Pore-Size Distributions of Cationic Polyacrylamide Hydrogels Varying in Initial Monomer...
9
Macromolecules 1994,27, 2965-2973 2965 Pore-Size Distributions of Cationic Polyacrylamide Hydrogels Varying in Initial Monomer Concentration and Cross-Linker/ Monomer Ratio Michael Kremer, Elmar Pothmann, Tobias RBssler, John Baker, April Yee, Harvey Blanch, and John M. Prausnitz’ Chemical Engineering Department and Chemical Sciences Division, Lawrence Berkeley Laboratory, University of California, Berkeley, California 94720 Received August 23, 1993; Revised Manuscript Received December 14, 19930 ABSTRACT: Pore-size distributionshave been measured for cationic acrylamide-based hydrogels. We use the experimental mixed-solute-exclusionmethod, MSE (introduced by Kuga), to obtain the solute-exclusion curve representing the amount of imbibed liquid inside the gel inaccessible for a solute of radius r. We use the Brownian motion model (developed by Cassasa) to convert the size-exclusion curve into the pore-size distribution, which gives the frequency of pore radius R as a function of R. This theoretically-based interpretation of MSE data leads to the Fredholm integral equation that we solve numerically. Results are reported for a series of hydrogels containing acrylamide and 3 % MAPTAC; the hydrogels differed in extent of cross-linkingand/or initialconcentrationof monomer. Pore-size distributions shift to lower pore sizes with rising initial monomer concentration and with rising cross-linker-to-monomer ratio. Introduction Gels are cross-linked polymer networks swollen in a liquid medium. The imbibed liquid serves as a selective filter to allow free diffusion of some solute molecules,while the polymer network serves as a matrix to hold the liquid together. When the liquid is water, the cross-linked polymer is a hydrogel. Gels are well-known in foods and medicines, as absorbents in disposable diapers, as filters for water purification and as separation materials for chromatography and e1ectrophoresis.l Gels are also of interest for controlled drug release2and for concentration of dilute solutions of macromolecules.3~4 Despite much progress, a fundamental understanding of gel properties is not yet sufficient for a rational design of novel gel systems. For such designs, it is important to know how solute molecules interact with the gel, in particular, how they partition between the gel phase and the surrounding liquid phase. Partitioning depends on two major effects: size exclusion and molecular attraction/repulsion. In this work we are concerned with the size-exclusion effect. Our goal is to determine pore-size distributions of some representative gels. For measuring gel microstruc- ture, it is not possible to use common methods such as mercury porosimetry or nitrogen adsorption because gels are swollen in a liquid medium; therefore, pores are not readily accessibleto mercury or nitrogen. For that reason, we use an indirect method for measuring pore-size distributions of gels based on the mixed-solute-exclusion (MSE) method introduced by K ~ga.~*~ This MSE method consists of three major steps: *Solutions with dissolved solutes of known concentra- tions and molecular sizes are brought into contact with the swollen gel. The molecular sizes of the solutes must cover a substantial range. (These solutions are calledstock solutions.) *Diffusion of solutes into the gel until equilibrium is attained. Partitioning of a particular solute depends both on the size of the solute and on the size distribution of the gel pores. * To whom correspondence should be addressed. @ Abstract published in Advance ACS Abstracts, April 15, 1994. OQ24-9297/94/2227-2965$Q4.50/0 *Thegel is separated from ita surrounding solution, and subsequent concentration measurements of solutes in the equilibrated surrounding solution are made. The decrease of each solute concentration relative to its initial stock- solute concentration is used for calculating the gel’s pore- size distribution. To isolate the size-exclusion effect from the molecular attraction/repulsion effect,we performed experiments with solutes that do not have specific interactions with the charged-polymer matrix. To assure that size effects alone are responsible for the observed partitioning, in separate experimental studies we used two solute series: a poly- (ethylene glycol)/poly(ethylene oxide)/ethylene oxide series, and dextran/oligosaccharide series. A polyelectrolyte hydrogel was prepared by an aqueous free-radical reaction of acrylamide (AAm) copolymerized with the cationic (3-(methacrylamido)propyl)trimethyl- ammonium chloride (MAPTAC).7 To obtain a network structure, N,”-methylenebis(acry1amide) (BIS) was added as a cross-linking agent. Pore-size distributions of polyelectrolyte hydrogels are strongly affected by three factors: *Concentration of the chemical cross-links of the polymer strands. That concentration is determined by the initial ratio of cross-linker to monomer. *Concentration of the physical entanglements of the polymer strands. That concentration is determined by the initial concentration of all polymerizable monomers in the aqueous solution. *Net chargeof the polyelectrolytehydrogel. That charge is determined by the initial concentration of the cationic and/or anionic monomer. These three factors can be quantified using the com- position of the hydrogel, that is, by the nominal concen- trations of monomer (AAm),comonomer (MAPTAC),and cross-linking agent (BIS) at preparation conditions. The composition of a polyelectrolyte hydrogel is characterized by three concentration parameters: moles of BIS in feed solution total moles of monomer in feed solution mass of all monomers (g) %T= volume of water (mL) % 0 1994 American Chemical Society
Transcript of Pore-Size Distributions of Cationic Polyacrylamide Hydrogels Varying in Initial Monomer...
Macromolecules 1994,27, 2965-2973 2965
Pore-Size Distributions of Cationic Polyacrylamide Hydrogels Varying in Initial Monomer Concentration and Cross-Linker/ Monomer Ratio
Michael Kremer, Elmar Pothmann, Tobias RBssler, John Baker, April Yee, Harvey Blanch, and John M. Prausnitz’ Chemical Engineering Department and Chemical Sciences Division, Lawrence Berkeley Laboratory, University of California, Berkeley, California 94720
Received August 23, 1993; Revised Manuscript Received December 14, 19930
ABSTRACT: Pore-size distributions have been measured for cationic acrylamide-based hydrogels. We use the experimental mixed-solute-exclusion method, MSE (introduced by Kuga), to obtain the solute-exclusion curve representing the amount of imbibed liquid inside the gel inaccessible for a solute of radius r. We use the Brownian motion model (developed by Cassasa) to convert the size-exclusion curve into the pore-size distribution, which gives the frequency of pore radius R as a function of R. This theoretically-based interpretation of MSE data leads to the Fredholm integral equation that we solve numerically. Results are reported for a series of hydrogels containing acrylamide and 3 % MAPTAC; the hydrogels differed in extent of cross-linking and/or initial concentration of monomer. Pore-size distributions shift to lower pore sizes with rising initial monomer concentration and with rising cross-linker-to-monomer ratio.
Introduction
Gels are cross-linked polymer networks swollen in a liquid medium. The imbibed liquid serves as a selective filter to allow free diffusion of some solute molecules, while the polymer network serves as a matrix to hold the liquid together. When the liquid is water, the cross-linked polymer is a hydrogel. Gels are well-known in foods and medicines, as absorbents in disposable diapers, as filters for water purification and as separation materials for chromatography and e1ectrophoresis.l Gels are also of interest for controlled drug release2 and for concentration of dilute solutions of macromolecules.3~4 Despite much progress, a fundamental understanding of gel properties is not yet sufficient for a rational design of novel gel systems. For such designs, it is important to know how solute molecules interact with the gel, in particular, how they partition between the gel phase and the surrounding liquid phase. Partitioning depends on two major effects: size exclusion and molecular attraction/repulsion.
In this work we are concerned with the size-exclusion effect. Our goal is to determine pore-size distributions of some representative gels. For measuring gel microstruc- ture, it is not possible to use common methods such as mercury porosimetry or nitrogen adsorption because gels are swollen in a liquid medium; therefore, pores are not readily accessible to mercury or nitrogen. For that reason, we use an indirect method for measuring pore-size distributions of gels based on the mixed-solute-exclusion (MSE) method introduced by K ~ g a . ~ * ~ This MSE method consists of three major steps:
*Solutions with dissolved solutes of known concentra- tions and molecular sizes are brought into contact with the swollen gel. The molecular sizes of the solutes must cover a substantial range. (These solutions are calledstock solutions.)
*Diffusion of solutes into the gel until equilibrium is attained. Partitioning of a particular solute depends both on the size of the solute and on the size distribution of the gel pores.
* To whom correspondence should be addressed. @ Abstract published in Advance ACS Abstracts, April 15, 1994.
OQ24-9297/94/2227-2965$Q4.50/0
*The gel is separated from ita surrounding solution, and subsequent concentration measurements of solutes in the equilibrated surrounding solution are made. The decrease of each solute concentration relative to its initial stock- solute concentration is used for calculating the gel’s pore- size distribution.
To isolate the size-exclusion effect from the molecular attraction/repulsion effect, we performed experiments with solutes that do not have specific interactions with the charged-polymer matrix. To assure that size effects alone are responsible for the observed partitioning, in separate experimental studies we used two solute series: a poly- (ethylene glycol)/poly(ethylene oxide)/ethylene oxide series, and dextran/oligosaccharide series.
A polyelectrolyte hydrogel was prepared by an aqueous free-radical reaction of acrylamide (AAm) copolymerized with the cationic (3-(methacrylamido)propyl)trimethyl- ammonium chloride (MAPTAC).7 To obtain a network structure, N,”-methylenebis(acry1amide) (BIS) was added as a cross-linking agent.
Pore-size distributions of polyelectrolyte hydrogels are strongly affected by three factors:
*Concentration of the chemical cross-links of the polymer strands. That concentration is determined by the initial ratio of cross-linker to monomer.
*Concentration of the physical entanglements of the polymer strands. That concentration is determined by the initial concentration of all polymerizable monomers in the aqueous solution.
*Net chargeof the polyelectrolyte hydrogel. That charge is determined by the initial concentration of the cationic and/or anionic monomer.
These three factors can be quantified using the com- position of the hydrogel, that is, by the nominal concen- trations of monomer (AAm), comonomer (MAPTAC), and cross-linking agent (BIS) at preparation conditions. The composition of a polyelectrolyte hydrogel is characterized by three concentration parameters:
moles of BIS in feed solution total moles of monomer in feed solution
mass of all monomers (g) % T = volume of water (mL)
%
0 1994 American Chemical Society
2966 Kremer et al. Macromolecules, Vol. 27, No. 11, 1994
% MAPTAC = moles of MAPTAC in feed solution
total moles of monomer in feed solution
The porous structure of a polyelectrolyte hydrogel is also affected by the properties of the surrounding solution, especially by dissolved ionic solutes (Donnan effect) and by dissolved uncharged solutes which partition unevenly between the gel phase and the solution phase (Osmotic effect).
Two series of hydrogels were prepared. In the first, % C varied (0.4-1.2%) while % T, % MAPTAC, and the ionic strength of the solution were held constant (at 15%, 3 % , and 0.001 M, respectively). In the second, % T varied (15-30 % ) while % C, % MAPTAC, and the ionic strength of the solution were held constant (at 0.2%, 15%, and 0.001 M).
Theoretical Section It is difficult to determine the porous structure of a
swollen material because of its fragility. Hydrogels may consist of 90 or even 99 weight % water and only 10 or 1 weight % polymer network. The porous structure of a hydrogel exists only in contact with an aqueous solution; when dehydrated, the network collapses into a compact mass. Therefore, techniques for measuring the porous structure of a hydrogel must consider the polymer-aqueous solution interaction that is required to preserve the structure. Because displacement of the imbibed aqueous liquid with any other fluid (e.g., mercury, nitrogen) does not retain the original gel structure, classical porosity- measurement techniques such as mercury intrusion or gas adsorption cannot be used.
Optical methods such as scanning electron microscopy have been applied to determine the microstructure of hydrogels, yielding a three-dimensional image of the structure. However, results from these methods strongly depend on the preparation technique of the hydrogel (e.g. critical-point drying with carbon dioxide, freeze-drying, and freeze-etching). These preparation techniques modify the structure, sometimes shrinking hydrogels up to 2096, as observed using critical-point drying.8
In the single-point solute-exclusion method, introduced by Aggebrandt and Samuelsons to measure the pore structure of swollen cellulose, solutions containing one solute each are equilibrated with the material to be examined. Using this method, Stone et al.'O-12 measured the pore structure of textile rayon and super tire cord using sugar and dextran probes. Kuga516 introduced the mixed-solute-exclusion method utilizing one solution comprising all solute species together covering a wide molecular-weight range. For that case, concentration measurements of each solute must be preceded by a separation technique such as gel permeation chramatog- raphy (GPC). Kuga investigated the porous structure of a cross-linked dextran gel (Sephadex), applying three different solute-exclusion methods. He performed his experiments using the above-mentioned single-point SE and mixed-SE and, in addition, the column solute- exclusion method. The latter is an inversion of GPC, where fully characterized polymer solutions are injected into a column packed with Sephadex. The elution behavior of the known polymer solutes is used to determine the pore structure. While this method saves much experimental time, it is applicable only to gel samples that are available as sufficiently rigid and finely divided particles such that their size and shape are independent of the surrounding liquid. It is therefore not useful for the hydrogels studied here.
Kuga's experimental results obtained with the single- point SE agree well with those obtained by the mixed-SE method. The column-SE method showed significant deviation in the high molecular-weight range, probably because of compression of gel particles during the packing procedure. For our purposes, the mixed-SE method is the best; it is relatively fast and inexpensive. We use here a modified form of Kuga's mixed-SE method, as sum- marized below. Details are available e1~ewhere.l~
The initial total mass of the cationic hydrogel in the swollen state ( m ' d 4 is composed of the cross-linked polymer network (mpN), the imbibed liquid (m'L,imb), and possible excess liquid (mL,exc), which sticks to the surface of the hydrogel but does not contribute to the imbibed liquid:
(1)
Contacting the hydrogel with the stock solution causes a migration of solutes into the pores of the hydrogel. Due to the porous structure of the gel, the equilibrium concentrations of the solutes in the gel phase are smaller than those in the surrounding solution phase; this dif- ference provides a driving force for the imbibed water to dilute the solution to achieve osmotic equilibrium. There- fore, the equilibrated total mass of the hydrogel is rewritten:
(2)
One part of the imbibed liquid is present in pores accessible to a solute of molecular weight M (m"a&t4)), while the remaining part is present in pores not accessible to this particular solute (m",onacc(M)):
(3)
The difference between the initial imbibed liquid (m'L,imb) and the equilibrated imbibed liquid (m''L,irnb) represents the expelled water (Amexpelled):
(4)
At the start of the experiment, the weight concentration of a solute of molecular weight M changes because the excess liquid (mL,exc), the expelled liquid (mexpell& and the accessible part of the imbibed liquid (m'lacc) contribute to a dilution of the surrounding solution; here m'lacc represents a solvent-solution exchange.
m'cs = mPN + m'L,imb + mL,erc
m'lGS = mPN + m"L,imb
m"L,imb = mffacc(M) + mffnonacc(M)
Amexpelled = m'L,iib - m"L,imb
w"(M) = msolute(M) (6)
The dilution ratio is defined as the concentration of the stock solution divided by the concentration at equilibrium:
(7)
msolv + m"acc(M) + Amexpelled + mL,exc
-- w'(M) - msolv + m"acc(W + Amelpelled + mL,erc
W " ( W mso1v
Combination of eq 7 with eqs 1-4 yields
The use of GPC to measure concentrations of the various solutes enables determination of the dilution ratio w'l w".
Macromolecules, Vol. 27, No. 11, 1994
The other mass quantities are measured by weighing. These data provide the amount of nonaccessible liquid as a function of molecular weight.
To convert molecular weight M into a solute radius, we use the hydrodynamic volume of a solute, which has been well accepted as a size parameter. The following equations give experimentally-determined15 relations between the molecular weights and the hydrodynamic radii of the solutes in water:16
r (8) = 0.271M".498 dextran (9)
r (A) = 0.271M"517 poly(ethy1ene glycol) (10)
r (A) = 0.166M"573 poly(ethy1ene oxide) (11)
Here M is the molecular weight corresponding to Mp, the peak volume in the distribution curve. If Mp is not stated by the supplier, the elution volume of polydisperse samples corresponding to Mn or M, must be evaluated,8 using, for example, the Lansing-Kraemer distribution8 or the less accurate estimate Mp = d M w M n .
The distribution coefficient K(r) as a function of solute radius r is the ratio of the accessible amount of imbibed liquid for a particular solute of radius r to the total amount of imbibed liquid:
The accessible amount and the total amount of imbibed liquid are defined by the following equations:
Combination of eqs 12-14 yields
"&nonacc,m
K(r) is the integral distribution coefficient, which is calculated from the experimentally-measured nonacces- sible amount of imbibed liquid (eq 8). K(r) is given by an integral that is solely a function of solute radius r integrated over the entire pore-size range (0 5 R I Rmm). The following section discusses the differential distribution coefficient K(R,r) as a function of solute radius r and pore radius R.
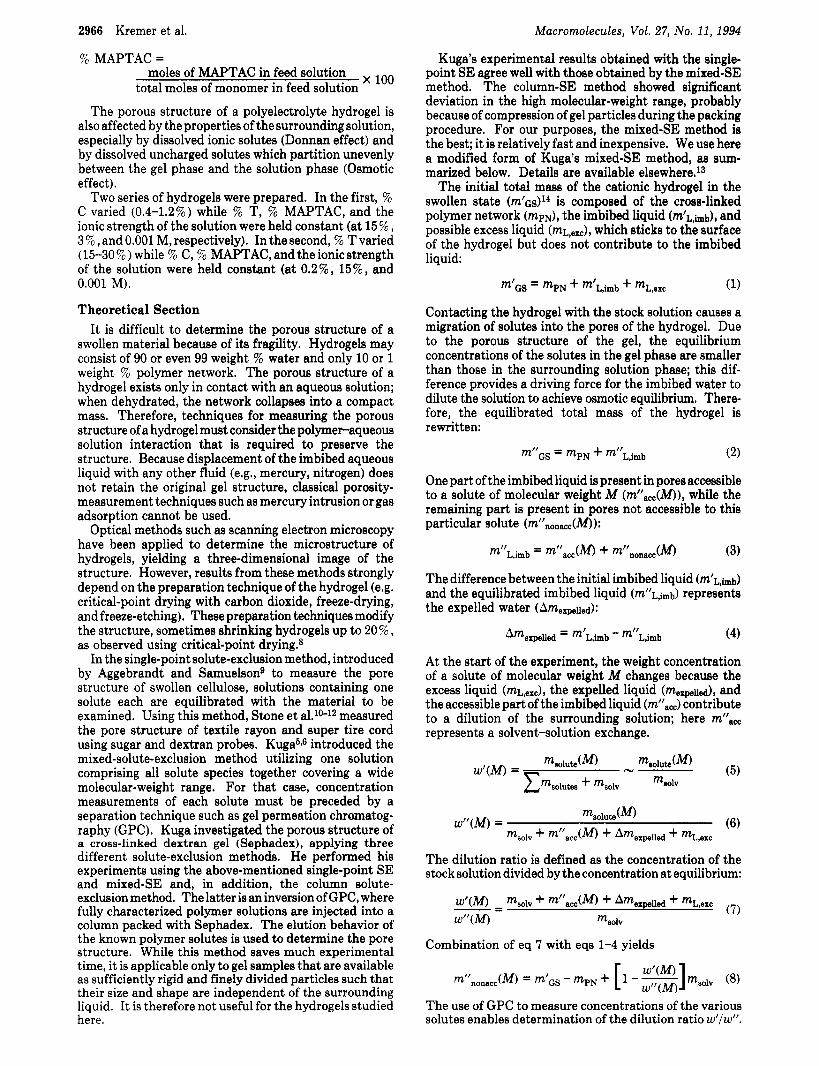
Equation 8 represents the solute-exclusion (SE) curve which provides information about the quantity of non- accessible water within the gel as a function of probe- solute radius. Kuga5 regarded eq 8 as the cumulative pore volume of the gel, but later6 he states that the identification of the SE curve with the pore-size distribution is not correct. This incorrect identification would mean that all the liquid existing in pores greater than the molecular size of a solute is available as accessible volume. Moreover, it would mean that the distribution coefficient for a solute of radius r, fitting into pores where R 2 r, is unity regardless of pore size. The latter statement is incorrect as long as the solute has a finite volume because of the excluded- volume effect (also known as the wall effect), shown in Figure 1.16 The wall effect requires information about partitioning of solutes between the outer solution phase and the gel phase as a function of solute size and pore size. This information is expressed by the differential distribu-
Pore-Size Distributions of Polyacrylamide Hydrogels 2967
Accessible pore volume \
Solute Molecule /
kRE J
SOLID
Water
.0 100.0 200.0 300.0 400.0 500.0 MOLECULAR DIAMFTER [ANGSTROM]
Addition of Solution
Accessible Water Non-accessible Water
Figure 1. Wall effect and the size-exclusion curve as a function of probe solute radius.
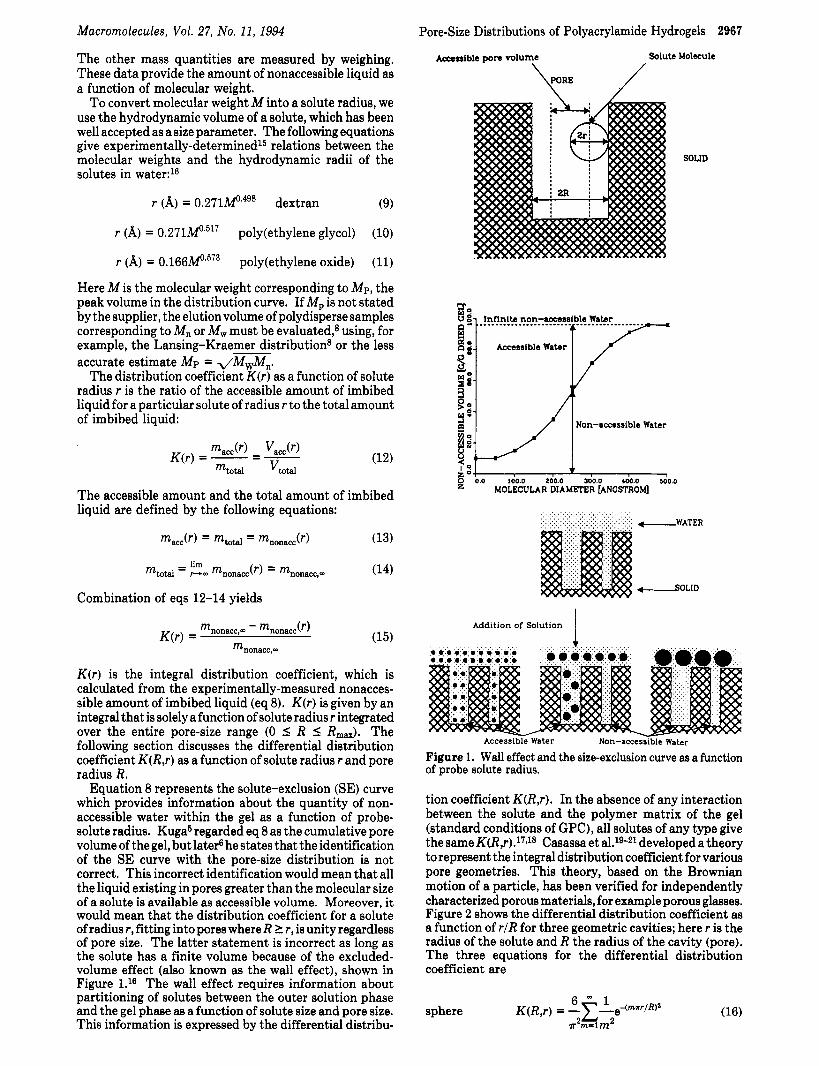
tion coefficient K(R,r). In the absence of any interaction between the solute and the polymer matrix of the gel (standard conditions of GPC), all solutes of any type give the sameK@,r).l7J8 Casassa et al.lS2l developed a theory to represent the integral distribution coefficient for various pore geometries. This theory, based on the Brownian motion of a particle, has been verified for independently characterized porous materials, for example porous glasses. Figure 2 shows the differential distribution coefficient as a function of rlR for three geometric cavities; here r is the radius of the solute and R the radius of the cavity (pore). The three equations for the differential distribution coefficient are
2968 Kremer et al. Macromolecules, Vol. 27, No. 11, 1994
(TYLINDRICAL C A W
EXPERIMENT. DATA (A)
. . I '. Q '. % '. I .. + POROUS GLASS 84 , '. I ,.
0 POROUS CLASS 159 t '. , '. I '
8 1 .. v POROUS CLASS 227 , '.
6 '. , '., c
0 POROUS GLASS 314
POROUS GLASS 517 v\ 0
0.00 0.15 0.30 0.45 0.60 0.75 0.00 1.05 1.20 1.35 I r/R (MOLECULE / PORE)
IO
Figure 2. Brownian motion model: Theoretical distribution coefficient as function of pore radius R and probe solute radius razz
m . 2
where flm are the roots Jo(@) = 0 where Jo indicates a Bessel function of the first kind and zero order.
Haller22 measured distribution coefficients for various controlled porous glasses (CPG) whose average pore diameters23ranged from 84 to517A." Comparison between the three theoretical curves and the experimental data suggests that the slab cavity is likely to be the best geometric pore shape for a reasonable representation of the experimental data. We therefore assume that the slab geometry is suitable for interpretation of our data. To our knowledge, these are the only experimental data using dextran probe solutes to measure distribution coefficients of porous materials with known pore-size distributions. Even though the slab cavity does not necessarily represent the porous structure of hydrogels, it leads to the best representation of the experimental data. To calculate the distribution coefficient with cylindrical-shaped pores, the roots Pm of the Bessel function of the first kind and order zero were taken from Carslaw and Jaeger.25 The good agreement between experiment and theory supports the validity of the theoretical framework developed by Casassa.
The differential distribution coefficientK(R,) is related to the pore-size distribution in the following way. Consider a group of pores of radii between R and R + dR with a total volume dV. Let dVacc(r) be the pore volume with pores of radii between R and R + dR accessible to a molecule of radius r , The amount of accessible volume for this
groups of pores is
dVacc(r) = K(R,r)dV (19)
where K(R,r) is the differential distribution coefficient for solutes with radius r when the pore radius is R. The differential distribution coefficient is restricted to the region 0 I K(R,r) I 1.
The differential pore-size distribution, denoted by f(R), is defined through
dV - f(R)dR ( 2 0 ) -- Vta,
where f(R)dR represents the fraction of the total pore volume that contains pores with radii between R and R + dR. Combination of eq 19 and 20 gives
dVacc(r) = K(R,r)f(R) V,,dR (21)
The total accessible volume for a solute molecule with radius r for all groups of pores is found from integration of eq 21:
Integration of the left side yields the integral distribution coefficient K(r) in accordance with eq 12:
To obtain the differential pore-size distribution, the final equation for data reduction is
Macromolecules, Vol. 27, No. 11, 1994
The left side of eq 24 is the measured overall distribution coefficient as a function of molecular radius r. T h e right- hand side consists of the differential distribution coef- ficient as a function of r and R and the desired pore-size distribution f(R). T h e differential distribution coefficient K(R,r) is provided by the Casassa model.
A drastic simplification would be to replace eq 18 with the simple approximation
(18d r K(R,r) = 1 - - R
However, in that event it would still be necessary to use numerical techniques to find f(R) from eq 24.
Solving integral eq 24 to obtain f(R) presents a serious problem. This equation is well-known as the inhomoge- neous Fredholm equation of the first kind; it can only be solved numerically. We use the computer program CON- TIN developed and maintained by P r o ~ e n c h e r ~ ~ ~ ~ to calcuate pore-size distributions. It is called CONTIN because it is often applied to solving integral equations of the first kind for effectively CONTINUOUS distributions of diffusion coefficients, molecular weights, et^.^^ Nu- merical solution of the Fredholm integral equation by inversion30 induces additional mathematical instabilities, creating a large (typically infinite) set of solutions f(R) that satisfy eq 24 within experimental error. These well- known instabilities are minimized by constraining the pore- size distribution to be the smoothest nonnegative distri- bution that is consistent with the experimental distribution coefficient K(r). The modular and clearly arranged structure of the computer program enables a user to incorporate additional theoretical models for particular applications not already included in the program. We included eq 18 in the subprogram USERK to account for the wall effect represented by the integral distribution coefficient K(R,r). Also, we changed the dimension specifications; we increased the number of quadrature grid points beyond 35 to obtain more accuracy. In some cases we used 250 grid points.
To verify the Brownian motion model in conjunction with the solution of the Fredholm integral equation, we utilized experimentally-determined distribution coef- ficientsK(r) of dextran solutes in various controlled porous glasses with independently known mean pore diameters.22 Calculation of pore-size distributions using the experi- mentally- determined distribution coefficients yields rea- sonable agreement of the average pore size or mean pore size with the CPG data as shown in Table 1. Because the pore-size distributions of these controlled porous glasses are not available, a comparison of measured and calculated pore-size distributions is not possible.
Experimental Section Synthesis of the acrylamide-based hydrogels is described by
Baker et a1.31 These hydrogels are able to swell to the order of hundreds of times their dry weight due to the hydrophilic nature of acrylamide. Incorporation of copolymer MAPTAC enlarges the swelling capacity due to an osmotic-pressure driving force, allowing more water to enter the gel phase. To maintain electroneutrality, the C1 ions of the MAPTAC molecule are confined to the gel phase because of the quaternary amine groups imbedded in the gel network. Therefore, additional water migrates into the gel phase to dilute the concentration of the C1 ions. Hydrophilicity and osmotic pressure yield hydrogels that can immobilize large amounts of water or aqueous solution. However, these hydrogels display a weak structure; that is, they
Pore-Size Distributions of Polyacrylamide Hydrogels 2969
Table 1. Comparison of Experimentally-Determined Mean Pore Diameters of Controlled Porous Glasses and
Calculated Mean Pore Diameters Using the Brownian Motion Model in Conjunction with the Solution of the
Fredholm Integral Equation porous glass mean diameter (A) 84 227 314 517 calcd mean diameter (A) 90 222 312 470 deviation ( % ) 7.1 2.25 0.6 10.0
Table 2. Composition of AAm/MAPTAC Hydrogels Used in This Work
___ ~~ ~~
variation % T variation % C % MAPTAC 3 3 % C %T 15, 20,25,30 15
0.2 0.4,0.8, 1.2
Table 3. Polydisperse PEO/PEG and Dextran/ Oligosaccharide Probe Solutes Used for Investigation of
AAM/MAPTAC Hydrogels Varying in % T. PEG/PEO dextran/oligosaccharides
M, fraction supplier M, Fraction supplier EG (M, = 62) PEG 200 PEG 300 PEG 400 PEG 3350 PEG 8OOO PEO 100 000 PEO 600 OOO PEO 900 000 PEO 4 000 000
Fischer glucose (M, = 180) Aldrich Union Carbide sucrose (M,,, = 342) Fisher
raffinose (M, = 504) 11 OOO Sigma 2000000 70 OOO Fluka
Aldrich 110 000 40 000 Pharmacia 500 000
a Polydispersity ranges from approximately 1.4 to 2.8.
break easily under mechanical stress. Increasing % T and % C reinforces the polymer network; however, the ability of the gel to absorb water then decreases.
Gel compositions are shown in Table 2. Our goal is to isolate the effects of % C and % T on pore-size distribution. In our hydrogels the lowest % T was 15% and the lowest ?4 C was 0.2%. Hydrogels with both low % T and % C are very fragile. Shifting % C and % T to higher values increases the rigidity of the hydrogel but also yields hydrogels whose structure is insensitive to further changes in % C and % T.
Using one solution containing all solutes of a series requires a highly resolving chromatographic apparatus and essentially monodisperse polymer fractions to resolve each solute peak sufficiently for reasonable accuracy. Kuga’s chromatograms show that individual solute peaks are close together; therefore, determination of solute concentrations leads to large analytical errors. To increase analytical accuracy, we split the all-solute solution into three or four subsolutions; each of these contains three solutes at most. Tables 3 and 4 show the solutes used in this work. These tables also show molecular weight, polydis- persity, and supplier. Tables 5 and 6 give the compositions of the solutions used for the MSE method.
Experiments for hydrogels with variable % T were performed with slightly polydisperse solutes. Determination of the dilution ratio in eq 8 has to be as accurate as possible because inaccurate measurements produce the largest random errors in the non- accessible water calculated from eq 8. For hydrogels varying in % C, more nearly monodisperse polymer fractions were used, as shown in Table 6. These more nearly monodisperse fractions improve significantly the concentration measurements by pro- ducing a higher resolution of the peaks in the chromatogram.
Use of subsolutions to increase analytical accuracy induced new experimental difficulties. Contacting identical hydrogels with several solutions containing different solutes yields unequal swelling equilibria and thus diverse pore structures caused by different osmotic pressures. The pore-size distribution cannot be obtained correctly from a combination of measured data from the various subsolutions. To circumvent this difficulty, it may be feasible to normalize the nonaccessible water with the swelling capacity in equilibrium by assuming a linear relationship between the swelling of a gel and its porous structure.32 Another option
2970 Kremer et al. Macromolecules, Vol. 27, No. 11, 1994
Table 4. Monodisperse Probe Solutes Used for Investigations of AAm/MAPTAC Hydrogels Varying in % C wt av (GPC) wt av (light scatter.) no. av (GPC) peak av (GPC)
solute Mw Mw MU M, MwIMn supplier PEO 4 000 OOO NIA NIA PEO 1 000 OOO 832 OOO 888 600 PEO 500 000 444 900 457 OOO PEO 200 000 305 400 299 300 PEO 60 000 62 600 66 600 PEG 20 000 19 700 PEG 10 000 10 900 PEG 3000 3 070 PEG 600 629 PEG 450 420 PEG 200 229 dextran 12 OOO 11 600 dextran 50 OOO 48 600 dextran 80 OOO 80 900 dextran 150 OOO 147 600 dextran 670 OOO 667 800 dextran 2 OOO OOO N/A glucose sucrose raffinose
Table 5. Compositions of Stock Solutions Used for Investigations of AAm/MAPTAC Hydrogels
Varying in % T PEGIPEO dextran
solution fraction w’ [wt % 1 P1 200
P2 300 100 000
8 000 600 000
8OOO 900 000
3 350 4000000
P3 400
P4 EG
0.80 0.25 0.70 0.40 0.25 0.70 0.40 0.25 0.10 0.40 0.16
solution fraction D1 110000
11 000 sucrose
D2 500000 40 OOO glucose
D3 2000000 70 OOO raffinose
w’ [wt % I 0.15 0.15 0.06 0.15 0.15 0.06 0.16 0.20 0.06
Table 6. Compositions of Stock Solutions Used for Investigations of AAm/MAPTAC Hydrogels
Varying in % C PEOIPEG dextran
solution MW wt % solution MW wt %
P1 EG 3000 200 OOO
10 000 500 OOO
20 000 1000 000
60 000 4 000 000
P2 200
P3 450
P4 600
1.0 D1 0.4 0.3 0.8 D2 0.5 0.3 0.8 D3 0.6 0.25 0.7 D4 0.4 0.2
raffinose 12 OOO 150 OOO glucose 50 OOO 670 OOO sucrose 80 OOO
2000000
0.06 0.1 0.2 0.06 0.15 0.2 0.06 0.2
0.2
is to increase the ionic strength of the surrounding solution by adding the salt sodium azide to the solutions to screen the effect of different osmotic forces.% Toward that end, sodium azide is used in this work with a concentration of 0.06519 g of NaNa per lo00 g of solution (0.001 M) to maintain the same degree of swelling of one class of hydrogels in equilibrium with each of the probe-solute-containing solutions.
Sodium azide also serves as an antibacterial agent for prevent- ing the destruction of solutes (especially sucrose, raffinose, and glucose%) by bacteria. In our initial experiments, we observed a degradation of our hydrogels over 3 months, resulting in a steady increase of the swelling capacity.% Since the gel disks are cut from gel sheets, polymer strands are destroyed, leaving radicals on the gel disks. These radicals initiate the degradation in the gel in conjunction with dissolved oxygen and promote a further break-up of polymer strands.% Because of its low ionization potential, the azide ion easily transfers an electron to the radical,
NIA 876 400 432 300 283 400 61 400 14 700 9 200 2 890 574 370 206 8 110 35 600 55 000 100 300 332 800 NIA
N/A 881 500 447 300 293 000 64 400 19 OOO 10 900 3 140 625 400 210
N/A Aldrich Chemical Co. 1.06 Scientific Polymer 1.03 1.08 1.03 1.34 1.19 1.06 1.10 1.14 1.11 1.43 Fluka 1.36 1.47 1.47 2.00 N/A Sigma 1.00 Aldrich 1.00 Fischer 1.00
saturating its electron shell; therefore, the azide ion inhibits decomposition of the hydrogel.% In the presence of sodium azide, hydrogels were stabilized; no change in swelling was observed over a long time.
To determine the dilution ratio in eq 8, it is necessary to conduct concentration measurements of the stock solutions and the corresponding equilibrated solutions. Since thesolutions contain more than one probe solute, it is necessary to separate the solutes and subsequently to detect them. Probe solutes of one series differ only in molecular weight; gel permeation chromatography (GPC) was used to separate the solutes, as described in ref 13.
The experimental procedure starts with weighing of gel samples to determine m’os. We used about 6-8 g for each jar where gels and solution were placed to reach equilibrium. The jars are straight-sided, including a lid with a gasket for a tight seal. The tendency of polyacrylamide gel to adhere to the surfaces of the jars resulted in broken or damaged gel disks upon removal. Therefore, all jars were placed in a dichlorcdimethylsilane-toluene solution for about 30 s to achieve hydrophobic glass surfaces of the jars. The jars were then thoroughly cleaned and rinsed with nanopure water. The amount of stock solution added was about 1.4 times the weight of the swollen gel. This amount of solution was chosen to obtain a maximum decrease of the concentration of the small probe solutes of about 50 % to guarantee a significant signal/noise ratio in the chromatogram. We used two jars for each gel/solution combination for determining experimental errors on the one hand and to minimize the number of jars on the other. The filled and closed jars were transferred to a constant-temperature bath purchased from Blue M Electric, Blue Island, IL 60406, Model MSB-3222 A-1. Constant temperature was maintained at 25 OC.
For each class of gels, two jars contacted gel with pure water to monitor the effect of broken gel particles. The pure solvent was later filtered and analyzed by GPC to check the existence of any additional peak caused by dissolved gel particles. Diffusion jars were prepared to contact each class of gel with the largest probe solute of each series (Dextran 2 OOO OOO, PEO 4 OOO OOO). These diffusion jars were filled with 3 times the amount of gel and solution of the regular jars to modify the equilibration as little as possible. We sampled the surrounding solution every second day to measure the concentration as a function of time necessary to determine the partitioning equilibrium of the probe solutes. Theselarge polymers fiiished their migration after about 10 days; however, we terminated the experiment after 14 days.
After equilibrium was reached, the gel disks were separated from the equilibrated solutions, thoroughly washed to remove essentially all probe solutes, and subsequently dried and weighed to determine mpN. The equilibrated solutions were first filtered (Whatman filter paper No. 40, crystalline retention) to remove gel particles which would affect the chromatographic measure- ments. After filtering, the equilibrated solutions and the corresponding stock solutions were alternately chromatographed

Macromolecules, Vol. 27, No. 11, 1994
2o 1 0 Series 1 (Dextran) A Serles 2 (Dextran)
Series 1 (PEOIPEG) + Series 2 (PEOIPEG) I
0
$1 g -20 z 1 1 0 1 0 0 1 0 0 0
Probe Solute Radius (Angstrom) Figure 3. Size-exclusion curve for the AAm MAPTAC hydrogel (20% T,3% MAPTAC,0.2% C). Thedatarepresentexperiments performed with PEO/PEG and dextran probe solutes. The data fit represents the fitted SE curve calculated and used by the computer program CONTIN to compute pore-size distributions; C swell (dextran and PEO/PEG) is the swelling capacity of the used hydrogels determined by weighing measurements. h n u
I
M Y 2o 1 - Data F1 (Fredholm)
B
P .- 2 op al V V
/
8 I Series 1 (PEOPEG) + Series 2 (PEOIPEG)
Series 1 (Dextran) A Series 2 (Dextran)
I u i
I
-? g -10 ' 1 0 0 1 0 0 0 z 1 1 0
Probe Solute Radius ( A n g s t r o m ) Figure 4. Size-exclusion curve for the AAm MAPTAC hydrogel (30% T, 3 % MAPTAC,0.2 % C). The datarepresent experiments performed with PEO/PEG and dextran probe solutes. The data fit represents the fitted SE curve calculated and used by the computer program CONTIN to compute pore-size distributions; C swell (dextran and PEO/PEG) is the swelling capacity of the used hydrogels determined by weighing measurements.
at least three times. Alternate measurements of stock solution and equilibrated solution were necessary to obtain accurate chromatographic results, because slight changes of the GPC equipment (state of the column, temperature, state of the mobile phase) greatly affect the results.
Results and Discussion Figures 3 and 4 show the solute-exclusion curves for the
20% and 30% T hydrogels. The lower limit, a nonac- cessible volume of zero, can be confirmed experimentally. However, some data points lie in the negative range due to the limited accuracy of the measurements. This lower limit is independent of solute radius below 6 A; molecules with radii smaller than 6 A are able to enter the entire
Pore-Size Distributions of Polyacrylamide Hydrogels 2971
= 60
4 0 4 /" - Data fi (Fredholm) I .
M Y
4
8 Series 1 (PEOREG)
+ Series 2 (PEOPEG) LI Series 1 (Dextran) A Series 2 (Dextran)
.- P
1 1 0 1 0 0 1 0 0 0
Figure 5. Size-exclusion curve for the AAm MAPTAC hydrogel (15 % T, 3 % MAPTAC, 0.4% C). The data represent experiments performed with PEO/PEG and dextran probe solutes. The data fit represents the fitted SE curve calculated and used by the computer program CONTIN to compute pore-size distributions; C swell (dextran and PEO/PEG) is the swelling capacity of the used hydrogels determined by weighing measurements.
Probe-Solute Radius (Angstrom)
gel-pore structure. The upper limit representing the swelling capacity is experimentally determined by two different methods. The solid and dashed lines represent the weighed swelling capacities of the gels in equilibrium with the various probe-solute solutions. The data show the results of the mixed-SE method; data in the high molecular-weight range (total exclusion) represent also the swelling capacity. Both methods show good agreement within experimental error. The data show that solutes with radii of 186 A or larger are totally excluded from both gels; however, between the lower and the upper limit, the exclusion behaviors of both gels are different because of different pore structures. Generally, with increasing gel fragility, the data scatter increases due to breaking of the gel. The standard deviation of the nonaccessible volume is about 25% for the 20% T gel, whereas the more rigid 30% T gel exhibits only a 10% standard deviation.
Figures 5-7 show solute-exclusion curves for the 0.4, 0.8, and 1.2% C cross-linked hydrogels. The 1.2% gel, the tightest one, excludes solutes with radii of about 200 A, while the 0.4% gel, with the loosest network, accom- modates molecules in its structure up to radii of only 160 A. Weighed swelling capacities in equilibrium with either dextran or PEO/PEG solutions agree better with increasing % C, again due to the increasing rigidity of the gel. No significant difference of the swelling capacities of the 1.2 % gel was measured; the dashed line coincides with the solid line. The data fit (Fredholm) line is the curve calculated by CONTIN which gives the smoothest non-negative pore- size distribution.
Figures 8 and 9 show the calculated pore-size distribution for the hydrogels varying in 7% T and % C, respectively. The mode represents pore radii with the highest prob- ability; the mean radius is the first moment of the distribution, and the variance is the second moment, The tighter 30% T gel exhibits a pore-radius range to 300 A, whereas the 20% T gel possesses pores with radii to 500 A. The hydrogels varying in 5% C are much tighter than the 96 T gels, although the 5% T content is only 15 7 % . The 0.4 % cross-linked gel possesses pores with maximum radii of 240 A; the 0.8% C and 1.2% C gels have pores with maximum pore radii of 200 and 180 A, respectively. The broadening of the distributions is represented by the
2972 Kremer et al.
Data fit (Fredholm) - g z
2 40 C swell (PEOIPEG)
h . . . . . . . . . . . . . . . . . . . . . . . . . . . . . . . . . . . . .
- A r m r
Y M C swell (Dextran)
0 Series 1 (Dextran) - , A Series2(Dedran)
-.....-. 30 -
M I
Macromolecules, Vol. 27, No. 11, 1994
Series 1 (PEO/PEG) + Series 2 (PEO/PEG)
M Y
Probe-Solute Radius (Angstrom)
Figure 6. Size-exclusion curve for the AAm MAPTAC hydrogel (15% T,3% MAPTAC,O.8% C). Thedatarepresentexperiments performed with PEO/PEG and dextran probe solutes. The data fit represents the fitted SE curve calculated and used by the computer program CONTIN to compute pore-size distributions; C swell (dextran and PEO/PEG) is the swelling capacity of the used hydrogels determined by weighing measurements.
C swell (PEOIPEG)
20 Data fit (Fredholm)
h
t h
a 01)
M . v
A Series 2 (Dextran) m Series 1 (PEO/PEG)
g o + Series 2 (PEOIPEG) 8
1 1 0 1 0 0 1 0 0 0
Probe-Solute Radius (Angstrom) Figure 7. Size-exclusion curve for the AAm MAPTAC hydrogel (15% T,3% MAPTAC, 1.2% C). Thedatarepresentexperiments performed with PEO/PEG and dextran probe solutes. The data fit represents the fitted SE curve calculated and used by the computer program CONTIN to compute pore-size distributions; C swell (dextran and PEO/PEG) is the swelling capacity of the used hydrogels determined by weighing measurements.
variance; decreasing % C produces a looser network and therefore a broader distribution, as indicated by a larger variance. Tables 7 and 8 give the modes, means, and variances for all measured pore-size distributions.
Conclusions For rational design of hydrogels, it is useful to know
how the pore-size distribution depends on the hydrogel characterization commonly expressed by ?& C, % T, and 96 comonomer. This work reports measurements of pore- size distributions for acrylamide-MAPTAC gels for the range of 5% C from 0.2 to 1.2, and '5% T from 15 to 30; 5% MAPTAC was constant at 3 ?& . Measurements are based on the mixed-solute-exclusion method using dextran or poly(ethyleneglycol/oxide) as probes. Mean pore sizes are
0 2 0 0 4 0 0 6 0 0
Figure 8. Computed pore-size distributions using CONTIN for the AAm/MAPTAC hydrogel (0.2% C, 3% MAPTAC) varying in % T (20, 30).
Pore Radius R (Angstrom)
0 1 0 0 2 0 0 3 0 0 Pore Radius R (Angstrom)
Figure 9. Computed pore-size distributions using CONTIN f the AAm/MAPTAC hydrogel (15% T, 3% MAPTAC) varying in % C (0.4, 0.8, 1.2).
Table 7. Mode, Mean, and Variance for Pore-Size Distributions of AAm/MAPTAC Hydrogels Varying in % T
mode [AI mean [A] variance [A21
30% T 27.9 100.1 16 555 20% T 72.9 168.8 41 314
Table 8. Mode, Mean, and Variance for Pore-Size Distributions of hAm/MAPThC Hydrogels Varying in 9% C
mode [AI mean [AI variance [A*] 0.4% C 99.5 124.8 20 514 0.8% C 55.7 92.0 12 109 1.2% c 54.4 67.8 6 923
in the range 67-168 A. Mean pore sizes and variances decrease with rising ?& T and rising ?& C. The gels that are most dense (high 7% C and high 5% T) have appreciable numbers of very small pores (diameters of the order of 1 A); as the gel becomes less dense, the frequency of such small pores becomes very low.
Acknowledgment. This work was supported by the Director, Office of Energy Research, Office of Basic Energy Sciences, Chemical Sciences Division of the U.S. Depart- ment of Energy under Contract No. DE-AC03-76SF00098
Macromolecules, Vol. 27, No. 11, 1994
and by the National Institute of Health under Grant No. R01 GM 46788-01. M.K. is grateful to the DAAD and E.P. is grateful to the Ernst-Solvay Stiftung for financial support through fellowships. The authors would like to thank Judy Lee, Jeannie Ahn, Helen Lam, and Anthony Hui who performed some of the measurements.
References and Notes (1) Tanaka, T. Gels. Encyl. Polym. Sci. Eng., 1986, 6, 514-536. (2) Ratner, B. D.; Hoffman, A. S. ACS Symp. Ser. 1976,31,1-37. (3) Sassi, A. P.; Blanch, H. W.; Prausnitz, J. M. In Polymer
Applications for Biotechnology, Macromolecular Separation andldentification; Soane, D. S. , Ed.; Prentice Hall: Englewood Cliffs, NJ, 1992; Chaper 8, pp 244-275.
(4) Vashegani-Farahani, E.; Cooper, D. G.; Vera, J. H.; Weber, M. E. Chem. Eng. Sci. 1992, 47 ( l ) , 31-40.
(5) Kuga, S. J. Chromatogr. 1986, 206, 449-461. (6) Kuga, S. J. Chromatogr. Lib. 1988,40, (Chapter 6). (7) Hooper, H. H.; Baker, J.; Blanch, H. W.; Prausnitz, J. M.
(8) Hagel, L. J . Chromatogr. Libr. 1988,40 (Chapter 5). (9) Aggebrandt, Samuelson J. Appl. Polym. Sci. 1964, 2, 2801-
(10) Stone, J. E.; Scallan, A. M. Tappi, 1967,50 (lo), 496-501. (11) Stone, J. E.; Scallan, A. M. Cellulose Chem. Technol. 1968,2,
(12) Stone, J. E.; Treiber, E.; Abrahamson, B. Tappi 1969,52 (I),
(13) Kremer, M.; Prausnitz, J. M. Lawrence Berkeley Laboratory Report, LBL-32845, UC-401; Lawrence Berkeley Laboratory: Berkeley, CA, 1992.
(14) A single prime denotes all quantities which change during the experiments before contacting the probe solutions and the gel samples; two primes denote all quantities at equilibrium.
(15) Measurements of intrinsic viscosity were used to determine hydrodynamic volumes. These volumes were used to calculate hydrodynamic radii for the solutes.
Macromolecules 1990,23, 1096.
2812.
343-358.
108-110.
Pore-Size Distributions of Polyacrylamide Hydrogels 2973
(16) Kubin, M.; Vozka, S. J. Polym. Sci., Polym. Symp. 1980, 68,
(17) Vilenchik, L. 2.; Kurenbin, 0. I.; Zhmakina, T. P.; Belen’kin,
(18) Gorbunov, A. A.; Solovyova, L. Ya.; Pasechnik, V. A. J.
(19) Casassa, E. F. J. Polym. Sci. Part B 1967, 5, 773. (20) Casassa, E. F.; Tagami, Y. Macromolecules 1969,2, 14. (21) Casassa, E. F. Macromolecules 1976, 9, 182. (22) Haller, W. Macromolecules 1977,lO (l), 83-86. (23) The average pore size of the controlled glasses (as determined
by the mercury-intrusion technique) is defined as the pore diameter which was penetrated when half of the total volume available for mercury became filled.26
(24) Haller, W. Nature 1965,206,6934396. (25) Carslaw, H. S.; Jaeger, J. C. Conduction of Heat in Solids, 2nd
(26) Provencher, S. W. Makromol. Chem. 1979,180,201-209. (27) Provencher, S. W. Comput. Phys. Commun. 1982,27,213-227. (28) Provencher, S. W. Comput. Phys. Commun. 1982,27,229-242. (29) Provencher, S. W. CONTIN (Version 2) User’s Manual;
Technical Report EMBL-DA07; European Molecular Biology Laboratory: Heidelberg, 1984.
(30) Inversion means finding the desired pore-size distribution (which is under the integral) from the measured integral distribution coefficient K(r) .
(31) Baker, J. P.; Stephens, D. R.; Blanch, H. W.; Prausnitz, J. W. Macromolecules 1992,25, 1955-1958.
(32) Rossler, T. Unpublished research, Department of Chemical Engineering, UC Berkeley, 1992.
(33) As the ionic strength increases, polyelectrolyte gels deswell due to screening of the fixed charges on the gel network. When not screened, these charges repel each other and contribute to the expansion of the network.
(34) Pothmann, E. Unpublished research, Department of Chemical Engineering, UC Berkeley, 1992.
(35) Kremer, M. Lawrence Berkeley Laboratory Report, to be published.
209-213.
B. G. Dok. Akad. N U U ~ SSSR 1980,250 (2), 381-383.
Chromatogr. 1988,448, 307-332.
ed.; Clarendon Press: Oxford, U.K., 1959.