Behavior of Active Sites in a Changing, Supported Metallocene Catalyst Particle: Modeling Monomer...
15
Behavior of Active Sites in a Changing, Supported Metallocene Catalyst Particle: Modeling Monomer Transport and Kinetics Mario G. Chiovetta,* Diana A. Estenoz INTEC, UNL-CONICET, Gu ¨ emes 3450, 3000 Santa Fe, Argentina Fax: þ54 342 455 9185; E-mail: [email protected] Received: March 16, 2004; Revised: July 10, 2004; Accepted: August 31, 2004; DOI: 10.1002/mame.200400069 Keywords: modeling; metallocene catalysts; morphology; polymer yield; supports Introduction In polyolefin polymerization, the analysis of the actual participation of the metallocene active sites in the polymer synthesis process as well as the degree of effectiveness of these sites in the overall reactor productivity is of relevance. Proper active site utilization is a key factor when conside- ring the design and operating conditions required for an efficient use of the reactor holding a specific catalyst- support system. The solid-within-a-solid [1] growth scenario derived from the nature of the physical system involved is of significant impact on the polymer manufacture process. The polymer, a solid, is being synthesized inside a particle of the support, another solid, producing a complex that, in turn, is affected by the fluid environment in the polymerization reactor. Metallocene active sites bonded to the porous surface of the support structure are impregnated following several techniques during catalyst preparation time. [2–6] These procedures determine the specific rate of polymerization depending on the chemical nature of the metallocene and the co-catalyst, the sequence of impregnation (co-catalyst placed before or after the metallocene), [6] and the degree (density) of pore coverage with active sites. Additionally, Summary: Support-catalyst-polymer particles composed of millions of microparticles arranged in cells and having silica nuclei covered with metallocene-methyl alumoxane (MAO) active sites are studied to analyze cell participation during polymerization. Main variables are the changing particle morphology and the kinetic-diffusion effects determining local monomer availability during residence time. The pheno- mena were studied by means of a mathematical model used to produce a set of predictions for particles polymerizing ethylene in a toluene slurry continuous stirred tank reactor (CSTR) under various operating conditions. This information is employed to predict the micro- and macroparticle behavior in situations designed to explore catalyst activities, monomer availabilities and reactor conditions. Kinetic constants and concentrations range from reference values up to 6 times these figures, with reactor temperatures between 323 and 353 K and particle Reynolds numbers on a 1 to 10 relative scale. Heat transfer and temperature elevation during poly- merization are predicted, with no relevant overheating ob- served. Morphology changes, in the form of density profiles inside the support-catalyst-polymer particle, are monitored with time, and their interaction with transport and reaction phenomena analyzed. Increasing catalyst activity alone may not produce proportional raises in yield; it appears more efficient to improve the monomer availability instead. High catalyst activity may produce monomer depletion at inner cells delaying their fragmentation and decreasing local polymer-production. Cell density vs. time for cells located at the exterior, at the center and at half the radius of the macroparticle. Macromol. Mater. Eng. 2004, 289, 1012–1026 DOI: 10.1002/mame.200400069 ß 2004 WILEY-VCH Verlag GmbH & Co. KGaA, Weinheim 1012 Full Paper
Transcript of Behavior of Active Sites in a Changing, Supported Metallocene Catalyst Particle: Modeling Monomer...

Behavior of Active Sites in a Changing, Supported
Metallocene Catalyst Particle: Modeling Monomer
Transport and Kinetics
Mario G. Chiovetta,* Diana A. Estenoz
INTEC, UNL-CONICET, Guemes 3450, 3000 Santa Fe, ArgentinaFax: þ54 342 455 9185; E-mail: [email protected]
Received: March 16, 2004; Revised: July 10, 2004; Accepted: August 31, 2004; DOI: 10.1002/mame.200400069
Keywords: modeling; metallocene catalysts; morphology; polymer yield; supports
Introduction
In polyolefin polymerization, the analysis of the actual
participation of the metallocene active sites in the polymer
synthesis process as well as the degree of effectiveness of
these sites in the overall reactor productivity is of relevance.
Proper active site utilization is a key factor when conside-
ring the design and operating conditions required for an
efficient use of the reactor holding a specific catalyst-
support system.
The solid-within-a-solid[1] growth scenario derived from
the nature of the physical system involved is of significant
impact on the polymer manufacture process. The polymer, a
solid, is being synthesized inside a particle of the support,
another solid, producing a complex that, in turn, is affected
by the fluid environment in the polymerization reactor.
Metallocene active sites bonded to the porous surface of
the support structure are impregnated following several
techniques during catalyst preparation time.[2–6] These
procedures determine the specific rate of polymerization
depending on the chemical nature of the metallocene and
the co-catalyst, the sequence of impregnation (co-catalyst
placed before or after the metallocene),[6] and the degree
(density) of pore coverage with active sites. Additionally,
Summary: Support-catalyst-polymer particles composed ofmillions of microparticles arranged in cells and having silicanuclei covered with metallocene-methyl alumoxane (MAO)active sites are studied to analyze cell participation duringpolymerization. Main variables are the changing particlemorphology and the kinetic-diffusion effects determininglocal monomer availability during residence time. The pheno-mena were studied by means of a mathematical model usedto produce a set of predictions for particles polymerizingethylene in a toluene slurry continuous stirred tank reactor(CSTR) under various operating conditions. This informationis employed to predict the micro- and macroparticle behaviorin situations designed to explore catalyst activities, monomeravailabilities and reactor conditions. Kinetic constants andconcentrations range from reference values up to 6 timesthese figures, with reactor temperatures between 323 and353 K and particle Reynolds numbers on a 1 to 10 relativescale. Heat transfer and temperature elevation during poly-merization are predicted, with no relevant overheating ob-served. Morphology changes, in the form of density profilesinside the support-catalyst-polymer particle, are monitoredwith time, and their interaction with transport and reactionphenomena analyzed. Increasing catalyst activity alone maynot produce proportional raises in yield; it appears moreefficient to improve the monomer availability instead. High
catalyst activity may produce monomer depletion at innercells delaying their fragmentation and decreasing localpolymer-production.
Cell density vs. time for cells located at the exterior, at thecenter and at half the radius of the macroparticle.
Macromol. Mater. Eng. 2004, 289, 1012–1026 DOI: 10.1002/mame.200400069 � 2004 WILEY-VCH Verlag GmbH & Co. KGaA, Weinheim
1012 Full Paper

the support introduces elements such as its compactness,
density and microsphere size that also affect catalyst behav-
ior. These lists of features for the active sites and support
represent the basic set of variables catalyst manufacturers
can resort to tailor-make properties, such as the kinetic
constant, k, of the overall support-catalyst complex. Here,
the term, catalyst, includes the metallocene, the co-catalyst
and any other added chemical, if used. When the prepara-
tion process is finished, a particle several microns in
diameter, composed of millions of microspheres each one
covered by a given number of metallocenic active sites, is
ready to produce polymers, as described in the section
below.
When exposed to the monomer after the support-catalyst
particles are introduced into the reactor fluid medium, each
microsphere is designed to contribute to the polymer
production. The degree of participation of the microsphere
is essentially affected by a series of factors: a) the particle
changing morphology and b) the kinetic/diffusion effects
determining the local monomer availability. The magnitude
of these two major factors shows varying extension with
time during the particle residence in the reactor. These
factors also depend on the microsphere considered and
change significantly according to its position within the
overall particle. In the case of very active catalysts, which
are common in the industrial manufacture of polyolefins,
the period of time required for the particle morphology
changes forced to occur by polymerization may be several
hundred seconds, with the transition thus spanning a signif-
icant portion of the total particle residence time in the
reactor.
The analysis of the two factors mentioned in the preced-
ing paragraph is performed for the metallocenic complex on
a silica-support microsphere in the interior of a catalyst
particle during its residence time in a typical reactor en-
vironment. The changes are studied by performing poly-
merization calculations with the associated mass and heat
transfer processes with a mathematical model previously
validated through the available laboratory scale data.[6] The
latter is used to produce a set of simulations for particles
polymerizing ethylene in a toluene slurry continuous stirred
tank reactor (CSTR) with silica-supported metallocene
catalysts with a methyl alumoxane (MAO) co-catalyst and
for various operating conditions with a reference, base-case
set of parameters summarized in Table 1.
Mathematical predictions are produced for particle
conditions departing from those in the base-case to explore
several catalyst activities and monomer concentrations
as well as reactor conditions. When catalysts with higher
activities are studied, the results are presented by means of a
parameter, kf or kinetic factor, for simplicity, indicating the
ratio of the value of the particular kinetic constant analyzed
to that for the base-case. Similarly, to explore several
monomer concentrations in the fluid phase, a concentration
factor, Cf, is introduced to express the value in the reactor
fluid phase as times the value, MB, in the base-case. In an
analogous fashion, several mixing conditions are studied
via the introduction of an initial-particle Reynolds factor,
Ref, that reflects the ratio of Re0 for the condition under
analysis to the dimensionless number in the base-case.
Particle Dynamics
A single particle (a combination of the support, catalyst and
polyolefin, termed macroparticle) is taken as the unit where
the analysis is performed. The heterogeneous processes
taking place in each macroparticle residing in the reactor
fluid medium are modeled using the mathematical scheme
of Estenoz and Chiovetta, whose main features are sum-
marized in the Appendix, as previously mentioned.[6]
The sequence of changes suffered by the macroparticle
starts with the alterations produced by polymerization in
the morphology of the support-catalyst particle fed to the
reactor. Following Estenoz and Chiovetta,[6,7] this particle
is considered as a set of cells composed of nonporous silica
microspheres with radius RC initially arranged in a pattern
the shape of a cube. The cube-cell arrangement is repeated
within the whole particle to form a three-dimensional
network: the overall support-catalyst particle is thus consi-
dered as a set of cube-cells arranged in concentric layers.
Each cube has a characteristic edge dimension, lc¼ n(2RC),
in which n is the integer number of microspheres located
between two adjacent vertices of the cube determined by the
centers of the microspheres; each of them is in contact with
a number, b, of other microspheres.[8] For the selected
geometrical description, each concentric layer of cube-cells
in the initial support-catalyst particle has a thickness, lc.
Several high-porosity, silica-support particles can be repre-
sented using this scheme when a additional spheres are
added inside the cube-cell,[4,6] according to the description
Table 1. Parameters for the model in the Appendix, base-caseconditions.
Parameter Value Unit Ref.
T0¼ TB 323 K [5]P 1.7 atm [5]MB 155 mol/m3 [5]RM0 4.50� 10�5 m [5]RC 6.00� 10�9 m [6]N 1 250 [6]k 1.20� 10�6 m/s [5]E 13 500 cal/mol [7]DH 20 000 cal/mol [7]e0 0.825 [5]ea 0.409 [18]rs 2.27� 103 kg/m3 [19]rp 9.00� 102 kg/m3 [7]cpM 0.27 cal/g �K [19]kM 0.47 cal/m � s �K [19]DL/t 5.00� 10�9 m2/s [19],[20]DEP/tm 3.33� 10�11 m2/s [21],[22]c* 1.1 [12],[13],[20]
Behavior of Active Sites in a Changing, Supported Metallocene Catalyst Particle: . . . 1013
Macromol. Mater. Eng. 2004, 289, 1012–1026 www.mme-journal.de � 2004 WILEY-VCH Verlag GmbH & Co. KGaA, Weinheim

in Estenoz and Chiovetta summarized in Table 2.[6] The
support-catalyst complex analyzed in this work is in the first
line of Table 2.
Once the reaction begins, polymer accumulates around
these support microspheres; the support-catalyst nucleus
plus the polymer deposit constitutes a microparticle.
When the polymer thickness is sufficient, fragmentation
occurs:[12,13] forces arising between any two adjacent mi-
croparticles in the cell due to polymer accumulation break
the initial support’s rigid pattern. Microparticles now are
partially free to move and fill the holes of the initial cube-
cell structure, forcing porosity to decay. Polymer-molecule
entanglements between microparticles that permit some
displacements but prevent the complete disruption of
the microparticle aggregate restrict this process. Accom-
modation of microparticles proceeds until the cell attains a
fairly homogenous compactness in all directions, with poro-
sity being practically constant at a value, e¼ ea, hereafter.
Figure 1 schematically shows the interior of a macro-
particle at a time when fragmentation has already began and
a set of cube-cells is undergoing or has already finished the
process of rearrangement of its microparticles. The lower-
left portion of the picture shows the macroparticle with: a)
the nucleus, at which fragmentation has not yet occurred; b)
the zone undergoing microparticle rearrangement and
porosity decay; and c) the zone where changes in micro-
particle-morphology are finished. One of the cube-cells
located on the fragmentation-limiting surface of the
macroparticle is blown up in the central portion of the
picture. Here, a microparticle in the cell (upper-right
portion of Figure 1) is holding the amount on polymer
required to produce the local rupture of the initial network
of microspheres in the support.
The variable introduced to follow polymer accumulation
is the growth factor, cL, for a microparticle located at rM, the
radial position of the microparticle in layer, L, within the
macroparticle. The growth factor is defined as the ratio of
the microparticle radius, Rm, at time, t, to the support-
catalyst, nonporous microsphere radius, RC:
cL ¼ RmðrM; tÞRC
ð1Þ
The model uses two calculation levels, as indicated in the
Appendix, employing rigorous mathematical techniques to
follow the changes in the polymerizing particle along time
for: a) the processes taking place in the overall support-
catalyst-polymer complex or macroparticle and b) the local
phenomena of polymerization occurring at the active sites
in the microparticles.[6]
Particle Density Evolution
Changes in the particle morphology have an impact on the
effective use of the active sites and are one of the major
factors affecting the macroparticle performance in terms of
the actual exposure of microspheres to monomer. One of the
indicators of the macroparticle degree of change locally, for
each microparticle, is the density of the cells at any given
macroparticle radius and time. Density evolution is, thus, a
first indicator of the progress of the particle-arrangement
process.
At initial conditions, the local, cube-cell density can be
calculated as a function of the density of pure silica, rs, and
the initial porosity, e0. The mass ratio of catalyst to support
is usually below 1%.[5,6] Hence, the support-catalyst micro-
sphere density is assumed to be equal to that of silica.
rM0 ¼ rsð1 � e0Þ ð2Þ
With a density and initial porosity of 2 273 kg/m3 and 0.825,
respectively, corresponding to the support studied in this
Table 2. Representation of typical supports according to ref.[6]
Ref. Pore diameter Pore volume Specific surface area Porosity (experimental) n a Porosity (modeled) RC
nm m3/g m2/kg nm
[5] 40 2.20� 10�6 2.20� 105 0.83 3 2 0.83 6.00[9] 20 1.70� 10�6 3.00� 105 0.79 3 4 0.79 4.40
[10] 15 2.20� 10�6 3.00� 105 0.83 3 2 0.83 4.40[11] 20 1.70� 10�6 3.00� 105 0.79 3 4 0.79 4.40
Figure 1. Scheme of the macroparticle during olefin polymer-ization, with nucleus, region after fragmentation and exterior zonewith microparticle-rearrangement completed. Blow-up for cube-cell and microparticle at fragmentation point.
1014 M. G. Chiovetta, D. A. Estenoz
Macromol. Mater. Eng. 2004, 289, 1012–1026 www.mme-journal.de � 2004 WILEY-VCH Verlag GmbH & Co. KGaA, Weinheim

work (Table 1), a value of 397.8 kg/m3 is obtained for the
support-catalyst particle density. The initial conditions are
also instrumental to calculate the number of microspheres
present. At any given support-catalyst layer, the solid
volume, (Vsolid)L0, can be expressed as a function of the
number of microspheres, NL, in all cube-cells in layer, L,
and each microsphere volume:
ðVsolidÞL0 ¼ NLð4=3ÞpR3C ð3Þ
The volume of the layer is given by:
VL0 ¼ ð4=3Þpðr3MÞL � ð4=3Þpðr3
MÞL�1
¼ ð4=3Þpð2nRCÞ3ðL3 � ðL� 1Þ3Þ ð4Þ
in which the support-catalyst particle radius, rM, is
expressed as a function of the layer number, L, as:
rML ¼ nð2RCÞL ð5Þ
Then, the solid fraction at any layer can be expressed using
the porosity, e0, and Equation (3) and (4) above:
1 � e0 ¼ ðVsolidÞL0
VL0
¼ NLð4=3ÞpR3C
ð4=3Þpð2nRCÞ3ðL3 � ðL� 1Þ3Þð6Þ
Solving for NL:
NL ¼ ð1 � e0Þð2nÞ3ðL3 � ðL� 1Þ3Þ ð7Þ
As soon as the support-catalyst particle is placed in the
monomer-rich reactor environment, polymerization begins
and the polyolefin accumulates on a stratum located outside
the nonporous microsphere, as schematically shown in
Figure 1. During a certain amount of time, the initial cube-
cell geometry does not undergo any changes; porosity
decreases while cell density increases due to polymer filling
of the original voids in the structure. A simple way of
relating cell density with its morphology dynamics is via the
cell porosity at this stage. To do so, Equation (3) and (6) are
updated to take into consideration the polymer deposit.
First, the solid volume in a layer is calculated using Equa-
tion (3) modified to account for the microparticle growth:
ðVsolidÞL ¼ NLð4=3ÞpðcLRCÞ3 ð8Þ
The volume of the layer is still given by Equation (4), since
the cube-cell dimension, lc, spanning the layer thickness
is the same as initially. Similarly, the expression for NL in
Equation (7) still holds true, since the number of micro-
spheres in a layer is independent of time.
Now, the expression equivalent to Equation (6) at this
stage of polymerization is obtained by combining Equation
(7) and (8):
1 � eðrM; tÞ ¼ ðVsolidÞL
VL
¼ ð1 � e0Þð2nÞ3ðL3 � ðL� 1Þ3Þð4=3ÞpR3Cc
3LðrM; tÞ
ð4=3ÞpR3Cð2nÞ
3ðL3 � ðL� 1Þ3Þð9Þ
Simplification renders:
eðrM; tÞ ¼ 1 � ð1 � e0ÞðcLðrM; tÞÞ3 ð10Þ
One particular value of the void fraction corresponds to the
time when the critical polymer thickness necessary for the
fragmentation of the microspheres is reached in the cubic
cell, namely c¼ c*.
e*ðrM; tÞ ¼ 1 � ð1 � e0Þðc*ðrM; tÞÞ3 ð11Þ
The cell density can be calculated at this point. The mass of
polymer on each microsphere is computed as a function of
the growth factor in the selected cell:
mpðrM; tÞ ¼ rp½ð4=3ÞpR3m � ð4=3ÞpR3
C�¼ rpð4=3ÞpR3
C½ðc*ðrM; tÞÞ3 � 1� ð12Þ
With the information that the number of microspheres in a
cube is (3n-2þa) and that the number of microspheres in an
edge is n,[6] the cell density becomes:
rðrM; tÞ ¼ mc þ mp
V¼ mc
Vþ mp
V
¼ rM0þrp
ð3n� 2 þ aÞð4=3ÞpR3C½ðc*ðrM; tÞÞ3�1�
ð2nRCÞ3
ð13Þ
The support/catalyst mass in a cell,mc, and the cell volume,
V, are introduced to calculate r. At this stage of the
polymerization process, the dimensions of the cell have not
changed and the ratio of support/catalyst mass to cell-
volume in Equation (13) (mc/V) can be replaced by the
initial value, rM0, found in Equation (2). Density increases
are related to the right-hand side term in the equation, with a
growing mass of accumulated polymer being added to that
of the support/catalyst initially present.
After fragmentation, Equation (10) still holds for the
calculation of the void fraction since, while microparticles
rearrange, cube-cell dimensions do not change. The density
can be calculated with Equation (13), by simply writing c
instead of c*, while the basic cube-cell-skeleton volume
remains constant.
Finally, when the porosity reaches the value, ea, corres-
ponding to the end of the microparticle arrangement
process,[6] cell density reaches its maximum; from here
on, porosity does not change and the arrangement of
microparticles will grow because of polymer accumulation
without change in cell morphology (constant ea). Conse-
quently, there will be a gradual decrease in cell density
because of polymer accumulation. The fraction of void
volume is maintained, but the microparticles forming the
solid phase turn into a lighter material with an ever-
increasing ratio of polymer-mass to support/catalyst-mass
as time passes. The equation for the cell density after
rearrangement is dominated by the constant-porosity ea
condition. The expressions for the whole cell volume,V, and
Behavior of Active Sites in a Changing, Supported Metallocene Catalyst Particle: . . . 1015
Macromol. Mater. Eng. 2004, 289, 1012–1026 www.mme-journal.de � 2004 WILEY-VCH Verlag GmbH & Co. KGaA, Weinheim

the support/catalyst and polymer volumes, Vc and Vp,
respectively, are:
V ¼ Vc þ Vp
1 � ea
ð14Þ
Vc ¼ ð3n� 2 þ aÞð4=3ÞpR3C ð15Þ
Vp ¼ ð3n� 2 þ aÞð4=3ÞpR3Cðc3 � 1Þ ð16Þ
The cell density at any given time, after rearrangement is
completed, can be calculated with the expressions in
Equation (14)–(16):
r ¼rsVc þ rpVp
Vð17Þ
r ¼ ð1 � eaÞ rs
1
c3þ rp 1 � 1
c3
� �� �ð18Þ
The behavior of the macroparticle density at very long time
approaches a final, limiting value fixed by porosity and
polymer density:
limc!1
r ¼ ð1 � eaÞ½rp� ¼ rMf ð19Þ
The density evolution of any cubic-cell in the macroparticle
follows a typical hump-type plot, as predicted by the model.
The curves are shown in Figure 2, in which density for a cell
is plotted vs. time. Conditions are the same as those given in
Table 1, except for the polymerization rate used, with a
kinetic factor, kf¼ 3. The results for three cells at dimen-
sionless radial positions 0, 0.5 and 1 inside the macro-
particle are presented. Fragmentation points are indicated
using the c* symbol. In the portions of the evolution
immediately before and after the fragmentation points,
density increases with time in all three cells shown because
of pore-filling by the polymer, whereas the cell volume is
unchanged. Density reaches a maximum value when rear-
rangement is finished, with porosity reaching e¼ ea. After
this point, the cell density decreases with an increasing
polymer mass fraction. A flat, almost horizontal portion of
the curves indicates a final value if the time is sufficient. For
the innermost cells, a fraction of the residence time in the
reactor is spent prior to fragmentation, signaling a lower
contribution to polymer production during this period.
For the parameters given in Table 1 and the correspond-
ing equations, cell density values in Figure 2 are 449.8 kg/
m3 at c*¼ 1.1, 770.8 kg/m3 at ea¼ 0.409, and 531.9 kg/m3
for long periods of time.
The analysis of density evolution above can be applied
to the macroparticle in Figure 1 to stress the simultaneous
presence of cells with microparticles in various arrange-
ments at any given time during the particle residence in the
reactor fluid. Figure 3 depicts the three regions participating
to different degrees of activity in the overall particle produc-
tion. Through the cell density at each stage, the progress in
the morphology-modification sequence is depicted. The
pictures for three typical cells after 200 s in the reactor are
schematically shown in Figure 3, for the conditions used to
compute the plots in Figure 2.
The nonfragmented nucleus (a) in the macroparticle in
Figure 1 is related to the cell schematically shown in the left,
upper region of Figure 3; this cell has not reached fragmen-
tation. The cube-cell not only keeps its initial dimensions,
but also the original microparticle distribution. Although
polymerization takes place, the net polyolefin accumulation
is relatively low, and thus, cell fragmentation occurs at
approximately 500 to 1 000 s. This piece of information is
important since, according to model predictions, a portion
of the microspheres will participate actively only after seve-
ral minutes in the reactor. Region (b) in the macroparticle in
Figure 1 is represented with the scheme in the left, lower
portion of Figure 3. Here, the cell has passed the fragmen-
tation point and is undergoing microparticle rearrangement,
while the cube-cell keeps the original dimensions. Finally,
the bottom-right schemes in Figure 3 correspond to cells in
region (c) of the macroparticle. Microparticles have passed
the ea mark, showing constant porosity and falling density
during this stage. The cell is no longer tied to the initial lcvalue, since the microparticles grow and push the outer limit
of the macroparticle constantly.
The general distribution of cells according to their mor-
phology in Figure 3 is representative of any typical polyme-
rization. However, the duration of each stage may vary
substantially, being a strong function of catalyst activity and
monomer concentration. The scheme in Figure 3 is com-
mon to a variety of process situations in future sections of
this work, but with varying time scales.
Figure 2. Cell density vs. time for kf¼ 3; cells located at theexterior (rM/RM¼ 1), at the center (rM/RM¼ 0) and at half theradius (rM/RM¼ 0.5) of the macroparticle. For all other conditions,see Table 1.
1016 M. G. Chiovetta, D. A. Estenoz
Macromol. Mater. Eng. 2004, 289, 1012–1026 www.mme-journal.de � 2004 WILEY-VCH Verlag GmbH & Co. KGaA, Weinheim

Reactor Feasible Operation Domain
Polyolefin synthesis is an exothermic process: in most
industrial technologies, the heat balance is the determining
factor in the reactor design. Industrial syntheses are affected
by the manner of how both the particles and the reactor deal
with the heat of polymerization and convey it to the exterior.
The case under study in this work corresponds to one of the
most favorable situations with regard to heat management,
since polymerization is performed in a CSTR with a well-
stirred liquid slurry carrying the growing support-catalyst-
polymer micro-reactors.
To perform the analysis of the active-site performance in
the macroparticle, the first set of data obtained from the
model is devoted to finding the thermal conditions the
macroparticle must tolerate in the reactor. In this section,
heat transfer is studied for various fluid temperatures and
stirring conditions, to establish the parameter range in
which the macroparticle will polymerize efficiently.
Heat Transfer from the Macroparticle
The Ranz-Marshall[14] and Nelson-Galloway[15] correla-
tions are used to model h, the heat transfer coefficient
between the particle and the surrounding fluid, as well as the
manner in which it varies with time as particle temperature
and dimensions change due to polymerization. Both corre-
lations are expressions for the Nusselt number as functions
of Prandtl and Reynolds numbers for a single sphere of
diameter, dp, into a fluid medium with density, rf, viscosity,
mf, heat capacity, Cpf, and thermal conductivity, ktf. The
main variable in the heat transfer analysis is h, whereas the
parameter considered is u, the particle velocity relative to
the fluid, as they appear in the Nu and Re numbers:
Nu ¼ hdp
ktf
ð20Þ
and
Re ¼ rfudp
mf
: ð21Þ
The Prandtl number, a relationship among the fluid
thermal properties and its viscosity is:
Pr ¼ mfCpf
ktf
: ð22Þ
The expression for the Ranz-Marshall’s correlation is:
Nu ¼ 2 þ 0:6Re1=2Pr1=3: ð23Þ
The Nelson-Galloway’s equation is:
Nu ¼2zþ 2z2ð1�cÞ1=3
1�ð1�cÞ1=3½ �2� 2
� �
z1�ð1�cÞ1=3 � tanh zh i ½ð1 � cÞ�1=3 � 1�; ð24Þ
where:
z ¼ ½ð1 � cÞ�1=3 � 1� b2Re1=2Pr1=3: ð25Þ
The equations above show functional relationships for
the Nu with the Re and Pr, the difference between the
expressions being the presence of a fluid volumetric
fraction, c, in the slurry, and of a bed-porosity related
functional z to include particle-to-particle effects in
Equation (24).
Figure 3. Microparticle arrangements after 200 s of polymerization; cube-cellslocated in the nucleus (top, left, rM< rM1), in the zone undergoing rearrangement(bottom, left, rM1< rM< rM2) and in the region with rearrangement completed(bottom, right, rM> rM2) of the macroparticle. Kinetic factor, kf¼ 3; for all otherconditions, see Table 1.
Behavior of Active Sites in a Changing, Supported Metallocene Catalyst Particle: . . . 1017
Macromol. Mater. Eng. 2004, 289, 1012–1026 www.mme-journal.de � 2004 WILEY-VCH Verlag GmbH & Co. KGaA, Weinheim
For the CSTR hosting the polymerization in a liquid
slurry under pseudo steady-sate conditions, a relatively
uniform fluid environment around a particle can be assum-
ed. From a global reactor perspective, the system is
homogeneous because the particle size distribution remains
virtually constant and is only affected by relatively neg-
ligible catalyst-input and product-output. However, the
conditions within each particle vary due to changes in
morphology and size during polymerization. Density chan-
ges may become relevant to the particle dynamics in the
fluid medium, but are of relative importance for the heat-
transfer correlations, affected mostly by the properties of
the liquid bulk phase. Conversely, the film heat-transfer
coefficient, h, is affected by macroparticle size.
To introduce several mixing conditions in a typical slurry
into the model, values of the macroparticle velocity, u, with
respect to the fluid are selected, ranging from 0.01 up to
0.1 m/s. For the fluid conditions under analysis, these
figures for u correspond to Reynolds numbers of 1.89 and
18.9, respectively, for a support-catalyst initial particle
diameter of 90 mm (Table 1) and TB¼ 323 K. These values
of Re0 are typical of laboratory slurries. A similar level of
mixing is also likely in commercial reactors, in which
values for the initial Reynolds number of the order of 1 to
10 times the base-case figures are, again, to be expected.
This is indicated in this work by means of factors, Ref,
ranging from 1, corresponding to Re0¼ 1.89 for the base-
case, to 10.
As it can be seen in Equation (23) and (25), the film
coefficient decreases with particle growth. However, and as
it was stated in ref.[12,13] in spite of the decay in h, the factor
effectively controlling the heat transfer is the product of
the film coefficient times the external area of the particle.
Because of the square-power dependence of hdp2 with the
particle size, the net heat transfer rate always increases with
polymerization, with a stronger dependence on dp for larger
radii.
Both the Ranz-Marshall and Nelson-Galloway correla-
tions are used in the model to predict temperature evolu-
tions, always choosing the most conservative result. The
goal is to detect the conditions for the polymerization such
that the particle will not be subject to temperatures above
383 K, as shown in what follows.
Maximum Temperatures
Maximum particle temperature is one of the parameters that
establishes the bounds of the practical operating-variable
domain in polyolefin reactors.[6,13,16] Although severe over-
heating is to be expected in industrial gas-phase polyolefin
synthesis,[17] heat transfer conditions are usually milder in
liquid-phase processes. If a thermal runway situation arises,
the macroparticle will not be able to evacuate the heat of
polymerization to the fluid at a rate high enough to keep the
temperature within controllable operational limits. In fact,
runaway conditions restrict the actual productivity of a
reactor, this being particularly important in gas-phase pro-
cesses, where, despite high-activity catalysts and significant
monomer pressures, the effective bound for the maximum
attainable yield is fixed by heat transfer conditions.
The model predictions for the thermal behavior of a
macroparticle in the case of the liquid slurry being studied,
under several operating conditions, are presented in
Figure 4.
When the system of equations [Equation (A-1)–(A-11),
Appendix] is simultaneously solved by the algorithm, the
value of T(rM,t) in the equations is predicted by the model.
The maximum value, Tmax, of the said variable, T(rM,t),
predicted at any point in the macroparticle during its resi-
dence time in the reactor is displayed in Figure 4. Maximum
temperatures reached in the particle are studied when
several values of the activity factor, kf, and the concentra-
tion factor, Cf, are employed. Simulations were performed
for the pairs, (kf,Cf)¼ (1,1), (2,2), (3,3), (4,4), (5,5) and
(6,6). Since kf¼Cf for all pairs, the plots are shown as
functions of (kf �Cf)1/2. The other independent variable in
the plot is the fluid temperature, TB, in the CSTR. This
variable stretches between 323 and 353 K, with the range
selected taking into consideration that fluid temperatures
below 323 K will diminish the reaction rate significantly,
whereas temperatures above 353 K will negatively affect
the heat transport from the particle to the fluid. The
parameter in the plot is the Reynolds factor, Ref.
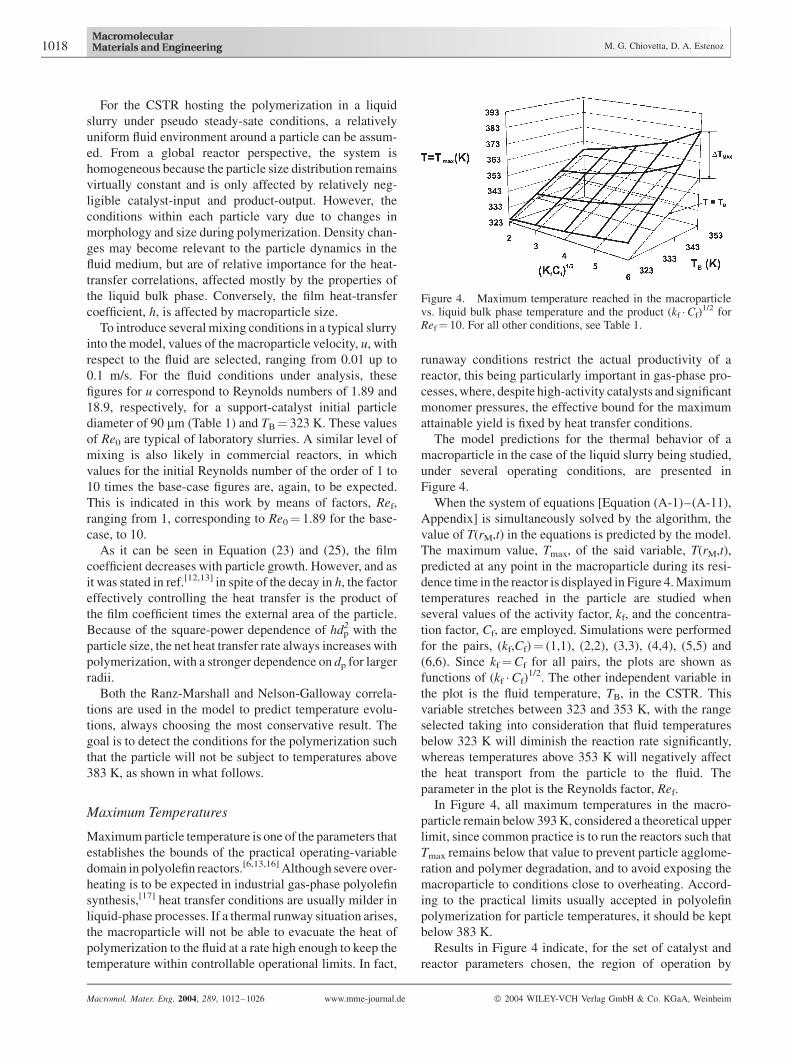
In Figure 4, all maximum temperatures in the macro-
particle remain below 393 K, considered a theoretical upper
limit, since common practice is to run the reactors such that
Tmax remains below that value to prevent particle agglome-
ration and polymer degradation, and to avoid exposing the
macroparticle to conditions close to overheating. Accord-
ing to the practical limits usually accepted in polyolefin
polymerization for particle temperatures, it should be kept
below 383 K.
Results in Figure 4 indicate, for the set of catalyst and
reactor parameters chosen, the region of operation by
Figure 4. Maximum temperature reached in the macroparticlevs. liquid bulk phase temperature and the product (kf �Cf)
1/2 forRef¼ 10. For all other conditions, see Table 1.
1018 M. G. Chiovetta, D. A. Estenoz
Macromol. Mater. Eng. 2004, 289, 1012–1026 www.mme-journal.de � 2004 WILEY-VCH Verlag GmbH & Co. KGaA, Weinheim

means of a curved surface. Although it is not indicated in the
plots, Tmax develops at early stages during polymerization,
when the less favorable conditions related to the product,
hdp2 mentioned in the previous section are present. As
expected, macroparticle temperatures are higher for hotter
slurries as shown by the surface in the figure, with the
liquid-slurry temperature, TB, having a direct impact on the
particle temperature. Nonetheless, even considering DTmax
for the points in the curve with the highest value of TB
(TB¼ constant¼ 353 K), it is apparent from the figure that
the maximum temperature in the particle does not increase
substantially with (kf,Cf). This fact allows operation with
very active catalysts and high monomer concentrations in
the slurry.
Microparticle Effectiveness DuringPolymerization
Once no thermal limitations are found for the operating
conditions in the reactor, the analysis of the effectiveness of
the macroparticle as a micro-reactor is in order.
The polymer yield for the conditions used to explore the
domain in Figure 4 is considered in the first place. Results
are presented in Table 3 for Ref¼ 10. Yields in kg of poly-
mer per kg of the support-catalyst complex fed to the reactor
for a residence time of 8 000 s are displayed for slurry
temperatures, TB, between 323 and 353 K, and for the pairs,
(kf,Cf)¼ (2,2), (3,3), (4,5), (5,5) and (6,6). To stress the fact
that both the reaction rate and the monomer concentration
are increased at each point, Table 3 displays in the left-most
column the product, kf �Cf.
From the analysis of the figures in the table, it can be
observed that the larger kf �Cf, the higher the yield, as one
would expect. However, the growth of the latter is essen-
tially linear when the former is increased following a square
power. Additionally, raising the liquid temperature in the
slurry produces an increase in yield as expected, according
to the range for TB in the previous section. If percentage
variations are considered for yields at any given kf �Cf, it can
also be seen that the incremental rate decreases indicating
that, when higher kinetics are proposed, the raise in produc-
tivity exists, but at an ever-decaying incremental rate.
To explore the reasons for this behavior, a closer look at
the evolution of the microparticles inside the macroparticle
is performed. Two important variables are followed in time:
a) the monomer concentration available at the active sites
rendered dimensionless with the bulk liquid phase value
and b) the microparticle growth factor, cL, as defined in
Equation (1).
Since a typical macroparticle may have more than 1 000
cube-cell layers in its radius, it is of practical interest to
choose a few layers to follow the variables in the paragraph
above in a manner representative of their distribution in the
macroparticle. Typically, the outer- and inner-most layers
are chosen. In Figure 2, a third layer located at half the
macroparticle radius was chosen to complete the study at
three representative depths inside the macroparticle. At this
particular stage in the analysis, it is better to choose as the
interior representative layer that corresponding to the
surface that divides the sphere in two portions of equal
volume.With thisapproachandgiventhespherical symmetry
of the macroparticle, this layer will be a better representation
of an interior microsphere since, at initial conditions, the
number of active sites located towards the interior and the
exterior of the layer is approximately the same.
Considering the support-catalyst, initial particle as the
reference state to compute the radius at half-the-volume, the
value for such radius termed RHV is:
VM
2¼ 1
2ð4=3pR3
M0Þ ¼ ð4=3pR3HVÞ ) RHV ¼ RM0=ð2Þ1=3
¼ 0:794RM0 ð26Þ
With these considerations, the monomer concentrations are
explored in the case of a system with Ref¼ 10, TB¼ 323 K,
and with kf �Cf¼ 1 and 25, for microparticles located in
layers at the center, the outside and limiting the half-volume
of a macroparticle, respectively. For this system, the dimen-
sionless monomer concentrations available in the cell-pores
for the microparticles at said locations are plotted as a
function of time in Figure 5. The full lines correspond to the
base case scenario with kf �Cf¼ 1, whereas the dotted
lines show the concentration evolution when a very active
catalyst is placed in a concentrated monomer environment
(kf �Cf¼ 25).
Table 3. Polymer yield at 8 000 s for several activities andtemperatures (Ref¼ 10).
kf �Cf TB Polymer yield Maximum temperature
K kg/kg K
4 323 8 603 324.25333 11 992 334.84343 13 344 345.61353 14 179 356.67
9 323 17 793 325.49333 22 159 336.66343 23 742 348.25353 24 911 360.36
16 323 29 154 327.13333 33 602 339.16343 35 559 352.02353 37 173 366.03
25 323 42 016 329.27333 46 199 342.60343 48 588 357.66353 49 560 371,12
36 323 55 852 332.11333 59 802 347.65343 62 792 361.30353 64 048 382.00
a)All other conditions as given in Table 1.
Behavior of Active Sites in a Changing, Supported Metallocene Catalyst Particle: . . . 1019
Macromol. Mater. Eng. 2004, 289, 1012–1026 www.mme-journal.de � 2004 WILEY-VCH Verlag GmbH & Co. KGaA, Weinheim
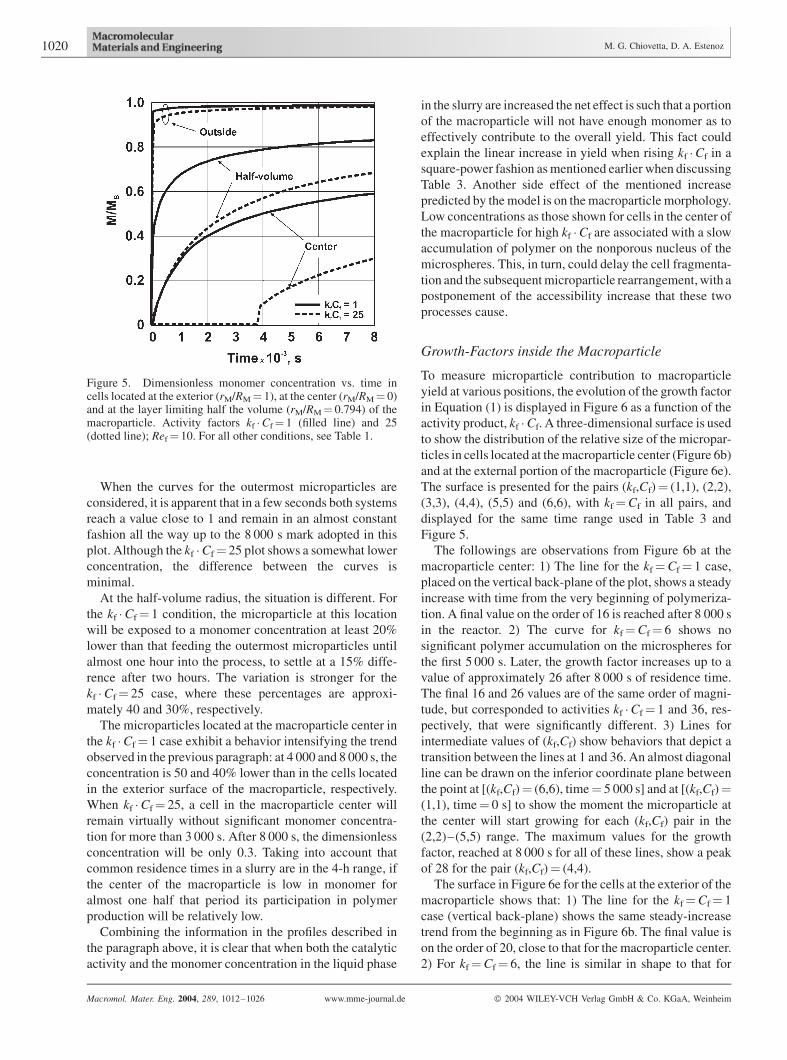
When the curves for the outermost microparticles are
considered, it is apparent that in a few seconds both systems
reach a value close to 1 and remain in an almost constant
fashion all the way up to the 8 000 s mark adopted in this
plot. Although the kf �Cf¼ 25 plot shows a somewhat lower
concentration, the difference between the curves is
minimal.
At the half-volume radius, the situation is different. For
the kf �Cf¼ 1 condition, the microparticle at this location
will be exposed to a monomer concentration at least 20%
lower than that feeding the outermost microparticles until
almost one hour into the process, to settle at a 15% diffe-
rence after two hours. The variation is stronger for the
kf �Cf¼ 25 case, where these percentages are approxi-
mately 40 and 30%, respectively.
The microparticles located at the macroparticle center in
the kf �Cf¼ 1 case exhibit a behavior intensifying the trend
observed in the previous paragraph: at 4 000 and 8 000 s, the
concentration is 50 and 40% lower than in the cells located
in the exterior surface of the macroparticle, respectively.
When kf �Cf¼ 25, a cell in the macroparticle center will
remain virtually without significant monomer concentra-
tion for more than 3 000 s. After 8 000 s, the dimensionless
concentration will be only 0.3. Taking into account that
common residence times in a slurry are in the 4-h range, if
the center of the macroparticle is low in monomer for
almost one half that period its participation in polymer
production will be relatively low.
Combining the information in the profiles described in
the paragraph above, it is clear that when both the catalytic
activity and the monomer concentration in the liquid phase
in the slurry are increased the net effect is such that a portion
of the macroparticle will not have enough monomer as to
effectively contribute to the overall yield. This fact could
explain the linear increase in yield when rising kf �Cf in a
square-power fashion as mentioned earlier when discussing
Table 3. Another side effect of the mentioned increase
predicted by the model is on the macroparticle morphology.
Low concentrations as those shown for cells in the center of
the macroparticle for high kf �Cf are associated with a slow
accumulation of polymer on the nonporous nucleus of the
microspheres. This, in turn, could delay the cell fragmenta-
tion and the subsequent microparticle rearrangement, with a
postponement of the accessibility increase that these two
processes cause.
Growth-Factors inside the Macroparticle
To measure microparticle contribution to macroparticle
yield at various positions, the evolution of the growth factor
in Equation (1) is displayed in Figure 6 as a function of the
activity product, kf �Cf. A three-dimensional surface is used
to show the distribution of the relative size of the micropar-
ticles in cells located at the macroparticle center (Figure 6b)
and at the external portion of the macroparticle (Figure 6e).
The surface is presented for the pairs (kf,Cf)¼ (1,1), (2,2),
(3,3), (4,4), (5,5) and (6,6), with kf¼Cf in all pairs, and
displayed for the same time range used in Table 3 and
Figure 5.
The followings are observations from Figure 6b at the
macroparticle center: 1) The line for the kf¼Cf¼ 1 case,
placed on the vertical back-plane of the plot, shows a steady
increase with time from the very beginning of polymeriza-
tion. A final value on the order of 16 is reached after 8 000 s
in the reactor. 2) The curve for kf¼Cf¼ 6 shows no
significant polymer accumulation on the microspheres for
the first 5 000 s. Later, the growth factor increases up to a
value of approximately 26 after 8 000 s of residence time.
The final 16 and 26 values are of the same order of magni-
tude, but corresponded to activities kf �Cf¼ 1 and 36, res-
pectively, that were significantly different. 3) Lines for
intermediate values of (kf,Cf) show behaviors that depict a
transition between the lines at 1 and 36. An almost diagonal
line can be drawn on the inferior coordinate plane between
the point at [(kf,Cf)¼ (6,6), time¼ 5 000 s] and at [(kf,Cf)¼(1,1), time¼ 0 s] to show the moment the microparticle at
the center will start growing for each (kf,Cf) pair in the
(2,2)–(5,5) range. The maximum values for the growth
factor, reached at 8 000 s for all of these lines, show a peak
of 28 for the pair (kf,Cf)¼ (4,4).
The surface in Figure 6e for the cells at the exterior of the
macroparticle shows that: 1) The line for the kf¼Cf¼ 1
case (vertical back-plane) shows the same steady-increase
trend from the beginning as in Figure 6b. The final value is
on the order of 20, close to that for the macroparticle center.
2) For kf¼Cf¼ 6, the line is similar in shape to that for
Figure 5. Dimensionless monomer concentration vs. time incells located at the exterior (rM/RM¼ 1), at the center (rM/RM¼ 0)and at the layer limiting half the volume (rM/RM¼ 0.794) of themacroparticle. Activity factors kf �Cf¼ 1 (filled line) and 25(dotted line); Ref¼ 10. For all other conditions, see Table 1.
1020 M. G. Chiovetta, D. A. Estenoz
Macromol. Mater. Eng. 2004, 289, 1012–1026 www.mme-journal.de � 2004 WILEY-VCH Verlag GmbH & Co. KGaA, Weinheim

(kf,Cf)¼ (1,1), with larger polymer accumulation for all
times. A final value of 65 is observed. 3) Intermediate lines
for (kf,Cf) ranging from (2,2) to (5,5) show analogous
behaviors, with maximum values for the growth factor, all at
8 000 s, monotonously increasing from the already men-
tioned 20 to 65.
The rate of increase of the growth factor decreases with
time in both Figure 6b and e regardless of kf �Cf. This is a
consequence of the plots showing cL, a measure of the
growth of the microparticle radius, Rm, as a function of
time. The phenomenon driving the growth is polymer-mass
accumulation; assuming constant polymer-stratum density
in the microparticle, the determining force is polymer-
volume accumulation which is a cubic function of Rm and,
hence, cL.
If model predictions in parts (b) and (e) are compared the
first observation is consistent with the findings in Figure 5
for monomer concentration in the cells. The growth of a
microparticle is driven by polymer accumulation on the
microsphere nonporous nucleus. For a microparticle, the
catalytic activity for any chosen kinetic factor, kf, is cons-
tant with time; hence, the variation in monomer availability
is the deciding factor in terms of the extent of polymeriza-
tion at this particular microparticle. A better look at cell
concentrations is in order, since it appears as being the
dominating variable in the process.
ConcentrationDistributionsAcross theMacroparticle
Monomer concentration evolution at the macroparticle
locations already employed in Figure 5 were obtained for
the set of simulation-runs corresponding to Table 3 and
Figure 6; results are shown in Figure 7. Curves for the
dimensionless monomer concentration in cells at the center,
the layer dividing the macroparticle volume in half, and the
exterior layer are plotted as a function of time, with the
product, kf �Cf, as the parameter. The effect of increasing
either kf or Cf was found to show no symmetry. Hence, to
maintain the comparison basis kf �Cf is set equal to 1, 4, 9,
16, 25 and 36 in all cases, but three columns are presented
in Figure 7. They show for each of these products the effect
of achieving them with values of kf<Cf (left column),
with kf¼Cf (center column), and with kf>Cf (right
column). The exact values employed for kf and Cf are
given in Table 4.
From the curves corresponding to kf¼Cf, it is possible to
observe the trend depicted in Figure 5, now for the various
pairs (kf,Cf) employed: 1) External cells rapidly enjoy and
steadily maintain high values of the monomer concentra-
tion for all (kf,Cf) cases, with maximum differences below
3% between the curves corresponding to the limiting case
for (1,1) and (6,6) presented. 2) At the half-volume position,
cells show a decay in concentration, more pronounced for
the higher values of (kf,Cf). Curves also indicate through the
shift of the shapes to the right that longer times are required
to reach a stable, practically flat profile. 3) For the innermost
cells, the situation is similar to that in the layer at half-
volume for (kf,Cf)¼ (1,1) and (2,2). However, a depletion in
monomer availability is observed for (kf,Cf)¼ (3,3) to (6,6).
As seen before, the period of time elapsed with the cell
practically not performing any polymerization due to lack
of monomer is longer for higher (kf,Cf). For (5,5) and (6,6),
the inner cells remain inactive for almost one half of the
macroparticle overall residence time in the reactor.
Figure 6. Microparticle growth factor vs. time and the product (kf �Cf)1/2, in cells located at
the center [(a), (b) and (c)] and at the exterior [(d), (e) and (f)] of the macroparticle, for kf<Cf
(left column), kf¼Cf (center column) and kf>Cf (right column); Ref¼ 10. For all otherconditions, see Table 1.
Behavior of Active Sites in a Changing, Supported Metallocene Catalyst Particle: . . . 1021
Macromol. Mater. Eng. 2004, 289, 1012–1026 www.mme-journal.de � 2004 WILEY-VCH Verlag GmbH & Co. KGaA, Weinheim

A different situation is predicted if the values of kf and Cf
are varied according to Table 4 to explore the effect of
relatively increasing/decreasing concentration vs. kinetics,
keeping the product kf,Cf constant for comparison purposes.
For the outermost cells in the upper rectangles in Figure 7,
there is no significant modification in the profiles when kf is
relatively increased or decreased with regard to Cf. Curves
are essentially those observed in the situation with kf¼Cf.
Nonetheless, observing the plots in detail, it can be noted
that when kf<Cf the line for the evolution with kf �Cf¼ 36
is closer to that for kf �Cf¼ 1 than it is when kf¼Cf.
Conversely, if kf>Cf plots for kf �Cf¼ 36 and 1 are more
separated if, again, compared with those in the kf¼Cf case.
Please note that for kf �Cf¼ 1 the lines depicting the
concentration evolution are exactly the same for the plots in
all three vertical columns following the definitions in
Table 4 (those for kf<Cf, kf¼Cf and kf>Cf, respectively).
The rectangles containing the plots located in the middle
horizontal section of Figure 7 contain the monomer concen-
tration evolution for the cells locates in the layer separating
the macroparticle into two equal volume domains. Here, the
effect described in the precedent paragraph is repeated.
Again, all curves for kf �Cf¼ 1 are identical in the left,
central and right half-volume individual plots and serve as a
reference. Increasing kf vs. Cf reduces the monomer
availability at all values of kf �Cf, the higher the product,
the stronger the effect. In practical terms, if one takesM/MB
for kf �Cf¼ 36 at a macroparticle residence time of 4 000 s,
half-way to the exit, when kf<Cf monomer concentration
is 50% higher than for kf>Cf. (M/MB¼ 0.6 and 0.4,
respectively). And additional fact related to the increasing
dominance of kf can be seen from the plots: a) For kf>Cf the
plots separate rapidly from the kf �Cf¼ 1 reference line. For
kf �Cf¼ 4, the departure is already noticeable. b) When
kf<Cf, it can be observed that the plot for kf �Cf¼ 4, with
kf¼ 1.333 and Cf¼ 3, crosses above the line for kf �Cf¼ 1,
showing for the first time a sequence inversion considering
the order when increasing kf �Cf that, up to this point, shows
a monotonous behavior.
As expected, for the three plots corresponding to the cells
in the macroparticle center, at the bottom horizontal band in
Figure 7, the plots describe a behavior conceptually similar
to that for the half-volume cells but stronger.
For kf �Cf¼ 36 and kf>Cf, the innermost cells do not
contribute substantially to the polymerization process since
Figure 7. Dimensionless monomer concentration vs. time for activity factors (kf �Cf)¼ 1,4, 9, 16, 25, and 36, in cells located at the exterior (rM/RM¼ 1), at the center (rM/RM¼ 0) andat the layer limiting half the volume (rM/RM¼ 0.794) of the macroparticle, for kf<Cf (leftcolumn), kf¼Cf (center column) and kf>Cf (right column); Ref¼ 10. For all otherconditions, see Table 1.
Table 4. Values of kf and Cf used in Figure 7.
kf �Cf kf>Cf kf¼Cf kf<Cf
kf Cf kf Cf kf Cf
1 1.000 1.000 1 1 1.000 1.0004 3.000 1.333 2 2 1.333 3.0009 4.000 2.250 3 3 2.250 4.000
16 5.000 3.200 4 4 3.200 5.00025 6.000 4.166 5 5 4.166 6.00036 7.000 5.143 6 6 5.143 7.000
1022 M. G. Chiovetta, D. A. Estenoz
Macromol. Mater. Eng. 2004, 289, 1012–1026 www.mme-journal.de � 2004 WILEY-VCH Verlag GmbH & Co. KGaA, Weinheim

little monomer is available for the reaction in the active sites
at this location. Once more, the separation between the plots
for kf �Cf¼ 1 and 4 is more pronounced than in the half-
volume cells in Figure 5.
Conversely, if kf<Cf, monomer concentration for
kf �Cf¼ 36 starts to grow at around 2 700 s and reaches a
value close to 0.4 at 8 000 s, this implying a considerable
improvement with regard to the kf>Cf condition. Again, an
inversion is observed when kf<Cf in the sequence for
the curves: concentrations for the curve at kf �Cf¼ 4 run
above those for kf �Cf¼ 1, as it was the case at the half-
volume radius.
It is now convenient to mention that these concentration
distributions correlate with the growth factors at the macro-
particle center in the sections termed (a) and (c) in Figure 6:
for the kf>Cf case, the surface in the macroparticle center
is mostly flat, indicating very small microparticles in the
cells; when kf<Cf, the whole surface is mostly separated
from the zero-value bottom coordinate plane, indicating
microparticles contribute to yield even deep in the
macroparticle.
As shown in the upper plots in Figure 7, the outermost
microparticles behave similarly regardless of the relative
values of kf and Cf. Consequently, three-dimensional plots
(d), (e) and (f) in Figure 6 are almost identical.
Exploring Kinetics vs. Concentration Effects
The analysis of the data in the previous section indicates
that the overall efficiency of the polyolefin production will
be affected dissimilarly if, to increase overall productivity,
the catalyst activity and the monomer concentration are
raised in a different manner. Figure 8 is devoted to analy-
zing the practical impact of the relative values of kf and Cf
upon the macroparticle behavior, and, hence, the polymer-
ization yield. First, a dimensionless relative polymer yield
is introduced as the ratio of the yield attained with a given
pair (kf,Cf) to that at kf �Cf¼ 1. Then, in Figure 8, this
relative yield is plotted as a function of kf �Cf for three
situations, namely at kf>Cf, kf¼Cf and kf<Cf. The
relative polymer yield is used as a measure of the reactor
efficiency when kinetics and concentration effects are
studied. A 458 dotted line in the plot is placed to make the
deviations from the behavior at kf �Cf¼ 1 visible. The
specific yields corresponding to the products 1, 4, 9, 16, 25
and 36 are shown in Figure 8.
First, it is predicted that higher yields are obtained when
the catalyst is designed and the reactor conditions selected
in a manner such that concentrations are predominant over
kinetic constants. The curve for relative yields correspond-
ing to kf<Cf is always above that for the inverse relation-
ship, with the line for kf¼Cf placed in between them. For
kf �Cf¼ 25, yields are approximately 40% higher if Cf> kf
when compared with case at Cf< kf (relative yields of 21
and 15, respectively).
As hinted to in Figure 7 by the sequence inversion
observed in the half-volume and center-cell plots when
kf<Cf, the corresponding relative polymer yield curve lies
above the 458 reference line, indicating, for low kf �Cf, an
efficiency higher than that in the reference (1,1) case.
Another general observation from the modeled results in
Figure 8 is that related to the fact that in all cases, save the
domain kf �Cf¼ [1–9], higher activities are followed by a
decrease in relative yield regardless of the relative monomer
concentration value. The plots in the indicated range bend
downwards for increasing activities, moving away from the
458 reference line.
As a general note, model predictions presented in
Figure 5–8 suggest a shift in the relative role played by
transport and kinetics in the highly nonlinear transport and
reaction processes taking place inside the macroparticle
concurrently with morphology changes. More active cat-
alysts are in principle desired, as well as higher monomer
concentrations in the liquid bulk-phase of the slurry.
However, the higher reaction rates associated with this
raise in kf �Cf could also produce a more rapid decay of the
reactant locally, in each of the cells. Additionally, cells
inside the particle are depending on the monomer amounts
existing in cells exteriorly located. If the latter are consum-
ing the monomer at a faster rate, less will be available for
active sites located to the macroparticle interior. This
situation is compounded with the fact that if monomer
access is more time-consuming and, consequently, polymer
accumulation slower, fragmentation, needed to increase
accessibility, will be further delayed.
Since fragmentation is strongly dependent on the struc-
tural properties of the support, the picture presented here
Figure 8. Relative macroparticle polymer yield vs. activityfactor kf �Cf, for kf>Cf, kf¼Cf and kf<Cf. Ref¼ 10. For allother conditions, see Table 1.
Behavior of Active Sites in a Changing, Supported Metallocene Catalyst Particle: . . . 1023
Macromol. Mater. Eng. 2004, 289, 1012–1026 www.mme-journal.de � 2004 WILEY-VCH Verlag GmbH & Co. KGaA, Weinheim

can be intensified or minimized according to the higher or
lesser breaking resistance of the silica matrix. It becomes
apparent at this point that the model can be used to predict
these trends provided the proper parameters, in particular,
the critical accumulation, c*, corresponding to the specific
support being studied is included in the model.
Conclusion
The cube-cell model and a set of parameters were used to
predict the behavior of the support-catalyst-polymer parti-
cle in the reactor. With this mathematical tool, it is possible
to build a realistic representation of the morphologies for
some typical silica supports employed in high-activity
metallocene-catalyst preparation into the model. The mo-
del, in turn, allows the coupling of the polymerization/heat-
and mass-transfer analysis with the transient in the
macroparticle structure occurring during particle growth.
In this work, the main effort is focused on modeling the
overall picture (transportþ polymerizationþmorphology
changes) despite complications derived from not assuming
instant fragmentation.
The model has shown its ability to predict the porosity
and density changes undergone by the macroparticle and
their interaction with the transport/polymerization phe-
nomena determining the said changes. The evolution of
these variables is followed by the model concurrently with
the changes in chemical and transport forces producing the
structural changes, thus recognizing their interactive nature.
Scouting simulations were performed with the model
under various operating conditions to assess the relative
significance of several variables of the process for a set of
typical silica-supported metallocene-based catalysts. Para-
meters used in the simulations to tailor-make polymeriza-
tion conditions are the kinetic constant, through the number
and chemical nature of the active sites deposited on the
microparticle nonporous nucleus, and the amount of mono-
mer available in the reactor fluid phase. According to
simulations, for the parameters used the catalyst activity
and the monomer concentration have the expected impact
on polymer production, although not in a similar manner
when each of them is varied.
Modeling the several stages in the morphology-changes
translates into density variations for cells at different
locations inside the macroparticle. This density distribution
at any given time is the first indicator of the ability of the
microparticles to effectively contribute to the macroparticle
yield. The cells near the macroparticle center are always in a
less convenient position when compared with those located
closer to the liquid bulk-phase, in terms of reaching the
final, accessible microparticle configuration that emerges
after fragmentation and subsequent rearrangement. The
relative extent of the time needed to attain this final stage,
characterized by an almost constant density, when com-
pared with macroparticle residence time in the reactor indi-
cates the actual participation of a cell at any given location
within the support-catalyst-complex.
Heat transfer and temperature elevation during poly-
merization do not pose practical limitations to the process.
For the domain studied, no overheating was predicted by the
model.
One of the conclusions of the analysis is that increasing
the kinetic constant should not necessarily produce a
proportional increase in polymer production. Moreover,
predicted results show that it is more efficient to raise the
monomer availability in the bulk phase. The highly non-
linear coupling of: a) particle morphology changes at all
levels, b) monomer transport, and c) polymerization creates
complex situations reflecting the interactive nature of these
phenomena. In the particular case of the macroparticle
yield, simulations suggest as practical to increase monomer
concentrations in the liquid reactor-phase feeding the active
sites above any increase in catalyst activity. It is clear that
the results may vary for other support-catalyst systems and
their corresponding parameter sets. The relevant point is
that the model may prove useful to analyze prospective
reactor conditions for each support-catalyst system and its
data, to prevent potential problems in their usage and to help
in the optimization of the economics of the process.
Appendix
The macroparticle is modeled as a pseudo-homogeneous
medium containing a solid phase composed of cells with
microparticles (nonporous, support-catalyst solid micro-
spheres covered by a growing polymer stratum) and a
porous region through which the monomer gains access to
the active sites located in the microparticles.[6] Spherical
symmetry is assumed for microparticles and the overall
macroparticle. In turn, the polymer stratum on the micro-
spheres is treated as pseudo-homogeneous. Both the com-
position and the temperature in the liquid bulk phase are
uniform and constant. External mass transfer limitations are
neglected, as well as temperature gradients across the
polymer stratum covering the microspheres.
The equations for mass and energy balances within the
macroparticle are:
@MðrM; tÞ@ t
¼ 1
r2M
@
@rM
DL
tr2
M
@MðrM; tÞ@ rM
� �� RðrM; tÞ
eðrM; tÞðA-1Þ
@TðrM; tÞ@t
¼ 1
r2M
@
@ rM
kM
rMcpM
r2M
@MðrM; tÞ@ rM
� �
� DHrMcpM
RðrM; tÞ ðA-2Þ
1024 M. G. Chiovetta, D. A. Estenoz
Macromol. Mater. Eng. 2004, 289, 1012–1026 www.mme-journal.de � 2004 WILEY-VCH Verlag GmbH & Co. KGaA, Weinheim

@M
@rM
¼ 0;@T
@rM
¼ 0 rM ¼ 0; t ¼ t ðA-3Þ
M ¼ MB;@T
@rM
¼ h
kM
ðT � TBÞ rM ¼ RMðtÞ; t ¼ t
ðA-4Þ
M ¼ 0; T ¼ T0 rM ¼ rM; t ¼ 0 ðA-5Þ
The pseudo-homogenous rate of polymerization in Equa-
tion (A-1) and (A-2) is modeled as a continuous sink term
R(rM,t):
RðrM; tÞ ¼ ð2nÞ3ð1 � e0Þ½L3 � ðL� 1Þ3�4p3½ðRLðtÞÞ3 � ðRL�1ðtÞÞ3�
� 4pR2CkðTÞMCðrM; tÞ ðA-6Þ
with k, the kinetic constant per unit area, being a function of
temperature:
kðrM; tÞ ¼ kðT0Þ expE
Rg
1
T0
� 1
TðrM; tÞ
� �� �ðA-7Þ
At the microparticle level, the mathematical model includes
monomer transport across the polymer layer, and the
chemical reaction at the catalyst active sites is located on the
microsphere external surface boundary. The monomer first
dissolves into the polymer layer, and then moves across its
amorphous region, neglecting transport through the crystal-
line region. Temperature gradients in the polymer layer are
considered negligible. Expressions are:
a@M0ðrm; tÞ
@t¼ 1
r2m
@
@r
aDEP
tm
r2m
@M0ðrm; tÞ@rm
� �ðA-8Þ
aDEP
tm
@M0
@rm
¼ kM0 rm ¼ RC; t ¼ t ðA-9Þ
M0 ¼ ZMðrM; tÞ rm ¼ Rm; t ¼ t ðA-10Þ
@Rm
@ t¼ Mh i kR
2C
rp
M0ðRC; tÞR2
m
ðA-11Þ
The system of equations from Equation (A-1)–(A-11) are
solved simultaneously[6] using a numeric scheme.
Table 1 gives the parameters and constants employed in
the base, reference case used in the analysis.
Nomenclature
a number of additional microspheres added to the
basic cube-cell
b Iler’s coordination number
c dimensionless growth-factor for a microparticle in
a cube-cell
cpm macroparticle heat capacity (cal/kg �K)
c* growth factor at the fragmentation point
Cf concentration factor, ratio of MB to the base-case
monomer concentration in Table 1
Cpf slurry fluid-phase heat capacity (cal/kg �K)
dp macroparticle diameter (m)
DEP monomer diffusion coefficient in amorphous
polymer (m2/s)
DL monomer diffusion coefficient in the fluid medium
(m2/s)
E activation energy (cal/g �mol)
h macroparticle external heat-transfer coefficient
(cal/m2 � s �K)
k superficial kinetic constant (m/s)
kf kinetic factor, ratio of k to the base-case kinetic
constant in Table 1
kM macroparticle thermal conductivity (cal/m � s �K)
ktf slurry fluid-phase thermal conductivity
(cal/m � s �K)
lc characteristic edge dimension of a support cube-
cell (nm)
L macroparticle-layer number, with L¼ 1 at the
particle center
m mass (kg)
mc mass of supportþ catalyst in a cell (kg)
mp mass of polymer in a cell (kg)
M monomer concentration (mol/m3)
MB monomer concentration in the slurry fluid-phase
(mol/m3)
MC monomer concentration at the active sites (mol/m3)
M0 monomer concentration in the amorphous region of
the polymer layer(mol/m3)
hMi monomer molecular weight (kg/kg �mol)
n number of microspheres located between two
adjacent vertices of a support cube-cell
N overall number of layers in the macroparticle
NL number of microspheres in layer, L
Nu Nusselt number, Equation (20)
P pressure (atm)
Pr Prandtl number, Equation (22)
rm microparticle radial coordinate (nm)
rM macroparticle radial coordinate (mm)
R monomer consumption rate (mol/m3 � s)
RC radius of non-porous support microspheres in cube-
cell microparticles (nm)
Re Reynolds number, Equation (21)
Ref Reynolds number factor, ratio of Re0 to the base-
case initial Reynolds number of 1.89
Rg universal gas constant (cal/g �mol �K)
RHV radius of macroparticle layer, L, dividing the
macroparticle volume in two halves
RL external radius of macroparticle layer, L
Rm radius of microparticle (nm)
RM radius of macroparticle (mm)
RM0 radius of initial support-catalyst particle (mm)
t time (s)
Behavior of Active Sites in a Changing, Supported Metallocene Catalyst Particle: . . . 1025
Macromol. Mater. Eng. 2004, 289, 1012–1026 www.mme-journal.de � 2004 WILEY-VCH Verlag GmbH & Co. KGaA, Weinheim

T temperature (K)
T0 initial temperature of the particle (K)
TB slurry fluid-phase temperature (K)
u macroparticle velocity relative to the slurry fluid-
phase (m/s)
V cell volume (m3)
Vc support-catalyst volume in cell (m3)
Vp polymer volume in cell (m3)
Vsolid solid volume (m3)
VL layer-L volume (m3)
VM macroparticle volume (m3)
Greek Letters
a amorphous-phase volume fraction of the polymer
layer
b parameter in Equation (25), dimensionless value¼0.543
DH heat of polymerization (cal/g �mol)
e porosity
e0 initial porosity
ea final-product porosity, after the rearrangement pro-
cess is completed
e* cell porosity at fragmentation time
Z monomer-in-polymer solubility
mf slurry fluid-phase viscosity (kg/m � s)
r cell density (kg/m3)
rf slurry fluid-phase density (kg/m3)
rM macroparticle density (kg/m3)
rM0 initial support-catalyst particle density (kg/m3)
rMf final-product macroparticle density (kg/m3)
rp polymer density (kg/m3)
rs silica density (kg/m3)
t tortuosity in the macroparticle
tm chain immobilization factor
c slurry fluid-phase volumetric fraction
z Equation (25), functional in Nu expression in
Equation (24)
Subscripts
L corresponding to layer L
0 initially
Acknowledgements: The authors are deeply grateful to theUniversidadNacional del Litoral (CAIþD 4/23) and toCONICETand SETCIP for their financial support.
[1] M. G. Chiovetta, ‘‘Proceedings 2nd European Conference onthe Reaction Engineering of Polyolefins, ECOREP II’’,Lyon, France 2002, p. 21.
[2] W. Kaminsky, M. Miri, H. Sinn, R. Woldt,Makromol. Chem.,Rapid Commun. 1985, 4, 17.
[3] J. Chien, J. Polym. Sci., Part. A: Polym. Chem. 1991, 29,1253.
[4] J. Chien, J. Polym. Sci., Part. A: Polym. Chem. 1991, 29,1243.
[5] J. Chien, D. He, J. Polym. Sci., Part A: Polym. Chem. 1991,29, 1603.
[6] D. A. Estenoz, M. G. Chiovetta, J. Appl. Polym. Sci. 2001,81,285.
[7] D. A. Estenoz, M. G. Chiovetta, Polym. Eng. Sci. 1996, 36,2208.
[8] R. K. Iler, ‘‘The Chemistry of Silica’’, J. Wiley & Sons, NewYork 1979.
[9] K. Soga, M. Kaminaka, Makromol. Chem. 1993, 194, 1745.[10] S. Collins, W. M. Kelly, D. A. Holden, Macromolecules
1992, 25, 1780.[11] W. Kaminsky, F. Renner,Makromol. Chem., RapidCommun.
1993, 14, 239.[12] M. A. Ferrero, M. G. Chiovetta, Polym. Eng. Sci. 1987, 27,
1436.[13] M. A. Ferrero, M. G. Chiovetta, Polym. Eng. Sci. 1987, 27,
1448.[14] W. E. Ranz, W. R. Marshall, Jr., Chem. Eng. Prog. 1952, 48,
141.[15] P. A. Nelson, T. R. Galloway, Chem. Eng. Sci. 1975, 30, 1.[16] D. A. Estenoz, M. G. Chiovetta, Polym. Eng. Sci. 1996, 36,
2224.[17] J. Kosek, Z. Grof, A. Novak, F. Stepanek, M. Marek, Chem.
Eng. Sci. 2001, 56, 3951.[18] S. W. Webb, Ph.D. thesis, University of Massachusetts, 1990.[19] R. C. Reid, J. M. Prausnitz, T. K. Sherwood, ‘‘The Properties
of Gases and Liquids’’, McGraw-Hill Book Co., New York1977.
[20] F. Bonini, V. Fraaije, G. Fink, J. Polym. Sci., Part A: Polym.Chem. 1995, 33, 2393.
[21] S. Floyd, K. Choi, T. Taylor, W. H. Ray, J. Appl. Polym. Sci.1986, 32, 2935.
[22] S. Floyd, K. Choi, T. Taylor, W. H. Ray, J. Appl. Polym. Sci.1986, 31, 2231.
1026 M. G. Chiovetta, D. A. Estenoz
Macromol. Mater. Eng. 2004, 289, 1012–1026 www.mme-journal.de � 2004 WILEY-VCH Verlag GmbH & Co. KGaA, Weinheim