Population mobility in rural Bangladesh - University of ...
471
POPULATION MOBILITY IN RURAL BANGLADESH: THE CIRCULATION OF WORKING PEOPLE A dissertation presented for the degree of Doctor of Philosophy in Geography in the University of Canterbury, Christchurch, New Zealand by A.Q.M. Mahbub University of Canterbury 1986
-
Upload
khangminh22 -
Category
Documents
-
view
2 -
download
0
Transcript of Population mobility in rural Bangladesh - University of ...
POPULATION MOBILITY IN RURAL BANGLADESH: THE CIRCULATION OF WORKING PEOPLE
A dissertation
presented for the degree of
Doctor of Philosophy in Geography
in the University of Canterbury,
Christchurch, New Zealand
by
A.Q.M. Mahbub
University of Canterbury
1986
THEQS
,A
TABLE OF CONTENTS
LIST OF TABLES
LIST OF FIGURES
GLOSSARY OF TERMS AND CONVENTIONS
ACKNOWLEDGEMENTS
ABSTRACT
CHAPTER 1 INTRODUCTION
1.1 THE FOCUS OF THE STUDY 1.1.1 Some definitions
1.2 THE SELECTION OF STUDY AREAS 1.2.1 Reasons for selecting
study areas
1.3 DESIGN OF THE FIELD RESEARCH
1.4 ORGANIZATION OF THE THESIS 1.4.1 Conventions
the
CHAPTER 2 MOBILITY IN BANGLADESH - CONCEPTUAL
Page
v
ix
xii
xv
xviii
1
2 3
4
5
8
13 15
ISSUES AND HISTORICAL BACKGROUND 17
2.1 DEFINITIONS OF POPULATION MOVEMENT 17 2.1.1 Mobility, migration and
circulation 18 2.1.2 Categories of circulation 22
2.2 SPACE, TIME AND LAND 26 2.2.1 Boundaries and distances 26 2.2.2 The duration of moves 30 2.2.3 The importance of land 34
2.3 POPULATION MOBILITY AND URBANIZATION IN BANGLADESH: AN OVERVIEW 37
2.3.1 Population movement in East Bengal and East Pakistan 39
2.3.2 Migration and urbanization 45 2.3.3 Rural service centres 53
2.4 MIGRATION STUDIES IN BANGLADESH 56 2.4.1 Some limitations of the
available literature 57 2.4.2 Towards a more relevant focus 60
ii
CHAPTER 3 THE CONTEXT OF POPULATION MOBILITY IN RURAL BANGLADESH 62
3.1 THE ENVIRONMENT OF MOBILITY 62 3.1 .1 The physical setting 63 3.1.2 Population 69 3.1.3 Agricultural patterns 82
3.2 MOBILITY AS CIRCULATION 91 3.2.1 Overview of mobility 92 3.2.2 Commuting 102 3.2.3 Circular migration 107 3.2.4 Seasonal migration 109
3.3 RELOCATION AND IMMOBILITY 113 3.3.1 Permanent relocation 113 3.3.2 Immobility 123
3.4 MOBILITY OF WOMEN 129
3.5 CONCLUSION 138
CHAPTER 4 PATTERNS OF COMMUTING AND CIRCULAR MIGRATION 141
4.1 SPACE-TIME DIMENSIONS OF COMMUTING 142 4.1 .1 The incidence of commuting 143 4.1 .2 Intra-rural commuting 147 4.1 .3 Rural-urban commuting 158
4.2 SPACE-TIME DIMENSIONS OF CIRCULAR MIGRATION 168
4.2.1 The incidence of circular migration 169
4.2.2 Streams of circular migration 171
4.3 CONCLUSION 176
CHAPTER 5 COMMUTING TRIPS: A CASE STUDY 180
5.1 SEASONAL PATTERN OF COMMUTING 180 5.1 .1 Milkmen 182 5.1.2 Wage earners 184 5.1.3 Civil servants 188 5.1 .4 Kachamal traders 190 5.1 .5 Total pattern 194
5.2 DURATION, DESTINATION AND MODE OF TRAVEL 202 5.2.1 Length of absence 202 5.2.2 Direction and mode of travel 207
5.3 SUMMARY 212
iii
CHAPTER 6 CHARACTERISTICS OF COMMUTERS AND CIRCULAR MIGRANTS 215
6.1 AGE AND EDUCATION 215 6.1.1 Age composition 215 6.1.2 Levels of education 226
6.2 OCCUPATION STRUCTURE 234
6.3
6.2.1 Occupation by mover category 234 6.2.2 Dual occupation structure 242
REASONS 6.3.1 6.3.2
FOR MOVEMENT Why do villagers Why do villagers commute?
migrate? prefer to
249 249
258
6.4 SUMMARY 265
CHAPTER 7 HOUSEHOLD BACKGROUND OF COMMUTERS AND CIRCULAR MIGRANTS 269
7.1 HOUSEHOLD SIZE AND COMPOSITION 269 7.1.1 Household size 270 7.1.2 Household composition 277
7.2 LAND OWNERSHIP PATTERNS 281 7.2.1 Land distribution 282 7.2.2 Attributes of land owners 292
7.3 TENURAL STATUS 298 7.3.1 'Gentlemen' farmers 298 7.3.2 OWner-operated tenancies 305
7.4 HOUSEHOLD INCOMES 314 7.4.1 Income and mover status 315 7.4.2 Mobility strategies and income 322
7.5 SUMMARY 327
CHAPTER 8 MOBILITY BEHAVIOUR AND SOCIO-ECONOMIC STATUS 331
8.1 A SOCIAL CONTEXT 8.1.1 Social stratification in
rural Bangladesh 8.1.2 Classification of socio
economic status
331
334
341
8.2 MOBILITY IN A PYRAMIDAL SOCIAL STRUCTURE 352 8.2.1 Mobility and socia-economic
status 353 8.2.2 Discussion 365
8.3 CONCLUSION 373
iv
CHAPTER 9 CONCLUSION 374
9.1 CIRCULATION: AN ENDURING FORM OF POPULATION MOVEMENT 375
9.1.1 The rationale for circulation 375 9.1.2 The components of circulation 379 9.1.3 Social class and mobility
strategies 384
9.2 SHORTCOMINGS AND SUGGESTIONS 385
APPENDICES 389
Appendix 1 Socio-Economic Indicators for Bangladesh 390
Appendix 2 General Trends of Part-Time Farming in Bangladesh 1950-1980 393
Appendix 3 Seasonality of Employment and Unemployment: Village Sabilpur, Noakhali, Bangladesh 1961-62 394
Appendix 4 Age Structure of Different Groups of Males, 1981 395
Appendix 5 Age Specific Rates of Mobility and Immobility of Males by Current Mobility Status, 1981 396
Appendix 6 The Village Survey 397
Appendix 7 Schedule for Household Census 419
Appendix 8 Schedule for Household Socio-Economic Survey 421
Appendix 9 Schedule for Prospective Mobility Register 431
Appendix 10 Interview Format of Partial Life History Survey 432
REFERENCES CITED 433
Table
1 .1
2.1
2.2
2.3
2.4
2.5
3.1
3.2
3.3
3.4
3.5
3.6
3.7
3.8
3.9
LIST OF TABLES
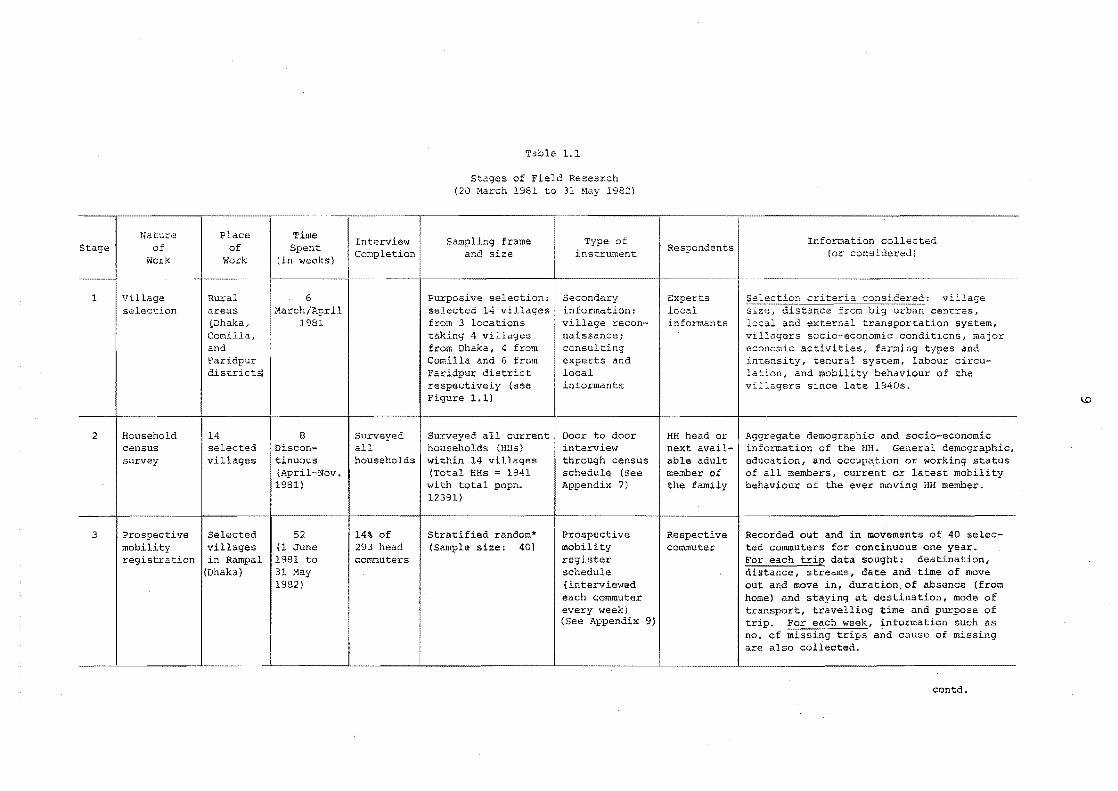
stages of Field Research
Time Criteria Used to Define Forms of Mobility
Bangladesh: Estimates of Employment and Unemployment 1972/73 and 1978/79
Employment by Economic Sector and Total Labour Force 1975 and 2000
Ratio of Agricultural and NonAgricultural Labour Force by Employment Status, 1972/73, 1978/79 and 2000
sectoral Shares of Gross Domestic Product in Different Years, Bangladesh
Some Comparative Statistics, Study Areas and the Nation, 1981
Population of Study Villages in Rampal, Chandina, and Sakhipur by Sex, 1981
Literacy Rate of Children aged 5-14 years, Adults aged 15 years and above, and All Population aged 5 years and above by Sex and Study Area
Educational Attainment of Population aged 5 years and above by Sex and Study Area, 1981
Educational Levels by Sex for Study Population and Bangladesh Rural Population, 1981
All Movers, Working Movers and Student Movers by Sex and Study Area
Male Working Movers by Their Mobility Behaviour and Study Area
Mobility Status of the Male Working Population by Study Area, 1981
Mobility Characteristics of All Households at the Time of Survey in 1981 by Place of Survey
Page
9
20
49
49
50
50
64
74
81
83
84
93
95
99
101
3.10
3.11
3.12
3.13
4.1
4.2
4.3
5.1
5.2
5.3
5.4
5.5
5.6
6.1
6.2
6.3
6.4
vi
Changing Patterns of Mobility Behaviour in the study Areas Since the 1950s
Some Features of Permanent Migration by Destination
Some Opinions and Attitudes of Stayers by Study Area
Some Socio-economic Characteristics of Working Women and Their Families by Mover and Stayer Category, 1981
Streams of Commuting from Rampal, Chandina and Sakhipur, 1981
Distribution of Intra-rural Commuting Flows from the Study Area(s) by Distance
streams of Circular Migration from Rampal, Chandina and Sakhipur, 1981
Rampal Commuters: Nature of Occupation at Destination, 1981
Reasons for Commuters Forgoing Trips, by Occupation Group
Monthly Distribution of Major Reasons for Commuters' Forgoing Trips
Duration of Commuting Trips by Occupation
Modes of Transport Used by Rampal Commuters (June 1981 - May 1982)
Rampal Commuters: Choice of Transport by Occupation Group
Education Levels of Commuters by Location, Occupation and Movement Stream
Education Levels of Circular Migrants by Location, Occupation and Movement Stream
Ratio of Rural:Urban Movers by Education Level for Commuters, Circular Migrants and Seasonal Migrants, 1981
Major Occupation Types of Circular Migrants at Their Destinations by Location, Migration Stream and Income
104
116
126
133
148.
157
172
181
198
200
203
211
211
229
230
233
237
6.5
6.6
6.7
6.8
6.9
6.10
6.11
6.12
6.13
6.14
7.1
7.2
7.3
7.4
7.5
7.6
7.7
vii
Major Occupation Types of Commuters at Their Destintions by Location, Movement Stream and Income
Occupations of Sample Commuters, Their Households, and Their Fathers
Occupations of Sample Circular Migrants, Their Households, and Their Fathers
Commuters' Destination Occupation by Principal Occupation, 1981
Circular Migrants' Destination Occupation by Principal Occupation, 1981
Reasons Given for Circular Migration from Study Villages
Reasons Given for Movement of the Circular Migrants, Fathers and Sons
Perceived Advantages and Disadvantages of Circular Migration from Villages
Stated Reasons for Commuting Instead of Migration
Perceived Advantages and Disadvantages of Commuting from Villages
Household Size for Movers, Stayers and All Households, 1981
Average Family Size of Mover and Stayer Households by Income Categories
Household Composition of Movers, Stayers and All Households, 1981
Distribution of Active Movers and Stayers by Household Composition
Percentage Share of Total Agricultural Land by Decile Groups of Households, 1981
Some Statistical Measures of Household Agricultural Landholdings by Study Area and Mobility Status Groups
Characteristics of Agricultural Landholdings by Mover/Stayer Samples, 1981
238
244
244
248
248
251
251
256
262
262
271
274
278
279
284
290
295
7.8
7.9
7.10
7.11
7.12
8.1
8.2
8.3
8.4
8.5
viii
Tenural status of Movers, Stayers and All Households, 1981
Patterns of Agricultural Labour Utilization Among the Stayers, Movers and All Village Households, 1981
Median and Quartiles Incomes of Movers, Stayers and All Households, 1981
Rates of Mobility and Immobility by Household Income Groups, 1981
Some Socia-Economic Characteristics of the Movers and Stayers Families by Their Household Income Levels, 1981
Socia-Economic Status of Households in the Study Villages, 1981
Number of Households, Population and Household Size by Socio-Economic Status, 1981
Mobility and Immobility Patterns of Households by Socio-Economic Status
Mobility and Immobility Patterns of Workers by Socio-Economic Status
Some Features of Active Movers and Lifetime Stayers Within the Different Mobility Groups
299
303
316
319
325
350
351
359
360
362
Figure
1 .1
2.1
2.2
2.3
2.4
3.1
3.2
3.3
4.1
4.2
4.3
4.4
4.5
4.6
5.1
5.2
LIST OF FIGURES
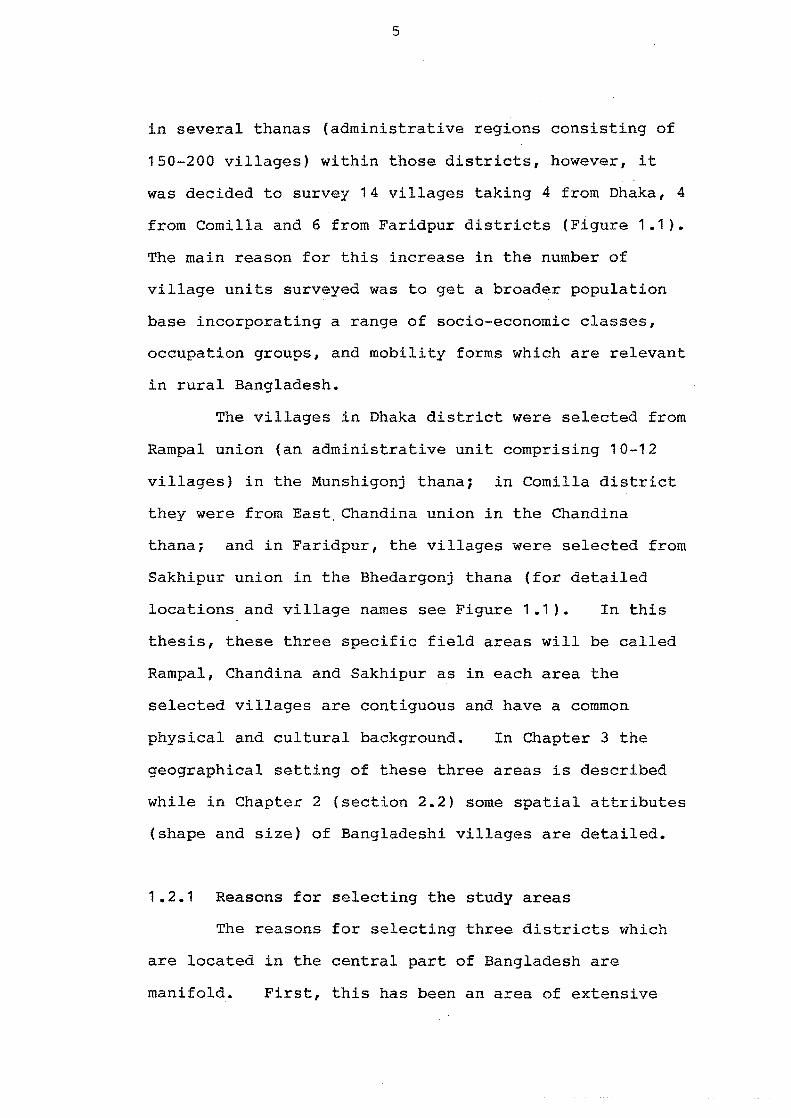
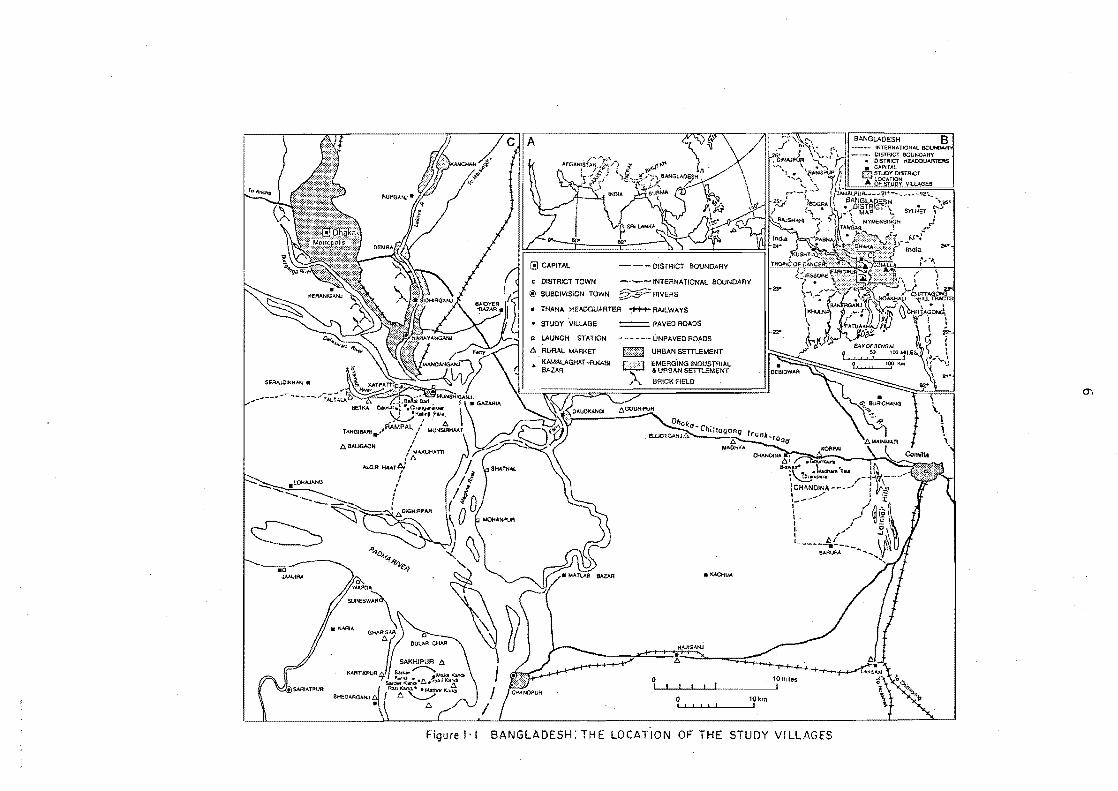
Bangladesh: The Location of the Study' Villages
A Typology of Population Mobility of Working People Originating from Villages in Bangladesh
Measures of Population Growth in Bangladesh Since 1901
Indices of Population Change in Bangladesh, 1911-1961
Average Annual Growth Rate of Population and Percentage in Rural Areas in Bangladesh, 1901-1981
Bangladesh: Population Density 1981
Age and Sex Structure: Residents, Non-residents and Total Population 1981
Farm Calendar and Periodic Movements of Village People: Bangladesh, 1981
Rural to Rural Commuting Flows from Rampal, Chandina and Sakhipur, 1981
Major Occupation Types and Rural-Urban Destinations of Commuters from Rampal, Chandina and Sakhipur, 1981
Major Occupation Types of Commuters by Stream, Frequency and Volume of Commuting from Rampal, Chand ina and Sakhipur, 1981
Rural to Urban Commuting Flows from Rampal, Chandina and Sakhipur, 1981
Flows of Circular Migration from Rampal, Chandina and Sakhipur to Different Towns, 1981
Size and Location of Towns
Seasonal Pattern of Commuting Trips by Occupation Groups, Rampal
Typical Pattern of Commuting Trips of Some Commuters from Rampal, Bangladesh, 1981
Page
6
23
38
41
41
72
87
151
153
155
160
175
175
183
185
x
5.3 Monthly Distribution of Commuting Trips -Completed or Forgone by a Sample of Commuters from Rampal 196
5.4 Average Time for Travelling and Working by Commuters in Different Occupation Groups 205
5.5 Cumulative Distribution of Duration of Commuting Trips by Occupation Group 205
5.6 Rampal Commuters: Volume of Travel by Rural and Urban Destinations 208
5.7 Cumulative Distribution of Commuting Trips by Distance 210
6.1 Age Structure of Different Groups of Males 217
6.2 Age-Specific Rate of Mobility and Immobility of Males by Current Mobility status, 1981 219
6.3 Retrospective Mobility Histories of Circular Migrants by Ten Year Age Group 222
6.4 Mobility and Immobility During the Working-Life of Circular Migrants 225
6.5 Education Levels of Commuters, Circular Migrants, Seasonal Migrants and Never Moved Males, 1981 227
6.6 Occupation structure of Active Movers and Current Non-movers in the study Areas, 1981 235
7.1 Lorenz Curves: Household Agricultural Land Holdings
7.2 Average and Maximum Amount of Agricultural Land (per Household) from Decile Group of Stayer, Commuter, Circular Migrant and
286
All Households 288
7.3 Household Yearly Income Distribution, 1981 317
7.4 Rates of Mobility and Immobility by Household Income Groups, 1981 320
8.1 Idealized Relationship Between Rate of Rural Out-Migration and Level of Individual or Family Socio-Economic Status 333
8.2
8.3
8.4
xi
Mobility Profile of People of Different Socio-Economic status Groups from 14 Villages in Bangladesh
Mobility and Immobility Patterns of Different Socio-Economic Groups
Upward and Downward Economic Mobility of Village Households by Economic Category
354
355
372
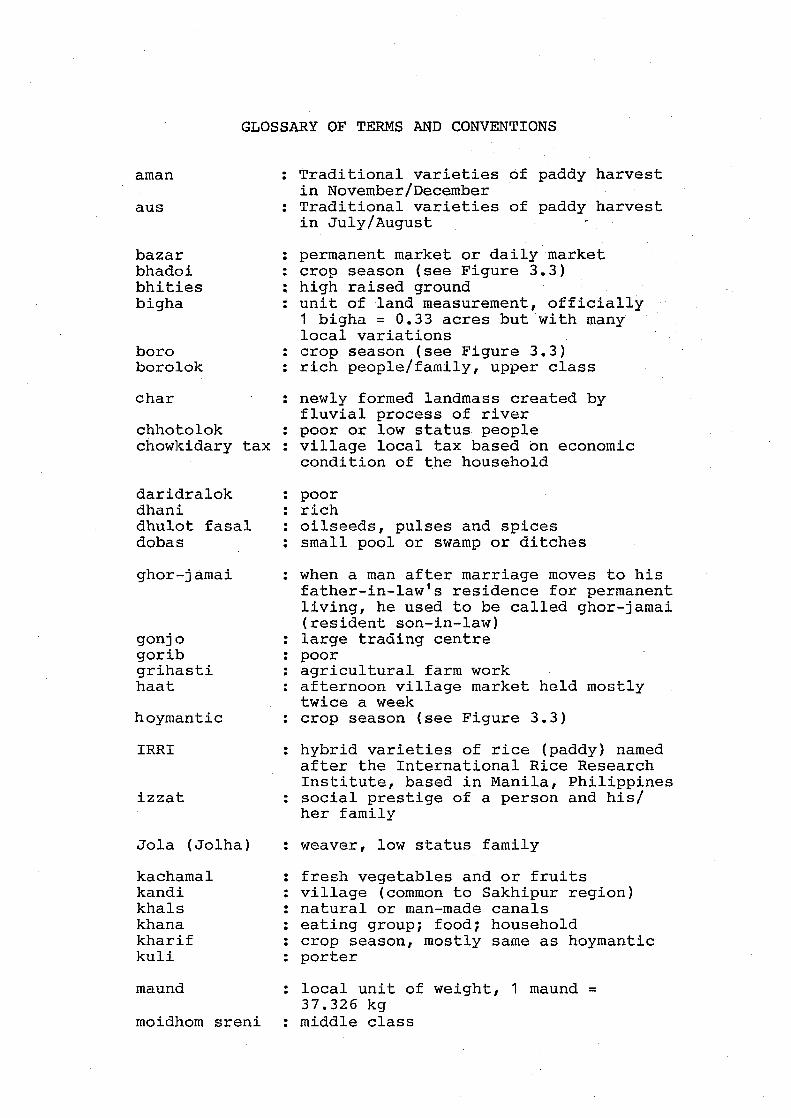
GLOSSARY OF TERMS AND CONVENTIONS
aman
aus
bazar bhadoi bhities bigha
boro borolok
char
chhotolok chowkidary tax
daridralok dhani dhulot fasal dobas
ghor-jamai
gonjo gorib grihasti haat
hoymantic
IRRI
izzat
Jola (Jolha)
kachamal kandi khals khana kharif kuli
maund
moidhom sreni
Traditional varieties of paddy harvest in November/December
: Traditional varieties of paddy harvest in July/August
: permanent market or daily market : crop season (see Figure 3.3) : high raised ground : unit of land measurement, officially
1 bigha = 0.33 acres but with many· local variations
: crop season (see Figure 3.3) : rich people/family, upper class
newly formed landmass created by fluvial process of river
: poor or low status people village local tax based on economic condition of ~he household
: poor rich oilseeds, pulses and spices
: small pool or swamp or ditches
: when a man after marriage moves to his father-in-Iaw's residence for permanent living, he used to be called ghor-jamai (resident son-in-law)
: large trading centre : poor
agricultural farm work : afternoon village market held mostly
twice a week : crop season (see Figure 3.3)
: hybrid varieties of rice (paddy) named after the International Rice Research Institute, based in Manila, Philippines
: social prestige of a person and his/ her family
: weaver, low status family
: fresh vegetables and or fruits : village (common to Sakhipur region) : natural or man-made canals : eating group; food; household : crop season, mostly same as hoymantic : porter
: local unit of weight, 1 maund = 37.326 kg
: middle class
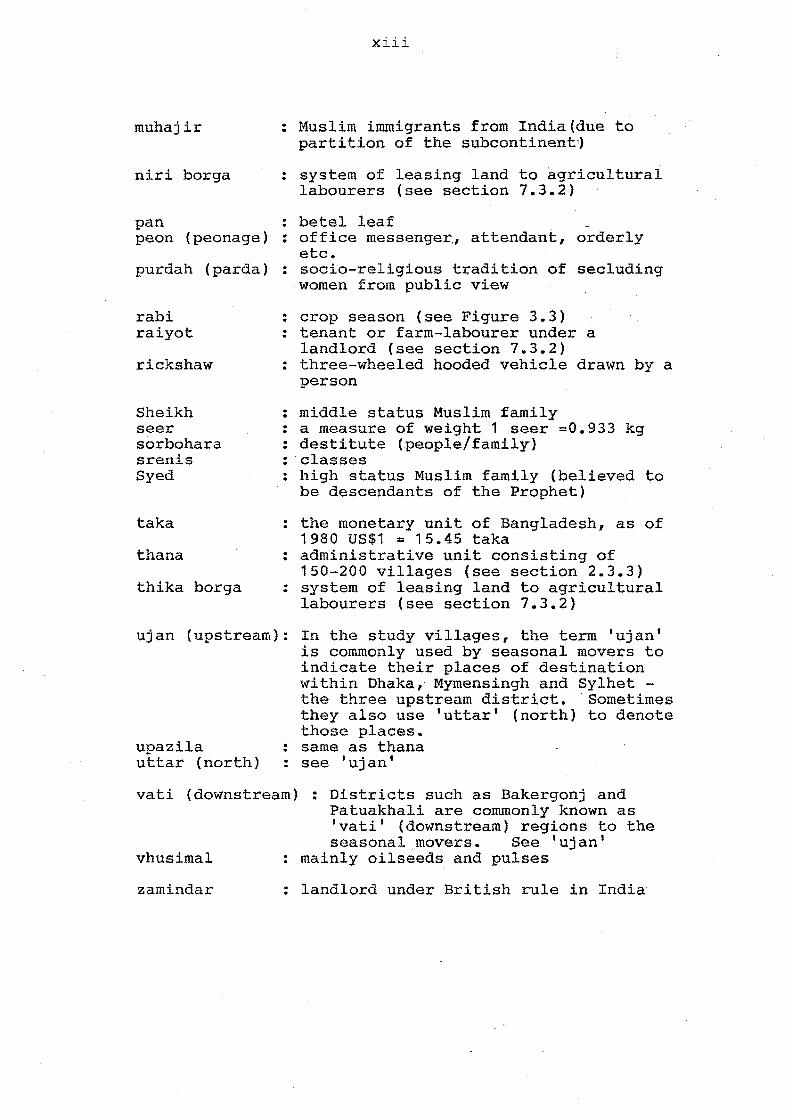
muhajir
niri borga
xiii
: Muslim immigrants from India(due to partition of the subcontinent1
: system of leasing land to agricultural labourers (see section 7.3.2)
pan : betel leaf peon (peonage) : office messenge~, attendant, orderly
etc. purdah (parda) : socio-religious tradition of secluding
women from public view
rabi raiyot
rickshaw
Sheikh seer sorbohara srenis Syed
taka
thana
thika borga
: crop season (see Figure 3.3) : tenant or farm-labourer under a
landlord (see section 7.3.2) : three-wheeled hooded vehicle drawn by a
person
: middle status Muslim family : a measure of weight 1 seer =0.933 kg : destitute (people/family) : 'classes : high status Muslim family (believed to
be descendants of the Prophet)
: the monetary unit of Bangladesh, as of 1980 US$1 = 15.45 taka
: administrative unit consisting of 150-200 villages (see section 2.3.3)
: system of leasing land to agricultural labourers (see section 7.3.2)
ujan (upstream): In the study villages, the term lujan' is commonly used by seasonal movers to indicate their places of destination within Dhaka,' Mymensingh and Sylhet -the three upstream district. 'Sometimes they also use 'uttar' (north) to denote those places.
upazila uttar (north)
: same as thana : see 'ujan'
vati (downstream) : Districts such as Bakergonj and Patuakhali are commonly known as 'vati' (downstream) regions to the seasonal ,movers. See 'ujan'
vhusimal mainly oilseeds and pulses
zamindar : landlord under British rule in India

xiv
Currencies, weights, and measures of area
Taka
seer
maund
acre mile
: local currency name (Tk. abbr. of Taka) US$1 = 15.45 Tk. as of 1980 US$1 = 17.98 Tk. as of 1981 US$1 = 25.34 Tk. as of 1984
· local measure of weight · 1 seer = 0.933 kg · local measure of weight · 1 maund = 40 seers = 37.326 kg
· 1 acre = 0.4047 hectares · · 1 mile = 1.609 kilometres · · 1 square mile = 2.5899 square · kilometres
ACKNOWLEDGEMENTS
The opportunity to carry out this study was made
possible by the grant of a Commonwealth Scholarship from
the University Grants Committee of New Zealand. For
this I am very grateful to the New Zealand Government.
I also wish to express my gratitude to the Ford
Foundation (Dhaka) for a very generous award which
enabled me to undertake extensive field research in
Bangladesh. During the latter days of my stay in New
Zealand, I also received financial support from the
Rotary Clubs of Belfast, Burnside Bishopdale,
Christchurch, Christchurch North, Linwood Woolston, and
Papanui. I am very grateful to them for their help.
I am indebted to Dr Richard Bedford who has
supervised this project from its inception. His
sincere guidance, valuable advice and critical attitude
to the project kept me on the alert and saved me from
falling into more errors than I have. Finally I wish
to thank him for, among many other things, his constant
inspiration which encouraged me to work in a country
which is far away from my home and family.
As the project took its final form, it greatly
benefited from the help and advice of many people both
inside and outside the Geography Department. I am
deeply grateful to Dr D.C. Johnston for his guidance
with regard to analysis of my data and his kind
permission to use some of his computer programmes.
xvi
I would also like to express my thanks to Professor W.B.
Johnston, head of the department, for his advice, moral
support and above all his keen interest in promoting
research on Bangladesh. Thanks are also due to other
staff of the department, especially Dr R.G. Cant and
Dr I.F. Owens for their advice and inspiration from time
to time. Within the department I also received
technical assistance, especially from the cartography
and photographic sections as well as from the
secretaries. I would like to acknowledge their
excellent services.
Within Bangladesh, special thanks are due to
Professor Nazrul Islam of Dhaka University, and Dr
Rafigul Huda Chaudhury of Bangladesh Institute of
Development Studies. They not only helped me in
obtaining financial support for field research in
Bangladesh, but also gave me an opportunity to work with
them in several projects in the field of migration and
urbanization in Bangladesh. Their encouragement and
intellectual inspiration, particularly as regards choice
of my research topic, were very much appreciated.
Field research is a team effort. Of those who
helped me in various ways in the field the following
deserve special mention: Ziaul Hug, Delwar Hossain and
Mobarak Hossain Khan who worked as research assistants:
Abdul Zabber, Niamat Ullah, Abdul Quadir, and Dalowar
Hossain who were data registrars; and Abul Hassem and
Ruhul Armin who helped me as local guides in the survey
xvii
villages. The debt which lowe to my hard-working
field staff is incalculable. I would also like to
express my thanks to all of my respondents and the
villagers for their cooperation, hospitality, and their
candour. In this study I have tried to honour their
frequent requests to highlight the real picture of
village life in this country.
There are many other people and friends whom I
would like to thank for their help, company, and moral
support. Among them David William Horsely, Dr Robert
Garth Ritchie, and Helen Redshaw deserve special
appreciation for their friendly help in various stages
of my project such as data processing, editing the
manuscript and proof-reading. Special thanks are also
due to Anna Moloney for typing the manuscript with such
care.
Despite the efforts of all these people, any
errors or omissions remain my responsibility.
A.Q.M. Mahbub Christchurch May 1986

ABSTRACT
This study is primarily concerned with work
related movement patterns of rural people in Bangladesh.
It involves a general historical review of the internal
migration of village people at the national level, and a
comprehensive assessment of contemporary mobility
behaviour of household earning members in three selected
rural areas in Bangladesh. The main focus is on two
types of movement, commuting and circular migration.
In the selected rural communities, a range of inquiries
were carried out at individual, household and community
levels with a view to: (i) assessing the total movement
pattern of village populations in 1980; (ii) estab
lishing individual and household characteristics of
commuters and circular migrants; (iii) distinguishing
these two types of movers from stayers and seasonal
migrants; and (iv) examining the relationship between
socio-economic status and mobility behaviour in rural
Bangladesh.
The main body of the thesis is comprised of 9
chapters. Chapter 1 gives a general introduction to
the scope and design of the dissertation. Chapter 2
examines some conceptual, theoretical and methodological
issues of mobility studies in the Bangladesh context.
A brief review of the history of population movement and
urbanization in Bangladesh is given in this chapter,
along with an assessment of the limitations of existing
migration literature in this country. In Chapter 3
xix
some aspects of the physical environment, population
growth and distribution, and agricultural patterns in
the three study areas are examined. An overview of all
current mobility patterns in these areas, including
permanent relocation and immobility, is also provided in
this chapter. Chapter 4 illustrates the space-time
patterns of commuting and circular migration while
Chapter 5 elaborates on the pattern and process of
commuting trips made by people with different
occupations in Rampal.
Chapters 6 and 7 contain detailed examinations of
the various characteristics of commuters and circular
migrants. Chapter 6 deals with individual characteris
tics of these movers and their stated reasons for
movement while Chapter 7 is concerned with their
household attributes. In Chapter 8 the relationship
between mobility behaviour and socio-economic status of
the surveyed population is examined empirically. The
concluding chapter (Chapter 9) briefly discusses the
relevance of circular mobility in Bangladesh in the
light of the major findings from village surveys.
Shortcomings of the study and some avenues for future
research are also indicated here.
The major conclusions derived from this study are
as follows:
1. The basic pattern of movement of working people
originating from rural areas in Bangladesh is
circular, involving temporary relocation from a
xx
village home base rather than the conventional
linear type of migration. Generally the pattern
includes three broad types of movements: commuting,
circular migration, and seasonal migration.
Permanent relocation for an economic reason usually
follows some experience of circular mobility.
2. Commuting has been widely practised by villagers
from different age groups, occupations, and
education levels. The individuals who participate
in circular migration are relatively young, well
educated, unmarried, economically better-off, and
come from larger families. They prefer salaried
jobs and services and are strongly directed to
cities and towns. Seasonal migration, on the other
hand, is more likely to be found among the labourers
in poor regions of the country.
3. The relationship between population movement and
agriculture pattern indicates that, generally, the
villagers from intensive agriculture areas prefer
commuting, and from traditional or poor farming
zones tend to migrate.
4. It is evident that among the rural families a dual
or multiple occupation (or income) strategy has been
evolving through the process of circular migration.
Increased pressure of population on land is further
strengthening this strategy and the circulation
process.
xxi
5. Empirical evidence shows that in rural Bangladlesh
people from different socio-economic claslses follow
different patterns of movement for earning a
livelihood. The pattern of socio-economic statuses
for male movers is fairly bi-modal which indicates
that within the pyramidal social structure those who
are in either the higher or the lower socio-economic
strata have higher rates of mobility than those who
lie at the top, middle and bottom levels. The
detailed pattern further suggests that earning males
from the upper strata are more attracted to circular
migration while those originating from the lower
socio-economic strata are more likely to make short
term movements such as commuting and seasonal
migration. Thus it can be concluced that commuting
is a viable alternative to circular migration,
especially among villagers in the lower socio
economic strata.
CHAPTER 1
INTRODUCTION
Movement of human population within densely
settled developing countries is both a widely discussed
phenomenon and a highly visible problem. The rapid
growth of cities in Asia and the proliferation of
sprawling 'squatter' and slum settlements over the past
20 to 30 years is due, in a large part, to accelerating
rural-urban population drift. Low-income peasants,
landless labourers, unemployed and underemployed youths,
victims of natural disasters, famine and war, together
with members of the educated elite, comprise the net
migrations streams frequently identified in recent
censuses and surveys. Yet not all of this movement
results in long-term displacement of population:
detailed empirical research in rural and urban areas has
established that much of the migration from the
countryside involves the movers in temporary rather than
permanent relocation.
Bangladesh emerged from the war of liberation in
1971 as a poor country characterised by an unfavourable
man-land ratio, increasing landlessness, persistent food
shortages, low level of technology, rudimentary
infrastructure and exploding population (Alamgir 1980).
Only seven countries have more population than
Bangladesh, and the total population of the last 80
2
countries in the world list is significantly lower than
the total number of Bangladeshi. By any standard
Bangladesh is one of the most densely populated
countries in the world, with 624 persons per square
kilometre (1617 persons per square mile) at the 1981
census. Although the great majority of people (8S
percent) still live in villages, the urban-resident
population has been increasing rapidly, especially since
the war of liberation. The average annual rate of
urban population growth in Bangladesh was 10.6 percent
during the 1974-81 census period compared with 2.3
percent for the population as a whole.
In spite of the magnitude of population movement
in a country with nearly 100 million inhabitants, little
attention has been focused on the nature and process of
internal migration. The few empirical studies
completed so far have emphasized rural out-migration,
mostly the conventional rural-urban migration stream.
The vast majority of internal movements such as intra
rural relocation, seasonal migration, commuting and
circular migration, have been largely ignored by
researchers as well as census surveys. It is with a
view to providing a more comprehensive analysis of
mobility in Bangladesh that the present study has been
undertaken.
1.1 THE FOCUS OF THE STUDY
Given the paucity of published literature on
3
population mobility in Bangladesh, it has been necessary
to conduct both a general historical review of the
internal migration of village people at the national
level, as well as intensive field inquiry into
contemporary movement in selected rural areas. The
study focuses attention on two dominant forms of
movement behaviour - commuting and circular migration.
In the selected rural communities, a range of inquiries
were undertaken with a view to: (i) assessing the total
movement pattern of village populations in 1980;
(ii) establishing individual and household
characteristics of commuters and circular migrants,
(iii) differentiating these two types of movers from
stayers and seasonal movers; and (iv) examining the
relationship between socio-economic status and mobility
behaviour in rural Bangladesh.
1.1.1 Some definitions
In the context of rural settlements in Bangladesh
the following definitions were adopted in the field. A
commuter is a villager who regularly (though not
necessarily every day) leaves his rural residence either
for work or for study, and goes to destination(s) which
is/are located at least two miles away from his home.
Included here are those villagers who commute either
daily (at least 3 or 4 days per week) or bi-weekly/
weekly throughout the year, as well as seasonal movers
who commute for at least a whole season per year.

4
Circular migrants, on the other hand, are those persons
who have moved either to an urban centre or to a rural
place for work or study, and intend to return or have
recently returned to the study village after living at
their destination for a period of at least three months
or a complete season (in the case of seasonal circular
migrants).
It is clear from these definitions that the field
inquiries were designed primarily to obtain information
on movements related to work (earning income in cash or
kind) or study. The inquiry deliberately excluded
movement for reasons such as marriage, visiting
relatives, occasional shopping, religious or
recreational tours, and many other social and cultural
activities (see Chapman 1970). The theme of this study
is thus the mobility behaviour of working people or
income earners. In this regard care should be taken
when comparing findings about mobility in rural
Bangladesh with those for other communities in the Third
World where a wider range of circular forms of movement
have been analysed.
1.2 THE SELECTION OF STUDY AREAS
In the plan for field research, it was proposed
that six villages from Dhaka, Comilla and Faridpur
districts would be selected. These would comprise two
contiguous village settlements from each district.
After an extensive reconnaissance of village communities
5
in several thanas (administrative regions consisting of
150-200 villages) within those districts, however, it
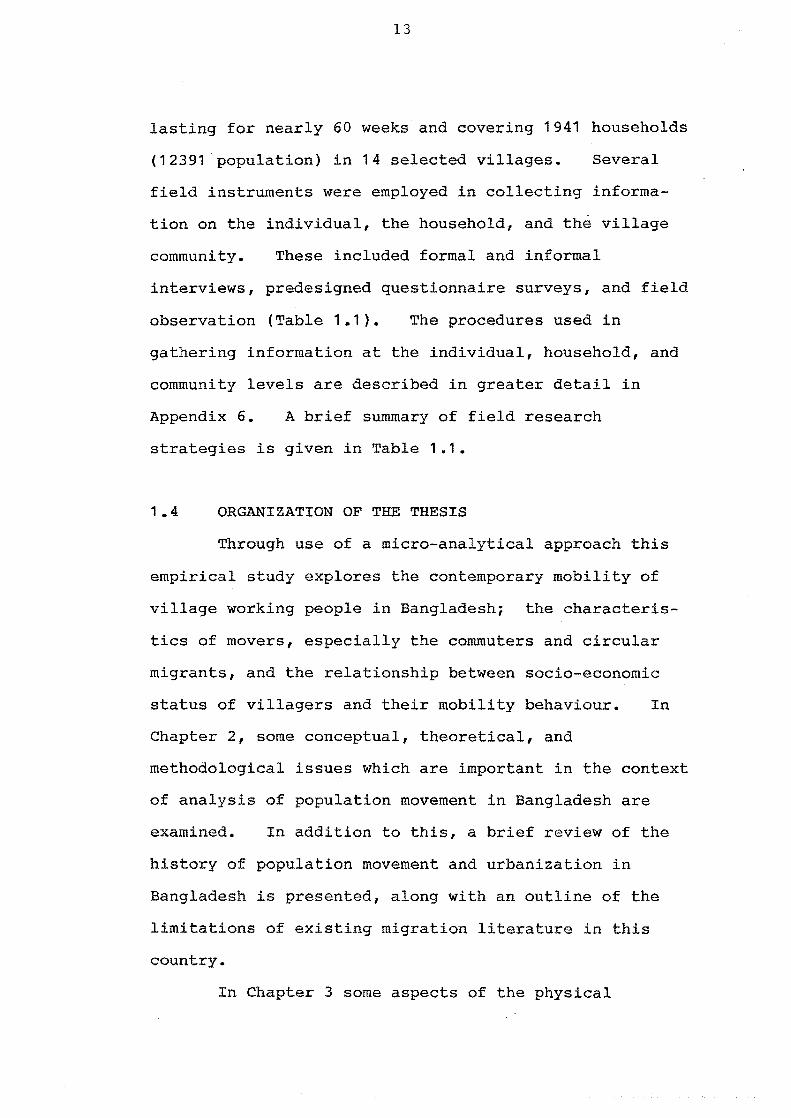
was decided to survey 14 villages taking 4 from Dhaka, 4
from Comilla and 6 from Faridpur districts (Figure 1.1).
The main reason for this increase in the number of
village units surveyed was to get a broader population
base incorporating a range of socio-economic classes,
occupation groups, and mobility forms which are relevant
in rural Bangladesh.
The villages in Dhaka district were selected from
Rampal union (an administrative unit comprising 10-12
villages) in the Munshigonj thana; in Comilla district
they were from East Chandina union in the Chandina
thana; and in Faridpur, the villages were selected from
Sakhipur union in the Bhedargonj thana (for detailed
locations and village names see Figure 1.1). In this
thesis, these three specific field areas will be called
Rampal, Chandina and Sakhipur as in each area the
selected villages are contiguous and have a common
physical and cultural background. In Chapter 3 the
geographical setting of these three areas is described
while in Chapter 2 (section 2.2) some spatial attributes
(shape and size) of Bangladeshi villages are detailed.
1.2.1 Reasons for selecting the study areas
The reasons for selecting three districts which
are located in the central part of Bangladesh are
manifold. First, this has been an area of extensive
""NJI""
DISTRICT BOUNDARY
Q DISTRICT TOWN ----INTERNATIONAL BOUNDARY
SUBDIVISION TOWN RIVERS
• THANA HEADQUARTER -:t+-t- RAILWAYS
• STUDY 'VILLAGE = PAVED ROADS
11 LAUNCH STATION ------ UNPAVED ROADS
RURAL MARKET !",','):N URBAN SETTLEMENT
I"""""l eMERGING INDUSTRIAL , ;.: & URBAN SETTl.£MeNT
BRICK FIELD
aKAQiuA
o 10miles I I
Figure I-I BANGLADESH: THE LOCATION OF THE STUDY VILLAGES
0'\
7
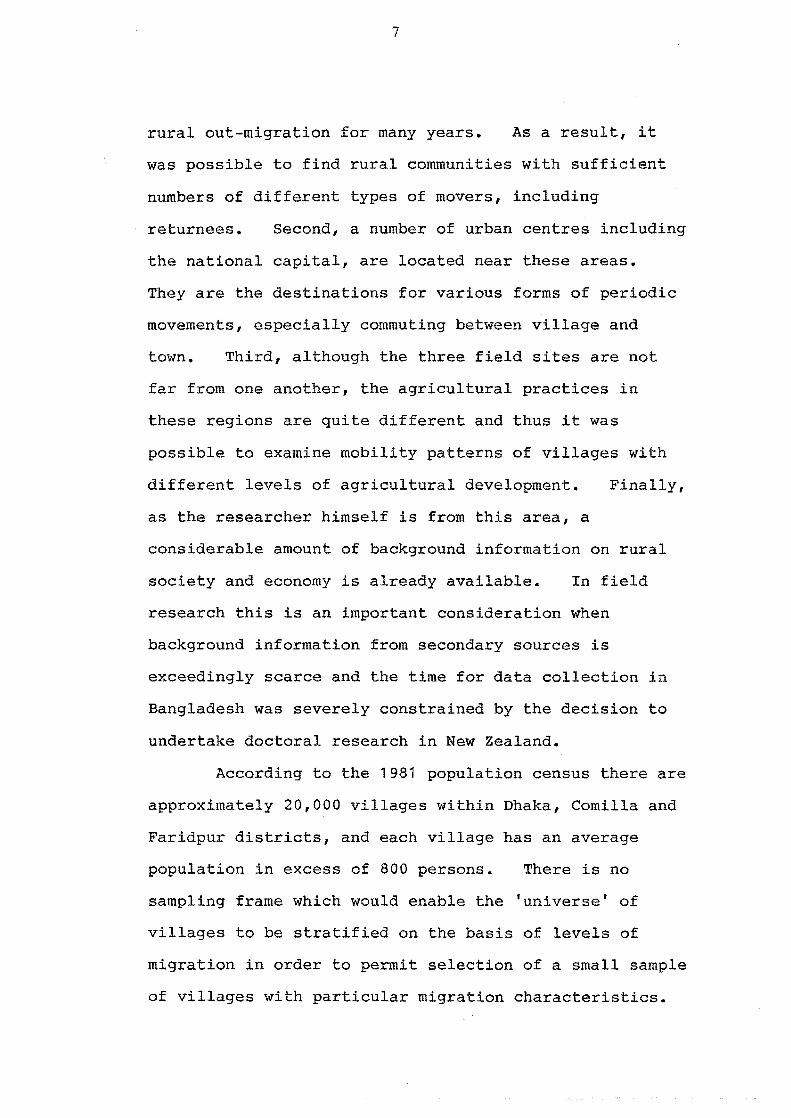
rural out-migration for many years. As a result, it
was possible to find rural communities with sufficient
numbers of different types of movers, including
returnees. Second, a number of urban centres including
the national capital, are located near these areas.
They are the destinations for various forms of periodic
movements, especially commuting between village and
town. Third, although the three field sites are not
far from one another, the agricultural practices in
these regions are quite different and thus it was
possible to examine mobility patterns of villages with
different levels of agricultural development. Finally,
as the researcher himself is from this area, a
considerable amount of background information on rural
society and economy is already available. In field
research this is an important consideration when
background information from secondary sources is
exceedingly scarce and the time for data collection in
Bangladesh was severely constrained by the decision to
undertake doctoral research in New Zealand.
According to the 1981 population census there are
approximately 20,000 villages within Dhaka, Comilla and
Faridpur districts, and each village has an average
population in excess of 800 persons. There is no
sampling frame which would enable the 'universe' of
villages to be stratified on the basis of levels of
migration in order to permit selection of a small sample
of villages with particular migration characteristics.
8
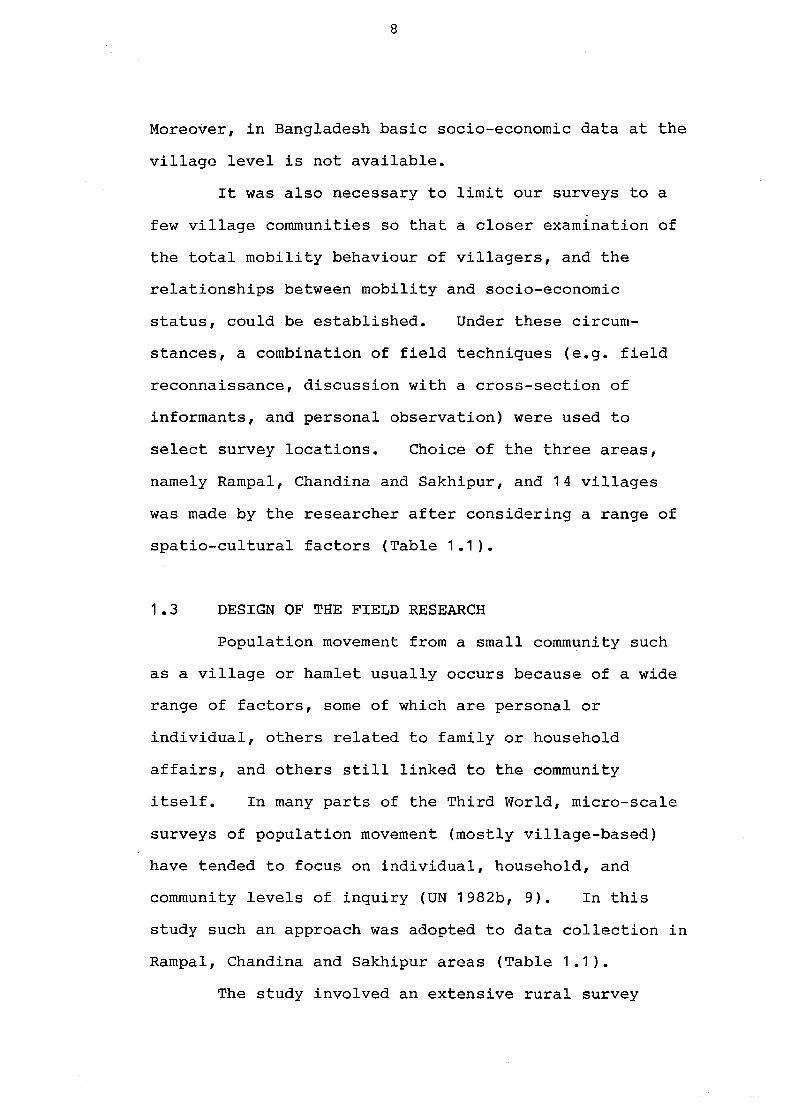
Moreover, in Bangladesh basic socio-economic data at the
village level is not available.
It was also necessary to limit our surveys to a
few village communities so that a closer examination of
the total mobility behaviour of villagers, and the
relationships between mobility and socio-economic
status, could be established. Under these circum-
stances, a combination of field techniques (e.g. field
reconnaissance, discussion with a cross-section of
informants, and personal observation) were used to
select survey locations. Choice of the three areas,
namely Rampal, Chandina and Sakhipur, and 14 villages
was made by the researcher after considering a range of
spatio-cultural factors (Table 1.1).
1.3 DESIGN OF THE FIELD RESEARCH
Population movement from a small community such
as a village or hamlet usually occurs because of a wide
range of factors, some of which are personal or
individual, others related to family or household
affairs, and others still linked to the community
itself. In many parts of the Third World, micro-scale
surveys of population movement (mostly village-based)
have tended to focus on individual, household, and
community levels of inquiry (UN 1982b, 9). In this
study such an approach was adopted to data collection in
Rampal, Chandina and Sakhipur areas (Table 1.1).
The study involved an extensive rural survey
Nature
~ of Work
1 Village
2
3
selection
Household census survey
Prospective mobility registration
Place of
Work
Rural areas (Dhaka, Camilla, and Faridpllr district~
14 selected villages
Selected villages in Rampal
(Dhaka)
Time Spent
(in weeks)
6 March/lI.pril
1981
8 Discontinuous (Apr iI-Nov. 1981)
52 (1 June 1981 to 31 May 1982)
Interview Completion
Surveyed all households
14% of 293 head commuters
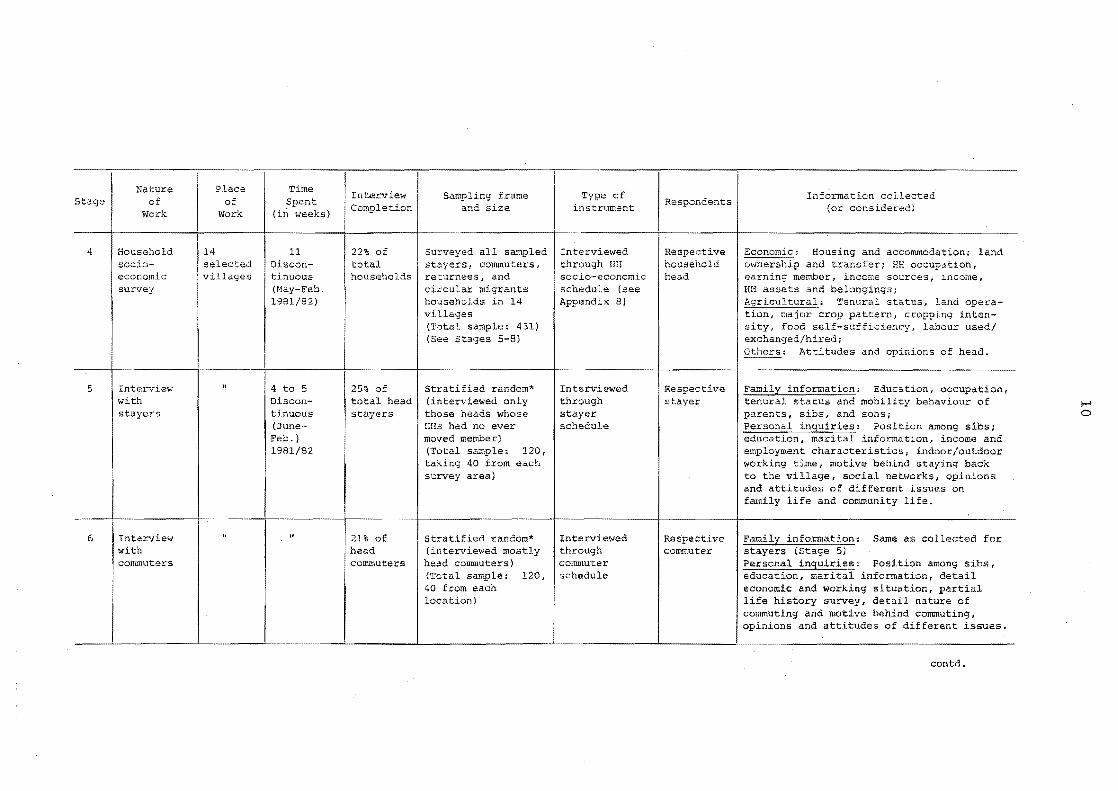
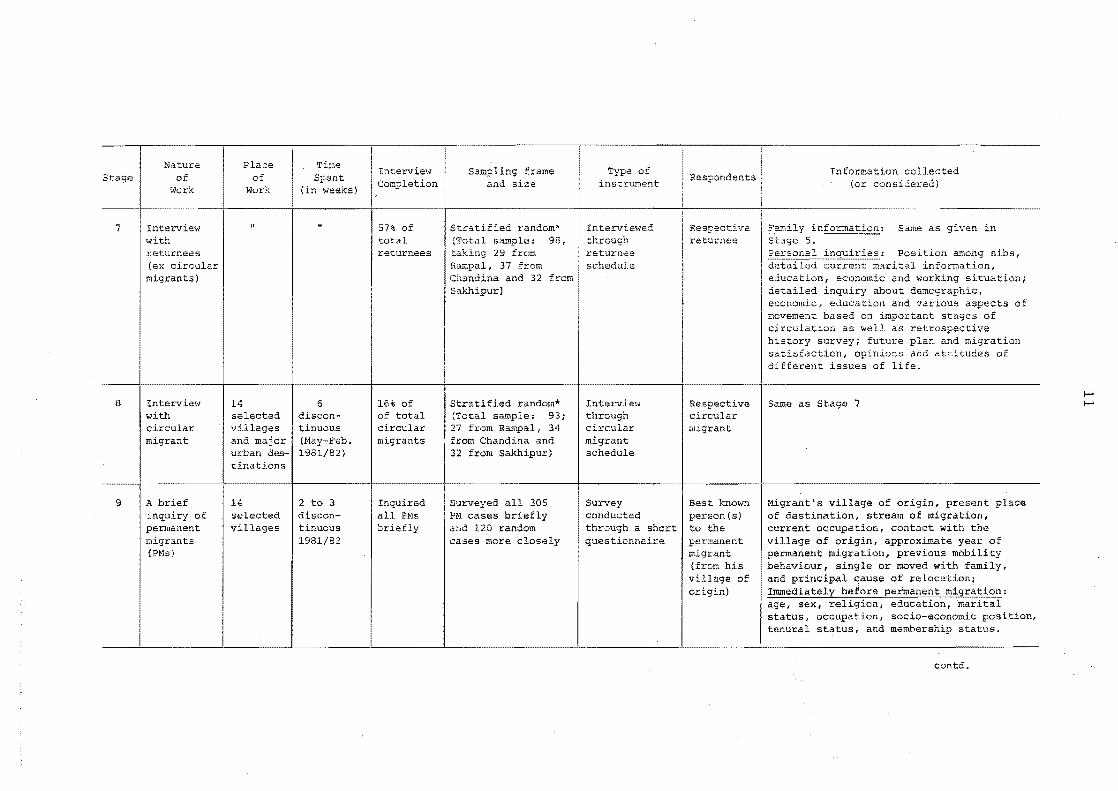
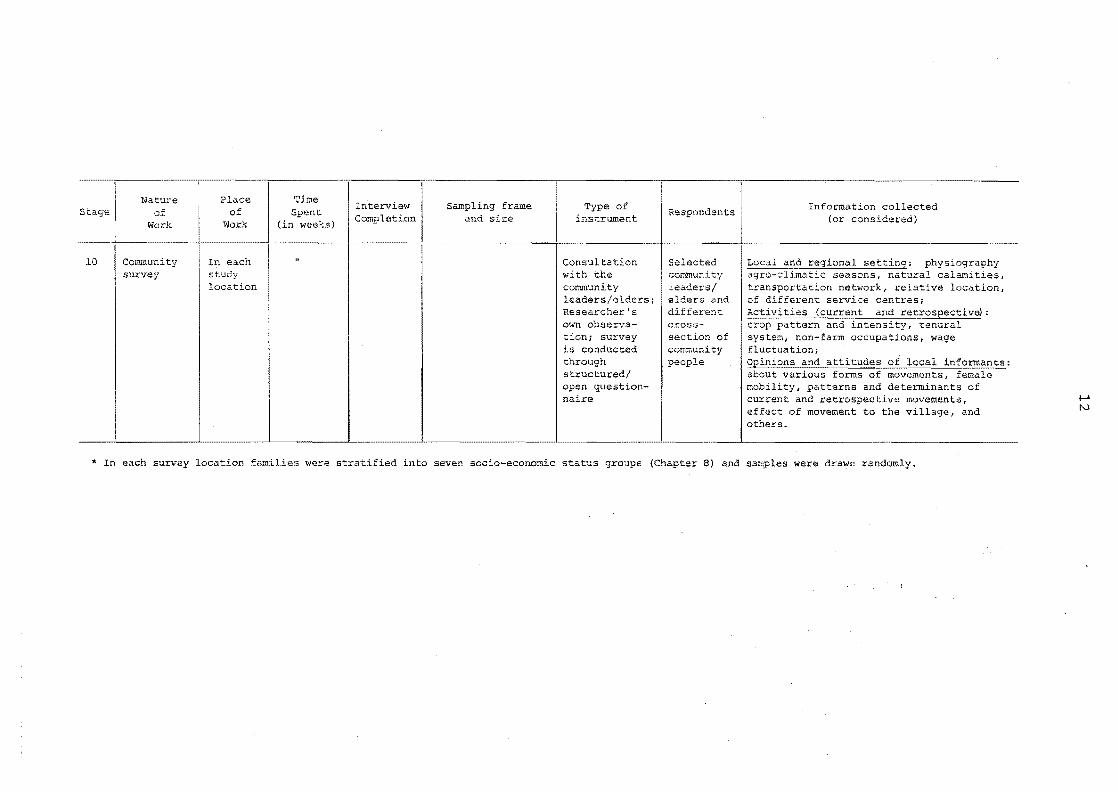
Table 1.1
Stages of Field Research (20 March 1981 to 31 May 1982)
Sampling frame and size
Purposive selection: selected 14 villages from 3 locations taking 4 villages from Dhaka, 4 from Comilla and 6 from Faridpur district respectively (see Figure 1.1)
Surveyed all current households eHHs) within 14 villages (Total HHs 1941 with total popn. 12391)
Stratified random* (Sample size: 40)
Type of instrument
Secondary information; village reconnaissance; consulting experts and local informants
Door to door interview through census schedule (See Appendix 7)
Prospective mobility register schedule (interviewed each commuter every week) (See Appendix 9)
Respondents Information collected (or considered)
Experts local informants
HH head or next available adult member of the family
Respective commuter
village centres,
local and external transportation system, villagers socia-economic conditions, major economic activities, farming types and intensity, tenurel system, labour circulation, and mobility behaviour of the villagers since late 19405.
Aggregate demographic and socia-economic information of the HR. General demographic, education, and occupation or working status of all members, current or latest mobility behaviour of the ever moving HH member.
Recorded out and in movements of 40 selected commuters for continuous one year. For each trip data sought, destination, distance, streams, date and time of move out and move in, duration,of absence (from home) and staying at destination, mode of transport, travelling time and purpose of trip. information such as no. of and cause of miSSing
contd.
1.0
Stage
4
5
6
Nature of
Work
Household socioeconomic survey
Interview with stayers
Interview with commuters
Place of
Work
14 selected villages
Time Spent
(in weeksl
11 Oiscontinuous (May-Feb. 1981/82)
4 to 5 Discontinuous (JuneFeb. ) 1981/82
Interview I Sampling frame Completion and size
22% of Surveyed all sampled total stayers, commuters, households returnees, and
circular migrants households in 14 villages (Total sample: 431) (See Stages 5-8)
25% of I Stratified random* total head (interviewed only stayers those heads whose
21% of head commuters
HHs had no ever moved member) (Total sample: 120, taking 40 from each survey area)
Stratified random* (interviewed mostly head commuters) (Total sample: 120, 40 from each location)
Type of instrument
Interviewed through HH
soc io-economic schedule (see Appendix 8)
Respondents
Respective household head
Information collected (or considered)
Housing and accommodation; land and transfer; HE occupation,
earning member, income sources, income, HE assets and belongings;
Tenural status, land operacrop pattern, cropping inten
sity, food self-SUfficiency, labour used/ exchanged/hired;
Attitudes and opinions of head.
----+------11-
Interviewed through stayer schedule
Interviewed through commuter schedule
Respective stayer
Respective commuter
Family information: Education, occupation, tenural status and mobility behaviour of parents, sibs, and sons; Personal inquiries: Position among sibs; education, marital information, income and employment characteristics, indoor/outdoor working time, motive behind staying back to the village, social networks, opinions and attitudes of different issues on f~nily and community life.
Family information: Same as collected for stayers (Stage 5) Personal inquiries: Position among sibs, education, marital information, detail economic and working situation, partial life history survey, detail nature of commuting and motive behind commuting, opinions and attitudes of different issues.
contd.
f-I o
Stage
7
8
9
Natura of
i~crk
Intervie'.v with returnees (ex circular migrants)
Interview with circular migrant
A brief inquiry of permanent migrants (PMs)
14
Place of
Work
selected villages and major urban des-tinations
14 selected villages
Time Spent
(in weeks)
6 discon-tinuous (May-Feb. 1981/82)
2 to 3 discontinuous 1981/82
I
I Interview I ,comPletion
57% of total re1:urnees
16'6 of of total circular migrants
Inquired all PMs briefly
Sampling frame and size
Stratified random* (Total sample: 98, taking 29 from Rampal, 37 from Chandina and 32 from Sakhipur)
Stratified random* (Total sample: 93; 27 from Rampal, 34 from Chandina and 32 from Sakhipur)
Surveyed all 305 Pl<! cases briefly and 120 random cases more closely
Type of instrlh"!lent
Interviewed through returnee schedule
Interview through circular migrant schedule
Survey conducted through a short questionnaire
Respondents
Respective returnee
Respective circular migrant
Best known person{s) to the permanent migrant (from his village of origin)
Information collected (or considered)
Family information: Same as given in Stage 5.
Position among sibs, marital information,
education, economic and working situation; detailed inquiry about demographic, economic, education and various aspects of movement based on important stages of circulation as well as retrospective history survey; future plan and migration satisfaction, opinions and attitudes of different issues of life.
I Same as Stage 7
Migrant's village of orkg~n, present place of destination, strerun of migration, current occupation, contact with the village of origin, approximate year of permanent migration, previous mobility behaviour, single or moved with family, and principal of
age, sex, , status, occupation, socia-economic position, tenural status, and membership status.
contd.
I-' I-'
Nature place Time In'terview Sampling frame Type of Information collected Stage of of Spent Respondents Work Work (in weeks) Completion and size instrument (or considered)
10 Community In each Consultation Selected survey study with the community
location conununity leaders/ location, leaders/elders; elders and Researcher's different own observa- cross-tion; survey section of is conducted community through people structured/ open question- mobility, patterns and of naire current and retrospective movements,
effect of movement to the village, and others.
* In each survey location families were stratified into seven socia-economic status groups (Chapter 8) and samples were drawn randomly.
!-' N
13
lasting for nearly 60 weeks and covering 1941 households
(12391 population) in 14 selected villages. Several
field instruments were employed in collecting informa
tion on the individual, the household, and the village
community. These included formal and informal
interviews, predesigned questionnaire surveys, and field
observation (Table 1.1). The procedures used in
gathering information at the individual, household, and
community levels are described in greater detail in
Appendix 6. A brief summary of field research
strategies is given in Table 1.1.
1.4 ORGANIZATION OF THE THESIS
Through use of a micro-analytical approach this
empirical study explores the contemporary mobility of
village working people in Bangladesh; the characteris
tics of movers, especially the commuters and circular
migrants, and the relationship between socio-economic
status of villagers and their mobility behaviour. In
Chapter 2, some conceptual, theoretical, and
methodological issues which are important in the context
of analysis of population movement in Bangladesh are
examined. In addition to this, a brief review of the
history of population movement and urbanization in
Bangladesh is presented, along with an outline of the
limitations of existing migration literature in this
country.
In Chapter 3 some aspects of the physical
14
environment, population growth and distribution, and
agricultural development in the three research areas are
examined. An overview of all current mobility patterns
in these areas, including permanent relocation
immobility is also provided in this chapter.
and
In
Chapter 4 insights are provided into the space-time
patterns of commuting and circular migration, the two
dominant forms of population movement in Bangladesh.
Following this, Chapter 5 elaborates on the pattern and
process of commuting trips made by people with different
occupations in Rampal.
Chapters 6 and 7 contain detailed examinations of
the various characteristics of the commuters and
circular migrants. Chapter 6 is concerned with
individual characteristics such as age, education and
occupation structure, while in Chapter 7 a comprehensive
analysis of their household attributes such as family
size and composition, landownership patterns, tenural
status and economic conditions is provided. The
reasons for commuting and migration and the advantages
and disadvantages of these two types of movements, as
stated by the movers themselves, are discussed in the
latter part of Chapter 6.
In the final analytical chapter (Chapter 8) an
initial attempt is made to explore relationships between
levels of household socio-economic status and rates of
commuting, migration, total mobility and immobility.
The relevant literature relating to mobility behaviour
15
and social structure is reviewed and the system of
social stratification in Muslim villages in Bangladesh
is established. A set of criteria for classifying
village households into several socio-economic classes
is provided, and finally the relationship between
mobility behaviour and socio-economic status of the
surveyed population is examined empirically.
In Chapter 9 the major findings of the study are
summarised and some implications for population
relocation, urbanization, and other related developments
are briefly discussed. Some avenues for future
research are also suggested. Several appendices are
included and these contain a number of basic data
tables, a more detailed statement on the methodology of
the village survey, and some of the questionnaires used
for collection information in the field.
1.4.1 Conventions
In the text some local terms are used frequently
so that the content of the thesis will be comprehensible
to the people of Bangladesh. These terms are under
lined and an explanation of their meaning is given in
English when they first appear. The main terms are
summarized in a Glossary.
The study also has retained 'standard' local
measures such as the acre (1 acre = 0.4 hectare) and the
mile (1 mile - 1.6 km) rather than using metric
equivalents. Local measures of area and currency are
16
detailed in the Glossary.
With regard to the hierarchy of administrative
units and their names, the study has followed
conventions used in the 1981 population census. A
point that should be noted concerns the spelling of the
name of the capital city of Bangladesh. Since 1983
Dhaka (rather than Dacca) has been the official spelling
and this is used throughout the thesis.
CHAPTER 2
MOBILITY IN BANGLADESH -CONCEPTUAL ISSUES AND HISTORICAL BACKGROUND
The objective of this chapter is to raise some
conceptual, theoretical, and methodological issues which
are important in the context of analysis of population
movement in Bangladesh and other densely populated
regions in Asia. An extended review of the literature
on mobility in Third World countries is not provided
here; several recent studies contain comprehensive
statements in this regard (see, for example, Prothero
and Chapman 1985; Hugo 1981; Goldstein 1978; Bedford
1981a). After examining the problems of defining the
forms of mobility relevant to this study, the history of
population movement and urbanization in Bangladesh is
reviewed briefly. In the final section, some
limitations of the existing migration literature in
Bangladesh are outlined. Discussion of the relation-
ship between social stratification and population
movement which has been the subject of much debate in
recent literature, is deferred until Chapter 8.
2.1 DEFINITIONS OF POPULATION MOVEMENT
The lack of standard definitions of 'a move' and
'forms of movements' is an unsolved problem in migration
research. Since the 1960s there have been a large
number of micro-scale empirical inquiries into internal
18
population movement in Third World countries, especially
in communities in South and Tropical Africa, Southeast
Asia, and the Pacific Islands (see, for example,
Prothero and Chapman 1985; Chapman and Prothero 1985).
From these studies a new terminology has evolved for
defining a wide variety of popUlation movements, mostly
local and regional, which could not be defined
satisfactorily by conventional migration definitions
derived largely from western experience. In developing
this terminology, researchers have freely used space,
time and purpose of movement criteria to define a
variety of movements which still lack uniform meaning
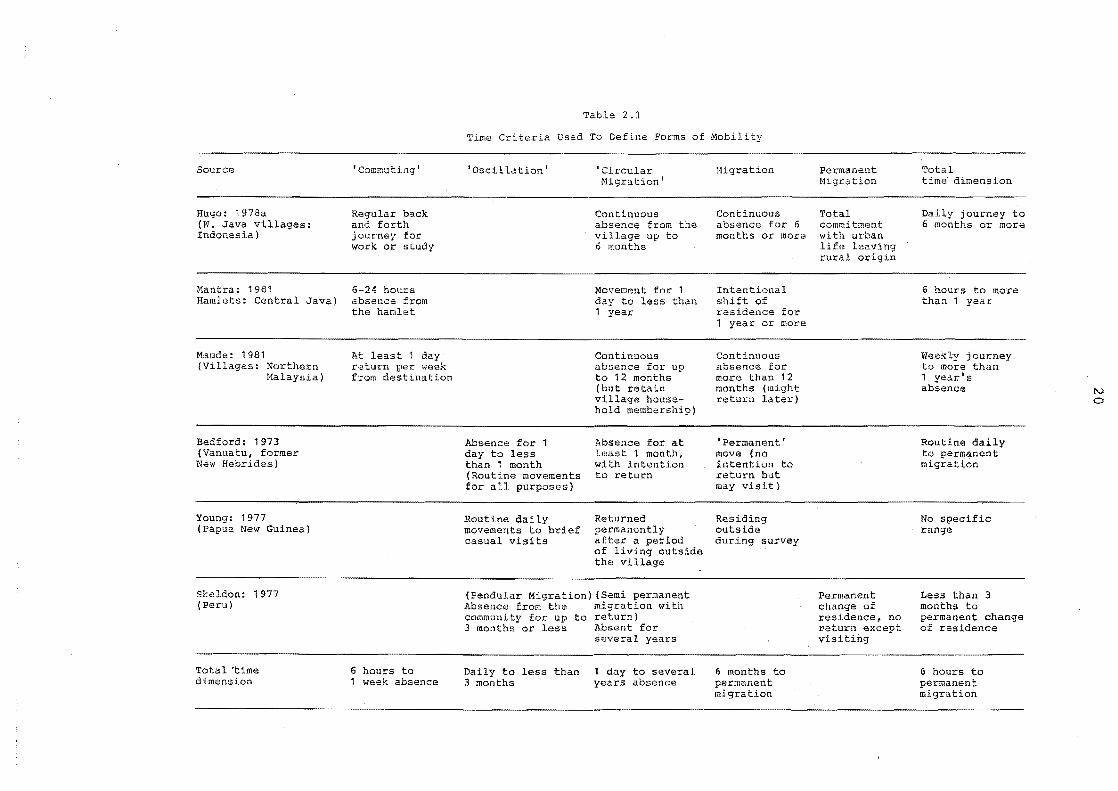
(Table 2.1). For this reason it is necessary to
elaborate on the concepts of migration and circulation -
the two essential components of population movement.
2.1.1 Mobility, migration and circulation
Mobility
The general term 'population mobility or
movement' includes all kinds of spatial relocation from
routine daily commuting to permanent migration that
occur over various distances, and in which the duration
of moves varies from a few hours to many years (UN
1970). It includes both reciprocal flows as well as
the conventional linear type of migrations.
An operational definition of mobility depends on
the types of research or types of data which are
available, or both (Kosinski and Prothero 1975, 1).
19
Mobility involves a spatial relocation either without
change of residence (such as commuters) or with change
in place of residence (both temporary and permanent
change). In either case a person who relocates for any
purpose, such as for work, study, visit, recreation,
shopping, etc. will be called a mover.
Migration
Following Zelinsky (1971, 225), population
mobility can be divided into migration and circulation.
The distinction is usually drawn on the basis of the
degree of permanent change of residence which is again
arbitrarily assessed by the researchers. The United
Nations (1970, 1) defines migration as a change of
residence from one civil division to another for a
period of one year or more. Those movements for less
than one year are regarded as non-migratory. Many
empirical studies, on the other hand, define a migrant
as a person who changes his residence for a period of
time such as six months or one year (Table 2.1).
The essential characteristic of migration is that
it involves a change of residence either temporarily or
permanently. This is one of the basic differences
between a 'mover' and a 'migrant'. Thus, all migrants
are movers but some movers such as commuters and short
term visitors, shoppers etc. are not migrants. Recent
mobility studies in Third World countries, have
established that migration can be divided into linear
and non-linear (circular or repetitive) patterns. The
Source
Hugo: 1978a (W. Java villages: Indonesia)
Mantra: 1981 Hamlets: Central Java)
Maude: 1981 (Villages: Northern
Malaysia)
Bedford: 1973 (Vanuatu, former New Hebrides)
Young: 1977 (papua New Guinea)
Skeldon: 1977 (Peru)
Total "time dimension
'Commuting'
Regular back and forth journey for work or study
6-24 hours absence from the hamlet
return from
6 hours to 1 week absence
Table 2.1
Time Criteria Used To Define Forms of Mobility
'Oscillation'
Absence for 1 day to less than 1 month (Routine movements for all purposes)
Routine daily movements to brief casual visits
'Circular Migration'
Continuous absence from the village up to 6 months
Movement for 1 day to less than 1 year
Continuous absence for up to 12 months (but retain village household membership)
Absence for at least 1 month, with intention to return
Returned permanently after a period of living outside the village
(Pendular Migration) (Semi permanent Absence from the migration with community for up to return) 3 months or less Absent for
several years
Daily to less than 3 months
1 day to several years absence
Migration
Continuous absence for 6 months or more
Intentional shift of residence for 1 year or more
continuous absence for more than 12 months (might return later)
'Permanent' move (no intention to return but may visit)
Residing outside during survey
6 months to permanent migration
Permanent Higration
Total commitment with urban life lea'ling rural origin
Permanent change of residence, no return except visiting
Total time dimension
Daily journey to 6 months or more
6 hours to more than 1 year
Weekly journey to more than 1 year's absence
Routine daily to permanent migration
No specific range
Less·than 3 months to permanent change of residence
6 hours to permanent migration
N o
21
former is very common in marriage migration while the
latter is mostly related to the movements of working
people, often from villages to towns.
Circulation
One of the definitions of circulation which is
commonly quoted by researchers, is that proposed by
Zelinsky (1971, 226):
•••• a great variety of movements, usually short-term, repetitive, or cyclical in nature, but all having in common the lack of any declared intention of a permanent or longlasting change in residence.
Following Nelson (1976), Hugo (1979a, 74) mentioned that
much of the mobility of individuals and families is
often repetitive, cyclical or seasonal, to and from a
'permanent' place of residence. This has been
demonstrated in a variety of Third World contexts.
In fact, 'circulation' includes all movements
encompassed by the label 'population mobility' except
for permanent migration (Hugo 1978b, 31). To
distinguish 'circulation' and 'migration', Prothero and
Chapman (1985, xvii) put it this way: "The critical
distinction between 'migration' and 'circulation', the
two major types of population mobility, denotes whether
or not a return to place of origin is involved."
Therefore a wide range of temporary migrants - from
short-term, seasonal to quasi-permanent types - who
intend to return to their place of origin, are in fact
'circulators'. With this in mind, many researchers
have labelled them as 'circular migrants' (see Table
22
2.1 ).
2.1.2 Categories of circulation
In the case of this study of mobility in
Bangladesh, circulation is divided broadly into two
categories: 'circular migration' which is closer to the
general term 'migration', and 'oscillation' which
includes frequent movement (e.g. commuting) and non
frequent movements or journeys (e.g. occasional visits,
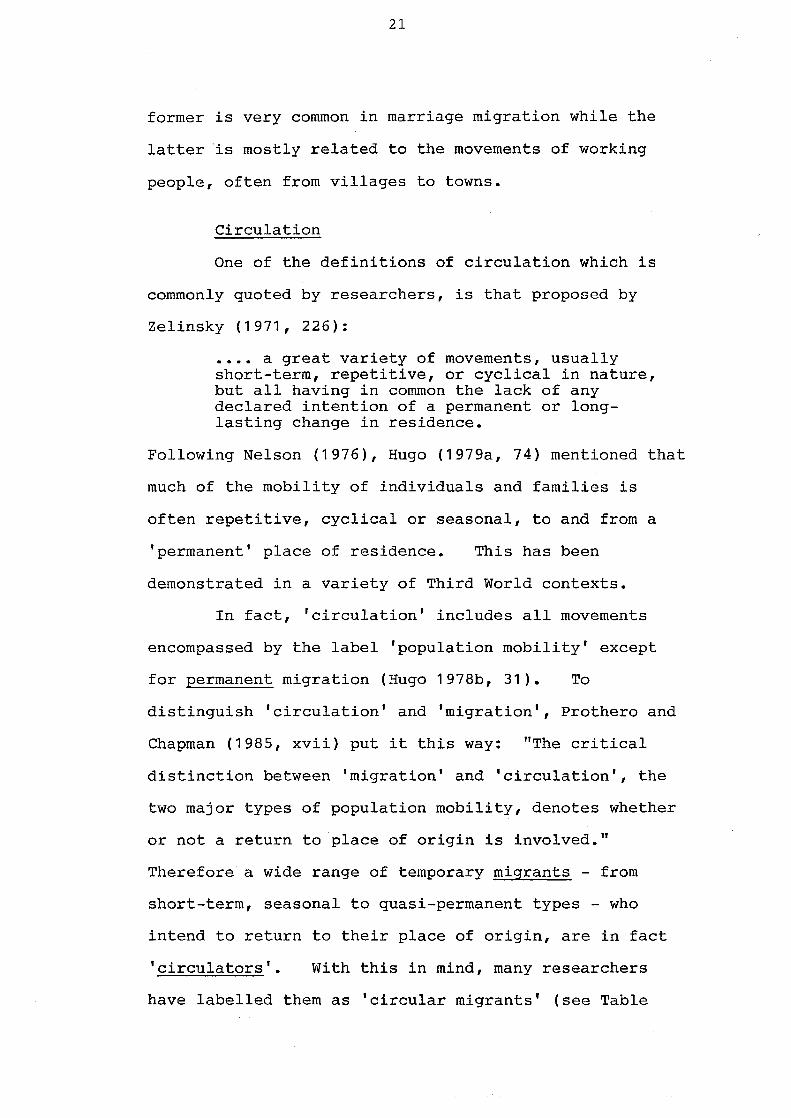
shopping etc.) (Figure 2.1). In the case of
'oscillation' or 'shuttle movement', the mover does not
require any stable residence at his place of
destination. In other words he oscillates from his
home base. On the other hand, 'circular migrants'
maintain dual residence - one (which is owned by the
movers) at the place of origin from which they circulate
and another (mostly rented) at the place of migration
(mostly town) where they temporarily reside. Hence, in
'circular migration', residential change for a diverse
range of periods is essential.
Circular migration
Functional definitions of 'circular migration'
vary greatly. This reciprocal flow of people begins at
a home base, proceeds to one or more specific locations,
and ultimately terminates at the same original base
(Roseman 1971, 591; Prothero and Chapman 1985; Mantra
1981). It is identified in the literature by a
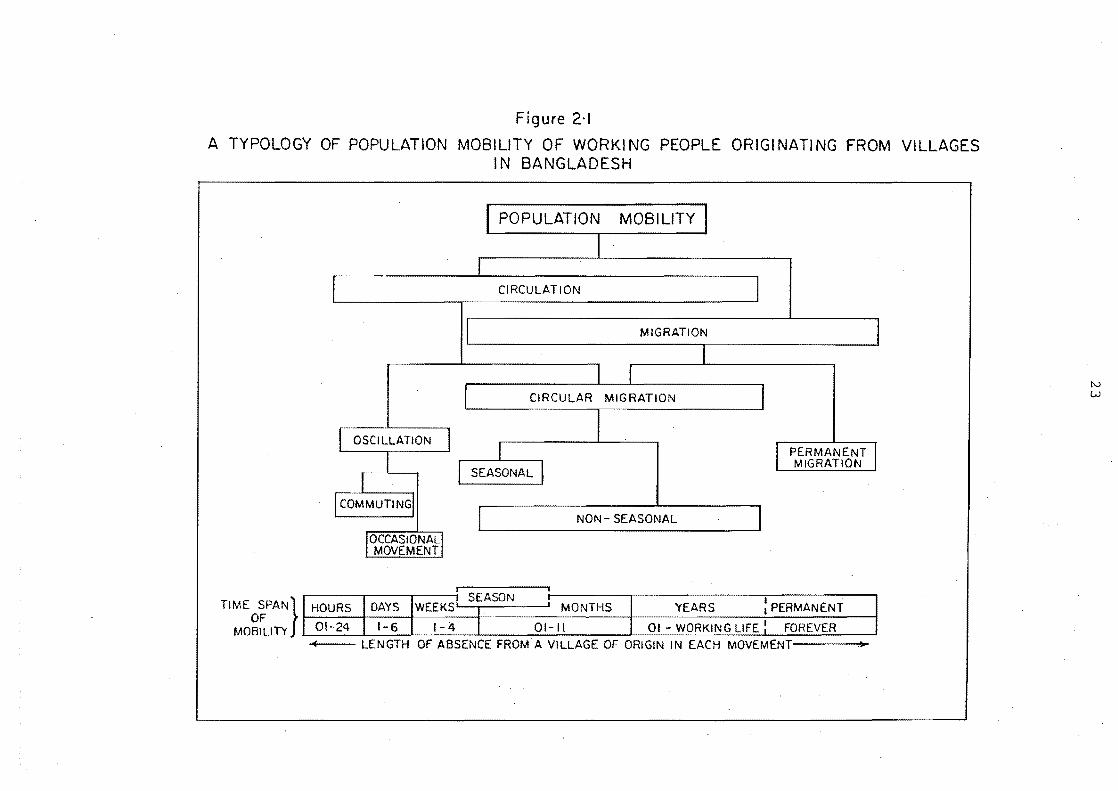
Figure 2-1
A TYPOLOGY OF POPULATION MOBILITY OF WORKI NG PEOPLE ORIGI NATI NG FROM VILLAGES IN BANGLADESH
TIME SPAN} OF
MOBILITY
I POPULATION MOBILITY J I
r r CIRCULATION I
MIGRATION
I J
I I CIRCULAR MIGRATION I
1 I OSCILLATION I r PERMANENT J I MIGRATION
SEASONAL I I I COMMUTINGI
r NON - SEASONAL J IOS~SIONA~ MO'tEMENT
I I
HOURS DAYS .l SEASON
: MONTHS YEARS : PERMANENT WEEKS
. 01-24 1-6 1- 4 I 01-11 01 - WORKING LIFE I FOREVER
"' LENGTH OF ABSENCE FROM A VILLAGE OF ORIGIN IN EACH MOVEMENT>
tv W
24
confusing variety of terms: 'circular migration',
'return migration', 'wage-labour migration', 'seasonal
migration', 'transhurnance', 'target migration',
'sojourner movements', 'life cycle migration', and
'working-life migration' (Prothero and Chapman 1985;
Hugo 1978b, 31).
In the field it is often necessary to divide
circular migration into several types of movement as it
involves a very diverse group of movers, ranging from
seasonal migrants to moderate to long-term (or lifetime)
migrants. Mantra (1981) divided such movers into
commuters and circulators. Both these groups are again
subdivided into regular, non-regular and seasonal types.
However, under the same label of circulators, he
includes occasional movers such as social visitors and
ceremonial travellers with labour migrants and seasonal
migrants. His classification, thus, does not highlight
the intrinsic difference between 'movers' and 'migrants'
as described earlier.
Many studies have stressed that the phenomenon of
seasonal labour migration is one of the most common
features of interal migration within the Third World
countries. Despite that fact, studies done by Hugo
(1978a) in Indonesia, Maude (1981) in Malaysia, Bedford
(1973) in the New Hebrides (Vanuatu), and Young (1977)
in Papua New Guinea, did not analyse such movement
separately within their broad category of circular
migration. In this study circular migration is sub-
25
divided into seasonal and non-seasonal ~ypes (Figure
2.1). Seasonal migration refers to seasonal movement
for work which is controlled by the regional agro-
climatic calendar. Non-seasonal circular migration
includes a wide variety of short-term and long-term
movements which are not tied to seasonal employment, and
are mostly oriented towards urban centres.
In the field, researchers sometimes loosely use
terms such as 'return', 'visit', and 'intention to
return' to frame their respective definition of circular
migration or repetitive movements. A circular migrant
may visit his village home and family many times during
his total migratory period, but usually he expects to
return to his place of origin when his work at the place
of destination(s) finishes. Similarly many circular
migrants (mostly rural to urban) may not have any
intention to return to their village of origin, but they
are compelled to return because of their poor income
which is not enough to meet the higher cost of living at
cities and towns. However, the time of return home may
be delayed because of the increasing population pressure
on rural land and employment. These latter factors
have made circular migration endemic in many parts of
underdeveloped countries including Bangladesh.
Commuting
The largest number of movers are commuters.
They mainly travel (daily, weekly or seasonally) for
work, but also for casual visits, shopping and for study
26
(Chapman 1970). Commuting is largely influenced by
local settings and situations, and as a result there is
considerable diversity in the empirical definitions of
commuting. Mantra (1981) in his Indonesian study
subdivided the commuters into regular, non-regular and
seasonal. Hugo (1978a, 126), on the other hand,
considered only the rural to urban commuters. Bedford
(1973), Young (1977) and Skeldon (1977) recorded
commuting considering it within the broad base of
'oscillation' or 'pendular' movements which includes
both commuting as well as some infrequent short visits
or travels.
Given the large volume of commuters in the Third
World countries, it can be hypothesised that with the
development of infrastructure and changing mode of
production in the countryside, commuting is gradually
becoming a substitute for migration. In this context
it is desirable to isolate this form of movement in the
study of population movement within countries like
Bangladesh. It may also be useful to examine categories
of commuting, such as daily, weekly, seasonal daily,
seasonal weekly.
2.2 SPACE, TIME AND LAND
2.2.1 Boundaries and distances
Most recent evidence on population mobility, and
especially circular forms of movement, in developing
countries has been derived from village level micro-
27
studies. The large numbers of movements recorded by
the researchers reflect, in part, the nature of the
boundary criteria used in the definition of a move. In
several studies the fact that a person leaves a village
is sufficient to qualify for a move. As the spatial
characteristics of villages such as size, shape and
relative location vary greatly from country to country
and region to region, cross-cultural comparison and
evaluation of mobility data using such definitions is
difficult. In this context, it is necessary to present
some important characteristics of Bangladeshi villages.
The Bangladeshi village
In Bangladesh, the village is the smallest
administrative unit, revenue unit, and census unit. l In
this part of the tropical monsoon world, villages are
very densely populated and relatively small in size. 2
Rural settlements (residential) are close, compact, and
1 As of mid 1981 Bangladesh had the following administrative hierarchy (Census 1981): 4 divisions, 21 districts, 71 sub-divisions, 477 thanas/upazilas, 4354 unions (rural), and 83,666 villages. Villages are defined mainly for administrative or census purposes and do not necessarily have sociological significance (Bertocci 1975).
2 The average area covered by a Bangladeshi village (excluding rivers, forests and urban settlements but including cropland) is nearly 320 acres (half of a square mile) and it varies greatly from a few acres to more than one square mile. Population size per village varies from less than a hundred to more than 10,000. Mean population size per village was around 900 persons in 1981. The average size of our 14 study villages is nearly one-third of a square mile and the range varies from 50 acres to more than 400 acres. The size of population, on average, was 795 (excluding non-residents).
28
contiguous; interrupted by tiny pieces of cultivated
. cropland. There are six to seven thousand village
market~3 which are of considerable importance in the
context of commuting.
Village boundaries are highly irregular in shape
and delineated by invisible criteria. Over the flat
terrain of the country, the general pattern of rural
settlements is almost uniformly scattered. Furthermore,
there is a high level of economic and socio-cultural
interdependence among village settlements. Another
characteristic of Bangladeshi villages is that for
village after village people talk the same language
(Bengali) and come from the same ethnic stock. So,
over the plain land of Bangladesh, there is virtually no
physical or cultural barrier to restrain human mobility
between neighbouring villages.
The above characteristics are important in the
context of the spatial criteria used in mobility
definitions. In many countries, including Bangladesh,
village boundaries are for administrative convenience
only. Unlike international boundaries, they have no
direct influence upon human movement. In Bangladesh
and most parts of South Asia, a village household has a
number of agricultural plots at various locations (both
within and outside the natal village) as well as at
3 A centre of non-agricultural activities/services and retailing consumer goods (see section 2.3.3). It also serves as a social and cultural centre for the interaction of rural people.
29
different distances from the residence. Landless
labourers also work at different agricultural plots.
Thus, for their livelihood, even the farmers and farm
workers have constantly been moving within and outside
their home villages.
In this situation, boundary crossing criterion
for defining local movers (such as commuters) has little
meaning because most of the household-earners, whether
farmer or non-farmer, very often move across their
village boundary for livelihood purposes. In fact,
given the varied size and shape of village settlements,
this criterion for defining movers lacks uniformity.
It aggravates the problem of comparing mobility data
from region to region within a country and from country
to country.
A minimum distance
In the light of the problem of using a boundary
crossing criterion, a minimum distance was used to
define a move. For any hierarchy of settlements,
distance is an important variable for mobility analysis.
Unlike the village boundary a minimum distance criterion
assists in eliminating problems associated with the
varied size and shape of the villages as well as the
uneven distribution of population (Bogue 1969, 757).
But the most critical problem is how the distance can be
used to define a 'move' systematically in practice. In
other words, within a village-based micro-space, where
everybody is to some extent moving, how can we
30
functionally distinguish a mover from a stayer.
In the above situation a close watch is needed to
sort out movers from stayers (although they sometimes
work outside the village). Here, the present study has
relied on a number of references on workers and
consumers travelling behaviour (Baqee 1976) as well as
the researcher's own experience from his previous rural
surveys in a similar society. Based on a minimum
distance of two miles (estimated from the mover's
residence), the study recorded 1071 commuters (1064
males, 7 females) from 14 study villages. The number
of commuters would be almost double if the study
measured commuting across the village boundary
irrespective of distance traversed by the villagers.
In that situation, it could be hard to record any single
stayer who never gets out of his home village for work.
2.2.2 The duration of moves
Another intrinsic problem of defining moves and
movers is the dimension of time. This invisible
criterion is more confusing than space and there is
still lack of precision in our definitions based on the
periodicity of different forms of movement, as well as
the distinction between movers and non-movers, and
'circular migration', 'migration' and 'permanent
migration'. In Table 2.1, the temporal domains of
various types of movements which have been empirically
defined by researchers in recent years are given.
31
Every form of movement identified here has a wide time
span and over the range of mobility, 'moves' vary from
six hour absences to permanent migration or relocation.
In the case of absences for commuting, the time
involved in a move varies from six hours to one week.
For circular migration moves range in duration from one
day to one year. The duration of moves termed
migrations varies from six months to a lifetime move.
These definitions suggest a high degree of temporal
overlapping in mobility types (Table 2.1 and Figure
2.1 ) • Singhanetra-Renard (1981) has also shown this is
the case in her study of mobility to and from villages
in northern Thailand. In such a situation, it is very
difficult to generalize about the temporal definitions
of different forms of mobility.
Avoiding a-priori definitions
Some researchers, such as Chapman (1970) and
Singhanetra-Renard (1981), studied all sorts of moves
involving some spatial relocation without imposing
a-priori definitions or attempting to group forms of
movement by type, such as commuting, oscillation,
seasonal circulation, long-term circulation, etc. Both
of them studied moves, not forms of movement. Chapman
included all moves ranging from absences for 24 hours to
permanent relocation. Singhanetra-Renard recorded all
moves from six hour absences to more than ten years.
In these two studies, the researchers avoided the
confusion which commonly arises because of diversity of
32
opinion over definitional issues. Commenting on
Mantra's and Singhnetra-Renard's classification of moves
with respect to space/time criteria and their temporal
distinction between commuting, circulation and
migration, Goldstein (1978, 48) said that they failed to
standardize their concepts of circular movements.
Continuous absence
Hugo (1978a) and Maude (1981) have both used the
term 'continuous absence' to qualify their time
dimension which they used in their operational
definitions (see Table 2.1). Defining 'circular
migration' and 'migration', Hugo used continuous periods
of absence for up to six months or more respectively,
while Maude extended it up to 12 months or more. But
it is not clear from their definitions whether they
excluded home visits in the interim period, or not. If
this is excluded, then these definitions have little
meaning in the economic and cultural contexts of many
parts of the Third World, including South Asia and
Bangladesh.
During our field stay (in Bangladesh) we met many
'circular migrants' (non-seasonal) who visited their
village homes more than 4 times a year. We also found
a differential pattern of visiting frequency and
duration of absence or circulation period among the
household head and non-head members, student and job
migrants, and married and unmarried migrants. The
general pattern is that heads and married migrants visit
33
more frequently than non-head, unmarried and student
migrants. This is quite understandable because the
household heads are married and they have more
responsibilities to their families in the village than
their unmarried migrant and student mover counterparts.
Hugo recognizes the difficulty of measuring circulation
by adopting an absolute time scale which usually creates
problems in developing a clear operational definition of
circulation (Goldstein 1978, 43).
In the New Hebrides (now Vanuatu) Bedford (1973)
categorised all absences up to one month as 'oscilla
tion' which includes routine daily movements to brief
casual visits. This wide temporal scale highly
overlaps with seasonal migration and short-term circular
migration, and thus it has less significance in
Indonesia (Hugo 1978a, 78), Bangladesh and probably
other parts of South and Southeast Asia. Defining
'oscillation', Young (1977) in Papua New Guinea, on the
other hand, avoided any absolute time scale.
Overlapping time scales
The present study avoids taking an absolute time
scale for defining various types of movement. It was
believed that absences for commuting could range from a
few hours to several days. For seasonal 'circular
migration', the time-span varies from more than one week
to less than 3-4 months. For non-seasonal 'circular
migration' it varies greatly from less than a months to
more than 8-9 months.
34
2.2.3 The importance of land
Recent reviews of population movement in the
Third World countries have demonstrated that the
environment of circulation in densely settled agrarian
regions in Asia is quite different from that of other
regions, such as Africa, the islands of the Pacific, and
less densely populated areas of Asia (Prothero and
Chapman 1985; Bedford 1981a). Researchers have argued
that the most important factor in this regard is
availability of and ownership of land (Young 1984;
Bedford 1981a).
An acute shortage
Unlike African and Melanesian societies, where
population densities are comparatively low and land is
communally owned, the most populous regions in Asia are
characterised by acute shortage of land and an unequal
distribution of this resource. A large proportion of
rural households in Bangladesh and other parts of South
and Southeast Asia such as India, Java, and the I
Philippines are either landless or own a small amount of
land (Ghose and Griffin 1980). The numbers of these
landless or near landless families are gradually
increasing with the continued rapid growth of population
and deterioration of socio-economic conditions in the
rural areas. In addition to this, the rate of growth
in the agricultural labour force in these crowded
regions is found to be higher than the expansion of

35
employment in the agricultural sector (see Tables 2.2,
2.3 and 2.4 for Bangladesh). As a result, it is an
undeniable fact that millions of adult men in Asian
villages remain unemployed, underemployed, and
seasonally employed.
The real situation of acquiring land and securing
employment on farms in the overpopulated villages in
South and Southeast Asia is more complex than the simple
fact outlined above. Boyce and Hartmann (1981, 26)
have illustrated this in the context of rural
Bangladesh:
Rural Bangladesh is a scene of relentless struggles, pitting villager against villager. Above all, villagers compete for control of land. To the poor man, land means the ability to reap the rewards of his own labour. To the rich man, land means the ability to profit from the labour of others. The competition is unequal, with winners and losers largely determined in advance. Those who command land, resources and markets prosper, while those who have only their labour to sell slowly waste until they die. Those in the middle enjoy a certain amount of mobility. A few aggressive individuals, ••• may manage to rise in the economic hierarchy. But for each middle peasant who rises, many others fall.
Dual occupations and incomes
In Bangladesh, the massive rural surplus
workforce which includes landless labourers, small
peasants, part-time farmers, and educated youths, has
much relevance for the current explosion of circular
mobility. Due to the scarcity of land and employment,
and the unequal distribution of these two resources,
particularly the land, most of the rural households
36
usually deploy their family labour both on and off the
farm, because they are unable to gain an adequate income
from either farming or wage labour. An empirical study
has revealed that in Bangladesh, 80 percent of farmers
have off-farm employment in addition to their farm work
(Ali 1980). The families earn off-farm income by
sending their members to urban, semi-urban and rural
market centres which constitute the destinations for
rural circulation (Section 2.3).
Many rural families or individuals, especially
from the lower economic strata of village society, are
locked into the dual occupation system and they depend
on village and town for livelihood (Forbes 1981). In
the urban or semi-urban areas, they mostly find work in
the informal sector - work suited to their poor skills
as well as to the agricultural calendar in their home
village. Individuals from the higher economic echelons
are likely to be better educated and come from large
families, the families which have extra man-power and
are able to spare their educated youths for a longer
period from the village. This group of working people
from the rural areas tend to engage in permanent jobs in
the urban informal sector (Hugo 1984; Young 1984) and
are less likely to commute or make frequent visits
associated with agricultural calendar.
The patterns and processes of circular mobility
associated with land shortage, land inequality and
agricultural structure are indeed very complex and vary
37
from one region to another. Very few studies, however,
attempt to explain this complexity, although many of us
agree with Chapman and Prothero (1977, 5) that
'Circulation, rather than being transitional or
ephemeral is a time-honored and enduring mode of
behaviour, deeply rooted in a great variety of cultures
and found at all stages of socio-economic change'.
2.3 POPULATION MOBILITY AND URBANISATION IN BANGLADESH: AN OVERVIEW
Traditionally, the people of Bengal have been
regarded for a long time as a "closed" nation, and the
region that is now known as Bangladesh has had a very
low level of urbanization. Although the population of
Bangladesh continues to remain predominantly rural
resident (Figure 2.2), there is undeniable evidence that
major changes are taking place which are generating
accelerating rates of human mobility and related to
this, higher levels of urbanization. With only 15
million, or 15 percent of the total population of almost
100 million, living in urban and semi-urban centres,
Bangladesh has a considerable potential for substantial
increase in the size of the urban population through
natural increase and redistribution of people from rural
to urban places.
After partition of the Indian sub-continent in
1947, levels of rural out-migration remained very low in
Bangladesh until the end of the 1950s. During the
1960s population movement within the country gained
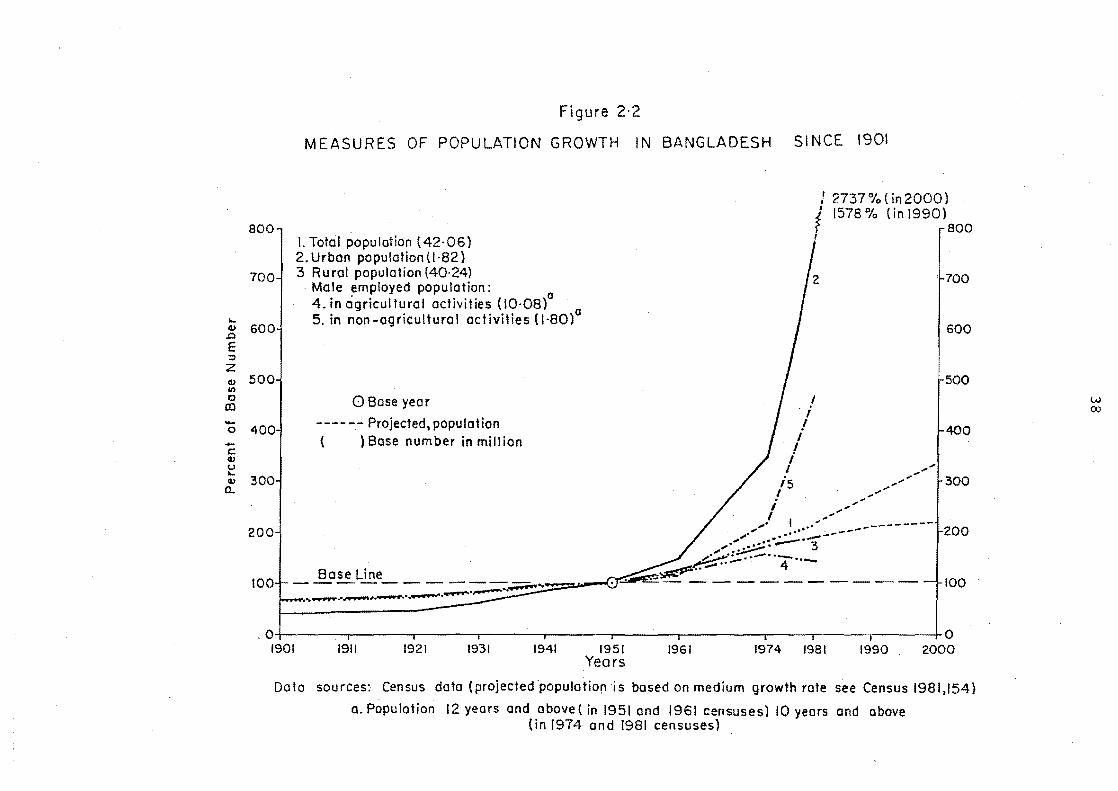
Figure 2·2
MEASURES OF POPULATION GROWTH IN BANGLADESH SINCE 1901
: 2737% (in2000) ; 1578 % (in 1990) ? raoo I
., 700
600
500
I
/ i ! 1-400
" is .".' I .,.'" i .. """/ 1-300
I .... ......
.... '. 1 ....... . .,; .- ...... .
; ......... ~'; ---.---------------~~~>'-.. - 3 1-200 • __ _ 4 "-
- ---}-IOO
,0 I j I I 10 1901 1911 1921 1931 1941 1951 1961 1974 1981 1990 2000
Years
Dota sources: Census data {projectedpopulotion 'is based on medium growth rote see Census 1981,154}
a. Population 12 years and above ( in 1951 and 1961 censuses) 10 years and above (in f974 and 1981 censuses)
w co
39
momentum and since the early 1970s the mobility of rural
people in particular has intensified considerably.
These trends since 1947 cannot be explained without
referring to the pre-partition situation with regard to
population movement and related phenomena. Until 1947,
Bangladesh was a part of undivided India and hence its
internal migration field extended over a vast empire.
2.3.1 Population movement in East Bengal and East Pakistan
The situation before 1947
Bangladesh is a long-settled area mainly due to
rich agricultural lands on which human settlement began
to flourish thousands of years ago (Majumdar 1943, 562;
Davis 1951, 23). For many centuries, even up until the
end of the 19th century, more people migrated to what
was then East Bengal than emigrated to other parts of
the Indian sub-continent (Rashid 1977, 512). In
medieval India there was a saying "there was a way in
but no way out of Bengal" (UN 198?, 5). In fact,
before the start of the twentieth century, the people of
this region of particularly fertile soils hardly felt
any necessity to migrate elsewhere in order to derive a
livelihood. People of Bengali origin were less likely
to work in the plantations (such as tea, coffee, rubber)
which employed millions of Indians in Assam and
Darjeeling in India, Sri Lanka, Malaysia and other parts
of the British empire in Asia, Africa and the Pacific
(Davis 1951; Georgo 1966j World Bank 1981).
40
It was not until the early 1900s when the
Bengalis began to experience pressure of population on a
scarce land resource that the balance of migration
across the boundary of East Bengal turned towards net
losses rather than gains (Figure 2.3). This process of
readjustment of population numbers and densities in
relation to available productive resources and rural
employment opportunities in India was abruptly
terminated in 1947 by the creation of Pakistan. As a
result the vast internal migration field of the East
Bengal people suddenly telescoped to a small area and
the potential for emigration from this densely settled
agrarian region was severely restricted.
Another factor which contributed to relatively
low levels of migration away from rural communities in
East Bengal before the twentieth century was the
region's hinterland status within the empire of India.
For a long period major administrative, commercial, and
industrial centres were located outside the region.
Even during the period when East Bengal was part of a
united Pakistan (from 1947-71), the main local centre,
Dhaka, was a provincial capital with limited commercial
and industrial infrastructure. In 1947, when
Bangladesh lost free access to Calcutta, then the
commercial and industrial capital of the sub-continent,
the main route of rural-urban traffic was also
disrupted. Because of its proximity to Calcutta, and
also because East Bengal has long been regarded as an
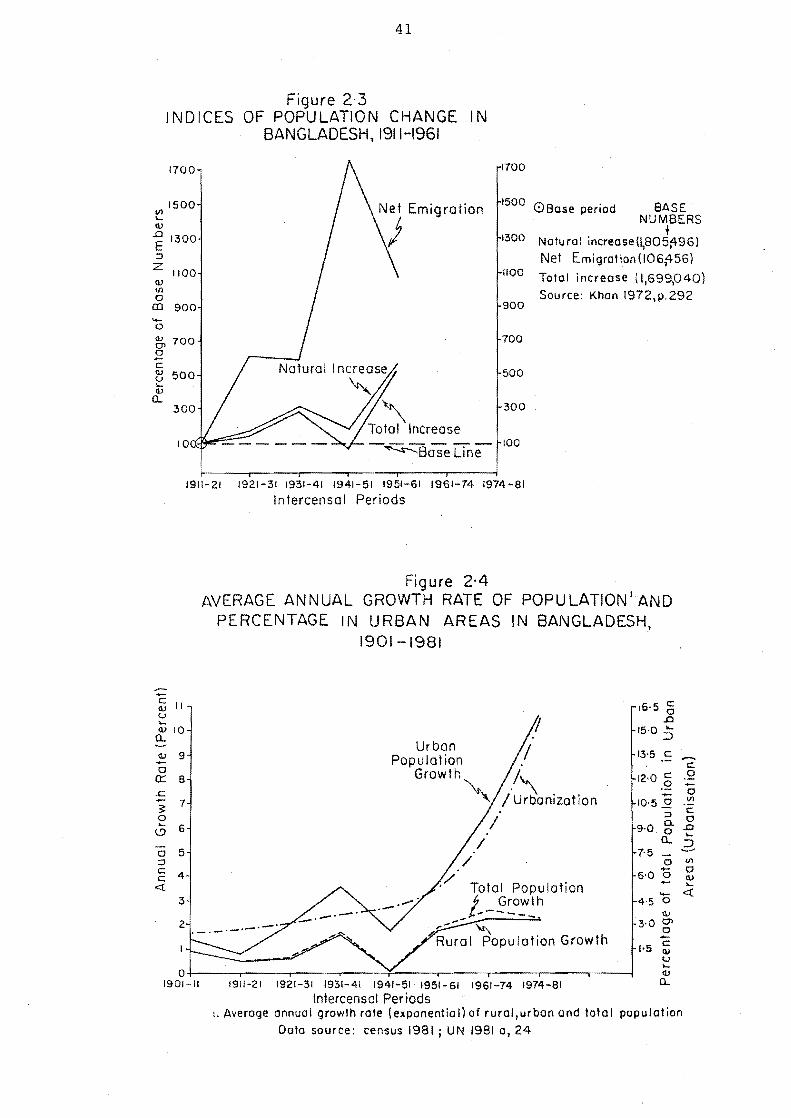
41
Figure 2·3 INDICES OF POPULATION CHANGE IN
BANGLADESH. 1911-1961
1700 1700
1500 Net Emigration 1500 o Bose period BASE VI
"-
) NUMBERS v t E 1300 1300 Natural increaseU,805fl961 ::> Net Emigro! ion (106;456) z
1100 1100 Total i ncreose (1,699,040) v til Source: Khan 1972,p.292 0 ro 900 900 ..... 0
~ 700 700
2 c: Natural Increase <IJ 500 500 u
~ '-<IJ a..
300
10 -~BaseLine
100
1911-21 1921-31 1931-41 1941-51 1951-61 1961-74 1974-81
-~ II u ..... (IJ 10 a.. v 9 -o
0:: 8
'i 7 o l? 6
o 5 ::> § 4 «
3
2
Intercensol Periods
Figure 2,4 AVERAGE ANNUAL GROWTH RATE OF POPULATION
I AND
PERCENTAGE IN URBAN AREAS IN BANGLADESHt
1901-1981
Urban Population
Growth
"" j /U'\b ' . r anlzatlOn
,'/ Total Population
l_~~O::~h ,--- ~ .. Rural Population Growth
16·5 c: 0 .0
15·0 ::5 13'5 c:
12.0 c: .2 -10'5 ~
::>
9·0. g-a..
7'5 0 -6·0 0 --4·5 0
<IJ 3.0 0>
0
O+-----r-----r-----r---~~--~r---_.,_----._--_.,_--~ /901-11 /911-21 1921-31 1931-41 1941-51' 1951-61 1961-74 1974-81
Intercensol Periods
---c: .2 -0 VI
c: 0 .0 .... 2.
VI 0 v .... «
I. Average onnual growth rote (exponentioilof rurol,urban ond totol population
Data source: census 1981 i UN 19810,24
42
agrarian region in India, the systematic development of
urban and industrial centres had not taken place in East
Bengal.
Partition and underdevelopment, 1947-1971
Partition of the sub-continent not only
restricted the spatial extent of migration of
Bangladeshi people, it also caused a great deal of
socio-economic disruption by dislocating three to four
million people within a very short time. At partition,
Bangladesh (then East Pakistan) gained 699,079 muhajirs
(Muslim immigrants) from India (census of Pakistan,
1951) and in return lost a large number of Hindu
emigrants (approximately three to four times the number
of Muslim immigrants). But the real loss was the
sudden mass emigration of skilled and educated Hindus,
business folk, urban dwellers, and land owning groups.
Unlike India and Pakistan (then West Pakistan)
Bangladesh lost qualified people and received in return
relatively unskilled immigrants, mostly peasants (Davis
1951 ) • Before partition, the Hindu community dominated
in business, administration, and various professions and
services in Bangladesh. They were more wealthy, urban
and literate than the Muslim communities. The
departure of Hindus from East Pakistan continued for
several years after the partition and by the early 1950s
most of the comparatively wealthy and well-educated
Hindus had moved to India.
43
The consequences of this emigration of rich and
better-qualified people from different sectors of the
economy were massive capital and brain-drains. These,
in turn, indirectly assisted West Pakistani ruling
elites and merchants to fill the gap created by Hindu
emigration. The loss of access to Calcutta also
fostered economic domination of East Pakistan by its
Western counterpart. After the creation of Pakistan,
economic and development policies were designed in such
a way that it made the East a hinterland of the West.
The economy of West Pakistan was able to grow at a
faster rate partly through profitable exploitation of
East Pakistan's resources, such as jute and tea (UN
1980a), and partly through having a lucrative market in
the East for manufactured goods. In brief, the
economic disparity between the two parts of Pakistan
became so acute that the net result for the eastern
region was little different from the economic
exploitation of East Bengal under colonial rule in
India. This economic exploitation did not end until
the war of liberation which led Bangladesh to
independence in 1971 (Khan, A.R. 1972 cited in UN
1980a).
Intra-rural mobility
It was stated earlier that Bangladesh has had
high rural population densities for a long time.
Available information clearly indicates that rural to
rural migration was the dominant stream of internal
44
population movement in Bangladesh, and peasants
constituted the bulk of the movers (George 1966; Davis
1951; Khan 1972). During the first five decades of the
twentieth century, the movement of peasants from
Bangladesh to neighbouring regions such as Assam,
Meghalaya and Tripura, where large tracts of
agricultural land were still available for cultivation,
dominated these rural population transfers. The
partition of India severely restricted this peasant
migration, although it has been argued (Ali 1983) that
after partition the flow of peasants to neighbouring
regions in India did not stop totally (Ali 1983).
However, the flow diminished significantly due in large
measure to the rise of violent anti-immigration protests
among the native people in those regions.
The net effect of partition was to reduce the
range of potential rural destinations for village people
in Bangladesh. This did not reduce the volume of
intra-rural population movement immediately - indeed
census results suggest that the level of lifetime
migration~ increased slightly from 2.3 percent to 3.5
percent from 1951 to 1961. But by 1974 it had fallen
back to 3.4 percent suggesting some stabilization in
this measure of internal migration in Bangladesh (Elahi
4 A person whose place of residence (district, state, province etc.) at the census date differs from his place of birth is a lifetime migrant. Such people comprise the lifetime migration streams (UN 1970) and the magnitude of this movement is commonly expressed in terms of the percentage of lifetime migrants in the total population (Census 1974, p.25).
45
1980). The spatial pattern of lifetime migration has
been closely related to the population density gradient.
western and north-western districts, which are
relatively less densely populated have received more
in-migrants than other regions of the country
(Obaidullah 1967; Krishnan and Rowe 1978). By the
early 1960s, when these regions were also experiencing
pressure of population on available resources rural
lifetime migration began to stabilize.
2.3.2 Migration and urbanisation
The rapid expansion of rural-urban migration
during the 1960s and 1970s, needs to be viewed in the
context of the country's demographic, economic, and
political background. As we have noted already,
Bangladesh is a rural country in terms of its population
distribution. The role of rural-urban migration in
urbanization has only been observed recently.
Urban population size
Between 1901 and 1961 the proportion of the
population that was rural resident fell by only 2.8
percent, i.e. from 97.6 percent in 1901 to 94.8 percent
in 1961 (Ahmad 1976). During the next two decades,
however, the proportion of people living in rural areas
fell by a further 10.1 percent, reflecting a significant
change in the patterns of migration, urbanization and
population redistribution. During the 1960s and 1970s
the net flow of lifetime migration changed from a rural
46
to an urban orientation. In 1951, for example, eleven
of the 17 districts in East Pakistan recorded net
lifetime migration gains. Most of those districts were
rural. By 1981, only eight districts out of a total of
21 were gaining more lifetime migrants than they were
losing, and 76 percent of the gains were in Dhaka and
Chittagong - the two most urbanized districts in
Bangladesh.
Given the vast number of people living in a very
compact territory, the importance of urbanization cannot
be understood solely in terms of the proportion of the
population living in towns. Although Bangladesh
remains one of the least urbanized countries in the
world, the size of the urban population is enormous (13
or 14 million in 1981). It is as big as the total
population of many nations like Australia, Malaysia, Sri
Lanka, Nepal etc. Between 1901 and 1981 the urban
population increased approximately 20 times - from
700,000 to 13.2 million (census unadjusted figures).
Over the same period the rural population trebled from
28 to 76 million.
Urban population growth
During the last two intercensal periods (i.e.
1961-74 and 1974-81), the annual growth rates of urban
population were 6.6 and 10.6 percent respectively
(Census 1981, Table 4, p.36). These rates are
extremely high by world standards as evident from the
United Nations' reports (1980b, 1982, Islam 1985). At
47
present rates of growth the urban population of
Bangladesh will double in less than 10 years.
There are three factors which contribute to the
growth of urban population - (i) natural increase of
population, (ii) out-migration from rural areas, and
(iii) spatial expansion of urban areas by boundaries
changes of existing centres and/or the creation of new
urban areas. In the case of Bangladesh, the principal
component of growth is the out-migration from rural
areas. Results from various studies and the 1981
census report suggest that at least half of the total
increase of urban population since 1961 was caused by
rural-urban migration (Chaudhury 1980; Khan 1982; Centre
for Urban studies 1982).
In some of the larger cities, such as Dhaka and
Khulna, in-migrants accounted for almost three-quarters
of the total increase in population during the 1961-74
census period (Khan 1982). During the last intercensal
period (1974-1981) 700,000 people a year were flooding
into the cities and towns - the equivalent of almost
2000 people every single day. In the next decade the
volume of in-migration is expected to rise substantially
according to projections of urban populations for 1990
and beyond (Figure 2.2).
The rapid increase in both rural-urban movement
and the size of the urban population, especially after
the independence, was stimulated by expansion of trade,
commerce, manufacturing and administration, and has been
48
accompanied by rising expectations for a better life in
town in the face of deteriorating rural conditions (Khan
1982). Despite heavy reliance upon traditional
agriculture as a means of livelihood, significant
changes in the occupation or employment structure are
gradually taking place in Bangladesh. This is
demonstrated in Tables 2.2 to 2.5. The data from these
tables clearly indicate that the relative share of
agriculture as a means of livelihood is decreasing.
It is also evident that in the agricultural
sector, there exists a substantial un/underemployed
labour force which is increasing much more rapidly than
the provision of new jobs. Population pressure and an
unequal distribution of resources, especially land, are
two important factors which are causing many villagers
to leave rural areas. As employment prospects in
agriculture worsen, a greater number of villagers are
moving to the cities, towns and other hubs of non
agricultural activities (e.g. rural markets, thana
centres etc.).
Urban movement and urban centres
Conventional definitions of 'migration' and
'urban' do not capture adequately the essence of either
rural-urban movement or the process of urbanization in
Bangladesh or elsewhere in the sub-continent. In
Bangladesh, much of the movement between rural areas and
urban centres, which is related to economic reasons, has
been temporary and cyclical in nature. It has involved
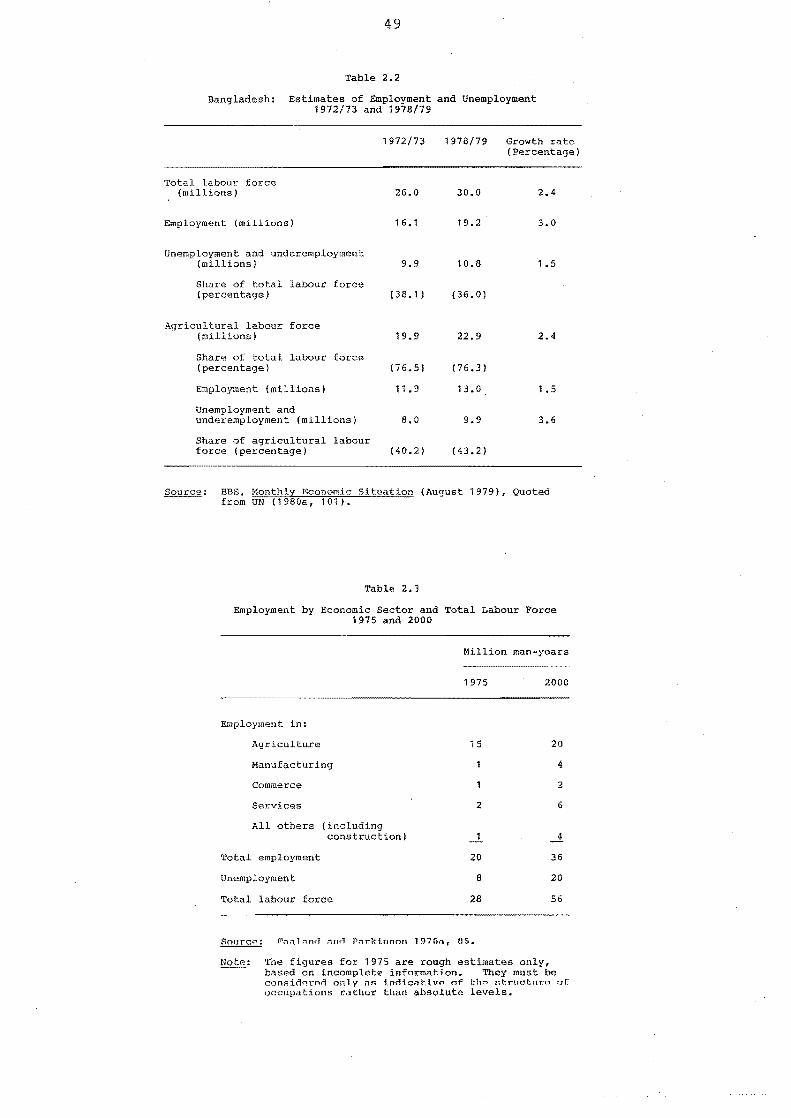
49
Table 2.2
Bangladesh: Estimates of Employment and Unemployment 1972/73 and 1978/79
Total labour force (millions)
Employment (millions)
Unemployment and underemployment (millions)
Share of total labour force (percentage)
Agricultural labour force (millions)
Share of total labour force (percentage)
Employment (millioils)
Unemployment and underemployment (millions)
Share of agricultural labour force (percentage)
1972/73
26.0
16.1
9.9
(38.1 )
19.9
(76.5)
11.9
8.0
(40.2)
1978/79
30.0
19.2
10.8
(36.0)
22.9
(76.3)
13.0
9.9
(43.2)
Growth rate (Percentage)
2.4
3.0
1.5
2.4
1.5
3.6
Source: BBS, Monthly Economic Situation (August 1979), Quoted from UN (1980a, 101).
Table 2.3
Employment by Economic Sector and Total Labour Force 1975 and 2000
Employment in:
Agriculture
Manufacturing
Commerce
Services
All others (including construction)
Total employment
Unemployment
Total labour force
Million man-years
1975
15
2
1
20
8
28
2000
20
4
2
6
....1. 36
20
56
SCIlr.Cf.': Pn<ll"n<l <111,1 Pnrld.nnon 197(' ... , OS.
Not.e: 'I'lle figures for 1975 are rough estimates only, based on incomplete information. They must be conRhl~r."fl only"" i.nrlicnt,ivn of ~hn "t:"'BetuLa Q[
occupations rather than absolute levels.
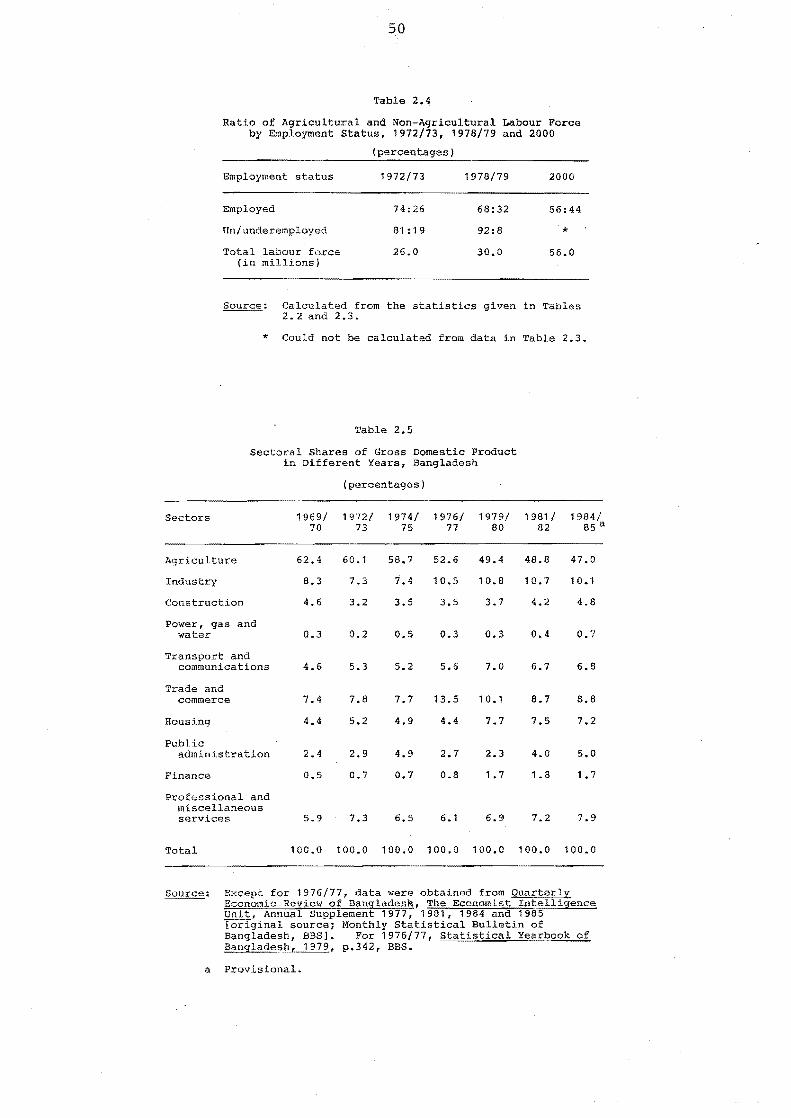
50
Table 2.4
Ratio of Agricultural and Non-Agricultural Labour Force by Employment Status, 1972/73, 1978/79 and 2000
(percentages)
Employment status 197'2/73 1978/79 2000
Employed 74:26 68:32 56:44
Un/underemployed 81: 19 92:8 * Total labour force 26.0 30.0 56.0
(in millions)
Source: Calculated from the statistics given in Tables 2.2 and 2.3.
* Could not be calculated from data in Table 2.3.
Table 2.5
sectoral Shares of Gross Domestic Product in Different Years, Bangladesh
Sectors
Agriculture
Industry
Construction
Power, gas and water
Transport and communications
Trade and commerce
Housing
Public administration
Finance
Professional and miscellaneous services
Total
(percentages)
1969/ 1972/ 1974/ 1976/ 1979/ 1981/ 1984/ 70 73 75 77 80 82 85 a
62.4 60.1 58.7 52.6 49.4 48.8 47.0
8.3 7.3 7.4 10.5 10.8 10.7 10.1
4.6 3.2 3.5 3.5 3.7 4.2 4.8
0.3 0.2 0.5 0.3 0.3 0.4 0.7
4.6 5.3 5.2 5.6 7.0 6.7 6.8
7.4 7.8 7.7 13.5 10.1 8.7 8.8
4.4 5.2 4.9 4.4 7.7 7.5 7.2
2.4 2.9 4.9 2.7 2.3 4.0 5.0
0.5 0.7 0.7 0.8 1.7 1.8 1.7
5.9 7.3 6.5 6.1 6.9 7.2 7.9
100.0 100.0 100.0 100.0 100.0 100.0 100.0
Source: Except for 1976/77, data were obtained from Quarterly Economic Review of Bangladesk, The Economist Intelligence Unit, Annual Supplement 1977, 1981, 1984 and 1985 [original source; Monthly Statistical Bulletin of Bangladesh, BBS]. For 1976/77, Statistical Yearbook of Bangladesh, 1979, p.342, BBS.
a ProvisionaL
51
movement of individual males who usually leave their
families in the village and retain village citizenship
as well as membership in town. The movers who practise
this "bilocality" are gradually increasing and make up a
progressively larger proportion of the urban population
(Skeldon 1984).
The process of circulation between rural and
urban or semi-urban places also appears to be dominated
by short-term and short-distance movement. This has
been facilitated by improvement of rural-urban
transport, and the proliferation of urban and semi-urban
centres due to the decentralization of administration
and some urban services and utilities, especially
electricity facilities. In addition there has been a
trend towards dependency among rural households on two
or more income sources, one on-farm and the others off
farm. It is generally believed that much of the short
term and short-distance circular movements cannot be
captured by census surveys, as the census traditionally
measures mobility on the basis of statements about place
of birth or place of previous/last residence. As a
result, in many Third World countries including
Bangladesh, census statistics generally underestimate
the magnitude of rural-urban mobility and the exposure
of rural populations to urban life.
Another aspect of census statistics must also be
taken into consideration and this is the way in which
urban places are defined. In Bangladesh the total
52
number of urban localities increased from 78 in 1961 to
108 in 1974. But in 1981, the number jumped from 108
to approximately 500 (Bangladesh Bureau of statistics
1984, 2) of which more than 350 localities were given an
urban status by applying a new definition.
In previous censuses, places were classed as
'urban' if they had a Municipality, a Town Committee or
a Cantonment Board. Such places had a continuous
collection of houses, a population of at least 5000
persons, and public utilities such as roads, street
lighting, water supply, sanitation, sewerage system,
etc. They were also normally centres of trade and
commerce with a population mostly non-agricultural and
having a higher literacy rate than was found in the
surrounding rural areas. An area which had the above
characteristics but less than 5000 population was also
considered as an urban centre in special cases.
In 1981 all the thana headquarters irrespective
of their area and level of urbanization, as well as
haats and bazars having electricity, which were not
covered under the previous definition, were classed as
"urban" (Census 1981,35). The exact numbers and
detailed characteristics of these newly defined urban
centres in 1981 have not yet been published. But the
census authority has reported that the new urban
localities accounted for nearly 30 percent of the total
urban population in 1981 (13.2 million) or roughly about
4 million people (ibid, 36).
53
The urban status of all thana headquarters which
lie within the countryside and some rural markets having
electricity is indeed a matter of great debate among the
population planners, migration experts and others. But
what is more important, especially in the context of
population mobility and urbanization in Bangladesh, is
that the 1981 census, for the first time, has recognized
the thana headquarters and rural markets as an important
locus of village out-migration. The significance of
these two hubs of non-agricultural activities becomes
far greater if we also consider patterns of local
movements (such as daily, weekly or bi-weekly commuting)
of village people (see Chapters 4 and 5). As Skeldon
(1984) has noted: lIif only the longer-distance flows
are considered as migration, the population of South
Asia appears relatively immobile but the whole situation
changes if the local movers are included. 1I
2.3.3 Rural service centres
Future patterns of population movement and the
expansion of urban areas in Bangladesh will depend to a
great extent on the development of two kinds of rural
service centres: the village markets (haats) and thana
headquarters. The essential characteristics of these
low-order central places in the Bangladesh urban
hierarchy are outlined below. Their significance in
the context of rural mobility patterns is elaborated on
in subsequent chapters.
54
Haats
There are more than 6500 village markets in
Bangladesh scattered over the country. The haat
usually meets once or twice per week following a
definite schedule which is synchronized with local
marketing cycles. These village markets form the 1st
order in the hierarchy of service centres (or central
places) in Bangladesh. They vary greatly in size,
function and zone of influence (i.e. size of
hinterland). Every village market has both permanent
shops and temporary stalls. On a haat-day (market
day), a periodic market attracts a larger number of
temporary stalls. Many village markets have other
infrastructure such as a post office, schools, mosques
and a union council office (lowest form of local
government office).
The larger trading centres (often known as
gonjos) have a greater number of permanent commercial
functions (including banks and small industries) and
non-commercial infrastructures. They have a better
transport network. Some of these big markets are
attached to the thana headquarters and they have
characteristics of semi-urban settlements with a few
urban features such as brick buildings, paved streets,
and electricity.
The zone of influence or size of hinterland of a
particular village market mainly depends on the size of
the market and its functional characteristics. Daily
55
markets or bazars have smaller hinterlands than periodic
markets or haats. The latter attract large numbers of
tradesmen, rural artisans, farmers, middlemen and
consumers from longer distances. Generally a small
market serves an area within a two to three mile radius
of a village (Islam and Hossain 1975, 55), while an
average size market extends its service up to a five
miles radius (Rashid 1977, 469). Overlapping in
service areas of neighbouring markets is common in every
rural region. The larger trading centres (gonjos) or
the specialized rural markets (e.g. cattle markets) have
larger hinterlands compared with the haats.
Thana headquarters
The functions of a thana headquarters are
different from those of a village market. It is an
administrative centre for an area of 125-150 square
miles covering, on average, around 200 villages and
200,000 people. The centre is well recognized as the
2nd order in the hierarchy of service centres in
Bangladesh. Primarily it is an administrative centre,
a police station and a revenue unit. Very recently the
centre has been upgraded by reorganizing its
administrative structure and adding a number of new
functions. Gradually, the name 'thana' is also being
changed into 'upazila' (sub-district).
The numbers of thana are very small as compared
to the numbers of rural markets. In 1981 there were
469 thanas (as against more tan 6500 haats and bazars)
56
in Bangladesh and less than 400 of them were within the
countryside. Thus the thana localities usually provide
villagers with a small number of jobs (as compared to
village markets) and these jobs are mostly suited for
educated people. Unlike the village market, a thana
centre has residential plots as many thana staff are
migrants (migrated from distant places which lie within
or outside the thana where the migrant is working).
The importance of thanas or upazilas, as mentioned
before, is increasing as more functions and public
utilities are added (Schroeder 1985). With concentra
tions of education institutions, business enterprises,
and professional services, thana have acquired a more
obvious "urban" appearance. Thana centres, along with
rural markets, have thus assumed greater significance as
destinations for work-related migration flows in recent
years, as well as contributing substantially to the
urbanization of BangladeshIs population.
2.4 MIGRATION STUDIES IN BANGLADESH
Compared with the other two demographic processes
(fertility and mortality), population movement has been
a neglected area of research in Bangladesh. Recently a
number of researchers have noted the paucity of
migration literature when they have been reviewing
studies available on this part of South Asia (Krishnan
and Rowe 1978; Simmons et ale 1977; Islam et ale 1982;
Choguill 1983; and Skeldon 1984). Detailed empirical
57
research on internal migration began very recently and
the published literature gives us an incomplete picture
of the total mobility behaviour for the population of
Bangadesh as well as for any particular movement form or
stream (Stoeckel et ale 1972; Chaudhury and Curlin 1975;
Chaudhury 1978a, 1983; Centre for Urban Studies 1982,
forthcoming).
2.4.1 Some limitations of the available literature
A focus on streams
Studies such as those by Obaidullah 1967, Khan
1972, Haq 1974, Krishnan and Rowe 1978, based on
conventional census data, have provided few insights
beyond their stated objectives of either describing the
intercensal and interdistrict (or division) migration
pattern, or outlining determinants of migration (mostly
age and sex), or attempting to prove some simple
statistical models in the context of Bangladesh (Haq
1974). Findings from these studies reveal little about
the local social, economic, political and environmental
context within which individuals make their mobility
decisions (Bedford 1981a).
Some urban surveys of squatters, slums, urban
poor, and vagrants have partly discussed the migration
decision process of the lower socio-economic classes of
urban in-migrants (Centre for Urban Studies 1976, 1977,
1979, 1983; Begum 1979; Qadir 1975; Farouk et ale 1978).
Studies which have focused mainly on urbanization or
58
population redistribution have also thrown some light on
rural-urban movement (Chaudhury 1980; Khan 1982; Islam
1978; Elahi 1972, 1980). However, much information on
rural-urban relocation or circulation, especially
between villages and small or intermediate towns,
remains unexplained since most studies have focused on
the large cities.
Most of the studies have mentioned that internal
population movement in Bangladesh (as elsewhere in South
Asia) is essentially a local phenomenon and that the
bulk of the movement occurs within the rural areas.
This general statement is derived from the place of
birth statistics which have been collected in every
decennial census. This is evident from the writing of
Krishnan and Rowe (1978) where the authors showed that
since 1951 the geographical pattern of internal movement
has remained nearly the same - a westward/North-Westward
movement.
Using longitudinal data on vital events (birth,
death and migration) in 101 villages of Matlab thana,
Chaudhury and Curlin (1975) found the converse was true.
They showed (1975, 208) that the bulk of the rural out
migrants (mostly male) move to urban areas. The
authors defined an out-migrant as one who moved outside
the study area and had not returned in six months time.
This definition, thus, excluded many short-term
movements from and to the village, such as commuting,
seasonal circulation and other periodic movements. In
59
another recent study of rural out-migration, Chaudhury
(1978a) adopted a similar time dimension for defining
out-migrants and thereby he deliberately excludes
circular migrants and seasonal migrants. Therefore, in
Bangladesh, a large number of short-term, periodic
circulators and commuters have been ignored by
researchers as well as by census surveys.
A focus on differentials
A common feature of migration studies in
Bangladesh, is that the researchers have invariably
tried to focus on migration differentials. Using the
same source of longitudinal data (vital events of Matlab
thana), Stoeckel et al. (1972) examined migration
selectivity, destinations, and reasons for migration,
while Chaudhury and Curlin (1975) have extended their
analysis to gain more insights into the dynamics of
rural migration. The latter study makes a modest
attempt to explain the trend, pattern and variation in
net migration, the selectivity of in- and out-migrants,
reasons underlying the in and out movement, destination
of the out-migrants, and some push-pull factors for
migration of both sexes. These two studies
(particularly the one by Chaudhury and Curlin) have
provided a considerable amount of information on the
individual's age, sex, marital status, occupation etc.,
as well as his household size and type.
The findings are to some extent common to that of
other hard-pressed agrarian regions of South and
60
Southeast Asia. A significant number of out-migrants
from the study area return to their villages and this
indicates some circulation or return migration which has
been recently (indirectly) noted by Krishnan and Rowe
(1978). They found that the district losing population
through migration receives more members in the 50-59 age
group than do the districts gaining immigrants.
2.4.2 Towards a more relevant focus
More recently Chaudhury (1978a, 1983) has
contributed significant factual information on rural
out-migration in Bangladesh. The main objective was to
understand the factors affecting rural out-migration at
the village as well as the individual level. The
Todaro hypothesis of rural-urban income differentials
was found inadequate to explain rural-urban migration,
and an alternative hypothesis highlighting intra-rural
inequality as the main cause and serious consequence of
rural emigration was tested in these studies (see
Connell et ala 1976; Dasgupta 1975; Lipton 1980).
Chaudhury found a U-shaped pattern in the
distributions for rural out-migrants in terms of income,
landholding and educational categories. This pattern
gives us a broad picture of the out-migration trend of
the rural classes (upper, middle and lower). However,
it does not provide us with an adequate picture of the
mobility of rural people in Bangladesh because Chaudhury
did not seek information on two very important types of
movement: commuting and seasonal migration. When a
61
wider range of movement types is taken into considera
tion, new dimensions emerge in both the pattern and
process of population movement in rural Bangladesh.
These dimensions form the substance of the following
chapters.
CHAPTER 3
THE CONTEXT OF POPULATION MOBILITY IN RURAL BANGLADESH
As we have seen from the review of published
research concerned with population movement in
Bangladesh, there are no studies which give an adequate
account of the total mobility behaviour of Bangladeshis.
The primary aims of this chapter are firstly to
introduce selected aspects of the "setting" for mobility
in rural Bangladesh, and secondly to describe the main
types of population movement recorded for people living
in 14 villages in three rural localities.
Some characteristics of the physical environment,
population and agriculture are outlined in the first
section. Description and analysis of land tenure,
social structure and economic status is deferred until
Chapters 7 and 8. In the second part of this chapter,
the three major forms of population circulation, two of
which are examined in depth in subsequent chapters, are
introduced. This is followed by a more detailed
discussion of three aspects of the total mobility system
which do not form part of the substantive analysis
elsewhere in the thesis - permanent relocation,
immobility and the movement behaviour of rural women.
3.1 THE ENVIRONMENT OF MOBILITY
People living in the 14 villages under study
largely depend on agriculture for a livelihood, and they
63
share a common language, culture, climate, history and
modes of production with the population of most other
parts of Bangladesh. This can be understood in the
context of the country's small size and its undiversfied
physio-climatic features. In addition to location, the
characteristics which differ most from one region to
another, are density of population, practice of farming
and development of physical and social infrastructure
such as transport, education, and financial institutions
(Table 3.1). The most striking features of Rampal are
an extremely high man-land ratio, intensive farming of
vegetable cash crops and proximity to the country's
largest urban and industrial agglomeration. Chandina
also has a few notable characteristics such as high
density of population and intensive cultivation of IRRI
rice. Compared with these two survey areas, the
Sakhipur region is backward in terms of agriculture,
accessibility and other dimensions of rural development.
Perhaps for such reasons, Sakhipur is relatively less
densely populated than Rampal and Chandina.
3.1.1 The physical setting
Rampal
Many of the opportunities and constraints of
livelihood in the survey communities are related to the
area's physical setting, including its geographical
location. Rampal is situated in an old floodplain of
the Meghna river. This older alluvium is one of the
most productive physiographic regions for agriculture in
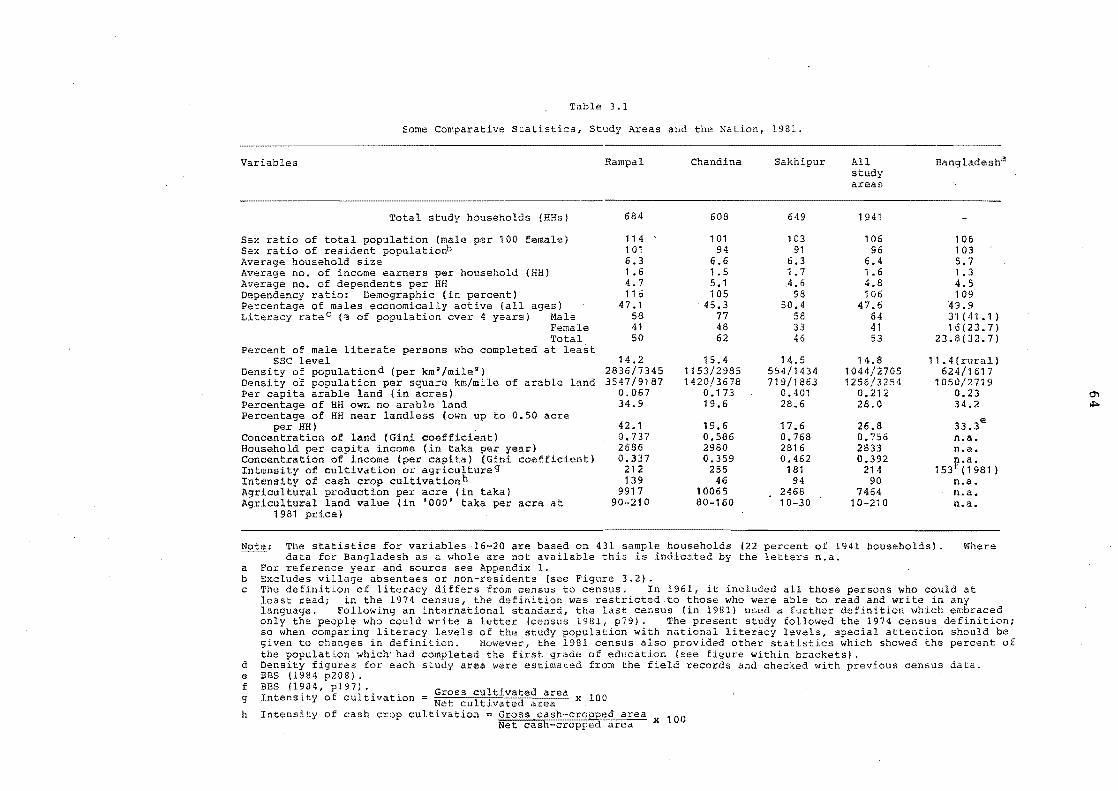
Table 3.1
Some Comparative Statistics, Study Areas and the Nation, 1981.
Variables
Total study households (HRs)
Sex ratio of total population (male per 100 female) Sex ratio of resident Average household size Average no. of income earners household (RH)
no. of dependents ratio: (in percent)
Percentage of males active (all ages) Literacy rateC (% of population over 4 years) Male
Female Total
Percent of male literate persons who completed at least SSC level
Density of population d (per kmo/mile") Density of population per square km/mile of arable land Per capita arable land (in acres) Percentage of HH own no arable land Percentage of HH near landless lawn up to 0.50 acre
per HH) Concentration of land (Gini coefficient) Household capita income (in taka per year)
of income (per capita) (Gini coefficient) cultivation or agriculture g cash crop cultivation h production per acre (in taka) land value (in '000' taka per acre at
1981 price)
Rampal
684
114 101 6.3 1.6 4.7 116
47.1 58 41 50
14,2 2836/7345 3547/9187
0.067 34.9
42.1 0.737 2686 0.337
212 139
9917 90-210
Chandina
608
101 94
6.6 1.5 5.1 105
45.3 77 48 62
15.4 1153/2985 1420/3678
0.173 19.6
19.6 0.586 2980 0.359
255 46
10065 80-160
Sakhipur
649
103 91
6,3 1.7 4.6
98 50.4
58 33 46
28.6
17.6 0.768 2616 0.462
181 94
2468 10-30
All study areas
1941
106 96
6,4 1.6 4.8 106
47.6 64 41 53
14.8 1044/2705 1256/3254
0.212 28.0
26.8 0.756 2833 0.392
214 90
7464 10-210
106 103 5.7 1.3 4.5 109
49.9 31(41.1) 16(23.7)
23.8{32.7)
11.4{rural) 624/1617
1050/2719 0.23 34.2
33.3e
n.a. n.a.
153P(~981 ) n.a. n.a. n.a.
Note: The statistics for variables 16-20 are based on 431 sample households (22 percent of 1941 households). ---- data for Bangladesh as a whole are not available this is indicated by the letters n.a.
Where
a For reference year and source see Appendix 1. b Excludes village absentees or non-residents (see Figure 3.2). c The definition of literacy differs from census to census. In 1961 it included all those who could at
least read; in the 1974 census, the definition was restricted to who were able to write in any language. Following an international standard, the last census (in 1981) used a further definition which embraced only the people who could write a letter (census 1981, p791. The present study followed the 1974 census definition; so when literacy levels of the population with national literacy levels, special attention should be given to in definition. However, 1981 census also other statistics which showed the percent of the population which' had completed the first grade of education see within brackets).
d Density for each study area were estimated from the field and checked with previous census data. e EBS (1984 I. f BBS (1984, 97). g Intensity
h Intensity of cash crop x 100
0'\
"""
65
Bangladesh. The present topography of Rampal with its
randomly located dobas (ditches), bhities (high land)
and other terrace like topographic features has mostly
been made by humans over many generations (Bangladesh
Geographical Society 1961). Most of the low lying
agricultural plots are inundated annually by the
Dhaleshwari flood water which regenerates soil
fertility.
The region has another advantage, which is its
vicinity to a big urban market. Within a short
distance from home the Rampalese can exchange their
agricultural commodities and surplus labour in.a number
of potential markets. The place of Rampal is 18 miles
downstream from the capital Dhaka; 8 miles away from
the industrial city of Narayangonji and only 3 miles
away from Betka, Binatpur, Rikabi Bazar, and Kamalaghat
- an emerging commercial, industrial and urban belt
along the right bank of the Dhaleshwari-Ichamati rivers
(Figure 1.1). The location of Rampal near the Dhaka
Narayangonj connurbation, and with easy communication
through the Dhaleshwari, Buriganga, and Sitalakhya
rivers, means that it is quite profitable to grow
vegetables and fruits instead of paddy and jute.
The role of road transport is also important
in Rampal and its surroundings. From Rampal one can
reach Rikabi Bazar, Munshigonj, Tongibari and other
market places by rickshaw or on foot. Some of the
regional roads (e.g. Munshigonj-Tongibari, Rikabi Bazar
Rampal etc.) are partly paved or brick-laid and have
66
recently been opened for light vehicles such as auto
rickshaws and locally assembled small buses. The
internal and external modes of transport are further
discussed in Chapter 5.
Chandina
Physiographically, Chandina is also a part of the
Meghna floodplain and lies at the eastern margin of that
old alluvial plain. The area is located in between the
Lalmai hills (average height 70 feet above sea level)
and frequently flooded area in Elliotgonj (Figure 1.1).
Most of the agricultural lands in Chandina, as opposed
to Rampal, are flat. The land seldom goes under flood
water but it is submerged with shallow rain water for
short periods especially when heavy showers occur during
the middle of the rainy season. The nearest river, the
Gumti, lies 10 to 12 miles north-east of Chandina and
flows far away from the region.
Road transport is the only way Chandina is linked
internally as well as with the outer world. However,
the region has a good road network as the Dhaka
Chittagong trunk road (the country's busiest highway)
passes through the area. It takes about 4 hours to
reach Dhaka or Chittagong from Chandina by bus. Comilla
district-town, with a population of 126,000 is situated
12 miles east of the study area.· Chandina is connected
with Comilla by rickshaws and buses via the Dhaka
Chittagong road. On the same highway there are few
other important commercial places which are also
67
accessible by buses and rickshaws from Chandina (Figure
1.1). Communication with other rural centres is mostly
dependent on unpaved roads over which the villagers
usually walk or ride bicycles and rickshaws.
Sakhipur
Sakhipur is an area where two large river
systems (Padma and Meghna) have met. The physiographic
history of this region is very recent, namely less than
100 years. The entire deltaic area between the
mainlands of Chandpur and Sariatpur sub-divisions within
which Sakhipur lies, has been created by fluvial
processes. The whole landmass is composed of recent
alluvium of the two rivers and the landscape is criss
crossed by several of their distributory channels. In
many parts of this deltaic land, the various processes
of land formation are still very active.
Administratively, this vast recent alluvial plain
(locally called Char) is divided into eight unions.
Sakhipur is the largest and oldest union. It consists
of 42 villages (Kandis) of various sizes. The villages
are mainly linear as the people built their houses on
the natural levee. According to the villagers, the
settlement in Sakhipur began in the early part of the
present century when people from Dighirpar, Munshigonj,
and Tongibari areas migrated to Sakhipur due to river
bank erosion and population pressure in Munshigonj
sub-division (Figure 1.1). However, data from the
survey villages in Sakhipur clearly indicate that the
68
present population of this region are virtually all (96
percent) locally born.
until the early 1970s annual flooding was a
common phenomenon in this area, but then the regularity
and severity of floods suddenly appeared to be less
visible. It is generally believed that the Farakka
barrage on the river Ganges across the border in India
is the main reason for such ecological change. Floods
are essential for the rejuvenation of soil fertility in
this deltaic plain. Villagers often complained that the
absence of a requisite level of flood has caused low
productivity on their agricultural land.
These physiographic conditions of the vast char
land have not only had an impact on agricultural
production; they have also adversely affected the
region's transportation and communication systems.
Although relatively close to Chandpur and Dhaka
Narayangonj towns, Sakhipur remains one of the most
backward regions in Bangladesh. The internal transport
system within this char area is underdeveloped compared
to the 'mainland' transport system. From November to
May, Sakhipur villagers mostly walk whenever they
commute or travel to any place. During the rest of the
year, some people travel by traditional country boat
where rivers are navigable.
The nearest urban centre - Chandpur - is
located 10 miles east of Sakhipur and is geographically
disconnected by the joint flow of the mighty rivers
Padma and Meghna. Dhaka city is regularly connected by
69
launch via Dularchar - the nearest launch station
situated five miles north of Sakhipur. Launch
passengers usually traverse this distance by walking on
the small foot-tracks through the villages or across the
crop fields. It takes approximately six hours to reach
Dhaka from Sakhipur, although the place is only 45 miles
away from the capital.
3.1.2 Population
Population density
Except for a few city-states like Singapore and
Hong Kong, Bangladesh is the most densely populated
nation in the world by any standard. As the country
largely depends on agriculture, the rural population
density distribution mostly follows the agricultural
productivity of the land. All the regions examined in
this study have striking imbalances in man-land ratio.
Rampal is by far the most crowded rural area in
Bangladesh. The average density of population in the
four survey villages in Rampal union is 7345 persons per
square mile, i.e. 4.5 times higher than the country's
mean density (Table 3.1) and more than double Dhaka
district's density (3472 persons per square mile).
This is an exceptionally high density even by the
Bangladesh rural standard. Further congestion arises
when the density is considered in terms of cultivated
land. It can be seen from Table 3.1 that there are
9187 inhabitants per square mile of arable land in
Rampal as against 2719 in Bangladesh and 5141 in Dhaka
70
district.
The region of Rampal has long been recognized as
the country's most densely inhabited area. According to
the 1951 census, the spatial and agricultural densities
of Rampal union I were 4667 and 7668 persons respectively
(Bangladesh Geographical Society 1961). In that census
year, Bangladesh had 777 persons (one-sixth of Rampal's
density) per square mile. The question may arise - why
is Rampal so crowded? The extremely high population
density can be explained by Rampal's history, high
fertility of soil, progressive farming, and locational
advantage.
Historical evidence shows that the Vikrampur
region (present Munshigonj sub-division) has long been
inhabited by human population. Even a century ago (in
1881),1278 inhabitants lived within a square mile in
Vikrampur (Sinha 1965, 40) and that density was one of
highest in all Bengal (West Bengal and Bangladesh
together). There were prosperous village settlements in
Vikrampur when Rampal was the seat of the Sena Kings
(c 1095 - 1260 AD, Majumdar 1943, 227-231). It is also
believed that Rampal was rich in agriculture during this
medieval period. There is no doubt that land
productivity is the main reason for high density in
Rampal, but it is by no means the only reason. The
other reasons are proximity and easy access to a number
1 Consists of 11 villages four of which are surveyed by the present study_
71
of urban and semi-urban centres as mentioned in the
previous section.
Chandina is also one of the most thickly
populated rural areas in the country. This study area
lies within Comilla -one of the two most populous
districts in Bangladesh (another one is Dhaka district,
see Figure 3.1). The spatial and agricultural
densities of population in this study location are 2985
and 3678 persons respectively. Comparable statistics
for Comilla district as a whole are 2700 and 3591
persons respectively. The high density of people in
Chandina, as in most areas of Comilla, is significantly
related to the intensive cultivation of IRRI rice
(hybrid rice). Although IRRI rice is known almost
everywhere in Bangladesh, Comilla is the district where
it grows most extensively and intensively.
Compared with Rampal and Chandina, the population
density of the Sakhipur region is much lower (Table
3.1). In this area an average density of 1434 persons
per square mile is found, which is lower than the
national average density (1617 persons) as well as the
density of Faridpur district (1793 persons per square
mile). Much less pressure of population on land also
exists in Sakhipur when the agricutural density is
compared with all other regions or districts mentioned
so far. It can be argued that low productivity and
recent settlement in the Sakhipur deltaic plain are
the two primary reasons for a lower population density.
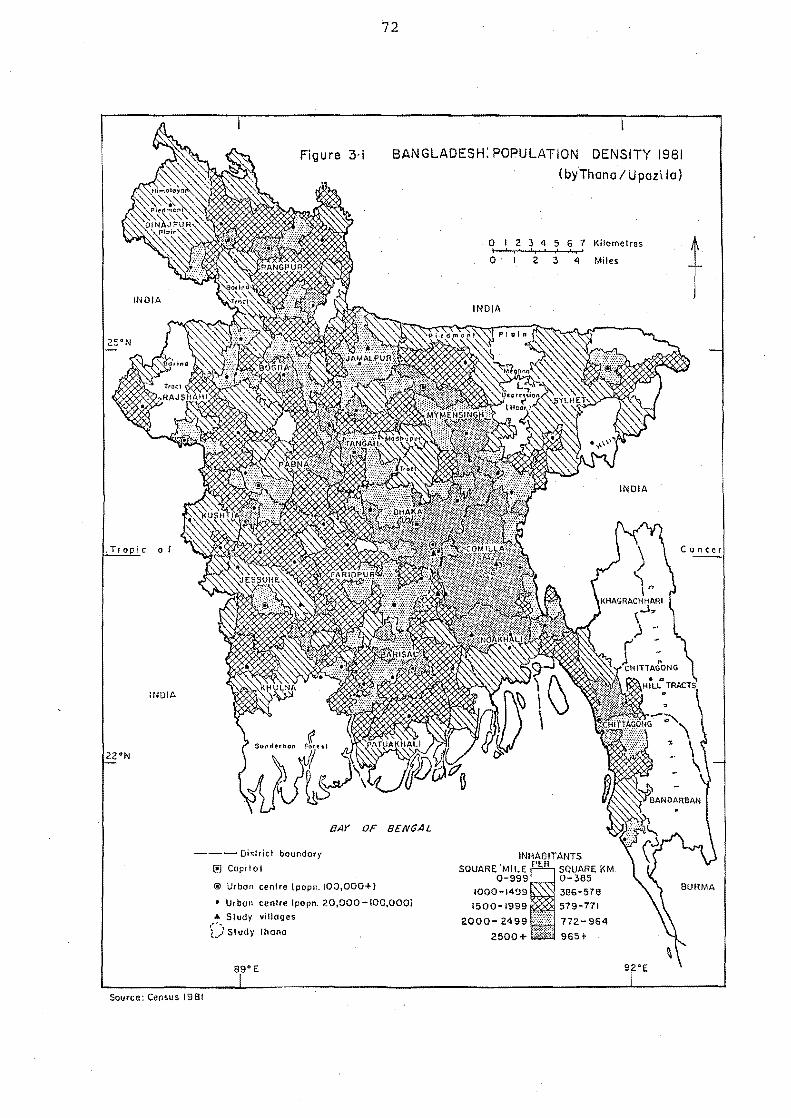
72
Figure 3·1 BANGLADESH: POPULATION DENSITY 1981
Tropic 01
INDIA
22°N
---Dislricl boundary
I!J Capitol
BAY OF BENGAL
® Urban cenlre (popn. 100,000+)
• Urban centre (popn. 20,000 -100,000) ... Siudy villages
';-;: Siudy Ihana
B9°t
Source: Census 19BI
(byThano I U pozi 10)
o I 2 J 45 6 7 Kilomelres I • " " ' " '" o 2 3 4 Miles
INDIA
INri SQUARE: 'MILE:
0-999 1000-1499
1500-1999
2000- 2499
2500+
92°E
Concer
73
Age structure
The total population enumerated in 1981 in the 14
villages under study was 12391, 6385 males and 6006
females (Table 3.2). Figure 3.2 exhibits the age and
sex structure of residents, non-residents, and total
population of each survey area as well as all the areas
together. 2 The age structure of population in
Bangladesh, as in many other less developed countries,
is generally depicted by a pyramid-shape with a broad
base and a narrow tip. This reflects a situation in
which there is a large percentage of children, and a
small percentage of elders, in the population.
In the communities surveyed, the population was
very young with 49 percent (average for three areas) of
children under the age of 15 years and 29 percent of
young adults aged 15-34 years (Figure 3.2a). The
corresponding proportions of children and young adults
in the total rural population of Bangladesh were 47
percent and 29 percent in 1981. The predominance of
younger people can also be established by looking at a
population's median age. According to the United
2 An individual who was found to live (sleep) regularly in his/her home village was considered as a resident. In contrast, individuals who regularly lived outside their villages and returned home frequently or infrequently to visit their families were categorised as non-residents. The nonresidents were actually the absentee members of village households and at the time of survey, they were found to reside elsewhere for economic or noneconomic purposes. Of the 1258 absentees (946 males and 312 females), 1212 persons were migrants and only 46, all males, were commuters.
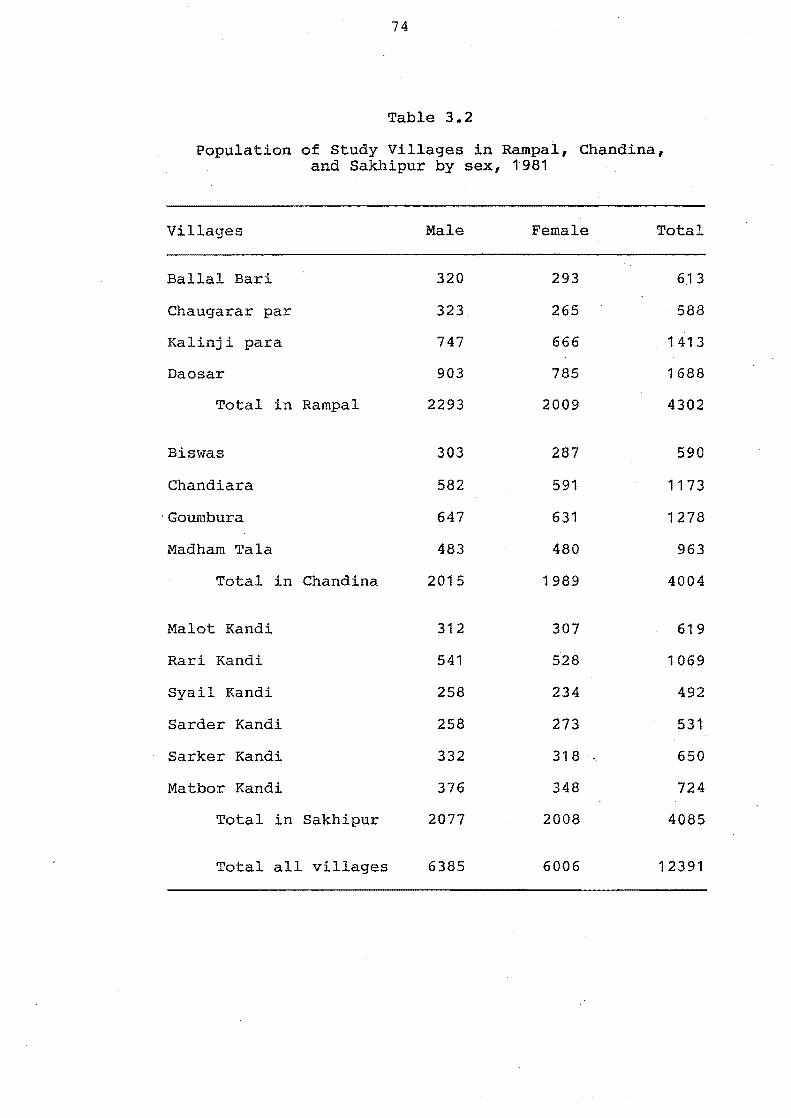
74
Table 3.2
Population of study Villages in Rampal, Chand ina , and Sakhipur by sex, 1981
Villages Male Female Total
Ballal Bari 320 293 6.13
Chaugarar par 323 265 588
Kalinji para 747 666 1413
Daosar 903 785 1688
Total in Rampal 2293 2009 4302
Biswas 303 287 590
Chandiara 582 591 1173
'Goumbura 647 631 1278
Madham Tala 483 480 963
Total in Chand ina 2015 1989 4004
Malot Kandi 312 307 619
Rari Kandi 541 528 1069
Syail Kandi 258 234 492
Sarder Kandi 258 273 531
Sarker Kandi 332 318 650
Matbor Kandi 376 348 724
Total in Sakhipur 2077 2008 4085
Total all villages 6385 6006 12391
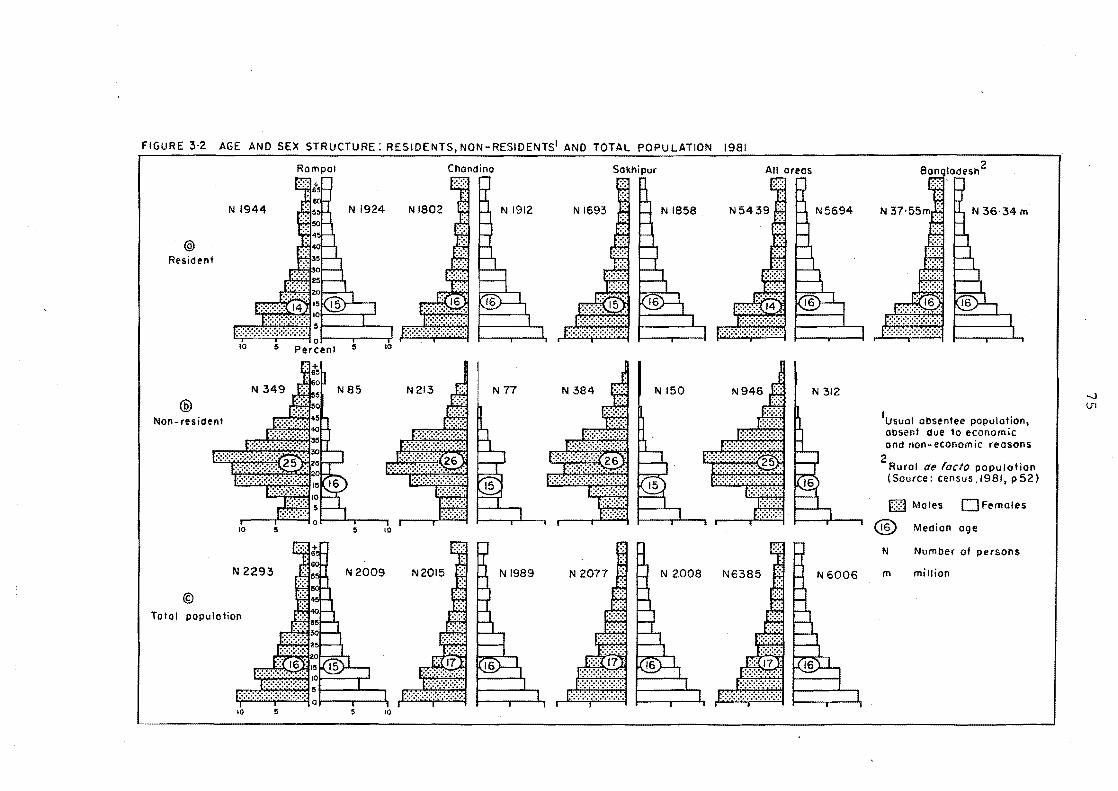
FIGURE 3·2 AGE AND SEX STRUCTURE: RESIDENTS, NON-RESIDENTSI AND TOTAL POPULATION 1981
Rempel Cnandina SOknipur
NI944
@ Resident
I J ......•.•.•.•... ,. ...... ' ..• , I···········" .. · .. "1 01 ". • I~ ; Percent
N85
@ Non- resident
10 5 5 10
N 2293 N2009
© Total population
! ••.••••••••• "':''10 I I, \ I
10 5 ~ 10
All areas BanQIOdeSh2
lusual absentee population, absent due 10 economic and non-economic reasons
2Rural de facto population (Source: census ,1981, p 52)
~ Males DFemoles
® Median age
N Number of persons
m million
-...J U1
76
Nations (1981a) if the median age is less than 20 years,
one can term the population a "young" one. In 1981,
the median age of the Bangladesh rural population was 16
years and that of the study population (resident) was 15
years. Over the census decades, the median age has also
declined with the concomitant increase in dependent
population. The youthfulness of a nation's population
has significant implications both for the rapid increase
of numbers and the mobility potential of its residents.
Sex ratio
The sex ratio for the total population recorded
in the three communities was 106 males per 100 females,
the same as the ratio obtained for Bangladesh by the
1981 census. It should be noted that for several
reasons such as underenumeration of females, higher
female mortality, and lower life expectancy, an excess
of males over females has been a feature of all censuses
in Bangladesh. Masculinity is also a common
characteristic of the sex composition of the population
of other South Asian countries (UN 1981a, 36). Among
the three study areas, the sex ratio of 114 in Rampal is
quite high (Table 3.1). A detailed explanation of this
high masculinity is beyond the scope of the present
study but, in brief, it can be stated that the high
mobility rate (Table 3.8) and severe population
congestion in Rampal, to a great extent, have indirectly
caused this sex imbalance.
77
Interestingly, it was evident that among the
young adult males aged 15 to 29 years, 22 percent were
married in Rampal, 42 percent in Chandina, and 33
percent in Sakhipur. According to the prevailing system
of marriage in Bangladesh, a female after marriage moves
to her husband's village. As Rampal has a smaller
proportion of young couples, the region is also more
likely to have a limited number of female marriage
immigrants. Some interesting relationships between
population congestion and high levels of mobility on the
one hand, and age at marriage, fertility control, and
sex ratio on the other, seem to exist and require
further research.
In a community where females are unlikely to move
out for work or study, the migration of males can reduce
considerably the masculinity of the resident population.
Table 3.1 illustrates this clearly. Among the resident
population there were 96 males per 100 females and the
ratio varied from one survey location to another. The
villages in Sakhipur recorded a significantly low
proportion of resident males, i.e. 91 males per 100
females. This can be explained by the fact that in
Sakhipur, migration was more common than commuting and
thus this particular area recorded relatively mora
absentees than the other two areas (Figure 3.2). In
Rampal, the sex ratio of the resident population was
101. Although this is lower than the region's overall
sex ratio of 114, it is evident that males still
dominate numerically in the population. This is due in
78
part to the smaller proportion of young married couples,
mentioned earlier, and also to the predominance of
commuting as a form of mobility. The latter was also
found to be important in Chandina, and perhaps this
factor contributes to an explanation for the
similarities in the sex ratios of the total resident
populations of this region.
The sex ratio of adult (aged 15 years and above)
residents varied greatly with age, and this reflected
the considerable selectivity by age and sex of migration
(Figure 3.2). Among the total resident population,
females from 15-64 years outnumbered males. There were
87 males per 100 females in this age range. From ages
15-34, the deficit of males remained at a high level (83
males per 100 females) which reflected the predominance
of male out-migration or absenteeism in that age group.
In the rural areas, a sex ratio of 93 in the 15-34 age
group was found in the 1981 census. A study based on
data from 228 villages of Mathab thana (in Comilla
district) indicated that out-migration of males reduced
the sex ratio at ages 25-34 years so dramatically that
in those villages there were less than 80 males per 100
females in this age group (Ruzicka et ala 1978a). In
the advanced age groups (65 years onward) the sex
composition of the resident population was absolutely
dominated by males due to higher female mortality at
older ages, and the return of male migrants to their
villages.
79
A very important characteristic of non-residents
or absentees from any rural region of Bangladesh is that
they overwhelmingly come from the working age male
population. In the study villages, three out of four
absentees were males, and four out of five males were
aged between 15 to 59 years (Figure 3.2b). The total
number of non-resident members in all survey areas was
1258, which included 1212 migrants and 46 male
commuters. The overwhelming majority of the absentees
(over 85 percent) were in town.
Among the 946 male non-residents, 73 percent had
left their villages to work, 10 percent for study and 17
percent were dependents, mostly children. The reasons
for absence, among the females, were quite different.
Of those 312 females living outside their villages at
the time of survey, 90.7 percent were dependents such as
wives, children etc. and only 6.7 and 2.6 percent were
income earners and students respectively. The above
patterns and characteristics of the rural non-resident
population should be understood in the context of the
total mobility behaviour of village people discussed in
section 3.2.
Education
Education is one characteristic where Chandinars
population is ahead of Rampal, and in turn Rampal leads
the Sakhipur region. However, in all three places a
higher literacy level was recorded than the national
average (Table 3.1). Information on education was
80
obtained for all individuals aged 5 years and above.
Children aged 5-14 years recorded a higher literacy rate
than the adults aged 15 years and above (Table 3.3).
Another distinct feature of the literacy levels of
children and adults is the difference between males and
females. Among the children the gap was very small (on
average 10 percent for three areas, with the literacy
rate of males being 10 percent higher than that of
females). Among the adults, on the other hand, it was
very high; in fact males had double the literacy rate
of females (Table 3.3). Education has great social and
economic significance, and its importance has been
increasing with the concomitant rise of population
pressure on rural land and employment.
All rural communities are not equally well served
or well advanced in terms of literacy levels and this is
mainly due to the unequal spatial distribution of
education facilities. Chandina and Rampal both have
superior facilities to those found in Sakhipur.
Students from the two former regions can find primary to
higher secondary schools at a convenient distance
(within three miles) from their homes. The two areas
also have local girls schools. The facilities for
education at or nearby the study areas in Sakhipur are
relatively poor. There is no girls school and college
(higher secondary school) within commuting distance from
Sakhipur.
The literacy rate is a crude index of the
educational achievement of a country or a region. The
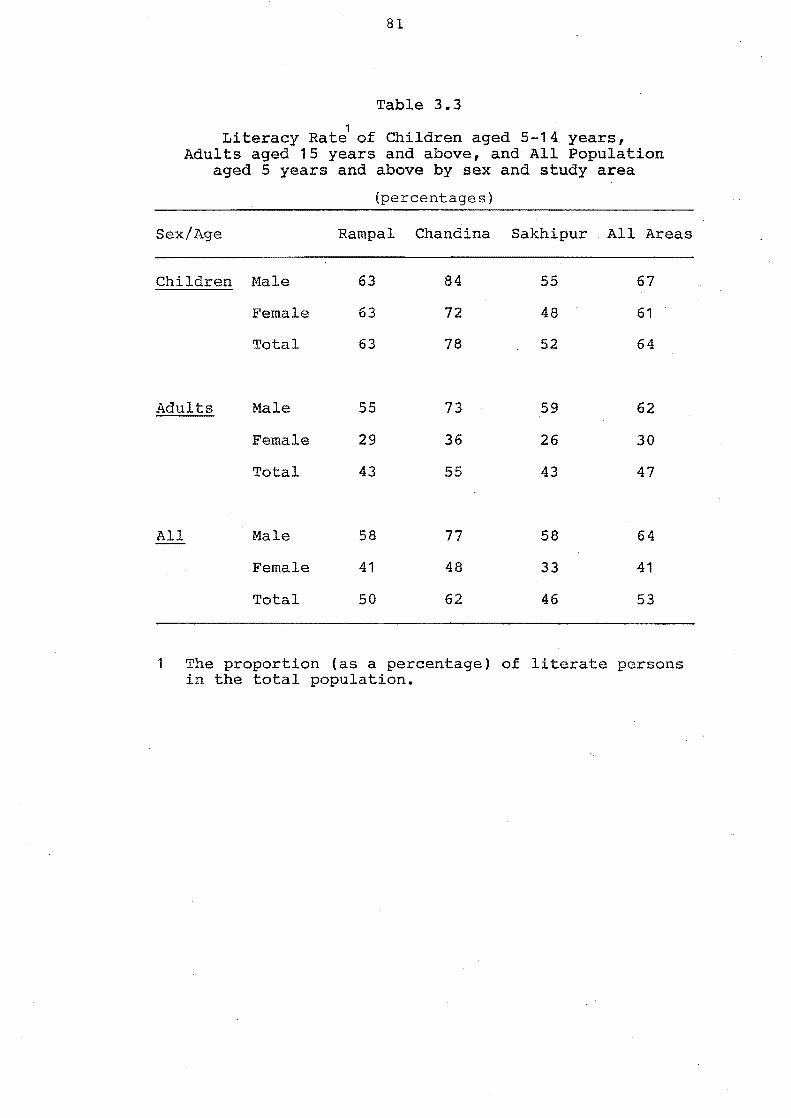
81
Table 3.3
Literacy Rat~ of Children aged 5-14. years, Adults aged 15 years and above, and All Population
aged 5 years and above by sex and study area
Sex/Age
Children Male
Female
Total
Adults Male
Female
Total
All Male
Female
Total
(percentage s)
Rampal Chandina Sakhipur All Areas
63
63
63
55
29
43
58
41
50
84
72
78
73
36
55
77
48
62
55
48
52
59
26
43
58
33
46
67
61
64
62
30
47
64
41
53
1 The proportion (as a percentage) of literate persons in the total population.
82
effective education level, however, is much below the
literacy rate. Tables 3.4 and 3.5 indicate the
education levels among the males and females in the
study communities, and also in total rural population of
Bangladesh (Table 3.5). It is evident from Table 3.5
that most of the literate persons have achieved a very
low level of education. Only about one-tenth of the
total literates had achieved Secondary School
Certificate (SSC) and above. The proportion varied
significantly between sexes: for males it was'14.8 and
for females 4.0. The effective education levels (i.e. , .
SSC and higher qualifications) of males and females were
much lower when the educational attainment of all
people, literates and illiterates, was considered
together (Table 3.4). It was found that only 9.4
percent of the males (aged 5 years and above) and 1.6
percent of the females had reached that education level.
3.1.3 Agricultural patterns
Agriculture is the predominant source of
livelihood in each of the study areas, as is the case in
most rural regions in Bangladesh. The major features
of this traditional means of living common to the three
study areas and also to other rural regions are: non-
mechanised family operated farming, traditional methods
of ploughing using intensive animal power, labour
intensive cultivation, low productivity, small holdings
often fragmented into several dispersed plots, a skewed
distribution of holdings in terms of ownership, and a
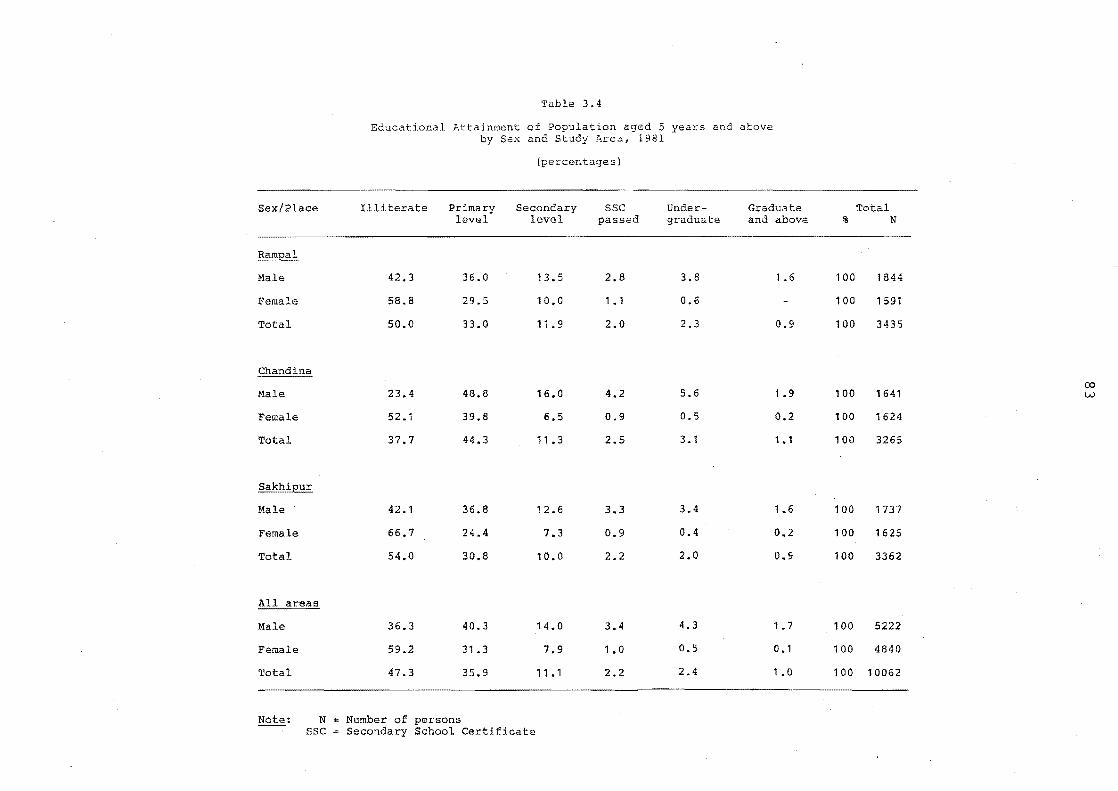
Table 3.4
Educational Attainment of Population aged 5 years and above by Sex and Study Areal 1981
(percen tage s)
Sex/Place Illiterate Primary Secondary sse Under- Graduate Total level level passed graduate and above % N
Ram~
Male 42.3 36.0 13.5 2.8 3,8 1 .6 100 1844
Female 58.8 29.5 10.0 1.1 0.6 100 1591
Total 50,0 33,0 11. 9 2.0 2.3 0.9 100 3435
Chandina 00
Male 23.4 48.8 16.0 4.2 5,6 1.9 100 1641 w
Female 52.1 39.8 6.5 0.9 0.5 0.2 100 1624
Total 37.7 44.3 11. 3 2.5 3.1 1.1 100 3265
Sakhipur
Male 42,1 36,8 12.6 3.3 3.4 1 .6 100 1737
Female 66.7 24.4 7.3 0.9 0.4 0.2 100 1625
Total 54.0 30,8 10.0 2.2 2.0 0.9 100 3362
All~
Male 36.3 40.3 14.0 3.4 4,3 1.7 100 5222
Female 59.2 31.3 7.9 1.0 0.5 0.1 100 4840
Total 47.3 35.9 11.1 2.2 2.4 1.0 100 10062
Note: N Number of persons sse Secondary School Certificate
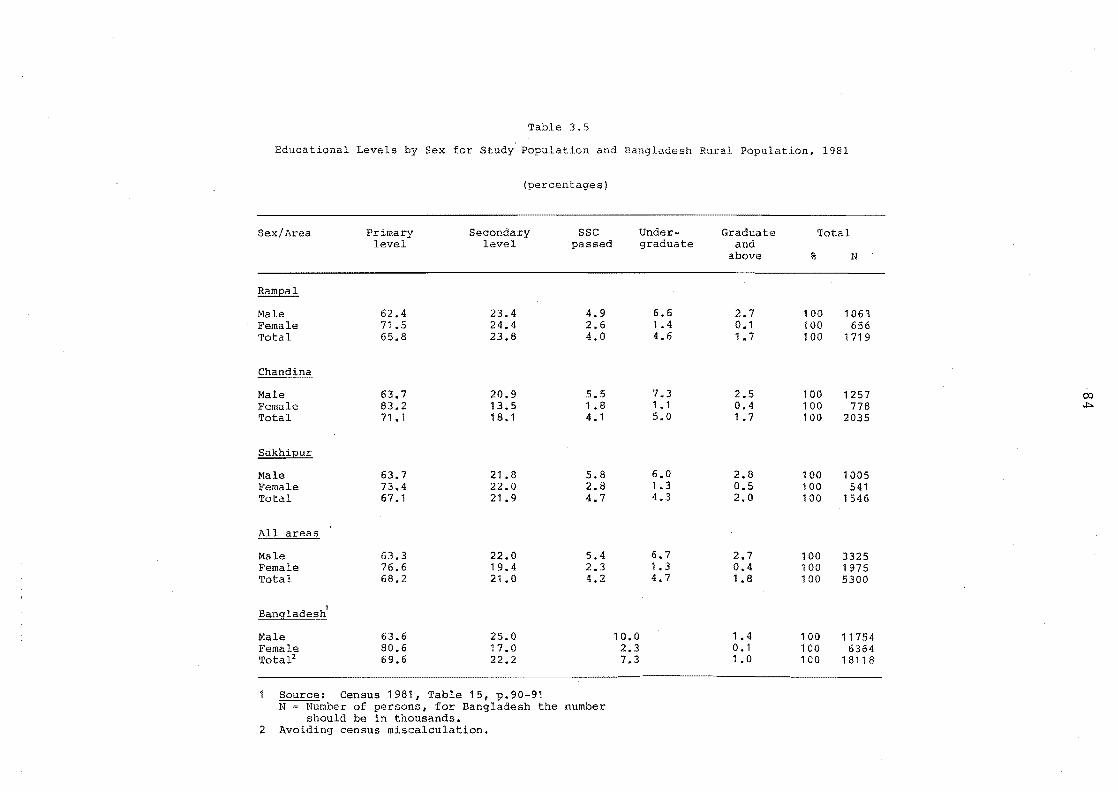
Table 3.5
Educational Levels by Sex for Study Population and Bangladesh Rural Population, 1981
(percentages)
Sex/Area Primary Secondary sse Under- Graduate Total level level passed graduate and
above % N
Ramlli!1.
Male 62.4 23.4 4.9 6.6 2.7 100 1063 Female 71.5 24.4 2.6 1.4 0.1 100 656 Total 65.8 23.8 4.0 4.6 1 .7 100 1719
Chand ina
Male 63.7 20.9 5.5 7.3 2.5 100 1257 00 Female 83.2 13.5 1.8 1.1 0.4 100 778 Il'>-
Total 71 .1 18.1 4.1 5.0 1.7 100 2035
Sakhipur
Male 63.7 21.8 5.8 6.0 2.8 100 1005 Female 73.4 22.0 2.8 1.3 0.5 100 541 Total 67.1 21.9 4.7 4.3 2.0 100 1546
All areas
Male 63.3 22.0 5.4 6.7 2.7 100 3325 Female 76.6 19.4 2.3 1 .3 0.4 100 1975 Total 68.2 21.0 4.2 4.7 1.8 100 5300
Bangladesh1
Male 63.6 25.0 10.0 1 .4 100 11754 80.6 17.0 2.3 0.1 100 6364 69.6 22.2 7.3 1.0 100 18118
Source: Census 1981, Table 15, p.90-91 N = Number of persons, for Bangladesh the number
should be in thousands. 2 Avoiding census miscalculation.

85
rising number of landless paupers. The characteristics
by which the agricultural pattern varies from one region
to another are the region's cropping pattern, intensity
of cultivation, and the utilization of modern inputs
such as hybrid seed, chemical fertilizer, irrigation
etc. In this section, the distinctive features of
agriculture in each study region are outlined. In
subsequent chapters, the interrelationships between
agriculture and mobility behaviour are examined more
closely.
Rampal
Landuse patterns (Figure 3.3) in Rampal and its
surrounding unions are quite different from most parts
of the country. Rampal is the centre of the Munshigonj
market gardening area, a compact agricultural region
covering approximately 20 square miles and growing
mainly cash crops such as vegetables, sugarcane,
bananas, pan (Betel piper) (Bangladesh Geographical
Society 1961). The growing of paddy (unhusked rice)
and jute, the two most important and extensively grown
crops of Bangladesh, has become less important in Rampal
due to competition from more highly valued perishable
cash crops. As a result of the high population density,
an attempt is made not only to use every inch of land,
but also to make the best use of land.
In Rampal, there is no true slack season for
garden crops; the greatest harvest is in winter when
vegetables are grown intensively over the whole
86
Munshigonj market gardening area. During this time,
the region focuses on activities related to the harvest
and trade of winter vegetables (see Chapter 5). Apart
from vegetable growing, Rampal has long been famous for
the cultivation of banana and pan. However, recently
the production and acreage of these two crops have been
reduced considerably. Since 1970, many farmers in the
Rampal region have switched from banana and pan
cultivation to vegetable cropping, as the demand of
fresh vegetables increased rapidly with the rapid growth
of Dhaka's population since the Independence.
Besides returning higher yields and profits, the
cultivation of vegetables has been made more attractive
by several other advantages. First, the vegetables grow
faster than the monocultural crops (banana, pan, sugar
cane etc.) and the growers can get a quick return on
their investment. They can also cultivate their land
several times a year. Second, the comparative costs for
producing vegetables are lower than the costs of growing
perennial or long-term crops. The risks of crop damage
are also higher in the latter case. Third, the growers
of banana and pan are facing increasing competition with
the growers of other regions such as Narsingdi,
Bakergonj, and Patuakhali. Finally, variable
topography, abundant water and temperature, and
plentiful labour contribute to what are excellent
conditions for growing a wide range of tropical
vegetables in every season of the year.
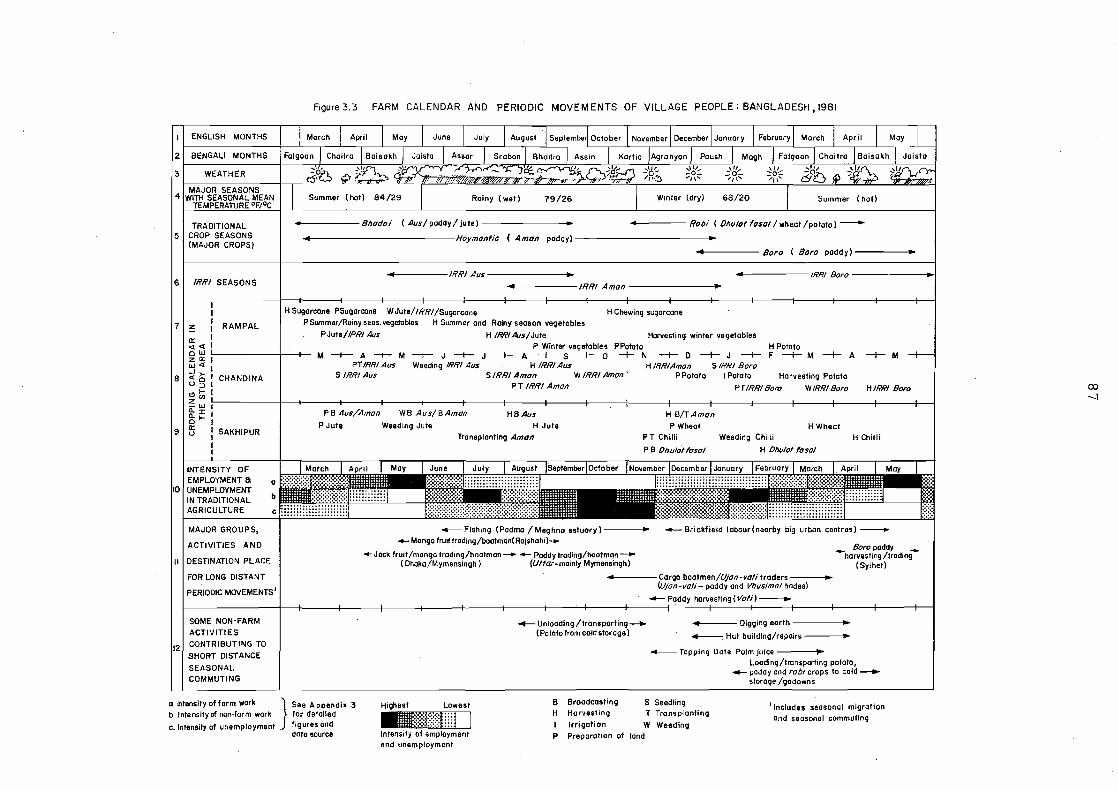
RAMPAL
CHANDINA
SAKHIPUR
FOR LONG DISTANT
PERIODIC MOVEMENTS'
SOME NON-FARM
ACTIVITIES
CONTRI8UTING TO
SHORT DISTANCE
SEASONAL COMMUTING
o. Intensily of farm work b. Inlensilyo! non·form work
c. Intensity of unemployment
Figure 3.3 FARM CALENDAR AND PERIODIC MOVEMENTS OF VILLAGE PEOPLE: BANGLADESH, 1981
Roiny (wet)
• Bhado; 4_---- Rob; ( lJhulo/ fasal / wheat /pototoJ -
4 Hoyman/ie (Amon poddy) ..
.. Boro ( Bora podd y J •
.. IRRI Aus • ... IRRI Bora •
04 IRRI Amon ..
H Sugarcane PSugarcone W Jute/IRRI/Sugorcone H Chewing sugarcane PSummer/Rainy seas. vegetables H Summer and Rainy season vegetables
PJute/IRRI Aus H IRRIAus/Jute Horvesling winter vegetables P Winter vegetables PPotato H Potato
M-+-A-+-M--+-J-+-J-+A--+-S-+-O-+-N-+D-+J-+-F-+-M-+A-+M PT IRRI Aus Weeding IRRI Aus H IRRI Aus H IRRIAman S IRRI Bora
S IRRI Aus S IRRI Amon W IRRI Amon' P Potato I Palata Harvesling Potato
P8 Aus/Amon
PJute
PT IRRI Amon PTIRRI Bora WIRRI Bora H/RRf Bora
W8 A us/ BAman HBAus Weeding Jute H Jute
Transplanting Amon
H 8/TAmon P Wheat
PT Cllilli
P 8 lJhulof Iosol
__ Fishing (Podmo / Meghno estuary) • .-. Mango fru~ trading /boalmon(Rajshohi)_
HWheol Weeding Chilli H Chilli
H lJhulot fa sol
"Jock fruit /mango trading/boatman - -- Poddy trading/bootmon-(Dhako/Mymansingh) (Uttar-mainly MymensinghJ
_ Bora poddy _ harvesling/lrading
(Sylhel)
}
See A ppendi. :I for detailed figures ond data source
Highest Lowest
.:.:.~.:.:.:.::: _·····1"'] .. ·11 :.:.:.:.:.:.: ::: Intensity of employment end unemploymenl
ol-----Cargo baatmen/Ujon-vof;traders • (U/on -voli - poddy and Vhusimollrodes)
- Paddy harvesling (Voti)_
_ Unloading /transporting_ (Po toto from cold storoge)
.. Digging eorlll ..
-----, Hut building/repairs •
8 H
P
_ Topping Date Palm juice ,
Broadcasting S Seedling Harvesting T Transplanting
Irrigation W Weeding Preparalion of lond
Loading/transporting potolo, _ paddy and rob; crops to cold_
storage /godowns
'Includes seasonal migration and seosonal commuting
00 -J
88
Chandina
Rice has been the principal crop of Chandina for
many centuries. Until the late 1960s, all the
varieties of rice grown here were traditional types.
Since then, the arrival of high-yielding varieties of
rice ( HYVS 3) and the associated modern technology such
as chemical fertilizer, pesticides, deep tubewell etc.
have radically changed the traditional cropping pattern
in this region. The changes had two main results:
increasing rice yields and the addition of another rice
season. By 1981 the traditional varieties of rice had
practically disappeared from Chandina (Figure 3.3).
Another crop that had recently disappeared from
Chandina was jute - a non-food cash crop. It has been
3 The study area of Chandina is only 6 miles away from the 'Bangladesh Academy for Rural Development' (BARD), centered at Kotbari near Comilla town. The institute was set up in 1960 with the assistance of the United States. In the late 1960s, BARD introduced IRRI rice (a high-yielding variety of rice invented by and named after the International Rice Research Institute, based at Manila in the Philippines) to its laboratory area in Comilla Kotwali thana, and then this 'miracle rice' rapidly diffused to many areas in Bangladesh. Chandina, being adjacent to Kotwali thana, is regarded as one of the foremost regions of the country where the HYV rice grows intensively in all seasons. In the 1970s the Bangladesh Rice Research Institute added a number of new varieties (for detailed names of all see Johnson 1982, 71) to the HYV family and introduced them to various regions of the country. At present the term IRRI has a wider meaning, especially among the villagers who loosely use this term to indicate all HYV rice or specific HYV rice seasons such as IRRI aus, IRRI boro etc. (Figure 3.3). More recently, the term HYV technology also commonly denotes a package of hybrid seed, chemical fertilizer and irrigation facilities.
89
replaced by a food cash crop, HYV potato which grows
during rabi season (Figure 3.3). Potato cultivation
has been known in this region since the early 1960s, but
in the 1970s when the HYV technology became more
available to this region, its yields and acreage
increased sharply. The high density of population in
Chandina ensures there is plenty of labour available, an
essential requirement for the growing of HYV rice and
potato crops. In Chandina, the rabi season was once
the least important agricultural cycle, but recently due
to the advent of mechanized irrigation systems
(irrigation through shallow and deep tube-wells) farmers
are now able to grow two very rewarding crops such as
IRRI boro and potato.
Sakhipur
The cropping pattern of Sakhipur region has
remained very much of the traditional type. The
pattern follows the country's three main traditional
cropping seasons along with the season's major
traditional crops (Figure 3.3). Farmers are cultivating
aus rice and jute in the Bhadoi season, aman rice in the
Hoymantic season, and wheat, chilli and Dhulot fasal
(pulses, oilseeds, and spices) in the Boro season.
After jute, chilli is an important cash crop in this
region, and recently an increasing number of farmers
have been cultivating this crop instead of other boro
crops.
90
Rice is the principal crop in Sakhipur, but the
region is still far from self-sufficient in this food.
Yet, despite this, Sakhipur has remained one of those
regions of Bangladesh where IRRI or HYV rice has not yet
diffused. There is a common belief among the farmers
in this char land that they may not achieve as great a
success in IRRI cultivation as has been achieved by the
'mainland' farmers. They argued that the IRRI ground
needs a waterlogging condition for a considerable period
of time at the planting stage, but due to porosity of
the sub-soil in most char land, water does not stand on
the ground after irrigation.
Productivity of land
Most of the agricultural land in Bangladesh
could be cropped two or three times a year if provided
with irrigation as needed, especially during the dry
winter season. In 1981, an index of the average
intensity of cropping or cultivation for the country as
a whole was 153 (Table 3.1). For Rampal, Chandina and
Sakhipur the relevant indices were 212, 255 and 181
respectively. With irrigation in Rampal and Chandina,
the lands hardly lie fallow at any time during the year.
In Rampal, a vegetable farmer, if he wishes, can grow
three, four or even a greater number of crops per year
on a single piece of land. If we exclude the monocrop
areas, i.e. lands under the same crop for one or more
years (e.g. sugarcane, banana, and pan gardens), the
cropping intensity of Rampal is well over 300. After
91
the advent of boro season irrigation in Chandina, triple
cropping has become a notable feature in this region.
The largest percentage of the arable land in the
Sakhipur study villages is double-cropped and the most
common crop-cycle is to grow robi crops after aus/aman
or jute.
From the standpoint of agriculture, the most
striking imbalance between Rampal-Chandina and Sakhipur
is the productivity of land. The average agricultural
production per acre (in taka) in Rampal and Chandina is
four times higher than that of Sakhipur (Table 3.1).
Besides a few other factors, the introduction of HYV
technology in these two areas has played a major role in
increasing agricultural production. The low
productivity in Sakhipur agriculture can be understood
in the light of the region's comparatively poor physical
environment and the absence of HYV technology. It is
also evident from Table 3.1 that the agricultural land
value which is directly related to productivity, is much
lower in Sakhipur than in the other survey areas.
In every rural region in Bangladesh, the most
striking features of agriculture are the small size of
arable land holding per capita, and the unequal
distribution of this essential resource.
are analysed in Chapter 7.
3.2 MOBILITY AS CIRCULATION
These issues
Internal population movement in Bangladesh is
92
essentially circular, involving temporary relocation
from a home base rather than the conventional linear
type of migration. Although 'circulation' or non
permanent movement has long been common in Bangladesh,
studies of population movement have neglected this
phenomenon. Based on empirical data, this section
attempts to provide a comprehensive picture of the
mobility behaviour of village people in Bangladesh.
The discussion will start with a general overview of
mobility in the three regions and this is followed
by a brief description of each type of movement and a
short note on the immobility pattern. The final
section examines some major features of mobility
behaviour of working women.
3.2.1 Overview of mobility
On the basis of mobility histories, 2325
individual movers were recorded in the 14 villages
surveyed in Dhaka, Comilla and Faridpur districts in
Bangladesh (Table 3.6). The overwhelming majority
were male workers who accounted for 98.56 percent of the
total working movers (male and female) and 91.26 percent
of all movers (working movers and student movers). Only
seven percent (172) were student movers and less than
two percent were female movers. Given their numerical
insignificance, both student movers and female movers
were excluded from further analysis. However, the
major characteristics of female working movers and the
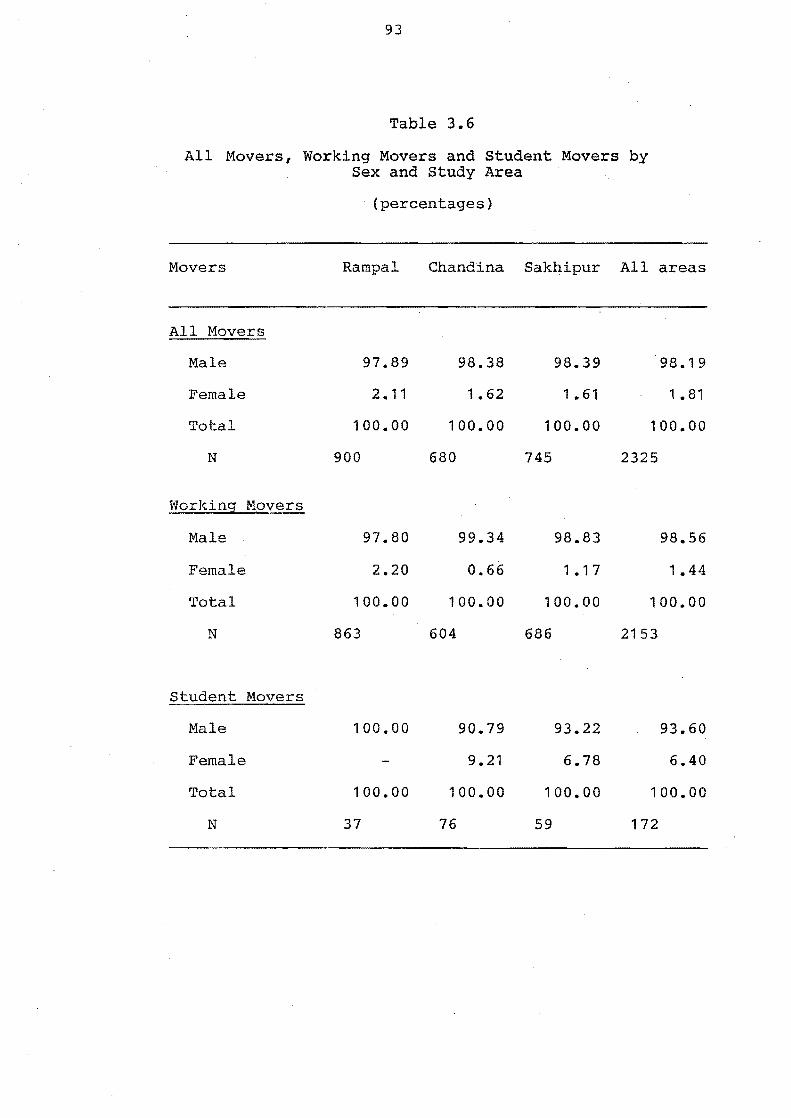
93
Table 3.6
All Movers, Working Movers and Student Movers by Sex and Study Area
Movers
All Movers
Male
Female
Total
N
Working Movers
Male
Female
Total
N
Student Movers
Male
Female
Total
N
(percentages)
Rampal Chandina Sakhipur All areas
97.89
2.11
100.00
900
97.80
2.20
100.00
863
100.00
100.00
37
98.38
1.62
100.00
680
99.34
0.66
100.00
604
90.79
9.21
100.00
76
98.39
1 .61
100.00
745
98.83
1 .17
100.00
686
93.22
6.78
100.00
59
98.19
1 .81
100.00
2325
98.56
1.44
100.00
2153
93.60
6.40
100.00
172
94
reasons for greater immobility among women, are briefly
discussed in section 3.4.
Following the field definition (see Chapter 1)
all working movers were classified into three broad
types: commuters, seasonal migrants (SMs) and non
seasonal or regular circular migrants (CMs). Seasonal
migration refers to movement which is controlled by the
regional agro-climatic calendar. On the other hand,
non-seasonal or regular circular migration includes a
wide variety of short-term and long-term movements which
were not tied to seasonal employment. Table 3.7 shows
the relative importance of the above mobility forms in
three study communities. Movers from Rampal and
Chandina tended to prefer commuting; while in Sakhipur
working movers were more migratory and in particular the
rate of seasonal migration was much higher (three times
higher than the combined rates of the other two study
areas). The variation of mobility patterns can be
understood in the light of various structural
characteristics which differentiate one region from
another.
Accessibility to urban areas
As we have seen in section 3.1.1, Rampal is well
located within the hinterland of the biggest urban,
industrial and commercial agglomeration of the country.
As a result, commuting has become extensive in Rampal.
Data from the present study revealed that in Rampal,
every eight households had at least five commuters and
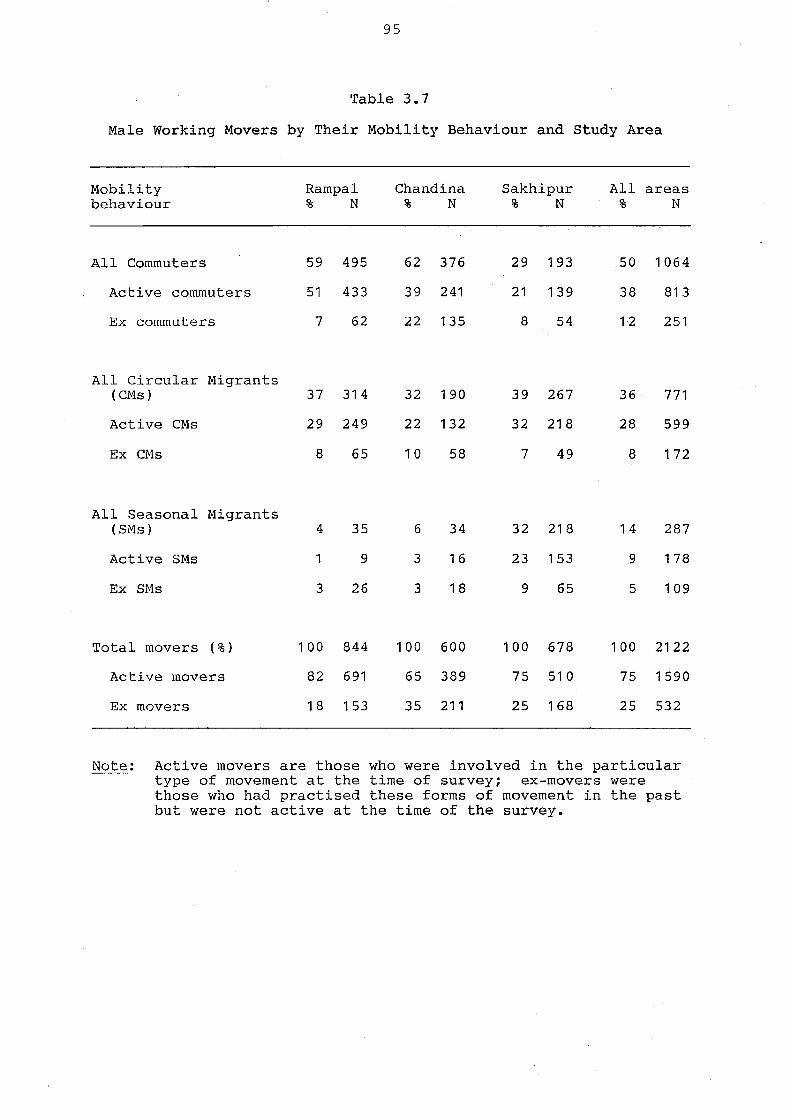
95
Table 3.7
Male Working Movers by Their Mobility Behaviour and study Area
Mobility behaviour
Rampal % N
All Commuters 59 495
Active commuters 51 433
Ex commuters 7 62
All Circular Migrants (CMs) 37 314
Active CMs 29 249
Ex CMs 8 65
All Seasonal Migrants (SMs) 4 35
Active SMs 1 9
Ex SMs 3 26
Total movers (%) 100 844
Active movers 82 691
Ex movers 18 153
Chandina % N
62 376
39 241
22 135
32 190
22 132
10 58
6 34
3 16
3 18
100 600
65 389
35 211
Sakhipur All areas % N % N
29 193 50 1064
21 139 38 813
8 54 12 251
39 267 36 771
32 218 28 599
7 49 8 172
32 218 14 287
23 153 9 178
9 65 5 109
100 678 1002122
75 510 75 1590
25 168 25 532
Note: Active movers are those who were involved in the particular type of movement at the time of survey; ex-movers were those who had practised these forms of movement in the past but were not active at the time of the survey.
96
four of them commuted to the urban and semi-urban
centres. With the shift from traditional cropping to
commercial market gardening, farmers found it necessary
to make commuting journeys associated with their
agriculture.
Chandina, on the other hand, has a good
transportation system to important rural commercial
centres as well as with the nearest district town
(Comilla) located 12 miles east from the study area.
In the absence of a big urban 'pull' here, the commuters
mostly confined their movements to local and regional
trade centres (haats). Given the long distance, rural
urban commuters followed a weekly or bi-weekly pattern
of oscillation. One-third of the total commuters were
circulating between places within the countryside as
well as between village and town. Most of these bi
directional movers were rickshaw pullers (a rickshaw is
a three wheeled pedal-driven road vehicle). Apart from
the transportation factor, Chandina's agricultural
pattern also favoured short-term cyclical movement.
Due to intensive farming all round the year, farmers and
farm labourers could not move away from their villages
for long periods of time.
Poor transportation in the Sakhipur region is
responsible for a much reduced volume of commuters,
especially the flows of rural to urban commuters. This
region, for instance, recorded only 46 rural-urban
commuters (24 percent of the total commuters) as against
97
292 (59 percent) and 165 (44 percent) counted in Rampal
and Chandina respectively. Almost all of the 46 were
weekly or bi-weeklY~overs. In 5akhipur, this
restricted incidence of commuting might be one reason
for a predominance of other forms of movement,
particularly seasonal migration (Tables 3.8 and 3.11).
In Rampal and Chandina the number of active seasonal
migrants (5Ms) was smaller than the number of ex 5Ms,
but in 5akhipur the numerical size of active 5Ms was
significantly greater.
These regional variations of movement patterns
were associated with the uneven impact of forces such as
urbanization, the development of transportation
networks, and the improvement of agriculture. In the
1950s and early 1960s seasonal migration had some
importance in Rampal and in Chandina. But during the
last two decades, the development of transport and
agriculture, and the proliferation of nearby urban
centres, has changed the movement pattern from a less
circulatory to a more circulatory type (i.e. from
seasonal circulation to daily commuting). On the other
hand, poor transport, traditional agriculture, and
severe shortages of periodic employment in and around
5akhipur region, mostly explain persistence of seasonal
and circular migration.
Data from the field surveys also revealed that
circulation of working movers was predominantly directed
towards urban centres. Only 38 percent of the total
98
movers (2122) circulated solely between rural settle
ments. A slight majority (53-54 percent) of the
seasonal migrants and commuters moved to rural areas.
But the flow of circular migration was almost uni
directional.
Out of every ten circular migrants (CMs), nine
went to towns and cities. Dhaka (the capital city)
alone attracted pbout half of the urban movers from the
study villages. The other three important urban
destinations were Narayangonj, Comilla and Chittagong.
The driving force behind this drift to the cities and
towns was the fact that the scope of intra-rural and
inter-rural circulation (for employment) had gradually
been narrowing. Some important reasons for this are
(i) an acute rural-urban wage gap; (ii) increasing
inequality {land/income} among the village households;
(iii) improvements in rural to urban transport;
(iv) population pressure on scarce resources (land,
employment etc.) in every rural area; (v) destruction
of some traditional rural occupations or industries;
(vi) a large scale seasonal shortage of rural
employment; and (vii) the impact of an urban bias in
development planning.
Employment
Table 3.8 summarizes the mobility status of all
working males who comprised 96 percent of the total
working population of the study areas. From the
statistics shown in this table, it is quite clear that
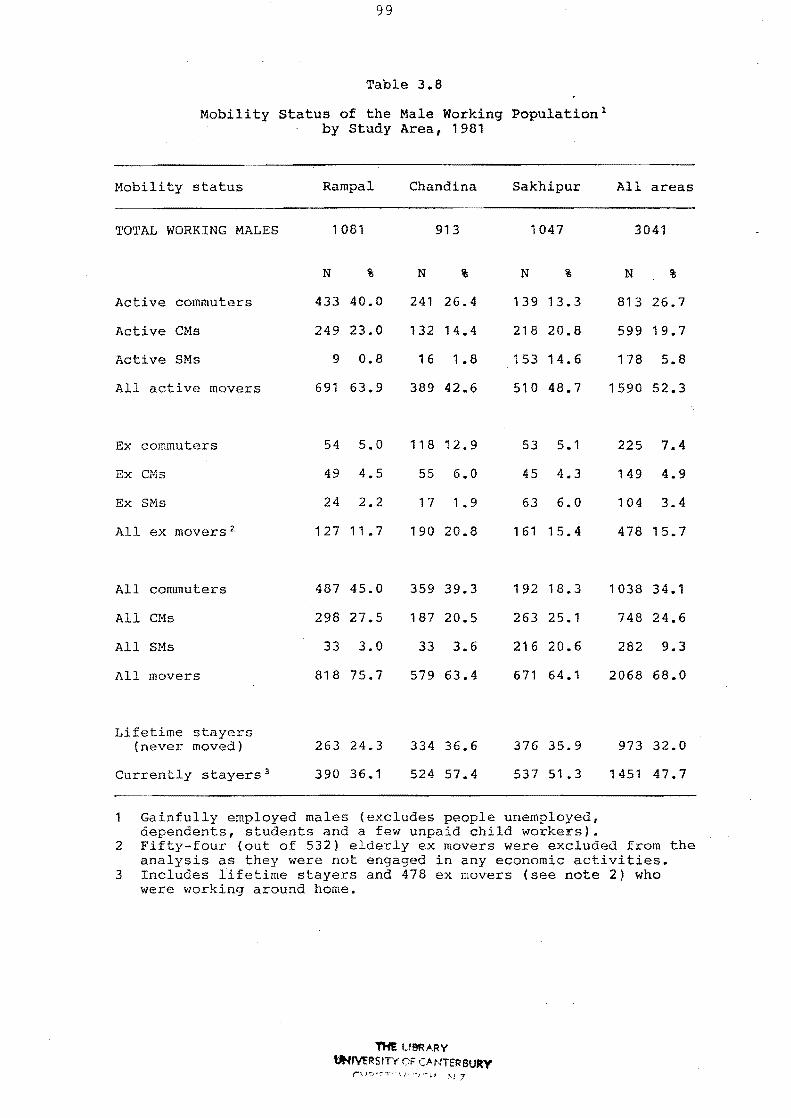
99
Table 3.8
Mobility status of the Male Working Population 1
by study Area, 1981
Mobility status
TOTAL WORKING .MALES
Active commuters
Active CMs
Active SMs
All active movers
Ex commuters
Ex CMs
Ex SMs
All ex movers2
All commuters
All CMs
All 8Ms
All movers
Lifetime stayers (never moved)
Currently stayers3
Rampal
1081
N %
433 40.0
249 23.0
9 0.8
691 63.9
54 5.0
49 4.5
24 2.2
12711.7
487 45.0
298 27.5
33 3.0
818 75.7
263 24.3
390 36.1
Chandina
913
N %
241 26.4
132 14.4
16 1 .8
389 42.6
118 12.9
55 6.0
17 1.9
190 20.8
359 39.3
187 20.5
33 3.6
579 63.4
334 36.6
524 51.4
Sakhipur
1047
N %
139 13.3
218 20.8
153 14.6
510 48.7
53 5.1
45 4.3
63 6.0
161 15.4
192 18.3
263 25.1
216 20.6
671 64.1
316 35.9
537 51.3
1 Gainfully employed males (excludes people unemployed, dependents, students and a few unpaid child workers).
All areas
3041
N %
813 26.1
599 19.7
118 5.8
1590 52.3
225 7.4
'49 4.9
104 3.4
478 15.7
1038 34.1
748 24.6
282 9.3
2068 68.0
973 32.0
1451 47.1
2 Fifty-four (out of 532) elderly ex movers were excluded from the analysis as they were not engaged in any economic activities.
3 Includes lifetime stayers and 478 ex movers (see note 2) who were working around home.
T1i! U9RARY UNMRSITY OF CANTE'RBURY
rt,J"':J·':'''!--'-\It'~}''''L' ~;.7
100
the practice of movement for securing employment has
become a very significant aspect of the livelihood of
village families in Bangladesh. Of the total male
workforce, the majority (52 percent) were found to earn
their living through movement. Two thirds of the men
(68 percent) had moved at some stage to get employment.
Only about one-third (32 percent) of the workforce were
categorised as stayers, people who always worked in
the vicinity of their home. However, in terms of
current mobility status, 47 percent of the workforce
were stayers. Thus the ratio of movers to stayers among
the current workers in all study areas was 52:48.
When the household was considered as a unit of
analysis (Table 3.9) it was found that 62 percent of all
(1941) households had a current mover. The remaining
38 percent were current stayer households comprising 21
percent with men who had never moved and 16 percent with
past movers who no longer left the village to work
elsewhere. Similar statistics on the mover/stayer
status of individuals and households in other Asian
countries are lacking and it is thus difficult to assess
the extent of mobility and immobility among individuals
and households in Bangladesh in wider comparative
context.
Apart from analysing the mobility status of all
working members, the study also explored the mobility
characteristics of all households (Table 3.9). Out of
every 10 households four were found to be currently
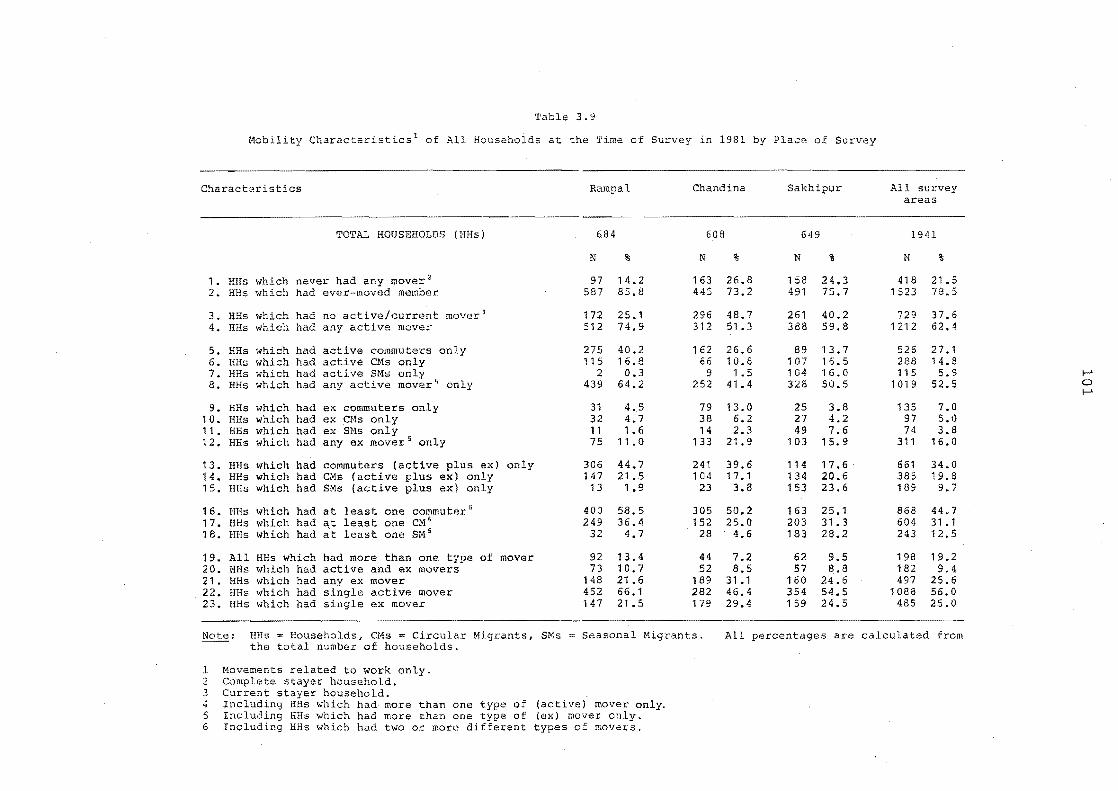
Table 3.Y
Mobility Characteristics l of All Households at the Time of Survey in 1981 by Place of Survey
Charact3ristics
TOTAL HOUSEHOLDS (HHs)
1. HHs which never had any mover2 2. HHs which had ever-moved member
3. RHs which had no active/current mover~ 4. HHs which had any active mover
5. HHs which had active commuters only 6. HHs which had active CNs only 7. HHs which had active SNs only 8. RHs which had any active mover 4 only
9. HRs which had ex commuters only 10. RHs which had ex .eMs only 11. RRs which had ex 8Ms only 12. HHs which had any ex movers only
13. HHs which had commuters (active plus ex) only 14. RRs which had CMs (active plus ex) only 15. HHs which had 5Ms (active plus ex) only
16. RHs which had at least one commuter" 17. HHs which had at least one CM G
18. HHs which had at least one SM 6
19. All HHs which had more than one type of mover 20. HHs which had active and ex movers 21. HHs which had any ex mover 22. RRs which had single active mover 23. RRs which had single ex mover
Rampal
684
N %
97 14.2 587 85.8
172 25.1 512 74.9
275 40.2 115 16.8
2 0.3 439 64.2
31 4.5 32 4.7 11 1. 6 75 11.0
306 44.7 147 21.5
13 1 .9
400 58.5 249 36.4
32 4.7
92 13.4 73 10.7
148 21.6 452 66.1 147 21.5
Chand ina
608
N %
163 26.8 445 73.2
296 48.7 312 51.3
162 26.6 66 10.8
9 1.5 252 41.4
79 13.0 38 6.2 14 2.3
133 21. 9
241 39.6 104 17.1
23 3.8
305 50.2 152 25.0
28 4.6
44 7.2 52 8.5
18931.1 282 46.4 179 29.4
Sakhipur
649
N %
158 24.3 491 75.7
261 40.2 388 59.8
89 107 104 328
13.7 16.5 16.0 50.5
25 3.8 27 4.2 49 7.6
103 15.9
114 17.6 134 20.6 153 23.6
163 25.1 203 31.3 183 28.2
62 9.5 57 8.8
160 24.6 354 54.5 159 24.5
All survey areas
1941
N %
418 21.5 1523 78.5
729 37.6 1212 62.4
526 288 115
1019
27.1 14.8
5.9 52.5
135 7.0 97 5.0 74 3.8
311 16.0
661 34.0 385 19.8 189 9.7
868 44.7 604 31. 1 243 12.5
198 182 497
1088 485
19.2 9.4
25.6 56.0 25.0
Note: RHs = Households, CMs = Circular Migrants, 5Ms the total number of households.
Seasonal Migrants. All percentages are calculated from
1 Movements related to work only. 2 Complete stayer household. 3 Current stayer household. 4 Including HHs which had more than one type of (active) mover only. 5 Including HRs which had more than one type of (ex) mover only, 6 Including HHs which had two or more different types of movers.
I-' o I-'
102
stayer households (households which had no current
mover) and two of them were complete stayer households
(households which never had any mover). The majority
of the families had working movers of varying types and
numbers as shown in Table 3.9. However, in most of the
cases (1088 out of 1212) the current movers' households
contained only one active mover per household.
Families possessing two or more active movers
(124 cases) followed a complex pattern of movement
behaviour. They very often selected two different
types of movement, mostly commuting and circular
migration, and this strategy enabled them to procure
incomes from a variety of destinations over a range of
distances. Further investigation showed that families
with more than one type of mover or more than one mover
were the larger and richer families (Table 7.11). The
socio-economic status of movers is examined in Chapter
8.
3.2.2 Commuting
Commuting in search of a livelihood has become a
part of the daily routine of a large number of working
males living in thousands of villages in Bangadesh. It
is a 'way of life' that has been firmly established in
rural life and economy. By and large, this particular
strategy of movement is greatly influenced by local
settings and situations, and as a result there is
considerable diversity in the patterns of commuting
103
in different parts of the country.
The significance of commuting
It is generally believed that commuting is the
dominant movement type in most rural areas in
Bangladesh. In some places like Rampal and Chandina,
commuting is more significant as a movement type than
other flows (Table 3.10). However, in other rural
communities, such as Sakhipur, it is slightly less
significant in terms of numbers of residents commuting
rather than participating in circular or seasonal
migration. Despite the preponderance of commuting
movement in all the areas together, and Rampal-Chandina
in particular, it was also found that the relative
importance of commuting is gradually declining in
every place (Table 3.10). In Rampal, the proportion of
commuter workers has decreased from 69 percent to 62
percent since the 1950s. During the same period of
time, the proportion commuting in Chandina has been
reduced by 10 percent (from 70 percent to 60 percent)
and by 7 percent (from 36 percent to 29 percent) in
Sakhipur.
During these three decades, the absolute number
of commuters has not declined; indeed the volume of
commuting has increased quite rapidly. But over the
last few decades circular migration has increased more
rapidly than other types of movements. In the next few
decades this trend is likely to continue and the
proportion of total mobility which is commuting will
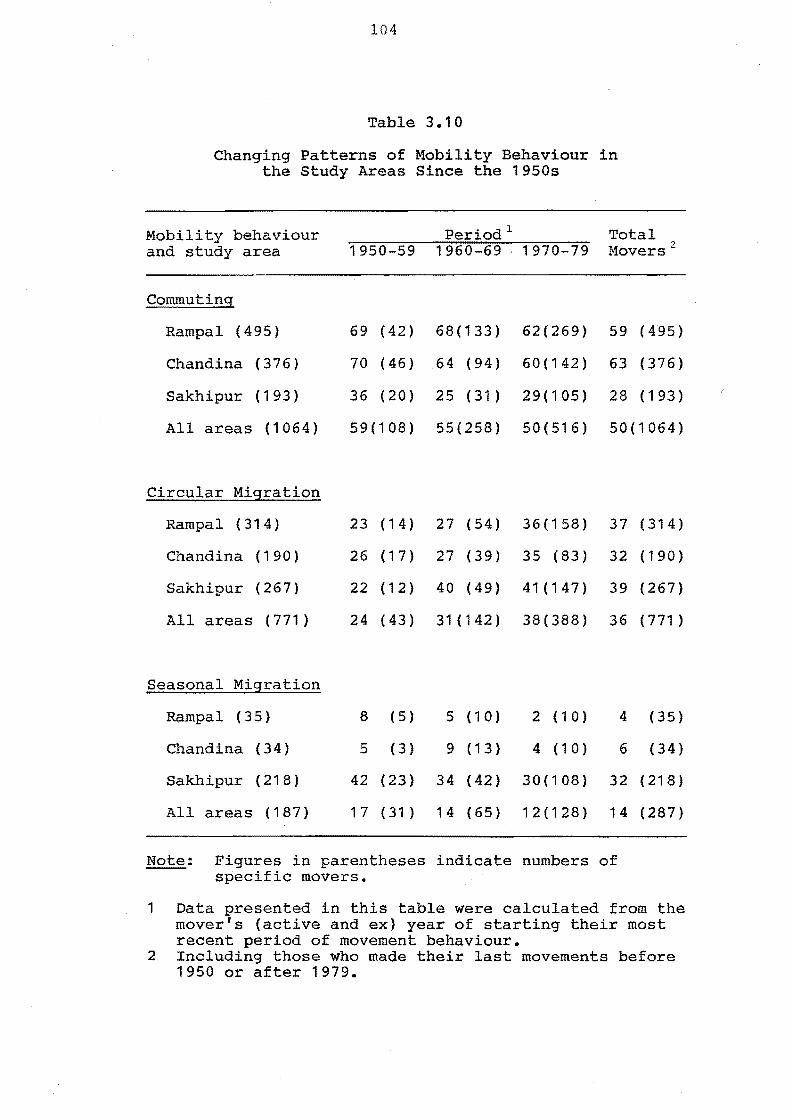
104
Table 3.10
Changing Patterns of Mobility Behaviour in the study Areas Since the 1950s
Mobility behaviour and study area
Commuting
Rampal (495)
Chand ina (376)
Sakhipur (193 )
All areas (1064)
Circular Migration
Rampal (314)
Chandina (190)
Sakhipur (267)
All areas (771)
Seasonal Migration
Rampal (35)
Chandina (34)
Sakhipur (218)
All areas (187)
Period 1 Total 1950-59 1960-69 1970-79 Movers 2
69 (42) 68(133) 62(269) 59 (495)
70 (46) 64 (94) 60(142) 63 (376)
36 (20) 25 (31 ) 29(105) 28 (193 )
59(108) 55(258) 50(516) 50(1064)
23 (14) 27 (54) 36(158) 37 (314)
26 (17) 27 (39) 35 (83) 32 (190)
22 (12) 40 (49) 41(147) 39 (267)
24 (43) 31 (142) 38(388) 36 (771)
8 (5 ) 5 (10) 2 (1 0) 4 (35)
5 (3 ) 9 (13) 4 (1 0) 6 (34)
42 (23) 34 (42) 30(108) 32 (218 )
17 (31 ) 14 (65) 12(128} 1 4 (287)
Note: Figures in parentheses indicate numbers of specific movers.
1 Data presented in this table were calculated from the mover's (active and ex) year of starting their most recent period of movement behaviour.
2 Including those who made their last movements before 1950 or after 1979.
105
fall further, especially in Rampal and Chandina.
However, at the same time, the volume of commuting will
also continue to rise because of the tremendous
population pressure on local resources and the impact of
modernization particularly on agriculture and
transportation.
The rationale for commuting
Unlike seasonal migrants, commuters are
represented by a wide range of occupation groups coming
from various ages, education levels, landholdings, and
economic classes (see Chapters 6, 7, and 8). In every
study area, their occupation patterns are heavily
influenced by two major factors, namely the agricultural
structure of the region and the nearness of the area to
towns and other centres of non-agricultural activities
such as rural markets and thana headquarters. Commuting
is a very appropriate type of movement, especially for
areas like Rampal and Chandina where agriculture stays
intensive in most parts of the year, and the majority of
people cannot provide their daily livelihood from the
land due to high man-land ratios and skewed distribu
tions of holdings. Since farming is intensive, the
villagers cannot leave their farms for long periods
and they mostly seek informal off-farm occupations close
to their village.
The introduction of intensive cropping through
HYV technology or the green revolution in traditionally
backward agricultural regions in Bangladesh, or other
106
parts of South and Southeast Asia, has been found to
have significant positive effects on rural employment
(Muqtada 1975; Jones 1978). But empirical studies have
seldom explained precisely the impact of that new
technology on the mobility behaviour of villagers. The
pattern found in Rampal and Chandina may not be true for
other countries where man-land ratios and the distribu
tion of arable land are significantly better than those
in the two Bangladeshi rural regions.
Turning to Rampal and Chandina again, it can also
be noted that commuting not only complements the
livelihood of poor farmers and wage labourers, it also
attracts a considerable number of surplus farmers (or
farm owners) who earn extra income through commuting to
nearby towns or big rural markets where very often they
have an established business. Some of them are dealing
with the regions' profitable crops (e.g. potatoes,
paddy, Kachamal etc.) or retailing modern fertilizers.
They have been attracted to commuting - a way of living
which provides them with an easy life and impressive
earnings from an improved cropping and commuting
occupation. As a matter of fact, with the development
of agriculture and transportation, the spread of urban
centres, and an increase in population pressure on
cultivation, a growing number of researchers have now
started to view commuting as an alternative to migration
in many Third World countries, especially in the compact
agrarian regions. This issue is discussed further in
107
Chapter 6.
3.2.3 Circular migration
Circular migration which mainly involves rural
urban migrants, appears to be a long-lasting mobility
type in the rural areas in Bangladesh. Unlike
commuting and seasonal migration, this particular type
of movement is less influenced by agricultural
activities and transport conditions. As a result, the
regional pattern of circular migration does not exhibit
great differences (Table 3.10). Although the migrants
are selected from a wider socia-economic spectrum, there
was a clear indication in the survey data that certain
groups of people, such as educated persons, salary
earners, and better-off villagers, had a high propensity
to circular migration. These aspects, along with the
other characteristics of the migrants and their
families, are examined in subsequent chapters.
Significance and growth
It can be argued that circular migration is the
dominant migratory flow in almost all rural communities
in Bangladesh. Empirical evidence (Table 3.7) from the
present study showed that about three-quarters (73
percent) of the total 1058 migrants (CMs plus SMs) were
circular migrants. Among the active migrants the
proportion of eMs was even higher - 77 percent (599 out
of 777). In Rampal and Chandina, circular migration
was far more important than seasonal migration. The
108
former place recorded 314 CMs accounting for 90 percent
of the total 349 migrants, and the latter area
registered 190 CMs who represented 85 percent of the
total 224 migrants. Sakhipur, the third study
location, generated 267 CMs contributing 55 percent of
the total migrants from this region.
Another notable feature of circular migration
evident in all study villages was its uninterrupted
growth, which is obviously related to the steady
increase in urban population through rural-urban
migration. In the 1950s circular migration in the
study population accounted for 24 percent of all working
movements; in the 1960s the proportion rose to 31
percent and eventually in the 1970s it further increased
to 38 percent (Table 3.10). The growth of this
mobility type is also evident in other parts of Asia and
the Third World (Hugo 1978a, Goldstein 1978, Bedford
1973, Chapman and Prothero 1985, Skeldon 1984).
There are many reasons for this increasing
circular migration from rural communities; these are
explained in great detail in Chapter 6. Given the low
level of urbanization, the absolute size and density of
rural population, and the growing dependency of rural
families on incomes from both rural and urban areas, it
can be predicted with some confidence that the system of
circular migration is likely to be further reinforced in
rural communities in Bangladesh.
109
3.2.4 Seasonal migration
As a strategy for livelihood, seasonal migration
is especially favoured by poor villagers from relatively
poor agricultural regions. The migrants tend to be
mainly unskilled and illiterate or nominally educated
labourers who come from the lower income families with
no cultivable land or very little land. The timing of
moves is closely bound up with the traditional
agricultural system. In the study areas in 1981,
seasonal migration was most common among the
agricultural labourers and small peasants.
Seasonal occupations
Usually the migrants leave their village
residence during the slack season and move to other
places (rural or urban) where various types of periodic
work are available at a range of distances from the
migrant's home. This has been illustrated quite
clearly in Figure 3.3. Sakhipur migrants work in
various activities such as fishing~ (34 percent or 52
out of 153) in the Padma-Meghna estuary; working at the
brickfields 5 (32 percent) in nearby urban centresj and
harvesting paddy (16 percent) in ujan-vati areas (mainly
Sylhet and Barisal districts). Other notable seasonal
4 Most of these seasonal fishermen were in fact labourers who came to fish on contract. So, in brief, the bulk of the catch was set apart for those who provided the fishing boat, net, and initial cash often necessary for payment in advance to the contract labourers.
5 Various types of manual work related to making, laying, transporting and baking of bricks.
110
occupations undertaken by migrants from the ~akhipur
region were casual contract-type businesses (dealing
mostly with the sale of seasonal crops - dhulot fasal),
driving rickshaws, and construction-work in towns.
In Rampal, there were only nine (5 percent of
178) active seasonal migrants - seven Kachmal traders,
and two casual labourers. Eight of them moved to
Dhaka-Narayangonj urban centre. Seasonal migrants
originating from Chandina were also mostly (14 out of
16) directed to towns where the migrants obtained
various types of temporary jobs ranging from contract
type business, to a salaried job to casual labour.
Declining significance
In many parts of the developing world, the
relative importance of seasonal migration among the
rural workforce has been declining gradually. This has
been substantiated in a number of recent studies (Maude
1981; Garnier 1978, 262; Van Schendel 1981, 143).
A similar finding is evident in our study villages. It
appeared that the proportion of all movers who were
seasonal migrants had declined from 17 percent in the
1950s to 14 percent in the 1960s, and to 12 percent in
the 1970s. The rate of decline, as shown in Table
3.10, varied markedly, especially between Rampal
Chandina and Sakhipur study areas. Seasonal migration
in Rampal and Chandina gradually became insignificant as
a mobility type; while in the Sakhipur region, this
form of movement was still found to be very important

111
although its relative importance had decreased
substantially from 42 percent in the 1950s to 30 percent
in the 1970s.
Further analysis of data relating to the decline
of seasonal migration indicated that among the ex
movers, the proportion of seasonal migrants was 20
percent (109 out of 532) but among the active movers the
rate had dropped to 11 percent (178 out of 1590). In
Rampal the proportion had decreased from 17 percent to
only one percent (26 out of 153 and 9 out of 691), in
Chandina from 9 to 4 percent (18 out of 211 and 16 out
of 389), and in the Sakhipur region the rate had changed
from 37 percent to 30 percent (65 out of 168, and 153
out of 510).
The pattern of seasonal circulation and its
space-time variations depends upon several factors, the
most important of which is the agricultural system. In
recent years studies in South and Southeast Asian
countries have argued that the incidence of seasonal
migration has declined where traditional farming methods
were substantially altered through the introduction of
modern seed-fertilizer-irrigation technology or 'Green
Revolution' (Van Schendel 1981, 143; Oberai and Singh
1982). Few will deny that the green revolution
increased labour demand and reduced the extent of the
slack season by adopting intensive cropping. As a
result one might expect a decreasing trend of seasonal
movement among the labourers and small peasants within
112
the green revolution regions. Van Schendel (1981, 143),
for instance, found that seasonal migration from five
villages of Bogra (northern district of Bangladesh)
came to an abrupt halt when intensive cultivation of
6 hybrid potato was introduced in rabi season. Rampal and
Chandina, two of the most successful green revolution
areas in Bangladesh, are areas where seasonal migration
is of limited significance.
Apart from agricultural improvement in the
migrants' native villages, another factor has reduced
the demand for seasonal labour in some regions. Rapid
population growth in rice-surplus districts such as
Sylhet and Barisal, formerly destinations for short-term
migrants during the paddy harvesting season, has
increased substantially the size of the local labour
force. In consequence, a large number of ujan-vati
paddy harvesters have had to re-direct their labour
migration to urban locations where they can find
seasonal work making bricks, in construction, and
selling seasonal agricultural products.
The intensity of seasonal migration from rural
settlements was found to decrease with gradual
development of agriculture and transportation links with
towns and rural markets. It also appeared that the
6 In Bangladesh, under traditional agriculture methods, farm workers often remain ununderemployed during rabi season. So during this period of the agricultural cycle, seasonal migrants either move to towns or to boro paddy growing areas (see Figure 3.3).
113
direction of movement was slowly shifting from rural
destinations to urban centres. Further investigation
is needed to explain fully the nature of this shift in
mobility behaviour.
3.3 RELOCATION AND IMMOBILITY
The main concern of this section is to analyse
the major features of permanent migration and immobility
on the basis of data collected from the survey villages.
In the case of the former, inquiry was focused on those
movements which were mostly related to the economic
livelihood of the migrants and their families. In
order to minimise the temporal and conceptual overlaps
in assessing 'permanent' and 'nonpermanent' movements,
the study defines permanent relocation as full
commitment to life in the place of destination.
3.3.1 Permanent relocation
According to the above definition 305 cases of
permanent relocation since 1947 were recorded in the 14
villages. 7 It was found that unlike temporary or
cyclical forms of movement, permanent relocations mostly
involved the displacement of the whole family or
household (87 percent cases) rather than the departure
or separation of individuals from the village family
(Table 3.11). When the whole family moved to the
7 These 305 migration cases were excluded from the village household lists, because the migrants had left their native village permanently.
114
destination, the volume of contacts with the native
place reduced sharply. Of the 305 cases of permanent
migration, 188 (62 percent) had no social contacts with
relatives at native villages; 114 (37 percent) had
visited relatives occasionally and only three were found
to remit money to village relatives. A sample of 120
cases (out of 305) further revealed that a quarter (31
out of 120) of the permanent migrants owned some arable
land in their village of origin (mostly cultivated by
blood relatives) and only seven out of 120 also owned
houses (used by the relatives) in their native villages.
Destinations
There were some important differences in the
destinations of people who had left their villages
permanently and those whose movement behaviour was
circular from a village base. Apart from migrations
that took place within the country (83 percent or 251
out of 305 cases), a significant percentage (17 percent,
54 out of 305) of the total flows ended at other
countries (mostly India and Pakistan) across the
international boundaries. These overseas migrants left
their native villages for two main reasons - economic
hardship and political division of the Indian
subcontinent. The latter cause was entirely related to
the displacement of 22 Hindu families and a Hindu male
from Goumbura and Madham Tala villages (in Chandina) to
mainly neighbouring states of Hindustan (India) such as
Assam and Tripura. All these emigrations took place
115
during the 1950s and 1960s. All but one of the Muslim
emigrants (29 families and two single males) carne from
Sakhipur villages and 14 of them settled in Bombay, 10
in Karachi, 4 in Assam and the remaining 3 in the Middle
East. As shown in Table 3.11, they were the poverty
stricken emigrants.
According to the villagers' opinion, those who
emigrated to Karachi and Bombay cities were very poor
and the majority of them had left their villages during
the 1970s when national and international economic
crises severely affected the livelihood of most
Bangladeshis. For a further insight especially into
these two very long-distant emigration channels, we
asked the villagers why those poor families selected
Bombay and Karachi cities instead of neighbouring big
urban centres such as Dhaka and Calcutta. The reason
was that in and around Sakhipur, these two permanent
migration routes were known to many villagers through
occasional visits of the previous emigrants.
Most of the permanent departures of families or
individuals from all the study areas were to destina
tions within Bangladesh. Of the total 305 migrations,
133 (44 percent) were to towns and 118 (39 percent) were
to rural settlements. The major rural destinations (74
out of 118) were in neighbouring regions. It was quite
evident that the reasons for permanent relocation varied
markedly with the nature of the destination (Table
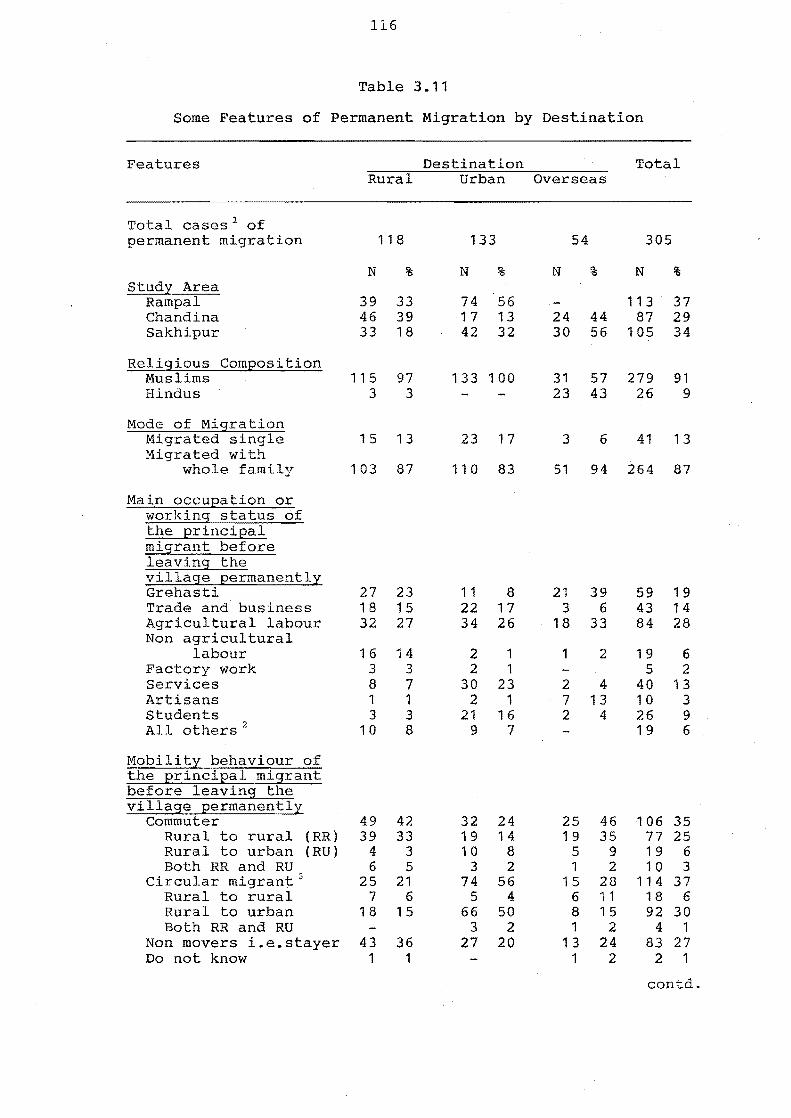
116
Table 3.11
Some Features of Permanent Migration by Destination
Features Destination Total Rural Urban Overseas
Total cases 1 of permanent migration 118 133 54 305
N % N % N % N % study Area
Rampal 39 33 74 56 113 37 Chand ina 46 39 17 13 24 44 87 29 Sakhipur 33 18 42 32 30 56 105 34
Religious ComEosition Muslims 115 97 133 100 31 57 279 91 Hindus 3 3 23 43 26 9
Mode of Migration Migrated single 15 13 23 17 3 6 41 13 Migrated with
whole family 103 87 110 83 51 94 264 87
Main occuEation or working status of the ErinciEal migrant before leaving the village Eermanently Grehasti 27 23 11 8 21 39 59 19 Trade and business 18 15 22 17 3 6 43 14 Agricultural labour 32 27 34 26 18 33 84 28 Non agricultural
labour 16 14 2 1 1 2 19 6 Factory work 3 3 2 1 5 2 Services 8 7 30 23 2 4 40 13 Artisans 1 1 2 1 7 13 10 3 Students 3 3 21 16 2 4 26 9 All others 2 10 8 9 7 19 6
Mobility behaviour of the ErinciEal migrant before leaving the village Eermanently
Commuter 49 42 32 24 25 46 106 35 Rural to rural (RR) 39 33 19 14 19 35 77 25 Rural to urban (RU) 4 3 10 8 5 9 19 6 Both RR and RU 6 5 3 2 1 2 10 3
Circular migrant" 25 21 74 56 15 28 114 37 Rural to rural 7 6 5 4 6 11 18 6 Rural to urban 18 15 66 50 8 15 92 30 Both RR and RU 3 2 1 2 4 1
Non movers i.e. stayer 43 36 27 20 13 24 83 27 Do not know 1 1 1 2 2 1
contd.
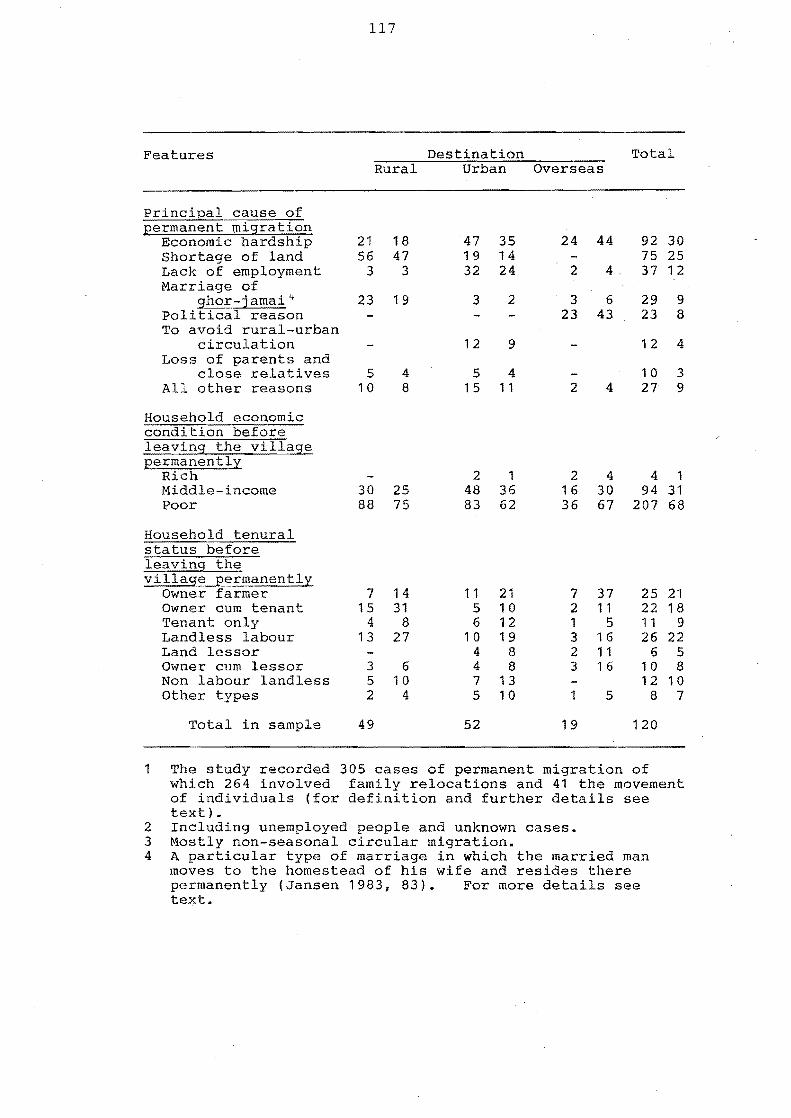
117
Features Destination Total Rural Urban Overseas
Principal cause of permanent migration
Economic hardship 21 18 Shortage of land 56 47 Lack of employment 3 3 Marriage of
ghor-jamai 4 23 19 Political reason To avoid rural-urban
circulation Loss of parents and
close relatives 5 4 All other reasons 10 8
Household economic condition before leaving the village permanently
Rich Middle-income 30 25 Poor 88 75
Household tenural status before leaving the village permanently
Owner farmer 7 14 Owner cum tenant 15 31 Tenant only 4 8 Landless labour 13 27 Land lessor Owner cum lessor 3 6 Non labour landless 5 10 Other types 2 4
Total in sample 49
47 35 19 14 32 24
3 2
12 9
5 4 1 5 11
2 1 48 36 83 62
11 21 5 10 6 12
10 19 4 8 4 8 7 13 5 10
52
24 44 92 30 75 25
24.3712
3 6 29 9 23 43 23 8
12 4
10 3 2 4 27 9
2 4 4 1 16 30 94 31 36 67 207 68
7 37 25 21 2 11 22 1 8 1 5 11 9 3 16 26 22 2 11 6 5 3 16 10 8
12 10 1 5 8 7
19 120
1 The study recorded 305 cases of permanent migration of which 264 involved family relocations and 41 the movement of individuals (for definition and further details see text) •
2 Including unemployed people and unknown cases. 3 Mostly non-seasonal circular migration. 4 A particular type of marriage in which the married man
moves to the homestead of his wife and resides there permanently (Jansen 1983, 83). For more details see text.
118
3.11).
Reasons for relocation
Permanent migration to towns was chiefly caused
by economic hardship, lack of employment and shortage of
land (mostly arable land) whereas movement to rural
areas was mostly due to the severe shortage of both
arable and homestead land. Increased population
pressure forced many small peasant and labourer families
to migrate to relatively less crowded rural regions.
Further analysis of reasons by place of origin indicated
that the rate of permanent relocation due to shortage of
land was positively associated with population density.
This has been substantiated by most census reports which
have shown that rural to rural lifetime migration was
closely related to the density (population) gradient as
mentioned in Chapter 2.
Data from each survey location revealed that
the "land-hungry" permanent migrant families were more
likely to move to neighbouring regions because of the
fact that short-distance displacement enabled them to
maintain vitally important social contacts (such as
children's marriages, parental visits, mutual help to
relatives etc.) with native relatives and society.
Another important cause of rural to rural permanent
migration, which was in fact rooted to land-shortage,
was the marriage system of those males who were living
119
in their father-in-Iaw's home as ghor-jamai 8 (resident
son-in-law). Almost one-fifth (23 out of 118) of the
rural migrations were linked with ghor-jamai marriage.
All of these 23 ghor-jamais came from poor, land-hungry
families and they married into families with a consider-
rable amount of land.
Changes in mobility status
The movement patterns were further examined in
the context of a transition from circular (non-linear)
to permanent (linear) forms of mobility. It was found
that only 27 percent of those who had left permanently
had changed their mobility status directly from stayer
to permanent relocation (83 out of 305, Table 3.11).
8 Under the prevailing system of marriage in Bangladesh, a woman at the time of marriage moves to her husband's residence to live. But in some marriages when the man permanently moves to the homestead of his wife, he used to be called ghor-jamai (resident son-in-law) - a term which downgrades the status of the husband in the society as well as in his fatherin-Iaw's house (Jansen 1983, 83). Generally the ghor-jamais come from a poor economic background, very often from landless and near landless families, and they marry into families with a relatively higher socio-economic status especially with the families which have daughters but no sons. So in this type of marriage system the sonless father-in-law, with the assistance of his young ghor-jamai can manage his agricultural activities or any other family business. What is more important to mention here is that in a society where elderly parents depend on their sons (for old age security), parents without sons rely on their ghor-jamai (if they have any). On the other hand, to the poor landless ghor-jamai, this marriage system provides an easy and quick way to escape from the economic constraints of his life, as he knows one day he and his wife will be the owner of his father-in-Iaw's property. In short, ghor-jamai marriage can be explained as an adaptation to the socio-economic circumstances of the people involved in the marriage (Jansen 1983, 83-84).
120
The large majority of the relocation cases (72 percent
of 305), had become permanent migrants after
participating in a form of non-linear movement such as
commuting or circular migration. These results suggest
that permanent relocation from villages in Bangladesh
follows from some experience with forms of circular
mobility.
Commonly, the migrant starts with a circulatory
pattern of movement from his village of residence to one
or more destination places and eventually, he settles
in the best available destination place. Parallel
findings can be found in other agrarian regions in South
Asia and Sub-Saharan Africa where the process of
internal migration, especially the rural-urban stream,
is predominantly non-linear (Nelson 1976) as in
Bangladesh.
Permanent migration for economic reasons is not a
new phenomenon in Bangladesh, but the scale, direction
and character of movement has definitely altered in
response to political changes in the Indian sub
continent (Chapter 2), increasing population pressure on
land, and uneven regional development through urbaniza
tion, transportation and agricultural improvement. But
unfortunately, due to the lack of appropriate data, the
changing nature of permanent relocation over time and
space cannot be shown statistically.
Prospects for permanent relocation
On the basis of the field data and fragmentary
121
evidence from census data, some conclusions can be
reached on permanent relocation. First, both long-
distance and short-distance relocation from rural
communities are becoming less common. The former may
be decreasing in significance at a faster rate than the
latter. An analysis of migration data based on 1951,
1961 and 1974 censuses, indicates that after 1961 the
lifetime migration rate has stabilised 9 (Elahi 1980).
The most obvious reason for such stabilisation is that
the permanent displacements within rural regions, as
opposed to towns, are heavily dependent on the
availability of land (homestead and arable) at the place
of destination. Due to the rapid increase of
population, land has become a very scarce resource in
high demand in every village in Bangladesh.
Permanent migration to urban centres appears to
be assuming a more important role. It is generally
believed that the Third World cities will be the final
place of living for the majority of rural migrants.
Nelson (1976, 733) indicates that those parts of the
Third World where temporary migration to town is still
extensive will experience a shift toward more permanent
relocation in the future. But there is little doubt
that in the case of Bangladesh, the above change or
transformation will remain fairly slow for a long time
in the future (Chapter 9).
9 Persons enumerated in a place (usually district) different from the "place of birth".
122
The very low mobility of rich families (Table
3.11) tends to suggest that permanent departure from the
rural areas is deeply associated with socio-economic
distress. This pattern is likely to continue, until
there are some radical changes in village life. Ongoing
rural development projects, such as rural electrifica
tion may bring some urban amenities and new jobs to
villages and thereby may help to keep some potential
migrants, especially the educated youths, in rural
areas.
Finally, the scope and opportunities for
permanent migration to other countries, especially to
the neighbouring states of India, are now much reduced
due to recent ethnic violence and strong anti-immigrant
feelings among the natives in Assam and Tripura states.
However, the current emigration of Bangladeshi workers
to the Middle East countries and the adjustment problems
on return of those workers to horne may generate some
potential permanent migrations from countryside to town.
A World Bank paper (1981) indicates that three-quarters
(78 percent) of the Middle East emigrants have come from
rural areas and a significant proportion of those
migrants are investing their overseas earnings in urban
land and housing in Bangladesh. By and large, however,
the options for permanent migration within and across
the territory of Bangladesh have been narrowing. This
has enhanced the role of nonpermanent reciprocal
movement in rural life.
123
3.3.2 Immobility
So far, different types of movement, recorded in
the three rural regions of Bangladesh, have been
outlined and it remains to illustrate some
characteristics of immobility. In a community where
both movers and stayers are very common, a comprehensive
perspective on mobility behaviour cannot be obtained
through surveys of only those people who have moved. It
is widely believed that the full range of answers
related to the question "why do people move?" is partly
reliant on the understanding of "why do people not
move?" (De Jong and Gardner 1981). The existing body
of migration literature on Bangladesh provides little
insight into the various characteristics of the stayers
and their families. This section gives a brief account
of the nature of immobility in the study communities.
Household characteristics
Analysing the mobility behaviour of all male
workers, it was found that in two-fifths of the village
households (763 out of 1941) there were 973 males who
had never worked for any period in a place which was two
miles or more away from their residence. According to
definitions adopted for this study (see Chapter 1) these
workers were classed as stayers or non-movers. 10 They
10 Although the stayers never moved for employment, the great majority of them (85 percent of the 120 in the sample), however, have visited neighbouring towns for various reasons (Table 3.12) other than work. These visits were not counted as 'migration' in this study as they were not related to activities associated with employment.
124
accounted for almost one-third (32 percent) of the total
male workers and two-thirds of the current stayer
workers (Table 3.8). Half of the stayer workforce (481
out of 973) came from those rural households which had
never had any people absent for work-related reasons
(Table 3.9). These complete stayer households were
found to be considerably different in terms of family
size, composition, land holding, income and other socio
economic characteristics from the other village
households such as households which had commuters or
migrants.
Working stayers originated mainly from families
characterized by small size (Table 7.1), simple
structure (Table 7.3), and low quantity and quality of
man-power (Table 7.12). As a result, these households
were found to earn an income lower than the earnings of
families with circular migrants or commuters (Chapter
7). In the field, it was quite noticeable that the son
who came from the single-son family was more likely to
remain as a stayer than as a commuter, or to be a
commuter rather than a circular migrant. Of the 120
stayers in the sample, a quarter had no brothers. The
corresponding proportions found among the samples of
commuters (120) and current CMs (93) were 18 percent and
only 6 percent respectively.
With reference to agricultural landownership
patterns, it was found that a non-mover's family on
average owned a greater amount of land than a commuter's
125
household, but less land than a circular migrant's
family. When the pattern of operated land and own
cultivated land was explored further, it was found that
although a stayer family owned a small amount of land,
it operated or cultivated larger areas than any mover's
family. This gives an indication as to why and how
some villagers were able to obtain a living and to stay
in their native villages.
Individual characteristics
Besides family background, the individual or
personal characteristics of non-movers such as age,
education, occupation etc. were also found to be
considerably different from the attributes of movers.
A common feature was that a large proportion of both
movers and non-movers belonged to the young adult ages
such as 15 to 29 years. The feature was mainly caused
by, and related to, the pyramidal structure of
population. Among the middle age males (30 - 54 years)
the proportion of non-movers was substantially lower in
comparison with the proportions of movers, especially
the commuters. Among those persons aged 55 and over,
the pattern was opposite - there was a greater
proportion of elderly stayers than of movers.
The reason for the low proportion of non-movers
in the middle age groups can be explained by the fact
that usually males at this particular stage of their
lives need to earn more money to support their family
which consists of spouse, children and very often
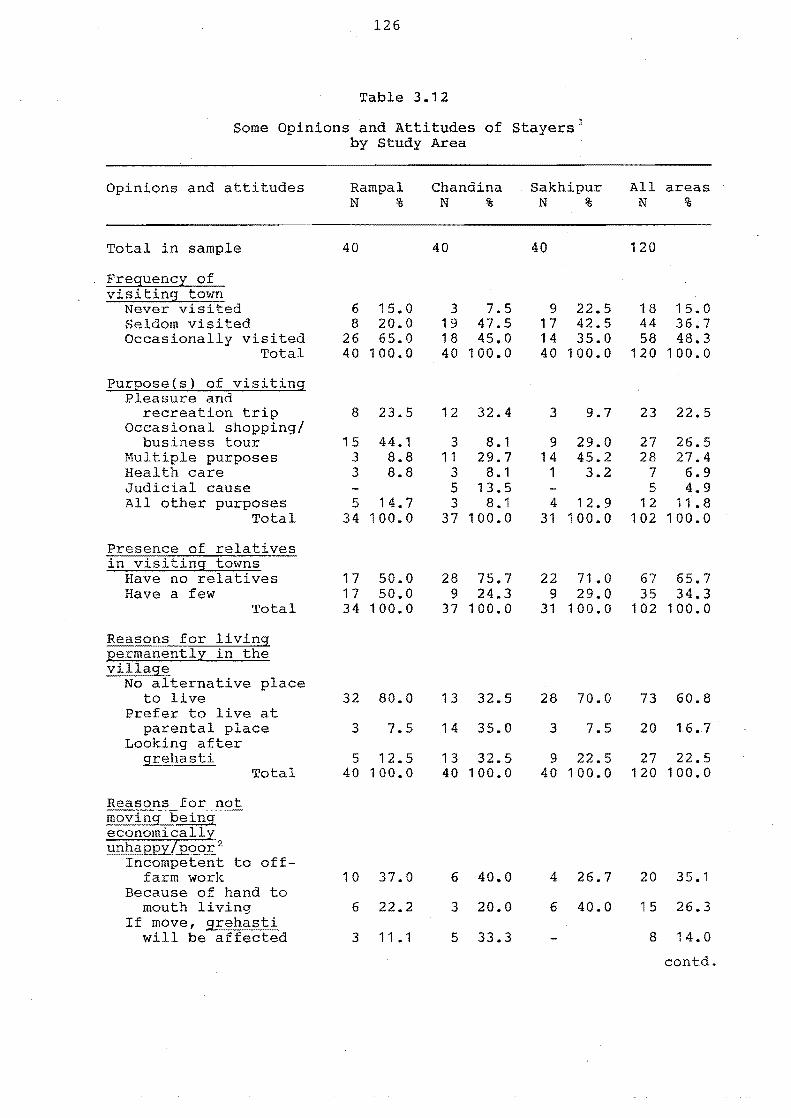
126
Table 3.12
Some Opinions and Attitudes of Stayers 1
by Study Area
Opinions and attitudes Rampal Chandina Sakhipur All areas N % N % N % N %
Total in sample 40 40 40 120
Freguency of visitins town
Never visited 6 15.0 3 7.5 9 22.5 18 15.0 Seldom visited 8 20.0 1 9 47.5 17 42.5 44 36.7 Occasionally visited 26 65.0 18 45.0 14 35.0 58 48.3
Total 40 100.0 40 100.0 40 100.0 120 100.0
PurEose(s) of visiting Pleasure and
recreation trip 8 23.5 12 32.4 3 9.7 23 22.5 Occasional shopping/
business tour 1 5 44.1 3 8.1 9 29.0 27 26.5 Multiple purposes 3 8.8 11 29.7 14 45.2 28 27.4 Health care 3 8.8 3 8.1 1 3.2 7 6.9 Judicial cause 5 13.5 5 4.9 All other purposes 5 14.7 3 8.1 4 12.9 12 11.8
Total 34 100.0 37 100.0 31 100.0 102 100.0
Presence of relatives in visiting towns
Have no relatives 17 50.0 28 75.7 22 71. 0 67 65.7 Have a few 17 50.0 9 24.3 9 29.0 35 34.3
Total 34 100.0 37 100.0 31 100.0 102 100.0
Reasons for living Eermanently in the village
No alternative place to live 32 80.0 13 32.5 28 70.0 73 60.8
Prefer to live at parental place 3 7.5 14 35.0 3 7.5 20 16.7
Looking after grehasti 5 12.5 13 32.5 9 22.5 27 22.5
Total 40 100.0 40 100.0 40 100.0 120 100.0
Reasons for not moving being economically unhaEEy7Eoor 2
Incompetent to off-farm work 10 37.0 6 40.0 4 26.7 20 35.1
Because of hand to mouth living 6 22.2 3 20.0 6 40.0 15 26.3
If move, grehasti will be affected 3 11.1 5 33.3 8 14.0
contd.
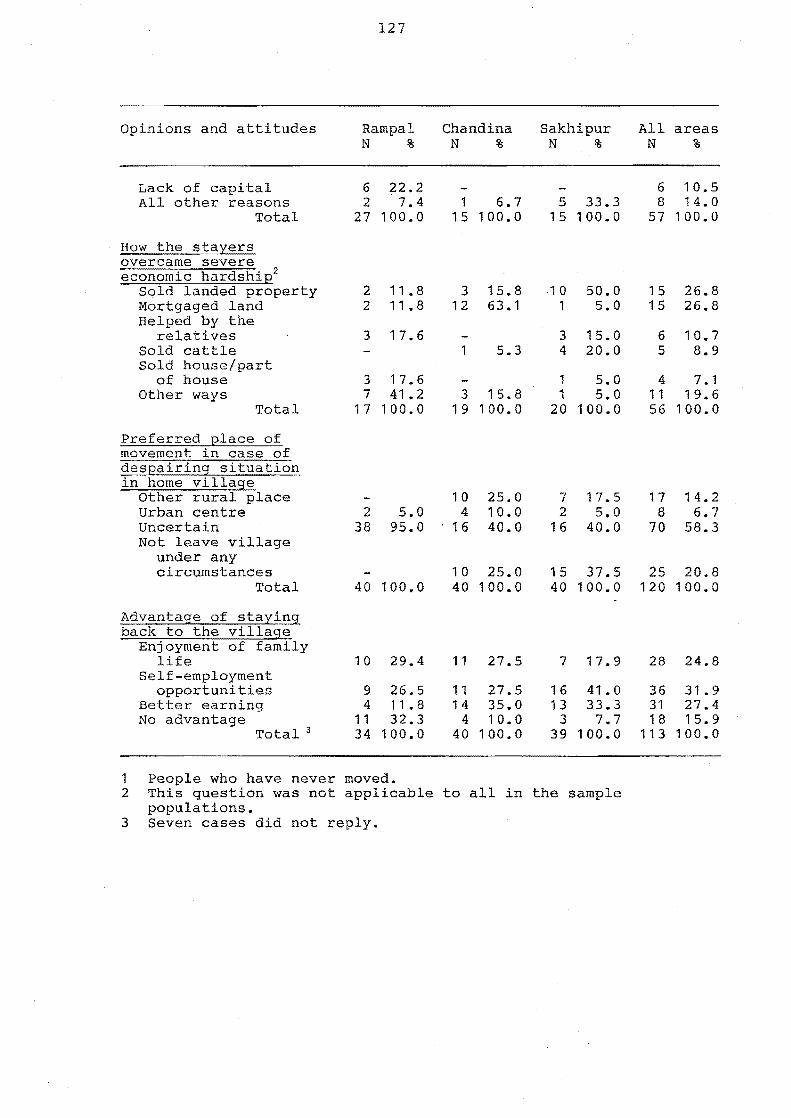
127
Opinions and attitudes Rampal Chand ina Sakhipur All areas N % N % N % N %
Lack of capital 6 22.2 6 10.5 All other reasons 2 7.4 1 6.7 5 33.3 8 14.0
Total 27 100.0 15 100.0 15 100.0 57 100.0
How the stayers overcame severe economic hardshiE2
Sold landed property 2 11.8 3 15.8 10 50.0 15 26.8 Mortgaged land 2 11. 8 12 63.1 1 5.0 15 26.8 Helped by the
relatives 3 17.6 3 15.0 6 10.7 Sold cattle 1 5.3 4 20.0 5 8.9 Sold house/part
of house 3 17.6 1 5.0 4 7.1 Other ways 7 41.2 3 15.8 1 5.0 11 19.6
Total 1 7 100.0 1 9 100.0 20 100.0 56 100.0
Preferred elace of movement in case of desEairing situation in home village
Other rural place 10 25.0 7 17.5 17 14.2 Urban centre 2 5.0 4 10.0 2 5.0 8 6.7 Uncertain 38 95.0 16 40.0 16 40.0 70 58.3 Not leave village
under any circumstances 1 0 25.0 15 37.5 25 20.8
Total 40 100.0 40 100.0 40 100.0 120 100.0
Advantage of staying back to the village
Enjoyment of family life 10 29.4 11 27.5 7 17.9 28 24.8
Self-employment opportunities 9 26.5 11 27.5 16 41.0 36 31 .9
Better earning 4 11 .8 14 35.0 13 33.3 31 27.4 No advantage 11 32.3 4 10.0 3 7.7 18 15.9
Total 3 34 100.0 40 100.0 39 100.0 113 100.0
1 People who have never moved. 2 This question was not applicable to all in the sample
populations. 3 Seven cases did not reply.
128
parents and young siblings of the spouse, and to arrange
education, housing and marriage for their dependents.
As the land could not provide the villagers with an
adequate means to achieve all these objective, mobility
was essential for employment among virtually all adult
males and specially the middle-aged villagers. It was
calculated from village data that less than 20 percent
of the middle-aged workers were complete stayers (i.e.
had never moved for work). The corresponding ratios
among the young adults and older age working males were
much higher - 40 percent and 30 percent respectively.
Among the non-movers (all ages) the proportion of
married people was also lower (62 percent as against 76
percent among the movers) and this can also be under-
stood in the light of the above discussion. Education
was another characteristic in which the non-movers
seemed to differ quite significantly from movers
particularly the circular migrants. Education also
substantially influenced the movers' occupation
structure. Since the stayers had a low level of
education, they relied heavily upon agricultural
activities as their sources of income and employment.
Reasons for staying
The non-movers were neither a random cross-section
of the village population nor people who frequently
desired to remain in the village under any
circumstances. In table 3.12 the stayers' opinions and
attitudes towards the strategy of immobility are
129
summarized. From their attitudes it was clear that the
majority of them were living in a state of great
uncertainty in the village as they could neither make
any movement from the village nor earn a satisfactory
living from local means.
Among the non-movers, there were some fundamental
reasons for an inability to move out from the village,
such as (i) shortage of family male man-power to look
after the farm and family; (ii) incompetence for off
farm work due to lack of skills or education;
(iii) impoverishment or hand to mouth living conditions;
(iv) lack of relatives living in towns or other
potential places of movement; and (v) ill health and
old age of some stayers. Nevertheless, not all village
stayers were dissatisfied with village life. A
significant minority of them (mostly the big farmers or
landlords) preferred to stay and find a living in the
village permanently.
in Chapter 8.
3.4 MOBILITY OF WOMEN
This issue is discussed further
A serious omission in many migration studies in
Bangladesh, as well as in other South Asian countries,
is empirical information on the socio-economic
characteristics and mobility behaviour of working women.
Decennial census reports in Bangladesh have frequently
contained statistics showing a high rate of female
mobility, the bulk of which is supposedly associated
130
with the traditional flows of women as dependents or due
to marriage. Moreover, census information on various
socio-economic characteristics of working migrants are
either very scanty or mostly ambiguous.
It is evident from case studies on population
movement that the mobility rate of working women from
rural areas is extremely low in the Indian sub
continent, and that Bangladeshi female workers would
perhaps be the least mobile labour force in Asia or
elsewhere. In this section, the major characteristics
of female movers are examined with a view to
establishing the main factors which deter rural women
from moving out from their villages for work.
Female labour migration
In all the survey villages females revealed a low
propensity to move outside their localities for work or
attending schools. Only 42 females were classed as
movers, of whom 11 had moved for study and the other 31
women to work. These female workers comprised less
than two percent (1.91 percent) of the total active
movers from the 14 survey villages. Twenty three of
the women were active circular migrants and they
comprised just under 4 percent of the total current
migrants. In northern India, women migrants from 16
villages accounted for 7 percent of all working migrants
(Connell et al. 1976, 42).
Chaudhury and Curlin (1975, 201) analysed the
131
reasons for out-migration from 101 villages in Matlab
thana, Bangladesh. They found that about 13 percent
(average ratio for 5 years data) of those who had left
their village in search of "occupational opportunities n
were females. But the study did not explain how many of
those females really availed themselves of opportunities
to work at the places of migration. Thus the exact
number of female working migrants from Matlab villages
was not available for direct comparison with other
studies. However, in spite of methodological and
definitional inconsistencies these empirical studies
(including the present one) furnish fascinating insights
into the sex differentials among working migrants
originating from rural communities in Bangladesh and
India.
Table 3.13 displays the major features of all
working women by mover and stayer status. Altogether,
there were 121 economically active females found in the
14 villages. A quarter of them (31 out of 121) were
movers and the remaining three-quarters were stayers who
had never left their native places for work. Compared
with the families of male working movers, the families
of women movers were mostly poor; over three-fifths of
them (63 percent) came from the lower socio-economic
classes and two-fifths of the families (41 percent) were
absolute destitutes. However, the socio-economic
condition of the female movers as shown in Table 3.13
was found to be slightly better as compared to that of
132
the stayer female workers. In this case, four out of
five families (83 percent) originated from the lower
class and three of them were extremely poor or
destitute. A detailed analysis of the various
attributes of working women in the context of their
propensity or ability to move out from their villages is
beyond the scope of this study. Having said this, a
brief explanation is given here of some important
factors related to the motives for mobility and
immobility among working women.
Factors hindering labour force participation
The explanation of a low incidence of mobility
among Bangladeshi women is rooted in the female's very
limited participation in economic activities. According
to the 1981 census the crude and the refined activity
rates 11 of females were 2.8 and 4.3 percent respectively
(for the male population, for instance, the rates were
very much higher, such as 49.9 and 73.9 percent
respectively). The corresponding figures for females
in the 1974 census were 2.6 and 4.0 percent. Although
there is evidence of a marginal increase in female
participation in the workforce, Bangladesh has one of
the lowest levels of female involvement in the labour
force. For example, the crude economic activity rate
11 The crude activity rate is the proportion of the total population of all ages that is aged ten years and above and are economically active. The refined activity rate is the proportion of the total population aged 10 years and over that is in this age group and economically active.
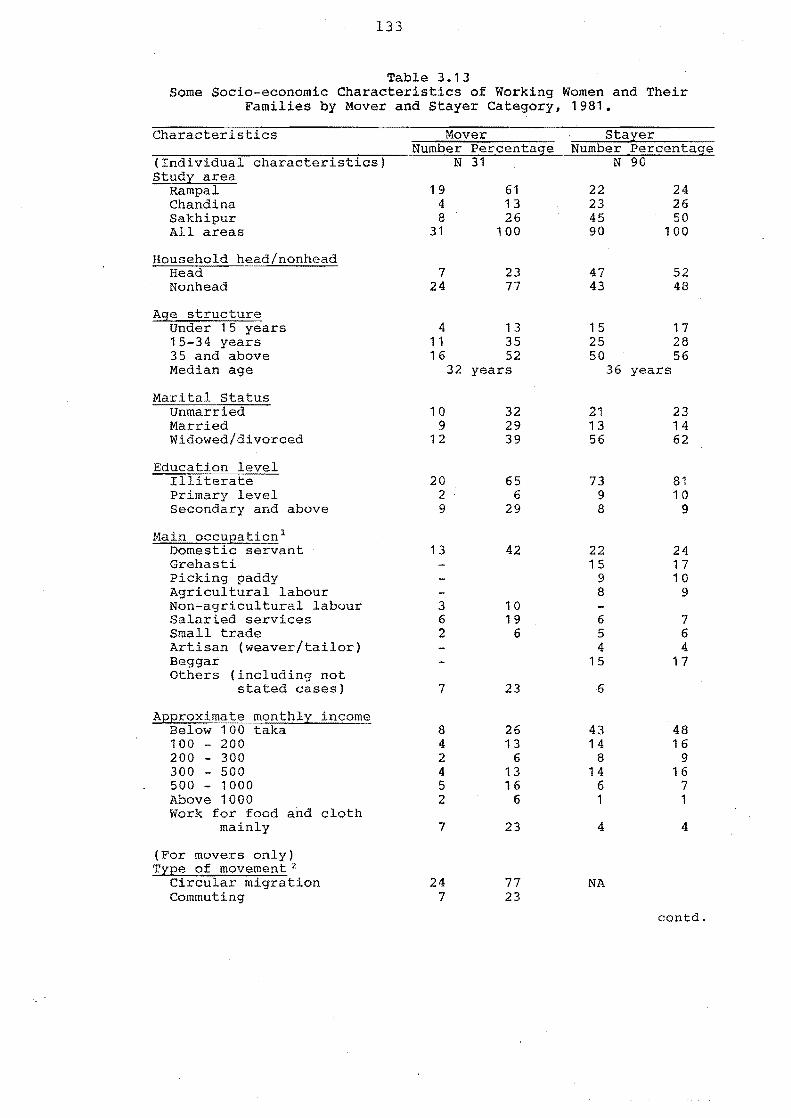
133
Table 3.13 Some Socia-economic Characteristics of Working Women and Their
Families by Mover and Stayer Category, 1981.
Characteristics
(Individual characteristics) Study area
Rampal Chandina Sakhipur All areas
Household head/nonhead Head Nonhead
Age structure Under 15 years 15-34 years 35 and above Median age
Marital status Unmarried Married Widowed/divorced
Education level Illiterate Primary level Secondary and above
Main occupation 1
Domestic servant Grehasti Picking paddy Agricultural labour Non-agricultural labour Salaried services Small trade Artisan (weaver/tailor) Beggar Others (including not
stated cases)
Approximate monthly income Below 100 taka 100 - 200 200 - 300 300 - 500 500 - 1000 Above 1000 Work for food and cloth
mainly
(For movers only) Type of movement 2
Circular migration Commuting
Mover Number Percentage
N 31
19 61 4 13 8 26
31 100
7 24
23 77
4 13 11 35 16 52
10 9
12
20 2 9
13
3 6 2
7
8 4 2 4 5 2
7
24 7
32 years
32 29 39
65 6
29
42
10 19
6
23
26 13
6 13 16
6
23
77 23
stayer Number Percentage
N 90
22 24 23 26 45 50 90 100
47 43
52 48
15 17 25 28 50 56
21 13 56
73 9 8
22 15
9 8
6 5 4
15
6
43 14
8 14
6 1
4
NA
36 years
23 14 62
81 10
9
24 17 10
9
7 6 4
17
48 16
9 16
7 1
4
contd.
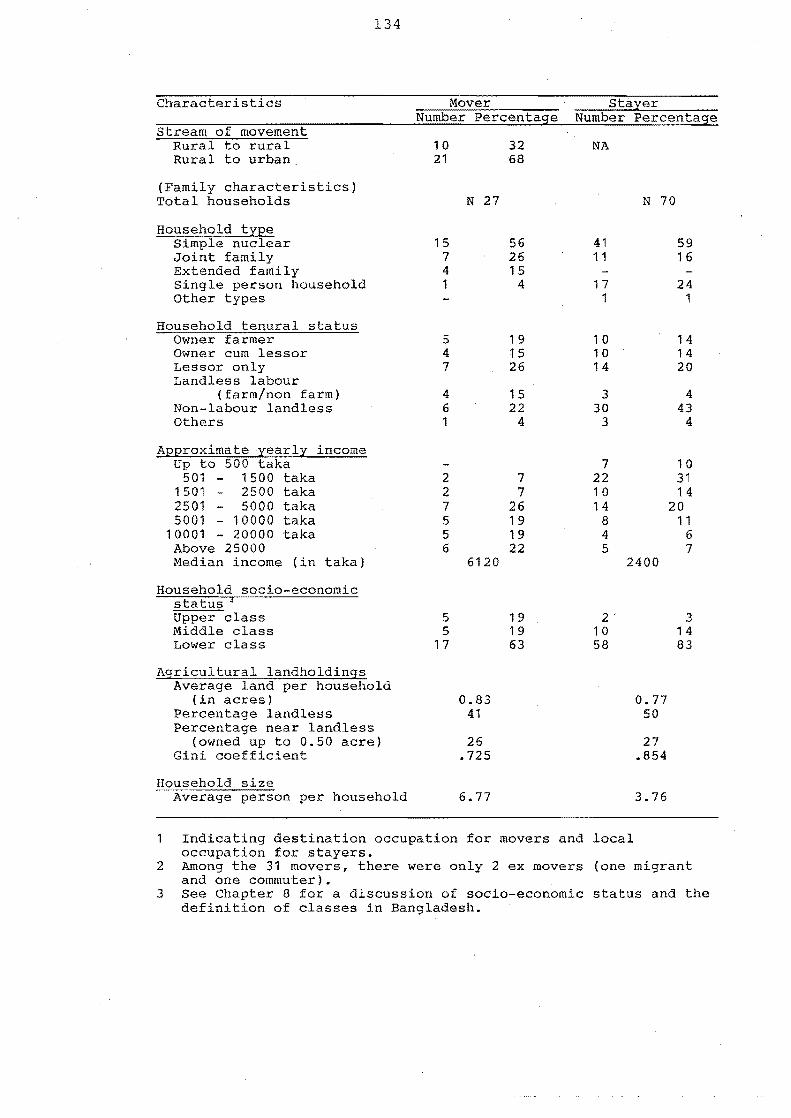
Characteristics
stream of movement Rural to rural Rural to urban.
(Family characteristics) Total households
Household type Simple nuclear Joint family Extended family Single person household other types
Household tenural status Owner farmer Owner cum lessor Lessor only Landless labour
(farm/non farm) Non-labour landless Others
Approximate yearly income Up to 500 taka
501 - 1500 taka 1501 2500 taka 2501 - 5000 taka 5001 - 10000 taka
10001 - 20000 taka Above 25000 Median income (in taka)
Household socio-economic status 3
Upper class Middle class Lower class
134
Agricultural landholdings Average land per household
(in acres) Percentage landless Percentage near landless
(owned up to 0.50 acre) Gini coefficient
Household size Average person per household
Mover Number Percentage
10 21
15 7 4 1
5 4 7
4 6 1
N 27
32 68
56 26 15
4
1 9 15 26
15 22
4
2 7 2 7 7 26 5 19 5 19 6 22
5 5
17
6120
0.83 41
26 .725
6.77
19 19 63
stayer Number Percentage
NA
41 11
17 1
10 10 14
3 30
3
N 70
59 16
24 1
14 14 20
4 43
4
7 10 22 31 10 14 14 20
8 11 4 6 5 7
2· 10 58
2400
0.77 50
27 .854
3.76
3 14 83
Indicating destination occupation for movers and local occupation for stayers.
2 Among the 31 movers, there were only 2 ex movers (one migrant and one commuter).
3 See Chapter 8 for a discussion of socia-economic status and the definition of classes in Bangladesh.
135
among females in all less developed countries was 22.3
percent in 1970 as against only 2.5 percent in
Bangladesh in 1974 (UN 1 981a,252) • The crude activity
rates for men and women in the study villages, surveyed
in 1981, were 48.0 and 2.0 percent respectively and the
refined activity rates were correspondingly estimated to
be 69.7 and 3.0 percent.
A number of studies (Arens and Van Beurden 1977;
Cain et al. 1979; Bertocci 1974; and Ahmad 1984) argue
convincingly that in Bangladesh, female particiation in
the civilian workforce is very much conditioned by
social taboos and values, class hierarchies, the
patriarchy system and religious conservatism, especially
the widely practised parda (purdah) system.12 These
socio-religious customs are practised more rigorously
within the rural communities where a woman's place is
generally considered to be in the home. Under the
patriarchy system, there exists a clear and unambiguous
segregation of labour between the male and female
members of a household. Usually the man earns bread
for the family and the woman does all non-earning
domestic work such as cooking, cleaning, childcare etc.
Paul Harrison (1981, 232) who has visited many Third
12 The complex concept of purdah - a term that literally means "veil" or "curtain" broadly refers to the many practices related to the seclusion of women among the Muslim communities in different parts of the world (Singh 1984, 96). The level of observance of purdah seems to vary with class, status, education, wealth, place of living (urban/rural) and many more indiviual or group variables.
136
World countries, including Bangladesh, writes that a
woman, in Bangladesh, will only work outside the home if
the direst need drives her to do so.
The tendency towards higher mobility levels among
poor women reveals some interesting trends. These
movers prefer to migrate to urban places rather than
commute between or migrate to rural areas. The main
reason for this is that in a traditional village Muslim
society, females lose their izzat (social prestige of a
person and his/her family) when they move outside the
home for doing any work. But in towns, such attitudes
towards female outdoor work have gradually-been
changing. The fact is that generally within the rural
communities, people are quite well-known to one another
and accustomed to talk about one's izzat. However,
when a woman comes to town she mostly remains unknown or
anonymous in the new urban society, and thus she does
not feel very much discomfort especially with regard to
possible ruin of her or her family's izzat.
Another reason for movement is that poor female
migrants generally do not have any rural means of living
such as an adult male bread earner, arable land, and
rich relatives. Urban pull factors such as higher
wages, regular work and better quality of work are also
attracting some women to work in town (Table 3.13).
Females in the upper socio-economic strata,
are less likely to move for work than poorer women.
Within the 14 survey villages only five women movers who
137
came from well educated wealthy families were recorded.
All of them migrated to Dhaka capital for jobs in the
public service. The good educational background of the
migrants and their families induced them to break
through the socio-religious restrictions on female
mobility for work.
The numbers of women workers (mover or stayer)
among the upper to middle class families are very small
as compared to those from poorer households (Table
3.13). The principal reasons for this are (i) the
families which come from better social and economic
positions are usually conscious of their izzat, elitism,
socio-religious values especially with respect to purdah
and division of female labour (Bertocci 1974); (ii) in
the rural areas, females (even the widowed and deserted
ones) from prosperous households have sufficient means
(land, male earner, rich relatives etc.) for a
livelihood and they do not need to engage in economic
activities within or outside the home.
Reasons for immobility
The mobility behaviour of working women cannot be
understood fully without an explanation of reasons for
immobility of the great majority of female workers (74
percent or 90 out of 121) who have stayed in their
villages. Besides socio-religious restrictions, there
are several other factors significantly related to the
immobility of women. First, the vast majority of the
stayer working women are very poor and illiterate, and
138
they are comparatively older than the female movers.
Thus they are not as eligible for urban work.
Another reason is that their families are very
small and mostly headed by widowed women; if they
sometimes temporarily migrate alone, there is nobody
left in the village to look after their children.
Moreover, they do not have any savings to meet the cost
of migration. Third, many of them fear that if the
whole family leaves the village (i.e. migrates),
someone will (illegally) occupy their tiny plots of
land. The second and third obstacles together have a
substantial negative impact on mobility trends,
particularly among families which are poor and headed by
women (as is evident in Table 3.13 there are only seven
women out of 31 movers, who were heads of households).
The number of female migrants who were heads of
households was very small (only 3 out of the 24 migrant
women).
3.5 CONCLUSION
This chapter has outlined some characteristics of
the environment within which contemporary mobility
behaviour in rural Bangladesh is set. The mobility and
immobility of working people in rural Bangladesh were
then cosidered within the framework of a space-time
typology presented in Chapter 2. The most significant
findings in this chapter concerning forms of mobility
139
can be summarized as follows:
1. Internal population movement of working people
in Bangladesh is essentially circular, involving
temporary displacement from a home base rather than the
conventional linear type of permanent relocation.
Commuting, circular migration, and seasonal migration
are the three broad types of circulatory movements.
Permanent relocation from villages usually follows
participation in some form of circulation.
2. options for permanent migration within and
across the territory of Bangladesh have been narrowing,
and this is reinforcing the significance of non
permanent reciprocal movement in rural life.
3. Empirical evidence from each study location
suggests that among all movers, the proportion of
circular migrants has been increasing and this trend is
likely to continue with growth in both the urban
population and rural poverty.
4. Like many other Third World countries, options
for intra-rural and inter-rural circulation have
gradually been narrowing. Data from the present study
indicates that six movements out of every ten were
oriented towards town. The proportion of rural-urban
movement in commuting and seasonal migration was almost
fifty:fiftYi but the flow of circular migration was
virtually uni-directional. Out of every ten migrants
nine went to towns and cities.
140
5. The predominance of the circular pattern of
mobility suggests that conventional statistics on
migration and urbanization in Bangladesh, have greatly
underestimated the volume of population movement.
These two processes need to be viewed and measured in
the context of a more realistic definition of movement.
6. Seasonal migration is most closely linked to
the traditional agricultural system and poor transport
conditions. As these two dimensions to rural
livelihood are modernized there has been a change from
seasonal migration to daily movement such as commuting.
7. Traditionally, in many parts of the Third
World, movement for employment is dominated by males
while migration associated with marriage is most common
for females. Yet there are many countries in Asia and
Africa where female participation in economic activities
as well as in movement is fairly noticeable, and above
all, is rising. Perhaps Bangladesh is one of those few
countries where women have been least absorbed into the
civil labour force and in work-related movement.
Furthermore, this pattern is most unlikely to change
very much, especially in the rural areas.
CHAPTER 4
PATTERNS OF COMMUTING AND CIRCULAR MIGRATION
Spatial and temporal dimensions of commuting and
non-seasonal circular migration, the two dominant forms
of internal movement in rural Bangladesh, are examined
in this chapter. Commuting in search of livelihood has
become a part of the daily routine of a large number of
working males living in rural communities. Villagers,
whose primary occupations are not related to farm
activities (such as tradesmen, non-agricultural wage
earners, salary earners, and village artisans) regularly
commute to work outside their home village. In order
to seek additional income, farmers also often
participate in ff-farm work by commuting. In rural
Bangladesh, there is a strong desire among adult males
to have two occupations, one off-farm and the other
usually from farm activities e.g. cultivation of land
(owned or rented) or work as day-labour on another
person's farm.
Variations with respect to the magnitude,
significance and spatial patterns of commuting were
found in the three study areas. Much of the variation
is due to the region's agricultural system (the
intensity of farm activities, cropping patterns, levels
of technology and yields or productivity) and the level
of accessibility to rural and urban off-farm employment.
Given the scanty information in the available literature
142
on the impact of these factors on commuting of
villagers, a comprehensive analysis of this form of
movement is presented in this chapter and in Chapter 5.
Circular migration which predominantly involves
rural-urban migrants, has also become firmly established
in Bangladesh rural life and economy. The increasing
importance of circular migration is associated with
rural overcrowding, improvement in rural-urban
accessibility, the development of rural education, and
the growing dependency of rural families on a dual
income strategy (income from rural and urban sectors).
Most of these factors were discussed in Chapter 2 where
the context of rural-urban migration and urbanization in
Bangladesh is described in some detail.
This chapter is divided into two broad sections.
Section 4.1 presents an analysis of commuting patterns
and processes in the three survey areas, with particular
reference to trends over time and the major movement
streams. In section 4.2 the process of circular
migration is examined with particular preference to the
temporal and spatial characteristics of moves by
villagers in Rampal, Chandina and Sakhipur.
4.1 SPACE-TIME DIMENSIONS OF COMMUTING
Commuting from rural settlements is not a new
phenomenon in Bangladesh, although the space-time
pattern of this movement type has changed substantially
in response to population pressure on rural land and
143
employment, improvements in transportation, the spread
of the urban network, and uneven regional agricultural
development. A great variety of commuting patterns was
found in the three survey areas which, as has been shown
in Chapter 3, are located in regions with distinctive
agricultural systems and transportation networks. In
this section of Chapter 4, the analysis focuses on the
incidence of commuting; directions and destinations of
movement; and the temporal dimensions of these
oscillating movements. The occupational characteristics
of a sample of commuters from Rampal, whose movements to
and from their rural homes were recorded over a 12 month
period, are examined in Chapter 5.
4.1.1 The incidence of commuting
Almost one third (30 percent) of males aged 15
years and over from the survey villages had been
commuters, and 23 percent were still active in this form
of movement from their respective home-village. The
incidence of commuting varied quite markedly from one
study area to another. In Rampal, for example, there
were 41 commuters per 100 males aged 15 years and above,
out of which 36 were still active. The corresponding
figures for Chandina and Sakhipur are 34 (22 active
commuters) and 17 (12 active commuters) respectively.
Given these differential rates, the volume of commuters
also varies considerably among the study areas (Figure
4.1a). The ratio of commuters was approximately 3:2:1
144
for Rampal, Chand ina and Sakhipur respectively.
Rampal and Chandina
The heaviest rates of commuting were recorded in
Rampal, an area which has long had a distinctive type of
'commuter culture' well adapted to the local
agricultural system and interlocked with the broad
network of rural and urban employment markets. These
are described in some detail in Chapter 5. Being close
to major employment centres and obtaining higher yields
from their native farms, Rampalese are less prone to
migrate elsewhere than people from the other study
areas. For this reason Rampal has remained one of the
most densely inhabited rural areas in Bangladesh, and
commuting has become more popular than any other type of
mobility (Table 3.8). In Chapter 5, it is shown how
Rampalese from many different occupational backgrounds
earn part of their annual income through commuting and
another part through local farm-based activities.
Movers from Chand ina also tend to prefer
commuting to other forms of mobility, although the rate
of commuting from here is lower than that from Rampal.
The main reason for this is that unlike Rampal, Chandina
is located quite some distance (60 miles) from the
country's biggest urban and industrial agglomeration
(Figure 1.1). In the absence of an easily accessible
major urban centre here, the commuters mostly travel
between local and regional rural trade-cum-service
centres (haats).
1.45
Very high population densities and intensive
farming also favour commuting rather than long-term
displacement. With the introduction of IRRI varieties
of rice, Chandina gradually moved from being a rice
deficit area to a rice surplus area. At present the
area successfully grows three rice crops, or two rice
and one cash crop (mainly potato) per farm-year (Figure
3.3). In fact, multiple cropping and labour intensive
farming demands large scale farm participation which
fluctuates from season to season, crop to crop, and from
farm job to job (such as ploughing, weeding, harvesting
etc.).
Good crops and a frequently fluctuating demand of
farm-work thus encourage Chandina movers to commute,
which makes it easier to earn off-farm income without
losing one's farm income at home. While interviewing
circular migrants, it was often noticed that a large
number of salary earners, particularly school teachers
and thana level office workers, tended to commute if
they secured a job, or could transfer their existing job
to a place near to their home village.
Sakhipur
A completely different pattern has been
established in Sakhipur where commuting was found to be
one of the least attractive forms of movement to
resident villagers (Tables 3.7 and 3.8). Unlike Rampal
and Chandina, the lack of transportation facilities in
Sakhipur limits the volume and rates of commuting, and
146
in particular it severely restricts the volume of rural
urban commuting (Table 4.1). Another important factor
which discourages commuting from Sakhipur (but promotes
seasonal and non-seasonal migration) is the traditional
agricultural system, especially the ancestral cropping
patterns and less intensive farming techniques.
Generation after generation, Sakhipur farmers
have been growing traditional varieties of rice for
food, and jute mainly for cash. These crops are more
vulnerable to diseases, require long cropping periods,
depend heavily on monsoon rain, and finally give poor
yields. In addition to this, crop failure due to
natural causes such as drought, flood, late rain, heavy
rain, and pest attack is a common phenomenon in and
around Sakhipur. As a result, farmers and farm
labourers are gradually losing their interest. in
agriculture and seeking off-farm occupations, mostly
through a seasonal or non-seasonal migration instead of
regular commuting.
Another factor which obviously deters Sakhipur
people from commuting is the long agricultural slack
season(s) - a characteristic associated with traditional
cropping patterns only. Under this system (which is
now non-existent in Rampal and Chandina), farmers have
little work between the times when crops are planted and
harvested. In this situation a significant number of
part-time farmers and day labourers prefer seasonal
migration especially migration to towns. Seasonal
147
migration is more profitable than being un/underemployed
in their home village, or earning a meagre off-farm
income through commuting to neighbouring markets.
4.1.2 Intra-rural commuting
The significance of rural destinations
Results from the field surveys indicate that
compared with circular migrants, commuters make
different choices with regard to their preferred
direction of movement. The aggregate statistics from
the three survey areas show that around half (53
percent) of all the commuters moved between rural
destinations on their last trip away from home (Table
4.1). Thirty four percent of them went directly to
towns, while the remaining 13 percent of commuters
travelled in both rural and urban directions. The
choice of stream(s) mostly depends on the nature of the
individualrs job and the geographical setting of his
area of origin. On this basis, different patterns of
commuting were found in the three study areas.
The majority of commuters from Rampal (55
percent) chose neighbouring towns as their destination.
In Chand ina and Sakhipur a different pattern was found
to be true. In the latter study area, three-quarters
of the commuters restricted their movements to
neighbouring rural settlements - mainly because the area
is poorly linked with nearby urban job markets. A
significant percentage of commuters from Chandina (25
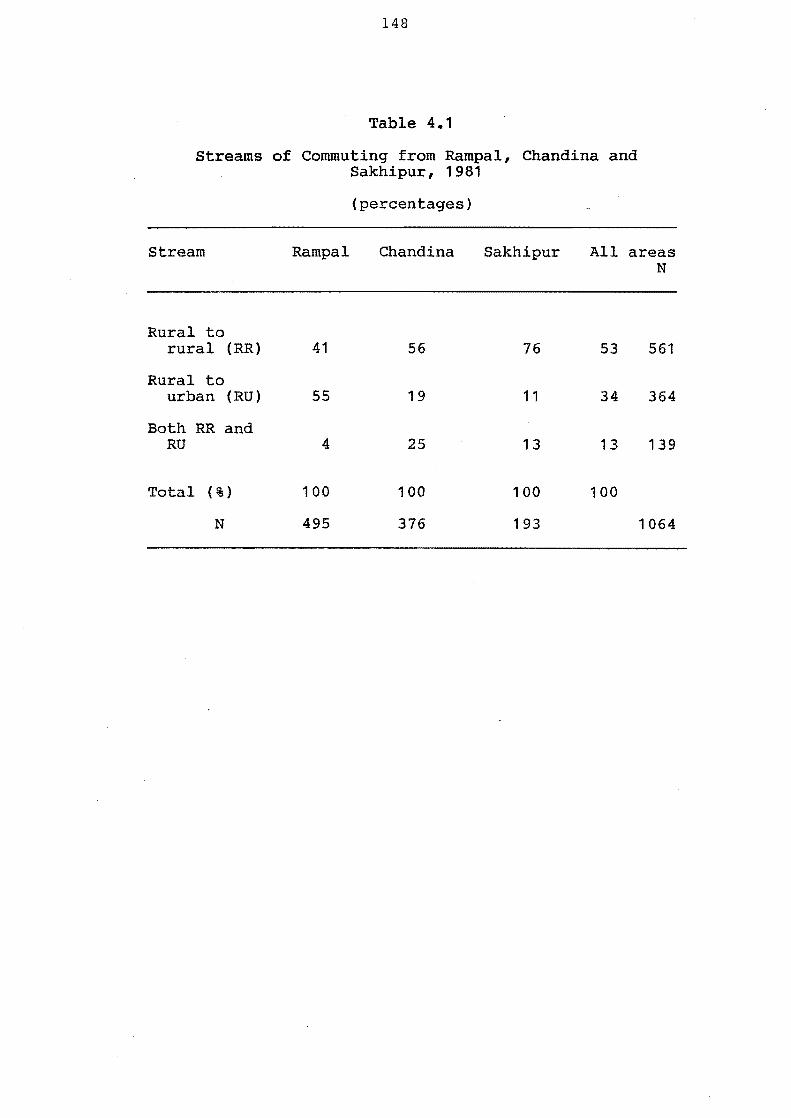
148
Table 4.1
streams of Commuting from Rampal, Chandina and Sakhipur, 1981
stream Rampal
Rural to rural (RR) 41
Rural to urban (RU) 55
Both RR and RU 4
Total (%) 100
N 495
(percentages)
Chandina Sakhipur
56 76
19 1 1
25 13
100 100
376 193
All areas N
53 561
34 364
13 139
100
1064
149
percent) and Sakhipur (13 percent) were also found to
commute to both urban and rural places. They mostly
include rickshaw pullers, auto rickshaw drivers, weavers
and some traders from Chandina, and goat traders, rabi
crop traders and milkmen from Sakhipur (Figure 4.3).
The flow of commuters to and from village
settlements in Bangladesh is deeply integrated into
rural socio-economic life. The spatial organization
of places of human activities in rural Bangladesh
(homesteads, market places, schools, administrative
offices and other service centres) only makes sense in
the context of linkages afforded by commuting. In this
section the spatial patterns of journeys to work which
involve movement over distances of at least two miles
from the commuter's village home are examined. Those
villagers who always work very close to their homes
are excluded. These are mainly full-time farmers and
farm-labourers -a very small group of villagers who walk
less than two miles from their homes to their places of
work (Ali 1980).
Diversity in patterns
The rural commuter's journey to work is directed
mainly to the village markets which playa vital role in
the mobility pattern of traders, village artisans,
salary earners, and non-agricultural workers within
rural areas in Bangladesh (Figure 4.1). Rural to rural
commuters usually move between a number of places at
different locations and distances from their homes.
150
This is particularly evident among the traders, artisans
and others who generally commute to periodic markets
(Figure 5.2b), but is also less commonly found among the
office-workers, school teachers and factory workers who
mostly commute to one destination.
In Rampal, 200 rural commuters made 463 commuting
flows between 20 to 25 destinations (Figure 4.1a). A
flow was counted when a person was found to commute
regularly (daily, weekly or seasonally) to one
particular place for his work. Thus, on average, a
rural commuter from Rampal has more than two (2.3)
commuting destinations. Similarly, a commuter from
Chandina and Sakhipur moves to 4.6 and 4.4 rural
destinations respectively, mostly rural markets.
These findings indicate that the circulation patterns of
Rampal's commuters are less diverse than those of
commuters in the other two survey areas. A large
number of Rampalese, particularly the factory workers,
porters, milkmen and office-workers, usually commute to
one place instead of two or more places like traders.
Commuting to factories and haats
The pattern of destination choices for rural
commuters from Rampal is strongly influenced by the
agglomeration of factories in and near the Kamalaghat
Rikabi Bazar trade centre. This place has evolved into
a semi-urban settlement. Figure 4.1a shows that 60
percent of intra-rural commuting was to that settlement.
Kamalaght-Rikabi Bazar alone attracted 36 percent of the

Figure 4·1 RURAL TO RURAL COMMUTING FLOWS FROM RAMPAL, CHANDINA AND SAKHIPUR, 1981
B
Srioogor •
I RAMPAL
iO 'Ito.,.
I'~ 0>,;>
".917/
2 Kamalaghat;. ::; Maktorpur Rikabi
4Firing; 8azar 5Binatpur 6 Mirkadim
Belko
Ie I
I $AK;"IPUR 2 Sakbpur 3 Tarc:unia 4 Nur 1,1oster 5 Baloe Hoot 6 Char J10nda
• 8hojessor
Burir Haat.
• Damudyo
·Oig;( Par
ACular Char
CHANDINA .Companygonj (b)
::; Korpoi 4 Nimsor 5 Shampu, 6 $remontapur 7 Rommahon
Doudkondi •
~, ~ A ~ ~~\ ~ IRAMPAL
r I .... _} ~ ;a CHANOI NA
I.... \ it 3 S"HIPIJR '-\ \ • J ~~~,; J ...... __ ('_~_,-
.~J ) i) '" (') ;.,~ ,fV~l ';> I
'- r.·! ~ ,f '1..",1 ! I .... ·'s'? r-J .... ..,.(._' .J {O I /,~ ...... ~I" r"" ".i \ '-. I 2a \ / \ ~ \.,.3 ,_'J\ I I " ....... '/ '\.. ,w:. \
W,f"J i ~~~\ \ r rs' Ij.1 ~ 1
? 5,0 I~O ~",,-1 MILES •
a 50 100 ~
~TRfS
.Gouripur
• Hajiqonj
• Rural Hoot (large hinterland)
Murad Nagar o
a Rural Hoot (smaller hinterland J /' "
• Thana Headquarter and.
a Thana Headquarter and 0
• Kamolagho!/Rikabi 8azar LI Olher importanl places
@ Town o Study oreG
/ . "-I five miles \ f dislonce ring \
from the study \ area I \ !
'- / '- --"
• Barura
® Camilla
oLalmai
• Laksam
Number of Commuters -. 150
... * I I 100 50 6-10 uplo 5
o 5 10 miles I ! I
kilometres
f-' U1 f-'
152
total flows. Villagers from a wide range of occupations
commute every day to that centre (Figure 4.2). Milkmen
go to the Rikabi Bazar daily market; traders mostly
follow the same route.
The largest group of rural commuters from Rampal
is wage earners such as factory workers, porters and
rickshaw pullers (Figure 4.3). They commute almost
every day to earn their daily livelihood. Factory
workers and porters mainly work at Kamalaghat-Rikabi
Bazar. Some of them also go to Betka, Mokterpur and
Binatpur factory areas. Rickshaw pullers are seen
around the important rural settlements but most traffic
still goes through the Rampal-Rikabi Bazar road. Salary
earners also make their routine daily movements mainly
towards the above mentioned trade centre and factory
locations.
In Chandina and Sakhipur, rural commuters
predominantly travel to different rural haats for work.
Their destination patterns are largely synchronized with
the haat-day cycles of those markets. This pattern has
changed in Rampal with the rise of Kamalaghat-Rikabi
Bazar trading centre which remains open seven days a
week instead of following any weekly meeting schedule
as with village markets. However, a significant
proportion of rural commuters (around 40 percent) from
Rampal still moved to different village markets.
Frequency of moving
Generally, commuters working at village markets
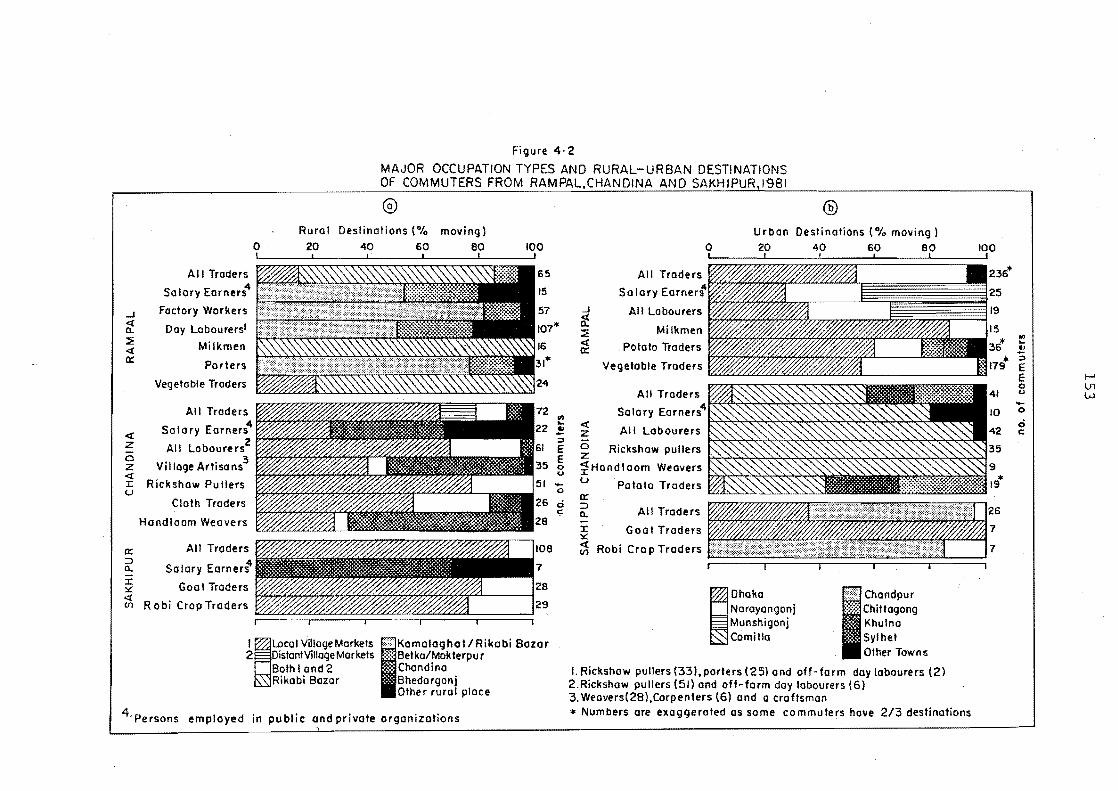
Figure 4·2
MAJOR OCCUPATION TYPES AND RURAL-URBAN DESTINATIONS OF COMMUTERS FROM RAMPAL,CHANDINA AND SAKHIPUR,1981
@ ®
..J <t a. :E <t 0::
<t Z o z
Rural Destinations (% moving) o 20 40 60 80 100 I !
All Traders P7777:?'77::t\: '" \ '" \ \: <: \ " \: \: " '( '" " " " " < < \: \: \: , ( " <P.·~;y_· ... ___
Salary Earners" ~i&B~i.~~ Factory Workers
Day Labourersl
Milkmen
Porters
Vegetable Traders
All Traders ~ I " Salary Earner~ ~~~55~
All Labourers
Village Artisa ns3 Ff?«f)g{{~y{/~n,,:1§
:2 Rickshaw Pullers u
0:: ::l a. J: ~
Cloth Traders
Handloom Weavers V/J/J/C/b"'L&Z<1 rill:
All Traders
Salary EarnerSl
Goat Traders r~~~~;UY*Y:hf17~Y70" ~ R obi Crop Traders v/////£////J////L///////L///////C///J.(C?d
I 2
I
Local ViIJageMorkets 10' Kamaloghot / Rikabi Bazar ntVillageMorkets :;:;: Betka/Mokferpur
Ih I and 2 Chandina Rikabi Bozor Bhedargonj
Other rural place
4'Persons employed in public and private orgonizations
o c:
Urban Destinations {% moving} o 20 40 60 eo 100
..J
rt :E <t 0::
" " t T77})} }») ;}»);;7777 177I771Zi') 7:)') A
Salary Earne
Vegetable Traders WZU'//////{(///V///I//(a/(///t1 "'=1
All Traders
Salary Earners"
~ All Lobourers ~~~~~~~~~~~~~~~~~
~ Rickshaw pullers ~:"'::"N~"""'~~"""'~~~~~N~~~""2'~""2''<i'i ~Handloom Weavers
U Potato Traders '"'~~~~~~~
0:: ~~~~~~~~
:J a. J:
~ Robi Cra p Traders ~~M~~'~~~'I'~'~!~::~
~Dhaka Narayangonj Munshigonj Camillo .I~I~:~",
I. Rickshaw pullers (331,porters (25) and off-form day labourers (2) 2.Rickshaw pullers (50 and off-farm day labourers (6) 3. Weavers(28),Carpenters (6) ond a era ftsman * Numbers ore exaggerated os some commuters have 2/3 destinations
on t:; :; E E o u -o
o c
I-' U1 W
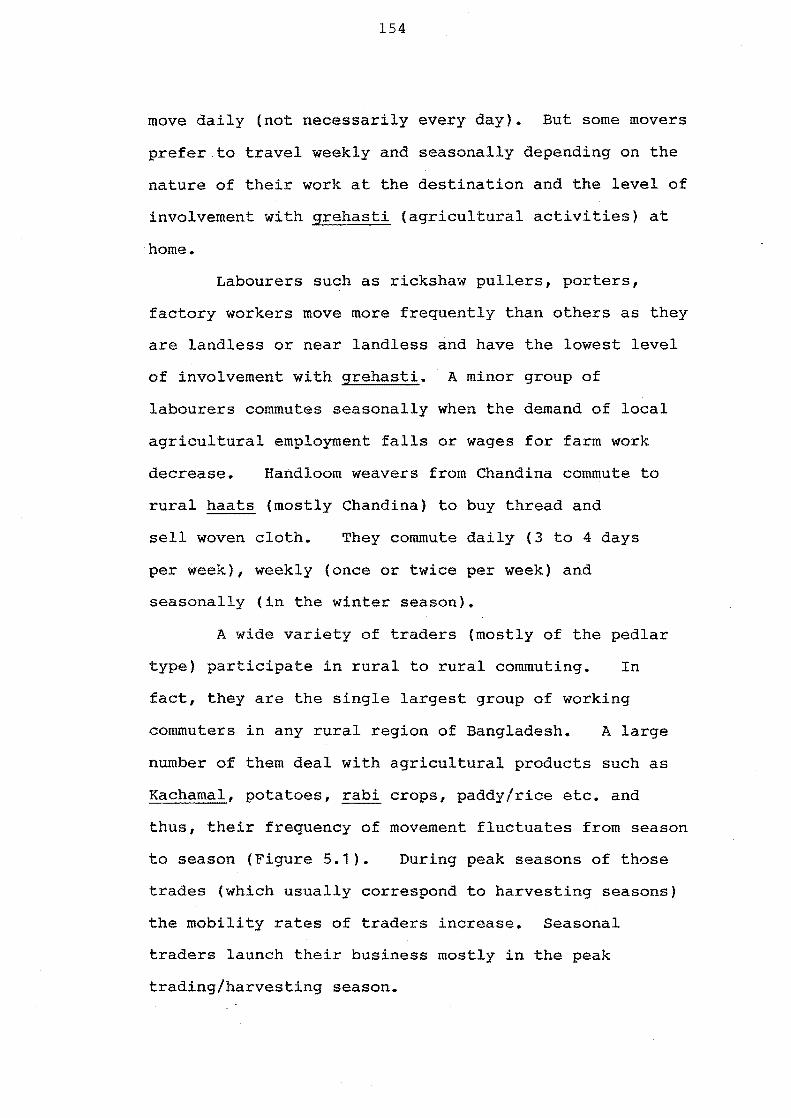
154
move daily (not necessarily every day). But some movers
prefer.to travel weekly and seasonally depending on the
nature of their work at the destination and the level of
involvement with grehasti (agricultural activities) at
home.
Labourers such as rickshaw pullers, porters,
factory workers move more frequently than others as they
are landless or near landless and have the lowest level
of involvement with grehasti. A minor group of
labourers commutes seasonally when the demand of local
agricultural employment falls or wages for farm work
decrease. Handloom weavers from Chandina commute to
rural haats (mostly Chandina) to buy thread and
sell woven cloth. They commute daily (3 to 4 days
per week), weekly (once or twice per week) and
seasonally (in the winter season).
A wide variety of traders (mostly of the pedlar
type) participate in rural to rural commuting. In
fact, they are the single largest group of working
commuters in any rural region of Bangladesh. A large
number of them deal with agricultural products such as
Kachamal, potatoes, rabi crops, paddy/rice etc. and
thus, their frequency of movement fluctuates from season
to season (Figure 5.1). During peak seasons of those
trades (which usually correspond to harvesting seasons)
the mobility rates of traders increase. Seasonal
traders launch their business mostly in the peak
trading/harvesting season.
III ....
50
40
'" ::> E 30 E o
u _ 20 o
o z 10
Figure 4· 3
MAJOR OCCUPATION TYPES OF COMMUTERS BY STREAM, FREQUENCY AND VOLUME OF COMMUTING FROM RAMPAL, CHANDINA
CHANDINA 0:: 0::
0:: a::
AND SAKHIPUR. 1981
Stream R R: Rural fa Ru ral
RU: Rural to Urban
RRU: 80th RR and RU
Frequency
= Doily Weekly Seasonal
I. Persons employed in public and private organizafions
RAMPAL
50
40
30
20
:::l
rlGO 0:: • 150
140
130
120
110 III
... '" :l
60 E E 0 u
50 0 0
40 z
30
20
10
o I Wl'//tI !(/LA rIO! ULV/! rO'VL'(lLD1 rurl'l"! V/Y/4 rE/yLA V/A [//V£A y1/V/6//J y/rYE4LrJ 0 Rickshaw Handloom Fabric All Other Pullers Weavers and Clothes Traders
Traders
Milkmen Rickshaw Porfers Factory Salary Pullers Workers Earners!
Kochamal Troders
I-' U1 U1
156
After the village markets, the thana is the
second most attractive destination for rural to rural
commuters. This particular administrative centre
mainly attracts salary earners (Figure 4.2)i and the
centre offers a small number of jobs to the local
commuters. One obvious reason is that most of the
official staff at thana centres are non-local people
(i.e. migrants) as they are usually recruited from other
thanas or districts. In addition, the number of thanas
within the rural areas is very small (less than 400)
compared with the number of village markets (which
number more than 6500).
Distances travelled and transport
Characteristics of the various distances
traversed by commuters to rural areas from Rampal,
Chandina and Sakhipur are summarized in Table 4.2. The
median distance of commuter travel found in the three
survey locations was approximately three miles and the
mean distances were 3.90, 4.91 and 4.16 miles
respectively. The majority of flows take place within a
five mile radius of the commuters' home.
A comparative picture shows that Chandina
commuters travel slightly longer distances than the
commuters from the other two areas. The difference is
mainly due to better transport which makes it easier for
a Chandina commuter to go up to 10 to 12 miles for work.
Besides walking, a commuter from Chandina can travel to
local and distant village markets by rickshaw and some

157
Table 4.2
Distribution of Intra-rural Commuting Flows from the Study Area(s) by Distance
(Cumulative percentages)
Distance Rampal Chandina Sakhipur All areas (in miles) No. of
Flows
2 - 3 65 52 49 54 1066
4 68 61 65 64 189
5 77 65 83 73 186
6 86 83 84 84 217
7 86 83 97 88 76
8 94 85 97 91 56
9 95 93 97 95 84
10 95 95 97 96 17
1 1 - 15 97 95 99 97 22
15+ 100 100 100 100 64
Total Flows 463 951 563 1977
Median Distance 3 3 3 3
Mean Distance 3.90 4.91 4.16 4.48
SD 2.42 4.02 2.44 3.31
cv 61 .89 81 .01 58.75 74.06
No. of rural commuters 200 206 129 535
No. of destinations per commuter 2.31 4.61 4.36 3.69
158
important markets by bus. The latter mode of transport
makes Daudkandi, Companigonj, and Laksam, for example,
accessible to daily commuters (Figure 4.1). Rampal and
Sakhipur rural commuters mostly travel short distances,
mainly due to the lack of rural bus services. Rampal
has rickshaw transport for rural commuting; but in
Sakhipur, commuters solely depend on walking.
The variation in commuting distances depends
greatly on the types of transport available to the
movers. Commuters from most occupational and economic
backgrounds walk to work due to the lack of modern
transport between village residences and rural markets.
Privately owned transport, such as bicycles and motor
cycles, is rare as the villagers are generally poor.
In the 14 study villages, less than five percent of the
813 commuters owned a bicycle. This particular vehicle
is unsuitable for the pedlar type of traders who
comprise the single largest group of commuters working
at different haats. There are also substantial
differences in the quality of rural roads (for different
vehicles) from region to region and from season to
season.
4.1.3 Rural-urban commuting
The flows of commuters between the study villages
and urban settlements were restricted to a dozen towns,
of which six received merely a fraction (5 percent) of
the total flow. The relative share of commuting flows
received by various towns from Rampal, Chandina and
159
Sakhipur is shown in Figure 4.4. During the period of
field research, 374 active commuters (236 from Rampal,
108 from Chandina and 30 from Sakhipur) were found to be
commuting to towns and a total of 481 townward flows
were recorded for these people. Obviously some
commuters, who were found to commute to more than one
urban centre, made two or more flows each. Rampal,
being close to the country's biggest urban agglomera
tion, generated 64 percent of all the urban flows
recorded. Chandina and Sakhipur shared 28 percent and 8
percent respectively.
The major destinations
Rampal and Chandina have a better rural-urban
commuting network than Sakhipur, which is poorly linked
to Chandpur and Dhaka towns. Chandina has a wider
network of commuter linkages, but still the largest
number of urban flows (72 percent) ended up in Comilla,
the nearest town to the area. Chittagong, Sylhet and
Dhaka received 12 percent, 6 percent and 4 percent of
the total flows respectively. The study found three
main urban centres frequented by Rampalese commuters.
Dhaka, the capital, attracted 47 percent of the total
urban flows from Rampal. Narayangonj received 37
percent and Munshigonj accounted for 11 percent. A
small number of commuters (mainly potato dealers) from
Rampal as well as from Chandina, were also found to
commute infrequently to distant urban centres as shown
in Figure 4.2b.
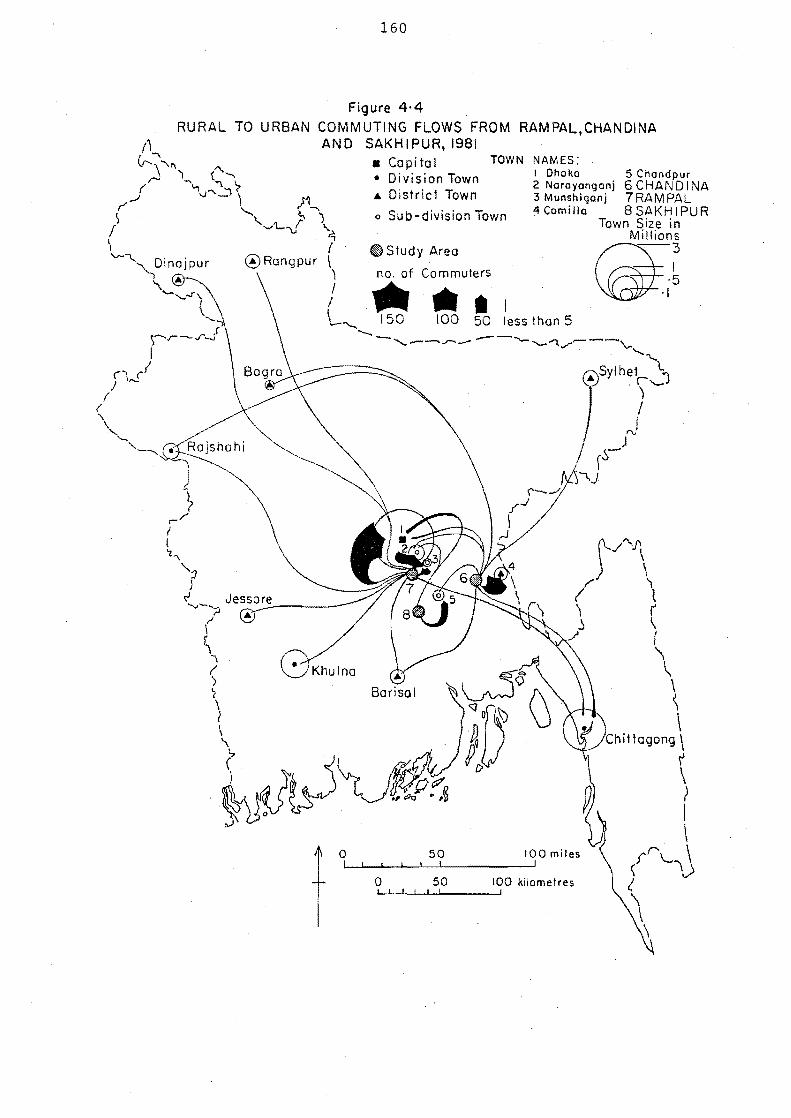
160
Figure 4·4 RURAL TO URBAN COMMUTING FLOWS FROM RAMPAL,CHANDINA
AND SAKHIPUR,1981
t 0 I
• Capitol • Division Town ... District Town
TOWN
o Sub-division Town
~Study Areo
no. of Commuters
•
NAMES: I Dhaka 2 Naroyonganj :; Munshiganj ~ Camillo
5 Chondpur 6 CHANDINA 7RAMPAL 8SAKHIPUR
Town Size in Millions
~~ -5
-I
150 *. I 100 50 less than 5
50 I
(\",,/\1',
r) \ ( \ 1 (
\ ( \
100 miles I
~ \ \ \
ittagong \
r \ t I \
rr-\... \
0 50 100 kilometres <; -\)
I. 1 I I I ! .......... -'-..L..-1-'-__ --',
\ \
161
The lower level of commuting to towns from
Chandina and Sakhipur was found to be determined mainly
by distance and transport conditions. The number of
towns within a reasonable daily commuting distance
(usually 10 - 15 miles) from these two rural areas, is
very small. In fact, only Comilla and Chandpur are
within this distance of Chandina and Sakhipur
respectively. The bulk of the urban commuting flows
from Chandina and Sakhipur stopped at these two towns.
Other towns (including Dhaka and Chittagong
cities) which have fewer commuter connections with those
two rural communities, did not attract substantial
numbers of commuters only because of distance. Further
analysis of data shows that long-distance commuting
trips were mostly made by a few wealthy business
commuters. In Chandina, inter-district potato
traders/dealers are of this kind. They commute to
different potato-storing centres from season to season
(Figure 3.3) and to different towns from time to time
for marketing potatoes to dealers/wholesalers. In
Sakhipur, long distance urban commuters are mainly goat
traders and a few vegetable traders and milkmen.
Economically, the former group is better placed than the
latter groups.
Long-distance commuting
The process of long-distance urban commuting from
Sakhipur was found to be different to that in Chandina.
In Sakhipur, almost all long-distance urban commuters

162
were destined for Dhaka city. Goat traders regularly
commuted to Dhaka once a week to sell goats to urban
butchers. The rest (of the days) of the week, they
commuted to different rural haats where they bought
goats directly from the individual owners. Vegetable
and milk traders usually commuted to Dhaka during winter
months (November to February) when Sakhipur produces
surplus vegetables and milk.
Both these groups of commuters work separately,
forming a gang of a few fellow commuters. A vegetable
trading gang consists of (vegetable) buyers and
suppliers - who change their job by rotation. The
buyers commute to different rural haats daily and buy
vegetables from the growers. Suppliers, on the other
hand, carry the goods to Dhaka city market where they
sell it to urban Kachamal dealers. Following the same
process, a milk-trading gang buys milk from rural
markets and supplies it to the Dhaka urban market.
This process of rural-urban commuting has
been developed recently by vegetable traders and milkmen
in Sakhipur. By forming a gang or partnership, the
commuters are now able to move to a distant city market
daily. In addition to this, the act of partnership has
enabled them to reduce transport costs and to increase
their capital investment. Obviously, the process has
evolved mainly due to the long distance and slow-speed
transport that has been present between Sakhipur and
Dhaka city. Given the better rural-urban transport
163
linkages, Rampal has established a different process of
rural-urban commuting (discussed in chapter 5), where
individual vegetable traders or milkmen rather than
groups commute daily between Rampal and Dhaka
Narayangonj urban markets.
The case of Rampal
In Rampal, rural-urban commuting flows showed a
different pattern (Figure 4.4). Ninety-five percent of
the commuters had one of three towns (Dhaka, Narayangonj
and Munshigonj) as their destination. The pattern of
flows to those towns apparently indicates that the
volume of commuting is positively correlated to
distance. For example, from 18 miles away, Dhaka
attracted 47 percent of Rampal urban commuters.
Narayangonj, eight miles apart from Rampal, received 37
percent of the commuters. Only 11 percent of the
commuters went to Munshigonj - an adjacent town (3 miles
distance) to Rampal.
Closer inspection of the data revealed that this
pattern has evolved under certain conditions. Firstly,
although the three towns lie widely apart, they are
located within the daily commuting radius of Rampal.
Secondly, city size and functions largely influence the
commuters r choice of destination. Dhaka, a multi
functional capital city has already attained a
population of almost four million. Narayangonj, an
industrial, commercial and administrative city with a
population of nearly 300,000, attracts various commuters
164
from Rampal every day. In comparion to those cities,
Munshigonj is a slow growing town with a population
of only 40,000. The town has been developed primarily
as an administrative centre (sub-division headquarters)
and has very little commercial attraction. Thirdly,
cheap water transport between Rampal and Dhaka
Narayangonj cities (via Katpatti), makes commuting
profitable to the Kachamal pedlars, milkmen and other
daily movers.
occupation and destination
A comparative picture of commuting patterns
showing stream, frequency and volume of movement of
major occupation groups found in the three study
locations, is given in Figure 4.3. In Rampal, urban
commuters have opted for a wide variety of occupations
such as Kachamal trade, milkmen, rickshaw pulling and
service in offices and factories. Each of these
occupation groups has developed a distinct type of
commuting pattern which is analysed in depth in Chapter
5. The pattern of destination choices also varies from
occupation to occupation (Figure 4.2). Generally, the
commuters with trade and business interests (except some
potato traders) prefer to commute to Dhaka and
Narayangonj cities. Salary earners, likewise, tend to
commute to Munshigonj, Narayangonj and Dhaka towns.
Commuters who deal with potatoes tend to move to
neighbouring towns as well as to distant urban centres.
Apart from Dhaka/Narayangonj cities, Rampal traders
165
travel as far as Chittagong, Khulna, Barisal and major
towns in the North Bengal region - where they supply
potatoes regularly on demand. Chandina traders mostly
go to the towns of Comilla, Chittagong and Sylhet for
supplying as well as for storing purposes.
Rampal vegetable traders mostly commute to towns,
especially Dhaka and Narayangonj. In fact, vegetable
traders from Rampal never commute to Munshigonj which
usually gets vegetables from adjacent villages. Dhaka
receives more vegetable traders from Rampal than
Narayangonj (Figure 4.2). However, further analysis
revealed that small traders tend to commute to
Narayangonj mainly because of the short distance, and
that big traders prefer to go to Dhaka to make a better
profit.
Vegetable farmers who usually take produce to
towns are more likely to go to Narayangonj so that they
can return home quickly and take part in farm work.
However, some days (mostly in winter) when they harvest
in bulk, they are more likely to commute to Dhaka city
market to sell their vegetables at a better price.
Vegetable traders are often considered as daily movers,
but in Rampal a proportion of them were found to make
their movements weekly (9 percent) as well as seasonally
(16 percent.). The latter group commute mainly during
winter time when Rampal grows vegetables more
extensively than during other seasons.
Weekly traders move two ways. One group, mostly
166
vegetable farmers, go to town once or twice per week.
The other usually stays in town (where they run their
vegetable business) and visit home every week. They are
permanent to quasi-permanent vegetable traders.
Bi-directional commuting
In Chandina and Sakhipur, a town-going commuter
was often identified as a bi-directional mover - one who
usually commutes to town as well as to rural areas.
Generally he moves to town weekly or twice a week and to
neighbouring rural destinations daily (not necessarily
every day). This particular process of commuting is
widely established among rickshaw pullers, weavers, and
cloth traders in Chandina and goat traders and rabi crop
traders in Sakhipur.
Analysis of this process revealed that rural
urban transport friction (such as long distance,
infrequent service, slow speed, higher cost of
transport) is inversely related to the frequency of
their movement. The higher the friction the lower will
be the frequency of commuting. Sakhipur goat traders,
for example, commute to Dhaka once per weeki but rabi
crop traders go to Chandpur twice per week. Another
example is RRU (rural to rural and rural to urban)
rickshaw pullers. In Chandina, they usually prefer to
commute to Comilla town weekly (once or twice per week)
rather than daily. Obviously this pattern indicates
their tendency to avoid daily long distance rickshaw
167
pulling at the cost of their health.
Chandina has large numbers of hand loom weavers
and cloth traders (fabrics and clothing). A
significant number of them travel weekly to the town of
Comilla. Their pattern of commuting is partly
influenced by rural-urban transport friction, but is
mainly synchronized with local rural market cycles and
the weekly haat day at Comilla town.
Weekly commuting is popular among the weavers in
Chandina. The entire group of weavers moving between
rural and urban areas are, in fact, genuine weekly
commuters (Figure 4.3). A few of them commute during
winter weeks of the year. The RRU weavers and cloth
traders commute to town weekly along with their routine
daily movement to rural haats.
Commuting of salary earners
In both Rampal and Chandina, town-going salary
earners were all found to commute to neighbouring towns.
The number of commuters in this occupation category has
been increasing with the improvement of rural-urban
transport. Given Rampalts better rural-urban transport
network, the majority of salary earners (65 percent)
commute between village and town. Nearly 45 percent of
these town-going commuters went to the nearest town -
Munshigonj. The rest moved to Narayangonj and Dhaka
cities. In Chandina, urban-destined salary earning
commuters mostly went to Comilla. A few of them
also commute to Mainamati cantonment (a satellite town
168
of Comilla). In Sakhipur, salary earners were found to
be unable to commute to town as the area, up till now,
remains relatively isolated from urban centres
for daily movers.
The frequency of commuting by salary earners
varies geographically. Rampalese are more likely to
commute daily. Chandina movers, by contrast, tend to
commute weekly (Figure 4.3). This pattern has
developed as a result of differential levels of distance
friction. For example, commuting to towns from Rampal,
is cheaper, easier and involves shorter distances than
commuting from Chandina. Weekly commuters from both
Rampal and Chandina usually stay at their destinations
(towns) and visit home most weekends as well as on
holidays.
4.2 SPACE-TIME DIMENSIONS OF CIRCULAR MIGRATION
There are two distinct types of circular
migration - seasonal and non-seasonal (i.e. regular).
The latter is widely practised and is the dominant form
of internal migration in the country (Tables 3.7 and
3.8). This section is concerned with non-seasonal
circular migration. Since the end of colonial rule in
India in 1947, the migration trends and patterns in
Bangladesh have changed. A brief account of these
changes was presented in Chapter 2. The analysis here
focuses on the contemporary trends, patterns and
variations in circular migration in the study areas.
169
4.2.1 The incidence of circular migration
It was established in Chapter 3 that circular
migration is the second major form of movement by
working males from rural areas (Tables 3.7 and 3.8).
Following commuting, it draws a large number of people
from different occupation and economic backgrounds away
from their villages. Among adult males aged 15 years
and above, the rates (per 100 people) of circular
migrants recorded in Rampal, Chandina, and Sakhipur were
26, 17 and 23 respectively. Rampal, with its proximity
to the largest urban agglomeration, had more circular
migrants than the other two areas. But the region did
not show such a difference in number of male migrants
from the other two areas, as was the case with
commuters.
The rate of circular migration from one study
area to another varies less significantly than the rates
of commuting and seasonal migration. There are two
main reasons for this. Firstly, it is evident that the
magnitude of commuting and seasonal migration largely
depends on the intensity of farm activities and
transport conditions. These two variables have less
impact on the flow of circular migration. Second, as
Bangladesh is a very small country, villagers from
various parts of the country are able to migrate to
towns within a small range of distances.
Chandina and Sakhipur
Residents in Chandina recorded a lower rate of
170
circular migration than was found in either Rampal or
Sakhipur. One reason for this is that in Chandina,
like Rampal, commuting acts as a substitute for
migration. Another cause of the relatively low
migration rate in Chandina is the impact of agricultural
development, especially increases in productivity of
land and intensity of cultivation through application of
the HYV technology. As a result, villagers who have a
substantial amount of land might have been less
interested in migrating elsewhere. Such an attitude
among the landowners in Chandina was often mentioned
during surveying. A study from another part of
Bangladesh also argued that improvement in agriculture
and the resultant incr.ease in local job opportunities I
seems to reduce the propensity to migrate (Chaudhury
1978a).
A different pattern of mobility was found in
Sakhipur survey villages. Here circular migration
rather than commuting was more prevalent. In this
particular area, both seasonal and non-seasonal
migration have become almost equally important. This
pattern has evolved mainly due to the limited scope for
frequent short-distance movement (i.e. commuting) in
and around Sakhipur. As the region is not suitable for
HYV technology, and lacks good transport, villagers
from different walks of life are forced to migrate to
earn the total or part of their annual household income.
171
Recent upsurge in circular migration
Chapter 2 has reviewed the historical background
of internal migration in Bangladesh, and it was noted
there that the rapid increase in rural out-migration for
livelihood is a recent phenomenon in this part of the
world. Similar trends were also observed in the
present study areas. The level of out-migration was
very low up until the end of the 1950s; gained momentum
during the 1960s; and finally the level reached a
launching-stage in the early 1970s. Since then,
migratory flows of working males from rural areas have
continued to increase rapidly.
Similar patterns will be found at the urban end
if urban in-migration trends are examined through time,
as rural out-migrants are predominantly oriented towards
cities and towns. One recent study (Centre for Urban
Studies 1982, 51), for example, has focused on Dhaka
City in-migration patterns, and the findings largely
correspond to those found in the rural areas.
4.2.2 Streams of circular migration
Data from each study village indicated that
circular migrants from rural regions are overwhelmingly
oriented towards urban centres. On an average, out of
ten migrants, nine went to cities and towns (Table 4.3).
A similar picture has also been found in several other
studies concerned with internal migration and/or
urbanization in Bangladesh (Chaudhury and Curlin 1975,
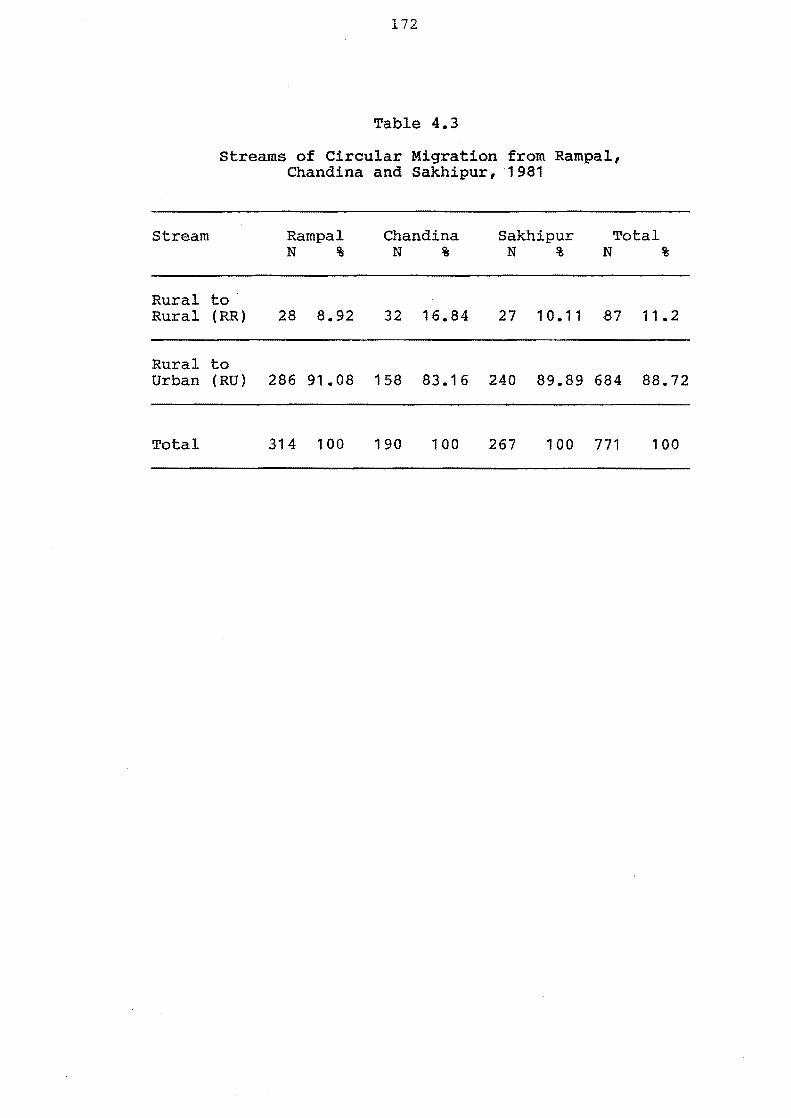
stream
Rural Rural
Rural Urban
Total
172
Table 4.3
streams of Circular Migration from Rampal, Chandina and Sakhipur, 1981
Rampal Chandina Sakhipur Total N % N % N % N %
to (RR) 28 8.92 32 16.84 27 10.11 87 11 .2
to (RU) 286 91.08 158 83.16 240 89.89 684 88.72
314 100 190 100 267 100 771 100
173
Khan 1982). The driving force behind this rural-urban
drift is the fact that the scope for inter-rural
migration for employment in Bangladesh has gradually
been diminishing.
Intra-rural circular migration
The opportunity for intra-rural migration of
people, especially peasants, in Bangladesh was severely
constrained when the country separated from India in
1947. During the last three decades the situation has
deteriorated further due to increased population
pressure. As was noted in Chapter 2, there has been a
stabilisation of inter district 'lifetime' migration
within the rural areas, and it is not surprising that in
each study area a small number of rural migrants was
recorded.
It is apparent from Table 4.3 that only 10
percent of all circular migrants moved to rural destina
tions. The rate varies from 9 percent in Rampal to 17
percent in Chandina. Village markets and the thana
centres, attracted almost two-thirds of the rural
migrants. The remaining one-third moved to different
rural places and service centres.
It appears likely that a significant proportion
of rural to rural migration, especially moves oriented
towards the big markets and/or important thana centres,
will be regarded as rural to urban (or semi-urban)
movement in the near future. Many thana centres and
rural markets with electricity and a few other urban
174
facilities have been redefined as urban localities by
the recent census (Census 1981, p.36). If one uses the
latest census reclassification of urban places, the
number of rural to rural migrations is reduced further
by a considerable degree.
Rural-urban circular migration
As already indicated, circular migration from
rural areas in Bangladesh is essentially a rural-urban
movement, undertaken mainly by the non-farm population
(Figure 6.6). In the three study locations 90 percent
of the migrants were found to move towards cities and
towns, and this ratio varied from the 91 percent in
Rampal to 90 percent in Sakhipur and to 83 percent in
Chandina. Dhaka city alone has attracted nearly half
(43 percent) of the total rural-urban migrants. The
other important urban destinations are Chittagong,
Narayangonj, Comilla and Khulna cities (Figure 4.5).
In combination, these major town (including Dhaka) have
attracted two-thirds of the migrants.
The magnitude of attraction of a town is more
likely to depend on its population size and structure of
functions (Figures 4.6 and 4.5) than any simple
distance-decay function. On the other hand, the
migration field of a region depends mainly upon the
characteristics of the migrants (Chapter 6) and external
transport linkages of that region.
The destination patterns of the migrants varied
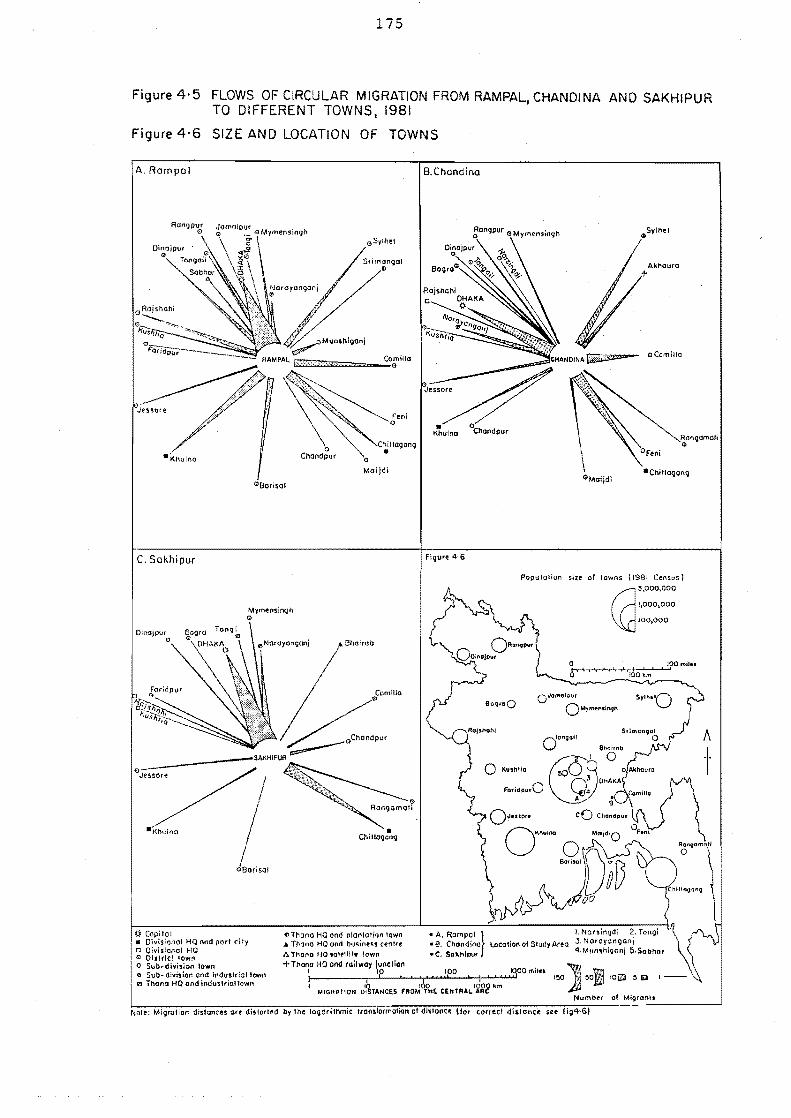
175
Figure 4·5 FLOWS OF CIRCULAR MIGRATION FROM RAMPAL, CHANDINA AND SAKHIPUR TO DIFFERENT TOWNS, 1981
Figure 4·6 SIZE AND LOCATION OF TOWNS
A, Rompol
~/'J ..•.....
'.\::;:.
-..
o Chondpur
"'Borisol
C, Sakhipur
o
Feni o
Chitlagong •
Maijdi
B.Chondina
:ongpur '" Mymensinqh
mCo-millo
Populolion size of lawns i 1981 Census l
Myfn~nsjn(Jh Q ca
3,000,000
',000,000
JOOJOOO
A Bhoirob
t---+-I T, .., •• -r ........... '.,,±'~' ~, ~,~j90 mile I "IOO'km
ComiUo . '"
. ~ .. "
Soq,cO OJ<J.fftOI4ll<.H SYlhtlO o MytM"sinqh
__ ------SAKHIPUA :::;...----
.~ aKhuino
08llr;sal
~ Copitol • Divisional HQ and port city a Oivisional HQ e Olttrfct tOwn o Sub-divi,jon lown o Sub- division and lf1dustf'iollown ~ Thona HQ and indusldal10wn
., TMna HQ ond plOnlOlion lown • A, Rampel } I. Norsingdi 2: Tongi .. Thana HO and bus;n ... cenfre • 8, Chandino Location of Study Area 3, Noroy~ng?nl h Thona flO 101.tlllo lown -C, SOkhlour 4,MIIO'"'Qonl :;,SQbhar
+Thana HQond toilwa) Junction 000 ' ], I I 10 100 I mil.. I;, \i'~
.. IGROrlOH DI~T.'HCES ·fA~J';!,f.:: ~~HTAA~I~~8:~ 1 .. I 100(1 50,P\
Nvmotr or MiQronlJ
Note: Migration distances are distorted by the lo~orithmic Itansformolion of distance Ifor eorrect dislonce se. fig4'G)
176
further with respect to the distance of migration. It
is evident that numbers of long-distance migrants from
the three study areas in general, and from Sakhipur
region in particular, are very small. One obvious
reason for such a pattern is the relative location of
these three areas. As shown in Figure 4.6, the areas
are located near the centre of the country and are not
far from the country's three major metropolitan cities
namely Dhaka, Chittagong, and Khulna. In Sakhipur,
poor transport is also partly responsible for the
region's low incidence of long-distance circular
migration.
It is evident that the migrants who live far away
from their places of origin are more likely to have a
permanent type of salaried job in public and private
sectors. Temporary employees, wage earners, and low-
income self-employed migrants very often cannot afford
to bear long-distance transport costs, and thus they
always look for employment at relatively short distances
from their village homes. The characteristics of
migrants are discussed in greater depth in Chapter 6.
4.3 CONCLUSION
This chapter has outlined the major patterns of
commuting and circular migration originating in the
three study areas. It is evident that the patterns and
processes of commuting of a rural region are strongly
tied up with the region's agricultural patterns and the
177
spatial organization of its neighbouring rural markets,
thana centres, and towns. Circular migration from
rural regions is now mostly oriented towards towns, and
thus the movement patterns of the migrants are firmly
influenced by the country's level and pattern of
urbanization.
The major features of the space-time patterns of
commuting and circular migration can be summarized as
follows:
1. The proportion of commuters in the population
varies significantly from one area to another. The
difference is mostly related to the agricultural system
in the area, and the accessibility of places in the
region to local and more distant towns. In the case of
circular migration there was much less variation between
areas in the incidence of movement. This is mainly due
to a reduction in intra-rural migration opportunities
with rising population densities and the deteriorating
economic position of most rural residents.
2. Most commuter trips by village people are
oriented towards neighbouring rural destinations.
Nevertheless, this pattern has been changing in almost
all rural areas in Bangladesh, and in those villages
which are close to the big urban centres (such as
villages in Rampal area), rural-urban commuting has
become or is becoming more important than the rural to
rural stream. In the case of non-seasonal circular
migration, the great majority of moves are directed
178
towards urban areas.
3. Distance acts as a definite deterrent to
commuting in most situations. In Bangladesh the
elasticity of distance with relation to volume of
commuting indicates that the village commuters generally
travel a very short distance (Table 4.2 and Figure 4.1).
This may be the result of several factor~ such as the
poor condition of transport systems, compactness of
rural settlements, and the villagers' resulting greater
dependence on walking. The relationship between
distance and volume of circular migration is less
obvious in the three study areas. This is partly a
function of the locaion of these areas in relation to
several of the nation's major urban centres. Long-
distance circular migration was less common from areas
with comparatively poor transport infrastructure.
4. Generally, the intensive cultivation of
marketable products and easy access to different markets
accelerates the commuting rate of rural people,
especially those who are associated with farming and/or
trading of farm products. It is also evident that
improvement in agriculture through use of HYV is
discouraging long-term (e.g. seasonal migration) to
farmers and farm workers in Rampal and Chandinaj
whereas the low intensity of agricuture in the Sakhipur
region is promoting seasonal migration. Thus, it can
be said that in an agrarian country like Bangladesh,
where the vast majority of villagers still depend on
179
agriculture for a livelihood, the high rate of commuting
of rural people is positively correlated with the
intensity of agricultural activities.
CHAPTER 5
COMMUTING TRIPS : A CASE STUDY
In this chapter the daily journeys of commuters
in different occupation groups are examined using
information collected from a sample of villagers in the
Rampal study area. Data were recorded using the
prospective mobility registration technique (Table 1.1,
stage 3) pioneered in some recent studies of internal
population movement in Southeast Asia and Melanesia
(Chapman 1970; Mantra 1981; Singhanetra-Renard 1981).
Over a 12 months registration period from June
1981 to May 1982, 8651 commuting trips were recorded for
40 men selected randomly from commuters of different
occupational groups (Table 5.1). Each trip involved
two moves - travel to place(s) of work and the return
home. As has been noted previously, in the context of
rural settings in Bangladesh, a trip is recorded when a
person moves to his workplace(s) which is/are located at
a minimum distance of two miles from the commuter's
village residence. Two aspects of commuting are
examined here: the seasonal rhythm of movement and the
distances travelled by people in the different
occupation categories.
5.1 SEASONAL PATTERN OF COMMUTING
Figure 5.1 shows temporal variations in commuting
trips for different occupation groups. Among the daily
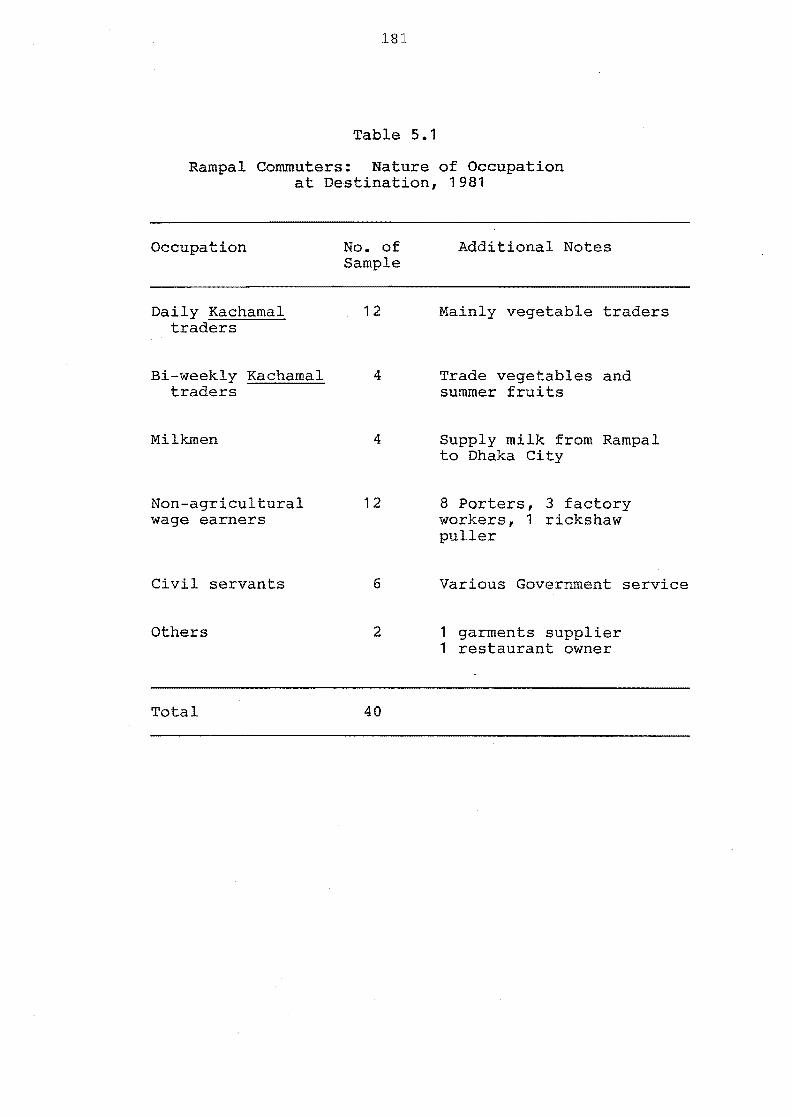
181
Table 5.1
Rampal Commuters: Nature of Occupation at Destination, 1981
Occupation No. of Sample
Daily Kachamal 12 traders
Bi-weekly Kachamal 4 traders
Milkmen 4
Non-agricultural 12 wage earners
Civil servants 6
Others 2
Total 40
Additional Notes
Mainly vegetable traders
Trade vegetables and summer fruits
Supply milk from Rampal to Dhaka City
8 Porters, 3 factory workers, 1 rickshaw puller
Various Government service
1 garments supplier 1 restaurant owner
182
commuters, milkmen move about most frequently. Their
average frequency of commuting trips per week, per
month, and over the study year - are 6.4, 28 and 335
respectively. Wage earners, civil servants and
Kachamal traders rank second, third and fourth in terms
of frequency of commuting. In brief, the frequency of
commuting is largely influenced by occupation, distance
of destination(s), availability of work (at destination)
and the commuter1s degree of seasonal involvement with
agricultural activities at the home village. The
patterns for different occupation groups are discussed
below.
5.1.1 Milkmen
Daily commuters
Milkmen usually supply milk from Rampal to Dhaka
and Narayangonj urban markets. Every day they either
collect milk from farmers' homes or buy from local
markets, and sell it in these urban centres. They
commute either in the morning or evening, but most
operate a morning shift. Most of those who commute in
the morning leave their residence early and return
before evening (Figure 5.2d). On return, some of them
work on their farms often until it is dark. Evening
shift milkmen spend their mornings in agricultural work.
They mostly return before midnight, although sometimes
it is necessary to stay overnight at their destination
given weather conditions and the absence of return
transport.
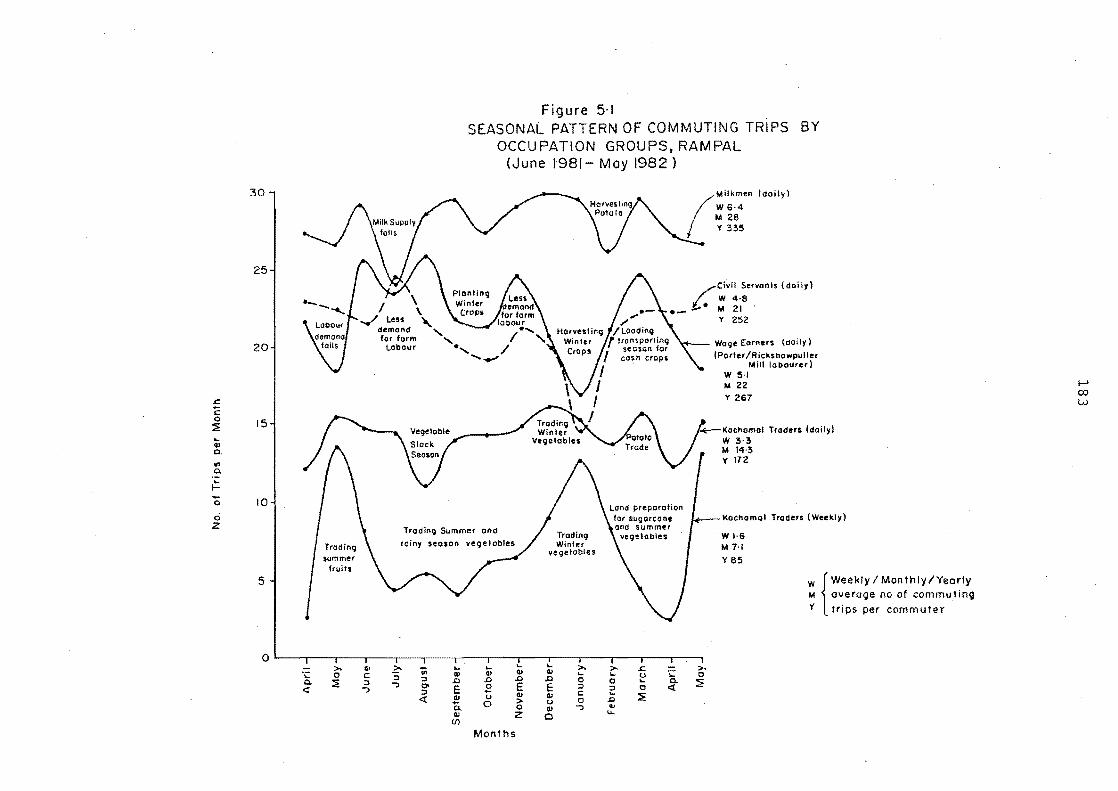
.<: 'E o :i!. ... 0> C.
... c. ... ~
30
25
20
15
'0 10 o Z
5
0 >. ·c 0
Q. :E <r
I \ .... / Uss ......
demond " for form
Ulbour
Figure 5·1 SEASONAL PATTERN OF COMMUTING TR'IPS BY
OCCUPATION GROUPS, RAM PAL (June 1981- May 1982 )
(
Milkmen (doily)
WG·4 M 28 y 335
/Civil Ser"onls (doily)
1... W 4·8 ._ ...... M 21 .
Y 252
WOlle Eor"e,s (doily 1 (Porler /RickShowpuller
Mill labourer) W 5,1 M 22 Y 267
Kochamal Traders (doily) W 3·3 hi 14·3 Y 112
Kochamal Traders (Weekly)
Trading Summer one! WI'6 M 7,1
4> >. iii ... ... '-c: :; II> II> ell ::l ::t .c .c .0
'"? '"? Ol E 0 E ::J - 4> <r ~ u
0 :> Q. 0 OJ Z (/)
Months
... >. >. 4> ... ... .0 0 0 E ::J
~ OJ c: .c (J 0
II> J ... 0
u..
s::. u -;: ... Q. 0 <r :E
>. 0
:i!.
y 85
W {weeklY/MonthlY/YearlY M overage no of commuting Y trips per commuter
...... 00 W
184
Almost all milkmen commute by rickshaw up to
Katpatti from where they go to Dhaka and Narayangonj by
launch. On return, most of them walk home from
Katpatti. These routine daily movements are less
frequent during July and February (Figure 5.1). Around
July, milk supply falls considerably due to a shortage
of fodder in the rainy season. In late winter (in
February), the reason for a decline in the incidence of
commuting trips is related to the labour demands of the
potato harvest in this region. During this time most
men spend some days every week harvesting their own cash
crop (potato) or locally exchanging labour to do so.
5.1.2 Wage earners
Major destination
Non-agricultural wage earners include porters,
rickshaw pullers, and mill labourers. Most porters and
mill workers travel for work to the evolving commercial,
industrial and urban belt which in fact, starts from
Betka, continues down to the right bank of
Ichamati/Dhaleswari rivers and ends at Munshigonj town
(Figure 1.1). The main focus of this area is
Kamalaghat-Rikabi Bazar business centre. In brief,
Kamalaghat has been developing rapidly as the most
important inland entrepot particularly for agricultural
products. Other important clusters within this
commercial belt, are Betka, Mirkadim, Binatpur and
Moktarpur. Large numbers of small industries (mainly
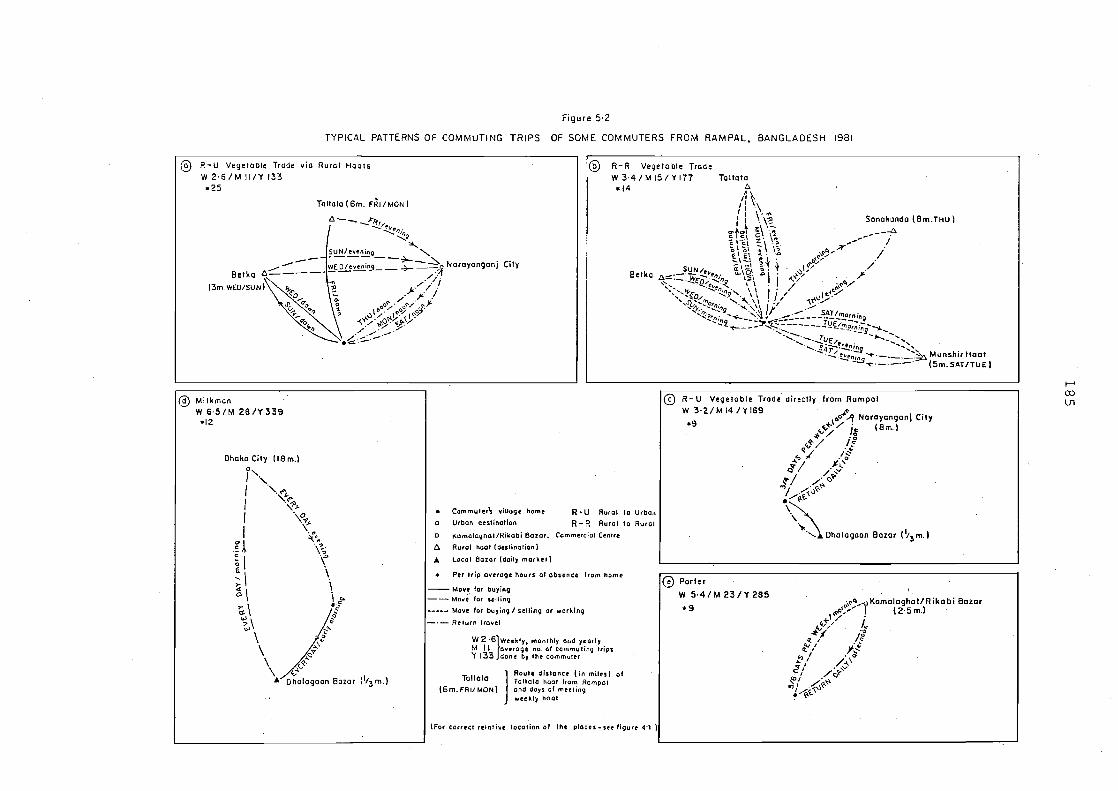
®
Figure 5·2
TYPICAL PATTERNS OF COMMUTING TRIPS OF SOME COMMUTERS FROM RAMPAL, BANGLADESH 19BI
R-U Vegelable Trade via Rural Hoots W 2·6/M Illy 133 .25
Belka ,
(3m. WED/SUN)
Tallala (6m. fRI/MON I
~---.!f:il/~ ~-!::~f~
-...:!J
SUNlevening "'"
~ED/eve;:.9=--=t-~r Narayanganj //.
:'! ;./j! '0. ,. )".1 'i \~r:P~' oQ~/' o~J-
:::a v ,,/ l("YI('~ .... -?-/>l'J<:/:t"\/ ./ /"--'
.~.::::.:.-'
@
City
R-R Vegetable Trade W3-4/MI5/YI77 Talloto
_14 t. ,n !: '\\." I I . ~ Sanokanda (Bm.THu)
"'t"t ;\ :;; _--A c C\ O. \.£ .,. ... - . "'C, ,"c.\ z \ .~ ... - / '0 1\ 01 ;; \! .t-c.,/f' I' E E' ",. - ~ ... ./ ~\ -:\ ~.~ .\. ~~~/ /'
._~!:!!'i.~\f~. ~\O\ ~. ~ . ~;... . Ll"'._. W;-O .~~. ,:i\ I I .... -?-/ . ~ .J' '~~"'''' -..;. --:'!.te'~i'. \ \ '. ,/ f.~\~-V
" ,~{o/ '-.!!g'. \ \ I 1/ ,,1l!5":/ ' .... sv. ....... ~o,.l). ...... '. \, " '/ ~.
.... .(V~~:;~"p ... "'F-:.l....~.~ I .-.:::' ___ S~.!/tnornjn .... !!If/Q --- ... .,~;..-- T ---- g ... -"'t----- ........ ~--------!:!~~~Tni~-~
...... :~ ........ -_ tu -- -to. .... : .......... , -....... · ......... E/~II . .... ... .....
·'.~4r·...!..'!~ ' ... :::., . ·· ... t~~~ ....... -._._.~ Munshu Haot . -;-._._._' (Sm.SAT/TUEI
Belka
@) Milkman @ R- U Vegelable Trade directly from Rompal
W 6·S/M 28/Y339 .12
Dhaka City (18 m.) 0, I " I ".<""
I '.<"1' \:).
I \0,,). I \~
~I \~t'~. ._,j. \? :: I Y' ! \ \ r \
('; \ i" \
•. !' r ~ '" ' '" 0 ~\ ~/
\ t \ ... '
<:;'7
\ ~'" \ ","<';
A Ohalagaon Bazar (1/3m.)
Commuler\ village home
a Urban destinatIon R-U Rural 10 Urban
R - R Rura I to Rural
o Kamo'Qljlhot/Rikooi Bator. Commercial Cenlre
6. Rural naar I deslination)
A Local Bazar (daily markt.)
Per 'rip Q1J~,a9t houlS of absence from home
-- Mo¥~ for buying -- MOlfe for sellin!)
... _-- Move for buyinl) I sellinq or working
_.- Relurn ttavel
W 2 '6}weekI Y, monthly ond -yearly M II overoQe no. ot c:ommulin~ trips Y 133 done by the commuter
Tollolo 16m.FAI/MON)
}
Route distance (in miles) of TaUolo hool from Rempol and days of meelin9 weekly nOOI
(For Correct relative location 01 the places ... ue figure 4'1 )
W3·21MI4/YI69 ~ . \0°-" ~ Noroyoo9aol City
.9 ... /. (8) <.,,<,;/ Ig m.
@ Parler
W 5·4/M 23/Y 285
*9
~ '0
<.,,~/ IE Q/ i~
:"'/ .)!~,Q Q / ..... "
~/ /.' (;,? '"', . ...;'..:.«-'" ./",~
\~ Dhalegoon Bazar (1/3 m.)
~,,,~_-o KamologhatlA ike bi Bazar <$'0"/ I (2·5m.)
\ / . ,,,,*/ I"
~"';I ·0
~ J Ig ~ ~ .~
Q..I ,~
t! /' /~\o d l ...... "
J /<:;'" ~I /.'", r) / /,,' -<,-u~ . "'~
I-' CO lJ1
186
cold storages and rice processing mills) and godowns
(warehouses) have already been established there.
Every day hundreds of wage labourers from Rampal
and its neighbouring areas commute to this urban
industrial agglomeration for casual employment. Data
from the mobility register show that over 75 percent of
off-farm day labourers from Rampal usually commute to
that workplace. The main flow of rickshaw pullers who
transport passengers and goods also follows the same
direction of daily movement. Figure 5.2e illustrates
the travelling pattern of a porter (kuli) who commutes
every day directly from his home to Kamalaghat-Rikabi
Bazar commercial centre for carrying loads.
Seasonal rhythm
Throughout the year, Rampal wage earners commute
to Kamalaghat-Rikabi Bazar. However, data from the
mobility register shows that the frequency of commuting
varies from month to month and season to season in
response to the agricultural cycle (in Rampal) and the
fluctuations of labour demand in that business centre.
The monthly frequency of commuting trips for wage
earners, varies from 17 to 26. The frequency of
movement decreases in May, September to October, and
falls markedly in winter (Figure 5.1). In May, when the
potato storing season ends (Figure 3.3), more than 40
cold stores along the Ichamati/Dhaleswari bank have very
little demand for labour and this diminishes the rate of
commuting of wage earners from Rampal. With the start
187
of the potato unloading season in August, labour demand
in these stores rises again. But during August to
October, Rampal also needs a large agricultural labour
force to plant potatoes and other winter vegetables.
So, labourers intentionally refrain from commuting for a
few days and spend time working on their own farms or
acting as labourers for other farmers (Table 5.2).
The marked decline in commuting rates in winter
corresponds to a heavy demand for local harvesting
labour as well as a lean period for non-agricultural
wage labour in the Kamalaghat-Rikabi Bazar business
centre. Winter is the good season for Rampalese.
During this season every household directly or
indirectly earns a considerable amount of cash by
harvesting winter vegetables which they grow mainly for
the big Dhaka/Narayangonj urban market. Very often
they get a bumper crop due to settled weather in winter.
Agricultural labourers get better wages and more regular
employment in the local area, and they have less
incentive to commute for wages in town.
Demand and supply
The rate of commuting begins to rise sharply in
late winter and reaches its annual peak in early summer
(in March) when all the business centres along the
Ichamati/Dhaleswari river bank have a shortage of wage
labourers. Workers simultaneously engage in trans
porting and loading potato, paddy and rabi crops in cold
stores, godowns and mills. They work from sunrise to
188
sunset; some days even up to 9 p.m. or later. Often
seasonal migrants from neighbouring districts (e.g.
Faridpur, Bakerganj etc.) work together with the local
wage commuters. On average, every labourer earns at
least twice as much cash at this time as in any other
season of the year.
The higher incidence of commuting during the
rainy season as well as around November, is mainly
influenced by a lower demand for local agricultural
employment. During this time there is some demand for
labour in Kamalaghat-Rikabi Bazar, but this is not
enough to absorb the increasing number of commuters
seeking wage employment. As the competition for work
is high, the employers and the labour contractors have
an advantage and can pay a low wage. Hence in June,
July, August and November, commuting labourers tend to
be under-paid and under-employed. Sometimes, commuters
return home without getting any work at all in these
months.
5.1.3 Civil servants
Dual occupations
Figure 5.1 clearly indicates that the rate of
commuting of civil servants is inversely related to the
intensity of agricultural activities. Commuting is
important except during the peak agricultural seasons
(such as planting and harvesting winter vegetables) when
civil servants often take part in their farm work or
189
supervise hired labourers or both. This pattern is
further verified in Section 5.1.5 where the reasons for
occasionally refraining from commuting over different
seasons are examined.
The seasonal pattern of mobility of those working
in the formal sector (including industrial workers) can
be explained by reference to the fact that in rural
Bangladesh, men have two or more occupations at the same
time. Excessive fragmentation of land holdings and
shortage of agricultural employment have forced the
village people to take off-farm jobs which provide part
of their total subsistence income. An empirical study
by Ali (1980, 29, See Appendix 2), for instance, found
that 84 percent of farm families in Bangladesh had a
member employed in off-farm work at least for some
time in 1980. This is a substantial increase in off
farm work since 1950.
Absenteeism
Generally, villagers obtain non-farm work through
commuting or circular migration. When the demand for
on-farm labour is high mobility rates decrease to a low
level. Recently the rate of absenteeism among workers
in Jute industries (the largest industry in Bangladesh)
has been at levels of 20 to 30 percent per month
(Shafique 1983, 23). The highest rate of absence (35
percent) occurs at the times of the annual planting and
harvesting seasons. An absence of female participation
in outdoor farm work also indirectly affects the rate of
190
mobility among males as they have to manage
simultaneously activities on the land as well as in
non-local off-farm jobs.
Mantra's (1981, 91) study in Indonesia reached
different conclusions regarding the seasonal pattern of
commuting of civil servants as well as contract
labourers. He found that farm activities do not affect
the mobility patterns of these groups. He reached this
conclusion from eight months registration of mobility
records. However, the study did not explain those
commuters' tenural status, involvement in farm work
particularly during peak season(s), and seasonal use of
unofficial leave. One reason for the difference might
be that in Indonesia (unlike Bangladesh) females
participate more in outdoor farm work and, as a result,
their male partners are able to keep on commuting even
during the busy period in their farms.
5.1.4 Kachamal traders
The vegetable season
Kachamal traders are the largest group among the
commuters from Rampal (Figure 4.2). Their pattern of
mobility is strongly related to the intensive and
extensive cultivation of vegetables in the Rampal
region. The rates of commuting daily and weekly, of
Kachamal traders are shown in Figure 5.1. The frequency
of trips per month of the daily traders ranges between
11 to 16. For weekly traders, the frequency varies
191
greatly from 3 to 13 trips per month. The highest rate
of movement comes twice per year for both groups -
firstly at the time of harvesting winter vegetables in
and around Rampal and secondly during summer when fruit
is picked in Rampal as well as in Dhaka, Mymensingh,
Rajshahi and Dinajpur districts (Figure 3.3).
Rampal has no true slack season for market
gardening. The major harvest is in winter when
vegetables grown commercially over the whole Munshigonj
market gardening area are mature (Section 3.1.3).
During this time the whole region's population focuses
on activities related to the harvest and trade of winter
vegetables. The flock of commuters related to the
vegetable trade comprises retailers, wholesalers,
dealers, middlemen and vegetable growers. As the
winter progresses, the volume and rate of commuting
increases. In the next few paragraphs movements of
vegetable traders are described in some detail.
The urban vegetable trade
The vegetable trader's commuting pattern is
ubiquitous and synchronized with weekly market cycles in
the rural areas and daily vegetable marketing times in
the nearby urban centres particularly in Dhaka/
Narayangonj city. The pattern is further complicated
py the range of vegetable business types (such as
retailer, wholesaler, dealer and middlemen) as well as
by the range of destinations open to traders for
business. Figure 5.2 illustrates this more clearly.
192
The pattern of trips for rural to urban trading is quite
different from that of the intra-rural commuting of
vegetable traders. Traders usually move to urban
centres to sell their vegetables which they buy either
from the local bazar (daily market) or from neighbouring
haats (rural weekly market). Urban commuters make their
trips via different rural markets (Figure 5.2a, c).
Urban vegetable markets open in the morning and
traders, particularly the retailers, reach there well
before the peak hours of business. Retailers who
commute to town directly from Rampal start their travel
before sunrise (Figure 5.2c). They buy the goods
during the previous day from the local market (such as
Dhalagaon Bazar) or from the grower's garden and bring
them to their home. Here, at night, they along with
their family members, spend a few hours arranging the
vegetables (i.e. cleaning, sorting, bunching) for
selling. Non-retail traders (such as wholesalers,
dealers, middlemen etc.) travel mostly during the
daytime and sell their goods to urban wholesale markets
which remain open from dawn to dusk.
Rural to urban commuting via neighbouring haats
(Figure 5.2a), has a different spatial pattern. In this
case, a commuter first moves to a particular site on
haat day (market day). Usually the haats meet on a
fixed schedule, two afternoons per week. There the
commuter buys vegetables directly from the growers and,
after buying, he is accompanied by other fellow
193
vegetable traders who carry their goods (by boat or
launch) to the urban market where they wait until the
following morning to retail their goods. At night they
arrange their vegetables and sleep in the market. In
the morning, as soon as they sell their goods, the
commuters quickly return home and spend the afternoon
mostly working in the fields. Figure S.2a illustrates
a weekly routine of three complete trips which involve
six days. The remaining day of the week is set aside
for a rest.
The rural vegetable trade
Vegetable traders who commute within rural areas
have a different pattern of movement which is
illustrated in Figure S.2b. This group mainly includes
vegetable retailers and middlemen. Every morning they
commute directly from their home to different rural
haats and come back the same evening. Choice of haat
depends mostly on the weekly cycle of rural markets as
well as distance and size of a particular haat. In
fact, most of the village peddlars in Bangladesh travel
following the pattern as shown in Figure S.2b.
Summer fruits
The mobility rate of Kachamal traders' rises
again in summer particularly when summer fruits such as
mango, jack fruit, liches etc. are available in the
market. Summer fruits are in high demand throughout the
whole country. In certain areas of the country (such
194
as Rajshahi, Dinajpur, Dhaka and Mymensingh districts)
they are grown commercially. A large number of
Kachamal traders are thus involved in the fruit business
in the summer season. As Rampal had long been famous
(section 3.1.3) for growing certain tree crops (mainly
bananas), people of this particular area traditionally
achieved the necessary skills for trading fruits.
Recently fruit-growing in Rampal has become less
important mainly due to strong competition for land and
labour from vegetable gardening. Hence, during summer,
Rampal fruit traders commute over a wide range of
distances from their home to buy summer fruits which
they usually retail at Dhaka/Narayangonj cities as well
as neighbouring village markets.
5.1.5 Total pattern
Commuting and the agricultural cycle
In the preceding sections the seasonal pattern of
commuting of each occupation group was explained in
detail. It will be shown in this section that their
total pattern of commuting is also largely influenced by
the major agro-climatic seasons in and around Rampal.
During mobility registration in Rampal it was often
reported that the commuters occasionally refrain from
commuting for some days particularly when they could
work in the fields. Field registrars were advised to
take note of those days together with the reason(s) for
not being able to commute.
195
The main idea was to clarify the impact of the
agricultural cycle on mobility, an issue that has been
mentioned but not illustrated clearly in many studies of
population movement in the Third World. The monthly
distribution of commuting trips completed or intention
ally forgone because of demands at home by all sample
commuters from Rampal is shown in Figure 5.3. Here it
is revealed that the rates of commuting and abstaining
from commuting fluctuated significantly on a seasonal
basis.
In the streets of Rampal, commuters are visible
throughout the whole year, but the heaviest rates of
commuting are recorded around March, June and November
(Figure 5.3) when a decline in the demand for
agricultural labour (in Rampal) encourages villagers to
move regularly for a livelihood. The rate also
increases as a result of certain "pull" factors (such as
the cycle of Kachamal trade and the crop storing season)
which mainly attract the Kachamal traders and day
labourers from Rampal.
Following the agricultural cycle in Rampal, the
rate falls during the middle of winter and early summer
when Rampal needs a large number of extra hands to
harvest winter crops and prepare farms for summer and
rainy season crops respectively (Figure 3.3). Except
for the Kachamal traders, all commuters had their lowest
rate of movement away from the village for work during
the winter harvesting season (Figure 5.1). The
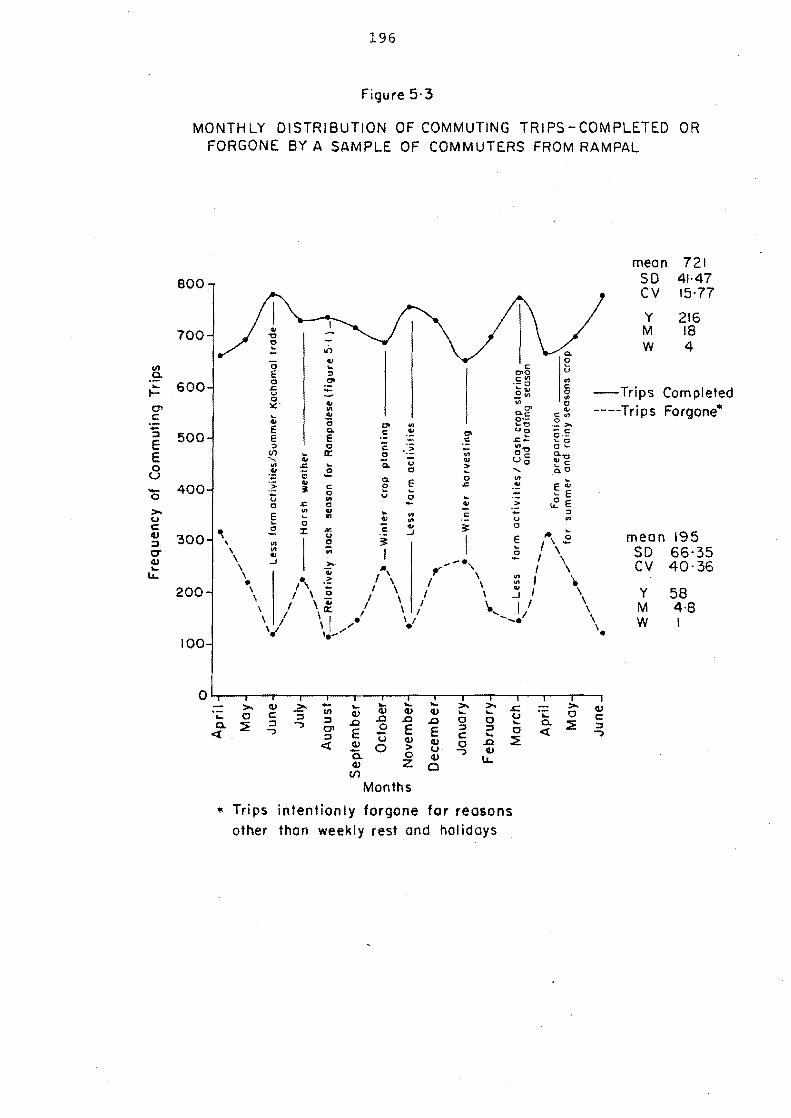
... I-0> C :;: :::I E E 8
196
Figure 5·3
MONTH LY DISTRIBUTION OF COMMUTING TRI PS - COM PLETEO OR FORGONE BY A SAMPLE OF COMMUTERS FROM RAMPAL
800
700
600
500
400
200
100
en c: o '" o eLi
C:'" .~ >. -c: 0-_ "'0 0'-Q.-o ~c: 0. 0
mean SO CV
Y M W
721 41-47 15·77
216 18 4
-Trips Completed ----Trips Forgone*
mean 195 SO 66·35 CV 40-36
Y M W
58 4·8 I
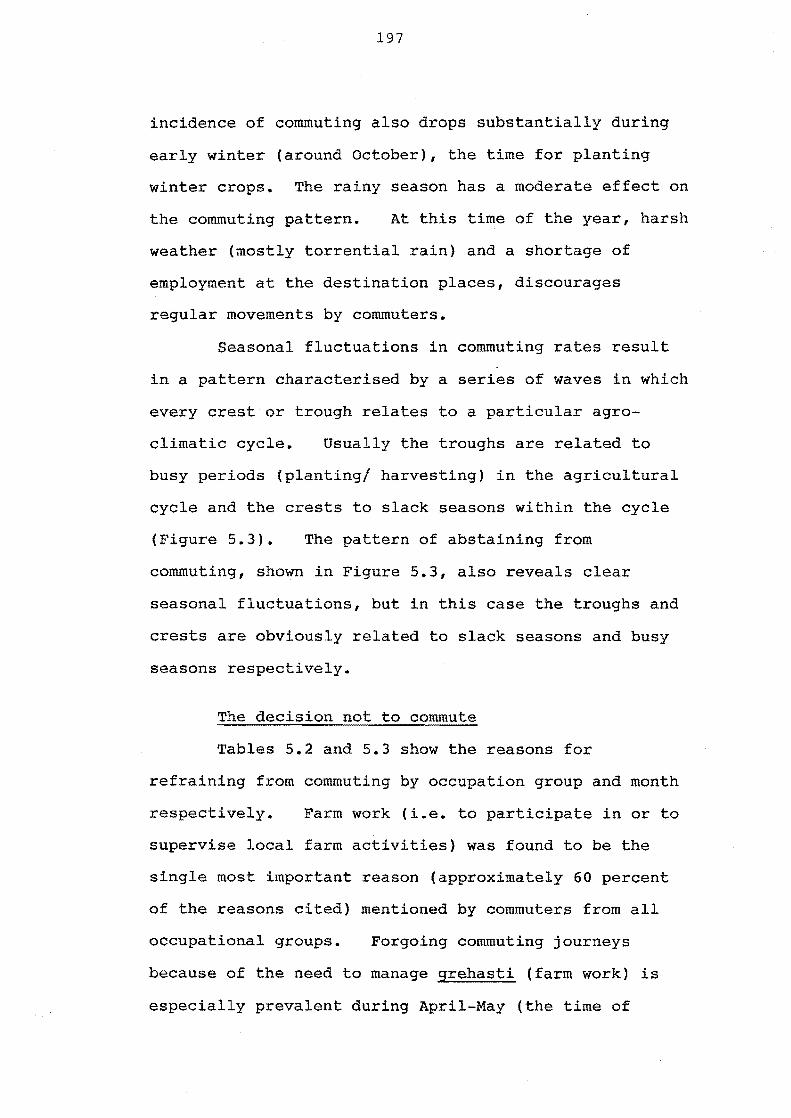
197
incidence of commuting also drops substantially during
early winter (around october), the time for planting
winter crops. The rainy season has a moderate effect on
the commuting pattern. At this time of the year, harsh
weather (mostly torrential rain) and a shortage of
employment at the destination places, discourages
regular movements by commuters.
Seasonal fluctuations in commuting rates result
in a pattern characterised by a series of waves in which
every crest or trough relates to a particular agro
climatic cycle. Usually the troughs are related to
busy periods (plantingl harvesting) in the agricultural
cycle and the crests to slack seasons within the cycle
(Figure 5.3). The pattern of abstaining from
commuting, shown in Figure 5.3, also reveals clear
seasonal fluctuations, but in this case the troughs and
crests are obviously related to slack seasons and busy
seasons respectively.
The decision not to commute
Tables 5.2 and 5.3 show the reasons for
refraining from commuting by occupation group and month
respectively. Farm work (i.e. to participate in or to
supervise local farm activities) was found to be the
single most important reason (approximately 60 percent
of the reasons cited) mentioned by commuters from all
occupational groups. Forgoing commuting journeys
because of the need to manage grehasti (farm work) is
especially prevalent during April-May (the time of
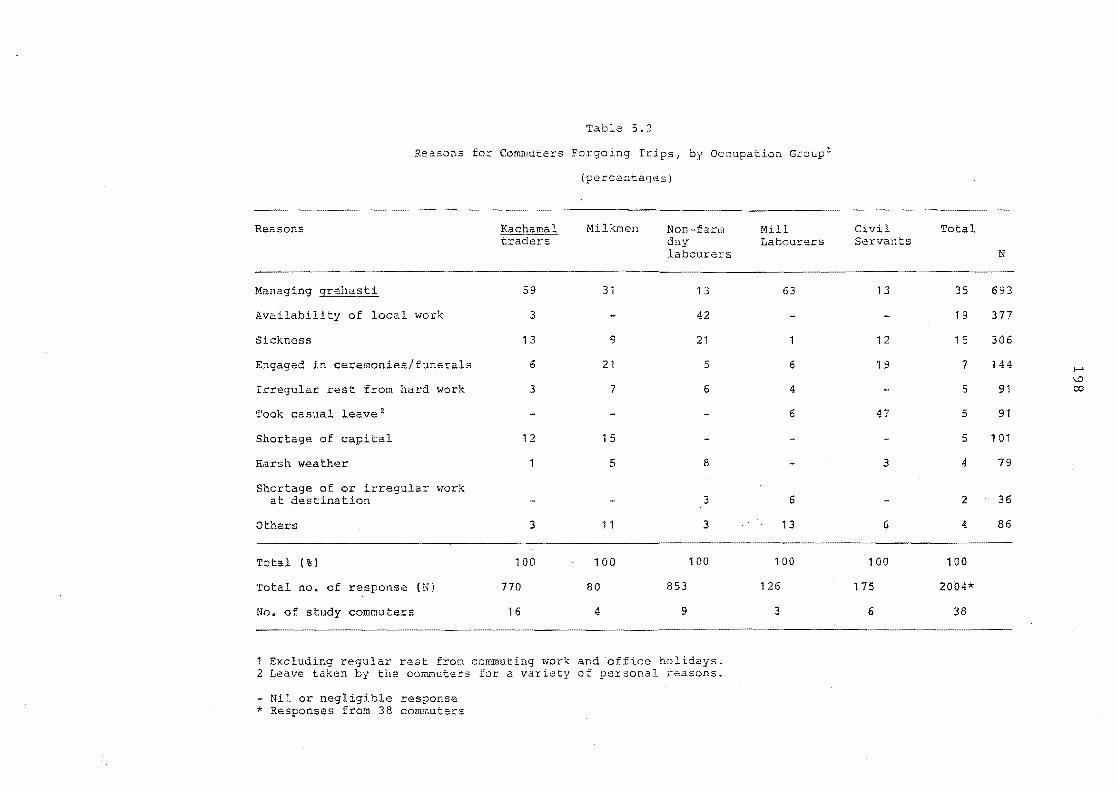
Table 5.2
Reasons for Commuters Forgoing Trips, by Occupation Groupl
Reasons tHlkmen Non-farm day labourers
Managing grehasti 59 31 13
Availability of local work 3 42
Sickness 13 9 21
Engaged in ceremonies/funerals 6 21 5
Irregular rest from hard \vork 3 7 6
Took casual leave 2
Shortage of capital 12 15
Harsh weather 5 8
Shortage of or irregular work at destination 3
Others 3 11 3
Total (% J 100 100 100
Total no. of response ( N) 770 80 853
No. of study commuters 16 4 9
1 Excluding regular rest fron co~~u~~ng work and office holidays. 2 Leave taken by the commuters for a variety of personal reasons.
- Nil or negligible response * Responses from 38 commuters
Mill Labourers
63
6
4
6
6
13
100
126
3
Civil Total Servants
N
13 35 693
19 377
12 15 306
19 7 144 ...... \.0
5 91 00
47 5 91
5 101
3 4 79
2 36
6 4 86
100 100
175 2004*
6 38
199
planting summer and rainy season crops), around October
(when winter crops are planted), and in December-January
(during the winter harvest).
Following the same pattern day labourers who are
mostly landless or near landless forgo commuting trips
when local farm work is readily available. Civil
servants avoid some commuting trips (on working days)
mostly during the agricultural seasons when they can
spend their casual leave supervising their own farm.
Very often they take this leave stating false personal
or family health reasons.
Sickness and shortage of cash
Sickness of commuters or their family members is
another common reason for forgoing a trip. This is more
common among the day labourers as they work hard and are
unable to obtain sufficient food regularly. During the
rainy season they often suffer from cold and fever due
to frequent outdoor work in wet conditions.
The number of commuting trips made by traders and
milkmen drop substantially when they fall short of money
(business capital) which may happen at any time of the
year depending on the size and nature of business,
agricultural investment, commitments to his dependents
and relatives, and above all his economic condition. In
October-November, small peddlars spend most of their
business capital on growing winter cash crops and hence
they cannot commute regularly because of a shortfall of
cash. Other notable reasons which detract from regular
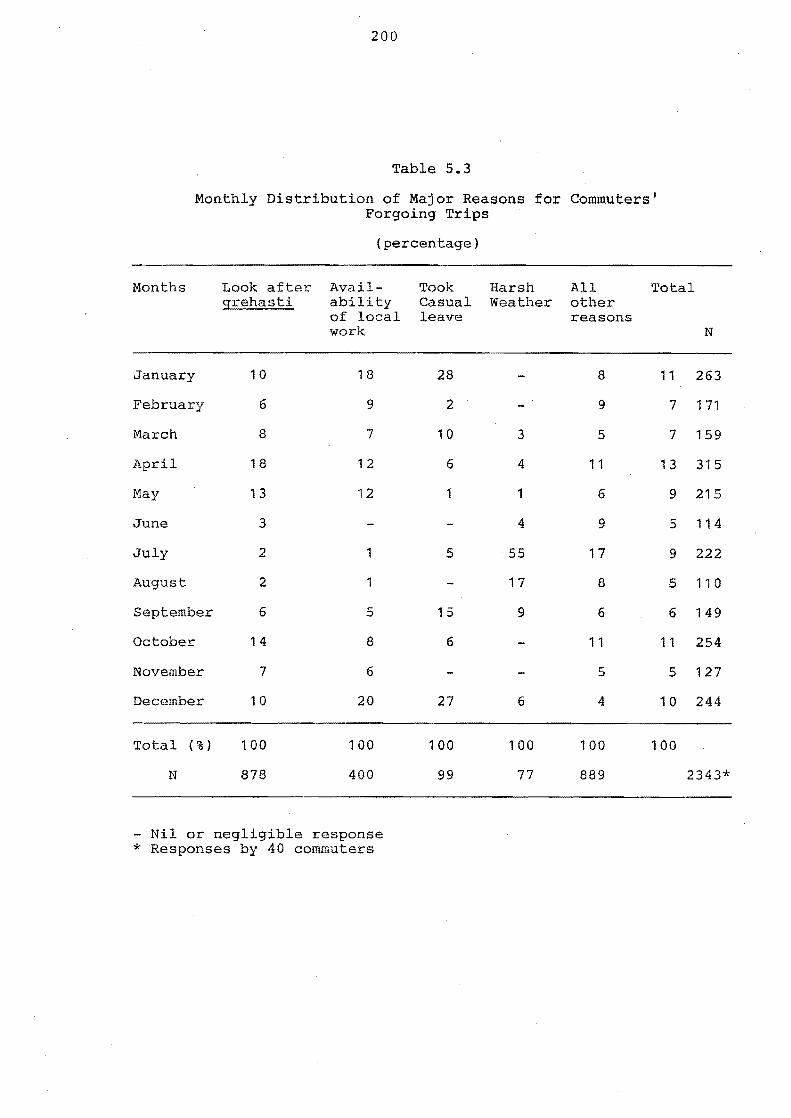
200
Table 5.3
Monthly Distribution of Major Reasons for Commuters' Forgoing Trips
(percentage)
Months Look after Avail- Took g:rehasti ability Casual
of local leave work
January 10 18 28
February 6 9 2
March 8 7 10
April 18 12 6
May 13 12 1
June 3
July 2 1 5
August 2 1
September 6 5 15
October 14 8 6
November 7 6
December 1 0 20 27
Total ( % ) 100 100 100
N 878 400 99
- Nil or negligible response * Responses by 40 commuters
Harsh All Total Weather other
reasons N
8 11 263
9 7 171
3 5 7 159
4 11 13 315
1 6 9 215
4 9 5 114
55 17 9 222
17 8 5 110
9 6 6 149
11 11 254
5 5 127
6 4 10 244
100 100 100
77 889 2343*
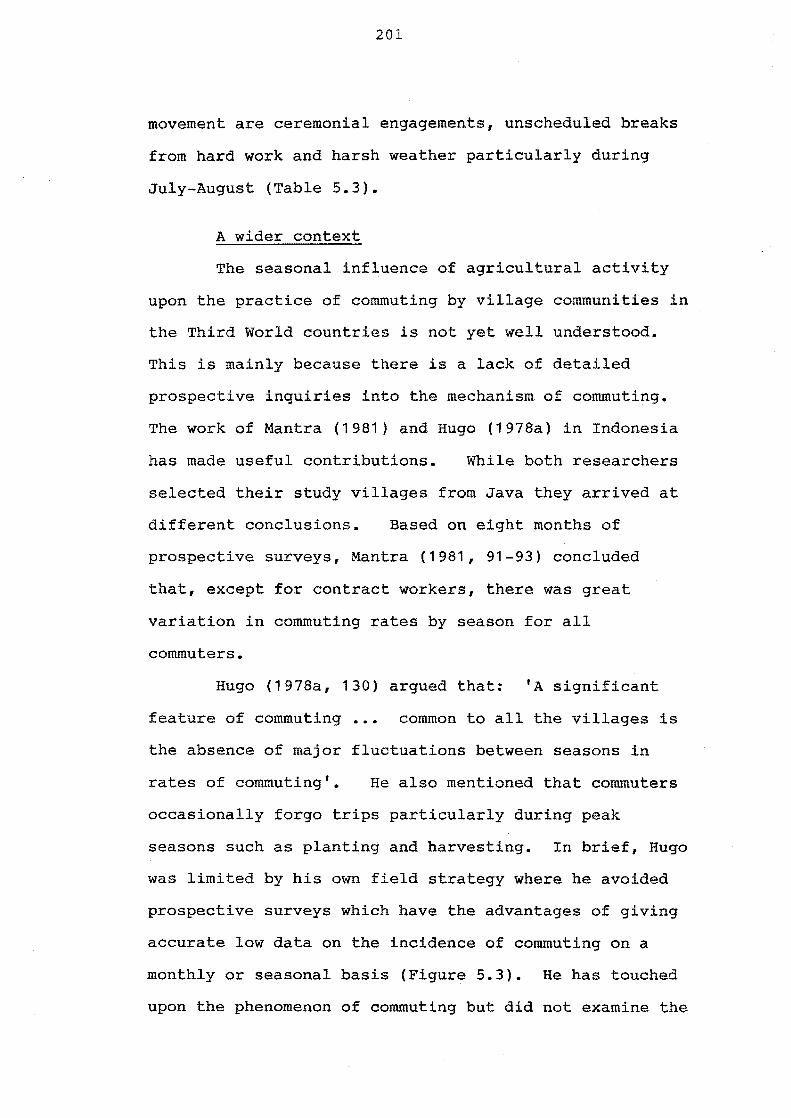
201
movement are ceremonial engagements, unscheduled breaks
from hard work and harsh weather particularly during
July-August (Table 5.3).
A wider context
The seasonal influence of agricultural activity
upon the practice of commuting by village communities in
the Third World countries is not yet well understood.
This is mainly because there is a lack of detailed
prospective inquiries into the mechanism of commuting.
The work of Mantra (1981) and Hugo (1978a) in Indonesia
has made useful contributions. While both researchers
selected their study villages from Java they arrived at
different conclusions. Based on eight months of
prospective surveys, Mantra (1981, 91-93) concluded
that, except for contract workers, there was great
variation in commuting rates by season for all
commuters.
Hugo (1978a, 130) argued that: 'A significant
feature of commuting common to all the villages is
the absence of major fluctuations between seasons in
rates of commuting'. He also mentioned that commuters
occasionally forgo trips particularly during peak
seasons such as planting and harvesting. In brief, Hugo
was limited by his own field strategy where he avoided
prospective surveys which have the advantages of giving
accurate low data on the incidence of commuting on a
monthly or seasonal basis (Figure 5.3). He has touched
upon the phenomenon of commuting but did not examine the
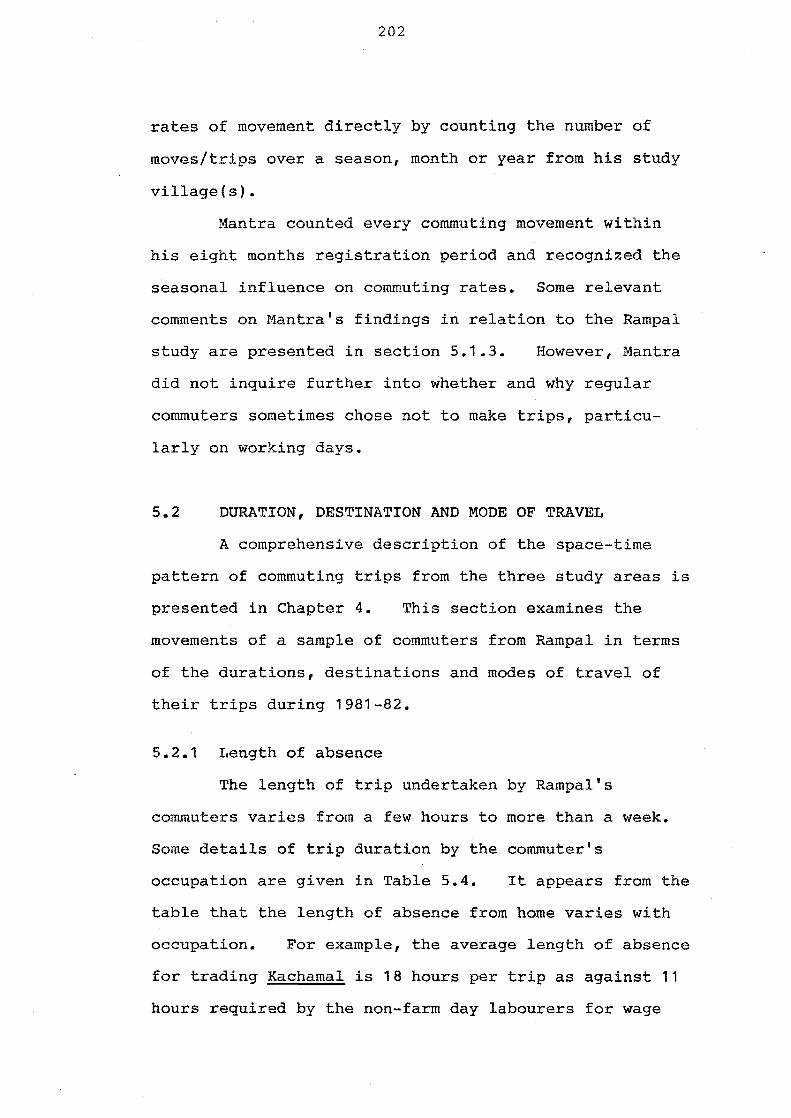
202
rates of movement directly by counting the number of
moves/trips over a season, month or year from his study
village(s).
Mantra counted every commuting movement within
his eight months registration period and recognized the
seasonal influence on commuting rates. Some relevant
comments on Mantra's findings in relation to the Rampal
study are presented in section 5.1.3. However, Mantra
did not inquire further into whether and why regular
commuters sometimes chose not to make trips, particu
larly on working days.
5.2 DURATION, DESTINATION AND MODE OF TRAVEL
A comprehensive description of the space-time
pattern of commuting trips from the three study areas is
presented in Chapter 4. This section examines the
movements of a sample of commuters from Rampal in terms
of the durations, destinations and modes of travel of
their trips during 1981-82.
5.2.1 Length of absence
The length of trip undertaken by Rampal's
commuters varies from a few hours to more than a week.
Some details of trip duration by the commuter's
occupation are given in Table 5.4. It appears from the
table that the length of absence from home varies with
occupation. For example, the average length of absence
for trading Kachamal is 18 hours per trip as against 11
hours required by the non-farm day labourers for wage
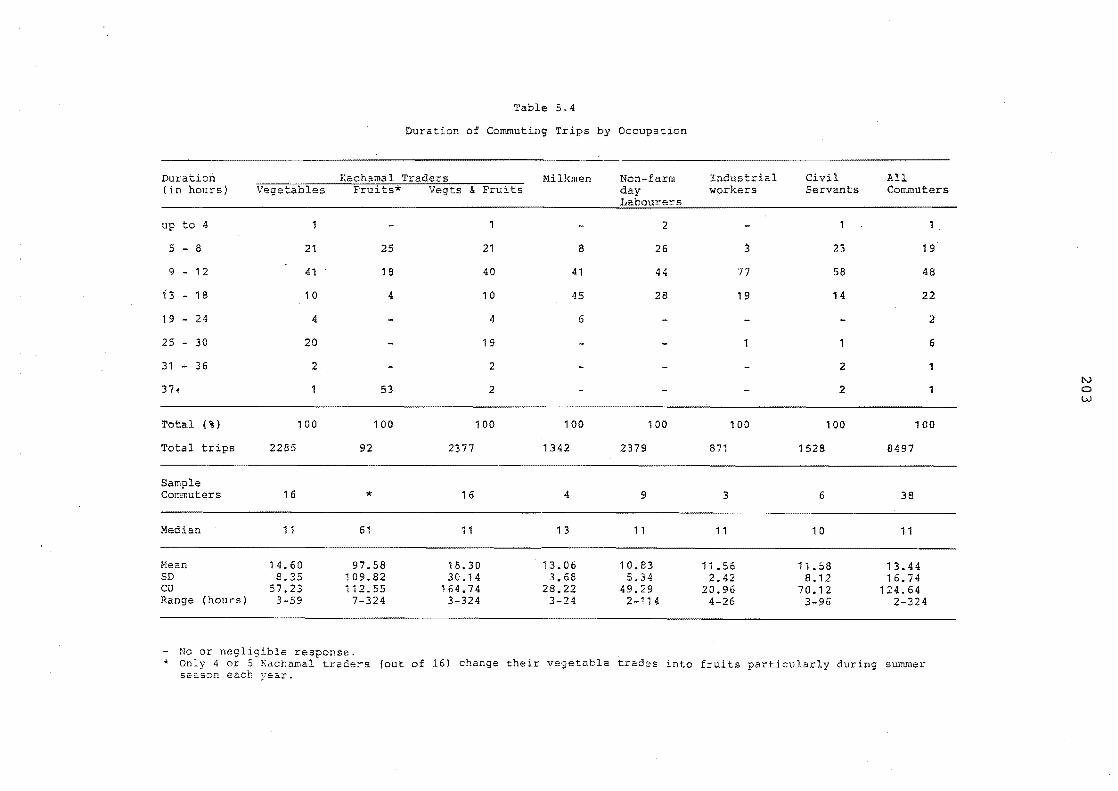
Table 5.4
Duration of Commuting Trips by Occupation
Duration Kachamal Traders Milkmen Non-farm Industrial Civil All (in hours) Vegetables Fruits* Vegts & Fruits workers Servants Commuters
up to 4 2
5 - 8 21 25 21 8 26 :3 23 19
9 12 41 18 40 41 44 77 58 48
i 3 - 18 10 4 10 45 28 19 14 22
19 - 24 4 4 6 2
25 - 30 20 19 6
31 - 36 2 2 2 IV
37+ 53 2 2 1 0 w
Total (%) 100 100 100 100 100 100 100 100
Total trips 2285 92 2377 1342 2379 871 '528 8497
Sample Commuters 16 * 16 4 9 3 6 38
Median 1 1 61 11 13 11 11 10 11
Mean 14.60 97.58 18.30 13.06 10.83 11.56 11.58 13.44 SD 8.35 109.82 30.14 3.68 5.34 2.42 8.12 16.74 CU 57.23 112.55 1 64.74 28.22 49.29 20.96 70.12 124.64 Range (hours) 3-59 7-324 3-324 3-24 2-114 4-26 3-96 2-324
- No or negl * Only 4 or (out of 16) change their vegetable trades into fruits particularly during summer
se~50n each year.
204
earning. On average, the milkmen usually spend 13
hours commuting daily between Rampal and Dhaka city. In
the formal sector, two groups of employees, namely civil
servants and industrial workers, took almost the same
amount of time (around 12 hours on average) for their
daily trips from home. These differences in duration
of absence from home are mainly the result of
occupation, distance of destination(s) and mode of
transport.
Kachamal traders
Among the Kachamal traders, the length of
commuting trips varied from 3 hours to 324 hours. The
main reason for this high level of variability is that
some traders commute for a longer period during the
summer fruit season and potato season, when commuting
occurs over great distances (50 to 200 miles) from
Rampal.
Fruit trading accounts for only four percent of
the total trips done by the Kachamal traders. If these
trips are excluded, the variability (cv) of commuting
time for Kachamal traders drops substantially from 165
percent to 57 percent and the average time per trip also
comes down to 15 hours from 18 hours (Table 5.4 and
Figure 5.4). Although, on average, a Kachamal trade
trip lasts a longer time, the cumulative distribution of
all Kachamal trips shows that 60 percent of the trips
never exceeded more than 12 hours absence from home
(Figure 5.5b) and the median length of absence was found
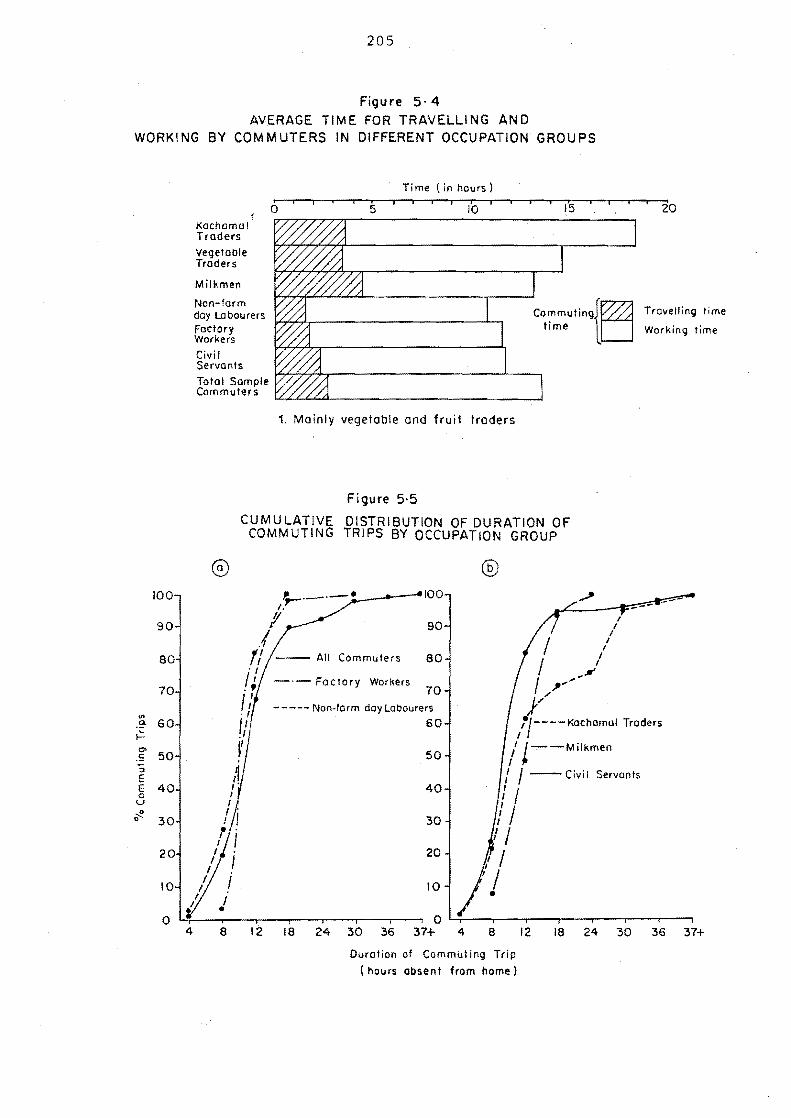
205
Figure 5· 4 AVERAGE TIME FOR TRAVELLING AND
WORKI NG BY COM M UTERS IN DIFFERENT OCCUPATION GROU PS
100
90
80
70
if)
.~ 60 ~ 01
50 .S :; E E 40 0
U
~ " 30
20
10
0
1 Kachomai Traders
Vegetable Traders
Milkmen
Non-form day Labourers Foctory Workers
Civil Servants
Total Sample Commuters
Time (in hours)
o (0
1. Mainly vegetable and fruit traders
Figure 5·5
COr;'mutingJ~ time lU
CUMULATIVE DISTRIBUTION OF DURATION OF COMMUTING TRIPS BY OCCUPATION GROUP
® ® ;-.._._. 100
/.
f! I 90 I
.f I
I I I
f/ Commuters 80 I
/ I • I .K /1 -'- Factory Workers / ,... . , 70 JI'
f/ ----- Non-form day Labourers
20
Travelling time
Working time
J/ . I
/?----KaChOmOI Traders II 60 .1
V
,1 I . I I / . I I . .
/ I I
I I I I I I
I I I •
4 8 12 18 24
50 / t--Milkmen
/ I --Civil Servants 40 : I
II 30 I /
20 I I
i / 10 •
0 30 36 37+ 4 e Duration of Commuting Trip
(hours absent from horne)
12 18 24 30 36 37+
206
to be 11 hours.
Figure 5.4 shows that Kachamal traders spend more
time at their destination(s) than other commuters.
Because a trip for trading Kachamal involves both buying
and selling of goods, the trader usually selects two
destinations (one for buying vegetables/fruits and the
other for selling or retailing) where he spends quite a
long period for trading.
Milkmen and labourers
Milkmen ranked second in terms of average time
spent on a commuting trip from Rampal. Their mean and
median length of commuting trips are approximately the
same - 13.06 and 13.00 hours respectively. The low
variation of commuting time among the milkmen can be
explained by the fact that they mostly commute to a
common destination (Dhaka city) travelling by the same
modes of transport. Unlike achamal traders, milkmen
have short business hours as they sell their milk
directly to the urban wholesale market.
Among all commuters, non-farm day labourers spend
the least amount of time (average 11 hours per trip) in
daily commuting from Rampal. They spend the shortest
time on travel as well as day work at their destination.
It is evident from Figure 5.4 that day labourers have
less working time than industrial workers and civil
servants. The obvious reason is that in the formal
sector of employment workers have regular full-time
employment, while in the informal sector the day
207
labourers have no guarantee of a full day's work at
their destination.
5.2.2 Direction and mode of travel
Figure 5.6 shows the volume of travel by the 40
commuters in the sample to important destinations.
During the survey year they completed 8651 commuting
trips by travelling 9431 times to more than 20 places at
variable distances from Rampal. Generally a commuter
works at one destination; but some commuters had more
than one destination per single trip as shown in Figure
5.2a.
Although the commuters travelled to a number of
places, three places, namely Kamalaghat-Rikabi Bazar,
Narayangonj and Dhaka, received almost two-thirds of the
total flows. Kamalaghat-Rikabi Bazar itself attracted
nearly one-third (31 percent, Figure 5.7). Rapidly
growing industrial and business centres along the
Ichamati-Dhaleswari bank (Figure 1.1) attracted half of
the total movements. On the other hand, Munshigonj, a
sub-division town at the doorstep of Rampal, attracted
only 8 percent of the total flows. The major reasons
for different levels of movement to these destination
places have been mentioned already in Chapter 4.
The cumulative distribution of commuting trips by
distance is shown in Figure 5.7. It is apparent that
more than 55 percent of all trips were confined within
three miles distance from Rampal and 83 percent limited
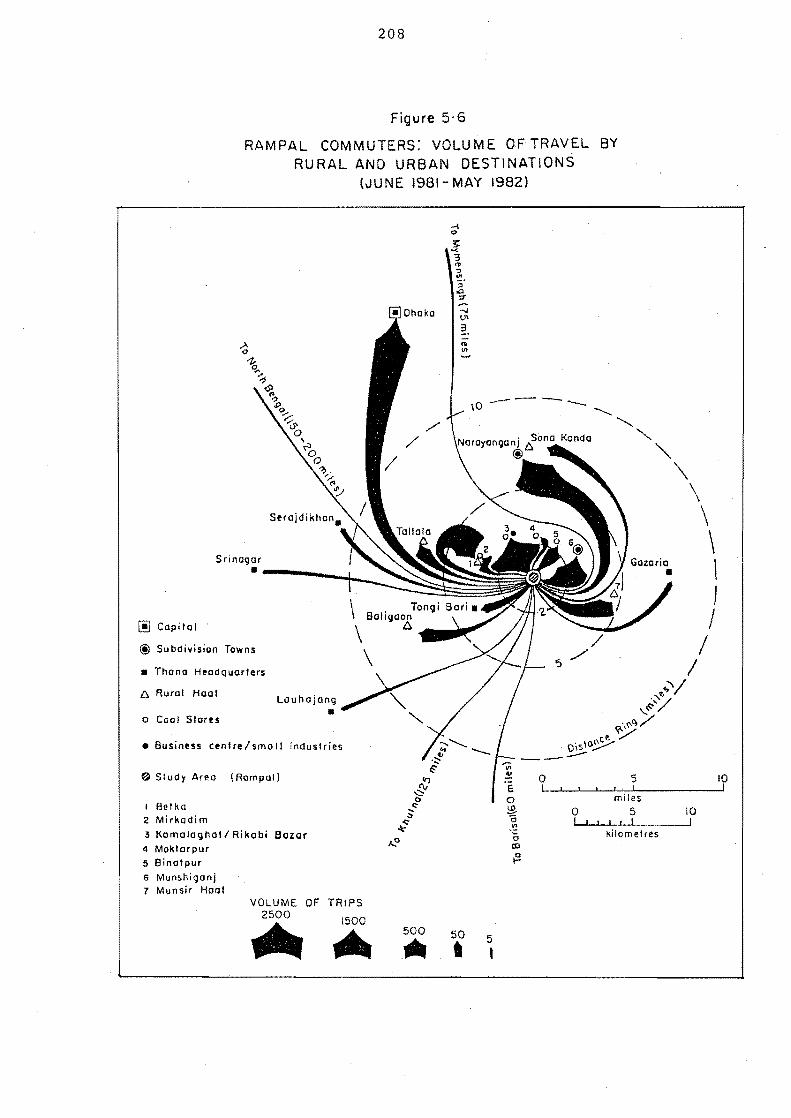
208
Figure 5·6
RAMPAL COMMUTERS: VOLUME OF TRAVEL BY RURAL AND URBAN DESTINATIONS
(JUNE 1981- MAY 1982)
Srinogar . ------""'--[!] Capito I
@ Subdivision Towns
• Thana Hl!adquarlers
l::J. Rurol Haal
o Cool 510ru
• Business cenlre/small induslries
/!'i.:j Siudy Area (Rompar) Vi .!:! 0 'E I ! .
5 !
0 miles I Belko 2 Mirkadim 3 Kamalaghall Rikobi Bazor 4 Moklorpur 5 8inotpur 6 Munshigonj 7 Munsir Hool
VOLUME OF 2500
• TRIPS
1500
• 500 •• 50
t 5 ,
:£. "6 .'!! 0 CD
{?
0 5 I ! ! I
kilometres
10 I
10 I
209
to seven miles. Less than 1 percent of the total
number of trips involved distances in excess of 20 miles
(Figures 5.6 and 5.7). The mean and median distances of
commuting from Rampal were 7 and 3 miles respectively.
Modes of transport
A significant feature of commuting from Rampal is
that a commuter often uses more than one mode of
transport during his trip between home and work
place(s). Selection of mode{s) largely depends upon
factors such as geographical distance, stream of
movement, nature of work, and the commuter's economic
condition. Table 5.6 shows the distribution pattern of
the modes of transport used by the 40 commuters for
completing their 8651 trips during the survey year.
Walking is by far the most common mode of transport,
followed by rickshaw,launch (motorized boat) and country
boat (non motorized).
Almost all commuters walked for at least a part
of their regular journey during 1981-82. Personal
transport such as the bicycle was used only by a very
small number of office workers and mill workers. For
rural commuters, the main alternative means of transport
to walking was the rickshaw which had a better network
than launch and boat. The urban commuters, especially
Dhaka and Narayangonj bound movers, mostly depended upon
the launch. At the time of the present survey,
motorized road transport (such as bus, auto-rickshaw
etc.) was not used within Rampal area or its·
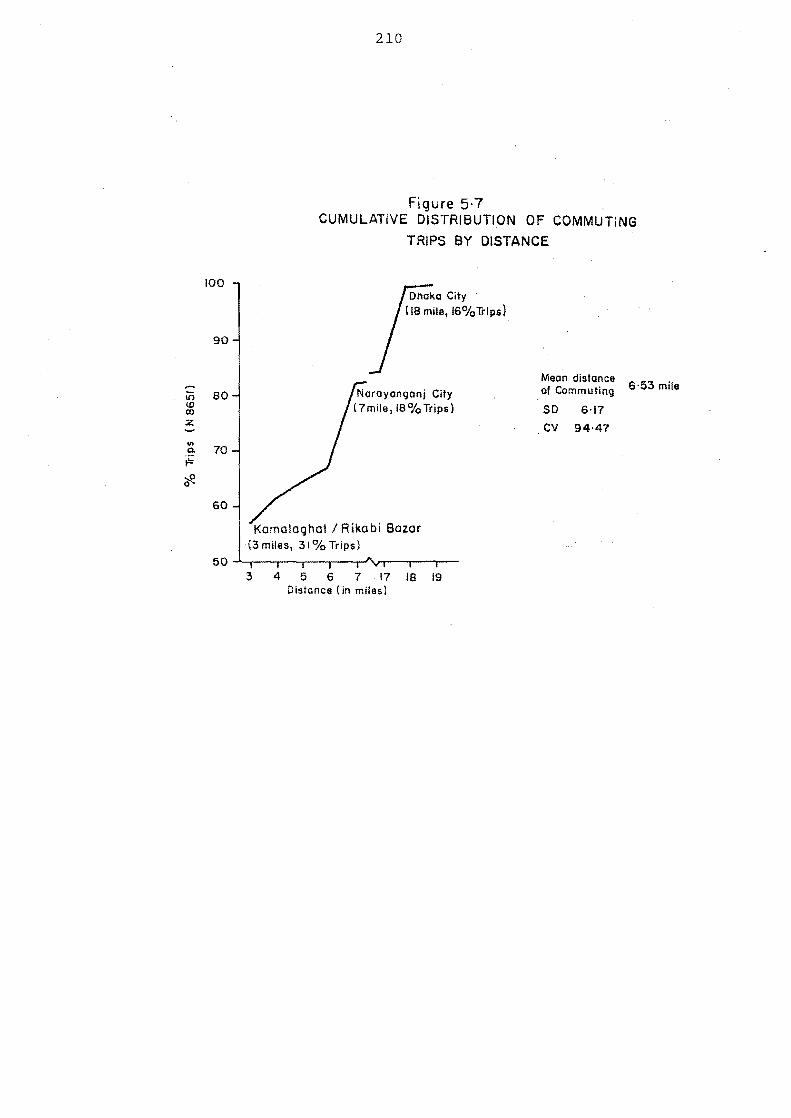
10 Ul CD Z
100
90
80
60
210
Figure 5·7 CUMULATIVE DISTRIBUTION OF COMMUTING
TRIPS BY DISTANCE
Komo\oghaf I Rikobi Bazar (3 miles, 31 0/ 0 Trips)
3 4 5 6 7 17 18 19 Distance (in miles)
Mean distance of Commuting
SD 6·17
. CV 94'47
6'53 mile
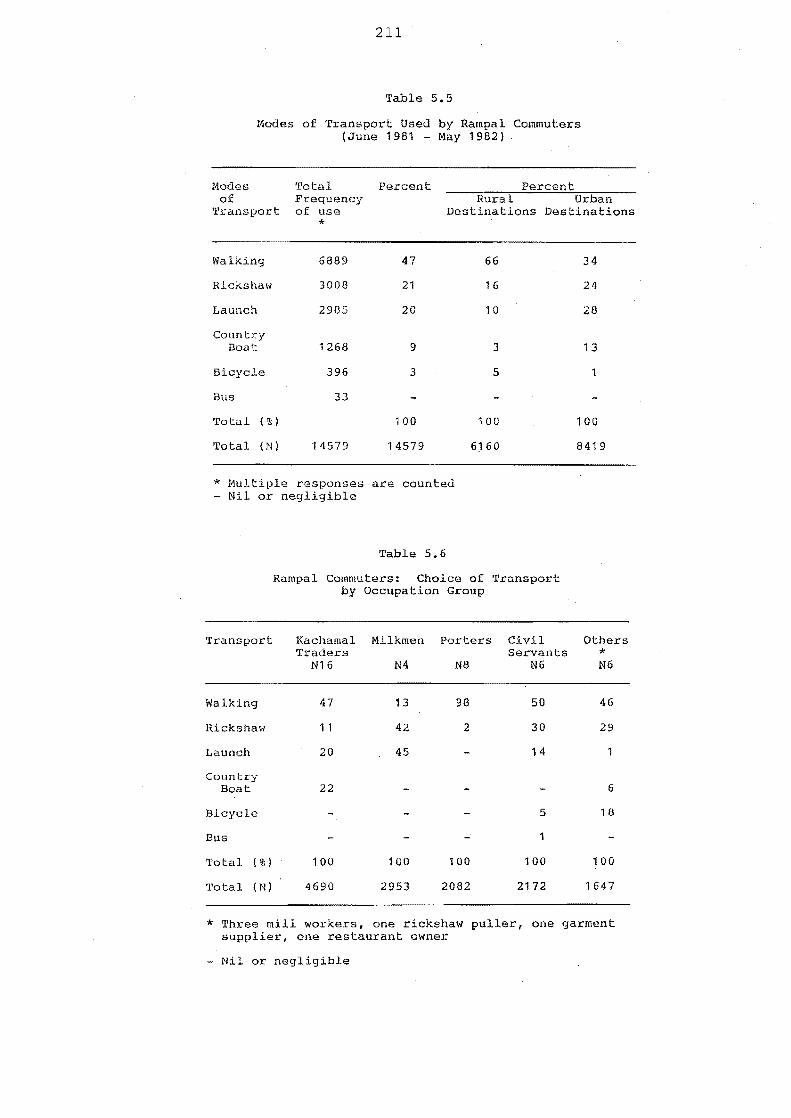
211
Table 5.5
Modes of Transport Used by Rampal Commuters (June 1981 - May 1982)
Modes Total Percent Percent of Frequency Rural Urban
Transport of use Destinations Destinations *
Walking 6889 47 66 34
Rickshaw 3008 21 16 24
Launch 2985 20 10 28
Country Boat 1268 9 3 13
Bicycle 396 3 5 1
Bus 33
Total (% ) 100 100 100
Total (N) 14579 14579 6)60 8419
* Multiple responses are counted - Nil or negligible
Transport
Walking
Rickshaw
Launch
Country Boat
Bicycle
Bus
Total (%)
Total IN)
Table 5.6
Rampal Commuters: Choice of Transport by occupation Group
Kachamal Milkmen Porters Civil Others Traders Servants *
N16 N4 N8 N6 N6
47 13 98 50 46
11 42 2 30 29
20 45 14
22 6
5 18
100 100 100 100 100
4690 2953 2082 2172 1647
* Three mill workers, one rickshaw puller, one garment supplier, one restaurant owner
- Nil or negligible
212
neighbouring rural regions.
5.3 SUMMARY
This chapter has examined spatial and temporal
characteristics of moves by a sample of Rampal commuters
over a period of 12 months. It is evident that
patterns of commuting vary significantly with
occupation, and are strongly influenced by agricultural
cycles. Distance to destination and mode of transport
are the two other important variables which influence
the space-time pattern of journeys. Some of the major
findings from the prospective mobility register for
commuters are as follows:
1. The volume of commuting and seasonal
variations in the incidence of movement depend largely
on the agricultural calendar. In general, there is an
inverse relationship between the intensity of farm
activities and the magnitude of commuting: the greater
the intensity of farm work, the smaller is the magnitude
of commuting (Figure 5.3). However, among the Kachamal
traders, the propensity to commute appears to be high
when agricultural activities are also at a high level,
especially during harvesting of winter vegetables
(Figure 5.1). In the rural areas, traders who deal
with agricultural products such as vegetables, fruits,
cereal crops or others, are likely to move more
frequently during or after the harvest period of these
crops and this pattern may be found in other agrarian
213
societies.
2. The frequency of commuting is also found to
vary with fluctuations in demand for labour in non
agricultural activities at the commuting destinations.
For example, a large number of off-farm commuter jobs at
Kamalaghat-Rikabi Bazar business centre are characteris
tically seasonal occupations, the ebb and flow of which
are strongly tied up with the crop calendar of certain
crops such as potato, paddy, and pulses.
3. It is also evident that there are significant
variations in the frequency of commuting trips over any
period of time by occupation group. These variations
are caused by a number of factors such as the type of
work, the commuters' levels of involvement with farm
activities, distance of destination, and modes of
transport used.
4. Generally, mode of transport has a strong
impact on the spatial organization of commuting flows.
Almost all commuters in Rampal, as elsewhere in rural
Bangladesh, walk for at least a part of their journey to
work. A large proportion of working people, consisting
mainly of labourers, pedlars, or any other low-income
group, hardly spend any money on transport. As a
result a great deal of time is spent on travelling to
and from work. The cost of transport (either in time
for walking, or cash for other modes) deters most rural
people from long-distance commuting.
5. It is evident that a number of commuting
214
trips from Rampal also take people away from home for
lengthy periods to locations far distant from
neighbouring places (Figures 5.6 and 4.1a). These
long-distance commuting trips are, in fact, a kind of
seasonal business tour made by a few better-off
villagers who deal with big business, such as supplying
potatoes from Munshigonj region to different parts of
the country and fruits from northern and central
districts to the capital city (Figure 3.3).
Longer distance commuting is exclusively limited
to the rich minority of people in the villages. A
counterpart of this pattern is the long distance
seasonal migration which is mainly undertaken by the
poor villagers. Before exploring the relationships
between socio-economic status and mobility patterns it
is necessary to establish the demographic, social and
economic characteristics of movers, especially the
commuters and circular migrants. This is the subject
matter of the next two chapters.

CHAPTER 6
CHARACTERISTICS OF COMMUTERS AND CIRCULAR MIGRANTS
Socio-economic characteristics of commuters and
circular migrants can be examined at several levels:
the individual mover, the household, the groups within a
community that are more or less mobile. In this and
the following two chapters each of these levels is
explored in turn. Selected characteristics of
individual movers - their ages, education levels and
occupations - are described in the first two sections.
Their stated reasons for commuting or being circular
migrants are discussed in the final section. Household
attributes, such as size and composition, land ownership
patterns, tenural status, income and economic conditions
are examined in Chapter 7.
6.1 AGE AND EDUCATION
6.1.1 Age composition
The major differences in the age composition of
commuters, migrants and non-movers are readily apparent
in Figure 6.1. Commuters tend to be either young,
middle aged or old villagers. Migrants are largely
concentrated in the young adult ages, while nonmovers
mostly comprise people from the dependent ages (children
under the age of 15 and people over 60 years). The age
specific rates of mobility and immobility as shown in
Figure 6.2 and Appendix 5, depict these demographic
216
patterns more clearly.
Age profiles for mover categories
The age distribution of the commuters and
migrants in the young working ages (15-39 years) are
almost identical (Figure 6.1d). The main concentration
of movers falls within the 25-29 age group, followed by
the immediate upper and lower age groups (i.e. age
groups 30-34 and 20-24). The larger concentration of
movers in the young adult ages is found to be true for
all survey villages.
The proportion of those in the young working ages
is higher among migrants (76 percent) than among
commuters (63 percent). Conversely, the percentage of
movers in the ages over 39 years is higher among
commuters (35 percent) than among migrants (21 percent).
As larger numbers of commuters continue to move well
into their forties and fifties, the median age for
commuters is higher (32 years) than that for migrants
(29 years).
The age distribution patterns of seasonal
migrants (SMs) and circular migrants (CMs) are very
close to each other. From the age of 20 to 59 years
the patterns are almost identical. The differences are
found among teenagers and in old aged people (Appendix
4). In these age groups there are more eMs than SMs and
after the age of 59 the incidence of seasonal migration
virtually disappears. The reason why younger aged and
older aged people show less interest in seasonal

FiQure 6·1 AGE STRUCTURE OF DIFFERENT GROUPS OF MALES
0) Residents' Non- Residents
RESIDENT (N5439) NON-RESIDENT (N 946)
20 15 10 5 o o 5 10 15 20 Percentage of Totol Residents Percentage of Total Non-Residents
c) Active Migranti: Active Commuters
5-9
0-4 .----.---,~--.----+I +---_.----.----.--~
20 15 10 5 o o 5 10 15 20 PercentOQ8 of Total Migrants Percentage of Toto I Commuters
Movements other than work and study purpose are nat counted.
b) All Never Movedl Males' EmPloyeiNever Moved Moles
TOTAL NON-MOVERS'(N4103) EMPLOYED2NON-MOVERS (N 973)
10-1'
5-9
O-~ I···········;················j··················j·················i··················j·················1
25 20 15 10 5 o o 5 10 15 20 Percentage of Total Non- Movers Percentage of Employed Non-Mo"tl8r$
d) Circular. Migrants: Commuters
5-9
0-4 .----.---,,---,----+1 ~I----.---_.----.---_,
20 15 10 5 o o 5 10 15 20 Percentage of Circular Migrants Percentage of Total Commuters
2 Currently employed stayers( working at home or close to home),excludes unemployeds, dependents and students.
3 Circular migrants and seasonal migrants together. @ Median age
N I-" -J
218
migration is closely related to the fact that manual
work is not easy for people at these stages of life.
Mobility rates and age
Figure 6.2 (also see Appendix 5) presents data on
immobility rates and various mobility rates by age for
all males surveyed in the 14 villages. It is evident
that the rates of immobility, commuting, and migration
at different ages follow a distinctive pattern. The
overall relationship between age and commuting rate can
be summed up as follows: rates of commuting are low
before adulthood, rise sharply up to the late twenties
or early thirties and then remain fairly stable up until
the mid-fifties after which they decrease slowly with
increasing age. The rates of circular migration are
low before adulthood, rise sharply from the late teens
to mid-twenties and then continue to rise, although less
sharply, up until the mid-thirties. From around age 35
the rates start to decrease rapidly up to the mid
forties and thereafter decrease slowly with increasing
age.
Among the commuters, there is little variation in
commuting rates from ages 25 to 54. After the age of
34, commuting rates remain much higher than migration
rates. For people aged 35 years and over it is double
(25 percent) the rate of circular migration (13
percent). At this stage of life villagers are more
liable to commute than migrate because higher age, along
with increasing responsibilities to look after family
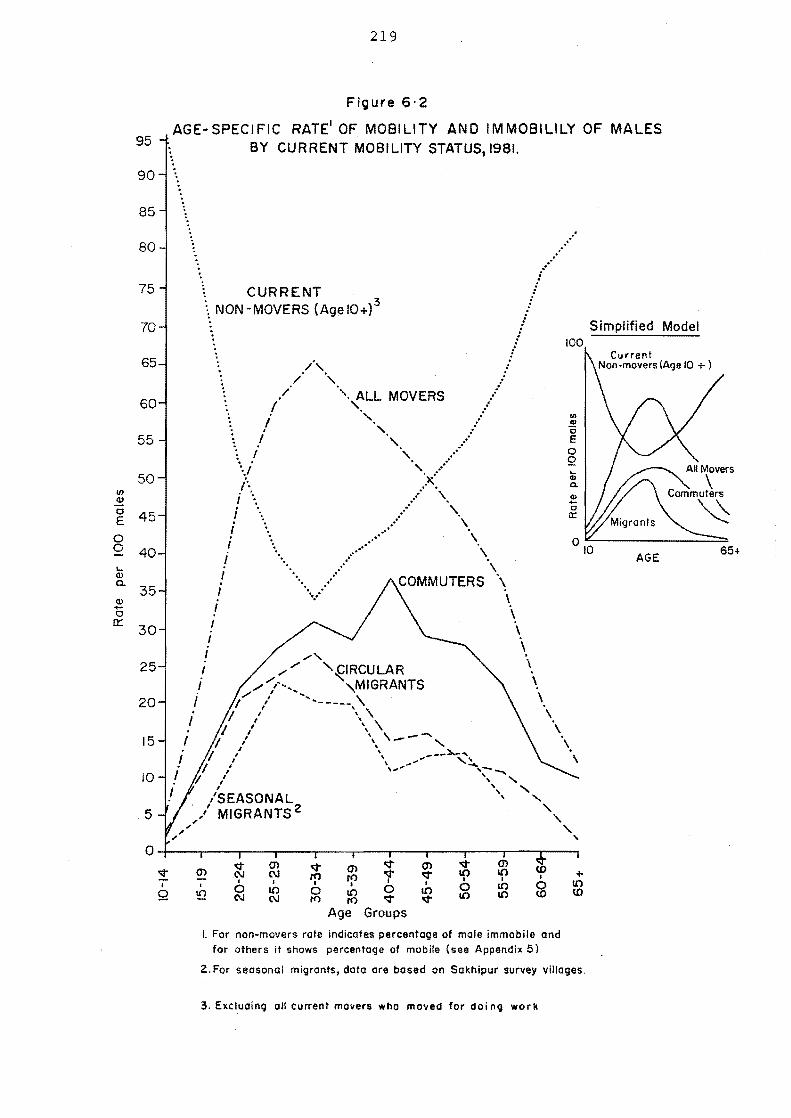
95
90
85
80
75
70
65
60
55
50 en <1:1
0 45 E 0 0 40 .... <1:1 a.
35 <1:1 ..... 0
0::: 30
25
20
15
10
5
0 <;t , 9
219
Figure 6'2
AGE-SPECIFIC RATE' OF MOBILITY AND IMMOBILILY OF MALES
I
BY CURRENT MOBILITY STATUS, 1981.
...... .'
\ CURRENT . 3 \ NON *MOVERS (Age 10+)
/, . / "
./ ". ALL MOVERS • I '. . ... / i '. , \..
I \. .... I ~. ~ .. . ...
\1 \. / l·, ):.: .. ' " i ... ....... " i .
" ......, .' .. ' \
.' .' \ .•...
,,' "
I
" .,/ COMMUTERS \
. . .:
i I
I v \
I I
I I t I
t
...... \. ...... / "-€IRCULAR
/"""~-"'''' ,MIGRANTS " " .............. , I' ... -----
\ \ \
.' .:
\ . \ .
, '/ " \\
\ , ~ ,
'/ ' \ , I \ \ _ ........
'/ " \ - " I \
'/ ' \ ___ ::t.-"
I ,..,.;" ,~
'/ " ,......... ,--"""" 'I " " \.
, ' " /SEASONAL " "
I \
,,/ MIGRANTS 2 \.\.
Simplified Model 100
'" 111 -0 E o Q "III Q.
AGE
/' \. , ,
(i) C\I
I
10 C\I
¢ (i) ¢ If) rr l' 610 0 If) If) <;t
Age Groups
I. For non-movers rate indicates percentage of male immobile and for others it shows percentage of mobile (see Appendix 5)
2. For seasonal migt'onts, data are based on Sakhipur survey villages.
3. Excluding all current movers who moved for doing work
65+
220
and farm in the village, very often creates obstacles to
movement.
The life cycle and commuting
Commuting has become part of the life cycle of
villagers from youth through to old age. Various
reasons could be adduced to explain the wide acceptance
of this form of movement. First, commuting provides
short-distance movement opportunities for all in
general, but for non-adult and older persons in
particular. Among the elderly commuters (those aged
over 59 years), 83 percent limited their journeys to the
neighbouring rural areas. Rural-urban commuters, on
the other hand, are mostly confined to the young and
adult villagers because of the distance to destinations.
In the second place, one can easily earn a living
through commuting without losing one's village
employment or farm engagement. So married males and
household heads usually find commuting much easier than
migration, since they can look after their families and
grehasties as well as obtaining some income through
commuting. This is one of the main reasons why middle
aged and elderly villagers show more interest in
commuting than in migration.
Finally, commuters from the older age groups have
some other barriers which prevent them from migrating
across their cultural domain. They are mostly
unskilled or less skilled and have little or no
education in comparison with circular migrants as well
221
as young commuters. Moreover, they are less familiar
with urban work or any formal job in the rural sector.
As a result, they tend to be concentrated in the
traditional occupations, either wage earning or doing
simple trades.
Migration and age through time
Given the widespread adoption of non-permanent
forms of relocation by working people from rural areas
in Bangladesh, there is an urgent need for information
concerning the retrospective mobility behaviour of
people in different age groups. The mobility histories
of 190 randomly selected circular migrants, 92 of whom
are active migrants while the remaining 98 are
returnees, afford some interesting information on the
incidence of migration by age group at different times
during the past thirty years, are illustrated in Figure
6.3. The groups are defined by the current age of the
migrants (Figure 6.3). Mobility histories are not
shown for people aged less than ten years because the
study did not find any incidence of movement for
employment at that early stage of life.
A cross-examination of mobility histories of
migrants from different age groups shows some
interesting results. It is evident that older males
spent less time in their youth (ages 10-29 years)
on employment related migration and education than their
counterparts currently in those age groups (Figure 6.3).
The patterns further exhibit that the older age males
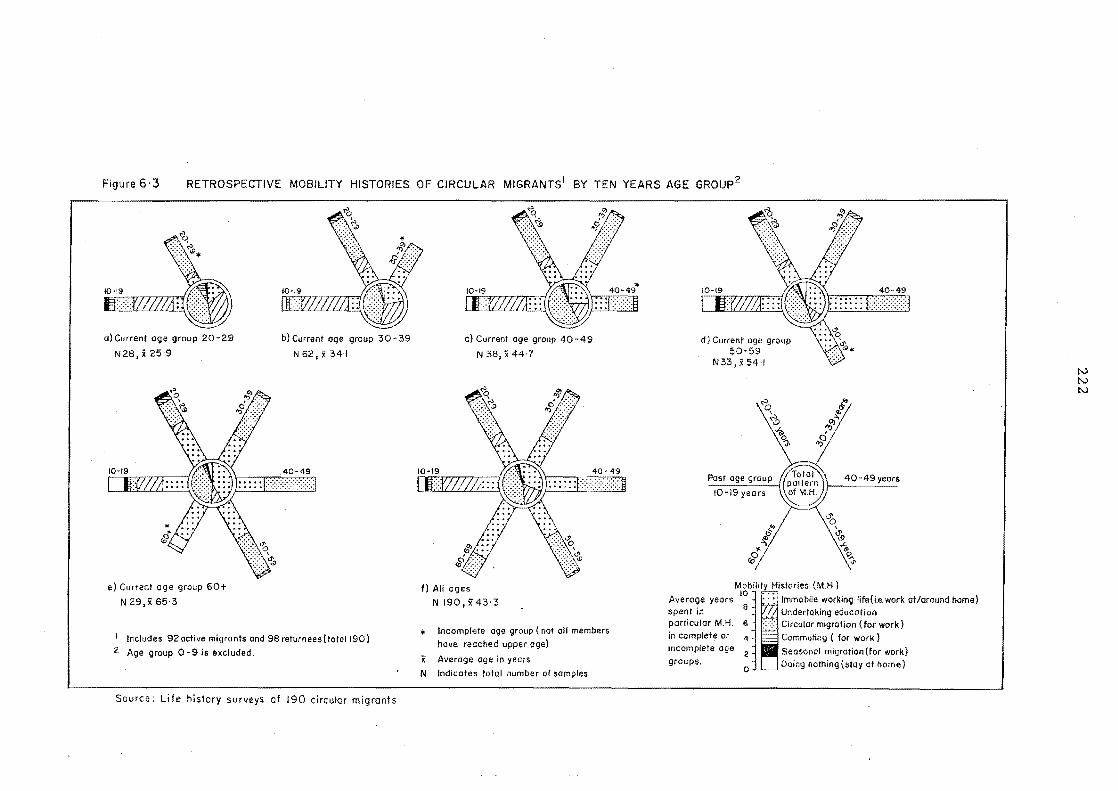
Figure 6·3 RETROSPECTIVE MOBILITY HISTORIES OF CIRCULAR MIGRANTS' BY TEN YEARS AGE GROUp2
a) Current age group 20-29
N28,x25-9
e) Current age group 60+
N29,x65'3
b) Current age group 30- 39
N 62, X 34·1
Includes 92 active migrants and 98 returnees{ 10(01190)
2 Age group 0-9 is eXCluded.
Source: Life history surveys of 190 circular migrants
c) Current oge group 40-49 N 38, il. 44·7
fl All ages
N 190,x43-3
* Incomplete age group ( not 011 members have. reoched upper oge)
x Average age in years
N Indicates lotol number of samples
d) Current group 50-
N33,x54"
40-49 years
Mobility Histories (MH)
Avero9a Ye. ors 10 I ~:: Immobile working life (La. work otlaround home) spent in B Undertaking education particular M.H. 6 ;:::::. Circular migration (for work) in complete or 4 Commuting ( for work)
incomplete age 2 Seasonal migration (tor work)
groups. 0 Doing nolhing(stoy at home)
N N N
223
tended to stay at home for longer periods than the
younger generation. Two to three decades ago, when the
present older migrants and return migrants were young,
many of them did not the necessity of moving to
obtain a livelihood. They found work at or around
home more often than the present generation of young
adults, and sometimes they did not work at all.
Similarly, education was not considered so
important by the present older generation when they were
young. By the 1960s when demographic and economic
pressures had increased rapidly, rural people,
especially the young seeking work for the first time,
had begun to face tremendous job shortages and heavy
competition for getting employment in and around their
native villages.
It is worthwhile mentioning here that in the
rural areas, agricultural land provides the major
source of employment. In most cases a family's land is
owned by the parents who, due to economic reasons, often
delay distribution of land to their heirs. As a
result, a growing number of unmarried or newly married
young adults are being forced to view migration as an
alternative strategy for living. In recent years,
increasing interest in education amongst the young is
also a reflection of the growing competition for those
scarce rural resources of land and employment.
Pressure from a rapidly growing population and
scarcity of land/employment also affected many older
224
generation migrants in their youth, but they have felt
these pressures more seriously in recent times.
Moreover, the significance of such pressures on them
when they were young was definitely less than it is for
present day young families.
The life cycle and circular migration
An attempt was made to establish a general model
for circular migrants showing the relative proportion of
their working lives spent as migrants (mobile) or in the
village (immobile) at different stages of the life-cycle
(Figure 6.4). On average, a circular migrant was found
to spend 60 percent of his total working life on
migratory work and the remaining 40 percent on work in
or around his home village. At different stages of
life, the duration of mobile and immobile working
periods varies quite significantly. Young adults spend
nearly three-quarters of their working life working away
from home, while at old age the same amount of time was
spent working at home or near it. People aged between
35 and 54 years showed a different pattern which almost
corresponds to the average pattern stated above.
Changes in mobility behaviour
Changes in mobility behaviour at various stages
of the migrant's life cycle are shown in Figure 6.4.
Experience of commuting and seasonal migration is more
common among younger circular migrants. With
increasing age circular migrants became much more stable
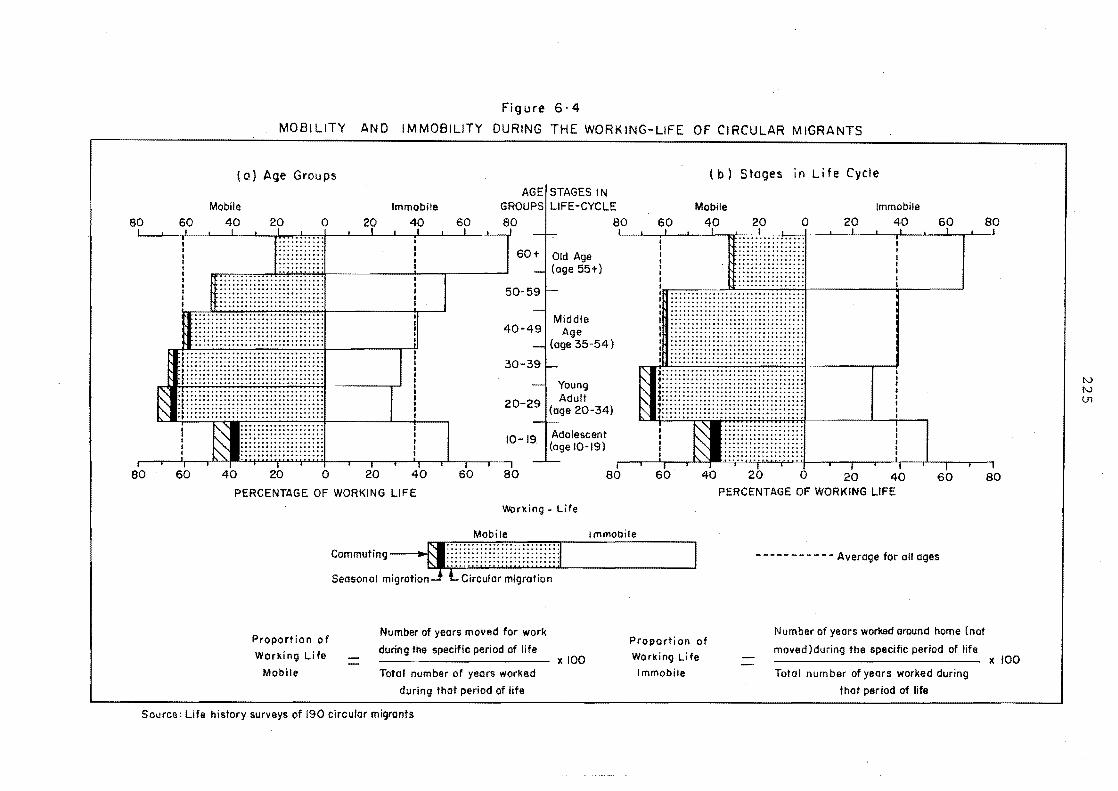
80 60 , I ,
.- • ---r- , 80 60
Figure 6·4
MOBILITY AND IMMOBILITY DURING THE WORKING-LIFE OF CIRCULAR MIGRANTS
(a) Age Groups ( b) Stages in Li fe Cycle
AGEl STAGES IN Mobile Immobile GROUPS LIFE-CYCLE
40 20 0 20 40 60 80 80 , , i' •
I I I I
60:.1 Old Age (age 55T)
50-59
~ Middle 40-49 Age (age 35-54)
30-39
Young
20-29 Adult (age 20-34)
10-19 Adolescent (age 10-19)
I 40 20 0 20 40 60 80 80
60 I
Mobile
40 I
20 I
· .. ~ " " .... ~ ... ~ .. ., ...... . · .... ,. ... ,. ... ~ . " ...... . .................... ••••• * .............. . ...... " .... " ....... . ..................... .................... .................... .................... .................... ..................... , . , , , , ..... , . , .. ~ , , , .................. " .. ..................... · , , . , .... " , , , ........ ~ ... ...................... · ......... "" , "" . , ~ , , .. ..
~j' •••.•••••• 1: ..•......• ): .. l: .. ):
I 60
~ 40
I 20
o
o
Immobile 20 40 60
, I I
I 20
, 40
I 60
80 I
80 PERCENTAGE OF WORKING LIFE PERCENTAGE OF WORKING LIFE
Proportion of
Working Life
Mobile
Working - Life
Mobile Immobile
~··························I-l . . ......................... ~ ....... . Commuting ......................... .. ............................. . ~ .. ~ ........ ~ .. ~ .. ~ ...... . Seasonol migrotion rC'i~~'~;~~' ;;~~~';i~~"
Number of years moved for work
during the specific period of life
Total number of years worke.d
during that period of life
x 100
Proportion of Working Life
Immobile
------- --- Averoge for all ages
Number of yeors worked around home (not
moved )during the specific period of life
Toto I number of years worked during
that period of life
x 100
Source: Life history surveys of 190 circular migrants
N N U1
226
in their mobility behaviour and the small proportion of
their mobile working lives spent in commuting and
seasonal migration are a reflection of their movement
behaviour when they were younger.
The propensity to change one form of mobility
for another, gradually decreases as the mover slowly
proceeds to middle age and old age. This could be the
general pattern for all types of movers, as we know that
with the advance of working life, people become more
fixed in their attitudes and behaviour such as the
selection of a particular occupation, working place and
dwelling place. On many occasions any change of these
results in a change in mobility pattern as well.
6.1.2 Levels of education
Education and mobility type
The relationship between mobility type and
education level is clearly evident in Figure 6.5 and
Tables 6.1 and 6.2. It is apparent that circular
migrants have achieved better education than other types
of movers and also non-movers. There are fewer
illiterates (21 percent) among them in comparison with
commuters (45 percent), seasonal migrants (61 percent)
and never-moved earning members (49 percent).
At the other end of the education ladder, the
percentage of circular migrants with secondary, higher
secondary and tertiary schooling far exceeds the
corresponding figures for the commuters, seasonal
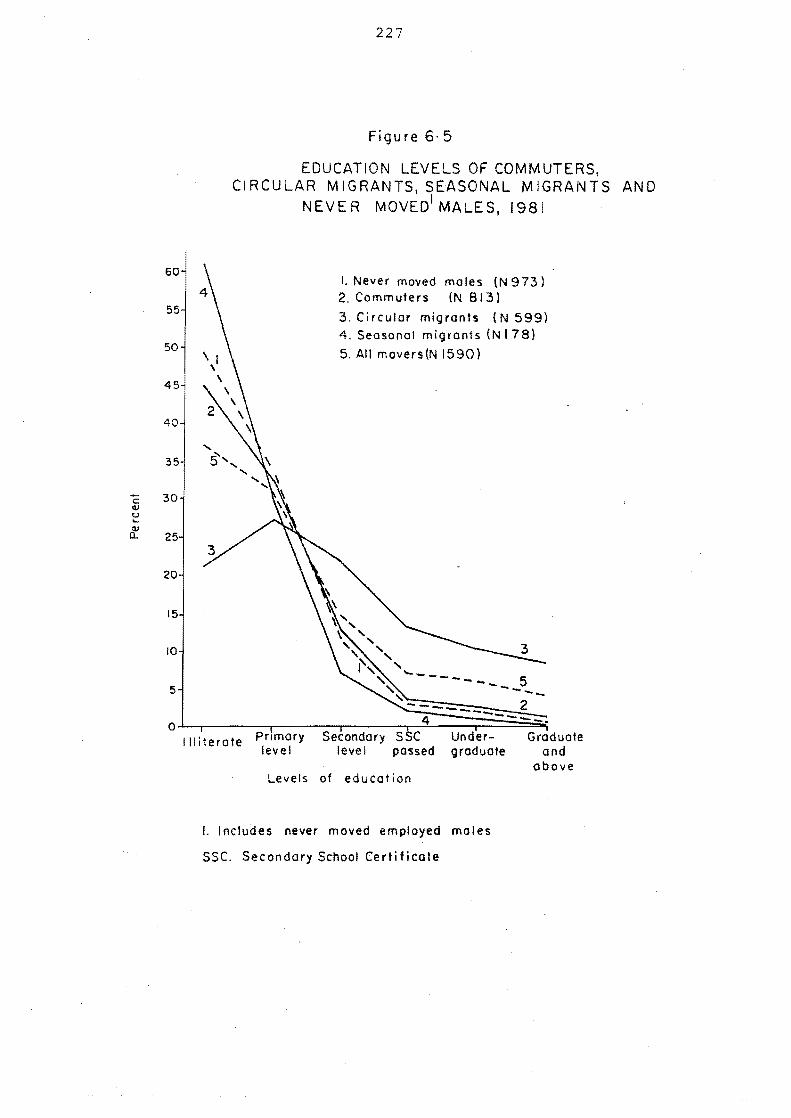
C Q)
u ... 8:
60
55
50
45
40
35
30
25
20
15
10
5
227
Figure 6·5
EDUCATION LEVELS OF COMMUTERS, CIRCULAR MIGRANTS, SEASONAL MIGRANTS AND
NEVE R MOVED1
MALES, 1981
I. Never moved moles (N 973) 2. Commuters (N 813)
3. Circular migrants (N 599) 4. Seasonal migrants (N 178)
5. All movers(N 1590)
- ... _ ..... 5 ---0~ ____ ~ ____ ~ ____ ~4~~==~~
Illiterate Pnmary Secondary S C Under- Graduate level level passed graduate and
Levels of education
I. I neludes never moved employed moles
SSC. Secondary School Certi ficate
above
228
migrants and non-movers (Figure 6.5). Those who
attained tertiary degrees (graduate and post-graduate)
are more likely to be circular migrants than to practise
other mobility patterns. Commuters have a higher level
of education than non-movers and seasonal migrants, but
it is markedly lower than circular migrants.
Literacy and occupation
Numerous studies in the Third World region (see
Connell et al. 1976) have shown that migrants are better
educated than those who have never moved out of their
parental place or those like commuters and seasonal
migrants, who have mostly remained at the village of
origin. The high rate of literacy among the circular
migrants (79 percent) can be explained by analysing some
of their attributes. Of these, the migrant's
occupation seems to be very important.
It appears from Table 6.2 that the migrants' high
literacy rate is related to the presence of a high
proportion of non-manual workers (e.g. salary earners,
traders and a few other occupation groups). The
educational levels of these circular migrants,
especially the salary earners, are far better than the
other occupational groups. For example, the rate of
illiteracy among the non-agricultural day labourers is
five to six times higher than the rate for salary
earners. Both factory workers and traders have a
better education than the day labourers, but their
educational achievements are still much lower compared
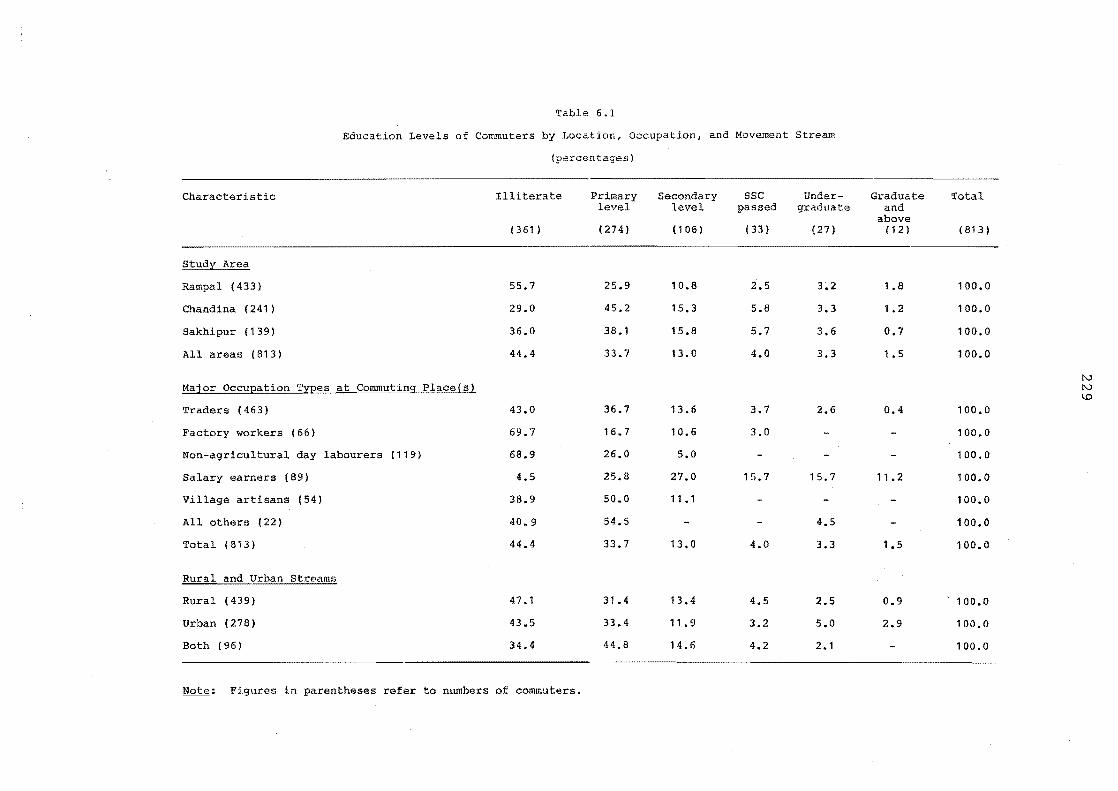
Table 6.1
Education Levels of Commuters by Location, Occupation, and Movement Stream
(percentages)
Characteristic Illiterate Secondary sse Under- Graduate Total level passed graduate and
above (361 ) (274) (106 ) (33) (27) ( 12) (813)
Study Area
Rampal (433) 55.7 25.9 10.8 2.5 3.2 1.8 100.0
Chandina (241) 29.0 45.2 15.3 5.8 3.3 1.2 100.0
Sak.hipur (139) 36.0 38.1 15.8 5.7 3.6 0.7 100.0
All areas (813) 44.4 33.7 13.0 4.0 3.3 1.5 100.0
f\)
Major OccuEation TYEes at Commuting Placets! f\)
\.0
Traders (463) 43.0 36.7 13.6 3.7 2.6 0.4 100.0
Factory workers (66) 69.7 16.7 10.6 3.0 100.0
Non-agricultural day labourers (119) 68.9 26.0 5.0 100.0
Salary earners (89) 4.5 25.8 27.0 15.7 15.7 11.2 100.0
Village artisans (54) 38.9 50.0 11 .1 100.0
All others (22) 40.9 54.5 4.5 100.0
Total (813) 44.4 33.7 13.0 4.0 3.3 1.5 100.0
Rural and Urban Streams
Rural (439) 47.1 31.4 13.4 4.5 2.5 0.9 100.0
Urban (278) 43.5 33.4 11 .9 3.2 5.0 2.9 100.0
Both (96) 34.4 44.8 14.6 4.2 2.1 100.0
Note: Figures in parentheses refer to numbers of commuters.
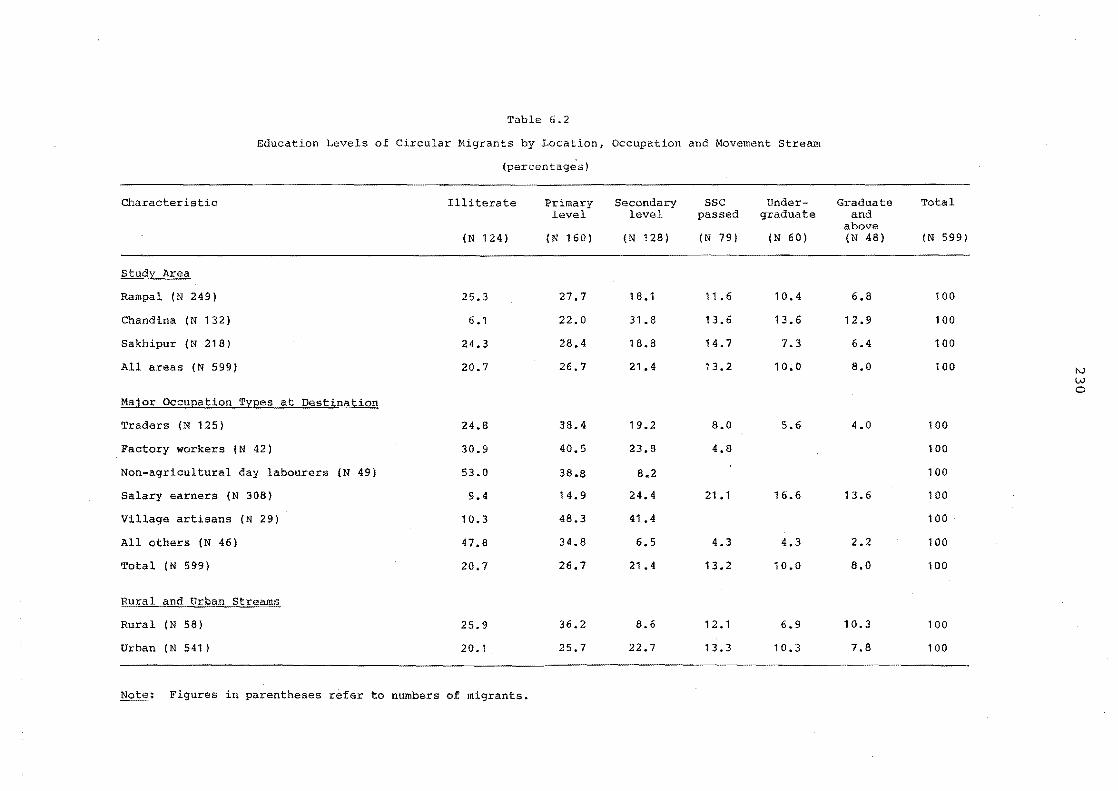
Table 6.2
Education Levels of Circular Migrants by Location, Occupation and Movement Stream
(percentage s)
Characteristic Illiterate Primary Secondary SSC Under- Graduate Total level level passed graduate and
above (N 124) IN 160) (N 128) (N 79) (N 60) (N 48) (N 599)
study Area
Rampal IN 249) 25.3 27.7 18.1 11. 6 10.4 6.8 100
Chand ina IN 132) 6.1 22.0 31.8 13.6 13.6 12.9 100
Sakhipur (N 218) 24.3 28.4 18.8 14.7 7.3 6.4 100
All areas (N 599) 20.7 26.7 21.4 13.2 10.0 8.0 100 N W 0
Major OccuEation TYEes at Destination
Traders (N 125) 24.8 38.4 19.2 8.0 5.6 4.0 100
Factory workers (N 42) 30.9 40.5 23.8 4.8 100
Non-agricultural day labourers (N 49) 53.0 38.8 8.2 100
Salary earners (N 308) 9.4 14.9 24.4 21.1 16.6 13.6 100
Village artisans (N 29) 10.3 48.3 41.4 100
All others (N 46) 47.8 34.8 6.5 4.3 4.3 2.2 100
Total eN 599) 20.7 26.7 21.4 13.2 10.0 8,0 100
Rural and Urban Streams
Rural (N 58) 25.9 36.2 8.6 12.1 6,9 10.3 100
Urban (N 541) 20.1 25.7 22.7 13.3 10.3 7.8 100
Note; Figures in parentheses refer to numbers of migrants.

231
to salary earners.
In the previous section, it was indicated that
circular migrants tend to be younger in comparison to
commuters and seasonal migrants. It can also be
established here that the young are better educated than
older people. Thus, age and education are closely
related, and this is reflected in the education levels
of different groups of migrants.
Due to low levels of education, commuters have a
different occupation structure to that of the circular
migrants (Tables 6.1 and 6.2). Salary earners whose
education levels were found to be far better than any
other occupation group constituted only 11 percent of
the total commuters (89 out of 813). On the other hand,
the traders who formed nearly three-fifths of the
commuters mostly originated from the illiterate or less
literate (primary level) villagers. Furthermore, a
large percentage of commuter wage earners and factory
workers (about 70 percent) have never been to any
school.
The levels of education of commuters, migrants
and others, reflect the structure of education in the
different areas. People from Chandina are
comparatively better educated than those in Sakhipur and
Rampal (see Chapter 3). Hence commuters and circular
migrants from this area tend to have more education.
Education and movement stream
The education level of movers can be further
232
examined in the context of movement (Table 6.3). There
are marked variations in education attainment among the
rural and urban movers. The level of education is
inversely related to movement within rural areas and
directly related to circulation between village and
towns. In general the propensity to move to towns
increases with the rise of education levels. This is
not only because of the shortage of white-collar jobs in
the rural areas, but also because people with a good
education are mostly unwilling to do manual work or very
low status services (e.g. caretaking, peonage).
It is further evident that intra-rural circular
migrants, who comprised only 10 percent of the total 599
migrants, mostly came from the lower and upper levels of
the education strata (Table 6.3). Because moderately
educated people have very limited job options in rural
areas, white-collar jobs such as teaching at schools or
undertaking office jobs at thana centres, are mostly
suitable for graduates who often come as migrants from
distant villages.
In other occupations including low-status
services, people with moderate schooling may well be
averse to accepting an inferior position. Above all,
formal education at moderate to higher levels creates
barriers between a person and the traditions and culture
of his community (Pickford 1984, 198). As a result,
he cannot undertake any occupation which is customarily
the work of an illiterate or a person with a low level

233
Table 6.3
Ratio of Rural:Urban Movers by Education Level for Commuters, Circular Migrants and Seasonal Migrants, 1981
Education Level Commuters
(N 813)
Illiterate 61 : 39
Primary Level 57:43
Secondary Level 60:40
SSC Passed 65:35
Undergraduate 45:55
Graduate and above 33:67
Circular Migrants
(N 599)
12:88
13:87
4:96
9: 91
7:93
13:87
Seasonal Migrants
(N 178)
56:44
53:47
62:38
0: 100
33:67
All movers
(N 1590)
51:49
43:57
33:67
26:74
20:80
17:83
234
of schooling.
6.2 OCCUPATION STRUCTURE
Unlike demographic traits, occupation
characteristics are more complex, particularly in rural
areas where a person often holds two or three jobs,
shares work with family members, is paid in cash, kind
or both, and frequently changes his occupation due to a
variety of reasons. Figure 6.6 shows the occupation
structure of all working men by their current mobility
behaviour. The figure clearly suggests that
occupational selectivity is strong among the mobile and
non-mobile workers. Non-movers are predominantly
involved in local agricultural activities, commuters
mostly travel to trade and do business or earn off-farm
wages, while circular migrants go away for salaried
jobs. This broad patterning of movement by occupation
seems to be true for other rural regions in Bangladesh.
6.2.1 Occupation by mover category
Commuters
In each study location a long list of commuter
occupations was found. Within this list, certain
occupations are commonly selected by a large number of
commuters. In Rampal, vegetable traders, factory
workers, milkmen, porters and rickshaw pullers all
together accounted for 74 percent of the total 433
commuters.
Chandina has a different pattern where the top

en c o en .... eI)
a..
-o
164
124
80
83
148
410
Figure 6·6
OCCUPATION' STRUCTURE OF ACTIVE MOVERS AND CURRENT NON-MOVERS3 IN THE STUDY AREAS ,1981
RAMPAL o m w ~ ~ ~ 00 ro ~ ~ ~%
I I I 1 , f I J t , I 7 7' 7' 7' 7' J 7' > :; :; " 7' :; 7' :; 7 7' 71 i
Grehosti (Farming)
Agricultura! Labour
Non-agricultural
Factory Labour
Salary Earning
Trade and Business
CHANDINA
33 r / / / / ./l Village Artisan
39 I / / / / / / I All Other Types 2
SAKHIPUR ALL AREAS
:; 7' :; > :; 7' :; 7' 7 7 7' 7' 7' 7' , 7 7Ll > > > , Sill .... G) .c 275 Grehosti (Forming) E I r :J > ,1',',' ,e ,/ r Z 210 > > ,£ , ,
7 > ,'Ie;, " " ,/
97
27
137
194
14
89
Agricult uro I Labour
Non-agricultural Labour
Factory Labour
Salary Earn ing
Trade and Business
Village Artisan
All Other Types 2
355
95
66
8
lSI
117
69 U! c 0 fI)
8 ... G)
a..
..... 0
794 ...
429 ~ E
243 ::l Z
liS
466
721
116
136
lZJ Current Non-movers o Active Commuters Active Circular Migronts(CMs) • Activ~ Seasonal Migrants (SMs)
I. Data shows principal occupation for non-movers, and destination occupation for movers.
2. Includ ing do to not stated.
3. InCludes never moved persons and ex-movers (who stopped moving temporarily or permanently)
tv w U1
236
five commuting occupations are - rickshaw pullers,
handloom weavers, cloth traders, drivers (truck, bus and
tractor) and vegetable traders. They included nearly
60 percent of the area's total commuters. Sakhipur
shows a further different pattern in which goat traders
and rabi crop traders are common occupations among the
commuters. Each of these occupations accounts for 25
percent of the jobs recorded by commuters. The
above mentioned occupation patterns are strongly
influenced by the areas agricultural structure and the
nature of transport linkages with neighbouring towns and
rural trade/service centres (described in detail in the
preceding chapters).
Circular migrants
The broad patterns of destination-occupations of
circular migrants from Rampal, Chandina and Sakhipur
are shown in Table 6.4. The majority of migrants are
salary earners. Traders, second in importance,
accounted for one-fifth (21 percent). Non-agricultural
labourers and factory workers each comprised less than
ten percent of the total 599 migrants. However, there
is substantial variation in occupation patterns among
the migrants in the three study places. In Rampal,
salary earners and traders were found to be almost
equally important. Each group accounted for 38 percent
of the total migrants from the region. Other
occupation groups such as factory workers, off-farm
labourers, and village artisans were also weighted
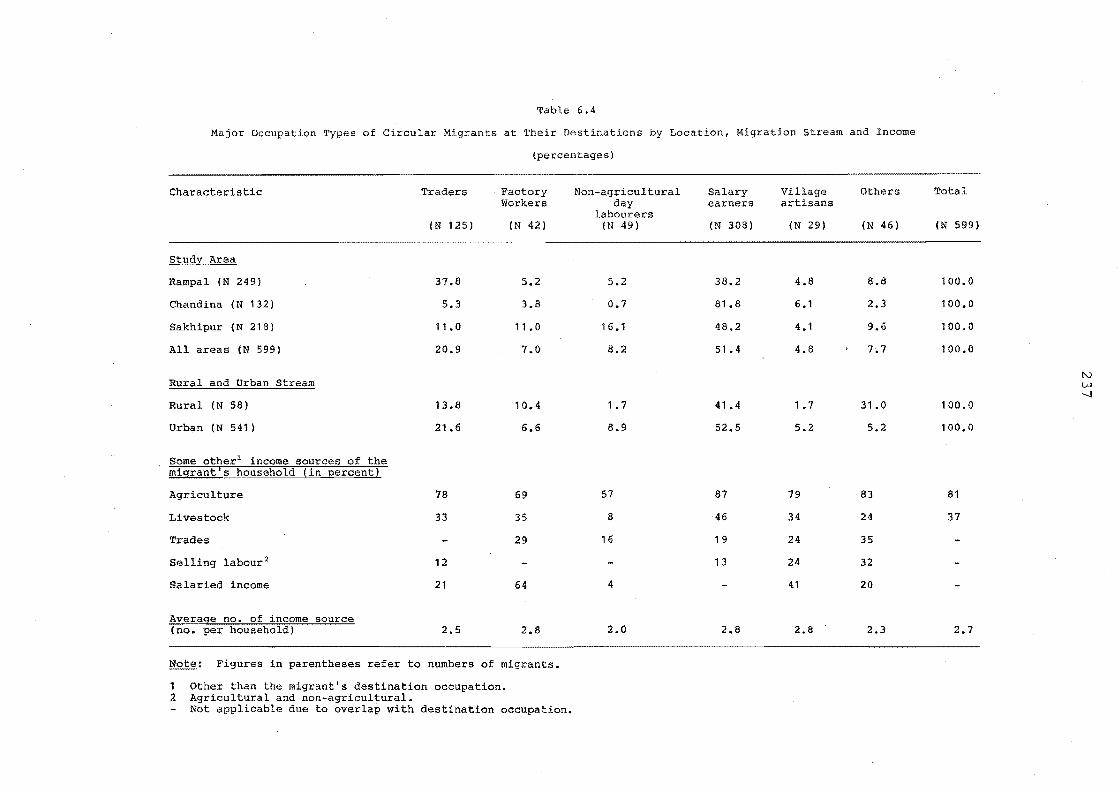
Table 6.4
Major Occupation Types of Circular Migrants at Their Destinations by Location, Migration Stream and Income
(percentages)
Characteristic
study Area
Rampal (N 249)
Chandina (N 132)
Sakhipur (N 218)
All areas (N 599)
Rural and Urban Stream
Rural (N 58)
Urban IN 541)
Some otherl income sources of the migrant's household (in percent)
Agriculture
Livestock
Trades
Selling labour2
Salaried income
Average no. of income source (no. per hQusehold)
Traders
(N 125)
37.8
5.3
11.0
20.9
13.8
21.6
78
33
12
21
2.5
Factory Workers
(N 42)
5.2
3.8
11.0
7.0
10.4
6.6
69
35
29
64
2.8
Note: Figures in parentheses refer to numbers of migrants.
1 Other than the migrant's destination occupation. 2 Agricultural and non-agricultural.
Not applicable due to overlap with destination occupation.
Non-agricultural day
labourers (N 49)
5.2
0.7
16.1
8.2
1.7
8.9
57
8
16
4
2.0
Salary earners
(N 308)
38.2
81.8
48.2
51.4
41.4
52,S
87
46
19
13
2.8
Village artisans
(N 29)
4.8
6.1
4.1
4.8
1.7
5.2
79
34
24
24
41
2.8
Others
(N 46)
8.8
2.3
9.6
7.7
31.0
5.2
83
24
35
32
20
2.3
Total
(N 599)
100.0
100.0
100.0
100.0
100.0
100.0
81
37
2.7
tv W --J

Table 6.5
Major Occupation Types of Commuters at Their Destinations by Location, Movement Stream and Income
(percentages)
Characteristic
Study Area
Rampal (433)
Chand ina (241)
Sakhipur (139)
All areas (813)
Rural and Urban stream
Rural (439)
Urban (278)
Both (96)
Some otherl income sources of the commuter's household (in percent)
Agriculture
Livestock
Trades
Selling labour 2
Salaried income
Average no. of income source (no. per household)
Traders
(463)
58.4
36.5
87.8
57.0
49.4
75.5
39.6
83
48
27
9
2.6
Factory Workers
(66)
14.8
0.8
8.1
13.4
2.5
58
24
23
15
2.2
Note: Figures in parentheses refer to numbers of commuters.
1 Other than the commuter's destination occupation. 2 Agricultural and non-agricultural
Not applicable due to overlap with destination occupation.
Non-agricultural day
labourers (119 )
13.2
24,9
1.4
14.6
16.8
2.5
39.6
48
16
15
5
1.9
Salary earners
(89)
8.8
18.2
5.0
10.9
9.8
11 .9
13.5
81
46
24
8
2.7
Village artisans
(54)
2.8
17.4
6.6
2.3
3.2
5.2
65
43
28
28
6
2.7
Others
(22)
2.1
2.1
5.7
2.7
1.8
4.3
2.1
91
55
50
27
16
3.2
Total
(813)
100.0
100.0
100.0
100.0
100.0
100.0
100.0
74
41
2.6
IV W 00
239
equally but each comprised a very small proportion of
the total {five percent as against 38 percent for salary
earners or traders}.
Circular migration in Chandina is common among
white-collar workers only. At least four-fifths (82
percent) of the migrants were found in that occupation
category. The rest of the movers were mainly traders,
village artisans, and factory workers. In Sakhipur
half of the migrants (48 percent) were found to move for
salaried jobs and services. Among other categories of
occupations, the proportion of day labourers is fairly
significant (16 percent) and they out-numbered all other
occupation-migrants including traders and factory
workers.
Salaried employment and personal networks
Salary earners include a wide variety of
occupation-migrants, from peons (office-messengers) to
high ranking public servants, less skilled to highly
skilled persons, and defence personnel such as police
and military men. The majority of salary earners
(around two-thirds) fell into the first category, and
nearly half of those came from the low cadre jobs such
as peons, guards, and petty clerks. The other two
broad occupation fields (i.e. skilled work and
police/military) equally shared the remaining one-third
of salary earners.
The nature of occupation of salary-earning
migrants is not significantly influenced by local and
240
commercial settings. In this case the educational
qualification of an individual mover would be the best
determinant. Other associated factors are the
functional characteristics of the neighbouring towns and
the influence of relatives and friends in getting jobs.
It was often perceived, while interviewing, that
the selectivity of migrants' occupation was to a great
extent influenced by the presence of relatives and
friends who lived (temporarily or permanently) in towns.
Generally, the significance of this influence depends on
a number of factors, such as job and economic status of
the relative, his socio-political networks or ties by
dint of which he helps others to get jobs, and the
strength of links with the native village and villagers.
In Chandina there were 33 defence personnel
(mostly soldiers) among the total 132 circular migrants.
The study observed that this high rate of participation
in military jobs by Chandina people was influenced by a
high-ranking military officer. He helped hundreds of
his rural relatives to get military or civil jobs mostly
in urban areas. The process of getting jobs through
honest or dishonest favours of relatives and friends was
found to be quite common everywhere in Bangladesh.
Data from all the survey locations indicated that at
least 70 percent of migrants among the salary earners
and factory workers were helped or favoured by someone
known to them.
241
Traders and labourers
Within the three study areas, only Rampal has a
sizeable proportion (38 percent) of migrant-traders.
Most of them (55 percent) are dealing with fruits and
vegetables, a traditional area of work for Rampalese.
Other migrant-traders, including those from Chandina and
Sakhipur, have corne from a wide variety of common trades
and businesses such as clothing, groceries, and
stationery.
The most common migrant-occupation among the non
agricultural day labourers is rickshaw-pulling. Out of
a total of 49 migrant-labourers, 30 were rickshaw
pullers. Sakhipur alone accounted for 22 migrant
rickshaw pullers. The scope for employment by day
labourers in and around Sakhipur is very limited and
hence the labourers are forced to choose a form of
migration (seasonal and non-seasonal) to obtain a
livelihood. Other wage-occupations undertaken by
labourers are mainly construction work and porterage.
Table 6.4 also shows the distribution of migrants'
occupations by their streams of movement. Non
agricultural labourers and village artisans (e.g.
weavers, tailors, barbers and blacksmiths) rarely
migrate to rural areas. These occupations, as seen in
Chapter 4, are more suitable for commuters than migrants
(also see Table 6.5).
242
6.2.2 Dual occupation structure
Commuters and part-time farming
In the rural areas, commuters have access to a
wider variety of occupations than other types of movers
and non-movers. They have the advantage of working
both in and outside their home village and hence a large
number of commuters spend part of their regular (not
necessarily daily) working time in local farm activities
in addition to their off-farm jobs. In the rural
areas, the practice of part-time farming combined with
off-farm jobs has a long history. A recent study by
Ali (1980) shows that the number of part-time farmers
has increased rapidly compared to full-time farmers from
8.4 percent to 84 percent within the three decades since
1950 (see Appendix 2). Rapid population growth,
fragmentation of land holdings, and falling farm incomes
forced the farmers to seek additional work off their
holdings.
It is difficult to assess the contributions of
part-time farmers to the total volume of commuters from
all rural areas in Bangladesh given inadequate census
data. However, in general, it can be assumed that
since a farmer through commuting finds it possible to
have Rn off-farm job in addition to maintaining his farm
work, a large number of part-time farmers would be
commuters. Thus the volume of commuters is also likely
to have increased rapidly since 1950.
Empirical data from the 14 study villages
243
strongly supports this assumption. Seventy five percent
of the commuters were found to have local farm work in
addition to their respective off-farm jobs (Table 6.6).
Further analysis also revealed that only 14 percent of
commuters consider farming as their principal
occupation. The remaining 61 percent undertook farming
as a secondary occupation. In other words, the
overwhelming majority of commuters (81 percent) leave
their village regularly to work in the job which
generates most of their income (Table 6.8). For off
farm labourers and salary earners the rate stands at a
higher level (93 to 95 percent) than the others.
Although the dual occupation structure among the
commuters is quite common, there are some commuters who
do not have any second occupation. A close analysis of
the occupation characteristics of commuters reveals that
those who do not engage in any sort of agricultural
activity often find it difficult to get a second
occupation. Of the 120 sample commuters, 24 of them
had one occupation each (Table 6.6). They came from
the landless and illiterate segment of the village
community and engaged in either small pedlar trades or
non-agricultural labour through daily commuting.
Villagers who usually rent out land tend to avoid
renting land to them as they are poor and cannot provide
necessary inputs (e.g. credit, ploughs, better seeds,
and irrigation) to farm the land. Under these
circumstances it becomes difficult for landless poor
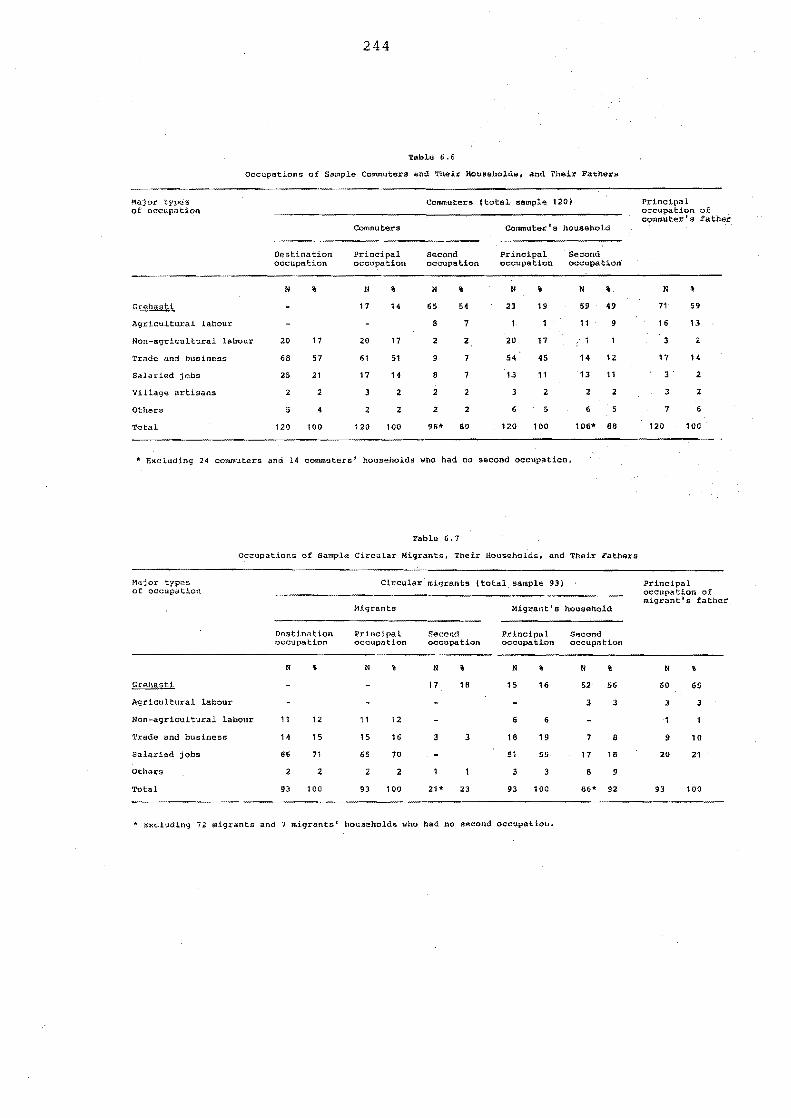
244
Table 6.6
Occupations of Sample Corrut1uters and Their Household •• and Their Fathers
Major types Commuters (total- sample 1201 Principal of occupation occupation of
commuter's father Commuters Commuter's household
Destination Principal Second Prinoipal Second occupation occupation occupation occupation occupation
N % N 'I; II 'I; II 'I; N '1;. N 'I;
Grehasti 17 14 65 54 23 19 59 49 71 59
Agricultural labour 8 7 11 16 13
Non-agricultural labour 20 17 2Q 17 2 2 20 17 :I Z
Trade and business 68 57 61 51 7 54 45 14 12 17 14
Salaried jobs 25 21 17 14 8 7 13 11 13 11 3 2
Village artisans 2 2 3 2 2 3 :2 2 2 3 2
Others 5 2 2 2 2 6 5 6 5 7
Total 120 100 120 100 96* 80 120 100 106* 88 120 100
• Excluding 24 commuters and 14 commuters· households Who had no second occupation.
Table 6.7
Occupations of Sample Circular Migrants, Their Households, and Their ~ather5
Major types Circular migrants I total. sample 931 Principal of occups tion occupation of
migrant's father Migrants Migrant' 5 household
Destin1l tion Principal Second Principlll Second occupation occupation occupation occupatipn occupation
N 'I; N % II N " N II %
Grehasti 17 1 B 15 16 52 56 60 65
Agricultural labour 3 3 3
Non-agricultural labour 11 12 11 12 6 6
Trade and business 14 15 15 16 3 3 18 19 7 8 9 10
Salaried jobs 66 71 65 70 51 55 17 18 20 21
others 2 2 2 2 3 3 a 9
Total 93 100 93 100 21* 23 93 100 86* n 93 100
* Excluding 72 migrants and 7 migrants' households who had no second occupation.
245
commuters to find a satisfactory second occupation.
Circular migrants
Unlike commuters and seasonal migrants, the
practice of dual or multiple occupations among the
circular migrants was not observed very much (Table
6.7). A sample of 93 migrants shows that only 21 have
additional employment. The majority (72 out of 93)
have one job over the whole year. There are two
important reasons why circular migrants are unlikely to
seek additional or secondary employment. First, it is
difficult to get a matchable combination of two off-farm
jobs (one as principal and the other as additional)
where a person can work simultaneously without
interfering with the terms of either job. In recent
years, urban population growth has been racing far ahead
of employment growth, and thus in towns it is very
difficult to get even one job at a time. Of those 21
additional jobs, only four are in towns.
Second, a large number of migrants from different
occupation groups already have other income sources
(other than work at their destination) in their villages
such as agriculture, livestock, trade etc. (Table 6.4).
Non-migrant family members such as stayers, commuters
and returnees usually look after those additional income
enterprises. Moreover, incomes from agricultural land
and the rearing of cattle can be reaped through the
process of renting out both land and cattle. There is
fierce competition among the labourers, sharecroppers,
246
tenants and marginal farmers for renting these two
resources at any condition set by the land and cattle
owners.
The nature of additional employment of the 21
sample migrants shows that 17 movers have been engaged
in part-time farming in their native villages and 4 have
been doing part-time business in their destination
towns. At the place of migration their principal
occupation types were as follows: 14 salary earners, 3
rickshaw-pullers, 2 traders, 1 factory worker and
another unclassified. Those 17 migrants who had
additional employment in agriculture were found to pay
frequent visits to their native villages and stay there
for a few days (on average five days per visit).
During that time they accomplished most of their farm
activities. A further analysis of the data also
reveals that none of these 17 migrants had an extra
worker in their village family, and thus they had to
practise two occupations.
Non-agricultural activities
A shift in principal occupation from farm to non
farm activities is not new in the rural areas; but
recently it has spread over the whole country mainly due
to the pressure of population on farm land. This type
of change has been encouraged in the villages by
commuting and migration. Tables 6.6 and 6.7 examine
this issue by introducing a comparative picture of
occupations of the movers (commuters and circular
247
migrants), their households, and their fathers. The
results indicate that the fundamental difference in
occupation structures between current movers and their
fathers is that most of the former have undertaken
agriculture as a second occupation or income source for
their households, whereas their fathers mostly relied on
farming as their principal source of employment or
income. This change in the principal occupation of the
movers and their fathers has occurred during the last
two to three decades, or roughly one generation period.
The main reason, as mentioned earlier, is an
ever-growing population. As the population grows the
amount of agricultural land per capita shrinks. When
this happens employment related to land also shrinks,
creating an occupational shift from the agriultural to
non-agricultural sector. The occupational mobility
from the agricultural to non-agricultural sector in
Bangladesh is also apparent from Tables 2.2, 2.3 and 2.4
and this phenomenon has been discussed in the context of
urbanization in Chapter 2.
In Tables 6.8 and 6.9 the movers destination
occupations and principal occupations are examined. The
data reveal that most of the movers usually leave their
village with a view to undertake their main occupations.
Among the commuters the proportion of those who moved
for undertaking a principal occupation was 81 percent
(655 out of 813 commuters), while among the migrants
this proportion was found to be as high as 95 percent
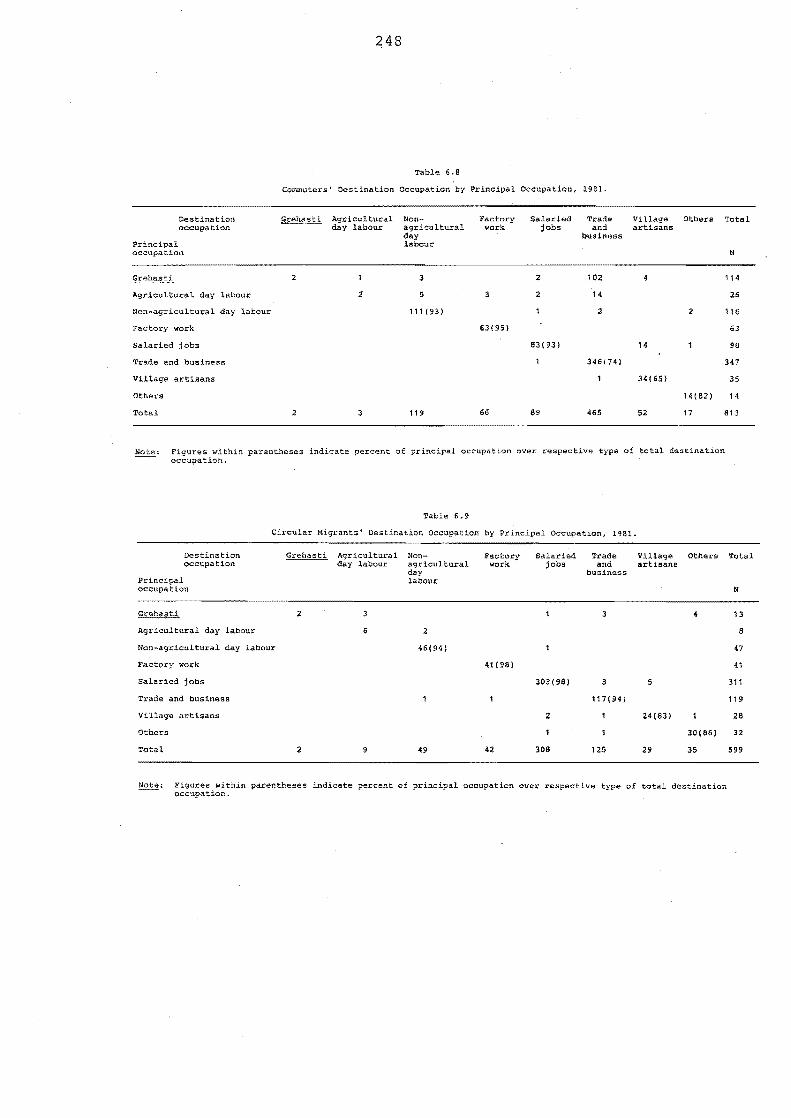
248
Table 6.S
Commuters l Destination Occupation I:y Principal Occupation, 1981.
Destination Grehasti Agricultural Non- Factory Salaried Trade Village Others Total occupation day labour work jobs and artisans
business Principal occupation N
Grehasti 2 3 2 102 4 114
Agricult.ural day labour t 5 3 14 26
Non-agricultural day labour 111 (93) 2 2 116
Factory work 63(95) 63
Salaried jobs 83(93) 14 96
Trade and business 346(74) 347
Village artisans 34(65) 35
Others 14(82) 14
Total 2 3 119 66 89 465 52 17 813
Note: Figures within parentheses indicate percent of principal occupation over respective type of total destination occupation~
Table 6.9
Circular Migrants' Destination Occupation by Principal Occupation, 1981-
Destination Grehasci Agricultural Non- Factory Salaried Trade Others occupation day labour agricultural work. jobs and
day business l'rincipal labour occupation
Grehasti ;/
Agricultural day labour 6 2
Non-agricultural day labour 46(94)
Factory work. 41 (98)
Salaried jobs 303(98) 3 5
Trade and business 117(94)
Village artisans 2 24(83)
Others 30(86)
Total 2 9 49 42 308 125 29 35
Figures within parentheses indicate percent of principal occupation over respective type of total destination occupation.
Total
N
13
8
47
41
311
119
28
32
599
249
(569 out of 599 migrants). The ratio further varied
from one occupation group to another as shown in those
tables.
It is also apparent from Tables 6.6 and 6.7 that
the principal occupations of the movers largely
determine the principal occupation patterns of their
households. On the basis of the above findings a
general statement can thus be made that in rural
Bangladesh a structural change of occupation from
agricultural to non-agricultural work has been evolving
rapidly through the process of circular movement.
6.3 REASONS FOR MOVEMENT
Additional perspectives on this structural change
can be obtained from the reasons given by commuters and
circular migrants for their spatial mobility_ There
are several well-known problems associated with data
collected retrospectively on reasons for movement,
especially the problem of post-facto rationalisation.
This is discussed in Appendix 6. In this section the
motives for commuting and circular migration are
examined using stated reasons for mobility. It should
be recalled that this study is concerned only with
movement for work, and thus the reasons for and choices
of commuting and circular migration are related to the
employment aspirations of the movers.
6.3.1 Why do villagers migrate?
Each migrant (active circular migrant or
250
returnee) in the sample was asked to state his main
reason (s) for migration from his village-. The question
was open-ended and every migrant was free to state more
than one reason. Surprisingly, when all the responses
were scanned, the results showed that only 36 percent of
the migrants (mostly returnees) cited more than one
reason, and more surprisingly almost all the responses
of the 191 migrants were easily grouped into five broad
categories (Table 6.10). This led to the inescapable
conclusion that there has been a serious on-going
economic, employment, and resource crisis in rural
Bangladesh.
The most frequently cited reasons for leaving the
village were economic hardship of the family, shortage
of agricultural land, and the migrants' negative
attitudes towards a peasant farmer's occupation. These
account for the stated reasons for migration of 76
percent of the respondents. One-fifth of the sample
mentioned the paucity of locally available work as their
main reason for migrating. In fact, the overall lack
of local employment opportunities in the migrants'
villages would be the most important root-cause of out
migration from any rural community in Bangladesh. The
reason for this is that the shortage of land in an
agrarian country like Bangladesh is associated with the
shortage of working opportunities in the rural areas.
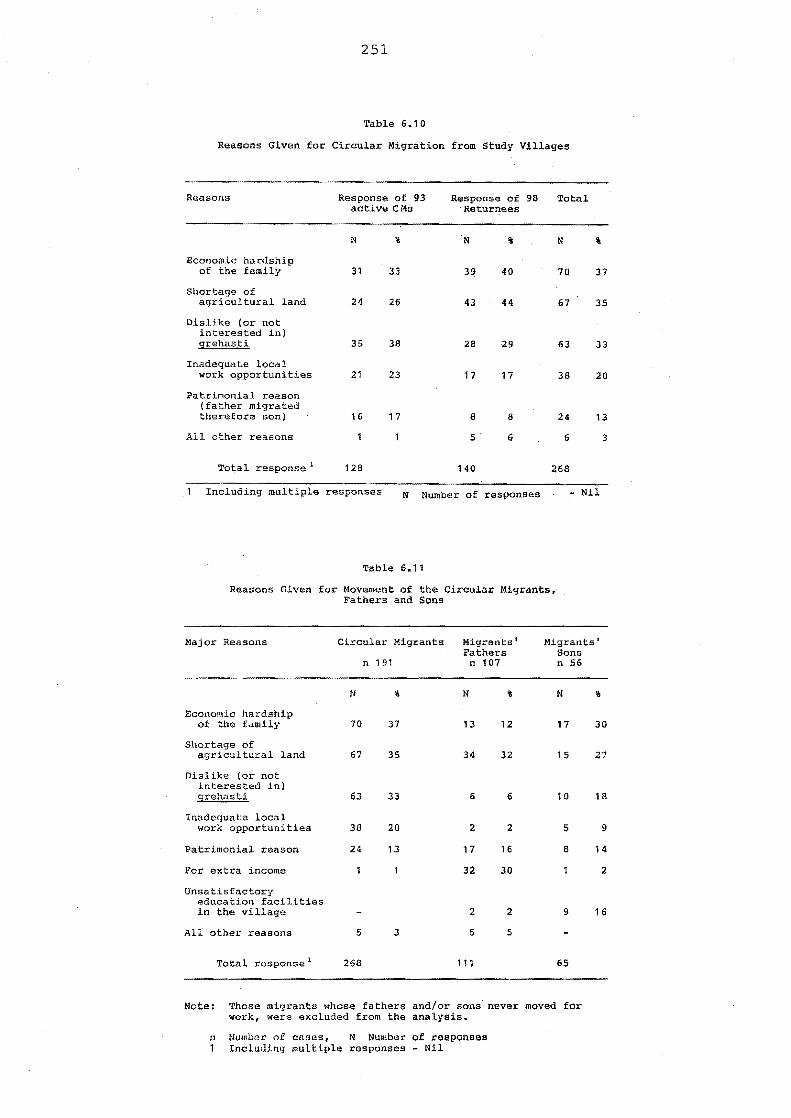
251
Table 6.10
Reasons Given for Circular Migration from Study Villages
Reasons Response of 93 Response of 98 Total active eMs Returnees
N % N % N %
Economic hardship of the family 31 33 3~ 40 70 37
Shortage of agricultural land 24 26 43 44 67 35
Dislike (or not interested in) grehasti 35 38 28 29 63 33
Inadequate local work opportunities 21 23 17 17 38 20
Patrimonial reason (father migrated therefore son) 16 17 8 8 24 13
All other reasons 5· 6 6 3
Total response 1 128 140 268
Including multiple responses N Number of responses -Nil
Table 6.11
Reasons Given for Movement of the Circular Migrants, Fathers and Sons
Major Reasons Circular Migrants Migrants' Migrants' Fathers Sons
n 191 n 107 n 56
N % N % N %
Economic hardship of the family 70 37 13 12 17 30
Shortage of agricultural land 67 35 34 32 15 27
Dislike (or not interested in) grehasti 63 33 6 6 10 18
Inadequate local work opportunities 38 20 2 2 5 9
Patrimonial reason 24 13 17 16 8 14
For extra income 32 30 2
Unsatisfactory education facilities in the village 2 2 9 16
All other reasons 5 3 5 5
Total response 1 268 111 65
Note: Those migrants whose fathers and/or sons· never moved for work, were excluded from the analysis.
IT Number of casas, N Number of rellPonses 1 Including mUltiple responses -Nil
252
Chain migration
Apart from the reasons mentioned so far, a
significant proportion of the migrants (13 percent)
claimed that they were induced to migrate by their
fathers and forefathers. In other words, they had/have
been following a "chain migration" process linking one
generation with the next. It was also found that chain
migration as a stated reason for movement was higher
among current migrants (17 percent) than past migrants
(8 percent). This suggests that due to the deepening
unemployment crisis within rural communites there is a
high probability that a son from a rural-base migrant
family will follow his father's or elders' mobility
behaviour, and the father will try to place his sones)
in the same migrant occupation.
Studies which directly address the issues of
chain migration in underdeveloped countries are severely
limited. However, on the basis of some indirect
accounts (Rimmer et al. 1978; Harrison 1981, 199-205)
concerning the rapid expansion of informal sector
occupations in the Third World cities, and its
attraction to millions of unskilled and semi-skilled
workers from the countryside, it can be said that there
is an immense prospect for the growth of chain migration
in many Third World countries including Bangladesh.
The practice of chain migration was apparent in West
Java (Hugo 1978a, 173) and India (Banerjee 1983).
253
Economic stress
Numerous studies have indicated that declining
economic opportunities within the countryside has been
the predominant cause of work-related migration by
village people in many underdeveloped countries. This
finding is also substantiated by data from Bangladesh
(Tables 6.10 and 6.11). In Table 6.11 the reasons for
mobility of three generations of migrants are detailed -
the migrant sample, their fathers and their children
(mostly sons). It appeared from the results that
movements due to economic crisis were more common among
the migrants than their fathers.
It is evident that the necessity for rural out
migration was not seriously felt by most village
dwellers in Bangladesh up until the early 1960s. Our
village data showed that only ten percent of 431 sample
respondents (120 stayers, 120 commuters and 191 CMs) had
a father who had been a circular migrant, while 16
percent of the respondents' fathers had been seasonal
migrants. The intensification of economic stress in
rural communities has occurred mainly due to the high
rate of population growth, scarcity of local work,
shortage of landholdings and lack of appropriate and
adequate rural development policies.
Attitudes towards farming
While economic hardship was the most important
reason stated for out-migration from villages in
Bangladesh, indifferent attitudes towards peasant
254
farming, especially among educated youths, also accounts
for a sizeable amount of circulation between the
villages and towns. One-third of the 191 circular
migrants told us directly th~t they did not like to be
involved with agricultural activities (grehasti).
These migrants largely originated from the young
educated group of economically better-off families.
Their literacy rate was as high as 94 percent (national
male literacy rate was 31 percent in 1981) and even 55
percent of them had successfully completed at least ten
years of schooling (corresponding national figure for
males was only 5 percent).
Further analysis of the data on these 63 migrants
indicates that except for one rickshaw puller all of
them were engaged in non-manual occupations such as
white-collar work (78 percent) and trade (15 percent).
Despite their disinterest in grehasti, the families of
these migrants were able to acquire a substantial amount
of land; none of them were found to be landless and the
average landholding per family was close to four acres
(2.5 times higher than the national figure). Due to
cheap labour and a huge demand for tenant farming
contacts in Bangladesh, these better-off landowning
families never confront any difficulties with the
cultivation of their holdings.
In contrast to the current migrants, their
fathers were much less likely to dislike farming tasks
(Table 6.11). The education gap between the two
255
generations could be the most likely reason for this.
In many underdeveloped countries, as Michael Lipton
pointed out (1980, 7), the better-off village families
profitably invest in education and through migration to
urban centres gain further resources (accumulated as
education, cash, land or other assets).
Advantages and disadvantages
To gain a more comprehensive picture of migration
motives, respondents were asked to state their views on
the advantages and disadvantages of migration from
villages. The predominance of advantages over
disadvantages is clearly apparent in Table 6.12 in which
nearly half of the respondents (46 percent)
spontaneously replied that they felt no inconvenience in
migration. In view of the perceived necessity for
leaving the village to get work in present-day
Bangladesh, movers saw many opportunities of achieving
improved means by living elsewhere.
The major disadvantage perceived by 98 out of 180
migrants, related to the separation from family,
relatives and grehasti. These sorts of socio-
psychological and economic inconvenience cannot be
removed unless a migrant changes his mobility behaviour
and practises commuting or seasonal migration, or ceases
moving altogether.
In Chapter 4 it was demonstrated that circular
migration was overwhelmingly directed to the cities and
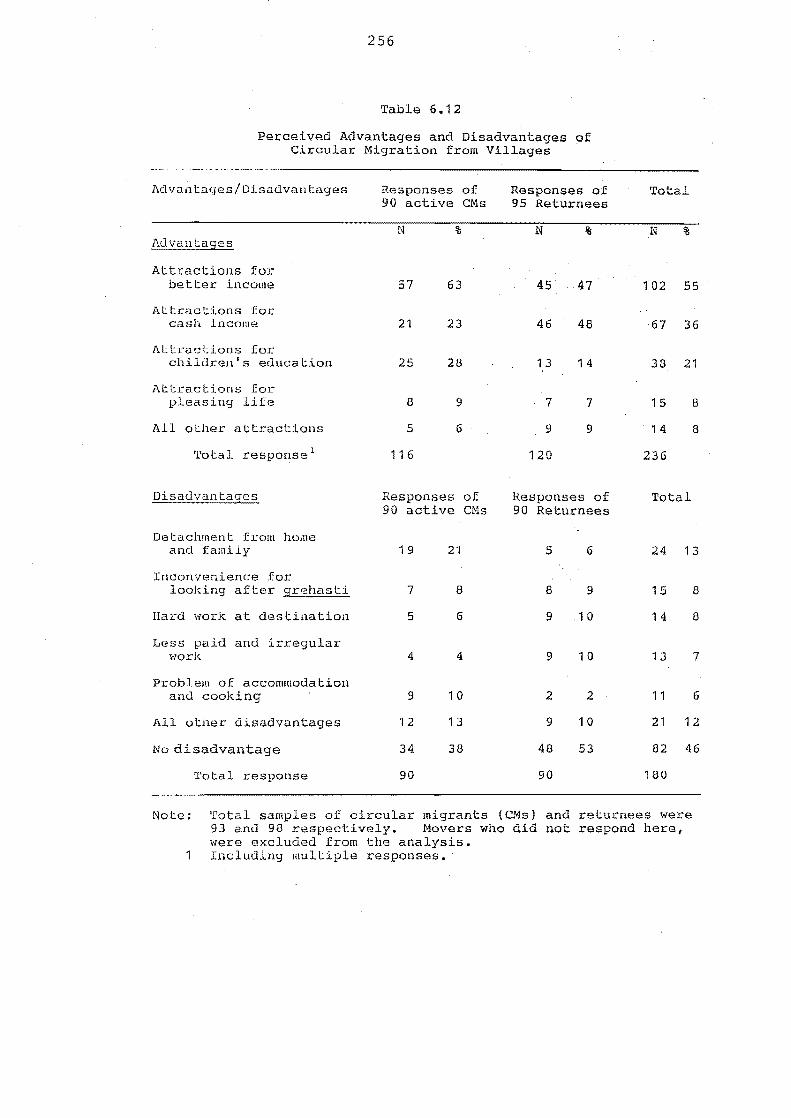
256
Table 6.12
Perceived Advantages and Disadvantages of Circular Migration from Villages
Advantages/Disadvantages
lldvantages
Attractions for better income
Attractions for cash income
Attractions for children's education
Attractions for pleasing life
All ol11er attractions
'l'otal response 1
Disadvantages
Detachment from home and family
Inconvenience for looking after
Hard work at destination
Less paid and irregular work
Problem of accommodation and cooking
All other disadvantages
No disadvantage
Total response
of 90 active eMs
N %
57 63
21 23
25 28
8 9
5 6
116
Responses of 90 active eMs
19 21
7 8
5 6
4 4
9 10
12 13
34 38
90
Responses of 95 Returnees
N %
45 47
46 48
13 14
7 7
9 9
120
Responses of 90 Returnees
5 6
8 9
9 .10
9 10
2 2
9 10
48 53
90
Total
N %
102 55
67 36
38 21
15 0
14 8
236
Total
24 13
15 B
14 8
13 7
11 6
21 12
82 46
180
Note: 'fotal samples of circular migrants (eMs) and returnees were 93 and 98 respectively. Movers who did not respond here, were excluded from the analysis. Including multiple responses.
257
towns. As a means of securing urban employment, this
particular mobility type reflects several advantages
relating to the movers' aspirations for higher income, .
better education for children and overall improvement of
living conditions. Nearly two-thirds (63 percent) of
the current migrants and about half (47 percent) of the
returnees stated that the prospect for better income in
towns is one of the main attractions of circular
migration. One reason for this is the decline of real
wages in rural areas and the increasing income
disparities between rural and urban sectors as well as
between rich and poor families.
Many studies carried out by individuals, national
agencies, and international bodies (Khan 1977; Alamgir
1974, 1978; Jansen 1983; UN 1980a) have documented those
economic facts and derived a frustrating prospect for
the country's overwhelming majority of citizens. Khan
drew attention to a very sharp decline in real wage
earnings in rural areas since the 1970s. The evidence
produced by Alamgir (1974) showed a downward trend in
real income per capita for both the agricultural and
rural populations during the pre-liberation and post
liberation periods. The same author also revealed that
between 1949/50 and 1954/55 per capita rural income
stayed approximately one-fifth of the per capita urban
income.
Support for villaqe society
Another attraction of circular migration between
258
villages and towns frequently stated by the respondents
was to secure the cash required for various
purposes in rural areas, such as domestic consumption,
school fees, purchasing agricultural inputs, and many
occasional events such as marriage, buying land or other
assets, and repairing houses. The necessity of
external cash support for the rural population has grown
rapidly with the rise of population, shortage of land or
other rural means of living, and the extent of poverty.
The importance of cash in the rural sector can
also be understood in the context of capitalist
development - a process which has been gradually
restructuring the subsistent Peasant economy into a cash
exchange economy. A recent study in Bangladesh (Sobhan
1981) estimates that some three-quarters of rural
households are at present depending fully or partly on
the market economy, as opposed to subsistence
cultivation, for their basic staple diet. The role of
circular migration in fostering the capitalist trans
formation of rural economies has been documented in
,other Third World countries (e.g. Bedford 1973, 133;
Whittaker 1984).
6.3.2 Why do villagers prefer to commute?
Apart from investigating the various characteris
tics of commuters, all 120 commuters in the samples from
Rampal, Chandina and Sakhipur were individually asked
why they preferred commuting to migration. The main
259
purpose of this inquiry was to explore the rationalisa
tions for commuting from rural areas in Bangladesh.
Table 6.13 shows the relative importance of 145
responses made by the 40 commuters in each of the three
survey locations. Some of them stated more than one
reason, but the most common reason for commuting is that
this particular mobility behaviour enables villagers to
look after grehasti and family in addition to earning
off-farm incomes.
The desire for two occupations
Unlike a migrant, a commuter has the advantage of
earning both farm and off-farm incomes simultaneously
and at the same time taking good care of his family.
In the 14 survey villages, it was observed that the
increasing popularity of commuting among the villagers
is related to the common practice of dual occupation,
particularly farm and off-farm activities. As noted
earlier in this chapter land shortage, rapid growth of
population and a skewed distribution of rural resources,
particularly farm land, has created circumstances
favouring a dual occupation strategy. Given that the
economic situation is worsening year by year, almost all
rural families who depend for the most part upon
agricultural income are now anxiously trying to obtain
an additional job outside the farm.
In these circumstances, a household earner who
wants to work both farm and off-farm sectors finds
commuting a convenient strategy for living. In the
260
village, those families who have a considerable amount
of agricultural land but a shortage of additional adult
male earners, try to maximize (or supplement) their
income through commuting. This, of course, reflects
the greater tendency for commuting among the members of
nuclear families.
Family commitments
The traditional Muslim society in rural areas is
highly critical of females who move outside their home
to work, shop or even for study, particularly when they
reach adolescence. Administration of the family thus
greatly depends on the men. Prolonged absences of men
from the village can adversely affect the family in many
ways, including cultivation of agricultural land,
children's education, and harmonious living. Under
these circumstances, it is not surprising that villagers
are more likely to commute rather than migrate if they
can find suitable off-farm work in reasonably close
proximity to their homes.
Another important reason for opting for commuting
rather than migration is the poor economic condition of
village people. A large number of rural dwellers,
especially labourers, small traders and poor peasants
are, in fact, living from hand to mouth. They earn
their daily livelihood mostly from off-farm sources
through short-distance commuting, although some of them,
in addition to off-farm income, derive some income from
261
local agricultural sources. Commuting provides an
avenue through which the poor can cross their village
boundary in the morning in search of work and come back
in the latter part of the day with some cash or food
essential for the daily livelihood of their families.
As they are almost entirely dependent upon a
daily income, this group of poverty stricken commuters
is virtually unable to migrate. They cannot cover the
initial cost of migration which not only includes the
movers' transport and maintenance costs at the.
destination place, but also includes a large sum of
money required for families remaining in the village for
at least a few weeks until the migrants will be able to
remit money or goods to their families. This type of
'poverty-trap' is one of the fundamental reasons for the
rapid rise of commuting in rural areas in Bangladesh.
Advantages and disadvantages
To gain a more comprehensive picture of the
causes of commuting respondents were also asked about
advantages and disadvantages of moving to and from their
villages. In Table 6.14 their responses are grouped
into a few broad categories. The statements in favour
of commuting reflect three main points. First, it is
evident that through commuting, villagers from different
walks of life are able to improve their incomes by
taking advantage of earning from two or more sources.
Second, the opportunity of earning cash through the
process of commuting, attracts a wide range of villagers
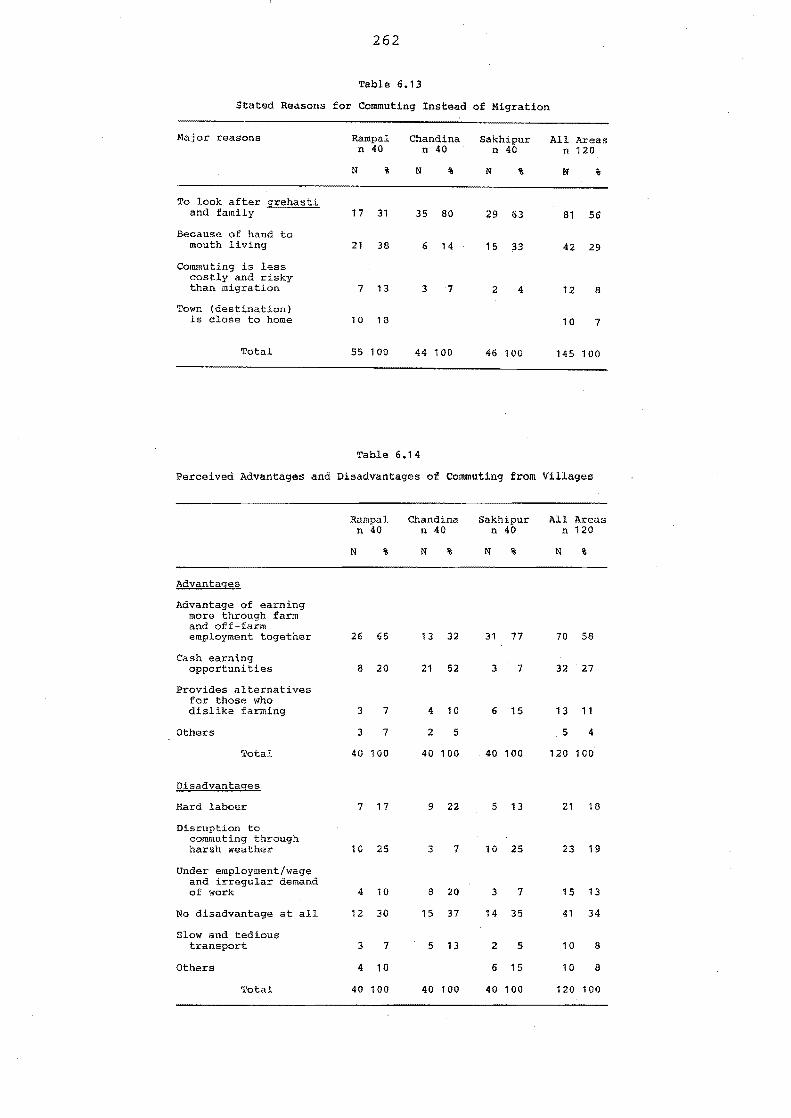
262
Table 6.13
Stated Reasons for Commuting Instead of Migration
Major reasons Rampal Chandina Sakhipur All Areas n 40 n 40 n 40 n 120
N % N % N % N %
To look after grehasti and family 17 31 35 80 29 63 81 56
Because of hand to mouth living 21 38 6 14 15 33 42 29
Commuting is less costly and risky than migration 7 13 3 7 2 4 12 8
Town (destination) is close to home 10 18 10 7
Total 55 100 44 100 46 100 145 100
Table 6.14
Perceived Advantages and Disadvantages of Commuting from Villages
Rampal Chand ina Sakhipur All Areas n 40 n 40 n 40 n 120
N % N % N % N %
Advantages
Advantage of earning more through farm and off-farm employment together 26 65 13 32 31 77 70 58
Cash earning opportunities a 20 21 52 3 7 32 21
Provides alternatives for those who dislike farming 3 7 4 10 6 15 13 11
Others 3 7 2 5 .5 4
Total 40 100 40 100 40 100 120 100
Disadvantages
Hard labour 7 17 9 22 5 13 21 18
Disruption to commuting through harsh weather 10 25 3 7 10 25 23 19
Under employment/wage and irregular demand of work 4 10 8 20 3 7 15 13
No disadvantage at all 12 30 15 37 14 35 41 34
Slow and tedious transport 3 7 5 13 2 5 10 8
Others 4 10 6 15 10 8
Total 40 100 40 100 40 100 120 100
263
from different socio-economic and occupational
backgrounds. contemporary villagers are increasingly
interested in earning cash in addition to farm income
which is largely obtained as kind.
There are many reasons behind this trend. In
Rampal and Chandina, for example, acute shortage of land
on the one hand, and the introduction of new farm
technology on the other, are the major reasons for the
rising demand for cash. With the introduction of high
yielding varieties in agriculture farmers need a large
amount of cash to buy the necessary inputs. They
usually collect money in different ways and the most
important method is earning cash through the processes
of commuting and circular migration. The traditional
farming system in Sakhipur does not require large cash
inputs into farming. Here, the villagers' main
interest in earning cash through commuting relates to
the shortage of land as well as poor return from
agricultural activities.
Another advantage of commuting, reported mainly
by those from the upper socio-economic ranks, is that
commuting provides an alternative living particularly
for those who want to live close to their village
families and do not want to touch farm-dust. Commuters
who aspire to such a life style, prefer to be white
collar workers, teachers or established (non-pedlar)
businessmen. They accomplish their family farm work
(grehasti) mostly with the help of hired labour.
264
It is apparent from Table 6.14 that the list of
disadvantages is not as great as that for advantages.
One-third of the commuters in each study area did not
perceive any disadvantage arising from commuting. The
rest have reported some of the inconveniences of
commuting, such as weather disturbance, hard work, slow
and tedious transport and uncertainty of getting regular
work. In practice, commuting is not seen to be
disadvantageous to rural society and economy.
Continuity through change
Generally the village people are poor,
conservative and firmly attached to their families and
place of birth. When a family wants to send one of its
members to work elsewhere, it always considers both the
economic and non-economic requirements of the family.
The latter factor (i.e. non-economic) is particularly
significant in non-western societies (Chapman 1970,
234) • Commuting as a type of non-residential movment
does not involve absence for a lengthy period from
family and village; it is a compromise between total
immobility and migration (cyclical or permanent
relocation).
The major significance of commuting in the rural
life in Bangladesh is that it enables villagers to live
in familiar social and environmental settings. A wide
range of villagers from different socio-economic and
occupational backgrounds consider commuting as a mode of
living which satisfies their objectives.
265
The significance of commuting and its prolifera
tion as a form of mobility are evident in many societies
within the Third World (Chapman 1970; Hugo 1978ai
Bedford 1973; Maude 1981; Singhanetra-Renard 1981).
Given the large volume of commuters in Third World
countries, researchers now believe that with the
development of infrastructure and new modes of
production, commuting is becoming a substitute for
migration.
6.4 SUMMARY
This chapter has analysed the age, education and
occupation characteristics of commuters and circular
migrants and their reasons for movement. The major
findings derived from the data can be summed up as
follows:
1. The age structures of commuters and migrants are
different. Commuters are mainly selected from the
young, middle aged and old aged villagers, while
the migrants have largely come from the young adult
ages.
2. In almost all age groups the propensity to commute
for work seems to be higher than the propensity to
migrate. After age 40, the gap between the
commuting rate and migration rate appears to widen
significantly.
3. At different stages of life the duration of the
mobile and immobile working periods varies quite
266
significantly among the different age groups.
Compared with the older generation people, the
younger generation has spent or is spending more
time in working away from their home village.
4. It appears that circular migrants are better
educated than those who have never moved out of
their native place or have mostly remained at the
village of their origin. Commuters have a higher
level of education than non-movers and seasonal
migrants, but a markedly lower level than circular
migrants. It was also found that the propensity
to migrate appears to be high, especially among the
higher educated males.
5. There is a marked variation in educational attain-
ment between rural and urban movers. In general
the propensity to move to towns increases with the
rise in education level.
6. As with the education level, the nature of occupa
tion of movers and non-movers differs widely.
Non-movers are predominantly involved in
agricultural activities; commuters mostly travel
for trade/business or earning off-farm wages while
circular migrants leave their villages for
salaried jobs and services. Seasonal migrants, on
the other hand, are concentrated in certain types
of wage earning occupations.
7. Unlike other types of movers and non-movers, the
commuters tend to have two occupations, one off-
267
farm and the other on-farm. The latter is in most
cases regarded as a secondary occupation.
8. It is evident that in the rural areas a
structural change from the agricultural base to a
non-agricultural base to household economic
activity has been evolving through the pocess of
circular movements. Increased pressure of
population on land is accelerating this process.
9. Inquiry into the villagers' motives for commuting
and circular migration revealed that unskilled and
low-income people are more likely to commute than
the skilled and better-off villagers who prefer
migration. Commuting is a form of mobility which
enables those villagers in the lower socio-economic
classes to take advantage of a range of economic
opportunities while migration is more suited to
maximizing opportunity for those in the higher
socio-economic strata. This relationship between
socio-economic status and mobility behaviour is
examined in depth in Chapter 8.
10. The most common reason for commuting is that it
enables village dwellers to work both on and off
their farms - a dual occupation strategy which has
become widespread through rural regions in
Bangladesh. Commuting is a viable alternative to
migration, especially among the poor farmers, part
time farmers, agricultural labourers and families
with fewer income earners.
268
11. The crucial factor for seeking outside employment
through commuting or seasonal migration is poverty
which operates via a range of variables such as
education level, availability of land, family size,
and household income. The next chapter explores
several demographic, social and economic attributes
of the households and families within which the
commuters and circular migrants are based.
CHAPTER 7
HOUSEHOLD BACKGROUND OF COMMUTERS AND CIRCULAR MIGRANTS
In this chapter selected demographic and socio
economic attributes of commuter and circular migrant
households are examined with a view to establishing the
significance of household variables in discriminating
between different groups of movers. The variables
discussed here are household size and composition, land
ownership patterns, tenural status, and income levels
and sources. Households are classified by mobility
status (circular migrant, commuter, stayer etc.) on the
basis of the present mobility behaviour of economically
active members. A household with two different types
of movers, for example, a commuter and a circular
migrant was counted twice, once as commuter household
and then as circular migrant household. The number of
families which contained more than one type of active
movers was 124; they accounted only 6 percent of the
total (1941) households or 10 percent of all (1212)
active mover families as shown in Table 3.9. In the
case of stayer households, the study examined only those
families which had no ever moved members.
7.1 HOUSEHOLD SIZE AND COMPOSITION
The propensity to move and the selection of a
particular mobility strategy by a potential mover
greatly depends on the demographic circumstances of the
270
mover's family or household. Reviews of migration
studies in Third World countries (Connell et ala 1976;
De Jong and Gardner 1981) indicate that certain
aspects of the family such as size, composition, and
life-cycle stage etc. have substantial influences upon
the migration decision-making process. Despite general
recognition of this, there has been a lack of research
concerning the impact of household factors on the
processes of commuting, seasonal migration and the
practice of immobility.
7.1.1 Household size
It appears from Table 7.1 that household size in
rural areas varies significantly between mover and
stayer families as well as between different types of
mover families. Circular migrants have come from big
famil in comparison with commuters, seasonal migrants
and stayers. On average, a household having an active
circular migrant recorded 7.71 members, while the mean
sizes of a commuter, a seasonal migrant and a stayer
household were 6.65, 6.32 and 5.43 members respectively.
Nearly a fifth of the circular migrant households
(82 out of 476) had more than 10 members per household.
The corresponding proportions of households with more
than 10 members among the commuters, seasonal migrants
and stayers households were 9, 8 and 3 percent
respectively (Table 7.1). At the other end of the
scale there were only 35 circular migrants (7 percent)
whose family size varied from 2 to 3 members. Among the
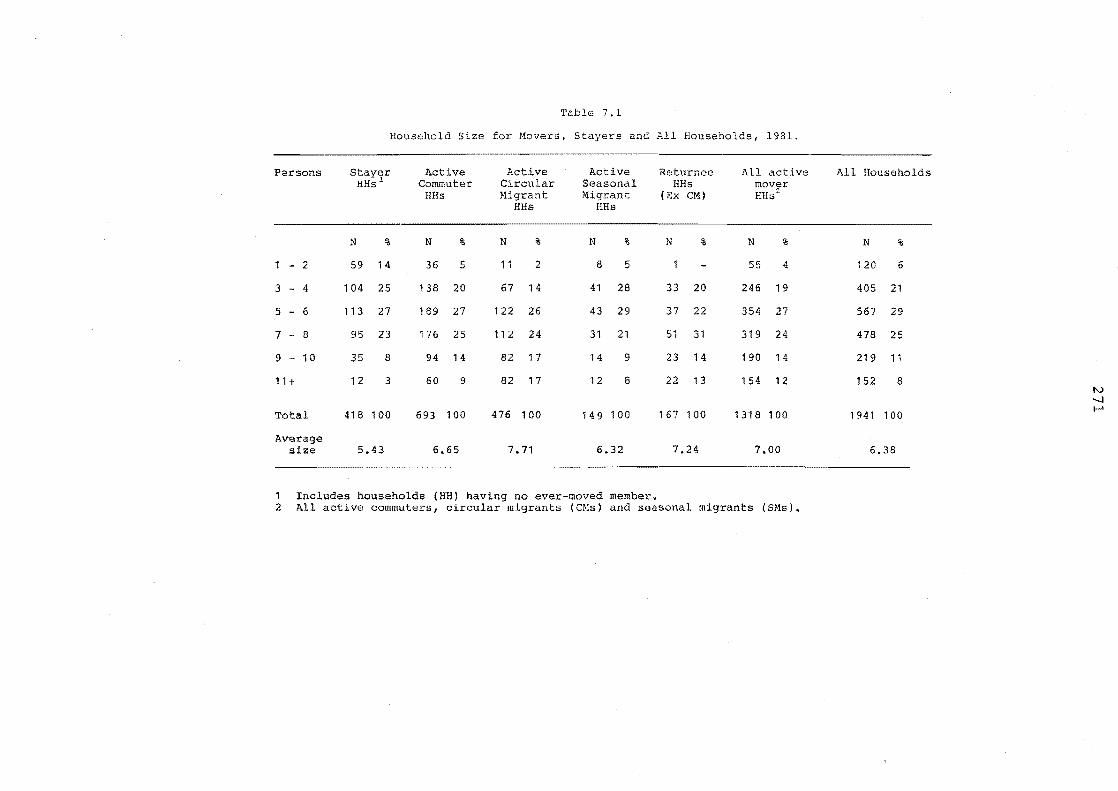
Table 7.1
Household Size for Movers, Stayers and All Households, 1981.
Persons Stayer Active Active Active Returnee All active All Households HHsl Commuter Circular Seasonal HHs mover
HHs l>1igrant Migrant (Ex eM) HHs2 HHs HHs
N % N % N % N % N % N % N %
- 2 59 14 36 5 11 2 8 5 55 4 120 6
3 - 4 104 25 138 20 67 14 41 28 33 20 246 19 405 21
5 - 6 113 27 189 27 122 26 43 29 37 22 354 27 567 29
7 - 8 95 23 176 25 112 24 31 21 51 31 319 24 478 25
9 - 10 35 8 94 14 82 17 14 9 23 14 190 14 219 11
11 + 12 3 60 9 82 17 12 8 22 13 154 12 152 8 N -..J
Total 41 B 100 693 100 476 100 149 100 167 100 1318 100 1941 100 f-'
Average size 5.43 6.65 7.71 6.32 7.24 7.00 6.38
1 Includes households (HB) having no ever-moved member. 2 All active commuters, circular migrants (eMs) and seasonal migrants (SMs).
272
circular migrants single-person households were not
found in any of the study areas in Bangladesh.
A positive relationship
The relationship between family size and
propensity to move, in general, suggests that movers
from rural areas tend to come from relatively large
households. In other words, the propensity to move for
work is positively associated with family size (Table
7.1). Several explanations of this relationship are
possible.
In rural areas, there has been an increase in the
number of households which, in the face of diminishing
opportunities to own or rent land, have extended their
economic activities into a wide range of non
agricultural pursuits. In this context, the large
families have an advantage over small households as the
former have more economically active members and can
easily spare one or more members for earning incomes off
their farms through migration.
Connell and his co-authors (1976, 45) pointed out
that through townward migration, big families were able
to reduce the risk of unpredictable farm income and to
diversify their "family economic portfolio". Caldwell
(quoted by Connell et ale 1976, 45) introduced another
sort of risk that a migrant might abandon his parents in
their old age and thus parents having a small number of
children discourage their children from migrating to
town.
273
Family size and economic condition
To gain a better perspective on the relationship
between family size and the mobility process, further
details of the families' economic and mobility
strategies are necessary. From data collected in the
field it is apparent that family size is directly
related to its economic condition (Table 7.2). In the
rural areas, large fami tend to be better off while
smaller families are found to be relatively poor. This
relationship has been found in the case of mover as
well as stayer households. Within the same economic
category the family size of movers is higher than that
of stayers.
In theory, it is hard to believe the above
statements, because it is often argued that poor,
illiterate peasants/ labourers have larger families than
the better educated and more well off. This study
cannot produce enough field and documentary evidence
evidence to conclusively prove these propositions but
the following account by Paul Harrison (1981, 253) is
useful in the cot ext of the changing rural situation in
Bangladesh:
In Bangladesh, surveys have found that the less land a man owns, the more likely his wife is to know about, approve of and practise family planning. Farmers of more than two acres ••• were determined to have as many sons as they needed to work their land without hired labour ••• at the critical size of holding that a man can work alone - about one and a half acres -and below, there was a noticeable desire for small families. But what of the theory that the landless and near-landless also want extra sons to bring in extra wages? This too begins
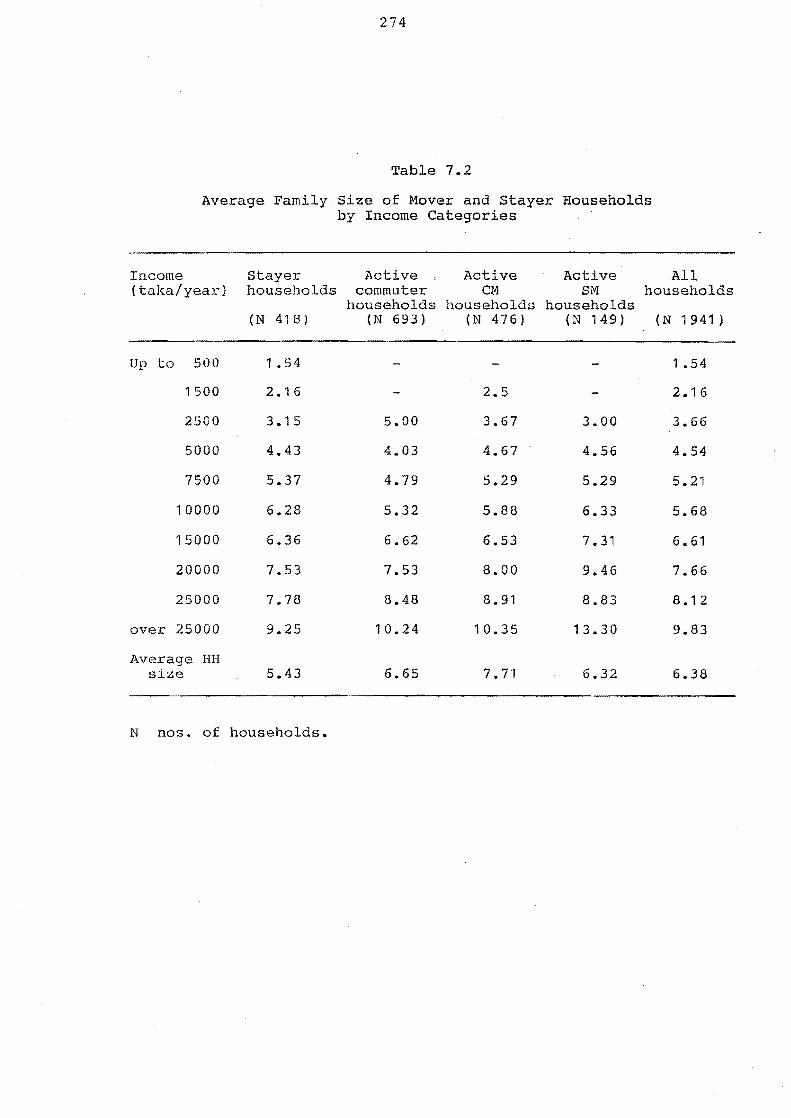
Income
274
Table 7.2
Average Family Size of Mover and Stayer Households by Income categories
Stayer Active , Active Active All (taka/year) households commuter CM SM households
households households households (N 418) (N 693) (N 476) (N 149) (N 1941)
Up to 500 1 .54 1 .54
1500 2.16 2.5 2.16
2500 3.15 5.00 3.67 3.00 3.66
5000 4.43 4.03 4.67 4.56 4.54
7500 5.37 4.79 5.29 5.29 5.21
10000 6.28 5.32 5.88 6.33 5.68
15000 6.36 6.62 6.53 7.31 6.61
20000 7.53 7.53 8.00 9.46 7.66
25000 7.78 8.48 8.91 8.83 8.12
over 25000 9.25 10.24 10.35 13.30 9.83
Average HB size 5.43 6.65 7.71 6.32 6.38
N nos. of households.
275
to be inoperable as poverty really bites it has been calculated that a male child begins from the age of twelve to repay the cost of rearing him. By the time he is sixteen, he will have repaid that cost in full, and by the time he is twenty, he will have earned enough to cover the cost of rearing another child. Now the decline in real wages produced by the labour surplus tends to lengthen the time needed for a child to repay its cost - if real wages halve, repayment time doubles. More critically still, increasing poverty has led to a situation where the poorest openly admit that while they might like to have more sons, they simply cannot afford to rear them up to the age when they will begin to earn money.
Poverty and family limitation
The norm for small families among the poor and
non-landowning class is not a desired one: rather it is
the outcome of general poverty and scarcity of farm
employment in the rural areas. In another recent study
in Bangladesh, Van Schendel (1981, 241-42) found that
household size was related to economic position: the
richer the household, the larger its size. The much
lower household sizes among the poor did not always
point to much lower fertility among them, but often to a
less complicated household structure. Rich households
were generally larger and more complex in terms of their
soial structures than poorer ones. In addition to this
view both Cain (1978) and Attood (1978) found that poor
families generate fewer surviving children than rich
ones.
Everywhere in Bangladesh there is heavy
competition for employment. But the situation seems to
be worst in the rural areas and in the agricultural
276
sector in particular. As the poor families cannot
afford to bear the cost of modern education or training
for their sons, they find it much harder to send their
sons to town for a job. So, the only option open to
them is reduction in numbers of household members and,
surprisingly, they were found to do that in various
ways: (i) controlling births; (ii) early-marriage of
their daughters; (iii) separating those sons who are
not willing or able to help parents i.e. insisting sons
to live isolate from their parents' household;
(iv) abandoning old parents; and (v) letting children
stay with other families (relatives or non-relatives).
Benefits of large families
In contrast to the above situation, having a
large family brings private benefits to the 'well-off and
better educated households. These families can afford
to train up their children in accordance with the demand
and prospect of jobs, and they can wait for a long time
until their sons become adults and start to receive a
good income through migration to towns and cities.
Here Harrison (1981, 226) puts forward another relevant
comment:
In most places [within the Third World countries] it still costs less to raise an extra child than the potential gain from his labour, his marriage alliance, or his support in old age. It is a profitable venture; it brings in a worthwhile return for the investment.
In brief, large families, as they are better off and
have extra manpower can update their skills to keep pace
277
with recent occupational changes brought about by the
stream of rural-urban movement.
7.1.2 Household composition
Extended and nuclear families
The context of family structure or composition is
another important demographic dimension to family size
which influences mobility strategies. As migrants tend
to come from larger families, joint and extended
families are more likely to promote migration. Out of
96 extended families, 55 (57 percent) have at least one
active circular migrant (Tables 7.3 and 7.4).
In the case of simple nuclear families, only 19
percent were able to spare a member for any lengthy
absence in employment elsewhere (Table 7.4). Table 7.3
indicates that the proportion of migrants coming from
nuclear families is significantly lower than the
proportions of commuters and non-movers. Thus, the
propensity for households to have migrant members
increases with the successive expansion of family
structure.
In many Third World countries (including
Bangladesh), the impact of socio-religious restrictions
against participation in women1s outdoor work results in
male dominance in occupational mobility. It also
limits long-term migration of male members, especially
from nuclear families where normally a household has one
male bread-winner who cannot be absent for long periods
In such a situation, it was found that male movers from
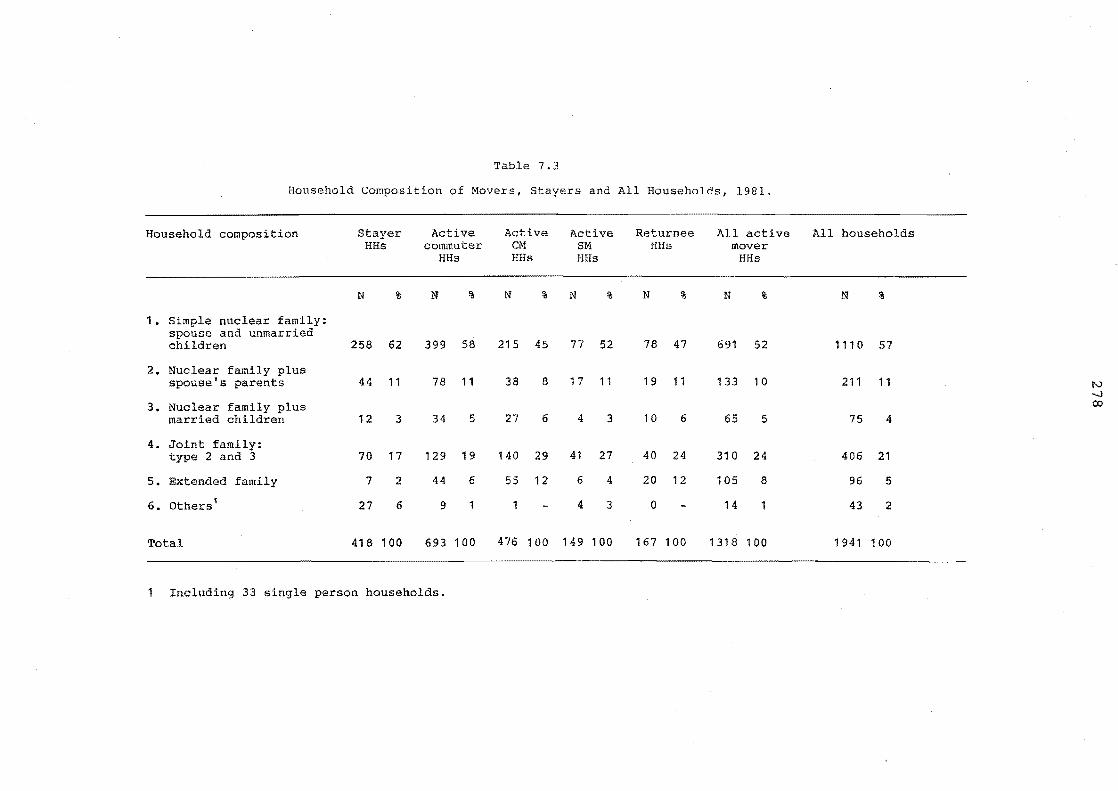
Table 7.3
Household Composition of Movers, Stayers and All Households, 1981.
Household composition Stayer Active Active Active Returnee All active All households HHs commuter CM SM HHs mover
HHs HHs HHs RRs
N % N % N % N % N % N % N %
1. Simple nuclear family: spouse and unmarried children 258 62 399 215 45 77 52 78 47 691 52 1110 57
2. Nuclear family plus spouse's parents 44 11 78 11 38 8 17 11 19 11 133 10 211 11 N
...,J
3. Nuclear family plus 00
married children 12 3 34 5 27 6 4 3 10 6 65 5 75 4
4. Joint family: 2 and 3 70 17 129 19 140 29 41 27 40 24 310 24 406 21
5. Extended family 7 2 44 6 55 12 6 4 20 12 105 8 96 5
6. Others 1 27 6 9 1 1 4 3 0 14 43 2
Total 418 100 693 100 476 100 149 100 167 100 1318 100 1941 100
Including 33 person households.
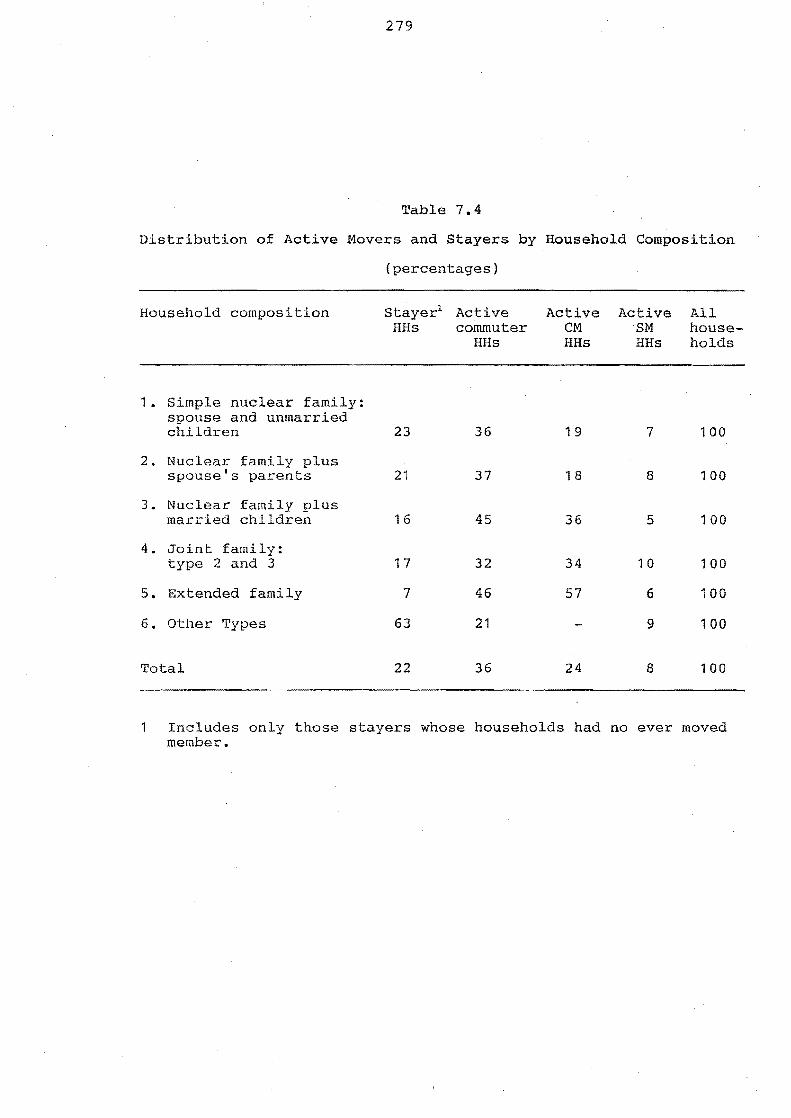
279
Table 7.4
Distribution of Active Movers and Stayers by Household Composition
(percentages)
Household composition stayer1 Active HHs commuter
HHs
1 • Simple nuclear family: spouse and unmarried children 23 36
2. Nuclear family plus spouse's parents 21 37
3. Nuclear family plus married children 16 45
4. Joint family: type 2 and 3 17 32
5. Extended family 7 46
6. other Types 63 21
Total 22 36
Active Active CM 'SM HHs HHs
19 7
18 8
36 5
34 10
57 6
9
24 8
All households
100
100
100
100
100
100
100
1 Includes only those stayers whose households had no ever moved member.
280
nuclear families largely prefer short-term movements
such as commuting and seasonal migration. A similar
situation exists in Northern Nigeria, where Goddard
(1973, cited in Connell et ale 1976, 48) found that
males from nuclear families were limiting their
movements to short-term seasonal circulation, because of
social restrictions against women working outdoors.
Birth order and mobility
Connell and his colleagues (1976, 46) indicated
that birth order and the number of sons in the family
are often very important in determining who migrates.
Farmers in Punjab, India (Wyon and Gordon, 1971) and in
Sri Lanka said to field investigators that usually the
younger sons were given preference for a better
education and migration over the elder. A similar
situation also exists in Bangladesh. Of the 93 sample
migrants, only 6 (7 percent) had no brother; the
majority (53 percent) were younger sons while the
remaining 40 percent were elder brothers. For the 120
sample commuters the relevant proportions for these
birth orders were 18, 50 and 32 percent respectively.
Stayers have yet another birth order pattern. They
were less likely to come from the younger sons.
The most striking difference between the migrants
and the stayers is that a large proportion of the
stayers (25 percent) came from single-son families. In
a society where sons customarily have the responsibility
of taking care of their father1s property along with
281
looking after aged parents, it is often inconvenient for
a man who has no brother to make a migratory move. On
the other hand, fathers having only one son are also
less likely to move than those who have more than one
son.
This finding emerged from a cross-inquiry of the
mobility behaviour of fathers of all people in all the
samples (i.e. stayers, commuters, circular migrants and
returnees altogether). It was found that among those
fathers who had one son, 35 percent were movers and the
remaining 65 percent had never made any movement for
livelihood. The proportions of movers and stayers
among those who had more than one son were recorded as
53 and 47 percent respectively.
The propensity to mobility or immobility among
the fathers of one son families or several-sons
families, varies from one sample group to another. The
lowest propensity to movement was found for the stayers
sample and the highest propensity was recorded in the
case of the circular migrant sample. This indicates
that the father's mobility status, to a great extent,
determines the son's mobility behaviour. It was also
found that the mobility strategies of elder sons have a
substantial influence on the movement attitudes of their
younger brothers.
7.2 LAND OWNERSHIP PATTERNS
In rural Bangladesh land is the resource which
282
provides employment or income, though not equally and
adequately, to almost all rural households. The amount
of land a household owns reflects to a large degree the
household's economic, social and strategic position
(Jansen, 1983, 291). Every family, whether poor or
rich is found to compete for this scarce resource.
Given the high degree of overcrowding in
agricultural land and its resulting unequal distribution,
most of the families in the countryside are nowadays
seeking additional employment off the farm. This has
resulted in a pattern of circular movement where both
land-poor and land-surplus families are sending their
rna earning members to cities, towns and a wide range
of rural places for work. The poverty of the land-poor
forces them to move in search of off-farm work, while
the land-surplus families invest their agricultural
surplus in migratory occupations.
In such a situation, the explanation of an
individual's mobility behaviour requires insight into
his landholding position (the amount of land owned/
operated by his household) and tenural status (his or
his family's relationship with land). In this section,
land ownership patterns of the movers are examined.
Tenure status is discussed further in the following
section.
7.2.1 Land distribution
The propensity to migrate from rural areas for
non-agricultural work in towns is attributed to
283
considerable degree to patterns of land ownership. A
number of studies have established that the scarcity of
land, landlessness and skewness in land distribution are
common features of villages where migration is common
in many densely settled agrarian societies in Asia
(Connell et al. 1976, Chaudhury 1978a, Lipton 1980). In
other words, there is a positive relationship between
high man/land ratios and a propensity to rural
emigration.
Lorenz curves and Gini coefficients
Bangladesh has one of the most unequal distribu
tions of land in a situation characterised by firstly an
extremely small per capita arable land (0.23 acres),
secondly a rapid increase of population, and thirdly the
process of land alienation from small to big landowners.
A recent study commissioned by the United states Agency
for International Development (USAID) revealed that
fewer than 10 percent of Bangladesh's rural households
own over half the country's cultivable land (Jannuzi and
Peach 1979). Meanwhile 60 percent of rural families
own less than 10 percent of the land. Almost one-third
own no cultivable land at all.
Inquiry in Rampal, Chand ina and Sakhipur produced
very similar statistics on land distribution. The top
decile group of households has acquired three-fifths (61
percent) of the total farm land (Table 7.5). Almost
one-third of households are absolutely landless and
another one-third which have some land, account for less
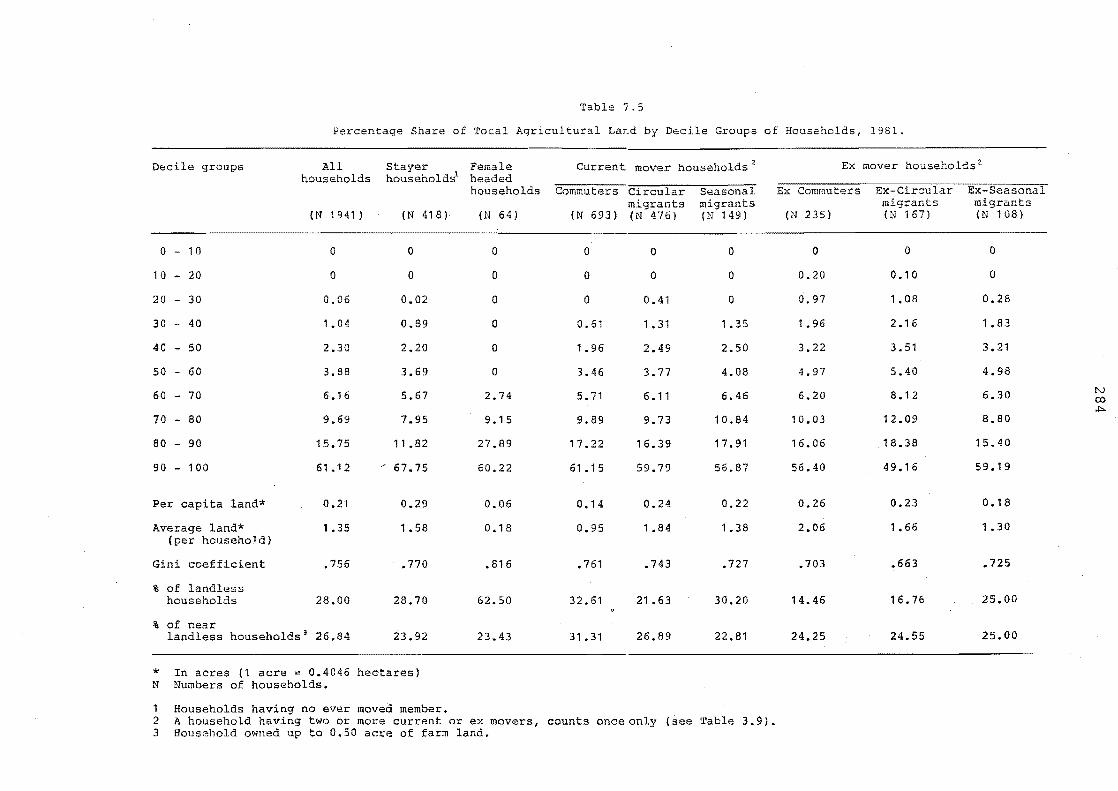
Table 7.5
Percentage Share of Total Agricultural La~d by Decile Groups of Households, 19B1.
Decile groups All households
(N 1941) (N 418)
o - 10 0 0
10 - 20 0 0
20 - 30 0.06 0.02
30 - 40 1.04 0.89
40 - 50 2.30 2.20
50 - 60 3.88 3.69
60 - 70 6.16 5.67
70 - 80 9.69 7.95
80 - 90 15.75 11.82
90 100 61.12 ~ 67.75
Per capita land* 0.21 0.29
Average land* 1.35 1.58 (per household)
Gini coefficient .756 .770
% of landless households 28.00 28.70
% of near landless households 3 26.84 23.92
* In acres (1 acre = 0.4046 hectares) N Numbers of households.
1 Households having no ever moved member.
Female Current mover households· headed households Commuters Circular Seasonal
migrants migrants (N 64) (N 693) (N 476) (N 149)
0 0 0 0
0 0 0 0
0 0 0.41 0
0 0.61 1.31 1.35
0 1.96 2.49 2.50
0 3.46 3.77 4.08
2.74 5.71 6.11 6.46
9.15 9.89 9.73 10.84
27.89 17.22 16.39 17.91
60.22 61 .15 59.79 56.87
0.06 0.14 0.24 0.22
0.18 0.95 1.84 1.38
.816 .761 .743 .727
62.50 32.61 21.63 30.20
23.43 31.31 26.89 22.81
2 A household having two or more current or ex movers, counts once only (see Table 3.9). 3 Household owned up to 0.50 acre of farm land.
Ex mover households 2
0 0 0
0.20 0.10 0
0.97 1.08 0.28
1. 96 2.16 1.83
3.22 3.51 3.21
4.97 5.40 4.98
6.20 8.12 6.30
10.03 12.09 8.80
16.06 18.38 15.40
56.40 49.16 59.19
0.26 0.23 0.18
2.06 1.66 1.30
.703 .663 .725
14.46 16.76 25.00
24.25 24.55 25.00
tv 00
"'"
285
than 10 percent of the land available for cultivation.
The empirical patterns of landownership are
demonstrated in Tables 7.5, 7.6, 7.7 and Figures 7.1 and
7.2. These show clearly that agricultural land is
concentrated in the hands of a few families. The bulk
of the land-share (57 to 68 percent) goes to the top
decile group of households. Except for households
headed by females, the concentration ratio in
landownership as measured by the Gini coefficient 1 was
found to vary between 0.669 to 0.770. This measure
indicates a high degree of inequality in land distribu-
tion among both the stayer and mover households.
Circular migrant families have slightly less
land-inequality in comparison with stayers and
commuters. This is evident in Figure 7.1 which shows
the Lorenz curves for the distribution of household
landholdings. A comparison of graphs b , c and d clearly
indicates that there has been some reduction of
inequality among the migrants households. The Gini
coefficient for the migrants' land-distribution was
0.743, a ratio of land concentration which was slightly
lower than the ratios of 0.761 and 0.770 measured for
commuters and stayers respectively.
1 A measure of concentration of land (or income) derived from the Lorenz curve (Figure 7.1). The value of G (Gini coefficient) can vary between zero and one. A value of G = 0 represents perfect equality in distribution of land; whilst G = 1 means absolute inequality i.e. all land is owned by a single household. Generally the larger G is, the more unequal is the distribution.
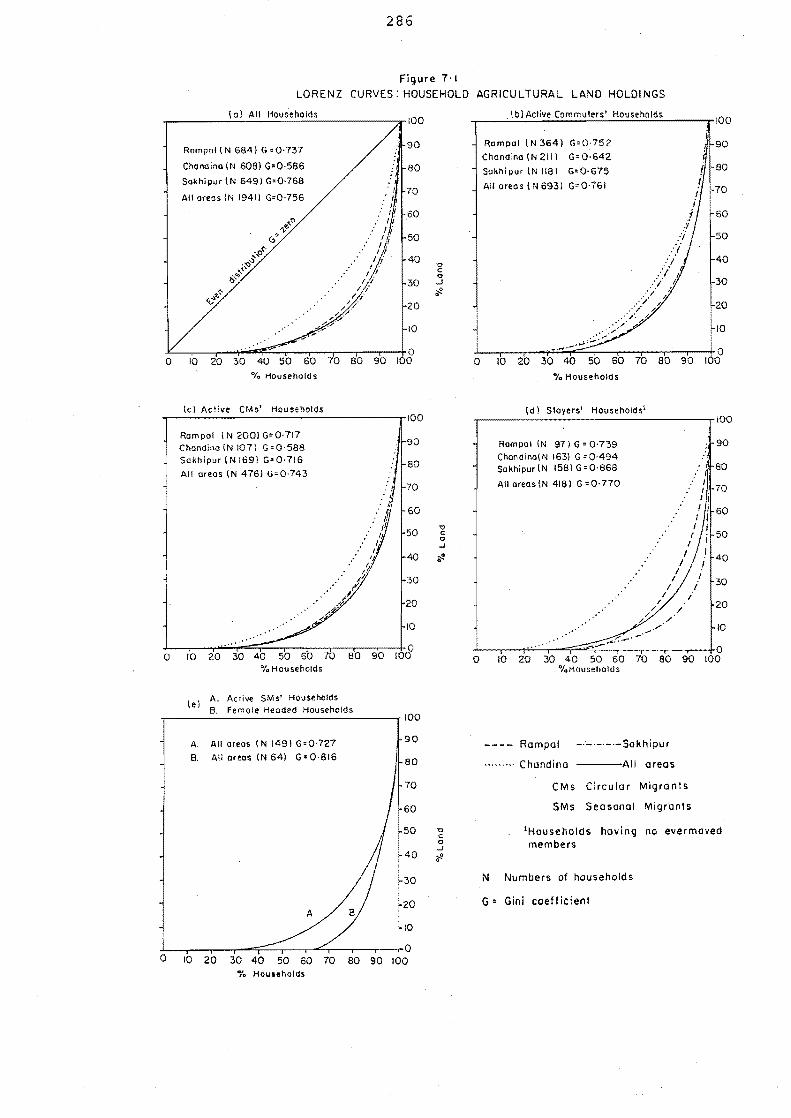
0
0
a
286
Figure 7·1
LORENZ CURVES: HOUSEHOLD AGRICULTURAL LAND HOLDINGS
(oj All Households
Rempel IN 684) G=0'737
Chandino IN 6081 G'0·586
Sakhipuf IN 649) G=0·768
All areas IN 1941) G=0·756
~o ","
0' .;...~~
\~VJ b"'~
<::-«}'"
10 20 30 40 50 60 70 80 90
% Households
lei A<:livf CMs' Households
Rampal (N 200) G= O' 717 Chandino IN 107) G-0·SS8 Sakhipur (N 1691 G·0·716
All areas IN 476) G=0·743
.. ' 10 20 30 40 50 60 70 80 90
% Households
Ie) A. Active SM s' Households B. Female Headed Households
A. All areas iN 149) G=0·727
B. All areas IN 64) G-O·916
A
10 20 30 40 50 60 70 80 90 % Households
100
90
eo
70
60
50
40 " c
" 30 .J
~ 20
10
0 I 0
100
90
80
70
60
50 ", c::
" ...J
40 >l! • 30
20
10
0 100
100
90
80
70
60
50 '" c
" ...J 40 >l! 0
30
20
10
0 100
lbl Aclive Commuters' HOuseholds -r--~:":"':":':';':';'';;'';;';;;';''';';';';;':;::':'':'''''':'':':=':':'::';'::':---"''T''IOO
Rampal(N364) G=0·752
Chandina (N 211) G=0'642
Sal<hipur IN 118) 6=0-675
All areas IN6931 G=0·761
90
80
70
60
50
:/ 40
/1 / // h 30
... I. .:/ I.
... / ""/. 20 ... ;>'" ~~ ./ 10
~-.-.-~~~~-r--r~--.--+O o 10 20 30 40 50 60 70 80 9,0 100
% Households
I d I Slayers' Household 51 ~------------------------------~IOO
90 Rompel (N 97) G = 0·739 Chondinal N 163) G =0-494 Sakhipur(N (58)G=0·868 :/80
Aliareas(N 418) G=0·770 ;' I : I 70
I
/ I
I
I
I I
I I
f
/ /.
/
I I
/ I
/ /
./ ...-
60
50
40
30
20
10
-~-''''''' ~~--~~~~~~~--~--r--r--+O o 10 20 30 40 50 60 70 80 90 100
%Hausehalds
---- Rempel -·-·-·-·-Sokhipur
......... Chondino All areas
eMs Circular Migrants
SMs Seasonal Migrants
IHouseholds having no ever moved members
N Numbers of households
G = Gini coefficient
287
These findings are also reflected in Table 7.5
which gives the percentage share of land owned by each
decile of households. At the lower end of the
distribution (deciles third to fifth), the land shares
are higher among the migrants than those among commuters
and stayers. For example, the bottom 40 percent
of migrants owned 1.72 percent of land as compared to
0.91 percent shared by stayers and 0.61 percent
possessed by commuters. In the top 10 percent, the
migrants' share of land was slightly lower than the
shares of commuters and stayers. Furthermore, the
reduction of land-inequality, to a considerable level,
is contributed to by the lower rate of landlessness
found among circular migrants (Table 7.6).
Land and migration
These findings lead us to the conclusion that a
larger proportion of the circular migrant families have
farm land, and the distribution of holdings among
migrant families is less unequal than is found among
other categories of mover. This is clearly evident
from Figure 7.2 which shows that in each decile of
households, a migrant has a significantly higher amount
of land than a commuter and a stayer. For instance, in
the fourth decile (decile group 30-40 percent) a migrant
household owned, on average, 0.24 acres of land - four
times as much as a commuter and almost twice as much as
as a stayer (Figure 7.2a). In the subsequent deciles,
the discrepancy gradually narrowed.
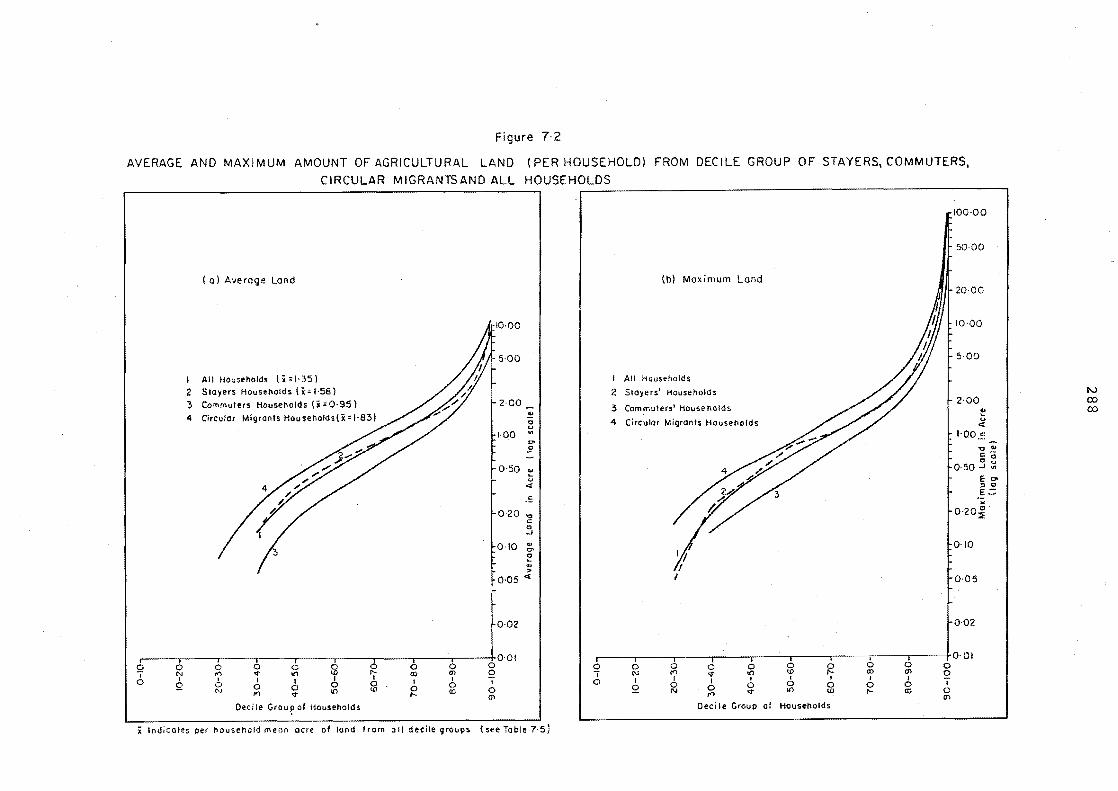
Figure 7·2
AVERAGE AND MAXIMUM AMOUNT OF AGRICULTURAL LAND (PER HOUSEHOLD) FROM DECILE GROUP OF STAYERS, COMMUTERS.
CIRCULAR MIGRANTS AND ALL HOUSEHOLDS ~---------------------------------------------.
100-00
50-00
(0) Average Lond (b) Maximum Land 20-00
10·00 11 rO
.
OO
5-00 1 5-00
I All Households t i = I· 35) All HQuseho Id S
2 Slayers' Households IV 2-00 3 Commuters' House nolds
2·00 CO
~ ~ CO
<> 4 Circular Migrants Housenolds u u «
2 Slayers HousehOlds Ii: '-58) :3 Commuters HousellOfds (i;0·95) 4 Circular Migrants Households(i= ',83)
1-00 '" I-QO.= "" £! .., ..
c-
O-50 ~ <> ::l
0·50..J '"
'" E co « :> '" e.:: .!E ,.
0-20 '0 0'20~ c :';
0·10 ., I ""
f ~O'IO :: ., >
0·05 « I- 0·05
0-02 ["02 0-01 I I j I I , I I I 0-01
0 0 0 0 0 0 0 (;) (;) 0 0 0 0 0 0 0 R 0 0 0 .. N '" q- I/') <0 I'-- «) '" 0 T (\J rf) <t .... <0 «) en 0 0
, I I I I I I I 'I 0 I I I I
, I I I I 0 0 0 0 0 0 0 0 0 0 0 0 0 0 0 0 - '" .... to W 0 '" 10 1.0 0 rf) v I'-- - rf) v r- oo
en en Decile Group of Households Oed Ie Graul> 01 Households
Indicotes per household mean acre of land from all decile groups t see Table 7-5)
289
Some other important measures of land
distribution such as per capita land and average land
holdings per household, were also derived from survey
data. It was found that migrants' families in each
study location had better access to agricultural land
than other mobility status families (Table 7.6).
Another point that should be noted here is that even the
returnees' households (households having ex-circular
migrants) were found to control more land than the
households of stayers, commuters and seasonal migrants.
The amount of land owned by circular migrants,
and the level of inequality were found to vary from one
location to another. A relatively lower level of land
concentration (G = 0.588) was recorded among migrants
from Chandina, for example, than for those from the
other two areas. Sakhipur migrants distinguished
themselves by holding larger amounts of land (per capita
as well as per household) and having higher levels of
inequality in terms of ownership of property. At
Rampal station migrant households had very small land
holdings and a higher inequality rate (Table 7.6). The
predominant reasons for the variations of land ownership
patterns among the migrants in the three study areas are
strongly related to the individual area's man/land ratio
and the quality of land as well. When land distribu
tion is related to migration rates (percentage of male
migrants among all males of age 15 years and above) a
widely mentioned hypothesis was supported which states
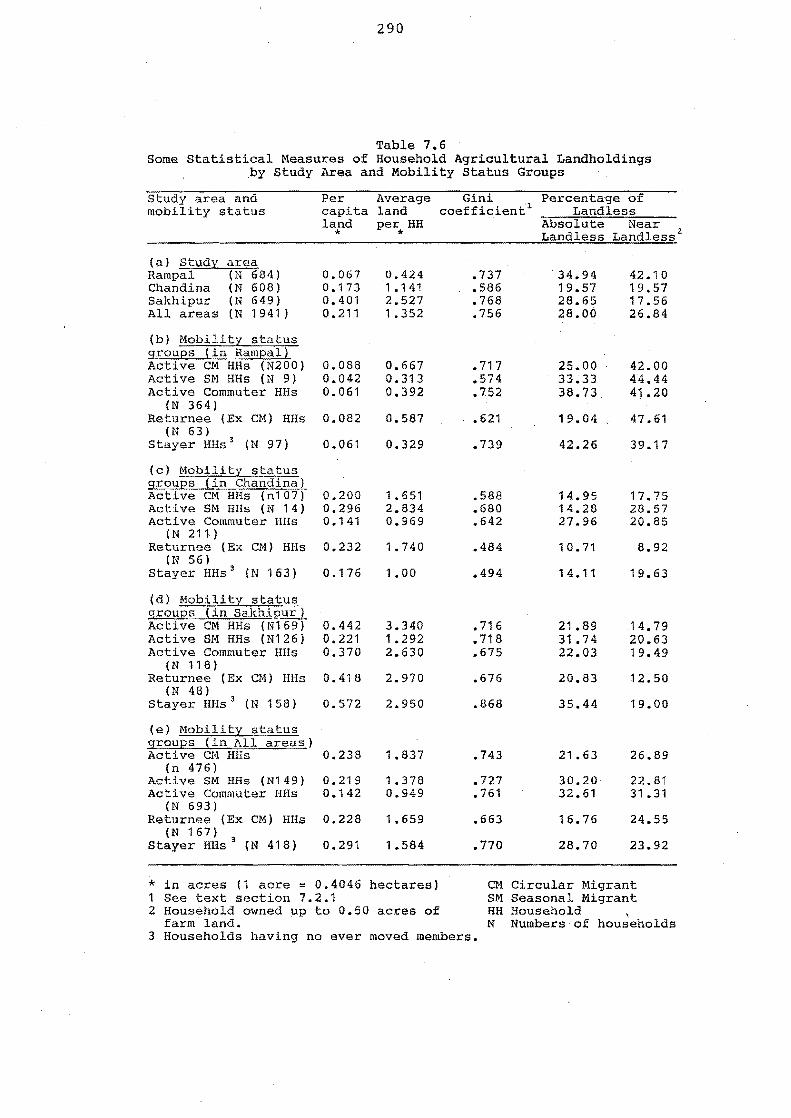
290
Table 7.6 Some statistical Measures of Household Agricultural Landholdings
by study Area and Mobility status Groups
study area and mobility status
(a) study Rampal Chandina Sakhipur All areas
area (N 684) (N 608) (N 649) (N1941)
(b) r10bility status groups (in Rampal) Active CM HHs (N200) Active 8M HHs (N 9) Active Commuter HHs
(N 364) Returnee (Ex CM) HHs
(N 63) stayer HHs3 (N 97)
(c) Mobility status groups (in Chandina) Active CM HHs (n107) Active SM HHs (N 14) Active Commuter HHs
(N 21l) Returnee (Ex CM) HHs
(N 56) stayer HHs3 (N 163)
(d) Mobility status groups (in Sakhipur) Active CM HHs (N169) Active SM HHs (N126) Active Commuter HHs
(N 118) RetUrnee (Ex CM) HHs
(N 48) stayer HHs 3 (N 158)
(e) Mobility status groups (in All areas) Active CM HHs
(n 476) Active SM HHs (N149) Active Commuter HHs
(N 693) Returnee (Ex CM) HHs
(N 167) 3
stayer HHs (N 418)
Per Average capita land lapd per* HH
0.067 0.173 0.401 0.211
0.088 0.042 0.061
0.082
0.061
0.200 0.296 0.141
0.232
0.176
0.442 0.221 0.370
0.418
0.572
0.238
0.219 0.142
0.228
0.291
0.424 1 .141 2.527 1.352
0.667 0.313 0.392
0.587
0.329
1 .651 2.834 0.969
1.740
1.00
3.340 1.292 2.630
2.970
2.950
1.837
1.378 0.949
1.659
1.584
* in acres (1 acre = 0.4046 hectares) 1 See text section 7.2.1 2 Household owned up to 0.50 acres of
farm land.
Gini 1 coefficient
.737
.586
.768
.756
.717
.574 • 752
.621
.739
.588
.680
.642
.484
.494
.716
.718
.675
.676
.868
.743
.727
.761
.663
.770
Percentage of Landless
Absolute Near 2
Landless Landless
·34.94 19.57 28.65 28.00
25.00 33.33 38.73 .
19.04
42.26
14.95 14.28 27.96
10.71
14.11
21 .89 31 .74 22.03
20.83
35.44
21.63
30.20 32.61
16.76
28.70
42.10 19.57 17.56 26.84
42.00 44.44 41.20
47.61
39.17
17.75 28.57 20.85
8.92
19.63
14.79 20.63 19.49
12.50
19.00
26.89
22.81 31 .31
24.55
23.92
CM Circular Migrant 8M Seasonal Migrant HH Household \ N Numbers of households
3 Households having no ever moved members.
291
that the high migration rate from a rural area is
associated with relatively higher levels of land-
inequality among the households of that area (Lipton
1980, 4; Connell et ale 1976, 10; Chaudhury 1978a).
The migration rates for Rampal, Chandina and Sakhipur
were found to be 21, 12 and 19 percent respectively.
The corresponding figures for land-inequality measured
by Gini coefficient were recorded as 0.737, 0.586 and
0.768 (Table 7.6).
Inequality and pauperism
The level of land-inequality greatly depends on
the intensity and prolongation of the processes of land
alienation and pauperism, both of which are again
influenced by the process of rural emigration. In the
rural areas the economic benefit of emigration often
partly or fully removes the risks of losing land and it
thereby pushes down the inequality rate among the
migrants. However, as land is a very scarce and
essential resource in Bangladesh, people try to hold on
to it as long as possible (Alangir 1978, 105). Land is
only disposed of by selling or mortgaging if the farmers
cannot find any alternative way of providing a liveli-
hood for a long period. In this context, Harrison
(1981, 87) rightly recounts:
in Bangladesh ••• the owner [of a small holding] becomes increasingly vulnerable. If he cannot find enough outside work - or if disease or disaster strike - he will have to mortgage his land for a loan and risk forfeiture, or sell it off bit by bit to buy
292
a temporary respite, ensuring short-term survival at the risk of long-term ruin.
In these circumstances, the migration process provides
an alternative strategy for survival.
While discussing the massive indebtedness in
Indian agriculture (India, Pakistan and Bangladesh),
Davis (1951, 210) rightly pointed out quoting Mukhtyar
(1930, 247-49) that a good proportion of the debt-free
families are, in fact, migratory. Among the migrants
of all study areas, the proportions of land-paupers were
found to be comparatively low (Table 7.6). This
result, obviously, indicates that a large number of
migrant families originating from the small landowning
class are trying to avoid land selling or mortgaging and
in turn they are adopting a migration strategy for
maintaining their livelihood.
7.2.2 Attributes of land owners
In the competition for acquiring land, circular
migrants appeared to be the winners against the other
competitors such as commuters, stayers and seasonal
migrants. In all deciles of households, they
(migrants) owned significantly higher amounts of land
than others (Figure 7.2). There are several socio-
economic attributes (e.g. educational attainment, family
size and composition, occupation, and income level)
which favour the migrants in acquiring more land. The
concentration of income may help the concentration of
land holdings and the two phenomena may reinforce each
293
other. Family size and composition are also intimately
connected to land acquisition.
In India, Attwood (1978, 5) stated, quoting
Mandelbaum (1970, 47-54), that wealthier families have
more surviving sons and they tend to remain in large
joint families for long periods. A parallel finding by
Cain (1978) from villages in Mymensingh district in
Bangladesh indicated that poor families generate fewer
surviving children and those households break down (due
to sons' departure from their fathers' home) much
earlier than rich families. He found that the mean age
of sons at the time they leave their fathers' home is
greater (28.5 years) among large landowning families
than among landless peasants (22.3 years).
Regarding household composition, Jansen (1983,
58) put his comment in this way " the more land a
household owns the more complex is its composition". In
the preceding section the migrants households were found
to be predominantly more complex than other groups of
movers as well as stayers. Considering all these
findings it can now be concluded that migrants have more
opportunities to reap rural income (mostly from land) as
well as urban income (through migration) and in doing
so, they can save more money which in turn is often
invested in land procurement.
Owned and operated land
The variable of land is further analysed in Table
7.7 where data on owned land and operated land are

294
compared. The results clearly indicated that the
migrants usually rent out a large proportion of their
land to tenant farmers. As a result, among the migrants
the amounts of operated land (per capita or per
household) were found to be much lower than the amounts
obtained for any other samples.
Due to the absence of migrants, their households
generally have a shortage of village-based male man
power required for the operation of all the family's
farm land. In such a situation, most of the migrant
families rent out at least part of their land. Data
also shows (Table 7.7) that among the landowning
households the proportion of non-cultivator families was
highest among the migrants (28 percent) and lowest among
the stayers (4 percent).
The case of commuters
It is evident from the analysis of land data that
the position of commuters in terms of their landholdings
is quite different to that for circular migrants. Such
a pattern can easily be understood in the light of
comparative socio-economic status. The most important
factor which indirectly caused an imbalance in land
distribution between the commuters and the migrants was
the difference in educational attainment. Higher
proportions of illiterate and nominally literate persons
were found among commuters, and most were employed
in low income occupations such as pedlar trades and wage
labour. As a result, commuters were generally not
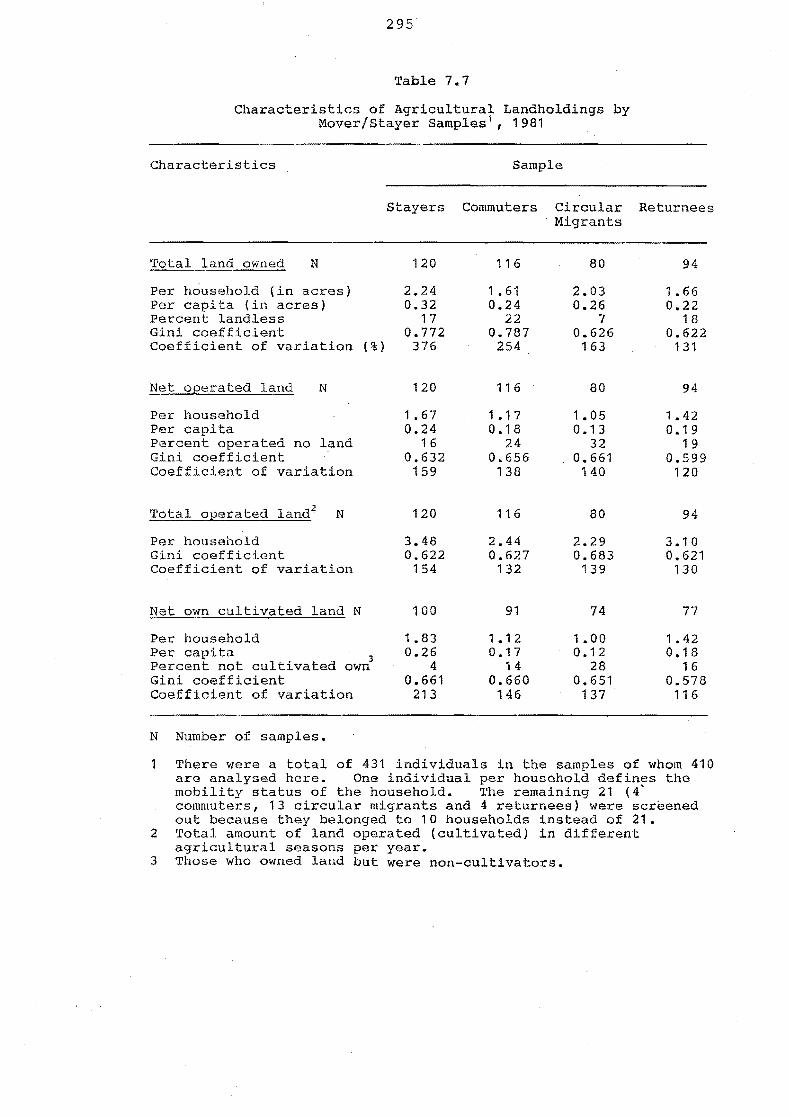
295
Table 7.7
Characteristics of Agricultural Landholdings by Mover/Stayer Samples 1
I 1981
Characteristics Sample
stayers Commuters Circular Returnees Migrants
Total land owned N
Per h~usehold (in acres) Per capita (in acres) Percent landless Gini coefficient Coefficient of variation (%)
Net operated land
Per household Per capita
N
Percent operated no land Gini coefficient Coefficient of variation
Total operated land2 N
Per household Gini coefficient Coefficient of variation
Net own cultivated land N
Per household Per capita 3 Percent not cultivated own Gini coefficient Coefficient of variation
N Number of samples.
120
2.24 0.32
17 0.772
376
120
1. 67 0.24
16 0.632
159
120
3.48 0.622
154
100
1 .83 0.26
4 0.661
213
11 6
1 .61 0.24
22 0.787
254
116
1.17 0.18
24 0.656
138
116
2.44 0.627
132
91
1.12 0.17
14 0.660
146
80
2.03 0.26
7 0.626
163
80
1.05 0.13
32 0.661
140
80
2.29 0.683
139
74
1.00 0.12
28 0.651
137
94
1. 66 0.22
18 0.622
131
94
1. 42 0.19
19 0.599
120
94
3.10 0.621
130
77
1.42 0.18
16 0.578
116
There were a total of 431 individuals in the samples of whom 410 are analysed here. One individual per household defines the mobility status of the household. The remaining 21 (4' commuters, 13 circular migrants and 4 returnees) were scr~ened out because they belonged to 10 households instead of 21.
2 Total amount of land operated (cultivated) in different agricultural seasons per year.
3 Those who owned land but were non-cultivators.
296
economically in a position to win in the competition
with migrants for land acquisition. Furthermore, the
difference of holding size between commuters and
migrants was partly caused by the differential patterns
of their family size and structure.
A comparative analysis of land owned or operated 2
shown in Table 7.7 indicates that although commuter
households possess smaller amounts of land than migrant
families, the former households operate more land than
the latter. In the previous chapter it was shown that,
unlike migrants, most commuters were involved in farm
activities. The following section will explain why
circular migrant families were far less interested in
self-operated farming than commuters and stayers.
Large households
Further analysis of land data revealed some
interesting aspects of the household land operation and
mobility strategies undertaken by the large joint
families. It was found that these families, in most
cases, have a sizeable area of land and several earners,
and they carefully utilize their manpower in such a way
that these families can earn an income simultaneously
from land, commuting and migration.
In Table 7.7 (see footnote 1) the study excluded
21 samples of which 13 were circular migrants who
originated from 10 households. These households were
2 Land cultivated by family members and/or hired labourers.
297
relatively large and had several earners including at
least two different types of working movers. On
average, these households owned 8.8 acres of land of
which 6.0 acres were operated by those families.
If these 13 cases (10 households) had been
included in the analysis done for Table 7.7, the average
amount of owned land, operated land and own cultivated
land by the migrants would be 2.69, 1.54 and 1.53 acres
. (per household) instead of 2.0, 1.05 and 1.00 acres
respectively (Table 7.7). This finding seems to be
contradictory to our previous statement that circular
migrants operate or cultivate smaller amounts of land
than others. The reason for the anomaly is that those
10 households were not just circular migrant households;
they contained several types of movers.
As a result of the highly skewed distribution of
land patterns of landholdings often misrepresent the
true picture of the majority of households. The
analysis and interpretation of landholdings in the
context of household composition and mobility strategies
is a complex subject. It is very complex in the case
of a minority of big households who possess large
amounts of land and earn income from diverse sources.
This complexity should be borne in mind in any analysis
of the relationship between land ownership and household
mobility strategies.
298
7.3 TENURAL STATUS
In Bangladesh the roots of rural emigration
predominantly lie in the land; people in the rural
areas depend in one way or another for their income or
employment on agricultural activities (Jansen, 1983, 2).
Income from agriculture can be obtained by owners of
land, tenants, employees for landowners or a combination
of these statuses. In rural Bangladesh there is yet
another group of households who get no income from
agricultural sources. These are the non-tenant, non
labour, landless families. The broad pattern of all
these tenural arrangements and their variations among
the different mobility status households is shown in
Table 7.8.
7.3.1 'Gentlemen' farmers
The most striking feature of land tenancy among
the circular migrants' families is that they are less
likely to practise tenant farming but more likely to
rent out land to the tenant farmers. Only 16 percent
of circular migrants were tenant farmers (owner cum
tenant plus pure tenant) compared with around 30 percent
for stayers, commuters, and seasonal migrants (Table
7.8). Almost one-fifth (19 percent) of the migrants'
households rented out their total land and nearly
another one-fifth (17 percent) rented out part of their
families holdings. In contrast to these figures, there
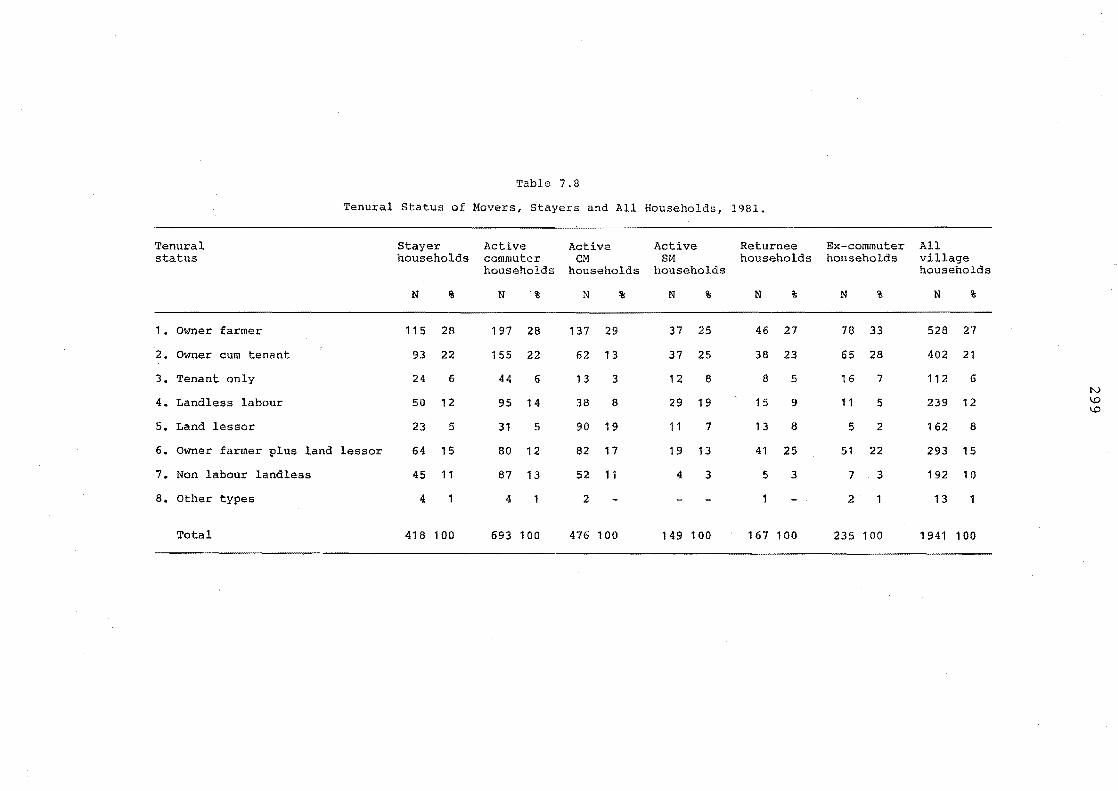
Table 7.8
Tenural Status of Movers, Stayers and All Households, 1981.
Tenural Stayer Active Active Active Returnee Ex-commuter All status households commuter eM SM households households village
households households households households
N % N % N % N % N % N % N %
1. Owner farmer 115 28 197 28 137 29 37 25 46 27 78 33 528 27
2. Owner cum tenant 93 22 155 22 62 13 37 25 38 23 65 28 402 21
3. Tenant only 24 6 44 6 13 3 12 8 8 5 16 7 112 6 N
4. Landless labour 50 12 95 14 38 8 29 19 15 9 11 5 239 12 \!:)
"" 5. Land lessor 23 5 31 5 90 19 11 7 13 8 5 2 162 8
6. Owner farmer plus land lessor 64 15 80 12 82 17 19 13 41 25 51 22 293 15
7. Non labour landless 45 11 87 13 52 11 4 3 5 3 7 3 192 10
8. Other types 4 4 2 2 13
Total 418 100 693 100 476 100 149 100 167 100 235 100 1941 100
300
was much less likelihood of other types of mover
households and stayers renting out land.
In the preceding section it was pointed out that
the circular migrants, unlike others, usually do not
operate a large proportion of their owned land (almost
half - see Table 7.7). Although it is not possible to
produce any comparable data from other parts of the
world, there exists a widely held view that there are
many more 'gentlemen' farmers among migrants than among
non-migrants.
Several reports published recently in and outside
of Bangladesh (Hussain 1977, Van Schendel 1981, Jansens
1983, and Hartmann and Boyce 1983) have noted that the
system of farming without touching farm dust, or farming
through share-cropping arrangements or hired labour, is
more profitable for those landowners who can utilize
their family labour in more remunerative occupations.
Obviously, this remark mostly referred to the landowning
migrant families who, on one hand, sent their male
earners to towns for higher incomes and, on the other
hand, reaped the fruits of land by using cheap farm
labour and controlling the terms and conditions of
sharecropping (the largest and most widely practised
type of land tenure in Bangladesh).
Sharecropping
Although, in general, sharecroppers cultivate the
301
landlord's field on a fifty-fifty basis,3 their net
share is always smaller than that of the landlords.
This is because they have to provide all inputs (except
land) and sometimes have to take a loan to do this from
landlords or money lenders. Very often this type of
loan from non-institutional sources is linked to the
condition of repayment in kind. This could be paddy at
a post-harvest-period price so that the landlords or
money-lenders can easily stock the crop at the cheapest
price and then sell it to the market at a high margin of
profit during the rest of the year.
If the crop of a sharecropper is damaged by
floods, drought or pests, he might end up with an income
that is even less than a farm labourer's earnings
(Hartmann and Boyce 1983, 196). Demographic pressure,
chronic shortage of land, and severe un/underemployment
problems in the agricultural sector deter sharecroppers
from revolting against these exploitative tenure
arrangements. Under these circumstances, it is hardly
surprising that the sharecropping system facilitated the
propensity of migration among the landowning families.
3 Considerable variation in cost sharing practices was found between the areas under study. In all areas human labour and animal power, which constitute the major costs to sharecroppers, were borne by the tenant. Seed for traditional crops was mostly supplied by the landlord. Modern inputs such as chemical fertilizers, hybrid seeds (e.g. IRRI paddy, potato etc.) and irrigation were not used-rn-sakhipur but were found quite commonly in the other two areas. Generally, the landowner provides these inputs but deducts his costs from the gross harvest before output is shared.

302
In many cases, long time absentee landowners find
sharecropping a convenient system for cultivating their
land. They come to stay in the village, usually during
the main harvest season, for a short period sufficient
to collect their shares from sharecroppers.
Attitudes towards farming
The notion of a 'gentleman' farmer or farm
supervisor also has to be considered in the context of
the social attitude towards manual labour. Tradition
ally, work such as agricultural labour was considered
an inferior means of livelihood and thus, if any family
could afford to live without working for others, they
would prefer to do so (Hussain 1977, 307). Generally,
families with a better education level tend to avoid
farm work and as a result a significant proportion of
circular migrant households were found to depend on
sharecroppers and agricultural labourers. In Table 7.9
a strong negative response among the migrants families
to the notion of selling their labour for farm work is
evident in comparison with other types of mover
households.
Migrants as farmers
Despite the fact that a large proportion of
migrant households (36 percent of all CMs or 46 percent
of landowning eM households - see Table 7.8) were found
to rent out land, many landowning families (294 out of
388 or 76 percent) still retained the title of farmer,
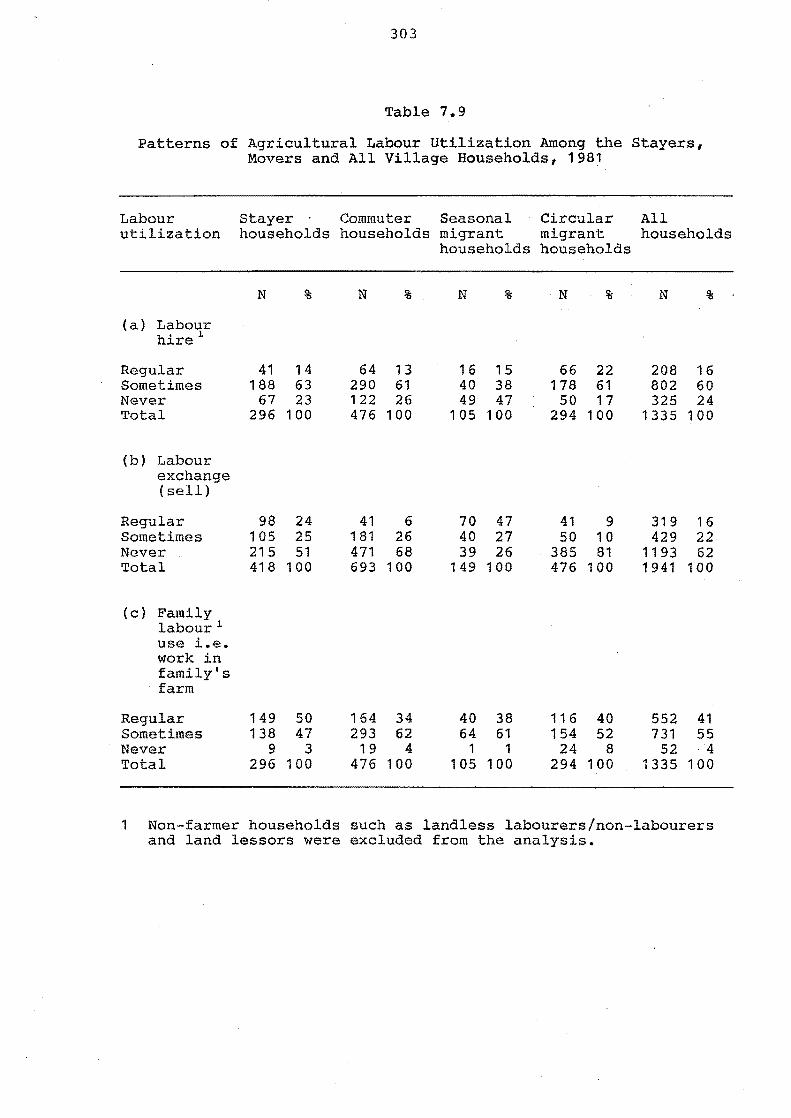
303
Table 7.9
Patterns of Agricultural Labour Utilization Among the Stayers, Movers and All Village Households, 1981
Labour stayer Commuter Seasonal Circular All utilization households households migrant migrant households
households households
N % N % N % N % N %
(a) Labour hire 1
Regular 41 14 64 13 16 15 66 22 208 16 Sometimes 188 63 290 61 40 38 178 61 802 60 Never 67 23 122 26 49 47 50 17 325 24 Total 296 100 476 100 105 100 294 100 1335 100
(b) Labour exchange (sell)
Regular 98 24 41 6 70 47 41 9 319 16 Sometimes 105 25 181 26 40 27 50 10 429 22 Never 215 51 471 68 39 26 385 81 1193 62 Total 418 100 693 100 149 100 476 100 1941 100
(c) Family labour 1
use i.e. work in family's farm
Regular 149 50 164 34 40 38 116 40 552 41 Sometimes 138 47 293 62 64 61 154 52 731 55 Never 9 3 19 4 1 1 24 8 52 4 Total 296 100 476 100 105 100 294 100 1335 100
1 Non-farmer households such as landless labourers/non-labourers and land lessors were excluded from the analysis.
304
either as owner-farmer, or as owner cum tenant, or as
owner cum lessor. It is of interest to establish how
these households carry out farming activities as well as
being absent for lengthy periods.
There is no single answer or tactic which can
explain this phenomenon. A number of variables were
found which were deeply related to the combined
operation of migration and farming. These were:
household size, amount of land owned or under self
operation, socio-economic condition and, finally, the
profitability of farming.
Bangladesh is a country of small scale
agriculture and much of the produce comes from millions
of mini peasant farms. Harrison (1981, 253) pointed
out that the maximum landholding that a man can work
alone in Bangladesh is one and a half acres (0.60
hectares). Less than one-third (29 percent) of the
landowning eM households owned that much land. The
proportion of such households actually operating that
amount of land is lower still as a good proportion of
landowning eMs (46 percent) had already rented out a
substantial amount of their land. Table 7.7 also
reveals that the amount of land under self-cultivation
among the eM families was much smaller than other non
migrant families.
A close look at the evidence in Tables 7.7 and
7.8 suggests that the overwhelming majority of the eM
families can practise farm activities and migration
305
together because they have been cultivating a very small
quantity of land. Families having a relatively large
farm-holding were found to cultivate only that much land
which could be economically managed by their own
family's labour and/or by hired labour. Very often
large landowning households have a greater amount of
manpower and they wisely employ part of it in the
family's farm management, leaving the other part to earn
off-farm incomes through migration.
How much land a migrant family can operate (or
could operate in the future) under self-cultivation
will depend, among other things, on its manpower, socio
economic condition and the profitability of farming. A
number of recent studies (Jansen 1983, Hussain 1979)
have claimed that sharecropping contracts have been
shortening in recent years as compared to earlier times.
The reasons for the shorter contracts, according to
those studies, are the increased competition for
sharecropping contracts and also the increased poverty
of tenants as well as of small landowners.
7.3.2 Owner-operated tenancies
Contraction of sharecropping land obviously goes
along with the expansion of land under self-cultivation.
There are some logical reasons for the rise of owner
operated tenancy in Bangladesh. The most important
reason is that when a land lessor household splits up,
the newly established households will need all or a
306
large part of their plots of land for self-cultivation.
The process of household-splitting reduces the landed
property and thus, in turn, results in a deterioration
of the socio-economic position of newly formed house
holds. Once the latter process gets established, it is
very difficult for the household to avoid so-called
'less prestigious work' such as farm occupation. Due
to the process of socio-economic degradation, a large
number of rural families (including migrant households)
have recently been undertaking farm activities.
Another important reason which encourages the
self-operated farming process is the higher rate of
profit in land cultivation. Since the early 1970s,
especially after the eruption of oil-prices, farming
became very profitable due to high prices for
agricultural products (Alamgir 1978, 110) on one hand
and declining farm wages (in real terms) on the other.
Moreover, with the diffusion of HYV technology, the
profitability of land cultivation increased even more.
The provision of tax-free income in the farming
sector was another incentive to cultivate land under
owner operation. However, all these incentives and
opportunities for making a good profit from cultivation
are mostly suited to the land-rich households. As
migrant families are better placed in terms of land
occupancy, they also have bright prospects for earning
land-based incomes.
307
Labour strategies
In the subsistence agriculture system, tilling of
land is mostly done by the family's manpower, male,
female or both. But in Bangladesh, due to socio
religious restrictions on female outdoor work, farm
activities in the field are carried out almost entirely
by males. As a result, households which lack active
male members or fall short of male manpower (due to
migration or if the household owns a large amount of
land) are found either to hire male labour to do
their farm work or to rent out land to tenant farmers.
There is an abundant supply of cheap male labour in
Bangladesh and the great majority of households usually
hire farm labourers to supplement the family's male
manpower (Table 7.9). Migrant families, obviously,
were found to hire farm workers more frequently than
other types of movers.
Households who owned more land also operated more
land and they depended more on hired labour in addition
to on the family's manpower. The nature of work done
by the family's members depended mostly on socio
economic status; those who were from the apex of rural
society, or close to it, were involved in farm
supervision or sometimes gave a hand in light tasks.
Others who could not afford to be conscious about so
called status, were engaged in all sorts of farm work.
Only the large joint families could spare male
members for taking care of their farm regularly. For
308
example, the average household size of the 116 CM
families (Table 7.9) who worked regularly on their farms
was more than ten; four out of five families were joint
or extended types. Meanwhile, part-time participation
in self-operated farms seemed to be very common,
especially among those households which did not have
full-time resident males in the village. In such a
situation, the migrants were found to plan their home
visits to coincide with critical times in the
agricultural calendar, such as land preparation,
harvesting etc.
Leasing land
There were several other tactics for cultivating
owner-operated farms. Sometimes economically better
off households leased out part of their self-operated
land just for a season or part of a season to those
families that could provide enough family labour
constantly for planting and nursing cauliflowers/
cabbages (in Rampal), potatoes (in Rampal and Chandina)
and chilli plants (in Sakhipur). These are the most
profitable farm products as well as the most labour-
intensive crops found in those study areas. Further-
more, at the time when these crops are usually grown
labour demand and wage rates both reach their peak
levels.
The underlying motive behind this type of leasing
(locally known as thika borga/niri borga) is to cut down
huge labour costs simply by exploiting those lessee
309
families who normally get one-fourth (some cases even
less) of the gross harvest against their unaccounted
sweated labour.4 Planning to grow cauliflowers,
cabbages, and potatoes is very often a kind of short
term investment of a large sum of moneyS and only those
families that have enough cash in hand, or have good
relations with financing authorities in villages and
towns can grow those crops profitably. In this case,
land-rich CM households have a better chance because the
migrants are already earning cash from towns, and they
have better education which indirectly helps in finding
loans (from various organizations in towns and in rural
locations) for growing these profitable crops.
In Rampal and Chandina, another practice of land
tenancy was observed among the farmer families. A few
4 During field inquiries in Rampal and Chandina, intensive and extensive use of labour was observed particularly in potato fields and cauliflower/cabbage patches. The huge army of workers (hired or family members) participating in various stages of growing these vegetable crops included men of all ages, children and even some women from the lower socioeconomic class. Sometimes at the busiest days of planting or harvesting of potatoes, it was found that the whole household, especially among the poor, moved to the field for work. In Rampal, irrigation by kalash (pitcher) was a common traditional method of watering cauliflower/cabbage gardens. Although the process is the easiest it requires a large amount of manpower: the pitcher is filled with water fom the nearest water sources (dobas/khals/ponds) and poured into the fields or plants after carrying (Bangladesh Geographical Society, 1961).
5 Other than the labour requirement, the productivity of these winter crops depends greatly on the amount of chemical fertilizer used, quality of seeds, and irrigation facilities. Growers often need a large amount of cash to buy these modern inputs.
310
households were found to lease out a part or all of
their self-operated land on a fixed-rent basis, mostly
for the winter season only. According to the contract
between the two parties, the lessee family pays a
certain amount of money in advance and it preferably
grows some profitable crops. Apart from family
maintenance, the lessor households (mostly migrant)
invest that rent-money in some more profitable but less
risky off-farm occupations, such as business in
neighbouring markets or elsewhere, getting jobs or
services in towns, or simply invest in children's
education with a view towards a better future for the
family.
When the contract season is over, the lessor
household takes back its leased out land under self
cultivation for the rest of the seasons of the year
during which times cultivation is much easier compared
to the winter season. A point should be mentioned here
that the practice of fixed-rent tenancy in Bangladesh
has been found an insignificant system due to socio
religious restrictions. But some recent researchers
(Jansen 1983; Hussain 1979), including the present one,
indicate that the trend towards a fixed-rent tenancy
system is slowly spreading through the social hierarchy
due to increasing socio-economic depression and the
diffusion of HYV technology.
The situation in Sakhipur
The amount of land owned or operated by migrant
311
and non-migrant households in Sakhipur villages was much
higher (Table 7.7) than was found in the other two study
areas. Here, a rich-landowning household depends
heavily on its sharecroppers or on wage labourers.
Households that usually operate a large amount of land
under self-cultivation mostly accomplish their farm
activities with the help of raiyots, a class of land-
poor which for a long time has been attached to the
tilling of land belonging to others, especially the big
landlords. 6 In addition, farm wages in Sakhipur are
among the cheapest in the country as the area has very
limited opportunities for earning an alternative or
additional living outside the farm.
Usually agricultural activities and wages in
Sakhipur peak during mid-March to mid-May, when a huge
quantity of labour is required for land preparation and
6 When the British colonized India, they created a tenural system in Bengal where zamindars became the lawful owners of land. They would cultivate their lands with the help of a group of tenants - called raiyots. The zamindary system was abolished in 1950 but the term raiyot is still commonly used in and around Sakhipur to denote a group of landless and near landless labourers who largely depend on big landowners for employment. Every big landlord has a number of raiyot families and he fosters them for his own interest. Some raiyots have no homestead land but have been sheltered for many years by their monibs {landlords}. Generally when the landlord needs agricultural labourers, he employs his raiyots first and pays low wages (lower than the market). Due to the feudal situation and extreme scarcity of employment, raiyots cannot speak out against this exploitation. The raiyot system in a different fashion exists in some other areas of the country especially where, like Sakhipur, a few households still own large plots of land and the large majority of families own virtually nothing.
312
sowing of aus/aman paddy and jute, the three widely
cultivated traditional crops of the country. Before
the start of this peak season, there is a short lean
period which runs through late January to early March.
During this slack season both human labour and animal
power remain quite cheap and the landlords take
advantage of this situation. They partly prepare some
of their plots of land (particularly those plots which
remain empty after harvesting aman paddy or some short
lived rabi crops) in advance and cleverly reduce the
peak season labour demand vis-a-vis wage rates.
Many respondents reported to us that previously
(10 -12 years ago) the landlords would never start land
preparation in advance. Perhaps they have changed
their minds recently because of increases in wages,
shortage of animal power, irregular availability of
family man-power due to the mobility of landowning
households, and of course, the deteriorating rural
economic condition.
Patrons, clients and non-farmers
Since 1950, the pattern of tenural arrangements
between landlords and tenants or landlords and
raiyots/labourers has diversified in the study areas.
What is significant to note here is that in any
arrangement the terms and conditions are always imposed
by the landlords on tenants, lessees and labourers.
Two separate studies (Hussain 1979, 2; Van Schendel
1981, 183) have argued that tenancy is a means of
313
'exploitation' of the weaker classes by well-to-do
families in rural Bangladesh.
Hussain's study further revealed that more
transactions of land between landlords and tenants took
place between the stronger large landowners and weaker
participants than between participants of similar
strength. Jansen (1983) explained the tenural
relationship between two participant households in terms
of a patron-client relationship where the land-poor
(client) tries to align himself with landlord (patron).
Among the circular migrant households the
proportion of landless was 22 percent (103 out of 476)
and half of them had no land-related occupation or
income at all. In other words, they were neither
farmer nor farm labourer. The study labelled these
households as a non-labour landless type. Their socio
economic condition was comparatively better than
landless labourers but was substantially lower in
comparison with the landowning class. Why were these
considerable numbers of households not interested in any
farm occupation? To answer this question requires
further research but it can be noted here that a
striking characteristic of these households was their
limited man-power.
Three-quarters of the non-labour landless
households were a simple nuclear type (average family
size was below 6 persons) and more than two-thirds (69
percent) had only one income source. Presumably a
314
large proportion of non-labour landless households might
be newly established families, and their tenural status
may change in the future. In addition it should be
mentioned that usually landlords do not want to rent
land to those families who have small quantities of man
power, assuming that they will not have adequate labour
for land development. On the other hand, farming on
tenant holdings with the help of hired labour is, in
general, unprofitable. Under these circumstances, these
non-labour landless families were found to depend only
on off-farm occupations located mostly in towns.
7.4 HOUSEHOLD INCOMES
The analysis of household income characteristics
is a complex and difficult task, particularly in rural
areas where very often a family has two or three sources
of income both in cash and in kind, and seldom keeps any
detailed records of payments and receipts. Many
factors such as occupation, education, family size/
composition and land holdings are closely related to the
household's economic condition. Since these factors,
which have been discussed in preceding sections, have an
important impact on the pattern of income distribution,
some impressions of the economic situations of movers
and non-movers will have been formed already. These
will definitely assist in the interpretation of the data
introduced in this section.
315
7.4.1 Income and mover status
Table 7.10 and Figure 7.3 give a comparative view
of the annual household income of movers, stayers and
all rural households covered by the surveys in 1981.
Results from these analyses clearly indicated that the
economic condition of migrants families was much better
than any other group of families. For example, the
median income of eM households was 15600 taka. This
amount was 30 percent higher than the median income of
commuters (12000 taka), but 117 and 152 percent higher
than the corresponding median incomes of stayers (7200
taka) and seasonal migrants (6180 taka).
Migrants and non-migrants
Variations in income between the circular migrant
and non-migrant families were also well marked in the
top and bottom 25 percent of households (upper and lower
quartiles) (Table 7.10). In the lower quartile the
difference in income between the migrants and the
commuters was 14 percent, while between the migrants and
the stayer-seasonal movers the difference was as high as
129 percent. In the upper quartile, the income
variation between the migrants and the commuters was
wider and averaged 42 percent. The other two groups of
households (stayers and seasonal movers) recorded 128
and 110 percent variation respectively_
At high levels of income (households receiving
over 60,000 taka, see Figure 7.3) the numbers of stayer
and seasonal migrant families, were very small. Only
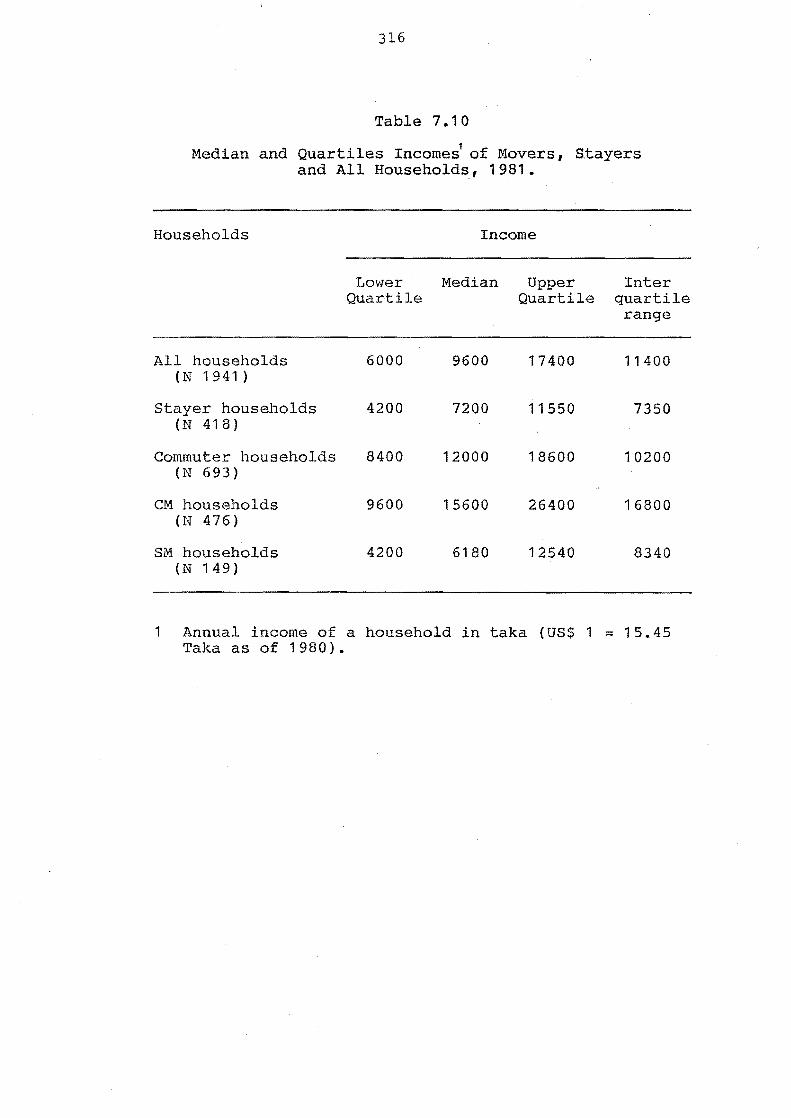
316
Table 7.10
1 Median and Quartiles Incomes of Movers, S,tayers
and All Households, 1981.
Households Income
Lower Median Upper Inter Quartile Quartile quartile
range
All households 6000 9600 17400 11400 (N 1941)
Stayer households 4200 7200 11550 7350 (N 418)
Commuter households 8400 12000 18600 10200 (N 693)
CM households 9600 15600 26400 16800 eN 476)
SM households 4200 6180 12540 8340 (N 149)
1 Annual income of a household in taka (US$ 1 = 15.45 Taka as of 1980).

100
90
en 80 "0
0 .s::: ~ en 70 :::J 0 J: - 60 0
-c: ~ u 50 ... ~ c.. ~
40 > -0 30 :::J
E :::J
U 20
10
0
Figure 7-3
HOUSEHOLD YEARLY I NCOME DISTRIBUTION, 1981
I All Households (N 1941)
2 Stoyers Households (N 418)
3 Commuters HouseholdslN 693)
4 C M's Households (N 476)
. 5 SM's Households (N 149)
6 Female Headed Households (N 64) 6
i : i : .- .
/ : i~
i ; I ;
! f c /: 1 ~
I j: ~ I
I ./ t!././o/ ._._._._o_.-.-·-·-·~ .
200 500 1000 2000 5000 IOPOO 20,000
Household Yearly Income in Taka (log scale)
.....,..~ .. --.- ..
~ Upper Quartile
\ Median
~ Lower Quarti Ie
50,000 100,000 200,000
W I-' -..J
318
42 households 1 out of a total of 1941 had an annual
income of over 60,000 taka. Of these 42, 30 families
had active circular migrants, 15 possessed commuters,
two households were comprised of seasonal migrants and
two were stayer families. When per capita incomes of
sample migrants were compared with those of sample
commuters and sample stayers it was found that in each
study location the mean per capita income of the
migrants was significantly higher than the per head
income of the other two groups of families.
Incidence of mobility and income
The relationship between household income levels
and the incidence of mobility is examined further in
Table 7.11 and Figure 7.4. It appears that the average
number of movers per household (mobility rate) is
directly related to the household income level while the
percentage of households which had no mover member at
all (immobility rate) is inversely related to income.
From the lowest to the highest income groups, the
average number of active movers per household was found
to vary from zero to 1.79 persons. On the other hand,
the immobility rates ranged between 100 percent and 5
percent.
None of the eleven lowest-income families had a
single mover member i.e. the rate of immobility for
7 Of these 42 families seven had two forms of movers -six had commuters and circular migrants and one family had both seasonal and non-seasonal migrants.
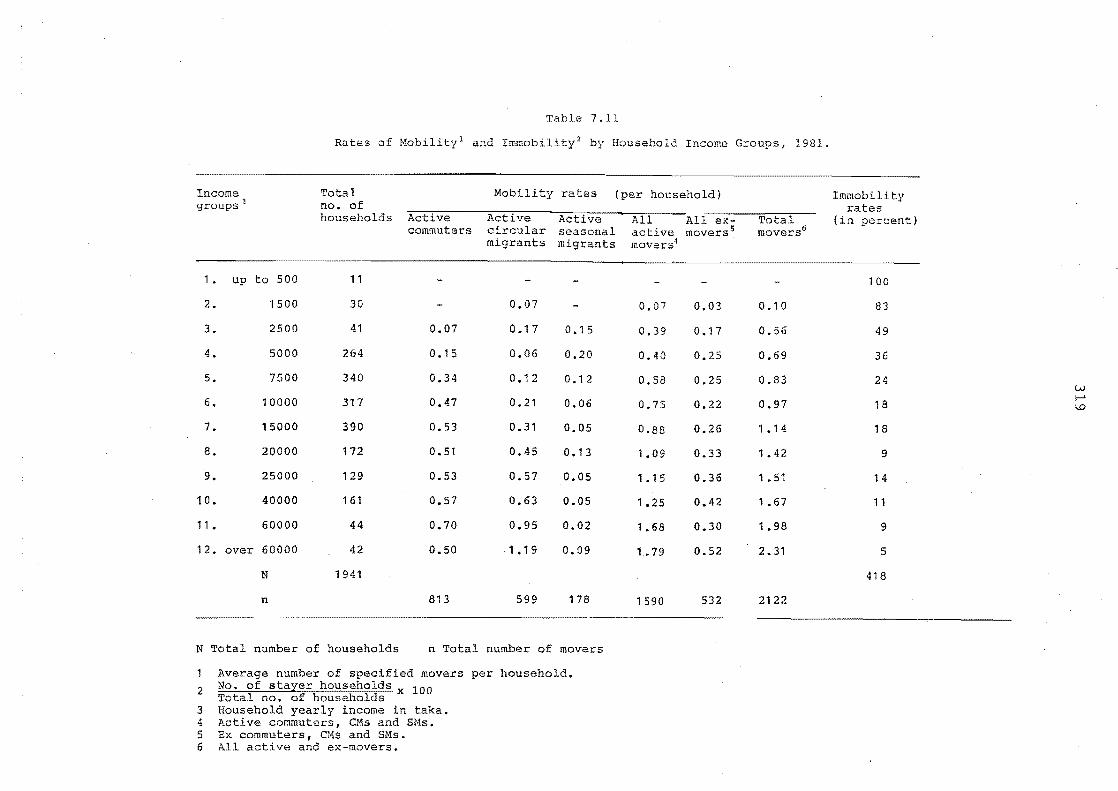
Table 7.11
Rates of 1 and Immobility~ by Household Income Groups/ 1981.
Income Total Mobility rates (per household) Immobility groups' no. of rates
households (in percent)
1 • up to 500 11 100
2. 1500 30 0.07 0.07 0.03 0.10 83
3. 2500 41 0.07 0.17 0.15 0.39 0.17 0.56 49
4. 5000 264 0.15 0.06 0.20 0.40 0.25 0.69 36
5. 7500 340 0.34 0.12 0.12 0.58 0.25 0.83 24 w 0.21 i-' 6. 10000 317 0.47 0.06 0.75 0.22 0.97 18 iJ:)
7. 15000 390 0.53 0.31 0.05 0.88 0.26 1.14 18
8. 20000 172 0.51 0.45 0.13 1.09 0.33 1.42 9
9. 25000 129 0.53 0.57 0.05 1.15 0.36 1.51 14
10. 40000 161 0.57 0.63 0.05 1.25 0.42 1.67 11
11 • 60000 44 0.70 0.95 0.02 1. 68 0.30 1.98 9
12. over 60000 42 0.50 1.19 0.09 1.. 79 0.52 2.31 5
N 1941 418
n 813 599 178 1590 532 2122
N Total number of households n Total number of movers
Average number of specified movers per household.
2 No. of stayer households x 100 Total no. of households
3 Household yearly income in taka. 4 Active commuters, CMs and 5Ms. 5 Ex commuters, CMs and 5Ms. 6 All active and ex-movers.
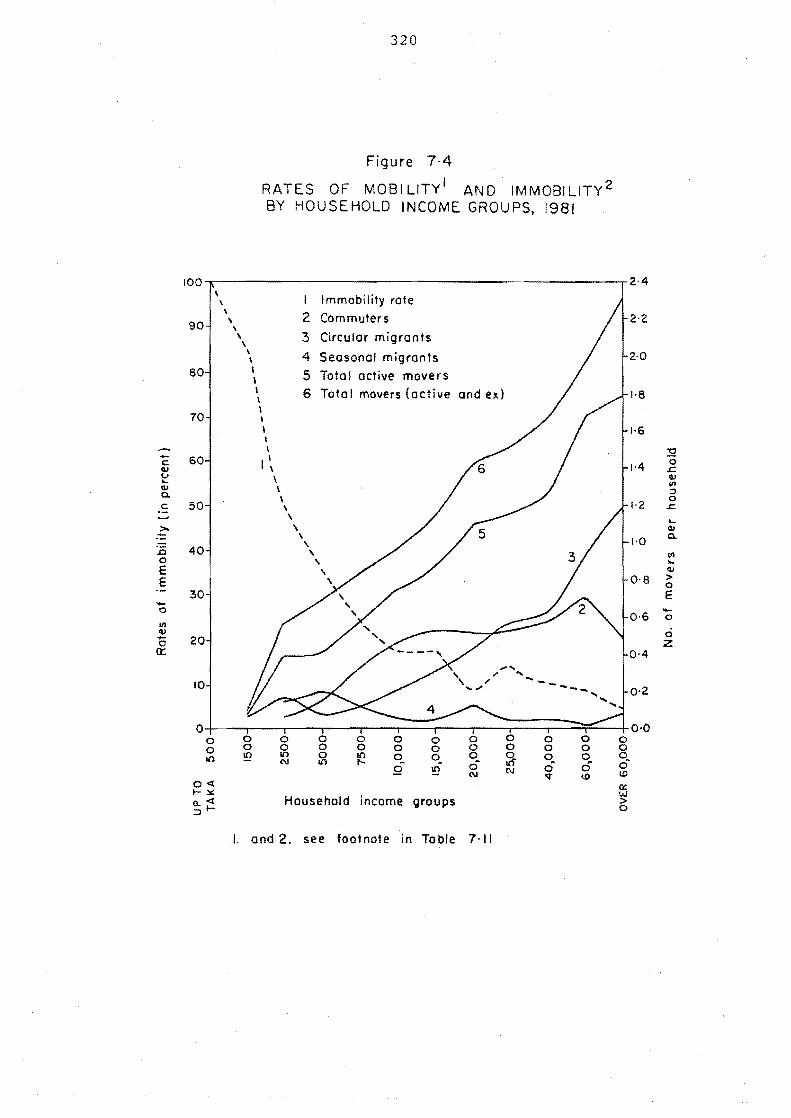
100 , \ \
\ 90 \ \
80
70
-- 60 c <U (j "'-<U Q.
c: 50
;::r.. -J:i 40 0 E E
30 -0
III Q)
(; 20 a::
10
0 0 0 10
0< .... ~ (1.< :::> ....
I.
320
Figure 7-4
RATES OF MOBI L1Tyl AND IMMOBIlITy2 BY HOUSEHOLD INCOME GROUPS, 1981
I Immobility rote 2 Commuters
\ 3 Circular migrants
\ 4 Seosonal migrants \ \ 5 Totol active movers \ I 6 Totol movers (active and ex) \ \ \ \ I I
I ~ \ ,
\ \ \
\ \ \
\ \ ,
\
--- .......... .....
0 0 0 0 0 0 0 0 0 0 0 0 0 0 0 0 0 0 0 0 !f? 10 0 10 0_ 0_ 0 ~ 0 0
N 10 l"- e e e Q !f? N N ~ !.O
Household income groups
and 2. see footnote in Tobie 7-11
2·4
2·2
2·0
1·8
1·6
:2 0 1·4 .c <U II> :::)
0 1'2 .c
.... <U
1·0 Q.
II> ... <U
O'S > 0 E
0·6 -0
ci z
0·4
0·2
a-a 0 0 q 0 !.O Q: w > 0
321
this particular income group was 100 percent. The next
income group (group 2) also consisted of an overwhelming
proportion of stayer families (83 percent or 25 out of
30 households). In the subsequent income categories
the relative immobility rates decreased rapidly.
Further analysis revealed that two-thirds of all
418 stayer households came, in economic terms, from the
lower half of income distribution for the 1941 families
(Table 7.11). Among the wealthier families the
proportions of stayer households were found to be very
low. At the highest income group there were 42
households of which only five percent were stayers
(Table 7. 11 ) •
The above evidence clearly indicates that richer
families are capable of producing greater numbers of
occupational movers than poorer households in
Bangladesh. On average, the numbers of active movers
that originated from lower income families (groups 1-5),
middle income families (groups 6-8), and upper income
families (groups 9-12) were 1.03, 1.18 and 1.42 persons
respectively. The calculations which produced these
statistics did not encompass 418 ever stayer families
and 311 currently stayer households. As stated earlier
these households were mostly concentrated in the lower
to middle income levels.
Considering all these families (mover or stayer)
together, Table 7.11 and Figure 7.4 thus demonstrate a
far more complete picture of mobility trends in relation
322
to the households' economic conditions. It was found
that the incidence of active movers from the lowest to
the highest income levels varied remarkably from 0 to
1.79 persons per household. The ratio of currently
moving members who originated from the lower, middle and
upper income families was almost 1:2:3 (exact ratio was
0.47:0.87:1.33 persons per household). This pattern
strongly suggests that the richer families in Bangladesh
are able to generate higher numbers of movers than the
poorer households.
7.4.2 Mobility strategies and income
The mobility patterns of different income groups
revealed that among the lower (not the lowest) to middle
income families commuting was more attractive than
circular migration, while the latter movement type was
predominantly found among people in the upper income
groups. Seasonal migration was very much the choice of
poor families.
The case of the very poor
It is seldom that the poorest families can afford
to earn a living through the temporary migration
process. There were 82 families whose annual income
did not exceed 2500 taka. Of these households, only 16
(19 percent) had active movers, mostly (13 out of 16)
seasonal and non-seasonal migrants. The reason for
choosing migration instead of commuting is that in the
rural areas the opportunities for dual income (farm plus
323
off-farm) through commuting are limited, for the low-
income households. This is because these families'
own virtually no land or cattle and they have a severe
shortage of adult male manpower.
The average family size of those 16 households
was only 3.56 persons, and the remaining 66 households
(out of 82) which did not have any active movers had an
even smaller number of family members (less than 2.45
persons). Connell et al (1976, 20) quoted Abou-Zeid
(1963) who found that in Egypt the poorest male
villagers had not migrated because their small fami
consisted mainly of women and young children, and they
did not have male kin to whom they could entrust their
families and cultivation in their absence. A growing
number of studies (Connell et al 1976; Lipton 1980) have
directly or indirectly stated numerous obstacles and
disincentives to emigration faced by the poorest
villagers in many developing countries. This matter is
discussed further at length in the latter part of
Chapter 8.
The case of the circular migrants
The concentration of income in the families with
circular migrants, as evident in Figure 7.3, is
definitely influenced by several factors which together
reflect the economic condition of a village family in
Bangladesh. Of them, size of land holdings, educational
achievements, household size and composition, and the
324
nature and diversity of occupation were considered to be
very important. The concentration of income is, in
fact, positively associated with the concentration of
these variables. This can be seen in Table 7.12.
The most important factors which favoured the
migrant families in improving their income levels were a
better education and larger family size. Given these
two advantages, the circular migrant families were able
to produce a significantly higher number of gainful
earners (per household) than commuter and stayer
households.
The data in Table 7.12 also reveal a notable
difference (both quantitative and qualitative) in
earning members between the upper and middle income
groups of mover families and between mover and stayer
families of upper income groups. The reasons for these
differences are, once again, closely linked to education
and family size. It is worth mentioning, for instance,
that effective educational achievements (at least sse
passed) were heavily clustered in the upper-income
mover families, especially among circular migrant
households (Table 7.12).
Further analysis confirmed that economic
improvement was found to be quite common among the
circular migrant families. All sample households were
questioned regarding changes in relative economic
condition over the five ears 1976 to 1981. Sixty-nine
percent of the circular migrant families (64 out of 93)
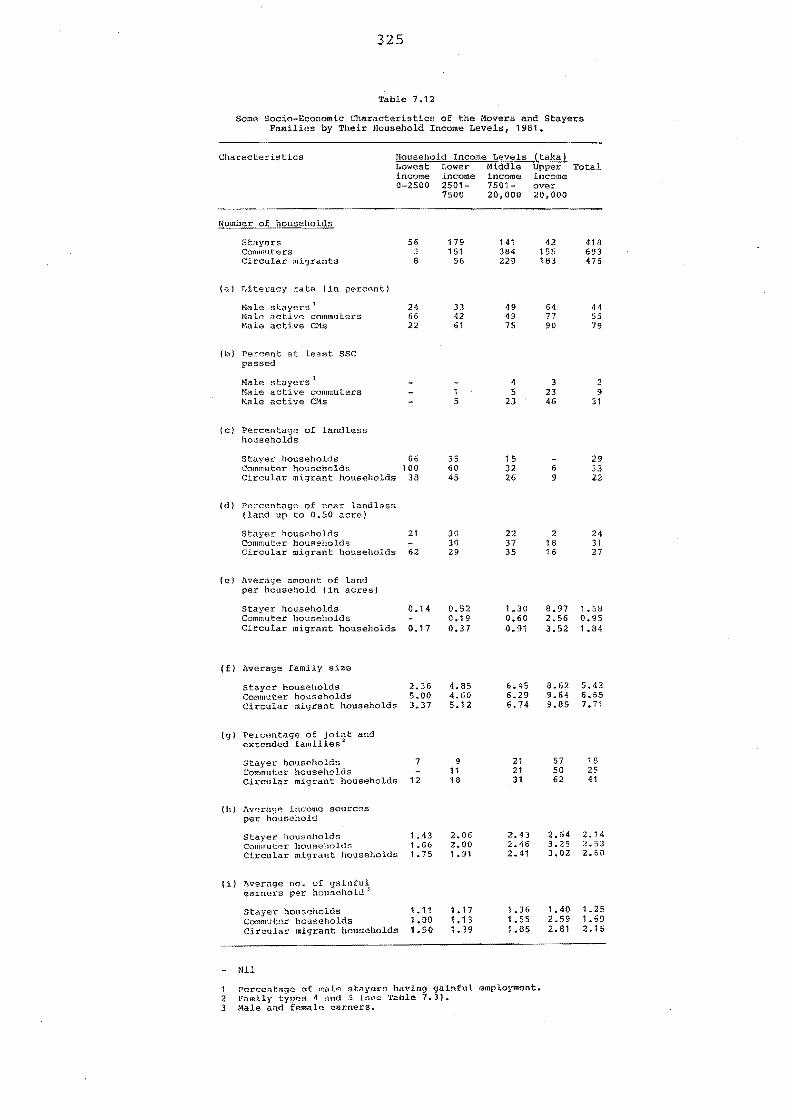
325
Table 7.12
Some Socio-Economic Characteristics of the Movers and Stayers Families by Their Household Income Levels, 1981.
Characteristics Household Income Levels Lowest Lower Middle income income income 0-2500 2501- 7501-
Number of households
stayers Commul:er.s Circular migrants
(al Literacy rate (in percent)
Male "tayers 1
f.1;)lc actlv(?! commuters Male active CMs
(b) Percent at least SSC passed
Male stayers 1
11a1e active commuters Male active CMs
(el Percentage of landless households
56 3 6
24 66 22
Stayer households 66 Commuter households 100 Circular migrant households 38
(d) Percentage of near landless (land up to 0.50 acre)
Stayer householos 21 Commuter hou!'leholds Circular migrant households 62
(el Average amount of land per household (in acres)
Stayer households Commuter households Circular migrant householdS
(f) Average family size
stayer households Commuter households Circular migrant households
(g) Percentage of joint and extended families 1
0.14
0.17
2.36 5.00 3.37
stayer households 7 Commuter households Circular migrant households 12
(h) 1\verllg~ income sources per household
stayer households COH\I(1U ter households Circular migrant households
(i) . Average no. of gainful earners per household l
Stayer households Commuter householdS Circular migrant households
Nil
1.43 1.66 1. 75
1. 11 1.00 1.50
7500 20,000
179 151
56
33 42 61
1 5
3S 60 45
30 30 29
0.52 0.19 0.37
4.65 4.60 5.12
9 11 18
2.06 2.00 1. 91
1.17 1.13 1.39
141 384 229
49 49 75
4 5
23
15 32 26
22 37 35
1.30 0.60 0.91
6.45 6.29 6.74
21 21 31
2.43 2.46 2.41
1.36 1. 55 1.85
(taka) Upper Total income over 20,000
42 155 183
64 77 90
3 23 46
6 9
2 18 16
8.97 2.56 3.52
8.62 9.64 9.85
57 50 62
2.64 3.25 3.02
1. 40 2.59 2.81
418 693 476
41 55 79
2 9
31
29 33 22
24 31 27
1.58 0.95 1.84
5.43 6.65 7.71
18 25 41
2.14 2.53 2.60
1. 25 1.69 2.16
1 Percentage of male st"yers having gainful employment. 2 Itam111' types ~ and 5 ("ee 'l'able 7.3). 3 Male and female earners.
326
stated that they had improved their incomes. The
proportions of households having improved incomes among
120 commuter families and the same number of stayer
samples were 55 percent and 43 percent respectively.
A general trend
These quantitative and qualitative assessments of
earning members of a family seem to be very important in
Bangladesh where there is fierce competition for scarce
resources and employment throughout the country. One
recent study (Osmani and Rahman, 1981) quoted by
Hartmann and Boyce (1983, 270) revealed a grim situation
showing that the real income of the top five percent of
the households in rural Bangladesh rose by 24 percent
between 1963/64 and 1976/77, while that of the bottom 85
percent declined by 33 percent. It was observed during
field work in 1981 that due to the severe employment
crisis in the rural areas and fear of deteriorating
economic prospects in the future, families of all
economic statuses were anxiously trying to diversify
their income sources by utilising all possible resources
of each potential earning member. However, only
families with large reserves of man-power with varied
skills, and considerable amounts of land, cattle and
capital were found to be successful in expanding their
economic ventures in and outside their native places.
Bangladesh is registered by the United Nations as
one of the least developed and poorest countries in the
world. Technological and economic problems mean that
327
rural families continue to rely heavily on the family's
man-power - both in terms of quantity and quality of
skill. In this regard, the trend towards
concentration of income in larger families may help the
concentration of land, education, and employment
prospects, and these phenomena may reinforce one
another. The relationships between mobility strategies
and socio-economic status in rural society is analysed
further in Chapter 8.
7.5 SUMMARY
In this chapter an attempt has been made to
identify the important demographic and socio-economic
attributes of different groups of movers. The main
findings can be summarized as follows:
1. The relationship between family size and the
propensity to move out for work suggests that movers
tend to come from relatively large households. There
is a positive relationship between family size and
numbers of movers (all types of movers together).
However, further investigation has indicated that the
family sizes of different types of movers as well as
stayers vary significantly. Generally, circular
migrants tend to come from larger families than
commuters, seasonal migrants and stayers.
2. As migrants tend to corne from larger households,
joint and extended families are more likely to promote
migration. Thus, the probability of having a migrant
328
member in a family increases with the successive
expansion of the family structure. In contrast, it is
found that earning members from small households and
nuclear families largely prefer short-term movements
(e.g. commuting and seasonal migration) or to stay in
the village. Families which are very large and complex
in structure mostly have two different types of movers,
circular migrants and commuters.
3. It was found that the birth order and number of sons
in a family are often important in determining a
specific mobility behaviour of an earner. Migrants are
usually younger sons, while stayers and commuters are
generally elder sons of single-son families or families
with a small number of sons.
4. An examination of mobility behaviour of fathers and
sons has indicated that the father 1 s mobility status
determines to a great extent the son 1 s movement
behaviour. Similarly the mobility strategies of older
sons may have a substantial influence on the attitudes
of younger sons.
5. In each study area, circular migrants have better
access to agricultural land than other types of movers
and stayers. It was found that circular migrant
families own a significantly greater amount of land than
stayer, commuter and seasonal migrant families.
Various factors, demographic, social and economic, have
favoured the migrant families over non-migrant families
in the acquisition of agricultural land.

329
6. The distribution pattern of operated-land between
the migrant and non-migrant households is the opposite
of their land ownership pattern. Field evidence has
indicated that migrant households usually rent out a
large proportion of their land to tenant farmers. A
migrant family was found to operate a smaller amount of
land than a stayer household and a commuter one.
7. The tenural status of households with active
circular migrants differs considerably from the status
of all other families. The most striking difference is
that, unlike other households, migrants are less likely
to practise tenant farming, but more likely to lease or
rent out land to tenant farmers (mainly sharecroppers).
In order to cultivate land they hire labour more
commonly than other households. It is often argued that
the land-rich migrant families prefer to utilize their
family labour in more remunerative occupations in towns
and reap the fruits of land by extracting cheap farm
labour and exploiting fland-hungry' sharecroppers in the
rural areas.
8. From the analysis of household income patterns of
movers and stayers, it has become clear that the
economic condition of circular migrant families is
better than any other group of families in the rural
areas. The concentration of income in migrant house
holds is positively associated with the concentration of
land, education and employment among these families.
It was also found that levels of household income of
330
commuters were higher than those of stayers and seasonal
migrants. They earned income from farm and off-farm
sources, but the latter source was very important since
the commuters own a smaller amount of land compared to
the circular migrants and stayers.
9. The relationship between household income level and
mobility type indicated that among the lower (not the
lowest) to middle income families, commuting was more
attractive than circular migration. On the other hand,
people from upper income families preferred circular
migration. Unlike these two major flows, seasonal
migration was clearly suited to the poor families.
The relationship between socio-economic status
and mobility strategies in rural Bangladesh is more
complex than this analysis of household income levels
suggests. The links between socio-economic status and
mobility behaviour in a Muslim society are examined in
greater depth in Chapter 8.
CHAPTER 8
MOBILITY BEHAVIOUR AND SOCIO-ECONOMIC STATUS
A major concern of recent migration studies has
been establishing the relationship between mobility
behaviour and social structure. Exploring the
relationship between population movement and integrated
rural development, Fuguitt (1979, 104), for example,
has stressed that an understanding of the determinants
and consequences of migration for rural development
requires looking at the social structure and the
differential position of individuals who mayor may not
migrate in that structure. In this chapter the
relationship between rates of commuting, migration,
total mobility and immobility and levels of household
socio-economic (SE) status are examined. An overview
of relevant literature on this issue in the Asian
context, especially with reference to the Indian sub
continent precedes an analysis of mobility and socio
economic status in rural Bangladesh.
8.1 A SOCIAL CONTEXT
For over a decade a number of researchers
(Connell et ala 1976, Lipton 1980, Chaudhury 1983, Boer
1981, Oberai and Singh 1982, Caldwell 1969, Skeldon
1976) have viewed rural out-migration in the context of
unequal distribution of income, wealth (mostly land) and
education among rural families, and have suggested, that
332
the propensity to leave rural areas is higher among
households that are either poor or rich. Connell and
others (1976, 197) have suggested that in villages where
land is unequally distributed rates of migration are
higher among both the poor and the rich as compared to
rates for the very poorest, the IImiddle" income group,
and the very richest. These studies reveal a bimodal
pattern of rural out-migration, an idealized pattern of
which is shown in Figure 8.1. The model indicates that
rates of migration are highest for those at medium-low
and medium-high levels of socio-economic status. It
also suggests that lower income groups tend to move to
nearby rural areas and the higher income groups are more
apt to move greater distances into larger urban areas.
Rhoda (1983, 43-44) explains this situation as follows:
Wealthier rural income groups are more apt to migrate or send their educated youth to larger cities in order to take advantage of their higher education levels or modern skills. On the other hand, relatively poor groups can only afford to migrate short distances and are expected to search for either agricultural or unskilled work in nearby areas because they generally lack the education, skills and information needed to compete in larger cities. The poorest of the poor are not expected to migrate because they lack funds for migration and are too preoccupied with survival. The middle income rural residents might be less apt to migrate because they are fairly secure as farmers or petty entrepreneurs and lack the urban skills which might motivate migration.
There have been few studies of the relationship
between socio-economic status of rural families and the
detailed patterns of mobility (and immobility) of
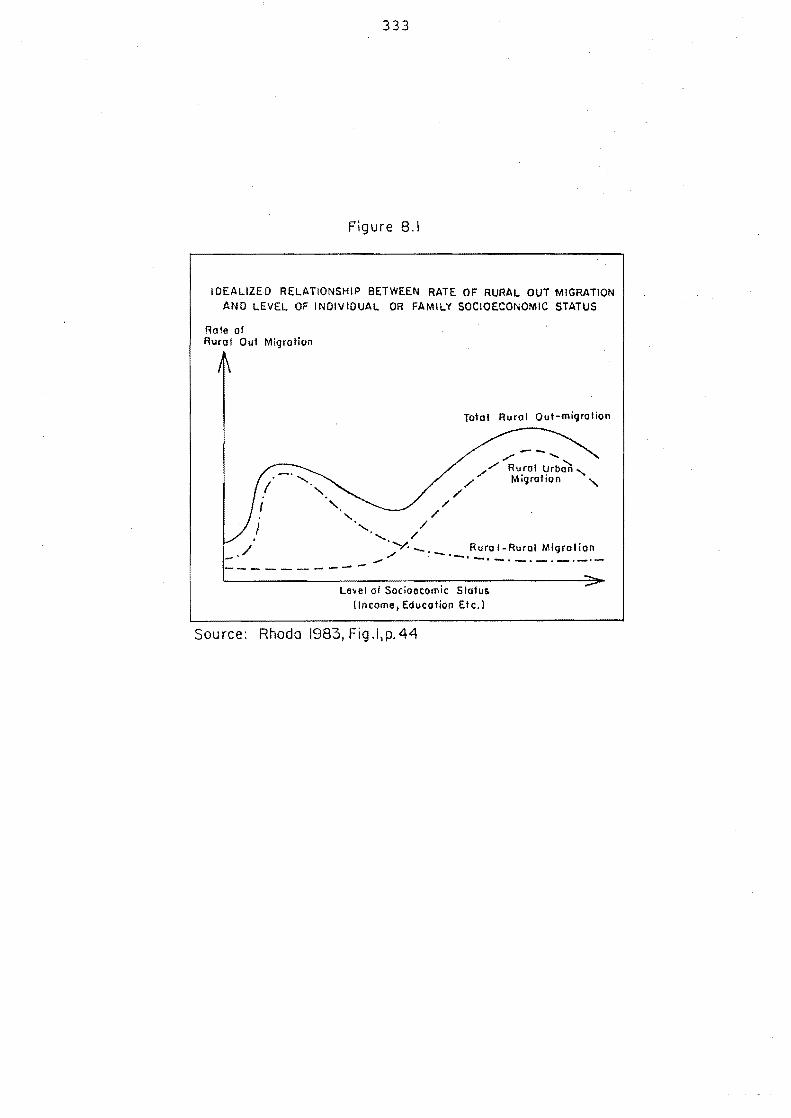
333
Figure 8.1
IDEALIZED RELATIONSHIP BETWEEN RATE OF RURAL OUT MIGRATION AND LEVEL OF INDIVIDUAL OR FAMILY SOCIOECONOMIC STATUS
Rote of RlJro lOut Migrotion
Toto I Rural Out-migration
/--, .• /'"'' Rural yrb~ '-
/ Mlgrafton "-/
/
" / ........ / " /
.'/._ Rural.Rural Mfgrallon ....,,/ .-.--.-.-.-.- .. -~-.----------
./
Level of Socioecomic Statu!> (Income. Education Etc.)
Source: Rhoda 1983, Fig.I,p.44
334
working people. It has been suggested in earlier
chapters that in rural Bangladesh people from different
SE status groups have different patterns of movement for
a livelihood. As we show later in this chapter, the
total pattern of movement conforms to the bi-modal
distribtion by status found in other studies. However,
the evidence suggests that people from the upper strata
of society prefer different movement forms and
strategies to those in other strata. The propensity to
migrate is higher among high status families, while
commuting and seasonal migration are more common in
lower status families. Understanding these
relationships requires an appreciation of social
stratification in rural Bangladesh today.
8.1.1 Social Stratification in Rural Bangladesh
The question of caste
There is a substantial literature on Muslim
social stratification in Bangladesh. It is evident
from most of the studies that the social stratification
system among the Muslims differs quite significantly
from that of the Hindus in the sub-continent. The most
recent effort to deal with the distinctive characteris
tics of Muslim stratification in Bangladesh has been
made by Arefeen {1982}.
In his review article, Arefeen points out several
fundamental differences between Muslim social hierarchy
and Hindu caste. First, as Islam is based on
principles of ,social egalitarianism, there is no strict
335
purity-pollution notion (concept of high-born and low
born status) in Muslim society. Second, no religious
or ideological restrictions are advanced for practising
endogamy and commensality among the Muslims of different
occupation, education and income groups.
A Muslim person has alternatives as far as
marriage partners are concerned. If he desires to
improve his economic status, which is common as we show
later, he tends to marry into a better class family. On
the other hand, following the rule of endogamy a Hindu
man must marry into his ascribed occupational caste and
thus for him no alternatives are available. Unlike the
situation with Hindu caste, Muslim stratification in
Bangladesh is flexible and social mobility from one
stratum to another, particularly from lower positions to
upper positions, can be achieved by means of wealth,
education and marriage contact with the upper status
family. More precisely, within Muslim communities a
family or an individual can lose, maintain or improve
his status by socio-economic achievements in competition
with others.
Despite these differences between Islam and
Hinduism, a few authors have focused on Muslim
stratification from the point of view of 'caste' or
'cast-like'. Arefeen has criticised their works by
saying that a general drawback of these works is that
they are vague. He also comments that most of those
authors mistakenly viewed the Muslim stratification
336
system as a form of Hindu caste. However, it is not
necessary to enter into the debate as the present study
found caste to be of little importance in Muslim village
societies in Bangladesh.
Other bases for differentiation
Lack of religious or ideological justification
for approving social distinctions and social
differentiation in Muslim societies has created an
unconformable situation as to determining the exact
nature of Muslim stratification. This led many
researchers (e.g. Bertocci 1970, 1974, 1979, Arefeen
1982, Guha 1965, Mukherjee 1948, Zaidi 1970, Islam 1974,
Jahangir 1982) to undertake empirical study with a view
to identify the proper determinants of relative status,
position or rank of a Muslim family or an individual in
hierarchial order.
Empirical evidence from these studies indicates
that social stratification in Muslim villages is
determined by a group of interrelated factors such as a
family's economic, educational, occupational and social
backgrounds. Guha (1965), for example, shows that the
'caste barriers' among the Muslims in west Bengal
(India) are created by social, economic and educational
factors rather than the operation of caste principles
(Arefeen 1982, 68). Similar results corne from Zaidi's
(1970) study of village life in Comilla district in
Bangladesh.
Bertocci (1970, 1974, 1979) studied social
337
stratification by applying both Marxian and Weber ian
models and observes that the social stratification in
his two research villages - Hajipur and Tinpara in
Bangladesh - resembles more of a class system than a
caste one (Arefeen 1982, 64-65). He identifies wealth
and lineage as two important bases of Muslim hierarchy
in Bangladesh.
Several recent works dealing with the conditions
of existence in rural Bangladesh (Van Schendel 1981,
Arens and Van Beurden 1977, Jansen 1983, Hartmann and
Boyce 1983) are also a potential source of information
on village social structure. A central theme of these
studies has been to explore the real life situation in
the countryside and the mechanisms by which social and
economic inequalities among different groups of
village households are maintained and reproduced. Van
Schendel (1981) and Arens and Van Beurden (1977), for
example, stratified their study households into several
peasant groups on the basis of ownership and control of
land. They found that the distribution of land or land
based income is positively associated with the economic
class and social status of village families.
Several common factors were identified that have
brought about and maintained the socio-economic
positions or classes in the villages. Chief among these
is one that is mentioned widely in all studies cited so
far, namely the possession of wealth which includes
effective income from all sources, agricultural and non-
338
agricultural. In a village situation where agriculture
is the predominant source of income, the ownership and
control of land has been recognised by most researchers
as the prime factor for differentiating household socio-
economic status. Other important factors for social
stratification are: occupation and education background
of the family, marital relations and lineage status, and
religious practice, especially the observance of purdah
(socio-religious tradition of secluding women from
public view).
Wealth and social stratification
Wealth, as a factor of determining social
stratification, is very important in Bangladesh, one of
the poorest countries in the world, where economic
resources are few, distribution of them is unequal, and
most people are preoccupied with survival or subsistence
living. Chowdhury (1978) studied social stratification
in Meherpur, a village in Dhaka district. He observed
that the present pattern of social structure and
stratification in rural Bangladesh has undergone many
changes due to various national, regional and global
events since the 1940s. He suggests:
••• economic class and social status are almost identical in Meherpur and it is possible to establish (a) certain correlation between the two. The high status Muslims of Meherpur are landowners and the low status Muslims are sharecroppers and landless labourers with few overlappings. (Chowdhury 1978, 86).
The link between wealth or economic power and
339
social status is clear from a well-known and widely
quoted Bengali proverb: "Last year I was a Jola
(weaver, low status), this year I have become a Sheikh
(middle status) and if next year's crops are good, I
shall be a Syed (high status, believed to be the
descendants of the Prophet)." The proverb first quoted
by Gait (1902) more than 80 years ago, is still on the
lips of people in the rural areas today. Presently the
proverb also refers to all individual mobility, not only
between the "low-born" occupation groups but also the
rest of the Muslim population (Jansen 1983, 76) citing
Bertocci 1970 and Chowdhury 1978).
The statuses of various patronymics, titles, and
lineages derive their significance from different
sources (see Gait 1913, Chowdhury 1978, Karim 1976).
However, in the rural Bangladesh context, social status
depends very much on economic power, and the
consolidation of economic power legitimates social
status over time (Jahangir 1982, 129). Bertocci (1970,
73) cites a village saying that: 'Nowadays if one's
economic position is good, one's lineage status is also
good.' He also comments that upward social mobility
among South Asian Muslims is basically a function of
wealth (Bertocci 1974, 106).
Education and occupation
Education and occupation levels are closely
related with the economic power of a family. In fact,
these three indicators of social stratification
340
are functionally intertwined both among themselves and
with class identification and status symbols (life
style) among village people. Education is a kind of
investment whereby one acquires a better occupation
which in turn ensures better income, and hence the whole
process results in an improvement of class position or
socio-economic standing of an individual and his family.
Among Muslims many members of the so-called
"lower caste" have changed their inferior social status
into a more valued position by means of achieving higher
education and a better profession. These two
achievements in turn certainly cause further upward
mobility of one's status. As a result it is easier to
marry into rich and high status families. Jansen
(1983, 77) reports a good example of this:
An unmarried research investigator from a Government institute who often came to the village told us he felt like a prince in the village. Many rich fathers of girls of marriageable age were eager to meet him. The research investigator told us his father was a poor peasant living far away, but the fact that he had a Government job made him potentially, a very attractive son-in-law.
In summary, the major points derived from the
discussion so far are: social stratification among the
Muslims in rural Bangladesh is not based on a caste
modeli rather it is mostly determined by a whole
mixture of socio-economic criteria such as wealth,
education, occupation, lineage, and other social
factors. Among these criteria, wealth, in general,
appears to be the most important factor. An increase
341
or decrease in wealth, status, power, knowledge etc.
very often causes social mobility (mobility from one
stratum to another, either upward or downward) among
Muslim families or individuals.
Classes
Lack of any rigid ideological barrier to changing
social status in Muslim communities has persuaded some
social scholars to investigate the Muslim stratification
system in the context of an open class system instead of
a strict caste order (Bertocci 1974, 106). According
to Karl Marx social classes emerge between which there
are no legal or supra-natural barriers to social
mobility (Mitchell 1979, 196). In this respect
Bertocci's (1974, 103) comment is 'social stratification
in ••• Bangladesh may best be understood as a highly
flexible, embryonic class system, rather than a caste
system'. Cain et ale (1979, 406) have a similar view
as they have remarked 'Rural Bangladesh is a class
society hierarchically organized primarily on the basis
of ownership and control of arable land.'
8.1.2 Classification of socio-economic status
An important problem still not clearly resolved
by researchers is the classification of rural households
in Bangladesh into various socio-economic groups,
statuses or classes. The literature available on social
stratification, discussed in the previous section, is
primarily concerned with the general social structure,
342
its changes through time, and major factors that are
related to the changes and maintenance of social
structure in rural areas.
Two empirical studies, published recently,
classified village families into several peasant classes
on the basis of ownership and control of land. However,
a growing number of researchers (see Van Schendel 1981,
37) are arguing about the justification of such
classification, especially in the context of Bangladesh
where nowadays a large proportion of rural families have
increasingly become involved in non-peasant economic
pursuits, and where a household, in most cases, holds
two or three income sources of varying nature (see
section 6.4 and Appendix 2). The difficulties of
classifying peasants 'in the field' are demonstrated by
various problems faced by Arens and Van Beurden (1977).
They felt their classification of village households to
be still "mainly tentative" and exclusively applicable
to their survey village and its surroundings.
Economic structure
One of the earliest attempts to understand the
socio-economic structure of rural people in Bangladesh
was undertaken by Ramkrishna Mukherjee (1948, 1971).
He studied six villages in Bogra district between 1942
and 1945. Mukherjee gave emphasis to the economic
structure of the village, with an analysis of activities
of various occupation groups. To determine the
hierarchy of economic structure he grouped the
343
occupations into three ranks or classes, viz., upper,
middle, and lower, depending upon the socio-economic
position of the occupational groups in rural society.
The upper rank is composed of "feudal" landlords,
prosperous peasantry, persons in well-paid jobs, and big
traders. The middle rank comprises mainly the self
sufficient peasantry, 'non-cultivating owner' and
'artisan and small trader' which maintains a reasonably
self-sufficient existence partly based on land. The
lower rank consists of small tenants (share-croppers),
agricultural labourers, beggars and others.
According to Mukherjee, the hierarchical order of
these occupation groups is based on inequalities in
income distribution and expenditure patterns. Thus
villagers belonging to the upper class have a prosperous
life and maintain a surplus budget, those at the bottom
of the social heap maintain a bare living, while those
in the middle are obviously somewhere in-between
(Mukherjee 1971, 154). According to Chowdhury (1978,
3), Mukherjee's use of the terms 'class' and 'occupation
group' is not very clear. However, his study is the
only one of its kind to deal with the economic
differentiation in a few villages of Bangladesh.
Obviously, it gives us some idea of the economic
hierarchy of rural Bangladesh in the mid-forties.
A different technique has been applied by Willem
Van Schendel (1981) to interpret economic differentia
tion among families in rural Bangladesh. He classified
344
village households into four economic categories (A, B,
C, and D, see Figure 8.4) on the basis of their ability
or inability to maintain their families for a certain
period at a certain standard of living (Van Schendel
1981, 90-91). In his view, this 'simple economic
categorization of households' relieved him from the
difficulties of calculating household income, and also
from the complexity of class analysis of peasants or
occupation groups.
One common characteristic of these three studies
is that they used a monolithic approach to classify
village households which stressed only the economic
criterion. For example, Arens and Van Beurden (1977)
stressed possession of land, Mukherjee (1971) emphasized
income, while Van Schendel (1981) measured a family's
economic condition in terms of the number of months it
could maintain itself.
The problem of measuring socio-economic classes
or ranks, which needs a pluralistic approach, remains
virtually unsolved. This has also been noted by Mia and
his co-authors who observed: 'Any satisfactory approach
to define social class in Bangladesh under the present
conditions lacking sufficient empirical studies may not
be established quickly' (Mia et al. 1975, 10). The
present study, however, has considered a range of
factors in the identification of socio-economic ranks or
classes in the rural areas.
345
A pyramid structure
It has been accepted that there are two basic
shapes describing social strata or class structures -
the pyramid and the diamond. The latter is the typical
pattern for modernized societies and the former mostly
represents underdeveloped societies, especially where
there are strong pressures toward social inequality
(Barber 1968, 295). The general characteristics of the
pyramidal social structure are that a small group of
families, who lie at the apex, enjoy much of the social
and economic prosperity and the large majority of
families who stay at or near the base of the pyramid
struggle even to obtain a bare living. This pyramid
structure was considered to be relevant to the
Bangladesh situation and village society was therefore
stratified into three broad classes: upper class,
middle class, and lower class (see Figure 8.2).
Everywhere in Bangladesh people often talk about three
customary classes (srenis) and their most common Bengali
synonyms such as borolok, dhani (upper class),
moidhom sreni (middle class), Chhotolok, daridralok,
gorib (lower class) (Van Schendel 1981, 92; Mia et al.
1975, 13). These three broad social strata are further
divided into several sub-strata as shown in Figure 8.2.
Seven SE strata or SE status groups are identified in
this study: two comprising the upper class, three for
the middle and two for the lower class groups.
346
Defining SE status in villages
In the village a person is usually known by his
family and a family is known by its socio-economic
condition or status. Therefore, the household or the
family is generally considered to be the unit of social
and economic stratification in rural communities. In
the field the 1941 households surveyed in the 14
villages were classified into seven SE status groups on
the basis of household possession of land, income,
chowkidary tax, tenural status, education level,
occupation, housing condition, attitudes towards manual
labour, and some social indicators, mainly lineage
status and degree of observance of purdah. All these
criteria were not applied for the identification of the
SE status of every household in every fieldwork site.
However, very often a mixture of criteria was used,
especially in determining the SE status of the extended
type of households.
The process of classification of households was
carried on in three stages. The first was on the
occasion of the house to house census inquiry, where
each household was given a particular SE status on the
basis of factual information provided by the family.
During the second visit to the household, when detailed
information on mobility and economic activities was
sought, the initial status was verified. This visit
involved 22 percent of the total households (431 out of
1941) selected on a sampling basis (see Appendix 6).
347
The third stage involved consultation wth a group of
elderly villagers who usually knew the SE condition of
every household very well. Here the ascribed status
for all households was verified.
In the context of village life, it is difficult
to evaluate the socio-economic standing of a household
and also to locate households appropriately in the
pyramid model of class structure. There are several
factors responsible for this. First of all, class
identification of a family is purely a subjective
determination which cannot be easily quantified in a
strict sense. Second, class consciousness among the
villagers in Bangladesh has not yet been sufficiently
developed, perhaps mainly due to mass illiteracy of
people and lack of appropriate political mobilization.
The lack of class or political consciousness
especially in rural Bangladesh, has been explained in
some recent village-based studies. In one of these
studies it is argued that: 'Most villagers in Jhagrapur
are poverty conscious without being class conscious'
(Arens and Van Beurden 1977, 77). In addition, the
class position of many families is changing as a result
of an increase or decrease in their wealth, power,
prestige, ability or knowledge.
There is an argument that the system of self
evaluating or self-rating of class position is subject
to bias. As was noted above, most villagers are not
very conscious of class even though terms such as,
348
dhani, borolok, gorib, sorbohara are used to denote
certain social groups. People from the middle to lower
ranks especially usually feel uneasy when someone
unknown to them directly asks about a person's status or
class. In this context, it is perhaps worthwhile to
quote once again from the Jhagrapur study:
In Jhagrapur there is a large family headed by a wise old man with whom we had a good relationship. We wanted the family to decide for itself to which class it belongs. The father used to argue that he was a middle peasant and had never sold his labour. His sons never showed a sign of agreement or disagreement (probably expressing their respect for him in this way). The sons worked for others from time to time. In the absence of their father they told us that they would have to do so more and more in the future, especially after they all would be married. In fact, they admitted that they had become or soon would become poor peasants. We finally decided to classify the family as poor peasant since all male working members were selling their labour from time to time while the father did not work at all due to his old age. But if we had come to the village ten years earlier they probably would have been classified as middle peasant. Apparently it was difficult for the father to accept that the family's situation had deteriorated. (Arens and Van Beurden 1977, 77).
Considering these difficult problems of
classifying village social strata, the present study has
relied on factual information, observation, group
consulting, and extensive cross-checking of those
variables which are related to class identification.
In this way it has been possible to derive empirically a
reasonable estimate of the hierarchy of households
statuses in rural Bangladesh.
349
The status of village households
The distribution of households according to their
SE status is shown in Table 8.1. Most of the families
in the villages are, in fact, either middle class or
lower class; the upper class group comprises a very
small proportion of the total households in each study
area. For example, in Rampal, this particular class
accounted for only 4.67 percent of the total 684
households. The corresponding percentages for Chandina
and Sakhipur were 5.59 and 2.61 respectively.
The most rich families ("upper class 1"), who lie
at the apex of the SE pyramid, are in fact very few in
number. Within the 14 villages, there were only 22 such
families (1.1 percent of 1941). On the other hand, at
the base of the pyramid a significant proportion of the
households (12.1 percent of 1941) were classified as
destitute (SE stratum 7). As regards the comparative
SE condition of the families in the three survey
locations, the situation in Chandina appears to be
slightly better than that in Rampal and significantly
better as compared to Sakhipur (Table 8.1).
Table 8.2 shows the distribution of household,
population, and household size by SE groups. It is
apparent from the table that in the upper strata the
share of village population is higher than the
corresponding share of village households. In the lower
strata it is the reverse, i.e. the population
proportions are lower as compared to the household
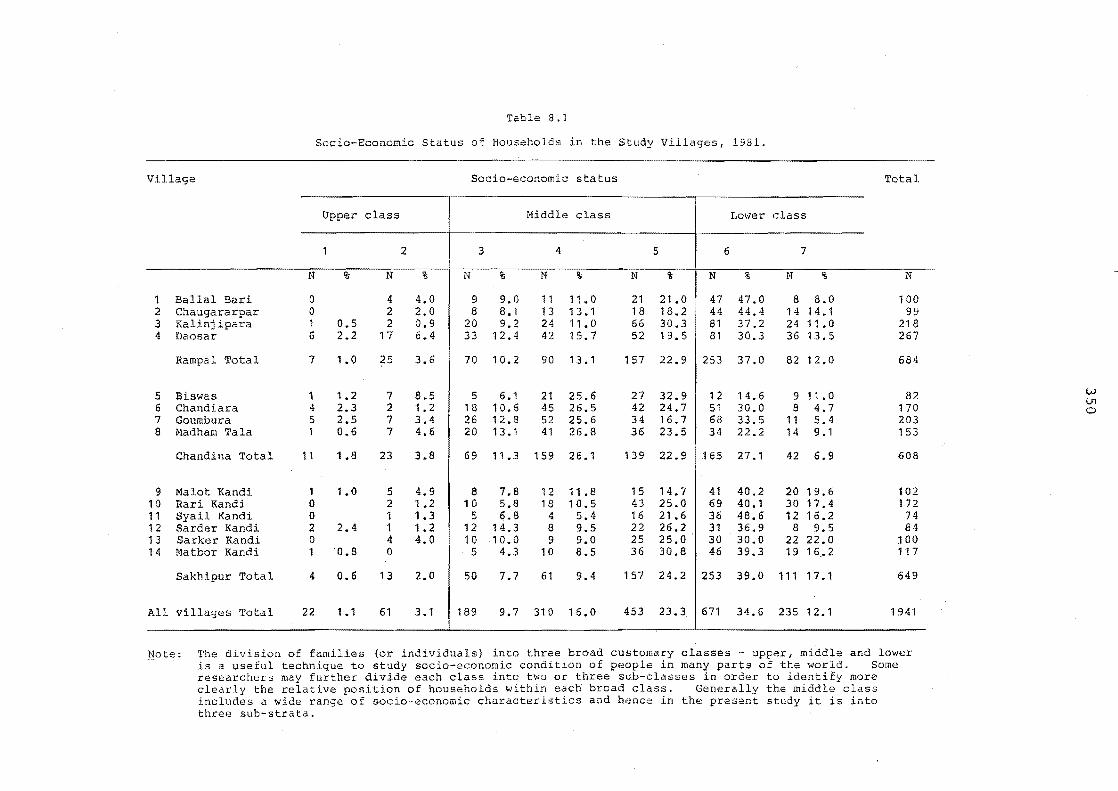
Table 8.1
Socia-Economic Status of Households in the Study Villages, 19B1.
Village Socia-economic status Total
Upper class Middle class Lower class
1 2 3 4 5 6 7
N % N % N % N % N % N % N % N
1 Ballal Bari 0 4 4.0 9 9.0 11 11 .0 21 21.0 47 47.0 8 8.0 100 2 Chaugararpar 0 2 2.0 8 8.1 13 1 3.1 18 18.2 44 44.4 14 14.1 99 3 Kalinj ipara 1 0.5 2 0,9 20 9.2 24 11 .0 66 30,3 81 37.2 24 11.0 218 4 Daosar 6 2.2 17 6,4 33 12.4 42 15.7 52 19.5 81 30.3 36 13.5 267
Rampal Total 7 1.0 25 3.6 70 10.2 90 13.1 157 22.9 253 37.0 82 12.0 684
5 Biswas 1 1.2 7 8.5 5 6.1 21 25.6 27 32.9 12 14.6 9 11.0 82 6 Chandiara 4 2.3 2 1 .2 18 10.6 45 26.5 42 24.7 51 30.0 8 4.7 170 7 Goumbura 5 2.5 7 3.4 26 12.8 52 25.6 34 16.7 68 33.5 11 5.4 203 8 Madham Tala 1 0,6 7 4.6 20 13.1 41 26.8 36 23.5 34 22.2 14 9.1 153
Chandina Total 11 1.8 23 3.8 69 11 .3 159 26.1 139 22.9 165 27.1 42 6.9 608
9 Malot Kandi 1 1.0 5 4.9 8 7.8 12 11.8 15 14.7 41 40.2 20 19.6 102 10 Rari Kandi 0 2 1.2 10 5.8 18 10.5 43 25.0 69 40.1 30 17.4 172 11 Syail Kandi 0 1 1.3 5 6.8 4 5.4 16 21.6 36 48.6 12 16.2 74 12 Sarder Kandi 2 2.4 1 1.2 12 14.3 8 9.5 22 26.2 31 36.9 8 9.5 84 13 Sarker Kandi 0 4 4.0 10 10.0 9 9.0 25 25.0 30 30.0 22 22.0 .100 14 Matbor Kandi 1 '0.8 0 5 4.3 10 8.5 36 30.8 46 39.3 19 16 .• 2 117
Sakhipur Total 4 0.6 13 2.0 50 7.7 61 9.4 157 24.2 253 39.0 111 17.1 649
All villages Total 22 1 .1 61 3.1 189 9.7 310 16.0 453 23.3 671 34.6 235 12.1 1941 --_._ ...... _--- ----
Note: The division of families (or individuals) into three broad customary classes - upper, middle and lower is a useful technique to study socio-economic condition of people in many parts of the world. Some researchers may further divide each class into two or three sub-classes in order to more clearly the relative position of households within each broad class. Generally the middle class includes a wide range of socia-economic characteristics and hence in the present study it is into three sub-strata.
W lJ1 o
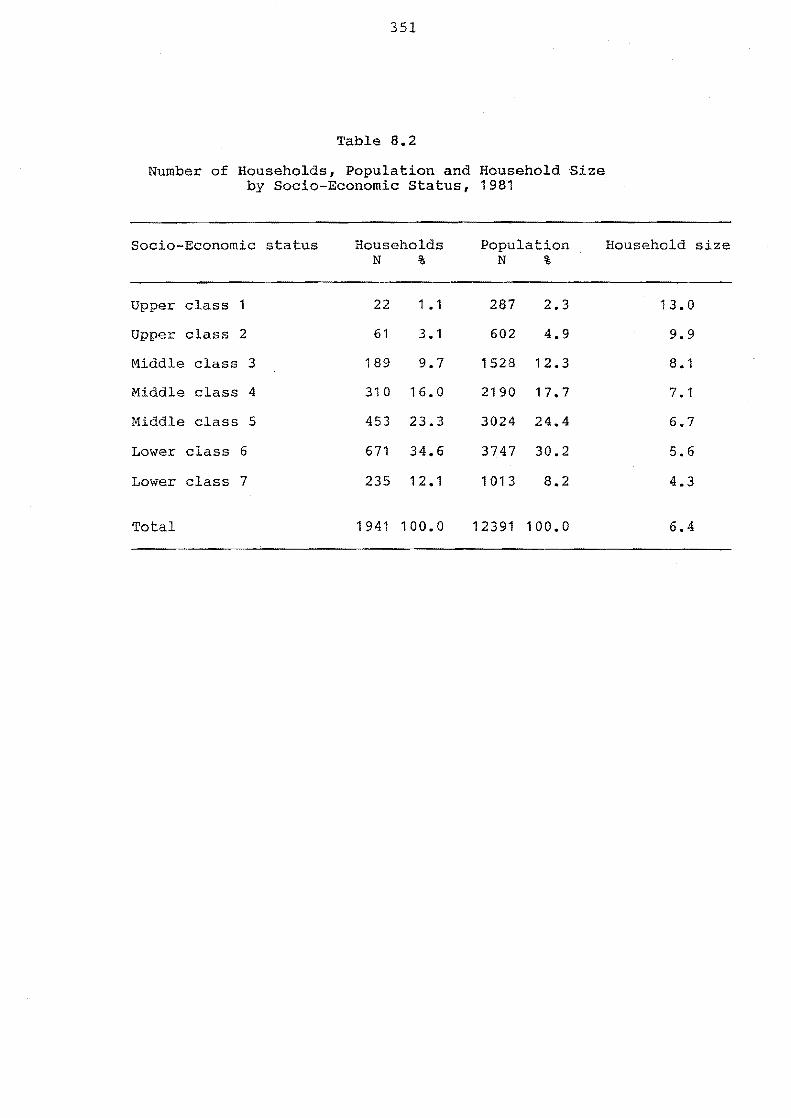
351
Table 8.2
Number of Households, Population and Household Size by Socio-Economic status, 1981
Socia-Economic status Households Population N % N %
Upper class 1 22 1.1 287 2.3
Upper class 2 61 3.1 602 4.9
Middle class 3 189 9.7 1528 12.3
Middle class 4 310 16.0 2190 17.7
Middle class 5 453 23.3 3024 24.4
Lower class 6 671 34.6 3747 30.2
Lower class 7 235 12.1 1013 8.2
Total 1941 100.0 12391 100.0
Household size
13.0
9.9
8.1
7.1
6.7
5.6
4.3
6.4
352
proportions. This has been caused by a marked
variation of household size between the upper and lower
strata; an upper class household contains, on average,
10.7 members, while a family from the lower class
consists of 5.2 persons on average (Table 8.2).
Nevertheless, this variation is not due to lower
fertility among the poor, but to a less complicated
household structure (see Chapter 7).
8.2 MOBILITY IN A PYRAMIDAL SOCIAL STRUCTURE
Circular movement is a means by which many rural
families in Bangladesh maintain or improve their
livelihood in the rural setting by sending their members
to work for money in towns or the rural hubs of non
agricultural activities, the haats and thana centres.
However, people from all socio-economic levels are not
able to move for employment with equal freedom and
flexibility. Different SE strata follow different
patterns of circulation. In this part
of the thesis, the relationship between mobility
behaviour and socio-economic structure of individuals or
households is examined. The interpretations are mostly
based on statistics collected for active movers (i.e.
those who have currently been involved in moving) and
lifetime stayers who never moved for the purpose of
employment but were found to be working in economic
activities available in and around their village home.

353
8.2.1 Mobility and socia-economic status
The pyramidal social structure is divided into
five groups on the basis of the household's mobility
behaviour. These groups provide a mobility profile of
rural families or people (Figure 8.2). Within this
profile, groups Band D were found to be much more
mobile than other groups. Group A which lies at the
top of the pyramid, has a mobility rate which is of
medium intensity. Villagers in groups C and E are
labelled as less mobile.
This pattern is illustrated more clearly in
Figure 8.3 where the rates of mobility and immobility of
villagers are plotted against the socio-economic status
of individuals or families. The figure shows a bi
modal pattern which indicates that the movers are
concentrated among the fairly rich (SE strata 2/3) and
among the fairly poor classes (SE strata 5/6). The
remaining groups such as groups A, C and E have lower
rates of mobility. The major characteristics of the
five mobile groups and their (groups) levels of response
to different mobility types and streams are illustrated
in Figure 8.2 and Table 8.5.
Highly mobile population
In the highly mobile population there are two
groups of people - B, which is located within the upper
socia-economic strata (strata 2/3); and D, which lies
near the base of the socia-economic pyramid (SE strata
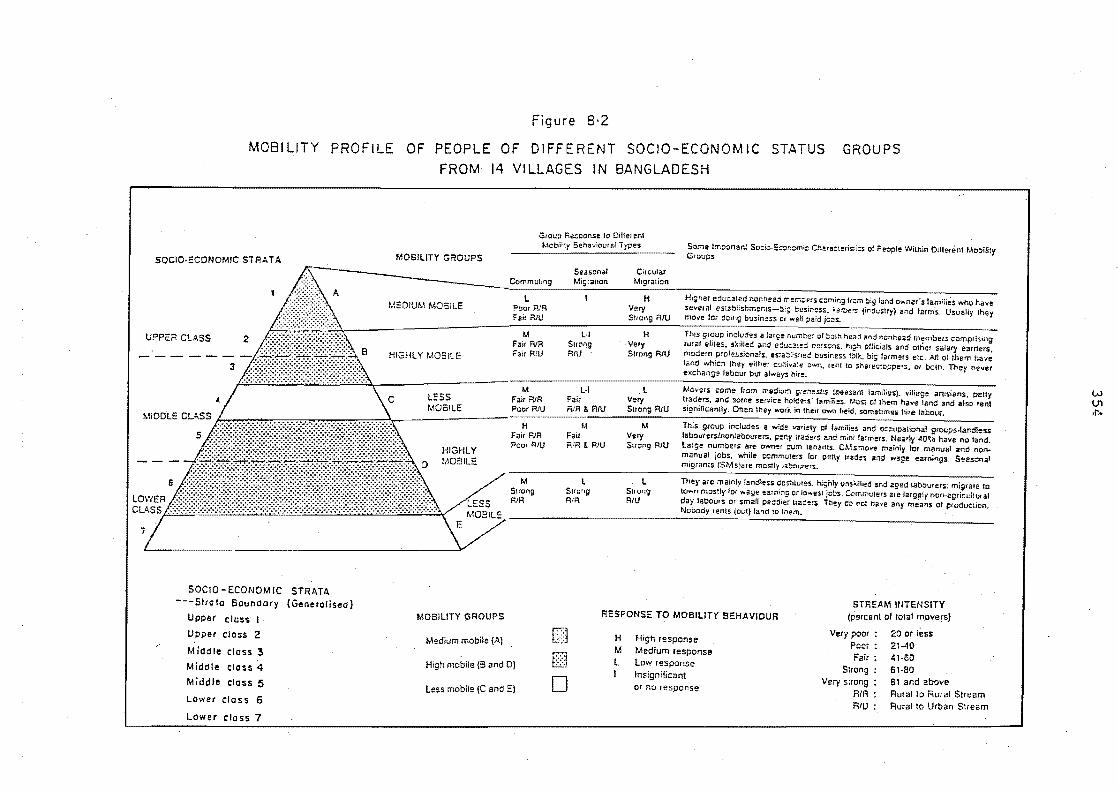
i
Figure 8·2
MOSI LJTY PROFILE OF PEOPLE OF 01 FFE RENT SOC10-ECONOM IC STATUS GROUPS
SOCIO·ECONOMIC SiRATA
UPPER CLASS
SOCIO-ECONOMIC STRATA ---Strata Boundary (Generalised)
Upper closs I,
Upper Closs 2
Miodle Closs 3
Middle class:;
Middle class 5
Lower elas s 6
Lower closs 7
FROM 14 VILLAGES IN BANGLAO H
Grou;> Re.sconse to Different Mcbiiay Behavioural ')'Pes Some Impona~! Socio-E~t::::rni~ C;aracleriSli:::s of People Within Oilte-Ient Mobility
Groups MOBILITY GROUPS
HIGHLY MOBILE
L!::SS MOBilE
MOBILITY GROUPS
Medium mobile {AI
Poor RlR Fai, RlU
M Fair RlR Fair R/U
M Fair RlR Poor RlIJ
H Fair RIA Poor RIO
II! SirOll9 RIR
High mob;;e {S and OJ
Less mobile IC and EJ
Sea~ollal
l·' Slrong A/U
l·1 Fair RlR & Rill
M Fait RiR & RIV
SHeng AIR
Cfrc:ular
H Very
RIU
H Ve'y Sirollil R/U
l Very Strong RIU
M Very Strong RIU
l Sireng RIIJ
Higher edu:,a1ed nonhead mer."io~rs c:.cmtng fr;:;n big iarad owner"s families who have several t"stab1ishmems-tli:; b:.!s:r.ess. k2,~""S {industry) and farms. Usually they mO."e for doing busin!ss or we!! pa!d jons....
This group includes a large nurr.::-e: of 'O.olh head and ncnhead 1"I1!mbers compd::ang rurat elites. SKilled and e~IJ=2ie~ oe~sons. h19.h OHicials and other salary ea(rlers~ mOdern professionals. !sta:::sl1ea business ton' •• b:; farmecs etc. All 01 them have land which they either c!JlitYa!e own. rent to share-;foppers. 01 bottl. They never exchange labOUT but always hire#
Movers come from medium greneS1JS ,peasant tamiii~s)~ peuy ltaders~ and SOme service hOICtfS' families. Most of them have and rent significanily. Otten Ihey work Tn their O¥m held. sometim:'$ hlfe labour.
This group includes a wide variely of 'amiitts and oc::upationai IlflDul,s.llan:tfh,ss labout~rs/nonlabourers. p~ny tra:ers and mini fz!mers. Nearly have no land. large numbers are owner ;u:n tenants. CMsmoV1t mainly tor manual and non-manual jobs. while t:cmmuters lor petty Irad.s ,,,d "'age earnings, Seasonal migr ants ISM s)are mOSlly la!xl~re,..
The)' aFe mainly fandiess deshtl1tes. highly vns~ihed and aged labourers; town rnosUy for wage earning c: Jawesr joos< Ccmmu!ers afe Jarg~fy non-i day labours Or small pe:::::jier lrad!~$ They C:C' net have 311y means of ptOduclion. Nobody rents (OVI) land 10 '''em..
RESPONSE TO MOBILITY BEHAVIOUR STREAM INTENSITY
(percent 01 tOlal movers)
H High response M Medium response L Low response
Insignificant or no response
Ver}' poor: Poor: Fair
Strong Very Sirong
RIA RIU
20 or less 21-40 41·60 61·80 91 and above Rura! to Rural Stream
Rural to Urban Stream
w VI ,/:>.
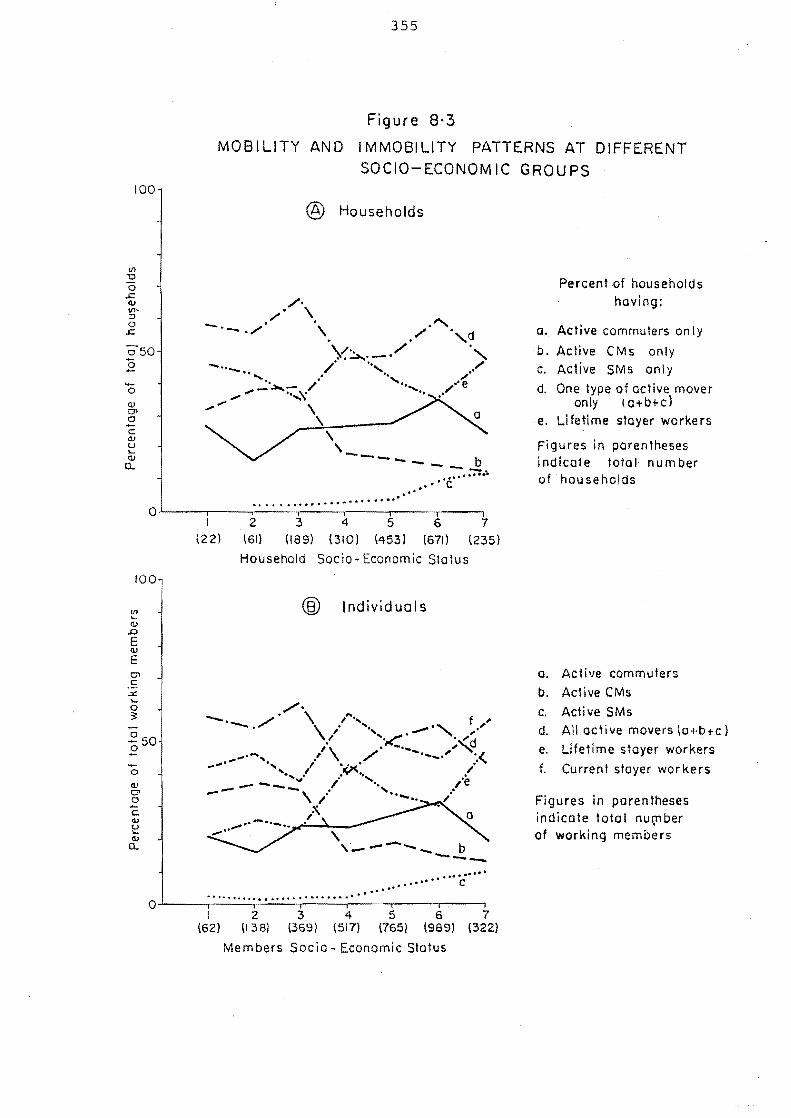
100
..... o (l) CJl o -c: Q)
u ..... (l)
a..
100
Ul "-(l) .Q
E (l)
E CJl c:
"-o 3:
.2 50 o -
355
Figure 8·3
MOBILITY AND IMMOBILITY PATTERNS AT DIFFERENT
SOCIO-ECONOMIC GROUPS
I (22)
® Households
, '-----.--- b ---....... II .. , .....
.. " ... c .. ' "" . " .................... ... &,. .......... "
2 (61)
3 4
(189) (:310) 5
(453)
6 7 (671) . (2:35)
Household Socio- Economic Status
® Individuals
\ ,.----_ b ---
.. .. .. .. .. ... " .. " .. ,. c···- .. ... " ..
Percent of households having;
o. Active commuters on Iy
b. Active CMs only c. Active SMs only
d. One type of active mover only (o+b+e)
e. Lifetime stayer workers
Figures in parentheses indicate total number of households
o. Active commuters
b. Active eMs
c. Active SMs d. All active movers io+b+c}
e. Lifetime stoyer workers
f. Current stayer workers
Figures in parentheses indicate 10tol nur,nber of working members
.. .. .... ...... .. ... . . .... .... . .. .. .... .. .. ... .. " .. o~---.~~~~~----.----r----~--~
I 2:3 45 6 7 (62) (138) (369) (517) (765) (989) (322)
Members Socia - Economic Status
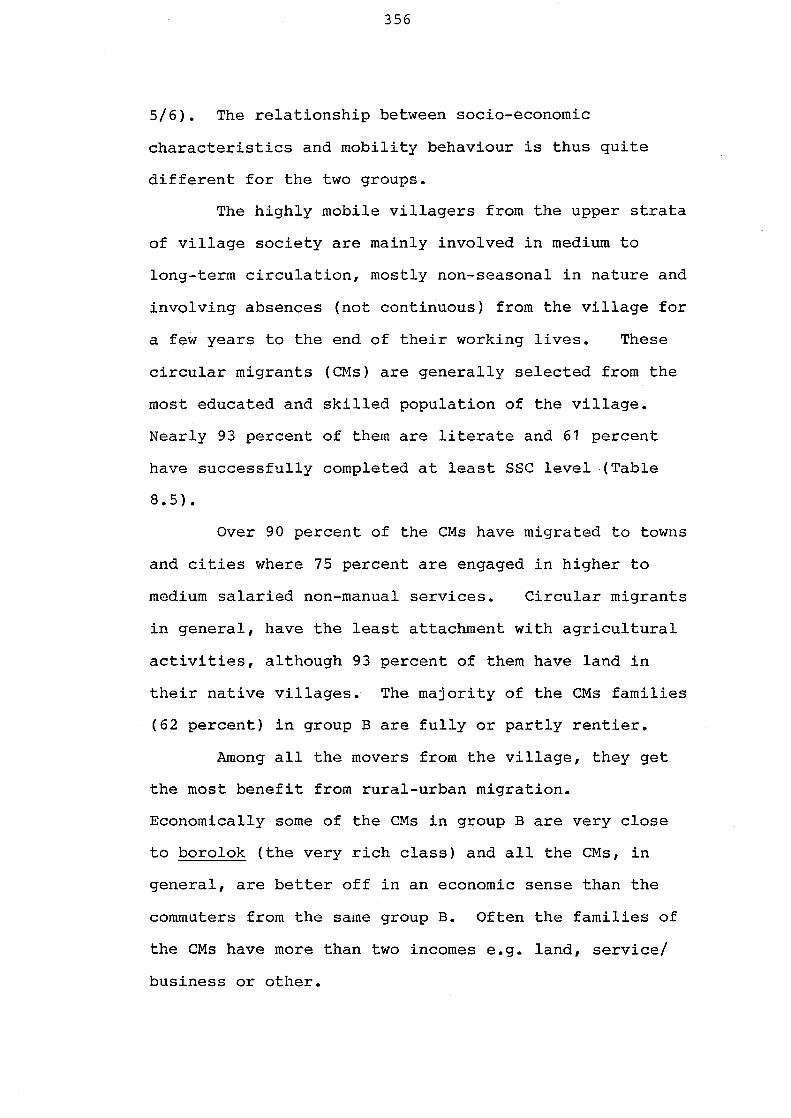
356
5/6). The relationship between socio-economic
characteristics and mobility behaviour is thus quite
different for the two groups.
The highly mobile villagers from the upper strata
of village society are mainly involved in medium to
long-term circulation, mostly non-seasonal in nature and
involving absences (not continuous) from the village for
a few years to the end of their working lives. These
circular migrants (CMs) are generally selected from the
most educated and skilled population of the village.
Nearly 93 percent of them are literate and 61 percent
have successfully completed at least SSC level (Table
8.5).
Over 90 percent of the CMs have migrated to towns
and cities where 75 percent are engaged in higher to
medium salaried non-manual services. Circular migrants
in general, have the least attachment with agricultural
activities, although 93 percent of them have land in
their native villages. The majority of the CMs families
(62 percent) in group B are fully or partly rentier.
Among all the movers from the village, they get
the most benefit from rural-urban migration.
Economically some of the CMs in group B are very close
to borolok (the very rich class) and all the CMs, in
general, are better off in an economic sense than the
commuters from the same group B. Often the families of
the CMs have more than two incomes e.g. land, service/
business or other.
357
Although these migrants are comparatively well
off by village standards, they usually do not have
sufficent means to opt for permanent urban residence
and, therefore, they adopt a strategy of temporary to
'quasi-permanent' circulatory migration. Their
movements are more innovative (Petersen 1958) than the
movers from lower SE strata, because they bring new
ideas to rural areas and generate change in both the
lives of their families in the village, as well as
changes in the community.
Commuters from group B, on the other hand, are
less educated than the CMs. Their literacy rate is 83
percent and the majority are under SSC level. They
commute equally to urban as well as rural areas. Rural
commuters are mostly business oriented (established
business) while urban commuters are service workers.
Commuters operate more land than the CMs and as they
live in the village, the majority (64 percent) are also
engaged in part-time farming. They do not exchange
labour but often work on their own farm.
Towards the base of the pyramid, another highly
mobile group comprises large numbers of movers from the
lower middle and gorib or poor classes (SE strata 5/6).
Unlike the movers of group B, their chances of achieving
a better life through the process of mobility are
considered to be very small. However, what is real in
their case is that they move mainly to safeguard their
existing level of well-being in rural societies and
358
settings.
Aggregate statistics from the 14 study villages
show that group D movers have a broad population base in
the rural areas (Table 8.3) and this group alone
accounts for 57 percent of the total active movers
(Table 8.4). These movers have come from a wide
variety of families and occupation groups such as
landless labourers and non-labourers, mini farmers,
owner cum tenant farmers, petty traders (mostly
peddler), and a wide Variety of low paid salary earners,
factory workers and non-agricultural wage earners.
In the village, 33 percent of group D movers have
no land at all. Another 30-35 percent have very little
land (below 0.50 acre), but due to shortages of ploughs,
draft animals, and cash they often cannot either
cultivate their own land or rent others' land. In this
situation, they are indirectly forced to rent out their
small parcels of land to those who control the means of
production. Those who have come from the lower middle
class are in a slightly better position than the gorib
class because fewer are landless and more have some
means to rent other land.
The CMs in group D, as in group B, also have a
better socia-economic condition as compared to others in
this group (Table 8.5). Seasonal migrants are in the
worst position. Two-thirds of them are illiterate, 60
percent landless or near landless, and nearly 80
percent depend on wage earning. Circular migrants
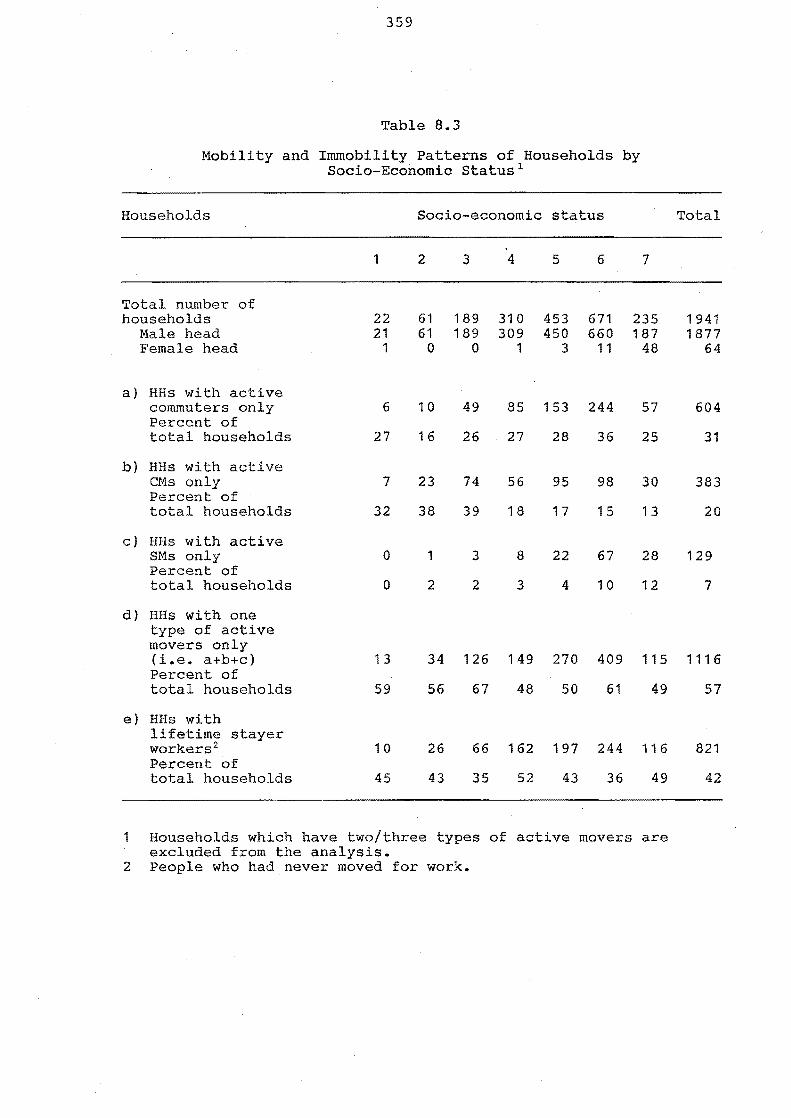
359
Table 8.3
Mobility and Immobility Patterns of Households by Socio-Economic Status 1
Households Socio-economic status
1 2 3 4 5 6 7
Total number of households 22 61 189 310 453 671 235
Male head 21 61 189 309 450 660 187 Female head 1 0 0 1 3 11 48
a} HHs with active commuters only 6 10 49 85 153 244 57 Percent of total households 27 16 26 27 28 36 2S
b) HHs with active eMs only 7 23 74 56 95 98 30 Percent of total households 32 38 39 18 17 15 13
cJ HHs with active SMs only 0 1 3 8 22 67 28 Percent of total households 0 2 2 3 4 10 12
d) HHs with one type of active movers only (i.e. a+b+c) 13 34 126 149 270 409 115 Percent of total households 59 56 67 48 50 61 49
e) HHs with lifetime stayer workers 2 10 26 66 162 197 244 116 Percent of total households 45 43 35 52 43 36 49
1 Households which have two/three types of active movers are excluded from the analysis.
2 People who had never moved for work.
Total
1941 1877
64
604
31
383
20
129
7
1116
57
821
42
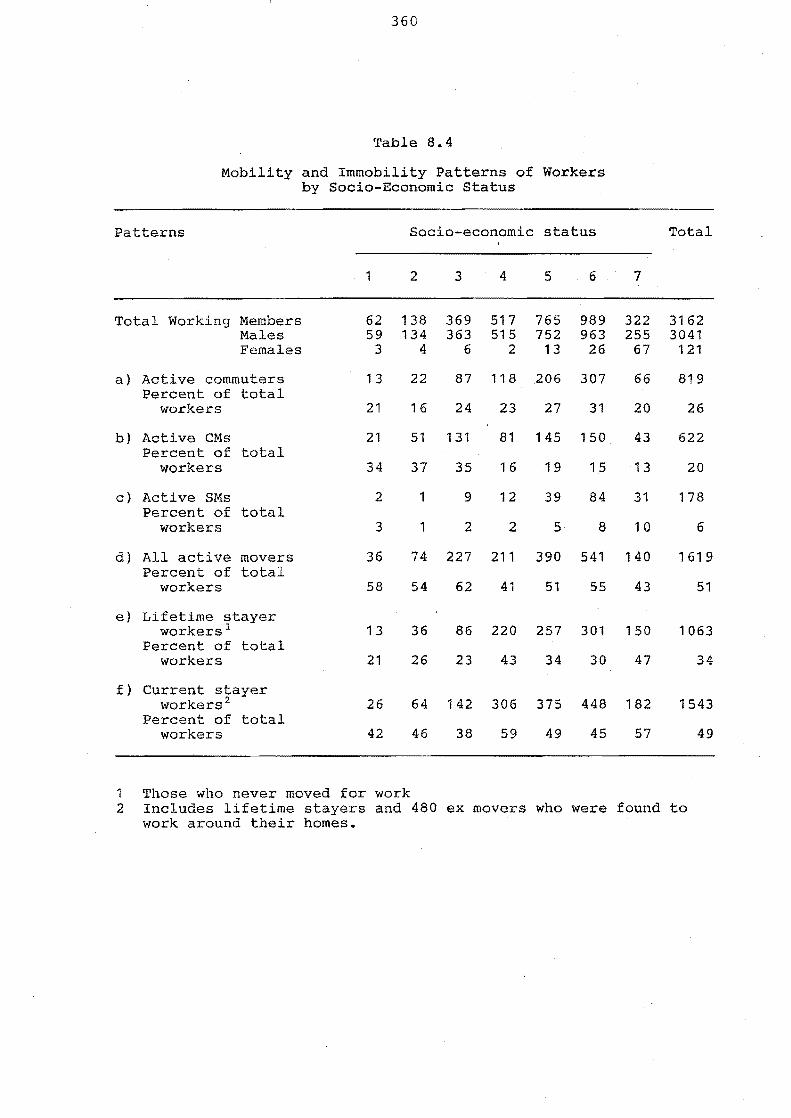
360
Table 8.4
Mobility and Immobility Patterns of Workers by Socio-Economic status
Patterns Socio-economic status Total
1 2 3 4 5 6 7
Total Working Members 62 138 369 517 765 989 322 3162 Males 59 134 363 515 752 963 255 3041 Females 3 4 6 2 13 26 67 121
a) Active commuters 13 22 87 118 206 307 66 819 Percent of total
workers 21 16 24 23 27 31 20 26
b) Active CMs 21 51 131 81 145 150 43 622 Percent of total
workers 34 37 35 1 6 19 15 13 20
c} Active SMs 2 1 9 12 39 84 31 178 Percent of total
workers 3 1 2 2 5 8 10 6
d) All active movers 36 74 227 211 390 541 140 1619 Percent of total
workers 58 54 62 41 51 55 43 51
e) Lifetime stayer workers 1 13 36 86 220 257 301 150 1063
Percent of total workers 21 26 23 43 34 30 47 34
f) Current stayer workers 2 26 64 142 306 375 448 182 1543
Percent of total workers 42 46 38 59 49 45 57 49
1 Those who never moved for work 2 Includes lifetime stayers and 480 ex movers who were found to
work around their homes.
361
heavily depend on urban income, mostly from low grade
office jobs and wage earnings. The majority of group D
movers (55 percent) are commuters who mostly move within
the rural areas seeking work in small trades or non
agricultural work, mostly rickshaw pulling. Rural to
urban commuters are mainly business oriented.
Less mobile population
Groups C and E are labelled as 'less mobile'
which means the people of the corresponding SE strata
are less likely to move from their village of residence.
The two groups have different reasons for their lower
propensity for mobility. In the case of group C, which
includes 'true' middle class villagers, mobility rates
are less than those of the upper middle class as well as
lower middle class villagers (see Figure 8.3). Major
reasons for their low mobility rates include: (i) most
of them (over 90 percent) have some land and other means
of production and thus they feel a sense of security in
the village; (ii) due to poor education they have less
ability (compared to the people of upper middle class)
to earn more through migration than what they have
already been earning in the village settings.
A close examination of movers' and stayers'
economic condition shows that those who are stayers
among the group C people are economically better off
than those who are mobile (Table 8.5). In other words,
economically, those who are close in a social sense to
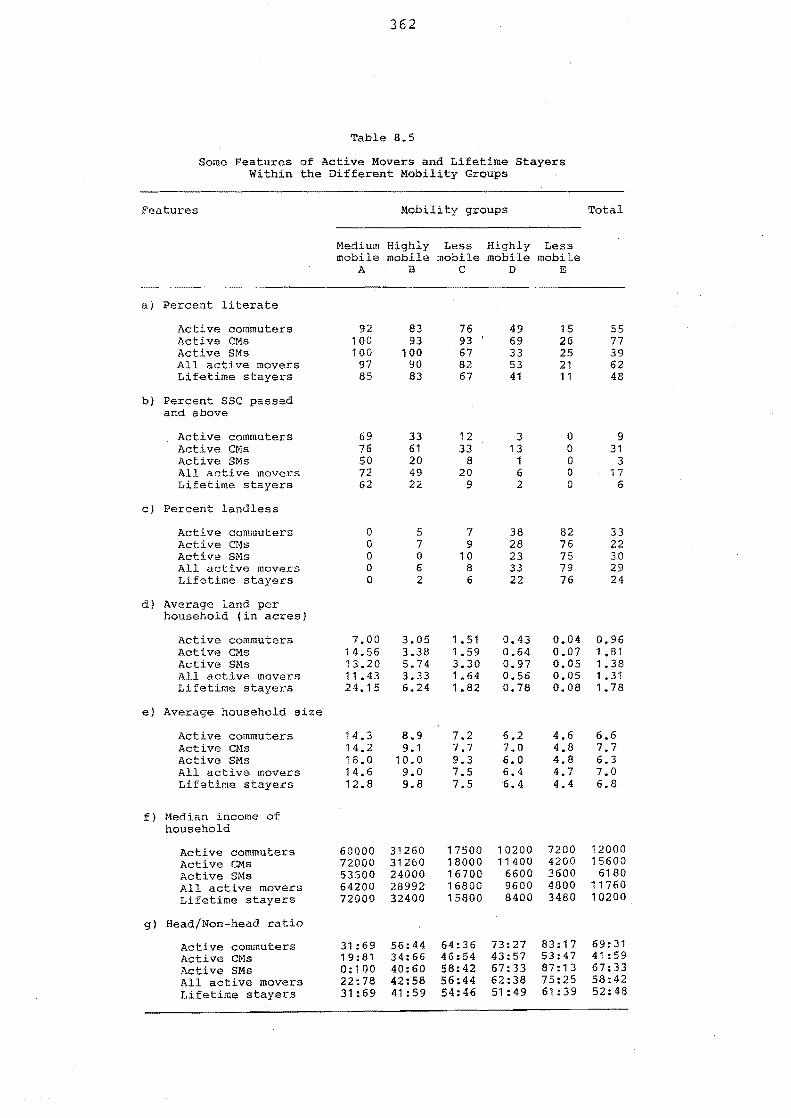
362
Table 8.5
Some Features of Active Movers and Lifetime Stayers Within the Different Mobility Groups
Features
a) Percent literate
Active commuters Active eMs Active SMs All active movers Lifetime stayers
b) Percent SSC passed and above
Active commuters Active CMs Active SMs All active movers Lifetime stayers
c) Percent landless
Active commuters Active C!1s Active SMs All active movers Lifetime stayers
d) Average land per household (in acres)
Active commuters Active CMs Active SMs All active movers Lifetime stayers
e) Average household size
Active commuters Active CHs Active SMs All active movers Lifetime stayers
f) Median income of household
Active commuters Active eMs Active SMs All active movers Lifetime stayers
g} Head/Non-head ratio
Active commuters Active CMs Active SMs All active movers Lifetime stayers
Mobility groups
Medium Highly Less Highly Less mobile mobile mobile mobile mobile ABC D E
92 100 100
97 85
69 76 50 72 62
o o o o o
7.00 14.56 13.20 11.43 24.15
14.3 14.2 18.0 14.6 12.8
60000 72000 53500 64200 72000
31: 69 19: 81 0: 100 22:78 31:69
83 93
100 90 83
33 61 20 49 22
5 7 o 6 2
3.05 3.38 5.74 3.33 6.24
8.9 9.1
10.0 9.0 9.8
31260 31260 24000 28992 32400
56:44 34:66 40:60 42:58 41 : 59
76 93 ' 67 82 67
12 33
8 20
9
7 9
10 8 6
1.51 1.59 3.30 1.64 1.82
7.2 7.7 9.3 7.5 7.5
17500 18000 16700 16800 15800
64:36 46:54 58:42 56:44 54:46
49 69 33 53 41
3 13
1 6 2
38 28 23 33 22
0.43 0.64 0.97 0.56 0.78
6.2 7.0 6.0 6.4 6.4
10200 11400
6600 9600 8400
73:27 43:57 67:33 62:38 51 : 49
15 26 25 21 11
o o o o o
82 76 75 79 76
0.04 0.07 0.05 0.05 0.08
4.6 4.8 4.8 4.7 4.4
7200 4200 3600 4800 3480
83:17 53:47 87: 13 75:25 61:39
Total
55 77 39 62 48
9 31
3 17
6
33 22 30 29 24
0.96 1 .81 1.38 1. 31 1. 78
6.6 7.7 6.3 7.0 6.8
12000 15600
6180 11760 10200
69:31 41 : 59 67:33 58:42 52:48
363
the lower middle class people are more prone to move out
than those who are far from them. This is conceivable
in the light of Mukherjee's (1948, 669) interpretation
of pyramidal social structure of rural societies. He
argues that middle class families have been experiencing
a gradual degradation of their socio-economic status as
a result of rural overcrowding. A large number of them
are being 'leached out' and added to the lower class -
the class which has been swelling at an unprecedented
rate.
In our study areas we found that the lower class
are heavily over-represented. Nearly 47 percent of our
survey households lie in this class. Large numbers
might drop from the lower middle class which was also
well represented in our survey communities. At the
bottom of the pyramid (mobility group E) are people
known as sorbohara (destitute) class. In the 14 study
villages we found 235 sorbohara families; one-fourth of
them are headed by poor widows. From 74 to 82 percent
of them have no land at all. The overwhelming majority
of these families (80-89 percent) are illiterate and
depended heavily on wage labour. Group E people have
different reasons for their limited mobility behaviour.
They have very few or no opportunities to migrate or to
circulate for work from their paternal village location,
and they are physically unfit for urban types of work as
well as for any hard work. Further reasons for greater
immobility among group E people will be discussed later
364
in this chapter.
The other villagers
The individuals or families which belong to group
A are the most wealthy class by village standards and
they are called borolok or dhani in rural Bangladesh.
They are the smallest group who lie at the apex of the
social pyramid. In the eyes of many villagers the
dhanis are those 'who sit and eat' and 'whose hands are
soft'.
In Figure 8.3 it is evident that group A members
are less likely to move out from their villages compared
to group B people but more likely to do so in comparison
with groups C and E. Further analysis of data
indicates that in group A the movers tend to come from
non-head members (Table 8.5) and they prefer rural-urban
circular migration. The heads of household, on the
other hand, are more prone to immobility as compared to
head members of other groups (Mahbub 1984). Thus,
taking both heads and non-heads into account, we
considered group A as having a 'medium' level of
mobility.
The head and non-head members of group A have
their own reasons for a differential pattern of
movement. Although the head members have a fair
opportunity to live anywhere, they are usually less
prone to conventional types of temporary or periodic
movements than those in groups Band D. In the village
365
they have enough resources, established businesses, big
farms, and higher socio-political positions, which they
do not want to lose through migration to towns.
On the other hand, their migration-prone sons are
mostly well educated, young, and have aspirations for
modern life. In the village, their families are big in
size and they are quite aware than when they are
separated from their parents' household, they will get a
small share of the wealth. In this regard it seems
that, when they establish their own households, their SE
status will drop from group 1 to 2 or even lower
following the same principle (i.e. gradation/
degradation of socio-economic status within the
pyramidal social structure) that we have partly
discussed with reference to group C.
In the village surveys it was found that a
significant number of sons had dropped from the rich
class, particularly when they separated from their
parents. Citing an example from Bahimara village in
Dhaka district, Jansen (1983, 68) noted that:
The break-up of the households and the division of the land leads to a very critical period for the new households which are established, and at this stage the foundation is laid for the social and economic position of a new household.
8.2.2 Discussion
The observed relationship between mobility
behaviour and social structure suggests that in these
rural communities, people originating from different
366
socio-economic positions adopt different patterns of
movement to maintain their livelihood. Within the
pyramidal structure those who are in either the higher
or the lower socio-economic strata have higher rates of
mobility than those who lie at the top, middle and
bottom levels. The evidence suggests that earning
males from the upper strata are more prone to circular
migration, whereas those coming from the lower socio
economic positions are more likely to make short-term
movements such as commuting and seasonal movements.
The poor and the rich
The reasons why poor villagers prefer commuting
and/or are unable to migrate in a greater number were
examined in Chapter 6. Poor income, low education/
skills, small family size and hand to mouth living
conditions have deterred many families from sending
their sons or principal earners to towns as migrant
workers. Many part-time farmers also consider
commuting a viable alternative to migration. Commuting
facilitates the earning of off-farm income by peasants
who do not want to lose their farm employment.
In four Indian villages, Kothari (1980, 262) has
considered poverty as the crucial element in low rates
of migration among the poor. Factors such as low
education, insufficient resources to support migration,
apathy, feelings of insecurity and low level of
aspirations account for the low mobility. The same
author also noted that many potential migrants belonging
367
to the lower-stratum families might not be able to
migrate because in the village there is some fear among
the poor households that once children leave the village
they will not continue to share their earnings with
their parents. In these circumstances it is more
likely that some poor families may exert pressure on
their children (mostly sons) to remain at home, or to
undertake a home-based movement like commuting.
On the other hand, a number of studies have
suggested that rural-urban migration acts for the
richer families as a tool to diversify their sources of
income. As Michael Lipton (1980, 7) has pointed out:
Rural emigration in LDCs is of two types: that in which better-off countryfolk use their surpluses (accumulated as education, cash or other assets) to buy into the urban scene, with its prospects to further accumulation; and that in which the poorer (but seldom the poorest) villagers seek to make up for the land deprivation, high rents, and labourreplacing technologies associated with the concentration and use of surpluses by the better-off in their villages of origin.
Household size and composition also acts as an
important catalyst for the out-migration of earning
males from the richer families. Generally, in the rural
areas the larger households are economically better-off
as they have more earning members and other accumulated
resources e.g. land, cattle, capital etc. Having more
resources and man-power, the large joint or extended
families can thus invest their surplus labour in rural-
urban migration. Moreover, these households can afford
the costs, risks and delayed returns associated with
368
migration (Kothari 1980, 273). Therefore, a person
belonging to a relatively prosperous household is more
likely to be a circular migrant than one from a poor
family in the lower classes.
The two flows of movers, the poor and the rich,
are clearly discernible from several recent studies as
mentioned at the beginning of this chapter. These
studies have mostly been concerned with rural-urban
migration. The range of empirical knowledge on the
relationship between socio-economic structure and
commuting behaviour of rural people is much smaller.
Little explicit attention has also been given to the
total mobility behaviour of those earning members who
belong to the top, middle and bottom of the social
pyramid (SE stratum 1, 4 and 7).
Many, though not all, believe that the villagers
who are very poor (SE stratum 7) are the chief source of
slum and squatter populations in towns and cities, and
thus the rural destitute families might have a rather
higher rate of migration. This viewpoint is more
relevant to some Latin American countries where the rate
of urbanization is relatively high, or some African
regions where severe natural catastrophes such as
prolonged drought and advancing sand dunes drive the
destitute to shanty towns. But in the case of
Bangladesh, one of the poorest countries in the world
where more than 85 percent of the population still
remain in villages, the rate of rural-urban migration
369
among the poorest sector of rural society cannot be
high.
In Bangladesh, a very poor village household
usually has the following economic disadvantages: very
little or no land, no plough and cattle, debts, few
income earners (often an old age male or under age
children or a widowed woman), and highly insecure
employment with a very low cash return. One common
reason for less mobility among the poorest villagers is
their ill health which in most cases makes them unfit
for urban hard work. So they are bound to remain in
the village and seek light work on the farms of
relatives and neighbours. With a very low income, they
cannot afford to buy more food, and are caught in a
vicious circle of poverty, malnutrition and impaired
labour power (Harrison 1981, 265).
Given the above situation which is very common in
rural Bangladesh, many impoverished or pauperized
families do not want to leave their village for several
reasons. In the first place they fear that once they
move to town someone will take over their homestead plot
and they will not be able to return. They are also
frightened about the possibility of losing social and
economic support (e.g. receiving loans, employment and
help in children's marriage matters) from their village
relatives and friends as it is difficult to get such
support in town society.
A recent study has explained how the poor and
370
very poor families, through "patron-client" relation
ships, are preoccupied with survival and are less likely
to leave their home village and relatives (Jansen 1983,
Chapter 4). In the present framework of economic,
social and political conditions, for many poor and
destitute villagers there is no option but to stay and
starve in the village. As one poor villager bitterly
remarked: 'They (better-off villagers) don't allow us
to die, but neither do they allow us to live ••• ' (Van
Schendel 1981, 90).
Socio-economic degradation
The relationship between socio-economic strata
and mobility behaviour of villagers is not static and it
is necessary to explain the dynamics of class mobility
within the pyramidal social structure. The general
characteristics of this type of pyramidal social
structure and the opportunities for upward or downward
social mobility have been described by Mukherjee (1948)
and more recently by Van Schendel (1981) and Jansen
(1983). The upper class, which is characterized by a
concentration of land and income, seldom gets people who
have been slightly upgraded from the middle class.
The lower class people are poor peasants who have
been divorced from their land. They have come from
middle class families which have been gradually
degrading as a result of rural overcrowding. Mukherjee
(1948) described the middle class as the self-sufficient
peasantry in rural Bengal. But today, four decades
371
after his survey, the bulk of the middle class families
undoubtedly belong to a dependent peasantry. It is also
evident that a large number of families from the middle
class are being 'leached out' and added to the lower
class - the class which has been swelling rapidly.
Over time, class mobility in Bangladesh shows a net
downward trend leading to pauperization (if not
proletarization) through the disintegration of the
middle class. This is clearly evident from Van
Schendel's study (see Figure 8.4). Generally, the
poorer the country, the smaller is the middle class and
the greater the polarization between the upper and lower
classes.
The consequences of this socio-economic
degradation are severe. There has been a rapid
increase in the proletariat group, and growth in a range
of tensions (social, economic and political) which have
relevance to population circulation and migration. In
such a situation a complex space-time mobility pattern
is likely for the proletariat group_ The distance,
duration and direction of their shuttle-movement will
be determined mainly by the availability of employment
at the home village, in the rural markets and nearby
towns and cities. The nature and availability of
transportation facilities will also influence movement
patterns. Proletariat females will join with their
male peer-group in the same sort of circular mobility
which has recently been indicated for the poor and
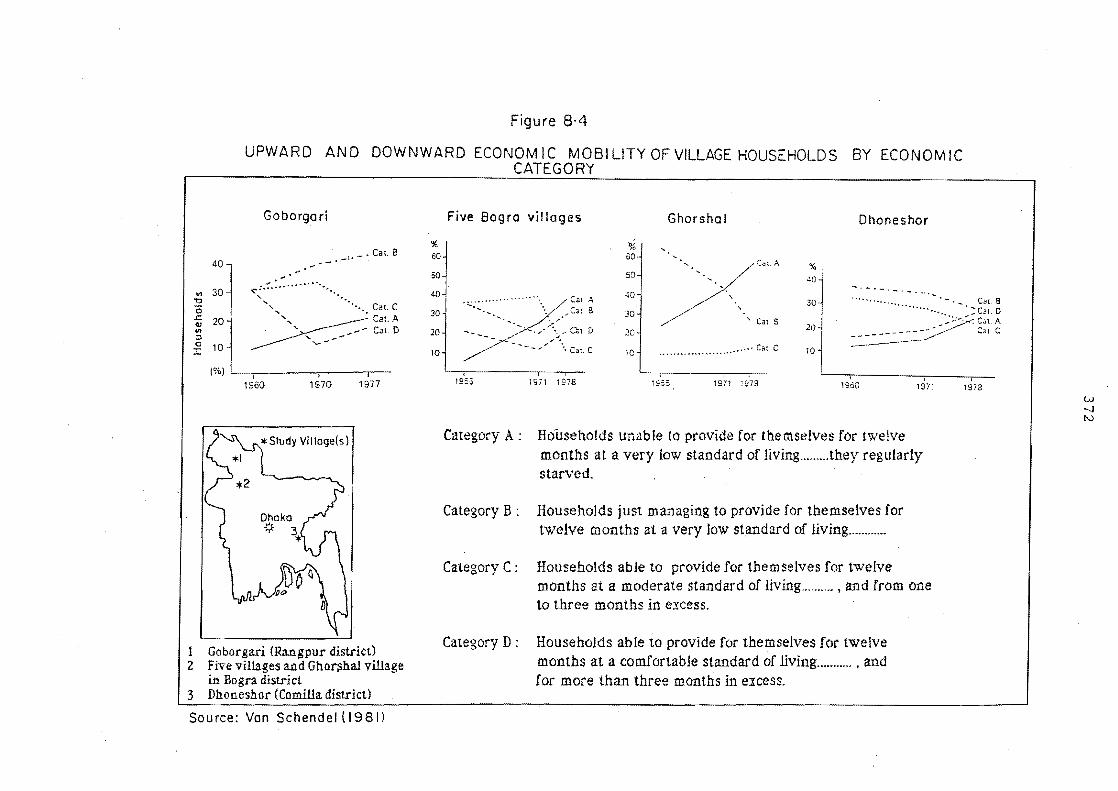
Figure 8·4
UPWARD AND DOWNWARD ECONOMIC MOBILITY OF VILLAGE HOUSEHOLDS BY ECONOMIC CATEGORY
40
..t: 30
'0 J:: OJ 20 tn ::;)
~ 10
Goborgori
• _ . _,. _ • Cal. 8
",,:.:::.~~~ ............. . "-
" ••.• Cal. C
~" • Cal. A
.', __ - Cat. 0 " --....-
(%)L Iii 1960 1970 1977
1 Goborgari (Rangpur district) 2 Five villages and Gho~hal village
in Bogra district 3 Dhoneshor (Camilla district)
Source: Van Schendel {( 981)
% 60
50
40
30
20
10
Five 80gro villages
~ ..... /ca!.A "._ /~/,ca: B
/
- - - /'/>-. ,.:~./ Q _ ..,,~.'" <:It, D ; .
'. Cat. C
.. : ro
00
50
':;0
30
20
10
Ghorshal
x:::: ea: C
!1 30, 2°1
Dhoneshor
-. -. - . ...•.• Cay. 8
• ::C31 D C.I. A Cat. C
10 1 L---'i--------__ ~,------_.,----,
1955 1971 1978 1955 1971 1978 1960 1971 1973
Category A: Households unable to provide for themselves for twelve months at a very low standard of living ......... they regularly starved.
Category B: Households just managing to provide for themselves for twelve months at a very low standard of living ........... .
Category C : Households able to provide for themselves for twelve months at a moderate standard of living .......... , and from one to three months in excess.
Category D : Households able to provide for themselves for twelve months at a comfortable standard of living ............ and for more than three months in excess.
w -...)
N
373
overcrowded regions of the country (Begum 1979; Chen
1986).
Finally, non-mobile or less mobile groups will be
forced to become more mobile. In this regard there
will be a small number of families in group C who will
work only at the home village. The poorest sector of
the village population (group E) will have no option but
to leave for the cities as destitutes. As a result of
the latter trend, the rural-urban stream of movement is
likely to expand at an unprecedented scale.
8.3 CONCLUSION
A growing number of researchers (e.g. Lipton
1980, Connell et ale 1976, Chaudhury 1983, Boer 1981
etc.) argue that rural out-migration is not only
caused by rising inequality among the village families
but that it is also in itself a cause of inequality. In
common with wealth and education, migration has a
polarising effect on village social stratification.
Boer (1981, 28) has observed that migration is
one of the mechanisms by which the less rigid social
structure in Bangladeshi villages is being changed into
a more rigid structure in which the opportunities for
upward mobility for the village poor and the risks of
downward mobility for the rich decrease. Analysing the
socia-economic achievements of village migrants in
Bangladesh, Chaudhury (1983, 71) concluded:
••• (The) current migration patterns and processes (in Bangladeshi villages) are income
374
regressive, widens the income and productivity gap and reinforces polarisation in rural areas. In the absence of progressive intervention, migration will reinforce existing economic stratification and its related negative human impacts - malnutrition, ill health, low worker productivity and violence.
In the light of these conclusions it can be said
that in rural Bangladesh in the mid-1980s the upward and
downward mobility of a household is, to a large degree,
dependent on the family1s economic achievements gained
through the migration process. Given a severe scarcity
of local resources (land and employment) and an
extremely high man-land ratio in the countryside, rural-
urban circulation has become a very important mechanism
by which a livelihood is secured for many village
households. However, as we have already seen, the
opportunities for upward mobility by dint of migration
achievements are not equal across households or
individuals.
Except for the rich, only a few aggressive
individuals or families, mostly from the middle class,
may manage to rise in the socio-economic hierarchy. For
most others population movement affords an opportunity
to maintain a family's or individual's existing standard
of living, perhaps for the time being. It can delay the
process of socio-economic degradation that has become
characteristic of social change in rural Bangladesh.
CHAPTER 9
CONCLUSION
Population circulation is not a new phenomenon in
the history of the relocation process of human beings
(see Prothero and Chapman 1985, Chapter 1). However,
it was not until the 1940s that scientific inquiry into
circular mobility commenced. Since the 1960s in
particular, circulation in population movement has
received increasing attention in migration literature,
especially that dealing with mobility in many Third
World countries where societies are still predominantly
rural-based in residence, employment and culture. It
has been established that this particular process of
movement is prevalent among the indigenous peoples of
Africa, Melanesia and Southeast Asia (Chapman and
Prothero 1985). Researchers now argue that much of
the population movement in many other regions of Asia,
including Bangladesh, is temporary or circular in nature
(Prothero and Chapman 1985).
This concluding chapter discusses briefly the
relevance of circular mobility in Bangladesh in the
light of our findings from village surveys. The most
significant results derived from the field inquiries are
summarized and some shortcomings associated with the
approach adopted in this research are reviewed.
Finally, some suggestions are made concerning further
research on mobility in Bangladesh and elsewhere.
375
9.1 CIRCULATION: AN ENDURING FORM OF POPULATION MOVEMENT
The basic pattern of movement of working people
originating from rural areas in Bangladesh is circular,
involving temporary displacement from a village home
base rather than the conventional linear type of
permanent relocation. Traditionally the pattern
includes three broad types of circular movements:
commuting, circular migration and seasonal migration.
Permanent relocation caused by inadequate income
opportunities in native villages usually follows some
experience of circular mobility.
9.1.1 The rationale for circulation
Circulation seems to dominate the internal
migration process in Bangladesh and other South Asian
countries (Skeldon 1984). Previously the volume of
this movement was relatively small and mostly confined
within rural settlements (Chapter 2) but in recent
decades both the magnitude and direction of reciprocal
flows have proliferated. More recently, circulation
has become an integral part of the life cycle of most
earning men of rural households (Chapter 3). Despite
heavy reliance on agriculture as a means of livelihood,
drastic changes have been taking place in rural areas
leading to a large scale adoption of dual or multiple
occupation strategies by rural families. This has
resulted in an accelerating rate of circulation of
household earning members between village domicile and
376
urban or rural workplaces.
Increasing landlessness, un/underemployment and
poverty, which are associated mainly with a high rate of
population growth and a skewed distribution of land in
terms of ownership, imply that the survival of many
households in rural Bangladesh is, in fact, largely
dependent on continued access to urban sources of income
and the availability of a large number of non-
agricultural jobs within the rural regions. Since
Bangladesh is very poor in resource terms and has a very
large peasant population, the government cannot afford
to create millions of off-farm jobs required for the
huge surplus labour force in the agricultural sector.
In such a situation, there is relentless competition for
scarce resources (such as land and employment) among the
villagers (Jansen 1983, Boyce and Hartmann 1981, 26).
For many village families, especially those coming
from middle and lower income groups, stable sources of
income and opportunities to utilize household labour
fully, are becoming increasingly difficult to acquire.
Such families are heavily dependent on "fragmented
occupations" in which they acquire employment or income
from the land, rural markets or nearby towns. As the
supply of jobs in any occupation is much lower than the
demand for work, the income from a single job or 'piece
of work' remains insufficient and villagers often engage
in two or three jobs or 'pieces of work' to satisfy
their basic socio-economic needs. The growing
377
importance of this dual or multiple occupation strategy
in rural Bangladesh has been stressed in many recent
studies (Jansen 1983, Van Schendel 1981, Hartmann and
Boyce 1983, and Chen 1986).
The most common mixture of economic activities in
rural Bangladesh are farming plus employment for money
in towns, village markets and thana centres (Chapter 6).
Villagers who travel to these hubs of commercial
activity usually follow a definite pattern of circular
mobility such as commuting, circular migration and
seasonal migration (Chapters 4 and 5). A general trend
evident in the three locations is that circular mobility
is growing in importance in association with the growth
of dual occupation practices. It can be argued that
the importance of circular mobility in rural Bangladesh
will continue to increase in the foreseeable future.
Such an assumption is supported by the simple fact that
Bangladesh, although a small country, has a 'giant'
rural population l and many individuals will have to
adopt circular mobility strategies if they are to
survive in either rural or urban locations.
1 In terms of total population size Bangladesh is placed eighth in the world, but the country has the fourth largest rural population in the world. Only China, India and Indonesia have larger rural populations than Bangladesh. None of these countries has such a high proportion of the total population living in rural areas and dependent on agriculture for livelihood (Khan 1977, 137, Jones 1978). In 1980, the proportion of rural population for Bangladesh was 88.8 percent as against 73.9, 77.7 and 79.8 percent found in China, India and Indonesia respectively (UN 1980b).
378
Zelinsky's (1971) argument that circulation is
only a stage in the mobility transition, and is linked
to particular processes and phases of socio-economic
change (notably urbanization, modernization, and
industrialization) has limited relevance in the context
of a society such as Bangladesh where, as mentioned
before, a vast proportion of the population is rural
based and will continue to be so for a long time. Some
investigators (Bedford 1971, Chapman and Prothero 1977,
Hugo 1978a, Mantra 1981, Young 1984) have criticized
Zelinsky's hypothesis and they have proposed that
circular mobility is a long-term phenomenon rather than
transitional. Chapman and Prothero (1977, 5) have
argued: 'Circulation, rather than being transitional or
ephemeral is a time-honored and enduring mode of
behaviour, deeply rooted in a great variety of cultures
and found at all stages of socio-economic change.'
Young (1984, 225) has suggested that, owing to
entrenchment of inequalities, uneven development and
incomplete transformation of economy, circular mobility
exists and will persist in many Third World countries.
Apart from the debate about whether circulation
is in fact a transitory or an enduring form of
population movement, a growing number of researchers
(Mantra 1981, Hugo 1978a, Ulack et al. 1986) consider
circular mobility as a viable substitute for
permanent relocation or for total immobility. The
present study has arrived at a similar conclusion and
379
has revealed that this particular form of movement is
essential for increasing numbers of rural Bangladeshis,
especially the poor, agricultural labourers, small
peasants, part-time farmers, unskilled or less skilled
groups, and families with fewer income earners. These
people can neither leave their village for good due to
lack of adequate income and stable employment at their
destination place nor stay at home permanently as they
do not have sufficient means of living (land and
employment) in their native village.
9.1.2 The components of circulation
In the study villages circular movement was
divided into three major categories: commuting,
circular migration and seasonal migration. These types
of population movement have all been practised by
villagers in Bangladesh for a long time. Generally,
the former two mobility behaviours are very common in
almost all rural regions while the latter is more likely
to be found among labourers in poorer regions. In the
three survey areas, movers from Rampal and Chandina
tended to prefer commuting to circular migration; the
incidence of seasonal migration had become insignificant
in these two regions. In Sakhipur, on the othr hand,
circular migrants and seasonal migrants outnumbered
commuters. The relative importance of commuting,
circular migration and seasonal migration in each survey
area was found to depend upon several factors. Most
380
important in this regard were the region's location,
transport infrastructure including rural-urban links
and, above all, agricultural practices and land use.
During the last three or four decades the
movement pattern of household earning members in all
areas has become more circulatory in nature. In other
words there has been a shift from seasonal and long-term
circulation to short-term frequent circulation such as
commuting. The field of commuting and circular
migration has enlarged greatly while the scope of
seasonal migration, particularly the intra-rural stream,
has been reduced substantially. It was also found that
over the last few decades circular migration has
increased more rapidly than any other movement type and
this trend is likely to parallel the steady increase in
the size and proportion of the population that is urban
based.
Numerous studies have indicated that inadequate
wages, shortage of land, and an unequal distribution of
farm holdings are the real explanations for rural out
migration in many agrarian societies. However, very
few studies consider the precise relationship between
forms of mobility and regional agriculture structure
(Prothero and Chapman 1985, 21). The rate and
incidence of commuting and migration (seasonal and non
seasonal) are to a large degree also dependent on a
range of agricultural factors such as cropping pattern,
intensity of cultivation, tenural system, and level of
381
access to improvements in technology (i.e. degree of
success in the 'green revolution'). In an agrarian
society such as Bangladesh, these factors have a major
influence on the mobility strategies of household
members.
In rural areas households have different levels
of agricultural involvement which is accomplished in
various ways through using male man-power of the family,
hiring labour, renting (in or out) land or a combination
of these processes. It was found that commuting has
become of immense significance in regions like Rampal
and Chandina where agriculture is intensive and
villagers have opportunities to cultivate cash crops
using modern seed, fertilizer and irrigation
technologies. Proximity to large urban centres and
improved transport links with cities, towns and large
rural markets are considered to be important requisite
factors which facilitate frequent movements of
agricultural products and people, thus leading to a
higher rate of commuting. On the other hand, in a poor
region such as Sakhipur, which is characterised by
traditional agriculture and poor infrastructure, there
are usually higher rates of seasonal migration.
Empirical evidence from the villages of India and
Bangladesh (see Connell et al. 1976, Kothari 1980, and
Chaudhury 1978a) suggests that in the poor or less
developed villages a high rate of out-migration is
likely while in the more developed villages (often
382
indicated by improvements in agricultural technology)
the propensity to migrate is reduced by the provision of
more regular employment in farming and a wider range of
job opportunities. Studies showing the propensity of
commuting movement in more developed and less developed
villages are scarce. Therefore, it is difficult to
suggest that in India villages within the green
revolution belt may have a high rate of commuting as
found in Rampal and Chandina in Bangladesh. A point
should be noted here that population mobility is a
complex, multivariate phenomenon and generalizations
based on a single variable are likely to fail. For
example, the man-land ratio of Kothari's study villages
in the Punjab (India) is much lower than the ratios
found in Rampal and Chandina. Furthermore, the
practice of dual occupation, which is positively
correlated with a high rate of commuting in Bangladeshi
villages, may not be so important in the case of the
Punjabi villages.
Evidence from this study, as well as from
research in Southeast Asia and the Pacific, indicates
that the pattern, process and the magnitude of commuting
among rural people depends, to a great extent, on the
local agricultural calendar. Several studies also
suggest that with the development of infrastructure and
modes of production, commuting gradually becomes a
substitute for migration in many Third World countries
(Hugo 1978a, Mantra 1981, Ulack et ala 1986, UN 1977,
383
1982b, 2). This proposition is important in the case
of Bangladesh where the overwhelming majority of people
live in rural areas and they depend increasingly on a
mixture of agricultural and non-agricultural activities
for their livelihood.
Elkan (1967) showed in his African studies that
the growth of towns can take place in several ways: an
increase in the number of permanent inhabitants, a
growing number of temporary migrants, or longer stays by
migrants. He found that since the 1960s the growth of
towns in East Africa has been caused predominantly by
the latter two. This finding obviously indicates the
immense significance of circulation in explaining the
urbanization process in many countries, especially where
the rate of urbanization is low and circulation has been
the dominant feature of rural-urban population movement.
Recently Skeldon (1984, 28) has stressed the profound
impact that rural-urban circulators or a fbi-local'
population have in urban growth in South Asia.
Results from field surveys in rural Bangladesh
indicate that the overwhelming majority of the circular
migrants (90 percent) were directed towards urban
centres. Almost 50 percent of the seasonal migrants
and the same proportion of commuters also moved to
cities and towns for livelihood. In 1981 when this
survey was conducted, one-third of the total household
earning members were involved in economic activities in
towns. The major forces behind this drift to the

384
cities may be known to many experts and policy makers
(see Chapters 3 and 4) but the incidence of circulation
in rural-urban mobility, and its contribution to urban
growth, have not been documented by census surveys. As
a result, it is widely believed that the conventional
census surveys have greatly underestimated the volume of
rural-urban mobility in Bangladesh.
9.1.3 Social class and mobility strategies
The movement of people for economic reasons is an
integral part of the complex process of socio-economic
change in rural communities. It is a means by which an
increasing number of families maintain or improve their
socio-economic standing in the rural setting. For at
least a decade a group of researchers have explained
rural out-migration in the context of unequal
distribution of land, income and education attainment
among rural families, and have suggested that the
propensity to leave villages is higher among households
that are either poor or rich (see Chapter 8).
On the basis of empirical analysis it has been
found that in rural Bangladesh, people from different
socio-economic classes follow different patterns of
movement for earning a livelihood. The pattern of
mobility for all male earning members is bi-modal which
indicates that within the pyramidal social structure
those individuals (or households) who are in either the
higher or the lower socio-economic strata have higher
385
rates of mobility than those who lie at the top, middle
and bottom levels (Figure 8.2). The poorest villagers
and the "middle class" people are classified as less
mobile groups. At the top of the socio-economic
pyramid the richest, in general, have medium levels of
mobility. The detailed patterns as shown in Figure 8.3
also suggest that earning males from the upper strata
are more attracted to circular migration, whereas those
corning from the lower socio-economic strata are more
likely to make short-term movements such as commuting
and seasonal migration.
In Chapter 8, it was also shown that within the
pyramidal social structure there was a net trend
downwards in social status and this was manifesting
itself in massive pauperization and semi-pauperization
through the disintegration of the middle class. As a
result, the study suggests that the space-time pattern
and rate of population movement in future will be
dominated even more by the mobility strategies of the
lower classes.
9.2 SHORTCOMINGS AND SUGGESTIONS
This study has attempted to present a
comprehensive assessment of contemporary mobility
behaviour of household earning members in three rural
locations in Bangladesh. It is a pioneering study in
Bangladesh, in the sense that it highlights the
significance of circulation or repetitive movement which
386
is now generally accepted as the dominant type of
population movement in many Third World countries. The
study has demonstrated the utility of differentiating
between concepts of commuting, circular migration,
seasonal migration and other forms of mobility (see
Table 2.1) in order to place the process of population
movement in rural Bangladesh in relevant social and
economic contexts. Meaningful distinctions were also
needed to identify movers from stayers, active movers
from previous movers or returnees, and circular migrants
from permanent migrants.
Although the primary focus of the thesis was the
mobility behaviour of commuters and circular migrants,
data on other forms of movers and stayers were also
collected and briefly analysed. More intensive
examination of these other groups would further our
understanding of mobility in Bangladesh. There is a
need for close investigation of returnees and permanent
migrants if we are to understand better the extent to
which circular migration is a substitute for permanent
relocation.
It is generally believed that the spread of green
revolution technology in many parts of Asia and
elsewhere has reduced the propensity for rural out
migration. But we know little about the detailed
implications of this particular technology for the total
pattern of population mobility in a green revolution
area. Evidence from Rampal and Chandina suggests that
387
the improvement of agriculture through intensive
cultivation of hybrid rice or cash crops is encouraging
people to make short-term, short-distance commuting
moves. However, the relationship between population
mobility and modernization of agriculture is very
complex and variable from one region to another (Hugo
1984). It is an area which should be studied
intensively using both prospective and retrospective
approaches.
Few studies have examined the flows of working
people as a function of household socio-economic status.
Such an approach would assist with the generation of
mobility theory which takes account of class structure.
The subject is highly complex and requires intensive
empirical inquiries. Longitudinal approaches would
best probe the nature of changing class status.
Another area of research, particularly relevant
to circular movement from rural areas, concerns the
household social and economic characteristics. The
family or household, which is the primary unit of
village social order, has a considerable impact on the
individual's decision to commute, migrate or work at the
home village. It has been emphasized in several
studies that inquiry into population mobility should
proceed at several levels simultaneously: individual,
household and community (Chapman 1981, Watts and
Prothero ND, Ojeda 1976).
Finally, it would have been useful to attempt to
388
measure the contribution of circular mobility to the
growth of towns in Bangladesh. This was not possible
in this study, but it is an important issue in those
countries where census statistics underestimate both the
volume of population movement and the extent of
participation in the urban economy. The policy
implications of circular mobility for both urban and
rural planning are considerable and these need to be
addressed much more explicitly in another study.

389
APPENDICES
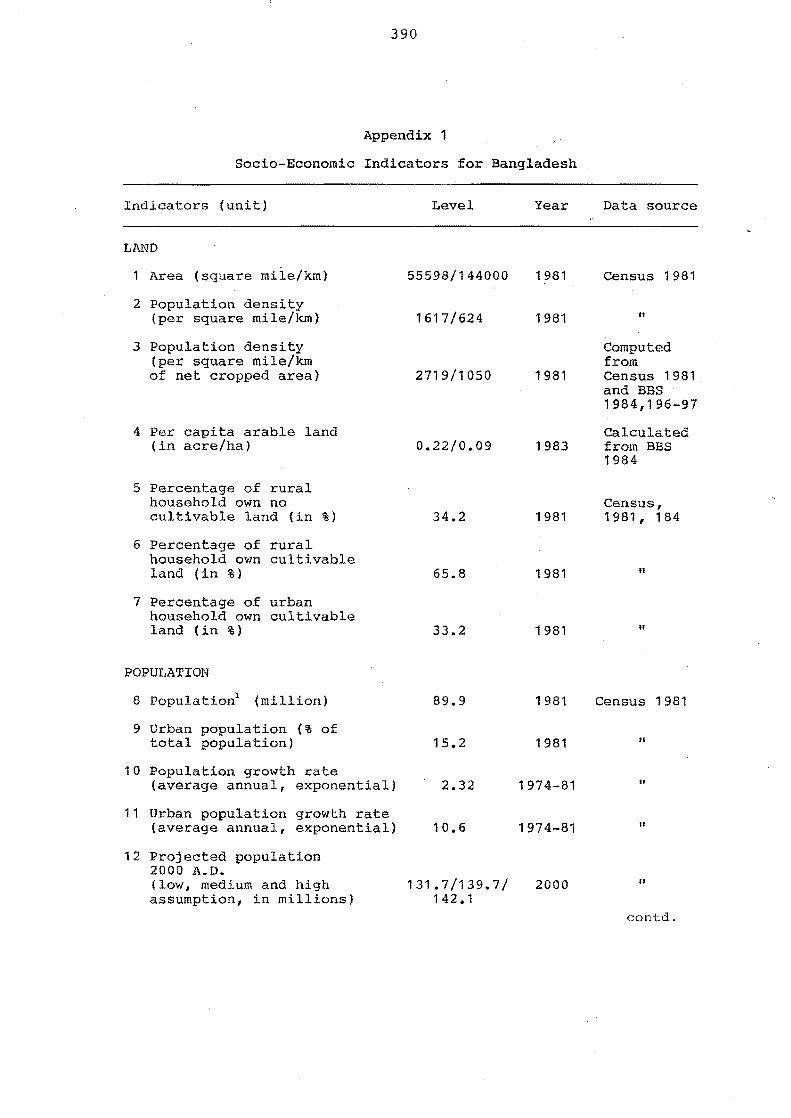
390
Appendix 1
Socio-Economic Indicators for Bangladesh
Indicators (unit)
LAND
Area (square mile/km)
2 Population density (per square mile/km)
3 Population density (per square mile/km of net cropped area)
4 Per capita arable land (in acre/hal
5 Percentage of rural household own no cultivable land (in %)
6 Percentage of rural household own cultivable land (in %)
7 Percentage of urban household own cultivable land (in %)
POPULATION
8 Populationl (million)
9 Urban population (% of total population)
10 Population growth rate (average annual, exponential)
11 Urban population growth rate (average annual, exponential)
12 Projected population 2000 A.D. (low, medium and high assumption, in millions)
Level Year
55598/144000 1981
1617/624 1981
2719/1050 1981
0.22/0.09 1983
34.2 1981
65.8 1981
33.2 1981
89.9 1981
15.2 1981
2.32 1974-81
10.6 1974-81
131.7/139.7/ 2000 142.1
Data source
Census 1981
"
Computed from Census 1981 and BBS 1984,196-97
Calculated from BBS 1984
Census, 1981, 184
"
"
Census 1981
II
II
II
"
contd.
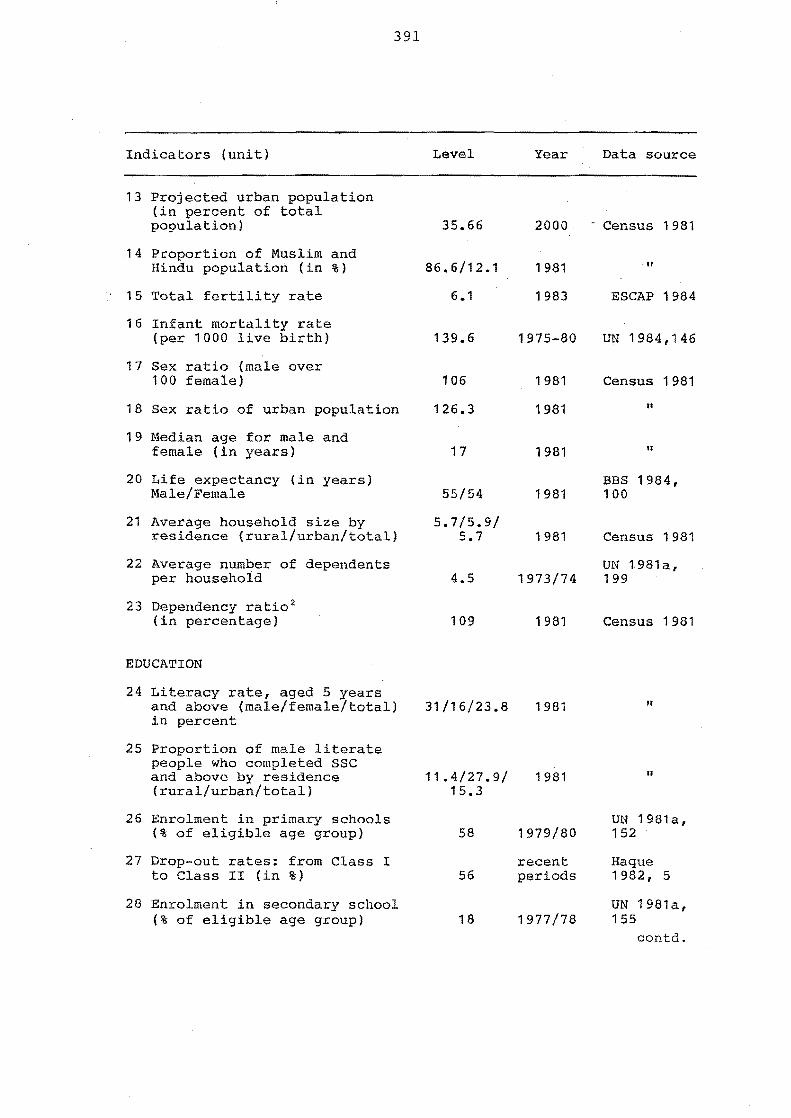
Indicators (unit)
13 Projected urban population (in percent of total population)
14 Proportion of Muslim and Hindu population (in %)
15 Total fertility rate
16 Infant mortality rate (per 1000 live birth)
17 Sex ratio (male over 100 female)
391
18 Sex ratio of urban population
19 Median age for male and female (in years)
20 Life expectancy (in years) Male/Female
21 Average household size by residence (rural/urban/total)
22 Average number of dependents per household
23 Dependency ratio 2
(in percentage)
EDUCATION
24 Literacy rate, aged 5 years and above (male/female/total) in percent
25 Proportion of male literate people who completed SSC and above by residence (rural/urban/total)
26 Enrolment in primary schools (% of eligible age group)
27 Drop-out rates: from Class I to Class II (in %)
28 Enrolment in secondary school (% of eligible age group)
Level
35.66
86.6/12.1
6.1
139.6
106
126.3
17
55/54
5.7/5.9/ 5.7
4.5
109
Year
2000
1981
1983
1975-80
1981
1981
1981
1981
1981
1973/74
1981
31/16/23.8 1981
11.4/27.9/ 1981 15.3
58 1979/80
recent 56 periods
18 1977/78
Data source
- Census 1981
" ESCAP 1984
UN 1984,146
Census 1981
II
" BBS 1984, 100
Census 1981
UN 1981a, 199
Census 1981
"
"
UN 1981a, 152
Haque 1982, 5
UN 1981a, 155
contd.
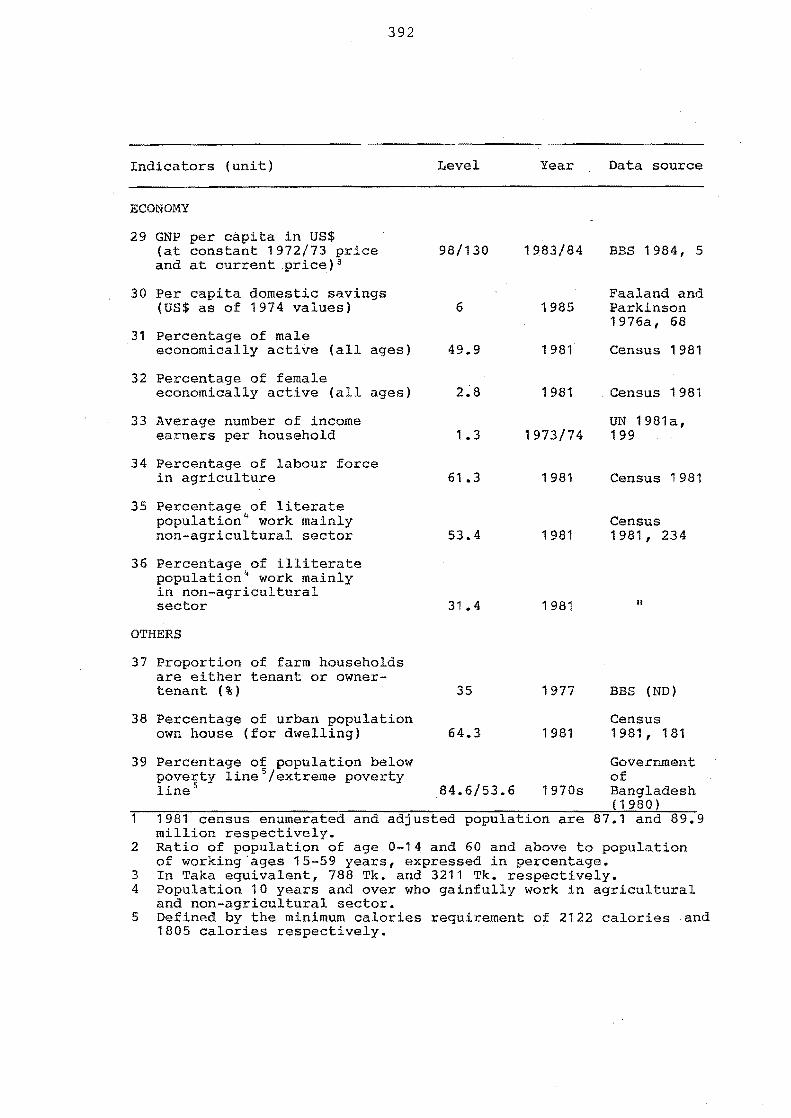
Indicators (unit)
ECONOMY
29 GNP per capita in US$ (at constant 1972/73 price and at current ,price) 3
30 Per capita domestic savings (US$ as of 1974 values)
392
31 Percentage of male economically active (all ages)
32 Percentage of female economically active (all ages)
33 Average number of income earners per household
34 Percentage of labour force in agriculture
35 Percentage of literate population 4 work mainly non-agricultural sector
36 Percentage of illiterate population 4 work mainly in non-agricultural sector
OTHERS
37 Proportion of farm households are either tenant or ownertenant (%)
38 Percentage of urban population own house (for dwelling)
39 Percentage of population below poverty lineS/extreme poverty lineS
Level Year
98/130 1983/84
6 1985
49.9 1981
2.8 1981
1.3 1973/74
61.3 1981
53.4 1981
31.4 1981
35 1977
64.3 1981
84.6/53.6 1970s
1 1981 census enumerated and adjusted population are million respectively.
Data source
BBS 1984, 5
Faaland and Parkinson 1976a, 68
Census 1981
Census 1981
UN 1981a, 199
Census 1981
Census 1981, 234
II
BBS (ND)
Census 1981, 181
Government of Bangladesh (1980 )
87.1 and 89.9
2 Ratio of population of age 0-14 and 60 and above to population of working 'ages 15-59 years, expressed in percentage.
3 4
5
In Taka equivalent, 788 Tk. and 3211 Tk. respectively. Population 10 years and over who gainfully work in agricultural and non-agricultural sector. Defined by the minimum calories requirement of 2122 calories and 1805 calories respectively.
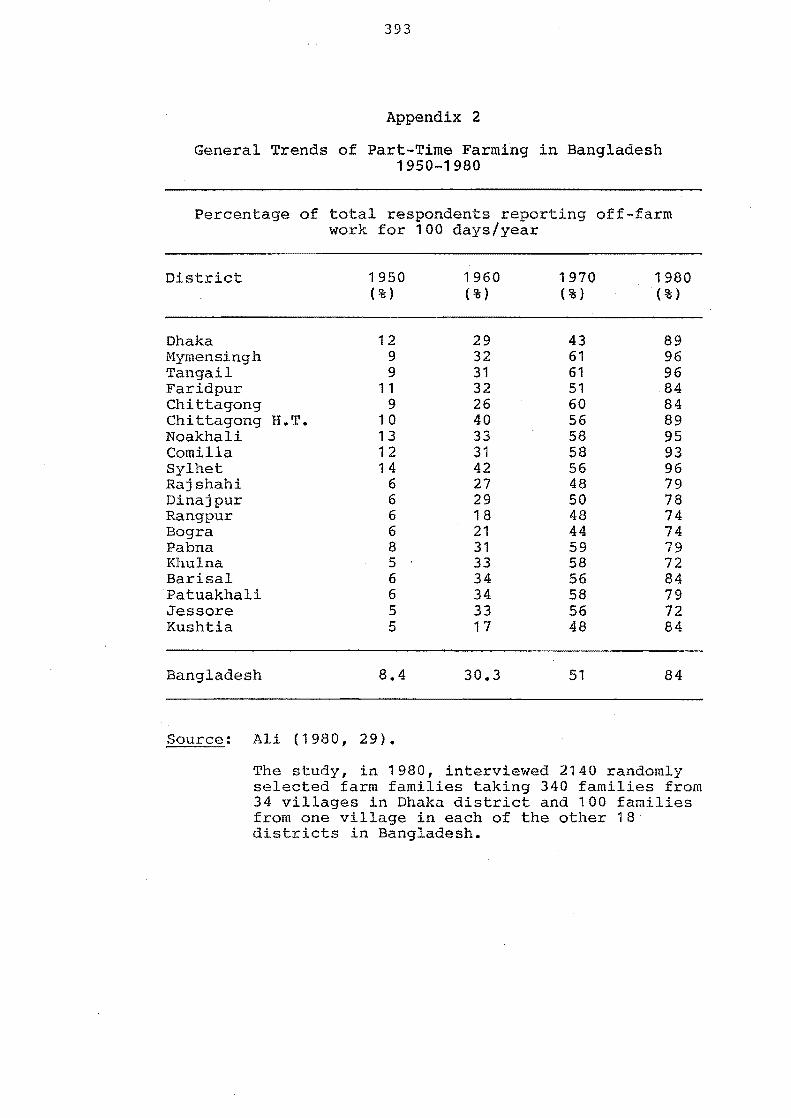
393
Appendix 2
General Trends of Part-Time Farming in Bangladesh 1950-1980
Percentage of total respondents reporting off-farm work for 100 days/year
District 1950 1960 1970 1980 ( % ) (%) (%) (%)
Dhaka 12 29 43 89 Mymensingh 9 32 61 96 Tangail 9 31 61 96 Faridpur 1 1 32 51 84 Chittagong 9 26 60 84 Chittagong H.T. 10 40 56 89 Noakhali 13 33 58 95 Comilla 12 31 58 93 Sylhet 14 42 56 96 Rajshahi 6 27 48 79 Dinajpur 6 29 50 78 Rangpur 6 18 48 74 Bogra 6 21 44 74 Pabna 8 31 59 79 Khulna 5 33 58 72 Barisal 6 34 56 84 Patuakhali 6 34 58 79 Jessore 5 33 56 72 Kushtia 5 17 48 84
Bangladesh 8.4 30.3 51 84
Source: Ali (1980, 29).
The study, in 1980, interviewed 2140 randomly selected farm families taking 340 families from 34 villages in Dhaka district and 100 families from one village in each of the other 18 districts in Bangladesh.
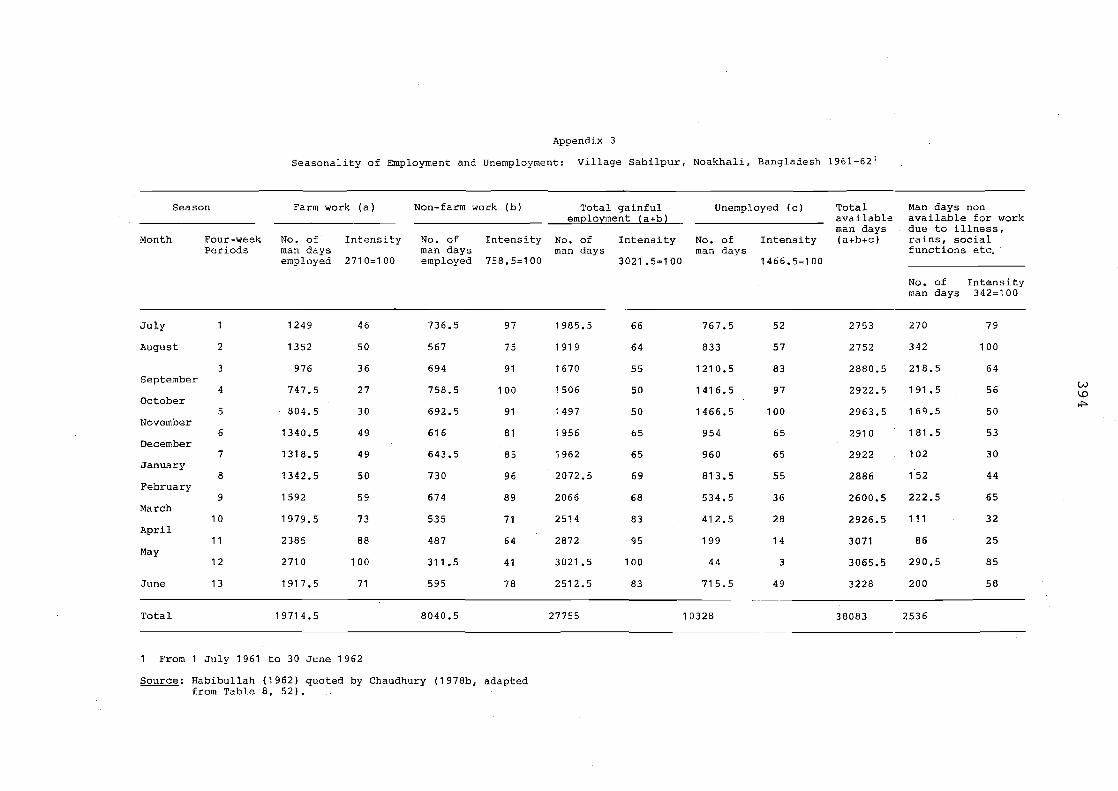
Appendix 3
Seasonality of Employment and Unemployment: Village Sabilpur, Noakhali, Bangladesh 1961-62 1
Season Farm work (a) Non-farm work (b) Total gainful Unemployed (c) Total Man days non emEloyment (a+bl available available for work
man days due to illness, Month Four-week No. of Intensity No. of Intensity No. of Intensity No. of Intensity (a+b+c) rains, social
Periods man days man days man days man days functions etc. employed 2710=100 employed 758.5=100 3021.5=100 1466.5=100
No. of Intensity man days 342=100
July 1249 46 736.5 97 1985.5 66 767.5 52 2753 270 79
August 2 1352 50 567 75 1919 64 833 57 2752 342 100
3 976 36 694 91 1670 55 1210.5 83 2880.5 218.5 64 September
W 4 747.5 27 758.5 100 1506 50 1416.5 97 2922.5 191.5 56
'" October ~ 5 804.5 30 692.5 91 1497 50 1466.5 100 2963.5 169.5 50
November 6 1340.5 49 616 81 1956 65 954 65 2910 181 .5 53
December 7 1318.5 49 643.5 85 1962 65 960 65 2922 102 30
January 8 1342.5 50 730 96 2072.5 69 813.5 55 2886 152 44
February 9 1592 59 674 89 2066 68 534.5 36 2600.5 222.5 65
March 10 1979.5 73 535 71 2514 83 412.5 28 2926.5 111 32
April 11 2385 88 487 64 2872 95 199 14 3071 86 25
May 12 2710 100 311.5 41 3021.5 100 44 3 3065.5 290.5 85
June 13 1917.5 71 595 78 2512.5 83 715.5 49 3228 200 58
Total 19714.5 8040.5 27755 10328 38083 2536
From 1 July 1961 to 30 June 1962
Source: Habibullah (1962) quoted by Chaudhury (1978b, adapted from Table 8, 52) •
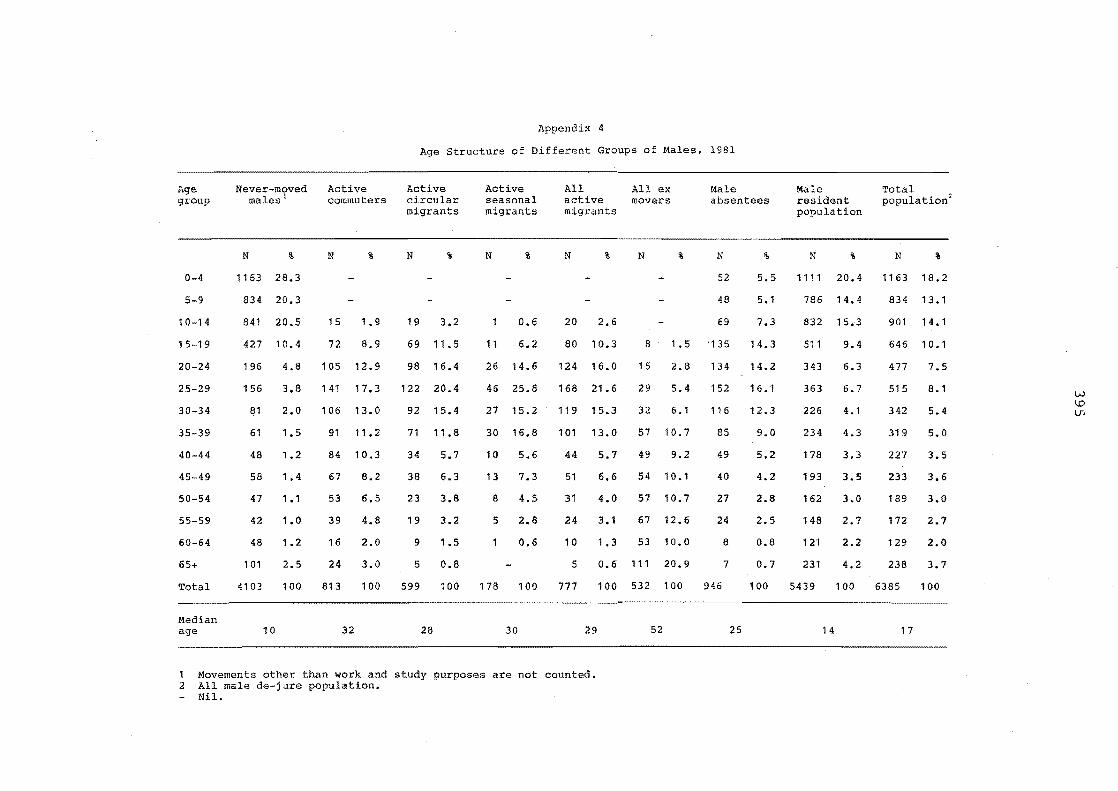
Appendix 4
Age Structure of Different Groups of Males, 1981
Age group
Active Active males comlUuters circular
Active seasonal migrants
All All ex active movers
Male absentees
0-4
5-9
10-14
15-19
20-24
25-29
30-34
35-39
40-44
45-49
50-54
55-59
60-64
65+
Total
Median age
N %
1163 28.3
834 20.3
841 20.5
427 10.4
196 4.8
156
81
61
48
58
47
42
48
101
4103
10
3.8
2.0
1.5
1.2
1.4
1.1
1.0
1.2
2.5
100
N %
15 1.9
72 8.9
10512.9
141 17.3
106 13.0
91 11 .2
84 10.3
67 8.2
53 6.5
39 4.8
16
24
813
32
2.0
3.0
100
migrants
N %
19 3.2
69 11. 5
98 16.4
122 20.4
92 15.4
71 11 .8
34 5.7
38 6.3
23 3,8
19 3,2
9
5
599
28
1.5
0.8
100
N %
0.6
11 6.2
26 14.6
46 25.8
27 15.2
30 16.8
10 5.6
13 7.3
8 4.5
5 2.8
0.6
178 100
30
migrants
N %
20 2.6
80 10.3
124 16.0
168 21 .6
119 15.3
101 13.0
44 5.7
51 6.6
31 4.0
24 3.1
1.3
N % N
52
48
69
8
15
29
32
1.5 '135
2.8 134
5.4
6.1
57 10.7
49 9.2
54 10.1
57 10.7
67 12.6
53 10.0
52
116
85
49
40
27
24
8 10
5
777
0.6 111 20.9
100 532 100
7
946
29 52
1 Movements other than work and study purposes are not counted. 2 All male de-jure population.
Nil.
25
%
5.5
5.1
7.3
14.3
14.2
16.1
12.3
9.0
5.2
4.2
2.8
2.5
0.8
0.7
100
Male Total resident population2
population
N %
1111 20.4
786 14.4
832 15.3
511
343
363
226
234
178
193
162
148
121
231
5439
14
9.4
6.3
6.7
4.1
4.3
3.3
3.5
3.0
2.7
2.2
4.2
100
N %
1163 18.2
834 13.1
901 14.1
646 10.1
477 7,5
515
342
8.1
5.4
319 5.0
227 3.5
233 3.6
189 3.0
172 2.7
129
238
6385
17
2.0
3.7
100
W \..0 U1
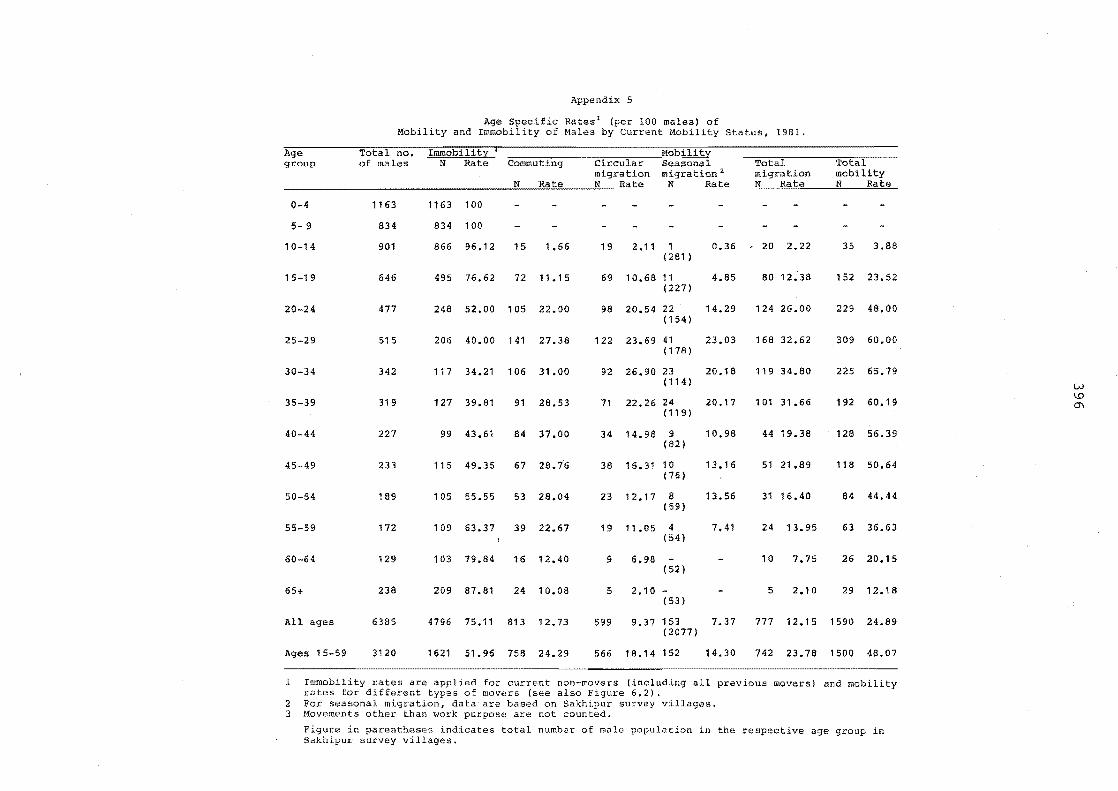
Appendix 5
Mobility
Age Total group of males
migration migration' migration mobility N Rate N Rate N Rate N Rate N Rate
0-4 1163 1163 100
5- 9 834 834 100
10-14 901 866 96.12 15 1.66 19 2.11 1 0.36 20 2.22 35 3.88 (281 )
15-19 646 495 76.62 72 11.15 69 10.68 11 4.85 80 12.38 152 23.52 (227)
20-24 477 248 52.00 105 22.00 98 20.54 22 14.29 124 26.00 229 48.00 (154 )
25-29 515 206 40.00 141 27.38 122 23.69 41 23.03 168 32.62 309 60.00 (178 )
30-34 342 117 34.21 106 31.00 92 26.90 23 20.18 119 34.80 225 65.79 (114 ) w
35-39 319 127 39.81 91 28.53 71 22.26 24 20.17 101 31.66 192 60.19 \J:)
CJ\ (119 )
40-44 227 99 43.61 84 37.00 34 14.98 9 10.98 44 19.38 128 56.39 (82)
45-49 233 115 49.35 67 28.76 38 16.31 10 13.16 51 21.89 118 50.64 (76)
50-54 189 105 55.55 53 28.04 23 12.17 8 13.56 31 16.40 84 44.44 (59)
55-59 172 109 63.37 39 22.67 19 11.05 4 7.41 24 13.95 63 36.63 (54)
60-64 129 103 79.84 16 12.40 9 6.98 10 7.75 26 20.15 (52)
65+ 238 209 87.81 24 10.08 5 2.10 - 5 2.10 29 12.'8 (53)
All ages 6385 4796 75.11 813 12.73 599 9.37 153 7.37 777 12.15 1590 24.89 (2077)
Ages 15-59 3120 1621 51.96 758 24.29 566 18.14 152 14.30 742 23.78 1500 48.07
1 Immobilitv rates are applied for current non-movers (including all previous movers) and mobility types of movers (see also Figure 6.2).
2 For seasonal data are based on Sakhipur survey villages. 3 Movements other work purpose are not counted.
in parentheses indicates total number of male population in the respective age group in survey villages.
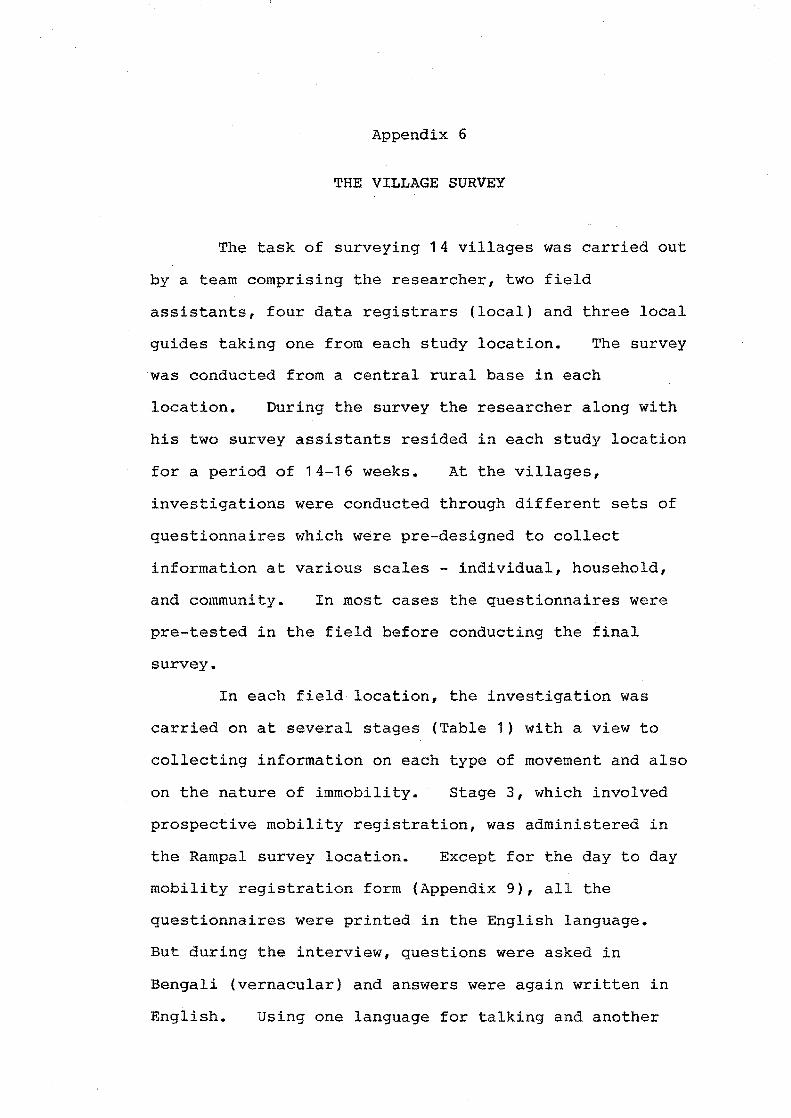
Appendix 6
THE VILLAGE SURVEY
The task of surveying 14 villages was carried out
by a team comprising the researcher, two field
assistants, four data registrars (local) and three local
guides taking one from each study location. The survey
was conducted from a central rural base in each
location. During the survey the researcher along with
his two survey assistants resided in each study location
for a period of 14-16 weeks. At the villages,
investigations were conducted through different sets of
questionnaires which were pre-designed to collect
information at various scales - individual, household,
and community. In most cases the questionnaires were
pre-tested in the field before conducting the final
survey.
In each field location, the investigation was
carried on at several stages (Table 1) with a view to
collecting information on each type of movement and also
on the nature of immobility_ stage 3, which involved
prospective mobility registration, was administered in
the Rampal survey location. Except for the day to day
mobility registration form (Appendix 9), all the
questionnaires were printed in the English language.
But during the interview, questions were asked in
Bengali (vernacular) and answers were again written in
English. Using one language for talking and another
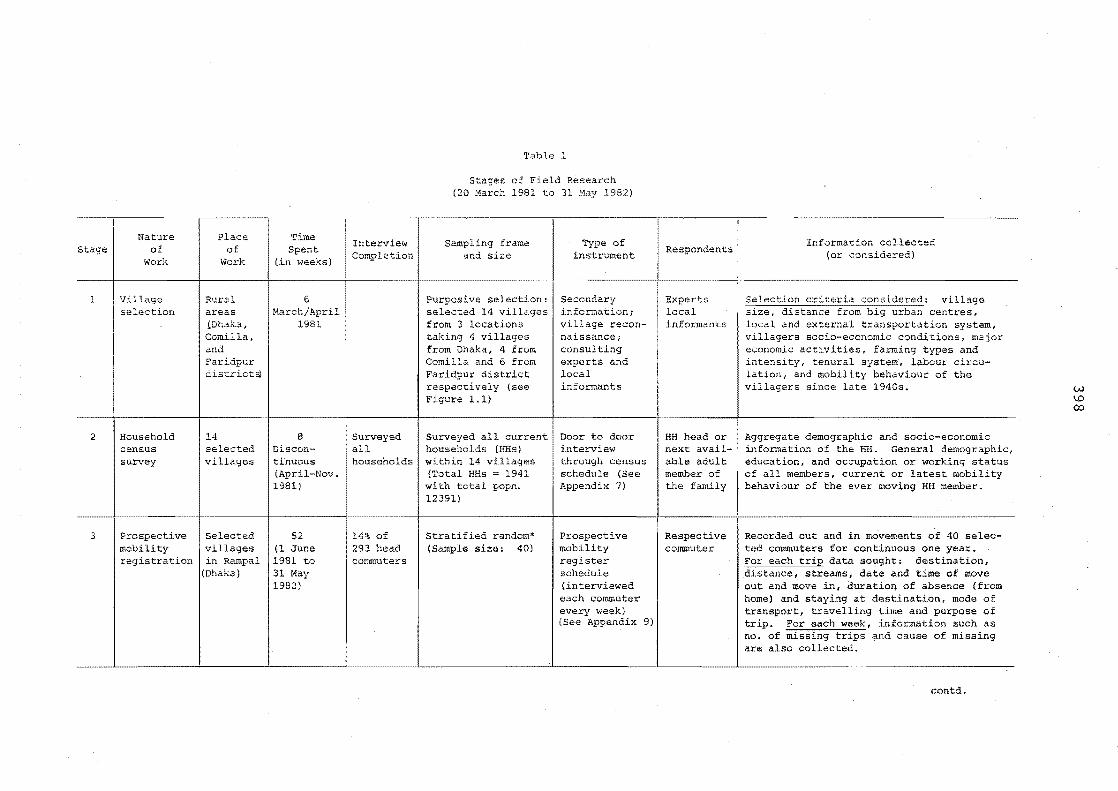
Nature Stage I of
Work
1 I Village
2
3
selection
Household census survey
Prospective mobility registration
Place of
Work
Rural areas (Dhaka, Comilla, and Faridpur districts)
14 selected villages
selected villages in Rampal
I(Dhaka)
Time Spent
(in weeks)
6 March/April
1981
8 Discontinuous (April-Nov. 1981)
52 (1 June 1981 to 31 May 1982)
Interview Completion
Surveyed all households
14% of 293 head commuters
Table 1
Stages of Field Research (20 March 1981 to 31 11ay 1982)
Sampling frame and size
Purposive selection: selected 14 villages from 3 locations taking 4 villages from Dhaka, 4 from Comilla and 6 from Faridpur district respectively (see Figure 1.1)
Surveyed all current households (HHs) within 14 villages (Total HHs 1941 with total popn. 12391)
Stratified random* (Sample size: 40)
Type of instrument
Secondary information; village reconnaissance; consulting experts and local informants
Poor to door interview through census schedule (See Appendix 7)
Prospective mobility register schedule (interviewed each commuter every week) (See Appendix 9)
Respondents
Experts local informants
HH head or next available adult member of the family
Respective commuter
Information collected (or considered)
village centres,
local and external transportation system, villagers socio-economic conditions, major economic activities, farming types and inte!1sity, tenural system, labour circulation, and mobility behaviour of the villagers since late 1940s.
Aggregate demographic and socia-economic information of the RH. General demographic, education, and occupation or working status of all members, current or latest mobility behaviour of the ever moving HH member.
Recorded out and in movements of 40 selected commuters for continuous one year. For each trip data sought. destination, distance, streams, date and time of move out and move in, duration of absence (from home) and staying at destination, mode of transport, travelling time and purpose of trip. For each week, information such as no. of missing trips and cause of missing are also collected.
contd.
W \.0 00

:J Nature of
l'iork
4 I Household
5
6
sooio-economic survey
Interview with stayers
Interview with commuters
Plao,---I Tim, of Spent Work (in weeks)
14 11 selected Discon-villages tinuous
(Hay-Feb. 1981/82)
4 to 5 Discontinuous (JuneFeb. ) 1981/82
Interview Completion
22% of total households
sampling frame and size
Surveyed all sampled stayers, commuters. returnees, and circular migrants households in 14 villages (Total sample: 431) (See Stages 5-8)
25% of I Stratified random* total head I (interviewed only stayers those heads whose
2U of head commuters
RHs had no ever moved member) (Total sample, 120, taking 40 from each survey area)
Stratified random* (interviewed mostly head commuters) (Total sample: 120, 40 from each location)
Type of instrument
Interviewed through HH sQcio-economic schedule (see Appendix 8)
Interviewed through stayer schedule
Interviewed through commuter schedule
Respondents
Respective household head
Respective stayer
Respective commuter
Information collected (or considered)
Housing and accommodation; land and transfer; HH occupation,
earning member, income sources, income, HH assets and belongings;
Tenural status, land operacrop pattern, cropping inten
sity, food self-sufficiency, labour used/ eXChanged/hired;
Attitudes and opinions of head.
Family information, Education, occupation, tenural status and mobility behaviour of parents, sibs, and sons; Personal inquiries: Position among sibs; education, marital information, income and employment characteristics, indoor/outdoor working time, motive behind staying back to the village, social networks, opinions and attitudes of different issues on family life and community life.
Family information: Same as collected for stayers (Stage 5) Personal inquiries, position among sibs, education, marital information, detail economic and working situation, partial life history survey, detail nature of commuting and motive behind commuting, opinions and attitudes of different issues.
contd.
W 1..0 \.0
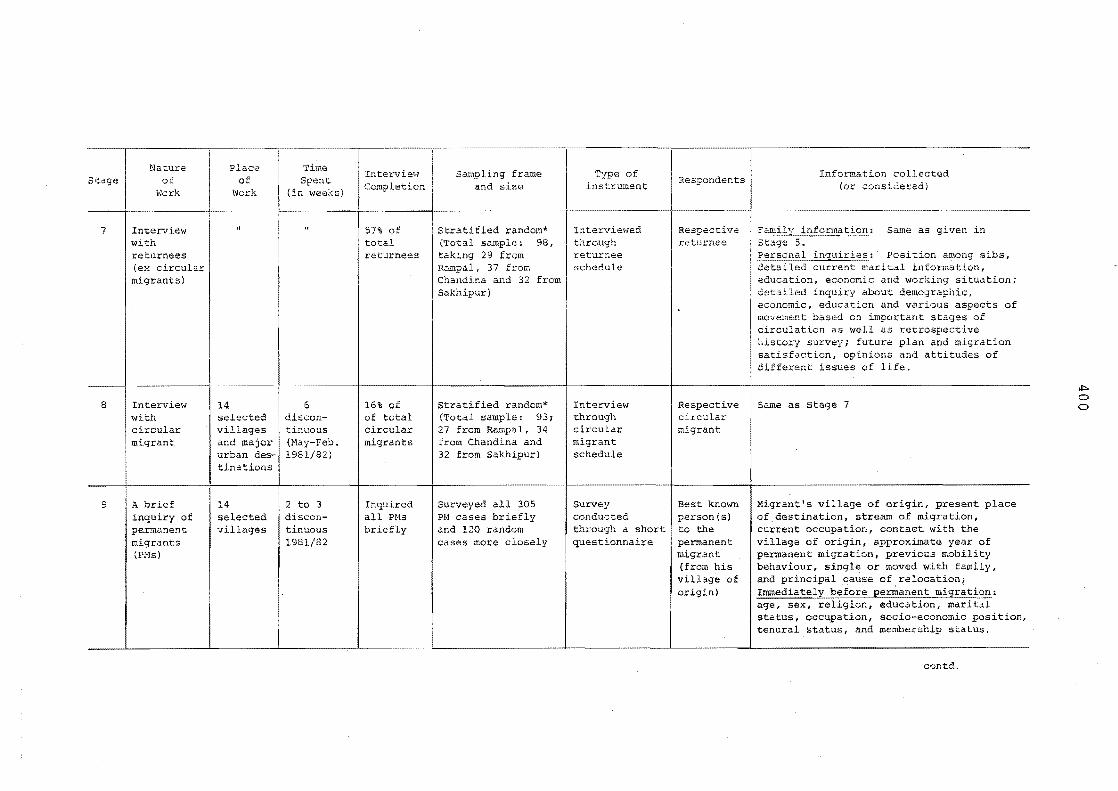
Nature Stage I of
Wcrk
7 I Interview with returnees (ex circular migrants)
---+ ------j 8 I Intervimv
with circular migrant
9 I A brief inquiry of permanent migrants (PMs)
14
Place of
Work
selected villages and major urban des-tinations
14 selected villages
Time spent
(in weeks)
6 discon-tinuous (May-Feb. 1981/82)
2 to 3 discon-tinuous 1981/82
Interview Completion
57% of total returnees
16% of of total circular migrants
Inquired all PMs briefly
Sampling frame and size
Stratified random* (Total sa~ple: 98, taking 29 from Rampal, 37 from Chand ina and 32 from Sakhipur)
Stratified random* (Total sample: 93; 27 from Rampal, 34 from Chandina and 32 from Sakhipur)
Surveyed all 305 PM cases briefly and 120 random cases more closely
Type of instrument
Interviel'led through returnee schedule
lntervie\<l through circular migrant schedule
survey conducted through a short questionnaire
Respondents
Respective returnee
Respective circular migrant
Best known person(s) to the permanent migrant (from his village of origin)
Information collected (or considered)
Same as given in
Position among sibs, current marital information,
education, economic and working situation; detailed inquiry about demographic, economic, education and various aspects of movement based on important stages of circulation as well as retrospective history survey; future plan and migration satisfaction, opinions and attitudes of different issues of life.
Same as stage 7
Migrant's village of origin, present place of destination, stream of migration, current occupation, contact with the village of origin, approximate year of permanent migration, previous mobility behaviour, single or moved with family, and principal cause of relocation;
age, sex, status, occupation, socio-economic position, tenural status, and membership status.
contd.
oJ:::. o o
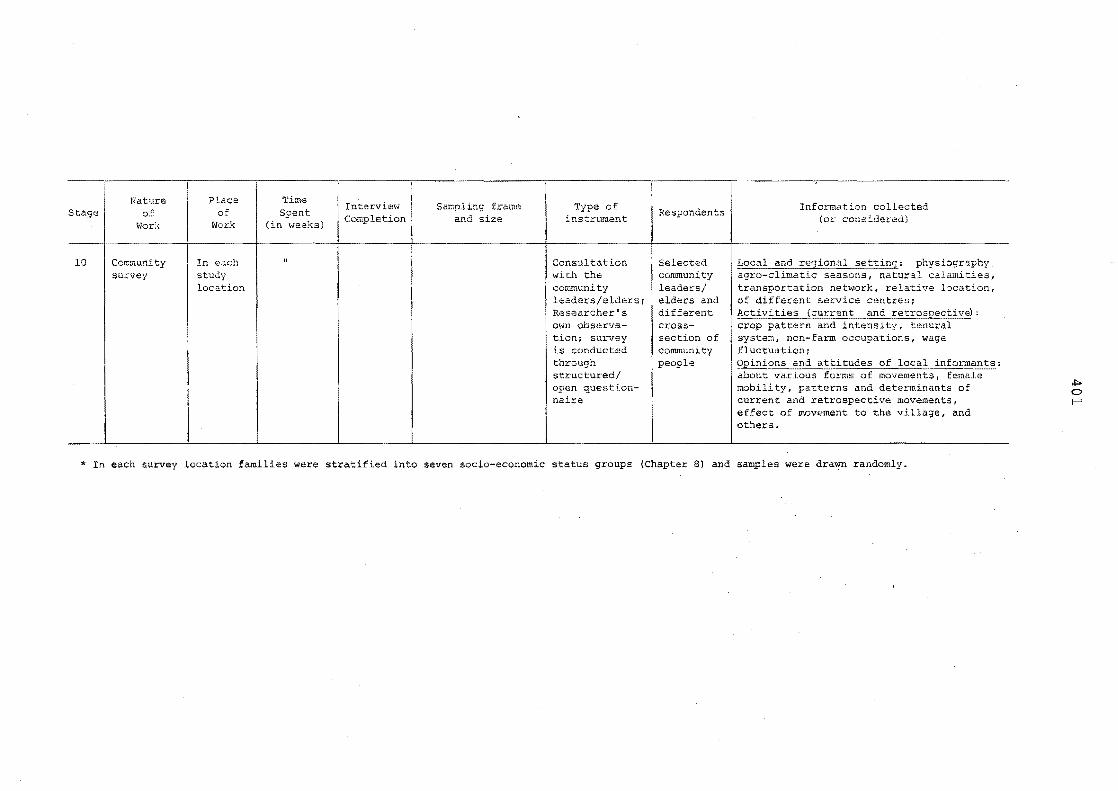
Nature Place Time Intervie~" Sampling frame Type of Information collected
of of Spent Respondents Work I~ork (in weeks) Completion and size instrument (or considered)
-10 Community In each " Consultation Selected L,
survey study with the community seasons, location community leaders/ transportation network, relative location,
leaders/elders; elders and of different service centres; Researcher's different A,
own observa- cross- e tion; survey section of system, non-farm occupations, wage is conducted community fluctuation; through people 0 structured/ a: open question- mobility, patterns and of naire current and retrospective movements,
effect of movement to the villa-ge, and others.
--~~---
* In each survey location families were stratified into seven socio-economic status groups (Chapter 8) and samples were drawn randomly_
,j:::.
o i--'

402
for writing did not cause any problems in the field
because a large proportion of the respondents were
illiterate and most of the interviews were conducted by
the researcher himself.
Two assistants were given training for helping
the researcher during the household census survey as
well as for doing some basic clerical tasks such as
processing and coding of data from census schedules and
supervising four data registrars.
Local guides, on the other hand, were employed to
accelerate the whole process of surveying and they
indirectly helped in many ways - introducing us
(researcher and his assistants) from door to door;
preparing interview appointments with village people
(resident or non-residents i.e. village out-migrants);
keeping an eye on the time when the non-resident members
corne horne for visiting so that we could interview them
directly in the village; and helping the interviewee to
remember past events. Furthermore, the presence of a
local guide during the interview seems to be important,
especially when some respondents intend to hide or
hesitate to give correct answers, particularly those
replies corresponding to economic matters such as
landownership, means of income, crop production etc.
It is not uncommon for respondents to give false
information in a situation when an unknown investigator
from an urban area appears in a village and, after a
short introduction, starts questioning people (Van
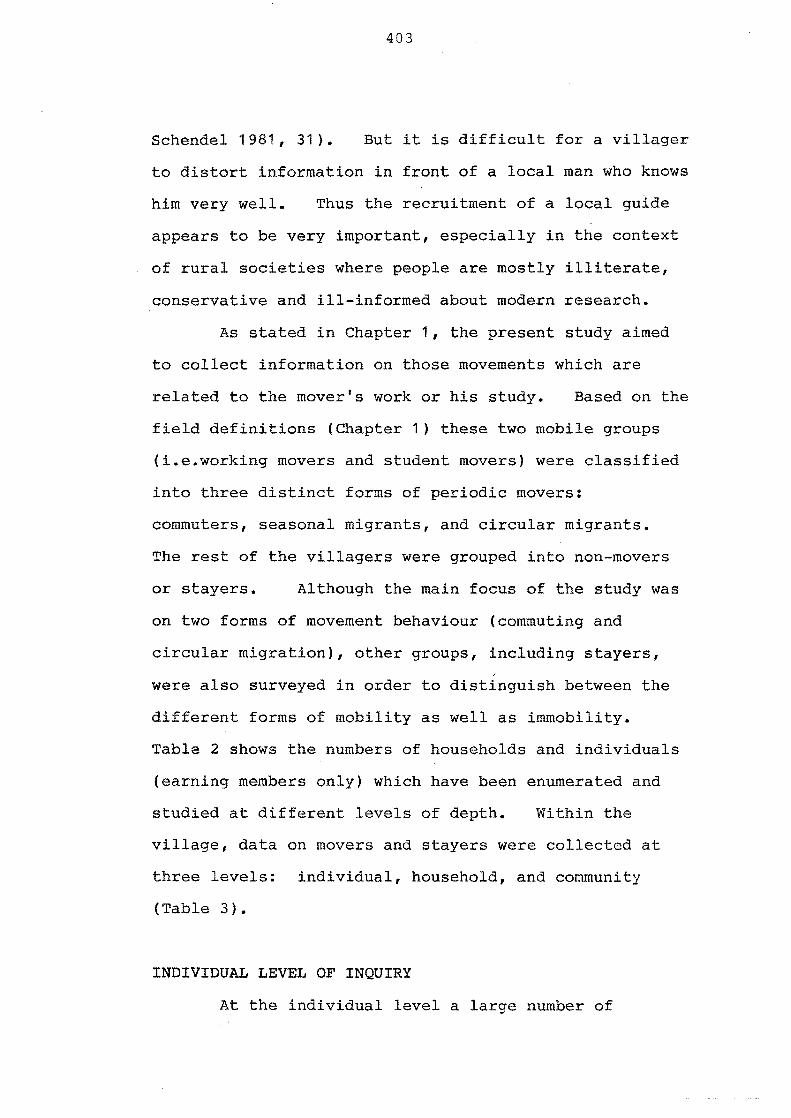
403
Schendel 1981,31). But it is difficult for a villager
to distort information in front of a local man who knows
him very well. Thus the recruitment of a local guide
appears to be very important, especially in the context
of rural societies where people are mostly illiterate,
conservative and ill-informed about modern research.
As stated in Chapter 1, the present study aimed
to collect information on those movements which are
related to the mover's work or his study. Based on the
field definitions (Chapter 1) these two mobile groups
(i.e.working movers and student movers) were classified
into three distinct forms of periodic movers:
commuters, seasonal migrants, and circular migrants.
The rest of the villagers were grouped into non-movers
or stayers. Although the main focus of the study was
on two forms of movement behaviour (commuting and
circular migration), other groups, including stayers, ,
were also surveyed in order to distinguish between the
different forms of mobility as well as immobility.
Table 2 shows the numbers of households and individuals
(earning members only) which have been enumerated and
studied at different levels of depth. Within the
village, data on movers and stayers were collected at
three levels: individual, household, and community
(Table 3).
INDIVIDUAL LEVEL OF INQUIRY
At the individual level a large number of
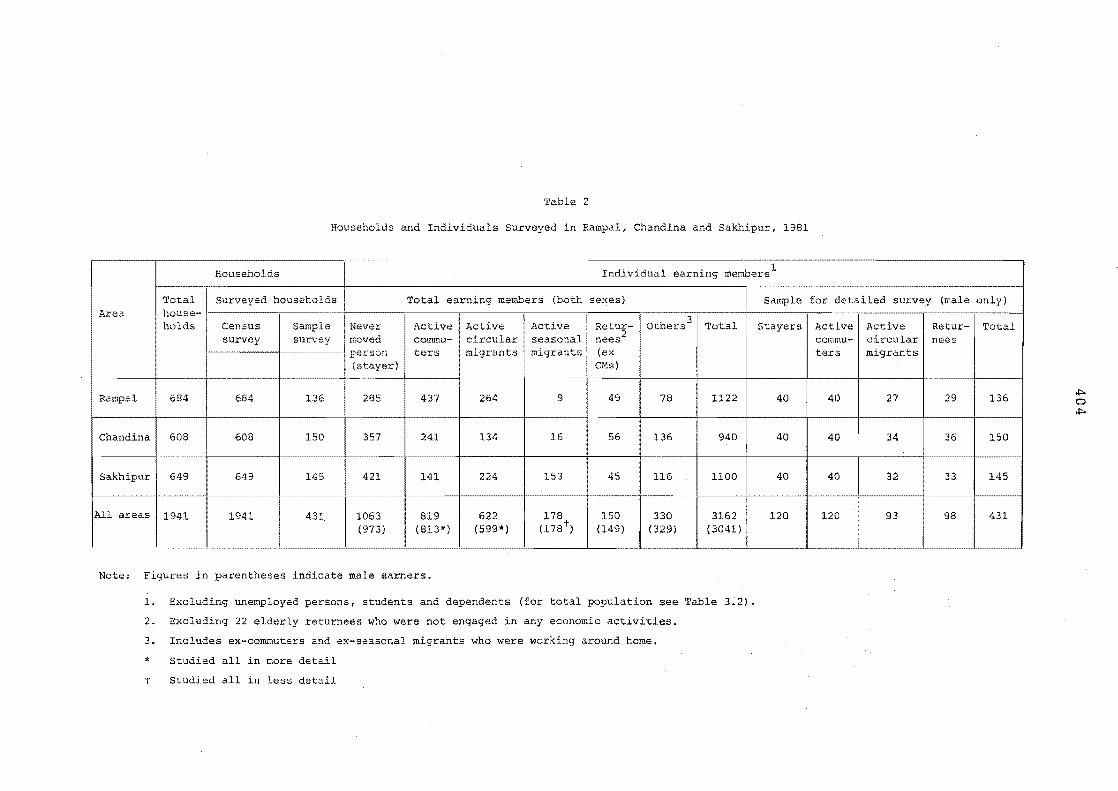
Table 2
Households and Individuals Surveyed in Rampal, Chandina and Sakhipur, 1981
Households Individual earning members 1
Total Surveyed households Total earning members (both sexes) I
Sample for detailed survey (male only) Area house-
3 holds Census Sample Never Active Active ' I Others Total ActLve I Retu5-survey survey moved commu- circular
""a"onal 1M"" person ters migrants migrants (ex (stayer) eMs)
Rampal 684 684 136 285 437 264 9 49 78 1122
Chandina 608 608 150 357 241 134 16 56 136 940
Sakhipur 649 649 145 421 141 224 153 I 45 116 1100
All areas 1941 1941 431, 1063 819 622 178 150 330 3162 (973) (813*) (599*) (178 t ) (149) (329) (3041)
"-------------------- ----
Note: Figures in parentheses indicate male earners.
1. Excluding unemployed persons, students and dependents (for total popUlation see Table 3.2).
2. Excluding 22 elderly returnees who were not engaged in any economic activities.
3. Includes ex-commuters and ex-seasonal migrants who were working around horne.
* Studied all in more detail
t Studied all in less detail
Stayers Active Active Retur- Total commu- circular nees ters migrants
40 40 27 29 136
40 40 34 36 150
40 40 32 33 145
120 120 93 98 431 I
I I
..,. o ..,.
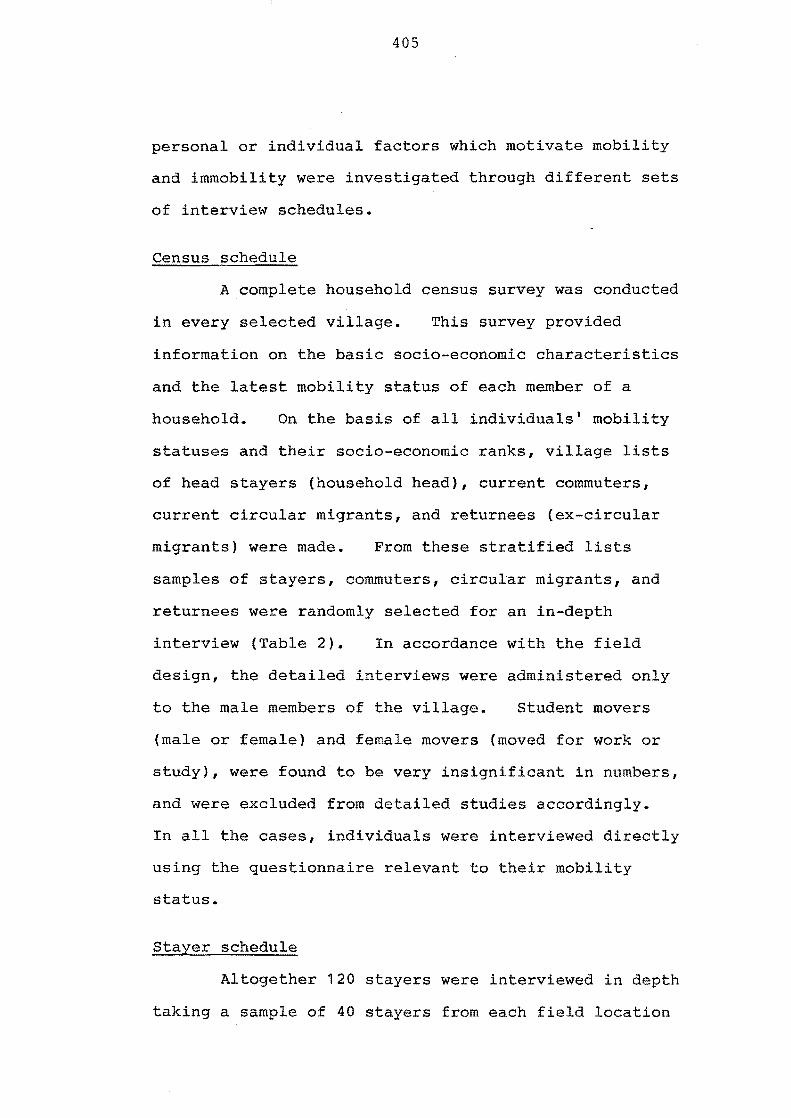
405
personal or individual factors which motivate mobility
and immobility were investigated through different sets
of interview schedules.
Census schedule
A complete household census survey was conducted
in every selected village. This survey provided
information on the basic socio-economic characteristics
and the latest mobility status of each member of a
household. On the basis of all individuals· mobility
statuses and their socio-economic ranks, village lists
of head stayers (household head), current commuters,
current circular migrants, and returnees (ex-circular
migrants) were made. From these stratified lists
samples of stayers, commuters, circular migrants, and
returnees were randomly selected for an in-depth
interview (Table 2). In accordance with the field
design, the detailed interviews were administered only
to the male members of the village. Student movers
(male or female) and female movers (moved for work or
study), were found to be very insignificant in numbers,
and were excluded from detailed studies accordingly.
In all the cases, individuals were interviewed directly
using the questionnaire relevant to their mobility
status.
stayer schedule
Altogether 120 stayers were interviewed in depth
taking a sample of 40 stayers from each field location
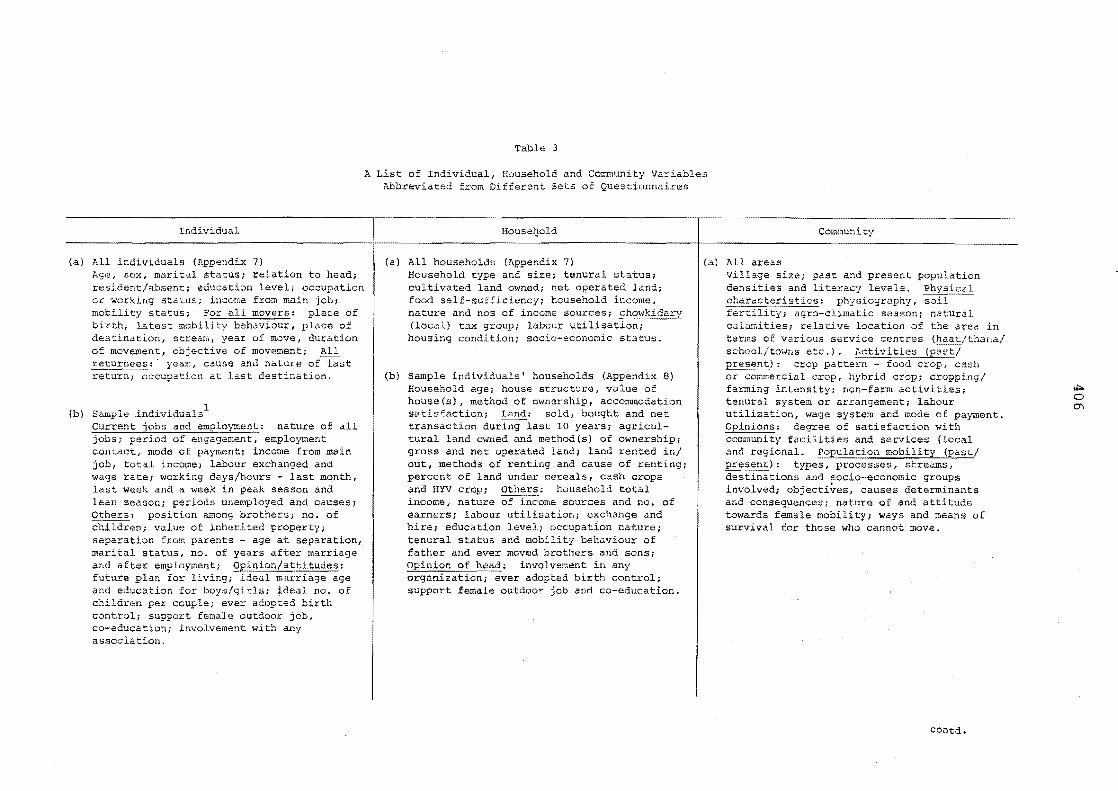
Individual
(a) All individuals (Appendix 7) Age, sex, marital status; relation to head; resident/absent; education level; occupation or working status; income from main job; mobility status; For all movers: place of birth; latest mobility behaviour, place of destination, stream, year of move, duration of movement, objective of movement; All returnees:· year, cause and nature of last return; occupation at last destination.
(b) Saruple .individualsl
Current jobs and employment: nature of all jobs; period of engagement, employment contact, mode of payment; income from main job, total income; labour exchanged and wage rate; working days/hours - last month, last week and a week in peak season and lean season; periods unemployed and causes; Others: position among brothers; no. of children; value of inherited property; separation from parents - age at separation, marital status, no. of years after marriage and after employment; future plan for living; and education for boys/girls; ideal no. children per couple; ever adopted birth control; support female outdoor job, co-education; involvement with any association.
Table 3
A List of Individual, Household and Community Variables Abbreviated from Different Sets of Questionnaires
Housel:!old Community
(a) All households (Appendix 7) (al All areas Household type and size; tenural status; cultivated land owned; net operated land; food self-sufficiency; household income, nature and nos of income sources; (local) tax group; labour housing condition; socio-economic status.
(b) Sample individuals' households (Appendix 8) Household age; house structure, value of house(s), method of ownership, accommodation satisfaction; Land: sold, bought and net transaction during last 10 years; agricultural land owned and methodes) of ownership; gross and net operated land; land rented in/ out, methods of renting and cause of renting; percent of land under cereals, cash crops and HYV crop; Others: household total income, nature of income sources and no. of earners; labour utilisation; exchange and hire; education level; occupation nature; tenural status and mobility behaviour of father and ever moved brothers and sons; Opinion of head: involvement in any organiZation; ever adopted birth control; support female outdoor job and co-education.
Village size; past and present population densities and literacy levels. Physical
physiography, soil agra-climatic season; natural
calamities; relative location of the area in terms of various service centres school/towns etc.). present): crop pattern -or co~ercial crop, hybrid crop; cropping/ farming intensity; non-farm activities; tenural system or arrangement; labour utilization, wage system and mode of payment. Opinions; degree of satisfaction with community facilities and services (local and regional. Population mobility (past/ present): types, processes, streams, destinations and socio-economic groups involved; objecti~es, causes determinants and consequences; nature of and attitude towards female mobility; ways and means of survival for those who cannot move.
contd.
"'" o 0'1
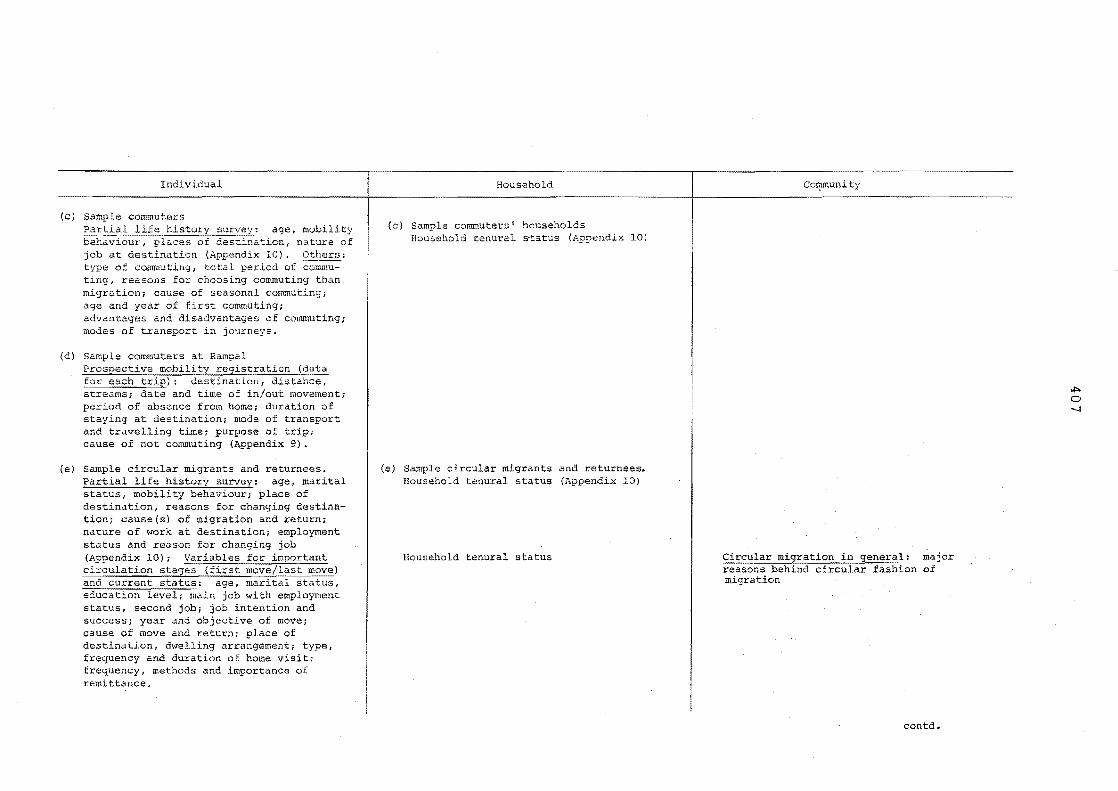
Individual
(c) Sample commuters
job at destination (Appendix 10). type of commuting, total period of commuting, reasons for choosing commuting than migration; cause of seasonal commuting; age and year of first commuting; advantages and disadvantages of commuting; modes of transport in journeys.
(d) Sample commuters at Rampal
streams; period of absence from home; staying at destination; mode of transport and travelling time; purpose of trip; cause of not commuting (Appendix 9) •
(e) Sample circular migrants and returnees. Partial life history survey: age, marital status, mobility behaviour; place of destination, reasons for changing destination; cause(s) of migration and return; nature of work at destination; employment status and reason for changing job (Appendix 10); Variables for important circulation stages (first move/last move) and current status: age, marital status, education level; main job with employment status, second job; job intention and success; year and objective of move; cause of move and return; place of destination, dwelling arrangement; type, frequency and duration of home visit; frequency, methods and importance of remittance.
Household
(e) Sample commuters' households Household tenural status (l'.ppendix 10)
(e) Sample circular migrants and returnees. Household tenural status (Appendix 10)
Household tenural status
Coqununity
Circular migration in general: major reasons behind circular fashion of migration
contd.
H::. o --J
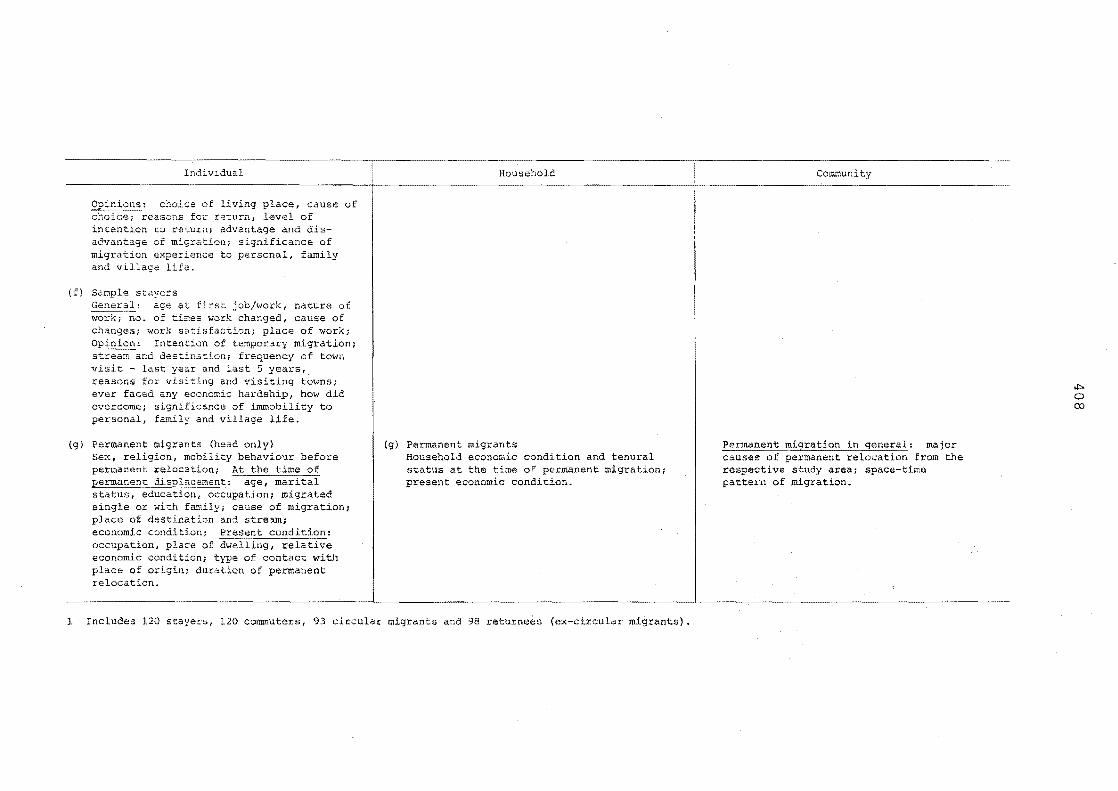
Individual
c;lOice of living place, cause of reasons far return, level of
intention to return; advantage and disadvantage of migration; significance of migration experience to personal, family and village life.
(f) Sample stayers age at first job/work, nature of
; no. of times work changed, cause of changes; wark satisfact:ian; place of work;
Intention of temporary migration; stream and destination; frequency of town visit - last year and last 5 years,. reasons for visiting and visiting towns; ever faced any economic hardship, how did overcome; significance of immobility to personal, family and village life.
(g) Permanent migrants (head only) Sex, religion, mobility behaviour before
relocation;
occupation; migrated single or with family; cause of migration; place of destination and stream; economic condition; occupation, place of economic condition; type of contact with place of origin; duration of permanent relocation.
Household
(g) Permanent migrants Household economic condition and tenural status at the time of permanent migration; present economic condition.
1 Includes 120 stayers, 120 commuters, 93 circular migrants and 98 returnees (ex-circular migrants).
Community
major from the
space-time
*" o 00
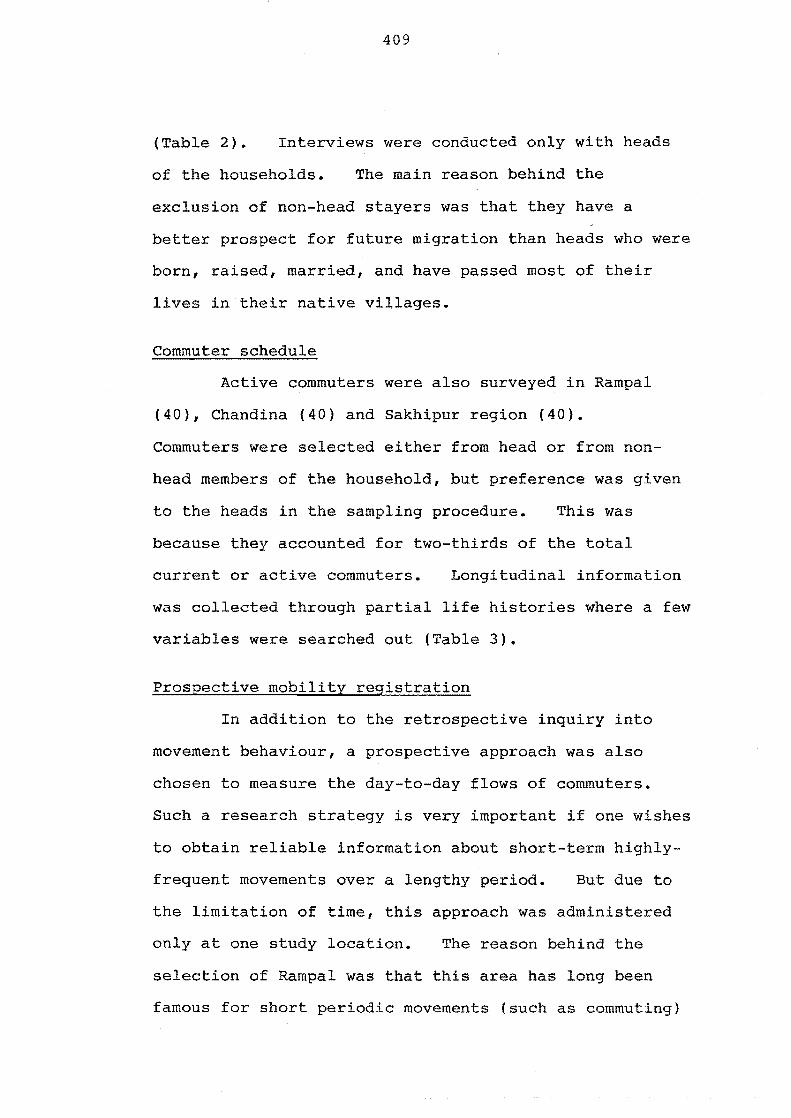
409
(Table 2). Interviews were conducted only with heads
of the households. The main reason behind the
exclusion of non-head stayers was that they have a
better prospect for future migration than heads who were
born, raised, married, and have passed most of their
lives in their native villages.
Commuter schedule
Active commuters were also surveyed in Rampal
(40), Chandina (40) and Sakhipur region (40).
Commuters were selected either from head or from non
head members of the household, but preference was given
to the heads in the sampling procedure. This was
because they accounted for two-thirds of the total
current or active commuters. Longitudinal information
was collected through partial life histories where a few
variables were searched out (Table 3).
Prospective mobility registration
In addition to the retrospective inquiry into
movement behaviour, a prospective approach was also
chosen to measure the day-to-day flows of commuters.
Such a research strategy is very important if one wishes
to obtain reliable information about short-term highly
frequent movements over a lengthy period. But due to
the limitation of time, this approach was administered
only at one study location. The reason behind the
selection of Rampal was that this area has long been
famous for short periodic movements (such as commuting)
410
and it is also well placed within the daily commuting
zone of the capital. Using the prospective mobility
registration approach, data on daily movements of 40
selected commuters were obtained (Table 1, Appendix 9).
A total of 8651 trips (daily, bi-weekly and weekly) were
recorded covering a 12 month period from 1st June 1981
to 31st May 1982. Initially the plan was for 8 months
registration, but the programme was extended up to 12
months with a view to covering seasonal variations in
movement behaviour.
Under close supervision, the registration system
was managed by four registrars (college students)
recruited from each of the study villages. Each
registrar was given the responsibility of recording
movements of 10 commuters and he met every commuter once
a week to record his movements (or cause of not moving)
over the previous week. The supervisor, either the
researcher or a field assistant, visited each registrar
once a fortnight. He collected completed forms from
the registrars and also met some of the commuters and
cross-checked their movements.
Circular migrant and returnee schedules
These two groups of respondents basically have
one common mobility form - circular migration. The
only difference is that the circular migrants have an
intention to return to a rural home in the future;
while the returnees have recently returned to their
village home for permanent or quasi-permanent residence.
411
In fact, the returnees are ex-circular migrants.
Although separate schedules were administered for
circular migrants and returnees, data on a large number
of common individual variables (Table 3) were collected
through a common set of partial life history surveys
(Appendix 10) and a simple module for examining
migration by stages.
In the life history survey, migrants and
returnees were asked twice to recall their mobility
history; firstly, since 1947 when the Indian sub
continent was divided, and secondly, from 1971 when
Bangladesh (then East Pakistan) was separated from
Pakistan. In the first recollection of histories, a
few variables such as age, occupation, type of
movements, and destination place were broadly examined
over the past three decades. In the second case, the
number of variables was increased to obtain some
detailed histories of migration over the 1970s (Appendix
10).
During the interview, accuracy and reliability of
past information was assessed through reference to
notable events of the respondent's past life as well as
through local and national events. Some measures were
also adopted when migrants and returnees were asked to
give more information on important stages of their
circulation, such as first move in life, last move,
conditions before last return, and current situation.
This alternative approach of examining migration by
412
stages is important where multiple returns (not in the
sense of visit) is commonly practised by the
circulators.
Within the available time for this stage of the
research we investigated 93 circular migrants (16
percent of total 599 male active CMs) and 98 returnees
(57 percent of all returnees). The samples were taken
from both head and non-head members of the households.
From the sample list, the migrants were mostly
interviewed directly in their village of origin, at the
time when they had come to visit home within our 3-4
months period of staying at each field location. A few
of them were also interviewed in Dhaka and Narayangonj
urban destinations.
Permanent migrant schedules
During our field stay at the villages, a short
investigation on permanent migrants from the sample
villages was also undertaken. The main objective was
to distinguish between the two processes of population
movement - permanent migration and non-permanent
circulation. Data were mainly collected from the
relatives of the permanent migrants. We defined
permanent relocation as full commitment to life in the
place of destination and according to this definition
there were 305 permanent relocations recorded in the 14
survey villages. Most of these cases (264 out of 305)
involved the displacement of families rather than
individuals (see Chapter 3).
413
HOUSEHOLD LEVEL OF INQUIRY
Social researchers very often consider the
household as the primary sampling unit for collecting a
wide range of demographic, economic, social and cultural
information. A large number of factors which are
linked with an individual's motives for mobility or
immobility in fact originate from his/her household or
family background. For the purpose of the present
study, a 'household' is operationally defined as a
socio-economic unit consisting of all persons related
either by blood or marriage who usually live together in
a particular village of residence within the study area,
and have common house-keeping arrangements. They also
normally take food from a common kitchen except when
temporarily living outside the household (e.g. migrant
members). In addition, permanently resident unrelated
persons (such as domestic servants, orphans and foster
children), having no other households that they may
claim to belong to, are also included as members of the
household. A person living alone is considered as a
one-person household for statistical purposes.
Household data were collected through a door-to
door census survey (Appendix 7) and a detailed socio
economic survey (Appendix 8) of a sample of 431
households (22 percent of the total 1941 households).
The latter inquiry includes all households in our
individual case studies (described in the previous
section) - i.e. 120 stayers, 120 commuters, 93 circular

414
migrants, and 98 returnees. The census survey obtained
some aggregate socio-economic data on each household
within the 14 villages, whereas the detailed household
investigation collected more information on socio
economic aspects as well as some other variables (Table
3). Besides census and household surveys, some
information on education, occupation, tenural status and
mobility behaviour of fathers, brothers and sons of
individual respondents (movers or stayers) was also
collected from individual schedules (stages 5 to 8,
Table 1).
The most difficult task when collecting
household-level data in rural Bangladesh (or elsewhere
in a similar village situation) is to arrive at an
accurate estimate of household income. Perhaps this
could be the most likely reason why many researchers,
who have thoroughly studied the socio-economic condition
of village households (notably Van Schendel 1981,
Jansen 1983, Arens and Van Beurden 1977, Hartmann and
Boyce 1983, and Cain 1978)did not undertake the
arduous task of calculating household income. In
Chapters 7 and 8 (sections 7.4 and 8.3) the complexity
of measuring income in village societies where most
families are involved in farm and off-farm economic
pursuits, and receive income in cash as well as in kind,
is explained.
The income from land is not a simple function of
the amount of land owned or controlled by a family. It
415
varies from region to region, year to year and one
household to another depending on a number of factors,
notably the quality or fertility of land, cultivation
skills, choice of crop and above all the weather factor.
A large proportion of rural households also derive at
least part of their annual income from irregular or
changeable income sources (e.g. casual wage work,
vending small articles in the markets and making
handicrafts). Here a brief explanation of the
procedure that was applied in the field for estimating
household income is given.
To unravel the complicated income issue the first
step was to hold separate meetings with community
people, different occupation groups and members of poor
families who very often had no fixed or regular income
sources. In those gatherings we discussed, along with
other things, the process and pattern of economic
activities: specifically the wage rates, its
fluctuation and payment system; the calendar of working
days for different groups of earning people in and
outside the farm; the price of agricultural products;
and the nature of various sources of income at different
socio-economic levels of rural households. These prior
investigations and consultations with different groups
of village people were essential for the measurement and
evaluation of household income.
Secondly, we copied a list of village households
from the village union council office. This included
416
the name of the head of each household, the number of
household members and the amount of chowkidary tax
(village local tax based on the economic condition of
each family) paid by the household. The latter
information was very important and useful to us as it
provided, in advance, an assessment of the relative
economic position of all households. We also added
some more information (e.g. land, occupation and income
sources) to that list with the help of the local guide
and other active informants.
Finally, by the time we came to a house to
conduct the interview with the household head, we had
some background information on the household's economic
position which helped us to evaluate the respondent's
answers and to arrive at a reasonable estimate of
household income. The direct and indirect help
rendered by the local guide as mentioned at the
beginning of this appendix was of incalculable value,
particularly with regard to measuring household income
and socio-economic status. The procedure employed to
measure socio-economic status of rural households
has been explained in Chapter 8.
COMMUNITY LEVEL INQUIRY
In addition to exploration of individual and
household factors, an examination of mobility and
immobility behaviour of working people from a village
community also requires an inquiry into those factors
417
which are linked to the community itself. At this
level of our field investigation, we examined various
community characteristics, physical and non-physical
(see Table 3), in the three selected rural areas.
Information was obtained by surveying available
literature as well as using empirical field techniques
such as close observation and direct interviews of
different cross-sections of rural people, notably
village leaders, elders, major occupation groups, and a
few other peer groups. The interviews were conducted
using structured and unstructured questionnaires.
In each location a common approach was followed.
First, on arrival at the survey site a discussion with
informants was followed by a general meeting where both
informants and common people were invited. In that
meeting we aimed (i) to introduce our mission to the
villagers, (ii) to gather a range of information through
a community questionnaire, and (iii) to explore the
nature of mobility behaviour of household earning
members from different socio-economic statuses.
Second, a number of group-interviews with important
occupation groups were held with a view to understanding
the relationship between mobility behaviour and various
economic activities of the villagers. In the study
villages at Rampal, we arranged meetings with vegetable
pedlars and portersj at Chandina with rickshaw pullers,
weavers and a wide range of haat-bound rural commuters.
In the Sakhipur field location, we interviewed a group
418
of commuters who were mostly engaged in the buying and
selling of goats and a few peer groups of seasonal
migrants such as fishermen and brickfield labourers.
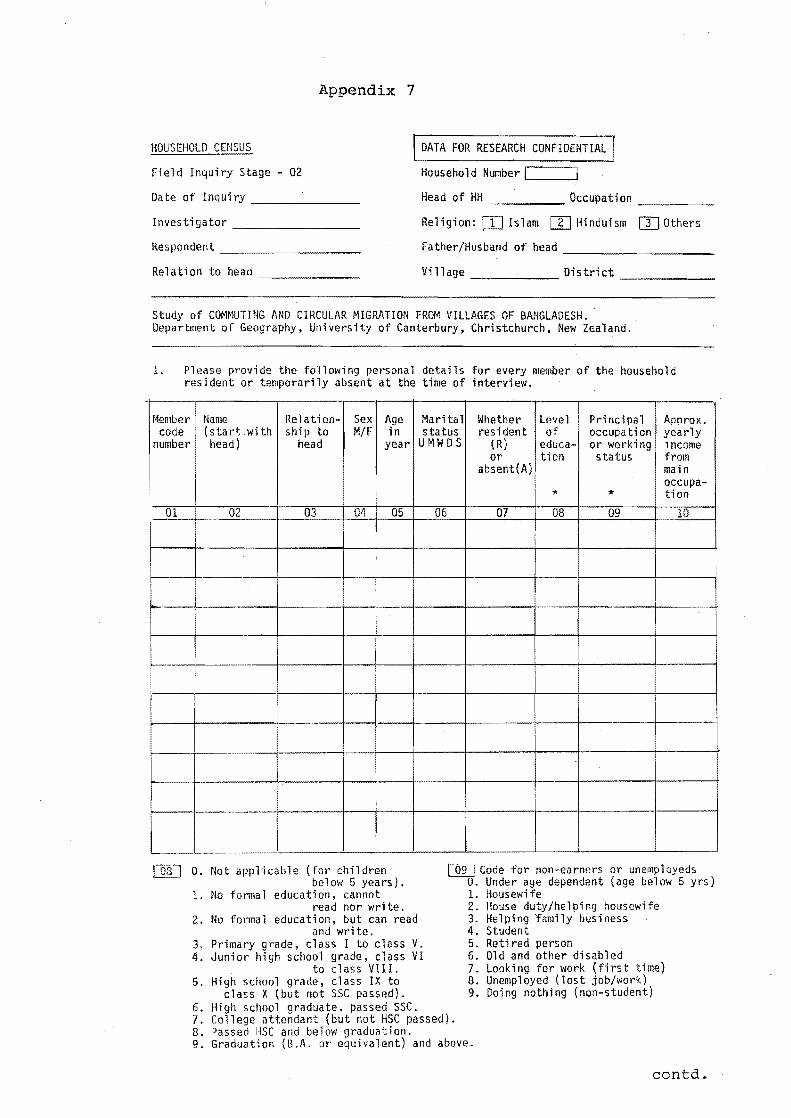
,
Appendix 7
HOUSEHOLD CENSUS I DATA FOR RESEARCH CONFIDENTIAL I Household Number '--__ --' Field Inquiry Stage - 02
Date of Inqui ry ___ ~ __ _ Head of HH _____ Occupation ____ _
Investigator _______ _ Rel igion: OJ Islam m Hindu; sm mOthers
Respondent ________ _ Father/Husband of head _________ _
Relation to head ______ _ Village .,.--_____ District _____ _
Study of COM~lUTING AND CIRCLILAR MIGRATION FROM VILLJI.GES OF BANGLAOESH. Deparbnent of Geography, University of Canterbury, Christchurch, New Zealand.
1. Please provide the following personal details for every member of the household resident or temporarily absent at the time of interview.
Member code
number
01
Name Relation- Sex Age Marital Whether Level Principal Approx. (start.with ship to M/F in status resident of occupation yearly head) . head year UMWDS (R) educa- or working income
or tion status from absent(A) main
occupa-* * tion
02 03 04 05 06 I 07 08 09 10
--1-------
O. Not applicable (for children below 5 years).
1. No formal education, cannot
~ Code for non-earners or unemployeds O. Under age dependent (age below 5 yrs)
read nor wri te. 2. No formal education, but can read
and write. 3. Primary grade, class I to class V. 4. Junior high school grade, class VI
to class VIII. 5. High school grade, class IX to
class X (but not SSC passed). 6. High school graduate. passed sse. 7. College attendant (but not HSe passed).
1. Housewi fe 2. House duty/helping housewife 3. Helping ramily business 4. Student 5. Retired person 6. Old and other disabled 7. Looking for work (first time) 8. Unemployed (lost job/work) 9. Doing nothing (non-student)
8. Passed HSC and below graduation. 9. Graduation (B.A. or equivalent) and above.
contd.
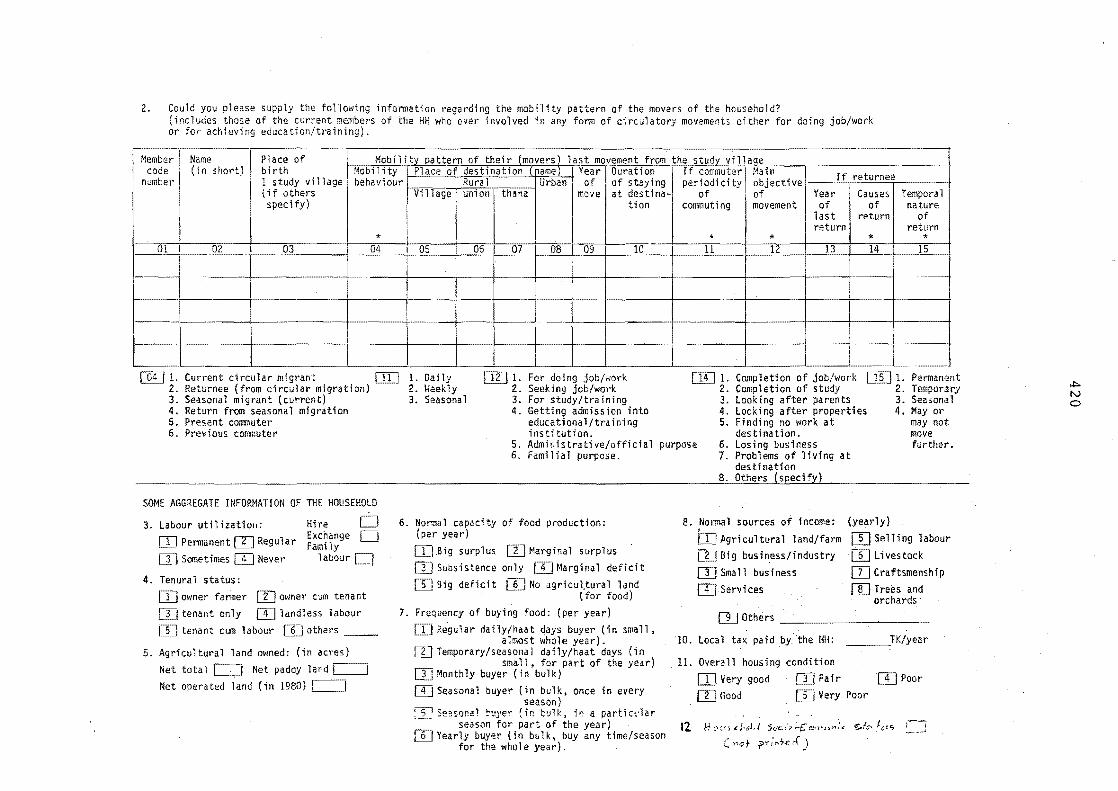
2. Could you please supply the following information l'egarding the mobility pattern of the movers of the household? (includes those of the current members of the HH who ever involved in any form of circulatory movements either for doing job/work or for aChieving education/training).
Mobility pattern of their (movers) last movement from the study vil'aQe
number
01
00 1-2. 3. 4. 5. 6.
I
! Mobil i ty Pl ace of des tmati on (!'lame) Year Duration 1 study vi11 age I bena vi our Rural (i f others Village union specify)
* 02 03 04 05 06
---
Current circular migrant 1. Daily Returnee (from circular migration) 2. Weekly Seasonal migrant (current) 3. Seasonal Return from seasonal migration Present commuter Previous commuter
Urban of of staying thana move at destina-
tion
07 I 08 09 10
1. For doing jab/work 2. Seeking job/work 3. For study/training 4. Getting admission into
educational/training institution.
!
I ,
periodicity objective If returnee If co~muterl Main
of of Year Causes Temporal commuting
* 11
1. 2. 3. 4. 5.
movement of of nature last return of return return
* * * 12 13 14 15
--- ----
-- ---
Completion of job/work 1. Completion of study 2. Looking after parents 3. Looking after properties 4. Finding no work at destination.
S. Administrative/official 6. Familial purpose.
purpose 6. Losing business
Permanent Temporary Seasonal Mayor may not move further.
SOME AGGREGATE INFORMATION OF THE HOUSEHOLD
3. Labour util izatiol': Permanent 0 Regular
m Sometimes m Never
4. Tenural status:
Hire D Exchange U fami ly
labour
owner farmer OI~ner cum tenant rn tenant only rn landless labour
tenant cum labour rn others __ ._
5. Agricultural land owned: (in acres) Net total Net paddy land Net operated land (in 1980)
6. Normal capacity of food production: (per year)
[[]Big surplus []J Marginal surplus Subsistence only Marginal deficit Big deficit rn No agricul.tural land
(for food) 7. Frequency of buying food: (per year)
Re'gular daily/haat days buyer (in small, almost whole year).
[gJ Temporary/seasonal daily/haat days (in sm~ll, for part of the year)
Monthly buyer (in bulk) [!J Seasonal buyer (in bulk, once in every
season) Se~sor.al '::uyer (in blk, ;r: a partict:lar
season for part of the year) Yearly buyer (in bulk, buy any time/season
for the whole year).
7. Problems of living at destination
8. Others (specify) _____ _
a. Normal sources of income:
b:J Agricultural land/farm LLf Big business/industry
Small business
rn Services
(yearly) m Selling labour Livestock
[lJ Craftsmenship . []J Trees and
, orchards rn Others ______ ~ __ _
10. local tax paid by the HH: _ TK/year
11. Overilll housing condition Very good Fair Poor
m Good Very Poor
12 H-c<'; d·"l,! s"c,":"C"""J>":' tt;:../0 f, • ., ("of P'f'''+'u()
..1::0 IV o
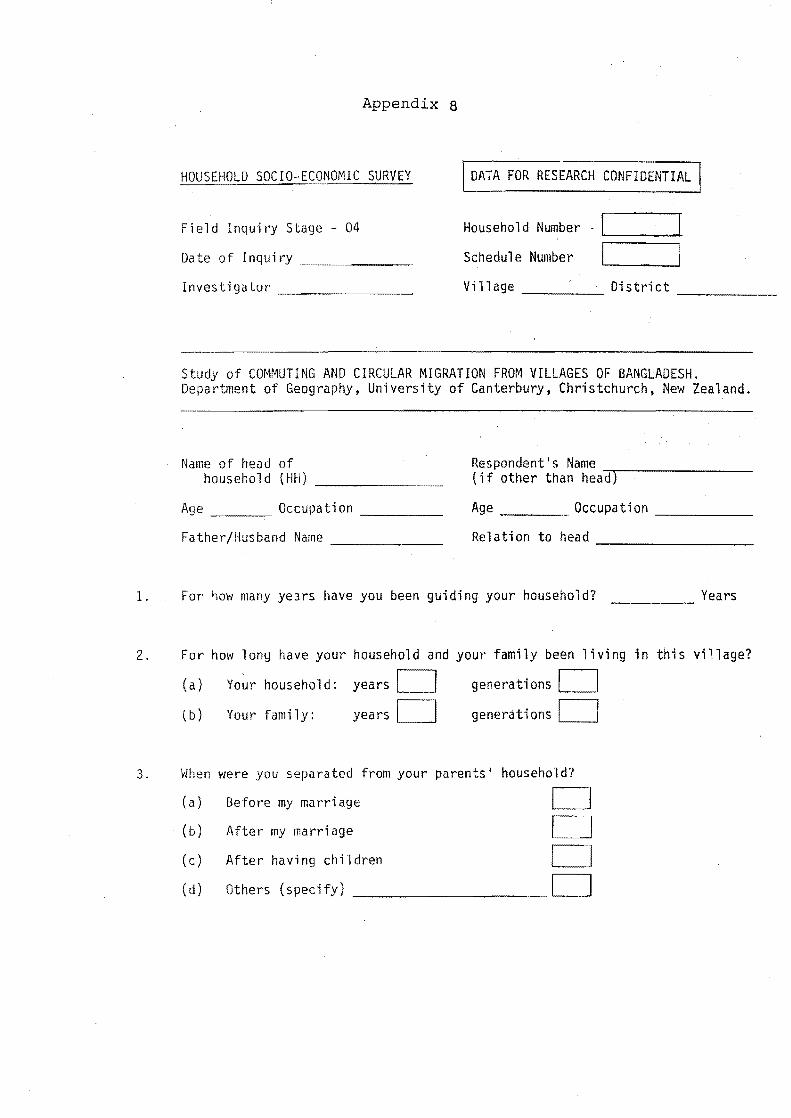
1.
Appendix 8
HOUSEHOLD socrO-ECONOMIC SURVEY , DATA FOR RESEARCH CONFIDENTIAL 1
Field Inquiry Stage - 04 Household Number -I ] Date of Inquiry _____ _ Schedule Number I i Investigator _______ _ Village District ------
Study of COMMUTING AND CIRCULAR MIGRATION FROM VILLAGES OF BANGLADESH. Deparbnent of Geography, University of Canterbury, Christchurch, New Zealand.
Name of head of household (HH)
Age ___ Occupation ____ _
Father/Husband Name _____ _
Respondent's Name { i f other than hea'd') -------
Age ____ Occupation _____ _
Relation to head ________ _
For how many yeJrs have you been guiding your household? Years
2. For how long have your household and your family been living in this village?
(a) Your household: years generations
(b) Your family: years D generations
3. When were you separated from your parents' household?
(a) Before my marriage D (b) After my marriage
(c) After having children
(d) Others (specify) D
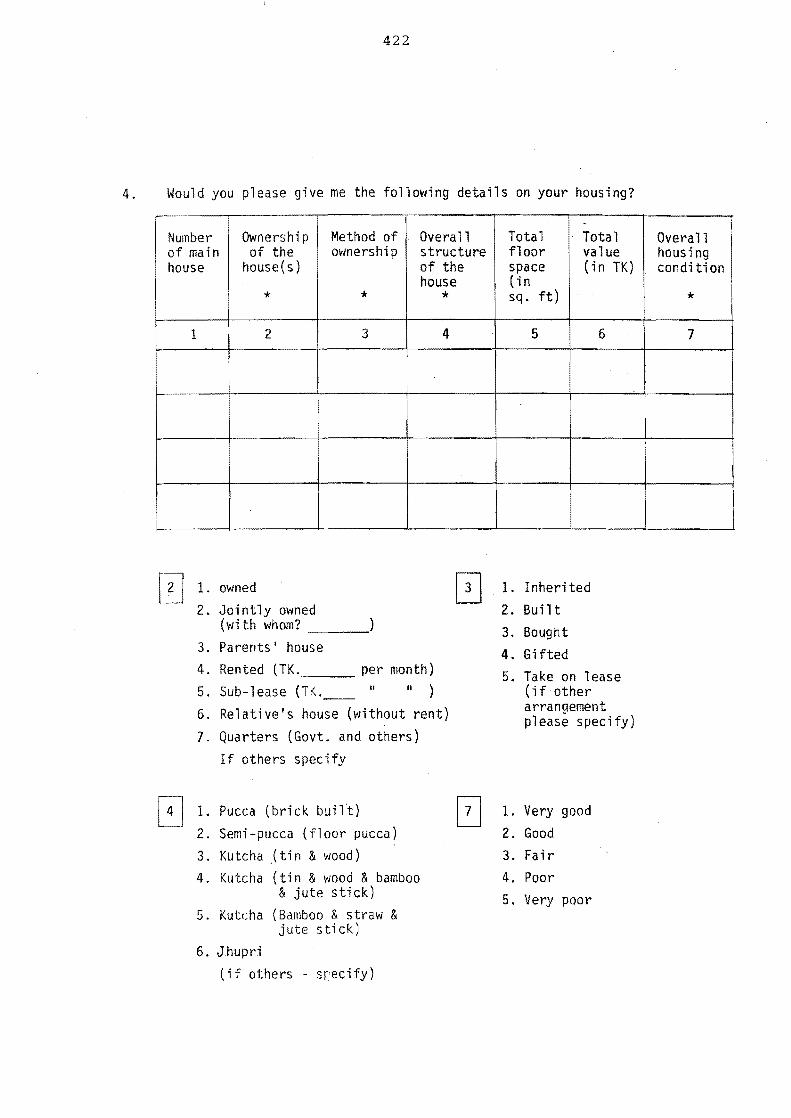
422
4. Would you please give me the following details on your housing?
. i Number Ownership Method of Overall Total Total Overall of main of the ownership structure floor value housing house house(s) of the space (i n TK) condition
house (; n * * * sq. ft) *
1 2 3 4 5 6 7
I ,
I
0 1. owned 0 1. Inherited 2. Jointly owned 2. Built
(with whom? 3. Bought 3. Parents' house 4. Gifted 4. Rented (TK. per month) 5. Take on lease 5. Sub-lease (TK. " II ) (if other
6. Relative's house (without rent) arrangement please specify)
7. Quarters (Govt. and others) If others specify
0 1. Pucca (brick buil~) [2] l. Very good
2. Semi-pucca (floor pucca) 2. Good
3. Kutcha ,(tin & wood) 3. Fair
4. Kutcha (tin & wood & bamboo 4. Poor & jute stick) 5. Very poor
5. Kutcha (Bamboo & straw & jute stick)
6. Jhupri (if others - sr;ecify)
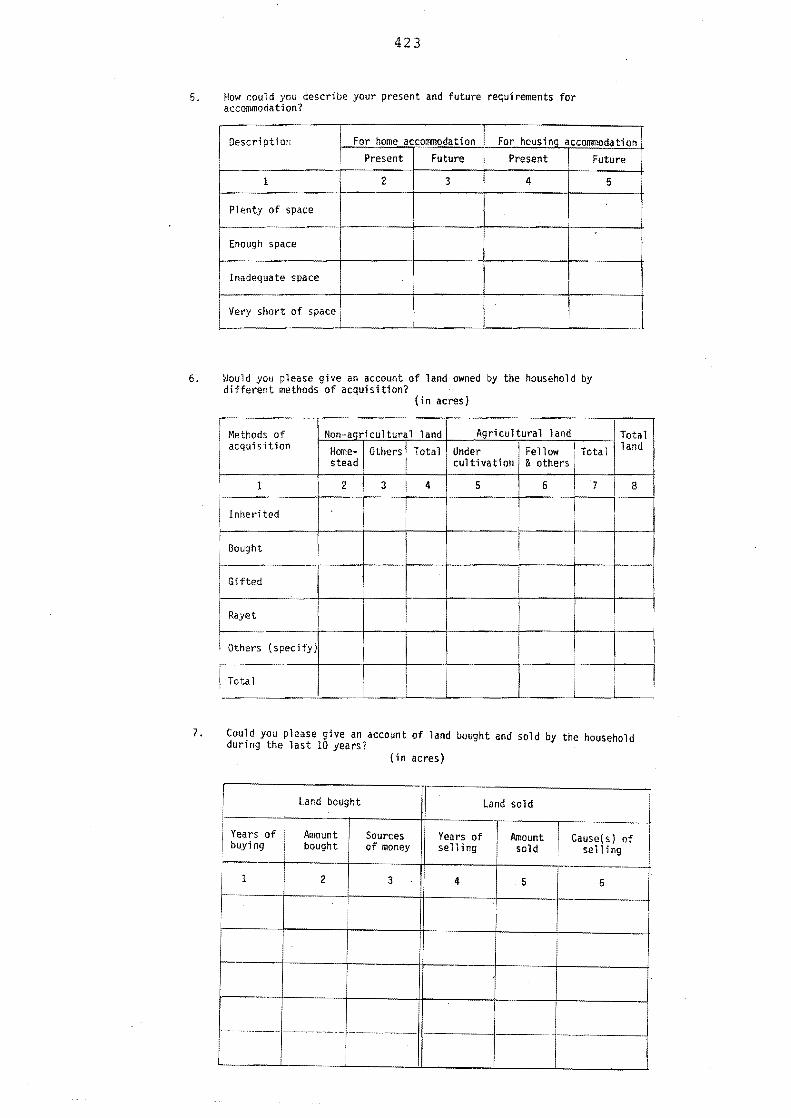
423
5. How could you describe your present and future requirements for accommodation?
I Description For home accommodation For housing accommodation Present Future Present Future
1 2 3 4 5
Plenty of space
~
Enough space
Inadequate space
Very short of space I 1--.
6. Would you please give an account of land owned by the household by different methods of acquisition?
(in acres)
Methods of Non-aQricultur 1 land Agricultural land Total acquisition Home- Others Total Under Fellow ~ Total land
stead cultivation & others i
1 2 3 4 5 6 ! 7 8
Inherited I
r
I Bought
Gifted
Rayet
Others (specify)
! I I i I
7. Could you please give an account of land bought and sold by the household during the last 10 years?
(in acres)
Land bought Land sold
I
I I I
Years of Amount Sources Years of Amount Cause(s) of buying bought of money sell ing sold sell ing
I 1 2 3 4 5 6
. ~--- .-~--- -~-~--~.---- --
I
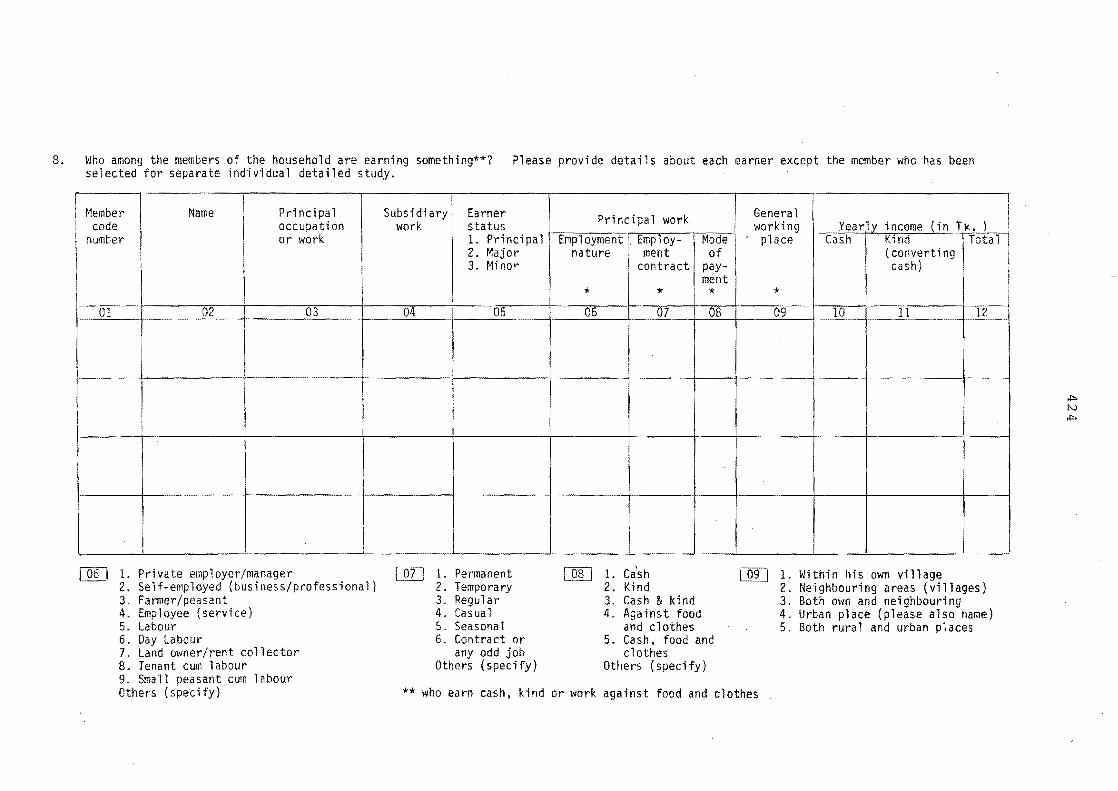
8. Who among the members of the household are earning something**? Please provide details about each earner except the member who has been selected for separate individual detailed study.
Subsidiary I !
I ~lember I Name Prj nci pa 1 Earner Principal work General I ! code occupation work . status working Yearl~ income (;n TI<. ) I number I or work 1. Principal Employment i. Employ- Mode place Cash .. Kind Total
2. Major nature i ment of {converting
I 3. Minor contract pay- cash} ment I '* * * * I i I
01 02 03 04 05 06 07 08 09 10 11 12
! ._.-
I
I-t I -
- .-
._-00 1. Private employer/manager 1. Permanent 1. Ca'sh 1. Within his own village
2. Self-employed (business/professional) 2. Temporary 2. Kind 2. Neighbouring areas (villages) 3. Farmer/peasant 3. Regular 3. Cash & kind 3. Both own and neighbouring 4. Employee (service) 4. Casual 4. Against food 4. Urban place (please also name) 5. Labour 5. Seasonal and clothes 5. Both rural and urban places 6. Day Labour 6. Contract or 5. Cash, food and 7. land owner/rent collector any odd job clothes 8. Tenant cum labour Others (specify) Others (specify) 9. Small peasant cum labour Others (specify) ** who earn cash, kind or work against food and clothes
,j:>.
tv ,j:>.
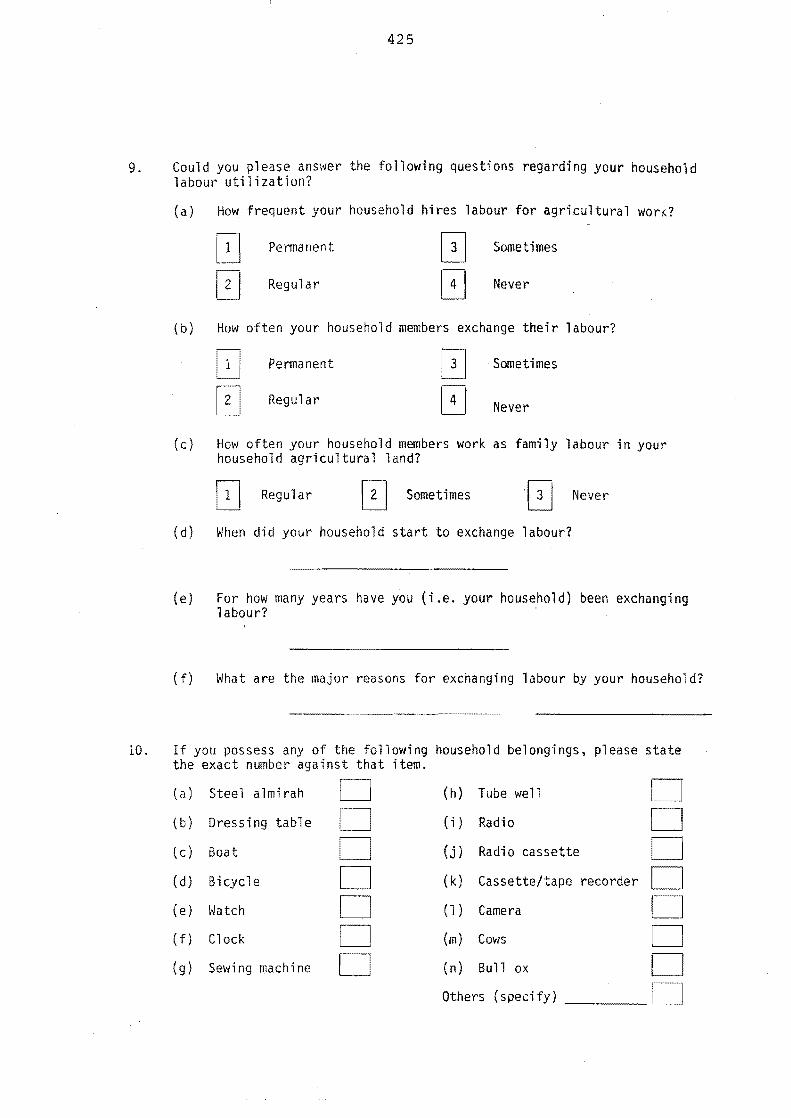
425
9. Could you please answer the following questions regarding your household labour utilization?
10.
(a) How frequent your household hires labour for agricultural work?
Permanent Sometimes
Regular Never
(b) How often your household members exchange their labour?
Permanent Sometimes
Regular Never
(c) How often your household members work as family labour in your household agricultural land?
o Regular o Sometimes '! 3 I Never
(d) When did your household start to exchange labour?
(e) For how many years have you (;.e. your household) been exchanging labour?
(f) What are the major reasons for exchanging labour by your household?
If you possess any of the following household belongings, please state the exact number against that item.
(a) Steel almirah D (h) Tube well
{b) Dressing tabl e (i) Radio D (c) Boat (j) Radio cassette 0 (d) Bicycle ( k) Cassette/tape recorder
(e) Watch 0 (1) Camera D (f) Clock (m) Cows D (9) Sewing machine (n) Bull ox
Others (specify)
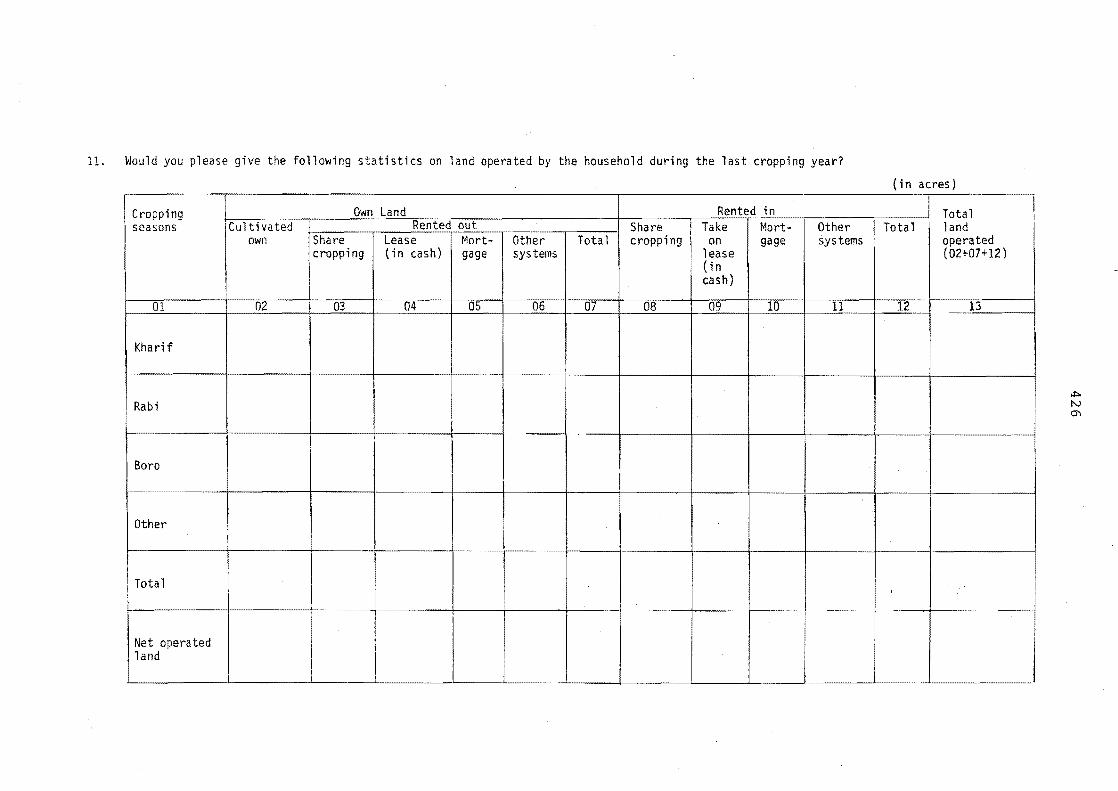
11. Would you please give the following statistics on land operated by the household during the last
Cropping Own Land Rented in seasons 'Cult; vated Rented out Share Take Mart-
own [Share Lease Mort- Other Total cropping on gage icropping (in cash) gage systems lease
( in cash)
01 02 03 04 05 06 07 08 09 10
Kharif
Rabi
i -I
Bora
---
Other
Total I --~ ---- "
Net operated land
-- ,--
ng year?
Other systems
11
(in acres)
Total Total land
operated (02+07+12)
12 13
,
I I
I
~ IV O'l
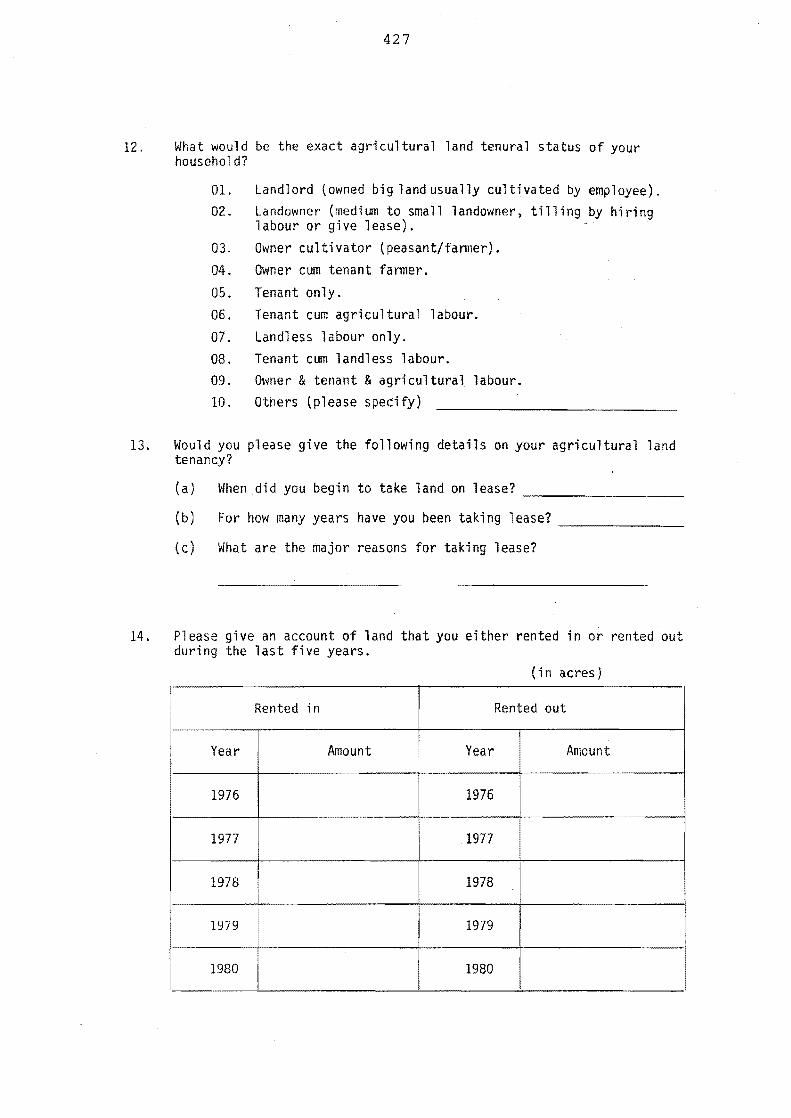
427
12. What would be the exact agricultural land tenural status of your household?
01. Landlord (owned big land usually cultivated by employee). 02. Landowner (medium to small landowner, tilling by hiring
labour or give lease).
03. Owner cultivator (peasant/farmer). 04. Owner cum tenant farmer.
05. Tenant only. 06. Tenant cum agricultural labour. 07. Landless labour only. 08. Tenant cum landless labour. 09. Owner & tenant & agricultural labour. 10. Others (please specify)
13. Would you please give the following details on your agricultural land tenancy?
(a) When did you begin to take land on lease? ------------------(b) For how many years have you been taking lease? __________ __
(c) What are the major reasons for taking lease?
14. Please give an account of land that you either rented in or rented out during the last five years.
(in acres) I I
Rented in Rented out
Year Amount Year Amount
1976 1976
1977 1977
1978 1978
1979 1979
1980 1980
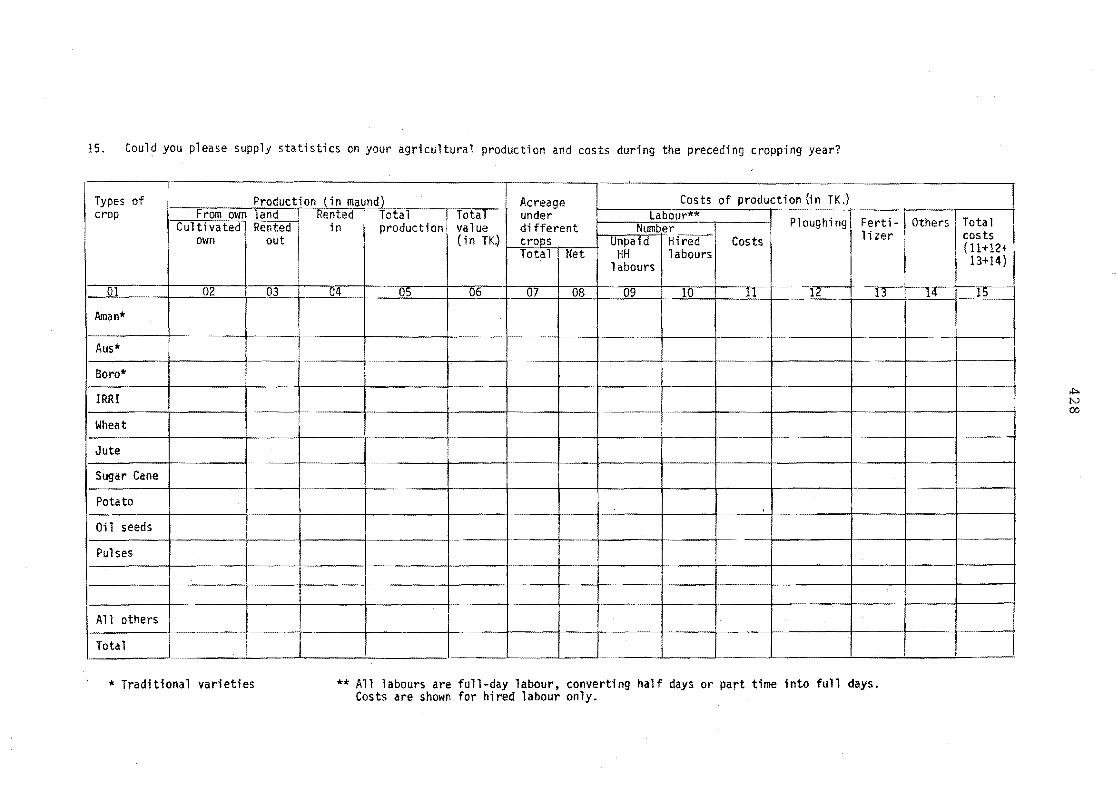
15. Could you please supply statistics on your agricultural production and costs during the preceding cropping year?
Types of Production (in maund) Acreage Costs of production (in TKJ crop From own land Rented Total Total under I labour**
Cultivated Rented in production val ue different Number Ploughing Ferti-own out (i n TK.) crops Unpaid Hlred Costs lizer
Total Net HH 1 abours labours
01 02 03 04 05 06 07 08 09 10 11 12 13
Aman* ~ - -~
~-
Aus* -~ ~ -
Boro*
IRRI
Wheat
Jute
Sugar Cane
Potato , ---~
Oil seeds
Pulses
All others
Total -
* Traditional varieties ** All labours are full-day labour. converting half days or part time into full days. Costs are shown for hired labour only.
Others
14
Total , costs (11+12+ 13+14)
15
~~-
--
.i>N 00

429
16. What would be the normal position of your household in terms of food production and consumption? (ask those HHs who have their own land - see Questions 6.and 12).
(a) Subsistence food grower.
(b) Surplus grower (small surplus normally c::Jmaunds surplus per year).
(c) Big surplus grower (normally c====Jmaunds per year).
(d) Marginal deficit grower (usually c::Jmaunds deficit per year).
(e) Big deficit grower (usually c=J maunds per year).
17. If you sometimes or always buy your food from the market, what type of buyer are you?
(a) Regular daily or haat days buyer (buy in small amount almost whole year).
(b) Temporary or seasonal daily or haat days buyer (buy in small, for part of the year).
(c) Monthly buyer (buy in bulk).
(d) Seasonal buyer (buy once in every season, in bulk).
(e) Seasonal buyer (usually buy once in a particular season - in bulk, for part of the year).
(f) Yearly buyer {buy once in a year - at any time/season but for the whole year requirement}.
18. What are the normal sources of income of your household? How much did your householc earn from these sources during 1980?
Income sources Normal Income sources (VI in 1980
1 2 3
(a) Agricu1tural production (food) (See Q.15) (b Agricultural production (non food) II
c Selling labour (Q.8 + Individual Questionnalre d Salarles or income from services ( II
{e Income from business/industries t .. (f All rents (land. house, shop, boat etc.) (q Sell i ng 1 and h Selling other household properties i ) Income from livestock j Cash from trees, orchards, fruits etc. k Handicrafts and other home products
(1) Others (specify) Total
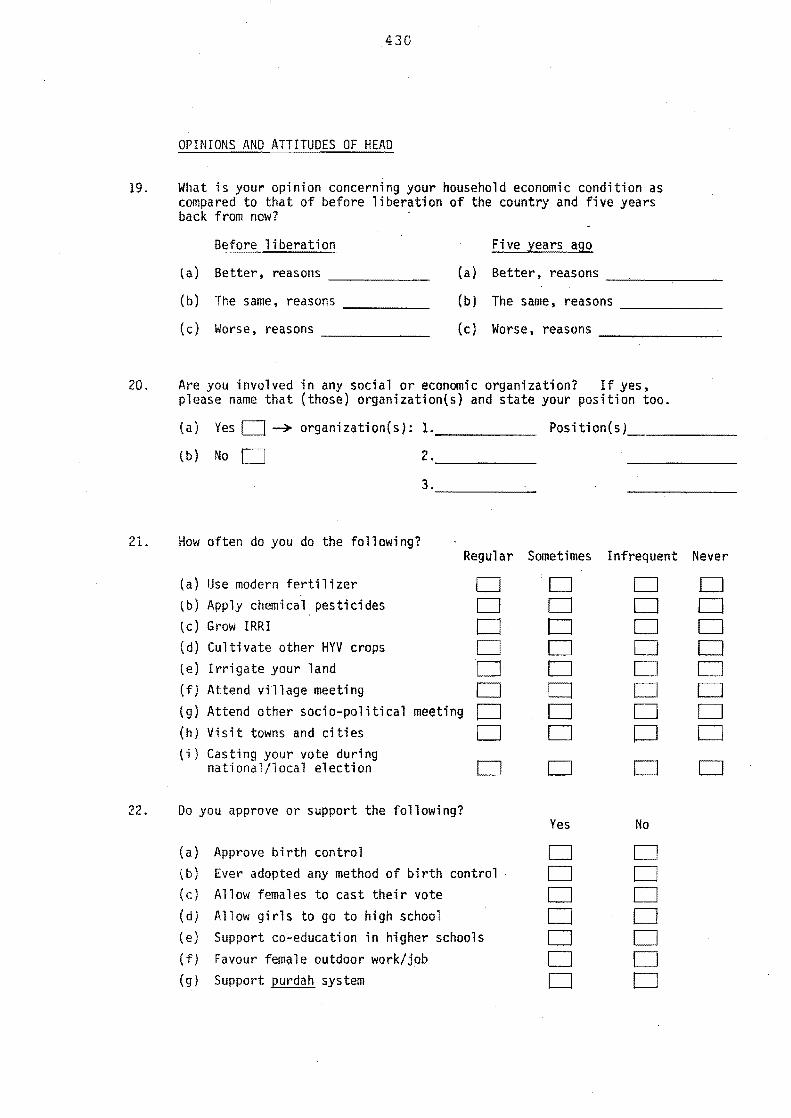
430
OPINIONS AND ATTITUDES OF HEAD
19. What is your opinion concerning your household economic condition as compared to that of before liberation of the country and five years back from now? .
Before liberation Five ,x:ears ago
la) Better~ reasons (a) Better, reasons
(b) The same, reasons (b) The same, reasons
(c) Worse, reasons (c) Worse, reasons
20. Are you involved in any social or economic organization? If yes, please name that (those) organization{s) and state your position too.
(a) Yes 0 ~ organization(s): 1. _____ _ Pos; ti one s ) _____ _
{b) No 0 2. ____ _
3. _____ _
21. How often do you do the following? Regular Sometimes Infrequent Never
(a) Use modern fertilizer D 0 tb) Apply chemical pesticides D 0 tcl Grow IRRI 0 0 (d) Cultivate other HYV crops D D D 0 le) Irrigate your land 0 0 0 0 (f) Attend village meeting D 0 D (g) Attend other socia-political meeting 0 D 0 (h) Visit towns and cities D D 0 D lil Casting your vote during
national/local election D
22. Do you approve or support the following? Yes No
{a} Approve birth control D (b) Ever adopted any method of birth control D (c) Allow females to cast their vote 0 (d) Allow girls to go to high school 0 0 (e) Support co-education in higher schools D D (f) Favour female outdoor work/job 0 (g) Support purdah system D
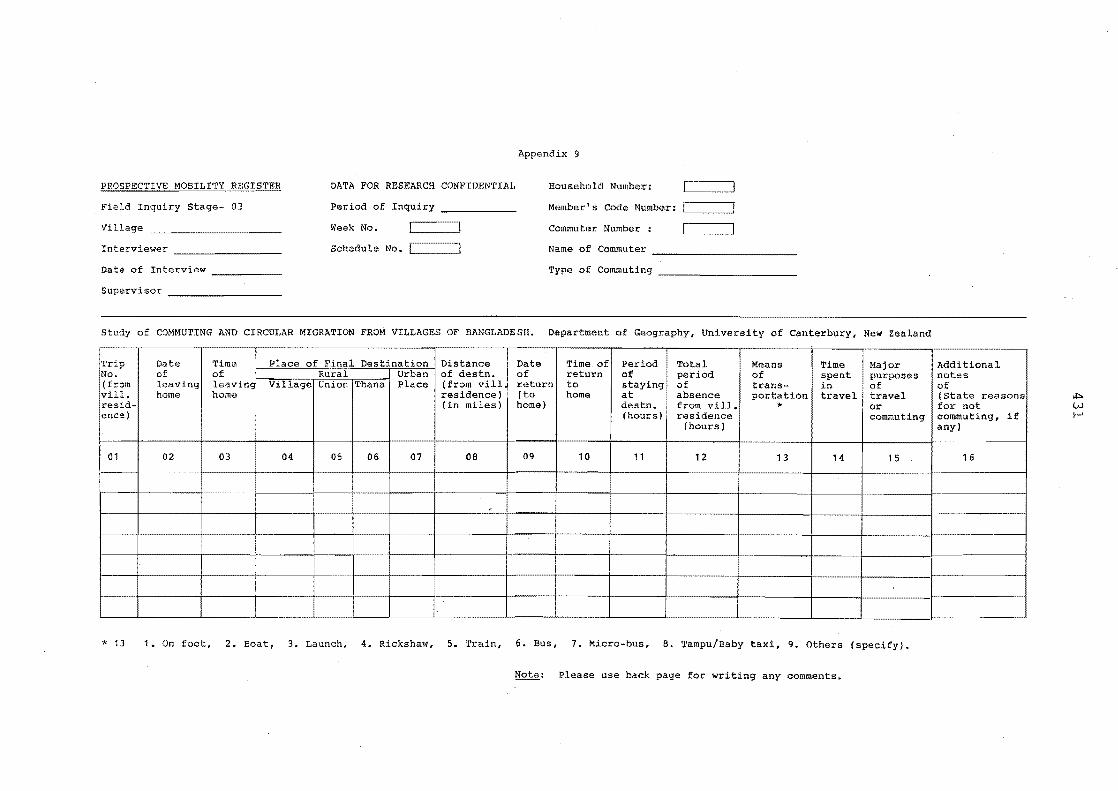
Appendix 9
PROSPECTIVE MOBILITY REGISTER DATA FOR RESEARCH CONFIDENTIAL Household Number: ---~
Field Inquiry Stage- 03 Period of Inquiry Member's Code Number:
Village Week No. Commuter Number [
Interviewer Schedule No. Name of Commuter ________________________ _
Date of Interview __________ __ Type of Commuting ____________________ ___
Supervisor
Study of COMMUTING AND CIRCULAR MIGRATION FROM VILLAGES OF BANGLADESH. Department of Geography, University of Canterbury, New Zealand
Trip Date Time Place of Final Destination Distance Date Time of Period Total Means Time Major No. of of Rural Urban of destn. of return of period of spent !!UL!!< .. I>,,,,,,, (from leaving leaving Village Union Thana place (from vill return to staying of trans- in vill. home home residence) (to home at absence portation travel travel resid- (in miles) home) destn. from vili. * or enee) (hours) residence commuting
(hours)
01 02 03 04 05 06 07 06 09 10 11 12 13 14 15
,
--~---
----
* 13 1. On foot, 2. Boat, 3. Launch, 4. Rickshaw, 5. Train, P. Bus, 7. Micro-bus, 8. Tampu/Baby taxi, 9. Others (specify).
Note: Please use back page for writing any comments.
Additional notes of state reasons
not commuting, if any)
16
---------
of;>. W i--'
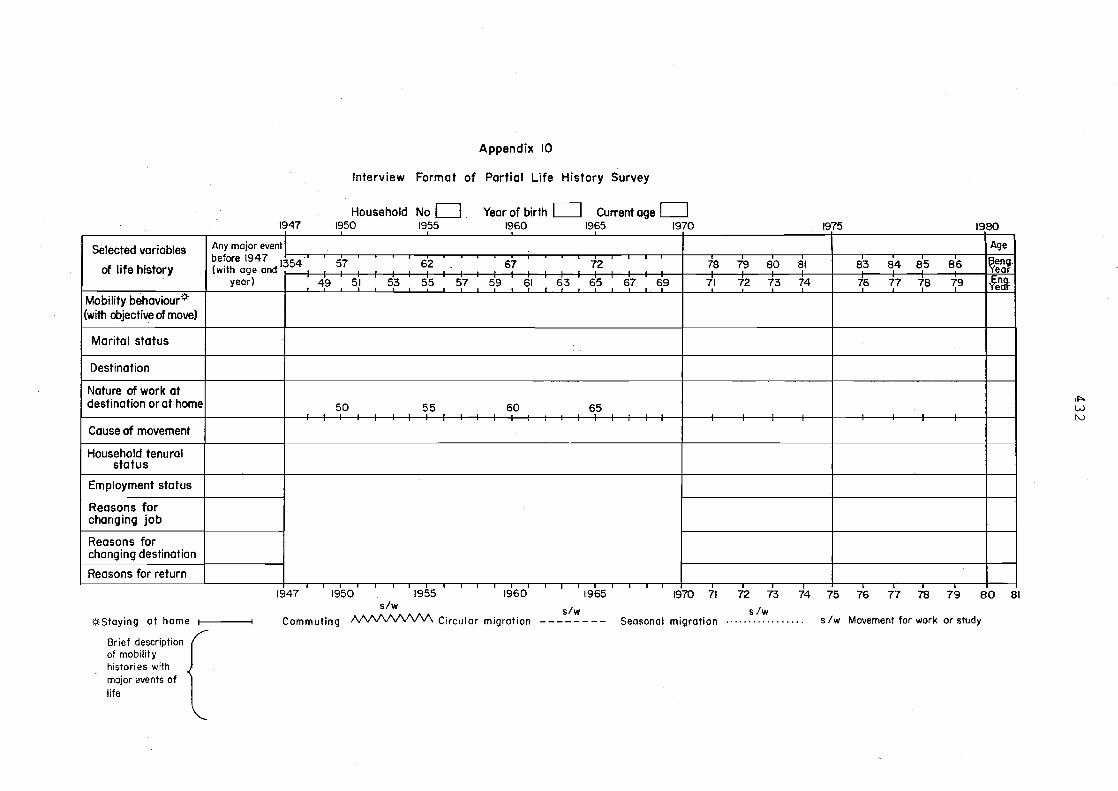
Selected variables
of life history
Mobility behaviour¢-(with objective of move)
Marital status
Destination
Nature of work at destination or at home
Cause of movement
Household tenural status
Employment status
Reasons for changing job
Reasons for changing destination
Reasons for return
~Staying at hame
Brief description of mobility histories with major events of life
Appendix 10
Interview Format of Partial Life History Survey
Household No 0 Year of birth 0 Current age 0 1947 1950 1955 1960 1965 1970 1975 1980
Any major event Age
before 1947 1354 57 62 67 72 76 79 60 61 83 84 85 86 8eng. (with age and Yeor
year) 49 51 53 55 57 59 61 63 65 67 69 71 72 73 74 76 77 78 79 fenJl:
50 55 60 65 .
-
1947 1950 1955 1960 1965 1970 71 72 73 74 75 76 77 78 79 80 81 s/w
Commuting /\IV\IVV\IVV\ Circular migration Seasonal migration s/w s/w
s Iw Movement for work or study
""" W t-v
433
REFERENCES CITED
Abbreviations used in references
ANU BBS ESCAP
UN
The Australian National University Bangladesh Bureau of Statistics Economic and Social Commission for Asia and the Pacific United Nations
References
Abou-Zeid, A.H. (1963). 'Migrant Labour and Social Structure in Kharga Osis' in J. Pitt-Ribers (ed.), Mediterranean Countrymen: Essays in the Social Anthropology of the Mediterranean, Paris Mouten.
Ahmad, Nafis (1976). A New Economic Geography of Bangladesh. New Delhi, Vikas.
Ahmad, Zubeida (1984). 'Rural Women and Their Work: Dependence and Alternative for Change', International Labour Review, 123, 1.
Alamgir, Mohiuddin (1974). 'Some Analysis of Distribution of Income, Consumption Saving and Poverty in Bangladesh', Bangladesh Development Studies, 2: 737-818.
Alamgir, Mohiuddin (1978). Bangladesh: A Case of Below Poverty Level Equilibrium Trap, Bangladesh Institute of Development Studies, Dhaka.
Alamgir, M.K. (1980). Development Strategy for Bangladesh: An Alternative Approach. Unpublished Ph.D. thesis in Economics, Boston University Graduate School.
Ali, A.M.S. (1980). 'Part-Time Farming in Bangladesh', Labour Capital and Society, 13: 2.
Ali, Salamat (1983). 'Human Ebb and Flow: The SubContinent', Far Eastern Economic Review, December 15.
Arefeen, H.K. (1982). 'Muslim Stratification Patterns in Bangladesh: An Attempt to Build a Theory', The Journal of Social Studies, No. 16.
Arens, J. and Van Beurden, J. (1977). Jhagrapur: Poor Peasants and Women in a Village in Bangladesh. Birmingham, Third World Publications.

434
Attwood, D.W. (1978). Why Some of the Rich Get Pooreri Economic Change and Mobility in Rural western India. Working Paper No. 23, Centre for Development Area Studies, McGill University, Montreal.
. Banerjee, Biswajit (1983). 'Social Networks in the
Migration Process: Empirical Evidence of Chain Migration in India', Journal of Developing Areas, 17, 2.
Bangladesh Bureau of Statistics (1979). Statistical Year Book of Bangladesh 1979, Dhaka.
Bangladesh Bureau of Statistics (1981). A Preliminary Report on Population Census 1981, Dhaka.
Bangladesh Bureau of Statistics (1984). Statistical Pocket Book of Bangladesh, 1983, Dhaka.
Bangladesh Bureau of Statistics (ND). Land Occupancy Summary Report of 1977, Dhaka.
Bangladesh Geographical Society (1961). Land Use in RampalUnion: A Horticultural Area, Monograph No. 1, BGS, Department of Geography, University of Dhaka, Dhaka.
Baqee, A.H.M.A. (1975-76). 'A Spatio-temporal Analysis of Rural Markets in Dacca District', Oriental Geographer, 19 & 20: 1 & 2.
Barber, Bernard (1968). 'The Structure of Stratification Systems', in International Encyclopedia of the Social Science, Vol. 15, Macmillan Co. and Free Press, U.S.A. p.295.
Barnes, D.F. and Binswanger, H.P. (1986). 'Impact of Rural Electrification and Infrastructure on Agricultural Changes, 1966-1980', Economic and Political Weekly, 21, 1.
Bedford, R.D. (1971). Mobility in Transition: An Analysis of Population Movement in the New Hebrides. Ph.D. dissertation, The Australian National University, Canberra.
Bedford, R.D. (1973). New Hebridian Mobility: A Study of Circular Migration. Department of Human Geography, Publication HG/9, ANU Press, Canberra.
Bedford, R.D. (1981a). 'The Variety and Forms of Population Mobility in Southeast Asia and Melanesia: The Case of Circulation', in G.W. Jones and H.V. Richter (eds), Population Mobility and Development: Southeast Asia and the Pacific,
435
Development Studies Centre Monograph No. 27, Canberra, ANU.
Bedford, R.D. '(1981b). Population Movement and the Articulation of Modes of Production in Eastern Fiji: A Comment. Discussion paper presented at a workshop on the geographical transfer of value in the Department of Human Geography, Research School of Pacific Studies, ANU, December.
Begum, Josna (1979). Rural-Urban Migration: A Case Study on Poor Female In-Migrants to Dhaka City. Unpublished research report, National Science and Technology Department, Dhaka.
Bertocci, Peter J. (1970). Elusive Villages: Social Structure and Community Organization in Rural East Pakistan. Unpublished Ph.D. dissertation, Michigan State University.
Bertocci, Peter J. (1974). 'Rural Communities in Bangladesh: Hajipur and Tinpara', in Clarence Maloney (ed.), South Asia: Seven Community Profiles. New York: Holt, Rinehart and Winston.
Bertocci, Peter J. (1979). 'Structural Fragmentation and Peasant Classes in Bangladesh', The Journal of Social Studies, No.5.
Boer, L. (1981). Bangladesh. Migration' , No. 13.
'Migration and Social Mobility in The Marginalization of Peasant Journal of Social Studies (Dhaka),
Bogue, D.J. (1969). Principles of Demography, New York: John Wiley and Sons.
Boyce, James K. and Hartmann, Betsy (1981). 'Who Works, Who Eats?', Bulletin of Concerned Asian Scholars, 13, 4.
Cain, Mead T. (1978). 'The Household Life Cycle and Economic Mobility in Rural Bangladesh', Population and Development Review, 4, 3.,
Cain, Mead et al. (1979). 'Class, Patriarchy and Women's Work in Bangladesh', Population and Development Review, 5, 3.
Caldwell, J.C. (1969). Rural-Urban Migration: The Movement to Ghana's Town. New York: Columbia University.
Census, 1951. Census Report of Pakistan, 1951, Vol. 3 (East Bengal), Karachi.
436
Census, 1961. Census of Pakistan, 1961, Vol. 2 (East Pakistan), Karachi, 1964.
Census, 1974. Bangladesh Population Census 1974, National Volume, Bangladesh Bureau of Statistics, Dhaka, 1977.
Census, 1981. Bangladesh Population Census 1981, National Series, Bangladesh Bureau of Statistics, Dhaka, 1984.
Centre for Urban Studies (1976). Squatters in Bangladesh Cities. Survey report by CUS, University of Dhaka.
Centre for Urban Studies (1979). The Urban Poor in Bangladesh, University of Dhaka.
Centre for Urban Studies (1982). The People of Dhaka: A Demographic and Socio-Economic Survey with Special Reference to Migrant Population of Dhaka Metropolitan Region. Dhaka, Centre for Urban Studies, University of Dhaka.
Centre for Urban Studies (1983). Slum in Dhaka City: A Socio-Economic Survey for Feasibility of Slums Clearance and Urban Renewal Programme in Dhaka City. Sponsored by Dhaka Municipal Corporation, Dhaka.
Centre for Urban Studies (forthcoming). Rural-Urban Migration from Villages of Faridpur, Dhaka. Centre for Urban Studies, University of Dhaka.
Chapman, M. (1970). Population Movement in Tribal Society: The Case of Duidui and Pichahila, British Solomon Islands. Ph.D. in Geography, University of Washington.
Chapman, M. (1976). 'Tribal Mobility as Circulation: A Solomon Islands Example of Micro/Macro Linkages', in L.A. Kosinski and J.W. Webb (eds), Population at Microscale, New Zealand Geographical Society, New Zealand.
Chapman, M. (1981). 'Policy Implications of Circulation: Some Answers from the Grassroots', in G.W. Jones and H.V. Richter (eds), Population Mobility and Development: Southeast Asia and the Pacific, Development Studies Centre Monograph no. 27, ANU.
Chapman, M. and Prothero, R.M. (1977). Circulation Between Horne Places and Towns: A Village Approach to Urbanization. Paper prepared for the Working Session on Urbanization in the Pacific, Annual
437
Meeting, Association for Social Anthropology in Oceania, Monterry, California, 2-6 March.
Chapman, M·. and Prothero, R.M. (eds) (1985). Circulation in Population Movement, London, Routledge and Kegan Paul.
Chaudhury, R.H. (1978a). 'Determinants and Consequences of Rural Out-Migration: Evidence from Some Villages in Bangladesh', Oriental Geographer, 22, 1 & 2.
Chaudhury, R.H. (1978b). Some Aspects of Seasonal Dimensions to Rural Poverty in Bangladesh. Paper presented at the Conference on Seasonal Dimensions to Rural Poverty, Institute of Development Studies, University of Sussex, July 3-6 (mimeo) •
Chaudhury, R.H. (1980). Urbanization in Bangladesh, Centre for Urban Studies, University of Dhaka, Dhaka.
Chaudhury, R.H. (1983). 'Migration, Mobility and Income Distribution: Some Evidence from Bangladesh', in Lata Chatterjee and Peter Nijkamp (eds), Urban and Regional Policy Analysis in Developing Countries, Gower.
Chaudhury, R.H. and Curlin, C.C. (1975). 'Dynamics of Migration in a Rural Area of Bangladesh', The Bangladesh Development Studies, 3, 2. ---
Chaudhury, R.H. et al. (1975). Management of Immigrants to Urban Regions of Bangladesh, in HABITAT -National Report on Human Settlement - Bangladesh, Govt of Bangladesh.
Chen, Marty (1986). 'Poverty, Gender, and Work in Bangladesh', Economic and Political Weekly, 21, 5.
Choguill, Charles L. (1983). 'Migration and its Implications for Urba.n Development', Regional Development Dialogue - United Nations Centre for Regional Development, 4, 1: 66-89.
Chopra, Kanchan (1986). 'Dimensions of Inequality in a High Growth Region', Economic and Political Weekly, 21,12.
Chowdhury, Anwarullah (1978). A Bangladesh Village: A Study of Social Stratification, Centre for Social Studies, Dhaka.
438
Connell, John et al. (1976). Migration from Rural Areas: The Evidence from Village Studies, Delhi: Oxford University Pn:~ss.
Dasgupta, B. and Laishley, R. (1975). 'Migration from Villages', Economic and Political Weekly, 10, 42: 1652-1662.
Davis, K. (1951). The Population of India and Pakistan. Princeton: Princeton University Press.
De Jong, G.F. and Gardner" R.W. (eds) (1981). Migration Decision Making: Multidisciplinary Approaches to Microlevel Studies in Developed and Developing Countries. New York, Pergamon Press.
Elahi, K.M. (1972). 'Urbanization in Bangladesh: A Geodemographic Studyl, Oriental Geographer, 16, 1.
Elahi, K.M. (1980). Internal Migration and Population Redistribution in Bangladesh. Paper presented to the Symposium on Migration and Population Redistribution in Asia and the Pacific Region, held in Japan, August.
Elkan, w. (1967). 'Circular Migration and the Growth of Towns in East Africa", International Labour Review, 96: 581-89.
ESCAP (1984). Asian-Pacific: Population Programme News, 13: 1.
Faaland, Just and Parkinson, J.R. (1976a). Bangladesh: The Test Case of Development. London: C. Hurst.
Faaland, J. and Parkinson, J.R. (1976b). 'Bangladesh: Gradual Development or Deepening Misery?', World Development, 4, 9.
Farouk, A. et ala (1978). The Vagrants of Dhaka City. Research report, Bureau of Economic Research, University of Dhaka.
Forbes, Dean (1981). 'Mobility and Uneven Development in Indonesia: A Critique of Explanations of Migration and Circular Migration', in G.W. Jones and H.V. Richter (eds), Population Mobility and Development: Southeast Asia and the Pacific, Development Studies Centre Monograph No. 27, ANU, Canberra.
Fuguitt, G.V. (1979). 'Population Movements and Integrated Rural Development', Sociologia Ruralis, 19, 2 & 3.
439
Gait, E. (1902). Census of India 1901. Calcutta: Bengal Secretarial Press.
Gait, E. (1913). Census of India, 1911 Vol. 1, Part 1. Calcutta.
Garnier, J.B. (1978). Geography of Population (Translated by Beaver, S.H.), Longman (2nd ed.), p.262.
George, M. V. (1966). Inb::rna1 Migration in Assam and Bengal, 1901-1961. Ph.D. Thesis, Department of Demography, Australian National University.
Ghose, Ajit and Griffin, Keith (1980). 'Rural Poverty and Development Alternatives in South and Southeast Asia: Some Policy Issues', Development and Change, 11, 4.
Goddard, A.D. (1973). R2Pu1ation Movements and Land Shortages in the Sokoto Close-settled Zone, Nigeria, University of Liverpool, Department of Geography.
Goldstein, S. (1978). Circulation in the Context of Total Mobility in Southeast Asia. Papers of the East-West Population Institute, Honolulu, No. 53.
Goldstein, S. and Goldstein, A. (1981). Surveys of Migration in Developing Countries: A Methodological Review. East-West Centre, Paper No. 71, Honolulu, Hawaii.
Gould, W.T.S. and Prothero, R.M. (1975). 'Space and Time in African Population Mobility', in L.A. Kosinski and R.M. Prothero (eds), People on the Move, Studies on IntE!rnal Migration. London: Methuen and Co. Ltd.
Government of Bangladesh (1980). The Second Five Year Plan 1980-85, Planning Commission, Dhaka.
Griffin, K. and Khan, Azizur Rahman (1978). 'Poverty in the Third World: Ugly Facts and Fancy Models', World Development, 6, 3.
Guha, Uma (1965). 'Caste Among the Rural Bengali Muslims', Man in India, 45, 2.
Habibullah, M. (1962). The Pattern of Agricultural Unemployment: A Case Study of an East Pakistan Village. Bureau of Economic Research, University of Dhaka.
440
Haque, Shamsul (1982). Education in Bangladesh. Australia: Commonwealth Council for Educational Administration.
Haq, z.s. (1974). Determinants of the Spatial Dynamics of Population Movements within Bangladesh. Unpublished Ph.D. dissertation in Geography, University of British Columbia.
Harrison, Paul (1981). Inside the Third World. Great Britain, Penguin Books.
Hartmann, Betsy and Boyce, James (1983). A Quiet Violence: View From a Bangladesh Village. London, Zed Press.
Hugo, Graeme J. (1978a). Population Mobility in West Java, Yogyakarta: Gadjah Mada University Press.
Hugo, Graeme J. (1978b). New Conceptual Approaches to Migration in the Context of Urbanization: A Discussion Based on Indonesian Experience. Paper prepared for a Seminar on 'New Conceptual Approaches to Migration in the Context of Urbanization', Organized by IUSSP, Bellagio, Italy, June 30 - July 3.
Hugo, Graeme J. (1979a). 'Circular Mobility and Life History Analysis: Some Comments based on Indonesian Experience', in Pryor, R.J. (ed.), Residence History Analysis, Canberra, Australian National University Press (Studies in Migration and Urbanization No.3).
Hugo, Graeme J. (1981), Impermanent Mobility in Indonesia: What Do We Know About Its Contemporary Scale, Causes and Consequences? Paper prepared for Population Association of American Annual Meeting's Session on Forms of Impermanent Mobility: Emerging Insights, Washington D.C., 26 March 1981.
Hugo, Graeme J. (1984). Micro Approaches to the Study of Population Movement: An Indonesian Case Study. Paper prepared for IUSSP Seminar on Micro Approaches in Demographic Research, ANU, Canberra, 3-7 September, 1984.
Huq, M. Ameerul (1976). Exploitation and the Rural Poor - A Working Paper on the Rural Power Structure in Bangladesh. Comilla: Bangladesh Academy for Rural Development.
Hussain, Mahabub (1977). 'Farm Size, Tenancy and Land Productivity: An Analysis of Farm Level Data in Bangladesh Agriculture', Bangladesh Development Studies, 5, 3.
441
Hussain, Mahabub (1979). 'Nature of Tenancy Markets in Bangladesh Agriculture', The Journal of Social Studies, No.3.
Hussain, Mahabub (1981). 'Agrarian structure: Some Considerations of Equity, Productivity and Growth', in Wahiduddin Mahmud (ed.), Development Issues in an Agrarian Economy - Bangladesh. Centre for Administrative Studies, Dhaka.
Islam, A.K.M. Aminul (1974). A Bangladesh Village Conflict and Cohesion. Anthropological Study of Politics. Cambridge, schenkman Publishing Company.
Islam, M.S. (1980). 'Life in the Mufassal Towns of Nineteenth Century Bengal', in Kenneth Ballhatchet and John Harrison (eds), The City in South Asia, Pre-Modern and Modern. Centre for South Asian Studies, School of Oriental and African Studies, University of London.
Islam, Nazrul (1978). Urbanization in Bangladesh: Patterns, Problems and Policies. Paper presented at the South Asian Regional Seminar on Small and Medium-sized Towns in Regional Development, Kathmandu, April 9-16 (mimeo).
Islam, Nazrul (1985). Impact of Rural Exodus on Urbanization Process in Asia. Paper presented for the United Nations Educational, Scientific and Cultural Organization, Paris.
Islam, Nazrul and Hossain, Hemayet (1975). 'Relationship of Urban Centres with their Rural Hinterlands', National Report on Human Settlements - Bangladesh Habitat, United Nations Conference on Human Settlements Regional Conference, Tehran, 14-19 June.
Islam, Nazrul et ala (1982). The People of Dhaka: A Demographic and Socio-Economic Survey with Special Reference to Migrant Population of Dhaka Metropolitan Region. Dhaka: Centre for Urban Studies, University of Dhaka.
Islam, Rizwanul (1979). 'What has been happening to Rural Income Distribution in Bangladesh', Development and Change, 10, 3.
Jahangir, B.K. 1982). Rural Society, Power Structure and Class Practice. Centre for Social Studies, University of Dhaka.
Jannuzi, F. Tomasson and Peach, J.T. (1979a). 'Notes on Land Reform in Bangladesh: The Efficacy of Ceilings', Journal of Peasant Studies, 6, 3.
442
Jannuzi, F. Tomasson and Peach, James T. (1979b). Bangladesh: A Profile of the Countryside. United states Agency for International Development (USAID), April, 1979.
Jansen, Eirik G. (1983). Rural Bangladesh: Competition for Scarce Resources. DERAP Working Paper No. 162, Chr. Michelsen Institute, Bergen, Norway.
Johnston, B.L.C. (1982). Bangladesh. London: Heinemann Educational Books.
Jones, steve (1978). Bangladesh: A Critical Evaluation of Recent Rural Development Programmes. Paper submitted to the Institute of British Geographers, Development Areas Study Group Conference, held at University of London, 23 September.
Karim, A.K. Nazmul (1976). Changing Society in India, Pakistan and Bangladesh. Dacca, Nawroze Kitabistan.
Khan, Abdullah AI-Mamun (1982). 'Rural-Urban Migration and Urbanization in Bangladesh', Geographical Review, 72, 4.
Khan, Azizur Rahman (1972). The Economy of Bangladesh. London: Macmillan.
Khan, Azizur Rahman (1977). 'Poverty and Inequality in Rural Bangladesh', in Poverty and Landlessness in Rural Asia, ILO, Geneva.
Khan, M.R. (1972). Migration Within and Across the Boundaries of East and West Pakistan, 1901-1961. Unpublished Ph.D. dissertation, Australian National University.
Kosinski, L.A. and Prothero, R.M. (eds) (1975), People on the Move: Studies on Internal Migration. London: Methuen and Co. Ltd.
Kothari, D.K. (1980). Patterns of Rural-Urban Migration: A Case Study of Four Villages in Rajasthan, India. :Ph.D. in Demography, ANU.
Krishnan, P. and Rowe, G. (1978). 'Internal Migration in Bangladesh', Rural Demography, 5, 1 & 2.
Lipton, M. (1980). 'Migration from Rural Areas of Poor Countries: the Impact on Rural Productivity and Income Distribution', World Development, 8, 1.
Mahbub, A.Q.M. (1984). fA Profile of Contemporary Mobility Behaviour in Rural Bangladesh', in Owens, I.F. et ale (eds), Proceedings of the 12th N.Z.
443
Geography Conference, N.Z.G.S., Christchurch, 219-25.
Mahmud, W. and Osmani, S.R. (1980). 'Impact of Emigrant Workers' Remittances on the Bangladesh Economy', Bangladesh Development Studies, 8, 3.
Majumdar, R.C. (ed.) (1943). History of Bengal, Vol. 1, University of Dhaka, Dhaka.
Mandelbaum, David G. (1970). Society in India. Vol. 1: continuity and Change. Berkeley, University of California Press.
Mannan, M.A. (1977). A Survey of Landless and Destitutes in Ten Villages of Camilla District. Comilla: Bangladesh Academy for Rural Development.
Mantra, I.B. (1981). Population Movement in Wet Rice Communities. Gadjah Mada University Press, Gadjah Mada University, Yogyakarta.
Maude, A. (1981). 'Population Mobility and Rural Households in North Kelantan, Malaysia', in G.W. Jones and H.V. Richter (eds), Population Mobility and Development: Southeast Asia and the Pacific, Development Studies Centre Monograph no. 27, Canberra, ANU.
Mia, Ahmadullah et ale (1975). Social Stratification and Social Welfare Services. Institute of Social Welfare and Research 1r University of Dhaka.
Mitchell, G. Duncan (ed.) (1979). A New Dictionary of Sociology. London, Routledge and Kegan Paul.
Mitchell, J.C. (1961). 'Wage Labour and African Population Movements in Central Africa', in K.M. Barbour and R.M. Prothero (eds), Essays on African Population. London: Routledge and Kegan Paul.
Mukherjee, Ramkrishna (1948). 'Economic Structure of Rural Bengal: A Survey of Six Villages', American Sociological Review, 13, 6.
Mukherjee, Ramkrishna (1971). Six Villages in Bengal. Bombay, Popular Prakashan.
Mukhtyar, G.C. (1930). Gujarat Village.
Life and Labour in a South Calcutta, Longmans.
Muqtada, M. (1975). 'The Seed Fertilizer Technology and Surplus Labour in Bangladesh Agriculture', Bangladesh Development Studies, 3, 4.
Nelson, J. (1976). 'Sojourners Versus New Urbanites: Causes and Consequences of Temporary Versus
444
Permanent City World Migration in Developing Countries', Economic Development and Cultural Change, 24, 4.
Obaidullah, M. (1967). 'Internal Migration in East Pakistan', Oriental Geographer, 11, 2.
Oberai, A.S. and Singh, H.K.M. (1982). 'Migration, Production and Technology in Agriculture: A Case Study in the Indian Punjab', International Labour Review, 121: 327-44.
Ojeda, D.V.M. (1976). Influence of Some Personal and Family Factors on Peasant Migration in Three Colombian Communities. Ph.D. Thesis, Ohio State University.
Osmani, S.R. and Rahman, A. (1981). 'A Study on Income Distribution in Bangladesh', Bangladesh Development Studies, July.
Petersen, W. (1958). 'A General Typology of Migration', American Sociological Review, 23, 3.
Pickford, John (1984). 'Now We are Into the New Age of Reality in Education', Commonwealth, 26, 6.
Prothero, R.M. and Chapman, M. (eds) (1985). Circulation in Third World Countries. London, Routledge and Kegan Paul.
Qadir, Sayda Rowsan (1975). of Squatter Settlement. Institute.
Bastees of Dacca: A Study Dhaka: Local Government
Rashid, Haroon Er. (1977). Geography of Bangladesh. Dhaka: University Press Ltd.
Rhoda, Richard (1983). 'Rural Development and Urban Migration: Can We Keep Them Down on the Farm?', International Migration Review, 17, 1.
Rimmer, Peter J. et ala (1978). 'Challenging the Unconventional Wisdom of Development Studies in the Third World', in Peter J. Rimmer et ala (eds), Food, Shelter and Transport in Southeast Asia and the Pacific: Challenging the Unconventional Wisdom of Development Studies in the Third World. Canberra, ANU.
Roseman, Curtis C. (1971). 'Migration as a Spatial and Temporal Process', Annals of the Association of American Geographers, 61: 589-598.
445
Ruzicka, Lado T. etal. (1978a). Demographic Surveillance System - Matlab: Census 1974. Vol. 2, Scientific Paper No. 10, Cholera Research Laboratory, Dhaka.
Ruzicka, L.T. et ale (1978b). Demographic Surveillance System - Matlab: Vital Events and Migration -1974. Vol. 3, Scientific Report No. 11, Cholera Research Laboratory, Dhaka.
Schroeder, Larry (1985). 'Decentralization in Rural Bangladesh', Asian Survey, 25, 11.
Shafique, Mahmud (1983). Peshar Rupantor (Changing Occupation), Bichitra, 28 January, Dhaka.
Shamsuddin, Dara (1981). 'Aspects of Migration from Rural Areas to Industrial-Urban Centres of Bangladesh', in R.B. MandaI (ed.), Frontiers in Migration Analysis. New Delhi: Concept Publishing Company, 205-216.
Simmons, Alan, et ale (1977). Social Change and Internal Migration: A Review of Research Findings from Africa, Asia and Latin America. International Development Research Centre, Ottawa, Canada.
Singh, Andrea of Women James T. of Asia.
Menefee (1984). 'Rural to Urban Migration in India: Patterns and Implications', in Fawcett et ale (eds), Women in the Cities
Colorado: Westview Press, 81-107.
Singhanetra-Renard, A. (1981). 'Mobility in North Thailand: A View from Within', in G.W. Jones and H.V. Richter (eds), Population Mobility and Development: Southeast Asia and the Pacific. Development Studies Centre Monograph No. 27, Canberra, ANU.
Sinha, Pradip (1965). Nineteenth Century Bengal: Aspects of Social History. Calcutta: K.L. Mukhopadhyah.
Skeldon, R. (1976). 'Regional Associations and Population Migration in Peru: An Interpretation', Urban Anthropology, 5: 233-252.
Skeldon, R. (1977). 'The Evolution of Migration Patterns During Urbanization in Peru', Geographical Review, 67, 4.
Skeldon, R. (1984). Migration in South Asia: An Overview. Population Research Leads, No. 16, Population Division, ESCAP, Bangkok.
446
Sobhan, Rehman (1981). 'Bangladesh and the World Economic System: The Crisis of External Dependence', Development and Change, 12, 3.
Stoeckel, John et ale (1972). 'out-Migration from a Rural Area of Bangladesh', Rural Sociology, 37, 2.
The Economist Intelligence Unit, Quarterly Economic Review of Bangladesh. Annual Supplement, 1977, 1981, 1984 and 1985, London, U.K.
Ulack, Richard et ale (1985). 'Circulation in the Philippines', Geographical Review, 75, 4.
United Nations (1970). Methods of Measuring Internal Migration. Population Studies No. 47, New York.
United Nations (1977). Report of the Expert Group Meeting on Migration and Human Settlement, ESCAP, Asian Population Studies Series no. 38, Bangkok.
United Nations, ESCAP (1979). Comparative Study of Migration and Urbanization in Relation to Development: A Framework. ESCAP, Bangkok.
United Nations (1980a). 'Prospects for the Economic Development of Bangladesh in the 1980s', Economic Bulletin for Asia and the Pacific, 31, 1.
United Nations (1980b). Population Growth. Economic and Social No. 68, New York.
Patterns of Urban and Rural Department of International
Affairs, Population Studies,
United Nations (1981a). Population of Bangladesh. Country Monograph Series No.8, ESCAP, Bangkok.
United Nations (1981b). Migration, Urbanization and Development in Indonesia. ESCAP country report on Comparative Study on Migration, Urbanization and Development in the ESCAP region, Bangkok.
United Nations (1982). Estimates and Projections of Urban, Rural and City Populations, 1950-2025: the 1980 Assessment. Department of International Economic and Social Affairs, New York.
United Nations (1982b). National Migration Surveys: Guidelines for Analyses. Survey manuals no. 10, ESCAP.
United Nations (1984). Demographic Year Book: 1982. New York.
United Nations (198?). Bangladesh. UN Fund for Population Activities, New York.
447
Van Schendel, W. (1981). Peasant Mobility: The Odds of Life in Rural Bangladesh. Assen, Van Gorcum.
Van Schendel, Willem (1981b). 'After the Limelight: Longer-Term Effects of Rural Development in a Bangladesh Village', Bulletin of Concerned Asian Scholars, 13, 4.
Ward, R.G. (1980). 'Migration, Myth and Magic in Papua New Guinea', Australian Geographical Studies, 18: 119-34.
Watts, Susan and Prothero, R.M. (ND). Population Mobility and Multilocality in Ilorine, Kwara State, Nigeria. Part 1. Working Paper No.1, Department of Geography, University of Liverpool.
Whittaker, William (1984). 'Migration and Agrarian Change in Garhwal District, Uttar Pradesh', in Tim P. Bayliss-Smith and Sudhir Wanmali (eds), Understanding Green Revolutions. Cambridge: Cambridge University Press, pp.109-135.
Wilson, Godfrey (1941-2). An Essay on the Economies of Detribalization in Northern Rhodesia, Parts I and II, Rhodes-Livingstone Papers, nos. 5 and 6. Livingstone: Rhodes-Livingstone Institute.
Wood, Geoffrey D. (1981). 'Rural Class Formation in Bangladesh, 1940-1980', Bulletin of Concerned Asian Scholars, 13, 4.
World Bank (1981). Labour Migration from Bangladesh to the Middle East. World Bank Staff Working Paper No. 454, Washington.
Wyon, J.B. and Gordon, J.E. (1971). The Khanna Study: Population Problems in the Rural Punjab. Cambridge (Mass), Harvard University Press.
Young, E.A. (1977). Simbu and New Ireland Migration. Unpublished Ph.D. Thesis, Department of Geography, ANU, Canberra.
Young, Elspeth (1980). The medium-sized Town in the Context of Mobility: Rural-Urban Linkages and Their Relevance for Decentralization Policies. Paper presented to the 1980 Development Studies Centre Conference 'Population Mobility and Development', 8-10 October.
Young, Mei Ling (1984). 'Circular Mobility and Its Policy', Selected Papers, Third Asian and Pacific Population Conference, Asian Population Studies Series No. 58, ESCAP, Bangkok.
448
Zachariah, K.C. (1966). 'Bombay Migration study: A Pilot Analysis of Migration to an Asian Metropolis', Demography, 3, 2.
Zaidi, H.S.M. (1970). The Village Culture in Transition. A study of East Pakistan Rural Society. Nicholas, Ralph.
Zelinsky, w. (1971). rThe Hypothesis of the Mobility Transition r , Geographical Review, 41, 2.


![Rural Development Academy [RDA] Bogura, Bangladesh](https://static.fdokumen.com/doc/165x107/633366825c229e42ad09e485/rural-development-academy-rda-bogura-bangladesh.jpg)