Income Inequality and Self-Rated Health Status: Evidence from the European Community Household Panel
Growth and Distribution of Rural Income in Bangladesh: Analysis Based on Panel Survey DataAuthor(s): Mahabub Hossain, Binayak Sen and Hossain Zillur RahmanReviewed work(s):Source: Economic and Political Weekly, Vol. 35, No. 52/53 (Dec. 30, 2000 - Jan. 5, 2001), pp.4630-4637Published by: Economic and Political WeeklyStable URL: http://www.jstor.org/stable/4410108 .
Accessed: 17/01/2013 22:43
Your use of the JSTOR archive indicates your acceptance of the Terms & Conditions of Use, available at .http://www.jstor.org/page/info/about/policies/terms.jsp
.JSTOR is a not-for-profit service that helps scholars, researchers, and students discover, use, and build upon a wide range ofcontent in a trusted digital archive. We use information technology and tools to increase productivity and facilitate new formsof scholarship. For more information about JSTOR, please contact [email protected].
.
Economic and Political Weekly is collaborating with JSTOR to digitize, preserve and extend access toEconomic and Political Weekly.
http://www.jstor.org
This content downloaded on Thu, 17 Jan 2013 22:43:17 PMAll use subject to JSTOR Terms and Conditions
Growth and Distribution of Rural
Income in Bangladesh
Analysis Based on Panel Survey Data
This article highiights aspects of growth aid distribution ofic incoes in rural Bangladesh b: focu.sing on a set of households in the period between 1987-1995. It reports
findings on changes in distribution of landholings, education and occupation of rural workers, structure and distribution of incomes, and income and lnon-income dimensions of poverty.
The article concludes wi;t!h tihe view- that policies based on providinSg better access to capital and education fJor the pooir wiould imake a greater ilmpact oll poverty reductioin than
policies based on interventions in the operation of land and labour markets.
IMANIABUB HOSSAIN, BINA-YAK SEN, HOSSAIN ZILLUR RAtHMAN
Introduction A though the household expendi-
ture surveys (HES) carried out by the Bangladesh Bureau of Statis-
tics (BBS) represent a major source for
analysing trends in income distribution and poverty, the results have generated controversies, as they seemed incongruent with macroeconomic trends. Considerable controversies persisted - at least until recently - on the nature of the rural growth process, on the directionality of attendant changes in income inequality and poverty, and on possible factors that underlined such changes [Rahman and Haque 1988; Khan and Hossain 1989; Osmani 1989; Khan i9901. Consultation with a third source of primary data, such as the present study, can help clear up factual controver- sies thit cloud thinking on policies. Simi- larly. the need for going beyond the con- ventional analysis of cross-sectional data to shed light on what is going on 'behind the scenes' (,an hardly be exaggerated. This paper highlights the dynamic aspects of the growth and distribution of rural incomes by focusing on the changing for- tnlnes of the same set of nouseholds over time. Broadening the scope of conven- tional poverty analysis is an important step, given the increasiing emphasis in the lit- erature on policies beyond economic growth.
The focus of the paper is restricted to the analysis of factors co;tritfuting to the dynamics of rn.raln income v,,^ ri and its distribution. Tihe paper is stLructured as follows. Section II descriLbes the niethodo- logy used for selectincg the ';'ample. Sec-
tio'I III reports :he findings of the survey on changes in the .isset base, occupation structure, and technological progress in agriculture. The ;tructure and the growth of household incomres and their deter-mi- nants are reported in Section IV. The section also gives a brief review of the aggregate trend and the sources of income inequality. An estimate of the incemc-poverty ievel for each of the survey points is presented in Section V. The section also focuses oi trends in non-income dimensions of poverty with special focus on health and education. it also presents the households own perceptions of the changes in well- being, to provide a check on the trends derived on the basis of objective assess- ment. Section VI provides a summary of the findings and draws implications for policy.
Data and Methods Survey Methodaology
The sample for the study was drawn in 1987 using a multistage random sampling method for tih study cf the Differential Impact of Modern Rice Technology con- ducted by the Bangladesh Institute of Development Studies (BIDS) in collabo- ration with the International Rice Research Institute (IRRI [See Hossain et a1 199-,4; David and Otsuka 1994 for tiic findings of the study] In the first stage, 64 unions (to cover one union each from 64 districts in Bangladesh) were selected from the list of ali unions (the lowest level local govern- meni unit, using a randomci number table. InP the secon,d sta,e, infornnation on land :irea. tota populatioion and literacy rates
were obtained for all villages of the selec- ted unions from the district reports of the 1981 Population Census. Two villages were selected purposively for each union such that the population pressure and the literacy rate for the selected villages were similar to those for the selected union. Thus, 124 villages were selected, with the first choice in each pair in the village being the most representative of the union. A census of all households in the first choice village was undertaken to collect informa- tion on the ownership of land, adoption of modern rice varieties, and the major source of household incomes. Where the village community was found non-cooperative for conducting the study, the household survey was conducted in the second choice village. Two unions were dropped at this stage because of the problem of logistics for conducting the survey. The sample thus consisted of 62 villages from 57 districts.
The census of the selected villages enumerated totalled 9,874 households or 159 households per village. These house- holds were used as the sample frame for the final draw of the sample for data generation on the operation of the house- hold economy. The households were classified into four landownership catego- ries: (a) functionally landless (with less than 0.2 hectare of land), (b) small land- owner (0.2 to 1.0 ha), (c) medium land- owner (1.0-2.0 ha) and (d) large landowner (over 2.0 ha). Each of the landownership groups w as further classified into two sub- grou)ps according to .whether the house- hold was engaged in tenancy cultivation or not. Twenty households 'were then selected from each village using the pro-
4630 EK;oaor'i_c a?-d Po1tti: al Weekix DecernIber 30, 20(0(
This content downloaded on Thu, 17 Jan 2013 22:43:17 PMAll use subject to JSTOR Terms and Conditions
portionate random sampling method so that each of the eight (4x2) strata was represented according to its weight. In a few villages the sample size was 21 be- cause of rounding error. The total sample for the 1987 survey thus consisted of 1,245 households.
The selected households were inter- viewed with a structured questionnaire for generating data on demographic charac- teristics of all household members, utilisation of all landowned and operated by the household, costs and returns of cultivation of different crops. ownership of non-land assets, employment of work- ing members and earnings from non-farm activities, and perceptions of the house- holds regarding their economic standing in the village and changes in their eco- nomic conditions. The same households were re-surveyed by BIDS in 1990 [see Rahman and Hossain 1995 for the find- ings] and in 1995 for the project entitled 'Analysis of Poverty Trends' supported by the Like Minded Group of donors. The sample size was larger in the later surveys as many households were subdivided due to demographic pressures. All subdivided households were covered by the later surveys. There was also some attrition due to migration of some households from the village. This paper is based on the data from the 1988 and 1995 surveys.
Estimation of Income
The concept of income used in the study is comprehensive, including income re- ceived in kind and in cash. A money value was imputed to receipts in kind at prices prevailing in the survey village. House- hold consumption of self-produced crops and their by-products, and livestock, fish- ery, and forestry products are considered as incomes. The income from crop produc- tion activities is estimated as the value of the main product and by-products net of the costs on account of seeds, fertilisers, pesticides, irrigation charge, payment to hired labour, and draft and machine power. The income thus includes the imputed value of the utilisation of resources owned by the household, such as land, family workers, and draft aniimals. Due to lack of information, no allowance could be made for depreciation of fixed assets and the owner-occupied housing. Receipts friom disinvestment of assets and borrowings are not included in incomes. Implicit trans- fers on account of non-market access to public services such as education and health care should ideally be included in income accounting. The survey lacked informa- tion on this aspect.
Measures of Income Inequality and Poverty
The degree of inequality in the distribu- tion of income was measured by the Gini coefficient, as proposed by Sen (1973). The concentration coefficient was esti- mated by ranking households in the scale of per capita incomes. A Gini decompo- sition analysis was conducted to identify the factors contributing to overall income inequality by following the procedure sug- gested by Fei et al 1978), Pyatte ei (1980) and Shorrocks (1983). The changes in the poverty situation was assessed by measur- ing a class of indices - the head count ratio, the poverty gap ratio, and the squared poverty gap ratio - using the method pro- posed by Foster, Greer and Thorbeck (1984).
Ill Changes in Asset Base and
Livelihood Systems The findings showv that the number of
rural households increased by only 0.8 per cent and the population by 0.3 per cent per year during 1987-95 period, compared to a 2.1 per cent annual growth iri national population during the 1980s, as estimated by the 199 1 population census. Rural-urban migration contributed to a large extent to the reduction in rural population growth. The number of households who migrated during the 1988-95 period constituted 14 per centof households enumerated in 1988. Nearly 55 per cent of the migrants belong- ed to the landless households. and 20 per
cent to households with less than 0.2 h-a. The incidence of migration was low among the land-rich households although many experienced migration of educated members.
The changes in the age composition of the population indicated a substantial decline in the natural rate of population growth. The size of the 0-10 age group declined substantially during the 1998-95 period, while the number in the age group 10 and above increased at a rate of 2.3 per cent per year, similar to that estimated by the 1981 Population Census for the 1973-81 period. The ratio of young children (0-4 age group) to women in the reproductive age (16 to 50) is a good indicator of the current terti lity in the population. The child- woman ratio among the survey population declined from 77 per cent in 1988 to 50 per cent by 1995 indicating substantial reduction in the fertility rate. These demo- graphic changes were reflected in the reduction in household size from 6.16 in 1988 to 5.95 in 1995. a rate of decline of 0.5 per cent per year.
The progress in population control was not yet reflected in the availability of family 1abJur. J'he ave-age number of family workers (earning members) increased from .61 to 1.79 during the 1998-95 period.
The labour force participation rate among adult (16 +) male members in fact declined marginally from 85 to 82 per cent due to hi-gher school participation rate among young adults. The increase in the number of family workers .was due to higher fe- male participation in economiic activities
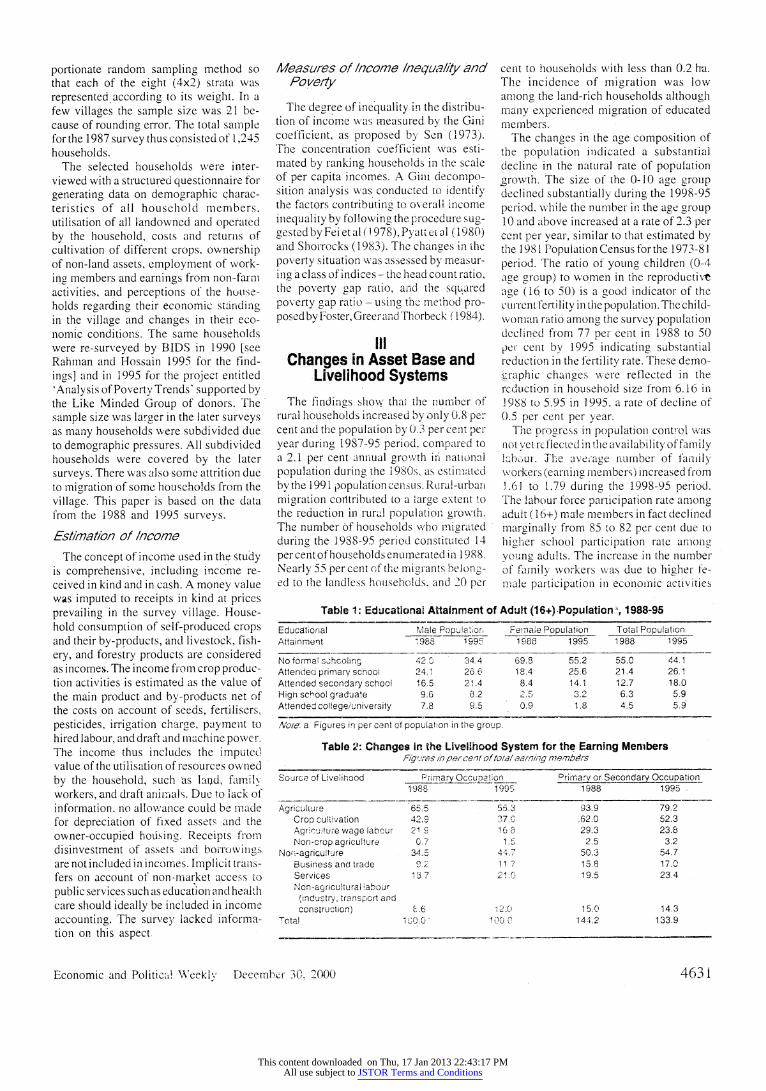
Table 1: Educational Attainment of Adult (16+) Population a, 1988-95
Educational Male Popu!atior Fe-naie Population Total Population Attainment 1988 1995 1988 1995 1988 1995
No formal schcolfin 42.0 34.4 69.8 55.2 55.0 44.1 Attended primary school 24.1 26.6 18.4 25.6 21.4 26.1 Attended secondary school 16.5 21.4 8.4 14.1 12.7 18.0
High school graduate 9.6 8.2 2.5 3.2 6.3 5.9 Attended college/university 7.8 9.5 0.9 1.8 4.5 5.9
Note: a Figures in per cent of population in the group.
Table 2: Changes In the Livelihood System for the Earning Menbers Fig,,'res n7 percent of total aarnig nmembnbrs
Source of Livelihood Primary Occupation Primary or Secondary Occupation 1988 1995 1988 1995
Agriculture 65.5 55.3 93.9 79.2 Crop cultivation 42.9 37.C .62.0 52.3 Agriculture wage labour 219 1 8 29.3 23.8
Non-crop agriculture 0.7 1 2.5 3.2
Nor--agriculture 34.5 44.7 50.3 54.7
Business and trade 9.2 11 15.8 17.0 Services 13.7 2119.5 23.4
Non-agricultural abour (industry, transport and construction) .6 2..C) 15.0 14.3
Total 1 0.0- 1 !00 144.2 133.9
Economic and Politicai Weekly December 30. 2000 4631
This content downloaded on Thu, 17 Jan 2013 22:43:17 PMAll use subject to JSTOR Terms and Conditions
outside the homestead, which increased from 7 to I 1 per cent over the period.
The quality of human capital seems to have improved (Table 1). The proportion of adult population without any formal schooling declined from 55 to 44 per cent, while those who attended secondary schools increased from 23 to 30 per cent. Those who had comnpleted high school or attended college were only 12 per cent of the adult population in 1995 and their proportion hardly changed over the 1988-95 period. There was a high rate of rural-urban migration from this category.
The changes in the livelihood system for the earning members can be seen from Table 2. In 1988 nearly two-thirds of the family workers were engaged in agricul- ture as the principal occupation; 43 per cent in farming activities for the house- hold, and 23 per cent selling labour services for others' farms. The dependence on agri- culture for livelihood however declined substantially over the period with increas- ing importance of rural non-farm activities. In 1995, 45 per cent of the workers were engaged in non-agricultural activities including various salauried and personal ser- vices, petty trade, shop-keeping and busi- ness, providing labour in agro-processing activities, transport operation and road and house construction. The number of culti- vators remained almost the same, while agricultural labourers declined by 1.7 per cent per year and non-agricultural workers increased by 6 per cent per year. The mobility of the labour force from agricul- ture to non-farm activities was facilitated by the improvement in rural infrastructure and human capital, and the technological progress in agriculture (see below) that generated employment opportunities in rural trade and transport sectors. The in- cidence of multiple occupations declined with greater importance of non-farm employment as the source of livelihood.
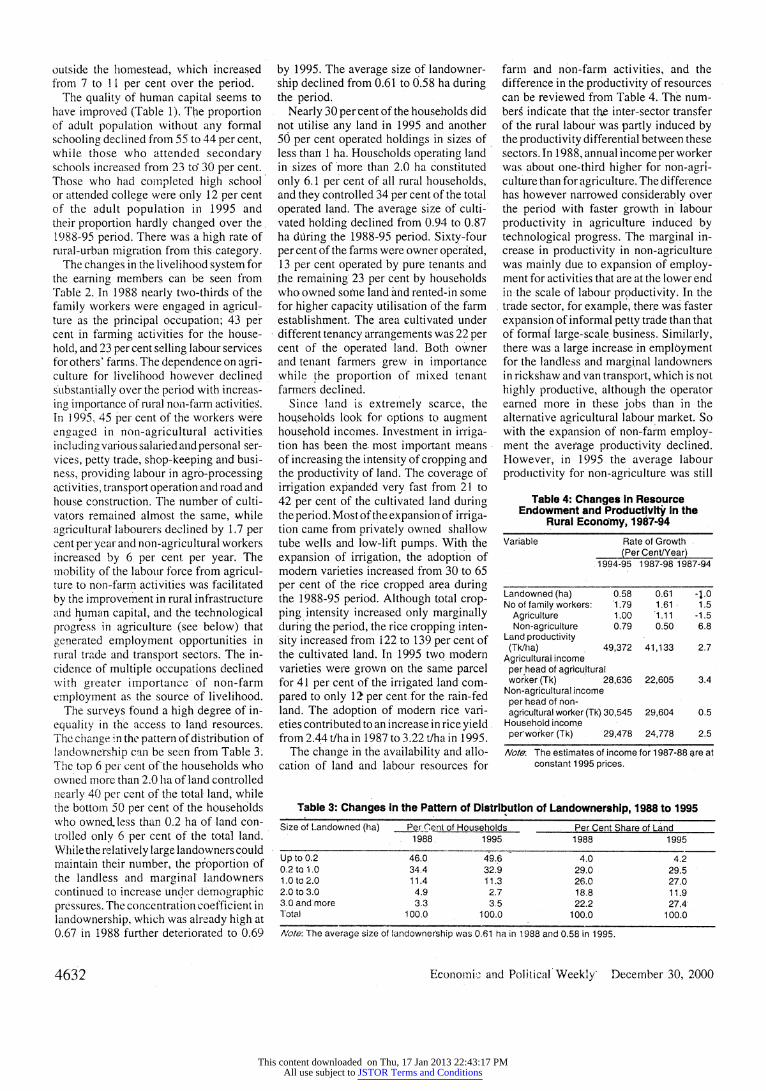
The surveys found a high degree of in- equality in the access to land resources. The change in the pattern of distribution of landownership can be seen from Table 3. The top 6 pei cent of'the households who owned more than 2.0 ha of land controlled nearly 40 per cent of the total land, while the bottom 50 per cent of the households who owned less than 0.2 ha of land con- trolled only 6 per cent of the total land. While the relatively large landowners could maintain their number, the proportion of the landless and marginal landowners continued to increase under demographic pressures. The concentration coefficient in landownership, which was already high at 0.67 in 1988 further deteriorated to 0.69
by 1995. The average size of landowner- ship declined from 0.61 to 0.58 ha during the period.
Nearly 30 percent of the households did not utilise any land in 1995 and another 50 per cent operated holdings in sizes of less than 1 ha. Households operating land in sizes of'more than 2.0 ha constituted only 6.1 per cent of all rural households, and they controlled 34 per cent of the total operated land. The average size of culti- vated holding declined from 0.94 to 0.87 ha during the 1988-95 period. Sixty-four per cent of the farms were owner operated, 13 per cent operated by pure tenants and the remaining 23 per cent by households who owned some land and rented-in some for higher capacity utilisation of the farm establishment. The area cultivated under different tenancy arrangements was 22 per cent of the operated land. Both owner and tenant farmers grew in importance while the proportion of mixed tenant farmers declined.
Since land is extremely scarce, the households look for options to augment household incomes. Investment in irriga- tion has been the most important means of increasing the intensity of cropping and the productivity of land. The coverage of irrigation expanded very fast from 21 to 42 per cent of the cultivated land during the period. Most of the expansion of irriga- tion came from privately owned shallow tube wells and low-lift pumps. With the expansion of irrigation, the adoption of modem varieties increased from 30 to 65 per cent of the rice cropped area during the 1988-95 period. Although total crop- ping intensity increased only marginally during the period, the rice cropping inten- sity increased from 122 to 139 per cent of the cultivated land. In 1995 two modern varieties were grown on the same parcel for 41 per cent of the irrigated land com- pared to only 12 per cent.for the rain-fed land. The adoption of modern rice vari- eties contributed to an increase in rice yield from 2.44 t/ha in 1987 to 3.22 tlha in 1995.
The change in the availability and allo- cation of land and labour resources for
farm and non-farm activities, and the difference in the productivity of resources can be reviewed from Table 4. The num- berg indicate that the inter-sector transfer of the rural labour was partly induced by the productivity differential between these sectors. In 1988, annual income per worker was about one-third higher for non-agri- culture than for agriculture. The difference has however narrowed considerably over the period with faster growth in labour productivity in agriculture induced by technological progress. The marginal in- crease in productivity in non-agriculture was mainly due to expansion of employ- ment for activities that are at the lower end in the scale of labour productivity. In the trade sector, for example, there was faster expansion of informal petty trade than that of formal large-scale business. Similarly, there was a large increase in employment for the landless and marginal landowners in rickshaw and van transport, which is not highly productive, although the operator earned more in these jobs than in the alternative agricultural labour market. So with the expansion of non-farm employ- ment the average productivity declined. However, in 1995 the average labour productivity for non-agriculture was still
Table 4: Changes in Resource Endowment and Productivitj in the
Rural Economy, 1987-94
Variable Rate of Growth (Per Cent/Year)
1994-95 1987-98 1987-94
Landowned (ha) 0.58 0.61 -1.0 No of family workers: 1.79 1.61 1.5
Agriculture 1.00 1.11 -1.5 Non-agriculture 0.79 0.50 6.8
Land productivity (Tk/ha) 49,372 41,133 2.7
Agricultural income per head of agricultural worker (Tk) 28,636 22,605 3.4
Non-agricultural income per head of non- agricultural worker (Tk) 30,545 29,604 0.5
Household income per'worker (Tk) 29,478 24,778 2.5
Note: The estimates of income for 1987-88 are at constant 1995 prices.
Table 3: Changes in the Pattern of Distribution of Landownership, 1988 to 1995
Size of Landowned (ha) Per Cent of Households Per Cent Share of Land 1988. 1995 1988 1995
Up to 0.2 46.0 49.6 4.0 4.2 0.2 to 1.0 34.4 32.9 29.0 29.5 1.0 to 2.0 11.4 11.3 26.0 27.0 2.0 to 3.0 4.9 2.7 18.8 11.9 3.0 and more 3.3 3.5 22.2 27.4 Total 100.0 100.0 100.0 100.0
'ote: The average size of landownership was 0.61 ha in 1988 and 0.58 in 1995.
4632 Economic and Political Weekly' December 30, 2000
This content downloaded on Thu, 17 Jan 2013 22:43:17 PMAll use subject to JSTOR Terms and Conditions
7 per cent higher than that for agriculture. Overall, the land productivity in agricul- ture increased at 2.7 per cent per year, and the labour productivity in all rural acti- vities increased at 2.5 per cent per year, indicating a respectable increase in total factor productivity.
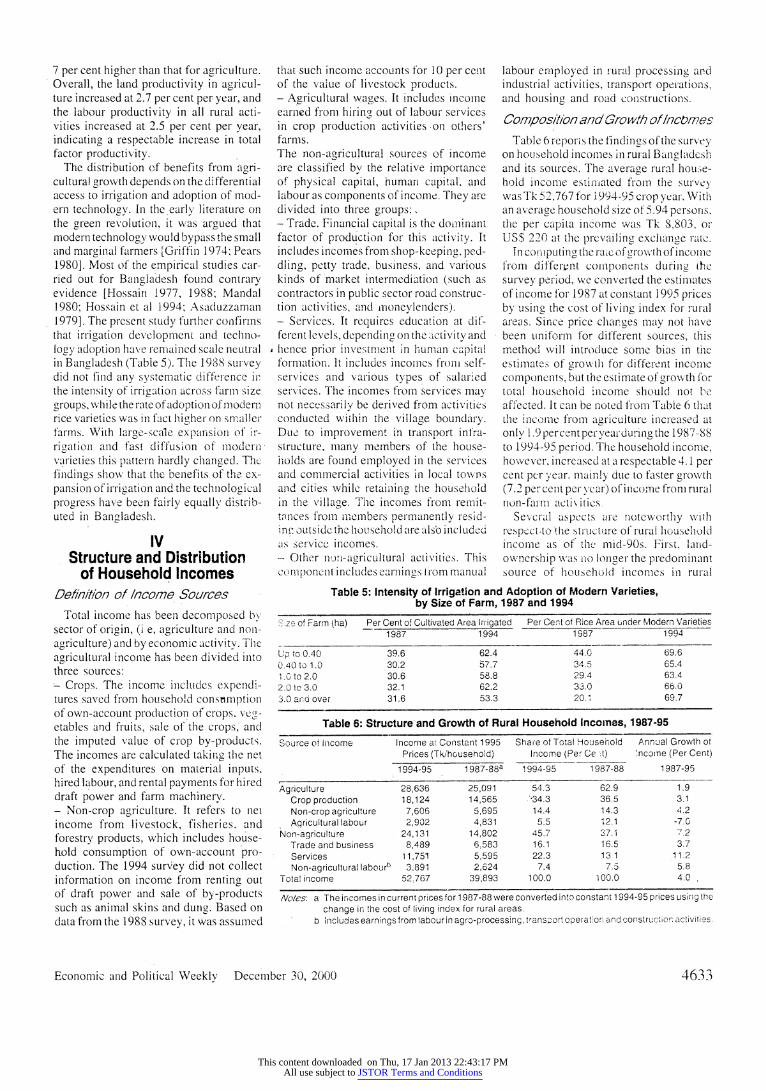
The distribution of benefits from agri- cultural growth depends on the differential access to irrigation and adoption of mod- ern technology. In the early literature on the green revolution, it was argued that modern technology would bypass the small and marginal farmers [Griffin 1974: Pears 1980]. Most of the empirical studies car- ried out for Bangladesh found contrary evidence [Hossain 1977, 1988; Mandal 1980; Hossain et al 1994; Asaduzzaman 1979]. The present study further confirms that irrigation development and techno- logy adoption have remained scale neutral in Bangladesh (Table 5). The 1988 survey did not find any systematic difference ii the intensity of irrigation across farm size groups, while the rate of adoption of modemc rice varieties was in fact higher on smaller farms. With large-scale expansion of ir- rigation and fast diffusion of mIodern varieties this pattern hardly changed. The findings show that the benefits of the ex-- pansion of irrigation and the technological progress have been fairly equally distrib- uted in Bangladesh.
IV Structure and Distribution
of Household Incomes Defin/iion of /ncome Sources
Total income has been decomposed by sector of origin, (i e, agriculture and non- agriculture) and by economic activity. The agricultural income has been divided into three sources: -Crops. The income includes expendi-
tures saved from household consumption of own-account production of crops. veg- etables and fruits, sale of the crops, and the imputed value of crop by-products. The incomes are calculated taking the net of the expenditures on material inputs. hired labour, and rental payments for hired draft power and farm machinery. - Non-crop agriculture. It refers to net income from livestock, fisheries, and forestry products, which includes house- hold consumption of own-account pro- duction. The 1994 survey did not collect information on income from renting out of draft power and sale of by-products such as animal skins and dung. Based on data from the 1988 survey, it was assumed
that such income accounts for 10 per cent of the value of livestock products. - Agricultural wages. It includes income earned from hiring out of labour services in crop production activities on others' farms. The non-agricultural sources of income are classified by the relative importance of physical capital, human capital. and labour as components of income. They are divided into three groups:, - Trade. Financial capital is the dominant factor of production for this activity. It includes incomes from shop-keeping, ped- dling, petty trade, business, and various kinds of market intermediation (such as contractors in public sector road construc- tion activities, and moneylenders). - Services. It requires education at dif- ferent levels, depending on the activity and hence prior investment in human capital formation. It includes incomes from self- services and various types of salaried services. The incomes from services may not necessarily be derived from activities conducted within the village boundary. Due to improvement in transport infra- structure, many members of the house- holds are found employed in the services and commercial activities in local towns and cities while retaining the household in the village. The incomes from remit- tances from members permanently resid- int( outside the household are also included as service incomes. - Other non--agricultural activities. This
component includes earnings from manual
labour employed in rural processing and industrial activities, transport operations, and housing and road constructions.
Composi/ion and Growth of/nc~mes
Table 6 reports the findings of the survey on household incomes in rural Bangladesh and its sources. The average rural hous;e- hold income estimated from the survey was Tk S2,767 for i 994-95 crop year. With an average household size of 5.94 persons, the per capita income was Tk 8,803, or US$ 220 at the prevailing exchange rate.
In computing the raI e of rovwth of incoine from different coImponents during the survey period, we converted the estimates of income for 1987 at constant 1995 prices by using the cost of living index for rural areas. Since price changes may not have been uniform- for different sources, this method will introduce some bias in the estimates of growth for different income components, but the estimate of growth for total household income should not be affected. It can be noted from Table 6 that the income from agriculture increased at only 1.9 percent per year during the 1987-88 to 1994-95 period. The household income, however, increased at a respectable 4. 1 per cent per year. mainly due to faster growth (7.2 per cent per year) of income fronl rural non-farm activities.
Several aspects are noteworthy Nwith respect.to the structure of rural household income as of the mid-90s. First, land- ownership was ino longer the predominant source of household incomes in rural
Table 5: Intensity of Irrigation and Adoption of Modern Varieties, by Size of Farm, 1987 and 1994
S z of Farm (ha) Per Cent of Cultivated Area Irrigated Per Cent of Rice Area under Modern Varieties 1987 1994 1987 1994
Up to 0.40 39.6 62.4 44.0 69.6 0.40 to 1.0 30.2 57.7 34.5 65.4 1.0 to 2.0 30.6 58.8 29.4 63.4 2.0 to 3.0 32.1 62.2 33.0 66..0 3.0 and over 31.6 53.3 20.1 69.7
Table 6: Structure and Growth of Rural Household Incomes, 1987-95
Source of Income Income at Constant 1995 Share of Total Household Annual Growth of Prices (Tk/household) Income (Per Ce -t) 'ncome (Per Cent)
1994-95 1987-88a 1994-95 1987-88 1987-95
Agriculture 28,636 25,091 54.3 62.9 1.9
Crop production 18,124 14,565 '-34.3 36.5 3.1
Non-crop agriculture 7,606 5,695 14.4 14.3 4.2
Agricultural labour 2,902 4,831 5.5 12.1 -7.0
Non-agriculture 24,131 14,802 45.7 37.i 7.2 Trade and business 8,489 6,583 16.1 16.5 3.7 Services 11,751 5,595 22.3 131 11.2
Non-agricultural labourb 3,891 2,624 7.4 7.5 5.8 Total income 52.767 39,893 100.0 100.0 4.0
Notes: a The incomes in current prices for 1987-88 were converted into constant 1994-95 prices using the
change in the cost of living index for rural areas. b includes earnings from labour in agro-processing, transport operation and construction activities.
Economic and Political Weekly December 30, 2000 4633
This content downloaded on Thu, 17 Jan 2013 22:43:17 PMAll use subject to JSTOR Terms and Conditions
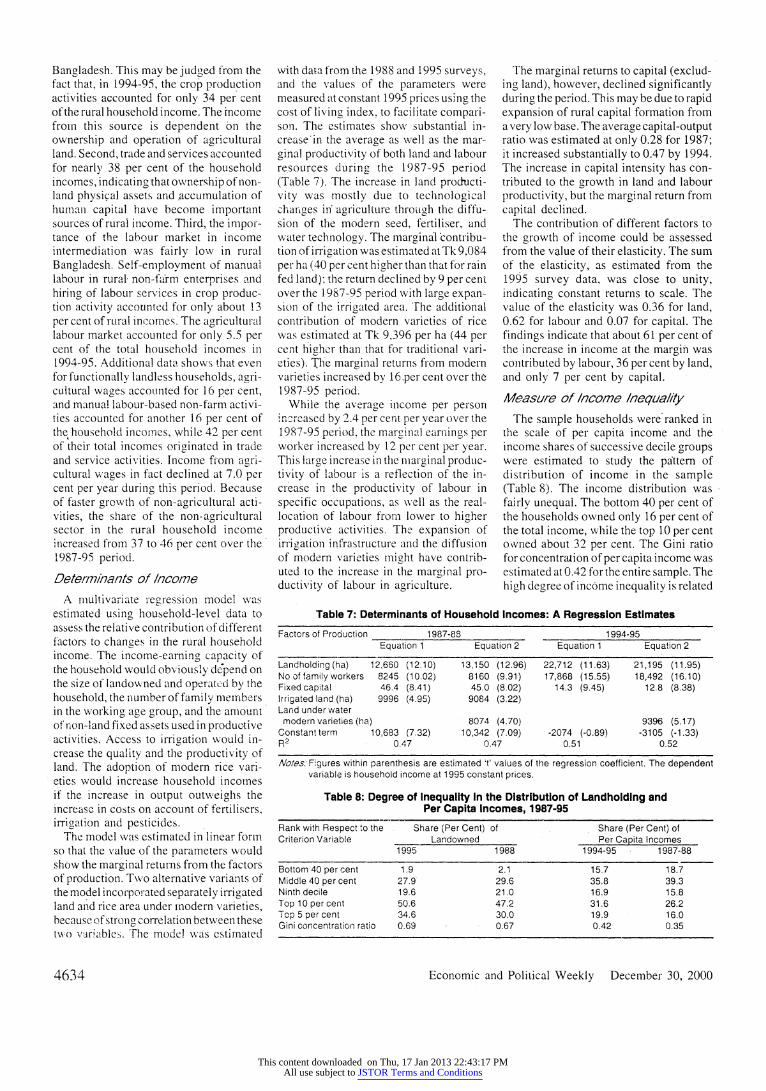
Bangladesh. This may be judged from the fact that, in 1994-95, the crop production activities accounted for only 34 per cent of the rural household income. The mcome from this source is dependent on the ownership and operation of agricultural land. Second, trade and services accounted for nearly 38 per cent of the household incomes, indicating that ownership of non- land physical assets and accumulation of human capital have become important sources of rural income. Third, the impor- tance of the labour market in income intermediation was fairly low in rural Bangladesh. Self-employment of manual labour in rural non-farm enterprises and hiring of labour services in crop produc- tion activity accounted for only about 13 per cent of rural incomes. The agricultural labour market accounted for only 5.5 per cent of the total household incomes in 1994-95. Additional data shows that even for functionally landless households, agri- cultural wages accounted for 16 per cent, and manual labour-based non-farm activi- ties accounted for another 16 per cent of the household incomes, while 42 per cent of their total incomes originated in trade and service activities. Income from agri- cultural wages in fact declined at 7.0 per cent per year during this period. Because of faster growth of non-agricultural acti- vities, the share of the non-agricultural sector in the rural household income increased from 37 to 46 per cent over the 1987-95 perio(d.
Determ/iants of Income
A multivariate regression model was estimated using household-level data to assess the relative contribution of different factors to changes in the rural household income. The income-earning capacity of the household would obviously depend on the size of landowned and operated by the household, the number of family memrbers in the working age group, and the amount of non-land fixed assets used in productive activities. Access to irrigation would in- crease the quality and the productivity of land. The adoption of modern rice vari- eties would increase household incomes if the increase in output outweighs the increase in costs on account of fertilisers, irrigation and pesticides.
The model was estimated in linear form so that the value of the parameters would show the marginal returns from the factors of production. Two alternative variants of the model incorpo-ated separately irrigated land and rice area under modern varieties, because of strong correlation between these two variables. The model was estimated
with data from the 1988 and 1995 surveys, and the values of the parameters were measured at constant 1995 prices using the cost of living index, to facilitate compari- son. The estimates show substantial in- crease'in the average as well as the mar- ginal productivity of both land and labour resources during the 1987-95 period (Table 7). The increase in land producti- vity was mostly due to technological changes in agriculture through the diffu- sion of the modern seed, fertiliser, and water technology. The marginal contribu- tion of irrigation was estimated at Tk 9,084 per ha (40 per cent higher than that for rain fed land); the return declined by 9 per cent over the 1987-95 period with large expan- sion of the irrigated area. The additional contribution of modern varieties of rice was estimated at Tk 9,396 per ha (44 per cent higher than that for traditional vari- eties). The marginal returns from modern varieties increased by 16.per cent over the 1987-95 period.
While the average income per person increased by 2.4 per cent per year over the 1987-95 period, the marginal earnings per worker increased by 12 per cent per year. This large increase in the marginal produc- tivity of labour is a reflection of the in- crease in the productivity of labour in specific occupations, as well as the real- location of labour from lower to higher productive activities. The expansion of irrigation infrastructure and the diffusion of modern varieties might have contrib- uted to the increase in the marginal pro- ductivity of labour in agriculture.
The marginal returns to capital (exclud- ing land), however, declined significantly during the period. This may be due to rapid expansion of rural capital formation from a very low base. The average capital-output ratio was estimated at only 0.28 for 1987; it increased substantially to 0.47 by 1994. The increase in capital intensity has con- tributed to the growth in land and labour productivity, but the marginal return from capital declined.
The contribution of different factors to the growth of income could be assessed from the value of their elasticity. The sum of the elasticity, as estimated from the 1995 survey data, was close to unity, indicating constant returns to scale. The value of the elasticity was 0.36 for land, 0.62 for labour and 0.07 for capital. The findings indicate that about 61 per cent of the increase in income at the margin was contributed by labour, 36 per cent by land, and only 7 per cent by capital.
Measure of Income Inequality The sample households were ranked in
the scale of per capita income and the income shares of successive decile groups were estimated to study the pattern of distribution of income in the sample (Table 8). The income distribution was fairly unequal. The bottom 40 per cent of the households owned only 16 per cent of the total income, while the top 10 per cent owned about 32 per cent. The Gini ratio for concentration of per capita income was estimated at 0.42 for the entire sample. The high degree of income inequality is related
Table 7: Determinants of Household Incomes: A Regression Estimates
Factors of Production 1987-88 1994-95 Equation 1 Equation 2 Equation 1 Equation 2
Landholding (ha) 12,660 (12.10) 13,150 (12.96) 22,712 (11.63) 21,195 (11.95) No of family workers 8245 (10.02) 8160 (9.91) 17,868 (15.55) 18,492 (16.10) Fixed capital 46.4 (8.41) 45.0 (8.02) 14.3 (9.45) 12.8 (8.38) Irrigated land (ha) 9996 (4.95) 9084 (3.22) Land under water
modern varieties (ha) 8074 (4.70) 9396 (5.17) Constant term 10,683 (7.32) 10,342 (7.09) -2074 (-0.89) -3105 (-1.33) R2 0.47 0.47 0.51 0.52
Notes. Figures within parenthesis are estimated 't' values of the regression coefficient. The dependent variable is household income at 1995 constant prices.
Table 8: Degree of Inequality in the Distribution of Landholding and Per Capita Incomes, 1987-95
Rank with Respect to the Share (Per Cent) of Share (Per Cent) of Criterion Variable Landowned Per Capita Incomes
1995 1988 1994-95 1987-88
Bottom 40 per cent 1.9 2.1 15.7 18.7 Middle 40 per cent 27.9- 29.6 35.8 39.3 Ninth decile 19.6 21.0 16.9 15.8 Top 10 per cent 50.6 47.2 31.6 26.2 Top 5 per cent 34.6 30.0 19.9 16.0 Gini concentration ratio 0.69 0.67 0.42 0.35
4634 Economic and Political Weekly December 30, 2000
This content downloaded on Thu, 17 Jan 2013 22:43:17 PMAll use subject to JSTOR Terms and Conditions
to the inequality in the distribution of landownership. The top 10 per cent of the rural households controlled 51 per cent of the total land, while the bottom 40 per cent owned only 2 per cent
There was a substantial deterioration of income distribution during the 1987-95 period. The income share of the bottom 40 per cent of the households declined from 19 to 16 per cent, while the share of the top 10 per cent of the households increased from 26 to 32 per cent. The value of the Gini concentration ratio increased from 0.35 to 0.42. An in-depth investiga- tion revealed that this was due to the drastic reduction in the crop sector income in several villages because of the disastrous flood in 1987. The reduction in crop sector income was obviously higher for larger landowning households. The land-poor households gained during that year from the relief and employment support pro- gramme undertaken by the government after the flood [Hossain and Akash 1994]. The allocation of expenditure for relief and development through rural public work programmes (Food for Work and Vulner- able Group Development) had declined since then, which may have contributed to the worsening income distribution during the 1987-95 period.
Sources of Income Inequaifty The distribution of total income may
change because of changes in the distri- bution of individual components of in- come and/or changes in the income share of the component. If additional income is derived from a relatively equally distri- buted source, income distribution will improve. Conversely, if the faster growing sources of income are more unequally distributed, the inequality in the distribu- tion of income will worsen.
The economic position of a household depends on the per capita income and not on the income from different components. So the Gini ratio of income for the com- ponent source does not have an economic meaning. Hence, we measured the concen- tration ratio of income from different components by maintaining.the same rank of the households in the scale of per capita income. These pseudo-Gini ratios for different components of income, and the results of the Gini decomposition analysis are reported in Table 9.
As expected, the crop sector income was highly unequally distributed because of the skewed distribution of landownership. But incomes from trade and services were almost as unequally distributed. About 65 per cent of the incomes from trade and 60
per cent of the incomes from services were concentrated in the hands of the top 40 per cent of the households in the per capita income ladder. Thus, employment and income opportunities in the fast growing nort-agricultural activities were also cap- tured by the relatively high-income groups, presumably due to their better access to capital and credit and improved human capital and their capacity to invest in education of the children. The income from agricultural wages and processing and transport and construction activities were distributed in favour of the lower income groups as shown by the low and negative values of the pseudo-Gini ratios for these components of income. Nearly 70 per cent of the agricultural wage income ac- crued to the bottom 40 ner cent of the households.
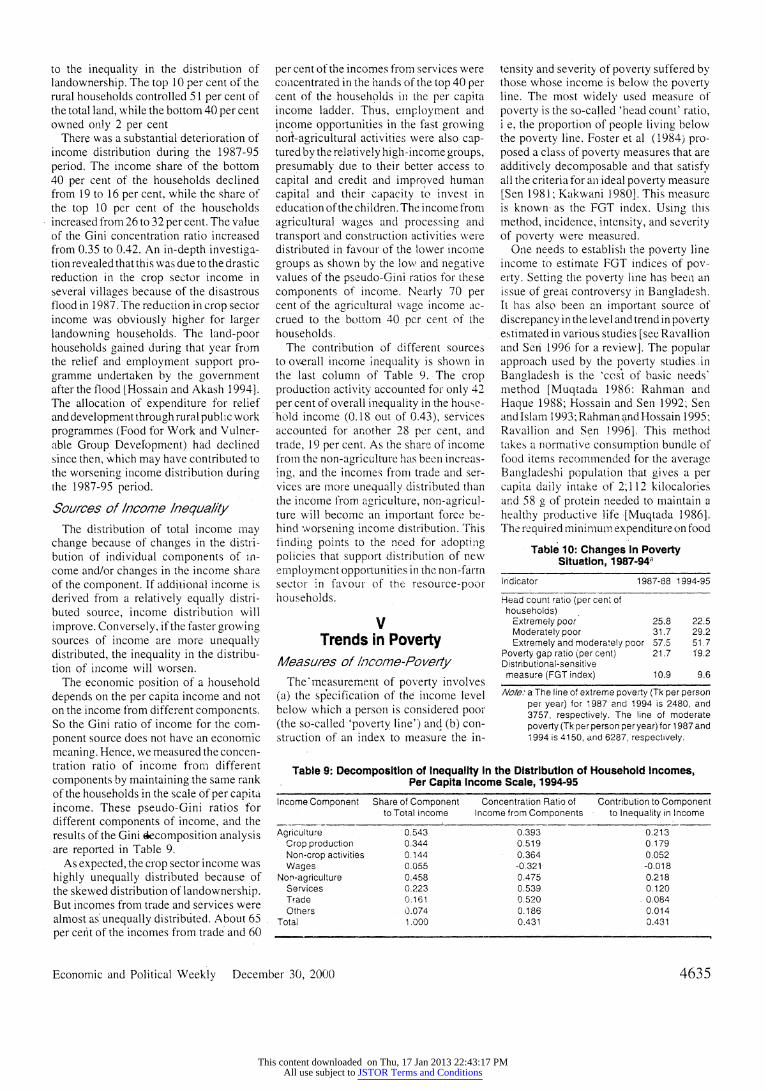
The contribution of different sources to overall income inequality is shown in the last column of Table 9. The crop production activity accounted for only 42 per cent of overall inequality in the house-
'hold income (0.18 out of 0.43), services accounted for another 28 per cent, and trade, 19 per cent. As the share of income from the non-agriculture has been increas- ing, and the incomes from trade and ser- vices are more unequally distributed than the income from agriculture, non-agricul- ture will become an important force be- hind worsening income distribution. This finding points to the need for adopting policies that support distribution of new employment opportunities in the non-farm sector in favour of the resource-poor households.
V Trends in Poverty
Measures of /ncome-Poverty The'measurement of poverty involves
(a) the specification of the income level below which a person is considered poor (the so-called 'poverty line') and (b) con- struction of an index to measure the in-
tensity and severity of poverty suffered by those whose income is below the poverty line. The most widely used measure of poverty is the so-called 'head count' ratio, i e, the proportion of people living below the poverty line. Foster et al (1984) pro- posed a class of poverty measures that are additively decomposable and that satisfy all the criteria for an ideal poverty measure [Sen 1981; Kakwani 1980]. This measure is known as the FGT index. Using this method, incidence, intensity, and severity of poverty were measured.
One needs to establish the poverty line income to estimate FGT indices of pov- erty. Setting the poverty line has been an issue of great controversy in Bangladesh. It has also been an important source of discrepancy in the level and trend in poverty estimated in various studies [see Ravallion and Sen 1996 for a review]. The popular approach used by the poverty studies.in Bangladesh is the 'cost of basic needs' method [Muqtada 1986: Rahman and Haque 1988; Hossain and Sen 1992; Sen and Islam 1993; Rahman and Hossain 1995; Ravailion and Sen 1996]. This method takes a normative consumption bundle of food items recommended for the average Bangladeshi population that gives a per capita daily intake of 2;112 kilocalories and 58 g of protein needed to maintain a healthy productive life [Muqtada 1986]. The required minimum expenditure on food
Table 10: Changes in Poverty Situation, 1987-94a
Indicator 1987-88 1994-95
Head count ratio (per cent of households)
Extremely poor 25.8 22.5 Moderately poor 31.7 29.2 Extremely and moderately poor 57.5 51.7
Poverty gap ratio (per cent) 21.7 1'9.2 Distributional-sensitive measure (FGT index) 10.9 9.6
Note: a The line of extreme poverty (Tk per person per year) for 1987 and 1994 is 2480, and 3757, respectively. The line of moderate poverty (Tk per person per year) for 1987 and 1994 is 4150, and 6287, respectively.
Table 9: Decomposition of Inequality in the Distribution of Household Incomes, Per Capita Income Scale, 1994-95
Income Component Share of Component Concentration Ratio of Contribution to Component to Total income Income from Components to Inequality in Income
Agriculture 0.543 0.393 0.213 Crop production 0.344 0.519 0.179 Non-crop activities 0.144 0.364 0.052 Wages 0.055 -0.321 -0.018
Non-agriculture 0.458 0.475 0.218 Services 0.223 0.539 0.120 Trade 0.161 0.520 0.084 Others 0.074 0.186 0.014
Total 1.000 0.431 0.431
Economic and Political Weekly December 30, 2000 4635
This content downloaded on Thu, 17 Jan 2013 22:43:17 PMAll use subject to JSTOR Terms and Conditions
items is estimated by using a set of prices for the reference year for the representative group of population. Earlier studies on poverty used national level retail prices for the reference year for representative food items as published in the Statistical Year- book of Bangladesh. More recent studies [Hossain and Sen 1992: Sen and Islam 1993] derived prices from the information on value and quantity for different food items published in the HES Reports. An additional 40 per cent allowance is then made for incomes needed to satisfy the non-food basic needs. This assumption is based on the finding of the HES that the expenditure group on the margin of pov- erty allocates 60 per cent of their consump- tion expenditure on food items [BBS 1989].
In this study, we basicall) followed the above approach to set the poverty line. In reporting results of the previous survey, official data on retail prices for Bangladesh were used. The 1995 survey, however, collected village-specific information on prices of basic necessities, which were used to measure village-specific poverty line. For non-food items, we used the change in consumer price index for the country as a whole since such information is not available for rural areas. This will introduce an upward bias in the estimate of poverty, since most rural households do not pay for such non-food items (such as house rent, electricity) and the level of expenditure on transport, recreation, edu- cation, and health is substantially lower in rural areas than in urban areas.
The measures of the severi.ty of poverty shown by the FGT index would depict what has been happening to changes in income among the poorer of the poor. This measure is however difficult to interpret. To see what has been happening at the lower end of the poverty scale, we used a lower poverty line income needed to have at least 1,800 kilocalories per person per day and called the households below this line as extremely poor, and those with enough incomes to obtain between 1,800 and 2,112 kilocalories as moderately poor. The lines of extreme poverty are estimated at 60 per cent of the line for moderate poverty following the findings of the 1985-86 HES of the Bangladesh Bureau of Statistics [BBS 1989]. This estimate is based on the relationship between per capita income and calorie intake at the household level.
The estimates of the percentage of households living below the poverty line are reported in Table 10. The head-count measure showed considerable improve- ment in the poverty situation during the
1987-95 period. The proportion of house- holds below the line of moderate poverty declined from 58 percent in 1987-88 to about 52 per cent in 1994-95. There was also a significant improvement in eco- nomic conditions of the poorer group among the poor. The number of extremely poor declined from 26 to 23 per cent.
The intensity of poverty is measured by the average gap of the income of the poor households from the poverty line. The poverty gap ratio declined from 22 percent in 1987-88 to 19 per cent in 1994-95, indi- cating an improvement in the intensity of poverty. The FGT index of poverty gives higher weights to income gains accruing to the poorer among the poor households. The FGT index declined only marginally from 10.9 to in 1989 to 9.6, indicating improvement in economic conditions at the lower end of the poverty scale also.
Non-Income Dimensions of Poverty
The survey collected other information on levels of living that are indirect indi- cators of extreme deprivations. One such information is the availability of warm clothes to protect themselves against low temperatures from December to February. Another is the possession of at least two sets of clothing so that the-person can wear a set while the other is cleaned and.dried after bathing. Deprivation of these basic clothing needs is an indication of severe economic distress. The 1990 survey found 15 percent of the sample population having less than two sets of clothing and 22 per cent without any winter clothing. But the situation has considerably improved since then. By 1995, people with less than two sets of clothing dropped to 3.5 per cent and those without any warm clothes to 6.7 per cent.
The survey also collected information on the health status of the sample popu- lation as an indicator of the outcome of economic distress. Members of households who were reported as either chronically ill or disabled were 3.2 per cent of the total population in 1988. The number dropped
to 2.3 percent by 1995. Members reported as occasionally ill and not fully able to participate in economic activities were 12.0 per cent of the sample in 1988; the number dropped to 9.8 per cent by 1995. The inci- dence of ill health was higherfor the female populations. The data show an improve- ment in health conditions during 1988-95 for both male and female populations. The magnitude of the problem, however, re- mains at a level that is not socially accept- able. Twelve per cent of the people still cannot lead a healthy active life, and 2.3 per cent are entirely dependent on others for their care and livelihood.
There has also been a significant im- provement in the levels of literacy. Nearly 42 per cent of the male and 70 per cent of the female population aged six and above had no formal schooling'during the 1988 survey. The number dropped to 34 and 55 per cent, respectively, at the time of the 1995 survey. There has been substantial increase in the number of those who at- tended primary and secondary schools, for both male and female population.
Another qualitative indicator of poverty would be the incidence of child labour. Participation in economic activities for children in the 11 to 15 age group droppecd from 20 per cent in 1988 to 12 per cent in 1995. Child labour was prevalent mostly among the male population; their labour force.participation rate declined from 30 to 21 per cent. The reduction in partici- pation rate was partly due to increased school attendance rate.
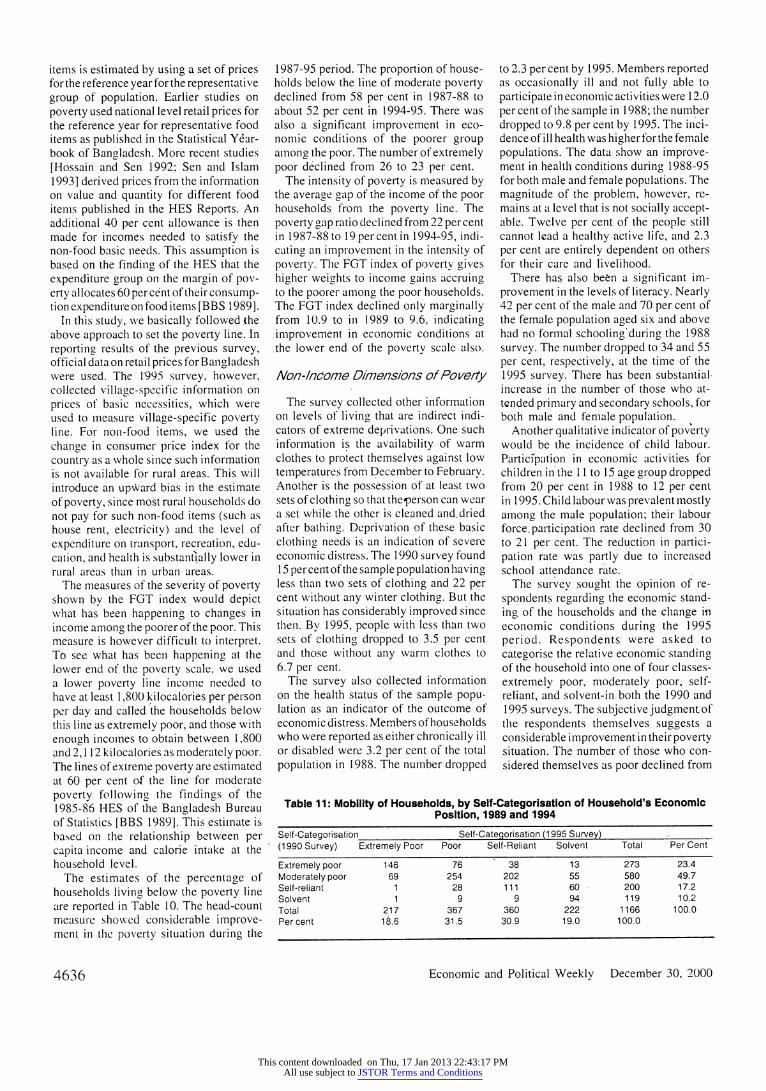
The survey sought the opinion of re- spondents regarding the economic stand- ing of the households and the change in economic conditions during the 1995 period. Respondents were asked to categorise the relative economic standing of the household into one of four classes- extremely poor, moderately poor, self- reliant, and solvent-in both the 1990 and 1995 surveys. The subjective judgment of the respondents themselves suggests a considerable improvement in theirpoverty situation. The number of those who con- sidered themselves as poor declined from
Table 11: Mobility of Households, by Self-Categorisation of Household's Economic Position, 1989 and 1994
Self-Categorisation Self-Categorisation (1995 Survey) (1990 Survey) Extremely Poor Poor Self-Reliant Solvent Total Per Cent
Extremely poor 146 76 38 13 273 23.4 Moderately poor 69 254 202 55 580 49.7 Self-reliant 1 28 111 60 200 17.2 Solvent 1 9 9 94 119 10.2 Total 217 367 360 222 1166 100.0 Percent 18.6 31.5 30.9 19.0 100.0
4636 Economic and Political Weekly December 30, 2000
This content downloaded on Thu, 17 Jan 2013 22:43:17 PMAll use subject to JSTOR Terms and Conditions
74 per cent in 1990 to about 50 per cent by 1995. Those who perceived themselves as extremely poor also declined from 24 to 18 per cent (Table 11).
The respondents were also asked in the 1995 resurvey to report the change in their economic conditions over the last five years and the reasons for the change. Improve- ment in economic conditions was reported by 39 per cent, and deterioration, by 19 per cent. Others stated that their economic condition had remained unchanged. Major factors behind improvement were reported as higheremployment opportunities, adop- tion of a modem rice variety, more earning members, higher profits in business, fewer family members to feed, and hard work, in that order of importance. The reasons behind deterioration were mentioned as fewereanling members, lack of employment opportunities, illness of earning members, natural disasters, payment of dowry and increase in the number of family members.
VI Conclusion
Although the growth of agricultural income decelerated in the early 1990s, total factor productivity in the overall rural economy increased at a satisfactory rate. The main contributors to growth in pro- ductivity were rapid expansion of irriga- tion and diffusion of modem high-yield- ing rice varieties. Non-crop agricultural activities, such as livestock and fisheries, also registered an impressive growth dur- ing the period. Labour productivity was substantially higher in non-farm activities than in agriculture, which provided incen- tives to movement of labour from agricul- ture to non-agricultural sector. Opportu- nities for non-farm employment have, however, been available to households with literate members and better access to capital.
An important factor behind the improve- ment in rural economic conditions has been the drastic reduction in the growth of the rural population due to rapid rural- urban migration and the reduction in the fertility rate. The success in population control had not yet made any impact on the rural labour force at the time of the 1995 survey. The rural labour force grew at 2.0 per cent per year during the 1987-95 period. The additional labour force found employment mostly in the non- agricultural activities.
The household income was fairly un- equally distributed mainly because of the high concentration in the ownership of land, the most important asset in rural areas. The Gini ratio is estimated at 0.69
for landownership and 0.42 for income. An analysis of the decomposition of in- come inequality by sources of income revealed that nearly half of the income inequality was on account of the concen- tration of non-agricultural incomes. In- comes from trade, services and livestock production were distributed more in favour of the higher income groups. The concen- tration in total household incomes deterio- rated during the period because of the increase in the share of non-agricultural incomes which was more unequally dis- tributed than incomes from agriculture.
The growth in rural income contributed to a considerable improvement in the poverty situation during the period under study. The magnitude of poverty, with a head-count index of 51 per cent, is a matter of serious concern since natural resources are already over exploited, and the adop- tion of the available technology has reached fairly high levels. A much faster accelera- tion of growth will be needed to alleviate poverty within a socially acceptable time ,horizon.
The findings of the study point to the importance of new agricultural techno- logy, physical infrastructure, and human capital in fostering higher growth and favourable income distribution in rural areas. Given the limited importance of the labour market in income intermediation, policies based on providing better access to capital and education for the poor would make a greater impact on poverty alleviation than policies based on inter- ventions in the operation of the land and labour markets. [WE
Note
1 Fast decline in poverty during 1976-86 and the consequent rise of poverty during 1986-96 based on official household expenditure surveys are two major moments in this debate. The debate between national accounts and household consumption survey-based estimates of the level of income (consumption) is another example. There is also considerable push vs pull debate relating to the increasing prominence of the rural non farm sector as provider of income and employment.
References Asaduzzman, M (1979): 4Adoption ofH Y V Rice
in Bangladesh', Bangladesh Development Studies 7(3): 23-29.
Bangladesh Bureau of Statistics (1989): Report on the Household Expenditure Surney 1986-87, Ministry of Planning, Government of Bangladesh, Dhaka.
David, C and K Otsuka (1994): Modern Rice Technology and Income Distribution in Asia, Lynne Rienner Publishers, Boulder and L ondon.
Fei, J C H, G Ranis and SWY Kuo (1978): 'Growth
and Family Distribution of Income by Factor Components', Quarterly Jounlal of Economics 92(1): '17-53.
Foster, J Greer and E Thorbeck (1984): 'A Class of Decomposable Poverty Measures', Econometrics 52(3): 761-66.
Griffin, K (1974): The Political Economy of Agrarian Change: An Essay on Green Revolution, Harvard University Press, Cambridge.
Hossain, M (1977): 'Farm Size, Tenancy and Land Productivity: An Analysis of Farm Level Data in Bangladesh Agriculture', Bangladesh Development Studies 5(3): 285-348.
Hossain, M (1988): Nature of Impact of Green Revolution in Bangladesh, IFPRI Research Report No 67, IFPRI, Washington, DC. Hossain, M and M Mukaddem Akash (1994): Public Rural Works for Relief and Development, IFPRI Working Paper on Food Subsidy, No 7, IFPRI, Washington, DC.
Hossain, M and B Sen (1992): 'Rural Poverty in Bangladesh: Trends and Determinants', Asian Development Review 10(1) 1-34.
Hossain M, M A Quasem, M A Jabbar, and M M Akash (1994): 'Production Environments, Modern Variety Adoption and Income Distribution in Bangladesh' in C C David and K Otsuka (eds), Modern Rice Technology and Income Distribution in Asia, Lynne Rienner Publishers, Boulder and London.
Kakwani, N (1980): Income Inequality and Poverty: Methods of Estimation and Policy Applications, Oxford University Press, New York.
Khan, A R (1990): 'Poverty in Bangladesh: A Consequence of and a Constraint on Growth', The Bangladesh Development Studies, 18(3).
Khan, A R and M Hossain (1989): The Strategy of Development in Bangladesh, Macmillan Press, London/Paris.
Mandal, M A S (1980): 'Farm Size, Tenancy and Productivity in an Area of Bangladesh', Bangladesh Journal of Agricultural Economics 3(2): 21-42.
Muqtada, M (1986): 'Poverty and Inequality: Trends and Causes' in R Islam and M.Muqtada (eds), Bangladesh: Selected Issues in Employment and Development, International Labour Organisations, New Delhi.
Osmani, S R (1990): 'Notes on Some Recent Estimates of Rural Poverty in Bangladesh', Bangladesh Development Studies 8(3).
Pears, A (1980): Seeds of Plenty, Seeds of Want: Social andEconomic Implications of the Green Revolution, Clarendon Press, Oxford.
Pyatt G, C Chen and J C H Fei (1980): 'Distribution of Income by Factor Components', Quarterly Journal of Economics 95(3): 451-473.
Rahman A, T Haque (1988): 'Poverty and Inequality in Bangladesh in 1980s', Research Report No 91, Bangladesh Institute of Development Studies, Dhaka.
Rahman, H Z and M Hossain (eds) (1995): Rethinking Rural Poverty: Bangladesh as a Case Study, Sage Publication, New Delhi/ Thousand Oaks/London.
Ravallion, M and B Sen (1996): 'When Method Matters: Monitoring Poverty in Bangladesh', Economic Development and Cultural Change, 44(4): 761-792.
Sen, A K (1973): On Economic Inequality, Clarendon Press, Oxford..
- (1981): Poverty and Famines: An Essay on Entitlement and Deprivation, Clarendon Press, Oxford.
Shorrocks, A F (1983): 'The Impact of Income Components on the Distribution of Family Incomes', Quarterly Journal of Economics 98(2): 3 10-326.
Economic and Political Weekly December 30, 2000 4637
This content downloaded on Thu, 17 Jan 2013 22:43:17 PMAll use subject to JSTOR Terms and Conditions
Copyright © 2022 FDOKUMEN