Four decades of rice water productivity in Bangladesh: A spatio-temporal analysis of district level...
14
Economic Analysis and Policy 44 (2014) 51–64 Contents lists available at ScienceDirect Economic Analysis and Policy journal homepage: www.elsevier.com/locate/eap Full length article Four decades of rice water productivity in Bangladesh: A spatio-temporal analysis of district level panel data Mohammad Alauddin a,∗ , Upali A. Amarasinghe b , Bharat R. Sharma c a The University of Queensland, School of Economics, Brisbane, Queensland 4072, Australia b International Water Management Institute, Patancheru 502324, Andhra Pradesh, India c International Water Management Institute, Pusa, New Delhi 110012, India article info Article history: Available online 3 March 2014 Keywords: Consumptive water use Water productivity Agro-ecological zones Groundwater dependency Fossil fuel Sustainability abstract The bulk of the water productivity (WP) literature has focused on static cross-sectional analysis with inadequate attention given to long-term, time series analysis, either at the country level or at a lower level of aggregation (e.g., district). The present study fills this gap by analyzing WP in Bangladesh using panel data of 21 districts over 37 years (1968–2004) divided into three phases. It estimated levels of, and trends in, WPs of one irrigated rice (rabi) crop, and two mainly rain-fed (kharif ) rice crops, with occasional supplementary irrigation. Also examined were WPs for rice crops in irrigated and rain-fed ecosystems. The findings indicated that WP levels in Bangladesh were significantly lower than that by global standards. Overall, WP growth rates varied significantly among districts and between phases with no consistent pattern emerging. On the whole, WPs trended upwards while differing widely among districts and between phases, seasons, ecosystems and areas differentiated by physiographic characteristics. The 1980s represented a period of stagnation. Drought-prone areas grew faster while salinity-prone areas grew slower vis-à-vis non-drought and non-saline areas. In the Ganges-dependent area, WP grew faster than that in the non-Ganges-dependent area. Rice production in Bangladesh represented a highly groundwater-dependent and fossil fuel-using process with significant environmental implications suggesting that WP growth may be unsustainable. Sustaining WP growth required a range of market and non-market-based policy options. © 2014 Economic Society of Australia, Queensland. Published by Elsevier B.V. All rights reserved. 1. Introduction Water is the critical input in the process of intensification of agriculture in densely populated parts of the world, especially South Asia (Shah, 2009; Shah et al., 2003) over the last half century. Given that water could be a limiting factor for crop production and, therefore, food security, measuring water productivity (WP) assumes critical importance. It is surprising then that the literature on agricultural development has focused extensively on land productivity (see e.g., Hayami and Ruttan, 1985) or total factor productivity (see e.g., Heady et al., 2010; Rahman and Salim, 2013) and there has been contrastingly inadequate attention paid to measuring agricultural WP. Molden (2007, pp. 11–12) differentiated between physical and economic water scarcity. The former refers to inadequate investment in water or a shortage of human capacity ∗ Corresponding author. E-mail address: [email protected] (M. Alauddin). http://dx.doi.org/10.1016/j.eap.2014.02.005 0313-5926/© 2014 Economic Society of Australia, Queensland. Published by Elsevier B.V. All rights reserved.
-
Upload
independent -
Category
Documents
-
view
4 -
download
0
Transcript of Four decades of rice water productivity in Bangladesh: A spatio-temporal analysis of district level...
Economic Analysis and Policy 44 (2014) 51–64
Contents lists available at ScienceDirect
Economic Analysis and Policy
journal homepage: www.elsevier.com/locate/eap
Full length article
Four decades of rice water productivity in Bangladesh:A spatio-temporal analysis of district level panel dataMohammad Alauddin a,∗, Upali A. Amarasinghe b, Bharat R. Sharma c
a The University of Queensland, School of Economics, Brisbane, Queensland 4072, Australiab International Water Management Institute, Patancheru 502324, Andhra Pradesh, Indiac International Water Management Institute, Pusa, New Delhi 110012, India
a r t i c l e i n f o
Article history:Available online 3 March 2014
Keywords:Consumptive water useWater productivityAgro-ecological zonesGroundwater dependencyFossil fuelSustainability
a b s t r a c t
The bulk of the water productivity (WP) literature has focused on static cross-sectionalanalysis with inadequate attention given to long-term, time series analysis, either at thecountry level or at a lower level of aggregation (e.g., district). The present study fills this gapby analyzing WP in Bangladesh using panel data of 21 districts over 37 years (1968–2004)divided into three phases. It estimated levels of, and trends in, WPs of one irrigated rice(rabi) crop, and two mainly rain-fed (kharif ) rice crops, with occasional supplementaryirrigation. Also examined were WPs for rice crops in irrigated and rain-fed ecosystems.
The findings indicated that WP levels in Bangladesh were significantly lower thanthat by global standards. Overall, WP growth rates varied significantly among districtsand between phases with no consistent pattern emerging. On the whole, WPs trendedupwards while differing widely among districts and between phases, seasons, ecosystemsand areas differentiated by physiographic characteristics. The 1980s represented a periodof stagnation. Drought-prone areas grew faster while salinity-prone areas grew slowervis-à-vis non-drought and non-saline areas. In the Ganges-dependent area, WP grewfaster than that in the non-Ganges-dependent area. Rice production in Bangladeshrepresented a highly groundwater-dependent and fossil fuel-using processwith significantenvironmental implications suggesting that WP growth may be unsustainable. SustainingWP growth required a range of market and non-market-based policy options.
© 2014 Economic Society of Australia, Queensland. Published by Elsevier B.V. All rightsreserved.
1. Introduction
Water is the critical input in the process of intensification of agriculture in densely populated parts of theworld, especiallySouth Asia (Shah, 2009; Shah et al., 2003) over the last half century. Given that water could be a limiting factor for cropproduction and, therefore, food security, measuring water productivity (WP) assumes critical importance. It is surprisingthen that the literature on agricultural development has focused extensively on land productivity (see e.g., Hayami andRuttan, 1985) or total factor productivity (see e.g., Heady et al., 2010; Rahman and Salim, 2013) and there has beencontrastingly inadequate attention paid to measuring agricultural WP. Molden (2007, pp. 11–12) differentiated betweenphysical and economic water scarcity. The former refers to inadequate investment in water or a shortage of human capacity
∗ Corresponding author.E-mail address:[email protected] (M. Alauddin).
http://dx.doi.org/10.1016/j.eap.2014.02.0050313-5926/© 2014 Economic Society of Australia, Queensland. Published by Elsevier B.V. All rights reserved.
52 M. Alauddin et al. / Economic Analysis and Policy 44 (2014) 51–64
to satisfy demand for water while the latter is primarily due to insufficient water supplies to meet all demands, includingenvironmental flows.
The South Asian country of Bangladesh suffers particularly from significant water resource and production issues whichare predicted to grow steadily worse (WARPO, 2002) with an associated dearth of empirical research to help addressthe problems. While Bangladesh’s water scarcity is primarily economic in nature, some parts, such as Nawabganj (#13),Naogaon (#11) and Rajshahi (#12) in the northwest may be approaching physical water scarcity. Furthermore, the qualityof groundwater contaminated with arsenic is a critical issue in many parts of Bangladesh and the adjoining areas of theIndian state of West Bengal (Chakraborti et al., 2002). De Vries et al. (2008, p. 1) found that reduction in water quality dueto pollution, water-borne diseases and disease vectors was a major concern related to environmental degradation.
The focus of agricultural development in Bangladesh has shifted from a process of external (extensivemargin) to internal(intensive margin) land augmentation (Hayami and Ruttan, 1985). The overall process seems consistent with Boserup’s(Boserup, 1965; 1981) views that (1) rising population pressure led to the intensification of farming methods in order toincrease food production to support extra population; (2) the pressure to change agricultural output by modifying farmingtechniques was primarily demand-driven.
A range of innovations collectively referred to as the green revolution led to agricultural intensification. The highyielding varieties (HYVs) of rice and wheat in South Asia spread to areas with pre-existing and well-developed irrigationinfrastructure primarily dependent on surface water (Raj, 1970). However, subsequent diffusion of the HYV technologybecame increasingly dependent on groundwater irrigation (Alauddin and Quiggin, 2008; Alauddin and Sharma, 2013)relative to other parts of the world, such as China (Shah, 2007). Groundwater as a source of irrigation has covered nearly75% of the total irrigated area in Bangladesh in recent years compared to minimal coverage at the beginning of the greenrevolution in the late 1960s (Alauddin and Tisdell, 1991; Alauddin and Tisdell, 1995; BBS, 2012). Private initiative, smallirrigation systems based on low-lift pumps (surface water), and shallow and deep tube wells (groundwater) drawn fromstreams and groundwater have proliferated. After initial rapid growth, low-lift pump irrigation has slowed significantlysince the 1990s due to limited access to reliable surface water sources. This has led to the development of groundwaterstructures in places previously served by surface water (WARPO, 2002, p. 11).
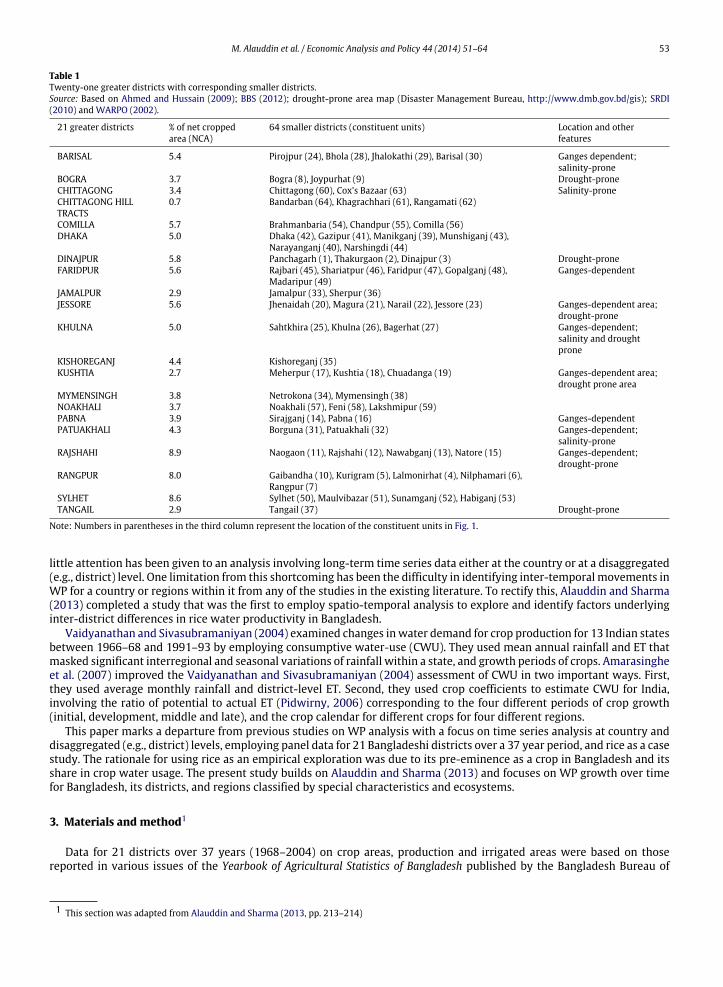
However, this average percentage of groundwater usage for Bangladesh as a whole has masked significant inter-districtvariations. For example, usage ranged from more than 95% in the northern districts of Bogra (#8 and #9) and Dinajpur(#1–3), and the central district of Tangail (#37) to minimal or none in the southern districts of Barisal (#24, #28–30) andPatuakhali (#31, 32) (Table 1 and Fig. 1). Furthermore, around 80% of the gross area irrigated in Bangladesh was allocatedto rice.
Of particular importance is the focus on the relative performance of the eight (greater) districts (Barisal, Faridpur, Jessore,Khulna, Kushtia, Pabna, Patuakhali and Rajshahi) that constitute theGanges-dependent area (GDA) accounting formore thana third of Bangladesh’s net cropped area (NCA, Fig. 1 and Table 1) vis-à-vis the non-Ganges-dependent area (NGDA). Thisresearch is part of the International Water Management Institute-Indo-Gangetic Basin (IWMI-IGB) project, and analysis ofWP levels and trends was an integral part of this project.
The driest and most severe drought-prone districts are located in the GDA (BBS, 1999). This region, characterized byhigh climatic variability, is likely to experience even greater climatic variability in coming decades. By 2050, the dry season(November–May) water deficit (deficit of rainfall over evapotranspiration) is expected to rise to 445 mm from 343 mm in2000 and 372 mm in 2025. The wet season (June–October) water surplus (surplus of rainfall over evapotranspiration) isexpected to increase to 1221 mm in 2050 from 980 mm in 2000 and 1072 mm in 2025 (WARPO, 2002, p. 13).
Although some drought and salinity-prone districts lie outside the GDA (Table 1), the most severe salinity-prone areas,as with most drought-prone areas, are located in this area. This paper is organized as follows: Section 2 provides a briefreview of the relevant literature. Section 3 discusses the materials and method used in the study. Section 4 presents theresults for the estimated levels of, and trends in, WPs of one irrigated rice (rabi) crop, and two mainly rain-fed (kharif ) ricecrops: combination of aus (early monsoon) and aman (monsoon–late autumn). It also presents levels of and trends in WPsfor rice crops in irrigated and rain-fed ecosystems. Results of Pearson correlation between WP in the irrigated ecosystemand overall WP and kharif WP are also presented. Implications and policy options are discussed in Section 5 and Section 6respectively, and Section 7 provides a brief conclusion.
2. Brief review of literature
Molden (1997) represented the first major research on water productivity. Subsequent research (e.g., Ahmad et al.,2004; Barker et al., 2003; Cai and Rosegrant, 2003; Molden et al., 2003); (Molden and Sakthivadivel, 1999) measured wateraccounts and crop water productivity on different scales. Cai and Sharma (2010) concentrated on the Indo-Gangetic Basinthat included parts of Bangladesh, India, Nepal and Pakistan, while Mahajan et al. (2009) and Jalota et al. (2009) focusedexclusively on the Indian Punjab. Cai et al. (2011) measured crop water productivity in ten major river basins, including theIndo-Gangetic, Mekong, Nile and Yellow River basins.
The bulk of the literature on crop WP has concentrated on static cross-section analysis and used aggregate data withoccasional micro-level evidence (Molden et al., 2007), even though different scenarios were considered between two pointsin time such as 2000 and 2025 (Cai and Rosegrant, 2003; Rosegrant et al., 2002). Despite this growth in the literature onWP,
M. Alauddin et al. / Economic Analysis and Policy 44 (2014) 51–64 53
Table 1Twenty-one greater districts with corresponding smaller districts.Source: Based on Ahmed and Hussain (2009); BBS (2012); drought-prone area map (Disaster Management Bureau, http://www.dmb.gov.bd/gis); SRDI(2010) and WARPO (2002).
21 greater districts % of net croppedarea (NCA)
64 smaller districts (constituent units) Location and otherfeatures
BARISAL 5.4 Pirojpur (24), Bhola (28), Jhalokathi (29), Barisal (30) Ganges dependent;salinity-prone
BOGRA 3.7 Bogra (8), Joypurhat (9) Drought-proneCHITTAGONG 3.4 Chittagong (60), Cox’s Bazaar (63) Salinity-proneCHITTAGONG HILLTRACTS
0.7 Bandarban (64), Khagrachhari (61), Rangamati (62)
COMILLA 5.7 Brahmanbaria (54), Chandpur (55), Comilla (56)DHAKA 5.0 Dhaka (42), Gazipur (41), Manikganj (39), Munshiganj (43),
Narayanganj (40), Narshingdi (44)DINAJPUR 5.8 Panchagarh (1), Thakurgaon (2), Dinajpur (3) Drought-proneFARIDPUR 5.6 Rajbari (45), Shariatpur (46), Faridpur (47), Gopalganj (48),
Madaripur (49)Ganges-dependent
JAMALPUR 2.9 Jamalpur (33), Sherpur (36)JESSORE 5.6 Jhenaidah (20), Magura (21), Narail (22), Jessore (23) Ganges-dependent area;
drought-proneKHULNA 5.0 Sahtkhira (25), Khulna (26), Bagerhat (27) Ganges-dependent;
salinity and droughtprone
KISHOREGANJ 4.4 Kishoreganj (35)KUSHTIA 2.7 Meherpur (17), Kushtia (18), Chuadanga (19) Ganges-dependent area;
drought prone areaMYMENSINGH 3.8 Netrokona (34), Mymensingh (38)NOAKHALI 3.7 Noakhali (57), Feni (58), Lakshmipur (59)PABNA 3.9 Sirajganj (14), Pabna (16) Ganges-dependentPATUAKHALI 4.3 Borguna (31), Patuakhali (32) Ganges-dependent;
salinity-proneRAJSHAHI 8.9 Naogaon (11), Rajshahi (12), Nawabganj (13), Natore (15) Ganges-dependent;
drought-proneRANGPUR 8.0 Gaibandha (10), Kurigram (5), Lalmonirhat (4), Nilphamari (6),
Rangpur (7)SYLHET 8.6 Sylhet (50), Maulvibazar (51), Sunamganj (52), Habiganj (53)TANGAIL 2.9 Tangail (37) Drought-prone
Note: Numbers in parentheses in the third column represent the location of the constituent units in Fig. 1.
little attention has been given to an analysis involving long-term time series data either at the country or at a disaggregated(e.g., district) level. One limitation from this shortcoming has been the difficulty in identifying inter-temporal movements inWP for a country or regions within it from any of the studies in the existing literature. To rectify this, Alauddin and Sharma(2013) completed a study that was the first to employ spatio-temporal analysis to explore and identify factors underlyinginter-district differences in rice water productivity in Bangladesh.
Vaidyanathan and Sivasubramaniyan (2004) examined changes inwater demand for crop production for 13 Indian statesbetween 1966–68 and 1991–93 by employing consumptive water-use (CWU). They used mean annual rainfall and ET thatmasked significant interregional and seasonal variations of rainfall within a state, and growth periods of crops. Amarasingheet al. (2007) improved the Vaidyanathan and Sivasubramaniyan (2004) assessment of CWU in two important ways. First,they used average monthly rainfall and district-level ET. Second, they used crop coefficients to estimate CWU for India,involving the ratio of potential to actual ET (Pidwirny, 2006) corresponding to the four different periods of crop growth(initial, development, middle and late), and the crop calendar for different crops for four different regions.
This paper marks a departure from previous studies on WP analysis with a focus on time series analysis at country anddisaggregated (e.g., district) levels, employing panel data for 21 Bangladeshi districts over a 37 year period, and rice as a casestudy. The rationale for using rice as an empirical exploration was due to its pre-eminence as a crop in Bangladesh and itsshare in crop water usage. The present study builds on Alauddin and Sharma (2013) and focuses on WP growth over timefor Bangladesh, its districts, and regions classified by special characteristics and ecosystems.
3. Materials and method1
Data for 21 districts over 37 years (1968–2004) on crop areas, production and irrigated areas were based on thosereported in various issues of the Yearbook of Agricultural Statistics of Bangladesh published by the Bangladesh Bureau of
1 This section was adapted from Alauddin and Sharma (2013, pp. 213–214)
54 M. Alauddin et al. / Economic Analysis and Policy 44 (2014) 51–64
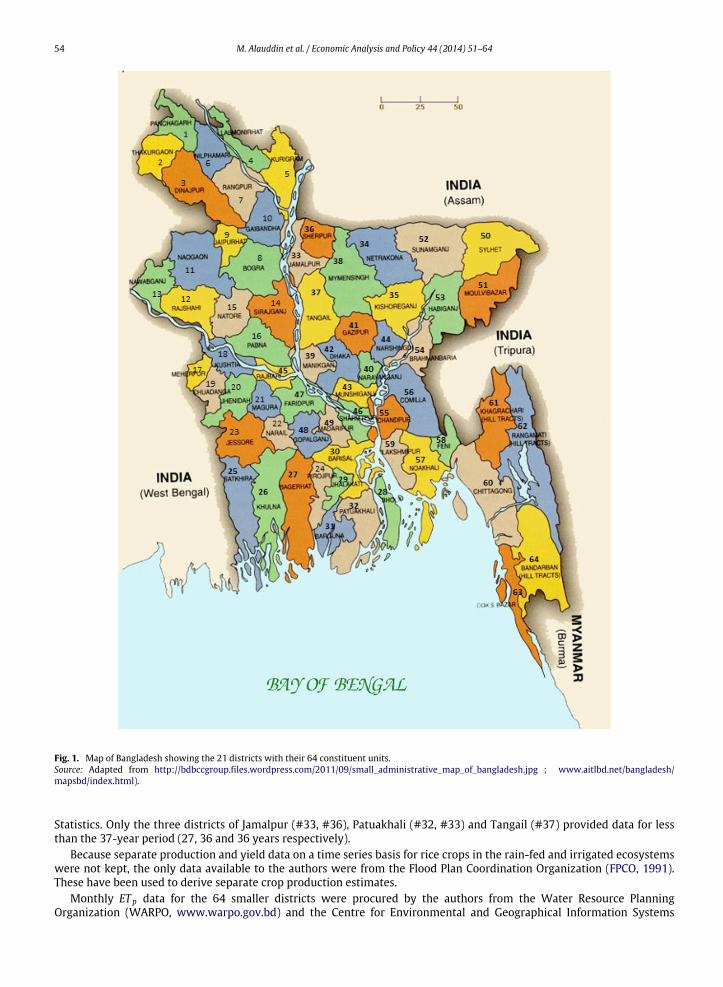
Fig. 1. Map of Bangladesh showing the 21 districts with their 64 constituent units.Source: Adapted from http://bdbccgroup.files.wordpress.com/2011/09/small_administrative_map_of_bangladesh.jpg ; www.aitlbd.net/bangladesh/mapsbd/index.html).
Statistics. Only the three districts of Jamalpur (#33, #36), Patuakhali (#32, #33) and Tangail (#37) provided data for lessthan the 37-year period (27, 36 and 36 years respectively).
Because separate production and yield data on a time series basis for rice crops in the rain-fed and irrigated ecosystemswere not kept, the only data available to the authors were from the Flood Plan Coordination Organization (FPCO, 1991).These have been used to derive separate crop production estimates.
Monthly ET p data for the 64 smaller districts were procured by the authors from the Water Resource PlanningOrganization (WARPO, www.warpo.gov.bd) and the Centre for Environmental and Geographical Information Systems
M. Alauddin et al. / Economic Analysis and Policy 44 (2014) 51–64 55
(CEGIS,www.cegisbd.com). Table 1 and Fig. 1 list and illustrate respectively these 64 constituent units and the corresponding21 greater districts. Monthly rainfall data were available for the 64 constituent units from CEGIS. The information wasavailable for most of the constituent units until 2002. The study extended the series to 2004 by using the median valuesfor the preceding years. The length of the time series was constrained by the availability of data on all the relevant variablesup to 2004. Furthermore, crop-related long-term data were only available for 21 greater districts.
Crop coefficients on a decadal (10-day) basis and the median sowing/transplanting and harvesting periods of differentcrops of rice were available from BARC (2001).
Rabi rice crop was completely irrigated while other rice crops represented a combination of irrigated and rain-fedecosystems. These have been used to derive separate crop production estimates. The evapotranspiration (ETp) and monthlyrainfall data for the 64 constituent units were reduced to the 21-district level in order to conform to the crop productionand related data by averaging the information for the relevant constituent units.
WP measurement involves both scientific and statistical information on water requirements for crops, rainfall, ETp,irrigation, crop production cycle, crop output and related data.
Eq. (1) is employed to estimate (Amarasinghe et al., 2007):
CWUl =
k∈seasons
IRAlk
j∈months
i∈growth periods
kc lki × ETpj ×dijnj
for irrigated crops
k∈seasons
RFAlk
j∈month
i∈growth periods
min (kc lki × ETpj, Effrfj) ×dijnj
for rain-fed crops(1)
where:
• IRAlk and RFAlk respectively represent the irrigated and rain-fed areas of the lth crop in the kth season;• i is the number of growth periods, generally four but could be more;• dij is the number of days of the jth month in the ith crop growth period;• nj is the number of days of the jth month;• kc is the crop coefficient of the crop in the ith growth period of the kth season; and• Effrf j is the effective rainfall for the period of the month in which the crop is grown.
Eq. (1) consists of two multipliers:
1. For irrigated crops it is simply the expression involving the second and third summation signs and entails the use of cropET p (=kc lkl × ETP j) on the assumption that irrigation meets the full water requirement of the crops. In reality, however,this may not be the case because irrigation in many water-scarce areas may not meet the full water requirement. In theabsence of any dependable information, the authors had no alternative but to assume away irrigated water deficit. Thisrepresents the irrigated multiplier (IM).
2. For the rain-fed crops, it is the minimum of (crop ET p,Effrf j). This is the rain-fed multiplier (RM).
Based on Amarasinghe et al. (2005, p. 9) Eq. (2) estimates effective rainfall as:
Effrf = AMR ∗ (1 − 0.25 ∗ AMR)/125 if AMR ≤ 250 mm or Effrf = 125 + 0.1 ∗ AMR if AMR ≥ 250 mm (2)
where Effrf and AMR represent millimeters of effective rainfall and average monthly rainfall respectively. The present studyused actual monthly rainfall data (Cf. Amarasinghe (2005); Amarasinghe et al. (2007)).
For a particular crop or a group of crops, WP has been defined as a ratio of crop output to CWU. This paper estimatedWP levels for Bangladesh and 21 of her greater districts over the entire duration of the time series and the specified phaseswithin it.
Phase 1 (1968–1980): early phase of the green revolution with significant input subsidies;Phase 2 (1981–1990): advancing phase of the green revolution and policy rationalization with greater role of market
forces; andPhase 3 (1991–2004): matured phase of the green revolution with maximum operation of market forces.The compound growth rates are based on a semi-logarithmic trend line corrected for first-order auto-correlation and
involved three steps: (a) taking the antilog of the slope; (b) subtracting 1 from it; and (c) multiplying the difference by 100(Gujarati, 2003, p. 180).
4. Results
The results for the overall rice water productivity levels and trends are first presented (Section 4.1). This is followed byanalyses based on crop seasons (Sections 4.2 and 4.3) and ecosystems (Sections 4.4 and 4.5). Particular attention is paid to
56 M. Alauddin et al. / Economic Analysis and Policy 44 (2014) 51–64
Table 2Levels and compound annual growth rates of overall rice water productivity by Bangladesh districts for selected phases, 1968–2004.
Greater district (constituent units) WP level (g/m3 of CWU) WP growth rate (% per annum)1968–2004 1968–1980 1981–1990 1991–2004 1968–2004 1968–1980 1981–1990 1991–2004
Barisal (24, 28, 29, 30) 306 261 302 350 ***1.363 ***2.489 −0.495 ***3.111Bogra (8, 9) 412 294 436 505 ***2.296 ***2.362 ***4.558 *0.974Chittagong Hill Tracts (61, 62, 64) 459 395 440 532 ***1.28 ***1.906 −0.843 ***1.625Chittagong (60, 63) 422 347 427 489 ***1.57 2.150 ***2.19 ***1.604Comilla (54, 55, 56) 407 323 384 501 ***1.937 **1.927 ***2.275 ***2.456Dhaka (39, 40, 41, 42, 43) 367 291 335 459 ***2.01 ***2.075 0.594 ***3.634Dinajpur (1, 2, 3) 367 286 355 452 ***1.913 **1.02 ***3.133 ***1.542Faridpur (45, 46, 47, 48, 49) 280 193 251 381 ***2.847 0.351 **3.603 ***3.892Jamalpur (33, 36) 371 290 329 418 ***2.172 −1.194 0.871 ***4.234Jessore (20, 21, 22, 23) 358 234 329 494 ***3.199 ***2.011 ***6.341 ***2.679Khulna (25, 26, 27) 344 258 333 432 ***2.284 ***3.445 1.005 ***2.395Kishoreganj (35) 400 316 381 491 ***1.912 *1.4 *1.493 ***2.81Kushtia (17, 18, 19) 326 214 294 452 ***3.291 ***3.385 **5.03 ***3.057Mymensingh (34, 38) 362 290 341 445 ***1.955 ***3.058 0.838 ***3.81Noakhali (57, 58, 59) 357 299 334 428 ***1.742 ***5.297 −1.041 ***2.324Pabna (14, 16) 335 219 308 463 ***3.183 ***1.992 ***3.76 ***3.323Patuakhali (31, 32) 297 267 279 336 ***1.25 ***5.586 ***−2.469 ***2.309Rajshahi (11, 12, 13, 15) 358 252 316 486 ***2.707 *1.41 0.881 ***2.266Rangpur (4, 5, 6, 7, 10) 381 280 361 489 ***2.307 0.768 ***2.476 ***2.087Sylhet (50, 51, 52, 53) 342 295 305 412 ***1.428 −0.417 ***1.168 ***2.945Tangail (37) 378 275 348 481 ***2.55 ***3.077 1.779 ***3.057NGDA 381 305 361 460 ***1.828 ***2.04 ***1.201 ***2.525GDA 329 233 305 437 ***2.694 ***2.15 ***2.849 ***2.959Non-drought 363 291 341 442 ***1.898 ***2.05 *1.015 ***2.866Drought-prone 363 259 344 472 ***2.609 ***2.385 ***3.228 ***2.279Non-salinity 362 275 340 454 ***2.225 ***2.098 ***2.061 ***2.719Salinity-prone 370 305 358 438 ***1.641 ***2.611 −0.114 ***2.375BANGLADESH 363 280 342 452 ***2.137 ***2.162 ***1.747 ***2.67
*p < .05; **p < .01; ***p < .001. Calculation of compound growth rates is described in Section 2.
differences in the performance of areas susceptible to drought, salinity, and the Ganges and non-Ganges-dependent areas(GDA and NGDA) in all cases.
4.1. Overall rice water productivity
Table 2 presents WP levels and its compound rates of growth for the entire time series, and the relevant phases, andgeographical entities. For Bangladesh as a whole, a WP of 361 g/m3 of CWU for the 1968–2004 period or 452 g during1991–2004 were significantly lower than global standards, ranging between 600 and 1600 g (Zwart and Bastiaanssen,2004) and 740 g reported by Cai and Sharma (2010) for the different areas of the Indo-Gangetic Basin (see alsoCai et al. (2011)).
While differing widely among the districts, the WP levels for Bangladesh as a whole increased by 22% (from 280 to342 g) between 1968–1980 and 1981–1990, and by 35% (from 342 to 453 g) between 1981–1990 and 1991–2004. Thecorresponding figures for the 13 districts in the NGDA were 18% (from 305 g to 361 g) and 27% (from 361 g to 460 g). ForGDA it increased by 31% (from 233 g to 305 g) and 43% (from 305 g to 437 g) respectively. For the drought-prone areas,the WP level during 1968–1980 was 11% below the non-drought areas (259 g and 291 g respectively). However, it reachedcomparable non-drought levels during 1981–1990 and exceeded the non-drought area WP by 6.8% during 1991–2004 (472g and 442 g respectively). The reversewas the casewith salinity-prone areas. TheWP level in salinity-prone areaswas higherduring 1968–1980 (305 g and 275 g) and 1981–1990 (358 g and 340 g) but fell below that of the areas unaffected by salinityduring 1991–2004 (438 g and 454 g respectively).
The WP levels appeared to be converging over time across regions. For example, the WP level for Bangladesh was 20%higher than that for the GDA (279 g and 233 g respectively) during 1968–1980. This difference declined to 11% (339 g and305 g) and 4% (453 g and 437 g) for 1981–1990 and 1991–2004 respectively. The divergence between theWP levels betweenthe NGDA and the GDA decreased from 31% (305 g and 233 g) during 1968–1980 to 18% (361 g and 305 g) and 5% (460 g and437 g) during 1981–1990 and 1991–2004 respectively.
Over the entire time series the WP for Bangladesh grew at a compound annual rate of 2.14% compared with 2.61% and1.83% respectively for the GDA and NGDA. In all the phases, WP in the GDA grew at a faster pace than in the NGDA and forBangladesh as a whole. The growth rates in Phase 2 were the lowest of the three phases and the 1991–2004 period recordedthe highest rates of growth for Bangladesh as a whole, the GDA and the NGDA.
For the 1968–2004 period and 1991–2004 all districts recorded statistically significant positive growth rates in overallrice WP. Growth rates were not statistically significant in Phase 1 for five districts (Chittagong #60, 63; Faridpur #45–49;
M. Alauddin et al. / Economic Analysis and Policy 44 (2014) 51–64 57
Table 3Levels and compound annual growth rates of average rice water productivity of kharif crop by Bangladesh districts for selected phases, 1968–2004.
Greater district (constituent units) WP level (g/m3 of CWU) WP growth rate (% per annum)1968–2004 1968–1980 1981–1990 1991–2004 1968–2004 1968–1980 1981–1990 1991–2004
Barisal (24, 28, 29, 30) 287 241 290 327 ***1.435 ***3.248 −0.540 ***2.837Bogra (8, 9) 387 287 383 482 ***2.149 ***2.234 ***3.228 0.483Chittagong Hill Tracts (61, 62, 64) 470 371 446 578 ***1.941 ***3.641 0.367 **1.425Chittagong (60, 63) 423 338 421 505 ***1.879 2.757 ***3.067 ***1.716Comilla (54, 55, 56) 358 289 337 438 ***1.81 **1.88 2.174 ***1.994Dhaka (39, 40, 41, 42, 43) 293 258 271 340 ***1.29 ***2.534 −1.173 ***3.898Dinajpur (1, 2, 3) 346 284 345 406 ***1.479 **1.02 ***2.856 0.707Faridpur (45, 46, 47, 48, 49) 216 178 196 267 ***1.684 0.438 0.825 **2.011Jamalpur (33, 36) 320 286 288 350 ***1.622 ***−2.584 −0.379 ***4.532Jessore (20, 21, 22, 23) 347 230 307 485 ***3.206 ***2.19 ***6.181 ***2.879Khulna (25, 26, 27) 343 252 332 435 ***2.445 ***4.603 0.981 ***2.364Kishoreganj (35) 348 278 334 423 ***2.004 ***4.162 ***2.391 ***2.788Kushtia (17, 18, 19) 314 212 287 427 ***3.076 ***3.494 *4.725 ***2.283Mymensingh (34, 38) 331 284 322 380 ***1.447 ***4.097 −0.177 ***3.705Noakhali (57, 58, 59) 328 280 304 389 ***1.63 ***6.063 ***−2.236 **1.869Pabna (14, 16) 275 207 237 366 ***2.461 ***2.228 1.394 ***3.773Patuakhali (31, 32) 290 249 279 333 ***1.641 ***8.045 ***−2.434 ***2.429Rajshahi (11, 12, 13, 15) 336 241 299 450 ***2.619 *1.588 1.703 ***2.517Rangpur (4, 5, 6, 7, 10S) 362 276 342 456 ***2.045 0.771 **2.029 *1.495Sylhet (50, 51, 52, 53) 339 284 306 414 ***1.608 0.680 ***2.327 ***1.963Tangail (37) 293 245 248 362 ***1.888 ***3.081 1.209 ***2.239NGDA 350 287 330 418 ***1.694 ***2.829 0.929 ***2.225GDA 302 223 278 394 ***2.416 ***2.534 **2.158 ***2.665Non-drought 332 272 312 398 ***1.729 ***2.941 0.531 ***2.598Drought-prone 338 250 314 435 ***2.4 ***2.529 ***2.968 ***1.921Non-salinity 328 261 306 404 ***1.961 ***2.636 ***1.516 ***2.399Salinity-prone 366 288 356 446 ***1.939 ***3.829 0.267 **2.207BANGLADESH 334 265 313 410 ***1.954 ***2.802 ***1.337 ***2.372
*p < .05; **p < .01; ***p < .001. Calculation of compound growth rates is described in Section 2.
Jamalpur #33, 36; Rangpur #4–7, 10; and Sylhet #50–53) with over 28% of Bangladesh’s NCA. In contrast, nine districts withnearly 36% of the country NCA did not experience any statistically significant growth in annual WP during 1981–1990.
4.2. Kharif rice water productivity
Table 3 presents theWP levels and the compound rates of growth for the kharif rice crop. For Bangladesh, a kharif WP of330 g/m3 of CWU for the 1968–2004 period or 407 g during 1991–2004was lower than those reported earlier for the overallcrop. This applied to other phases and the 1968–2004 period. Significant inter-district variations in levels were observed.In all periods, the kharif WP levels for the GDA were below the country average and even more so for the correspondingfigures for the NGDA.
The kharif WP levels for Bangladesh increased by 18% (from 265 to 313 g) between 1968–1980 and 1981–1990, and by32% (from 313 to 410 g) between 1981–1990 and 1991–2004. The corresponding figures for the NGDA were similar, at 15%(from 287 g to 330 g) and 27% (from 330 g to 418 g) respectively. The GDA recorded changes of 25% (from 223 g to 278 g) and42% (from 278 g to 394 g) respectively; kharif WP levels appeared to converge over time in a similar manner to the overallrice WP (Table 2).
The picture for non-drought and drought-prone areas was similar to the one for overall rice WP presented earlier inTable 2. However, it was somewhat different for the non-salinity and salinity-prone areas. During 1991–2004, salinity-proneareas as a whole registered a lower level of WP for kharif rice than the areas not affected by salinity.
Over the 1968–2004 period, kharif rice WP for Bangladesh grew at a compound annual rate of 1.95%, compared to 2.42%and 1.69% for the GDA and NGDA respectively. During 1968–1980, kharif rice WP in the NGDA grew at a faster pace thanin the GDA and for Bangladesh. In the 1981–1990 period, neither the GDA nor the NGDA registered statistically significantgrowth rate. During 1991–2004 the GDA experienced higher WP growth rate than the NGDA and Bangladesh combined.The drought-prone areas registered growth rates in the GDA of 2.42%, 2.53% and 2.67% during 1968–2004, 1968–1980and 1991–2004 respectively in contrast to the NGDA and combined Bangladesh growth rates of 1.73%, 2.94% and 2.60%respectively.
Growth rates for the same saline and non-saline areas offered a similar picture. For the entire period, all districts recordedstatistically significant positive growth rates in kharif WP. For the 1991–2004 period, all but two districts (Bogra #8–9, andDinajpur #1–3 with 9.5% of Bangladesh’s NCA) registered significantly positive growth rates. The growth rates were notstatistically significant during 1968–1980 for four districts, representing just over a quarter of Bangladesh’s NCA. In contrast,11 districts with approximately half the country’s NCA did not experience statistically significant growth during 1981–1990.
58 M. Alauddin et al. / Economic Analysis and Policy 44 (2014) 51–64
Table 4Levels and compound annual growth rates of average rice water productivity of rabi crop by Bangladesh districts for selected phases, 1968–2004.
Greater district (constituent units) WP level (g/m3 of CWU) WP growth rate (% per annum)1968–2004 1968–1980 1981–1990 1991–2004 1968–2004 1968–1980 1981–1990 1991–2004
Barisal (24, 28, 29, 30) 471 476 425 498 0.195 ***−2.905 −0.065 ***2.387Bogra (8, 9) 481 387 545 522 ***1.407 ***3.348 1.871 *1.265Chittagong Hill Tracts (61, 62, 64) 451 459 431 458 −0.009 −0.959 ***−3.579 ***1.899Chittagong (60, 63) 421 390 452 428 ***0.448 0.443 −0.814 ***2.072Comilla (54, 55, 56) 522 478 518 566 ***0.952 1.500 0.183 ***1.986Dhaka (39, 40, 41, 42, 43) 472 405 455 548 ***1.315 0.929 −0.730 ***2.841Dinajpur (1, 2, 3) 509 468 500 553 ***0.721 0.205 −0.744 ***1.185Faridpur (45, 46, 47, 48, 49) 516 447 510 585 ***1.166 −0.680 0.487 ***3.704Jamalpur (33, 36) 480 322 455 532 ***1.904 *9.635 −0.106 ***1.901Jessore (20, 21, 22, 23) 459 403 461 511 ***0.963 ***−1.91 ***1.856 ***2.155Khulna (25, 26, 27) 355 284 348 427 ***1.666 −1.049 **1.389 ***2.512Kishoreganj (35) 447 360 438 536 ***1.654 0.262 −0.277 ***2.619Kushtia (17, 18, 19) 424 340 427 501 ***1.597 ***−2.663 ***3.609 ***3.545Mymensingh (34, 38) 438 340 412 548 ***1.878 ***−3.043 *1.833 ***2.805Noakhali (57, 58, 59) 481 466 445 521 **0.534 −1.724 −0.382 ***3.403Pabna (14, 16) 493 395 519 565 ***1.42 −0.709 −0.439 ***1.983Patuakhali (31, 32) 382 448 269 407 −0.658 ***−4.203 −3.414 **−2.548Rajshahi (11, 12, 13, 15) 437 356 406 535 ***1.573 ***2.06 −8.619 ***1.336Rangpur (4, 5, 6, 7, 10) 472 396 476 540 ***1.263 −0.769 −0.240 ***2.419Sylhet (50, 51, 52, 53) 344 304 305 409 ***1.259 −1.145 −0.957 ***4.257Tangail (37) 570 496 586 616 ***0.963 0.684 *−1.181 ***2.393NGDA 462 412 449 513 ***0.947 −0.336 −0.621 ***2.024GDA 451 386 442 517 ***1.224 **−1.134 −0.323 ***2.514Non-drought 456 411 436 510 ***0.913 ***−1.037 −0.616 ***2.255Drought-prone 461 388 467 524 ***1.303 0.280 −0.332 ***2.053Non-salinity 463 402 454 523 ***1.116 −0.412 −0.480 ***2.174Salinity-prone 426 406 401 461 ***0.614 −1.642 −0.774 ***2.266BANGLADESH 458 403 447 514 ***1.044 *−0.598 −0.522 ***2.188
*p < .05; **p < .01; ***p < .001. Calculation of compound growth rates is described in Section 2.
4.3. Rabi rice water productivity
For Bangladesh, a rabi WP of 453 g for the 1968–2004 period or 523 g during 1991–2004 were appreciably higher thanthose for the annual or kharif rice crops (Table 4). This applied to the phases and the time series as a whole. In all phases,the rabiWP levels for the GDA were below the country average and for the corresponding figures for the NGDA.
The rabiWP levels for Bangladesh increased by 15% (from 385 to 444 g) between 1968–1980 and 1981–1990, and by 18%(from 444 to 523 g) between 1981–1990 and 1991–2004. The corresponding figures for the NGDA were 9% (from 412 g to449 g) and 14% (from 449 g to 513 g). The GDA recorded changes of 15% (from 386 g to 442 g) and 17% (from 442 g to 517 g)respectively. Non-saline area WP levels were consistently above those in salinity-prone areas in all phases. WP levels werequite the opposite for the drought-prone and non-drought areas in all phases except during 1960–1980.
Over the entire time series (1968–2004) the rabi WP for Bangladesh grew at a compound annual rate of 1.04% whilethe GDA recorded a growth rate of 0.91%, with the NGDA showing the highest growth rate of 1.22%. During Phase 1, rabiWP in the GDA and for Bangladesh recorded negative rates of growth while the growth in the NGDA was not statisticallysignificant. Rabi did not record any statistically significant rates of growth for Bangladesh, the GDA or the NGDA during1981–1990. Growth rates during 1991–2004 were appreciably higher but when compared to the entire period were notstatistically significant. Overall, salinity-prone areas experienced lowerWP growth rates for the entire period of 1968–2004but the reverse was the case for 1991–2004. Drought-prone areas experienced a higher growth rate during the entire periodof 1968–2004 but a lower rate for 1991–2004 than the non-saline areas.
During 1968–1980, the growth rates were statistically significant for eight districts. Of these, four districts with 16% NCAexperienced negative growth rates. During 1981–1990, statistically significant positive growth rates were found for fourdistricts (17% NCA), while two districts with 3.6% NCA recorded statistically significant negative growth.
This contrasts with the 1991–2004 period during which all districts registered significant positive rates of growth. Forthe entire period of 1968–2004, all but one district (Patuakhali #32–33, negative growth) experienced significantly positivegrowth.
4.4. Rice water productivity in the rain-fed ecosystems
Table 5 sets out WP levels and trends for the rain-fed rice crop. The WP level for Bangladesh overall was consistentlyhigher than in the GDA for 1981–1990 and 1991–2004 but lower for the 1968–1980 and the entire period of 1968–2004.
There did not appear to be any significant difference in rain-fed rice WP between drought-prone and non-drought areasduring 1968–2004. During 1991–2004 the WP level (413 g) in drought-prone areas was marginally higher than that in the

M. Alauddin et al. / Economic Analysis and Policy 44 (2014) 51–64 59
Table 5Levels and compound annual growth rates of average rice water productivity of rain-fed crop by Bangladesh districts for selected phases, 1968–2004.
Greater district (constituent units) WP level (g/m3 of CWU) WP growth rate (% per annum)1968–2004 1968–1980 1981–1990 1991–2004 1968–2004 1968–1980 1981–1990 1991–2004
Barisal (24, 28, 29, 30) 286 240 290 325 ***1.434 ***3.159 −0.564 ***2.849Bogra (8, 9) 382 285 381 472 ***2.084 ***2.243 ***3.313 0.523Chittagong Hill Tracts (61, 62, 64) 468 370 440 578 ***1.954 ***3.619 0.508 **1.425Chittagong (60, 63) 417 337 414 493 ***1.79 2.727 ***2.979 **1.719Comilla (54, 55, 56) 357 289 335 435 ***1.793 **1.845 2.137 ***2.01Dhaka (39, 40, 41, 42, 43) 288 256 267 332 ***1.212 ***2.519 −1.356 ***3.778Dinajpur (1, 2, 3) 341 280 344 396 ***1.416 **1.003 ***2.981 0.484Faridpur (45, 46, 47, 48, 49) 213 177 194 260 ***1.574 0.440 0.682 *1.796Jamalpur (33, 36) 316 284 284 346 ***1.599 ***−2.602 −0.436 ***4.491Jessore (20, 21, 22, 23) 330 227 291 454 ***2.965 ***2.051 ***5.502 ***2.897Khulna (25, 26, 27) 342 252 331 434 ***2.451 ***4.59 1.022 ***2.37Kishoreganj (35) 345 272 331 422 ***2.072 ***3.97 ***2.793 ***2.756Kushtia (17, 18, 19) 277 201 257 362 ***2.584 ***2.946 4.238 ***2.026Mymensingh (34, 38) 329 283 319 379 ***1.448 ***4.117 −0.135 ***3.748Noakhali (57, 58, 59) 328 280 304 389 ***1.631 ***6.036 ***−2.219 **1.884Pabna (14, 16) 266 206 233 346 ***2.264 ***2.199 1.117 ***3.662Patuakhali (31, 32) 288 247 278 332 ***1.633 ***7.739 ***−2.475 ***2.399Rajshahi (11, 12, 13, 15) 321 235 289 423 ***2.461 **1.761 1.138 ***2.455Rangpur (4, 5, 6, 7, 10) 360 274 339 455 ***2.06 0.737 **2.145 *1.419Sylhet (50, 51, 52, 53) 337 284 305 410 ***1.584 0.732 ***2.286 ***1.966Tangail (37) 288 244 245 352 ***1.778 ***3.049 1.125 ***1.952NGDA 347 285 328 414 ***1.667 ***2.788 *0.956 ***2.176GDA 291 220 269 372 ***2.246 ***2.442 *1.857 ***2.578Non-drought 329 271 310 393 ***1.697 ***2.892 0.518 ***2.56Drought-prone 326 247 305 413 ***2.242 ***2.457 ***2.747 ***1.811Non-salinity 321 258 301 392 ***1.874 ***2.578 ***1.412 ***2.326Salinity-prone 365 287 354 446 ***1.945 ***3.787 0.320 **2.213BANGLADESH 328 262 308 400 ***1.88 ***2.746 **1.255 ***2.31
*p < .05; **p < .01; ***p < .001. Calculation of compound growth rates is described in Section 2.
non-drought areas (393 g), but was not found to be statistically significant. The rain-fed riceWP level in salinity-prone areaswas consistently higher than in non-saline areas.
For the 1968–2004 period, all districts recorded statistically significant WP growth rates. Two districts (Dinajpur #1, 2,3; Bogra #9, 10, 9.5% NCA) did not experience any statistically significant growth in WP during 1991–2004. This contrastswith the 1981–1990 scenario during which twelve districts (52% NCA) did not experience any significant WP growth forthe rain-fed rice crop. Four districts (25.6% NCA) did not experience any significant WP growth for the rain-fed rice cropduring 1968–1980. GDA recorded higher WP growth rates in all phases except 1968–1980. Salinity-prone areas registeredhigher growth rates than areas not affected by salinity during 1968–1980 and 1991–2004. In contrast, lower growth ratesemerged across the entire period (1968–2004) and during 1981–1990. A similar pattern ofWP growth during all phases andthe entire period of 1968–2004 was experienced by the drought-prone areas.
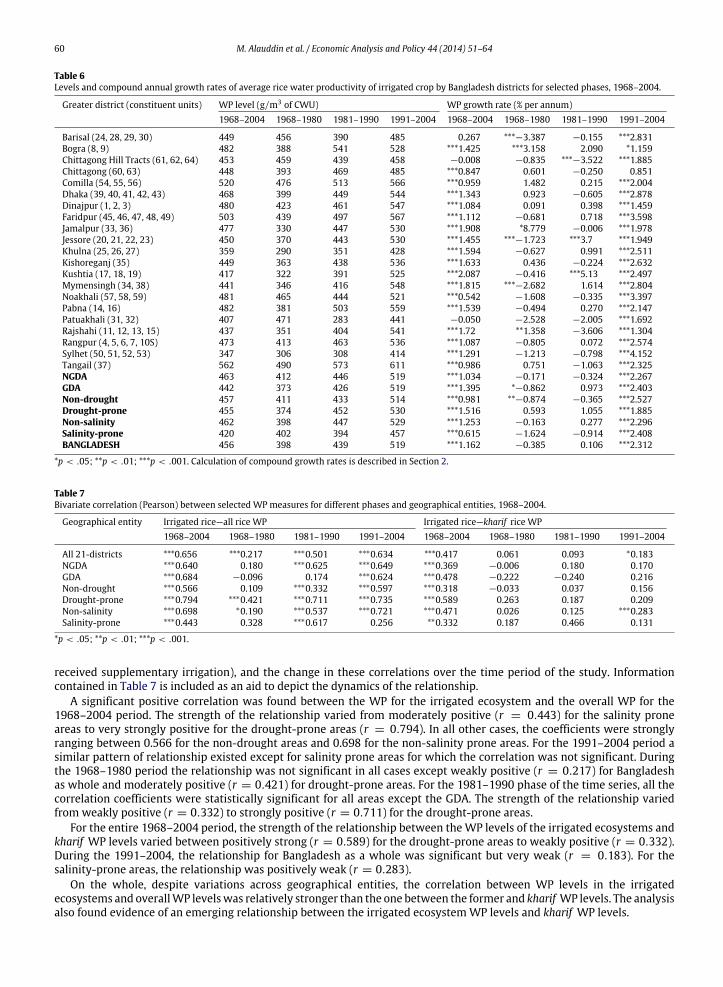
4.5. Rice water productivity in the irrigated ecosystems
Table 6 presents rice WP levels and trends for the irrigated ecosystem. The WP level for Bangladesh as a whole wasconsistently higher than in the GDA for all phases and the entire period of 1968–2004. GDA WP levels were consistentlylower than those in the NGDA for until 1990 and during 1968–2004, and leveled with NGDA during 1991–2004. For thenon-drought areas,WP levelswere higher during the period overall and during 1968–1980 but lower during 1981–1990 and1991–2004. Non-saline area WP levels were higher than those in the salinity-prone areas in all phases except 1968–1980.
During 1968–2004, all but two districts (Chittagong Hill Tracts #61–62, 64, and Patuakhali, #31–32 with 5% NCA)experienced significant positive growth rates. However, during 1968–1980, 15 districts (70% NCA) did not experience anysignificant WP growth while three districts (Barisal #24, 28–30; Jessore #20–23; and Mymensingh #34, 38, 15% NCA)registered significant negative growth rates. This contrasts sharply with the 1991–2004 scenario during which all but onedistrict (Chittagong #60, 63) experienced significant positiveWP growth. Notably, 18 districts did not record any significantWP during 1981–1990.
For Bangladesh as a whole, theWP grew at 1.16% per annum over the entire period of 1968–2004. In contrast, the growthrate doubled to 2.31% during 1991–2004. Somewhat similar results emerged with growth rates for the geographical entitiesbased on the GDA–NGDA, drought-non-drought, and salinity-non-salinity classifications during the same time periods.During 1991–2004 higher growth rates were observed for GDA and salinity-prone areas. On the other hand, the non-drought-prone areas as a whole experienced a higher growth rate during 1991–2004.
Given Bangladesh’s high dependence on groundwater, the data were analyzed to determine the strength of thecorrelations between WP in the irrigated ecosystem and overall WP and kharif WP (given that part of the kharif rice crops
60 M. Alauddin et al. / Economic Analysis and Policy 44 (2014) 51–64
Table 6Levels and compound annual growth rates of average rice water productivity of irrigated crop by Bangladesh districts for selected phases, 1968–2004.
Greater district (constituent units) WP level (g/m3 of CWU) WP growth rate (% per annum)1968–2004 1968–1980 1981–1990 1991–2004 1968–2004 1968–1980 1981–1990 1991–2004
Barisal (24, 28, 29, 30) 449 456 390 485 0.267 ***−3.387 −0.155 ***2.831Bogra (8, 9) 482 388 541 528 ***1.425 ***3.158 2.090 *1.159Chittagong Hill Tracts (61, 62, 64) 453 459 439 458 −0.008 −0.835 ***−3.522 ***1.885Chittagong (60, 63) 448 393 469 485 ***0.847 0.601 −0.250 0.851Comilla (54, 55, 56) 520 476 513 566 ***0.959 1.482 0.215 ***2.004Dhaka (39, 40, 41, 42, 43) 468 399 449 544 ***1.343 0.923 −0.605 ***2.878Dinajpur (1, 2, 3) 480 423 461 547 ***1.084 0.091 0.398 ***1.459Faridpur (45, 46, 47, 48, 49) 503 439 497 567 ***1.112 −0.681 0.718 ***3.598Jamalpur (33, 36) 477 330 447 530 ***1.908 *8.779 −0.006 ***1.978Jessore (20, 21, 22, 23) 450 370 443 530 ***1.455 ***−1.723 ***3.7 ***1.949Khulna (25, 26, 27) 359 290 351 428 ***1.594 −0.627 0.991 ***2.511Kishoreganj (35) 449 363 438 536 ***1.633 0.436 −0.224 ***2.632Kushtia (17, 18, 19) 417 322 391 525 ***2.087 −0.416 ***5.13 ***2.497Mymensingh (34, 38) 441 346 416 548 ***1.815 ***−2.682 1.614 ***2.804Noakhali (57, 58, 59) 481 465 444 521 ***0.542 −1.608 −0.335 ***3.397Pabna (14, 16) 482 381 503 559 ***1.539 −0.494 0.270 ***2.147Patuakhali (31, 32) 407 471 283 441 −0.050 −2.528 −2.005 ***1.692Rajshahi (11, 12, 13, 15) 437 351 404 541 ***1.72 **1.358 −3.606 ***1.304Rangpur (4, 5, 6, 7, 10S) 473 413 463 536 ***1.087 −0.805 0.072 ***2.574Sylhet (50, 51, 52, 53) 347 306 308 414 ***1.291 −1.213 −0.798 ***4.152Tangail (37) 562 490 573 611 ***0.986 0.751 −1.063 ***2.325NGDA 463 412 446 519 ***1.034 −0.171 −0.324 ***2.267GDA 442 373 426 519 ***1.395 *−0.862 0.973 ***2.403Non-drought 457 411 433 514 ***0.981 **−0.874 −0.365 ***2.527Drought-prone 455 374 452 530 ***1.516 0.593 1.055 ***1.885Non-salinity 462 398 447 529 ***1.253 −0.163 0.277 ***2.296Salinity-prone 420 402 394 457 ***0.615 −1.624 −0.914 ***2.408BANGLADESH 456 398 439 519 ***1.162 −0.385 0.106 ***2.312
*p < .05; **p < .01; ***p < .001. Calculation of compound growth rates is described in Section 2.
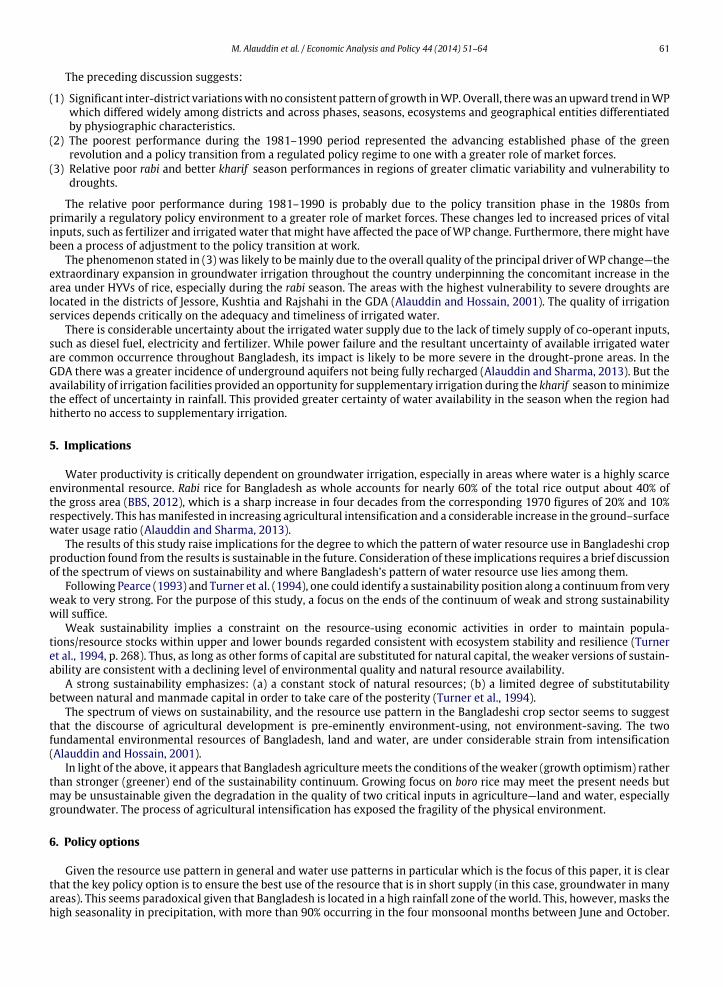
Table 7Bivariate correlation (Pearson) between selected WP measures for different phases and geographical entities, 1968–2004.
Geographical entity Irrigated rice—all rice WP Irrigated rice—kharif rice WP1968–2004 1968–1980 1981–1990 1991–2004 1968–2004 1968–1980 1981–1990 1991–2004
All 21-districts ***0.656 ***0.217 ∗∗∗0.501 ∗∗∗0.634 ***0.417 0.061 0.093 ∗0.183NGDA ∗∗∗0.640 0.180 ∗∗∗0.625 ∗∗∗0.649 ∗∗∗0.369 −0.006 0.180 0.170GDA ∗∗∗0.684 −0.096 0.174 ∗∗∗0.624 ∗∗∗0.478 −0.222 −0.240 0.216Non-drought ∗∗∗0.566 0.109 ∗∗∗0.332 ∗∗∗0.597 ∗∗∗0.318 −0.033 0.037 0.156Drought-prone ∗∗∗0.794 ∗∗∗0.421 ∗∗∗0.711 ∗∗∗0.735 ∗∗∗0.589 0.263 0.187 0.209Non-salinity ∗∗∗0.698 ∗0.190 ∗∗∗0.537 ∗∗∗0.721 ∗∗∗0.471 0.026 0.125 ∗∗∗0.283Salinity-prone ∗∗∗0.443 0.328 ∗∗∗0.617 0.256 ∗∗0.332 0.187 0.466 0.131
*p < .05; **p < .01; ***p < .001.
received supplementary irrigation), and the change in these correlations over the time period of the study. Informationcontained in Table 7 is included as an aid to depict the dynamics of the relationship.
A significant positive correlation was found between the WP for the irrigated ecosystem and the overall WP for the1968–2004 period. The strength of the relationship varied from moderately positive (r = 0.443) for the salinity proneareas to very strongly positive for the drought-prone areas (r = 0.794). In all other cases, the coefficients were stronglyranging between 0.566 for the non-drought areas and 0.698 for the non-salinity prone areas. For the 1991–2004 period asimilar pattern of relationship existed except for salinity prone areas for which the correlation was not significant. Duringthe 1968–1980 period the relationship was not significant in all cases except weakly positive (r = 0.217) for Bangladeshas whole and moderately positive (r = 0.421) for drought-prone areas. For the 1981–1990 phase of the time series, all thecorrelation coefficients were statistically significant for all areas except the GDA. The strength of the relationship variedfrom weakly positive (r = 0.332) to strongly positive (r = 0.711) for the drought-prone areas.
For the entire 1968–2004 period, the strength of the relationship between theWP levels of the irrigated ecosystems andkharif WP levels varied between positively strong (r = 0.589) for the drought-prone areas to weakly positive (r = 0.332).During the 1991–2004, the relationship for Bangladesh as a whole was significant but very weak (r = 0.183). For thesalinity-prone areas, the relationship was positively weak (r = 0.283).
On the whole, despite variations across geographical entities, the correlation between WP levels in the irrigatedecosystems and overallWP levelswas relatively stronger than the one between the former and kharif WP levels. The analysisalso found evidence of an emerging relationship between the irrigated ecosystemWP levels and kharif WP levels.
M. Alauddin et al. / Economic Analysis and Policy 44 (2014) 51–64 61
The preceding discussion suggests:
(1) Significant inter-district variationswith no consistent pattern of growth inWP.Overall, therewas anupward trend inWPwhich differed widely among districts and across phases, seasons, ecosystems and geographical entities differentiatedby physiographic characteristics.
(2) The poorest performance during the 1981–1990 period represented the advancing established phase of the greenrevolution and a policy transition from a regulated policy regime to one with a greater role of market forces.
(3) Relative poor rabi and better kharif season performances in regions of greater climatic variability and vulnerability todroughts.
The relative poor performance during 1981–1990 is probably due to the policy transition phase in the 1980s fromprimarily a regulatory policy environment to a greater role of market forces. These changes led to increased prices of vitalinputs, such as fertilizer and irrigated water that might have affected the pace ofWP change. Furthermore, theremight havebeen a process of adjustment to the policy transition at work.
The phenomenon stated in (3) was likely to bemainly due to the overall quality of the principal driver ofWP change—theextraordinary expansion in groundwater irrigation throughout the country underpinning the concomitant increase in thearea under HYVs of rice, especially during the rabi season. The areas with the highest vulnerability to severe droughts arelocated in the districts of Jessore, Kushtia and Rajshahi in the GDA (Alauddin and Hossain, 2001). The quality of irrigationservices depends critically on the adequacy and timeliness of irrigated water.
There is considerable uncertainty about the irrigated water supply due to the lack of timely supply of co-operant inputs,such as diesel fuel, electricity and fertilizer. While power failure and the resultant uncertainty of available irrigated waterare common occurrence throughout Bangladesh, its impact is likely to be more severe in the drought-prone areas. In theGDA there was a greater incidence of underground aquifers not being fully recharged (Alauddin and Sharma, 2013). But theavailability of irrigation facilities provided an opportunity for supplementary irrigation during the kharif season tominimizethe effect of uncertainty in rainfall. This provided greater certainty of water availability in the season when the region hadhitherto no access to supplementary irrigation.
5. Implications
Water productivity is critically dependent on groundwater irrigation, especially in areas where water is a highly scarceenvironmental resource. Rabi rice for Bangladesh as whole accounts for nearly 60% of the total rice output about 40% ofthe gross area (BBS, 2012), which is a sharp increase in four decades from the corresponding 1970 figures of 20% and 10%respectively. This hasmanifested in increasing agricultural intensification and a considerable increase in the ground–surfacewater usage ratio (Alauddin and Sharma, 2013).
The results of this study raise implications for the degree to which the pattern of water resource use in Bangladeshi cropproduction found from the results is sustainable in the future. Consideration of these implications requires a brief discussionof the spectrum of views on sustainability and where Bangladesh’s pattern of water resource use lies among them.
Following Pearce (1993) and Turner et al. (1994), one could identify a sustainability position along a continuum from veryweak to very strong. For the purpose of this study, a focus on the ends of the continuum of weak and strong sustainabilitywill suffice.
Weak sustainability implies a constraint on the resource-using economic activities in order to maintain popula-tions/resource stocks within upper and lower bounds regarded consistent with ecosystem stability and resilience (Turneret al., 1994, p. 268). Thus, as long as other forms of capital are substituted for natural capital, the weaker versions of sustain-ability are consistent with a declining level of environmental quality and natural resource availability.
A strong sustainability emphasizes: (a) a constant stock of natural resources; (b) a limited degree of substitutabilitybetween natural and manmade capital in order to take care of the posterity (Turner et al., 1994).
The spectrum of views on sustainability, and the resource use pattern in the Bangladeshi crop sector seems to suggestthat the discourse of agricultural development is pre-eminently environment-using, not environment-saving. The twofundamental environmental resources of Bangladesh, land and water, are under considerable strain from intensification(Alauddin and Hossain, 2001).
In light of the above, it appears that Bangladesh agriculturemeets the conditions of theweaker (growth optimism) ratherthan stronger (greener) end of the sustainability continuum. Growing focus on boro rice may meet the present needs butmay be unsustainable given the degradation in the quality of two critical inputs in agriculture—land and water, especiallygroundwater. The process of agricultural intensification has exposed the fragility of the physical environment.
6. Policy options
Given the resource use pattern in general and water use patterns in particular which is the focus of this paper, it is clearthat the key policy option is to ensure the best use of the resource that is in short supply (in this case, groundwater in manyareas). This seems paradoxical given that Bangladesh is located in a high rainfall zone of the world. This, however, masks thehigh seasonality in precipitation, with more than 90% occurring in the four monsoonal months between June and October.
62 M. Alauddin et al. / Economic Analysis and Policy 44 (2014) 51–64
Furthermore, there is considerable uncertainty in the arrival of monsoonal rains. As a result, crop production faces the riskof regular bouts of drought and flood of differing severity with significant adverse implications for crop production.
Water-saving can be achieved in several ways embodying two broad strategies that entail (a) a gradual but substantialshift from dry season rice to non-rice crops, such as pulses and vegetables that are less water-consuming, and (b) a reductionin the relative dependence on the rabi rice crop and an expansion of the scope of the kharif crop.
Despite significant expansion in the rice area under HYV in the dry (rabi) season, actual yields are on average 2 tonnesper hectare below the potential. Point (a) above represents a partial reallocation of land from rice to non-rice crops and doesnot necessarily imply a reduction in rice output in the rabi (dry) season. The rabi rice output could be maintained at thepresent level or increased by bridging the gap between potential and actual yields through improved input and resourcemanagement. The land released from dry season rice cropping could be allocated to other crops of higher nutritional valuebut less in water consumption (Afzal et al., 2004, p. 60). Point (b) implies the need for a significant expansion of HYV ricetechnology in the kharif season through: (i) more effective provision of supplementary irrigation to kharif HYV areas, and(ii) greater adaptability of HYVs to various environmental conditions.
The above strategies are underpinned, amongst others, by three categories of policy options: market-based, research anddevelopment (R & D)-based and institutional support.
Market-based optionIn Bangladesh, pricing of material inputs such as fertilizers, pesticides and irrigation equipment and other machinery has
been rationalized through policies that evolved in the 1980s and 1990s. This included the removal of subsidies and exchangerate distortions. However, groundwater (a key environmental good) has been considered a ‘free’ good even though it isbecoming increasingly scarce resources in many parts of Bangladesh.
The owners of irrigationmachinery, such as deep tube-wells extract undergroundwater for irrigating their own land andcharge a fee at commercial rates for irrigating others’ land. Pricing per cubicmeter of water irrigated or a fee based on enginecapacity could be imposed to demonstrate, at least partially, the true value of this environmental resource. The former isdifficult to enforce in practice but the latter is relatively easier to implement. An alternative, complementary strategy couldbe to design incentive mechanisms for innovation of the environment-saving type, for example, water- and energy-savingmechanical innovations.
R & D-based optionDeveloping rice and non-rice crop varieties that require less water (water-saving) is critically important. Given the
importance of rice, Bangladesh, for example, is a virtual rice monoculture, and there is significant reliance on ground-waterirrigation during the dry season. This involves developing technologies or providing incentives for a greater usage of surfacewater for irrigation given its relative abundance in some parts of Bangladesh. This assumes greater significance becauserapid urbanization is likely to place considerable strain on groundwater tables for domestic usage water supplies in urbanareas.
Of paramount importance is to extend and intensify research efforts toward developing HYVs of non-rice crops, forexample, pulses and vegetables, which are financially attractive to farmers and can partially but effectively replace rabirice crop cultivation. These crop varieties must contain multiple attributes involving wider adaptability to temperaturevariations, higher yields and lower consumptive water usage. This entails process innovations.
Bangladesh has made significant progress in varietal development and grain quality for widespread adoption in a rangeof agro-ecological zones that are more suited for rabi (dry season) than kharif (wet season). Challenges remain for thedevelopment of drought- and salinity-tolerant varieties, short maturing varieties with lower water requirements, as well asfuture climate proofed varieties with higher temperature tolerance (for example, wheat). Bangladesh has developed morethan 30 varieties of pulses with high yield potentials and adaptability to a range of environmental conditions. However,challenges remain for short maturing varieties between two rice crops, adaptability to stresses caused by variability inweather conditions, such as the severity of winter, and the high incidence of fog, making it financially attractive to farmersrelative to other crops, such as maize or boro rice.
Institutional supportThere are several ways in which uncertainty surrounding cropping pattern changes from rice to non-rice crops in the
rabi season and increased coverage of the HYVs of rice in the kharif season can be managed or minimized.Input supply and delivery systems involving adequate and timely availability of critical inputs such as fertilizers and
irrigation water need to be more efficient. Uncertainty in energy supplies (power and diesel) has been found to have adetrimental effect on crop yields. This also is likely to affect water productivity.
Given the serious consequences of crop failure, especially for the smaller and marginal farmers, the provision for cropinsurance is likely to be an important requirement in reducing the risk of crop failure due to natural phenomena, such asdroughts and floods of differing severity.
Furthermore, in order to build awareness and sensitization to resource use and conservation, a significant strengtheningof the linkages between education and research is a key approach that is likely to achieve water-use efficiency.
The above by no means represents an exhaustive list of options. However, it embodies some of the major options thatBangladesh could purse in order to sustain land and water productivity.
M. Alauddin et al. / Economic Analysis and Policy 44 (2014) 51–64 63
7. Conclusion
This paper argues that the process of crop production and attendant consumptive water use, especially groundwatermeets the conditions (or, ‘criteria’) of weak sustainability. It is debatable whether the present WP growth process issustainable. The paper advocates a set of market and non-market-based, policy options which, if taken as a whole, are likelyto sustain water productivity.
This research has contributed to the literature in two important ways. First it has departed from the bulk of existingliterature that focuses on spatial dimension of WP and used panel data to provide a spatio-temporal perspective. Second,it has and explored issues such as WP trend analysis across districts, regions, seasons, ecosystems and districts in differenttime phases that have not been addressed before.
One limitation of this paper is that analysis covered only until 2004. This paper focused on rice only, given its importancein Bangladesh agriculture. However, the methodological framework can be easily extended to other crops and datapermitting that the time series can be extended to more recent years as well. Furthermore, this analytical framework canbe adapted to other countries such as India with a much more diverse hydrological, physiographic and climatic conditionsthan Bangladesh.
Acknowledgments
With the usual caveats the authors gratefully acknowledge: funding from the Australian Research Council DiscoveryProject (DP0663809), the International Water Management Institute Indo-Gangetic Basin Project, and the Australian Centrefor International Agricultural Research Project (ASEM 2011-005); useful comments and constructive suggestions by ananonymous reviewer of this journal and Tushaar Shah; essential data provided by Inamul Haque, Nilufa Islam, Ehsan HafizChowdhury andM. Sattar Mandal; statistical analysis and econometric estimation by Hong Son Nghiem; and computer dataentry by Rezaul Hasan and Kamrul Hasan.
References
Afzal, M.A., Bakr, M.A., Hamid, A., Haque, M.M., Akhtar, M.S., 2004. Mungbean in Bangladesh. Lentil, Blackgram and Mungbean Development Pilot Project.Pulses Research Centre. Publication No. 23. Bangladesh Agricultural Research Institute, Gazipur, p 60.
Ahmad, M.D., Masih, I., Turral, H., 2004. Diagnostic analysis of spatial and temporal variations in crop water productivity: a field scale analysis of therice–wheat cropping system of Punjab, Pakistan. J. Appl. Irrigation Sci. 39 (1), 43–63.
Ahmed, A., Hussain, H., 2009. Climate Change and Livelihoods: An Analysis of Agro-Ecological Zones of Bangladesh. Centre for Global Change, Dhaka.Alauddin, M., Hossain, M., 2001. Environment and Agriculture in a Developing Economy: Problems and Prospects for Bangladesh. Edward Elgar, London.Alauddin, M., Quiggin, J., 2008. Agricultural intensification, irrigation and the environment in South Asia: issues and policy options. Ecol. Econ. 65, 111–114.Alauddin, M., Sharma, B.R., 2013. Inter-district rice water productivity differences in Bangladesh: an empirical exploration and implications. Ecol. Econ.
93, 210–218.Alauddin, M., Tisdell, C.A., 1991. The Green Revolution and Economic Development: The Process and its Impact in Bangladesh. Macmillan, London.Alauddin, M., Tisdell, C.A., 1995. Labour absorption and agricultural development in Bangladesh prospects and predicaments. World Dev. 23, 281–297.Amarasinghe, U.A., 2005. Country Policy Support Program (CPSP) Report No. 10. International Commission on Irrigation and Drainage, New Delhi, 15 pp.Amarasinghe, U.A., Shah, T., Singh, O.P., 2007. Changing Consumption Patterns: Implications on Food and Water Demand in India. IWMI Research Report
119, International Water Management Institute, Colombo, Sri Lanka. p. 43.Amarasinghe, U.A., Sharma, B.R., Aloysius, N., Scott, C., Smakhtin, V., de Fraiture, C., 2005. Spatial Variation inWater Supply and Demand across River Basins
of India. IWMI Research Report 83, International Water Management Institute, Colombo. p. 42.BARC (Bangladesh Agricultural Research Council), 2001. Application of Agro-Ecological Zones Database in Drought Management and Water Availability
Assessment. Bangladesh Agricultural Research Council, Dhaka.Barker, R., Dawe, D., Inocencio, A., 2003. Economics of water productivity in managing water for agriculture. In: Kijne, J.W., Barker, R., Molden, D. (Eds.),
Water Productivity in Agriculture: Limits and Opportunities for Improvement. International Water Management Institute, CAB International andColombo, Oxford, pp. 19–35.
BBS, 1999. Bangladesh Compendium of Environment Statistics 1997. Bangladesh Bureau of Statistics, Dhaka.BBS, 2012. Yearbook of Agricultural Statistics of Bangladesh. Bangladesh Bureau of Statistics, Dhaka.Boserup, E., 1965. Population and Technological Change. The Economics of Agrarian Change under Population Pressure. George Allen & Unwin, London.Boserup, E., 1981. Population and Technological Change. University of Chicago Press, Chicago.Cai, X., Molden, D., Mainuddin, M., Sharma, B.R., Ahmad, M., Karimi, P., 2011. Producing more food with less water in a changing world: assessment of
water productivity in 10 major river basins. Water Int. 36, 42–62.Cai, X., Rosegrant, M., 2003. World water productivity: current situation and future options. In: Kijne, J.W., Barker, R., Molden, D. (Eds.), Water Productivity
in Agriculture: Limits and Opportunities for Improvement. International Water Management Institute, CAB International and Colombo, Oxford,pp. 163–178.
Cai, X.L., Sharma, B.R., 2010. Integrating remote sensing, census andweather data for an assessment of rice yield,water consumption andwater productivityin the Indo-Gangetic river basin. Agric. Water Manag. 97, 309–316.
Chakraborti, D., Rahman, M.M., Paul, K., Chowdhury, U.K., Sengupta, M., Lodh, D., Chanda, C.R., Saha, K.C., Mukherjee, S.C., 2002. Arsenic calamity in theIndian Subcontinent: What lessons have been learned?. Talanta 58, 3–22.
De Vries, F.P., Acquay, H., Molden, D., Scherr, S., Valentin, C., Cofie, O., 2008. ‘Learning from bright spots to enhance food security and to combat degradationof water and land resources’. In: Bossio, D., Geheb, K. (Eds.), Conserving Land, Protecting Water. International Water Management Institute, CABInternational and Colombo, Oxford, pp. 1–19.
FPCO (Flood Plan Coordination Organization), 1991. Bangladesh Action Plan for Flood Control—Guidelines on Economic Analysis. Flood Plan CoordinationOrganization, Dhaka.
Gujarati, D., 2003. Basic Econometrics. McGraw-Hill, New York.Hayami, Y., Ruttan, V.W., 1985. Agricultural Development: An International Perspective. Johns Hopkins University Press, Baltimore.Heady, D., Alauddin, M., Rao, D.S.P., 2010. Explaining agricultural productivity growth: an international perspective. Agric. Econ. 41, 1–14.Jalota, S.K., Singh, K.B., Chahal, G.B.S., Gupta, R.K., Chakraborty, S., Sood, A., Ray, S.S., Panigrahy, S., 2009. Integrated effect of transplanting date, cultivar and
irrigation on yield, water saving and water productivity of rice (Oryza sativa L.) in Indian Punjab: Field and simulation study. Agric. Water Manag. 96,1096–1104.
64 M. Alauddin et al. / Economic Analysis and Policy 44 (2014) 51–64
Mahajan, G., Bharaj, T.S., Timsina, J., 2009. Yield and water productivity of rice as affected by time of transplanting in Punjab, India. Agric. Water Manag.96, 525–532.
Molden, D., 1997. Accounting for water use and productivity. In: SWIM Paper 1. International Water Management Institute, Colombo, p. 27.Molden, D. (Ed.), 2007. Water for Food, Water for Life: A Comprehensive Assessment of Water Management in Agriculture. International Water
Management Institute, Earthscan and Colombo, London.Molden, D., Murray-Rust, H., Shaktivadivel, R., Makin, I., 2003. A water-productivity framework for understanding and action. In: Kijne, J.W., Barker, R.,
Molden, D. (Eds.), Water Productivity in Agriculture: Limits and Opportunities for Improvement. International Water Management Institute, CABInternational and Colombo, Oxford, pp. 1–18; Molden, D., Sakthivadivel, R. and Habib, Z. 2001. ‘Basin-level productivity of water: Examples fromSouth Asia’. IWMI Research Report 49, International Water Management Institute, Colombo, p. 30.
Molden, D., Owesis, T.Y., Steduto, P., Kijne, J.W., Hanjra, M.A., Brindaban, P.S., 2007. Pathways for increasing agricultural water productivity’. In: Molden(Ed.), Water for Food, Water for Life: A Comprehensive Assessment of Water Management in Agriculture. International Water Management Institute,Earthscan and Colombo, London, pp. 279–310.
Molden, D., Sakthivadivel, R., 1999. Water accounting to assess use and productivity of water. Int. J. Water Resour. Dev. 15 (1), 55–71.Pearce, D., 1993. Blueprint 3: Measuring Sustainable Development. Earthscan, London.Pidwirny, M., 2006. Fundamentals of Physical Geography, second ed. http://www.physicalgeography.net/fundamentals/8j.html.Rahman, S., Salim, R., 2013. Six decades of total factor productivity change and sources of growth in Bangladesh agriculture (1948–2008). J. Agric. Econ.
64, 275–294.Raj, K.N., 1970. Growth, transformation and planning of agriculture. In: Robinson, E.A.G., Kidron,M. (Eds.), EconomicDevelopment in SouthAsia.Macmillan,
London, pp. 102–126.Rosegrant, M., Cai, X., Cline, S.A., 2002. World Water and Food to 2025: Dealing with Scarcity. International Food Policy Research Institute, Washington,
DC.Shah, T., 2007. The groundwater economyof SouthAsia: an assessment of size, significance and the socio-ecological impacts. In: Giordano,M., Villholth, K.G.
(Eds.), The Agricultural Groundwater Revolution: Opportunities and Threats to Development. International Water Management Institute, CABInternational and Colombo, Oxford, pp. 7–36.
Shah, T., 2009. Taming the Anarchy: Groundwater Governance in South Asia. International Water Management Institute, Resources for the Future andColombo, Washington, DC.
Shah, T., Debroy, A., Quereshi, A.A., Wang, J., 2003. Sustaining Asia’s groundwater boom. Nat. Resour. Forum 27, 130–141.SRDI, 2010, Soil Resource Development Institute. Ministry of Agriculture, Dhaka, Bangladesh.Turner, R.K., Doktor, P., Adger, N., 1994. Sea-level rise and coastal wetlands in the UK: mitigation strategies for sustainable management. In: Jansson, A.M.,
Hammer, M., Folke, C., Costanza, R. (Eds.), Investing in Natural Capital: The Ecological Economics Approach to Sustainability. Island Press, Washington,DC.
Vaidyanathan, A., Sivasubramaniyan, K., 2004. Efficiency of water use in agriculture. Econ. Political Weekly 39 (27), 2989–2996.WARPO (Water Resources Planning Organization), 2002. NationalWaterManagement Plan (Main Report)—Options for the Ganges Dependent Area.Water
Resources Planning Organization, Dhaka.Zwart, S.J., Bastiaanssen,W.G.M., 2004. Review ofmeasured cropwater productivity values for irrigatedwheat, rice, cotton andmaize. Agric.WaterManag.
69, 115–133.