Advancing Student Mobility through Data Mobility – A BC Focus

Population Mobility Dynamics Estimated from Mobile
Telephony Data
John Doyle, Peter Hung, Ronan Farrell, and Sean McLoone
ABSTRACT In the last decade, mobile phones and mobile devices using mobile cellular tel-ecommunication network connections have become ubiquitous. In several developedcountries, the penetration of such devices has surpassed 100 percent. They facilitate com-munication and access to large quantities of data without the requirement of a fixedlocation or connection. Assuming mobile phones usually are in close proximity with theuser, their cellular activities and locations are indicative of the user’s activities and move-ments. As such, those cellular devices may be considered as a large scale distributed humanactivity sensing platform. This paper uses mobile operator telephony data to visualize theregional flows of people across the Republic of Ireland. In addition, the use of modifiedMarkov chains for the ranking of significant regions of interest to mobile subscribers isinvestigated. Methodology is then presented which demonstrates how the ranking of sig-nificant regions of interest may be used to estimate national population, results of whichare found to have strong correlation with census data.
KEYWORDS call detail records; imperfect trajectories; Markov chain; stationary distri-bution; population estimation
Introduction
A mobile cellular telecommunication network is a geographically distributedradio network that enables communication via voice, text, or data between twoor more devices (Theodore, 2001; Mishra, 2004; Korhonen, 2003; Olsson et al.,2009; Ghosh et al., 2010). It routinely collects a wealth of information related tocustomer interactions in the context of its normal service operations. Functionssuch as connecting calls, delivering text messages via SMS, and providing Internetaccess generate a huge amount of data which mobile network operators use forcustomer billing and service delivery.
The operator-based data includes, among others, network bandwidth usagemeasurement logs, which are typically measured in Erlang (units of personphone use per hour), handover records, locating area logs, and call detailrecords (CDR). Handover records are recordings of migrations of a user fromone servicing cell to another while in the process of an active call. Location arealogs consist of periodic location updates relating to the set of cell towers, whichare prepared to serve a particular mobile device at any given time. CDR contains
Correspondence Address: John Doyle, The Callan Institute for applied ICT, National Univer-sity of Ireland Maynooth, Maynooth, Co. Kildare, Ireland. E-mail: [email protected]
Journal of Urban Technology, 2014Vol. 21, No. 2, 109–132, http://dx.doi.org/10.1080/10630732.2014.888904
# 2014 The Society of Urban Technology
Dow
nloa
ded
by [
Nat
iona
l Uni
vers
ity o
f Ir
elan
d M
ayno
oth]
at 0
8:30
11
June
201
4

information about all interactions between a mobile network and its customersthat are required for billing purposes. It may consist of user information relatingto people in connection with the network operators, the nature of the communi-cation activity (voice, SMS, data, etc.), duration of the activity, starting time ofthe activity, and servicing cell identification numbers of both the sender and thereceiver when available.
This research uses anonymized CDR from Meteor, a mobile network operatorin the Republic of Ireland, to visualize the regional flows of people across Ireland,and also investigates the use of Markov chain fixed row vectors for the identifi-cation of significant mobile subscriber regions of interest as well as populationdensity prediction. The Meteor network under investigation has just over onemillion customers, which represents approximately a quarter of the country’s4.6 million inhabitants in 2012 (CSO, 2012), and operates using both 2G and 3Gtelephone technologies. The CDR collected from the operator’s core networkincludes records related to voice calls, short message service (SMS), and datatransfer. Cell tower information, which contains geo-spatial coordinates in theIrish Grid Coordinate Reference System (The Irish Grid, 2011), network type,and transmitter azimuth, was also provided.
The voice calls and SMS records are split into originating and terminatingfiles, while data logs contain information on mobile Internet sessions. The voiceoriginating and terminating logs contain information on the time of each call,the caller and the called subscriber’s anonymized unique identifier, the durationof each call, and the servicing cell towers of both caller and called subscribers atthe start and end of each call when available. Similar information related toSMS activity is contained in the SMS originating and terminating logs. For eachInternet session recorded in the data logs, information on the anonymizedunique identifier, access point name (APN), session start time, duration of thesession, servicing cell at the start of the session, quantities of data uploaded anddownloaded, and servicing network node is collected. Note cell information isonly available for Meteor subscribed mobile devices. The available dataset con-sists of approximately three months of voice and SMS records from 09/11/2010to 27/02/2011 and approximately two weeks of data records from 08/02/2011to 27/02/2011, and contains tens of millions of CDR activities per day.
Background
In recent years, the wider availability of human mobility data gives rise to anincrease of research activities involving human movement and spatial-temporalbehavior at both urban and national scales. This is probably due to the varietyof potential applications resulting from the classification and prediction ofhuman mobility (Song et al., 2010a, 2010b), such as resource planning (Deruycket al., 2012), dynamic transportation services (Steenbruggen et al., 2011), andunderstanding of human mobility behavior (Um et al., 2009; Park et al., 2010).
Ratti et al. (2006, 2007), Calabrese and Ratti (2006), Calabrese et al. (2011a),and Horanont and Shibasaki (2008) each focused on human activity mapping.Ahas et al. (2007a, 2007b, 2008, 2010a) demonstrated that suburban commutermovements and tourist movement dynamics could be extracted from sources ofmobile telephony data. Tourist movements have also been examined by Kuusiket al. (2010, 2011), while methods for home and work location estimation and
110 Journal of Urban Technology
Dow
nloa
ded
by [
Nat
iona
l Uni
vers
ity o
f Ir
elan
d M
ayno
oth]
at 0
8:30
11
June
201
4

population movement dynamics have been proposed by Ahas et al. (2010b), Silmand Ahas (2010), Calabrese et al. (2011b), Isaacman et al. (2011), Kelly et al. (2011),and Jarv et al. (2012).
Areas associated with mass urban activity may be readily sourced from cellactivity counts, as demonstrated by Reades et al. (2007, 2009), Andrienko et al.(2010a, 2010b), Becker et al. (2011a), Isaacman et al. (2010), Vieira et al. (2010)and Caceres et al. (2012). This type of work has generally focused on clusteringareas of similar activity profiles with applications such as group movement pat-terns (Becker et al., 2011b) and marketing (Lin and Wan, 2009).
Other applications include examinations on the differences between ruraland urban societies (Eagle et al., 2009b), the production of agent-based modelsof epidemic spread (Frias et al., 2011), the construction of social network graphs(Onnela et al., 2007a, 2007b; Nanavati et al., 2008; Kamola et al., 2011), studieson the characteristics of communication flow (Lambiotte et al., 2008; Kringset al., 2009; Kelly et al., 2011), and the identification of community structureusing communication flow (Walsh and Pozdnoukhov, 2011; Ratti et al., 2010).
Movement and mobility predictability by mobile telephony data has alsobeen a topic of discussion; most notably the works of Gonzalez et al. (2008) andSong et al. (2010a, 2010b) have provided insights into the basic laws governinghuman motion and limiting thresholds on the predictability of human movement.The range of human motion was quantified in Gonzalez et al. (2008) using theradius of gyration, which measures the overall range of an individual trajectory.This research demonstrated a stark contrast between actual human motion andclassical random walk models. By measuring the entropy of individual trajec-tories, Song et al. (2010a, 2010b) showed that there was a potential predictabilityof 93 percent in user mobility across a mobile network operator’s subscriberbase, despite the significant differences in travel patterns.
Eagle et al. (2009a, 2009c) demonstrated the application and design of com-munity structure algorithms that are appropriate for the identification of locationclusters relevant to a mobile user’s life. Bluetooth beacons located at subscriberhomes supplemented validation of the proposed techniques. Mobility modelingalgorithms were also developed using discrete Markov chains, for example byPark et al. (2010) in which it was demonstrated that the approximation of usermobility through Markov chains reproduces the slow, sub-polynomial growthpredicted by the evolution of the radii of gyration. They also proposed how theeigenvalues and eigenvectors of a Markov chain were related to subscriber mobi-lity. Jarv et al. (2014), Steenbruggen et al. (2011), Caceres et al. (2008), Yim (2003),and Rose (2006) discussed how the availability of large quantities of human move-ment data had also been of interest in the transportation sciences.
Cell Coverage Regions
A mobile network topology is governed by coverage and capacity requirements.While cell coverage is generally constrained by geographical factors, capacity isgenerally influenced by traffic demand (Theodore, 2001; Korhonen, 2003;Mishra, 2004; Olsson et al., 2009; Ghosh et al., 2010). As traffic demand is stronglylinked to population density, parameters such as cell size and density vary withmobile user density. Typically, mobile network topology for 2G, 3G, and 4G aredesigned separately. This results in the possibility of several cell towers of
Population Mobility Dynamics Estimated 111
Dow
nloa
ded
by [
Nat
iona
l Uni
vers
ity o
f Ir
elan
d M
ayno
oth]
at 0
8:30
11
June
201
4

varying telecommunication standards covering a single geographical area indifferent network configurations.
Using the collective cell tower data, namely the geo-spatial coordinates andnetwork type of each cell, it is possible to approximate idealized cell site coverageareas. This is achieved via Voronoi tessellation (Okabe et al., 1992), of each mobilenetwork of interest, where each center represents a cell base station site location.Note the accuracy of the tessellation in approximating cell coverage areas isaffected by channel characteristics, topography of the area, and physical layer par-ameters that include among others, transmitter frequency, tilt, height, and trans-mission power (Mishra, 2004). These have not been factored into this analysisand hence may introduce some approximation error.
The coverage regions produced in this way are a reasonable approximationfor cell site locations that lie within central locations. However, the absence of lim-iting threshold on coverage regions size means that cells sites along coastal regionsare poorly approximated. As a result, the introduction of a maximum cell siteradius of 20 km and 15 km is introduced for 2G and 3G networks, respectively.The choice of each threshold reflects the realistic limit for communication witheach standard given our network topology. Each site radius Sr is calculated via
Sr =���Sa
p
√(1)
where Sa denotes the cell site coverage area and is given by
Sa =1
2
∑n−1
i=0
(xiyi+1 − xi+1yi)
∣∣∣∣∣∣∣∣∣∣ (2)
where n is the number of vertices in the coverage polygon and (x,y) are the spatialcoordinates of each point. To establish more specific cell sectored regions foranalysis, each tessellation may be subdivided using cell transmitter azimuthangle information. Note multiple cells on one site with the same transmitterazimuth angles share the same cell coverage polygon. Cell radius (Cr) and area(Ca) can thus be estimated using Equations 1 and 2, while individual cell centroidEasting and Northing locations (Cx, Cy) are given by;
Cx = 1
6Ca
∑n−1
i=0
(xi + xi+1)(xiyi+1 − xi+1yi) (3)
Cy = 1
6Ca
∑n−1
i=0
(yi + yi+1)(xiyi+1 − xi+1yi) (4)
An illustrative example of cell boundary polygons for Meteor’s 2G and 3G net-works is given in Figure 1.
Movement Transition Flows
With the ever-increasing availability of trajectory data, observing the aggregatedflows of people or animals between regions of interest has been a growing areaof research. The work of Andrienko and Andrienko (2002, 2011), Andrienko etal. (2012), Buchin et al. (2011), and Doyle et al. (2011) has explored varying tech-niques to visualize and group similar movement patterns. Similarly, CDR subscri-ber trajectories may be exploited in this regard.
112 Journal of Urban Technology
Dow
nloa
ded
by [
Nat
iona
l Uni
vers
ity o
f Ir
elan
d M
ayno
oth]
at 0
8:30
11
June
201
4

A mobile device CDR trajectory is a path observed from CDR that a subscri-ber follows through a cell network as a function of time. Such trajectories arereadily extracted from CDR by selecting device-specific temporally sorted celltower connections. The trajectory may be spatially correlated by relating thespatial information of a servicing cell to each trajectory point. By counting thenumber of subscriber transitions between servicing cell towers in a given timeframe, we can construct an aggregated transition matrix, Ta (k),
Ta(k) =
t1,1(k) t1,2(k) · · · t1,R(k)t2,1(k) t2,2(k) · · · t2,R(k)
..
. ... . .
. ...
tR,1(k) tR,2(k) · · · tRR(k)
⎛⎜⎜⎜⎝
⎞⎟⎟⎟⎠ (5)
where R is the number of regions of interest, and ti,j (k) is the transition intensityfrom region i to j at time k. For the mobile network considered in this research, Ta isa large matrix containing approximately 115 million elements (R ¼ 10,721). Fortransition flow analysis, the matrix size needs to be reduced in order to lowerboth the computational complexity and memory requirements.
Several existing clustering methods can be used to combine adjacent cell cov-erage polygons of varying standards into a larger polygon representative of asymbolic location such as a population center. To this end, an agglomerative hier-archical based clustering (Xu and Wunsch, 2005) was chosen, using the Euclideandistance between each base station site location as a similarity measure. Initially,as a compromise between spatial accuracy and computational intensity, 500 clus-tered cell regions were selected. By performing a spatial union on the coveragepolygons of individual cells within each cluster, the coverage region of eachcluster can be generated and visualized as in Figure 2(a). This reduces Ta to T(R ¼ 500). The flow of people between clustered regions and the geographicalareas covered represents a proxy for the flow of people between individual
Figure 1: Sectored cell coverage of Meteor (a) 2G (4042 cells); and (b) 3G (6679 cells) networks in theRepublic of Ireland. Blue lines indicate original Voronoi cell boundary edges, while red lines corre-
spond to the cell boundary edges after the cell radius limiting threshold was applied.
Population Mobility Dynamics Estimated 113
Dow
nloa
ded
by [
Nat
iona
l Uni
vers
ity o
f Ir
elan
d M
ayno
oth]
at 0
8:30
11
June
201
4

population centers. The proportional link strengths demonstrating observed tran-sitions among regions are illustrated in Figure 2(b).
The transition intensity or strength may also be observed temporally betweentwo individual regions. A comparison of average daily activity volumes betweenMaynooth and Leixlip, towns in the north-east corner of County Kildare, Ireland,is displayed in Figure 3. With populations of 12,510 and 15,452, respectively, bothare served by a commuter train service to Dublin and are close to the M4 motor-way. From Figure 3, as expected Friday evening (4–8pm) has the highest tran-sition volume in comparison to other days of the week. The commutingbehavior that exists between Maynooth and Leixlip is also evident, as earlyspikes in transition intensity from Maynooth to Leixlip is recorded on weekdays, with the expected lull on weekends.
The temporal directionality of the transition intensity is an important featurewhen observing the flow of individuals. A sample of regional transition flows con-structed using a customized interface between MATLABw and Google Earthw isdepicted in Figure 4. It illustrates Dublin city regional transition flows in timeperiods of low and high intensities, where the width of a connecting arrow corre-sponds to directional transition intensity. The anchor point for each connectionarrow is positioned at the centroid position of each cluster, which is the centerof the mass of cell base station sites independent of the number of cells in each site.
Population Density Estimation
A Markov chain is a mathematical representation of a stochastic process thatundergoes step transitions from one state to another within a finite or countablestate space. They have been extensively used in many domain areas includingmobility modeling (Eagle et al., 2009a; Park et al., 2010), biomedical data analysis
Figure 2: The proportional link strengths demonstrating observed transitions between clustered cellregions: (a) Clustered cell coverage regions; (b) Proportional strengths of transitions between clustered
cell regions
114 Journal of Urban Technology
Dow
nloa
ded
by [
Nat
iona
l Uni
vers
ity o
f Ir
elan
d M
ayno
oth]
at 0
8:30
11
June
201
4

(Ocan, 2005), and speech recognition (Rabiner, 1989; Ostendorf et al., 1996). A first-order, discrete-time Markov chain is used to mathematically represent a process,S(k), k ¼ 0, 1,2, . . . , that undergoes random step transitions such that
P[S(k) = j|S(k − 1) = i] = pij(k) (6)
for all i, j and k (Ibe, 2008). Here pi,j (k) is the conditional probability that theprocess will transition from state i at time k21 to state j at time k. A Markovchain which does not depend on the time unit, is known as a homogeneousMarkov chain and implies
P[S(k) = j|S(k − 1) = i] = pij. (7)
From this, it is inferred that the state transition probability pi,j only dependson the current state and not on the sequence of previous states. This specifickind of memorylessness is called the Markov property.
Homogeneous Markov chains are useful when the state sequence, S(k), k ¼ 0,1,2, . . . , is directly observable. By extracting a subscriber CDR trajectory, it is poss-ible to directly observe an individual subscriber’s cell tower state sequence. Aspreviously discussed, cells may be linked to symbolic locations defined by theircoverage regions, thus Markov chains may be used to model a mobile subscribers
Figure 3: Average daily activity volumes of subscribers moving between clustered regions coveringthe towns of Maynooth and Leixlip.
Population Mobility Dynamics Estimated 115
Dow
nloa
ded
by [
Nat
iona
l Uni
vers
ity o
f Ir
elan
d M
ayno
oth]
at 0
8:30
11
June
201
4

transient movement between these symbolic locations. Similarly, national mobilitymay be modeled when subscriber movements are combined into a single mobilitymodel characterizing flow throughout the country.
T =∑N
u=1
Tu (8)
where N is the number of subscribers.By counting the transitions between clustered regions from concurring activi-
ties, an aggregated transition matrix, Tu, can be constructed which summarizes themovement of the uth subscriber. To reduce high frequency transitions and toensure uniformly sampled trajectories, each subscriber trajectory was sampledat a regular interval every 15 minutes from the start of the observation period.The procedure is illustrated in Figure 5. Within each 15-minute temporalwindow, the estimate of location is based on the last recorded servicing cell
Figure 4: Dublin city regional transition flows in time periods of (a) low, and (b) high intensity, wherethe width of the connecting arrow corresponds to directional transition intensity. Note connecting
arrows with very low intensity have been removed for visual clarity.
116 Journal of Urban Technology
Dow
nloa
ded
by [
Nat
iona
l Uni
vers
ity o
f Ir
elan
d M
ayno
oth]
at 0
8:30
11
June
201
4

tower recorded for that subscriber during that period. When no CDR activityoccurs during a particular temporal window, no sample would be taken.
CDR trajectory sampling distributions are non-uniform and dictated by theactivity profiles of individual subscribers (Gonzalez et al., 2008; Ranjan et al.,2012). As a result, the number of observable subscribers fluctuates with normalcyclic national activity patterns. The net effect is that during periods of normalsocial activity (i.e., excluding public holidays such as New Year’s Eve and largeevents such as St Patrick’s Day) only a portion of the total subscriber populationmay be observed at any one instance. The percentage of active subscribers over aseven-day period observed using the aforementioned sampling technique is illus-trated in Figure 6.
The transition matrix of each subscriber, Tu, may be translated into a prob-ability transition matrix, Pu, by scaling each row such that
Pu = [ pij]R×R �∑R
j=1
pij = 1, ∀i (9)
The resulting probability transition matrix, Pu, characterizes the movement of anindividual subscriber. Using this framework, a Markov chain mobility model foreach subscriber registered to the cellular network was obtained using a month
Figure 5: CDR trajectory state sequence sampling, where the output sequence S ¼ {S1, S1, S3, S3, S4}.Smaller yellow circles represent actual regional transitions within a sample period and larger yellowcircles represent the observed output transition sequence before resampling. The larger white circle
represents missing information.
Figure 6: Typical percentage of subscribers which may be observed over a seven-day period.
Population Mobility Dynamics Estimated 117
Dow
nloa
ded
by [
Nat
iona
l Uni
vers
ity o
f Ir
elan
d M
ayno
oth]
at 0
8:30
11
June
201
4

long period of observations, where the number of observable state equals thenumber of regions of interest R.
If a Markov chain is irreducible, or ergodic, it is possible to go from every stateto every other state in one or more steps (Grinstead and Snell, 1997). In such cases,the following holds
W = lim j�1Pj (10)
where W is a matrix with identical rows w, and all components of w sum to 1. ThenwP ¼ w, and any row vector v such that vP ¼ v is a constant multiple of w. A rowvector w with the property wP ¼ w is called a fixed row vector for P and may becalculated by various methods, as outlined in by Grinstead and Snell (1997).
A fixed row vector characterizes the long term probability of a system being ina given state when the state transitions are governed by an underlining Markovchain. The fixed row vector of a mobile subscriber’s mobility Markov chain, wu,conveys the probability of observing that subscriber at a region in space over along period of time. In order to extract national population counts using fixedrow vectors, the home location of each subscriber needs to be segregated fromthese regions of interest. Here, the maximum weighting approach used involvesassigning a subscriber’s home location to the region that has the maximum fixedrow vector weight. The population count of any region may then be calculatedby counting the number of subscribers who are estimated to live in that region.
Alternatively, it is also hypothesized that the fixed row vector for the aggre-gated Markov chain mobility model, wa, will convey the likelihood of observingthe mobile operators active subscriber base at a particular region in space over along period of time, which in turn provides an estimate for national populationdensity. The model has the advantage that the calculation is based on the overallsubscriber data rather than individual subscriber regions of interest. Hence, it istotally privacy preserving in the sense that none of the subscribers are individuallytracked. Also, only a single calculation is required to form the aggregated fixed rowvector, which is less computationally intensive than the maximum weightingapproach, where the number of calculation is proportional to the number of sub-scribers. Each of the proposed techniques is summarized in Figure 7.
However, mobility Markov chains are not necessarily ergodic. Instead, theyare typically sparse and may contain absorbing states (i.e. pii ¼ 1): for example,if a subscriber is only ever serviced by a single cell tower or if its last trajectorysample was to a previously unvisited tower. For an aggregated mobilityMarkov chain an absorbing state may occur if subscribers from a particularregion of interest never left that area during the time concerned. Likewise, anon-ergodic chain may form if every region of interest was not visited duringthe observation period.
To ensure each mobility Markov chain is ergodic and thereby non-absorbing, aregularization process similar to that used by Googlew PageRank algorithm (Brinand Page, 1998) is introduced. It consists of applying a small transition weight to allstate transitions before the fixed row vector is calculated and is given by
Q = aP + (1 − a)J
R(11)
where Q is a modified Markov chain, J is a R × R matrix of ones, and a balancesthe learnt mobility patterns summarized by P with the influence of random
118 Journal of Urban Technology
Dow
nloa
ded
by [
Nat
iona
l Uni
vers
ity o
f Ir
elan
d M
ayno
oth]
at 0
8:30
11
June
201
4

transition probabilities introduced by the term J/R. To this end a is estimated as(121/R). Note Q should satisfy to the following conditions:
(1) pii , 1, ∀i
(2) 0 ≤ pij ≤ 1, ∀i∀j
(3) Q = [qij]R×R �∑Rj=1
qij = 1, ∀i
The incorporation of uniformly regularized weighting has the added benefit ofaccounting for the likelihood of observing transitions which relate to all plausiblebut unobserved journeys. Using the previously mentioned clustered cell regions(R ¼ 500) as a proxy for spatial regions of interest, a visualization of Q for a randomlyselected subscriber is visualized in Figure 8. Note all weights which are asymptoti-cally zero are removed for visual clarity. Figure 8(a) depicts the weighted transitionprobabilities, with arch height corresponding to the probability of transitioning fromone region to another. Figure 8(b) depicts the region rank estimated from Q given itsfixed row vector w. The observed regional ranking suggests that the subscriber tendsto travel in County Meath, with occasional trips into Dublin City.
Using the same clustered cell regions, an estimate of population density wascalculated using both proposed approaches. The results are visualized in Figure 9,with density normalized between 0 and 1 for visual clarity. While maximumweighting relies only on information collected from individual subscribers, it isprone to noise in CDR data as it relies on the assumption that both a significant
Figure 7: Overview of each population estimation technique.
Population Mobility Dynamics Estimated 119
Dow
nloa
ded
by [
Nat
iona
l Uni
vers
ity o
f Ir
elan
d M
ayno
oth]
at 0
8:30
11
June
201
4
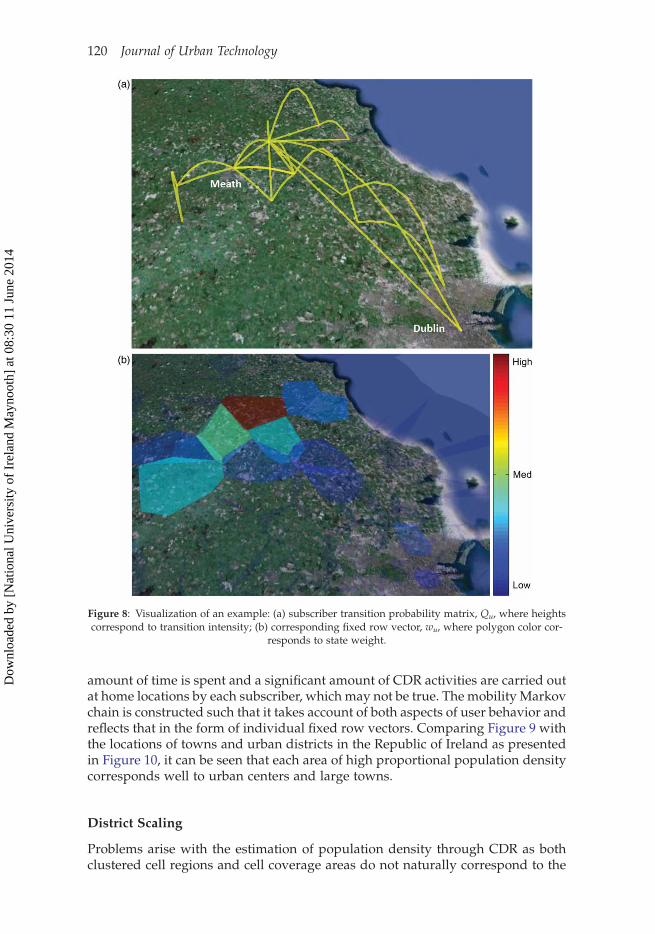
amount of time is spent and a significant amount of CDR activities are carried outat home locations by each subscriber, which may not be true. The mobility Markovchain is constructed such that it takes account of both aspects of user behavior andreflects that in the form of individual fixed row vectors. Comparing Figure 9 withthe locations of towns and urban districts in the Republic of Ireland as presentedin Figure 10, it can be seen that each area of high proportional population densitycorresponds well to urban centers and large towns.
District Scaling
Problems arise with the estimation of population density through CDR as bothclustered cell regions and cell coverage areas do not naturally correspond to the
Figure 8: Visualization of an example: (a) subscriber transition probability matrix, Qu, where heightscorrespond to transition intensity; (b) corresponding fixed row vector, wu, where polygon color cor-
responds to state weight.
120 Journal of Urban Technology
Dow
nloa
ded
by [
Nat
iona
l Uni
vers
ity o
f Ir
elan
d M
ayno
oth]
at 0
8:30
11
June
201
4

boundaries of districts or municipalities used by governments in the calculation ofregional or local population. To allow direct comparisons between estimatedpopulating density and census ground truth, where census data is suppliedfrom the Central Statistics Office (CSO) Ireland, measurements of populationobserved at each region need to be redistributed to regions within officially
Figure 9: Population density estimates based on (a) individual home locations as sourced from sub-scribers; (b) aggregated mobility model.
Figure 10: Sourced from the Central Statistic Office (CSO) Ireland: (a) town locations across theRepublic of Ireland, with (b) corresponding normalized population density.
Population Mobility Dynamics Estimated 121
Dow
nloa
ded
by [
Nat
iona
l Uni
vers
ity o
f Ir
elan
d M
ayno
oth]
at 0
8:30
11
June
201
4

defined district boundaries. In Ireland, a common local area district used in thecalculation of population is known as an Electoral Division (ED). There areapproximately 3400 ED in Ireland ranging in size from several hundredsquared meters in urban areas to several squared kilometers in rural regions.
A sample of the spatial distribution of buildings is displayed in Figure 11. Theproperty use and location of each building is sourced from Geodirectory (2012).Established and maintained by An Post and Ordnance Survey Ireland (OSI), itis one of the most comprehensive building address databases available in theRepublic of Ireland.
The procedure used to distribute estimated population onto EDs consists ofseveral steps. First, assign each identified occupied home to an ED. Next, allocateeach home in an individual ED to a cell region of interest that covers the dwellingconcerned in its spatial coverage polygon. If multiple regions of interest cover aparticular building, due to instances of overlapping 2G and 3G coverage, ran-domly assign a covering region from that list. Once all dwellings have beenassigned, group them into a matrix H,
H =
h1,1(k) h1,2(k) · · · h1,R(k)h2,1(k) h2,2(k) · · · h2,R(k)
..
. ... . .
. ...
hM,1(k) hM,2(k) · · · hMR(k)
⎛⎜⎜⎜⎝
⎞⎟⎟⎟⎠ (12)
where hi,j is the number of homes from ith ED assigned to region of interest j, whileM and R are the numbers of EDs and clustered regions, respectively. H is then ED
Figure 11: A sample of the spatial distribution of buildings across the Republic of Ireland. Alsoincluded is the cell coverage regions in the area (indicated by red lines), and ED boundaries (black
lines); (a) Residential locations (blue dots), and (b) Commercial buildings (black dots).
122 Journal of Urban Technology
Dow
nloa
ded
by [
Nat
iona
l Uni
vers
ity o
f Ir
elan
d M
ayno
oth]
at 0
8:30
11
June
201
4

normalized such that
H = [hij]M×R �∑M
i=1
hij = 1, ∀j (13)
The number of subscribers living within an individual ED, Ni, is thenestimated by,
Ni =∑R
j=1
Njhij (14)
where Nj denotes the number of estimated subscribers living in a region ofinterest j. Using this method of distribution, Figure 12 depicts the populationfor each ED as estimated using the aforementioned fixed row vectors tech-niques for R ¼ 500. In particular, proportional population estimated for theDublin region is displayed in Figure 13. It can be observed that the ED segre-gated spatial distribution of subscribers between census data and both esti-mation techniques are strongly correlated. The discrepancies, such as in thecity center region, could be attributed to the differences in the nature ofcensus, where only residential addresses are recorded, and the activity observedby mobile networks.
Finally, to obtain the population density, perhaps a more important measure,H is transformed to D where
D = HA (15)
Figure 12: Electoral division population estimates across the Republic of Ireland from (a) maximumweighting; (b) aggregated vector.
Population Mobility Dynamics Estimated 123
Dow
nloa
ded
by [
Nat
iona
l Uni
vers
ity o
f Ir
elan
d M
ayno
oth]
at 0
8:30
11
June
201
4

and A is a diagonal matrix
A =
1
a10 · · · 0
01
a2· · · ..
.
..
. ... . .
.0
0 · · · · · · 1
aM
⎛⎜⎜⎜⎜⎜⎜⎜⎜⎜⎝
⎞⎟⎟⎟⎟⎟⎟⎟⎟⎟⎠
(16)
Figure 13: Proportional population estimated for the Dublin region from (a) census counts; (b)maximum weighting, and (c) aggregated vector.
124 Journal of Urban Technology
Dow
nloa
ded
by [
Nat
iona
l Uni
vers
ity o
f Ir
elan
d M
ayno
oth]
at 0
8:30
11
June
201
4

where ai is the spatial area of the ith ED. Then, D is normalized to �D using EDcolumns similar to the normalized �H.
Census Validation
To validate the population estimate given by each fixed row vector from modifiedMarkov chain mobility models, a direct comparison is drawn between the esti-mated populations and the Irish 2011 census (CSO, 2012). The correlation ofcensus population counts with the population estimates based on maximumweighting was found to be 0.8645 while that with aggregated vector was 0.8088.The results indicate that both approaches have a strong spatial relationship tocensus count measurements.
On a national level, the spatial variance of percentage error between censusdata and estimated population is shown in Figure 14. In general, the mean ofthe percentage error between census data and estimates from aggregated vectoris 0.64037 percent with a standard deviation of 0.51335 percent while the corre-sponding values for the population estimates based on maximum weighting are0.54007 percent and 0.42464 percent, respectively. As a result, the maximumweighting approach appears to provide population estimates which matchmore closely with the census data. Note the percentage error is calculated basedon normalized population count. From Figure 14, there is no clear pattern associ-ated with the spatial distribution of error. In the absence of accurate Meteor sub-scriber demographics, it is hypothesized that estimation error fluctuates with thespatial density of meteor’s subscriber population. If the age of each subscriberwere known, this hypothesis could be tested by proportionally scaling each popu-lation estimate by its corresponding ED age profile.
Comparing the population density between census data and both techniques,correlations of 0.8661 and 0.8438 are obtained from maximum weighting andaggregated vector approaches, respectively. While the census correlations from�H are similar to those from �D using both techniques, it appears that themaximum weighting approach provides better estimates compared to aggregated
Figure 14: The spatial variance of percentage error between census data and estimated populationfrom (a) maximum weighting; (b) aggregated vector.
Population Mobility Dynamics Estimated 125
Dow
nloa
ded
by [
Nat
iona
l Uni
vers
ity o
f Ir
elan
d M
ayno
oth]
at 0
8:30
11
June
201
4

vector. However, it is noted that maximum weighting is much more computation-ally intensive and privacy non-preserving as the assumed home location of eachindividual subscriber is tracked anonymously during the process.
On the regional scope, a comparison of census data and estimated populationcount for each county in the Republic of Ireland is summarized in Table 1. In eachcase, the total county population count is the sum of all ED counts which arelocated in a particular county. From this table, the maximum weighting approachand aggregated vector approach had a percentage mean squared error (MSE) withCSO census of 6.2288 and 4.0415, respectively. When the measurement for Dublincounty is omitted the percentage MSE was 1.0491 and 2.0832, respectively.
In the study of mobility, correlation is an important measure, as it captures therelationship between measured population count and population estimates. Byobserving changes in correlation, we can capture relative displacements of popu-lation over time. Here, the maximum weighting approach and aggregated vectorapproach had correlations with CSO census of 0.98408 and 0.97731, respectively.When the measurement for Dublin county is omitted, the correlations were0.9124 and 0.8515, respectively.
Table 1: A comparison of Central Statistics Office Ireland census data andestimated population density for each county in the Republic of Ireland, where
measurements are the percentage of total population.
CountyCentral Statistics Office
Ireland (%)Maximum Weighting
(%)Aggregated Vector
(%)
Carlow 1.19 2.22 2.93Cavan 1.60 0.53 0.39Clare 2.55 2.81 3.16Cork 11.31 10.24 11.98Donegal 3.51 1.14 0.48Dublin 27.75 39.40 35.03Galway 5.46 5.27 4.17Kerry 3.17 1.36 0.92Kildare 4.58 6.09 7.24Kilkenny 2.08 2.24 2.98Laois 1.76 2.35 3.33Leitrim 0.69 0.14 0.07Limerick 4.18 5.36 6.82Longford 0.85 0.50 0.44Louth 2.68 1.34 0.70Mayo 2.85 1.35 0.99Meath 4.01 3.74 3.55Monaghan 1.32 0.27 0.15Offaly 1.67 1.43 1.83Roscommon 1.40 0.66 0.52Sligo 1.43 0.65 0.34Tipperary 3.46 2.02 2.37Waterford 2.48 1.97 1.69Westmeath 1.88 1.89 2.19Wexford 3.17 2.63 3.14Wicklow 2.98 2.39 2.62MSE 0 6.2288 4.0415MEE Excluding
Dublin0 1.0491 2.0832
126 Journal of Urban Technology
Dow
nloa
ded
by [
Nat
iona
l Uni
vers
ity o
f Ir
elan
d M
ayno
oth]
at 0
8:30
11
June
201
4

The strong correlations (.0.95) of estimated counts demonstrates the effec-tiveness of Markov chain fixed row vector analysis for approximating populationdensity based on CDR at county level. However, while similar correlations are alsoobserved at the Electoral Division level, there is an overall reduction in themeasured correlations at ED relative to county level. This may be a result ofgreater fluctuations in proportional population representation over smaller geo-graphical regions, caused by the spatial variations of mobile operator penetration.
Moreover, the consistently high levels of errors found in Dublin County (citycenter in particular; refer to Figure 13) might illustrate one possible limitation of acensus, i.e., that it only contains records of residential address. Indeed, subscribersmay tend to carry out a substantial amount of CDR activities in densely populatedareas. Alternatively, a substantial number of subscribers might be staying in thecity center temporally for an extended period of time (shopping, night-out, etc.),and may not be recorded as residing there through a census.
Evaluating the impact of spatial resolution has on accuracy and correlationwith respect to census measurements of ED population density and populationcount, it was observed that the aggregated vector approach had an optimalregion of spatial resolution. Figure 15 illustrates the observed measurements of
Figure 15: Impact of spatial resolution on (a) correlation; (b) MSE between census data and populationdensity estimates from the aggregated vector approach.
Population Mobility Dynamics Estimated 127
Dow
nloa
ded
by [
Nat
iona
l Uni
vers
ity o
f Ir
elan
d M
ayno
oth]
at 0
8:30
11
June
201
4

correlation and MSE over a range of R, a parameter that generally corresponds tospatial resolution.
Results indicate that if spatial regions of interest are too small, the approxi-mation error due to transition noise, such as that introduced by localization uncer-tainty and network penetration, will increase. This suggests that spatial regions ofinterest should mirror national population centers, where towns and other urbandistrict boundaries are maintained. Note, the effects of spatial resolution on sub-scriber based maximum weighting could not be evaluated in this extent due tocomputational limitations. Nonetheless, results presented by Eagle et al. (2009a,2009c) show that when locating the home of a subscriber, a set of home celltowers is typically found. Thus, similar to the results obtained for the aggregatedvector approach, it is reasonable to assume that the subscriber maximum weight-ing approach will also have a threshold of R above which transition noise willaffect the accuracy of home location estimation.
Another important factor when evaluating performance is temporal hom-ogeneity. If each mobility Markov chain used in the calculation of population istemporally heterogeneous, it is statistically different when computed from differ-ent observation periods, meaning each estimate of population will be different.Thus, the accuracy of the proposed technique will be a function of the observationperiod. The study of temporal homogeneity is the subject of future work.
Conclusion
This paper used call detail records (CDR) from Meteor, a mobile network operatorin the Republic of Ireland, to visualize the regional flows of people across Ireland.The use of CDR location estimates for the identification of significant mobile sub-scriber regions of interest and the estimation of population density was also inves-tigated. Potential practical applications include utility load forecasting anddynamic transportation services as they require a human activity feed/source,whether live or historic, to help predict human-related service demands.
The high correlation of estimated results with the Central Statistics OfficeIreland census data demonstrates the effectiveness of Markov chain fixed rowvector analysis for approximating population density proportions. While popu-lation estimation via such techniques does not result in the fine-grained measure-ments achieved through a census, population fluctuations can be monitored atmuch finer temporal resolutions and lower cost.
Each approach to the estimation of population density discussed has its ownadvantages and disadvantages. Although the estimates derived from the subscri-ber-based maximum weighting approach are more accurate, the calculation ofeach individual vector is more computationally intensive compared to thesingle calculation required for the aggregated vector approach. Moreover, theaggregated approach is totally privacy preserving, as calculations are based onthe overall subscriber data instead of individual subscriber regions of interest.
Acknowledgments
The research presented in this paper was funded by a Strategic Research Clustergrant (07/SRC/I1168) by Science Foundation Ireland under the National Develop-ment Plan and by the Irish Research Council under their Embark Initiative in part-
128 Journal of Urban Technology
Dow
nloa
ded
by [
Nat
iona
l Uni
vers
ity o
f Ir
elan
d M
ayno
oth]
at 0
8:30
11
June
201
4

nership with ESRI Ireland. The authors gratefully acknowledge this support. Theauthors would like to gratefully acknowledge the support of Meteor for providingthe data used in this paper (in particular John Bathe and Adrian Whitwham).
Notes on Contributors
John Doyle is a post-doctoral research fellow at the National University of IrelandMaynooth, where his research is focused on the development of data mining andmachine learning applications related to semiconductor manufacturing.
Peter Hung is a post-doctoral research fellow at the National University of IrelandMaynooth. His research interests include system identification, online and offlinesignal processing, pattern classification, and machine learning, as well as geocom-putation.
Ronan Farrell is the director of the Callan Institute for applied ICT at National Uni-versity of Ireland Maynooth. He has published over a hundred peer-reviewedpapers and holds three patents; his research interests include radio and wirelesssystems, with particular interest in their use in non-communication domains.
Sean McLoone is a professor and director of the Energy Power and IntelligentControl Research Cluster in the School of Electronics, Electrical Engineering,and Computer Science at Queen’s University Belfast, Northern Ireland. He alsoholds a joint appointment in the department of electronic engineering, NationalUniversity of Ireland Maynooth, where he was head of department from 2009to 2012.
Population Mobility Dynamics Estimated 129
Dow
nloa
ded
by [
Nat
iona
l Uni
vers
ity o
f Ir
elan
d M
ayno
oth]
at 0
8:30
11
June
201
4

Bibliography
R. Ahas, A. Aasa, U. Mark, T. Pae, and A. Kull, “Seasonal Tourism Spaces in Estonia: Case Study withMobile Positioning Data,” Tourism Management 28: 3 (2007a) 898–910.
R. Ahas, A. Aasa, S. Silm, and M. Tiru, “Mobile Positioning Data in Tourism Studies and Monitoring:Case Study in Tartu, Estonia,” Information and Communication Technologies in Tourism 2007 (2007b)119–128.
R. Ahas, A. Aasa, A. Roose, U. Mark, and S. Silm, “Evaluating Passive Mobile Positioning Data forTourism Surveys: An Estonian Case Study,” Tourism Management 29: 3 (2008) 469–486.
R. Ahas, A. Aasa, S. Silm, and M. Tiru, “Daily Rhythms of Suburban Commuter Movements in theTallinn Metropolitan Area: Case Study with Mobile Positioning Data,” Transportation Research PartC: Emerging Technologies 18: 1 (2010a) 45–54.
R. Ahas, S. Silm, O. Jarv, E. Saluveer, and M. Tiru, “Using Mobile Positioning Data to Model LocationsMeaningful to Users of Mobile Phones,” Journal of Urban Technology 17: 1 (2010b) 3–27.
G. Andrienko and N. Andrienko, “A General Framework for Using Aggregation in Visual Explorationof Movement Data,” Cartographic Journal 47: 1 (2002) 22–40.
G. Andrienko, N. Andrienko, P. Bak, S. Bremm, D. Keim, T. von Landesberger, C. Politz, and T. Schreck,“A Framework for Using Self-Organising Maps to Analyse Spatio-Temporal Patterns, Exemplified byAnalysis of Mobile Phone Usage,” Journal of Location Based Services 4: 3–4 (2010a) 200–221.
G. Andrienko, N. Andrienko, M. Mladenov, M. Mock, and C. Plitz, “Discovering Bits of Place Historiesfrom People’s Activity Traces,” in Visual Analytics Science and Technology (VAST), 2010 IEEE Sym-posium On (2010b) 59–66.
N. Andrienko and G. Andrienko, “Spatial Generalization and Aggregation of Massive Movement Data.Visualization and Computer Graphics,” IEEE Transactions On 17: 2 (2011) 205–219. ISSN 1077–2626.doi:10.1109/TVCG.2010.44.
N. Andrienko, G. Andrienko, H. Stange, T. Liebig, and D. Hecker, “Visual Analytics for UnderstandingSpatial Situations from Episodic Movement Data,” Kunstl Intelligenz 74 (2012) 1–11. ISSN 0933–1875.10.1007/s13218–012-0177-4.
R.A. Becker, R. Caceres, K. Hanson, J.M. Loh, S. Urbanek, A. Varshavsky, and C. Volinsky, “A Tale ofOne City: Using Cellular Network Data for Urban Planning,” Pervasive Computing, IEEE 10: 4(2011a) 18–26. ISSN 1536-1268.
R.A. Becker, R. Caceres, K. Hanson, J.M. Loh, S. Urbanek, A. Varshavsky, and C. Volinsky, “ClusteringAnonymized Mobile Call Detail Records to Find Usage Groups,” 1st Workshop on Pervasive UrbanApplications (PURBA) (2011b).
S. Brin and L. Page, “The Anatomy of a Large-Scale Hypertextual Web Search Engine,” Computer Net-works and ISDN Systems 30 (1998) 107–117. ISSN 0169-7552.
K. Buchin, B. Speckmann, and K. Verbeek, “Flow Map Layout Via Spiral Trees. Visualization and Com-puter Graphics,” IEEE Transactions On 17: 12 (2011) 2536–2544. ISSN 1077-2626. doi:10.1109/TVCG.2011.202
N. Caceres, J.P. Wideberg, and F.G. Benitez, “Review of Tra_c Data Estimations Extracted from CellularNetworks,” Intelligent Transport Systems, IET 2: 3 (2008) 179–192. ISSN 1751-956X.
R. Caceres, J. Rowland, C. Small, and S. Urbanek, “Exploring the Use of Urban Greenspace ThroughCellular Network Activity,” Proceedings of 2nd Workshop on Pervasive Urban Applications (Newcastle,June 18–22, 2012).
F. Calabrese and C. Ratti, “Real Time Rome,” Networks and Communication Studies 20: 3–4 (2006) 247–258.F. Calabrese, M. Colonna, P. Lovisolo, D. Parata, and C. Ratti, “Real-Time Urban Monitoring Using Cell
Phones: A Case Study in Rome. Intelligent Transportation Systems,” IEEE Transactions On 12: 1(2011a) 141–151. ISSN 1524-9050.
F. Calabrese, G. Di Lorenzo, L. Liu, and C. Ratti, “Estimating Origin-Destination Flows Using MobilePhone Location Data,” Pervasive Computing, IEEE 10: 4 (2011b) 36–44, ISSN 1536-1268.
CSO, Population Classified by Area, vol. 1, ,http://www.cso.ie/en/census/census2011reports/census2011populationclassifiedbyareaformerlyvolumeone/. Accessed August, 2012.
M. Deruyck, E. Tanghe, W. Joseph, and L. Martens, “Characterization and Optimization of the PowerConsumption in Wireless Access Networks by Taking Daily Traffic Variations into Account,”EURASIP Journal on Wireless Communications and Networking (2012) 1–12.
J. Doyle, P. Hung, D. Kelly, S. McLoone, and R. Farrell, “Utilizing Mobile Phone Billing Records forTravel Mode Discovery,” In IET Irish Signals and Systems Conference, 2011.
N. Eagle, A. Clauset, and J.A. Quinn, “Location Segmentation, Inference and Prediction for Anticipat-ory Computing,” in Proceedings of AAAI Spring Symposium on Technosocial Predictive Analytics(Stanford, CA, 2009a).
130 Journal of Urban Technology
Dow
nloa
ded
by [
Nat
iona
l Uni
vers
ity o
f Ir
elan
d M
ayno
oth]
at 0
8:30
11
June
201
4

N. Eagle, Y.-A. de Montjoye, and L.M.A. Bettencourt, “Community Computing: Comparisons betweenRural and Urban Societies Using Mobile Phone Data,” in Computational Science and Engineering,2009. CSE ’09. International Conference on, volume 4 (2009b) 144–150.
N. Eagle, J.A. Quinn, and A. Clauset, “Methodologies for Continuous Cellular Tower Data Analysis,” In
Pervasive 63 (2009c) 342–353.E. Frias Martinez, G. Williamson, and V. Frias-Martinez, “An Agent-Based Model of Epidemic Spread
Using Human Mobility and Social Network Information,” in Privacy, Security, Risk and Trust(passat), 2011 IEEE Third International Conference on and 2011 IEEE Third International Conferenceon Social Computing (socialcom) (2011) 57–64.
Geodirectory, http://www.geodirectory.ie/, accessed Aug. 2012.A. Ghosh, J. Zhang, J.G. Andrews, and R. Muhamed, Fundamentals of LTE, 1st edition (Upper Saddle
River, NJ, USA: Prentice Hall Press, 2010). ISBN 0137033117, 9780137033119.M.C. Gonzalez, C.A. Hidalgo, and A.L. Barabasi, “Understanding Individual Human Mobility Pat-
terns,” Nature 453: 7196 (2008) 779–782.C.M. Grinstead and J.L. Snell, Introduction to Probability: Second Revised Edition (Providence: American
Mathematical Society, 1997).T. Horanont and R. Shibasaki, “An Implementation of Mobile Sensing for Large-Scale Urban Monitor-
ing,” In the Proceedings of Urbansense08 (2008).O. Ibe, Markov Processes for Stochastic Modeling (New York: Elsevier, 2008).S. Isaacman, R. Becker, R. Caceres, S. Kobourov, J. Rowland, and A. Varshavsky, “A Tale of Two Cities,”
In Proceedings of the Eleventh Workshop on Mobile Computing Systems & Applications (ACM,2010) 19–24.
S. Isaacman, R. Becker, R. Caceres, S. Kobourov, M. Martonosi, J. Rowland, and A. Varshavsky, “Iden-tifying Important Places in Peoples Lives from Cellular Network Data,” Pervasive Computing 10 (2011)133–151.
O. Jarv, R. Ahas, E. Saluveer, B. Derudder, and F. Witlox, “Mobile Phones in a Traffic Flow: A Geo-graphical Perspective to Evening Rush Hour Traffic Analysis Using Call Detail Records,” PLoS
One 7: 11 (2012) e49171.O. Jarv, R. Ahas, and F. Witlox, “Understanding Monthly Variability in Human Activity Spaces: A
Twelve-Month Study Using Mobile Phone Call Detail Records,” Transportation Research C: EmergingTechnologies 38 (2014) 122–135.
M. Kamola, E. Niewiadomska-Szynkiewicz, and B.C. Piech, “Reconstruction of a Social NetworkGraph from Incomplete Call Detail Records,” in Computational Aspects of Social Networks(CASoN), 2011 International Conference on (2011) 136–140.
D. Kelly, J. Doyle, and R. Farrell, “Analyzing Ireland’s Social and Transport Networks Using Sparse Cel-lular Network Data,” In IET Irish Signals and Systems Conference (2011).
J. Korhonen, Introduction to 3G Mobile Communications, Second Edition (London: Artech House, 2003).G. Krings, F. Calabrese, C. Ratti, and V.D. Blondel, “Urban Gravity: A Model for Inter-City Telecommu-
nication Flows,” Journal of Statistical Mechanics: Theory and Experiment 2009: 07 (2009) 936–939.A. Kuusik, R. Ahas, and M. Tiru, “The Ability of Tourism Events to Generate Destination Loyalty
Towards the Country: An Estonian Case Study,” in S. Meltsamees and J. Reiljan, ed., Discussions ofEstonian Economic Policy XVIII (Berlin: Berliner Wissenchafts-Verlag, 2010) 140–155.
A. Kuusik, M. Tiru, and R. Ahas, “Innovation in Destination Marketing: The Use of Passive MobilePositioning for the Segmentation of Repeat Visitors in Estonia,” Baltic Journal of Management 6(2011) 378–399.
R. Lambiotte, V.D. Blondel, C. De Kerchove, E. Huens, C. Prieur, Z. Smoreda, and P. Van Dooren, “Geo-graphical Dispersal of Mobile Communication Networks,” Physica A: Statistical Mechanics and its
Applications 387: 21 (2008) 5317–5325.Q. Lin and Y. Wan, “Mobile Customer Clustering Based on Call Detail Records for Marketing Cam-
paigns,” in Management and Service Science, 2009. MASS ’09. International Conference on (2009)1–4.
A.R. Mishra, Fundamentals of Cellular Network Planning and Optimization: 2 g/2.5 g/3 g... Evolution to 4 g
(Hoboken: John Wiley & Sons, 2004).A. Nanavati, R. Singh, D. Chakraborty, K. Dasgupta, S. Mukherjea, G. Das, S. Gurumurthy, and A. Joshi,
“Analyzing the Structure and Evolution of Massive Telecom Graphs. Knowledge and Data Engineer-ing,” IEEE Transactions On 20: 5 (2008) 703–718. ISSN 1041-4347.
R. Ocan-Riola, “Non-homogeneous Markov Processes for Biomedical Data analysis,” Biometrical Journal
47: 3 (2005) 369–376.
Population Mobility Dynamics Estimated 131
Dow
nloa
ded
by [
Nat
iona
l Uni
vers
ity o
f Ir
elan
d M
ayno
oth]
at 0
8:30
11
June
201
4

A. Okabe, B.N. Boots, K. Sugihara, and S.N. Chiu, Spatial Tessellations: Concepts and Applications of
Voronoi Diagrams (Chichester: Wiley & Sons, 1992).M. Olsson, S. Sultana, S. Rommer, L. Frid, and C. Mulligan, SAE and the Evolved Packet Core: Driving the
Mobile Broadband Revolution (Waltham: Academic Press, 2009).J.P. Onnela, J. Saramaki, J. Hyvonen, G. Szabo, M. Argollo de Menezes, K. Kaski, A.L. Barabasi, and J.
Kertesz, “Analysis of a Large-Scale Weighted Network of One-To-One Human Communication,”New Journal of Physics 9 (2007a) 179.
J.P. Onnela, J. Saramaki, J. Hyvonen, G. Szabo, D. Lazer, K. Kaski, J. Kertesz, and A.L. Barabasi, “Struc-ture and Tie Strengths in Mobile Communication Networks,” Proceedings of the National Academy of
Sciences 104: 18 (2007b) 7332–7336.M. Ostendorf, V.V. Digalakis, and O.A. Kimball, “From Hmm’s to Segment Models: A Unified View of
Stochastic Modeling for Speech Recognition,” Speech and Audio Processing, IEEE Transactions On 4: 5(1996) 360–378. ISSN 1063-6676.
J. Park, D.S. Lee, and M.C. Gonzalez, “The Eigenmode Analysis of Human Motion,” Journal of Statistical
Mechanics: Theory and Experiment 2010: 11 (2010) 11021–11036.L.R. Rabiner, “A Tutorial on Hidden MARKOV Models and Selected Applications in Speech Recog-
nition,” Proceedings of the IEEE 77: 2 (1989) 257–286. ISSN 0018-9219.G. Ranjan, H. Zang, Z.-L. Zhang, and J. Bolot, “Are Call Detail Records Biased for Sampling Human
Mobility?,” SIGMOBILE Mob. Comput. Commun. Rev. 16: 3 (2012) 33–44. [Online]. Available:http://doi.acm.org/10.1145/2412096.2412101
C. Ratti, S. Williams, D. Frenchman, and R.M. Pulselli, “Mobile Landscapes: Using Location Data fromCell Phones for Urban Analysis,” Environment and Planning B Planning and Design 33: 5 (2006) 727–748.
C. Ratti, A. Sevtsuk, S. Huang, and R. Pailer, “Mobile Landscapes: Graz in Real Time,” G. Gartner,W. Cartwright, and M. Petersons, eds., Location Based Services and Telecartography, Berlin: Springer, 2007.
C. Ratti, S. Sobolevsky, F. Calabrese, C. Andris, J. Reades, M. Martino, R. Claxton, and S. H. Strogatz,“Redrawing the Map of Great Britain from a Network of Human Interactions,” PLoS ONE 5: 12(2010) 14248.
J. Reades, F. Calabrese, A. Sevtsuk, and C. Ratti, “Cellular Census: Explorations in Urban Data Collec-tion,” IEEE Pervasive Computing 6: 3 (2007) 30–38.
J. Reades, F. Calabrese, and C. Ratti, “Eigenplaces: Analyzing Cities Using the Space- Time Structure ofthe Mobile Phone Network,” Environment and Planning B: Planning and Design 36: 5 (2009) 824–836.
G. Rose, “Mobile Phones as Traffic Probes: Practices, Prospects and Issues,” Transport Reviews 26: 3(2006) 275–291.
S. Silm and R. Ahas, “The Seasonal Variability of Population in Estonian Municipalities,” Environmentand Planning. A 42: 10 (2010) 2527–2546.
C. Song, T. Koren, P. Wang, and A.L. Barabasi, “Modelling the Scaling Properties of Human Mobility,”Nature Physics 6: 10 (2010a) 818–823.
C. Song, Z. Qu, N. Blumm, and A.L. Barabasi, “Limits of Predictability in Human Mobility,” Science 327:5968 (2010b) 1018–1021.
J. Steenbruggen, M. Borzacchiello, P. Nijkamp, and H. Scholten, “Mobile Phone Data from GSM Net-works for Traffic Parameter and Urban Spatial Pattern Assessment: A Review of Applications andOpportunities,” GeoJournal 78 (2011) 1–21.
The Irish Grid, The Irish Grid: A Description of the Coordinate Reference System Used in Ireland,,http://www.osi.ie/Services/GPS-Services/Reference-Information/Irish-Grid-Reference-System.aspx. Accessed September, 2011.
C. Theodore, Wireless Communications: Principles and Practice, 2nd edition (Upper Saddle River, NJ, USA:Prentice Hall PTR, 2001). ISBN 0130422320.
J. Um, S.W. Son, S.I. Lee, H. Jeong, and B.J. Kim, “Scaling Laws Between Population and Facility Den-sities,” Proceedings of the National Academy of Sciences 106: 34 (2009) 14236–14240.
M.R. Vieira, V. Frias-Martinez, N. Oliver, and E. Frias-Mandnez, “Characterizing Dense Urban Areasfrom Mobile Phone-Call Data: Discovery and Social Dynamics,” in IEEE Second International Con-ference on Social Computing (SocialCom) (2010) 241–248.
F. Walsh and A. Pozdnoukhov, “Spatial Structure and Dynamics of Urban Communities,” Proceedings ofthe 1st Workshop on Pervasive Urban Applications (San Francisco, June 12–15, 2011).
R. Xu and D. Wunsch, “Survey of Clustering Algorithms,” Neural Networks, IEEE Transactions On 16: 3(2005) 645–678. ISSN 1045-9227.
Y. Yim, “The State of Cellular Probes. Institute of Transportation Studies, Research Reports, WorkingPapers,” Proceedings, Institute of Transportation Studies (UC Berkeley, 2003).
132 Journal of Urban Technology
Dow
nloa
ded
by [
Nat
iona
l Uni
vers
ity o
f Ir
elan
d M
ayno
oth]
at 0
8:30
11
June
201
4
Copyright © 2022 FDOKUMEN