A Survey of Consumer Brand Loyalty in the Mobile Telephony ...
61
A SURVEY OF CONSUMER BRAND LOYALTY IN THE MOBILE TELEPHONY INDUSTRY IN KENYA BY PHEOBE AWUOR 1)61/60797/2010 W W ° F NAIROBI) LOWER KABETf- i ___ LIBRARY A Management Research Project Submitted in partial fulfillment of the requirements for the aw ard of Master of Business Administration Degree, University of Nairobi. October, 2012
-
Upload
khangminh22 -
Category
Documents
-
view
0 -
download
0
Transcript of A Survey of Consumer Brand Loyalty in the Mobile Telephony ...
A SURVEY OF CONSUMER BRAND LOYALTY IN THE MOBILE TELEPHONY INDUSTRY IN KENYA
BY
PHEOBE AWUOR
1)61/60797/2010
W W ° F NAIROBI) LOWER KABETf- i___ LIBRARY
A Management Research Project Submitted in partial fulfillment of the
requirements for the aw ard of Master of Business Administration
Degree, University of Nairobi.
October, 2012

DECLARATION
This research proposal is my original work and has not been to any other institution of
learning for the award o f an academic certificate.
Phoe
<Z O O f 2 . .
Date
This research project has been submitted for examination with my approval as the student
supervisor.
L^a t ilDr. Raymond Musvoka
SupervisorDate
li

ACKNOWLEDGEMENTS
The completion of this project was not easy. It was not created by the researcher alone,
but relied on the cooperative assistance of many unforeseen hands. It has enabled me face
new challenges of new situations with more confidence and broadened my analytical
skills.
My sincere appreciation goes to my supervisor Dr. Ray Musyoka for taking me through
the research process, right form proposal writing, and presentation through to analysis
and conclusions. His skilful guidance, constructive criticism, patience enthusiasm and
suggestions supported the efforts to get the project successfully completed.
I also wish to thank Dr.Munyoki whose inspiration and encouragement has implanted in
me an unequivocal optimism. I wish to extend my gratitude to MBA class of 2012.1 may
not be in a position to mention all your names but you really shaped my life in a
significant way.
I wish to offer my utmost thanks to God the Almighty for giving me the strength, health,
sound mind and all that He provided during this period. Know it’s in Him, by Him and
through Him that I came to the completion of this programme in good time. Thank you
God.
m

DEDICA TION
My angelic daughter Sulwe Adela you are my main focus, you give me reason to want to
press on to higher levels .Making me laugh even when I am burnt out. God bless you.
Dear mum and dad, I know that I will always need you no matter what age I am.
You’ve made me laugh, wiped my tears, hugged me tight, watched me succeed, seen me
fall, cheered me on, kept me going strong and drove me a little bit crazy at times! Indeed
you are the promise from God that I will have a friend forever. We are because of you.
You are a fountain of inspiration. Thank you for believing in me.
IV
TABLE OF CONTENTS
DECLARATION.......................................................................................................................ii
ACKNOWLEDGEMENTS..................................................................................................... iii
DEDICATION.......................................................................................................................... iv
TABLE OF CONTENTS...........................................................................................................v
LIST OF TABLES..................................................................................................................viii
LIST OF FIGURES.................................................................................................................. ix
ABSTRACT................................................................................................................................x
CHAPTER ONE: INTRODUCTION.................................................................................. 1
1.1 Background of the study...................................................................................................... 1
1.1.1 Brand Loyalty........................................................................................................... 1
1.1.2 Overview o f the Telephony Industry in Kenya..................................................... 3
1.1.3 Mobile Telephony Industry in Kenya.....................................................................5
1.2 Research Problem................................................................................................................ 6
1.3 Objectives of the Study....................................................................................................... 9
1.4 Value of the Study...............................................................................................................9
CHAPTER TWO: LITERATURE REVIEW ...................................................................11
2.1 Introduction.........................................................................................................................11
2.2 Brand Loyalty.................................................................................................................... 11
2.2.1 Customer Loyalty................................................................................................... 13
2.2.2 Customer Purchasing Behavior and Loyalty.......................................................14
v
2.3 The Nature of Services and Service Marketing...............................................................15
2.3.1 Service Quality and Customer Satisfaction.........................................................17
2.4 Conceptual Framework..................................................................................................... 18
CHAPTER THREE: RESEARCH METHODOLOGY................................................ 20
3.1 Introduction........................................................................................................................20
3.2 Research Design................................................................................................................20
3.3 Population.......................................................................................................................... 20
3.4 Sampling............................................................................................................................ 20
3.5 Data Collection..................................................................................................................21
3.6 Data Analysis.....................................................................................................................21
CHAPTER FOUR: DATA ANALYSIS, FINDINGS AND DISCUSSIONS............23
4.1 Introduction........................................................................................................................ 24
4.2 Response Rate.................................................................................................................... 24
4.3 Demographic Details........................................................................................................ 25
4.3.1 Distribution o f the Respondents across the mobile telephone providers........ 25
4.3.2 Distribution of Respondents by Age............................................................... 25
4.3.3 Distribution o f Respondents by Highest Education Level................................. 26
4.3.4 Distribution o f Respondents by Gender............................................................... 26
4.3.5 Distribution o f Respondents by Employment Status..........................................27
4.3.6 Distribution o f Respondents by Personal and Household Incomes.................. 27
4.4 Brand Loyalty.................................................................................................................... 28
vi
4.4.1 Customer satisfaction 32
4.4.2 Value Added services e.g. Money transfer services.........................................33
4.5 Factors that Discourage Brand switching..................................................................... 36
CHAPTER FIVE: SUMMARY, CONCLUSIONS AND RECOMMENDATIONS 39
5.1 Introduction........................................................................................................................ 39
5.2 Summary............................................................................................................................ 39
5.3 Conclusion.........................................................................................................................40
5.4 Recommendations............................................................................................................. 41
5.5 Suggestions for further Study.......................................................................................... 41
REFERENCES........................................................................................................................ 43
APPENDICES............................................................................................................................ i
Appendix I: Letter of Introduction............................................................................................ i
Appendix D: Questionnaire...................................................................................................... ii
vii
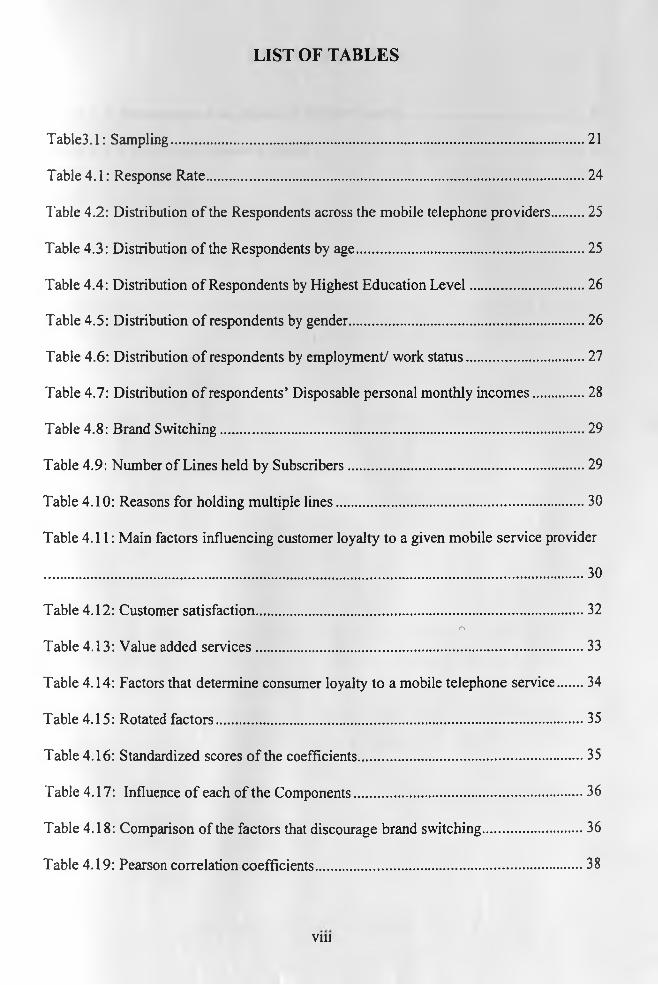
LIST O F TABLES
Table3.1: Sampling..................................................................................................................21
Table 4.1: Response Rate........................................................................................................24
Table 4.2: Distribution o f the Respondents across the mobile telephone providers........ 25
Table 4.3: Distribution o f the Respondents by age...............................................................25
Table 4.4: Distribution o f Respondents by Highest Education Level................................26
Table 4.5: Distribution o f respondents by gender................................................................. 26
Table 4.6: Distribution o f respondents by employment/ work status.................................27
Table 4.7: Distribution o f respondents’ Disposable personal monthly incomes...............28
Table 4.8: Brand Switching.................................................................................................... 29
Table 4.9: Number of Lines held by Subscribers.................................................................29
Table 4.10: Reasons for holding multiple lines.....................................................................30
Table 4.11: Main factors influencing customer loyalty to a given mobile service provider
.................................................................................................................................................... 30
Table 4.12: Customer satisfaction.......................................................................................... 32o
Table 4.13: Value added services.......................................................................................... 33
Table 4.14: Factors that determine consumer loyalty to a mobile telephone service....... 34
Table 4.15: Rotated factors..................................................................................................... 35
Table 4.16: Standardized scores of the coefficients.............................................................. 35
Table 4.17: Influence o f each of the Components..............................................................36
Table 4.18: Comparison of the factors that discourage brand switching............................. 36
Table 4.19: Pearson correlation coefficients..........................................................................38
Vlll

LIST OF FIG U R ES
Figure 2.1: Parasuraman et al., Model of Service Quality................................................. 17
Figure 2.2: Conceptual Framework Model..........................................................................19
IX
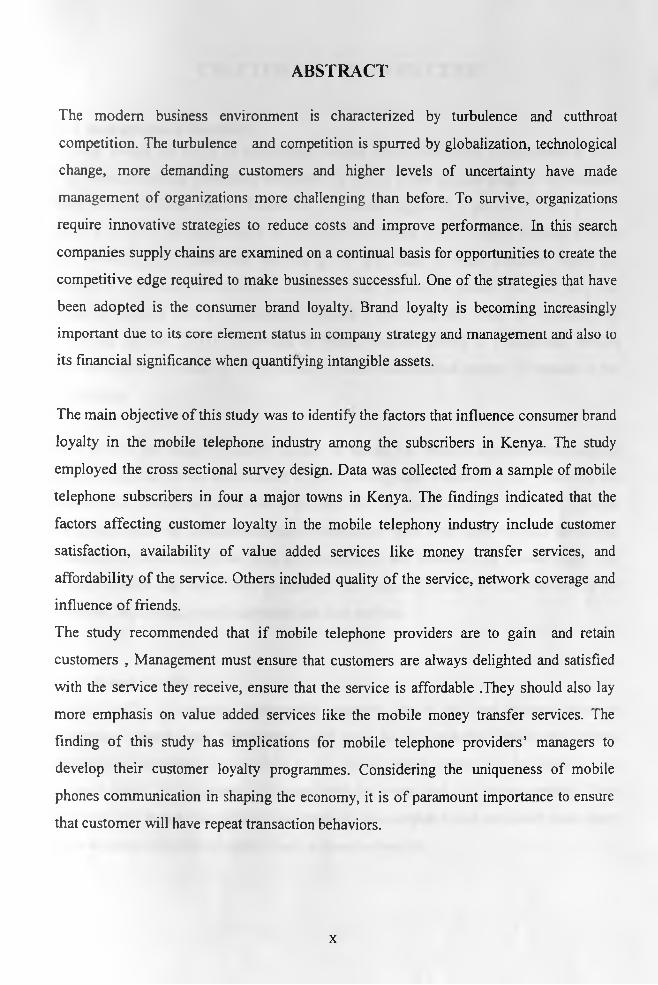
ABSTRACT
The modem business environment is characterized by turbulence and cutthroat
competition. The turbulence and competition is spurred by globalization, technological
change, more demanding customers and higher levels of uncertainty have made
management of organizations more challenging than before. To survive, organizations
require innovative strategies to reduce costs and improve performance. In this search
companies supply chains are examined on a continual basis for opportunities to create the
competitive edge required to make businesses successful. One of the strategies that have
been adopted is the consumer brand loyalty. Brand loyalty is becoming increasingly
important due to its core element status in company strategy and management and also to
its financial significance when quantifying intangible assets.
The main objective of this study was to identify the factors that influence consumer brand
loyalty in the mobile telephone industry among the subscribers in Kenya. The study
employed the cross sectional survey design. Data was collected from a sample of mobile
telephone subscribers in four a major towns in Kenya. The findings indicated that the
factors affecting customer loyalty in the mobile telephony industry include customer
satisfaction, availability of value added services like money transfer services, and
affordability of the service. Others included quality o f the service, network coverage and
influence o f friends.
The study recommended that if mobile telephone providers are to gain and retain
customers , Management must ensure that customers are always delighted and satisfied
with the service they receive, ensure that the service is affordable .They should also lay
more emphasis on value added services like the mobile money transfer services. The
finding o f this study has implications for mobile telephone providers’ managers to
develop their customer loyalty programmes. Considering the uniqueness of mobile
phones communication in shaping the economy, it is o f paramount importance to ensure
that customer will have repeat transaction behaviors.
x
CHAPTER ONE: INTRODUCTION
1.1 Background of the study-Today, people are living in increasingly sendee based economies. For instance in 2011
the communications sub-sector accounted for 56.0% of the total earnings in the transport
and communications sector. Moreover, the sector registered a growth of 14.5 percent
from Ksh.605.5 billion recorded in 2010 to 693.1 billion in 201 l(Kenya National Bureau
of Statistsics,2012).Therefore services go to the heart of value creation within the
economy (Rust and Oliver,2005). A service is any activity or benefit that one party can
offer to another which is essentially intangible and does not result in ownership of
anything (Kotler, 2001). According to Bantug-Herrera (2006) in Philippines, service
sectors enterprises make up 79.6 percent of total businesses and employ 70 percent of the
workforce.
The growth and usage of mobile phones in Kenya has reached unprecedented heights
with the highest growth experienced in 2007 (Ndungu and Waema, 2011). This trend has
seen a fray of entry by telephone subscribers into the Kenyan market. Due to the nature
of competition, the telecommunication companies have from time to time developed
innovative products to enable them stay competitive and increase their market share. The
notable routes that have been pursued in this regard include the introduction of M
payment M banking, loyalty schemes, and data services.
1.1.1 Brand Loyalty
Brand loyalty is becoming increasingly important due to its core element status in
company strategy and management and also to its financial significance when
quantifying intangible assets (Bello et al., 2009). Brand loyalty can be defined as a
concept which the consumer associates with the brand and the related product. This
association is based on analysis o f the assets which constitute brand perceived value, their
inter-relations and derived aspects such as brand extension.
1
The loyalty to the brand measures the grade of attachment between the consumer and the
brand. This is a referred to as conductive response, not aleatory, expressed throughout
time by a judging unit with respect to one or more alternative trademarks. Based on this
definition o f brand’s loyalty consider loyalty is achieved as the result o f an evaluating
process o f the satisfaction obtained on previous buys (Bloemer and Kasper, 2007;
Jimenez and Vargas, 2007). The loyalty to the brand forms the base of its value and it is
created by a variety o f factors such as the experience of use, the recognition, the identity,
and the perceived quality. According to Santesmases (2010), brand loyalty connects the
company to the market, in order to find out about market needs and to develop the
products which serve the demand and supply them.
According to the Marketing science institute brand value is determined by the client and
not by the company. From this perspective, the institute defines brand value as the set of
associations, built in the image of the consumer which allows the brand to generate a
greater turnover than it would if the product did not have that brand (Guillaume, 2008).
Brand loyalty can be the most valuable asset a firm possesses in part because they bring
higher margins, better channel cooperation, easier extension possibilities, and a host of
other benefits (Reast, 2005).
Building strong brand loyalty is dependent on creating positive, strong, and unique
associations that will help buyers differentiate it from other available brands
(Broniarczyk and Dawar, 2004). Research has also shown that a brand loyalty is often the
basis of consumer attitudinal and behavioral judgments towards the brand in various
contexts such as co-branding and extensions (Aggarwal, 2000).The associations that
create the unique brand concept, however, may often originate from the actual physical or
technical characteristics of the brand’s products that differentiate it from other brand
concepts (Park et al.,2008).According to Kotler and Armstrong (1997,) brand managers
must plan long-term brand strategy and watch over their brand’s loyalty. This can be
achieved through working closely with advertising agencies to create national advertising
campaigns to build market share and long term consumer brand loyalty.
2
1.1.2 Overview of the Telephony Industry in KenyaThe telecommunication industry is one of the fastest growing in the Kenyan market. The
sector continued to post a considerable growth mainly on account of mobile telephone
industry. During the 2011/12, the fixed network market segment maintained a declining
trend. The total fixed line subscription dropped by 39.6% from 460,000 recorded as at
30th June2011. Mobile telephone subscriber base expanded by 27.7% from 20,119,000 to
25,280,000 as at 30“' June 2011 .This growth resulted in an increase in mobile penetration
rate from 52.2 to 64.0% over the same period(KNBS,2012).
Initially there only existed telephone services in Kenya and was provided by the
government through Telkom Kenya which handled telephone services for the whole
country. The government sought to have a body that regulates telecommunications
thereby leading to the formation of Communication Commission of Kenya(CCK) in
February, 1999. CCK came into existence through the Kenya Communication Act 1998.
It was formed to license and regulate telecommunications, radio communication and
postal services in Kenya. Its major responsibilities apart from licensing operators are to
regulate tariffs for monopoly areas, establishing interconnection principles as well as
approving communication equipment.
In the year 2002 the government through CCK licensed two mobile telephone service
companies, that is, Safaricom Limited and Kencell Communications at a cost of four
billion shillings. Later on a third mobile operator was to be licensed, that is, Econet
Limited at a cost of two billion. In the years to come Telkom was privatized by selling a
stake to France Telkom which has ventured in the mobile industry through Orange
Mobile. Safaricom and Kencell, later Zain (now known as Bharti Airtel Ltd) have a large
stake in the Kenyan market. According to the communications commission of Kenya,
CCK June 2012, Safaricom Limited boasts of the largest market share at 69.9% followed
by Airtel with 15.2%, Orange with 8% and Essar telecom with 6.4%. This shows that the
telecommunications industry is still skewed towards dominant players Safaricom and
Airtel.(CCK,201 l)Although Safaricom has been a dominant player, Bharti's Airtel Kenya
3
boosted its market share to 15% from 11% in the first quarter of 2012 and captured 60%
of new mobile customers each month. It is therefore evident that Bharti Airtel is
becoming a force to contend with. This is by virtue of their aggressive advertising and
other promotional campaigns.
In the earlier years Airtel which was known as Kencell and later Zain had targeted the
high end market consisting of businessmen (who have to constantly communicate with
suppliers and their branches) and managers but it did not seem to work out seeing that the
market was not that substantial to be self sustaining. (Muturi, 2002) Safaricom on the
other hand entered the market with relatively lower prices that attracted middle income
families which took a large part of the population. At the time the mobile companies
seemed punitive with their unattractive rates but it was out of their hands seeing that they
were taxed heavily. (Muturi, 2002). When Kencell began to fail it was sold off to Celtel,
Zain and Bharti Airtel and was rebranded as such. Though it was able to attract some of
the middle income families with its attractive pricing, there was a lot of skepticism from
consumers by virtue of it being remembered as Kencel and Zain which were
discriminatory to them thus creating positioning error. (Muturi,2002).
Orange, a third entrant to the telecommunications market, has had most of its focus
emphasized on data services as opposed to voice services. This was based on their
competitive strategy as they sought to capitalize on their core competency as they
deemed voice services to be “crowded” and unprofitable(Tarus, 2010).In years to come
Airtel(then known as Zain Kenya which is considered to be a force in the mobile sendee
sector by virtue of trying to erase the previous brands through aggressive advertising
campaigns found that there is a difference between consumer expectation and
management perception in mobile telephony services and this is what took Bharti Airtel a
while to realize.
What can be said in retrospect is that brand loyalty is truly experienced only to some
degree in the mobile service sector with some customers shifting from network to
network. For instance when Bharti Airtel lowered the voice call in 2011 the total number
4
of subscriber base in Kenya increased to 20.1 Million. Safaricom, lost part of its market
share to rivals who were charging lower tariffs, dropping by 4.9 per cent from the
previous quarter's 80.7 per cent. Airtel, saw its market share rise by 4.4 per cent, Telkom
Orange's market share also rose by 1.3 per cent while the tariff wars hived 0.7 per cent
off Essar Telecom. The retention of large market share by Safaricom in the wake of stiff
competition and lower calling rates by the rivals (Airtel,Yu and Orange) can be attributed
to effective brand management. Alongside brand management it can also be pointed out
that coverage has always been a crucial factor especially given that the Kenyan market
has ties all over the country through relatives in rural areas (Mwema, 2007).
Brand loyalty has been experienced in the telecommunication industry with Safaricom
has retaining the highest market share (69.9) despite charging the highest rates for both
on net and off net calls. Partly this is because the consumer has had time to sample what
the various companies have to offer and establish what brand has been built to their
liking. According to Juniper (2010) brand loyalty in the sector, could be said to be
experienced for reasons such as perceived quality of the brand, attractive pricing,
customer satisfaction, perceived risk of switching and the variety o f value added services.
Earlier on loyalty was forced with tools such as high switching costs and also having
other people using the brand but the Kenyan market is experiencing choice presently.
1.1.3 Mobile Telephony Industry' in Kenya
The word mobile comes from the Latin word mobiles which means to “move” or “able to
move freely or easily” or” able or willing to move freely or easily between occupations,
places of residencies and social classes”. Device, state of being, industry(oxford English
dictionary)The word mobile device can be described as mobile, wireless or cellular
phone, a portable, hand held communications device connected to a wireless network that
allows users to make local voice calls, send text messages and run applications
(Goldstuck 2009).
5

In Kenya, the growth o f mobile phone subscribers has been tremendous. The subscriber
base expanded by 25.7% from 20,119,000 in June2010 to 25,280,000 in June2011 .This
growth resulted in an increase in mobile penetration rate from 52.2% in June 2010 to
64% at the end of June 2011.This was above the Penetration rates estimated by the
International Telecommunications Union (ITU) at 41.0% during the same period. In the
same year, the mobile operators lowered both on net and off net tariffs in a bid to attract
more customers in their respective networks (KNBS, 2012).
In the same year, the government through, the CCK introduced mobile number
portability. Using the porting service, customers have the freedom of moving from one
network to another while retaining the individual subscriber numbers. This further
promoted competition and wider consumer choice. Meanwhile, the fixed network market
segment maintained a declining trend with a fixed line subscription dropping by 39.6%.
The reduction of fixed lines could be attributed to increase of use of mobile phones. The
fixed international voice traffic for both incoming and outgoing calls also dropped by
22.4% and 1.9% respectively. This too was occasioned by increased use of mobile
phones in international calls following the lowering o f international voice calling charges
and other competing alternatives such as instant messages over the internet. Generally in
the last half a decade, the use of land lines has grown far less quickly (Rosenberg, 2010).
1.2 Research Problem
The modem business environment is characterized by turbulence and cutthroat
competition. The turbulence and competition is spurred by globalization, technological
change, more demanding customers and higher levels of uncertainty have made
management of organizations more challenging than before (Black et. al, 2000).To
survive, organizations require innovative strategies to reduce costs and improve
performance. In this search telecommunication firms in Kenya have examined brand
loyalty as a major route to gain competitive edge required to make businesses successful.
According to Fearme and Fowler (2006) consumer loyalty is the route to competitive
6

advantage in such an environment to cope with high levels of uncertainty and turbulence
(Christopher et. al., 2000).
The mobile telephony market in Kenya has undergone major developments: They include
the development of M payments that were pioneered in by Safaricoms’ Mpesa in 2007
although other telecommunication companies would later follow suit to develop similar
products. According to Tiwari & Buse (2007),this empowered organizations with new
ways to offer accessibility to their customers. In 2009,mobile telephone providers and
commercial banks started forming partnerships which saw the development of several M
banking products like KCB Connect, M-Karo and Coop M banking by the cooperative
bank, Hello Money by Barclays bank, Sim-ple banking by National bank,M Kesho by
Equity bank among others.
The latest major development in the mobile telecommunications industry was the entry of
Bharti which bought out Zain Kenya. Bharti Airtel famously introduced the low cost
model in Kenya in 2010.Althouh the model and its lower tariffs could did not increase
voice volumes and market share as expected, it was credited for the reduction in both on
net and off net voice rates. The most recent and perhaps the most laudable is the laying of
fiber infrastructure by the National Optic Fiber Infrastructure (NOFBI) countrywide.
However these developments have not been void o f challenges. The notable challenge
include; high fees paid by operators to obtain a license, government interference in the
elimination of call termination rates(CTR), punitive tax rates, flooding o f the market by
cheap and counterfeit phones, market dominance by some players in the sub sector, cable
vandalism, sabotage by other market players just to mention but a few.
A number o f studies have been done in Marketing especially in relation to firm customer
loyalty. Njoroge (2007), studied customer satisfaction on service quality at Kenya Power
and concluded that customers were dissatisfied with the service level offered by the
organization because the firm did not have a satisfying customer education programme.
Kirui, (2001), conducted a study on competitive advantage through customer loyalty
schemes at EABL Kenya; Ndungu (2011) studied brand loyalty in insurance industry
7
from the consumers’ perspective, and sought to determine the effects of brand value,
which is perceived by customers based on the services offered by the insurance company
preferred, on the level of loyalty towards insurance companies. Murigi(2003) studied the
determinants of brand loyalty in pharmaceutical products and found out that customer
satisfaction and the level of advertising as the main determinants. Murigi (2003) noted
that customers consistently want certain attributes like ease of use, timeliness, and
certainly in virtually all service products. Nyaoga (2007) did a study on the role of
service quality management and performance in establishing customer loyalty in the
service industry Nyagechi(2010) explored perception of brand equity of daily newspapers
by media buying agencies in Nairobi, Oyieko (2011) explored factors affecting brand
loyalty in the private security industry in Kenya and Mwanika (2009) factors affecting
brand loyalty of toilet soaps in Kenya .However, no known study has been done on this
important aspect of consumer brand loyalty in Kenya. This therefore, makes it necessary
for study to be conducted on this important operational linking tool.
The mobile telecommunications industry in Kenya is fairly young there are a few studies
carried out on the subject matter. Maina (2001) investigated perceived quality service and
found that there is a difference between customer expectation and management
perception in mobile telephony business. Muturi (2002) investigated what consumer
loyalty meant for mobile telecommunications companies in the face of new entrants in
the market. Murugu (2008), studied the level of customer satisfaction and its impact on
loyalty in Airtel (then known as Zain) and found out that customers consistently want
certain attributes like ease of use, timeliness, and certainly in virtually all sendee
products Gichuru (2003) investigated brand switching in the mobile telephony business
in Kenya. This study will seek to investigate consumer loyalty in this industry especially
in the face of better rates which should mean getting value for money and cost
effectiveness.
8
1.3 Objectives of the StudyThe main objective of this study was to identify the factors that influence consumer brand
loyalty in the mobile telephone industry among the subscribers within the Nairobi
County. However the specific objectives of the study were to:
i) Identify factors that determine consumer loyalty to a mobile telephone service
provider.
ii) Establish the factors that discourage switching from one mobile telephony service
provider to another.
iii) To investigate the challenges facing mobile telephone providers in building brand
loyalty.
1.4 Value of the Study
The study aims to add knowledge base to existing literature on consumer brand loyalty in
the mobile telephony industry. The study shall be of great importance to academic
institutions focusing on the emerging trends in mobile telephony. Secondly, from the
managerial point of view, the study shall help practicing managers as the policy makers
to improve on mobile phone policies as well as improve on the current weaknesses in the
sub-sector. By identifying the major reasons as to why some mobile subscribers retain
high market shares despite their higher calling rates. This study may assist policy makers
of the market followers to go back to the drawing board and chart the way forward with
the knowledge that price alone is not the main influence of loyalty in this sub sector.
Academicians and other researchers wishing to carry out further research, it will
contribute to the existing literature in brand management. The study will be a source of
reference material for future researchers on other related topics; it would also help other
academicians who undertake the same topic in their studies. First and foremost, the study
aims to add knowledge base to existing literature on consumer brand loyalty in the
mobile telephony industry. The study shall be of great importance to academic
institutions focusing on the emerging trends in mobile telephony.
9

From the managerial point o f view, the study shall help practicing managers as the
decision makers to improve on mobile phone policies as well as improve on the current
weaknesses in the sub-sector. By identifying the major reasons as to why some mobile
subscribers retain high market shares despite their higher calling rates. This study may
assist the management o f the market followers to go back to the drawing board and chart
the way forward with the knowledge that price alone is not the main influence of loyalty
in this sub sector.
10
CHAPTER TWO: LITERATURE REVIEW
2.1 Introduction
This chapter explores the theoretical and empirical literatures underpinning with the
objective o f finding what other scholars have researched on or written regarding
consumer brand loyalty in the mobile telephony industry. The chapter also develops a
conceptual framework, which will underlie the study.
2.2 Brand Loyalty
According to Jacoby and Kyner (1999), brand loyalty is a behavioral response and as a
function o f psychological processes. It is a function o f both attitudes and behavior. Brand
loyalty represents a general concept which describes a consumer’s overall buying
behavior patterns within a product class (Day 1998). It is a descriptive variable that refers
to individual differences in consumers’ general shopping behavior and buying styles
within a particular product class. Brand loyalty can therefore be broadly be defined as a
consumer’s preference to buy a single brand name in a product. It is a result of the
perceived quality of the brand and not necessarily its price (Kyle 1998).
According to Aaker (2001) brand loyalty reflects how likely a customer will be to switch
to another brand, especially when that brand makes a change, either in price or product
features. Brand and customer loyalty represents a buyer’s overall attachment or deep
commitment to a product, service, brand, or organization (Oliver 1999). The loyalty
concept is similar in meaning to relationship commitment, which is described by the
relationship marketing literature as an enduring desire to be in a valued relationship
(Morgan and Hunt 2004). Loyalty manifests itself in a variety of behaviors, the more
common ones being recommending a service provider to other customers and repeatedly
patronizing the provider (Fomell, 2002).
Different authors have presented different perceptual and cognitive factors that influence
repeat purchases hence leading to brand loyalty. According to Aaker(1991),brand
awareness, brand associations, and perceived product or service quality are the major
determinants o f brand loyalty. Chematony and McDonald (2003) included image,
perceived value, personality; and organizational associations as additional determinants.
Brand awareness refers to the strength of the brand node in memory, i.e. how easy it is
for the consumer to remember the brand, brand recall is the most common way to erasure
brand awareness while brand image refers to strong, favorable and unique brand
associations in memory which result in perceived quality, a positive attitude and overall
positive effect (Kottler and Keller, 2003).
There are many advantages o f brand loyalty. According to Delgado-Ballester and
Munuera-Aleman (2001) the interest in brand loyalty derives from the value that loyalty
generates to companies in terms of substantial entry barriers to competitors, an increase
in the firm ’s ability to respond to competitive threats, greater sales and revenues,
establishment of a customer base that is less sensitive to the marketing efforts of
competitors, lower customer price sensitivity, reduced expenditure on attracting new
customers and improved organizational profitability (Rowley,2005).
Brand loyalty leads to greater and continual sales since the same brand is repeatedly
purchased, irrespective of situational constraints. Consumers may use more of the brand
to which they are loyal, since they may “like” using the brand or because they identify
with the image of the brand. Brand loyal consumers are willing to pay more for a brand
because they perceive some unique value in the brand that no other alternative can
provide. Moreover brand loyal users are willing to search for a brand and they require
less advertising frequency, resulting in lower costs for advertising and distribution (Kyner
2003).
12
According to Smith (2002) brand loyalty enables an organization to expand its market
share. Smith further argues that brands with greater market share demonstrate greater
levels of repeat purchasing behavior habit among their buyers. According to Ehrenberg et
al.,(2000) there is a correlation between market share and number of purchases per buyer
and that people appear to like popular (high-market share) products more than less
popular ones. Other researchers have also found that there exists a strong positive
correlation between brand loyalty and market related to market share and, that habitual
buying is directly related to market share (Smith and Whan Park 2002).
Consequently small market share brands have fewer buyers and they are purchased less
frequently by these few buyers. In contrast, more popular brands have more buyers and
they are also purchased more often by these same many buyers. This is because there is
greater awareness and distribution support for high market share brands. For example, a
high market share brand may be the only brand that is carried by some stores and, thus,
distribution patterns may favor the habitual buying of high market share brands (Fader
and Schmittlein 2003). In retrospect to brand loyalty in the mobile telephony industry, the
growth M banking and M payments has played a significant role. Other factors include,
aggressive strategies a adopted by the Mobile telephone service provides, effective brand
management.
2.2.1 Customer Loyalty
Customer loyalty implies allegiance and faithfulness resulting in a continuing relationship
that is part of the way in which products are supplied to the market (Smith and Whan-
Park 2002). Loyalty is an emotional feeling of commitment where past memories lead to
current and future obligations. According to Donoghue (2000), there are three forms of
brand loyalty; transactional loyalty, perceptual loyalty and complex loyalty.
Transactional loyalty relates to a customer buying behavior changing but what motivates
that change is not clear in perceptual loyalty, attitudes and opinions reflect possible
13
buying behavior in future. Complex loyalty relates to a combination of transactional and
perceptual loyalties (Morgan and Hunt 2004).
Oliver (2007) identified four sequential stages in developing customer loyalty. First is
cognitive loyalty where the customer purchase with a belief the offer is superior.
Secondly the customer is affectively loyal that is achieved after repeat purchases. Third,
the customer is combatively loyal where there is high involvement and purchases are
intentional. The last stage is action loyalty where actions are taken with the desire to
overcome every possible obstacle that might hinder purchasing the brand to which a
person is loyal.
Mobile telephone providers should make an attempt to more from cognitive loyalty to
action loyalty since retaining customers is financially less expensive than attracting new
customers (Reich held and Schefter,2000). Aaker (2001) noted that brand loyalty leads to
certain marketing advantages such as reduced marketing costs and increased business due
to customer base and greater trade leverage. Donoghue (2000) reported that attracting and
retaining customers could be attributed to core services and trust builders. She gave
favorable return policy, section and choice of merchandise, rewards programs and
promotions as examples of core services and good staff attitude, accurate product
information, delivering on advertising promises, knowing the people and being
recognized as examples of trust builders.
2.2.2 Customer Purchasing Behavior and Loyalty
Customers’ satisfaction and relationship marketing greatly contribute to the
understanding of customer’s behavior especially towards a brand, shore or supplier.
According to Lewin (1996), trust and loyalty are both grounded on experience of
satisfaction accumulated overtime. Therefore customer’s satisfaction resulting from
market transactions is connected to most and repurchase delicious. Lead to high level of
customer loyalty due to other intervening variables (Oliver 2005).
14
Besides must other features of the most stable and durable relationships are commitment,
stability, interaction, power, influence, dependence, reciprocity and cooperation.
Commitment is durable desire to maintain an important relationship. Morgan and Hunt
(2004), identified determinants o f commitment as the degree to which customers and
firms share the same values (value congruence). The level of shared aims in the
relationship (goal congruence), the value of the benefits deriving from the relationship as
well as the costs which interrupting the relationship would cause. Given (2005), linked
commitment to satisfaction deriving from the perceived equity in the exchange process.
2.3 The Nature of Services and Serv ice Marketing
Marketing in mobile telephone industry aims to ensure that services are managed to
achieve set goals (Oliver 2005). Consequently mobile telephone providers have a
responsibility o f persuading customers to entrust them with their funds (money transfer
services) better tariffs, clear networks, a wider coverage and reliability are the some of
the services for the customers. Since basic management principles apply to both
management of services and products, there is historical lack of interest in services.
(Cannon 1999). This is attributed to the little understanding of differences that exists
between management o f products ducts and services. Bitran & Lojo (2009), Parasuranam
et al (1993), and Zeithanal et al (1996), noted six differences namely services are usually
perishable, variable simultaneity, intangible, heterogeneous occur only once only once
and cannot be replicated hence perishable service providers are obligated to ensure that
capacity and demand patterns are commensurate.
Kerringer (2008), asserted that services are highly variable since they highly depend on
their provider when and where they are produced. Since production and consumption of
services occur at the same time, consumer’s participation becomes critical if performance
in providing quality service is not increase since services cannot be tested heard felt or
smelled before purchasing. (Berry 2007), customers are forced to form opinion and
altitudes based on previous experiences. Firms have to seek opinions from customers in
15
order to get feedback on services. Difficulties in trying to maintain consistently high
service level because customers’ opinions are individualistic. Hence daily monitoring of
customers reaction to service provision is essential (Cannon 1999).
In determining customer’s loyalty the rating of service quality plays a significant role as
it leads to customer satisfaction which influences repeat transactions (Oliver, 2005). Like
other business organizations mobile telephone providers should adopt the use of total
quality management (TQM). This will ensure mobile telephone providers achieve
operational efficiency by reducing time and resource wastage and replacing
unsatisfactory services.
Since service quality is inferred from experiences perceived quality is emphasized.
Perceived quality cannot be objectively determined because customers judge products
and services quality based on different important attributes such as product characteristic
like reliability and performance that differ among them (Aaker, 2006), attitude of
customers towards products will generally be influenced by customer perception of
quality service (Paliwoda 2009).Perceived quality service can be said to be the degree to
which a product or service is uniquely positioned and perceptually differentiated from its
competitors. It is judged based on a variety of intrinsic informational cues that they
associate with product by providing a basis for perceptions o f products and service
quality (Schiffman & Kanuk 2004).
The research marketing team of Parasuraman, Berry and Zeithmal (1988) use
SERVQUAL for service quality measurement. It has twenty two test items where
respondents first rate the service provider based on their expectations and later rate the
same test items based on actual service delivery thus showing their perceptions rate these
items on a seven-point scale. The mean of the gap difference between perception and
expectation for all items showed the SERVQUAL score with low service quality being
signified by a negative score. The team viewed perception o f service quality as the
discrepancy between customer’s expectations or desires and their perceptions. The
16
SERVQUAL model has five dimensions namely tangibility, reliability, responsiveness,
assurance and empathy. This is as depicted in Figure 2.1
Figure 2.1: Parasuraman et al., Model of Service Quality
Source: Parasuraman Zeithmul & Barry (1988)
Despite several criticisms leveled against it, the SERVQUAL model has performed better
than any other measuring instrument. Buttle (2006), criticized it for failing to draw
assumptions from any established economic, statistical and psychology theory. Hence it
offered little evidence that customer’s assess service quality by the gap between their
perceptions and expectations. Cronin and Taylor (2002:2005), instrument because its
proponents failed to provide a concrete definition o f perceived service quality in
attitudinal terms. SERVQUAL received support from Robinson (2009), who claimed it
was more scientific in scale development, in assessing customer loyalty, there could be
need to bridge the gap between customer perception and perception and expectations
which may require SERVQUAL measurement.
2.3.1 Service Quality and Customer Satisfaction
Rust and Zahonick (2003), noted service quality could be effectively managed if the
concept of satisfaction is clearly understood. Rust and Oliver (2004), described customer
17
satisfaction as the customer’s fulfillment response hence a process in which satisfaction is
viewed as largely based on meeting or exceeding customer satisfaction and service
quality.
Service quality can therefore be used to indicate the level of customer satisfaction. This
can be done with measurement o f dimensions of service quality (Buttle, 2006) hence
mobile telephone providers are committed to delivery satisfaction. From these
considerations mobile telephone provider’s management should measure the overall
customer satisfaction and attempt to understand the nature o f service quality and
interactions between customer value and service quality (Mutua, 2007). Cerchigro and
Ayrosa (2003) found that service quality, future purchase intentions and custom
satisfaction are related when companying perception o f service quality in British and
Kenyan mobile telephone providers. They found that customer satisfaction and overall
evaluation o f service quality were related to the same factors in both countries. For
British provide dependability of the service closely matched customer satisfaction and
service quality while for Kenyan providers assurance links service quality and customer
satisfaction.
2.4 Conceptual Framework
Customer loyalty requires mobile telephone providers to focus on factors that affect its
ability in maintaining old customers. This includes having highly differentiated products
that differ from those of competitors, high end products where price is not the primary
buying factor products that have a high service component and multiple products meant
for the same customer. Given that is a channel though which consumers reduce money
related products/ services, must, customer satisfaction with bank services, perceived
value of products/services provided by the bank, the firm image should work together to
influence the decision to participate in repeat transactions with a particular provider.
18
Figure 2.2: Conceptual Framework Model
Product dependability CSR activities, Service quality
----------------------- * >
Level of CustomerTrust LoyaltyCustomer satisfactionInnovationValue added services
Independent Variables Dependent variable
Source: Researcher, (2012).
Service quality determines how products are offered to customers leading to either the
customer being satisfied or disenchantment. By asking the customers of their individual
assessment of the service and products offered, management gets feedback which it uses
to either enhance the service or change the products offered hence altering customer
loyalty. These same outcomes are also the result of manifest brand loyalty toward a
brand.
19
CHAPTER THREE: RESEARCH METHODOLOGY
3.1 Introduction
This chapter outlines the overall methodology that was used to carry out this research. It
embodies; the research design, the research population, sampling design, data collection
methods, research procedures and the methodology.
3.2 Research Design
The study adopted a descriptive cross sectional survey method in determining the
consumer brand loyalty in the mobile telephony in Kenya. According to Kothari (2003)
the design is a flexible and allows the researcher to consider many different aspects of a
problem hence helping the researcher to gain new insights and ideas about a problem.
Other scholars such as Oyieko (2010) and Murugu (2008) successfully used descriptive
survey design in their studies.
3.3 Population
For the purposes of this study, the population of interest was all mobile telephone
subscribers in Kenya’s major towns namely Nairobi, Mombasa, Nakuru and Kisumu. The
facts that were studied did not vary substantially by regions across the country thus
allowed for generalization of the results, (Mugenda and Mugenda 2003).
3.4 Sampling
The population of interest was divided into four strata (towns) namely Nairobi,Kisumu,
Nakuru and Mombasa and in each stratum was further divided into three categories
based on their socio-economic class depending on their income levels (Low income,
Middle income and High income classes) before randomly selecting five (5) respondents
20
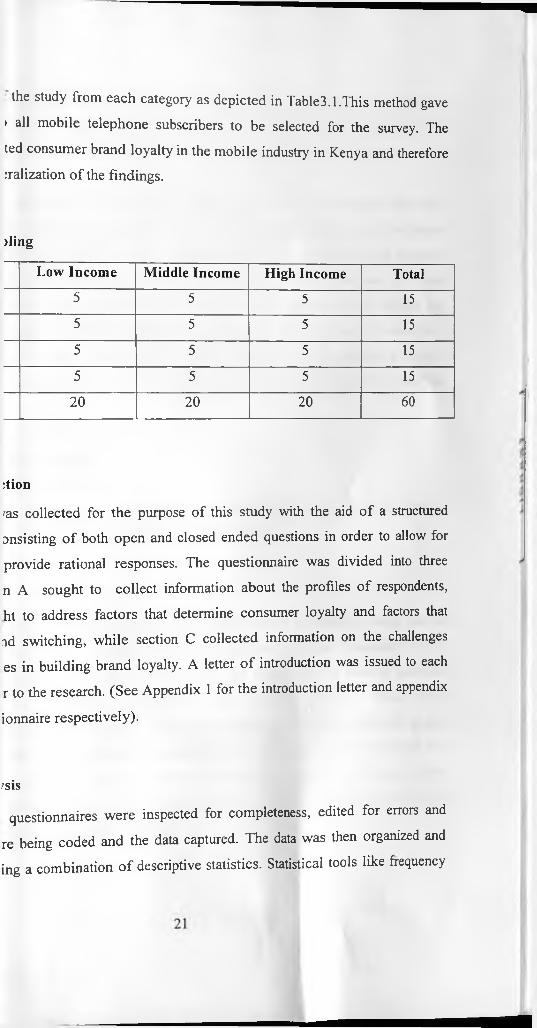
the study from each category as depicted in Table3.1.This method gave
> all mobile telephone subscribers to be selected for the survey. The
ted consumer brand loyalty in the mobile industry in Kenya and therefore :ralization of the findings.
ding
Low Income Middle Income High Income Total5 5 5 15
5 5 5 15
5 5 5 15
5 5 5 15
20 20 20 60
:tion
/as collected for the purpose of this study with the aid of a structured
onsisting o f both open and closed ended questions in order to allow for
provide rational responses. The questionnaire was divided into three
n A sought to collect information about the profiles of respondents,
ht to address factors that determine consumer loyalty and factors that
nd switching, while section C collected information on the challenges
es in building brand loyalty. A letter o f introduction was issued to each
r to the research. (See Appendix 1 for the introduction letter and appendix
ionnaire respectively).
/sis
questionnaires were inspected for completeness, edited for errors and
re being coded and the data captured. The data was then organized and
ing a combination o f descriptive statistics. Statistical tools like frequency

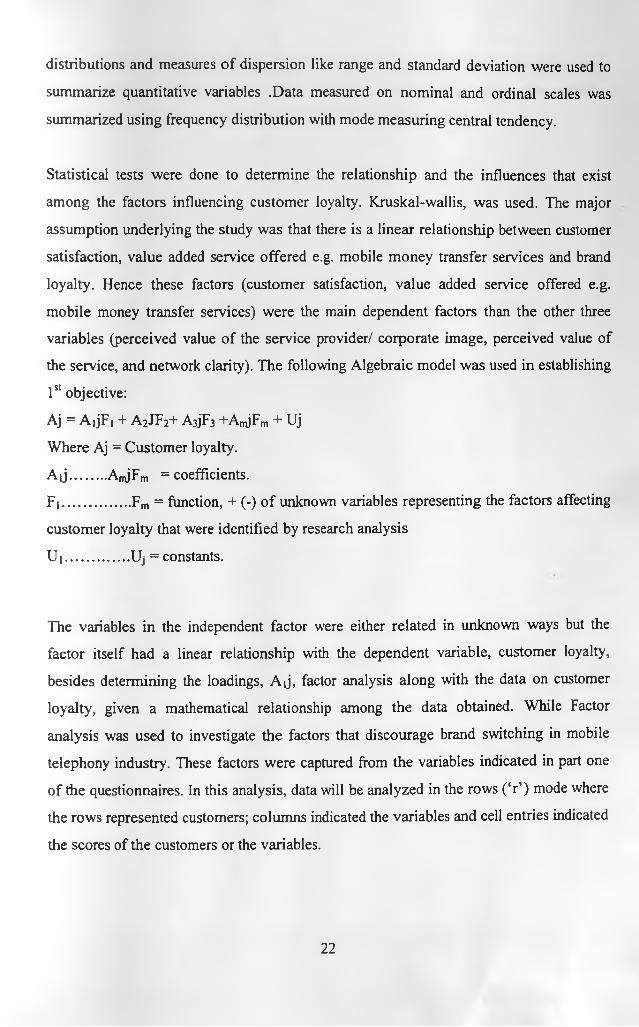
distributions and measures o f dispersion like range and standard deviation were used to
summarize quantitative variables .Data measured on nominal and ordinal scales was
summarized using frequency distribution with mode measuring central tendency.
Statistical tests were done to determine the relationship and the influences that exist
among the factors influencing customer loyalty. Kruskal-wallis, was used. The major
assumption underlying the study was that there is a linear relationship between customer
satisfaction, value added service offered e.g. mobile money transfer services and brand
loyalty. Hence these factors (customer satisfaction, value added service offered e.g.
mobile money transfer services) were the main dependent factors than the other three
variables (perceived value o f the service provider/ corporate image, perceived value of
the service, and network clarity). The following Algebraic model was used in establishing
1st objective:
Aj = AijFi + A2JF2+ A jF-? +AnjFm + Uj
Where Aj = Customer loyalty.
Aij......... A„jFm = coefficients.
Fi..................Fm = function, + (-) o f unknown variables representing the factors affecting
customer loyalty that were identified by research analysis
U i ....................... U j = constants.
The variables in the independent factor were either related in unknown ways but the
factor itself had a linear relationship with the dependent variable, customer loyalty,
besides determining the loadings, Ajj, factor analysis along with the data on customer
loyalty, given a mathematical relationship among the data obtained. While Factor
analysis was used to investigate the factors that discourage brand switching in mobile
telephony industry. These factors were captured from the variables indicated in part one
of the questionnaires. In this analysis, data will be analyzed in the rows (‘r ) mode where
the rows represented customers; columns indicated the variables and cell entries indicated
the scores of the customers or the variables.
22
distributions and measures o f dispersion like range and standard deviation were used to
summarize quantitative variables .Data measured on nominal and ordinal scales was
summarized using frequency distribution with mode measuring central tendency.
Statistical tests were done to determine the relationship and the influences that exist
among the factors influencing customer loyalty. Kruskal-wallis, was used. The major
assumption underlying the study was that there is a linear relationship between customer
satisfaction, value added service offered e.g. mobile money transfer services and brand
loyalty. Hence these factors (customer satisfaction, value added service offered e.g.
mobile money transfer services) were the main dependent factors than the other three
variables (perceived value of the service provider/ corporate image, perceived value of
the service, and network clarity). The following Algebraic model was used in establishing
1st objective:
Aj = AjjF i + A2JF2+ A3jF3 +AmjFm + Uj
Where Aj = Customer loyalty.
A J ..........AnjFm = coefficients.
F i.................. Fm = function, + (-) o f unknown variables representing the factors affecting
customer loyalty that were identified by research analysis
U i.................Uj = constants.
The variables in the independent factor were either related in unknown ways but the
factor itself had a linear relationship with the dependent variable, customer loyalty,
besides determining the loadings, A ij, factor analysis along with the data on customer
loyalty, given a mathematical relationship among the data obtained. While Factor
analysis was used to investigate the factors that discourage brand switching in mobile
telephony industry. These factors were captured from the variables indicated in part one
of the questionnaires. In this analysis, data will be analyzed in the rows (‘r ’) mode where
the rows represented customers; columns indicated the variables and cell entries indicated
the scores of the customers or the variables.
22
To establish the challenges facing the telecommunications providers in building brand
loyalty, content analysis was used. This was used to support the results o f quantitative
analysis in drawing conclusions and recommendations for the study.
23
CHAPTER FOUR: DATA ANALYSIS, FINDINGS AND DISCUSSIONS
4.1 Introduction
This chapter presents analyses, interpretations and findings of the study based on the
research methodology. The analysis is both quantitative and qualitative. The chapter is
structured according to the questions in the questionnaire and provides discussion of the
findings together with their implications. The results are presented on consumer brand
loyalty in the mobile telephony industry in Kenya. The data was gathered exclusively
from questionnaire as the research instrument. The questionnaire was designed in line
with the objectives of the study. Moreover the additional data and observations, gained
from the survey have been incorporated into the discussion.
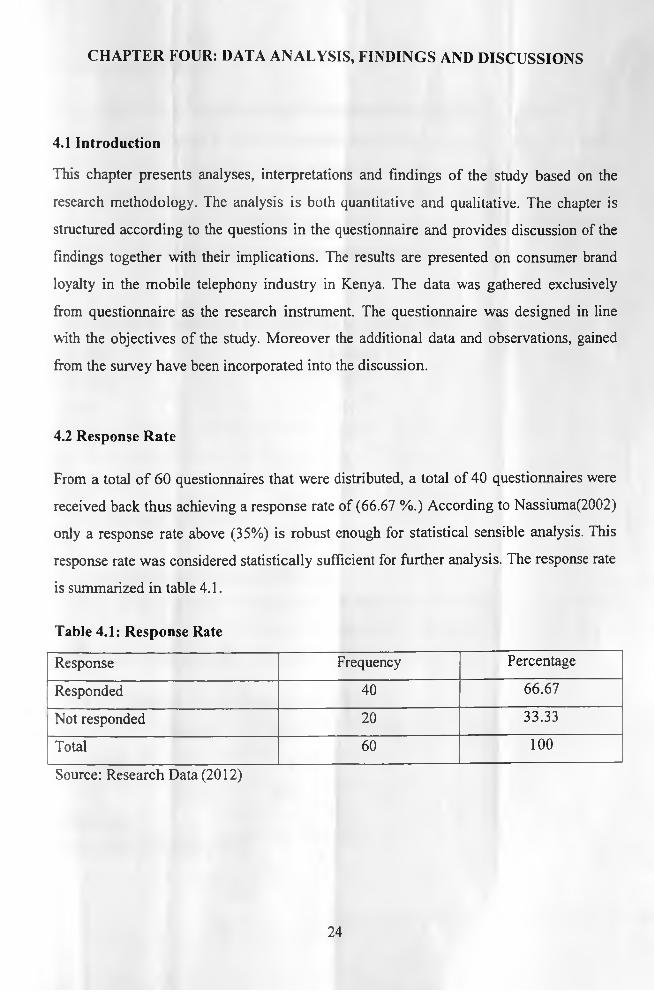
4.2 Response Rate
From a total of 60 questionnaires that were distributed, a total of 40 questionnaires were
received back thus achieving a response rate of (66.67 %.) According to Nassiuma(2002)
only a response rate above (35%) is robust enough for statistical sensible analysis. This
response rate was considered statistically sufficient for further analysis. The response rate
is summarized in table 4.1.
Table 4.1: Response Rate
Response Frequency Percentage
Responded 40 66.67
Not responded 20 33.33
Total 60 100
Source: Research Data (2012)
24
4.3 Demographic Details
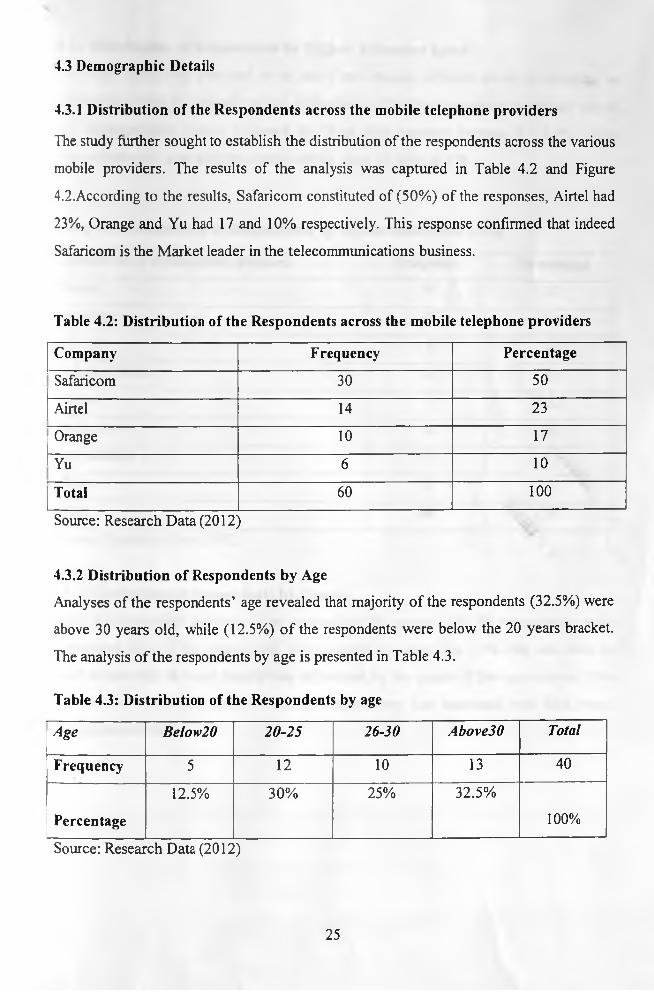
4.3.1 Distribution of the Respondents across the mobile telephone providers
The study further sought to establish the distribution of the respondents across the various
mobile providers. The results of the analysis was captured in Table 4.2 and Figure
4.2.According to the results, Safaricom constituted of (50%) of the responses, Airtel had
23%, Orange and Yu had 17 and 10% respectively. This response confirmed that indeed
Safaricom is the Market leader in the telecommunications business.
Table 4.2: Distribution of the Respondents across the mobile telephone providers
Company Frequency Percentage
Safaricom 30 50
Airtel 14 23
Orange 10 17
Yu 6 10
Total 60 100
Source: Research Data (2012)
4.3.2 Distribution of Respondents by Age
Analyses of the respondents’ age revealed that majority o f the respondents (32.5%) were
above 30 years old, while (12.5%) o f the respondents were below the 20 years bracket.
The analysis o f the respondents by age is presented in Table 4.3.
Table 4.3: Distribution of the Respondents by age
Age Below20 20-25 26-30 Above30 Total
Frequency 5 12 10 13 40
Percentage
12.5% 30% 25% 32.5%
100%
Source: Research Data (2012)
25
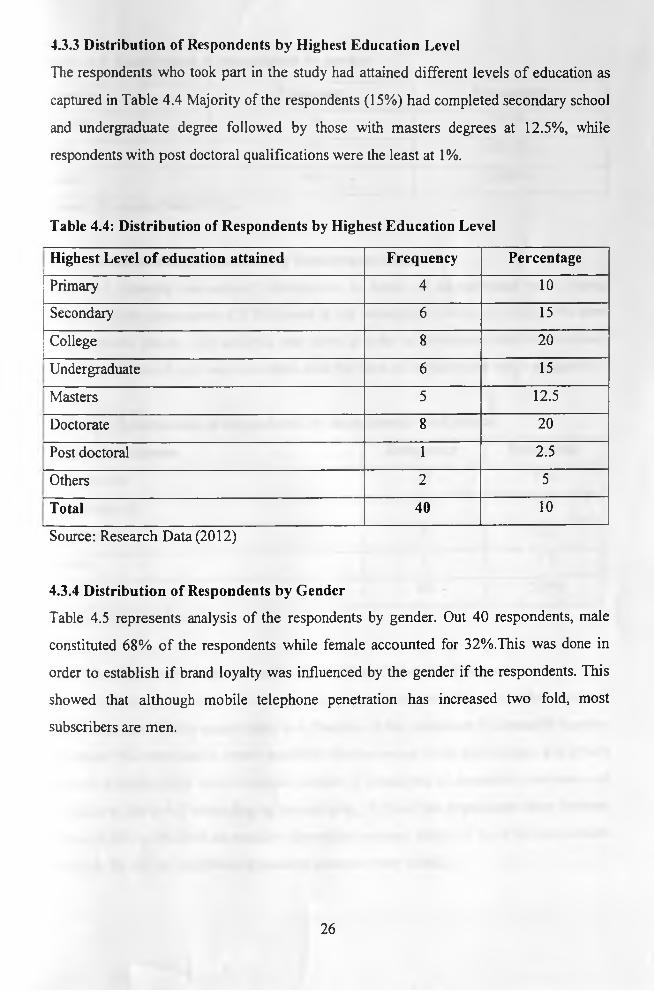
4.3.3 Distribution of Respondents by Highest Education Level
The respondents who took part in the study had attained different levels of education as
captured in Table 4.4 Majority of the respondents (15%) had completed secondary school
and undergraduate degree followed by those with masters degrees at 12.5%, while
respondents with post doctoral qualifications were the least at 1%.
Table 4.4: Distribution of Respondents by Highest Education Level
Highest Level o f education attained Frequency Percentage
Primary 4 10
Secondary 6 15
College 8 20
Undergraduate 6 15
Masters 5 12.5
Doctorate 8 20
Post doctoral 1 2.5
Others 2 5
Total 40 10
Source: Research Data (2012)
4.3.4 Distribution of Respondents by Gender
Table 4.5 represents analysis of the respondents by gender. Out 40 respondents, male
constituted 68% of the respondents while female accounted for 32%.This was done in
order to establish if brand loyalty was influenced by the gender if the respondents. This
showed that although mobile telephone penetration has increased two fold, most
subscribers are men.
26
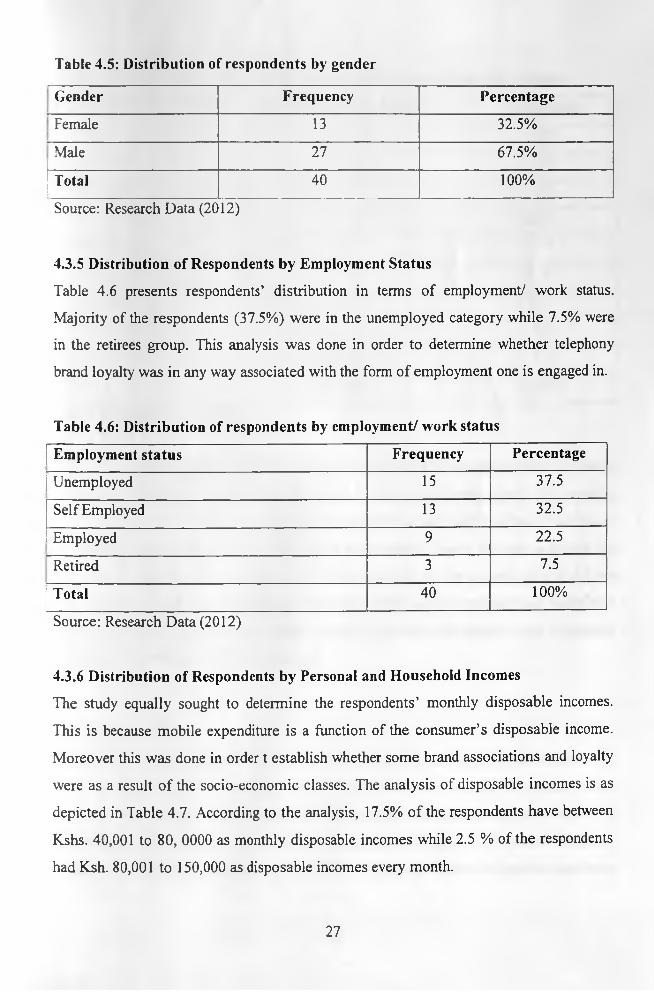
Table 4.5: Distribution of respondents by gender
Gender Frequency Percentage
Female 13 32.5%
Male 27 67.5%
Total 40 100%
Source: Research Data (20 12)
4.3.5 Distribution of Respondents by Employment Status
Table 4.6 presents respondents’ distribution in terms of employment/ work status.
Majority of the respondents (37.5%) were in the unemployed category while 7.5% were
in the retirees group. This analysis was done in order to determine whether telephony
brand loyalty was in any way associated with the form of employment one is engaged in.
Table 4.6: Distribution of respondents by employment/ work status
Employment status Frequency Percentage
Unemployed 15 37.5
Self Employed 13 32.5
Employed 9 22.5
Retired 3 7.5
Total 40 100%
Source: Research Data (2012)
4.3.6 Distribution of Respondents by Personal and Household Incomes
The study equally sought to determine the respondents’ monthly disposable incomes.
This is because mobile expenditure is a function of the consumer’s disposable income.
Moreover this was done in order t establish whether some brand associations and loyalty
were as a result o f the socio-economic classes. The analysis of disposable incomes is as
depicted in Table 4.7. According to the analysis, 17.5% of the respondents have between
Kshs. 40,001 to 80, 0000 as monthly disposable incomes while 2.5 % of the respondents
had Ksh. 80,001 to 150,000 as disposable incomes every month.
27
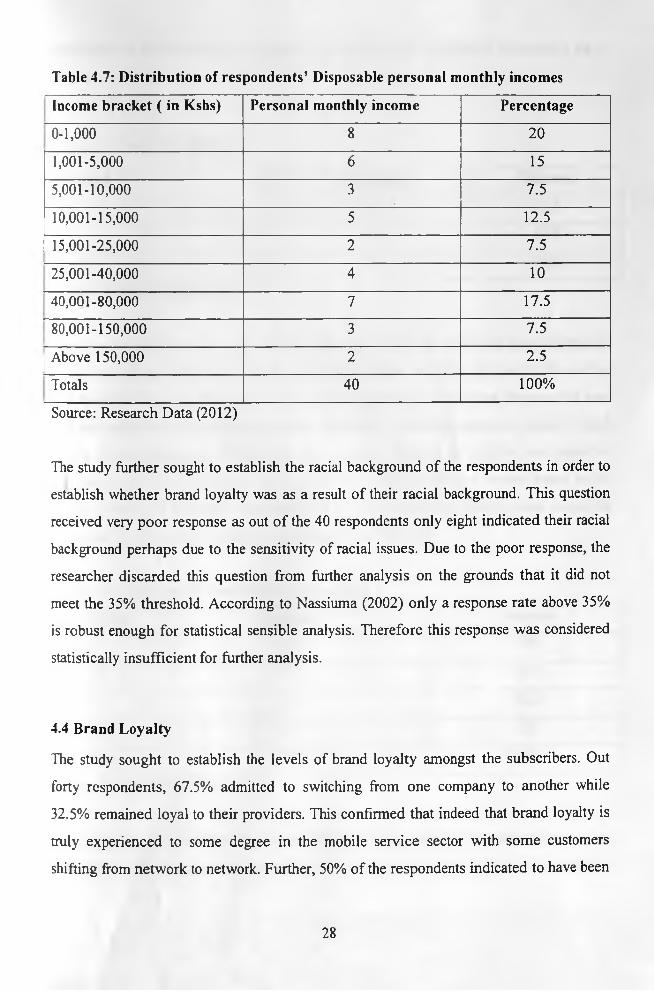
Table 4.7: Distribution of respondents’ Disposable personal monthly incomes
Income bracket ( in Kshs) Personal monthly income Percentage
0-1,000 8 20
1,001-5,000 6 15
5,001-10,000 3 7.5
10,001-15,000 5 12.5
15,001-25,000 2 7.5
25,001-40,000 4 10
40,001-80,000 7 17.5
80,001-150,000 3 7.5
Above 150,000 2 2.5
Totals 40 100%
Source: Research Data (2012)
The study further sought to establish the racial background of the respondents in order to
establish whether brand loyalty was as a result of their racial background. This question
received very poor response as out o f the 40 respondents only eight indicated their racial
background perhaps due to the sensitivity of racial issues. Due to the poor response, the
researcher discarded this question from further analysis on the grounds that it did not
meet the 35% threshold. According to Nassiuma (2002) only a response rate above 35%
is robust enough for statistical sensible analysis. Therefore this response was considered
statistically insufficient for further analysis.
4.4 Brand Loyalty
The study sought to establish the levels of brand loyalty amongst the subscribers. Out
forty respondents, 67.5% admitted to switching from one company to another while
32.5% remained loyal to their providers. This confirmed that indeed that brand loyalty is
truly experienced to some degree in the mobile service sector with some customers
shifting from network to network. Further, 50% of the respondents indicated to have been
28
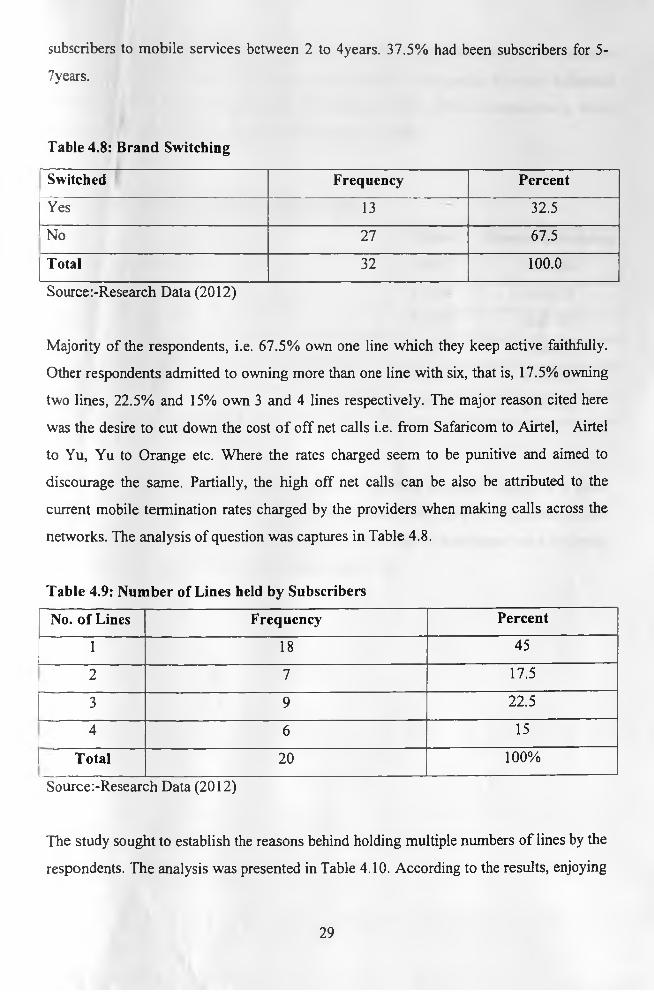
subscribers to mobile services between 2 to 4years. 37.5% had been subscribers for 5-
7years.
Table 4.8: Brand Switching
Switched Frequency Percent
Yes 13 32.5
' No 27 67.5
Total 32 100.0
Source:-Research Data (2012)
Majority of the respondents, i.e. 67.5% own one line which they keep active faithfully.
Other respondents admitted to owning more than one line with six, that is, 17.5% owning
two lines, 22.5% and 15% own 3 and 4 lines respectively. The major reason cited here
was the desire to cut down the cost o f off net calls i.e. from Safaricom to Airtel, Airtel
to Yu, Yu to Orange etc. Where the rates charged seem to be punitive and aimed to
discourage the same. Partially, the high off net calls can be also be attributed to the
current mobile termination rates charged by the providers when making calls across the
networks. The analysis of question was captures in Table 4.8.
Table 4.9: Number of Lines held by Subscribers
No. o f Lines Frequency Percent
1 18 45
2 7 17.5
3 9 22.5
4 6 15
Total 20 100%
Source :-Research Data (2012)
The study sought to establish the reasons behind holding multiple numbers of lines by the
respondents. The analysis was presented in Table 4.10. According to the results, enjoying
29
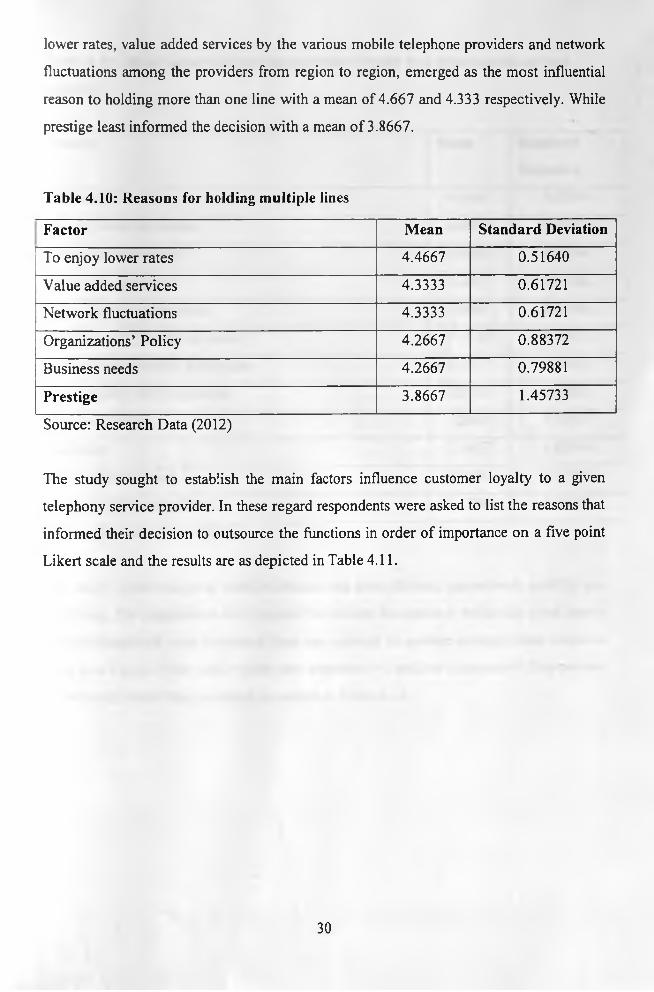
lower rates, value added services by the various mobile telephone providers and network
fluctuations among the providers from region to region, emerged as the most influential
reason to holding more than one line with a mean of 4.667 and 4.333 respectively. While
prestige least informed the decision with a mean o f 3.8667.
Table 4.10: Reasons for holding multiple lines
Factor Mean Standard Deviation
To enjoy lower rates 4.4667 0.51640
Value added services 4.3333 0.61721
Network fluctuations 4.3333 0.61721
Organizations’ Policy 4.2667 0.88372
Business needs 4.2667 0.79881
Prestige 3.8667 1.45733
Source: Research Data (2012)
The study sought to establish the main factors influence customer loyalty to a given
telephony service provider. In these regard respondents were asked to list the reasons that
informed their decision to outsource the functions in order of importance on a five point
Likert scale and the results are as depicted in Table 4.11.
30
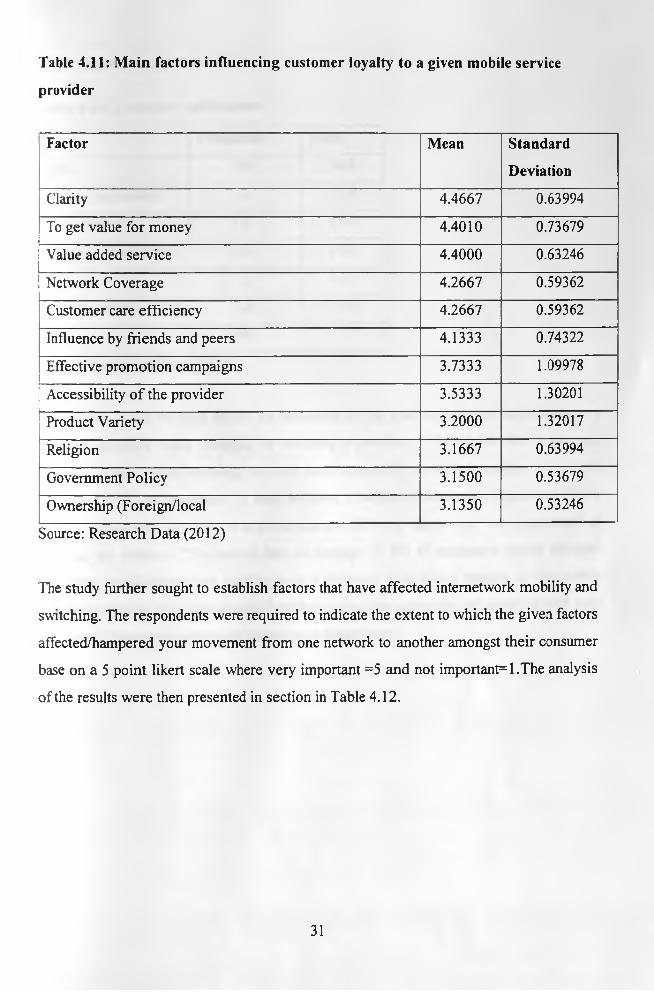
Table 4.11: Main factors influencing customer loyalty to a given mobile service
provider
Factor Mean Standard
Deviation
Clarity 4.4667 0.63994
To get value for money 4.4010 0.73679
Value added service 4.4000 0.63246
Network Coverage 4.2667 0.59362
Customer care efficiency 4.2667 0.59362
Influence by friends and peers 4.1333 0.74322
Effective promotion campaigns 3.7333 1.09978
Accessibility o f the provider 3.5333 1.30201
Product Variety 3.2000 1.32017
Religion 3.1667 0.63994
Government Policy 3.1500 0.53679
Ownership (Foreign/local 3.1350 0.53246
Source: Research Data (2012)
The study further sought to establish factors that have affected internetwork mobility and
switching. The respondents were required to indicate the extent to which the given factors
affected/hampered your movement from one network to another amongst their consumer
base on a 5 point likert scale where very important =5 and not im portant 1.The analysis
of the results were then presented in section in Table 4.12.
31
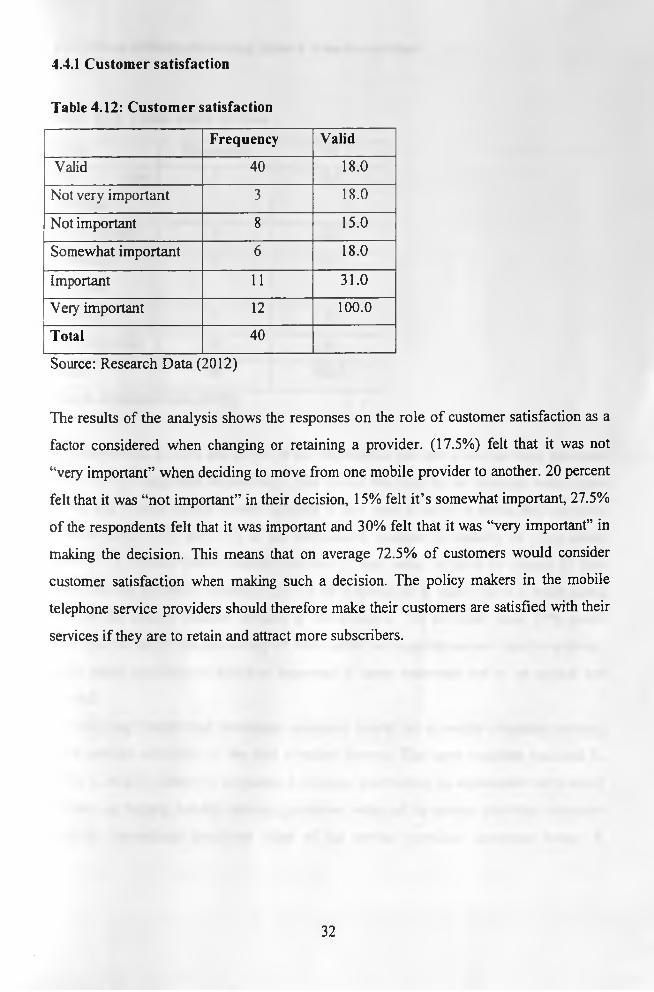
4.4.1 Customer satisfaction
Table 4.12: Customer satisfaction
Frequency Valid
Valid 40 18.0
Not very important 3 18.0
Not important 8 15.0
Somewhat important 6 18.0
Important 11 31.0
Very important 12 100.0
Total 40
Source: Research Data (2012)
The results of the analysis shows the responses on the role of customer satisfaction as a
factor considered when changing or retaining a provider. (17.5%) felt that it was not
“very important” when deciding to move from one mobile provider to another. 20 percent
felt that it was “not important” in their decision, 15% felt it’s somewhat important, 27.5%
of the respondents felt that it was important and 30% felt that it was “very important” in
making the decision. This means that on average 72.5% of customers would consider
customer satisfaction when making such a decision. The policy makers in the mobile
telephone service providers should therefore make their customers are satisfied with their
services if they are to retain and attract more subscribers.
32
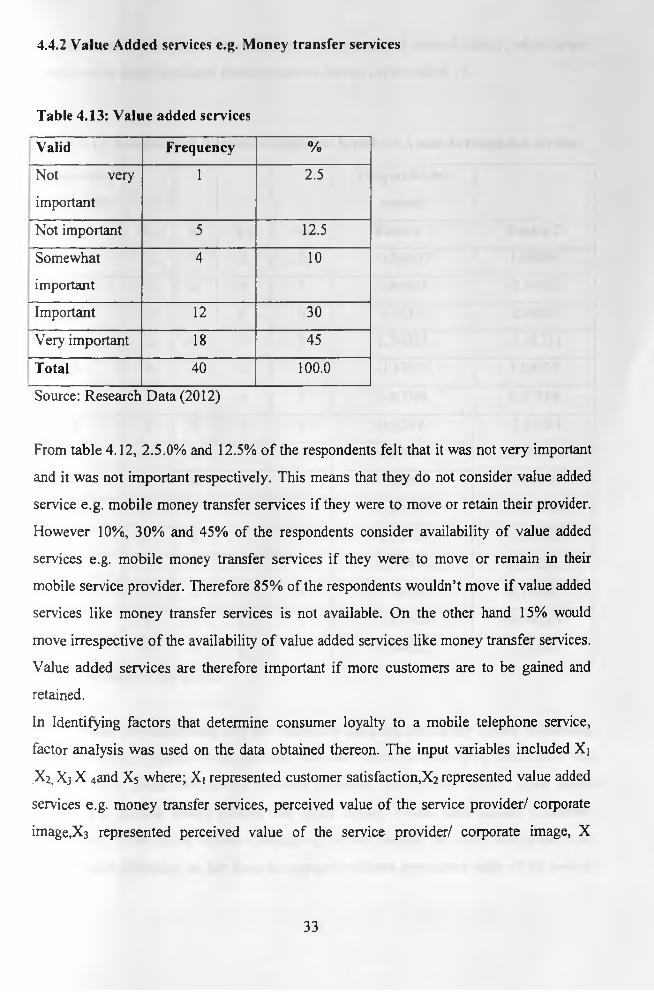
4.4.2 Value Added services e.g. Money transfer services
Table 4.13: Value added services
Valid Frequency %
Not very
important
1 2.5
Not important 5 12.5
Somewhat
important
4 10
Important 12 30
Very' important 18 45
Total 40 100.0
Source: Research Data (2012)
From table 4.12, 2.5.0% and 12.5% o f the respondents felt that it was not very important
and it was not important respectively. This means that they do not consider value added
service e.g. mobile money transfer services if they were to move or retain their provider.
However 10%, 30% and 45% of the respondents consider availability of value added
services e.g. mobile money transfer services if they were to move or remain in their
mobile service provider. Therefore 85% of the respondents wouldn’t move if value added
services like money transfer services is not available. On the other hand 15% would
move irrespective o f the availability o f value added services like money transfer services.
Value added services are therefore important if more customers are to be gained and
retained.
In Identifying factors that determine consumer loyalty to a mobile telephone service,
factor analysis was used on the data obtained thereon. The input variables included Xi
,X2, X3 X 4and X5 where; Xi represented customer satisfaction,X2 represented value added
services e.g. money transfer services, perceived value of the service provider/ corporate
image,X3 represented perceived value of the sendee provider/ corporate image, X
33
represented affordability o f the service and X5 represented network clarity, while output/
factor scores were calculated from the data as shown in the table 4.14.
Table 4.14: Factors that determine consumer loyalty to a mobile telephone service
Input/varia
bles values
Output/factor
scores
X, x2 x3 x 4 x5 Factor 1 Factor 2
9 6 9 2 2 -0.84037 1.09086
4 6 2 6 7 0.88018 -0.19022
0 0 5 0 0 -1.09151 -2.00037
2 2 0 9 9 1.74028 -0.61231
6 9 8 3 3 -0.43271 1.04976
3 8 5 4 7 0.40098 0.32186
4 5 6 3 6 -0.02497 -0.15184
8 6 8 2 2 -0.77007 0.72030
4 4 0 8 8 1.43499 -0.46909
2 8 4 5 7 0.64349 0.13451
1 2 6 0 0 -1.14897 -1.44074
6 9 7 3 5 -0.14974 0.93232
6 7 1 7 8 1.19589 0.10743
2 1 7 1 1 -0.93920 -0.90774
9 7 9 2 1 -0.94820 1.11161
Source: Research Data (2012)
To determine the relationship and the influences that exist among the factors influencing
customer loyalty Kruskal-wallis, analysis was used under the underlying assumption that
there exists a linear relationship between customer satisfaction factors, value added
services e.g. Mobile money transfer and brand loyalty. Hence these factors (Customer
satisfaction, Value added service offerings e.g. money transfer services) were taken to as
the two main dependent on the factors compared to others (perceived value of the service
34
provider/ corporate image, perceived value o f the service, and network clarity) with
Customer satisfaction coded as Factor 1 and Value added service offerings e.g. Money
transfer services coded as Factor 2.
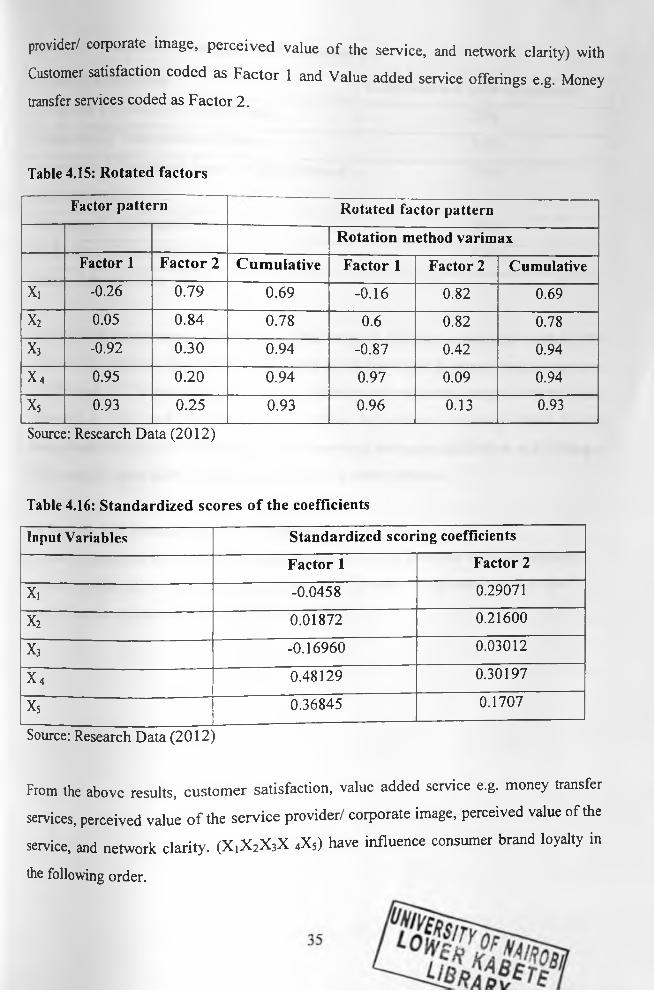
Table 4.15: Rotated factors
Factor pattern Rotated factor pattern
Rotation method varimax
Factor 1 Factor 2 Cumulative Factor 1 Factor 2 Cumulative
X ! - 0.26 0.79 0.69 - 0.16 0.82 0.69
x2 0.05 0.84 0.78 0.6 0.82 0.78
X3 - 0.92 0.30 0.94 - 0.87 0.42 0.94
x 4 0.95 0.20 0.94 0.97 0.09 0.94
X5 0.93 0.25 0.93 0.96 0.13 0.93
Source: Research Data (2012)
Table 4.16: Standardized scores o f the coefficients
Input Variables Standardized scoring coefficients
Factor 1 Factor 2
X, -0.0458 0.29071
x 2 0.01872 0.21600
X3 -0.16960 0.03012
x 4 0.48129 0.30197
X5 0.36845 0.1707
Source: Research Data (2012)
From the above results, custom er satisfaction, value added service e.g. money transfer
services, perceived value o f the service provider/ corporate image, perceived value of the
service, and network clarity. (X ,X 2X3X 4X5) have influence consumer brand loyalty in
the following order.

Table 4.17: Influence of each of the Components
Extracted component % Influence of each component
Component 1 (Customer satisfaction) 29%
Component 2 (Value added services) 21%
Component 3 (Perceived value of the service&
Corporate image)
03%
Component 4 (Affordability) 30%
Component 5 (Network clarity) 17%
Source: Research Data (2012)
Thus the first component (affordability of the service) influences customers most at 30%
followed by customer satisfaction and value added services e.g. money transfer services
at 29% and 21 % respectively. Network clarity and corporate image have the least
influence at 17% and 3% respectively. Hence to increase consumer brand loyalty
management should focus on the cost o f the services, customer satisfaction and offering a
wide range of value added services e.g. Money transfer services.
4.5 Factors that Discourage Brand switching
In order to establish the factors that discourages switching from one mobile telephony
service provider in the mobile telephone industry, Kruskal Wallis and ANOVA were
used where the treatment factor customer loyalty.
36
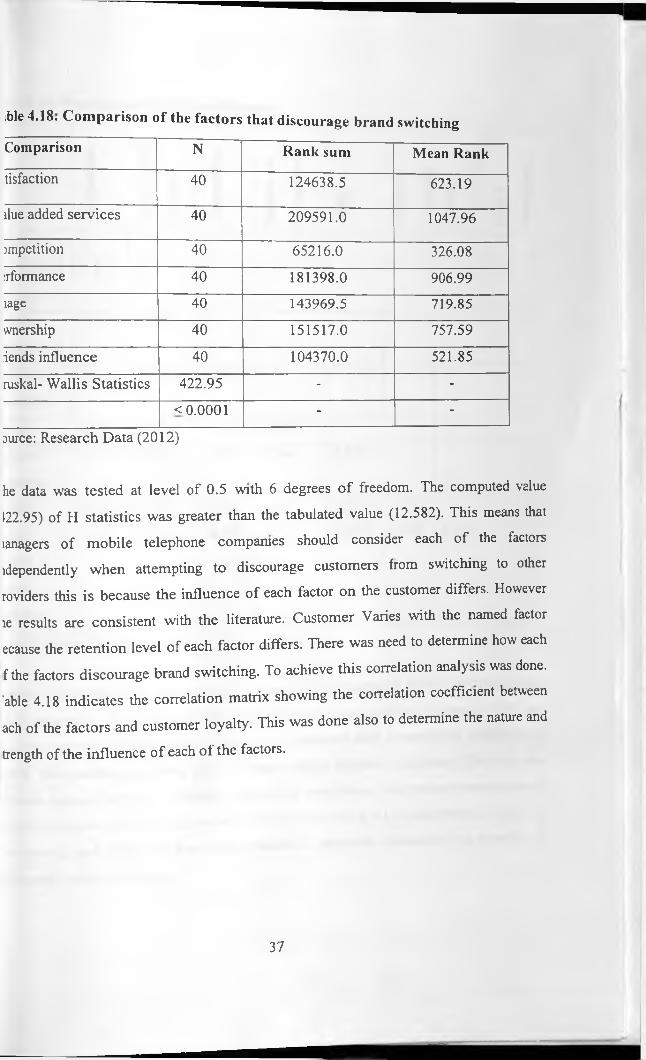
ible 4.18. Comparison of the factors that discourage brand switching
Comparison N Rank sum Mean Rank
tisfaction 40 124638.5 623.19
due added services 40 209591.0 1047.96
impetition 40 65216.0 326.08
rformance 40 181398.0 906.99
lage 40 143969.5 719.85
wnership 40 151517.0 757.59
iends influence 40 104370.0 521.85
ruskal- Wallis Statistics 422.95 - -
<0.0001 - -
aurce: Research Data (2012)
he data was tested at level of 0.5 with 6 degrees o f freedom. The computed value
122.95) of H statistics was greater than the tabulated value (12.582). This means that
lanagers of mobile telephone companies should consider each of the factors
idependently when attempting to discourage customers from switching to other
roviders this is because the influence of each factor on the customer differs. However
le results are consistent with the literature. Customer Varies with the named factor
ecause the retention level of each factor differs. There was need to determine how each
f the factors discourage brand switching. To achieve this correlation analysis was done,
'able 4.18 indicates the correlation matrix showing the correlation coefficient between
ach of the factors and customer loyalty. This was done also to determine the nature and
trength of the influence of each o f the factors.
37
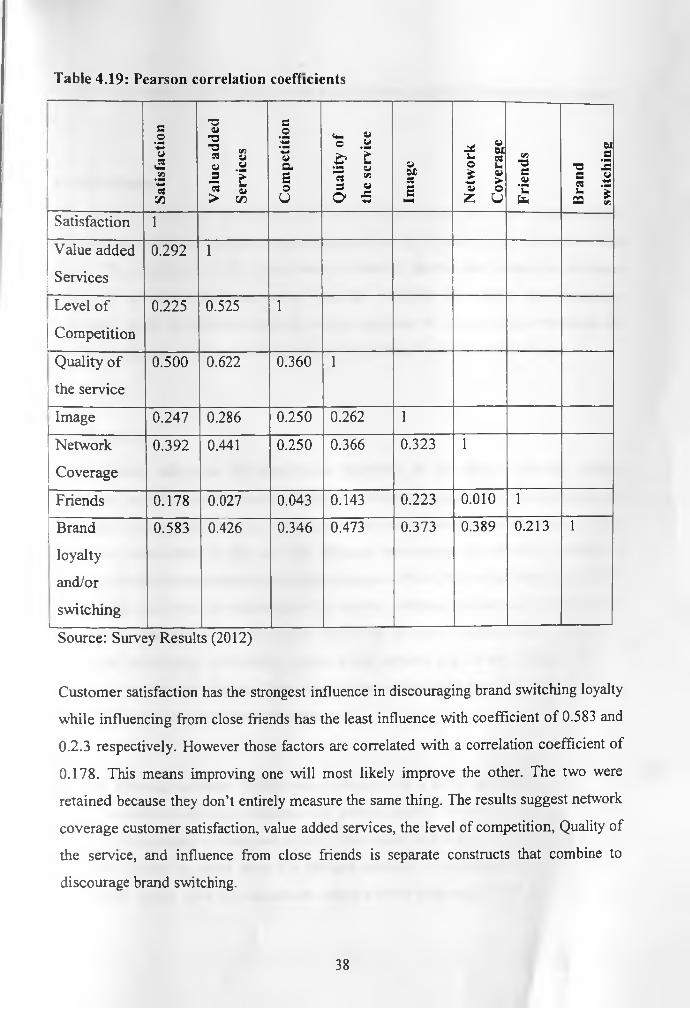
Table 4.19: Pearson correlation coefficients
Satis
fact
ion
Val
ue a
dded
Serv
ices
Com
petit
ion
Qua
lity
of
the
serv
ice
Imag
e
Net
wor
k
Cov
erag
e
Frie
nds
Bra
nd
switc
hing
Satisfaction 1
Value added
Services
0.292 1
Level of
Competition
0.225 0.525 1
Quality o f
the service
0.500 0.622 0.360 1
Image 0.247 0.286 0.250 0.262 1
Network
Coverage
0.392 0.441 0.250 0.366 0.323 1
Friends 0.178 0.027 0.043 0.143 0.223 0.010 1
Brand
loyalty
and/or
switchingi____________
0.583 0.426 0.346 0.473 0.373 0.389 0.213 1
Source: Survey Results (2012)
Customer satisfaction has the strongest influence in discouraging brand switching loyalty
while influencing from close friends has the least influence with coefficient o f 0.583 and
0.2.3 respectively. However those factors are correlated with a correlation coefficient of
0.178. This means improving one will most likely improve the other. The two were
retained because they don’t entirely measure the same thing. The results suggest network
coverage customer satisfaction, value added services, the level of competition, Quality of
the service, and influence from close friends is separate constructs that combine to
discourage brand switching.
38
CHAPTER FIVE: SUMMARY, CONCLUSIONS AND RECOMMENDATIONS
5.1 Introduction
This chapter presents the summary of the findings from chapter four, and it also gives the
discussions, conclusions and recommendations of the study based on the objectives of the
study. The objectives of this study were to identify factors that determine consumer
loyalty to a mobile telephone service provider; establish the factors that discourage
switching from one mobile telephony service provider to another and investigate the
challenges facing mobile telephone providers in building brand loyalty in Kenya.
5.2 Summary
This research addressed the three main objectives of the study: customer loyalty,
switching services providers and challenges to building brand loyalty. The research is a
response for the need of customer loyalty research in mobile telephone industry in Kenya.
This was occasioned by the fact that although there exists four mobile operators in
Kenya, one telecommunication provider commands 68% of the market share as the other
three battle it out with the remainder o f the market. Utilizing the proposed loyalty model
as a theoretical framework, the direct influences of brand loyalty were found to be
customer satisfaction, affordability, value added services e.g. money transfer sendees,
quality o f service and influence from close influence from close friends. In the study, data
sets of 40 completed questionnaires were used.
Factors affecting customer loyalty were extracted from a set of selected items borrowed
from commitment and gap measurement of service quality. The items were then amended
to suit determination of customer loyalty. This meant that each of the items influenced
customer loyalty in varied ways. For instance contrary to expectation of the researcher,
the survey results show that customers attach a lot of importance to provision of value
39
added services especially the now famous Money transfer services e.g. MPESA Airtel
Money, Orange money and Yu cash when considering the mobile provider to subscribe
to.
Since the items were many, there was need to measure them to meaningful factors that
influence customer loyalty i.e. customer satisfaction and value added services like mobile
money transfer services. This was achieved through the use of principal component
analysis. Seven distinct factors were extracted from the initial items namely customer
satisfaction, availability of network, competition, corporate image, performance,
influence from close friends (peers) and perceived value. Items that are associated with
customer satisfaction indicated that subscribers align satisfaction and value added
services offerings especially the mobile money transfers with the mobile telephone
services and products.
Item that create an environment where the confidence is instilled in the customer
(especially regarding the mobile money transfer services) seem to play a significant role
in customer loyalty. It was further noted that customer satisfaction has the highest
positive coefficient o f correlation with customer loyalty. This indicates that its influence
on customer loyalty is much higher than other factors. Items aligned to loyalty included
confidence in both customer satisfaction and value added services like the mobile money
transfer services. Network availability had a positive correlation coefficient of 0.389
indicating great influence towards customer loyalty.
5.3 Conclusion
The contribution o f this study to customer loyalty research is twofold. First, it has
successfully applied the traditional conceptualization of customer loyalty in mobile
telephony sector that is different from the market place examined in prior studies.
Second, customer satisfaction, network availability and clarity. Perceived value,
corporate image, performance competition and influence from close friends were found
to be important determinant of customer loyalty.
40
5.4 Recommendations
The finding of this study has implications for mobile telephone providers’ managers to
develop their customer loyalty programmes. Considering the uniqueness of mobile
phones communication in shaping the economy, it is of paramount importance to ensure
that customer will have repeat transaction behaviors (especially regarding the mobile
money transfer services) and show loyalty to a provider. Current behaviors can result in
slowed economic growth since more resource may be wasted in movements from one
provider to another.
The four mobile providers should also study their competitive environment with a view
of adjusting it, use of network marketing where present customers should influence
potential customer or existing customers to maintain loyalty, further to this. These
companies should improve range of products offering in inform of Value added services
as well as emphasize quality of services and to ensure customer satisfaction since both
positively influence customer loyalty.
Customer loyalty is mostly based on how quality of services offered by mobile telephone
service providers. It is therefore essential to ensure that the channels for offering the
services are right and enhance customer satisfaction. For example, customer care outlets
should be expanded as well as enhancement of the clarity width of network coverage.
This is mainly because the findings o f the study indicate that customer satisfaction had a
high positive influence on consumer brand loyalty. It is therefore apparent that such a
factor should be the focus of mobile telephone service providers.
5.5 Suggestions for further Study
This study has a number of areas that can be addressed in future research. Firstly, the data
used in this study limits generalization to other sectors. A confirmatory analysis and
cross-sectorial validation using a large sample gathered from other sectors is required for
greater generalization of the factors affecting customer loyalty in the mobile telephone
industry.
41
Secondly the study did not incorporate loyalty outcomes (e.g. market share, relative price
&profit) prior studies suggested that market share increases as loyalty increases. The
influence of loyalty on the market share product price and profit of any mobile telephone
provider is an important issue in need of systematic empirical research studies should be
conducted to show the relationships that exist in these outcomes and customer loyalty in
the mobile telephone services industry. This may involve the use of regression analysis to
come up with a model that could be used for predicting market share when level of
customer loyalty is known.
42
REFERENCES
Aaker, D. (2001). Managing Brand Equity: Capitalizing on the value o f a Brand Name.
New York: The free press.
Aaker, D. (1996). Dimensions o f brand personality. Journal o f Marketing Research 34,
347-56
Agarwal, K. and Rao, R. (2006). An empirical comparison o f consumer-based measures
o f brand equity. Marketing Letters.
Bantug-Herrera (2006). Brand trust in the context of consumer loyalty. European Journal
o f Marketing.
Bello et al., (2009). Customer Loyalty: Toward an integrated conceptual framework.
Journal o f Marketing Science 22 ( 2), 99-113.
Broniarczyk and Dawar (2004). A national customer satisfaction barometer: The Swedish
experience. Journal o f Marketing 56 (1), 6-21.
Buttle, F. (1996). SERVQUAL: Review,Research Agenda. European Journal o f
Marketing.
Canno, T. (1980). Marketing principle and practice (5th Edition). Cassel Publisher.
Cannon (1999). The outcome set of Relationship marketing in consumer marketing.
International Business Review.
Cerchigro and Ayrosa (2003). The theory o f Buyer Behavior. New York: John Eiley &
Sons.
Chematony and McDonald (2003). The commitment-trust theory of relationship
marketing. Journal o f Marketing 58, 20-38.
Christopher (2000). A marketing approach to customer retention. Journal o f Customer
Marketing.
Ehrenberg (2000). The importance o f customer satisfaction in explaining brand and
dealer loyalty. Journal o f Marketing Management, European Management Journal.
Fader and Schmittlein ((2003). The chain of effects from brand trust and brand affect to
brand performance: The role of brand loyalty. Journal o f Marketing.
43
Fearme and Fowler (2006). SERVPERF versus SERVQUAL: Reconciling performance-
based and perceptions minus expectation measurement of SQ. Journal o f Marketing
5 6 ,125-131.
Fomell (2002). What is brand equity anyway, and how do you measure it? Journal o f the
Market Research Society.
Fraenkel and Wallen (2002). Consumers and their brands: developing relationship theory.
Journal o f Consumer.
Gichuru (2003). Brand switching in the mobile telephony business in Kenya. Unpublished
MBA Project. University of Nairobi
Given (2005). Reviving brand loyalty: A reconceptualization within the framework of
consumer brand relationships. International Journal o f Research in Marketing.
Goldstuck (2009). The different roles o f satisfaction, trust, and commitment in customer
relationship. Journal o f Marketing 63, 70-87.
Guillaume (2008). The new strategic brand management: Creating and sustaining brand
equity long term. London: Kogan Page.
Jacoby and Kyner (1999). Conceptualizing, measuring, and managing customer-based
brand equity.
Kenya National Bureau of Statistics (2012). The economic survey (2011). Nairobi,
Kenya: KNBS.
Kerringer (2008). The measurement and dimensionality o f brand associations. Journal o f
Product & Brand Management 9 (6), 350-70.
Kirui, (2001). Competitive advantage through customer loyalty schemes at EABL.
Kotler, A. (2006). Customer relationship management: Principles o f Marketing (11th
Edition). Prentice Hall
Kottler and Keller (2003). Strategic brand management: Building, measuring and
managing brand equity. India: New Jersey Prentice Hall.
Kyle (1998). Loyalty: The influences o f satisfaction and brand community integration.
44
Kyner (2003). Evaluation of brand equity measures: Further empirical results. Journal o f
Product & Brand management 10 (1), 38-51.
Maina (2001). An investigation on perceived quality and brand loyalty in mobile the
telephony business. Unpublished MBA Project. University of Nairobi
Mallat, Rossi & Tuunainen, (2007). The outcome set o f Relationship marketing in
consumer marketing. International Business Review 4, 447-469.
Mugenda and Mugenda, (2003). Research methods for social sciences (2nd Edition).
N airobi: Moran Publishers.
Murigi (2003). An investigation on the determinants o f brand loyalty in pharmaceutical
products. Unpublished MBA Project. University of Nairobi
Murugu (2008). Customer satisfaction and its impact on loyalty in Zain. Unpublished
MBA Project. University of Nairobi
Mwanika (2009). Factors affecting brand loyalty o f toilet soaps in Kenya. Unpublished
MBA Project. University of Nairobi
Ndungu (2011). Brand loyalty in insurance industry, A case o f Britak Insurance.
Unpublished MBA Project. University of Nairobi
Njoroge (2007). The impact o f Customer satisfaction on service quality at Kenya Power.
Unpublished MBA Project. University of Nairobi
Nyagechi (2010). Perception o f brand equity o f daily newspapers by media buying
agencies in Nairobi. Unpublished MBA Project. University of Nairobi
Nyaoga (2007). The role o f service quality management and performance in establishing
customer loyalty in the service industry. Unpublished MBA Project. University of
Nairobi
Oyieko (2011) Factors affecting brand loyalty in the private security industry in Kenya.
Unpublished MBA Project. University of Nairobi
Parasuranam (1993). An empirical model for brand loyalty measurement. Journal o f
Targeting, Measurement and Analysis fo r Marketing, 15 (4).
Reich held and Schefter (2000). Zero defections: Quality comes to services. Harvard
Business Review (September-October), 105-11.
Rowley, J. (2005). The four Cs o f customer loyalty, marketing intelligence and planning.
45

Rust and Oliver (2005). Consumer-based brand equity: improving the measurement &
empirical evidence. Journal o f Product & Brand Management.
Smith and Whan Park (2002). Marketing communications: Theory and applications.
Pearson Prentice.
Suoranta and M anilla (2009). Brand equity and the extendibility of brand names.
International Journal o f Research in M arketing.
46
APPENDICES
Appendix I: Letter of Introduction
Dear Sir/ Madam,
RE: MBA RESEARCH
You are receiving this letter because I would like to request your assistance in completing
the attached questionnaire. I am a student at the University o f Nairobi (UON) pursuing a
Master o f Business Administration (MBA). I am undertaking a research project in partial
fulfillment of the requirements for the award of the degree. My study is on “A Survey o f
Brand Loyalty in the Mobile Telephony Industry in Kenya
You have been selected to form part o f the study as a respondent. I will be very grateful if
you would spare sometime from your busy schedule, to respond to the questions listed on
the attached questionnaire.
Your response will be treated with utmost confidentiality. The findings of this research
maybe made available to you upon completion of the research, if you so request.
Your assistance and co-operation will be highly appreciated.
Yours faithfully,
PHOEBE AWUOR
UON MBA STUDENT
RAYMOND MUSYOKA
SUPERVISOR
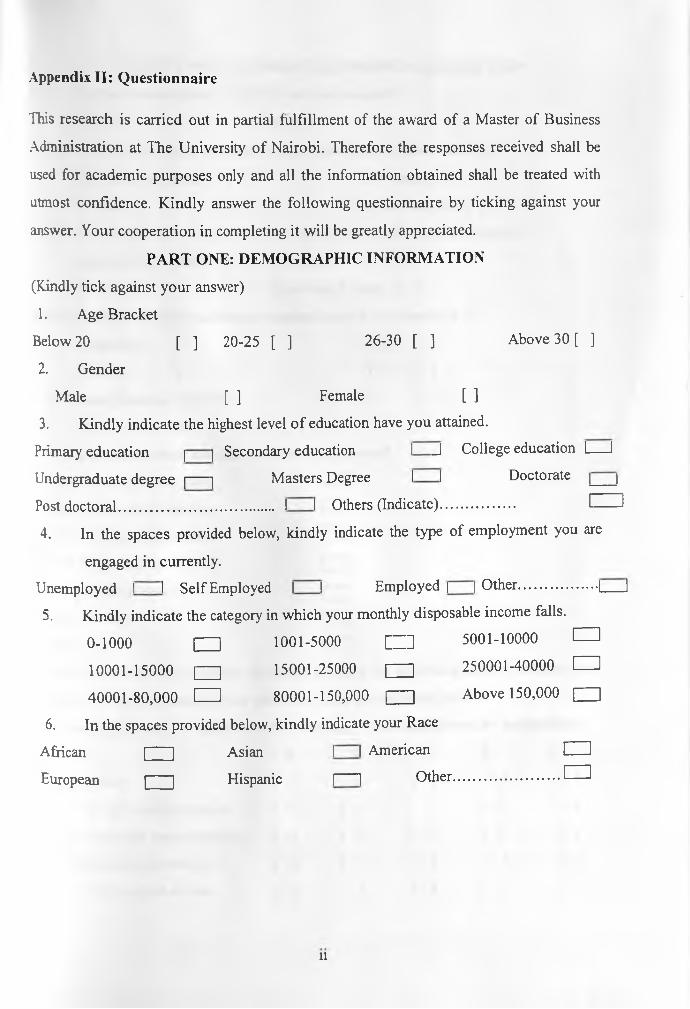
Appendix II: Questionnaire
This research is carried out in partial fulfillment of the award of a Master of Business
Administration at The University o f Nairobi. Therefore the responses received shall be
used for academic purposes only and all the information obtained shall be treated with
utmost confidence. Kindly answer the following questionnaire by ticking against your
answer. Your cooperation in completing it will be greatly appreciated.
PART ONE: DEMOGRAPHIC INFORMATION
(Kindly tick against your answer)
1. Age Bracket
Below 20 [ ] 20-25 [ ] 26-30 [ ] Above 30 [ ]
2. Gender
Male [ ] Female [ ]
3. Kindly indicate the highest level o f education have you attained.
Primary education | ] Secondary education I J College education I-----1
Undergraduate degree |----- 1 Masters Degree I 1 Doctorate | |
Post doctoral.......................................... I I Others (Indicate).................... I------ 1
4. In the spaces provided below, kindly indicate the type of employment you are
engaged in currently.
Unemployed I I Self Employed 1 1 Employed [ 1 Other..................... I----- 1
5. Kindly indicate the category in which your monthly disposable income falls.
0-1000 [ZD 1001-5000 CZH 5001-10000 □
10001-15000 □ 15001-25000 □ 250001-40000 □
40001-80,000 □ 80001-150,000 □ Above 150,000 □
6. In the spaces provided below, kindly indicate your Race
African
European□
□
Asian
Hispanic
| | American
|-----1 Other.
□.[= □
u
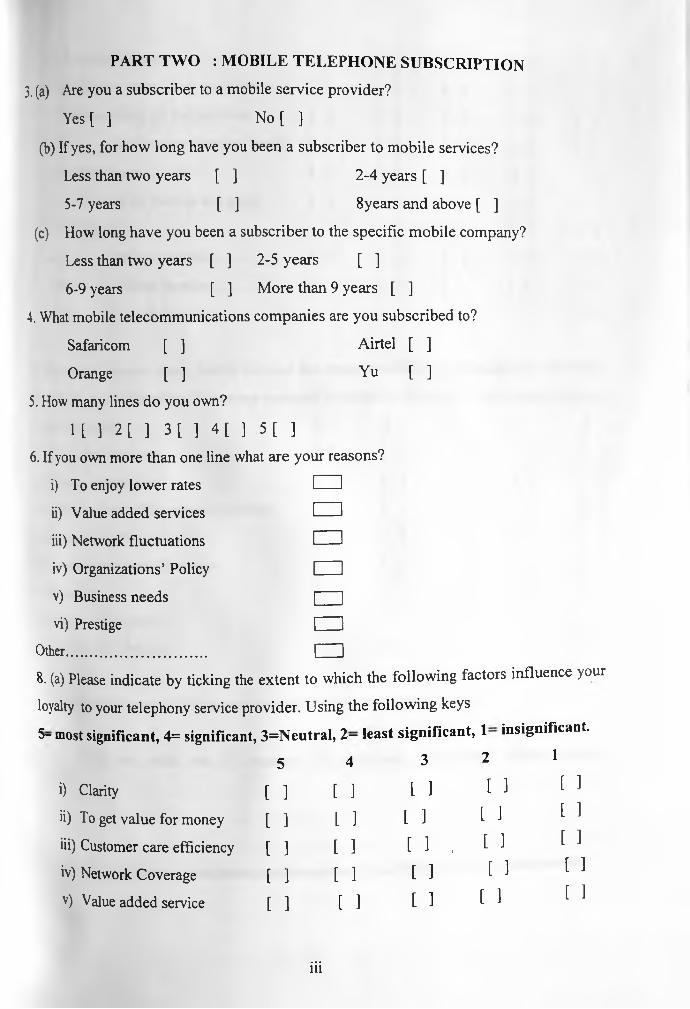
PART TW O : MOBILE TELEPHONE SUBSCRIPTION
3. (a) Are you a subscriber to a mobile service provider?
Yes [ ] No [ ]
(b) If yes, for how long have you been a subscriber to mobile services?
Less than two years [ ] 2-4 years [ ]
5- 7 years [ ] 8years and above [ ]
(c) How long have you been a subscriber to the specific mobile company?
Less than two years [ ] 2-5 years [ ]
6- 9 years [ ] More than 9 years [ ]
4. What mobile telecommunications companies are you subscribed to?
Safaricom [ ] Airtel [ ]
Orange [ ] Yu [ ]
5. How many lines do you own?
1[ 1 2 [ ] 3 [ ] 4 [ ] 5 [ ]
6. If you own more than one line what are your reasons?
i) To enjoy lower rates □ii) Value added services □iii) Network fluctuations □iv) Organizations’ Policy [ = □v) Business needs □vi) Prestige □
Other...................................... □8. (a) Please indicate by ticking the extent to which the following factors influence your
loyalty to your telephony service provider. Using the following keys
5- most significant, 4= significant, 3=Neutral, 2— least significant, 1 insignificant.
5 4 3 2 1
i) Clarity [ ] [ ] [ 1 M N [ ] [ 1 I 1 1 1 [ 1 t 1 . f ) [ 1 [ ] [ I I 1 1 1 [ ] 1 1 t 1 1 1
ii) To get value for money [ 1iii) Customer care efficiency [ ]iv) Network Coverage [ ]v) Value added service [ 1
iii
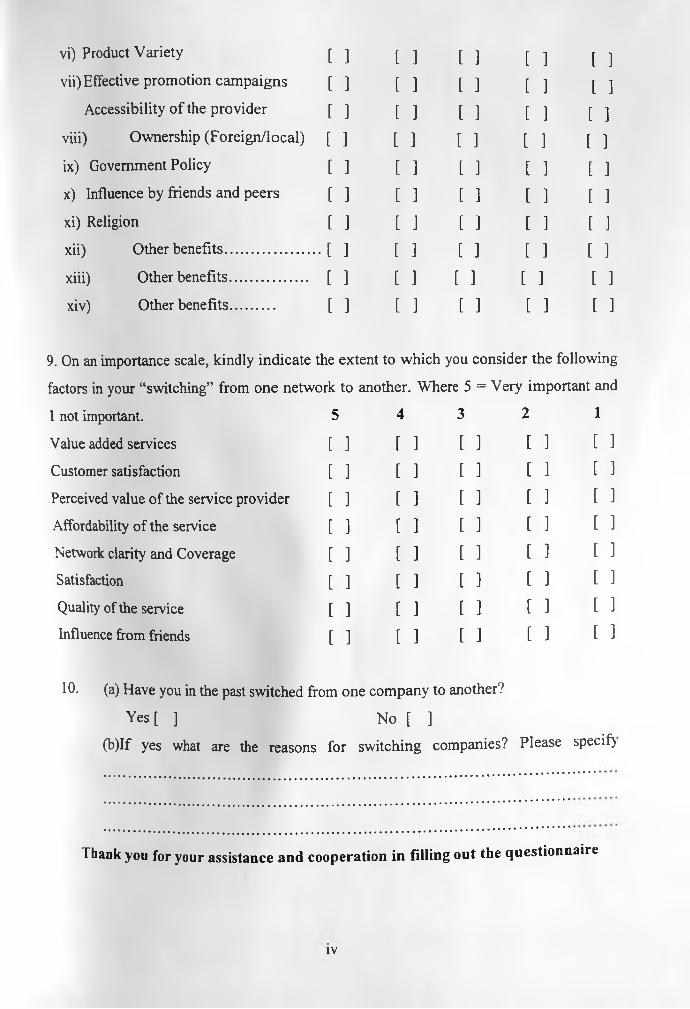
vi) Product Variety [ ] [ ] [ ] [ ] [ ]vii) Effective promotion campaigns [ ] [ ] [ ] [ ] [ ]
Accessibility o f the provider [ ] [ ] [ ] [ ] [ ]viii) Ownership (Foreign/local) [ ] [ ] [ ] [ ] [ ]ix) Government Policy [ ] [ ] [ ] [ ] [ ]x) Influence by friends and peers [ ] [ ] [ ] [ ] [ ]xi) Religion [ ] [ ] [ ] [ ] [ ]xii) Other benefits........................ •[ ] [ ] [ ] [ ] [ ]xiii) Other benefits..................... [ ] [ ] [ ] [ ] [ ]xiv) Other benefits............ [ ] [ ] [ ] [ ] [ ]
9. On an importance scale, kindly indicate the extent to which you consider the following
factors in your “switching” from one network to another. Where 5 = Very important and
1 not important. 5 4 3 2 1
Value added services [ ] [ ] [ ] [ ] [ ]
Customer satisfaction [ ] [ ] [ ] [ ] [ 1
Perceived value of the service provider [ ] [ ] [ ] [ ] [ ]
Affordability of the service [ ] [ ] [ ] [ ] [ ]
Network clarity and Coverage [ ] [ ] [ ] [ ] [ ]
Satisfaction [ ] [ ] [ ] [ ] [ ]
Quality of the service [ ] [ ] [ 1 [ 1 [ ]
Influence from friends [ ] [ ] [ ] [ ] [ 1
10. (a) Have you in the past switched from one company to another?
Yes [ ] No [ ]
(b)If yes what are the reasons for switching companies? Please specify
Thank you for your assistance and cooperation in filling out the questionnaire
IV