Polymorphism at the Ribosomal DNA Spacers and Its Relation to Breeding Structure of the Widespread...
13
Copyright 2001 by the Genetics Society of America Polymorphism at the Ribosomal DNA Spacers and Its Relation to Breeding Structure of the Widespread Mushroom Schizophyllum commune Timothy Y. James, Jean-Marc Moncalvo, Sean Li 1 and Rytas Vilgalys Department of Botany, Duke University, Durham, North Carolina 27708-0338 Manuscript received May 15, 2000 Accepted for publication October 6, 2000 ABSTRACT The common split-gilled mushroom Schizophyllum commune is found throughout the world on woody substrates. This study addresses the dispersal and population structure of this fungal species by studying the phylogeny and evolutionary dynamics of ribosomal DNA (rDNA) spacer regions. Extensive sampling (n 5 195) of sequences of the intergenic spacer region (IGS1) revealed a large number of unique haplotypes (n 5 143). The phylogeny of these IGS1 sequences revealed strong geographic patterns and supported three evolutionarily distinct lineages within the global population. The same three geographic lineages were found in phylogenetic analysis of both other rDNA spacer regions (IGS2 and ITS). However, nested clade analysis of the IGS1 phylogeny suggested the population structure of S. commune has undergone recent changes, such as a long distance colonization of western North America from Europe as well as a recent range expansion in the Caribbean. Among all spacer regions, variation in length and nucleotide sequence was observed between but not within the tandem rDNA repeats (arrays). This pattern is consistent with strong within-array and weak among-array homogenizing forces. We present evidence for the suppres- sion of recombination between rDNA arrays on homologous chromosomes that may account for this pattern of concerted evolution. U NDERSTANDING genes that are important in de- mune is a single biological species (Raper et al. 1958). The species has been found as a wood decomposer of termining a species’ distribution is a principal over 150 genera of flowering plants (Cooke 1961) and goal of ecological genetics. A related question asks how is well documented as a wound parasite of trees and as a gene is distributed throughout a species’ range. With a human pathogen of minor but increasing importance this latter information in hand, it becomes possible to (Rihs et al. 1996). speculate how life history traits influence the spatial The global distribution of several S. commune genes distribution of a gene. We have applied this approach has been previously determined. The first genes studied in studying the distribution of genes throughout the were the A and B incompatibility loci. Through exten- range of the cosmopolitan mushroom, Schizophyllum sive genetic crosses, Raper et al. (1958) determined commune Fr. Species with cosmopolitan distributions are that the numerous mating types (alleles) were randomly atypical, and understanding what genetic and life his- distributed throughout the world. The random distribu- tory traits are important in maintaining the global suc- tion of mating types in S. commune was generally ac- cess of these species may suggest basic principles in cepted as the result of widespread dispersal of S. com- understanding other species’ distributions. Our primary mune spores. Although long-distance airborne dispersal question has been to resolve whether or not long-dis- of fungal spores is well documented in literature (Pady tance spore dispersal is important in determining the and Kapica 1955; Hirst and Hurst 1967; Ingold population genetics and widespread distribution of this 1971), such dispersal may not be necessary to explain common fungus. the mating type distributions of S. commune. This is pri- S. commune is a model organism of the class Basidiomy- marily because incompatibility loci in fungi are strongly cota that includes the mushroom-forming, rust, and influenced by a form of negative frequency-dependent smut fungi. Most research on S. commune has focused on selection that selects for rare mating types and tends to its complex mating system in which haploid individuals maintain a large number of mating types at near-equal must be heteroallelic at two unlinked factors (the A and frequencies (May et al. 1999). This same selective pres- B incompatibility loci) for mating to occur. Interpopula- sure tends to equilibrate allele frequencies among popu- tion compatibility tests have demonstrated that S. com- lations (Wright 1939; Zambino et al. 1997). Recently, results from allozyme markers ( James et al. 1999) have challenged the notion that long-distance Corresponding author: Tim James, Department of Botany, Box 90338, dispersal affects the population genetic structure of S. Duke University, Durham, NC 27708-0338. E-mail: [email protected] commune. These results demonstrated that most geo- 1 Present address: Department of Biochemistry, University of Illinois, Urbana, IL 61801. graphically disjunct populations are genetically near- Genetics 157: 149–161 ( January 2001)
-
Upload
independent -
Category
Documents
-
view
0 -
download
0
Transcript of Polymorphism at the Ribosomal DNA Spacers and Its Relation to Breeding Structure of the Widespread...

Copyright 2001 by the Genetics Society of America
Polymorphism at the Ribosomal DNA Spacers and Its Relation to BreedingStructure of the Widespread Mushroom Schizophyllum commune
Timothy Y. James, Jean-Marc Moncalvo, Sean Li1 and Rytas Vilgalys
Department of Botany, Duke University, Durham, North Carolina 27708-0338
Manuscript received May 15, 2000Accepted for publication October 6, 2000
ABSTRACTThe common split-gilled mushroom Schizophyllum commune is found throughout the world on woody
substrates. This study addresses the dispersal and population structure of this fungal species by studyingthe phylogeny and evolutionary dynamics of ribosomal DNA (rDNA) spacer regions. Extensive sampling(n 5 195) of sequences of the intergenic spacer region (IGS1) revealed a large number of uniquehaplotypes (n 5 143). The phylogeny of these IGS1 sequences revealed strong geographic patterns andsupported three evolutionarily distinct lineages within the global population. The same three geographiclineages were found in phylogenetic analysis of both other rDNA spacer regions (IGS2 and ITS). However,nested clade analysis of the IGS1 phylogeny suggested the population structure of S. commune has undergonerecent changes, such as a long distance colonization of western North America from Europe as well as arecent range expansion in the Caribbean. Among all spacer regions, variation in length and nucleotidesequence was observed between but not within the tandem rDNA repeats (arrays). This pattern is consistentwith strong within-array and weak among-array homogenizing forces. We present evidence for the suppres-sion of recombination between rDNA arrays on homologous chromosomes that may account for thispattern of concerted evolution.
UNDERSTANDING genes that are important in de- mune is a single biological species (Raper et al. 1958).The species has been found as a wood decomposer oftermining a species’ distribution is a principalover 150 genera of flowering plants (Cooke 1961) andgoal of ecological genetics. A related question asks howis well documented as a wound parasite of trees and asa gene is distributed throughout a species’ range. Witha human pathogen of minor but increasing importancethis latter information in hand, it becomes possible to(Rihs et al. 1996).speculate how life history traits influence the spatial
The global distribution of several S. commune genesdistribution of a gene. We have applied this approachhas been previously determined. The first genes studiedin studying the distribution of genes throughout thewere the A and B incompatibility loci. Through exten-range of the cosmopolitan mushroom, Schizophyllumsive genetic crosses, Raper et al. (1958) determinedcommune Fr. Species with cosmopolitan distributions arethat the numerous mating types (alleles) were randomlyatypical, and understanding what genetic and life his-distributed throughout the world. The random distribu-tory traits are important in maintaining the global suc-tion of mating types in S. commune was generally ac-cess of these species may suggest basic principles incepted as the result of widespread dispersal of S. com-understanding other species’ distributions. Our primarymune spores. Although long-distance airborne dispersalquestion has been to resolve whether or not long-dis-of fungal spores is well documented in literature (Padytance spore dispersal is important in determining theand Kapica 1955; Hirst and Hurst 1967; Ingoldpopulation genetics and widespread distribution of this1971), such dispersal may not be necessary to explaincommon fungus.the mating type distributions of S. commune. This is pri-S. commune is a model organism of the class Basidiomy-marily because incompatibility loci in fungi are stronglycota that includes the mushroom-forming, rust, andinfluenced by a form of negative frequency-dependentsmut fungi. Most research on S. commune has focused onselection that selects for rare mating types and tends toits complex mating system in which haploid individualsmaintain a large number of mating types at near-equalmust be heteroallelic at two unlinked factors (the A andfrequencies (May et al. 1999). This same selective pres-B incompatibility loci) for mating to occur. Interpopula-sure tends to equilibrate allele frequencies among popu-tion compatibility tests have demonstrated that S. com-lations (Wright 1939; Zambino et al. 1997).
Recently, results from allozyme markers (James et al.1999) have challenged the notion that long-distance
Corresponding author: Tim James, Department of Botany, Box 90338, dispersal affects the population genetic structure of S.Duke University, Durham, NC 27708-0338. E-mail: [email protected]. These results demonstrated that most geo-1 Present address: Department of Biochemistry, University of Illinois,
Urbana, IL 61801. graphically disjunct populations are genetically near-
Genetics 157: 149–161 ( January 2001)

150 T. Y. James et al.
the herbaria at Uppsala (UPS), Sweden and Leiden, The Neth-isolated and hence experience little exchange througherlands (Rijksherbarium). Details on the origin of strains andspores. Allelic data such as those derived from allozymesfruiting body collections are available from the authors.
are often used to infer patterns of population structure DNA techniques: Tissue for DNA extraction was obtainedand gene flow among samples. One drawback from such from S. commune strains by scraping mycelia from week-old
cultures grown on either potato dextrose agar (Difco, Detroit)an approach is that historical processes, such as founderor a medium consisting of malt extract (1.5%), yeast extractor vicariant events, can be difficult to disentangle from(0.3%), glucose (0.5%), and agar (1.5%). Mycelia were dehy-patterns resulting from a current genetic drift/genedrated in a Speed-vac concentrator (Savant Instruments, Far-
flow equilibrium (Felsenstein 1982; Neigel 1997). As mingdale, NY) and ground to a fine powder using a dissectingan alternative to protein electrophoretic data, DNA se- needle and microcentrifuge pestle. Total genomic DNA was
isolated from the ground mycelia following Zolan and Puk-quence variation has the advantage that the history ofkila (1986). Herbarium specimens were extracted in a similarthe alleles or haplotypes can be inferred through phylo-manner using z0.1 g of fruiting body tissue.genetic methods. By knowing the phylogenetic history
The structure of the rDNA locus in S. commune and theof the alleles at a locus, there is promise of separating the location and orientation of primers for PCR are shown graphi-past demographic events among a group of populations cally in Figure 1A, with unpublished primer sequences pro-
vided in the legend. The primers for the ITS region (ITS1from current patterns of migration (Neigel 1997; Tem-and ITS4) are reported in White et al. (1990). For the IGS1pleton 1998).locus, the primers LR20R and 5SRNA were used for PCRIn the fungi, the ribosomal RNA coding cistronamplification, and internal primers LR12R and 5SRNASC
(rDNA) has been widely utilized for molecular system- were employed for automated sequencing. Primers annealingatic studies (e.g., White et al. 1990; Moncalvo et al. to the 5S and 18S rDNA genes (5SRNAR and INVSR1R) were
used to amplify the IGS2 region, and these, as well as internal2000) as well as population genetics (e.g., Ramsfield etprimers (IGS2R1-4), were used to obtain nearly complete IGS2al. 1996; Carbone et al. 1999). At the rDNA locus thesequences (z2.5 kbp).amount of variation among copies within a single species
Amplification of the ITS and IGS1 loci was performed usingis often quite dramatically lower than that between spe- reaction conditions and thermocycling parameters describedcies, a pattern termed concerted evolution (Dover in Vilgalys and Hester (1990). For the IGS2 locus, amplifi-1982; Arnheim 1983). In S. commune, the rDNA is com- cation cycles were modified such that annealing was at 578
and extension for 75 sec at 728. Amplicons were purified withposed of z120 tandemly repeated units on the eighthULTRAfree-MC centrifugal columns (Millipore Corp., Beford,largest chromosome (Dons and Wessels 1980; Asgeirs-MA) and sequenced using dye terminator chemistries on ABIdottir et al. 1994). As in many other fungi, the 5S rDNA 373 or 377 DNA sequencers (Perkin Elmer, Norwalk, CT).
gene is also present within the repeated rDNA unit and Restriction analysis of amplicons was conducted using theis found between the 25S and 18S genes (Figure 1A). enzyme Hinf I in a total reaction volume of 15 ml following
the manufacturer’s protocol (Promega, Madison, WI).Two noncoding regions exist in each repeat, the inter-To separate different IGS1 haplotypes within heteroge-nal transcribed spacer (ITS) and the intergenic spacer
neous PCR reactions, amplicons from both dikaryons and(IGS). fruiting bodies were cloned into the PCR2.1 vector (In-This study describes rDNA spacer variation in S. com- vitrogen, San Diego). A single recombinant bacterial colony
mune throughout the species’ entire geographic range. was chosen for each sample and placed directly into a 25-mlvolume PCR reaction lacking any template. The primersWe explore the species’ population genetic structureLR20R and 5SRNA were used to reamplify and sequence theseand compare the rDNA data with the data that existclones from PCR2.1.for other loci, namely the population structure of the
Sequences for IGS1 are deposited in GenBank under acces-mating incompatibility and allozyme loci. This study sion nos. AF249392–AF249586. Accession numbers for ITSbuilds on our understanding of patterns of gene flow are AF249364–AF249391, and numbers for IGS2 are AF-in S. commune by employing a larger and more diverse 249355–AF249363.
Phylogenetic analyses: Sequences were aligned by eye usingsample and by using a phylogenetic approach that hasthe program GeneDoc (Nicholas and Nicholas 1997) andthe potential of separating population structure fromimported into the phylogenetic software package PAUP*population history. These data also illuminate how pat- (Swofford 1998). For the IGS1 locus, the 195 sequences were
terns of concerted evolution progress in isolated popula- used to generate an alignment of 671 bp. An alignment oftions that have not undergone speciation. 626 bp was produced for 27 sequences from the ITS region,
and the IGS2 data set employed nine samples aligned intoa 2704 bp matrix. At IGS1, sequence alignment was mostlyunambiguous; however, several regions were difficult to alignMATERIALS AND METHODSand were excluded for the purpose of phylogenetic analysis,leaving 506 aligned characters. Many gaps existed in the align-Sampling strategy: A subset of 80 strains from the global S.ment of IGS1 and were considered to be an additional charac-commune collection used by Raper et al. (1958) was providedter state for phylogenetic analyses. When gaps were greatercourtesy of R. C. Ullrich (University of Vermont). This samplethan a single nucleotide long, these gaps were recoded suchconsisted of 68 homokaryotic (genetically haploid) and 12that each apparently unique insertion/deletion event was con-dikaryotic (genetically diploid) strains. Additional fruitingsidered a separate character state. For the ITS, gaps in thebodies were collected from natural substrates, primarily dur-alignment were also considered a fifth character state, whereasing the years 1995–1999, and were used to derive 98 mycelialgapped regions were excluded from the analysis of IGS2 duecultures from germinated spores. Last, 16 fruiting bodies of
diverse geographic origin were obtained as specimens from to the uncertainty in the alignment of the repetitive elements.

151rDNA Variation in Schizophyllum commune
Phylogenies were inferred using the maximum parsimony of clade X. Dn (X) similarly describes the average distance ofeach haplotype within clade X from the geographical centercriterion. For IGS1 and ITS regions heuristic searches wereof the next more inclusive clade within which clade X is nested.performed to find the most parsimonious phylogenies, em-Values significantly larger or smaller than that expected forploying random sequence addition to find initial trees andno geographic association of haplotypes can be tested viausing the tree-bisection and reconnection (TBR) algorithmpermutation of population assignments to haplotypes (Tem-for branch swapping (Swofford 1993). For the IGS1 data,pleton et al. 1995). Haplotypes were assigned to the same100 heuristic searches were performed, saving at most 100eight populations defined for FST estimation. Clade distancesmost parsimonious trees per search, and for the ITS regionwere calculated using a distance matrix among populations.1000 searches were performed, saving all most parsimoniousContiguous locations (e.g., North and Central America) weretrees. Exhaustive searching of all possible topologies was usedassigned a distance value of one. Locations separated by Atlan-to find most parsimonious trees for IGS2. Bootstrap confi-tic, Pacific, or Indian Oceans were assigned an arbitrary dis-dence measures for phylogenetic nodes were generated usingtance value of three. Although not ideal, the use of approxi-100 replicate resamplings, each subject to a heuristic searchmate values in the distance matrix instead of geographicwith TBR branch swapping. For ITS and IGS2 data sets, allcoordinates was necessitated because population samples weremost parsimonious trees were saved for each bootstrap repli-collected from diverse localities within geographically broadcate. For the IGS1 data set, a maximum of 50 trees werepopulations.saved for each replicate. Homoplasy (convergent or parallel
evolution) was measured on the molecular phylogeniesthrough the consistency index (CI) statistic (Farris 1989).This statistic provides a ratio of the minimum number of RESULTScharacter changes along a phylogeny given the data to theactual number of changes along the phylogeny as recon- Molecular variation within the spacer regions: Prelimi-structed by the parsimony criterion. nary sampling showed the ITS region to possess consid-
Measures of population structure and nucleotide diversity: erably less sequence variation than the IGS1 region.Nucleotide diversities, or the average number of differences Therefore IGS1 was selected for more intensive sam-per site between two homologous sequences (p) were calcu-
pling. Of 195 strains sampled for IGS1, 143 uniquelated using the program DNASP (Rozas and Rozas 1997)haplotypes were identified. The average number of sub-following equation 10.5 of Nei (1988). Diversities were calcu-
lated both for the global population as a whole as well as stitutions per site (p) among any two random samplesseparately for the three major clades (see results). Coding from the global population was 0.044 6 0.002. Of theand gapped regions were excluded from the diversity computa- 506 aligned positions at IGS1, 172 (or 33.9%) displayedtions.
nucleotide polymorphisms or polymorphic insertion/Wright’s FST was used to describe what proportion of thedeletion events (indels). Of the variable positions, 80total genetic variance at a locus is due to differences among
populations (Wright 1951). Sequences were grouped by sam- (or 46.5%) of these were unique to a single sample,ple origin into eight populations: Africa, Asia, Australasia, (i.e., singletons). In contrast, of the 27 sequences ob-the Caribbean, Central America, Europe, North America, and tained for ITS, only 31 positions (or 5.0%) were variable,South America. These populations are nearly the same as
and the corresponding value of p was 0.007 6 0.001.those in previous studies (Raper et al. 1958; James et al. 1999).For the nine IGS2 sequence samples, 252 of 2176 sitesFST can range from 1.0, in which all of the variation is among(or 11.6%) were variable, with p 5 0.049 6 0.004. Se-populations, to 0.0, in which all populations appear homoge-
neous. We calculated FST via an AMOVA analysis using the quence diversity was higher at the 59 half of IGS2 (p 5software package ARLEQUIN (Excoffier et al. 1992; Schnei- 0.065 6 0.007) relative to that of the 39 half (p 5 0.040 6der et al. 1997). 0.004). Moreover, only two sites were variable in the 200-Interpreting analyses of molecular variation (e.g., FST) as a
bp region directly upstream of the 18S rDNA. The spec-reflection of gene flow relies on the assumption that associa-trum of polymorphism along each of the three spacertions of haplotypes with geography result from a gene flow/
genetic drift equilibrium among populations. Alternatively, regions (measured as p along a sliding window of 25nested clade analyses can be used to discriminate between positions; Figure 1B) contrasts the high diversity of in-phylogeographic patterns resulting from historical events (e.g., tergenic spacers with both coding regions and the ITS.past fragmentation, range expansion, colonization) and those
Regions of invariant sequence within the IGS1 spacerdue to recurrent gene flow (Templeton et al. 1995; Tem-were also uncovered. For instance, all sequences pos-pleton 1998). These analyses utilize a phylogeny and the
geographical distribution of haplotypes or clades of haplo- sessed a “TATA box” at nucleotides 229 to 225 relativetypes. Nested clade analysis (NCA) was performed using the to the 5S rRNA gene. The “TATA box” of S. communesoftware GEODIS v. 2.0 (Posada et al. 2000) on subsets of the is in the same position as the consensus sequence ofIGS1 network (phylogeny) for which there was a low probabil-
Laccaria bicolor (Martin et al. 1999) and Neurospora crassaity (P , 0.05) of containing any convergent mutations (de-(Selker et al. 1986), and is found as an upstream ele-scribed in Templeton et al. 1992). Nested clade analysis di-ment of the 5S rDNA in all organisms studied to datevides a phylogeny into hierarchical subsets of n step clades,
where n is an integer equal to the number of observed muta- (Venkateswarlu et al. 1991).tions connecting the haplotypes of a clade. For each clade In the IGS2 spacer, beginning z40 bp downstreamthere is a geographic focal point about which all individuals from the 5S rRNA gene, a large region (z400 bp inare centered. Two quantitative measures of how haplotypes
length) of highly repetitive DNA was encountered. Thiswithin a clade are geographically dispersed were suggested byconsisted of numerous 7-bp repeats, with the repeatTempleton et al. (1995). DC (X) describes the average distance
of each haplotype within clade X from the geographic center TCAGTA(G/A) encountered most frequently. Between

152 T. Y. James et al.
Fig
ure
1.—
(A)
Sch
emat
icof
rDN
Alo
cus
inSc
hizo
phyl
lum
com
mun
e.B
oxes
indi
cate
codi
ng
regi
ons.
Hal
farr
ows
indi
cate
prim
ers
used
for
PCR
and
sequ
enci
ng.
Un
publ
ish
edpr
imer
sequ
ence
swer
eas
follo
ws:
LR
20R
,59-G
TG
AG
AC
AG
GT
TA
GT
TT
TA
CC
CT
;LR
12R
,59-G
AA
CG
CC
TC
TA
AG
TC
AG
AA
TC
C;5
SRN
A,5
9-AT
CA
GA
CG
GG
AT
GC
GG
T;5
SRN
AR
,59
-AC
QG
CA
TC
CC
GT
CT
GA
T;5
SRN
ASC
,59-G
GG
AT
GC
GG
TG
CT
TT
C;I
NV
SR1R
,59-A
CT
GG
CA
GA
AT
CA
AC
CA
GG
TA
;IG
S2R
1,59
-AA
CA
TT
GC
AA
GC
GA
CC
GG
CA
GT
T;I
GS2
R2,
59-G
GT
TT
TG
GC
TG
AC
TT
TG
AT
TT
TG
;IG
S2R
3,59
-CA
CG
AG
TT
TT
AT
GG
CC
AC
TG
;IG
S2R
4,59
-CA
GT
AC
TA
AC
AG
TC
CT
TG
GT
A.
(B)
Spec
trum
ofpo
lym
orph
ism
amon
gth
eth
ree
rDN
Asp
acer
regi
ons
depi
cted
asa
slid
ing
win
dow
ofsi
ze25
bpan
dst
epsi
zeof
8bp
.pde
scri
bes
the
aver
age
num
ber
ofpa
irw
ise
subs
titu
tion
sat
apa
rtic
ular
site
amon
gth
egl
obal
popu
lati
on.
Th
eab
scis
sare
pres
ents
the
posi
tion
alon
gth
esp
acer
regi
onab
out
wh
ich
the
slid
ing
win
dow
isce
nte
red.

153rDNA Variation in Schizophyllum commune
Since sequence heterogeneity appeared largely re-stricted to between-array rather than within-array varia-tion, i.e., confined to different homologous chromo-somes, we investigated whether recombination wassuppressed within this large gene region. The cross be-tween strains Belize#1 and Ecuador1.2 involved twomonokaryons, each of whose chromosomal arrays ap-pear homogenous at IGS1. However, Belize#1 and Ecua-dor1.2 arrays differ in the size of the IGS1 regions, arein two different clades in the IGS1 phylogeny, and differin the presence of a HinfI restriction site within thespacer. Progeny (n 5 74) were isolated from this cross
Figure 2.—Extreme spacer length variation near the 59 end and were genotyped at the HinfI restriction site. Allof IGS2 detected using PCR primers 5SRNAR and IGS2R4.
progeny genotypes were uniallelic, with 41 progenyStrains are grouped into geographic origin (eastern and west-identical to the Belize#1 parental type and 33 identicalern hemispheres). A shows monokaryotic strains that appear
to have only a single length variant, whereas in B dikaryotic to the Ecuador1.2 type. In summary, there was no evi-strains frequently possess two variants. dence from this cross for recombination between ribo-
somal arrays on different chromosomes.Phylogeographic patterns in spacer evolution: Phylo-
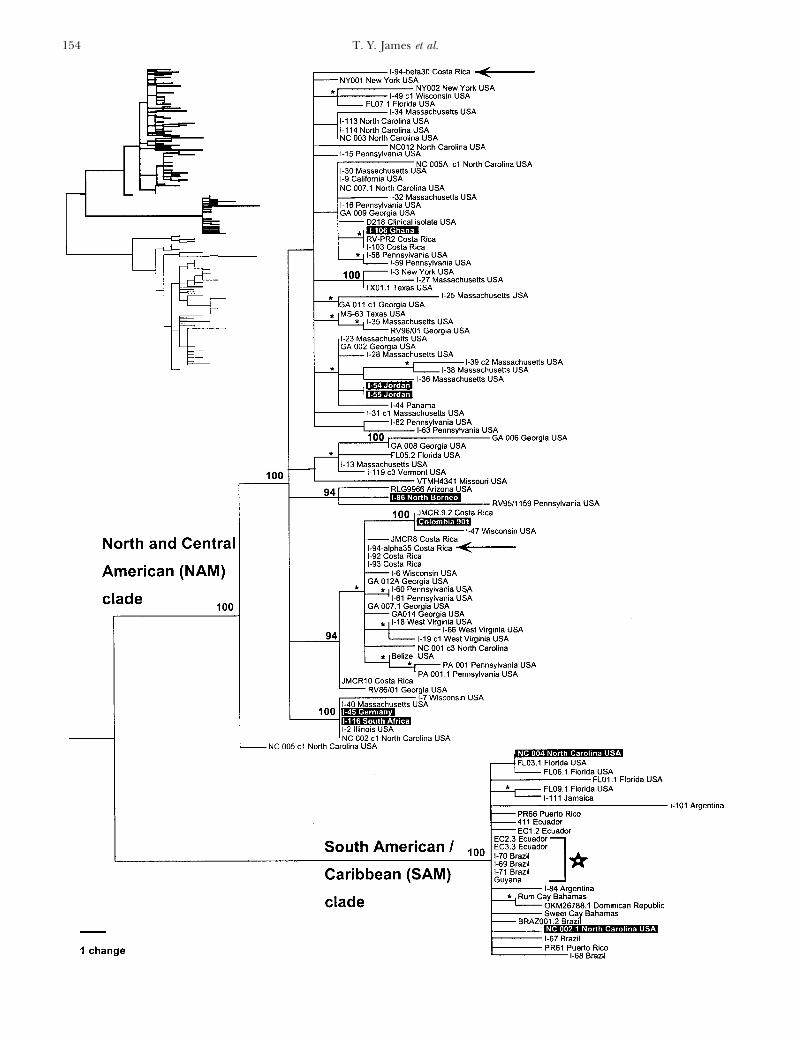
15 and 40 of these repeats were found in each strain genetic reconstruction of the IGS1 data revealed threeinterspersed among nonrepetitive DNA. Larger repeti- primary groupings, each supported with 100% boot-tive elements (19 bp) primarily in tandem arrangement strap confidence. One of the groupings correspondedwere found near the middle of the IGS2 spacer, and 4–8 to samples from North America (NAM) and Centralimperfect copies of this element were observed among America (NAM clade; Figure 3). However, only onestrains. No large (i.e., .50 bp) repeats at any spacer out of seven samples from western North America wereregion were found by dot plot analysis. found in this group. A second group consisted of sam-
Sequence data revealed the ITS1 region to be z150 ples from South America (SAM) and the Caribbean,bp and the ITS2 region to be z240 bp. Both ITS spacers and included some isolates from Florida and Northdisplayed minimal among-strain length heterogeneity Carolina (SAM clade; Figure 3). The final group con-(,4 bp per spacer). In contrast, the IGS1 spacers dem- tained the large majority of the samples from the easternonstrated much greater length heterogeneity between hemisphere (EAS clade; Figure 4). This last group alsostrains, ranging in size from 280 to 340 bp. The size of included most samples from western North Americathe IGS2 region also varied between strains and was and Wisconsin. Besides the placement of the westerndetermined to be 2400–2500 bp from DNA sequencing. North American samples, a lack of geographic concor-
Concerted evolution of rDNA spacers: Heterogeneity dance with phylogeny occurred in other instances. Forwas observed in sequence chromatograms generated by example, some isolates from Germany, South Africa,direct sequencing of IGS1 amplicons from many dikary- and Jordan grouped within the North and Centralotic individuals. This indicated that these genetically American clade (Figure 3). These geographic discrep-diploid samples possessed more than one IGS1 haplo- ancies could be most easily explained by recent migra-type of differing length, causing a reading shift in the tion events.sequence chromatograms. In contrast, sequence chro- Although the samples generally grouped by geo-matograms for monokaryotic or haploid individuals al- graphic origin, there is little evidence of geographicways produced distinct, unambiguous data, suggesting substructure within each of the three major groups.that all or most of the copies within these strains were There were, however, two subgroups in the EAS cladeof equal length. Length variation at IGS2 also appeared that clustered by geography (Figure 4). One subgroupconfined to dikaryotic individuals and absent within consisted of many samples from Australia and Papuamonokaryons. Amplification products of the IGS2 re- New Guinea, and was defined by three unique changes.gion using the primers 5SRNAR and IGS2R4 often pro- The other subgroup consisted of western North Ameri-duced double-banded products for dikaryotic individu- can strains intermixed with European samples. None ofals (Figure 2). At the ITS region, no length or sequence the samples from western North America were identicalvariation was ever observed among the amplification with those from Europe; however, some of these samplesproducts of dikaryons. differed by only a single base change.
After cloning IGS1 amplicons from dikaryotic samples Phylogenetic analysis of the ITS alignment recoveredinto PCR2.1, typically a single cloned haplotype was the same three major geographic groupings as seen atsequenced. For one sample in which two clones were IGS1 (Figure 5A). Due to the low level of variationsequenced, two different haplotypes were found (1-94- among sequences, bootstrap values for these groupings
were very low. Despite this, the variable sites were veryalpha and 1-94-beta Costa Rica; arrows in Figure 3).
154 T. Y. James et al.

155rDNA Variation in Schizophyllum commune
consistent with the phylogeny, as indicated by a high CI small geographic dispersion (or clade distance, Dc) rela-tive to the distribution of Dc values generated by permut-of 0.969. The western North American sample grouped
with the eastern hemisphere samples, as observed in ing population assignments of haplotypes (Figure 6B).In addition, since the internal clade 1-12 shows lowerthe IGS1 tree.
Phylogeographic patterns of sequence evolution at clade distance than the average of the clade distancesfor the tip clades that have presumably descended fromIGS2 resembled those seen with IGS1 and ITS regions
(Figure 5B). Despite the limited sampling, the same it [i.e., DcI-DcT significantly low (P , 0.05)], the infer-ence key presented in Templeton (1998) suggests athree geographic clades were well supported. The large
amount of IGS2 variation also resolved a very well sup- contiguous range expansion within the SAM clade.Since the internal clade was largely restricted to north-ported and consistent (CI 5 0.964) phylogeny.
Although the three spacer regions showed topological ern South America, it is inferred that a range expansioninto the Caribbean as well as North America and Argen-congruence, they differed completely in the rank order
of sequence diversity for each of the three major clades tina has occurred from this ancestral haplotype.For the EAS clade (Figure 4), much greater sequence(also apparent in relative phylogenetic branch lengths).
For each spacer phylogeny, a different clade displayed variation exists and such variation causes ambiguity innetwork estimation. Regardless, significant historicalthe highest levels of nucleotide polymorphism as mea-
sured by substitutions per site (p). At IGS1, the rank- patterns were found in this group. Clearly, because west-ern North American haplotypes are nested within theorder of sequence variation followed EAS (p 5 0.018 6
0.001) . NAM (p 5 0.015 6 0.001) . SAM (p 5 European clade (Figure 4), a long distance colonizationof America from Europe is suggested. Such a coloniza-0.013 6 0.002). The SAM clade also displayed the lowest
IGS2 polymorphism, with rankings NAM (p 5 0.027 6 tion is supported by NCA because the clade distances(Dc) of the clades containing western North American0.010) . EAS (p 5 0.024 6 0.007) . SAM (p 5 0.011 6
0.003). Finally, a reversal of IGS1 polymorphism was haplotypes are significantly low (P , 0.05) but theirnested clade distances (Dn) are significantly high (resultsobserved at ITS, where SAM (p 5 0.008 6 0.010) .
NAM (p 5 0.006 6 0.002) . EAS (p 5 0.003 6 0.001). not shown). Such reversals between Dc and Dn for a cladegenerally indicate dispersal events (Templeton 1998).Population structure and dispersal: The extensive
sampling of IGS1 sequences allowed estimation of FST,or the proportion of genetic variation due to differences
DISCUSSIONamong populations. The estimate of global FST derivedusing AMOVA was 0.487, implicating strong geographic The data presented here further explore the geo-
graphic scale and composition of breeding populationspopulation subdivision within S. commune. The IGS1 FST
value is higher than that estimated from allozyme data in S. commune. The sequence data show three geneticallydiscrete populations that appear to be geographically(0.214; James et al. 1999; Table 1) and contradicts the
low level of among-population differentiation inferred broad. More precisely, most of the eastern hemisphereforms one phylogenetic group; most of North America,from the distribution of mating types (FST 5 0.008 and
0.010 for the A and B mating loci, respectively; Raper including Central America, comprises the secondgroup; and the third group contains the majority of theet al. 1958; Table 1).
While estimates of FST rely on equilibrium population South American and Caribbean samples. Although ourextensive haplotype sampling has been able to revealdynamics, NCA do not and are capable of detecting
nonequilibrium historical associations between popula- instances of rare migration (Figures 3 and 4), thesemigrations may have occurred only in the recent historytions. Two of the three major geographic clades (SAM
and EAS) were subject to NCA. Within the SAM clade of the species.We also investigated the evolution of all rDNA spacer(see Figure 3), there is little phylogenetic structure. A
parsimonious network of these sequences is unambigu- regions to understand how population subdivision af-fects the amount and pattern of sequence variation atous and results in many tip clades emanating from a
single internal haplotype (Figure 6A). NCA shows that loci evolving under different rates of nucleotide substi-tution. The IGS displayed high levels of nucleotide di-the internal haplotype, as well as the one-step clade it
is contained within (1-12), shows significantly (P , 0.05) versity in contrast to the minimal variation observed at
Figure 3.—Phylogeny based on IGS1 sequence data. Heuristic searches found 9700 equally parsimonious trees. One of thetrees is shown, using parsimony to describe branch lengths (total length of the tree 5 285 steps; CI 5 0.795). This portion ofthe tree covers the western hemisphere group. Sequences are labeled with the strain or collection name, followed by geographicalorigin. Bootstrap values are shown above nodes; *, short internal node with .90% bootstrap support. Sequences that are placedcontradictory to their geographic origin are shown as white-on-black text. The group of identical sequences indicated by a staris the set of haplotypes shown by nested clade analysis to be an internal clade with significantly small geographic dispersion (seeFigure 6A).

156 T. Y. James et al.
Figure 4.—Second portion of the IGS1 phylogeny showing the eastern hemisphere (EAS) group.

157rDNA Variation in Schizophyllum commune
Figure 5.—(A) Phylogeny based onITS sequence data. Presented is one ofthree most parsimonious trees, 32 stepslong (CI 5 0.969). (B) Phylogeny basedon IGS2 sequence data. Exhaustivesearching recovered one most parsimo-nious tree, 305 steps long (CI 5 0.964).
the ITS. However, all rDNA spacer regions displayed the easily be explained as a demonstration of strong balanc-ing selection on mating loci. This selection preventssame three geographic groupings using phylogenetic
methods. differentiation and genetic drift of mating type frequen-cies despite the lack of significant interpopulation geneGlobal distribution of genetic elements—selection vs.
drift: S. commune is a common, cosmopolitan species flow (James et al. 1999).Both the lack of mating type differentiation amongfor which neither morphology, mating compatibility
tests, nor distributions of mating types have differenti- continents and the lack of mating incompatibilityamong intercontinental populations in S. commune mayated global populations. In contrast, neutral marker
loci have shown that very strong genetic differentiation have a general genetic basis. Many biological species ofmushroom fungi are broadly distributed over multipleexists among geographic populations (Table 1). The
random distribution of mating types among otherwise continents (Horak 1983; Vilgalys and Sun 1994;Peterson and McCleneghan 1997 and referencesgenetically divergent S. commune populations can most

158 T. Y. James et al.
TABLE 1 evolving in a neutral or near-neutral fashion, not allshow population differentiation, e.g., sorbitol dehydro-FST estimates among global populations ofgenase (Table 1). Menadione reductase and isocitrateSchizophyllum commune at selected locidehydrogenase also show this pattern of allozyme varia-tion in S. commune (James et al. 1999), and all threeData FST
loci additionally share reduced allelic diversity. SimilarA mating-type locus 0.008 patterns have been observed in Drosophila melanogasterB mating-type locus 0.010
in which several loci possess a single common alleleAllozyme (multilocus estimate) 0.214present in all populations and only a few additional rareAllozyme (aspartate aminotransferase) 0.476alleles at low frequency (Singh and Rhomberg 1987).Allozyme (aconitase) 0.442
Allozyme (sorbitol dehydrogenase) 20.023 Strong purifying selection at a locus could be responsi-Allozyme (phosphoglucoisomerase) 0.001 ble for this lack of observable genetic differentiationIGS1 (DNA sequences) 0.487 among populations, by the elimination of new variants
of suboptimal fitness.While the patterns of phylogeography suggest a large
geographical component to population subdivision, atherein) and display high levels of mating type diversityclimatological component may also be involved. Forwith little or no geographical structuring (Whitehouseexample, the fact that four of six samples from southern1949; Ullrich 1977). A model of mating compatibilityFlorida, a subtropical climate, group with samples fromevolution among allopatric populations of basidiomy-the Caribbean Sea and South America in the IGS1 phy-cete fungi should consider that two populations thatlogeny (Figure 3), suggests that the similar climate andbecome geographically isolated may not differentiate athabitat may be more important in determining popula-mating loci due to balancing selection that slows thetion structure than geographical distance. A similar ex-loss of mating types, allowing equivalent sets of matingample in the Mediterranean can be found in the group-types to be maintained between the two populationsing of Moroccan samples with those of European origin(Zambino et al. 1997; May et al. 1999). Since the mating(Figure 4). These results suggest that S. commune maytype loci themselves additionally function in sexual de-disperse frequently over marine areas devoid of habitat.velopment (Hiscock and Kues 1999), it is likely thatIf such long distance dispersal is possible, why thenpopulations that do not possess the same sets of matingare global populations differentiated? One hypothesistypes would show a high degree of incompatibility dueappeals to a historical process in which the former distri-to nonfunctional interactions between mating types thatbution of S. commune was much narrower and disjunct,have evolved independently.allowing the differentiation of the three major lineages.The patterns of phylogeography at S. commune IGS1Subsequent range expansions in combination with long-were similar to those derived from allozyme markersdistance dispersal would then create the phylogeo-(James et al. 1999), i.e., geographically broad but geneti-graphic patterns we have observed, namely three geneti-cally divergent populations. In this study, the IGS1 datacally divergent lineages whose distributions generally,provide much more detail in defining populations thanbut not entirely, correspond with their geographic ori-allozyme loci due to the ability to produce a robustgin. This hypothesis is supported from the results ofphylogeny. Additionally, phylogenetic methods were ca-the nested clade analysis that suggest continuous rangepable of detecting in S. commune the signatures of coloni-expansion to have occurred in at least one of the threezation and range expansion that could not be addressedmajor lineages (SAM clade; Figure 6). In addition, be-using allele frequency-based estimates of populationcause the SAM clade contains the least amount of se-structure (see results).
Among loci of S. commune that are believed to be quence polymorphism at two of the three spacers, the
Figure 6.—(A) Parsimony network of IGS1 haplotypes within the South American (SAM) clade. Strain designations enclosedby rounded boxes possess the same haplotype. Solid-line boxes surround one-step clades, and dashed-line boxes show two-stepclades. Numbering indicates the clade designations utilized by nested clade analysis (e.g., 1-5 is the fifth one-step clade). Thelarge internal haplotype (star in Figure 3) represented by six strains is surrounded by a boldface, rounded box. Strains fromthe Caribbean are shown in italic; strains from North America are underlined; the remaining strains are from South America.Small circles indicate inferred but not sampled haplotypes. (B) Clade distances (Dc) and nested clade distances (Dn) generatedby GeoDis for the one-step clades nested within clade 2-3. User-defined geographic distances among populations were as follows:North America and the Caribbean were considered one distance unit apart, South America and the Caribbean were one distanceunit, and North and South America were two distance units. Also shown are the differences between average clade distances forinterior vs. tip clades (DcI 2 DcT) and the corresponding value for nested clade distances (DnI 2 DnT). Superscripts indicatesignificantly small (S) or large (L) distances. The chain of inference follows the key provided in the Appendix of Templeton(1998). In words, contiguous range expansion within Clade 2-3 is suggested because clade 1-12 shows significantly small geographicdispersion and it is the only interior clade (presumably ancestral) in clade 2-3.

159rDNA Variation in Schizophyllum commune
SAM range expansion may be of a relatively recent ori- be more frequent, or more recent, than the restricteddispersal needed to create the deep phylogenetic diver-gin. Further support for the nonequilibrium status of
S. commune populations exists in the high number of gences between the three major geographic clades. Ifthe range expansion to cosmopolitan has been ratherlong-distance dispersal events recorded in the IGS1 phy-
logeny (Figures 3 and 4). Such migrations appear to recent, then the process of population homogenization

160 T. Y. James et al.
through gene flow may yet be incomplete. Our observa- LITERATURE CITEDtions that S. commune thrives in secondary forest growth Arnheim, N., 1983 Concerted evolution of multigene families, pp.
38–61 in Evolution of Genes and Proteins, edited by M. Nei andand human-disturbed sites suggest that hypotheses con-R. K. Koehn. Sinauer Associates, Boston.sidering range expansion, and possibly intercontinental
Asgeirsdottir, S. A., F. H. J. Schuren and J. G. H. Wessels, 1994human-mediated dispersal, merit further attention. Assignment of genes to pulse-field separated chromosomes of
Schizophyllum commune. Mycol. Res. 98: 689–693.Concerted evolution of S. commune rDNA spacers:Carbone, I., J. B. Anderson and L. M. Kohn, 1999 Patterns ofThe large level of haplotype diversity at the ribosomal
descent in clonal lineages and their multilocus fingerprints arespacers appears to be entirely due to differences be- resolved with combined gene genealogies. Evolution 53: 11–21.
Cassidy, J. R., D. Moore, B. C. Lu and P. J. Pukkila, 1984 Unusualtween individuals rather than differences among theorganization and lack of recombination in the ribosomal RNAtandem repeats within an array. Because haploid strainsgenes of Coprinus cinereus. Curr. Genet. 8: 607–613.
appear fixed for a single haplotype, yet many haplotypes Cooke, W. B., 1961 The genus Schizophyllum. Mycologia 53: 575–599.Dons, J. J. M., and J. G. H. Wessels, 1980 Sequence organizationexist within populations, a strong argument is made for
of the nuclear DNA of Schizophyllum commune. Biochim. Biophys.the occurrence of intrachromosomal homogenizationActa 607: 385–396.
of elements in a single array and for a lack of recombina- Dover, G. A., 1982 Molecular drive: a cohesive mode of speciesevolution. Nature 295: 111–117.tion between the rDNA arrays of homologous chromo-
Excoffier, L., P. E. Smouse and J. M. Quattro, 1992 Analysis ofsomes at meiosis. Our failure to detect recombinantsmolecular variance inferred from metric distances among DNA
between rDNA arrays in one test cross provides addi- haplotypes: application to human mitochondrial DNA restrictiondata. Genetics 131: 479–491.tional support for recombination suppression. In addi-
Farris, J. S., 1989 The retention index and the rescaled consistencytion, the high consistency of the IGS1 phylogeny (CI 5index. Cladistics 5: 417–419.
0.790) argues against recombination events within this Felsenstein, J., 1982 How can we infer geography and history fromgene frequencies? J. Theor. Biol. 96: 9–20.region. Such events would produce haplotypes that con-
Hirst, J. M., and G. W. Hurst, 1967 Long-distance spore transport.tained nucleotides that had not coevolved and thereforeSymp. Soc. Gen. Microbiol. 17: 307–344.
the nucleotide characters would not be consistent with Hiscock, S. J., and U. Kues, 1999 Cellular and molecular mecha-nisms of sexual incompatibility in plants and fungi. Int. Rev.a single phylogeny. The suppression of recombinationCytol. 193: 165–295.within rDNA arrays in other mushroom species has been
Horak, E., 1983 Mycogeography in the South Pacific region: Aga-observed (Cassidy et al. 1984; Liou 2000), but recombi- ricales, Boletales. Austr. J. Bot. Suppl. Ser. 10: 1–41.
Ingold, C. T., 1971 Fungal Spores: Their Liberation and Dispersal. Ox-nation has been observed between arrays of the mush-ford University Press, London.room L. bicolor (Selosse et al. 1996; Martin et al. 1999).
James, T. Y., D. Porter, J. L. Hamrick and R. Vilgalys, 1999 Evi-The observation of within-rDNA array homogenization dence for limited intercontinental gene flow in the cosmopolitan
mushroom, Schizophyllum commune. Evolution 53: 1665–1677.combined with repression of homologous recombina-Liou, S.-R., 2000 Evolutionary genetics of speciation in basidiomy-tion between arrays is also reminiscent of recombination
cetes: genetic studies of reproductive isolation in Pleurotus djamor/of rDNA in Saccarhomyces cerevisiae in which meiotic cross- calyptratus complex. Ph.D. Thesis, Duke University, Durham, NC.
Martin, F., M.-A. Selosse and F. Le Tacon, 1999 The nuclearovers between sister chromatids are highly favored overrDNA intergenic spacer of the ectomycorrhizal basidiomycetenonsister exchanges (Petes and Pukkila 1995).Laccaria bicolor: structural analysis and allelic polymorphism. Mi-
Our data support the notion that the nucleotide sub- crobiology 145: 1605–1611.May, G., F. Shaw, H. Badrane and X. Vekemans, 1999 The signa-stitution rate is higher at the IGS2 region than at the
ture of balancing selection: fungal mating compatibility geneIGS1 region in S. commune, which is in turn higher thanevolution. Proc. Natl. Acad. Sci. USA 96: 9172–9177.
that for the ITS spacer region. Data from the IGS regions Moncalvo, J.-M., F. M. Lutzoni, S. A. Rehner, J. Johnson and R.Vilgalys, 2000 Phylogenetic relationships of agaric fungi basedsuggest that the process of intrachromosomal homoge-on nuclear large subunit ribosomal DNA sequences. Syst. Biol.nization of repeats on the same array occurs faster than49: 278–305.
the collective substitution rate of all the sites at IGS1. Nei, M., 1988 Molecular Evolutionary Genetics. Columbia UniversityPress, New York.In turn, nucleotide substitution occurs faster than inter-
Neigel, J. E., 1997 A comparison of alternative strategies for estimat-chromosomal homogenization can make populations ing gene flow from genetic markers. Annu. Rev. Ecol. Syst. 28:monomorphic for a single IGS1 haplotype. For the ITS 105–128.
Nicholas, K. B., and H. B. Nicholas, Jr., 1997 GeneDoc: analysisregion, the homogenization of arrays also happensand visualization of genetic variation. http://www.cris.com/faster than the substitution rate, the latter of which zKetchup/genedoc.shtml.
appears to progress almost as slowly as genetic drift and Pady, S. M., and L. Kapica, 1955 Fungi in air over the AtlanticOcean. Mycologia 47: 34–50.fixation of haplotypes within populations.
Peterson, R. H., and S. C. McCleneghan, 1997 Reports on long-We thank Robert C. Ullrich for providing the S. commune strains distance sexual compatibility in Agaricales. Nord. J. Bot. 17: 419–
432.from the collection of J. R. Raper. Thanks are also due to CathiePetes, T. D., and P. J. Pukkila, 1995 Meiotic sister chromatid recom-Aime, Omon Isikhuehmen, Karen Nakasone, David Porter, Martin
bination. Adv. Genet. 33: 41–62.Schnittler, and Sebastian Verduiin for providing additional material.Posada, D., K. A. Crandall and A. R. Templeton, 2000 GeoDis:John Wares, Stuart McDaniel, Cymon Cox, and Austen Ganley pro-
a program for the cladistic nested analysis of the geographicalvided critical comments on earlier drafts. Two anonymous reviewers distribution of genetic haplotypes. Mol. Ecol. 9: 487–488.are also thanked for suggestions to improve the manuscript. Steve Ramsfield, T. D., E. M. Becker, S. M. Rathlef, Y. Tang, T. C. VrainLeathers provided valuable laboratory assistance in sequencing efforts. et al., 1996 Geographic variation of Chondrostereum purpureumThis work was funded by a National Science Foundation Grant to detected by polymorphisms in the ribosomal DNA. Can. J. Bot.
74: 1919–1929.R.V. (DEB-9408347) and a Sigma Xi GIAR to T.J.

161rDNA Variation in Schizophyllum commune
Raper, J. R., G. S. Krongelb and M. G. Baxter, 1958 The number Templeton, A. R., E. Routman and C. A. Philips, 1995 Separatingand distribution of incompatibility factors in Schizophyllum com- population structure from population history: a cladistic analysismune. Am. Nat. 92: 221–232. of the geographical distribution of mitochondrial DNA haplo-
Rihs, J. D., A. A. Padhye and C. B. Good, 1996 Brain abscess caused types in the tiger salamander, Ambystoma tigrinum. Genetics 140:by Schizophyllum commune: an emerging basidiomycete pathogen. 767–782.J. Clin. Microbiol. 34: 1628–1632. Ullrich, R. C., 1977 Natural distribution of incompatibility factors
Rozas, J., and R. Rozas, 1997 DnaSP version 2.0: a novel software in basidiomycetous fungi. Mycologia 69: 714–719.package for extensive molecular population genetics analysis. Venkateswarlu, K., S.-W. Lee and R. N. Nazar, 1991 ConservedComput. Appl. Biosci. 13: 307–311. upstream elements in plant 5S ribosomal RNA encoding genes.
Schneider, S., J.-M. Kueffer, D. Roessli and L. Excoffier, 1997 Gene 105: 249–253.ARLEQUIN: a software for population genetic data analysis. Ver Vilgalys, R., and M. Hester, 1990 Rapid genetic identification and1.1. Genetics and Biometry Lab, Department of Anthropology, mapping of enzymatically amplified ribosomal DNA from severalUniversity of Geneva, Geneva. Cryptococcus species. J. Bacteriol. 172: 4238–4246.
Selker, E. U., E. Morzycka-Wroblewska, J. N. Stevens and R. L. Vilgalys, R., and B. L. Sun, 1994 Ancient and recent patterns ofMetzenberg, 1986 An upstream signal is required for in vitro geographic speciation in the oyster mushroom Pleurotus revealedtranscription of Neurospora 5S RNA genes. Mol. Gen. Genet. 205: by phylogenetic analysis of ribosomal DNA sequences. Proc. Natl.189–192.
Acad. Sci. USA 91: 4599–4603.Selosse, M.-A., G. Costa, C. Di Battista, F. L. Tacon and F. Martin,White, T. J., T. D. Bruns, S. B. Lee and J. W. Taylor, 1990 Amplifi-1996 Meiotic segregation and recombination of the intergenic
cation and direct sequencing of fungal ribosomal RNA genes forspacer of the ribosomal DNA in the ectomycorrhizal basidiomy-phylogenetics, pp. 315–321 in PCR Protocols: A Guide to Methodscete Laccaria bicolor. Curr. Genet. 30: 332–337.and Applications, edited by M. A. Innis, D. H. Gelfand, J. J.Singh, R. S., and L. R. Rhomberg, 1987 A comprehensive study ofSninsky and T. J. White. Academic Press, New York.genic variation in natural populations of Drosophila melanogaster.
Whitehouse, H. L. K., 1949 Multiple-allelomorph heterothallismII. Estimates of heterozygosity and patterns of geographic differ-in the fungi. New Phytol. 48: 212–244.entiation. Genetics 117: 255–271.
Wright, S., 1939 The distribution of self-sterility alleles in popula-Swofford, D. L., 1993 PAUP: Phylogenetic Analysis Using Parsimony.tions. Genetics 24: 538–552.3.1.1. User’s manual. Smithsonian Institution, Washington, DC.
Wright, S., 1951 The genetical structure of populations. Ann. Eu-Swofford, D. L., 1998 PAUP*. Phylogenetic Analysis Using Parsimonygen. 15: 323–354.(*and Other Methods). Version 4. Sinauer Associates, Sunderland,
Zambino, P., J. V. Groth, L. Lukens, J. R. Garton and G. May,MA.1997 Variation at the b mating type locus of Ustilago maydis.Templeton, A. R., 1998 Nested clade analysis of phylogeographic
data: testing hypotheses about gene flow and population history. Phytopathology 87: 1233–1239.Mol. Ecol. 7: 381–397. Zolan, M. E., and P. J. Pukkila, 1986 Inheritance of DNA methyla-
Templeton, A. R., K. A. Crandall and C. F. Sing, 1992 A cladistic tion in Coprinus cinereus. Mol. Cell. Biol. 6: 195–200.analysis of phenotypic associations with haplotypes inferred from
Communicating editor: S. Yokoyamarestriction endonuclease mapping and DNA sequence data. III.Cladogram estimation. Genetics 132: 619–633.