W kierunku nowoczesnej polityki energeytcznej (Towards modern energy policy)
Upload
khangminh22Category
view
0download
0
ZESZYTY NAUKOWE
Szkoły Głównej Gospodarstwa Wiejskiego w Warszawie
SCIENTIFIC JOURNALS
Warsaw University of Life Sciences – SGGW
POLITYKI EUROPEJSKIE, FINANSE i MARKETING
NR 22 (71) 2019
EUROPEAN POLICIES, FINANCE AND MARKETING
NO 22 (71) 2019
Wydawnictwo SGGW
Warszawa 2019
Warsaw University of Life Sciences – SGGW Press Warsaw 2019

RADA PROGRAMOWA Bogdan Klepacki (SGGW), prof. dr hab. – Szkoła Główna Gospodarstwa Wiejskiego w Warszawie – przewodniczący, Polska Mieczysław Adamowicz, prof. dr hab. – Państwowa Szkoła Wyższa im. Papieża Jana Pawła II w Białej Podlaskiej, Polska Marian Podstawka, prof. dr hab. -Szkoła Główna Gospodarstwa Wiejskiego w Warszawie, Polska Janusz Żmija, prof. dr hab. dr h.c. -Uniwersytet Rolniczy w Krakowie, Polska Andrzej P. Wiatrak, prof. dr hab. – Uniwersytet Warszawski, Polska Lubica Bartova , prof. – Slovak Agricultural University In Nitra, Słowacja Julian Briz, prof.- Universidad Politecnica de Madrid, Hiszpania Alina Hyz, prof, University of West Attica, Grecja Francęsco.Sotte, prof. – Universita Politecnica delle Marche Ancona, Włochy Harun Uçak, prof, Alanya Alaaddin Keykubat University, Turcja Sandra Krtalic, Full Profesor – Academic Unit for Finance, Departament of Economics and Tourism, Juraj Dobrila University of Pula, Chorwacja KOMITET REDAKCYJNY Marian Podstawka, prof. dr hab. – Redaktor Naczelny Agnieszka Parlińska, dr inż. – Zastępca Redaktora Naczelnego, Janina Sawicka, prof. dr hab. Agnieszka Biernat-Jarka, dr Marzena Lemanowicz, dr, redaktor tematyczny (marketing) Halina Powęska, dr hab. Eugeniusz Pudełkiewicz, prof. SGGW dr hab. Aleksandra Wicka, dr inż. – redaktor tematyczny (ubezpieczenia) Marzena Ganc, dr – redaktor tematyczny (finanse) Agata Cienkusz, mgr – redaktor językowy, język polski Jacqueline Leszczynska, mgr – redaktor językowy, język angielski Wiesław Szczesny – prof. SGGW dr hab., redaktor statystyczny Tomasz Jaroszewski, mgr – sekretarz redakcji PROJEKT OKŁADKI – Tomasz Tabor REDAKCJA TECHNICZNA – Krystyna Piotrowska ADRES KORESPONDENCYJNY Szkoła Głowna Gospodarstwa Wiejskiego w Warszawie Instytut Ekonomii i Finansów Katedra Finansów ul. Nowoursynowska 166, 02-787 Warszawa tel./fax: 22 593 40 77; e-mail: [email protected] ISSN 2081-3430 Wydawnictwo SGGW ul. Nowoursynowska 166, 02-787 Warszawa tel. (22) 593 55 20 (-22, -25 – sprzedaż) e-mail: [email protected], www.wydawnictwosggw.pl Druk: ZAPOL sp.j., al. Piastów 42, 71-062 Szczecin

SPIS TREŚCI Lista Recenzentów ............................................................................................................. 5 Grażyna Ancyparowicz Programy Interwencyjne w Polityce Pieniężnej Eurosystemu INTERVENTION PROGRAMS IN THE MONETARY POLICY OF THE EUROSYSTEM ................................................................................................................... 7 Agnieszka Biernat-Jarka ASSESSMENT OF GREENING IN THE CONTEXT OF PROVIDING ENVIRONMENTAL PUBLIC GOODS IN AGRICULTURE ......................................... 18 Grzegorz Biesok, Jolanta Wyród-Wróbel PROACTIVE PURCHASE BEHAVIOUR AND THEIR RELATIONS IN SIMPLE SATISFACTION MODEL ................................................................................................ 28 Joanna Błach, Monika Wieczorek-Kosmala Przesłanki działań odpowiedzialnych społecznie w kontekście czynników kreacji wartości przedsiębiorstwa: wyniki badań MOTIVES FOR SOCIALLY RESPONSIBLE ACTIVITIES IN THE CONTEXT OF VALUE CREATION FACTORS: RESEARCH RESULTS ....................................... 38 Tomasz J. Dąbrowski Wykorzystanie stron internetowych w komunikowaniu polityki społecznej odpowiedzialności przez spółki publiczne notowane na GPW w Warszawie THE ROLE OF WEBSITES IN COMMUNICATING CSR POLICY BY PUBLIC COMPANIES LISTED ON THE WARSAW STOCK EXCHANGE .............................. 50 Piotr Hadrian PRACTICAL CONSIDERATIONS FOR THE IMPLEMENTATION OF MARKETING AUDIT AS STRATEGIC CONTROL ............................................... 65 Sylwester Kozak, Agata Wierzbowska BANK EFFICIENCY AND CONCENTRATION OF THE BANKING SECTOR IN THE CEE COUNTRIES ............................................................................................... 77 Wioletta Krawiec MOTIVATING AND DEMOTIVATING FACTORS FOR MANAGERS OF CULTURAL INSTITUTIONS IN THE AREA OF BRANDING OF THE LODZ CITY - RESEARCH RESULTS .................................................................................................. 90 Barbara Kucharska, Mirosława Malinowska TRENDS IN Y GENERATION’S BEHAVIOUR ON THE FOOD MARKET ............. 106

Iwona Lupa-Wójcik STUDENT ATTITUDES TOWARD THE USE OF CHATBOTS IN CUSTOMER SERVICE ......................................................................................................................... 120 Grzegorz Maciejewski, Sylwia Mokrysz NEW TRENDS IN CONSUMPTION ON THE COFFEE MARKET ............................ 132 Anna Owczarczyk IMPACT OF PENSION SYSTEM REFORMS ON PUBLIC FINANCE EXPENDITURES IN POLAND ..................................................................................... 145 Iwona Pomianek CLASSIFICATION OF BORDER SUBREGIONS OF EASTERN POLAND ACCORDING TO THEIR LEVEL OF SOCIO-ECONOMIC DEVELOPMENT ......... 156 Adrian Sadłowski Skutki stosowania płatności redystrybucyjnej w zależności od wariantu wdrożeniowego na przykładzie Polski THE CONSEQUENCES OF USING DIFFERENT VARIANTS OF IMPLEMENTATION OF REDISTRIBUTIVE PAYMENT – A CASE STUDY OF POLAND ................................................................................................................... 170 Bogdan Sojkin, Magdalena Ankiel PURCHASE DETERMINANTS OF DURABLE GOODS FOR RESIDENTS OF LARGE CITIES IN POLAND .................................................................................. 184 Jacek Strojny, Wiesław Musiał Obszary wiejskie w systemie ekonomiczno-społecznym państw Unii Europejskiej RURAL AREAS IN THE SOCIO-ECONOMIC SYSTEM OF EU COUNTRIES ....................................................................................................... 193 Cezary Szydłowski Rola audytu wewnętrznego w ocenie wydatków samorządów miejskich THE ROLE OF INTERNAL AUDIT IN THE EVALUATION OF URBAN LOCAL GOVERNMENT EXPENDITURES ............................................................................... 210 Natalia Wasilewska, Tatiana Bludova, Volodymyr Tokar, Oleksiy Kudenko EVALUATION OF TARGET MARKET SEGMENTS FOR ENTERPRISES .............. 223 Robert Wolny THE DEVELOPMENT OF PROSUMPTION ON THE POLISH E-SERVICES MARKET ......................................................................................................................... 238 Joanna Wyrobek, Paul Lane IMPACT OF INTERNATIONALIZATION ON THE CAPITAL STRUCTURE OF COMMERCIAL COMPANIES ................................................................................ 250

Lista Recenzentów (nr 21 i 22) Dr hab. Agata Adamaska Dr Marcin Awdziej Dr hab. Bogusława Bek-Gaik Dr hab. Agnieszka Bitkowska Dr hab. Piotr Bórawski - prof. UWM Dr hab. Justyna Franc Dąbrowska - prof. SGGW Dr.oec., Prof. Nadiia Davydenko Dr Agnieszka Deresz Prof. dr hab. Danuta Dziawgo Prof. dr hab. Leszek Dziawgo Dr hab. Sławomir Franek - prof. US Prof. Iryna Golyash Prof. dr hab. Wojciech Grzegorczyk Dr hab. Rafał Haffer - prof. UMK Dr hab. inż. Magdalena Jaciow Dr hab. Sebastian Jarzębowski Prof. dr hab. Sławomir Juszczyk Dr hab. Zbigniew Korzeb - prof. PB Dr Dorota Kozioł-Kaczorek Dr hab. Witold Kowal - prof. UE Dr hab. inż. Piotr Kułyk Dr hab. Wiesława Lizińska - prof. UWM Prof. dr hab. Elżbieta Mączyńska Dr hab. Anna Matuszczak - prof. UEP Dr hab. Ewa Miklaszewska Prof. dr hab. inż. Wiesław Musiał Dr hab. Maria Parlińska - prof. UTH Dr Joanna Petrykowska Dr hab. Marta Postuła Dr hab. Renata Przygodzka - prof. UwB Dr Grażyna Rembielak Dr hab. Edyta Rudawska - prof. US Dr Volodymyr Rudyk Prof. Baiba Rivza Prof. Jelena Salkovska dr.oec. Dr hab. inż. Alicja Sekuła Dr hab. Piotr Senkus - prof. UPH Prof. dr hab. Elżbieta Skrzypek Dr inż. Iwona Staniec Dr hab. Magdalena Stefańska - prof. UEP Dr Bartłomiej Suchodolski Prof. dr hab. Jan Szambelańczyk Dr inż. Stanisław Szarek Dr Teresa Szot - Gabryś Dr Anna Świrska Dr.oec., Prof. Tatjana Tambovceva
Dr Yilmaz Toktaş Dr hab. Renata Tomaszewska - prof. UKW Dr Monika Wakuła Dr Damian Walczak Dr hab. Mirosław Wasilewski - prof. SGGW Dr Wioletta Wereda Dr hab. Tomasz Zalega - prof. UW Prof. dr hab. Małgorzata Zaleska Dr Oksana Zamora Dr hab. Magdalena Zioło - prof. US Dr hab. inż. Dagmara Zuzek Asist. Prof. Dr Hasan Bilgehan Yavuz


7
22 (71) 2019 DOI 10.22630/PEFIM.2019.22.71.21
Grażyna Ancyparowicz Narodowy Bank Polski, Rada Polityki Pieniężnej Górnośląska Wyższa Szkoła Handlowa
Programy Interwencyjne w Polityce Pieniężnej Eurosystemu
INTERVENTION PROGRAMS IN THE MONETARY
POLICY OF THE EUROSYSTEM
Niniejszy artykuł przedstawia uwarunkowania prawne i przesłanki tzw. luzowania ilościowego (quantitative easing, QE) w polityce pieniężnej Eurosystemu. Omówiono główne programy interwencyjnych zakupów dłużnych papierów wartościowych, wzmiankując związane z tymi programami ryzyka dla stabilności systemu finansowego, które mogą zmaterializować się w dalszej perspektywie. Podkreślono potrzebę stałego monitorowania niestandardowych instrumentów finansowych stosowanych w krajach Eurolandu, tak aby polskie centralne instytucje finansowe rozporządzały pełnym instrumentarium przeciwdziałania niekorzystnym zjawiskom w sferze krajowych finansów i gospodarki, które mogłyby zaistnieć i u nas w sytuacji kryzysowej o globalnym zasięgu. W badaniu zastosowano metodę analizy dokumentów Europejskiego Banku Centralnego (EBC) oraz wewnętrznych materiałów NBP dotyczących niestandardowych instrumentów polityki pieniężnej.
Słowa kluczowe: bank centralny, luzowanie ilościowe, duży program skupu aktywów JEL Codes: G01, G21, G28, H12
Wstęp Tradycyjnie rozumiana polityka pieniężna polega na sygnalizowaniu pożądanej wysokości stopy procentowej i dostosowaniu bazy monetarnej do poziomu odpowiadającego tej wysokości. Banki centralne, w ramach przyjętej przez siebie strategii, pełnią misję stabilizacji siły nabywczej emitowanej przez siebie waluty, korzystając z szerokiego wachlarza instrumentów. Do bieżącego sterowania rynkiem międzybankowym służą zmiany krótkoterminowych stóp procentowych oraz podstawowe operacje otwartego rynku (rzadziej – operacje sterylizujące). Jednak tradycyjne strategie oraz instrumenty stabilizacji systemu finansowego zawiodły, gdy upadek wielkiego banku inwestycyjnego Lehman Brothers (15 września 2008 r.) podważył zaufanie do instytucji rynku finansowego. W odpowiedzi na drastyczne ograniczenie akcji kredytowej (credit crunch), Europejski Bank Centralny (podobnie jak wcześniej Bank Japonii, Bank Anglii oraz FED) podjął działania zwiększające ekspansywność polityki pieniężnej, stosując zarówno klasyczne jak i niestandardowe instrumenty polityki pieniężnej.
W obliczu narastającego ryzyka znacznego spowolnienia wzrostu gospodarczego na świecie i długotrwałego utrzymywania się inflacji poniżej celu uważanego za pożądany dla podtrzymania koniunktury (2% r/r), polityka zasilania przez bank

8
centralny realnej sfery gospodarki narodowej przybrała charakter interwencyjny, a po uspokojeniu sytuacji na rynkach finansowych – antycykliczny. Po tym, jak wyczerpały się klasyczne narzędzia banku centralnego (bo podstawowe stopy procentowe osiągnęły wartość zerową lub ujemną), zastosowano instrumenty bezpośrednio zasilające w płynność rynek papierów dłużnych, a pośrednio – realną sferę gospodarki (Dudkiewicz B., 2016; Grosnal i in., 2016; Ancyparowicz, 2017, s. 11-20).
Celem niniejszego artykułu jest charakterystyka głównych instrumentów, które złożyły się na politykę luzowania ilościowego (quantitative easing – QE) realizowaną w Eurosystemie w latach 2012-2018. Tego rodzaju instrumenty polityki finansowej najwcześniej zastosowano w Japonii, potem w USA, a następnie w Unii Europejskiej, aby zwalczyć skutki kryzysu finansowego 2007-2009. Chociaż instrumenty te okazały się niezwykle pomocne w walce o zachowanie stabilności globalnego systemu finansowego i skutecznie pobudziły aktywność gospodarki w dobie pokryzysowej, ich efektywność stopniowo maleje; są to bowiem środki doraźne i nie zastąpią one koniecznej reformy globalnego systemu finansowego.
Doświadczenia krajów Eurolandu mogą być ważną przesłanką modyfikacji polityki pieniężnej w Polsce, gdyby kiedykolwiek wystąpiła potrzeba interwencji polskiego banku centralnego przy użyciu niestandardowych narzędzi polityki finansowej1. Również prywatne instytucje sektora finansowego, a także korporacje działające w sferze gospodarki realnej, powiązane z rynkami finansowymi poprzez kredyty czy emisje obligacji korporacyjnych, powinny być na bieżąco informowane o nowych, niestandardowych rozwiązaniach, koncepcjach i trendach na głównych rynkach finansowych współczesnego świata. Temu służy komunikacja z rynkiem, działalność wydawnicza i edukacyjna NBP.
Skup obligacji skarbowych w Eurosystemie Traktat o funkcjonowaniu Unii Europejskiej w art. 123 stanowi: Zakazane jest udzielanie przez Europejski Bank Centralny lub banki centralne Państw Członkowskich, zwane dalej „krajowymi bankami centralnymi”, pożyczek na pokrycie deficytu lub jakichkolwiek innych kredytów instytucjom, organom lub jednostkom organizacyjnym Unii, rządom centralnym, władzom regionalnym, lokalnym lub innym władzom publicznym, innym instytucjom lub przedsiębiorstwom publicznym Państw Członkowskich, jak również nabywanie bezpośrednio od nich przez Europejski Bank Centralny lub krajowe banki centralne ich papierów dłużnych. Regulacja ta została również ujęta w art. 21 Statutu ESBC/EBC. Tym niemniej, art. 18 ust. 1., tego Statutu określa sytuacje, w których norma ta nie obowiązuje: aby osiągnąć cele ESBC i wykonywać swe zadania, EBC i krajowe banki centralne mogą dokonywać operacji na rynkach finansowych w formie kupna i sprzedaży bezwarunkowej (outright).
————— 1 W Polsce występuje wysoka nadpłynność systemu bankowego, wywołana głównie silnym strumieniem napływu środków pomocowych z Unii Europejskiej. W tej sytuacji nie wystąpiła dotychczas potrzeba podjęcia przez Narodowy Bank Centralny działań antykryzysowych o charakterze antycyklicznym, polegających na bezpośrednim zasilaniu w płynność krajowego rynku bankowego i pobudzaniu akcji kredytowej na rzecz sektora niefinansowego. Jednak, zgodnie z założeniami polityki pieniężnej, NBP może w określonych warunkach przeprowadzić emisję obligacji, zakup oraz sprzedaż papierów wartościowych na rynku wtórnym, włącznie z zakupem lub sprzedażą obligacji korporacyjnych (NBP, 2018, s. 8).

9
Spośród dotychczas wykorzystywanych antycyklicznych instrumentów polityki pieniężnej, zastosowanych w reakcji na kryzys przez Europejski System Banków Centralnych (ESBC) można wymienić: zerowe i ujemne stopy procentowe, skup obligacji skarbowych oraz zakupy (spełniających wysokie kryteria bezpieczeństwa) obligacji korporacyjnych. Transakcje te przeprowadzane były początkowo wyłącznie na rynku wtórnym, ale później także na rynku pierwotnym przez banki centralne Eurosystemu (tabela 1). Każdy z interwencyjnych programów skupu instrumentów finansowych zasilał w płynność realną sferę gospodarki, choć czynił to w charakterystyczny dla siebie sposób.
Tabela 1. Uwarunkowania makroekonomiczne w momencie wprowadzenia skupu obligacji skarbowych przez EBC i inne wybrane banki centralne
Wyszczególnienie Japonia Wielka Brytania
Stany Zjednoczone Strefa euro Szwecja
Data ogłoszenia skupu obligacji skarbowych
2008-12-19 2009-03-05 2009-03-18 2015-01-22 2015-02-12
Referencyjna stopa procentowa banku centralnego
0,10 0,50 0,00-0,25 0,05 -0,10
Dynamika PKB (realny przyrost w stosunku do poprzedniego roku, w %)
-3,7 -5,9 -3,5 1,8 3,6
Inflacja (zmiany cen w stosunku do roku poprzedniego, w %)
0,4 2,9 -0,4 -0,6 0,1
Źródło: Niestandardowe działania w zakresie polityki pieniężnej stosowane przez wybrane banki centralne, materiały wewnętrzne NBP, Warszawa, 2018.
Strategia Eurosystemu w reakcji na kryzys i uporczywą recesję w krajach Eurolandu
była realizowana w dwu etapach. Pierwszy etap rozpoczął się 9 października 2008 r., a zamknął komunikatem po posiedzeniu Rady Prezesów 4 czerwca 2014 r.; drugi etap został zainicjowany kilka tygodni później i trwał do końca 2018 r. Działalność EBC prowadzona w latach 2008-2014 była zorientowana przede wszystkim na zwiększenie płynności w systemie bankowym i stosowanie instrumentów motywujących banki do zwiększenia akcji kredytowej (Enhanced Credit Support Programme). W tym okresie, w ramach pomocy dla najbardziej dotkniętych kryzysem krajów strefy euro, prowadzono na rynku wtórnym zakupy zabezpieczonych obligacji rządowych (CBPP3) i skup papierów wartościowych zabezpieczonych aktywami (ABSPP). W szczególności, z dniem 10 maja 2010 r. wdrożono program Security Market Purchase (SMP), który doprowadził to tak silnego wzrostu płynności w Eurosystemie, że EBC musiał uciec się do operacji sterylizujących2. Z dniem 6 września 2012 r. ruszył program – Outright Monetary Trasactions (OMT), formalnie realizowany do lipca 2014 r., który okazał się zbyt restrykcyjny, aby (pomimo znacznej
————— 2 Ten wzrost płynności utrzymywał się w następnych latach i był związany głównie z nabywaniem papierów wartościowych w ramach program skupu aktywów sektora publicznego (PSPP). Na dzień 13 lipca 2018 r. wartość obligacji skupionych w ramach SMP wyniosła 82 882 mln EUR (NBP, 2018a, s. 81-82).
10
obniżki rentowności skarbowych papierów wartościowych) mógł stymulować akcję kredytową. Rok wcześniej, EBC sięgnął po inne niestandardowe narzędzie określane mianem forward guidance, kiedy to oficjalnie zobowiązał się do utrzymywania przez dłuższy czas stóp procentowych na rekordowo niskim poziomie (EBC, 2017, s. A 4 – A 6).
Działaniami uzupełniającymi w stosunku do interwencyjnego skupu papierów rządowych przez banki centralne stały się programy czasowego pożyczania aktywów (securities lending), które służyły poprawie płynności wybranych segmentów rynku papierów wartościowych. Prekursorem tej formy interwencji na rynku finansowym był FED, który operacje o tym charakterze prowadził już w latach 60. ubiegłego wieku. Doświadczenia z tego okresu wykorzystał później dla odbudowy zaufania do rynku finansowego po kryzysie subprime, tym skuteczniej, że już wcześniej prowadził politykę pieniężną opartą na przeprowadzaniu transakcji bezwarunkowego kupna aktywów z wykorzystaniem papierów emitowanych przez rząd federalny. Operacje pożyczania aktywów (securities lending) prowadzone są również przez ESBC, z zasady w formie przetargów, a polegają one na wymianie na termin O/N wybranych papierów wartościowych (m.in. bonów, obligacji oraz papierów wartościowych indeksowanych do wskaźnika inflacji).
W warunkach uporczywie niskiej inflacji EBC dążył do wywołania efektu synergicznego w wyniku współdziałania polityki monetarnej, fiskalnej i strukturalnej. W szczególności, możliwość interwencyjnych zakupów dużych pakietów obligacji skarbowych przez bank centralny ułatwiała zarządzanie finansami państwa, bowiem można było w ten sposób zwiększać popyt na rządowe papiery wartościowe, co obniżało rentowność tych walorów i w efekcie prowadziło do stopniowego obniżania kosztów obsługi długu publicznego. Tym samym zwiększała się zdolność ministra finansów do pozyskania efektywnego kosztowo, rynkowego finansowania bieżącego deficytu budżetowego i obniżenia kosztów spłaty wymagalnych zobowiązań.
Banki sprzedające EBC skarbowe papiery wartościowe mogły wykorzystać wykreowany w ten sposób pieniądz do nabywania innych aktywów finansowych, a także do rozszerzenia akcji kredytowej na rzecz realnej sfery gospodarki. Ta polityka niesie jednak ryzyko, jeżeli bowiem skala skupu przez bank centralny obligacji emitowanych przez ministra finansów przybiera zbyt duże rozmiary, to w końcu zniechęca inwestorów, obniżając popyt na skarbowe papiery wartościowe. Dlatego też EBC, kontynuując interwencyjny skup obligacji rządowych, w 2016 r. sięgnął również po inne niestandardowe instrumenty polityki pieniężnej3.
Skup obligacji komercyjnych przez banki Eurosystemu Na początku 2014 r. dynamika kurczenia się akcji kredytowej w krajach strefy euro zaczęła przekraczać 2% miesięcznie, bowiem lokowanie środków w bankach centralnych spowodowało, iż nadpłynność w sektorze bankowym została zredukowana
————— 3 W grudniu 2018 r. Europejski Bank Centralny kończył swój program zakupu aktywów, a amerykańska Rezerwa Federalna kontynuowała cykl podnoszenia stóp procentowych, jednocześnie zmniejszając swój bilans. Wielu obserwatorom wydawało się wówczas, że rok 2019 upłynie pod znakiem dalszego zacieśniania polityki pieniężnej na świecie, ale w obliczu spowolnienia dynamiki PKB i groźby recesji, od listopada 2019 r. EBC powrócił na ścieżkę luzowania monetarnego. W ślad za nimi politykę pieniężną złagodziło także wiele innych banków centralnych na świecie.

11
w ciągu dwu lat dziesięciokrotnie (do 80 mld EUR), a kurs EUR/USD zbliżył się do rekordowo wysokiego poziomu (1,40). W związku z tym EBC od lipca 2014 r. zaniechał operacji sterylizujących, wprowadził ujemną stopę procentową od środków utrzymywanych przez banki na rachunku bieżącym banku centralnego oraz w depozycie, a także uruchomił pożyczki (targeted longer-term refinancing operations – TLTRO) zaprojektowane w taki sposób, aby stanowiły one bodziec do zwiększenia akcji kredytowej dla sektora niefinansowego.
W komunikacie z 21 kwietnia 2016 r. Rada EBC określiła kryteria kwalifikowalności aktywów będących przedmiotem skupu w ramach Corporate Sector Purchase Programme – CSPP (Guideline EU 2015/510) oraz poinformowała, że skupione obligacje korporacyjne będą oferowane w ramach programu securities lending4. W dniu 1 czerwca 2016 r. zapadła Decyzja (EBC/2016/26) w sprawie uruchomienia programu zakupu komercyjnych papierów wartościowych posiadających rating kredytowy (również na rynku pierwotnym, z wyłączeniem obligacji emitowanych przez podmioty zaliczane do sektora publicznego)5. Decyzję tę poprzedziło następujące oświadczenie: chociaż EBC podziela pogląd, że świadomość problemów związanych ze środowiskiem, wraz z zachowaniem etycznym i społecznie odpowiedzialnym, jest ważna dla społeczeństwa, to jednak decydenci polityczni (w pierwszym rzędzie) muszą uzgodnić, zdefiniować i promować odpowiednie polityki i środki. Nie jest jednak możliwe umieszczenie ich w programie skupu aktywów na dużą skalę, który jest realizowany jako tymczasowy środek polityki pieniężnej w stosunkowo krótkim czasie, [bowiem] ograniczyłoby to skuteczność APP w jej wkładzie w wypełnianie mandatu EBC w zakresie utrzymania stabilności cen (EBC, 2017a).
Tydzień później program skupu obligacji korporacyjnych wszedł w fazę realizacji, za pośrednictwem banków spełniających kryteria kwalifikacji Eurosystemu (tablica 2).
Tablica 2. Banki centralne Eurosystemu uczestniczące w CSPP
Krajowy bank centralny Kraj pochodzenie skupowanej obligacji korporacyjnej
Banque Nationale de Belgique Belgia, Cypr, Grecja, Holandia, Luksemburg, Malta, Portugalia, Słowacja, Słowenia
Deutsche Bundesbank Niemcy, Holandia Banco de Espana Hiszpania, Holandia Suomen Pankki Austria, Estonia, Finlandia, Irlandia, Litwa, Łotwa Banque de France Francja Banco d’Italia Holandia, Włochy Źródło: NBP, 2018 s. 89.
————— 4 Warto przypomnieć, że papiery emitowane przez sektor prywatny (głównie obligacje) zostały włączone do katalogu instrumentów polityki pieniężnej w strefie euro na podstawie art. 2 ust. 2 Decyzji Rady Prezesów EBC nr 415/98 z 29 czerwca 1998 r. w sprawie konsultacji Europejskiego Banku Centralnego udzielanych władzom krajowym w sprawie projektów przepisów prawnych (98/415/WE). 5 Rada Prezesów EBC już wcześniej wyróżniła takie kryteria oceny emitenta i jego papierów dłużnych jak: okres pozostający do zapadalności obligacji w momencie skupu od 6 miesięcy do 30 lat i 364 dni, waluta emisji – EUR, , miejsce emisji obligacji – kraje strefy euro oraz rating kredytowy przyznany przynajmniej przez jedną agencję ratingową na poziomie inwestycyjnym. Warto odnotować, że rating kredytowy na poziomie inwestycyjnym odnosi się do emitenta/instrumentów dłużnych; według Fitch Ratings oraz S&P poziom inwestycyjny określany jest w skali od AAA do BBB- (lub odpowiedniej w przypadku innej agencji ratingowej).

12
Skup obligacji korporacyjnych może być realizowany przy wykorzystaniu platformy elektronicznej lub bezpośrednio w kontakcie banku centralnego z kontrahentem, a jego beneficjentami są – co do zasady – przedsiębiorstwa nie korzystające z finansowania na rynku kapitałowym. Przyjęto bowiem założenie, że tendencje występujące na rynkach kapitałowych mają przełożenie (spillover) także na to, co się dzieje na rynkach kredytowych6. Ocena efektywności programu skupu komercyjnych papierów wartościowych dokonywana jest przez EBC na podstawie następujących kryteriów: wpływu na koszty finansowania korporacji, wpływu na emisję nowych obligacji korporacyjnych oraz wpływu na strukturę kapitałową emitenta i korporacji nie objętych programem (EBC, 2018).
Tabela 3. Struktura zakupionych przez Eurosystem obligacji korporacyjnych
Wyszczególnienie Obligacje spełniające kryteria CSPP
Obligacje skupione w ramach CSPP
Rating AA 13% 11% Rating A 44% 43%
Rating BBB 43% 46% Kraj/region
Francja 31% 30% Niemcy 25% 25% Włochy 12% 12%
Hiszpania 9% 10% Holandia 5% 6%
Belgia 5% 5% Szwajcaria 3% 4%
Inne kraje Eurolandu 6% 6% Kraje spoza strefy euro 4% 3%
Sektor gospodarki Działalność usługowa 17% 15%
Infrastruktura i transport 13% 11% Przemysł samochodowy 10% 9%
Telekomunikacja 8% 9% Energia 7% 6%
Nieruchomości 7% 6% Budownictwo 5% 6%
Napoje 4% 6% Technologia 5% 5%
Przemysł medyczny 5% 5% Chemia 4% 5% Żywność 3% 4%
Ubezpieczenia 3% 3% Pozostałe sektory 9% 9%
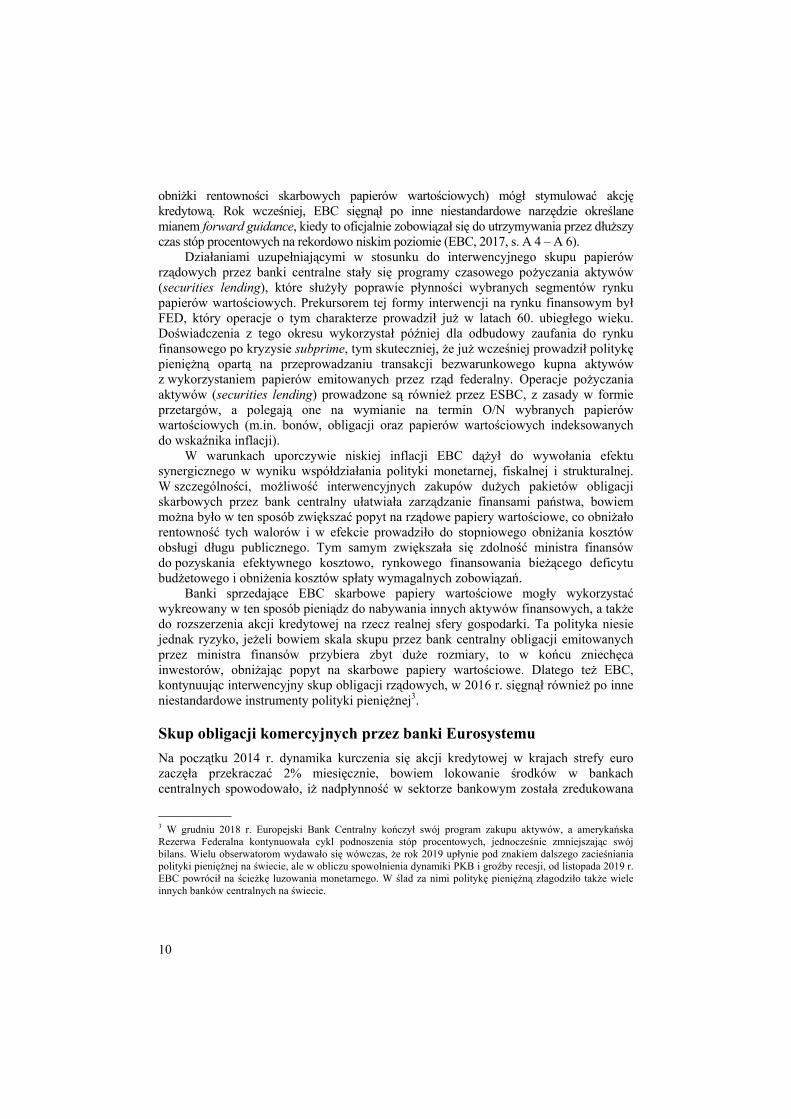
Źródło: NBP, 2018, s. 95-96. Do 31 grudnia 2017 r. nominowane w EUR papiery wartościowe nabyte w ramach
wszystkich programów interwencyjnych osiągnęły wartość 228,4 mld EUR i stanowiły 55% aktywów ogółem EBC (wykres 1). Według publikowanych danych, dostępnych
————— 6 Luzowanie ilościowe realizowane w ramach polityki pieniężnej banku centralnego nie zwiększa majątku banków komercyjnych, a jedynie zmienia strukturę ich bilansu, zwiększając w nim udział aktywów płynnych (Bernanke, 2016).
13
w momencie pisania niniejszego artykułu, do 6 lipca 2018 r. Eurosystem nabył (łącznie) obligacje korporacyjne o różnych terminach zapadalności, pochodzące ze 1154 różnych emisji (zagregowane informacje o ilościowej strukturze tego portfela zawiera tabela 3). W ujęciu ilościowym, ponad połowa tego portfela przypadała na 46 spółek. Najwięcej, bo aż 30 skupionych serii obligacji korporacyjnych było wyemitowanych przez niemiecki koncern Daimler, na drugim miejscu wystąpiło francusko-holenderskie przedsiębiorstwo Unibail-Rodamco działające na rynku nieruchomości komercyjnych, natomiast firmy o charakterze strategicznym (na przykład Airbus Group Finance B. V.) zajmowały w tej statystyce odległe pozycje (choć z nieoficjalnych doniesień prasowych wiadomo, że w ujęciu wartościowym były to transakcje na wielką skalę). Wystąpiły również przypadki nagłej sprzedaży korporacyjnych obligacji, które wcześniej nabył Eurosystem. Przykładem są tu m.in. obligacje wyemitowane przez brytyjski koncern Glencore, południowo-afrykański oddział koncernu Steinhoff Europe AG, a także obligacje firm nie spełniające warunków programu (NBP, 2018, s. 92-96).
Wykres 1. Aktywa EBC, stan na 31. grudnia 2017, w mld EUR Źródło: EBC, 2017, s. 5 A
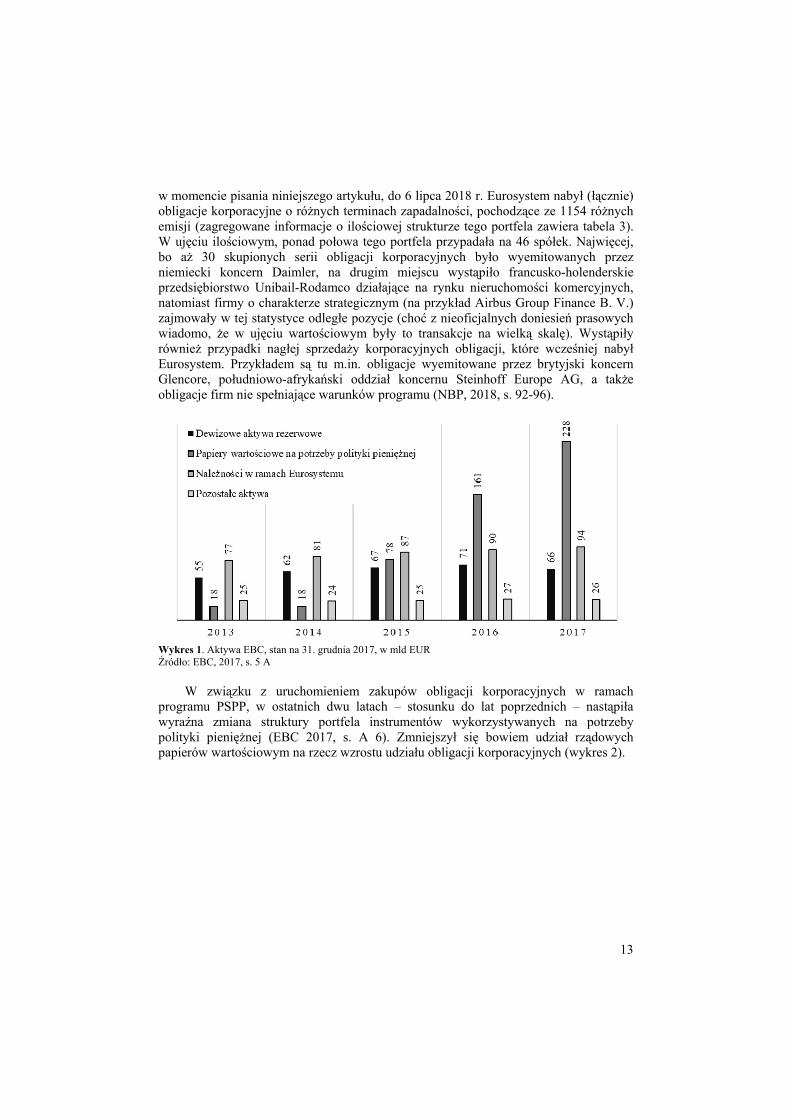
W związku z uruchomieniem zakupów obligacji korporacyjnych w ramach
programu PSPP, w ostatnich dwu latach – stosunku do lat poprzednich – nastąpiła wyraźna zmiana struktury portfela instrumentów wykorzystywanych na potrzeby polityki pieniężnej (EBC 2017, s. A 6). Zmniejszył się bowiem udział rządowych papierów wartościowym na rzecz wzrostu udziału obligacji korporacyjnych (wykres 2).

14
Wykres 2. Papiery wartościowe w portfelu EBC utrzymywane na potrzeby polityki pieniężnej, w mld EUR Źródło:, EBC, 2017, s A 6.
EBC dokonując ewaluacji polityki pieniężnej pozytywnie ocenił ten program,
akcentując istotne zmniejszenie spreadów między rynkiem terminowym a kasowym, a także pozytywne tendencje w innych obszarach rynku finansowego. Zwiększenie emisji obligacji korporacyjnych (przede wszystkim we Francji i Holandii) wywołało przesunięcie w strukturze finansowania działalności przedsiębiorstw niefinansowych, polegające na relatywnym spadku udziału kredytów zaciąganych w bankach komercyjnych przez firmy działające w sferze gospodarki realnej. Dokonało się to, nie tyle ze względu na ograniczenia akcji kredytowej przez sektor bankowy, ile z uwagi na wzrost emisji własnych obligacji przedsiębiorstw ważnych dla gospodarki danego kraju, a także gospodarki całej Unii Europejskiej. Zaobserwowano także, iż wzrost zaangażowania rynku kapitałowego w finansowanie działalności wielkich korporacji, zachęca banki komercyjne do finansowania małych i średnich przedsiębiorstw, co przejawia się ułatwieniami dostępu do kredytów dla tej grupy klientów (EBC, 2018).
Rada Prezesów EBC nie określiła docelowej wartości wolumenu zakupów, a jedynie w komunikacie z dnia 26 października 2017 r. powiadomiła, że skup komercyjnych papierów dłużnych będzie prowadzony przynajmniej do końca września 2018 r. Termin ten właśnie mijał, gdy Rada Prezesów EBC oświadczyła, że „będzie kontynuować zakupy netto w ramach programu skupu aktywów (APP) na nowym poziomie 15 mld euro miesięcznie do końca grudnia 2018 r. i przewiduje, iż jeśli średniookresowe perspektywy inflacji znajdą potwierdzenie w aktualnych danych, zakupy zostaną zakończone” (EBC, 2018).
Deklaracja ta pojawiła się w czasie, gdy w opinii większości analityków koniunktura gospodarcza w Eurolandzie ulegała ochłodzeniu, a wskaźniki wyprzedzające sugerowały kontynuację trendu spadkowego (NBP, 2018b, s. 9-20). Dlatego, już rok temu, większość obserwatorów przewidywała, że EBC najprawdopodobniej tylko zmniejszy skalę interwencyjnego skupu aktywów, ale po raz kolejny odroczy ostateczny termin zamknięcia programu APP i innych programów interwencyjnych przynajmniej do końca roku. Tak się stało. W ślad za tym nie nastąpiła redukcja bilansu, bowiem EBC reinwestował spłaty kapitału po zakończeniu QE,
15
chociaż przez pierwsze dziesięć miesięcy 2019 r. nie prowadził skupu aktywów na rynku pierwotnym.
Interwencyjna polityka pieniężna EBC budziła kontrowersje wewnątrz Rady Zarządzającej tego banku; było to nieuniknione. Strefa euro jest zbiorem gospodarek, które znacznie różnią się między sobą nie tylko pod względem bieżącej sytuacji koniunkturalnej, ale także uwarunkowań strukturalnych, takich jak poziom PKB per capita, poziom zadłużenia, skłonność do oszczędzania czy preferencje społeczne co do wysokości stóp procentowych. Pozostaje otwartym pytanie, kto najwięcej skorzysta na reinwestycjach papierów dłużnych, czy i jak zmienią się udziały poszczególnych państw Eurolandu w tzw. kluczu kapitałowym, według którego działa EBC skupując aktywa. Odejście od dotychczasowych zasad preferowałoby kraje ekonomicznie i finansowo mocniejsze, penalizując słabsze (przede wszystkim Włochy i Grecję), a to z pewnością nie pomoże tym gospodarkom, które najbardziej potrzebują wsparcia. Po ostatnim globalnym kryzysie finansowym pozostał „gorzki smak zawiedzionego zaufania i zerwanego paktu między finansami, gospodarką i społeczeństwem. (…) Taka napięta atmosfera skłania do wydawania uproszczonych ocen moralnych i etycznych” (Dembinski P. 2017, s. 10).
W odpowiedzi na te psychospołeczne wyzwania, Europejski Bank Centralny ponownie ogłosił (we wrześniu 2019 r.) cały pakiet działań zmierzających do złagodzenia warunków monetarnych, w szczególności: obniżył stopę depozytową z minus 0,4% do minus 0,5%, jednocześnie sygnalizując utrzymywanie ujemnych stóp w dłuższym okresie, a nawet możliwość dalszych obniżek. Równocześnie wprowadził dwustopniowy system oprocentowania nadwyżkowych rezerw banków komercyjnych (tzw. tiering), który ma ograniczać negatywny wpływ ujemnej stopy depozytowej na wyniki banków, a ostatecznie na akcję kredytową. Wprowadzając to rozwiązanie de facto zwiększono możliwość dalszego obniżania stopy depozytowej w przyszłości. Ponadto EBC wznowił program skupu aktywów (po 20 mld euro miesięcznie) i to bez wyraźnego nakreślania granicznego terminu jego realizacji, zaś Rada Prezesów EBC złagodziła warunki długoterminowych operacji płynnościowych (TLTRO) polegających na udzielaniu refinansowania bankom komercyjnym, pod warunkiem zwiększenia przez nie akcji kredytowej.
Zakończenie Każda decyzja w polityce pieniężnej wiąże się z możliwością wystąpienia efektów ubocznych, które ex ante trudno przewidzieć i ocenić. Jednakże, na podstawie dotychczasowych danych statystycznych i prognoz, można sformułować wniosek, że niekonwencjonalna polityka pieniężna EBC realizowana w reakcji na kryzys lat 2007-2009 dość skutecznie neutralizowała negatywne skutki załamania rynków finansowych w pierwszej fazie kryzysu i ułatwiła przełamanie recesji. Powrót gospodarki europejskiej na ścieżkę zrównoważonego wzrostu okazał się jednak nietrwały, w gospodarce Niemiec i mniej zamożnych krajów strefy euro pojawiają się ostatnio tendencje stagnacyjne, które mogą mieć trwały charakter, biorąc pod uwagę skalę i synchronizację globalnego pogorszenia koniunktury. Ryzyko pogłębienia lub utrwalenia stagnacji w warunkach niskiej inflacji ocenia się za poważne. W tej złożonej sytuacji, główne banki centralne, w tym EBC nie miały innego wyjścia, niż powrót na ścieżkę luzowania ilościowego, choć
16
– z oczywistych względów – w skali znacznie skromniejszej niż przez laty, z wykorzystaniem zarówno pozytywnych jak i negatywnych doświadczeń z tamtego trudnego okresu.
Obok doraźnych i średniookresowych korzyści, polityka luzowania ilościowego niesie długofalowe ryzyka, którym zapewne trzeba będzie sprostać w bliżej nieokreślonej przyszłości. Zwracali na to uwagę ekonomiści już w pierwszych latach stosowania niestandardowych instrumentów, które posłużyły do luzowania ilościowego w polityce pieniężnej. W szczególności zwracano uwagę na następujące zagrożenia: po pierwsze, niestandardowe instrumenty polityki pieniężnej opóźniają reformę systemu finansów publicznych (Roubini i Mihm, 2010), po drugie – powodują nieuzasadnioną aprecjację walut narodowych (Stiglitz 2012, s. 37-39), po trzecie – generują gwałtowny przyrost agregatów pieniężnych na globalnych rynkach finansowych (Taylor, 2012, s. 19, Bernanke, 2012; Goodhart i Ashworth, 2012, s. 640-670).
Eksperymenty w ramach Eurosystemu przeprowadzane w obszarze polityki pieniężnej były i są uważnie obserwowane przez Narodowy Bank Polski. NBP jako uczestnik Europejskiego Systemu Banków Centralnych, zwraca baczną uwagę na to, by agendy analityczne i gremia decyzyjne miały pełną, aktualną wiedzę o światowych trendach w dziedzinie finansów. W „Założeniach Polityki Pieniężnej na rok 2020.” przewidziano zastosowanie niekonwencjonalnych instrumentów polityki pieniężnej7, jednak nic nie wskazuje na to, aby trzeba było po nie sięgać w dającej się przewidzieć perspektywie czasowej (Glapiński, 2019).
Literatura Ancyparowicz G. (2017), Wybrane aspekty strategii celu inflacyjnego w teorii i praktyce banków centralnych, Annales Universitatis Mariae Curie-Skłodowska, sectio H – Oeconomia, Vol. 51, No 6 Ben Bernanke (2016), What tools does the Fed have left? Part 1: Negative interest rates, „Brookings Institution”, 18 marca Bernanke B.S. (2012), Monetary Policy since the Onset of the Crisis, August 31, https://www.federalreserve.gov/newsevents/speech/bernanke20120831a.htm Dembinski P. H. (2017) Etyka i odpowiedzialność w świecie finansów, Wydawnictwo Studio Emka, Warszawa Dudkiewicz B. (2016) Europejski Bank Centralny i nadzór finansowy w Unii Europejskiej a stabilność finansowa, CeDeWu.Pl, Warszawa EBC (2017) Raport Roczny – Roczne sprawozdanie finansowe, www.nbp.pl/publikacje/publikacje_ecb/ar2017.pl.pdf EBC (2018), The impact of the corporate sector purchase program on corporate bond markets and the financing of euro area non-financial corporations, https://www.ecb.europa.eu/pub/pdf/other/ecb.ebart201803_02.en.pdf EBC (2017a), The ECB’s corporate sector purchase programme: its implementation and impact; https://www.ecb.europa.eu/pub/pdf/other/ebbox201704_02.en.pdf
————— 7 Chodzi m. in. o następujący zapis: „Głównym instrumentem służącym realizacji celu operacyjnego polityki pieniężnej NBP są operacje otwartego rynku. Stosując je, NBP oddziałuje na warunki płynnościowe w sektorze bankowym w sposób umożliwiający kształtowanie się stawki POLONIA w pobliżu stopy referencyjnej NBP. (…) Operacje strukturalne mogą zostać przeprowadzone w celu długoterminowej zmiany struktury płynności w sektorze bankowym. Gdyby wystąpiła taka konieczność, bank centralny może przeprowadzić następujące operacje strukturalne: emisję obligacji, zakup oraz sprzedaż papierów wartościowych na rynku wtórnym”.

17
Glapiński A. (2019) Powrót głównych banków centralnych do łagodzenia polityki pieniężnej, Bank 11 Goodhart Ch. A. E., Ashworth, J. P. (2012), QE: a successful start may be running into diminishing returns, Oxford Review of Economic Policy, Volume 28, Issue 4, 10 December, https://doi.org/10.1093/oxrep/grs034 Grostal i in. (2016), Alternatywne strategie polityki pieniężnej, NBP, Warszawa Narodowy Bank Polski. Rada Polityki Pieniężnej, Założenia Polityki Pieniężnej na 2020 rok, https://www.nbp.pl/polityka_pieniezna/dokumenty/zalozenia/zalozenia_pp_2020.pdf NBP (2018a), Zastosowanie niestandardowych działań przez Narodowy Bank Polski, Warszawa NBP (2018), Założenia Polityki Pieniężnej na rok 2019 www.nbp.pl/polityka_pieniezna/dokumenty/zalozenia/zalozenia_pp_2019.pdf NBP (2018b) Raport o inflacji, listopad, www.nbp.pl/polityka_pieniezna/dokumenty/raport_o_inflacji/raport_listopad_2018.pdf Protokół (Nr 4) w sprawie Statutu Europejskiego Systemu Banków Centralnych i Europejskiego Banku Centralnego (Dz. Urz. UE C 326/230). Roubini N., Mihm S. (2010), Crisis Economics: A Crash Course in the Future of Finanse, The Penguin Press, New York Stiglitz J. B. (2012), Macroeconomics, Monetary Policy, and the Crisis [w:] Blanchard O., Romer D., Spencer M., Stiglitz J. (red.), In the Wake of the Crisis: Leading Economists Reassess Economic Policy, MIT Press, Cambridge Taylor J. B. (2012), Monetary Policy Rules Work and Discretion Doesn’t: A Tale of Two Eras, Journal of Money, Credit and Banking Lecture, March Traktat o Funkcjonowaniu Unii Europejskiej (Dz. Urz. UE C 326/47)
Summary This article presents the underlying legal and economic bases of so-called quantitative easing (QE) in the monetary policy of the Eurosystem. Large asset purchase programs and other intervention purchases of securities are discussed, and the risks of such policies for the long-term stability of the financial system are also addressed. It is noted that the non-standard financial instruments which are used in the Eurozone require close monitoring by Polish government financial institutions. This would help Poland access the full range of financial instruments that could be used to neutralize any unfavorable developments in the national financial sector and in the Polish economy which might occur in a global economic crisis. The research is based on analysis of European Central Bank documents and analytical studies of the Polish National Bank concerning non-standard instruments of financial policy.
Keywords: central bank, quantitative easing, large scale asset purchase programs JEL Codes: G01, G21, G28, H12
Informacja o autorze:
Prof. Dr hab. Grażyna Ancyparowicz Narodowy Bank Polski, Rada Polityki Pieniężnej Górnośląska Wyższa Szkoła Handlowa im. Wojciecha Korfantego w Katowicach e-mail: [email protected] ORCID: 0000-0003-0196-7873

18
22 (71) 2019 DOI 10.22630/PEFIM.2019.22.71.22
Agnieszka Biernat-Jarka Warsaw University of Life Sciences - SGGW
ASSESSMENT OF GREENING IN THE CONTEXT OF PROVIDING ENVIRONMENTAL PUBLIC GOODS
IN AGRICULTURE
The article discusses the concept of providing environmental public goods through agriculture. The theoretical goal of the discussion was to present the concept of greening under the EU's Common Agricultural Policy. This concept was developed on the basis of available literature and from EU and Polish documents. The concrete goal is to assess greening instruments in terms of their implementation and compliance by farmers. A review of the available literature on the subject allows the assumption that the greening instrument implemented under the CAP has contributed to an intensification of activities by farmers in the field of environmental protection. The article was prepared based on source materials, monographs and scientific articles as well as Eurostat data. The article also presents the results of Eurobarometer surveys that show the expectations of EU citizens towards the European Union's CAP in the field of environmental and climate protection. Results of surveys have shown that on the one hand, the European Union should be responsible for ensuring healthy and safe food products for consumers, while on the other hand the goal of the Common Agricultural Policy should be to ensure an appropriate standard of living for farmers.
Key words: Common Agricultural Policy, public goods, greening, environmental protection, Poland, European Union JEL code: Q 14, Q18
Introduction The current Common Agricultural Policy of the EU provides financial support for farmers, encouraging them to carry out activities beneficial for the natural environment. Currently, particular attention in the functioning of the Common Agricultural Policy is attached to linking the financing possibilities of individual instruments, e.g. direct payments or actions under rural development policy with the provision of environmental public goods. Public goods are defined as those which are not supplied or insufficiently supplied by the market. The use of these goods by one person does not limit or exclude the use of others at the same time1. Public goods are available to everyone, including those who have not paid for them. They consciously use these goods and avoid bearing any costs arising from their use. Without the state's interference in the production and supply of public goods, there could be a situation where, despite the high demand for a
1 Stiglitz J., E.: Ekonomia sektora publicznego, PWN Warszawa 2004, p. 150; Samuelson P.,S., Nordhaus W., D.: Ekonomia, tom 2, PWN Warszawa 1996, p. 239; Acocella N.: Zasady polityki gospodarczej, PWN, Warszawa 2002, p. 131; Altvater E. Public goods for human security, http://revistas.ucm.es/index.php/PAPE/article/viewFile/PAPE0707220001A/25673, Papeles del Ester, 14 (2007), 1-19;

19
given good, production would not take place2. Environmental goods supplied under the EU's agricultural policy include3: biodiversity, agricultural landscape, soil conservation, proper water relations. As part of the current Common Agricultural Policy, starting from 2013, payment of direct payments was made as well as the possibility of using specific rural development programs with activities beneficial for the natural environment. First of all, we should mention here the payment for greening, which depends on meeting the requirements in the field of crop diversification, maintenance of permanent grassland (TUZ) and the allocation of part of the farm area for ecological purposes4. An important role in the payment system is also compliance by farmers with the so-called good agricultural culture, which includes provisions for proper management of agricultural land. In this way, the aim is to maintain biological biodiversity by protecting natural habitats, animal and plant species in Natura 2000 areas. In addition to direct payments, the system of measures proposed to farmers under the Rural Development Program5 is very important in the delivery of public goods. The most important instruments that matter in providing environmental public goods are: restoring and protecting as well as enriching biodiversity in selected areas, improving water management and preventing soil erosion. Extensive land use in less-favored areas or the construction of ecological corridors and enclaves contribute to the preservation of landscape values and promote the biodiversity of rural areas6.
The concept of "greening" within the CAP Greening payments were introduced as a result of the Common Agricultural Policy (CAP) reform of 2013. The European Commission has stated that it is necessary to support farms in exchange for their use of activities contributing to the achievement of ecological goals in the field of improving environmental impact. Greening can be described as a mechanism of positive agri-environmental public goods7. It is implemented through the diversification of crops, maintaining permanent grassland, including traditional orchards, which are slightly dense and cover the area of the permanent grassland (TUZ), and maintaining pro-ecological areas on agricultural land. The maintenance of permanent grassland greatly contributes to the preservation of biodiversity, carbon absorption and soil protection. Diversification, in contrast, improves soil quality, while establishing ecological focus areas also ensures protection and enhancement of biodiversity, reduction of pollution flowing into surface waters and improvement of soil resistance.
2 Wojtyna A.: Nowoczesne państwo kapitalistyczne a gospodarka, Teoria i praktyka, PWN Warszawa 1990, Stiglitz J., E.: Ekonomia sektora publicznego, PWN Warszawa 2004, p. 94 3 Cooper T., Kaley H., Baldock D.: Conceptual Framework on Public Goods Provided Through Agriculture in the EU. Working Document of the Technical Working Group Public Goods, European Network for Rural Development, 4/2009, p. 14-28. 4 System płatności bezpośrednich w latach 2015-2020, MRiRW, Warszawa maj 2015, p. 1-10. 5 Program Rozwoju Obszarów Wiejskich na lata 2014-2020 (PROW 2014-2020), Warszawa, 12 grudnia 2014 6 Biernat-Jarka A.: Dobra publiczne w rolnictwie w nowej perspektywie finansowej Unii Europejskiej, Zagadnienia Ekonomiki Rolnej, IERiGŻ, Warszawa 1/2016, p. 144-154 7 Jaroszewska J.: Zazielenienie jako przykład internacjonalizacji efektów zewnętrznych – agrośrodowiskowych dóbr publicznych, Z badań nad rolnictwem społecznie zrównoważonym, Monografie Programu Wieloletniego, IERiGŻ, Warszawa 40/2017, p. 72.

20
In Poland, farmers participating in the direct payments system must submit applications for greening payment. Farms with an area of up to 10 ha of agricultural land can use this system without being obliged to comply with greening requirements. These requirements also do not apply to organic farms.
Crop diversification is based on the fact that when arable land covers 10-30 ha of land on a farm, at least two plant species must be cultivated and the main crop must not constitute more than 75% of the land. On a farm with over 30 ha of arable land, at least three different crops must be cultivated, and the main crop must not constitute more than 75% of the area, and in total two crops may not cover more than 95% of this land. Farms where cultivated grasses or other herbaceous plants and / or fallow land constitute more than 75% of the arable land, and with additional land that does not constitute more than 30 ha, are exempt from diversification. In addition, diversification may be exempted for farms in which 75% of arable land is permanent grassland and / or grass or other herbaceous forage, with any additional arable land not to exceed 30 ha. The diversification obligation also excludes farms where organic production is carried out on part of the arable land, while the remaining arable land area is less than 10 ha. Farmers with more than 15 ha of arable land must allocate 5% of their land for pro-ecological purposes. These areas may consist of fallow land, buffer zones, wooded areas, agro-forestry areas, but need also to use catch crops or winter green cover. The main goal of maintaining ecological focus areas is to maintain and increase biodiversity8.
Another greening measure is to maintain permanent grassland, which also contributes to the conservation of biodiversity. Therefore, a ban on the conversion of permanent grassland into arable land was introduced in Natura 2000 areas. An appropriate share of permanent grassland must be maintained in a nation’s total area of agricultural land, and may not decrease by more than 5% from 2015 levels. If such a situation occurs, Member States must oblige their farmers to restore their grassland to permanent pasture9.
Regarding ecological focus areas, so-called “productive” and “non-productive” ecological areas can be defined. Productive ecological areas include catch crops, the use of nitrogen-fixing crops, short rotation coppices or the so-called agroforestry system. On the other hand, pro-ecological areas that do not include agricultural production are fallow land, buffer zones, wooded areas, landscape elements, i.e. hedges and wooded belts, ditches, ponds, coppice and mid-field balks10.
8Regulation (EU) No 1307/2013 of the European Parliament and of the Council of 17 December 2013 laying down provisions on direct payments to farmers under support schemes under the common agricultural policy and repealing Council Regulation (EC) No 637/2008 and Council Regulation (EC) No. 73/2009, Official Journal of the European Union, Article 44 http://g.ekspert.infor.pl/p/_dane/akty_pdf/E0L/2013/347/608.pdf#zoom=90 9 Tamże, Article 45 10 Evaluation study of the payment for agricultural practices beneficial for the climate and the environment, Alliance Environnementand the Thünen Institute November –2017–ALLIANCE ENVIRONNEMENT, European Union, 2017 https://ec.europa.eu/agriculture/sites/agriculture/files/fullrep_en.pdf, str. 1-5
21
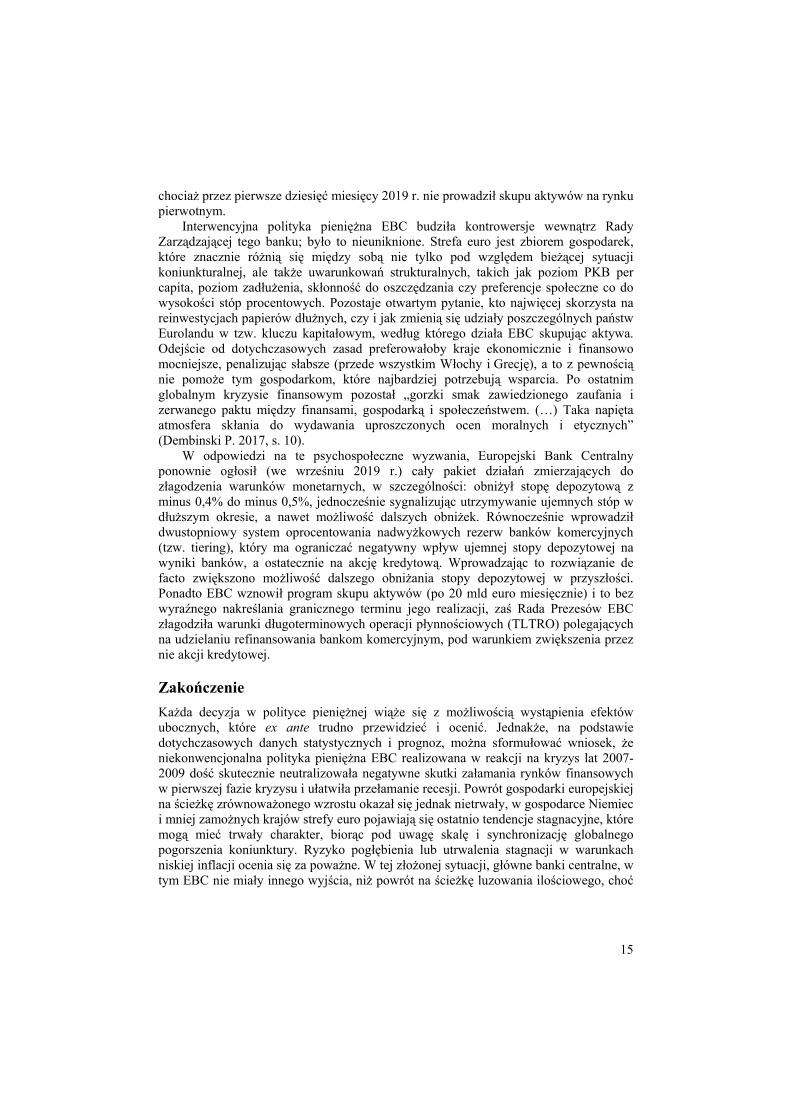
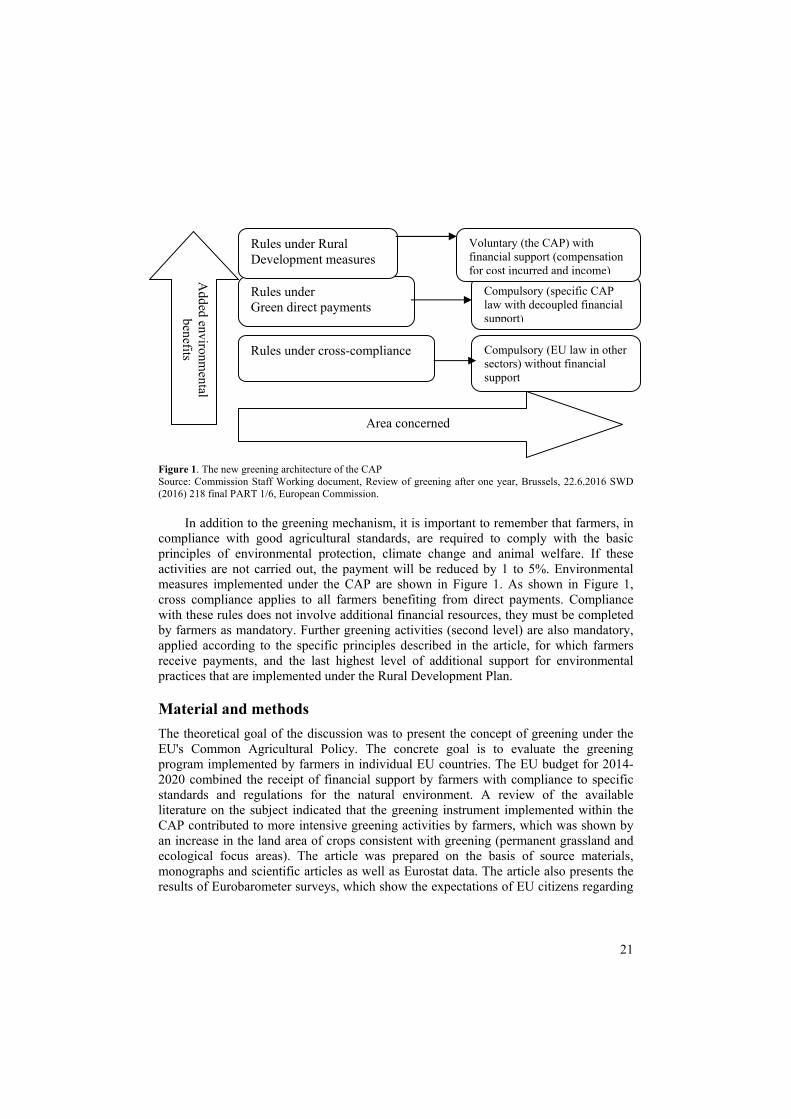
Figure 1. The new greening architecture of the CAP Source: Commission Staff Working document, Review of greening after one year, Brussels, 22.6.2016 SWD (2016) 218 final PART 1/6, European Commission.
In addition to the greening mechanism, it is important to remember that farmers, in compliance with good agricultural standards, are required to comply with the basic principles of environmental protection, climate change and animal welfare. If these activities are not carried out, the payment will be reduced by 1 to 5%. Environmental measures implemented under the CAP are shown in Figure 1. As shown in Figure 1, cross compliance applies to all farmers benefiting from direct payments. Compliance with these rules does not involve additional financial resources, they must be completed by farmers as mandatory. Further greening activities (second level) are also mandatory, applied according to the specific principles described in the article, for which farmers receive payments, and the last highest level of additional support for environmental practices that are implemented under the Rural Development Plan.
Material and methods The theoretical goal of the discussion was to present the concept of greening under the EU's Common Agricultural Policy. The concrete goal is to evaluate the greening program implemented by farmers in individual EU countries. The EU budget for 2014-2020 combined the receipt of financial support by farmers with compliance to specific standards and regulations for the natural environment. A review of the available literature on the subject indicated that the greening instrument implemented within the CAP contributed to more intensive greening activities by farmers, which was shown by an increase in the land area of crops consistent with greening (permanent grassland and ecological focus areas). The article was prepared on the basis of source materials, monographs and scientific articles as well as Eurostat data. The article also presents the results of Eurobarometer surveys, which show the expectations of EU citizens regarding
Added environm
ental benefits
Area concerned
Rules under cross-compliance Compulsory (EU law in other sectors) without financial support
Rules under Green direct payments
Compulsory (specific CAP law with decoupled financial support)
Rules under Rural Development measures
Voluntary (the CAP) with financial support (compensation for cost incurred and income)

22
CAP activities for environmental and climate protection. The research was carried out in December, 2016. It was based on approximately 28,000 direct questionnaire interviews, including over 1,000 respondents in Poland.
Results and Discussion Financing greening within the CAP After the introduction of the greening payment, the total amount of financial resources allocated to direct payments in the European Union did not change, only transfers between individual types of payments were affected. Of the approximately EUR 40 billion allocated to direct payments, EUR 11.7 billion (around 30% of all direct payments and almost 8% of the total EU budget) are green funding. Farmers in the EU received, on average, around 80 euros per hectare per year in 2016 for greening payments. In Poland in 2016, PLN 15 billion were allocated for direct payments, of which more than 4 billion PLN were for greening. The greening payment per ha in 2016 was PLN 309.77, equivalent to EUR 71.34/ha. Responsibility for the use of greening in the EU is based on shared management, i.e. the European Commission is responsible for implementing the EU budget, and tasks related to the implementation of payments are delegated to individual Member States. Agencies responsible for the direct payment system are required to collect applications from farmers, conduct administrative checks of beneficiaries, and calculate and pay the corresponding payments. Assessment of greening as an instrument for achieving the objectives of the CAP The greening payment was introduced in the current financial perspective as an instrument intended to contribute to the introduction of production methods that have a positive impact on the natural environment.
The justification for greening by the European Commission was to reward farmers for providing public goods for which the market is unable to pay. However, the question arises as to whether the introduction of greening has actually contributed to an increase in the area of permanent grassland and ecological crops.
In order to verify the thesis, the author analyzed statistical data showing changes in the area of permanent grassland and pro-ecological areas in all EU countries in 2016. EU Member States, as part of the 2013 reform, were obliged to maintain an appropriate ratio of permanent grassland area to overall agricultural area, which is referred to as the reference index. The rate of permanent grassland in the EU is currently around 30%, an increase of 1.5% compared to 2007-2014.
This increase, however, does not necessarily mean a real increase in the area of permanent grassland; the decrease in the area of declared permanent grassland (counter) (from 47 million ha in 2007-2014 to 44 million ha in 2016) occurred more slowly than the decrease of the denominator, i.e. arable land (from 164 million ha in 2007-2014 to 145 million ha in 2016). As shown in Table 1, in most EU member states the reference ratio of permanent grassland for 2015-2020 was at a lower level than the actual percentage of permanent grassland in 2016. Only a slightly lower percentage of permanent grassland compared to the reference indicator could be seen in nine member countries, e.g. Great Britain, Estonia or Portugal, while the maximum differences were

23
3pp. On average, for the entire EU, the actual percentage of permanent grassland area was only 0.1% lower than the assumed reference indicator for 2015-2020.
Table 1. Permanent grassland and ecological land area in EU countries, in 2016
Countries
Permanent grassland Ecological focus areas
Permanent grassland declared, in 2016
Reference indicator for 2015-
2020
Percentage of
permanent grassland in 2016
Arable land covered by
the obligation in the area of
environmental protection
Required ecological
areas: 5% of arable land
covered by the obligation in the terms of ecological focus areas
Ecological focus areas
declared
ecological focus areas
declared above the required
minimum
Belgium 448 987 33,7% 34,2% 706 984 35 349 53 315 51% Bulgaria 430 730 11,7% 11,6% 2 992 629 149 631 210 043 40% Czech Republic
568 829 18,4% 18,6% 2 396 918 119 846 178 209 49%
Denmark 187 406 7,7% 7,8% 2 106 321 105 316 108 850 3% Germany 4 225 999 26,9% 26,7% 10 738 721 536 936 681 520 27% Estonia 191 413 28,0% 24,5% 399 630 19 981 39 807 99% Ireland 4 146 476 91,1% 92,3% 317 777 15 889 39 117 146% Greece 1 113 762 34,3% 32,1% 672 977 33 649 111 797 232% Spain 5 188 284 26,4% 26,9% 9 337 789 466 889 1 497 885 221% France 8 308 807 31,2% 31,4% none none none none Croatia 128 516 12,8% 13,6% 523 344 26 167 73 255 180% Italy 1 352 638 15,7% 16,1% 3 352 576 167 629 307 295 83% Cyprus 2 622 2,3% 2,0% 1 862 3 093 9 123 195% Latvia 320 117 22,3% 22,8% 823 932 41 347 81 369 97% Lithuania 695 077 21,5% 25,9% 2 103 701 105 185 251 038 139% Luxembourg 61 497 51,3% 53,0% 47 818 2 391 3 668 53% Hungary 576847 12,6% 12,4% 3 348 571 167 429 298 598 78% Netherlands 690 270 40,6% 40,5% 582 736 29 137 60 378 107% Austria 904 038 43,4% 43,9% 305 859 15293 20 837 36% Poland 1 849 142 14,3% 15,5% 5 791 052 289 553 408 652 41% Portugal 893 592 38,2% 37,7% 405 779 20 289 38 882 92% Romania 1 675 808 23,9 22,3 5 103 229 255 161 383 267 50% Slovenia 234 513 56,1 56,8 70 803 3 540 5 705 61% Slovakia 390 167 23,3 23,0% 1 220 965 61 048 89 208 46% Finland 134 006 6,4 6,6 413 588 20 679 27 312 32% Sweden 424 332 14,3 16,8 1 379 908 68 995 118 308 71% United Kingdom
8 547 962 64,8% 61,9% 4 795 556 239 778 497 274 107%
Total 4 1691838 30,2% 30,1% 60 004 114 3 000 206 5 594 727 86% * The table does not include Malta, due to the lack of permanent grasslands, and in France there is no complete data on ecological focus areas. Source: author’s own elaboration based on Eurostat.
In turn, the area of ecological crops on average across the EU in 2016 accounted for
over 86% more than the required minimum of these areas. Notably, countries with much higher areas of ecological focus than the assumed indicator were Greece and Spain, with over 200%.
The European Court of Auditors has found that, following the introduction of greening, changes in agricultural practices only occurred on around 5% of EU

24
agricultural land. According to research by Louhichi et al.11, greening had no effect on 71% of farmers who also did not incur any costs associated with its implementation. Of the nearly 30% of farmers affected by greening, only two-thirds incurred costs of EUR 25/ha due to farm adaptation to these requirements. Only the costs incurred by 2% of farmers exceeded EUR 100/ha. This situation mainly concerned highly specialized farms, e.g. in vegetable production. This research also showed a very slight increase of 1% in farmers' income due to price increases as a result of reduced production volumes. As data from the European Commission show, in 2015, 24% of farms were covered by at least one greening obligation, which was 73% of the arable land in the EU (110 million ha from 150 million ha throughout the EU). In 2016, the percentage of households with at least one commitment resulting from greening increased to 77%. The Commission considers this increase to be the result of actions taken12.
According to the annual report of the Court of Auditors [S annual report on the implementation of the budget for 2016, paragraph 7.56], the introduction of the greening requirement resulted in 2016 that 1% of UAA in the EU required greater diversification and about 1% of UAA required the introduction of additional ecological focus areas. Louhichi et al. indicated that after the introduction of the greening obligation, this requirement changed agricultural practices on 4.5% of UAA, including 1.8% due to crop diversification, 2.4% due to ecological focus areas and 1.5% permanent agricultural land in the EU (around 1.2% of arable land has overlapped with ecological focus and crop diversification.)13
The European Commission data shows that in 2015, 76% of farms, including those not covered by the payment system in the European Union, were not covered by the greening obligation, which accounted for 27% of all UAAs. On the other hand, as regards beneficiaries of greening payments, 65% of farms operating on 16% of UAA were exempted.
Based on the analysis of statistical data, it can be concluded that the hypothesis that, after the introduction of greening payments there would be an increase in the area of permanent agricultural land and ecological focus areas, has not been confirmed. This means that the introduction of greening has not resulted in the need to increase the area of permanent grassland or of ecological plants in most EU member states. In turn, the cited research also shows14 that after the introduction of the greening requirement, there were no changes in agricultural holdings with agricultural practices used so far (farms met the requirements for greening or were exempted from this obligation). There is also a so-called “deadweight effect,” where public funds paid to farmers for the delivery of public goods, in this case for agricultural practices beneficial for the environment, would still be delivered without support, because they are the result of farmers’ normal activity or are also required by legal provisions, in this case cross-compliance. The deadweight effect within the Common Agricultural Policy exists because greening requirements
11 Louhichi, K., P. Ciaian, M. Espinosa, And. Perni and S. Gomez y Paloma, Economic impacts of CAP greening: application of an EU-wide individual farm model for CAP analysis (IFM-CAP), European Review of Agricultural Economics 45(2)/2018: 205–238 12 Zazielenienie - bardziej złożony system wsparcia dochodów, który nie jest jeszcze skuteczny pod względem środowiskowym, Sprawozdanie specjalne, Europejski Trybunał Obrachunkowy 2017 r., p. 26-28 13 Louhichi, K., P. Ciaian, M. … p. 205–238 14 Tamże

25
were met earlier and thus major changes in crop diversification or pro-ecological activities were not required. As demonstrated by statistical data in Poland, the requirements for greening were already met in 2014, with a surplus of about 30%. And in other EU countries, on average, twice as much space as the required 5% was allocated to ecological focus areas (Table 1). In addition, in 2016 there was an increase in the ratio of permanent grassland to 30% compared to the reference period 2007-2014, which was resulted from a decrease in the total area of arable land by 19 million ha. In addition, pasture was included in the current definition of permanent grassland, and a new type of arable land was identified: environmentally sensitive, which cover 16% of permanent grassland in the EU. However, about 96% of environmentally sensitive permanent grasslands are in the Natura 2000 area. Despite the fact that the separation of environmentally sensitive permanent grassland (TUZ) in these areas has a positive impact on biodiversity, attention should be directed more to areas located outside the Natura 2000 area.
Of the ecological focus areas reported under greening, productive areas dominated. In 2016, they constituted 58%, with nitrogen binding crops and catch crops predominating.
Greening should add value beyond the basic requirements for receiving direct payments. However, there are also situations of overlapping greening requirements and cross-compliance, i.e. on the one hand certain pro-environmental practices are required as part of good agricultural culture, while on the other they can be declared as ecological focus areas. In some EU member states, including Poland, the requirements of good agricultural culture overlapped with pro-ecological areas in regard to maintaining buffer zones, ponds, ditches, coppices and catch crops.
The purpose of the article was also to show the level of public awareness in EU countries regarding the use of CAP instruments and their justification in the context of environmental protection. These opinions were based on the Eurobarometer opinion poll15, which was published in December 2017. These studies were conducted on a sample of over 28,000 direct questionnaire interviews. Regarding the most important obligations of farmers towards society, respondents emphasized providing healthy and safe high quality food (55% in the EU, 48% in Poland), ensuring the welfare of farm animals (28% in the EU and 14% in Poland), as well as protecting the environment and fighting against climate change (25% in the EU and 15% in Poland). When asked whether problems relating to agriculture and rural areas should be dealt with at the EU, national or local level, very interesting answers were obtained. Namely, respondents stated that ensuring healthy and safe food products as well as guaranteeing food supplies should rest on the European Union (51% of EU respondents). Also, ensuring an adequate standard of living for farmers should be part of the Common Agricultural Policy (44% of EU respondents). When asked whether they had heard about the support that is given to farmers within the CAP, 67% of respondents answered “yes” and 61% thought that the
15Public opinion on the Common Agricultural Policy, Eurobarometer, https://ec.europa.eu/info/food-farming-fisheries/key-policies/common-agricultural-policy/cap-glance/eurobarometer_en ( 3/15/2019)

26
CAP benefits not only farmers but also all Europeans. In addition, 62% of respondents said that the CAP contributes to mitigating the effects of climate change. When asked whether farmers' support at 1% of the total public expenditure of 28 Member States and almost 40% of the total EU budget is appropriate, 45% answered “yes” and 26% said that it was too low. About 44% of respondents said that this support should be higher in subsequent years, and 12% said that support should remain at the same level.
Summing up the results of the Eurobarometer research, it is necessary to emphasize the great awareness of European society regarding the Common Agricultural Policy. Over 60% of respondents are aware of the great importance of the CAP instruments carried out to mitigate the negative effects of climate change. In addition, citizens and therefore also consumers of food products are aware that proper agricultural policy makes it possible to provide healthy and safe food.
Conclusions The aim of the article was to show whether the introduction of payments for greening within the CAP has contributed to an increase in the area of permanent agricultural land and ecological crops, which have a positive impact on the natural environment. Research has shown that the introduction of greening payments under the EU CAP has not increased the area allocated to areas that are beneficial from the environmental and climate point of view. The introduction of greening requirements meant that only 1% of UAA in the EU required land diversification and around 1% of UAA required the introduction of ecological focus areas. Does this mean that the European Commission did not make sense? The author's task was to separate whether subsidies related to environmental practices as part of direct payments resulted in greater awareness of farmers themselves that their activities could have a positive impact on the environment. Farmers know that as part of direct payments they receive funds for undertaking practices that are friendly to environmental protection and climate. They also realize that if they fail to meet these requirements, they will lower their levels of payments, which can have a significant negative impact on their income. In addition, EU citizens, as shown by Eurobarometer surveys, are highly aware of the importance of using pro-environmental instruments under the CAP. This is a promising and extremely important signal, because we know that our positive action begins with the awareness of the significance of a given problem, while without awareness, our action either does not take place or is very limited.
Literature: Acocella N.: Zasady polityki gospodarczej, PWN, Warszawa 2002. Altvater E. Public goods for human security, http://revistas.ucm.es/index.php/PAPE/article/viewFile/PAPE0707220001A/25673, Papeles del Ester, 14 (2007). Biernat-Jarka A.: Dobra publiczne w rolnictwie w nowej perspektywie finansowej Unii Europejskiej, Zagadnienia Ekonomiki Rolnej, IERiGŻ, Warszawa 1/2016, p. 144-154. Commission Staff Working document, Review of greening after one year, Brussels, 22.6.2016 SWD (2016) 218 final PART 1/6, European Commision.

27
Cooper T., Kaley H., Baldock D.: Conceptual Framework on Public Goods Provided Through Agriculture in the EU. Working Document of the Technical Working Group Public Goods, European Network for Rural Development, 4/2009. Opinia publiczna na temat Wspólnej Polityki Rolnej, Eurobarometr, https://ec.europa.eu/info/food-farming-fisheries/key-policies/common-agricultural-policy/cap-glance/eurobarometer_pl. Evaluation study of the payment for agricultural practices beneficial for the climate and the environment, Alliance Environnementand the Thünen Institute November –2017–ALLIANCE ENVIRONNEMENT, European Union, 2017 https://ec.europa.eu/agriculture/sites/agriculture/files/fullrep_en.pdf. Jaroszewska J.: Zazielenienie jako przykład internacjonalizacji efektów zewnętrznych – agrośrodowiskowych dóbr publicznych, Z badań nad rolnictwem społecznie zrównoważonym, Monografie Programu Wieloletniego, IERiGŻ, Warszawa 40/2017 Louhichi, K., P. Ciaian, M. Espinosa, A. Perni and S. Gomez y Paloma, Economic impacts of CAP greening: application of an EU-wide individual farm model for CAP analysis (IFM-CAP), European Review of Agricultural Economics 45(2)/2018: 205–238 Podlasiak, Z.: Ekonomiczna analiza countries, Wyższa Szkoła Studiów Międzynarodowych, Łódź 2009. Program Rozwoju Obszarów Wiejskich na lata 2014-2020 (PROW 2014-2020), Warszawa, 12 grudnia 2014 Samuelson P.,S., Nordhaus W., D.: Ekonomia, tom 2, PWN Warszawa 1996. Stiglitz J., E.: Ekonomia sektora publicznego, PWN Warszawa 2004. System płatności bezpośrednich w latach 2015-2020, MRiRW, Warszawa maj 2015; Wojtyna A.: Nowoczesne państwo kapitalistyczne a gospodarka, Teoria i praktyka, PWN Warszawa 1990. Commission Staff Working document, review of greening after one year, Brussels, 22.6.2016 SWD (2016) 218 final PART 1/6, European Commision SPRAWOZDANIE KOMISJI DLA PARLAMENTU EUROPEJSKIEGO I RADY w sprawie wdrażania obowiązku w zakresie obszarów proekologicznych w ramach systemu płatności bezpośrednich z tytułu zazieleniania{SWD(2017) 121 final Sprawozdanie roczne dotyczące wykonania budżetu za rok budżetowy 2016 (DZ. U. 2017/C 322/01 z 28.09.2017r) Zazielenienie-bardziej złożony system wsparcia dochodów, który nie jest jeszcze skuteczny pod względem środowiskowym, Sprawozdanie specjalne, Europejski Trybunał Obrachunkowy 2017 r. Review of greening after one year, European Commission Brussels, 22.6.2016 SWD (2016) 218 final PART 3/6 Commission Staff Working Document Regulation (EU) No 1307/2013 of the European Parliament and of the Council of 17 December 2013 establishing rules for direct payments to farmers under support schemes within the framework of the common agricultural policy and repealing Council Regulation (EC) No 637/2008 and Council Regulation (EC) No 73/2009, Official Journal of the European Union, http://g.ekspert.infor.pl/p/_dane/akty_pdf/E0L/2013/347/608.pdf#zoom=90. Information about author:
Dr. Engr. Agnieszka Biernat-Jarka Warsaw University of Life Sciences - SGGW Institute of Economy and Finances e-mail: [email protected] ORCID: 0000-0003-2497-1656
28
22 (71) 2019 DOI 10.22630/PEFIM.2019.22.71.23
Grzegorz Biesok Jolanta Wyród-Wróbel University of Bielsko-Biała
PROACTIVE PURCHASE BEHAVIOUR AND THEIR RELATIONS IN SIMPLE SATISFACTION MODEL
The purpose of the paper was to verify how proactive shopping behaviours, as declared by
the respondents, affect the relationship between expectations, perceived quality and customer satisfaction within a simple satisfaction model. The subject of research was supermarket customers. The authors of the article assumed ten proactive shopping behaviours and then built and verified a satisfaction model in the groups of respondents declaring, or not declaring, the given behaviour.
The main conclusions resulting from the analysis is that satisfaction with purchases is more determined by the perceived quality in the case of customers who declare frequent purchases of products that improve the standard of living, consistency in purchasing perceived products and rapidity of purchasing decisions. Keywords: consumer research, proactive consumer behaviour, satisfaction model, structural equation modelling (SEM) JEL Codes: M310, L810
Introduction A buyer is not left alone in a purchase decision process. In addition to the influence of family or friends, buyers are influenced by marketing communication which uses various instruments to attract their attention. It depends on the buyer how much information s/he receives, how much s/he absorbs from marketing communications or how much s/he engages in the preparation of the offer (e.g. prosumption), before making a purchase decision.
Readiness to acquire the knowledge on a given topic, finding information, taking active steps to adapt the environment to own needs are some examples of proactive behaviours mentioned in the literature in the context of work or career (Ch. H. Wu and S. K. Parker1, M. L. Mallin et al.2, Ling at al. 3, Ismail et al.4, Claes and Loo5). In this respect, the buyer can also be proactive when s/he takes actions, such as: searching
1 Ch. H. Wu and S. K. Parker: Thinking and acting in anticipation: A review of research on proactive behavior. Advances in Psychological Science, 21(4)/2013, p. 679-700. 2 M. L. Mallin, Ch. B. Ragland and T. A. Finkle: The proactive behavior of younger salespeople: Antecedents and outcomes. Journal of Marketing Channels, 21/2014, p. 268-278. 3 N-P. Ling, N. F. A. Bandar, F. A. Halim and A. L. Muda: Proactive behaviour as a mediator in the relationship between quality of work life and career success. International Journal of Business and Society, 18 S4/2017, p. 701-709. 4 A. Ismail, W.A.W.M Nowalid and R.A. Bakar: Proactive behaviour as a mediator of the relationship between career management and career satisfaction. Jurnal Pengurusan (UKM Journal of Management), 48/2016, p. 99-110. 5 R. Claes and K. V. Loo: Relationships of proactive behaviour with job-related affective well-being and anticipated retirement age: an exploration among older employees in Belgium. European Journal of Ageing, 8(4)/2011, p. 233-241.

29
for offers, analysing technical data, comparing, checking rankings, testing products, visiting various points of sale, etc. The scope of proactivity of the buyers may be different, change in time and adapt to the certain circumstances.
Literature review The decisions of clients and their behaviours are determined by numerous factors described extensively in various publications by such authors as M. Miczyńska-Kowalska6, A. Falkowski and T. Tyszka7, A. Rybowska8, D. Mirońska9, L. Rudnicki10, L. Piersiala11. These factors can be both objective and subjective in nature. The first group includes the testing of products, the rankings created by reputable institutions, etc., while the second group contains, for example, habits and customs. Undoubtedly, the decision involves some effort which is designed to meet a specific need and the elimination of some kind of discomfort. At the end of this process, satisfaction should appear, as a result of fulfilling the needs. For this reason, the client tries to do everything worth the effort to achieve the goal.
Buyers behave differently when purchasing common goods (e.g. routine purchases), and when buying a product worth a much larger part of their income. Regardless of what products the decision concerns, it may entail different behaviours, i.e. the buyer can passively accept the market offer, not devoting time to look for alternatives or he may actively seek the best offer, ignoring or thoroughly analysing marketing information from different companies. Such behaviours correspond to the idea of proactive personality proposed by Bateman and Crant12. In their opinion, the proactive personality is distinguished by: scanning the environment and identifying the opportunities for constructive change, showing initiative and taking action, and persevering until change is affected. In this context, attributes of such a personality correspond to the various actions of the buyers, e.g. intentional and unintentional, voluntary or compulsory behaviours13.
In addition, a closer look at the trends of behaviour described by K. Liczmańska14, demonstrates the features that predestine purchase proactiveness, e.g.:
• consciousness (the consumers know their needs and expectations), • seeking information (with a distance to advertisements),
6 M. Miczyńska-Kowalska: Istota konsumpcji i zachowań konsumenckich – zarys problematyki. Annales Universitatis Mariae Curie-Skłodowska Lublin – Polonia. VOL. XXVI, 9, Sectio I, Wydział Filozofii i Socjologii UMCS, 2001. 7 A. Falkowski, T. Tyszka: Psychologia zachowań konsumenckich. GWP, Gdańsk 2002. 8 A. Rybowska: Zachowania zakupowe klientów sklepów internetowych. Zeszyty Naukowe Akademii Morskiej w Gdyni, 65/2010. 9 D. Mirońska: Zachowania nabywców na rynku - trendy i wpływ na działanie przedsiębiorstw. International Journal of Management and Economics, 27/2010, s. 114-132. 10 L. Rudnicki: Zachowania konsumentów na rynku. PWE, Warszawa 2012. 11 L. Piersiala: Strategie zakupowe konsumentów uwarunkowane płcią. Zeszyty Naukowe Politechniki Śląskiej. Seria: Organizacja i Zarządzanie, Z. 68 Nr Kol. 1905/2014. 12T. S. Bateman, J. M. Crant: The proactive component of organizational behavior: A measure and correlates. Journal of Organizational Behavior, 14/1993, p. 103-118; 13 A. Rybowska: Zachowania zakupowe klientów sklepów internetowych. Zeszyty Naukowe Akademii Morskiej w Gdyni, 65/2010, s. 24. 14 K. Liczmańska: Kluczowe czynniki determinujące zachowania konsumenckie na przykładzie mieszkańców województwa kujawsko-pomorskiego. Zeszyty Naukowe Uniwersytetu Szczecińskiego, nr 875 Problemy Zarządzania, Finansów i Marketingu, 41(2)/2015, s. 115-116.

30
• expecting satisfaction (as the result of buying or using the product). According to Bateman and Crant15 proactive people show certain behaviours. In our
opinion, these behaviours can also be related to shopping activities and scanning for change opportunities – the buyers themselves search for information about products, consider various options, estimate costs and choose the best and the conformable offer, and:
• set effective, change-oriented goals – proactive people are not guided only by commonly available information, they are looking for knowledge from various sources and confronting information, they go beyond the usual patterns, they constantly cross boundaries from the perspective of their own perception and other people16,
• anticipate and prevent problems – searching for possibilities of changes, e.g. in the case of unavailability of a product at a given point of sale, an alternative place of purchase has been prepared,
• do different things or do things differently – search-oriented attitude, no limitations, proactive people follow their own schemes, they are individualists, e.g. they move around the sales space in a different way than proposed by merchandising methods17,
• take action – proactive people are active observers, they take matters into their own hands,
• persevere – proactive people realize their goals, remain with their choices, however they can change their minds if circumstances require it,
• achieve results – implementation of decisions once made, activation of other people by influencing their attitudes, way of shopping, moving around the sales space.
In the buyer’s mind, marketing messages shape the image of the product responding to their needs, which frees the customer from the necessity to look for alternatives. For some buyers, such messages are the most useful, desirable, saving time normally spent on searching for another product. Others would rather engage themselves in the search for alternative choices, devoting as much time to this activity as they consider necessary. Such behaviour of buyers corresponds to two of the six selection strategies presented by Falkowski and Tyszka18, i.e.:
• strategy of dominance and pseudo-dominance – selection of the best alternative, dominating over the other alternatives,
• and the strategy of the advantage of positive features – manifested in comparing the positive features of the products and then selecting the one that has more assumed features (there is no randomness, the choice is well-considered)
15 T. S. Bateman, J. M. Crant: Proactive behavior: meaning, impact, recommendations. Business Horizons, 42(3)/1999, p. 63-70. 16 A. Bańka: Intencjonalne konstruowanie przyszłości i wyprzedzające realizowanie celów: walidacja Skali Proaktywności Ogólnej. Czasopismo Psychologiczne. Psychological Journal, 21(1), 2015, s. 10. 17 G. Biesok, J. Wyród-Wróbel: Merchandising w łańcuchu dostaw. Wybrane Zagadnienia Logistyki Stosowanej, Komitet Transportu Polskiej Akademii Nauk, 3/2006, s. 111-119. 18 L. Piersiala: Strategie zakupowe konsumentów uwarunkowane płcią. Zeszyty Naukowe Politechniki Śląskiej. Seria: Organizacja i Zarządzanie, Z. 68 Nr Kol. 1905/2014, s. 95 za: A. Falkowski, T. Tyszka: Psychologia zachowań konsumenckich. GWP, Gdańsk 2002.

31
Frequently such clients participate in the creation of marketing processes. For example, introducing certain innovations in the product or service, to better fulfil the needs and expectations of current and future customers19. A similar market activity is also prosumption, which can also be classified as a proactive consumer behaviour.
A. Bańka20 points out that the proactive person takes causative action actively and subjectively, takes the initiative in improving current circumstances or creating new ones; involves challenging the status quo rather than passively adapting to present conditions21. The concept of proactivity is similarly defined by Bateman and Crant22. According to the authors, being proactive means taking the initiative and changing things in the intended direction, for the better.
Being a proactive consumer means searching for information, confronting the knowledge coming from various sources, taking the initiative related to learning the market offer, possessing a resistance to marketing activities such as advertising, promotion at the point of sale, etc. This does not mean, however, that this kind of person always behaves in the same way in every situation, or that his purchase behaviour might sometimes show symptoms of proactivity and in other situations, might not. Regardless of criteria guiding the buyer or how much he will be proactive in his actions, his decisions have one goal – satisfaction with the choice. The proactivity in shopping behaviour can only be a factor supporting the satisfaction, which does not mean that it leads to satisfaction directly.
Research methodology and data collection The main objective of the research was to verify whether proactive shopping behaviour declared by respondents has an influence on the relationship between expectations, perceived quality and customer satisfaction in a simple satisfaction model. The research concerned supermarket customers, and the used methods were: surveys and structural equations modelling methods (SEM).
The authors, based on a literature review, assumed ten behaviours which can manifest a proactive shopping attitude (Table 1). In the survey questionnaire, descriptions of these activities were formed as questions which respondents had to answer, assessing their behaviour in the 5-point Likert scale from absolutely disagree (1) to completely agree (5) with the neutral element: hard to say (3).
The first part of the questionnaire included assessment of purchasing behaviour and the general profile of the customer. In the second part, the respondents were able to evaluate 1, 2 or 3 selected supermarkets, specifying the frequency of shopping, willingness to recommend this supermarket (according to the NPS methodology), opinion about the supermarket in 35 aspects (similarly on the Likert scale, identical to the one described above). One question was about the overall level of satisfaction (Generally, I am satisfied with shopping at this supermarket).
19 A. I. Baruk: Prosumpcja jako wielowymiarowe zachowanie rynkowe. Zakres aktywności marketingowej współczesnych nabywców. PWE, Warszawa 2017, s. 23. 20 A. Bańka, 2015, op. cit., s. 8. 21 J. M. Crant: Proactive behavior in organizations. Journal of Management, 26(3)/2000, s. 436. 22 T. S. Bateman, J. M. Crant, op. cit., 1999, s. 63.

32
Table 1. Descriptions of proactive shopping behaviours used in the study Code Description A01 I often buy products that improve my quality of life A02 Consistently I try to buy products which I have imagined A03 If I notice problems during shopping, I inform customer service A04 I react to problems with the quality of goods (e.g. I make a complaint) A05 If I need something or intend to buy something, I do it immediately A06 I make purchase decisions quickly A07 I always use the sales promotions/actions first A08 Changes introduced in stores (e.g. changes in the location of goods) are not a problem for me A09 I try to track price bargains A10 I consult significant purchases with family and friends Source: Authors’ own research.
These statements were used as manifest variables in a simple satisfaction model. The model assumed that customer expectations remain in relation to the perceived quality and indirectly affect the satisfaction.
The selected model did not include the direct impact of expectations on satisfaction because in our previous studies we stated that there was no significant, direct impact of expectations on the satisfaction of supermarket customers23. The satisfaction model used for this study is presented in Figure 1.
Figure 1. Satisfaction model used in the study Source: Authors’ own research. We used structural equation modelling (SEM) methodology to verify the model. Assumptions of the modelling are presented in Table 2. Table 2. Assumptions of constructed models Modelling method Structural equations modelling (SEM)
Partial least squares method (PLS) Measuring manifest variables Survey research
5-point Likert scale Latent variable blocks Reflective Verification of the measurement model
Cronbach’s α coefficient Dillon-Goldstein’s ρ coefficient
Estimation Bootstrap (100 subsamples) Intercept = 0 in inner model equations
Assessment of the moderation effect
Modelling in groups T-test on significance of the difference of the means in groups Coefficient of moderating effect f2
Calculations PLSPM in R environment Source: Authors’ own research.
23 G. Biesok, J. Wyród-Wróbel: Relacje pomiędzy postrzeganą jakością usług i satysfakcją klientów supermarketów. Problemy Jakości 50(5)/2018, s. 27-32.
Expectations Perceived quality Satisfaction

33
Survey questionnaires were distributed in southern Poland, in the Silesian and Lesser Poland voivodships, using a snowball method. After the formal and substantive control, 247 questionnaires were approved for further analysis. The basic characteristics of the surveyed population are presented in Table 2. Table 2. Sample characteristics
Feature Percent Supermarkets Percent Gender female 72,5% Biedronka 34,0% male 27,5% Lidl 17,4% Age no data 1,7% Tesco 8,5% less than 18 yr. 0,8% Kaufland 8,1% 18 – 25 37,5% Lewiatan 6,5% 25 – 40 26,7% Dino 3,6% 40 – 65 30,8% Delikatesy Centrum 3,6% 65+ 2,5% Other 18,3% Voivodship Silesian 85,8% Lesser Poland 14,2% Source: Authors’ own research.
Findings In the first step, a satisfaction model was determined on data from the whole sample (Figure 2). Assessment of the external (measurement) model gave satisfactory results – all blocks of manifest variables showed sufficient internal consistency (Cronbach's α and Dillon-Goldstein’s ρ coefficients were higher than 0.7 – Table 3).
Figure 2. Satisfaction model determined on data from the whole sample Source: Authors’ own research. Table 3. Evaluation of the measurement model Latent variable The number of
manifest variables Cronbach’s α Dillon-Goldstein’s
ρ Expectations 5 0.813 0.870 Perceived quality 8 0.864 0.894 Satisfaction 3 0.856 0.913 Source: Authors’ own research.
Next, the respondents were divided into two groups: those who positively responded to proactive aspect (I agree, I completely agree) and the others. These groups were named respectively: group T and group N. The structure of respondents due to this division is shown in Figure 3.
We determined the model for each of these aspects and for each of these groups separately and examined the differences between the coefficients of the corresponding paths in the model. The significance of this difference was assessed using the t-test. The
Expectations Perceived qualityR2 = 0,399
Satisfaction R2 = 0,513
0,632 p < 0,001
0,717 p < 0,001
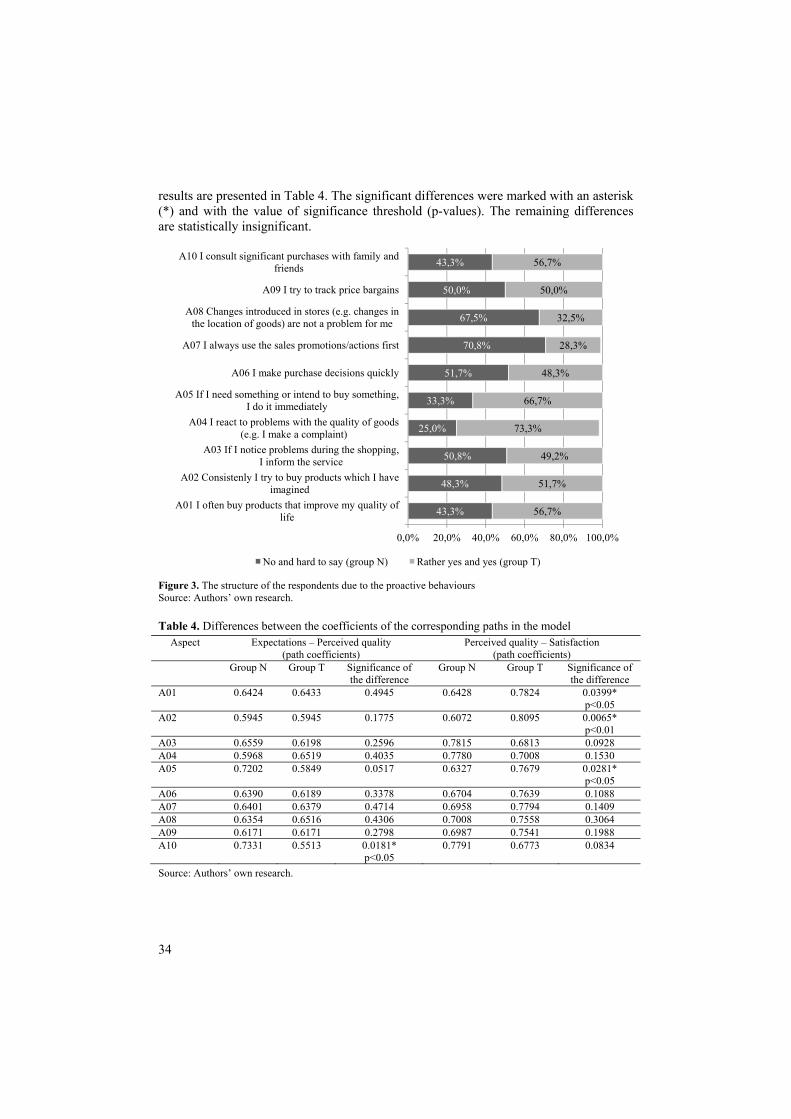
34
results are presented in Table 4. The significant differences were marked with an asterisk (*) and with the value of significance threshold (p-values). The remaining differences are statistically insignificant.
Figure 3. The structure of the respondents due to the proactive behaviours Source: Authors’ own research. Table 4. Differences between the coefficients of the corresponding paths in the model
Aspect Expectations – Perceived quality (path coefficients)
Perceived quality – Satisfaction (path coefficients)
Group N Group T Significance of the difference
Group N Group T Significance of the difference
A01 0.6424 0.6433 0.4945 0.6428 0.7824 0.0399* p<0.05
A02 0.5945 0.5945 0.1775 0.6072 0.8095 0.0065* p<0.01
A03 0.6559 0.6198 0.2596 0.7815 0.6813 0.0928 A04 0.5968 0.6519 0.4035 0.7780 0.7008 0.1530 A05 0.7202 0.5849 0.0517 0.6327 0.7679 0.0281*
p<0.05 A06 0.6390 0.6189 0.3378 0.6704 0.7639 0.1088 A07 0.6401 0.6379 0.4714 0.6958 0.7794 0.1409 A08 0.6354 0.6516 0.4306 0.7008 0.7558 0.3064 A09 0.6171 0.6171 0.2798 0.6987 0.7541 0.1988 A10 0.7331 0.5513 0.0181*
p<0.05 0.7791 0.6773 0.0834
Source: Authors’ own research.
43,3%
48,3%
50,8%
25,0%
33,3%
51,7%
70,8%
67,5%
50,0%
43,3%
56,7%
51,7%
49,2%
73,3%
66,7%
48,3%
28,3%
32,5%
50,0%
56,7%
0,0% 20,0% 40,0% 60,0% 80,0% 100,0%
A01 I often buy products that improve my quality of life
A02 Consistenly I try to buy products which I have imagined
A03 If I notice problems during the shopping, I inform the service
A04 I react to problems with the quality of goods (e.g. I make a complaint)
A05 If I need something or intend to buy something, I do it immediately
A06 I make purchase decisions quickly
A07 I always use the sales promotions/actions first
A08 Changes introduced in stores (e.g. changes in the location of goods) are not a problem for me
A09 I try to track price bargains
A10 I consult significant purchases with family and friends
No and hard to say (group N) Rather yes and yes (group T)
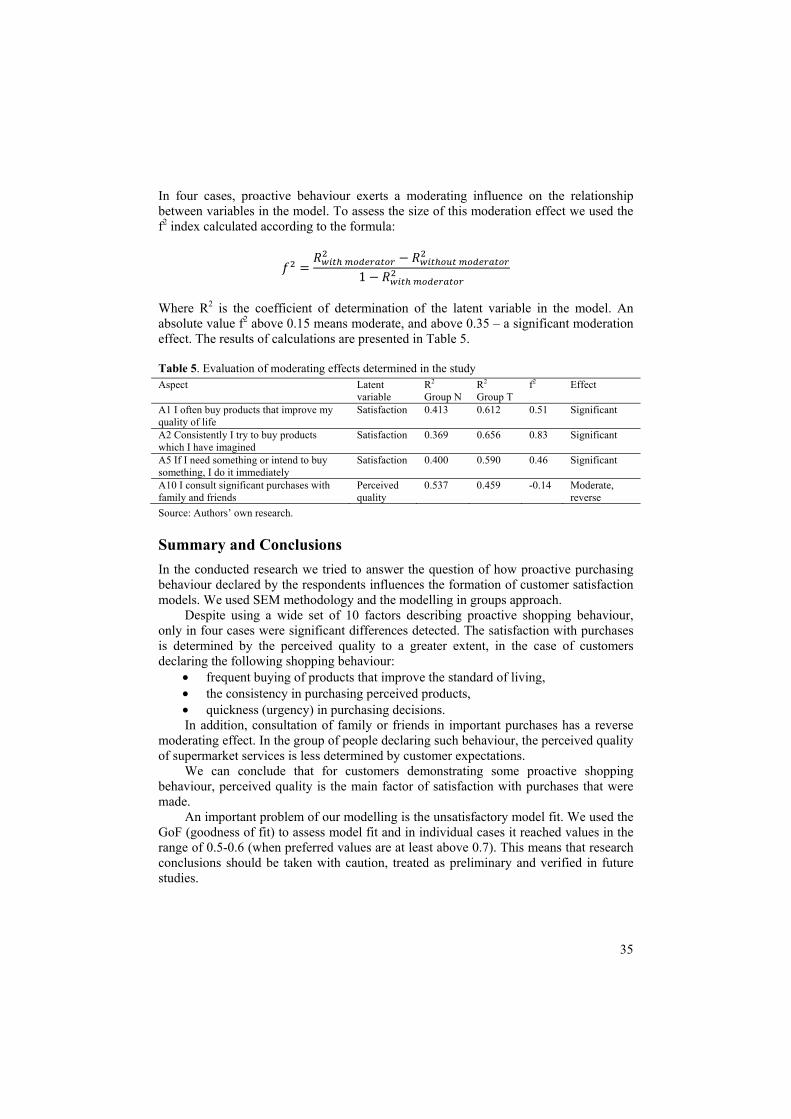
35
In four cases, proactive behaviour exerts a moderating influence on the relationship between variables in the model. To assess the size of this moderation effect we used the f2 index calculated according to the formula: 1
Where R2 is the coefficient of determination of the latent variable in the model. An absolute value f2 above 0.15 means moderate, and above 0.35 – a significant moderation effect. The results of calculations are presented in Table 5. Table 5. Evaluation of moderating effects determined in the study Aspect Latent
variable R2
Group N R2
Group T f2 Effect
A1 I often buy products that improve my quality of life
Satisfaction 0.413 0.612 0.51 Significant
A2 Consistently I try to buy products which I have imagined
Satisfaction 0.369 0.656 0.83 Significant
A5 If I need something or intend to buy something, I do it immediately
Satisfaction 0.400 0.590 0.46 Significant
A10 I consult significant purchases with family and friends
Perceived quality
0.537 0.459 -0.14 Moderate, reverse
Source: Authors’ own research.
Summary and Conclusions In the conducted research we tried to answer the question of how proactive purchasing behaviour declared by the respondents influences the formation of customer satisfaction models. We used SEM methodology and the modelling in groups approach.
Despite using a wide set of 10 factors describing proactive shopping behaviour, only in four cases were significant differences detected. The satisfaction with purchases is determined by the perceived quality to a greater extent, in the case of customers declaring the following shopping behaviour:
• frequent buying of products that improve the standard of living, • the consistency in purchasing perceived products, • quickness (urgency) in purchasing decisions. In addition, consultation of family or friends in important purchases has a reverse
moderating effect. In the group of people declaring such behaviour, the perceived quality of supermarket services is less determined by customer expectations.
We can conclude that for customers demonstrating some proactive shopping behaviour, perceived quality is the main factor of satisfaction with purchases that were made.
An important problem of our modelling is the unsatisfactory model fit. We used the GoF (goodness of fit) to assess model fit and in individual cases it reached values in the range of 0.5-0.6 (when preferred values are at least above 0.7). This means that research conclusions should be taken with caution, treated as preliminary and verified in future studies.
36
In future research it would be necessary to take into account other factors than those described in the publication and to verify their impact on the relations between variables in the model. One can also consider a quantitative description of some proactive factors (e.g. using data on the frequency of purchases, time spent on purchases, etc.).
Further research on proactive shopping attitudes and their impact on customer satisfaction, creating a profile of clients characterized by proactive shopping behaviour, would also have practical implications – it would allow better matching of the product offer, sales space including product displays and the offer of commercial services to the needs of proactive people.
Bibliography Bańka A.: Intencjonalne konstruowanie przyszłości i wyprzedzające realizowanie celów: walidacja Skali Proaktywności Ogólnej. Czasopismo Psychologiczne. Psychological Journal, 21(1)/2015. Baruk A. I.: Prosumpcja jako wielowymiarowe zachowanie rynkowe. Zakres aktywności marketingowej współczesnych nabywców, PWE, Warszawa 2017. Bateman T. S., Crant J. M.: The proactive component of organizational behavior: A measure and correlates, Journal Of Organizational Behavior 14/1993. Bateman T. S., Crant J. M.: Proactive behavior: meaning, impact, recommendations, Business Horizons 42(3)/1999. Biesok G., Wyród-Wróbel J.: Modele satysfakcji klienta, Difin, Warszawa 2016. Biesok G., Wyród-Wróbel J.: Relacje pomiędzy postrzeganą jakością usług i satysfakcją klientów supermarketów, Problemy Jakości 50(5)/2018. Biesok G., Wyród-Wróbel J.: Merchandising w łańcuchu dostaw, Wybrane Zagadnienia Logistyki Stosowanej, Komitet Transportu Polskiej Akademii Nauk, 3/2006. Claes R., Loo K. V.: Relationships of proactive behaviour with job-related affective well-being and anticipated retirement age: an exploration among older employees in Belgium, European Journal of Ageing 8(4)/2011. Crant J. M.: Proactive behavior in organizations, Journal of Management 26(3)/2000. Falkowski A., Tyszka T.: Psychologia zachowań konsumenckich, GWP, Gdańsk 2002. Ismail A., Nowalid W. A. W. M. and Bakar R. A.: Proactive behaviour as a mediator of the relationship between career management andcareer satisfaction, Jurnal Pengurusan (UKM Journal of Management) 48/2016. Liczmańska K.: Kluczowe czynniki determinujące zachowania konsumenckie na przykładzie mieszkańców województwa kujawsko-pomorskiego, Zeszyty Naukowe Uniwersytetu Szczecińskiego, nr 875 Problemy Zarządzania, Finansów i Marketingu 41(2)/2015. Ling N-P., Bandar N. F. A., Halim F. A. and Muda A. L.: Proactive behaviour as a mediator in the relationship between quality of work life and career success, International Journal of Business and Society 18 S4/2017. Mallin M. L., Ragland Ch. B. and T. A. Finkle: The Proactive Behavior of Younger Salespeople: Antecedents and Outcomes, Journal of Marketing Channels 21/2014. Miczyńska-Kowalska M.: Istota konsumpcji i zachowań konsumenckich – zarys problematyki, Annales Universitatis Mariae Curie-Skłodowska Lublin – Polonia, . Vol. XXVI, 9, Sectio I 2001. Mirońska D.: Zachowania nabywców na rynku – trendy i wpływ na działanie przedsiębiorstw, International Journal of Management and Economics 27/2010. Piersiala L.: Strategie zakupowe konsumentów uwarunkowane płcią, Zeszyty Naukowe Politechniki Śląskiej, Seria: Organizacja i Zarządzanie 68(1905)/2014. Rudnicki L.: Zachowania konsumentów na rynku, PWE, Warszawa 2012.

37
Rybowska A.: Zachowania zakupowe klientów sklepów internetowych, Zeszyty Naukowe Akademii Morskiej w Gdyni nr 65, grudzień 2010. Wu Ch. H., Parker S. K.: Thinking and Acting in Anticipation: A Review of Research on Proactive Behavior, Advances in Psychological Science 21(4)/2013.
Proaktywne zachowania zakupowe i ich relacje w prostym modelu satysfakcji
Streszczenie Celem przeprowadzonych badań była chęć weryfikacji czy i w jakim stopniu deklarowane przez respondentów proaktywne zachowania zakupowe wpływają na relacje między oczekiwaniami, postrzeganą jakością a satysfakcją klientów w prostym modelu satysfakcji. Podmiotem badań byli klienci supermarketów.
Autorzy artykułu przyjęli dziesięć zachowań, w których może demonstrować się proaktywna postawa zakupowa. Następnie ustalono modele satysfakcji w grupach respondentów deklarujących lub niedeklarujących dane zachowanie. Głównymi wnioskami wynikającym z analiz jest to, że satysfakcja z zakupów w większym stopniu zdeterminowana jest przez postrzeganą jakość w przypadku klientów deklarujących częste kupowanie produktów, które poprawiają poziom życia, konsekwencję w nabywaniu upatrzonych produktów oraz szybkość (niezwłoczność) podejmowanych decyzji zakupowych. Słowa kluczowe: badania konsumenckie, proaktywne zachowania zakupowe, model satysfakcji, modelowanie równań strukturalnych (SEM) JEL Codes: M310, L810 Information about authors
PhD. Eng. Grzegorz Biesok University of Bielsko-Biała Wydział Zarządzania i Transportu, Katedra Zarzadzania, 43-309 Bielsko-Biała, ul. Willowa 2. e-mail: [email protected] ORCID: 0000-0002-4987-5823 PhD. Eng. Jolanta Wyród-Wróbel University of Bielsko-Biała Wydział Zarządzania i Transportu, Katedra Zarzadzania, 43-309 Bielsko-Biała, ul. Willowa 2. e-mail: [email protected] ORCID: 0000-0001-6018-9755
38
22 (71) 2019 DOI 10.22630/PEFIM.2019.22.71.24
Joanna Błach Monika Wieczorek-Kosmala Uniwersytet Ekonomiczny w Katowicach
Przesłanki działań odpowiedzialnych społecznie
w kontekście czynników kreacji wartości przedsiębiorstwa: wyniki badań
MOTIVES FOR SOCIALLY RESPONSIBLE ACTIVITIES IN
THE CONTEXT OF VALUE CREATION FACTORS: RESEARCH RESULTS
Artykuł prezentuje wyniki badań empirycznych, wpisujących się w nurt dotyczący związku
pomiędzy aktywnością przedsiębiorstwa w obszarze działań społecznie odpowiedzialnych, a efektywnością działalności. Wiele z dotychczas przeprowadzonych badań empirycznych koncentrowało się na zależnościach zachodzących pomiędzy działaniami CSR a miarami kreacji wartości przedsiębiorstwa. W niniejszych badaniach przyjęto natomiast inną optykę, pozwalającą na ocenę związku pomiędzy działaniami CSR a czynnikami istotnymi dla kreacji wartości przedsiębiorstwa (w oparciu o wyniki badania ankietowego). Celem badań była weryfikacja hipotezy o występowaniu zależności pomiędzy realizacją działań CSR a rangą korzyści z tych działań, identyfikowanych w aspektach i obszarach działalności o kluczowym znaczeniu dla poprawy zdolności do kreacji wartości przedsiębiorstwa. Badania wykazały, że przedsiębiorstwa, które wykazują się wyższą aktywnością działań CSR oraz podejmujące takie działania regularnie, wyżej oceniły korzyści z tym związane, istotne dla poprawy zdolności do kreacji wartości.
Słowa kluczowe: odpowiedzialność społeczna przedsiębiorstwa, czynnik kreacji wartości przedsiębiorstwa, teoria interesariuszy JEL codes: G32, O16, M14
Wstęp Koncepcja społecznej odpowiedzialności przedsiębiorstwa (CSR) jest definiowana w różny sposób, z uwzględnieniem różnych wymiarów (ekonomicznego, środowiskowego i społecznego), przejawów i kontekstów (relacje z interesariuszami, dobrowolność) podejmowanych działań1. Kluczową kwestią są oczekiwania społeczne, na które przedsiębiorstwo odpowiada poprzez swoje działania, w celu uzyskania akceptacji społecznej, zwiększenia prestiżu i budowy kapitału zaufania2. Nawiązuje to do zasad dobroczynności i powiernictwa, które tworzą fundament społecznej odpowiedzialności biznesu. 1 A. Dahlsrud: How corporate social responsibility is defined: an analysis of 37 definitions, Corporate Social Responsibility and Environmental Management 15/2008, s. 1-13. 2 A.B. Carroll: A three-dimensional conceptual model of corporate social performance, Academy of Management Review 4(4)/1979, s. 497-506; S.P. Sethi: Dimensions of corporate social responsibility,
39
Zainteresowanie koncepcją CSR wzrasta pod wpływem popularyzacji koncepcji zrównoważonego rozwoju czy wzrostu świadomości społeczeństwa w zakresie kosztów zewnętrznych działalności przedsiębiorstw (problemy społeczne, etyczne czy ekologiczne). Społeczeństwo oczekuje, że przedsiębiorstwa będą podejmować aktywne działania w celu rozwiązania problemów, do powstania których się przyczyniają3. Jednocześnie poprawa transparentności działania, pozwala interesariuszom ocenić czy przedsiębiorstwo odpowiada na zgłaszane przez nich oczekiwania4. Niniejszy artykuł wpisuje się natomiast w nurt badawczy dotyczący związku pomiędzy aktywnością CSR a osiąganymi wynikami finansowymi. Związek ten jest przedmiotem wielu prac, brakuje jednak jednoznacznych rozstrzygnięć w tym zakresie. W warstwie koncepcyjnej, prezentowane w niniejszym opracowaniu badania odwołują się głównie do hipotezy wpływu społecznego, a także do teorii interesariuszy5. Podejście to wiąże się z koncepcją „oświeconego” kapitalizmu menedżerskiego, zgodnie z którym maksymalizacja wartości przedsiębiorstwa dla akcjonariuszy nie może odbywać się bez poszanowania interesów pozostałych grup6, a efektywne zarządzanie relacjami z interesariuszami prowadzi do wzrostu wartości przedsiębiorstwa7. Prezentowane w niniejszym opracowaniu badania empiryczne mają na celu udzielić odpowiedzi na pytanie, czy przedsiębiorstwa, które angażują się w działania CSR, identyfikują korzyści podjęcia tych działań w odniesieniu do poprawy zdolności do kreacji wartości.
W części pierwszej artykułu przedstawiono krótki przegląd dotychczasowych badań w nurcie związków pomiędzy aktywnością CSR a wynikami działalności przedsiębiorstwa. W drugiej części omówiono koncepcję i metodykę przeprowadzonych badań empirycznych, a w części trzeciej – wyniki i dyskusję. Ostatnia część zawiera podsumowanie.
Podstawy teoretyczne Analiza potencjalnych związków pomiędzy działalnością CSR a wynikami finansowymi przedsiębiorstwa została przedstawiona w pracy8. Zauważono, że związek ten, jeśli w ogóle występuje9, może mieć charakter pozytywny (hipoteza wpływu społecznego) lub
California Management Review 23(3)/1981, s. 526-538; K.V. Lins, H. Servaes, A.Tamayo: Social capital, trust, and firm performance: The value of corporate social responsibility during the financial crisis, Journal of Finance 72/2017, s.1785-1823. 3 J.D. Margolis, J.P. Walsh: People and Profits? The Search for a Link between a Company’s Social and Financial Performance, Lawrence Erlbaum: Mahwah, New Jersey 2001. 4 R. Bénabou, J. Tirole: Individual and corporate social responsibility, Economica 77/2010, s. 1-19. 5 R.E. Freeman: Strategic Management. A Stakeholder Approach, Pitman Books Limited, Boston 1984;B. Cornell, A.C. Shapiro: Corporate Stakeholders and Corporate Finance, Financial Management Spring 1987, s. 5-14. 6 E. Brigham, J. Houston: Podstawy zarządzania finansami, PWE, Warszawa 2005, s. 41; A. Cwynar, W. Cwynar: Kreowanie wartości spółki poprzez długoterminowe decyzje finansowe, Polska Akademia Rachunkowości, Warszawa – Rzeszów 2007, s.13-14; A. Doś: Warunki i strategie kreacji wartości przedsiębiorstwa w oparciu o odpowiedzialność społeczną –ujęcie syntetyczne, Finansowy Kwartalnik Internetowy „e-Finanse, 7(3)/2011, s. 29-41. 7 A.J. Hillman, G.D. Keim: Shareholder Value, Stakeholder Management and Social Issues: What’s the Bottom Line? Strategic Management Journal 22/2001, s. 125-139. 8 L.E. Preston, D.P. O’Bannon: The corporate social-financial performance relationship: a typology and analysis, Business & Society 36/1997, s. 419-429. 9 Niektóre badania wskazują na brak związku pomiędzy działaniami CSR a wynikami finansowymi przedsiębiorstwa np. M. Brine, R. Brown, G. Hackett: Corporate social responsibility and financial performance in the Australian context, Economic Round-up, Autumn 2007, s. 47-58; R.K. Mittal, N. Sinha, A.
40
negatywny (hipoteza substytucji). Dyskusyjny jest także kierunek oddziaływania, a więc rozstrzygnięcie, czy poprawa sytuacji finansowej przedsiębiorstwa jest rezultatem podejmowanych działań CSR (hipoteza wpływu społecznego), czy też może to wyniki finansowe warunkują skalę zaangażowania przedsiębiorstwa w CSR (hipoteza dostępności środków na działalność CSR)10. Przeprowadzone do tej pory liczne badania empiryczne11 nie pozwalają na sformułowanie jednoznacznych wniosków12.
Znaczna część badań potwierdza hipotezę wpływu społecznego, wskazując na pozytywny, słaby, ale istotny statystycznie związek między tymi wymiarami działalności przedsiębiorstwa13. Można oczekiwać zatem, że włączenie koncepcji CSR
Singh: An analysis of linkage between economic value added and corporate social responsibility, Management Decision 46(9)/2008, s. 1437-1443; M. Sobczyk: W poszukiwaniu wpływu dokonań CSR na wyniki finansowe, Prace Naukowe Uniwersytetu Ekonomicznego We Wrocławiu 436/2016, s. 261-269. 10 Na potencjalne warianty zależności zachodzących między aktywnością CSR a wynikami ekonomicznymi przedsiębiorstwa wskazała także M. Marcinkowska (2010), opisując założenia tezy o harmonii i dysharmonii celów ekonomicznych i działań CSR. Por. M. Marcinkowska: Społeczna odpowiedzialność przedsiębiorstw a ich wyniki ekonomiczne – aspekty teoretyczne, Przegląd Organizacji 10/2010, s. 7-10. 11 Friede G. i inni (2015) opracowali studium ponad 2000 badań empirycznych dotyczących związków między wynikami finansowymi a działalnością CSR, potwierdzające niejednoznaczność wyników. Por. G. Friede, T. Busch, A. Bassen: ESG and financial performance: aggregated evidence from more than 2000 empirical studies, Journal of Sustainable Finance & Investment 5/2015, s. 210-233. 12 Cześć publikowanych badań potwierdza hipotezę substytucji o negatywnym związku między CSR a wynikami finansowymi przedsiębiorstwa, odwołującą się do opinii Friedmana M. (1970) na temat powinności przedsiębiorstwa. Wyższa aktywność CSR prowadzi do wzrostu kosztów i w rezultacie obniżenia wyników finansowych przedsiębiorstwa, w szczególności wydajność i wyniki finansowe przedsiębiorstwa spadają, gdy działania CSR są niespójne i prowadzone sporadycznie, bez połączenia z globalną strategią rozwoju (Tang Z. i inni, 2012). Inne badania potwierdzają hipotezę dostępnych środków wskazującą na zależność działań CSR od wyników finansowych przedsiębiorstwa. Nawiązuje to do stanowiska P. Druckera (1992), zgodnie z którym warunkiem podjęcia pełniej odpowiedzialności przez przedsiębiorstwo za swoich interesariuszy i za swoje oddziaływanie na otoczenie jest osiąganie odpowiednich wyników finansowych. Łączy się to z hipotezą wolnych przepływów pieniężnych – przedsiębiorstwo wykorzystuje wewnętrzne źródła finansowania do działań CSR, zmniejszając zasób środków finansowych pozostających w dyspozycji menedżerów, co ogranicza problem agencji i może być korzystne dla wszystkich interesariuszy (McGuire J.B. i inni, 1988; Whelan T., Fink C., 2016). Podobną niejednoznaczność podkreślają w swojej pracy (Chang D., Kuo L., 2008; Friede G. i inni, 2015). Por. M. Friedman: The social responsibility of business is to increase its profits, New York Times Magazine, September 13 1970, s. 32-33; Z. Tang, C.E. Hull, S. Rothenberg: How corporate social responsibility engagement strategy moderates the CSR–financial performance relationship, Journal of Management Studies 49(7)/2012, s. 1274-1303; P. Drucker: The new society of organizations, Harvard Business Review September- October 1992, s. 95-104; J.B. McGuire, A. Sundgren, T. Schneeweis: Corporate social responsibility and firm performance, Academy of Management Journal 31/1988, s. 854-872; T. Whelan, C. Fink C.: The comprehensive business case for sustainability. Harvard Business Review 21/2016 (October), s. 1-10; D. Chang, L. Kuo: The effects of sustainable development on Firms’ Financial performance – and empirical approach, Sustainable development 16(7)/2008, s. 364-380; G. Friede, T. Busch, A. Bassen: ESG and financial performance: aggregated evidence from more than 2000 empirical studies, Journal of Sustainable Finance & Investment 5/2015, s. 210-233. 13 Fernando C.S. i inni (2017) wykazali, że właściwa polityka zarządzania ryzykiem środowiskowym sprzyja kreacji wartości. Natomiast Waddock S. i Graves S. (1997) zauważyli, że związki między wynikami finansowymi a działalnością CSR zależne są od sektora działalności. Por. C.S. Fernando, M.P. Sharfman, V.B. Uysal: Corporate environmental policy and shareholder value: Following the smart money, Journal of Financial and Quantitative Analysis 52/2017, s. 2013-2051; S. Waddock, S. Graves: Finding the link between stakeholder relations and quality of management, Journal of Investing 6/1997, s. 20–24. Zob. również prace: J.D. Margolis, J.P. Walsh: People and Profits? The Search for a Link between a Company’s Social and Financial Performance, Lawrence Erlbaum: Mahwah, New Jersey 2001; B. Bek-Gaik, B. Rymkiewicz: Społeczna odpowiedzialność przedsiębiorstw a finansowe miary dokonań, Zeszyty Naukowe Uniwersytetu Szczecińskiego, nr 804, Finanse, Rynki Finansowe, Ubezpieczenia
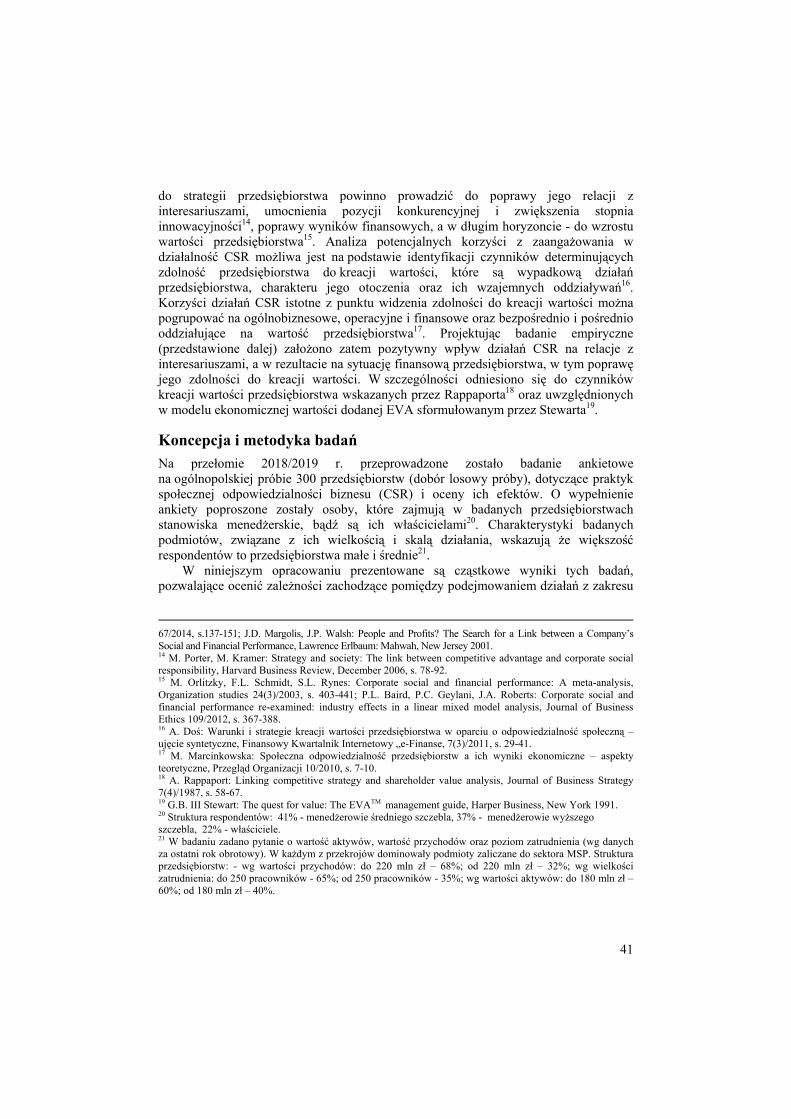
41
do strategii przedsiębiorstwa powinno prowadzić do poprawy jego relacji z interesariuszami, umocnienia pozycji konkurencyjnej i zwiększenia stopnia innowacyjności14, poprawy wyników finansowych, a w długim horyzoncie - do wzrostu wartości przedsiębiorstwa15. Analiza potencjalnych korzyści z zaangażowania w działalność CSR możliwa jest na podstawie identyfikacji czynników determinujących zdolność przedsiębiorstwa do kreacji wartości, które są wypadkową działań przedsiębiorstwa, charakteru jego otoczenia oraz ich wzajemnych oddziaływań16. Korzyści działań CSR istotne z punktu widzenia zdolności do kreacji wartości można pogrupować na ogólnobiznesowe, operacyjne i finansowe oraz bezpośrednio i pośrednio oddziałujące na wartość przedsiębiorstwa17. Projektując badanie empiryczne (przedstawione dalej) założono zatem pozytywny wpływ działań CSR na relacje z interesariuszami, a w rezultacie na sytuację finansową przedsiębiorstwa, w tym poprawę jego zdolności do kreacji wartości. W szczególności odniesiono się do czynników kreacji wartości przedsiębiorstwa wskazanych przez Rappaporta18 oraz uwzględnionych w modelu ekonomicznej wartości dodanej EVA sformułowanym przez Stewarta19.
Koncepcja i metodyka badań Na przełomie 2018/2019 r. przeprowadzone zostało badanie ankietowe na ogólnopolskiej próbie 300 przedsiębiorstw (dobór losowy próby), dotyczące praktyk społecznej odpowiedzialności biznesu (CSR) i oceny ich efektów. O wypełnienie ankiety poproszone zostały osoby, które zajmują w badanych przedsiębiorstwach stanowiska menedżerskie, bądź są ich właścicielami20. Charakterystyki badanych podmiotów, związane z ich wielkością i skalą działania, wskazują że większość respondentów to przedsiębiorstwa małe i średnie21.
W niniejszym opracowaniu prezentowane są cząstkowe wyniki tych badań, pozwalające ocenić zależności zachodzące pomiędzy podejmowaniem działań z zakresu
67/2014, s.137-151; J.D. Margolis, J.P. Walsh: People and Profits? The Search for a Link between a Company’s Social and Financial Performance, Lawrence Erlbaum: Mahwah, New Jersey 2001. 14 M. Porter, M. Kramer: Strategy and society: The link between competitive advantage and corporate social responsibility, Harvard Business Review, December 2006, s. 78-92. 15 M. Orlitzky, F.L. Schmidt, S.L. Rynes: Corporate social and financial performance: A meta-analysis, Organization studies 24(3)/2003, s. 403-441; P.L. Baird, P.C. Geylani, J.A. Roberts: Corporate social and financial performance re-examined: industry effects in a linear mixed model analysis, Journal of Business Ethics 109/2012, s. 367-388. 16 A. Doś: Warunki i strategie kreacji wartości przedsiębiorstwa w oparciu o odpowiedzialność społeczną –ujęcie syntetyczne, Finansowy Kwartalnik Internetowy „e-Finanse, 7(3)/2011, s. 29-41. 17 M. Marcinkowska: Społeczna odpowiedzialność przedsiębiorstw a ich wyniki ekonomiczne – aspekty teoretyczne, Przegląd Organizacji 10/2010, s. 7-10. 18 A. Rappaport: Linking competitive strategy and shareholder value analysis, Journal of Business Strategy 7(4)/1987, s. 58-67. 19 G.B. III Stewart: The quest for value: The EVATM management guide, Harper Business, New York 1991. 20 Struktura respondentów: 41% - menedżerowie średniego szczebla, 37% - menedżerowie wyższego szczebla, 22% - właściciele. 21 W badaniu zadano pytanie o wartość aktywów, wartość przychodów oraz poziom zatrudnienia (wg danych za ostatni rok obrotowy). W każdym z przekrojów dominowały podmioty zaliczane do sektora MSP. Struktura przedsiębiorstw: - wg wartości przychodów: do 220 mln zł – 68%; od 220 mln zł – 32%; wg wielkości zatrudnienia: do 250 pracowników - 65%; od 250 pracowników - 35%; wg wartości aktywów: do 180 mln zł – 60%; od 180 mln zł – 40%.
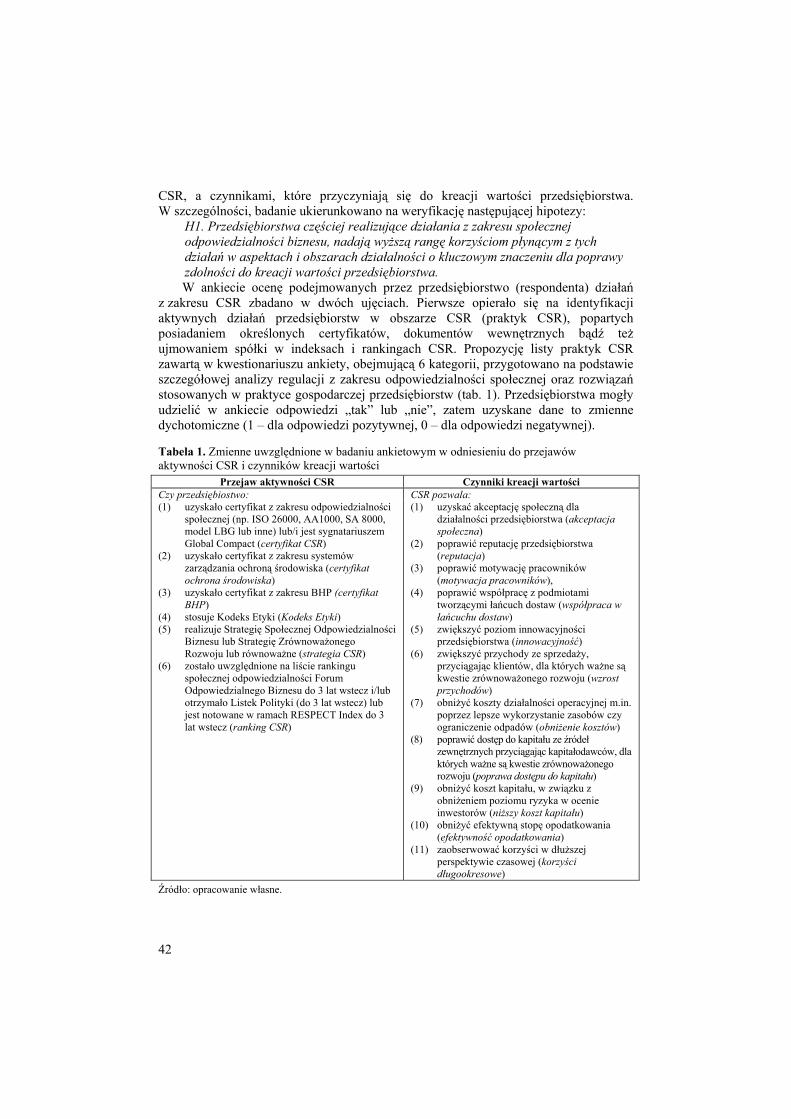
42
CSR, a czynnikami, które przyczyniają się do kreacji wartości przedsiębiorstwa. W szczególności, badanie ukierunkowano na weryfikację następującej hipotezy:
H1. Przedsiębiorstwa częściej realizujące działania z zakresu społecznej odpowiedzialności biznesu, nadają wyższą rangę korzyściom płynącym z tych działań w aspektach i obszarach działalności o kluczowym znaczeniu dla poprawy zdolności do kreacji wartości przedsiębiorstwa. W ankiecie ocenę podejmowanych przez przedsiębiorstwo (respondenta) działań
z zakresu CSR zbadano w dwóch ujęciach. Pierwsze opierało się na identyfikacji aktywnych działań przedsiębiorstw w obszarze CSR (praktyk CSR), popartych posiadaniem określonych certyfikatów, dokumentów wewnętrznych bądź też ujmowaniem spółki w indeksach i rankingach CSR. Propozycję listy praktyk CSR zawartą w kwestionariuszu ankiety, obejmującą 6 kategorii, przygotowano na podstawie szczegółowej analizy regulacji z zakresu odpowiedzialności społecznej oraz rozwiązań stosowanych w praktyce gospodarczej przedsiębiorstw (tab. 1). Przedsiębiorstwa mogły udzielić w ankiecie odpowiedzi „tak” lub „nie”, zatem uzyskane dane to zmienne dychotomiczne (1 – dla odpowiedzi pozytywnej, 0 – dla odpowiedzi negatywnej).
Tabela 1. Zmienne uwzględnione w badaniu ankietowym w odniesieniu do przejawów aktywności CSR i czynników kreacji wartości
Przejaw aktywności CSR Czynniki kreacji wartości Czy przedsiębiostwo: CSR pozwala: (1) uzyskało certyfikat z zakresu odpowiedzialności
społecznej (np. ISO 26000, AA1000, SA 8000, model LBG lub inne) lub/i jest sygnatariuszem Global Compact (certyfikat CSR)
(2) uzyskało certyfikat z zakresu systemów zarządzania ochroną środowiska (certyfikat ochrona środowiska)
(3) uzyskało certyfikat z zakresu BHP (certyfikat BHP)
(4) stosuje Kodeks Etyki (Kodeks Etyki) (5) realizuje Strategię Społecznej Odpowiedzialności
Biznesu lub Strategię Zrównoważonego Rozwoju lub równoważne (strategia CSR)
(6) zostało uwzględnione na liście rankingu społecznej odpowiedzialności Forum Odpowiedzialnego Biznesu do 3 lat wstecz i/lub otrzymało Listek Polityki (do 3 lat wstecz) lub jest notowane w ramach RESPECT Index do 3 lat wstecz (ranking CSR)
(1) uzyskać akceptację społeczną dla działalności przedsiębiorstwa (akceptacja społeczna)
(2) poprawić reputację przedsiębiorstwa (reputacja)
(3) poprawić motywację pracowników (motywacja pracowników),
(4) poprawić współpracę z podmiotami tworzącymi łańcuch dostaw (współpraca w łańcuchu dostaw)
(5) zwiększyć poziom innowacyjności przedsiębiorstwa (innowacyjność)
(6) zwiększyć przychody ze sprzedaży, przyciągając klientów, dla których ważne są kwestie zrównoważonego rozwoju (wzrost przychodów)
(7) obniżyć koszty działalności operacyjnej m.in. poprzez lepsze wykorzystanie zasobów czy ograniczenie odpadów (obniżenie kosztów)
(8) poprawić dostęp do kapitału ze źródeł zewnętrznych przyciągając kapitałodawców, dla których ważne są kwestie zrównoważonego rozwoju (poprawa dostępu do kapitału)
(9) obniżyć koszt kapitału, w związku z obniżeniem poziomu ryzyka w ocenie inwestorów (niższy koszt kapitału)
(10) obniżyć efektywną stopę opodatkowania (efektywność opodatkowania)
(11) zaobserwować korzyści w dłuższej perspektywie czasowej (korzyści długookresowe)
Źródło: opracowanie własne.

43
Drugie ujęcie opierało się na deklaracji respondentów dotyczącej częstotliwości zaangażowania przedsiębiorstwa w realizację inicjatyw z zakresu CSR. Respondenci proszeni zostali o wskazanie, czy działania z zakresu CSR są podejmowane w ich przedsiębiorstwie: (1) regularnie (jako cykliczne aktywności wpisane na stałe w strategię działania), (2) okazjonalnie (jednorazowe akcje związane z określonymi potrzebami), czy też (3) w ogóle nie są realizowane.
Czynniki sprzyjające kreacji wartości oparto natomiast w ankiecie na ujęciu A. Rappaporta i G. Stewarta22. Respondenci poproszeni zostali o wskazanie, w jakim stopniu prawdziwe są określone stwierdzenia, odnoszące się do korzyści wynikających z działań odpowiedzialnych społecznie. Pytanie zawierało instrukcję, by odpowiedź na pytanie udzielona została z perspektywy sytuacji badanego przedsiębiorstwa (w celu wyeliminowania subiektywnej oceny respondenta). Ocena stopnia zgodności z ujętymi w pytaniu stwierdzeniami (związanymi z czynnikami kreacji wartości przedsiębiorstwa) dokonywana była na siedmiostopniowej skali Likerta. W kwestionariuszu ankiety zaproponowano listę 11 kategorii korzyści płynących z działań CSR, obejmującą zarówno bezpośrednie, jak i pośrednie czynniki kreacji wartości przedsiębiorstwa oraz uwzględniające relacje przedsiębiorstwa z różnymi grupami interesariuszy tj. pracownikami, dostawcami, klientami, inwestorami, właścicielami i społeczeństwem (tab. 1).
Wyniki badań i dyskusja Większość spośród badanych przedsiębiorstw wykazywała się aktywnością w podejmowaniu działań z zakresu CSR, potwierdzoną posiadaniem stosownych certyfikatów, regulacji wewnętrznych, bądź oceną zewnętrzną (rys. 1, Panel A). W badanej grupie największa grupa przedsiębiorstw posiadała certyfikat z zakresu BHP (ok. 82% badanych), certyfikat z zakresu ochrony środowiska (ok. 67% badanych) oraz Kodeks Etyki (ok. 61% badanych). Należy podkreślić, iż prawie połowa badanych podmiotów (ponad 48%) potwierdziła posiadanie strategii społecznej odpowiedzialności biznesu lub strategii zrównoważonego rozwoju.
Rysunek 1. Wyznaczniki aktywności działań CSR w badanych przedsiębiorstwach (odsetek przedsiębiorstw wg kategorii praktyk CSR i ich częstotliwości) Źródło: opracowanie własne.
22 G.B. III Stewart: The quest for value: The EVATM management guide, Harper Business, New York 1991; A. Rappaport: Linking competitive strategy and shareholder value analysis, Journal of Business Strategy 7(4)/1987, s. 58-67
81,8%
67,0%
60,7%
48,3%
31,7%
17,3%
Certyfikat BHP
Certyfikat ochrona …
Kodeks Etyki
Strategia CSR
Certyfikat CSR
Ranking CSR
Panel A. Praktyki CSR
nigdy
14,3%
okazjonaln
ie53,0%
regularnie32,7%
Panel B. Częstotliwość działań CSR
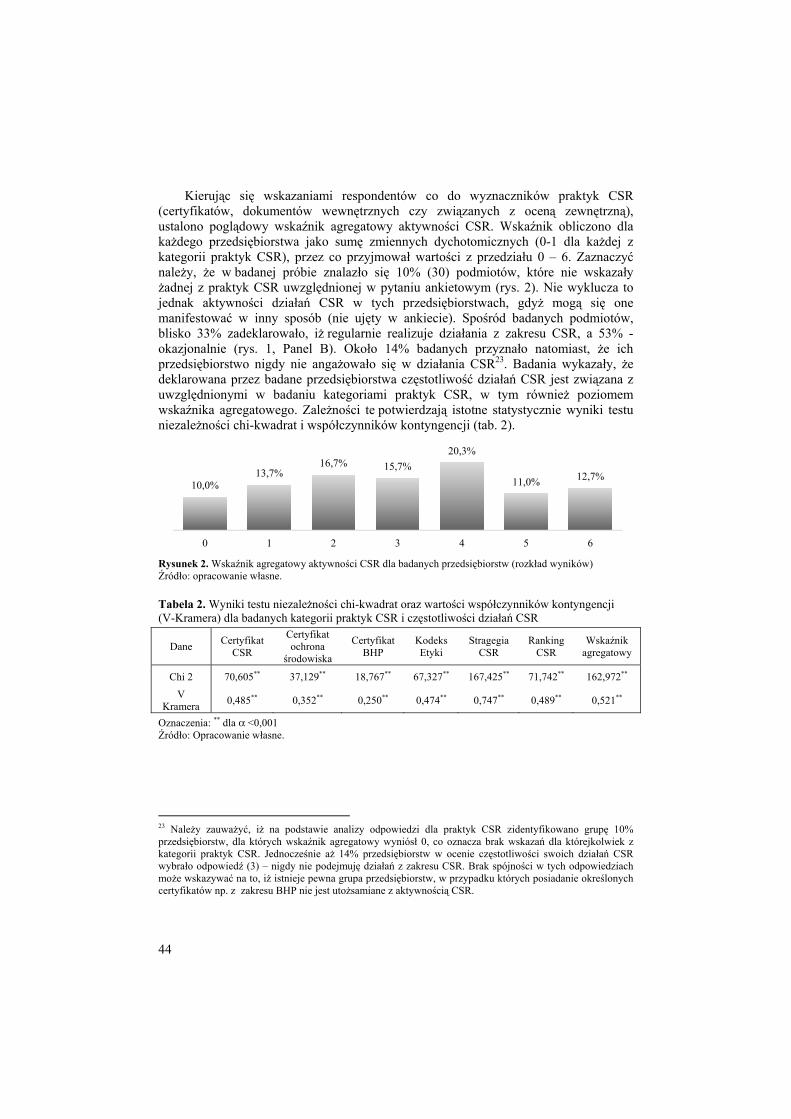
44
Kierując się wskazaniami respondentów co do wyznaczników praktyk CSR (certyfikatów, dokumentów wewnętrznych czy związanych z oceną zewnętrzną), ustalono poglądowy wskaźnik agregatowy aktywności CSR. Wskaźnik obliczono dla każdego przedsiębiorstwa jako sumę zmiennych dychotomicznych (0-1 dla każdej z kategorii praktyk CSR), przez co przyjmował wartości z przedziału 0 – 6. Zaznaczyć należy, że w badanej próbie znalazło się 10% (30) podmiotów, które nie wskazały żadnej z praktyk CSR uwzględnionej w pytaniu ankietowym (rys. 2). Nie wyklucza to jednak aktywności działań CSR w tych przedsiębiorstwach, gdyż mogą się one manifestować w inny sposób (nie ujęty w ankiecie). Spośród badanych podmiotów, blisko 33% zadeklarowało, iż regularnie realizuje działania z zakresu CSR, a 53% - okazjonalnie (rys. 1, Panel B). Około 14% badanych przyznało natomiast, że ich przedsiębiorstwo nigdy nie angażowało się w działania CSR23. Badania wykazały, że deklarowana przez badane przedsiębiorstwa częstotliwość działań CSR jest związana z uwzględnionymi w badaniu kategoriami praktyk CSR, w tym również poziomem wskaźnika agregatowego. Zależności te potwierdzają istotne statystycznie wyniki testu niezależności chi-kwadrat i współczynników kontyngencji (tab. 2).
Rysunek 2. Wskaźnik agregatowy aktywności CSR dla badanych przedsiębiorstw (rozkład wyników) Źródło: opracowanie własne. Tabela 2. Wyniki testu niezależności chi-kwadrat oraz wartości współczynników kontyngencji (V-Kramera) dla badanych kategorii praktyk CSR i częstotliwości działań CSR
Dane Certyfikat CSR
Certyfikat ochrona
środowiska
Certyfikat BHP
Kodeks Etyki
Stragegia CSR
Ranking CSR
Wskaźnik agregatowy
Chi 2 70,605** 37,129** 18,767** 67,327** 167,425** 71,742** 162,972** V
Kramera 0,485** 0,352** 0,250** 0,474** 0,747** 0,489** 0,521**
Oznaczenia: ** dla α <0,001 Źródło: Opracowanie własne.
23 Należy zauważyć, iż na podstawie analizy odpowiedzi dla praktyk CSR zidentyfikowano grupę 10% przedsiębiorstw, dla których wskaźnik agregatowy wyniósł 0, co oznacza brak wskazań dla którejkolwiek z kategorii praktyk CSR. Jednocześnie aż 14% przedsiębiorstw w ocenie częstotliwości swoich działań CSR wybrało odpowiedź (3) – nigdy nie podejmuję działań z zakresu CSR. Brak spójności w tych odpowiedziach może wskazywać na to, iż istnieje pewna grupa przedsiębiorstw, w przypadku których posiadanie określonych certyfikatów np. z zakresu BHP nie jest utożsamiane z aktywnością CSR.
10,0%13,7%
16,7% 15,7%20,3%
11,0% 12,7%
0 1 2 3 4 5 6

45
Analiza korespondencji wykazała24, że przedsiębiorstwa deklarujące brak podejmowania działań na rzecz CSR miały najczęściej zerowy wskaźnik agregatowy aktywności CSR, zaś przedsiębiorstwa deklarujące regularność takich działań miały przeważnie wskaźnik agregatowy aktywności CSR na poziomie 5 lub 6. Ze względu na pozytywnie zweryfikowane zależności, w dalszej analizie przyjęto, że wyznacznikiem aktywności CSR jest deklarowana regularność podejmowania takich działań.
Na rys. 3. zaprezentowano średnią wartość wskazań respondentów (wg skali Likerta) na poszczególne kategorie korzyści wynikających z podejmowania działań CSR w ich przedsiębiorstwach. Wyraźnie zauważalne jest, iż respondenci wyższą rangę nadali korzyściom pośrednio związanym z kreacją wartości przedsiębiorstwa, w szczególności możliwości poprawy reputacji i wzrostu akceptacji społecznej. Korzyści bezpośrednio związane z wartością przedsiębiorstwa (takie jak: poprawa dostępu do kapitału, niższy koszt kapitału, wzrost przychodów czy obniżenie kosztów) otrzymały nieco niższą rangę (ok. 4,9). Poddane analizie korzyści płynące z działań CSR można również przeanalizować przez pryzmat relacji przedsiębiorstwa z poszczególnymi grupami interesariuszy. Na podstawie częstości odpowiedzi potwierdzających zgodność opinii przedsiębiorstw z przedstawionymi w kwestionariuszu korzyściami, można zauważyć ich najwięcej przedsiębiorstw wskazuje na efekty odnoszące się do relacji ze społeczeństwem (76% przedsiębiorstw), następnie – z dostawcami (74% przedsiębiorstw) oraz klientami (66% przedsiębiorstw). Korzyści odnoszące się do relacji przedsiębiorstwa z pozostałymi interesariuszami: pracownikami, inwestorami i właścicielami są wskazywane przez ok. 64-63% badanych przedsiębiorstw. Wyniki te są zatem spójne z przedstawionym na rys. 3 rankingiem korzyści.
Rysunek 3. Średnie rangi dla korzyści wynikających z podejmowania działań CSR w badanych przedsiębiorstwach Źródło: Opracowanie własne.
24 Wnioski te wynikają z analizy mapy percepcji (jako graficznej prezentacji wyników analizy korespondencji), która nie została tu zaprezentowana z uwagi na ograniczenie objętości opracowania.
4,663
4,830
4,910
4,913
4,923
4,957
4,973
4,987
5,100
5,147
5,240
efektywność opodatkowania
motywacja pracowników
obniżenie kosztów
wzrost przychodów
niższy koszt kapitału
poprawa dostępu do kapitału
korzyści długookresowe
innowacyjność
współpraca w łańcuchu dostaw
akceptacja społeczna
reputacja

46
Dane CSR jest zistotne statkontyngenstatystyczn Tabela 3. W(V-Kramera
Dane
Chi 2
V Kramera Kruskal-Wallis
Dane
Chi 2
V Kramera
Kruskal-Wallis
Oznaczenia: *Źródło: Opra
Rysunek 4. Mdziałań Źródło: Opra
zaprezentowzwiązana z dotystycznie wy
ncji wskazują, nie.
Wyniki testu niea) dla częstotliw
Korzyśc
Reputacja As
74,587**
0,282**
40,122**
Korzyści Poprawa dostę
kapitału
34,304*
0,239*
32,322**
** dla α <0,001; *cowanie własne.
Mapa percepcji d
cowanie własne.
wane w tabeli ostrzeganiem wyniki testu nieże zależnośc
ezależności chi-wości działań Cci pośrednio zwią
Akceptacja społeczna
Wsw ł
d
41,559** 56
0,263** 0
34,632** 49
bezpośrednio zwępu do
Niższykapi
33,3
0,2
* 30,3
* dla α <0,05;
dla mediany rang
3 pozwalają
wymiernych kezależności chci te są słabe l
-kwadrat oraz wCSR i oceny wynązane ze zdolnoś
spółpraca łańcuchu dostaw
Inno
6,915** 4
0,308** 0
9,483** 3
wiązne ze zdolnoy koszt itału
Wprzy
317* 72
36* 0,
328** 64
g korzyści z dzia
ą stwierdzić, żkorzyści tych hi-kwadrat. Wlub umiarkow
wartości współcnikających z niścią do kreacji w
wacyjność dłu
3,546**
0,269**
9,086**
ością do kreacji Wzrost ychodów
Ok
,320** 7
347**
,634** 7
ałań CSR i często
że częstotliwodziałań, co po
Wartości współwane, ale równ
czynników kontch korzyści
wartości
Korzyści ugookresowe p
31,638*
0,230*
25,690**
wartości Obniżenie kosztów
Eopo
75,600**
0,355**
70,981**
otliwości podejm
ość działań otwierdzają łczynników nież istotne
tyngencji
Motywacja pracowników
64,612**
0,328**
52,650**
fektywność odatkowania
36,816**
0,248**
27,371**
mowania takich
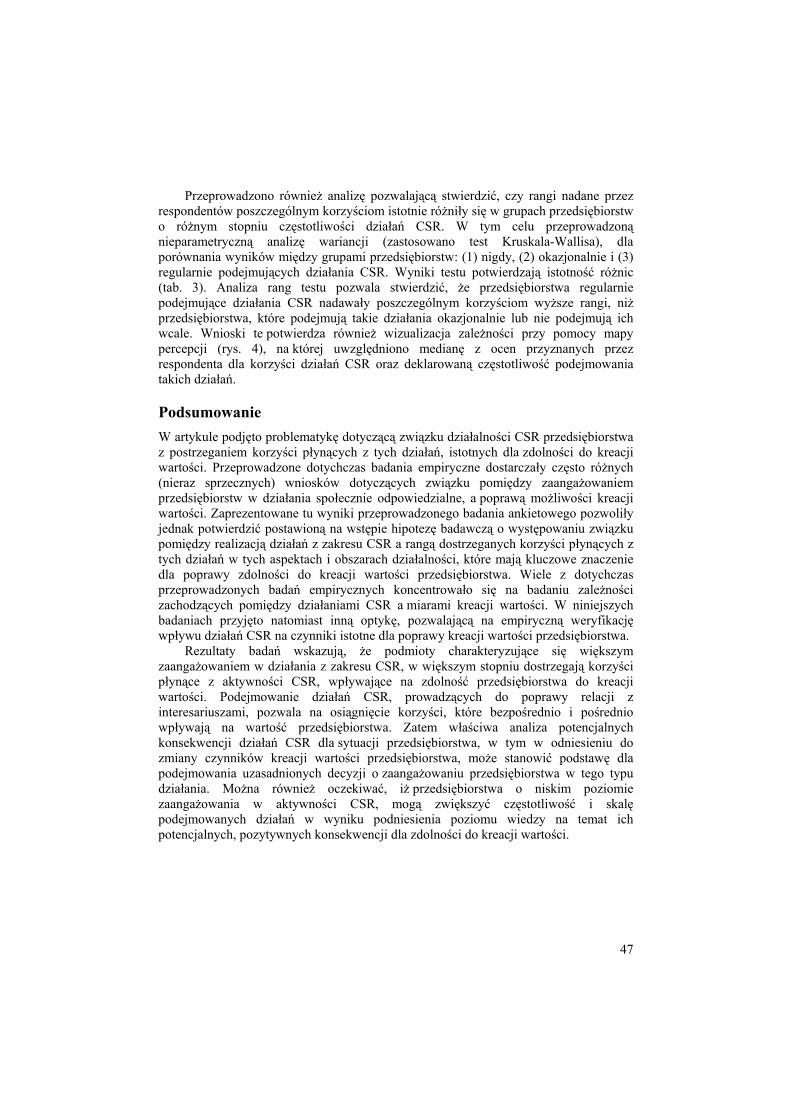
47
Przeprowadzono również analizę pozwalającą stwierdzić, czy rangi nadane przez respondentów poszczególnym korzyściom istotnie różniły się w grupach przedsiębiorstw o różnym stopniu częstotliwości działań CSR. W tym celu przeprowadzoną nieparametryczną analizę wariancji (zastosowano test Kruskala-Wallisa), dla porównania wyników między grupami przedsiębiorstw: (1) nigdy, (2) okazjonalnie i (3) regularnie podejmujących działania CSR. Wyniki testu potwierdzają istotność różnic (tab. 3). Analiza rang testu pozwala stwierdzić, że przedsiębiorstwa regularnie podejmujące działania CSR nadawały poszczególnym korzyściom wyższe rangi, niż przedsiębiorstwa, które podejmują takie działania okazjonalnie lub nie podejmują ich wcale. Wnioski te potwierdza również wizualizacja zależności przy pomocy mapy percepcji (rys. 4), na której uwzględniono medianę z ocen przyznanych przez respondenta dla korzyści działań CSR oraz deklarowaną częstotliwość podejmowania takich działań.
Podsumowanie W artykule podjęto problematykę dotyczącą związku działalności CSR przedsiębiorstwa z postrzeganiem korzyści płynących z tych działań, istotnych dla zdolności do kreacji wartości. Przeprowadzone dotychczas badania empiryczne dostarczały często różnych (nieraz sprzecznych) wniosków dotyczących związku pomiędzy zaangażowaniem przedsiębiorstw w działania społecznie odpowiedzialne, a poprawą możliwości kreacji wartości. Zaprezentowane tu wyniki przeprowadzonego badania ankietowego pozwoliły jednak potwierdzić postawioną na wstępie hipotezę badawczą o występowaniu związku pomiędzy realizacją działań z zakresu CSR a rangą dostrzeganych korzyści płynących z tych działań w tych aspektach i obszarach działalności, które mają kluczowe znaczenie dla poprawy zdolności do kreacji wartości przedsiębiorstwa. Wiele z dotychczas przeprowadzonych badań empirycznych koncentrowało się na badaniu zależności zachodzących pomiędzy działaniami CSR a miarami kreacji wartości. W niniejszych badaniach przyjęto natomiast inną optykę, pozwalającą na empiryczną weryfikację wpływu działań CSR na czynniki istotne dla poprawy kreacji wartości przedsiębiorstwa.
Rezultaty badań wskazują, że podmioty charakteryzujące się większym zaangażowaniem w działania z zakresu CSR, w większym stopniu dostrzegają korzyści płynące z aktywności CSR, wpływające na zdolność przedsiębiorstwa do kreacji wartości. Podejmowanie działań CSR, prowadzących do poprawy relacji z interesariuszami, pozwala na osiągnięcie korzyści, które bezpośrednio i pośrednio wpływają na wartość przedsiębiorstwa. Zatem właściwa analiza potencjalnych konsekwencji działań CSR dla sytuacji przedsiębiorstwa, w tym w odniesieniu do zmiany czynników kreacji wartości przedsiębiorstwa, może stanowić podstawę dla podejmowania uzasadnionych decyzji o zaangażowaniu przedsiębiorstwa w tego typu działania. Można również oczekiwać, iż przedsiębiorstwa o niskim poziomie zaangażowania w aktywności CSR, mogą zwiększyć częstotliwość i skalę podejmowanych działań w wyniku podniesienia poziomu wiedzy na temat ich potencjalnych, pozytywnych konsekwencji dla zdolności do kreacji wartości.

48
Literatura Baird P.L., Geylani P.C., Roberts J.A.: Corporate social and financial performance re-examined: industry effects in a linear mixed model analysis, Journal of Business Ethics 109/2012, s. 367-388. Bek-Gaik B., Rymkiewicz B.: Społeczna odpowiedzialność przedsiębiorstw a finansowe miary dokonań, Zeszyty Naukowe Uniwersytetu Szczecińskiego, nr 804, Finanse, Rynki Finansowe, Ubezpieczenia 67/2014, s.137-151. Bénabou R., Tirole J.: Individual and corporate social responsibility, Economica 77/2010, s. 1-19. Brigham E., Houston J.: Podstawy zarządzania finansami, PWE, Warszawa 2005. Brine M., Brown R., Hackett G.: Corporate social responsibility and financial performance in the Australian context, Economic Round-up, Autumn 2007, s. 47-58. Carroll A.B.: A three-dimensional conceptual model of corporate social performance, Academy of Management Review 4(4)/1979, s. 497-506. Chang D., Kuo L.: The effects of sustainable development on Firms’ Financial performance – and empirical approach, Sustainable Development 16(7)/2008, s. 364-380. Cornell B., Shapiro A.C.: Corporate Stakeholders and Corporate Finance, Financial Management Spring 1987, s. 5-14. Cwynar A., Cwynar W.: Kreowanie wartości spółki poprzez długoterminowe decyzje finansowe, Polska Akademia Rachunkowości, Warszawa – Rzeszów 2007 Dahlsrud A.: How corporate social responsibility is defined: an analysis of 37 definitions, Corporate Social Responsibility and Environmental Management 15/2008, s. 1-13. Doś A.: Warunki i strategie kreacji wartości przedsiębiorstwa w oparciu o odpowiedzialność społeczną –ujęcie syntetyczne, Finansowy Kwartalnik Internetowy „e-Finanse, 7(3)/2011, s. 29-41. Drucker P.: The new society of organizations, Harvard Business Review September- October 1992, s. 95-104. Fernando C.S., Sharfman M.P., Uysal V.B.: Corporate environmental policy and shareholder value: Following the smart money, Journal of Financial and Quantitative Analysis 52/2017, s. 2013-2051. Freeman R.E.: Strategic Management. A Stakeholder Approach, Pitman Books Limited, Boston 1984. Friede G., Busch T., Bassen A.: ESG and financial performance: aggregated evidence from more than 2000 empirical studies, Journal of Sustainable Finance & Investment 5/2015, s. 210-233. Friedman M.: The social responsibility of business is to increase its profits, New York Times Magazine, September 13 1970, s. 32-33. Hillman A.J., Keim G.D.: Shareholder Value, Stakeholder Management and Social Issues: What’s the Bottom Line? Strategic Management Journal 22/2001, s. 125-139. Lins K.V., Servaes H., Tamayo A.: Social capital, trust, and firm performance: The value of corporate social responsibility during the financial crisis, Journal of Finance 72/2017, s.1785-1823. Marcinkowska M.: Społeczna odpowiedzialność przedsiębiorstw a ich wyniki ekonomiczne – aspekty teoretyczne, Przegląd Organizacji 10/2010, s. 7-10. Margolis J.D., Elfenbein H.A., Walsh J.P.: Does it pay to be good … and does it matter? A meta-analysis of the relationship between corporate social and financial performance, 2009. Retrived: http://ssrn.com/abstract=1866371. Access: 12.05.2019. Margolis J.D., Walsh J.P.: People and Profits? The Search for a Link between a Company’s Social and Financial Performance, Lawrence Erlbaum: Mahwah, New Jersey 2001. McGuire J.B., Sundgren A., Schneeweis T.: Corporate social responsibility and firm performance, Academy of Management Journal 31/1988, s. 854-872. Mittal R. K., Sinha N., Singh A.: An analysis of linkage between economic value added and corporate social responsibility, Management Decision 46(9)/2008, s. 1437-1443.

49
Orlitzky M., Schmidt F. L., Rynes S. L.: Corporate social and financial performance: A meta-analysis, Organization studies 24(3)/2003, s. 403-441. Porter M., Kramer M.: Strategy and society: The link between competitive advantage and corporate social responsibility, Harvard Business Review, December 2006, s. 78-92. Preston L.E., O’Bannon D.P.: The corporate social-financial performance relationship: a typology and analysis, Business & Society 36/1997, s. 419-429. Rappaport A.: Linking competitive strategy and shareholder value analysis, Journal of Business Strategy 7(4)/1987, s. 58-67. Sethi S.P.: Dimensions of corporate social responsibility, California Management Review 23(3)/1981, s. 526-538. Sobczyk M.: W poszukiwaniu wpływu dokonań CSR na wyniki finansowe, Prace Naukowe Uniwersytetu Ekonomicznego We Wrocławiu 436/2016, s. 261-269. Stewart G.B. III.: The quest for value: The EVATM management guide, Harper Business, New York 1991. Tang Z., Hull C. E., Rothenberg S.: How corporate social responsibility engagement strategy moderates the CSR–financial performance relationship, Journal of Management Studies 49(7)/2012, s. 1274-1303. Waddock S., Graves S.: Finding the link between stakeholder relations and quality of management, Journal of Investing 6/1997, s. 20–24. Whelan T., Fink C.: The comprehensive business case for sustainability. Harvard Business Review 21/2016 (October), s. 1-10.
Summary The paper presents the results of an empirical study on the relationship between a company’s CSR activities and its performance. Most previous empirical investigations were focused on the interdependencies between CSR activity and metrics of value creation. However, this study adopted a different approach to the problem. Using the data obtained in the questionnaire, the study examined the relationship between CSR activity (its frequency) and the relevance of the benefits of responsible activities that directly or indirectly influence the value creation process. The main purpose was to verify the hypothesis that there are statistically significant interdependencies between companies’ CSR activities and the given benefits of responsible activities as value drivers. The result has shown that companies which are more involved in CSR activities (more regularly) tend to rank higher the benefits of CSR activities that are relevant value drivers.
Keywords: corporate social responsibility, value creation factors, stakeholder theory JEL codes: G32, O16, M14 Informacje o autorach:
Dr hab. Joanna Błach Uniwersytet Ekonomiczny w Katowicach ul. 1 Maja 50, 40-287 Katowice, Polska e-mail: [email protected] ORCID: 0000-0002-6546-2172 Dr hab. Monika Wieczorek-Kosmala, Prof. UE Uniwersytet Ekonomiczny w Katowicach ul. 1 Maja 50, 40-287 Katowice, Polska e-mail: [email protected] ORCID: 0000-0002-7048-0172

50
22 (71) 2019 DOI 10.22630/PEFIM.2019.22.71.25
Tomasz J. Dąbrowski Szkoła Główna Handlowa w Warszawie
Wykorzystanie stron internetowych w komunikowaniu
polityki społecznej odpowiedzialności przez spółki publiczne notowane na GPW w Warszawie*
THE ROLE OF WEBSITES IN COMMUNICATING CSR
POLICY BY PUBLIC COMPANIES LISTED ON THE WARSAW STOCK EXCHANGE
Przedsiębiorstwa, angażując się w działania z zakresu CSR, mogą generować korzystne dla
siebie zachowania interesariuszy i budować reputację. Z drugiej strony niska świadomość interesariuszy dotycząca tych działań i ich nieufność stanowią główne przeszkody w maksymalizowaniu korzyści dla przedsiębiorstw. Rodzi to potrzebę skutecznej komunikacji, która zwiększałaby tę świadomość i niwelowała nieufność. Celem badań przedstawionych w tym artykule było określenie, w jaki sposób spółki notowane na Giełdzie Papierów Wartościowych w Warszawie wykorzystują swoje strony internetowe do komunikowania działań z zakresu CSR. Badania oparto na analizie stron internetowych i zamieszczonych na nich dokumentów. Główne wyniki wskazują, że najważniejszym czynnikiem różnicującym wykorzystanie stron internetowych w komunikacji CSR była wielkość przedsiębiorstwa. Słowa kluczowe: społeczna odpowiedzialność biznesu, komunikacja, Internet, spółki publiczne, interesariusze JEL Codes: M14, M39, D83
Wstęp Komunikowanie polityki społecznej odpowiedzialności stanowi dla przedsiębiorstw szczególne wyzwanie. Związane jest ono ze zróżnicowaniem odbiorców komunikatów dotyczących tej sfery, różnorodnością odnoszących się do niej treści oraz mnogością kanałów komunikacji, którymi przekaz może docierać do odbiorcy. Wyzwanie to wynika także z wyjściowej postawy wielu odbiorców nastawionych sceptycznie do tego typu komunikacji, łączących ją ze zjawiskiem wybielania (greenwashing), czy niewielkiego zainteresowania części interesariuszy sferą społecznej odpowiedzialności biznesu i ich generalnie niskiego poziomu wiedzy w tym zakresie. Dodatkowo, przedsiębiorstwa zajmują się komunikowaniem polityki CSR od stosunkowo niedawna i mają na tym polu znacznie mniej doświadczeń, niż w komunikacji związanej z budowaniem skojarzeń dotyczących ich zdolności do działania i realizowania zadań charakterystycznych dla jednostki gospodarczej. Próby wykorzystywania wiedzy *Artykuł powstał w ramach badań statutowych dotyczących Zarządzania respektującego wartości w koncepcji rozwoju integralnego (humanistycznego), realizowanych pod kierunkiem dr hab. Magdaleny Mikołajek-Gocejny, prof. SGH (nr badania KNOP/S17/02/17).

51
i umiejętności zdobytych w jednym obszarze do rozwijania komunikacji odnoszącej się do zupełnie innych zagadnień w wielu przypadkach kończą się niepowodzeniem.
Komunikacja związana ze społeczną odpowiedzialnością biznesu stanowi materię nową nie tylko dla przedsiębiorstw, ale również dla badaczy. Zwraca się uwagę na fragmentację badań z tego zakresu i różnorodność perspektyw, z których problematyka ta jest analizowana, a jednocześnie na rosnące zainteresowanie, jakim się ona cieszy1. Dokonując przeglądu literatury przedmiotu Golob i in.2 zidentyfikowali główne obszary tematyczne badań obejmujące: ujawnianie informacji (strategie, narzędzia komunikacji, media, oczekiwania interesariuszy), proces komunikacji oraz jej skutki z punktu widzenia przedsiębiorstw i konsumentów. Badania, których wyniki przedstawiono w artykule mieszczą się w pierwszym z wymienionych obszarów. Mają zarówno walor praktyczny, odnosząc się do kwestii stanowiących istotne wyzwanie dla przedsiębiorstw, jak i poznawczy, wzbogacając wiedzę dotyczącą wykorzystania przez podmioty gospodarcze własnych stron internetowych w komunikowaniu swojej polityki społecznej odpowiedzialności.
Znaczenie polityki społecznej odpowiedzialności i jej komunikowanie Społeczna odpowiedzialność biznesu może być rozpatrywana z różnych perspektyw. Począwszy od lat 90. XX w. w literaturze i badaniach z tego zakresu silnie obecny jest nurt akcentujący perspektywę ekonomiczną. W obrębie tego nurtu rozpatrywane są różnego typu korzyści, jakie niesie dla przedsiębiorstw odpowiednio zaprojektowana polityka społecznej odpowiedzialności oraz analizowane są związki między prowadzeniem tej polityki a wynikami finansowymi3. Wśród korzyści zwraca się uwagę zarówno na te, które mają charakter endogeniczny, jak i na takie, które odnoszą się do sfery relacji organizacji z otoczeniem. Do korzyści wewnętrznych można zaliczyć wzrost identyfikacji pracowników z przedsiębiorstwem4oraz zmniejszenie ryzyka nadużyć wynikające ze zwiększenia roli etyki w kształtowaniu kultury organizacyjnej5. Korzyści zewnętrzne obejmują zaś wzrost atrakcyjności podmiotu wśród potencjalnych pracowników6, poprawę oceny przedsiębiorstwa i jego produktów7oraz zwiększenie (w pewnych warunkach) ich atrakcyjności dla klientów8, a także silniejsze
1Golob U., Verk N., Ellerup-Nielsen A., Thomsen C., Elving W.J.L., Podnar K., The communicative stance of CSR: reflections on the value of CSR communication, „Corporate Communications: An International Journal” 2017, Vol. 22, No. 2. 2Golob U., Podnar K., Elving W.J., Ellerup Nielsen A., Thomsen C., Schultz F., CSR communication: quo vadis?, „Corporate Communications: An International Journal” 2013, Vol. 18, No. 2. 3 Carroll A.B., Shabana K.M., The Business Case for Corporate Social Responsibility: A Review of Concepts, Research and Practice, „International Journal of Management Reviews” 2010, Vol. 12, No. 1. 4Peloza J., Papania L., The Missing Link Between Corporate Social Responsibility and Financial Performance: Stakeholder Salience and Identification. „Corporate Reputation Review” 2008, Vol. 11, No. 2. 5Treviño L.K., Weaver G.R., Gibson D.G., Toffler B.L., Managing ethics and legal compliance: What works and what hurts, “California Management Review” 1999, Vol. 41, No. 2. 6 Turban D.B., Greening D.W., Corporate social performance and organizational attractiveness to prospective employees, “Academy of Management Journal” 1997, Vol. 40, No. 3. 7 Brown T.J., Dacin P.A., The Company and the Product: Corporate Associations and Consumer Product Responses, „Journal of Marketing” 1997, Vol. 61, No. 1. 8 Sen S., Bhattacharya C.B., Does Doing Good Always Lead to Doing Better? Consumer Reactions to Corporate Social Responsibility, „Journal of Marketing Research” 2001, Vol. 38, No. 2.

52
zaangażowanie emocjonalne konsumentów prowadzące w konsekwencji do intencji zakupu9, wzrost poczucia satysfakcji u klientów10 i podwyższenie się poziomu ich zaufania11. Dodatkowo, podnosi się kwestię wpływu społecznej odpowiedzialności na przewagę konkurencyjną12oraz na reputację przedsiębiorstwa13.
Szerokie spektrum korzyści związanych z polityką społecznej odpowiedzialności, jakie są udziałem prowadzących ją przedsiębiorstw znajduje swoje odzwierciedlenie w osiąganych przez te podmioty wynikach finansowych. Potwierdzają to zarówno rezultaty badań przeglądowych, obejmujących metaanalizę licznych uzyskanych wcześniej wyników14, jak i studia empiryczne dotyczące występowania związków między polityką CSR, jej elementami lub oceną a sytuacją finansową przedsiębiorstw rozpatrywaną w ujęciu księgowym bądź rynkowym. Przedmiotem analizy były między innymi relacje między działaniami w zakresie ochrony środowiska naturalnego i aktywnością prospołeczną a zmianami wartości rynkowej przedsiębiorstwa15, między poziomem wydatków na dobroczynność a przyszłymi przychodami16, między tego typu wydatkami a rynkową stopą zwrotu skorygowaną o ryzyko17, między zmianą oceny polityki społecznej odpowiedzialności podmiotu, skutkującą jego włączeniem do indeksu etycznego lub wykluczeniem go z niego a różnymi zmiennymi kształtującymi wartość rynkową przedsiębiorstwa18.
Przedstawione dotychczas rozważania dowodzą dużego znaczenia polityki społecznej odpowiedzialności, która gdy jest odpowiednio zaprojektowana stanowi dla przedsiębiorstwa źródło korzyści rynkowych, reputacyjnych i finansowych. Rodzi się pytanie, czy podobnie istotna jest komunikacja związana z tą polityką. Jest to pytanie
9 Pérez R.C., Effects of Perceived Identity Based on Corporate Social Responsibility: The Role of Consumer Identification with the Company, „Corporate Reputation Review” 2009, Vol. 12, No. 2. 10 Luo X., Bhattacharya C.B., Corporate Social Responsibility, Customer Satisfaction, and Market Value, „Journal of Marketing” 2006, Vol. 70, No. 4. 11Pivato S. Misani N., Tencati A., The Impact of Corporate Social Responsibility on Consumer Trust: The Case of Organic Food, „Business Ethics: A European Review” 2008, Vol. 17, No. 1. 12 Porter M.E., Kramer M.R., Creating Shared Value. How to reinvent capitalism — and unleash a wave of innovation and growth, „Harvard Business Review” 2011, January-February. 13Brammer S., Pavelin S., Building a good reputation, „European Management Journal” 2004, Vol. 22, No. 6; Siltaoja M.E., Value Priorities as Combining Core Factors between CSR and Reputation – A Qualitative Study, „Journal of Business Ethics” 2006, Vol. 68, No. 1; Soppe A.B.M., Schauten M.B.J., Soppe J. and Kaymak U., Corporate Social Responsibility Reputation (CSRR): Do Companies Comply to their Raised CSR Expectations?, „Corporate Reputation Review” 2011, Vol. 14, No. 4. 14 Margolis D., Walsh J.P., Misery Loves Companies: Rethinking Social Initiatives by Business, „Administrative Science Quarterly” 2003, Vol. 48; Orlitzky M., Schmidt F.L., Rynes S.L., Corporate social and financial performance: A metaanalysis, „Organization Studies” 2003, Vol. 24, No. 3. 15 Von Arx U., Ziegler A., The Effect of CSR on Stock Performance: New Evidence for the USA and Europe, „Quantitative Finance” 2014, Vol. 14, No. 6. 16 Lev B., Petrovits C., Radhakrishnan S., Is doing good good for you? How corporate charitable contributions enhance revenue growth, „Strategic Management Journal” 2010, Vol. 31, No. 2. 17Brammer S., Millington A.I., Does it pay to be different? an analysis of the relationship between corporate social and financial performance „Strategic Management Journal” 2008, Vol. 29, No. 12. 18Consolandi C., Jaiswal-Dale A., Poggiani E., Vercelli A., Global Standards and Ethical Stock Indexes: The Case of the Dow Jones Sustainability Stoxx Index, „Journal of Business Ethics” 2009, Vol. 87, No. 1; Ramchander S., Schwebach R.G., Staking K., The informational relevance of corporate social responsibility: evidence from DS400 index reconstitutions, „Strategic Management Journal” 2012, Vol. 33, No. 3; Adamska A., Dąbrowski T.J., Do Investors Appreciate Information about Corporate Social Responsibility? Evidence from the Polish Equity Market „InzinerineEkonomika-Engineering Economics” 2016, Vol. 27, No. 4.
53
o tyle znaczące, że komunikacja tego typu wcale nie musi być pozytywnie postrzegana. Jak już bowiem sygnalizowano, przynajmniej część odbiorców ma do niej stosunek negatywny, traktując ją jako przejaw manipulacji nastawionej na wybielanie, czy upiększanie obrazu przedsiębiorstwa (window dressing). Poszukując odpowiedzi na pytanie o znaczenie komunikacji odnoszącej się do polityki CSR podmiotu warto rozpatrzyć je na trzech płaszczyznach. Pierwsza obejmuje komunikację jako element samej polityki społecznej odpowiedzialności. W przypadku takich składowych tej polityki, jak programy etyczne, mające służyć kształtowaniu bardziej wrażliwej etycznie kultury organizacyjnej, dialog z interesariuszami, społeczne kampanie informacyjne, czy projekty z zakresu cause-related marketingu, komunikacja stanowi immanentną część działań związanych z danym elementem polityki CSR i bez niej polityka w tym obszarze nie mogłaby być realizowana.
Druga płaszczyzna dotyczy komunikacji mającej na celu przekazywanie informacji o inicjatywach z zakresu społecznej odpowiedzialności podejmowanych przez przedsiębiorstwo i ich rezultatach. Prezentowany jest pogląd, że „bez komunikacji nieważne, jakiego rodzaju i ile inicjatyw podejmują przedsiębiorstwa, wpływ CSR na ich postrzeganie przez interesariuszy będzie zerowy, bądź nawet negatywny”19. Wskazuje się również, że komunikacja dotycząca sfery CSR wpływa na wizerunek, reputację i wiarygodność podmiotu20. Komunikacji przypada istotna rola informacyjna i edukacyjna polegająca nie tylko na upowszechnianiu wiedzy na temat działań i dokonań podmiotu, ale także wyjaśnianiu motywów oraz tłumaczeniu znaczenia realizowanych inicjatyw i ich wpływu na sytuację różnych grup interesariuszy. Dzięki temu są możliwe właściwa ocena tych inicjatyw przez interesariuszy i redukowanie poziomu ich nieufności wobec działań prowadzonych przez przedsiębiorstwo w ramach jego polityki CSR.
Trzecia płaszczyzna związana jest natomiast z rolą komunikacji jako autonomicznego sygnału wskazującego na podejście podmiotu do polityki społecznej odpowiedzialności i jej komunikowania oraz stopień zaangażowania, jakie w obydwu tych sferach przejawia organizacja. Przedsiębiorstwa dość często traktują społeczną odpowiedzialność biznesu i związaną z nią komunikację jako obszary działań symbolicznych, czyli takich które „zmierzają do osiągnięcia celu bez angażowania znaczących zasobów”21. Działania te należy odróżnić od działań substancjalnych, które są wymierne i wymagają „widocznego wydatkowania zasobów”22. O ile te pierwsze w sferze komunikacji mają ograniczone znaczenie, o tyle te drugie są istotne, bowiem sygnalizują wysoki poziom zaangażowania i stanowią podstawę oceny przedsiębiorstwa wpływającej na zachowania interesariuszy. Dobrym przykładem w tym zakresie mogą
19 Pérez A., Corporate reputation and CSR reporting to stakeholders: Gaps in the literature and future lines of research, „Corporate Communications: An International Journal” 2015, Vol. 20, No. 1, s. 16. 20Pfau M., Haigh M.M., Sims J., Wigley S., The Influence of Corporate Social Responsibility Campaigns on Public Opinion, „Corporate Reputation Review” 2008, Vol. 11, No. 2. 21 Mahon J.F., Corporate Reputation: A Research Agenda Using Strategy and Stakeholder Literature, „Business and Society” 2002, Vol. 41, No. 4, s. 419. 22Galbreath J., How does corporate social responsibility benefit firms? Evidence from Australia, „European Business Review” 2010, Vol. 22, No. 4, s. 417.

54
być wyniki badań wskazujące na wpływ takich działań komunikacyjnych, jak publikowanie raportów społecznej odpowiedzialności na wartość podmiotu23.
Biorąc pod uwagę wszystkie trzy przedstawione płaszczyzny można przyjąć, że komunikacja dotycząca polityki CSR przedsiębiorstwa ma nie mniejsze znaczenie niż sama polityka, jaką w tej sferze prowadzi organizacja.
Proliferacja przekazu dotyczącego polityki społecznej odpowiedzialności przedsiębiorstwa Przedsiębiorstwa nieustannie komunikują się z różnymi grupami interesariuszy starając się kształtować swój pozytywny obraz. Gros tej komunikacji zawiera przekaz dotyczący zdolności do działania, a tylko niewielka część ukierunkowana jest na rozpowszechnianie przesłania związanego ze sferą społecznej odpowiedzialności. Grono odbiorców tych dwóch przekazów pokrywa się jedynie częściowo, a wyjściowa postawa w stosunku do każdego z nich jest inna – w przypadku przekazu odnoszącego się do polityki CSR znacznie bardziej sceptyczna. Wszystko to sprawia, że proliferacja przekazu związanego z polityką społecznej odpowiedzialności przedsiębiorstwa odbywa się w inny sposób, z wykorzystaniem bardziej różnorodnych kanałów komunikacji.
Kanały komunikacji służące rozpowszechnianiu przekazu dotyczącego polityki CSR podmiotu można podzielić na niepowiązane i powiązane z przedsiębiorstwem, a samą komunikację na jednostopniową lub dwustopniową. Głównym kanałem komunikacji niepowiązanym z przedsiębiorstwem są massmedia. W zależności od formy współpracy z nimi podmiot gospodarczy zachowuje większą lub mniejszą kontrolę nad przekazem – większa (w zasadzie pełna) występuje w odniesieniu do reklamy, mniejsza w przypadku działań z zakresu PR. Innym kanałem, najczęściej niepowiązanym z przedsiębiorstwem, są punkty sprzedaży. Mogą być one wykorzystywane jako miejsce rozpowszechniania informacji na temat proekologicznej lub prospołecznej aktywności podmiotu związanej z prowadzonymi kampaniami społecznymi lub realizowanymi programami cause-related marketingu. Ten ostatni instrument marketingu społecznego daje zresztą szczególnie szerokie możliwości komunikacyjne obejmujące łączenie działań przedsiębiorstwa (reklamy w massmediach, aktywności z zakresu PR, umieszczania materiałów w punktach sprzedaży, oznakowywania produktów, aktywności na własnych stronach internetowych, czy w portalach społecznościowych) z działaniami partnerów włączanych do współpracy w ramach programu (najczęściej są to organizacje pozarządowe) i beneficjentów, na rzecz których gromadzone są fundusze24.
Do kanałów komunikacji zależnych od przedsiębiorstwa najpowszechniej używanych w proliferacji przekazu dotyczącego polityki społecznej odpowiedzialności należą własne strony internetowe podmiotu oraz raporty CSR (określane też niekiedy mianem raportów zrównoważonego rozwoju). Wśród największych przedsiębiorstw
23Carnevale C., Mazzuca M., Sustainability Report and Bank Valuation: Evidence from European Stock Markets, „Business Ethics: A European Review” 2014, Vol. 23, No. 1. 24 Dąbrowski T.J., Cause-related marketing w kreowaniu i komunikowaniu polityki społecznej odpowiedzialności biznesu, „Marketing i Rynek” 2011, No. 3.

55
globalnych ponad 95% wykorzystuje pierwszy z tych kanałów25i ponad 90% drugi26. Kanały te mają cały szereg zalet decydujących o ich popularności – nie generują bardzo wysokich kosztów, pozwalają przedsiębiorstwu zachować całkowitą kontrolę nad przekazem, umożliwiają dotarcie z nim do różnych grup interesariuszy i ułatwiają dostarczenie im ważnych informacji dotyczących zaangażowania podmiotu, wywieranego przez niego pozytywnego wpływu, motywacji kryjących się za prospołecznymi, czy proekologicznymi działaniami oraz obrazujących zgodność tych działań z profilem przedsiębiorstwa. Skutkiem przekazywania informacji tego typu jest zmniejszanie się sceptycyzmu interesariuszy wobec polityki społecznej odpowiedzialności podmiotu27. Dodatkowo, własne strony internetowe i raporty dają możliwość w miarę swobodnego kształtowania prezentowanych treści, nie ograniczając ich zakresu, co pozwala na przedstawianie faktów i danych zwiększających konkretność i szczegółowość przekazu. Te cechy przekazu odnoszącego się do działań ze sfery CSR zwiększają siłę jego oddziaływania i podnoszą efektywność w budowaniu reputacji przedsiębiorstwa28.
Obok własnych stron internetowych i raportów ważnymi kanałami komunikowania polityki społecznej odpowiedzialności podmiotu są media społecznościowe i pracownicy. W przypadku mediów społecznościowych, takich jak Facebook, większe znaczenie mają strony korporacyjne, niż strony poświęcone konkretnym inicjatywom realizowanym w ramach tej polityki, bowiem przekaz zawarty na stronach korporacyjnych mocniej wpływa na reputację w zakresie CSR, jaką cieszy się podmiot29. Z kolei pracownicy odgrywają ważną rolę ze względu na swój status wiarygodnego źródła informacji. Jako kanał komunikacji powinni być jednak rozpatrywani w szerszym kontekście . Z jednej strony bowiem są oni odbiorcami przekazu dotyczącego polityki społecznej odpowiedzialności przedsiębiorstwa trafiającego do nich w ramach komunikacji wewnętrznej z drugiej zaś stanowią nadawców tego przekazu w odniesieniu do interesariuszy zewnętrznych30. Dodatkowo pracownicy mogą być również instrumentem polityki CSR chociażby poprzez swoje zaangażowanie w wolontariat pracowniczy. Oprócz mediów społecznościowych i pracowników niekiedy jako kanał komunikowania wybranych elementów polityki prospołecznej bądź prośrodowiskowej przedsiębiorstwa wykorzystywane są opakowania jego produktów. Jest to najczęściej związane z posługiwaniem się przez dany podmiot takimi instrumentami, jak wspominany już cause-related marketing.
Źródłem przekazu dotyczącego polityki CSR przedsiębiorstwa może być ono samo lub podmioty przez niego inspirowane, ale mogą też nim być organizacje i osoby nie pozostające pod wpływem działań komunikacyjnych danej jednostki gospodarczej.
25 Smith K.T., Alexander J., Which CSR-Related Headings Do Fortune 500 Companies Use on Their Websites?, „Business Communication Quarterly” 2013, Vol. 76, No. 2. 26 KPMG, The road ahead. The KPMG Survey of Corporate Responsibility Reporting 2017. 27 Du S., Bhattacharya C.B., Sen S., Maximizing Business Returns to Corporate Social Responsibility (CSR): The Role of CSR Communication, „International Journal of Management Reviews” 2010, Vol. 12, No. 1. 28 Berens G., van Rekom J., How Specific Should Corporate Communication Be?, in: Facets of Corporate Identity, Communication and Reputation, T.C. Melewar (red.), Routledge, New York 2008. 29 Lee S.Y., How can companies succeed in forming CSR reputation?, „Corporate Communications: An International Journal” 2016, Vol. 21, No. 4. 30 Birth G., Illia L., Lurati F., Zamparini A., Communicating CSR: practices among Switzerland's top 300 companies, „Corporate Communications: An International Journal” 2008, Vol. 13, No. 2

56
Taki całkowicie niezależny przekaz bywa związany z oceną polityki społecznej odpowiedzialności poszczególnych podmiotów dokonywaną przez instytucjonalnych mandatariuszy, jakimi są agencje zajmujące się między innymi screeningiem etycznym na potrzeby inwestorów, organizacje pozarządowe, czy media lub z rozprzestrzenianiem informacji przez trudne do zidentyfikowania źródła. W pierwszym przypadku komunikat może mieć charakter syntetyczny i być zawarty w ratingu (np. włączeniu spółki do indeksu etycznego, bądź wykluczenie jej z niego) albo w rankingu, może też przybrać bardziej rozbudowaną postać analizy zamieszczonej w raporcie, reportażu lub innej formie wypowiedzi medialnej, w drugim zaś z reguły związany jest z pogłoską (word of mouth).
Zakres wykorzystania korporacyjnych stron internetowych w komunikowaniu polityki społecznej odpowiedzialności przez spółki publiczne w Polsce – metodyka i wyniki badań Badania dotyczące wykorzystania korporacyjnych stron internetowych w komunikowaniu różnych elementów polityki społecznej odpowiedzialności przedsiębiorstwa były już realizowane, zarówno na świecie31, jak i w Polsce32. Celem badań prezentowanych poniżej było określenie zakresu i sposobu wykorzystywania korporacyjnych stron internetowych w komunikowaniu polityki CSR przez spółki publiczne, których akcje notowane są na rynku regulowanym GPW w Warszawie. W badaniach skoncentrowano się na trzech grupach podmiotów: spółkach z indeksu WIG20 (skład indeksu na dzień 21.03.2018 r.), spółkach z indeksu mWIG40 (skład indeksu na dzień 23.03.2018 r.) i spółkach z indeksu sWIG80 (skład indeksu na dzień 23.03.2018 r.). Wybór spółek publicznych podyktowany był takimi ich cechami jak szerokie grono interesariuszy, czy konieczność sprostania wyższym standardom w zakresie poziomu transparentności. Poza tym zwraca się także uwagę na większe zainteresowanie działalnością takich podmiotów przejawiane przez media i opinię publiczną. Wszystkie te czynniki sprzyjają przywiązywaniu przez spółki publiczne większej wagi do sfery społecznej odpowiedzialności biznesu i komunikowania swojej polityki w tym zakresie oraz rosnącemu zainteresowaniu tą polityką ze strony otoczenia. Podstawowe pytania badawcze, na które starano się uzyskać odpowiedzi dotyczyły popularności wykorzystywania korporacyjnych stron internetowych w komunikowaniu polityki społecznej odpowiedzialności oraz elementów tej polityki obecnych w przekazie. Badanie nie dotyczyło natomiast rzeczywistych działań prowadzonych przez przedsiębiorstwa – nie obejmowało weryfikacji informacji prezentowanych przez spółki.
Badaniami objęto łącznie 140 podmiotów. Analizie poddano ich korporacyjne strony internetowe oraz zawarte na nich dokumenty (kodeksy, raporty, opisy strategii itd.). Analiza ta miała na celu uzyskanie odpowiedzi na dwa pytania: czy spółka wykorzystuje swoją stronę internetową w komunikowaniu polityki społecznej odpowiedzialności przedsiębiorstwa oraz jaki jest zakres komunikowania tej polityki.
31 Smith K.T., Alexander J., op. cit. 32 Krzemień M., Piekalski G., Największe polskie firmy a społeczna odpowiedzialność biznesu, Raport z badania, Screening Centrum CSR.PL, 2012.

57
Zakres ten mierzony był obecnością na stronie informacji odnoszących się ogólnie do sfery CSR lub bardziej szczegółowo do różnych elementów konstytuujących politykę w tej sferze. Zestaw mierników obejmował więc: • obecność w serwisie korporacyjnym sekcji, w której publikowane były informacje
poświęcone społecznej odpowiedzialności przedsiębiorstw lub dowolnemu elementowi polityki w tym zakresie,
• obecność na stronie internetowej opisu sformalizowanej, przyjętej przez władze spółki strategii CSR, dokumentu, który taką strategię zawierał, bądź informacji, że taka strategia została przyjęta,
• obecność na stronie internetowej informacji dotyczącej istnienia w strukturze organizacyjnej przedsiębiorstwa jednostki zajmującej się CSR i kanału komunikacji umożliwiającego bezpośredni kontakt z konkretnym, wskazanym pracownikiem tej jednostki,
• obecność na stronie kodeksu etycznego (zbioru zasad, kodeksu dobrych praktyk, kodeksu compliance, bądź innego odpowiadającego im dokumentu) lub jego opisu,
• obecność na stronie raportu społecznej odpowiedzialności lub odnośnika do niego, • obecność na stronie lub w innych zamieszczonych na niej dokumentach informacji
o sporządzeniu raportu według wytycznych GRI, • obecność na stronie lub w innych zamieszczonych na niej dokumentach informacji
dotyczącej dialogu z interesariuszami, • obecność na stronie opisu polityki wobec dostawców, uwzględniającej kryteria
CSR lub dokumentu (np. kodeksu), który by taką politykę zawierał, bądź był jej świadectwem,
• obecność na stronie internetowej lub w zamieszczonych na niej dokumentach opisu polityki bądź działań prowadzonych wobec społeczności lokalnej,
• obecność na stronie internetowej lub w zamieszczonych na niej dokumentach informacji dotyczących polityki środowiskowej bądź działań podejmowanych w tym zakresie,
• obecność na stronie internetowej lub w zamieszczonych na niej dokumentach opisu polityki dobroczynności bądź działań prowadzonych w tej sferze,
• obecność na stronie internetowej lub w zamieszczonych na niej dokumentach informacji na temat wolontariatu pracowniczego.
Badane spółki różniły się pod względem swojego podejścia do wykorzystania
korporacyjnych stron internetowych w komunikowaniu polityki społecznej odpowiedzialności. Podstawowym czynnikiem różnicującym to podejście okazały się rozmiary przedsiębiorstwa. Jest to widoczne między innymi w postaci odsetka spółek z poszczególnych indeksów, które posługiwały się swoimi stronami internetowymi w komunikowaniu tego typu polityki. W przypadku podmiotów największych, należących do indeksu WIG20 obecność w serwisie korporacyjnym najpowszechniej występującego elementu, czyli sekcji w której publikowane były informacje poświęcone społecznej odpowiedzialności przedsiębiorstwa, zaobserwowano w 90% spółek. W segmencie spółek średnich z indeksu mWIG40 odsetek ten spadał do nieco ponad 62%, a w grupie spółek małych należących do indeksu sWIG80 malał jeszcze bardziej, wynosząc 31%. Zjawisko to można wyjaśnić wskazując, że wykazywanie

58
zaangażowna ich repu
Biorąinternetowelementemz informacprzypadkópolityce śrdanych odtego typudotyczące CSR. Kode20% (ale tPodobny przedsiębiodo takichpracowniczuwzględniapierwszegoa dane odnprzypadkóstruktur odinternetow
Wykres 1. KkomunikującyŹródło: oprac
33Brammer S
wania w sferzutację, niż wykąc pod uwagęwe w komum najpowszechcjami poświęw. Nieco mrodowiskowej
dnoszących siu. Kolejnymi
kodeksów eteksy etyczne tylko w 17% sodsetek (20%orstwa przywh składowyczy, dialog z anie kryterióo z tych elemnoszące się dow (13,5%). Ndpowiedzialny
wych jedynie 8
Komunikowanie pych tę politykę zacowanie własne.
., Pavelin S., op.
ze CSR przezkazywanie takę ogół badanyunikowaniu hniej występuęconymi tej
mniej popularnj, które znalę do polityki , pod wzglętycznych, rapzamieściło naspółek były to% podmiotówiązywały natoh polityki interesariusz
w CSR we mentów obecno każdego z pNajrzadziej spych za sferę
8% podmiotów
olityki CSR przea pomocą korpora
cit.
z duże podmikiego zaangażych spółek wswojej polit
ującym w serwpolityce –
ne było publazły się w 4
dobroczynnoędem częstośportowania i a swojej strono raporty opraw) komunikoomiast mniejsspołecznej oami, politykawspółpracy
ne były w sepozostałych trpółki komunikCSR – tego
w.
z spółki z indeksuacyjnej strony int
ioty gospodarżowania przez
wykorzystującytyki społeczwisie była, jakzaobserwowa
blikowanie in42% serwisóości, pojawiajści występowposiadania s
nie internetowacowane zgodował swoją zą wagę do podpowiedzialna wobec społz dostawcamrwisach korprzech tylko wkowały istnie
typu dane z
u WIG20 na tle oternetowej
rcze ma więkz podmioty mnych korporacynej odpowiek już zauważano ją w onformacji pośów korporacyjących się na wania, były formalizowan
wej 26% spółekdnie z wytycznstrategię CSrzekazu odnoności, jak łeczności lok
mi. Informacjeoracyjnych 1
w nieco niższyenie w przedsznalazły się n
ogółu podmiotów
kszy wpływ niejsze33. yjne strony edzialności, żono, sekcja około 48% święconych
yjnych oraz 40% stron informacje
nej strategii k, a raporty nymi GRI). R. Badane
oszącego się wolontariat
kalnych czy e na temat 4% spółek, ym odsetku siębiorstwie na stronach
w

Po dwykorzystyw komunikprzeprowaPorównaniw spółkachzachowań z indeksu zaangażowkonstytuuj
Obok wskazać tawiększą wPrzypisywprezentowaspołecznośkodeksu et
Spółkprzekazu Dodatkowodo informoo środowisprzedsiębiodostaw. Ob
Wykres 2. KkomunikującyŹródło: oprac
dokonaniu anywania przekowaniu ich
adzono oddzieie wyników h dużych, śrpodmiotów wWIG20 naj
wanie w komuących polityktego najbardz
akże na inne wagę do komuwały też więk
aniu na stronści lokalnych.tycznego i woki średnie wy
odnoszącegoo, podmioty towania o swosko naturalnorstw komunibrazują to dan
Komunikowanie pych tę politykę zacowanie własne.
nalizy pozwez badane sh polityki slnie w odniesotrzymanych
rednich i mawchodzących jważniejszą unikowanie kakę CSR. Jest toziej zauważalnich cechy cha
unikowania posze znaczenienie internetow Za mniej isto
olontariatu prayróżniał z koo się do icte intensywnieoich kodeksace, natomiastikowały uwzgne przedstawio
olityki CSR przea pomocą korpora
walającej na spółki korpospołecznej odieniu do spółeh w całej pałych, umożlw skład każdcechą wyróżażdego z uwzo dobrze widonego wyróżniarakterystycznolityki dobroce posiadaniu wej oraz infootne uznawałyacowniczego.olei silniejszych zaangażowej wykorzystych etycznycht w mniejs
ględnianie krytone na wykres
z spółki z indeksuacyjnej strony int
rozpoznanieoracyjnych sdpowiedzialnoek należącychpopulacji z liwiło lepszedej z tych grużniającą okazględnionych
oczne na wykrka można w pne. Podmioty czynności niż
sformalizowaormowaniu o y natomiast ko
y nacisk kładwania w woywały korporah i inicjatywaszym stopniuteriów CSR wsie 2.
u mWIG40 na tleternetowej
całościoweerwisów inteości, podobn
h do każdego zwynikami u
zrozumienieup. W przypaazało się ic
w pomiarze resie 1. przypadku spó
te przywiązypolityki środ
anej strategii swojej polit
omunikowanie
dziony na proolontariat pr
acyjne strony iach związanycu niż ogół w zarządzaniu
e ogółu podmiotó
59
go obrazu ernetowych ną analizę z indeksów. uzyskanymi e specyfiki adku spółek h większe elementów
ółek dużych ywały nieco dowiskowej.
CSR i jej tyce wobec e dotyczące
opagowanie racowniczy. internetowe ch z troską
badanych u łańcuchem
ów

60
Cechązaangażowskładowycte przypisylokalnych Relatywnieinternetowz interesaridostaw. Sp
Przedwykorzystaprzejawóww wielorakfunkcjonuji przetwórszaangażowdziałań w może wynrealizowani adresatów
Wykres 3. KkomunikującyŹródło: oprac
Konfo
groźby deto operate)
34Bertels S., Expectations,
ą charakterywanie w komch polityki spywały mniejsz
oraz prezene lepiej natom
wych do proiuszami i uwz
pecyfikę tę obrdstawione zróżania korpora
w polityki spoki sposób. Po je we wrastwo surowc
wanie środowitym zakresie
nikać z nacisnie polityki w stanowi bow
Komunikowanie pych tę politykę zacowanie własne.
ormizm nakazlegitymizacji,) i znalezien
Peloza J., Runn
, „Corporate Repu
ystyczną spómunikowanie połecznej odpze znaczenie inntowaniu inicmiast radziły opagowania zględniania krazują dane wżnicowanie spacyjnych stroołecznej odpo
pierwsze, wiażliwych repców, bankowskowe i społei komunikują
sku konkurenCSR obejm
wiem element
olityki CSR przea pomocą korpora
zuje więc dop, utraty społe
nia się pod p
ning Just to Stanutation Review”,
ółek z indbranych po
powiedzialnośnformowaniu cjatyw w zasobie z wykprzekazu d
kryteriów CSRwidoczne na wpółek publicznon internetoowiedzialnościększa widoczputacyjnie swość) wymueczne sprawiają to. Po drugincyjnego34. W
mującej całe międzynarodo
z spółki z indeksuacyjnej strony int
pasować się doecznego przyzpręgierzem op
nd Still? Managi 2008, Vol. 11, N
deksu sWIGod uwagę wści przedsiębio swojej poli
akresie wolonkorzystywaniedotyczącego R w doborze
wykresie 3. nych pod wzg
owych w koci tych podmzność spółek sektorach (eusza na nijąc, że prowadie, większa ak
W przypadkuspektrum in
owego standa
u sWIG80 na tle ternetowej
o tego standarzwolenia na dpinii publiczn
ing CSR ReputaNo. 1.
G80 było nw pomiarze iorstwa. Ponaityce wobec spntariatu prac
em korporacyjdialogu pro
e partnerów w
ględem ich pomunikowaniu
miotów możnadużych, z któ
energetyka, ich bardziej dzą one szerszktywność spó
u tego typu nicjatyw, ins
ardu.
ogółu podmiotów
rdu, co pozwadziałanie (socnej. Po trzec
ation in an Era
najmniejsze elementów
adto spółki połeczności
cowniczego. jnych stron
owadzonego w łańcuchu
odejścia do u różnych
a uzasadnić órych część wydobycie
znaczące zy wachlarz ółek dużych podmiotów strumentów
w
ala uniknąć cial licence cie, jak już
of Ratcheting

61
sygnalizowano, spółki duże odnoszą z działań w sferze CSR większe korzyści reputacyjne. Może stanowić to dodatkową motywację dla tych podmiotów do prowadzenia bardziej widocznej polityki społecznej odpowiedzialności. Po czwarte, duże spółki ze względu na swoje rozmiary mają szersze grono interesariuszy i wywierają silniejszy wpływ na ich sytuację. Rodzi to uzasadnione, dalej idące oczekiwanie ze strony interesariuszy, odpowiedzią na które jest bardziej rozbudowana polityka CSR przedsiębiorstwa i dotycząca jej komunikacja. Po piąte wreszcie, duże spółki dysponują większymi zasobami. Daje to nie tylko większe możliwości w zakresie prowadzenia polityki społecznej odpowiedzialności, ale także wymusza szersze i bardziej intensywne przekazywanie informacji na jej temat. Poświęcanie na komunikację zbyt małych zasobów sygnalizowałoby bowiem, że sfera CSR traktowana jest przez przedsiębiorstwo jako obszar działań jedynie symbolicznych, odzwierciedlając niski poziom zaangażowania podmiotu w inicjatywy prospołeczne i prośrodowiskowe.
W przypadku spółek średniej wielkości i małych, komunikowanie polityki CSR może być mniej intensywne, ponieważ podmioty te nie podlegają tak silnej presji zewnętrznej, ani też nie muszą angażować tak dużych zasobów, aby sygnalizować odpowiedni poziom aktywności społecznej. Dlatego też ich korporacyjne strony internetowe rzadziej zawierają przekaz poświęcony polityce społecznej odpowiedzialności, a zakres prezentowanych na nich informacji jest zazwyczaj węższy.
Podsumowanie Kwestia społecznej odpowiedzialności przedsiębiorstw może być rozpatrywana z różnych perspektyw: etycznej, społecznej, czy politycznej. W artykule przyjęto perspektywę ekonomiczną i zarządczą, koncentrując się na korzyściach płynących z prowadzenia polityki CSR oraz znaczeniu jej komunikowania. Biorąc pod uwagę, że korporacyjne strony internetowe stanowią jeden z głównych kanałów tej komunikacji zbadano, w jaki sposób kanał ten jest wykorzystywany przez spółki publiczne notowane na GPW w Warszawie. Uzyskane wyniki wskazują, że spółki te różnią się pod względem stopnia wykorzystania korporacyjnych stron internetowych w proliferacji przekazu dotyczącego ich polityki CSR. Podstawowym czynnikiem różnicującym okazały się rozmiary podmiotu – najczęściej i w najszerszym zakresie polityka ta była komunikowana przez spółki duże, należące do indeksu WIG20, a najrzadziej informowały i niej spółki małe, należące do indeksu sWIG80.
Przeprowadzone badania koncentrowały się na identyfikacji występowania w serwisach internetowych spółek informacji na temat różnych elementów polityki CSR, nie obejmowały natomiast bardziej szczegółowego rozpoznania sposobu prezentowania tych informacji. Dalsze badania mogłyby więc dotyczyć analizy treści pozwalającej ustalić długość zamieszczanych na stronach komunikatów, określić ich zawartość semantyczną, czy zidentyfikować stosowane w nich techniki impression management.
Bibliografia Adamska A., Dąbrowski T., Zarządzanie ryzykiem reputacji w banku, „Finanse. CzasopismoKomitetuNauk o Finansach PAN” 2010, No. 1(2).
62
Adamska A., Dąbrowski T.J., Do Investors Appreciate Information about Corporate Social Responsibility? Evidence from the Polish Equity Market „Inzinerine Ekonomika-Engineering Economics” 2016, Vol. 27, No. 4. Berens G., van Rekom J., How Specific Should Corporate Communication Be?, in: Facets of Corporate Identity, Communication and Reputation, T.C. Melewar (red.), Routledge, New York 2008. Bertels S., Peloza J., Running Just to Stand Still? Managing CSR Reputation in an Era of Ratcheting Expectations, „Corporate Reputation Review”, 2008, Vol. 11, No. 1. Birth G., Illia L., Lurati F., Zamparini A., Communicating CSR: practices among Switzerland's top 300 companies, „Corporate Communications: An International Journal” 2008, Vol. 13, No. 2. Brammer S., Millington A.I., Does it pay to be different? an analysis of the relationship between corporate social and financial performance „Strategic Management Journal” 2008, Vol. 29, No. 12. Brammer S., Pavelin S., Building a good reputation, „European Management Journal” 2004, Vol. 22, No. 6. Brown T.J., Dacin P.A., The Company and the Product: Corporate Associations and Consumer Product Responses, „Journal of Marketing” 1997, Vol. 61, No. 1. Carnevale C., Mazzuca M., Sustainability Report and Bank Valuation: Evidence from European Stock Markets, „Business Ethics: A European Review” 2014, Vol. 23, No. 1. Carroll A.B., Shabana K.M., The Business Case for Corporate Social Responsibility: A Review of Concepts, Research and Practice, „International Journal of Management Reviews” 2010, Vol. 12, No. 1. Consolandi C., Jaiswal-Dale A., Poggiani E., Vercelli A., Global Standards and Ethical Stock Indexes: The Case of the Dow Jones Sustainability Stoxx Index, „Journal of Business Ethics” 2009, Vol. 87, No. 1. DąbrowskiT.J., Cause-related marketing w kreowaniu i komunikowaniu polityki społecznej odpowiedzialności biznesu, „Marketing i Rynek” 2011, No. 3. Du S., Bhattacharya C.B., Sen S., Maximizing Business Returns to Corporate Social Responsibility (CSR): The Role of CSR Communication, „International Journal of Management Reviews” 2010, Vol. 12, No. 1. Fombrun C.J., Gardberg N.A., Barnett M.L., Opportunity platforms and safety nets: corporate citizenship and reputational risk, „Business and Society Review” 2000, Vol. 105, No. 1. Galbreath J., How does corporate social responsibility benefit firms? Evidence from Australia, „European Business Review” 2010, Vol. 22, No. 4. Golob U., Podnar K., Elving W.J., Ellerup Nielsen A., Thomsen C., Schultz F., CSR communication: quo vadis?, „Corporate Communications: An International Journal” 2013, Vol. 18, No. 2. Golob U., Verk N., Ellerup-Nielsen A., Thomsen C., Elving W.J.L., Podnar K., The communicative stance of CSR: reflections on the value of CSR communication, „Corporate Communications: An International Journal” 2017, Vol. 22, No. 2. KPMG, The road ahead. The KPMG Survey of Corporate Responsibility Reporting 2017. Krzemień M., Piekalski G., Największe polskie firmy a społeczna odpowiedzialność biznesu, Raport z badania, Screening Centrum CSR.PL, 2012. Lee S.Y., How can companies succeed in forming CSR reputation?, „Corporate Communications: An International Journal” 2016, Vol. 21, No. 4. Lev B., Petrovits C., Radhakrishnan S., Is doing good good for you? How corporate charitable contributions enhance revenue growth, „Strategic Management Journal” 2010, Vol. 31, No. 2. Luo X., Bhattacharya C.B., Corporate Social Responsibility, Customer Satisfaction, and Market Value, „Journal of Marketing” 2006, Vol. 70, No. 4.

63
Mahon J.F., Corporate Reputation: A Research Agenda Using Strategy and Stakeholder Literature, „Business and Society” 2002, Vol. 41, No. 4. Margolis D., Walsh J.P., Misery Loves Companies: Rethinking Social Initiatives by Business, „Administrative Science Quarterly” 2003, Vol. 48. OrlitzkyM., Schmidt F.L., Rynes S.L., Corporate social and financial performance: A metaanalysis, „Organization Studies” 2003, Vol. 24, No. 3. Peloza J., Papania L., The Missing Link Between Corporate Social Responsibility and Financial Performance: Stakeholder Salience and Identification. „Corporate Reputation Review” 2008, Vol. 11, No. 2. Pérez A., Corporate reputation and CSR reporting to stakeholders: Gaps in the literature and future lines of research, „Corporate Communications: An International Journal” 2015, Vol. 20, No. 1. Pérez R.C., Effects of Perceived Identity Based on Corporate Social Responsibility: The Role of Consumer Identification with the Company, „Corporate Reputation Review” 2009, Vol. 12, No. 2. Pfau M., Haigh M.M., Sims J., Wigley S., The Influence of Corporate Social Responsibility Campaigns on Public Opinion, „Corporate Reputation Review” 2008, Vol. 11, No. 2. Pivato S. Misani N., Tencati A., The Impact of Corporate Social Responsibility on Consumer Trust: The Case of Organic Food, „Business Ethics: A European Review” 2008, Vol. 17, No. 1. Porter M.E., Kramer M.R., Creating Shared Value. How to reinvent capitalism — and unleash a wave of innovation and growth, „Harvard Business Review” 2011, January-February. Ramchander S., Schwebach R.G., Staking K., The informational relevance of corporate social responsibility: evidence from DS400 index reconstitutions, „Strategic Management Journal” 2012, Vol. 33, No. 3. Sen S., Bhattacharya C.B., Does Doing Good Always Lead to Doing Better? Consumer Reactions to Corporate Social Responsibility, „Journal of Marketing Research” 2001, Vol. 38, No. 2. Siltaoja M.E., Value Priorities as Combining Core Factors between CSR and Reputation – A Qualitative Study, „Journal of Business Ethics” 2006, Vol. 68, No. 1. Smith K.T., Alexander J., Which CSR-Related Headings Do Fortune 500 Companies Use on Their Websites?, „Business Communication Quarterly” 2013, Vol. 76, No. 2. Soppe A.B.M., Schauten M.B.J., Soppe J. and Kaymak U., Corporate Social Responsibility Reputation (CSRR): Do Companies Comply to their Raised CSR Expectations?, „Corporate Reputation Review” 2011, Vol. 14, No. 4. Treviño L.K., Weaver G.R., Gibson D.G., Toffler B.L., Managing ethics and legal compliance: What works and what hurts, “California Management Review” 1999, Vol. 41, No. 2. Turban D.B., Greening D.W., Corporate social performance and organizational attractiveness to prospective employees, “Academy of Management Journal” 1997, Vol. 40, No. 3. Von Arx U., Ziegler A., The Effect of CSR on Stock Performance: New Evidence for the USA and Europe, „Quantitative Finance” 2014, Vol. 14, No. 6.
Summary Companies, by engaging in Corporate Social Responsibility (CSR) activities, can generate favorable stakeholder behaviors and build up their corporate reputations. On the other hand, stakeholders’ low awareness of these activities, and their lack of confidence in corporations, create major obstacles in gaining maximum benefits for these companies. This gives rise to a need for effective CSR communication. The purpose of the research presented in this paper was to identify how companies listed on the Warsaw Stock Exchange use their websites to communicate CSR activities. The research was based on the analysis of company documents. The main results show that company size was the most important factor differentiating CSR communication.

64
Key words: corporate social responsibility, communication, internet, public companies, stakeholders JEL Codes: M14, M39, D83
Informacja o autorze:
dr hab. Tomasz J. Dąbrowski, prof. SGH Instytut Zarządzania Wartością Zakład Marketingu Wartości Szkoła Główna Handlowa w Warszawie Al. Niepodległości 162 02-554 Warszawa e-mail: [email protected] ORCID: 0000-0002-0594-6642

65
22 (71) 2019 DOI 10.22630/PEFIM.2019.22.71.26
Piotr Hadrian Cracow University of Economics
PRACTICAL CONSIDERATIONS FOR THE IMPLEMENTATION OF MARKETING AUDIT
AS STRATEGIC CONTROL
The article discusses the problems of marketing control, understood as a function which tops the management cycle. The immediate aim of this article is to present the results of research on the use of marketing audit as a form of strategic marketing control, in particular, the indicated factors that affect the limitation of its use.
Considerations on the theoretical aspect, as well as the analysis of empirical material of a secondary and primary nature, were conducted using the literature studies method and qualitative research methods. I presented the results of several studies directly devoted to the problems of implementing marketing audit against the background of analyzing the place of audit in the structure of marketing control. The research, although conducted at different times, in different markets and using different methods, undertook similar research topics, which allows, to some extent, a qualitative comparative analysis of their results.
The presented results show that the degree of the use of marketing audit in economic practice still should be assessed as weak. Limiting factors for the use of marketing audit in enterprises include, first and foremost: restricting access to information necessary in the process of auditing, unawareness of the benefits resulting from the implementation of marketing audit, the unclear nature of marketing activities undertaken, and the fear of excessive organizational and financial burden. Key words: marketing management, strategic marketing control, marketing audit JEL Code: M31, M42
Introduction Marketing management concerns one of the many functions of an enterprise, and is, in certain circumstances, a leading function. It can be regarded as a bundle of decision-making and control processes, woven into the entire cycle of an organization’s activity. These functions are implemented at the strategic and operational levels, taking into account the full range of typical management, from analysis and planning, organizing, and motivating to implementation and controls. An efficient control system guarantees the profitability of activities undertaken as part of the marketing function of the company. Different levels of control indicate areas of marketing with varying degrees of use, thus making it possible to allocate resources, link distinguished areas of activity and define the scope of expenditures on top of operational and strategic effects. Ultimately, controls make marketing management more efficient and effective. The adoption of such a position encourages reflection on the practice of control activities as a determinant of the efficiency of marketing management.
As a result of the author’s research interests, oriented towards marketing controls, and in particular marketing audit, attention is paid to the difficulties and limitations of implementing control functions in marketing practice. The purpose of the publication is

66
to indicate the conditions that, in the opinions of the surveyed enterprises, limit the use of marketing audit as a marketing strategic control tool. These conditions are defined based on a review of some literature which has presented results of several studies on the implementation of direct marketing audit, generally discussed and examined in the broader context of the overall control of marketing, and even enterprise control. Considerations on the theoretical aspect, as well as the analysis of empirical material of a secondary and primary nature, were conducted using the literature studies method and qualitative research methods, such as: description, explanation, interpretation and critical analysis of source content.
Audit in the marketing control structure Relatively little space is devoted in the literature to the issue of control, as the literature tends to contemplate the whole category of marketing or marketing management, which is a consequence of a long period (in principle, until the 1970s), when it was believed that measuring the effectiveness of marketing performance is very difficult, if not impossible.1 Only R. Buzzell challenged the thesis of the absolute immateriality of marketing effects, and thus its non-measurability.2 This started a discussion on the possibility of marketing controls and proposing structured solutions thereof. The difficulty of measuring marketing activities, thus control thereof, may be due to the fact that many individual actions initiated in the area of marketing and the resulting effects (often measurable ones, e.g. sales) are eventually absorbed in an organization by the implemented production processes or operating customer services. These complications also arise due to the fact that despite the general theoretical knowledge of the audit methodology, as well as marketing, this control is proving very difficult to define. Marketing is a social science, where many causes and effects are complex and difficult to extract. Not everything can be expressed in quantitative measures, and many issues can only be described in qualitative terms. The studied phenomena are often difficult to grasp, incidental, or dynamic, and the methods of control are imperfect (declarative, intuitive). All this makes it difficult to determine the theoretical basis of marketing control, which directly affects the problems of its practical implementation.
Marketing control is treated as the final stage of the management process and at the same time as the preparatory stage of planning. In the classical approach, it is divided into operational and strategic control. Operational control is usually understood as an evaluation of the obtained results in relation to the formulated goals (cybernetic approach – feedback, ex-post control),3 and less frequently as an evaluation of implementation (follow-up control, ongoing control),4 or an evaluation of the variability of the environment allowing for the correction of planned values (anticipatory control).5 In principle, in such approaches, operational control almost always relates to the
1 J. N. Sheth, R. S. Sisodia: Marketing productivity. Issues and analysis, ”Journal of Business Research” 55/2002, p. 350. 2 R. D. Buzzell: Marketing productivity, Ohio State University, Columbus 1958. 3 Ph. Kotler, G. Armstrong, J. Saunders, V. Wong: Marketing. Podręcznik europejski, PWE, Warszawa 2002, p. 152. 4 P. D. Bennett: Marketing, McGraw-Hill Book Company, New York 1988, pp. 631-632. 5 M. D. Hutt, T. W. Speh: Zarządzanie marketingiem. Strategia rynku dóbr i usług przemysłowych, Wydawnictwo Naukowe PWN, Warszawa 1997, p. 599.
67
business plan (short-term, usually annual) for marketing activities, and thus to the assessment of the performance of the activities over time, according to specific guidelines to achieve the stated objectives. Control understood in this way has diagnostic (what is the situation? what has been achieved and what has not, and why not?) and forecasting functions (what happens next in such a situation? how to proceed? should we change our actions and in what direction?).
Systematic operational control of marketing should be followed by strategic control, which should refer on the one hand to assumptions of strategic nature (directions, strategies, forecasts, assumed policies of marketing activities), and on the other hand, provide a basis for the correction or development of a new marketing strategy of the company. The need for strategic control and correction was noticed in the theory and practice of marketing many years ago, as evidenced by, among others, the formulation of strategic marketing,6 and ultimately, the creation of its new market concept. As proposed by Ph. Kotler, strategic control includes a hierarchy of marketing effectiveness, marketing audit, evaluation of marketing excellence, and review of ethical and social responsibility within the structure of marketing control.7
Another proposal for a marketing control structure as a criterion for distinguishing its components assumes not the level of control activities but the subject of control.8 This proposal immediately defines the scope of control activities, which in Kotler’s proposal is indicated as the third level of detail, after defining the level of control (operational, strategic) and the method or area that control is used in. Another proposal for a structure of control activities distinguishes six elements (levels) of control and evaluation of marketing.9 In the approach to the control of marketing activities related to the concept of value marketing, it is assumed that “the ultimate test of an investment in marketing (...) is whether it creates value for shareholders”.10 This natural business perspective aims to break the limitations of linking financial results with marketing activities. This approach resulted in the development of a three-tiered model for monitoring the effectiveness of marketing activities (comprehensive evaluation of marketing, evaluation of the impact on the market, evaluation of the marketing tool), which in fact reflects three levels of control: strategic, tactical and operational.11
Kotler’s cited proposal for a control structure of strategic marketing included marketing audit as one for of such control.12 Agreeing with the view that there is a
6 H.Meffert: Marketing. Grundlagen der Abzatzpolitik, Gabler, Wiesbaden 1986, p. 31. 7 Ph. Kotler: Marketing. Analiza, planowanie, wdrażanie i kontrola, Gebethner i Ska, Warszawa 1994, p. 683. 8 Control: the macro environment, scheduled tasks, marketing strategy, marketing organization, marketing systems, profitability, and marketing function. Cf: H. Mruk: Kontrola marketingowa [in:] H. Mruk, B. Pilarczyk, B. Sojkin, H. Szulce: Podstawy marketingu, Wydawnictwo Akademii Ekonomicznej w Poznaniu, Poznań 1999, pp. 268-270. 9 Control of: 1) comprehensive marketing plan and marketing strategy, 2) profit centers and strategic business units, 3) marketing programs, 4) marketing tactics, 5) personnel responsible for development and implementation of programs and tactics, 6) market environment entities (competitive). Cf. e.g.: R. W. Haas: Industrial marketing management, PWS-Kent Publishing Company, Boston 1986, pp. 381-412; B. Baruk: Nowoczesna strategia marketingowa. Aspekty strukturalne i procesowe, Wydawnictwo Naukowe PWN, Warszawa 2002, pp. 204-205. 10 M. McDonald, H. Wilson: Plany marketingowe, Oficyna a Wolters Kluwer business, Warszawa 2012, p. 655 11 M. McDonald, H. Wilson: Plany marketingowe, op. cit., p. 662-680. 12 Some authors have a different view, placing audit in the area of marketing analysis. Cf, e.g.: N. Piercy: Marketing. Strategiczna reaorientacja firmy, Wydawnictwo Felberg SJA, Warszawa 2003, pp. 227-235; M. McDonald, H. Wilson: Plany marketingowe, op. cit., p. 133-282.

68
possibility to use audit as a tool for strategic control, regardless of its concept, type, structure or function, one can assume its direct and widespread use in the marketing control of market operators. Despite the interest in marketing audit since the 1950s, empirical research devoted to this issue was rarely undertaken. In the literature devoted to marketing audit, the authors rather focused on giving advice about the theoretically well-established but not empirically confirmed usefulness of marketing audit.13 It was only in the last dozen or so years that several interesting publications presenting the results of empirical research appeared. They, however, do not confirm the optimistic thesis that this form of strategic control of marketing should be used universally and without problems. Therefore, it is worth noting the conditions that limit the use of marketing audit, which are signaled in this study.
The conditions for using marketing audit. A review of the research results The only studies carried out at an early stage of using audit as a marketing control tool show that it was used by a small group of companies, just over a quarter.14 The authors found that the most common problem in the implementation of auditing activities was the lack of data expected by the auditor and misunderstandings between auditors and employees of the audited company.
A quarter of a century later, in a study on the practice of marketing audit in enterprises operating in the Australian market, nearly half of the respondents indicated that their companies used different forms of marketing audit (i.e., regarding different problems with different levels of control depth), mostly in the form of self-control (three quarters), special auditing teams or external audit (approx. one third, respectively).15 The main identified problems encountered in enterprises in connection with marketing audit include the lack or unavailability of data and a lack of standards for comparing activities, and the difficulty of benchmarking in the area of marketing. The results of the survey indicated that the vast majority of demographic variables of enterprises do not influence 13 Cf: J. Naylor, A. Wood: Practical Marketing Audits: A Guide to Increased Profitability, John Wiley & Sons, New York 1978; E. N. Berkowitz, W. A. Flexner: The Marketing Audit: A Tool for Health Service Organizations, ”Health Care Management Review” 3/1978, pp. 51-57; M. Wilson: The Management of Marketing, Gowe Publishing, Westmead 1980; N. D. Kling: The Marketing Audit: An Extension of the Marketing Control Process, ”Managerial Finance” 1/1985, vol. 11, pp. 23-26; E. S. Lurin: Audit Determines the Weak Link in Marketing Chain, ”Marketing News” 20/1986, pp. 35-37; M. Mokwa: The strategic marketing audit: An adoption / utilization perspective, ”Journal of Business Strategy” 1986 vol. 6, Spring; A. Payne: Marketing usług, PWE, Warszawa 1997; T. Yaegel: FIERRA Spawns Need for New Marketing Strategies, ”Bankers Magazine” 173(5)/1990, pp. 78-82; D. McGlinche: Doing your own Marketing Audit, ”Marketing Computers” 16/1996,pp. 26-28. 14 L. M. Capella, W. S. Sekely: The Marketing Audit: Methods, Problems and Perspectives, ”Akron Business and Economic Review” 3/1978, vol. 9, pp. 37-41. Study using a sample of 134 managers representing market operators in the United States of America. 15 M. Taghian, R.N. Shaw: The Marketing Audit and Business Performance: An Empirical Study of Large Australian Companies, Australia and New Zealand Marketing Academy Conference (ANZMAC) Proceedings 2002, pp. 3151- 3157. The population studied was a set of 22,000 companies from which the sample was taken by deliberate choice, selecting the largest manufacturing and service companies, in terms of revenue generated. Such a sample selection resulted from the assumption that in larger companies there is a greater probability of “practicing professional marketing”. Only 216 responses were acquired from the 1,441 organizations to which the questionnaires were sent.

69
the decision to use (or not use) marketing audit, except for the age of the organization and the level of education of its marketing manager. It turned out that the marketing audit was more often used by entities that had been operating on the market for longer periods of time and by those in which marketing managers had higher education.16
The results of a survey conducted in 2007 on a sample of 199 large and medium-sized enterprises in Poland’s Pomeranian Province17 indicated that nearly three-fifths of medium-sized companies and more than two-thirds of large companies performed strategic marketing control (mostly in combination with operational control). The entities that did not achieve this level of control indicated a lack of adequate funding, high costs (both financial and organizational), or insignificance of the level of control of the business as the reasons for it. At the same time, it was found that the relevant management decisions are not always matched by adequate control activities. For example, among the companies declaring to formulate strategic plans, there were some that did not carry out strategic control. Among the entities declaring to conduct strategic marketing control, about half of medium sized enterprises and over two fifths of large enterprises declared the use of marketing audit, most often including the effectiveness rank. Thus, only less than one third of all medium sized and large enterprises surveyed declared the use of audit as a strategic marketing control tool. This result indicates a fairly low prevalence of this kind of control tool among entities located in this region of Poland.18
In the market research devoted to the recognition of the state of knowledge and skills of companies operating on the Polish market to use business audit tools, including marketing audit, the conditions for the introduction of the audit and barriers to their use were assessed.19 Only one-third of the surveyed companies declared regular or occasional use of marketing audit. The result indicates a low uptake of marketing audit as a strategic control tool; especially as not all companies treated it as a control tool (some used it at the analysis stage in the marketing management process). Over half of the companies implemented audit independently (internal audit), and the remaining used external audit. The survey shows that none of the included descriptor variables of 16 The relation between the age of the surveyed organizations and the degree of using the audit was explained by the fact that younger companies (established after 1971) were less willing to use the audit due to their greater efficiency in gaining easier access to wider and richer resources of external marketing information, which weakened the need to use audit. On the other hand, better education of marketing managers in organizations using marketing audit was most probably due to the fact that the audit issues were included or more comprehensively commented on in educational programs offered only by higher education institutions. 17 W. Dryl: Audyt marketingowy, CeDeWu, Warszawa 2010, pp. 207-2016. The survey of medium and large enterprises was conducted on a population 423 entities. 199 statements of the surveyed companies (98 large and 101 medium) were collected. 18 The published results arouse concern whether the operators really understood the conceptual category of marketing audit as a tool for strategic control properly. This doubt comes from the declared audit frequency that provides a more operational nature and its treatment as synonymous with control. The responses suggest that the results concerning the use of marketing audit (in the proper sense of the term) should be interpreted as too optimistic. 19 K. Bachnik: Audyt marketingowy w małych i średnich przedsiębiorstwach [in:] Audyt biznesowy w działalności małych i średnich przedsiębiorstw, ed. A. Skowronek-Mielczarek, Oficyna Wydawnicza SGH, Warszawa 2018, pp. 109-138. The aim of an extensive study conducted in 2017 was to diagnose the use of audit practice tools in the business management of small and medium-sized enterprises in Poland. The survey was conducted by telephone interview method (CATI) on a deliberately selected sample of 200 small and medium sized enterprises operating in Poland, which initially declared use of audit activities.

70
enterprises (industry, ownership form, ownership capital, market coverage, number of employees) has a significant statistical impact on the need for use, manner (regular, irregular), or form of marketing audit. The most important barriers to the use of marketing audit were the lack of appropriate tools, human and financial resources, lack of time for such a systematic (structured) study, and difficulties in estimating its direct benefits.
The research undertaken by the author concerning the use of marketing audit (case study method) by selected, well-developing enterprises operating on the Polish market showed that it is used very rarely.20 In those entities where it is actually implemented, it is implemented as a component of the internal audit in the organization. The factors diagnosed in the course of the study, which condition taking action to control marketing in general, in the form of an audit in particular, are: market situation, size and stability of the company, the scope of its marketing activity,21 the adopted model of managing the organization, the will of owners and managers, formulation of a marketing strategy, achieved operational results (their dynamics), on top of organizational and formal (legal) conditions. Entrepreneurs do not see the need to conduct formal, structured marketing control in a situation of competitive stabilization (not perceiving threats), conducting business according to an intuitive management model (spontaneous, emotional action better than rational), achieving a well-established and stable market position (sense of security), achieving ever higher sales values on the market (sales are growing = good), involvement in new technological, organizational and market projects (there is no time to look back), lack of formal requirements (no need = we do not do it). In fact, in none of the cases in which no marketing control was implemented, was the argument of financial or organizational constraints actually raised. The resources and potential of the surveyed companies certainly enabled them to carry out (independent or external) control, while the emerging organizational conditions were related to the fear of disorganization of work in the areas subject to control.
Interesting aspects related to the practice of marketing audit were the subject of a study aimed at determining the significance of conditions for successful implementation of marketing audit in marketing management.22 Considering the variables affecting the
20 The study was conducted by the author to verify previously presented research results in the literature that were dedicated to the implementation of the audit as a marketing control tool. The studied population consisted of well-developing enterprises (based on the presented ranking lists) classified into groups of large or medium-sized enterprises whose parent offices are located in the southern part of Poland. At the same time, efforts were made to conduct the survey in selected foreign enterprises. The main problem of the conducted research turned out to be the limited openness of representatives of enterprises to undergoing the examination and providing access to materials illustrating the tools of marketing control used, primarily marketing audit. Finally, 8 business cases were investigated, including one company from each of the countries: Czech Republic, Slovakia and Ukraine. The conducted case studies noted problems related not only to audit or marketing control, but in a broader sense, with the actual consolidation of the marketing orientation of enterprises.A wider discussion of the results of the study will be presented in a forthcoming monograph on marketing auditing. 21 This factor, in fact, reflects serious connotations on the actual orientation of business marketing and understanding the essence of marketing. 22 D. Lipnická, J. Ďaďo: Marketing Audit and Factors Influencing Its Use in Practice of Companies (From an Expert Point of View), ”Journal of Competitiveness” 4/2013, vol. 5, pp. 26-42. Using the Delphi method, opinions were collected on the conditions of audit from 16 experts - theorists (scientists) and practitioners (marketing managers) – and analyzed. Based on the established list of factors (including the barriers) that

71
implementation and results of marketing audit, the experts listed most frequently: a factor defined as auditor proficiency (understood as the professional approach of the auditor to the audited company, and their ability to select appropriate methods); knowledge of the current situation of a company’s marketing activities exercised by its managers (knowledge about the company and its marketing processes); acceptance of the audit and its results by all employees of the audited entity (awareness of the need for implementation and purposes of the marketing audit from the company’s employees); regularity of the auditing; availability of information (providing real data on the audited company, as well as readiness to provide all information necessary for the performance of the audit by an external company); the independence of the audit; effort for continuous improvement (the willingness to make changes and apply the marketing audit recommendations); consensus between the auditor and the company audited (agreement between the audit procedure and the audited entity and between the two parties); and sufficient time to carry out the audit (not only in the context of the implementation of the marketing audit, but also in terms of training and preparation of the employees). Few experts pointed to such factors determining the use of the marketing audit as its scope (determining the degree of complexity), the period of audited marketing activities (most often periods in which specific problems were observed), and the availability of financial resources to carry out the audit.
The experts perceived the following primary barriers that prevent companies from implementing marketing audit: the lack of proper knowledge of marketing audit, lack of authentic marketing orientation of the companies, the lack of awareness that the audit can result in knowledge and recommendations that will contribute to the increase in revenue of the company exceeding the cost of implementing the marketing audit by an external organization, and the fear of the possible effects of the audit. They also pointed out the reluctance of the controlled company to provide information to independent external entities and the lack of specialized auditors and managers who have perfectly mastered the implementation of marketing audit as significant problems in the case of external audit. In the case of small and medium-sized enterprises, financial constraints related to marketing audit were seen as a potential barrier.
The experts clearly attributed the greatest importance to the availability of information for the auditors. The key factors are also the experience of the marketing auditor, the independence of the marketing audit process, and approval of the audit objectives by employees of the audited company. Factors such as the complexity of the marketing audit, knowledge of the situation in the studied marketing company, sufficient time to carry out the audit, effort to continuously improve the business, the availability of funds, and the correct implementation of the audit have been identified by experts as significantly affecting the implementation and results of the auditing. The least impact was attributed to the consensus between the controlled company and the audit firm, on top of focus on the marketing audit in a short period of time. The experts have attributed significant importance to most of the factors identified as barriers that prevent or hinder the implementation of the marketing audit, and indicated the key position to the companies’ reluctance to make changes, to communicate information to third parties on affect the implementation and results of the audit of marketing activities determined in the first phase of the study, in the second phase, their importance was evaluated.

72
the one hand, and ignorance of marketing audit from both theoretical and practical points of view on the other.
The list of marketing audit implementation restrictions indicated in the results of the research is presented in Table 1.
Table 1. Marketing audit implementation restrictions indicated in the results of the research
The conditions limiting the use of marketing audit
The research concerning the use of marketing audit (authors of the publication)
Cap
ella
, Se
kely
Tagh
ian,
Sh
aw
Dry
l
Bac
hnik
Had
rian
Lipn
ická
, Ď
aďo
the lack or unavailability of data expected by the auditor x x x
misunderstandings between auditors and employees of the audited company x
the lack of standards for comparing activities, and the difficulty of benchmarking in the area of marketing x
the lack of adequate funding x x x high costs of auditing (both financial and organizational) x x
insignificance of strategic control of the business x the lack of appropriate tools x the lack of human resources x the lack of time for such a systematic (structured) study x
difficulties in estimating direct benefits of the audit x x situation of competitive stabilization (failure to perceive threats) x
conducting business by an intuitive management model x
achieving a well-established and stable market position (sense of security) x
achieving ever higher sales values on the market x involvement in new technological, organizational and market projects (there is no time to look back) x
the lack of formal requirements x the fear of disorganization of work in the areas subject to control (of the possible effects of the audit) x x
the lack of proper knowledge of marketing audit x the lack of authentic marketing orientation of the companies x
the lack of specialized auditors and managers x
Source: Author’s own elaboration.

73
The valuable results of other studies, whose objectives and research problems did not directly address the issue of conditions for the use of audit, are also presented in the literature. In the survey conducted among companies perceiving the evaluation of strategic directions of marketing activities as at least an important aspect of marketing management, marketing audit were used by about two fifths of these entities.23 Although the research did not directly consider the issue of factors influencing the level of audit use, the diagnosed weak interest of managers responsible for marketing in elementary issues related to the scope of the marketing audit may be treated as a condition for the level of audit use in the examined entities.
A continuation of this project was the research done in 2011.24 During the interviews, the following measurements were made: perception of the importance of various marketing control tasks and control tools (methods), such as: sales analysis, market share analysis, cost (expenses) analysis, buyer satisfaction survey (customer satisfaction observation), profitability analysis, marketing effectiveness analysis, and marketing audit. The results of the study indicated that the lowest score was given to the only strategic control tool, which is the marketing audit. Its low importance translated into a low level of the use of audit by the surveyed companies.25 Such low ratings for marketing audit undermine the essence of the marketing control system, as they indicate the low importance of problems related to the evaluation of marketing activities at the strategic level. In another study, on sustainable use of marketing audit, half of the surveyed managers felt that the audit is a very important marketing tool for marketing management in their enterprise.26
Conclusions Empirical material contained in all the above-mentioned studies was obtained thanks to incomplete, unrepresentative research, therefore the cognitive value of these results should be perceived as a simplified, approximate picture of the use of marketing audit, and in a broader context, control in the practice of marketing management. The presented results show that the degree of the use of marketing audit in economic practice 23 W. Kowal:Audyt marketingowy jako narzędzie kontroli marketingowej w świetle wyników badań polskich przedsiębiorstw, ”Nauki o zarządzaniu. Management sciences” 9/2011, pp. 107-130. The research was conducted using the CATI method at the turn of 2006, on a nationwide sample of 251 directors and marketing managers, sales managers or trade department managers of manufacturers operating on consumer markets and employing more than 250 people. After verifying the questionnaires, 231 interviews were used to analyze the results of the survey. 24 W. Kowal:System kontroli marketingowej w świetle wyników badań polskich przedsiębiorstw, ”Marketing i Rynek” 3/2013, pp. 17-24. The research was conducted using the standardized interview, CATI method, on a sample of 140 directors and marketing managers, sales managers or trade department managers of medium-sized enterprises operating on consumer markets and employing more than 50 people. The study had national coverage. 25Unfortunately, the author did not present detailed information on the number of surveyed entities using marketing audit as a tool to control marketing activities. 26 D. Serbănică, V. Radulescu, A.F. Cruceru: The Role of Marketing Audit in Evaluation Sustainable Marketing Performance in Romanian Organizations, ”Amfiteatru Economic” 17(40)/2015, pp. 1011-1021. Using the interview method (categorized, structured) the opinions of the top management of 30 Romanian service companies operating in the transport (railway), telecommunications, banking, real estate, IT and promotional services sectors, in different markets (local, national, international and global), thus generating very different volumes of turnover, were collected.

74
still should be assessed as weak. The level of implementation of this form of marketing control, as can be seen, is independent of the time when the research was conducted, the market that was the subject of the research, the type of entities surveyed, or the methodology of the research. The noticed and described differences do not prove different attitudes towards audit and its importance among the separated groups of enterprises of the studied populations. In the case of results concerning conditions limiting the use of marketing audit, recurring indications concern mainly: − lack of availability of information necessary for the audit process as a result of
limiting this access by managers, marketing services or employees of the audited entity, which is a result of fear of a possible unfavorable assessment and resulting consequences;
− unawareness of benefits resulting from the implementation of marketing audit, which results from a wider problem of ignorance of the essence and functions of this (and other) control tools; still, control is perceived negatively as a supervision, power and repression tool, and not as a positive tool supporting the management process;
− the ”fuzzy” character of marketing activity of enterprises, which is manifested in the extreme case of lack of factual marketing orientation, and more often as incorrect understanding of the essence and scope of marketing activities, a lack of proper organization (planning) of marketing, a lack of clear strategic indications, and a careless model of marketing management;
− fear of excessive organizational and financial loads, which in fact do not seem justified, and from a psychological point of view are important brakes to implementing new solutions. The presented results of the few empirical studies on strategic control of marketing
activities, on the one hand, indicate the research potential related to the deepening of knowledge on the practice of marketing behavior of enterprises. On the other hand, they determine the direction of the tasks associated with the need to broaden and deepen knowledge on control (including audit) among practitioners. The research outcomes show that the limited utilization of this management function is in fact largely the result of misunderstanding its nature, role and importance, which should stimulate better and more precise explanation of the assumptions and practical solutions in the area of marketing control.
Literature Bachnik K.: Audyt marketingowy w małych i średnich przedsiębiorstwach [in:] Audyt biznesowy w działalności małych i średnich przedsiębiorstw, ed. A. Skowronek-Mielczarek, Oficyna Wydawnicza SGH, Warszawa 2018, pp. 109-138. Baruk B.: Nowoczesna strategia marketingowa. Aspekty strukturalne i procesowe, Wydawnictwo Naukowe PWN, Warszawa 2002. Bennett P. D.: Marketing, McGraw-Hill Book Company, New York 1988. Berkowitz E. N., Flexner W. A.: The Marketing Audit:A Tool for Health Service Organizations, ”Health Care Management Review” 3/1978, pp. 51-57. Buzzell R. D.: Marketing productivity, Ohio State University, Columbus 1958, https://etd.ohiolink.edu/!etd.send_file?accession=osu1486464627808243&disposition=inline (14.03.2018).

75
Capella L. M., Sekely W. S.: The Marketing Audit: methods, Problems and Perspectives, ”Akron Business and Economic Review” nr 3/1978, vol. 9, s. 37-41. Haas R. W.: Industrial marketing management, PWS-Kent Publishing Company, Boston 1986. Hutt M. D., Speh T. W.: Zarządzanie marketingiem. Strategia rynku dóbr i usług przemysłowych, Wydawnictwo Naukowe PWN, Warszawa 1997. Lurin E. S.: Audit Determines the Weak Link in Marketing Chain, ”Marketing News” 20/1986, pp. 35-37. Kling N.D.: The Marketing Audit: An Extension of the Marketing Control Process, ”Managerial Finance” 1/1985, vol. 11, pp. 23-26. Kotler Ph.: Marketing. Analiza, planowanie, wdrażanie i kontrola, Gebethner i Ska, Warszawa 1994. Kotler Ph., Armstrong G., Saunders J., Wong V.: Marketing. Podręcznik europejski, PWE, Warszawa 2002. Kowal W.: Audyt marketingowy jako narzędzie kontroli marketingowej w świetle wyników badań polskich przedsiębiorstw, ”Nauki o zarządzaniu. Management sciences” 9/2011, pp. 107-130. Kowal W.: System kontroli marketingowej w świetle wyników badań polskich przedsiębiorstw, ”Marketing i Rynek” 3/2013, pp. 17-24. Lipnická D., Ďaďo J.: Marketing Audit and Factors Influencing Its Use in Practice of Companies (From an Expert Point of View), ”Journal of Competitiveness” 4/2013 vol. 5, pp. 26-42. McDonald M., Wilson H.: Plany marketingowe, Oficyna a Wolters Kluwer business, Warszawa 2012. McGlinchey D.: Doing your own Marketing Audit, ”Marketing Computers” 16/1996, pp. 26-28. Meffert H.: Marketing. Grundlagen der Abzatzpolitik, Gabler, Wiesbaden 1986. Mokwa M.: The strategic marketing audit: An adoption / utilization perspective, ”Journal of Business Strategy” 4/1986, vol. 6, pp. 88-95. Mruk H.: Kontrola marketingowa [in:] Mruk H., Pilarczyk B., Sojkin B., Szulce H., Podstawy marketingu, Wydawnictwo Akademii Ekonomicznej w Poznaniu, Poznań 1999. Naylor J., Wood A.: Practical Marketing Audits: A Guide to Increased Profitability, John Wiley & Sons, New York 1978. Payne A.: Marketing usług, PWE, Warszawa 1997. Sheth J. N., Sisodia R. S.: Marketing productivity. Issues and analysis, ”Journal of Business Research” 55/2002, pp. 349–362, http://rajsisodia.com/raj/wp-content/uploads/2012/07/Marketing-Productivity-Issues-and-Analysis.pdf (14.12.2017). Serbănică D., Radulescu V., Cruceru A.F.: The Role of Marketing Audit in Evaluation Sustainable Marketing Performance in Romanian Organizations, ”Amfiteatru Economic” 17(40)/2015, pp. 1011-1021. Yaegel T.: FIERRA Spawns Need for New Marketing Strategies, ”Bankers Magazine” 173(5)/1990, pp. 78-82. Taghian M., Shaw R.N.: The Marketing Audit and Business Performance: An Empirical Study of Large Australian Companies, Australia and New Zealand Marketing Academy Conference (ANZMAC) Proceedings 2002, pp. 3151- 3157; https://www.researchgate.net/publication/ 237428376_The_Marketing_Audit_and_Business_Performance_An_Empirical_Study_of_Large_Australian_Companies (20.10.2018).
76
Praktyczne uwarunkowania implementacji strategicznej kontroli marketingu w formie audytu
Streszczenie Artykuł poświęcony jest problematyce kontroli marketingu rozumianej jako funkcja wieńcząca cykl procesu zarządzania. Bezpośrednim celem artykułu jest zaprezentowanie wyników badań dotyczących wykorzystywania audytu marketingu jako formy strategicznej kontroli marketingu, a w szczególności wskazywanych czynników, które wpływają na ograniczenie jego wykorzystania.
Rozważania w części teoretycznej, jak i analizie materiału empirycznego o charakterze wtórnym i pierwotnym, prowadzone były z wykorzystaniem metody studiów literaturowych oraz metod badań jakościowych.Na tle rozważań poświęconych usytuowaniu audytu w strukturze kontroli marketingu, dokonano prezentacji wyników kilku badań, poświęconych bezpośrednio problemom implementacji audytu marketingu. Badania, choć prowadzone w odmiennym czasie, na różnych rynkach i różnymi metodami, podejmowały podobne zagadnienia badawcze, co umożliwia w pewnym zakresie dokonanie jakościowej analizy porównawczej ich wyników.
Z zaprezentowanych wyników wynika, że stopień wykorzystywania audytu marketingu w praktyce gospodarczej, niezmiennie należy ocenić jako słaby. Za czynniki ograniczające wykorzystanie audytu marketingu w przedsiębiorstwach, należy uznać przede wszystkim ograniczenie dostępu do informacji niezbędnych w procesie realizacji audytu, nieświadomość korzyści wynikających z realizacji audytu marketingu, nieklarowny charakter podejmowanych działań marketingowych oraz obawy przed nadmiernymi obciążeniami natury organizacyjnej i finansowej. Słowa kluczowe: zarządzanie marketingiem, strategiczna kontrola marketingu, audyt marketingu JEL Code: M31, M42 Information about author:
Dr Piotr Hadrian Crakow University of Economics Marketing Department ul. Rakowicka 27 31-510 Kraków e-mail: [email protected] ORCID: 000-0003-0922-920X
77
22 (71) 2019 DOI 10.22630/PEFIM.2019.22.71.27
Sylwester Kozak, Warsaw University of Life Sciences - SGGW
Agata Wierzbowska, Kobe University
BANK EFFICIENCY AND CONCENTRATION OF THE
BANKING SECTOR IN THE CEE COUNTRIES
Abstract: The relationship between the structure of the banking market and efficiency of banks has been a subject of many studies for several decades. There is no uniform opinion on the correlation between these variables. The goal of the research is to investigate this relationship for 96 banks operating in eleven CEE countries in the years of 2005-2017. Bank efficiency scores are assessed with the SFA method and regressed with bank and macroeconomic characteristics. The results show that the efficiency of banks is positively affected by the concentration of the market on which they operate, as well as by the size of individual banks. This relationship is valid for all examined countries. Additionally, bank efficiency is positively impacted by improving the banking system. On the other hand, the GDP per capita, inflation rate and bank capital ratio are not conducive to bank efficiency.
Key words: CEE countries, bank, efficiency, market concentration JEL codes: G10, G15, G21
Introduction Banks efficiency in recent decades has been an important subject for academics and policy makers 1 . Among them, relatively frequent studies include the relationship between the banking market concentration and efficiency of banks. However, the conclusions from these studies are relatively divergent. Some of them indicate a positive
1 G. Casu, C. Girardore, Bank competition, concentration and efficiency in the single European market, The Manchester School vol. 74(4)/2006, p. 441-468; A. Berger , I. Hasan, M. Zhou, Bank ownership and efficiency in China: what will happen in the world’s largest nation?, Journal of Banking and Finance vol. 33/2009, p. 113-130; M. Duygun, V. Sena, M. Shaban, Schumpeterian competition and efficiency among commercial banks, Journal of Banking and Finance vol. 37/2013, p. 5176-5185; R. Mesa, H. Sánchez, J. Sobrino, Main determinants of efficiency and implications on banking concentration in the European Union, Spanish Accounting Review vol. 17(1)/2014, p. 78-87; M. Niţoi, C. Spulbar, An Examination of Banks’ Cost Efficiency in Central and Eastern Europe, Procedia Economics and Finance vol. 22/2015, p. 544-551; T. Silva, S. Guerra, B. Tabak, R. de Castro Miranda, Financial networks, bank efficiency and risk-taking, Journal of Financial Stability vol. 25(C)/2016, p. 247-257; J. Peng, V. Jeng, J. Wang, Y. Chen, The impact of bancassurance on efficiency and profitability of banks: Evidence from the banking industry in Taiwan, Journal of Banking and Finance vol. 80/2017, p. 1-13; P. Avramidis, Ch. Cabolis, K. Serfes, Bank size and market value: The role of direct monitoring and delegation costs, Journal of Banking and Finance vol. 93/2018, p. 127-138.

78
impact of banking sector concentration on bank performanc,2 while others show the opposite direction of the dependence3 or do not find any significant relationship4. Similar discrepancies occur in the assessment of the possible impact of individual factors, including of a bank’s market share on its efficiency. The difference between obtained results may come from the fact that these relationships were examined in various macroeconomic conditions with various timeframes, and on sets of banks operating in different geographical regions.
The goal of our research is to assess how the level of the banking market concentration affects efficiency of banks in the CEE region in the years from 2005-2017. Additionally, we check the impact of the market share of these banks on their efficiency. The time range of the research includes two important events that could have a significant impact on the banks' activity, i.e. the global financial crisis of 2007-2009 and the public finance crisis in some euro area countries in 2011-2012. The study covers 96 banks operating in eleven CEE countries. The importance of the issue of ensuring effective delivery of credit and other banking services to enterprises and households and effective implementation of the monetary policy of the central bank make the problem of studying the level of banks' efficiency an important topic for both academics and supervisory institutions. The study fills the existing gap in literature in this respect and casts a new look at the shape of this relationship, while taking into account some macroeconomic variables, such as: GDP per capita, inflation rate, level of development of the banking sector, as well as banks’ capital ratio.
The rest of the article consists of three sections and conclusions. The first presents conclusions from the literature review, the second presents data and methods used in the research, and the third discusses the results of the research. The entire study is summarized in the conclusions.
Market structure and efficiency – existing studies The economic literature does not provide a definite answer on the question about the impact of the structure of the banking market on banks' performance. The results of the research are usually explained with two theories: the market power (MP) theory and the efficient structure (ES) theory. The first one uses two models for describing the market structure-performance relationship, i.e. the structure-conduct-performance hypothesis (SCP) and the relative market power hypothesis (RMP). The SCP hypothesis assumes that in a more concentrated market banks set prices that are more favorable for 2 A. Berger, R. Demsetz, P. Strahan, The consolidation of the financial services industry: Causes, consequences, and implications for the future, Journal of Banking and Finance vol. 23/1999, p. 135-194; M. Haynes, S. Thompson, The productivity effects of bank mergers: Evidence from the UK building societies, Journal of Banking and Finance vol. 23/1999, p. 825-846; J. Bikker, K. Haaf, Competition, concentration and their relationship: An empirical analysis of the banking industry, Journal of Banking and Finance vol. 26(11)/2002, p. 2191-2214; D. Amel, C. Barnes, F. Panetta, C. Salleo, Consolidation and efficiency in the financial sector: A review of the international evidence, Journal of Banking and Finance vol. 28/2004, p. 2493-2519. 3 S. Rhoades, Efficiency effects of horizontal (in-market) bank mergers, Journal of Banking and Finance vol. 17(2-3)/199, p. 411-422; E. Mamatzakis, R. Matousek, A. Vu A.N., What is the impact of bankrupt and restructured loans on Japanese bank efficiency?, Journal of Banking and Finance vol. 72/2017, p.187-202. 4 N. Avkiran, The evidence on efficiency gains: The role of mergers and the benefits to the public, Journal of Banking and Finance vol. 23(7)/1999, p. 991-1013; G. Casu, C. Girardore, Bank competition, concentration and efficiency in the single European market, The Manchester School vol. 74(4)/2006, p. 441-468.

79
themselves and earn higher profits. In turn, the RMP hypothesis assumes that more favorable prices could be introduced only by banks with larger market shares, regardless in how concentrated are the markets in which they operate.
The relationship between the market structure and companies’ performance was for the first time noticed by Mason5. He stated that although the behavior of enterprises may depend on economic conditions, the level of market concentration is the main determinant in their decision to increase prices, which leads to improvement of results. An important stage in the development of the SCP hypothesis is shown in an article by Bain6, in which he stated that the smaller the number of enterprises in a market, and the higher the concentration, leads to behaviors indicating a decrease in competition. As a result, companies increase prices and achieve higher profits, which are carried out at the expense of reducing customers’ wealth. Such conduct has been noticed in the research conducted on banks over the last few decades. Gilbert noticed that in the 1960s, due to the change in the legal requirements referring to the effects of bank mergers on the competition, large US banks were able to offer lower deposit rates and higher loan rates and as a result raise their profits7. Garcia-Herrero et al.8 and Fu et al.9 tested the market structure-performance relationship in China and Asia Pacific countries in the years 1997-2004 and 2007-2008, respectively, and found that banks are more efficient in less concentrated banking markets. Similarly, Maudos and Fernandez de Guevara,10 based on research of the European banking sector in the years 1995-2001, stated that the increase in concentration and market power leads to a fall in efficiency.
The efficient structure (ES) theory was formulated by Demsetz and states that more efficient firms grow at the expense of less competitive competitors11. In the banking sector efficient banks can lower the prices of their products, become more competitive and gain new customers. It enables them to increase their market share by displacing or taking over less competitive competitors. Such a process leads to increased concentration of the entire banking market. In one of the earliest studies on this subject, Evanoff and Fortier explain that an increase in the concentration of local bank markets in the USA in the 1970s and 1980s was caused when more efficient banks acquired less competitive entities12. In recent years, using the ES theory, Homma et al. examined Japanese banks operating in the period of 1974-2005 and explained that efficient large banks
5 E. Mason, Price and Production Policies of Large-Scale Enterprise, American Economic Review vol. 29(1)/1939, p. 61-74. 6 J. Bain, Relation of Profit Rates to Industry Concentration, Quarterly Journal of Economics vol. 55/1951. 7 R. Gilbert, Bank market structure and competition, Journal of Money, Credit, and Banking vol. 16/1984, p. 617-660. 8 A. Garcia-Herrero, S. Gavila, D. Santabarbara, What explains the low profitability of Chinese banks? Journal of Banking and Finance 33/2009, p. 2080-2092. 9 X. Fu, Y. Lin, P. Molyneux, Bank competition and financial stability in Asia Pacific. Journal of Banking and Finance vol. 38/2014, p. 64-77. 10 J. Maudos, J. Fernandez de Guevara, Factors explaining the interest margin in the banking sectors of the European Union, Journal of Banking and Finance vol. 28/2008, p. 2259-2281. 11 H. Demsetz, Industry structure, market rivalry, and public policy, Journal of Law and Economics vol. 16/1973, p. 1-9. 12 D. Evanoff, D. Fortier, Reevaluation of the structure-conduct-performance paradigm in banking, Journal of Financial Services Research vol. 1(3)/1988, p. 277-294.

80
significantly gained their market share due to acquiring banks in a weaker financial condition13.
Both MP and ES theories, however, have two different characters and two opposite directions of action. In the MP theory, the market structure is an exogenous factor which affects performance of banks. On the other hand, in the ES theory the market structure is an endogenous factor and is the outcome of decisions made by the banks operating on it. Concentration is therefore an important parameter of the banking activities. It affects, among other things, banks’ efficiency, quality of delivered banking services, and innovation in creating new banking products. Among others, Claessens and Laeven indicate that the banking market concentration has significant impact on the availability of banking services (mainly credit) to households and enterprises, which naturally shapes the rate of economic development of the country14. Demirguc-Kunt et al. state that a higher banking market concentration increases the cost of financial intermediation15.
Research on the relationship between the banking market concentration and bank performance in the CEE countries is rather limited. Andries examined banks operating in seven CEE countries over the period of 2004-2008 and found a growing trend in their efficiency16. One of the conclusions of this research is that an increase in the level of banking concentration and bank size positively affects the efficiency of banks. Efthyvoulou and Yildirim assessed the market power and efficiency of banks in 17 CEE countries based on their performance over the period 2002-2010. They noticed a significant variation in these variables in the analyzed countries and a diversified response of banks to the effects of the financial crisis, due, among other factors, to the ownership structure17. Most other papers focus rather on assessing the efficiency of banks18.
Changes in efficiency are assessed not only in relation to the degree of concentration of the banking market, but also in relation to the level of competition, which is measured by non-structural measures, i.e. the Panzar-Rosse H-statistic19, the Lerner index 20 and the Boone indicator 21 . Non-structural measures often point to
13 T. Homma, Y. Tsutsui, H. Uchida, Firm growth and efficiency in the banking industry: A new test of the efficient structure hypothesis, Journal of Banking and Finance vol. 40/2014, p. 143-153. 14 S. Claessens, L. Laeven, What drives bank competition? Some international evidence, Journal of Money, Credit and Banking vol. 36(3)/2004, p. 563-583. 15 A. Demirgüç-Kunt, L. Laeven, R. Levine, Regulations, market structure, institutions, and the cost of financial intermediation, Journal of Money, Credit and Banking vol. 36(3)/2004, p. 593-622. 16 A. Andries, S. Ursu, Financial crisis and bank efficiency: An empirical study of European banks, Economic Research-Ekonomska Istrazivanija vol. 29(1)/2011, p. 485-497. 17 G. Efthyvoulou, C. Yildirim, Market power in CEE banking sectors and the impact of the global financial crisis, Journal of Banking and Finance vol. 40/2014, p. 11-27. 18 G. Anayiotos, H. Toroyan, A. Vamvakidis, The efficiency of emerging Europe's banking sector before and after the recent economic crisis, Financial Theory and Practice vol. 34/2010, p. 247-267; T. Poghosyan, A. Poghosyan, Foreign bank entry, bank efficiency and market power in Central and Eastern European Countries, Economics of Transition vol. 18(3)/2010, p. 571-598; B. Tuskan, A. Stojanovic, Measurement of cost efficiency in the European banking industry, Croatian Operational Research Review vol. 47/2016, p. 47-66. 19 J. Goddard, J. Wilson, Competition in banking: A disequilibrium approach. Journal of Banking and Finance vol. 33/2009, p. 2282-2292. 20 Z. Fungacova, L. Solanko, L. Weill, Does competition influence the bank lending channel in the Euro area? Journal of Banking and Finance vol. 49/2014, p. 356-366. 21 B. Tabak, D. Tazio, D. Cajueiro, The relationship between banking market competition and risk-taking: do size and capitalization matter? Journal of Banking and Finance vol. 36/2012, p. 3366-3381.
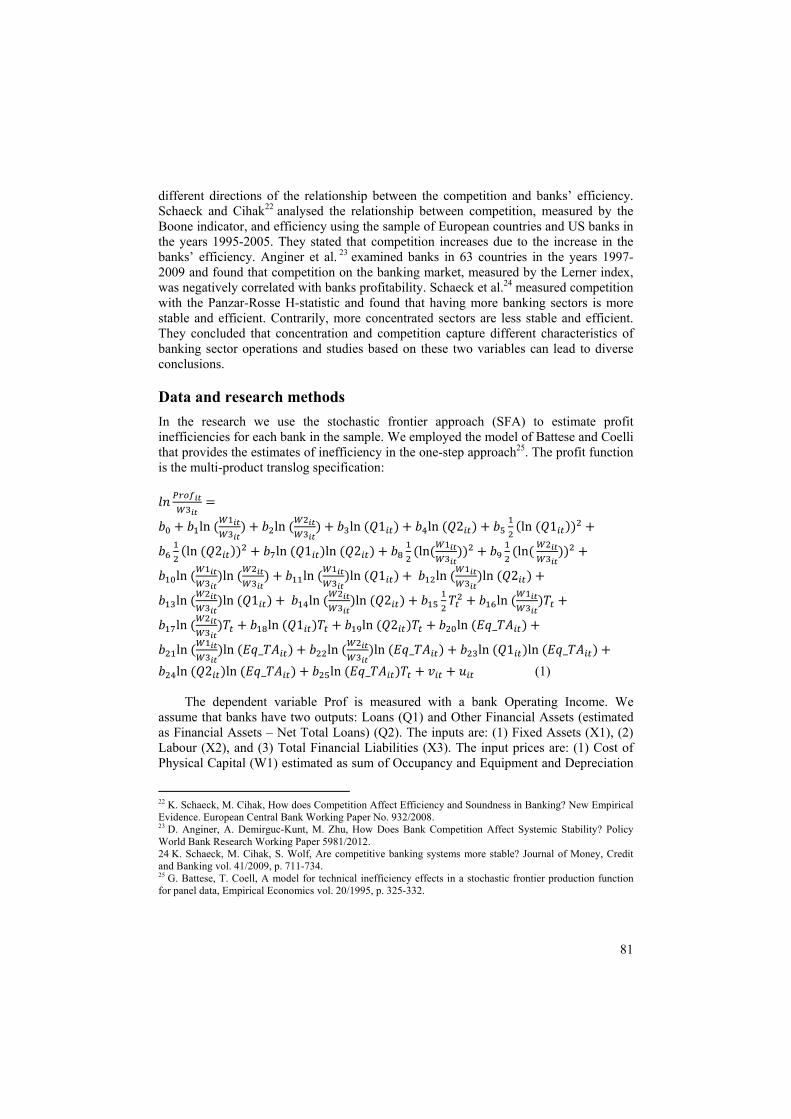
81
different directions of the relationship between the competition and banks’ efficiency. Schaeck and Cihak22 analysed the relationship between competition, measured by the Boone indicator, and efficiency using the sample of European countries and US banks in the years 1995-2005. They stated that competition increases due to the increase in the banks’ efficiency. Anginer et al. 23 examined banks in 63 countries in the years 1997-2009 and found that competition on the banking market, measured by the Lerner index, was negatively correlated with banks profitability. Schaeck et al.24 measured competition with the Panzar-Rosse H-statistic and found that having more banking sectors is more stable and efficient. Contrarily, more concentrated sectors are less stable and efficient. They concluded that concentration and competition capture different characteristics of banking sector operations and studies based on these two variables can lead to diverse conclusions.
Data and research methods In the research we use the stochastic frontier approach (SFA) to estimate profit inefficiencies for each bank in the sample. We employed the model of Battese and Coelli that provides the estimates of inefficiency in the one-step approach25. The profit function is the multi-product translog specification:
ln ln ln 1 ln 2 ln 1ln 2 ln 1 ln 2 ln lnln ln ln ln 1 ln ln 2ln ln 1 ln ln 2 ln ln ln 1 ln 2 ln _ln ln _ ln ln _ ln 1 ln _ln 2 ln _ ln _ (1)
The dependent variable Prof is measured with a bank Operating Income. We assume that banks have two outputs: Loans (Q1) and Other Financial Assets (estimated as Financial Assets – Net Total Loans) (Q2). The inputs are: (1) Fixed Assets (X1), (2) Labour (X2), and (3) Total Financial Liabilities (X3). The input prices are: (1) Cost of Physical Capital (W1) estimated as sum of Occupancy and Equipment and Depreciation
22 K. Schaeck, M. Cihak, How does Competition Affect Efficiency and Soundness in Banking? New Empirical Evidence. European Central Bank Working Paper No. 932/2008. 23 D. Anginer, A. Demirguc-Kunt, M. Zhu, How Does Bank Competition Affect Systemic Stability? Policy World Bank Research Working Paper 5981/2012. 24 K. Schaeck, M. Cihak, S. Wolf, Are competitive banking systems more stable? Journal of Money, Credit and Banking vol. 41/2009, p. 711-734. 25 G. Battese, T. Coell, A model for technical inefficiency effects in a stochastic frontier production function for panel data, Empirical Economics vol. 20/1995, p. 325-332.

82
of PP&E divided by Fixed Assets; (2) Cost of Labour (W2) which is Compensation and Benefits Expense over Total Assets; (3) Cost of Funds (W3) calculated by dividing Interest Expense by Total Financial Liabilities. Following Berger and Mester 26 and Andries and Ursu27 we included also Equity to Total Assets (Eq_TA) as an input to control for differences across banks’ risk preferences. To impose linear homogeneity restrictions, we normalised the dependent variable and all input prices by W3. Finally, we employed time dummy (T) to allow for technological and other time-specific changes, following Lensink, Meesters, and Naaborg28, Lozano-Vivas and Pasiouras29, and Andries and Ursu30. Based on estimating equation (1) we obtained the values of bank profit inefficiency effects .
In order to investigate the determinants of bank profit inefficiency across CEE countries, and especially the impact of market concentration, we regress on the range of potential explanatory variables describing the macroeconomic situation, each country’s banking sector, and bank-specific situation according to the following specification:
_ _ _ (2)
The positive coefficient would mean that the determinant increases bank profit
inefficiency, i.e., decreases bank efficiency. Negative sign on a coefficient would mean that efficiency increases. In the equation (2) GDP per capita (gdp_cap) and Inflation (infl) measure income level and change in annual average consumer price level. The ratio of Banking Sector Loans to GDP (loan_gdp) represents the level of financial intermediation in each country. Market Concentration (concentration) is measured with either market share of the 5 largest banks in a country (CR5) or Herfindahl-Hirschman Index (HHI). Individual Bank Market Share (MKTSh) is estimated as a ratio of the bank total assets to total bank assets in a country. Alternatively, we use Bank Size (Size) calculated as the natural logarithm of bank total assets to check the impact of relative and absolute size of a bank on profit inefficiency. In order to control for the bank’s safety and performance (perf), we employ Total Capital Ratio (TCR) or use ROAA, ROAE, Cost to Income Ratio (C/I), one at a time.
Further, we were also interested in whether the impact of banking market concentration on profit inefficiency is identical across the CEE countries under analysis. For that we estimated the model with an interaction of concentration measure and individual country dummy. We assume thus that all the other variables extend identical impact across all the countries and that only effects of market concentration might differ:
26 A. Berger, L. Mester, Inside the black box: What explains differences in the efficiencies of financial institutions?, Journal of Banking and Finance vol. 21/1997, p. 895-947. 27 A. Andries, S. Ursu, Financial crisis and bank efficiency: An empirical study of European banks, Economic Research-Ekonomska Istrazivanija vol. 29(1)/2016, p. 485-497. 28 R. Lensink, A. Meesters, I. Naaborg, Bank efficiency and foreign ownership: Do good institutions matter?, Journal of Banking and Finance vol. 32/2008, p. 834-844. 29 A. Lozano-Vivas, F. Pasiouras, The impact of non-traditional activities on the estimation of bank efficiency: International evidence, Journal of Banking and Finance vol. 34/2010, p. 1436-1449. 30 A. Andries, S. Ursu, Financial crisis and bank efficiency: An empirical study of European banks, Economic Research-Ekonomska Istrazivanija vol. 29(1)/2016, p. 485-497. .

83
_ _ _ (3)
We also checked whether the impact differs between countries that have and have
not adopted the euro with the dummy variable EURO, which takes value 1 for the years since euro adoption, and 0 otherwise: _ _ _
(4)
All bank-level data are obtained from the SNL database. Data on GDP per capita, rate of inflation, and loans to GDP come from Eurostat while data on market concentration come from ECB Statistical Data Warehouse. All the data are of annual frequency and cover the period from 2005 to 2017. We collected the data on 11 Central and Eastern European countries: Bulgaria (8 banks), Czech Republic (9), Estonia (4), Croatia (14), Hungary (9), Lithuania (6), Latvia (6), Poland (19), Romania (9), Slovenia (3), and Slovakia (7).
Results and discussion In the first stage of the research we estimated banks’ profit inefficiency scores using the trans-log equation 1. Table 1 presents values of the average inefficiency and efficiency scores for the individual countries and for individual years.
Table 1. Average profit inefficiency and efficiency scores Country u1 PE1 Year u2 PE2
BG 16.2% 85.1% 2005 13.4% 87.5% CZ 15.8% 85.4% 2006 14.8% 86.3% EE 18.5% 83.1% 2007 17.1% 84.3% HR 17.5% 84.0% 2008 20.0% 81.8% HU 18.1% 83.5% 2009 19.6% 82.2% LT 17.7% 83.7% 2010 18.8% 82.9% LV 14.5% 86.5% 2011 15.1% 86.0% PL 21.6% 80.6% 2012 18.6% 83.0% RO 16.0% 85.2% 2013 22.6% 79.8% SI 26.9% 76.4% 2014 16.8% 84.5% SK 12.8% 88.0% 2015 18.0% 83.5%
2016 16.7% 84.6% 2017 19.7% 82.1%
Note: Bulgaria - BG, Czech Republic - CZ, Estonia - EE, Croatia - HR, Hungary - HU, Lithuania - LT, Latvia - LV, Poland - PL, Romania - RO, Slovenia - SI, Slovakia – SK, 1) average for the entire period, 2) average over all countries, u – profit inefficiency score, PE – profit efficiency score, where PE=exp(-u). Source: Authors’own calculation based on the SNL data.
The results indicate that efficiency of banks in the CEE countries is diverse, from the lowest in Slovenia (76%) to the highest in Slovakia (88%) with the average for the region of 84%. Additionally, during the analysed period the CEE banks operated

84
with a variable efficiency. The values of efficiency scores for individual years indicate that banks’ efficiency falls in the periods of macroeconomic turbulence in 2007-2009 and 2012-2013, and after these periods significantly restores.
In the second stage of the research we checked how the banking market concentration affects banks’ inefficiency scores , controlling for the impact of some macroeconomic variables and bank characteristics (Table 2). The results confirm the assumption of a significant impact of the market structure on the banks’ efficiency. For both measures of concentration, CR5 and HHI, the coefficients in the Models 1 and 2 indicate that banks tend to enjoy higher profit efficiency in more concentrated markets. For a robustness check we regressed efficiency with variables representing the size of the bank (Models 3, 4 and 5) and we received similar results implying that larger banks can achieve higher profit efficiency. Such outcomes can be explained with the ES theory, which states that the more efficient banks become, they increase their market share and concentration of the market31.
Table 2. Relation between profit inefficiency scores and macroeconomic and bank individual variables
Variable Model 1 Model 2 Model 3 Model 4 Model 5 Model 6 Model 7 Model 8
l.GDPpc 0.040 (0.034)
0.031 (0.033)
0.042* (0.023)
0.113*** (0.036)
0.103*** (0.035)
-0.012 (0.021)
-0.002 (0.020)
0.023* (0.013)
l.Inflation 0.006* (0.003)
0.006 (0.000)
0.006** (0.003)
0.007** (0.003)
0.007** (0.003)
-0.003 (0.002)
-0.002 (0.002)
0.003* (0.002)
Loan_GDP 0.001 (0.000)
-0.001* (0.000)
0.001** (0.000)
-0.001*** (0.000)
-0.001*** (0.000)
-0.001*** (0.000)
-0.001*** (0.000)
0.001 (0.000)
CR5 -0.002*** (0.001)
-0.004*** (0.001) 0.001
(0.000) -0.001 (0.000)
0.001 (0.000)
HHI -0.589** (0.201) -0.942***
(0.243)
MKTSh -0.353*** (0.130)
Size -0.056*** (0.012)
-0.056*** (0.012)
TCR 0.005** (0.002)
0.005*** (0.002)
0.005** (0.002)
0.005*** (0.002)
0.005*** (0.002)
ROAA -0.035*** (0.012)
ROAE -0.002** (0.001)
C/I 0.005*** (0.000)
Constant -0.124 (0.296)
-0.119 (0.294)
-0.247 (0.211)
0.181 (0.305)
0.159 (0.303)
0.365* (0.188)
0.267 (0.179)
-0.303*** (0.118)
N 625 625 625 625 625 625 625 625
R2 0.044 0.039 0.049 0.114 0.107 0.042 0.13 0.531
F-stat 2.77 2.18 4.48 5.21 4.63 4.48 5.62 40.48
Note: standard error in brackets, ***, **, * represent 1%, 5% and 10% significance level. Source: Authors’own calculation based on the SNL data. 31 The National Bank of Poland reported in 2018 that for some recently in Poland, large banks become more efficient and earn the majority of profits of the banking sector, see: Box 2.5 Concentration of earnings of domestic commercial banks, Financial Stability Report. December 2018. NBP, p. 57-58.
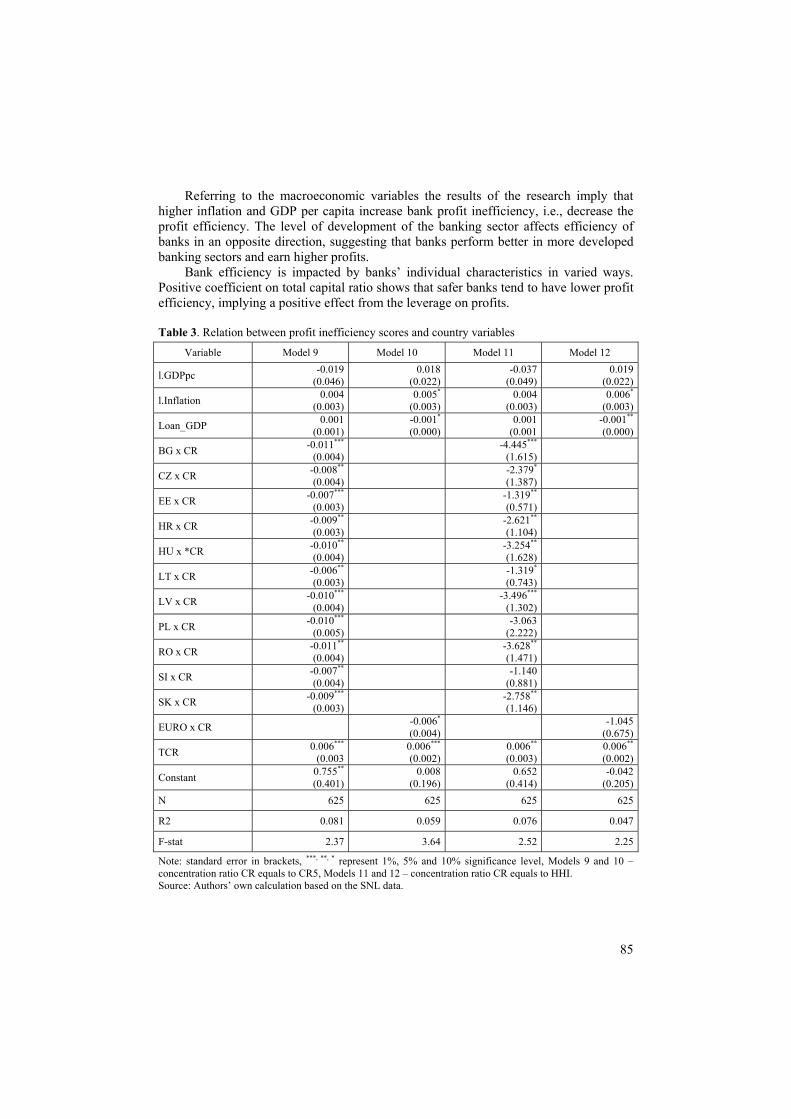
85
Referring to the macroeconomic variables the results of the research imply that higher inflation and GDP per capita increase bank profit inefficiency, i.e., decrease the profit efficiency. The level of development of the banking sector affects efficiency of banks in an opposite direction, suggesting that banks perform better in more developed banking sectors and earn higher profits.
Bank efficiency is impacted by banks’ individual characteristics in varied ways. Positive coefficient on total capital ratio shows that safer banks tend to have lower profit efficiency, implying a positive effect from the leverage on profits.
Table 3. Relation between profit inefficiency scores and country variables
Variable Model 9 Model 10 Model 11 Model 12
l.GDPpc -0.019(0.046)
0.018(0.022)
-0.037(0.049)
0.019 (0.022)
l.Inflation 0.004(0.003)
0.005*
(0.003)0.004
(0.003)0.006*
(0.003)
Loan_GDP 0.001(0.001)
-0.001*
(0.000)0.001
(0.001-0.001** (0.000)
BG x CR -0.011***
(0.004)-4.445***
(1.615)
CZ x CR -0.008**
(0.004)-2.379*
(1.387)
EE x CR -0.007***
(0.003)-1.319**
(0.571)
HR x CR -0.009**
(0.003)-2.621**
(1.104)
HU x *CR -0.010**
(0.004)-3.254**
(1.628)
LT x CR -0.006**
(0.003)-1.319*
(0.743)
LV x CR -0.010***
(0.004)-3.496***
(1.302)
PL x CR -0.010***
(0.005)-3.063
(2.222)
RO x CR -0.011**
(0.004)-3.628**
(1.471)
SI x CR -0.007**
(0.004)-1.140
(0.881)
SK x CR -0.009***
(0.003)-2.758**
(1.146)
EURO x CR -0.006*
(0.004)-1.045
(0.675)
TCR 0.006***
(0.0030.006***
(0.002)0.006**
(0.003)0.006** (0.002)
Constant 0.755**
(0.401)0.008
(0.196)0.652
(0.414)-0.042
(0.205) N 625 625 625 625
R2 0.081 0.059 0.076 0.047
F-stat 2.37 3.64 2.52 2.25
Note: standard error in brackets, ***, **, * represent 1%, 5% and 10% significance level, Models 9 and 10 – concentration ratio CR equals to CR5, Models 11 and 12 – concentration ratio CR equals to HHI. Source: Authors’ own calculation based on the SNL data.

86
When it comes to bank performance, higher profitability measured by ROAA and ROAE, and higher cost efficiency C/I32 (Models 6, 7 and 8) allow banks to achieve higher profit efficiency. It is noteworthy that the R-squared statistic is especially high for the specification with C/I ratio showing thus the high importance of banks’ operating costs on profit efficiency.
Finally, the results of Models 9 to 12, which check whether the influence of market concentration on bank profit efficiency depends on the specific country under analysis, imply that banking market concentration impact on banks’ profit efficiency is similar and statistically significant in all the analysed CEE countries (Table 3). When we use HHI instead of CR5 ratio, the coefficient is not statistically significant in Poland and Slovenia only. There is also no prominent difference in the impact of market concentration between euro area and non-euro area countries.
Conclusions This paper studies the relatively rarely described problem of the impact of banking market structure on bank profit efficiency in CEE countries in years 2000-2017. The results show that growing market concentration extends positive impact on the efficiency of the banks operating on this market. Larger bank size and bank market share have a similar effect. Thus, it seems that banks in CEE countries within the studied period could follow the ES theory. Increase in market concentration was endogenous and came from the growing size of the effective banks which crowded out less effective institutions.
Bank profit efficiency is supported by banks’ profitable activities, low operation costs relative to incomes, and financial leverage. Furthermore, the efficiency is affected by the external environment, especially the level of banking sector development, price stability, and level of income per inhabitant, represented by GDP per capita. The direction of the impact of macroeconomic variables on efficiency suggest that in countries with lower GDP per capita (including emerging markets) banks operate more efficiently. It thus follows that these countries must be wary of a possible fall in bank efficiency as they continue to grow and should continue monitoring the situation of their banking systems.
References
Anginer D., Demirguc-Kunt A., Zhu M., How Does Bank Competition Affect Systemic Stability? Policy World Bank Research Working Paper 5981/2012. Amel D., Barnes C., Panetta F., Salleo C., Consolidation and efficiency in the financial sector: A review of the international evidence. Journal of Banking and Finance vol. 28/2004. Anayiotos G., Toroyan H., Vamvakidis A., The efficiency of emerging Europe's banking sector before and after the recent economic crisis. Financial Theory and Practice vol. 34/2010. Andries A., The determinants of bank efficiency and productivity growth in the central and eastern European banking systems. Eastern European Economics vol. 49(6)/2011. Andries A., Ursu S, Financial crisis and bank efficiency: An empirical study of European banks. Economic Research-Ekonomska Istrazivanija vol. 29(1)/2016. Avkiran N., The evidence on efficiency gains: The role of mergers and the benefits to the public. Journal of Banking and Finance vol. 23(7)/1999. 32 Lower values of cost-to-income ratio C/I indicate higher cost efficiency.
87
Avramidis P., Cabolis Ch., Serfes K., Bank size and market value: The role of direct monitoring and delegation costs. Journal of Banking and Finance vol. 93/2018. Bain J., Relation of Profit Rates to Industry Concentration. Quarterly Journal of Economics vol. 55/1951. Battese G., Coelli T., A model for technical inefficiency effects in a stochastic frontier production function for panel data. Empirical Economics vol. 20/1995. Berger A., The profit-structure relationship in banking – tests of market-power and efficient-structure hypotheses. Journal of Money, Credit and Banking vol. 27/1995. Berger A., Demsetz R., Strahan P., The consolidation of the financial services industry: Causes, consequences, and implications for the future. Journal of Banking and Finance vol. 23/1999. Berger A., Hannan T., The Price-Concentration Relationship in Banking. The Review of Economics and Statistics vol. 71/1989. Berger A., Mester L., Inside the black box: What explains differences in the efficiencies of financial institutions? Journal of Banking and Finance vol. 21/1997. Berger A., Hasan I., Zhou M., Bank ownership and efficiency in China: what will happen in the world’s largest nation? Journal of Banking and Finance vol. 33/2009. Bikker J., Haaf K., Competition, concentration and their relationship: An empirical analysis of the banking industry. Journal of Banking and Finance vol. 26 (11)/2002. Casu B., Girardone C., Bank competition, concentration and efficiency in the single European market. The Manchester School vol. 74(4)/2002. Claessens S., Laeven L., What drives bank competition? Some international evidence. Journal of Money, Credit and Banking vol. 36(3)/2004. Demirgüç-Kunt A., Laeven L., Levine R., Regulations, market structure, institutions, and the cost of financial intermediation. Journal of Money, Credit and Banking vol. 36(3)/2004. Demsetz H., Industry structure, market rivalry, and public policy. Journal of Law and Economics vol. 16/1973. Duygun M., Sena V., Shaban M., Schumpeterian competition and efficiency among commercial banks. Journal of Banking and Finance vol. 37/2013. Efthyvoulou G., Yildirim C., Market power in CEE banking sectors and the impact of the global financial crisis. Journal of Banking and Finance vol. 40/2014. Financial Stability Report. December 2018, The National Bank of Poland, Warsaw 2018. Fu X., Lin Y., Molyneux P., Bank competition and financial stability in Asia Pacific. Journal of Banking and Finance vol. 38/2014, p. 64-77. Fungacova Z., Solanko L., Weill L., Does competition influence the bank lending channel in the Euro area? Journal of Banking and Finance vol. 49/2014, p. 356-366. Garcia-Herrero, A., Gavila, S., Santabarbara, D., What explains the low profitability of Chinese banks? Journal of Banking and. Finance vol. 33/2009, p. 2080-2092. Gilbert R., Bank market structure and competition. Journal of Money, Credit, and Banking vol. 16/1984. Haynes M., Thompson S., The productivity effects of bank mergers: Evidence from the UK building societies. Journal of Banking and Finance vol. 23/1999. Homma T., Tsutsui Y., Uchida H., Firm growth and efficiency in the banking industry: A new test of the efficient structure hypothesis. Journal of Banking and Finance vol. 40/2014. Koutsomanoli-Filippaki A., Margaritis D., Staikouras C., Efficiency and productivity growth in the banking industry of Central and Eastern Europe. Journal of Banking and Finance vol. 33/2009. Koutsomanoli-Filippaki A., Staikouras C., Competition and concentration in the New European banking Landscape. Working Paper Department of Accounting and Finance, Athens University of Economics and Business 2014, Greece. Lensink R., Meesters A., Naaborg I., Bank efficiency and foreign ownership: Do good institutions matter? Journal of Banking and Finance vol. 32/2008.
88
Lozano-Vivas A., Pasiouras F., The impact of non-traditional activities on the estimation of bank efficiency: International evidence. Journal of Banking and Finance vol. 34/2010. Mamatzakis E., Matousek R., Vu A.N., What is the impact of bankrupt and restructured loans on Japanese bank efficiency? Journal of Banking and Finance vol. 72/2017. Mason E., Price and Production Policies of Large-Scale Enterprise. American Economic Review vol. 29(1)/1939. Maudos J., Fernandez de Guevara J., Factors explaining the interest margin in the banking sectors of the European Union. Journal of Banking and Finance vol. 28/2014, p. 2259-2281. Mesa R., Sánchez H., Sobrino J., Main determinants of efficiency and implications on banking concentration in the European Union. Spanish Accounting Review vol., 17(1)/2014. Niţoi M., Spulbar C., An Examination of Banks’ Cost Efficiency in Central and Eastern Europe. Procedia Economics and Finance vol. 22/2015. Peng J., Jeng V., Wang J., Chen Y., The impact of bancassurance on efficiency and profitability of banks: Evidence from the banking industry in Taiwan. Journal of Banking and Finance vol. 80/2017. Poghosyan T., Poghosyan A., Foreign bank entry, bank efficiency and market power in Central and Eastern European Countries. Economics of Transition vol. 18(3)/2010. Rhoades S., Efficiency effects of horizontal (in-market) bank mergers. Journal of Banking and Finance vol. 17(2-3)/1993. Schaeck K., Cihak M., How does Competition Affect Efficiency and Soundness in Banking? New Empirical Evidence. European Central Bank Working Paper No. 932/2008. Schaeck K., Cihak M., Wolf S., Are competitive banking systems more stable? Journal of Money, Credit and Banking vol. 41/2009, p. 711-734. Silva T., Guerra S., Tabak B., de Castro Miranda R., Financial networks, bank efficiency and risk-taking. Journal of Financial Stability vol. 25(C)/2016. Tabak B., Tazio D., Cajueiro D., The relationship between banking market competition and risk-taking: do size and capitalization matter? Journal of Banking and Finance vol. 36/2012, p. 3366-3381. Tuskan B., Stojanovic A., Measurement of cost efficiency in the European banking industry. Croatian Operational Research Review vol. 47/2016.
Efektywność banków a koncentracja sektora bankowego w krajach EŚW
Streszczenie Zależność między strukturą rynku bankowego a efektywnością banków jest przedmiotem wielu badań od kilku dziesięcioleci. Większość z nich wskazuje na dodatnią korelację między tymi zmiennymi. Celem badania jest zbadanie tej relacji dla 96 banków działających w jedenastu krajach Europy Środkowo-Wschodniej w latach 2005-2017. Efektywność banków jest wyznaczana przy pomocy metody SFA a następnie poddana regresji względem czynników makroekonomicznych i indywidualnych dla banków. Wyniki badania wskazują, że na efektywność banków pozytywnie wpływa koncentracja rynku, a także wielkość ich aktywów. Zależność ta jest obecna we wszystkich badanych krajach. Dodatkowo stwierdzono, że na efektywność banków pozytywnie wpływa rozwój systemu bankowego. Natomiast przeciwnie, PKB pc, stopa inflacji i współczynnik kapitałowy banku nie sprzyjają wydajności banków.

89
Słowa kluczowe: kraje EŚW, bank, efektywność, koncentracja rynku JEL codes: G10, G15, G21 Information about authors:
Sylwester Kozak, dr hab. Warsaw University of Life Sciences - SGGW 166 Nowoursynowska Str., 02-798 Warsaw, e-mail: [email protected], ORCID: 0000-0001-9485-6704.
Agata Wierzbowska, dr Kobe University 2-1 Rokkodai-cho, Nada-ku, Kobe, Japan, e-mail: [email protected], ORCID: 000-0001-8641-3217.

90
22 (71) 2019 DOI 10.22630/PEFIM.2019.22.71.28
Wioletta Krawiec University of Lodz
BUILDING A BRAND FOR THE CITY OF LODZ: MOTIVATING AND DEMOTIVATING FACTORS
FOR MANAGERS OF CULTURAL INSTITUTIONS
The article aims to identify areas/factors that may motivate or discourage managers of cultural institutions from getting actively involved in the process of building the Lodz brand for cultural resources.
The article describes the manager profile of cultural institutions and presents an ordered list of factors (stimuli) that have a positive or negative impact on the activities of managers of cultural institutions in the area of creating the city brand.
The empirical basis of the article is interviews with managers and promotion employees in the city's cultural institutions in Lodz. Data analysis was carried out by the principles of grounded theory methodology. The research has been carried out since December 2017 within the Department of Marketing and the Department of City and Region Management of the Faculty of Management at the University of Lodz as part of the project: "Cooperation of public administration with cultural institutions in the context of building a city brand". Keywords: city brand, manager, grounded theory, cultural institutions, motivators, de-motivators JEL Codes: M14, M31
Introduction Today's cultural institutions need professionals who think like innovators and manage like businesspeople. Currently, cultural managers are expected to have creative ideas (creative solutions), the ability to see opportunities and threats in the future, and flexible adaptation to changes in the environment.1 It is also related to the fact that the documented level of education of the employed workers is becoming less and importing less. Modern technology enables people to access knowledge and gather different experiences faster. However, technologies are developing more quickly than many people are able to acquire new skills. Therefore, there is a belief that soft skills will be the primary influence on the success of modern organizations, replacing the lack of hard skills of their employees.2 Remote or individualized work styles, and generational
1 S. Kania: Przewódca jako kreator zmian w organizacji, „Menagement Forum”, vol. 3, no. 2, 2015, ss. 38-43; W. Krawiec: Kreatywność jako determinanta tworzenia wartości i pogłębiania doświadczeń jej odbiorców, Prace naukowe Uniwersytetu Ekonomicznego we Wrocławiu, nr 529, 2018, ss. 129-139; R. W. Woodman, J. E. Sawyer, R. Griffin: Toward a Theory of Organizational Creativity, „ Academy of Management Review" vol. 18 (2), 1993; J. D. Wadden: Marketing creativity: the influence of personal and proximal work factors on creative activity, „ Marketing Management Journal", vol. 21 (2), 2011, s. 73; Report GUS: Działalność innowacyjna przedsiębiorstw w Polsce w latach 2013-2015, s. 41-63. 2 M. Bellon, Szefowa IBM uważa, że zatrudnianie ludzi na podstawie dyplomu, jest błędem, Business Sinder Polska, https://businessinsider.com.pl/rozwoj-osobisty/kariera/kariera-w-branzy-technologicznej-rady-szefowej-ibm/esre9wc (z dnia: 10.02.2019).

91
differences, mean that other factors can motivate or demotivate employees. Research in this area is conducted mainly for large organizations, but there are not many publications in the area of cultural institution management. Usually these publications are targeted at public administration employees.3
In this article, the scope of changes in the business world described above was referred to managers and employees of the city's cultural institutions in Lodz. Based on the conducted interviews and their analysis, in accordance with the principles of grounded theory methodology, the author of the paper managed to identify/categorise the profile of the manager of a cultural institution (CI) and the factors motivating or demotivating employees of cultural institutions in the process of building the brand of the city of Lodz, taking into account its cultural resources.
The reference of considerations to cultural resources results from brand strategy adopted by this city of Lodz. It should be mentioned here that the cultural resources of the city of Lodz are one of the city sub-products accepted and recorded in the document titled “The Brand Management Strategy for the years 2010-2016”4, which specified the direction for building the city's brand based on culture, new media and creative industry. In order to understand the essence and potential of the creative approach to the city's brand, a document describing activities related to the development of culture, entitled “Culture Development Policy 2020+ for the City of Lodz”, was prepared.5
The results of the research presented in the article are a part of a larger research project conducted within the Department of Marketing and the Department of City and Region Management of the Faculty of Management at the University of Lodz entitled "Cooperation between public administration and cultural institutions in the context of building a city's brand".
Managers of cultural institutions and building the city's brand for cultural resources Building the city's brand is influenced not only by the city's resources but also by the people who can be able to use these resources. Through them, the brand can articulate its values, which are reflected in the city image. The city's brand should be regarded as a particularly complex and multidimensional construct, as it results from the complexity of the territorial
3 E.g. L. Bright's research refers to the relationship between public service motivation and personality traits, management level and financial preferences of public sector employees. The results show that public sector employee motivation is to a large extent related to gender, educational level, level of management and financial preferences of public sector employees. The implications of this study and the areas of future research are discussed. Look at the research in more detail: L. Bright, Public Employees With High Levels of Public Service Motivation: Who Are They, Where Are They, and What do They Want?, “Review of Public Personnel Administration”, Vol. 25. 2, 2005, pp. 138-154; L. Bright, Where Does Public Service Motivation Count the Most in Government Work Environments? A Preliminary Empirical Investigation and Hypotheses, “Public Personnel Management”, Vol.42, 1, 2013, pp. 5-26; L. Bright, Why Age Matters in the Work Preferences of Public Employees: A Comparison of Three Age-Related Explanations, “Public Personnel Management”, Vol. 39, 1, 2010, pp. 1-14; and research: S. Park, Motivation of Public Managers as Raters in Performance Appraisal: Developing a Model of Rater Motivation, “Public Personnel Management”, Vol. 43, 4, 2014; pp. 387-414; B. E Wright, S. Kim, Participation's Influence on Job Satisfaction: The Importance of Job Characteristics, “Review of Public Personnel Administration”, 24, 1, 2004, pp. 18–40. 4 Original title (Polish): Strategia Zarządzania Marka Łódź na lata 2010-2016, s. 17-30. 5 Original title (Polish): Polityka Rozwoju Kultury 2020+ dla Miasta Łodzi.

92
product. The city, similar to a company, offers its current and potential users certain products, both tangible and intangible, in the broadly understood spatial structure of the city, which become the subject of the market exchange.6 The city’s brand, therefore, connects both material elements that constitute the city's reality (infrastructure, architecture, tourism development) and intangible aspects (values and beliefs).7 The process of building a city's brand is significantly different from the process of creating a consumer product brand. These differences come down mainly to the objectives, the level of diversification of consumer groups and the complexity of the process.8
In the process of creating a city's brand based on cultural resources, the managers of cultural institutions (CI) can play a significant role. They become, to some extent, the guardians of the city's proper image. This requires cultural institutions to employ managers with an appropriate profile. It is not a simple task for any organisation. Managerial psychology has long tried to create a list of features that should characterize an ideal manager. There are many approaches in the literature to describe managerial features, skills and competencies.9 The manager's profile is described in the following dimensions: professionally (professional qualifications and managerial competencies) and personally (managerial typology: visionary, analyst, contractor, observer, theoretician, pragmatist).10 It is worth mentioning here the profile of the manager of the so-called "new era", whose work should be based on the 3-C model: communication, creativity, cohabitation.11 This approach is associated with a demanding market today, in which creative managers are required.12 More attention is given to the soft skills of managers, which influence the success of a modern organisation.13
Therefore, the culture manager will be expected to have characteristics for creating a professional profile and intellectual potential. These should facilitate leading and managing a team of people, as well as achieving the common goals of cultural institutions. The desired characteristics of cultural managers are described in the
6 T. Markowski: Marketing terytorialny, „Studia KPZK PAN”, t. CXII, 2002. 7 M. Korczyńska: Marka miasta, „Marketing i Rynek”, (12),2002, ss. 2–10. 8 R. Seweryn: Kryzys gospodarczy a ewolucja marki Kraków w opinii hiszpańskich turystów, „Współczesne Zarządzanie”, (1), 2013, ss. 51–61; Ph. Kotler, N. Lee: Marketing w sektorze publicznym. Mapa drogowa wyższej efektowności, Wyd. Akademickie i Profesjonalne, Wyższa Szkoła Przedsiębiorczości i Zarządzania im. L. Koźmińskiego, Warszawa 2008. 9 A. Tomaszuk: Sylwetka menedżera w świetle teorii zarządzania i badań własnych na przykładzie menedżerów sektora budownictwa województwa podlaskiego, „Economics and Management”, nr 4, 2013, ss. 67-81; Z. Ciekanowski: Rola menedżera w organizacji, „Zeszyty Naukowe Uniwersytetu Przyrodniczo-Humanistycznego w Siedlcach. Administracja i Zarządzanie”, z. 34, nr 107, 2015, ss. 185-195; M. Ciesielska: Lider poszukiwany. Jak stworzyć model kompetencji pożądanego lidera zespołu, „Personel 7 ”, 2007. 10 P.F. Drucker: Menedżer skuteczny, AE, Kraków 1994; C.S. Nosal: Psychologia myślenia i działania menedżera, AKADE, Kraków 2001; P. Wachowiak: Profesjonalny menedżer, Difin, Warszawa 2001. 11 W. Wierżyński: Menedżerowie nowej ery, http://www.pi.gov.pl/PARP/chapter_86196.asp?soid=4A743DA96D4F422C94CAB3F7CACF3036, dostęp: 15.11.2018. 12 M. Williams: Mistrzowskie przywództwo, Oficyna Wolters Kluwer Business, Kraków 2009; K. B. Simerson, M. L.Venn, Menedżer jako lider, Oficyna Wolters Kluwer Business, Warszawa; J. Penc:, Nowe zarządzanie w nowej gospodarce, Wydawca SLG International Training Center, Warszawa 2010. 13 These soft skills, such as communication, interpersonal and social skills or emotional intelligence, are much more difficult to learn than, e.g. programming. Look more: M. Bellon, Szefowa IBM uważa, że zatrudnianie ludzi na podstawie dyplomu, jest błędem, Business Sinder Polska, https://businessinsider.com.pl/rozwoj-osobisty/kariera/kariera-w-branzy-technologicznej-rady-szefowej-ibm/esre9wc(z dnia: 10.02.2019).
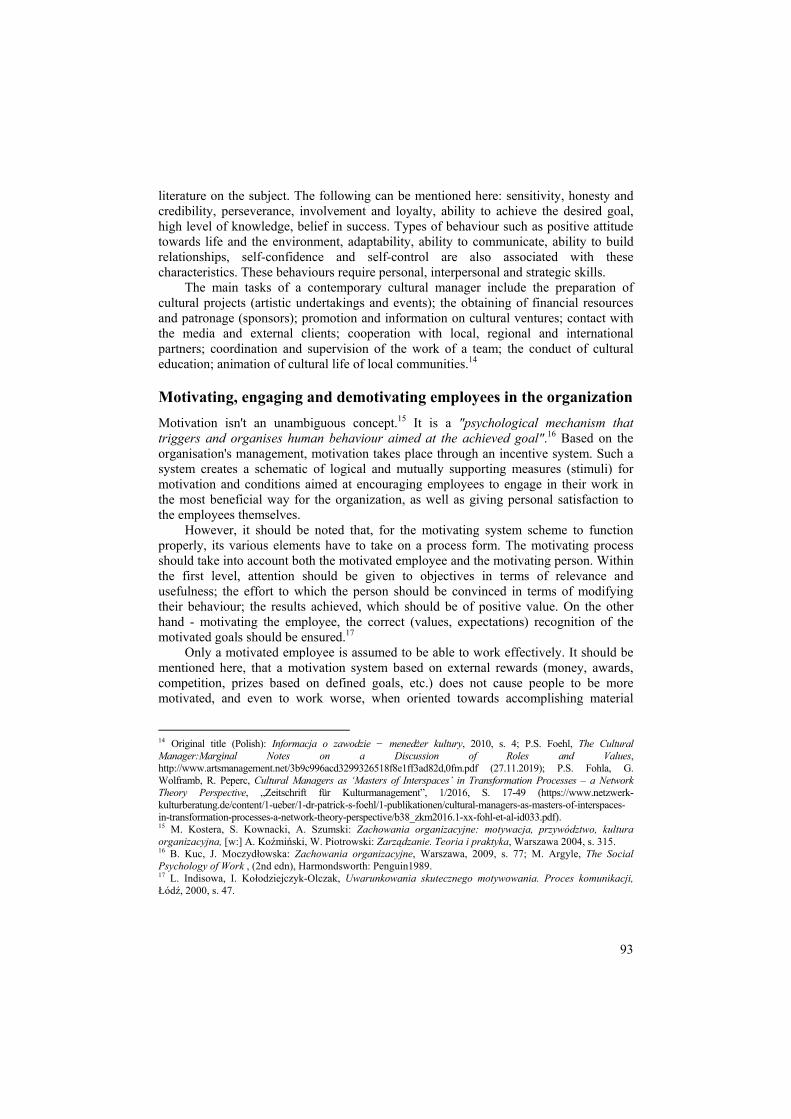
93
literature on the subject. The following can be mentioned here: sensitivity, honesty and credibility, perseverance, involvement and loyalty, ability to achieve the desired goal, high level of knowledge, belief in success. Types of behaviour such as positive attitude towards life and the environment, adaptability, ability to communicate, ability to build relationships, self-confidence and self-control are also associated with these characteristics. These behaviours require personal, interpersonal and strategic skills.
The main tasks of a contemporary cultural manager include the preparation of cultural projects (artistic undertakings and events); the obtaining of financial resources and patronage (sponsors); promotion and information on cultural ventures; contact with the media and external clients; cooperation with local, regional and international partners; coordination and supervision of the work of a team; the conduct of cultural education; animation of cultural life of local communities.14
Motivating, engaging and demotivating employees in the organization
Motivation isn't an unambiguous concept.15 It is a "psychological mechanism that triggers and organises human behaviour aimed at the achieved goal".16 Based on the organisation's management, motivation takes place through an incentive system. Such a system creates a schematic of logical and mutually supporting measures (stimuli) for motivation and conditions aimed at encouraging employees to engage in their work in the most beneficial way for the organization, as well as giving personal satisfaction to the employees themselves.
However, it should be noted that, for the motivating system scheme to function properly, its various elements have to take on a process form. The motivating process should take into account both the motivated employee and the motivating person. Within the first level, attention should be given to objectives in terms of relevance and usefulness; the effort to which the person should be convinced in terms of modifying their behaviour; the results achieved, which should be of positive value. On the other hand - motivating the employee, the correct (values, expectations) recognition of the motivated goals should be ensured.17
Only a motivated employee is assumed to be able to work effectively. It should be mentioned here, that a motivation system based on external rewards (money, awards, competition, prizes based on defined goals, etc.) does not cause people to be more motivated, and even to work worse, when oriented towards accomplishing material
14 Original title (Polish): Informacja o zawodzie − menedżer kultury, 2010, s. 4; P.S. Foehl, The Cultural Manager:Marginal Notes on a Discussion of Roles and Values, http://www.artsmanagement.net/3b9c996acd3299326518f8e1ff3ad82d,0fm.pdf (27.11.2019); P.S. Fohla, G. Wolframb, R. Peperc, Cultural Managers as ‘Masters of Interspaces’ in Transformation Processes – a Network Theory Perspective, „Zeitschrift für Kulturmanagement”, 1/2016, S. 17-49 (https://www.netzwerk-kulturberatung.de/content/1-ueber/1-dr-patrick-s-foehl/1-publikationen/cultural-managers-as-masters-of-interspaces-in-transformation-processes-a-network-theory-perspective/b38_zkm2016.1-xx-fohl-et-al-id033.pdf). 15 M. Kostera, S. Kownacki, A. Szumski: Zachowania organizacyjne: motywacja, przywództwo, kultura organizacyjna, [w:] A. Koźmiński, W. Piotrowski: Zarządzanie. Teoria i praktyka, Warszawa 2004, s. 315. 16 B. Kuc, J. Moczydłowska: Zachowania organizacyjne, Warszawa, 2009, s. 77; M. Argyle, The Social Psychology of Work , (2nd edn), Harmondsworth: Penguin1989. 17 L. Indisowa, I. Kołodziejczyk-Olczak, Uwarunkowania skutecznego motywowania. Proces komunikacji, Łódź, 2000, s. 47.

94
benefits. Much more engaging are stimuli from the group of internal motivators.18 These can include: challenges in the workplace; a sense of the reality of the task being performed; learning new things; personal development; independence in action. Other essential practices in this area include skillful delegation of functions and powers, employee involvement in setting goals for the organization and joint celebration of successes19, as well as relations with supervisors and comfort at work (independence of the position, organizational culture of the company, ensuring work-life-balance).20
An appropriately constructed motivating system should trigger the employee's involvement, which will indicate their attitude towards the organisation. In social psychology, attitude is understood as an individual's permanent approach to someone or something. It includes three components: rational (perspective "I work here because I have no other choice"); emotional (reaction "I work here because I want to") and behavioural ("I work because I should").21
From the perspective of the organization, the most valuable is involvement, which is manifested by initiating changes and taking responsibility for them, perceiving problems and making proposals for solving them, innovativeness, and searching for new professional challenge22
However, the question often arises, why despite the specific motivation system for employees, does it not work? The report prepared by “ARC Market and Opinions” shows that the most discouraging factors for managers to continue working include complicated relationships with their supervisors and illegal objectives.23 These are often the main reasons for resignation from work.
Profile of managers of cultural institutions and factors motivating / demotivating their involvement in the city of Lodz's branding process of cultural resources - research results Method research The scope of the analysed research results is dictated by the purpose of the article, the state of the available data and the adopted method of their analysis and deduction. The information for review in this article comes from 15 purposely selected interviews with
18 S. Park, Motivation of Public Managers as Raters in Performance Appraisal: Developing a Model of Rater Motivation, „Public Personnel Management”, Vol. 43, 4, 2014; pp. 387-414. 19 M. Wójtowicz, Tajemnice motywacji – trzy spojrzenia na problem motywacji pracowników, Good Point, https://goodpoint.blog/tajemnice-motywacji-trzy-spojrzenia-na-problem-motywacji-pracownikow/ (z dnia: 24.04. 2017). 20 Report: Motywacje menadżerów 2016, ARC Rynek i opinie, Warszawa 2016; M. Matejun, S. Dębska, Non-Economic Incentives to Motivate Employees – Lodz Branch of Norauto Polska Ltd. Example, [in:] D. Lewicka (red.), Organisation Management. Competitiveness, Social Responsibility, Human Capital, AGH University of Science and Technology Press, Krakow 2010, pp. 91-112; L. Machara and P. Jain, Factors affecting staff motivation in public libraries: a case of selected public libraries in Botswana, „Mousaion: South African Journal of Information Studies”, Vol. 34, 1, 2016, pp. 101 – 122. 21 G. Lindzey, E. Aronson: Handbook of Social Psychology, New York, Random House, 1985; J.P. Meyer, N.J. Allen, A Tree-Component Conceptualization on Organizational Commitment, „Human Resource Management Review” 1991, No. 1, ss. 61–89. 22H. Guryn, Czy warto mierzyć zaangażowanie pracowników, „Personel i Zarządzanie” 2009, nr 4. 23 Report: Motywacje menadżerów 2016, ARC Rynek i opinie, Warszawa 2016.

95
managers and promotion specialists employed in city cultural institutions subordinate to the City of Lodz Office (approx. 30% of surveyed managers of cultural institutions in Lodz).24 From the answers of the respondents, it can be concluded that all the people participating in the study have higher education. The respondents work in cultural institutions such as theatres, museums, cultural centres, libraries, sports and cultural institutes.
The interviews were transcribed and then, following the accepted aim of the article and the principles of grounded theory methodology, the so-called theoretical sampling and coding were undertaken.25 This analysis also allowed to determine the purpose of this article.
It should also be mentioned here that the ground theory assumes researching without formulating any research hypotheses; at most, there may be so-called initial assumptions, which, based on the research, may evolve or create new ones. It is also possible not to have them at all. The ground theory gives the researcher the possibility to discover new phenomena, concepts, theories, classifications or, as a result, to find relations between categories, which may be the starting point for the formulation of research hypotheses.26
The categories and codes presented in the article are the results of analyses carried out using the adopted research procedure on the methodology of grounded theory. Respondents were not given any definitions or assumptions during the research. Throughout the study, the questions asked were broadened or shortened; the reason for this was the research direction and the adopted research strategy, which was not limited to respondents. It should be mentioned that in qualitative research, the basis of the analysis is induction, i.e. creating generalisations based on detailed information obtained from the collected data. These studies are only cognitive in nature and help to understand or explore a new trend.27
The results presented in the article are subject to certain limitations. In the article, not all the codes adopted in the study were written down due to their large number. The article narrows down the discussion to 15 statements by representatives of municipal cultural institutions subordinate to the City Office. Therefore, this study cannot be treated as representative. The article omits descriptions of existing relations/assumptions between separate categories, which would allow considering a more significant number of problematic threads or development of other hypotheses. The paper also does not quote managers' statements. The results of the analysis are presented in tables, due to the publication limitations of the article. The observed phenomena was organised this way in order to make the areas describing the CI manager's profile, and the factors motivating
24 In the whole research project, 50 representatives of cultural institutions in Lodz, subordinate to the City of Lodz Office, as well as to the Marshal of the Lodz Province, joined the research. The research was carried out by the cultural institutions that agreed to participate in the survey. 25 The main elements of grounded theory are theoretical sampling, coding, theoretical saturation and continuous comparison. Patrz: K. Konecki: Studia z metodologii badań jakościowych. Teoria ugruntowana, Warszawa, PWN,2000, s. 26. 26 Hypotheses, concepts and properties of ideas are built during empirical research; during that time, they are also modified and verified. Patrz: K. Konecki: Studia z metodologii …, PWN, s. 26. 27 J. Niedbalski: Komputerowe wspomaganie analizy danych jakościowych. Zastosowanie oprogramowania NVIVO i Atlas.TI w projektach badawczych opartych na metodologii teorii ugruntowanej, Wyd. UŁ, Łódź, 2014.

96
and demotivating them to get involved in building the brand of the city of Lodz in the area of cultural resources, more readable.
Profile of managers of cultural institutions in Lodz Table 1 contains features describing the profile of the CI manager that emerged in the course of research.28 Tabela 1. Profile of a cultural institution employee Codes based on the
in-depth theoretical
sampling of the analysed interview content (selective
approach)
Grouping of selective codes
Grouped subcategories constituting the values of the categories
Description of the main categories' values
Main categories
- involved person - observer - optimist - target-oriented person - communicative person
personality psychological maturity
- to the psyche, it is understood as a stage of shaping a person's personality, i.e. a set of psychological traits appropriate for a person, testifying to their individuality, which makes it possible to formulate opinions and make decisions. - it is a period in which the physical and psychic characteristics of a human being enable them to function in society, reproduction, - consists of physical, psychic and social maturity.
H
uman
mat
urity
- social/local patriotism (proud patriot) - organisational patriotism (proud manager)
societal views
social maturity
- age - human development period
physical maturity
- - chairperson, director, manager, supervisor, leader - former workplace
workplace - it is the job seniority, workplace, education, industry in which he worked, scope of duties and responsibility for them, skills acquired in the course of their performance.
Pr
ofes
sion
al e
xper
ienc
e
- - clerk - businessman - non-governmental worker
experience in the industry/sector
- - profession - speciality - scientific title (MA, PhD)
education
- - skills - - job seniority - - workplace Source: Author’s own study based on research.
Based on the results of the ordered ranking in Table 1, it can be observed that two main categories describe the profile of the CI manager who is partially responsible for
28 The described set of categories in Table 1 is the 5th version of the in-depth study. The categories are given a basis for building a theory within them. The selected categories may be further transformed in the course of research.

97
creating the city of Lodz brand in the area of cultural resources. These categories are called "human maturity" and "professional experience". The description of the main categories was possible due to the analysis and coding described in the methodology of this article. Under the category "human maturity" subcategories such as "psychological maturity" in the context of a manager's personality are described. In this subcategory, during theoretical sampling, such a manager emerged as one who is engaged, an observer, an optimist, a goal-oriented person, a communicative person.
The second subcategory of "human maturity" is "social maturity". Social maturity describes “social/local/organisational patriotism", i.e. love and attachment to one's own local fatherland, place of residence or birth, pride in one's own company. Such people who identify themselves with the place are more inclined to do something for the city. The last subcategory of ''human maturity'' is ''physical maturity'' - the period of human development – ''age''. It is a definition of the state of "physical maturity" (in biology it refers to the organism) and ''psychological maturity'' of a person (male or female) who is not a child. At the same time, it is the subcategory that had the least meaning in the conducted research. The persons studied were aged 30-50 years.
The second category is not surprising when it comes to the employee profile. The subcategories defined within it are the central areas that are usually described in each employee's CV (Curriculum Vitae). The subcategories distinguished here include job position (current and former), industry/sector experience, education, skills in a broad sense, job tenure, job place of employment. However, within them, the author of the article underlined the particular importance of the subcategory "experience in the industry/sector - official, entrepreneur, non-governmental worker". It might be an essential criterion that will have a huge impact on the perception of the world but will also influence the manager's performance in the environment in which he or she works. Within this category, it is also possible to find dependencies between the subcategories "workplace" and "skills".
On the other hand, the subcategory "industry/sector experience" may be significantly related to the subcategory "psychological maturity - personality" from the category "human maturity". One of the main categories which deserves attention is "human maturity", which seems to significantly dominate over "professional experience". The "personal" characteristics within this category may be more important and necessary at work than those resulting from work experience.
Factors motivating and demotivating the CI manager to engage in building the brand of the city of Lodz for cultural resources Table 2 is the result of interviews conducted among managers of cultural institutions in Lodz. Separate categories organize and describe the scope of content spoken in the process of research. Recording the research results in a table was aimed at easier readability of the observed phenomena. Based on the research, two main categories were distinguished, internal (Table 2) and external (Table 3) factors, whose more in-depth explanation and description is found in the tables.

98
Table 2. Internal factors (stimuli) from the group of motivators and demotivators influencing the involvement of cultural institution (CI) employees in building the city's brand for Lodz
Grouped subcategories
constituting the values of the main
category, i.e. internal factors
Codes based on the deepened theoretical sampling of analysed interview contents (selective approach)
Description of subcategory values Motivator present based on studies Demotivator present based on research
attitude/ mentality - the approach of CI employees to actions aimed at building a city's brand with their participation
- willingness to learn from others, getting to know partners' work techniques and willingness of CI employees to work "for ideas", create something unique and of good quality; - identification with one's own city facilitates work and tasks related to its brand (local patriotism); - appreciation of NGOs cooperation; - culturally aware managers ("working in CI is a state of mind"); appreciation of professional management; "elimination of people from the situation"; - a positive attitude of CI managers towards planned and measurable activities
- lack of ability to be inspired by documents developed to build a city's brand; disrespectful attitude towards documents, and their entries are treated as “unnecessary dizziness”; - employees of CI say that the assumptions about the development of the Lodz brand "are often omitted"; - the reluctance of CI employees for large events, although they understand their need to organise events for visitors to the city; - lack of thinking about the benefits of getting involved in building a city's brand on the part of CI employees; - lack of willingness in most CIs to take responsibility and take risks related to building a city brand, because "no one will give a reward for it"; - lack of professional managerial approach, conviction that in CI "everyone can manage"; - failure to see the effects of their own actions discourages managers
cooperation/ relationships
- creating ties and cooperation with others, need to work in a group to achieve common goals, willingness to perform tasks in a team and solve problems together - it is an emotional competence; it determines the quality of relations with other people
- possibility for CI to consult with the city government in order to get to know the parties' opinions; share own experience, knowledge; get to know partners and deepen ties between participants in meetings, etc.; - individual (personal) approach to CI employees raises the level of confidence, recognition and identification with the tasks performed; - mutual acceptance of the parties (CI employee, city authorities, external entities, e.g. NGOs and other companies) deepen the relations between them and allows to achieve strategic and operational goals (e.g. raising money for projects, renting of exhibits from other institutions, etc.); - high personal culture of employees and their level of education provides the basis for development at various levels of cooperation; - cooperation with external entities (e.g. NGOs) enables the creation of interesting project teams; - the task of the CI employees, openness and willingness to engage in dialogue is the basis for
- consultations, meetings with nothing to do "Pro-forma meetings"; - too rare cooperation of CI with city government, e.g. due to lack of money; there is a need for more frequent dialogue between cultural institutions; - lack of twinning programmes between other cities; - lack of sense of inspiration from the documents developed for city branding; - omitting some CI to participate in tasks for the city's brand, e.g. developing documents
99
cooperation sense of purpose/ achievement/ effect
- a feeling of the sense that the tasks performed mean something important is being done that gives a real impact for the good of the city's brand
- in cultural institutions are people with passion and visions of the development of the city of Lodz; - a formal written process of activities allows to implement tasks in life; they have a real impact; - the documents show the essence of the actions, but "they make sense when they transform into a strategy."
- lack of sense of efficiency, nonsense; - goals/tasks defined in an unclear way, cause doubts and reluctance; lack of "seeing" what is pursued in common cooperation; - the need to see one's own place in the process of brand building; - psychological pressure that there is not enough time for everything; - lack of effectiveness of meetings, feeling of wasting time; - the senselessness of frequent events that do not translate into cultural quality; - the need to define measures that allow checking the effects of work
appreciation/ confidence/ involvement
- attention and appreciation from the government for what they do for the city; recognition often results in greater involvement of employees in city branding
- appreciation/respect for their own work and work of other institutions for what they do; - engaging cultural institutions in the city's big projects allows them to get involved in building the city's brand; - respect for the separateness of institutions and specialisation allows for effective implementation of projects for the city's brand
- not all cultural institutions are recognised as opinion-making environments having an impact on building a city's brand strategy; - lack of boasting of niche institutions by the city government; - lack of "understanding and confidence by the city government that CI can do something", more independence is needed;
sense of development
- feeling the state of personal/ individual improvement of one's own skills over a specified time
- the possibility of exposing the creative activities of a given person or institution for the benefit of the city brand; - possibility of learning from others during project cooperation with different entities; - feeling the need for a planned and measurable action that can be verified over time
- lack of possibility of realization of fully imposed mission/aims/tasks by CI due to conditions, e.g. condition and surface of the building; too short execution time; or badly delegated task - not fully consistent with the character of a given CI; - lack of information in the CI, what is required of them in terms of branding;
independence / resourcefulness
- ability to cope with difficult conditions resulting from a lack of money, people, place, ideas, etc.
- ability to cope with difficult conditions resulting from insufficient space, building conditions, lack of money, lack of people to perform tasks; - ability to use the creativity of employees of CIs;
- employees' potential not fully exploited, - more projects are needed to harness the potential of CI employees to build their own brand and the city
communication/ feedback
- ability to exchange information, communicate between the CI and the municipality and other entities, mental way of information processing
- possibility of expressing one's own opinion during consultations - providing documents describing how to build a brand of cultural resources in accordance with the adopted strategy of the city
- lack of feedback on whether the municipality appreciates the submitted/implemented ideas by the CI; - due to its specificity/variety of CI, there are no clearly defined rules for the selection/integration of a given CI into actions for the city's brand; - way of entries in documents sometimes blocks actions, incomprehensibility, inadequacy
- ability to see many places that are not used for branding purposes and the ability to use them in an interesting way
- recognising different niche institutions/activities/places in the city within which the image of the city can be built; be able to use them creatively
- many unused areas of Lodz, especially smaller, niche areas; - the creativity of the team depends on the budget available; - existing mental limitations of people
Source: Author’s own study based on research.

100
Table 3. External factors (stimuli) from the group of motivators and demotivators influencing the involvement of cultural institutions (CI) employees in building the city's brand in Lodz Grouped subcategories constituting the values of the main category, i.e. external factors
Codes based on the deepened theoretical sampling of analysed interview contents (selective approach) Description of subcategory values
Motivator present based on studies
Demotivator present based on research
budget/financing of activities/ employee salaries
- financial resources available for the implementation of planned activities, promotion and other activities aimed at the development of institutions and the city's brand. The salaries of employees should also be taken into account
- cultural institutions can carry out tasks without a budget through private relations and friendship of CI employees; - there is support for co-financing from external entities: sponsors, guests, local governments, etc. - financial assistance resulting from partnership cooperation with various companies and institutions; - co-financing of cultural projects by the entities, to which the CI is subordinate (city authorities), although this is small money
- often underfunded projects which cannot be carried out at an adequate level of quality; there is not enough for everything; - lack of money for investment activities, promotion, etc. - subsidies received by self-government entities often suffice only for "partial maintenance of buildings and salaries of employees, which are not high"; - financial resources are not "allocated proportionally" to the tasks performed for the city's brand
Documents/strategies/plans - tools that make it possible to learn, understand and implement the recorded strategy; they determine the direction of CI activities
- understanding the importance of creating strategic documents and their sense of existence for the good of the city's brand; - documents are helpful when competing for equal competitions aimed at obtaining financial resources; they allow for verification of CI's activities; - documents allow the CI to act coherently to build the city's brand; - documents eliminate the randomness of actions; - large events permanently included in the calendar/city plans
- documents are often considered to be 'something that simply is'; 'many entries in documents are dead, underdeveloped, e.g. ways of financing were not reasonable'; - work in culture is "on the verge of absurdity", "a large creation of documents as if it were a military unit"; - documents and developed strategies are considered "uninspiring and unreal"; - based on documents the CI are not quite able to define their position as individuals in the process of building a city's brand, they want to know their place in building a city's brand; - the schedule of events includes those of low cultural value; "they are often not ambitious enough."
Working conditions - affect work satisfaction; a comfortable workplace, equipment is conducive to greater involvement; adverse conditions mean that people are reluctant to come to work
- possibility of making events in unusual places, "because it attracts attention", "Lodz has many such places, e.g. avant-garde buildings etc."
- lack of building conditions for the implementation of specific tasks resulting from the adopted CI strategy, but also a limited possibility to participate in activities for the city's brand; - not all CI buildings are in good condition, no money for investments
Work organisation
- should be adapted to the skills and conditions of the CI, so that it is interesting, allowing developing the CI and its employees.
- organising meetings with CI employees as a way to listen to the employees' opinions;- dealing with financial deficiencies using the skills of their own team of employees effectively,
- poorly prepared meeting formulas and inadequately adjusted meeting times ('late Friday evening') are not conducive to the effectiveness of meetings; - rejection of a large number of cultural projects and budget cuts in the projects adopted do not

101
e.g. they are often forced to "conduct promotional activities on their own"; - organising events in inspiring places, such as avant-garde ones, which attract the attention of the recipient and influence his opinion about Lodz, the place of the event and the CI; - allowing CI employees to create documents building the city's brand; - attempts to eliminate randomness in employing CI managers
allow the quality of implementation to be maintained; - a problem in event management, i.e. "overlapping of large events with smaller ones, which results in no attention being paid to smaller IK and niche events", which are great from the perspective of building the identity of the city; - lack of "professionalism in CI management", "randomness in employing managers" of CI; - "...dysfunctional promotion office, does not help much"; - erroneous delegation of tasks not following the CI profile; - last-minute tasks, "lack of time to complete them"; - a small number of CI employees needed to organise events; - need for CI knowledge and goals to be achieved in cooperation for building a city's brand; - lack of "discussion, disputes, which are more creative than documents"; - lack of assistance from the city government in finding sponsors for niche activities; - lack of partnership exchange programmes between cities
Communication tools - any use of communication tools (marketing-related, technological solutions, etc.) to communicate information, money, people, things, ideas, etc. Bearing in mind the consistency of action and building relationships.
- there are consultations/meetings between City Hall and cultural institutions - transfer of documents for building the city's brand on cultural resources and general principles of operation; - cooperation between CI based on human, non-formal friendship - collaboration on individual projects between the CI and the city government
- it is not known on what basis cultural institutions are selected as opinion-making entities at various events, creating documents, strategies or cooperation; - lack of formal programmes building relations between institutions involved in the process of building the city's brand
Source: Author’s own study based on research.
Based on the presented results in Table 2 and Table 3 it can be observed that it is the factors (incentives) from the group of motivators and internal demotivators that have a significant impact on the involvement of employees of cultural institutions in building the city' brand in Lodz. During the analysis there were often statements characterized by the attitude of employees towards actions for the city brand, they often referred to the need for cooperation and building inter-institutional relations. Employees of cultural institutions would also like to feel a sense of meaning from their tasks and would like to see the effects for which they should be appreciated. The government's appreciation of CI's work translates into greater involvement in the next project for the city's brand.
However, appreciation does not have to be of a financial nature, but for example it can be inviting to further projects or asking the CI to express an opinion on actions for

102
the city. It should be noted here that CI employees have a fairly high sense of duty and want to perform tasks that are a challenge for them, to feel that they are developing. CIs want to know that city authorities trust them so much that they can make their own decisions about building a city's brand. Cultural people have a high level of creativity, which is often useful in situations where they have to create something for which they have no financial or human resources.
From the group of motivators and external demotivators influencing the involvement of CI employees in building the city' brand in Lodz, documentation including the strategy and action plan is important. It should be designed in such a way that it is an effective tool for the CI to engage in activities for the benefit of the city. It should be understandable and show a clear direction of action. CI managers understand and need documents to act, but if there are too many, they are discouraged. Involvement in activities for the city's brand may also be discouraged by lack or insufficient financial resources for the organisation of events. Working conditions are also important, although, according to many respondents, they have improved in recent years, but some of the tasks commissioned de facto do not match the capacity of their cultural institutions. Tasks for the city are often badly delegated, and not in accordance with the activity profile of a given CI.
Summary Every functioning organization should bear in mind that people are its most valuable asset. However, it is often the case that strategies/tasks are more important than the people doing them. This problem was also noticed in interviews with cultural institutions (CI). On the basis of the conducted research, many factors can be observed that may indicate the abandonment of important internal and external motivators for the managers, where these motivators are aimed at involving CI employees - in this case - in the process of building the brand of the city of Lodz regarding cultural resources.This starts from the attitude/relationship of the CI towards the documents provided to them concerning the construction of the city's brand, and ends with the areas of common dialogue, cooperation, or measurement of the effects of the actions (Tables 2 and 3).
Based on the analysis of the statements of respondents, the CI manager profile was developed. It, however, requires verification and determination of the impact of this person and CI's co-workers on the process of engaging in city branding. According to the adopted method of analysis, i.e. grounded theory, it would be advisable to present preliminary assumptions which, based on research, may evolve or create new ones. One of the noticed assumptions was the aim of the article itself, which emerged in the previous research of the author for the profile of the manager.29 It should be mentioned that the presented descriptions do not constitute the final work on this topic. Interviews with CIs other than the respondents and the city government should also be included. The defined categories presented in this article allow to derive further assumptions for further research, but their description for volumetric reasons has been omitted.
29 The results of these studies, after positive reviews, are awaiting publication.

103
References Bellon M., Szefowa IBM uważa, że zatrudnianie ludzi na podstawie dyplomu, jest błędem, Business Sinder Polska, https://businessinsider.com.pl/rozwoj-osobisty/kariera/kariera-w-branzy-technologicznej-rady-szefowej-ibm/esre9wc (z dnia: 10.02.2019). Bright L., Public Employees With High Levels of Public Service Motivation: Who Are They, Where Are They, and What do They Want?, „Review of Public Personnel Administration”, Vol. 25. 2, 2005, pp. 138-154. Bright L., Why Age Matters in the Work Preferences of Public Employees: A Comparison of Three Age-Related Explanations, „Public Personnel Management”, Vol. 39, 1, 2010, pp. 1-14. Bright L., Where Does Public Service Motivation Count the Most in Government Work Environments? A Preliminary Empirical Investigation and Hypotheses, „Public Personnel Management”, Vol.42, 1, 2013, pp. 5-26. Ciekanowski Z.: Rola menedżera w organizacji, „Zeszyty Naukowe Uniwersytetu Przyrodniczo-Humanistycznego w Siedlcach. Administracja i Zarządzanie”, z. 34, nr 107, 2015, ss. 185-195. Ciesielska , Lider poszukiwany. Jak stworzyć model kompetencji pożądanego lidera zespołu, „Personel 7 ”, 2007. Drucker P.F.: Menedżer skuteczny, AE, Kraków 1994; C.S. Nosal: Psychologia myślenia i działania menedżera, AKADE, Kraków 2001; P. Wachowiak: Profesjonalny menedżer, Difin, Warszawa 2001. Foehl P.S., The Cultural Manager:Marginal Notes on a Discussion of Roles and Values, http://www.artsmanagement.net/3b9c996acd3299326518f8e1ff3ad82d,0fm.pdf (27.11.2019). Fohla P.S., Wolframb G., Peperc R., Cultural Managers as ‘Masters of Interspaces’ in Transformation Processes – a Network Theory Perspective, „Zeitschrift für Kulturmanagement”, 1/2016, S. 17-49 (https://www.netzwerk-kulturberatung.de/content/1-ueber/1-dr-patrick-s-foehl/1-publikationen/cultural-managers-as-masters-of-interspaces-in-transformation-processes-a-network-theory-perspective/b38_zkm2016.1-xx-fohl-et-al-id033.pdf (27.11.2019). Goldsmith M., Greenberg C., Robertson A., Hu-Chan M.: Globalni liderzy – kolejna generacja, Warszawa 2007, s. 65. Guryn H.: Czy warto mierzyć zaangażowanie pracowników, „Personel i Zarządzanie” 2009, nr 4. Indisowa L., Kołodziejczyk-Olczak I., Uwarunkowania skutecznego motywowania. Proces komunikacji, Łódź 2000, s. 47. Informacja o zawodzie − menedżer kultury, 2010, s. 4. Kania S.: Przewódca jako kreator zmian w organizacji, „Menagement Forum”, vol. 3, no. 2, 2015, ss. 38-43. Konecki K.: Studia z metodologii badań jakościowych. Teoria ugruntowana, Warszawa, PWN, 2000, s. 26. Korczyńska M.: Marka miasta, „Marketing i Rynek”, (12),2002, ss. 2–10. Kostera M., Kownacki S., Szumski A.: Zachowania organizacyjne: motywacja, przywództwo, kultura organizacyjna, [w:] A. Koźmiński, W. Piotrowski: Zarządzanie. Teoria i praktyka, Warszawa 2004, s. 315. Kotler Ph., Lee N.: Marketing w sektorze publicznym. Mapa drogowa wyższej efektowności, Wyd. Akademickie i Profesjonalne, Wyższa Szkoła Przedsiębiorczości i Zarządzania im. L. Koźmińskiego, Warszawa 2008. Krawiec W.: Kreatywność jako determinanta tworzenia wartości i pogłębiania doświadczeń jej odbiorców, Prace naukowe Uniwersytetu Ekonomicznego we Wrocławiu, nr 529, 2018, ss. 129-139. Kuc B., Moczydłowska J.: Zachowania organizacyjne, Warszawa 2009, s. 77. Lindzey G., Aronson E.: Handbook of Social Psychology, New York, Random House, 1985.

104
Machara L., Jain P., Factors affecting staff motivation in public libraries: a case of selected public libraries in Botswana, „Mousaion: South African Journal of Information Studies”, Vol. 34, 1, 2016, pp. 101 – 122. Markowski T.: Marketing terytorialny, „Studia KPZK PAN”, t. CXII, 2002. Matejun M., Dębska S., Non-Economic Incentives to Motivate Employees – Lodz Branch of Norauto Polska Ltd. Example, [in:] D. Lewicka (red.), Organisation Management. Competitiveness, Social Responsibility, Human Capital, AGH University of Science and Technology Press, Krakow 2010, pp. 91-112. Meyer J.P., Allen N.J., A Tree-Component Conceptualization on Organizational Commitment, „Human Resource Management Review” 1991, No. 1, ss. 61–89. Niedbalski J.: Komputerowe wspomaganie analizy danych jakościowych. Zastosowanie oprogramowania NVIVO i Atlas.TI w projektach badawczych opartych na metodologii teorii ugruntowanej, Wyd. UŁ, Łódź 2014. Park S., Motivation of Public Managers as Raters in Performance Appraisal: Developing a Model of Rater Motivation, „Public Personnel Management”, Vol. 43, 4, 2014; pp. 387-414. Penc J.:, Nowe zarządzanie w nowej gospodarce, Wydawca SLG International Training Center, Warszawa 2010. Penc J.: Motywowanie w zarządzaniu, Kraków 1996, s. 203. Polityka Rozwoju Kultury 2020+ dla Miasta Łodzi. Raport: Motywacje menadżerów 2016, ARC Rynek i opinie, Warszawa 2016. Raport GUS: Działalność innowacyjna przedsiębiorstw w Polsce w latach 2013-2015, s. 41-63. Seweryn R.: Kryzys gospodarczy a ewolucja marki Kraków w opinii hiszpańskich turystów, „Współczesne Zarządzanie” (1), 2013, ss. 51–61. Simerson K. B., Venn M. L.:, Menedżer jako lider, Oficyna Wolters Kluwer Business, Warszawa. Strategii Zarządzania Marka Łódź na lata 2010-2016, s. 17-30. Tomaszuk A.: Sylwetka menedżera w świetle teorii zarządzania i badań własnych na przykładzie menedżerów sektora budownictwa województwa podlaskiego, „Economics and Management”, nr 4, 2013, ss. 67-81.7]\ Wadden J. D.: Marketing creativity: the influence of personal and proximal work factors on creative activity, „ Marketing Management Journal”, vol. 21 (2), 2011, s. 73. Woodman R. W., Sawyer J. E., Griffin R.: Toward a Theory of Organizational Creativity, „ Academy of Management Reciew” vol. 18 (2), 1993. Wierżyński W.: Menedżerowie nowej ery, http://www.pi.gov.pl/PARP/chapter_86196.asp?soid=4A743DA96D4F422C94CAB3F7CACF3036, dostęp: 15.11.2018. Williams M.: Mistrzowskie przywództwo, Oficyna Wolters Kluwer Business, Kraków 2009. Wright B. E, Kim S., Participation's Influence on Job Satisfaction: The Importance of Job Characteristics, „Review of Public Personnel Administration”, 24, 1, 2004, pp. 18–40. Wójtowicz M., Tajemnice motywacji – trzy spojrzenia na problem motywacji pracowników, Good Point, https://goodpoint.blog/tajemnice-motywacji-trzy-spojrzenia-na-problem-motywacji-pracownikow/ (z dnia: 24.04. 2017). Czynniki motywujące i demotywujące menedżerów instytucji kultury
w obszarze budowania marki miasta Łodzi – wyniki badań
Streszczenie Celem artykułu jest zidentyfikowanie obszarów/ czynników, które mogą motywować lub też zniechęcać menedżerów instytucji kultury do aktywnego zaangażowania się w proces budowania marki Łodzi o zasoby kultury.

105
W artykule opisano profil menedżera instytucji kultury oraz zaprezentowano uporządkowaną lisy czynników (bodźców), które mają pozytywny bądź negatywny wpływ na działania menedżerów instytucji kultury w obszarze kreowania marki miasta.
Podstawę empiryczną artykułu stanowią wywiady przeprowadzone z menedżerami i pracownikami ds. promocji w miejskich instytucjach kultury w Łodzi. Analiza danych została przeprowadzona zgodnie z zasadami metodologii teorii ugruntowanej. Badania te są prowadzone od grudnia 2017 r. w obrębie Katedry Marketingu oraz Katedry Zarządzania Miastem i Regionem Wydziału Zarządzania Uniwersytetu Łódzkiego w ramach projektu: „Współpraca administracji publicznej z instytucjami kultury w kontekście budowania marki miasta”. Słowa kluczowe: marka miasta, menedżer, teoria ugruntowana, instytucje kultury, motywatory, demotywatory JEL Codes: M14, M31 Information about authors:
Dr Wioletta Krawiec Faculty of Management University of Łódz ul. Matejki 22/26 90-237 Łódź e-mail: [email protected] ORCID: 0000-0001-5619-9467

106
22 (71) 2019 DOI 10.22630/PEFIM.2019.22.71.29
Barbara Kucharska Mirosława Malinowska University of Economics in Katowice
TRENDS IN Y GENERATION’S BEHAVIOUR ON THE FOOD MARKET
The aim of the article is to identify Y generation’s behaviour on the food market in the
context of dominant consumer trends. The purpose of the article was accomplished by literature studies, information from branch magazines and direct research carried out by the authors of the article. Identification of consumer trends was made on the basis of secondary sources of information, using also the report Top 10 Global Consumer Trends 2019 by Euromonitor International. The report also became an inspiration to undertake direct research, which was carried out using the auditorium survey technique among representatives of the Y generation. The results of research and analysis indicate that the Y generation referred to as "yummy" is an extremely important entity on the food market - large, young, innovative , active, fast, demanding, unique and very important for the supply entities on the food market. The behaviour of this group of consumers determines contemporary trends on the market and the necessity to undertake activities consistent with these trends in terms of the offer, its availability, as well as diversity and price.
Key words : generation Y, consumer behaviour, food market, trends JEL Code: D11 D12 J11
Introduction Generation Y is the generation of young people forming a market segment that is extremely important for food supply entities, especially food producers and retailers, as well as providers of catering services. In the literature different dates are taken into consideration while describing Y generation and it concerns both initial and final dates of time interval (from 1977 to 2000)1. The size of the segment and its specific character means that generation Y has, and is going to have in the future, a significant impact on how the market functions. These are the reasons for implementation of research supporting recognition of not only behaviours of generation Y consumers on the food market, but also trends prevailing within these behaviours.
According to the report Top 10 Global Consumer Trends 2019, the most important consumer trends in 2019 still include those that derive from post-modernist determinants of consumption and development of information technologies. Post-modernist consumers are those for whom freedom is the most important catchword, while multi-
1 M. Bartlett, Analyst: understanding what shapes generation can help the... . Credit Union Journal, No. 8(21)/2004; P. Dalton, Managing the generation. ABA Washington News, No. 11(19)/2003; R. K. Miller, K. Washington, Consumer Behavior 2011: Millennial Consumers, Richard K. Miller and Associates (RKMA), Loganville 2011; M. Rich, Millennial students and technology choices for information searching. The Electronic Journal of Business Research Methods, No. 6(1)/2008.
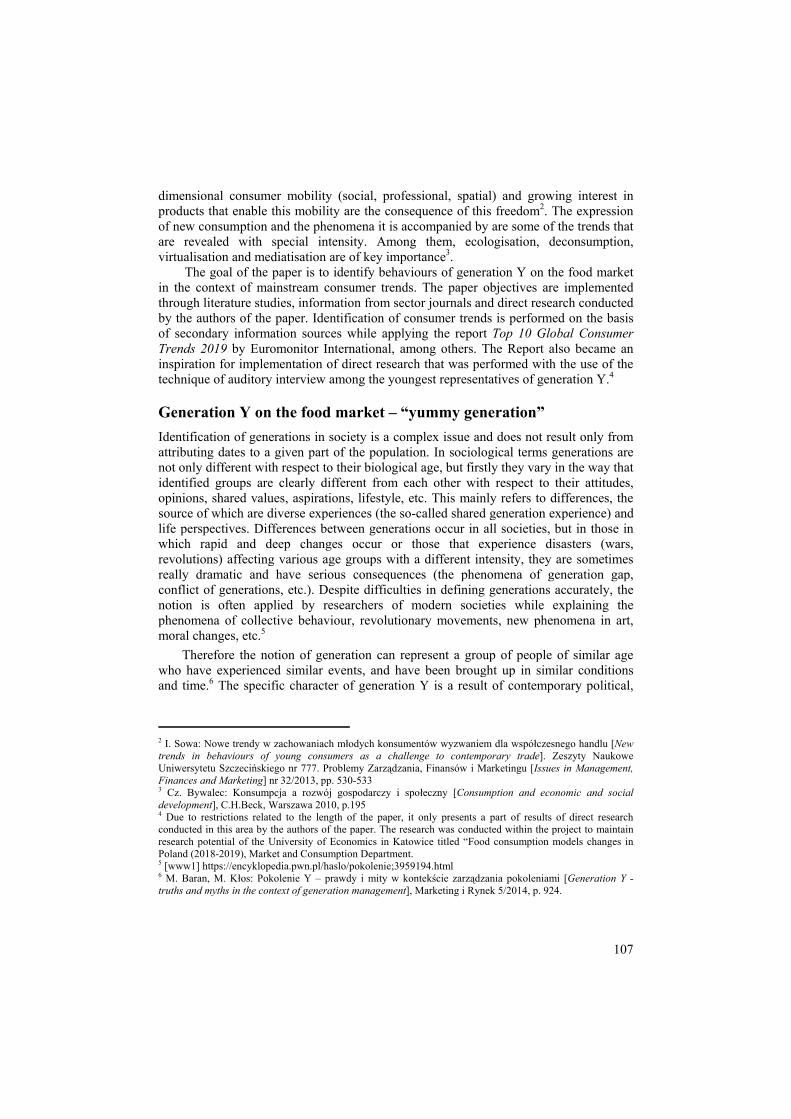
107
dimensional consumer mobility (social, professional, spatial) and growing interest in products that enable this mobility are the consequence of this freedom2. The expression of new consumption and the phenomena it is accompanied by are some of the trends that are revealed with special intensity. Among them, ecologisation, deconsumption, virtualisation and mediatisation are of key importance3.
The goal of the paper is to identify behaviours of generation Y on the food market in the context of mainstream consumer trends. The paper objectives are implemented through literature studies, information from sector journals and direct research conducted by the authors of the paper. Identification of consumer trends is performed on the basis of secondary information sources while applying the report Top 10 Global Consumer Trends 2019 by Euromonitor International, among others. The Report also became an inspiration for implementation of direct research that was performed with the use of the technique of auditory interview among the youngest representatives of generation Y.4
Generation Y on the food market – “yummy generation” Identification of generations in society is a complex issue and does not result only from attributing dates to a given part of the population. In sociological terms generations are not only different with respect to their biological age, but firstly they vary in the way that identified groups are clearly different from each other with respect to their attitudes, opinions, shared values, aspirations, lifestyle, etc. This mainly refers to differences, the source of which are diverse experiences (the so-called shared generation experience) and life perspectives. Differences between generations occur in all societies, but in those in which rapid and deep changes occur or those that experience disasters (wars, revolutions) affecting various age groups with a different intensity, they are sometimes really dramatic and have serious consequences (the phenomena of generation gap, conflict of generations, etc.). Despite difficulties in defining generations accurately, the notion is often applied by researchers of modern societies while explaining the phenomena of collective behaviour, revolutionary movements, new phenomena in art, moral changes, etc.5
Therefore the notion of generation can represent a group of people of similar age who have experienced similar events, and have been brought up in similar conditions and time.6 The specific character of generation Y is a result of contemporary political,
2 I. Sowa: Nowe trendy w zachowaniach młodych konsumentów wyzwaniem dla współczesnego handlu [New trends in behaviours of young consumers as a challenge to contemporary trade]. Zeszyty Naukowe Uniwersytetu Szczecińskiego nr 777. Problemy Zarządzania, Finansów i Marketingu [Issues in Management, Finances and Marketing] nr 32/2013, pp. 530-533 3 Cz. Bywalec: Konsumpcja a rozwój gospodarczy i społeczny [Consumption and economic and social development], C.H.Beck, Warszawa 2010, p.195 4 Due to restrictions related to the length of the paper, it only presents a part of results of direct research conducted in this area by the authors of the paper. The research was conducted within the project to maintain research potential of the University of Economics in Katowice titled “Food consumption models changes in Poland (2018-2019), Market and Consumption Department. 5 [www1] https://encyklopedia.pwn.pl/haslo/pokolenie;3959194.html 6 M. Baran, M. Kłos: Pokolenie Y – prawdy i mity w kontekście zarządzania pokoleniami [Generation Y - truths and myths in the context of generation management], Marketing i Rynek 5/2014, p. 924.

108
cultural, economic and firstly technological processes.7 Therefore the generation can be described from demographic, historical, technological and socio-cultural perspective. Assuming that generation Y in Poland represents people born in the 1980s and 1990s8, it can be stated that this group constitutes around a quarter of the country’s population. Furthermore, they are grown up, yet young people (the youngest representative is 19 now, and the oldest 39 years old) and they are well educated. The size of this segment and its specific character in terms of demography means that the people from this generation have and are going to have significant impact on the functioning of the whole society now and in the future.
Millennials have a different attitude to migration, change of the place of living and work that is a natural element of life.
Technological perspective seems to be vital for the analysis of generation Y. For the members of this generation, IT technologies are something natural and indispensable, a necessary connection with the surrounding world for the purpose of real and / or virtual participation in it. For this generation proficiency in the use of modern IT devices is nothing extraordinary. Thanks to IT they have access to various resources at the same time, and they can perform a lot of tasks at the same time. Therefore they are called multi-taskers. Thanks to the Internet, they have access to broad knowledge resources, everywhere and at any moment (similarly to other generations). However, they often succumb to the illusion that they have access to the whole of knowledge and competences – they are the generation that does not need mentors or intermediaries in the access to knowledge or culture. For representatives of generation Y, the Internet is not only a source of information but also a space to exchange experiences and information.
Looking at this generation from a socio-cultural perspective, it can be noticed that people representing it delay the “moment of leaving the family” and establishing their own household. They consider themselves tolerant, they show interest and concern about other people, they are willing to think positively, and they manifest significant flexibility. They consider themselves glad and happy. A broad circle of friends, health, fame and material success are priorities for them. They do well in stressful situations. They are also often described as impatient and demanding people oriented on achievement of quick results.9 They are mobile not only in virtual terms as they travel a lot.
There is no compliance regarding precise establishment of dates for generation Y in the literature, because of differences occurring between various countries in the sphere of ICT implementation, political changes, etc. There are no explicit guidelines concerning determination of specific dates for the same society segment, but there is an
7 P. Kisiel:, Millenialsi – nowy uczestnik życia społecznego [Millennials – a new participant of social life], Studia Socialia Cracoviensia 8 (2016) nr 1., p.93. 8 In the literature, various time frames are adopted for this generation, however it is often assumed that generation Y (often called the generation of millennials) is represented by people born between 1980 and 1999. 9 P. Kisiel: Millenialsi – nowy uczestnik życia społecznego… [Millennials – a new participant in social life], op. cit., pp 85-91.
109
agreement between researchers concerning features describing this generation10. Millennials (as they are often described) are active, well-educated people, willing to continue their development. They use new technologies in every area of life, and thanks to the access to the Internet, they are “World citizens” – they have friends all over the world. They are self-confident and at the same time tolerant and open. They attach great importance to the quality of life or experience, but not to possessing. They are convinced about their exceptionality and they have high self-esteem which makes them a little resistant to criticism. They also have high ecological awareness. Generation Y consumers are characterised by smartness and being very-well informed about market offers thanks to the use of new technologies that support gathering information11. Millennials know the trends reigning on the market and willingly perform transactions with the use of the Internet. They also search for bargains and use personalised products. Quality is not always the most important for them. What counts is firstly their own, original style that should be provided by brands. They like novelties and value companies that often launch novelties on the market.12
From the point of view of their behaviour on the food market, Generation Y can be called a “yummy generation”, “foodies” and “yummymers”, as they are fascinated with food.13 Sometimes the members of this generation are called the generation of food maniacs. Shopping for food is a way of spending free time, preparing meals is a hobby and eating them is a real pleasure. For them, not only the taste of food is important but also its look. They are pioneers in using unconventional ingredients and spices, as well as services of unconventional catering services (sushi, fit style cuisine, etc.). They also take pictures of meals that are self-made or ordered in restaurants and share them on social networking sites.
Analysing behaviours of this generation on food market it should be emphasised that “yummymy” consumers are interested in regional products and they pay attention to what they eat14. Product authenticity, traditional methods of production and its local character are extremely important for them. It is also important for them where the products come from and the fact that they are Polish. They draw inspiration from foreign cuisines, they read, observe and introduce new meals in their menu. They are pioneers of diverse grocery novelties. Healthy food fashion is observed among this group of consumers – they are in favour of “slow food” which does not mean that they do not eat “fast food”. They eagerly visit “fast casual” restaurants that offer higher product quality and better décor than traditional “fast food” restaurants, but at the same time the service is fast. They also spend more on food in comparison with the previous generations – they choose food products of high quality that are definitely more expensive, and they often eat out while appreciating culinary experiments at home at the same time. They are interested in products that are truly “bio”, “eco” and not just labelled in this way. They
10 E. Gołąb-Andrzejak: Konsumenci pokolenia Y – nowe wyzwanie dla komunikacji marketingowej [Generation Y consumers – a new challenge for marketing communication], Handel Wewnętrzny 2016/2, p. 141. 11 E. Gołąb-Andrzejak: Konsumenci pokolenia … [Generation consumers…] of op.cit., p. 143. 12[www2] 13 On the subject of generation Y [www3] [www4] [www5] [www6][www7][www8] 14 [www3] [www4] [www5] [www6][www7][www8]
110
are more aware consumers who rarely get attached to a specific store or restaurant. “Yummymy” consumers read the labels as well as ingredients of meals, and increasingly more often they look for products with no artificial additives that are sold in ecological packaging.
Generation Y look for products of rather high quality with respect to their nutritional values and taste qualities. They also concentrate on maximisation of the price to quality ratio. “Yummy” consumers are engaged, i.e. they want to help companies in the process of preparation and development of products or offer and have impact on its shape. Contrary to what can be expected, millennials most willingly buy food in brick-and-mortar stores. Online shopping in this category is growing but it mainly concerns products with long “use by” dates, simple products that are inconvenient to transport as well as exotic or exclusive products that are not available in brick-and-mortar stores. Comfort and product availability are most important determinants of the choice of the store, whereas the product price is less important. Therefore, “yummymy” generation often do shopping in “convenience” type stores, and they do smaller shopping but more frequently than other generations. “Yummymy” generation is also more likely to buy food in local stores – there they can find unique products, products of local manufacturers and a broad range of local, unique and “non-mass” food brands that millennials could be interested in.
Generation Y also often is referred to as the “digital generation”, digital natives, appreciate all technological facilities that enable product purchase (applications, price comparison engines, simulations, culinary and food advice, inspirations) and the possibility to share an opinion on social networking sites and websites with stores and restaurants. They are aware of the power of their opinions and their impact on others; therefore they expect virtualisation from producers, stores, restaurants and offers that would enable them to benefit from the possibility of integration between the real and virtual world.
Trends in consumer behaviour in the context of the food market Changes in consumer behaviours are a result of transformations occurring in the group of factors determining these behaviours, i.e. factors related to consumers, the household they are a part of, as well as the environment in which they function. The trends that create new market conditions and affect decision-making in the sphere of food consumption, and consequently also concerning its purchase, processing and storing, as well as using catering services are especially important for generation Y consumers.
According to the Top 10 Global Consumer Trends 2019 report, the most important trends in consumer behaviours in 2019 still include those that derive from post-modernist determinants of consumption and development of information technologies. Post-modernist consumers are those for whom freedom is the most important keyword and value and multidimensional consumer mobility (social, professional and spatial) as well as growing interest in products that enable this mobility are the consequence of this

111
freedom15. The expression of new consumption and the phenomena it is accompanied by are some of the trends that are developing very extensively. Among them, ecologisation, individualisation, deconsumption, virtualisation or mediatisation have key significance16.
The majority of presented trends in consumer behaviours (Table 1) is most often a continuation of the phenomena previously recognised and described in the literature on the subject, however, the phenomena undergo some modifications, or they adopt new forms. The trends that in a great extent show consumers’ care about their well-being, quality of life and the possibility to ensure self-control are especially vital.
Table 1. Most important trends in consumer behaviours, essential from the perspective of the food market Specification Behaviours of food consumers
Everyone’s an expert
Considerable consumer demand of digital consumers on knowledge absorption and sharing is at the basis of this trend. Fast and unlimited access to information encourages the consumers to conduct their own research enabling the choice of the offer that is best for them – the highest quality for the lowest price. Consumers explore, discover and use great amounts of information, and other consumers are often one of their most important sources. Their experiences, reviews and advice become invaluable. The trends are favoured by social media that constitute the platform of information exchange and that has brought new meaning to the notion of information spread by word of mouth. The possibility to express opinions about an offer provided to users by enterprises but also to establish contacts with professionals in a given area are becoming the basis for building confidence and loyalty. The number of opinions and difficulty in recognising their authenticity is a problem for consumers. The possibility to disseminate information means that consumers can be the best product/producer/retailer promoter or its worst PR person. The trend especially concerns products/services related to consumers’ hobbies, including cooking or using catering services among others.
I can look after myself
The trend is an expression of consumer endeavours to ensure and / or regain the sense of full control over their own life both in physical and emotional dimensions. Consumers equipped with appropriate tools (including applications) while having access to information sources, can find / develop solutions to their problems themselves. They are self-sufficient in this sphere. They are able to take care of themselves. For the consumers, health, happiness and simplicity are the priority they can pay more to have. The trend is a response to the excess of often contradictory information and an expression of growing awareness, striving to manipulate it in social media. Personal, individual consumers’ needs are important. Personalisation has great importance17.
Economics of haste – instead of “I want it”. “I want it now”;
Consumers’ expectations concern the immediate possibility of access to the very offer as well as information about the offer. The syndrome of immediate gratification, speed of consumers’ life and the lifestyle – assessed by them in terms of efficiency and effectiveness contribute to the growth of these expectations. Consumers expect from enterprises, the solutions enabling to save time and spend it on professional and / or social
15 I. Sowa: Nowe trendy w zachowaniach młodych konsumentów wyzwaniem dla współczesnego handlu [New trends in behaviours of young consumers as a challenge to contemporary trade]. Zeszyty Naukowe Uniwersytetu Szczecińskiego nr 777. Problemy Zarządzania, Finansów i Marketingu nr 32/2013, pp. 530-533 16 Cz. Bywalec: Konsumpcja a rozwój gospodarczy i społeczny [Consumption and economic as well social development], C.H.Beck, Warszawa 2010,p.195 17 For example My spoon Guru UK app allows to create a personalised profile with respect to dietary preferences through over 180 various tags. Tellspec Canada – a manual scanner that offers food testing in real time, food safety and food authenticity.

112
efficiency-drive lifestyle
life. Consumers expect mobile applications that help to organise their life better through making queues shorter, synchronisation of preferences and personal data management among others.
Back to basics for status
Consumers expect simple and transparent solutions and elimination of all these elements or solutions that have negative impact on their health and life. They aim to regain control over what they eat, drink or put on their skin. They want only necessary product ingredients adjusted to their needs to be used. They appreciate the possibility to interfere with the composition of the products such as food or cosmetics. The rule that “the less, the better, the more transparent” is prevailing. This trend also refers to the packaging. Product composition should be clearly exposed on the front of the packaging (some cosmetic companies limit the number of used ingredients to 5), and the very packaging should be ecological, reusable or suitable for recycling. It is strongly associated with the previous “health” or “wellness” trend expressed in buying safe food and ecological food, paying attention to product composition, quality/freshness of products, drinking a lot of liquids, using professional dietary advice or controlling the diet of household members.
I want a plastic-free world
Consumers expect eliminating or at least reducing the use of plastics. They are willing to pay more for ecological products and those that can be recycled. Plastic became a preferred packaging material due to many reasons, including versality of use, durability and the possibility to secure food against being wasted. The level of its recovery, recycling and reuse is insufficient. There is not enough consumer knowledge about what can be recycled.
Conscious consumers
Consumers search for the ways to make reasonable decisions concerning what they buy and look for solutions for the negative impact that consumerism has on the world. This attitude, full of respect and sympathy, comprises care about other people, animals and the environment. The trend is represented by people caring about health, interested in well-being of animals, as well as people who notice the negative impact of enterprises on the natural environment. Aware consumers do not need to manifest radical attitudes, but they can behave in a flexible way, e.g. they eliminate products of animal origin from their diet in a specific time. Consumers choose not only a healthy but also ethical lifestyle (e.g. protest against testing products on animals, selected methods of animal farming, growth of demand on ingredients of plant origin, veganism, vegetarianism). Information about non-applying practices harming the environment and well-being of animals is important.
Finding my JOMO18 (joy of missing out)
Consumers aim to determine the boundaries of their privacy. They reduce the time spent on the Internet and limit or eliminate posting information about their private life and special events they participate in. They highly appreciate offline contacts – visit to a brick and mortar store, place of rest and recreation with no access to Wi-Fi network and establishment of privacy at non-professional time and space. Planned switching off from virtual space provides consumers with time and reflection regarding what they want and like doing. Consumers do not aim at total isolation from the rest of the world but try to limit compulsory interactions. Consumers’ fear of blurring of boundaries between private and social life, effectiveness of personal data, interference with consumer behaviours, pressure of social networking portals (the necessity to do exciting things and sharing information about these events with others to be accepted) are the causes of the trend. Access to the Internet and social networking sites transformed using social networking sites into a form of obligation. Life has become an obligation to fulfil expectations of others for 24 hours / 7 days a week. So far, the trend is referred to as “slowing down to the speed of life”, “escape from new technologies” comprised in deconsumption – conscious limiting of consumption to rational size, compliant with natural, individual, physical and psychical features of consumers, unwillingness towards mass consumption and smart shopping – rational planning of household budget through buying necessary
18 The sense of satisfaction related to the escape from the mass of information, restricted application of mobile devices and social media. It is the opposite to FOMO (fear of missing out), i.e. the fear of being neglected (lack of information, experience or chances for interaction).
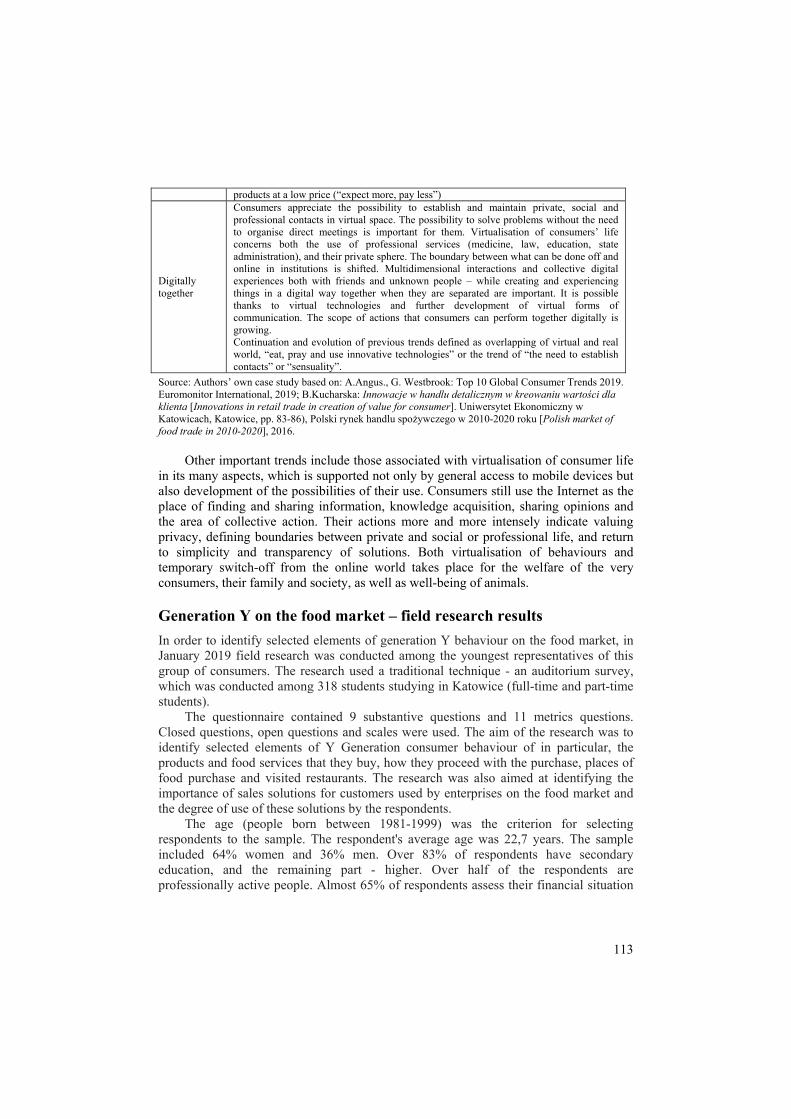
113
products at a low price (“expect more, pay less”)
Digitally together
Consumers appreciate the possibility to establish and maintain private, social and professional contacts in virtual space. The possibility to solve problems without the need to organise direct meetings is important for them. Virtualisation of consumers’ life concerns both the use of professional services (medicine, law, education, state administration), and their private sphere. The boundary between what can be done off and online in institutions is shifted. Multidimensional interactions and collective digital experiences both with friends and unknown people – while creating and experiencing things in a digital way together when they are separated are important. It is possible thanks to virtual technologies and further development of virtual forms of communication. The scope of actions that consumers can perform together digitally is growing. Continuation and evolution of previous trends defined as overlapping of virtual and real world, “eat, pray and use innovative technologies” or the trend of “the need to establish contacts” or “sensuality”.
Source: Authors’ own case study based on: A.Angus., G. Westbrook: Top 10 Global Consumer Trends 2019. Euromonitor International, 2019; B.Kucharska: Innowacje w handlu detalicznym w kreowaniu wartości dla klienta [Innovations in retail trade in creation of value for consumer]. Uniwersytet Ekonomiczny w Katowicach, Katowice, pp. 83-86), Polski rynek handlu spożywczego w 2010-2020 roku [Polish market of food trade in 2010-2020], 2016.
Other important trends include those associated with virtualisation of consumer life
in its many aspects, which is supported not only by general access to mobile devices but also development of the possibilities of their use. Consumers still use the Internet as the place of finding and sharing information, knowledge acquisition, sharing opinions and the area of collective action. Their actions more and more intensely indicate valuing privacy, defining boundaries between private and social or professional life, and return to simplicity and transparency of solutions. Both virtualisation of behaviours and temporary switch-off from the online world takes place for the welfare of the very consumers, their family and society, as well as well-being of animals.
Generation Y on the food market – field research results In order to identify selected elements of generation Y behaviour on the food market, in January 2019 field research was conducted among the youngest representatives of this group of consumers. The research used a traditional technique - an auditorium survey, which was conducted among 318 students studying in Katowice (full-time and part-time students).
The questionnaire contained 9 substantive questions and 11 metrics questions. Closed questions, open questions and scales were used. The aim of the research was to identify selected elements of Y Generation consumer behaviour of in particular, the products and food services that they buy, how they proceed with the purchase, places of food purchase and visited restaurants. The research was also aimed at identifying the importance of sales solutions for customers used by enterprises on the food market and the degree of use of these solutions by the respondents.
The age (people born between 1981-1999) was the criterion for selecting respondents to the sample. The respondent's average age was 22,7 years. The sample included 64% women and 36% men. Over 83% of respondents have secondary education, and the remaining part - higher. Over half of the respondents are professionally active people. Almost 65% of respondents assess their financial situation

114
as good, and 17% - as very good. Around 18% consider it to be sufficient. Over 40% of respondents live in a large city (over 100,000 inhabitants), 27% are rural residents, Average number of people in households surveyed is 3,3. Respondents assess their participation in the purchase decisions of food in their households at the level of 50,4%.
The list of declared (mentioned) food products purchased by the respondents consisted of 44 items, which were then assigned by the researchers to product groups (Table 2). Most often it was dairy (64%), vegetables (55%), bread (53%) and fruit (48%).
Table 2. Food products most often bought by respondents (in %)
Specification Total sample Dairy products, including cheese (12.1%), milk (9.7%) 64,0 Vegetables 55,4 Bread 53,4 Fruits 48,2 Meat 40,0 Non-alcoholic drinks, including water (9.7%) 18,6 Sausages 15,0 Sweets, including cakes, ice cream (5.6%) 14,7 Powdery products 12,9 Pasta 11,3 Ready-to-eat products, fast food products , pizza , vegetable creams , fries, sandwiches 10,1 Gluten-free, sugar-free, unprocessed, vegan, eco products 4,9 Fish 3,6 Other: sauces, spices, ketchup, appetizers, chips, alcoholic drinks, beer, nuts, energy drinks, semi-finished products, various cuisines of the world, coffee, tea
9,2
Source: Authors’ own elaboration based on field research. The respondents were also asked to specify the ways in which they purchase food
(including purchases at stores and online shopping using various facilities (mobile applications or websites). Research results indicate that respondents buy food mainly in stationary stores (98%). They mentioned from the name or described a total of 44 different places for buying food. Biedronka (68%) and Lidl (62%) are the stores most frequently indicated by the respondents. Every fourth respondent purchases in Tesco (24%) and Auchan (23%), and slightly less - in Kaufland (17%). Among the spontaneous names of stores where respondents buy food, there are also smaller outlets - 13% buy in Żabka, which is a convenience store, about 8% make purchases in Lewiatan, Carrefour and Aldi stores.
Respondents declare purchasing food mostly in conventional retail formats (discount shops, supermarkets, hypermarkets). These outlets offer wide and differentiated range of food products, thus every group of buyers can find the assortment adapted to its expectations.19 Additionally, food buyers, when purchasing food products, often tend to choose the shop most relevant to the location. Almost 7% of respondents did not mention the name of the store, specifying it in the categories "small" or “local ". Only about 12% of respondents buy food using websites of stationary stores, slightly less
19 B. Kucharska, Food in retailers' commercial offer - possibilities of building relationships with consumers, Olsztyn Economic Journal, nr 14/2019, s. 313-324.

115
(9%) buy in online stores. In order to purchase food, the respondents also use the applications offered by stationary stores (about 8%), and online stores (4%). Table 3. Catering services - the most frequently used by respondents (in%)
Specification Total sample Dishes
Pizza 36,3 fast-food, burger, hamburger, hot-dog, French fries, casseroles 27,6 Lunch 25,0 Kebab 9,8 Chinese cuisine, Thai cuisine, world cuisines, sushi, seafood 7,5 coffee, tea 7,2 pancakes, dumplings, spaghetti, pasta, tortilla 6,4 cakes, desserts, ice cream 5,9 healthy food, box diet, salads 4,6 other: dinners, breakfasts, bagels, sandwiches, beer, dishes by weight, cocktails 2,6
Places / ways of using catering services food with delivery 15,3 restaurants 13,9 coffeehouses 5,6 other: bars, pubs, catering 4,9 Source: Authors’ own elaboration based on field research.
Declarations of respondents regarding the use of catering services should be
attributed to both the offer and the places / ways of consumption. The respondents mentioned a total of 44 catering services. The most often mentioned were pizza (36%), fast-food dishes (28%) and dinner dishes (25%), (table 3).
Respondents also had the opportunity to indicate their typical behaviour regarding catering services and to indicate the types of visited places. Most of the respondents buy services at catering places (82,%), but over half of orders cover home delivery - 56% use the website for this purpose, and 27% use the mobile application. Almost 10% of respondents order dishes by phone with home delivery. In addition, some consumers use interactive kiosks (7%), the Internet (3%) and mobile applications to order meals consumed in the catering place. Most respondents use the services of restaurants (71%), cafes (60%) pizzerias (57%) and fast food bars (57%). The respondents are also customers of ice cream parlours (13%), milk bars (6%) and food trucks (6%). The largest number of respondents (36%) stated that they eat at McDonald's, a little more than 19% - at Pizza Hut, and 16% - at KFC. The respondents also visit such institutions as Aioli (7.4%), Pizza Dominium (5%) and Dagrasso (4%). They are also customers of cafes such as Starbucks and Costa Cafe. At the same time the catering places mentioned by the respondents include a lot of local places offering various meals from many regions of the world, different types of meals (vegan, vegetarian,) with different levels of customer service. Respondents asked about the most visited catering places mentioned 283 different names.

116
Table 4. Elements of the offer of food products and catering services in the respondents’ behaviour
Specification Elements of food products offer/gastronomy offer Importance- average*
Use - average**
Everyone is an expert I can look after myself Back to basics for status
Informing about the composition of the product / meal 5,84 5,28 Informing about the sugar content 5,33 4,55 Informing about the preservatives content 5,20 4,52 Informing about the fat content 5,03 4,43 Informing about the calorie content 4,93 4,66 Informing about the vitamins content 4,80 3,29 Informing about the presence of allergens 4,76 3,07 Informing about the presence of carbohydrates 4,68 3,48 Informing about the salt presence 4,57 3,86 Informing about the lactose presence 4,47 3,96 Informing about the gluten presence 4,25 3,61
Conscious consumer
Company commitment to people who need help 4,58 4,02 Informing about ways of preventing food waste 4,02 3,60 Informing about ways of sharing food 4,01 3,61
Efficiency-drive lifestyle
The possibility of food / meal delivery to the indicated place 4,54 4,58
Availability of small packages 4,14 3,48 An extensive offer of ready-to-eat dishes 3,66 4,01 A proposition of how to prepare a meal 3,84 3,30 The possibility of tasting products / dishes 3,77 3,72 Suggestions on how to serve a meal 3,47 2,94
I can look after myself I want a plastic-free world Conscious consumer
An extensive offer of bio, eco, natural and gluten free products / dishes 4,02 3,50
Availability of ecological packaging 3,95 3,29 The possibility of composing individualized meals by the customer 4,01 3,40
The possibility of planning a list of meals 3,92 3,27 Ability to draw up a shopping list 3,88 3,55 Calorie calculator 3,86 3,48
Digitally together
Sharing mobile applications 3,86 3,10 Enterprises’ activity on social networks 3,75 3,53
I can look after myself Efficiency-drive lifestyle
Possibility of using the "box" diet 3,73 3,04 Dietician advice 3,67 3,05
An extensive offer of vegetarian / vegan products / dishes 3,32 2,71
The world is a game
Competitions for clients 3,41 2,48 Clients’ clubs 3,27 3,53 Culinary workshops / games for customers 2,90 3,99
* assessment of significance was made on a scale from 1 to 7, 1 - definitely not important; 7- definitely important ** the frequency of use was declared on a scale of 1 to 7, 1 - never; 7- always Source: Authors’ own elaboration based on field research.
Consumer behaviour on the food market can be recognized by identifying the
importance of individual elements of the food offer and the frequency of their use. The respondents' declarations indicate the importance of many of these elements (Table 4). In particular, consumers exhibit behaviour typical for trends described as "everyone is an expert", "I can take care of myself" and "return to the sources". It is important for
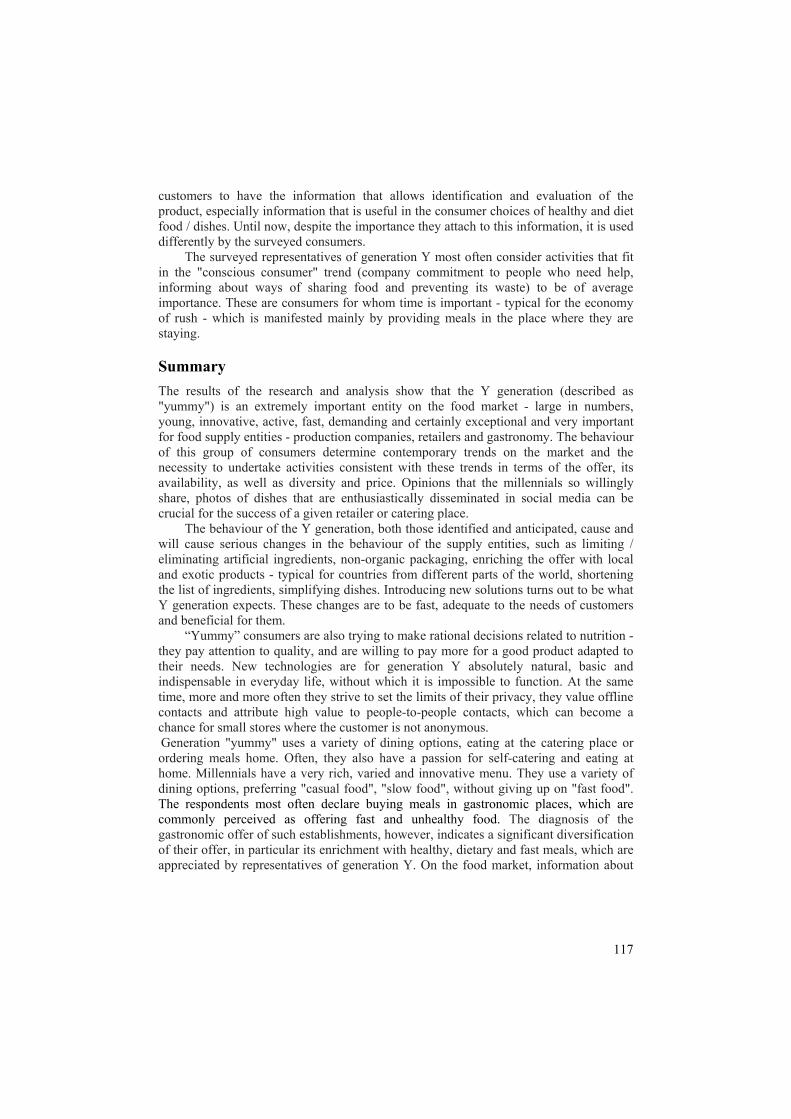
117
customers to have the information that allows identification and evaluation of the product, especially information that is useful in the consumer choices of healthy and diet food / dishes. Until now, despite the importance they attach to this information, it is used differently by the surveyed consumers.
The surveyed representatives of generation Y most often consider activities that fit in the "conscious consumer" trend (company commitment to people who need help, informing about ways of sharing food and preventing its waste) to be of average importance. These are consumers for whom time is important - typical for the economy of rush - which is manifested mainly by providing meals in the place where they are staying.
Summary The results of the research and analysis show that the Y generation (described as "yummy") is an extremely important entity on the food market - large in numbers, young, innovative, active, fast, demanding and certainly exceptional and very important for food supply entities - production companies, retailers and gastronomy. The behaviour of this group of consumers determine contemporary trends on the market and the necessity to undertake activities consistent with these trends in terms of the offer, its availability, as well as diversity and price. Opinions that the millennials so willingly share, photos of dishes that are enthusiastically disseminated in social media can be crucial for the success of a given retailer or catering place.
The behaviour of the Y generation, both those identified and anticipated, cause and will cause serious changes in the behaviour of the supply entities, such as limiting / eliminating artificial ingredients, non-organic packaging, enriching the offer with local and exotic products - typical for countries from different parts of the world, shortening the list of ingredients, simplifying dishes. Introducing new solutions turns out to be what Y generation expects. These changes are to be fast, adequate to the needs of customers and beneficial for them.
“Yummy” consumers are also trying to make rational decisions related to nutrition - they pay attention to quality, and are willing to pay more for a good product adapted to their needs. New technologies are for generation Y absolutely natural, basic and indispensable in everyday life, without which it is impossible to function. At the same time, more and more often they strive to set the limits of their privacy, they value offline contacts and attribute high value to people-to-people contacts, which can become a chance for small stores where the customer is not anonymous. Generation "yummy" uses a variety of dining options, eating at the catering place or ordering meals home. Often, they also have a passion for self-catering and eating at home. Millennials have a very rich, varied and innovative menu. They use a variety of dining options, preferring "casual food", "slow food", without giving up on "fast food". The respondents most often declare buying meals in gastronomic places, which are commonly perceived as offering fast and unhealthy food. The diagnosis of the gastronomic offer of such establishments, however, indicates a significant diversification of their offer, in particular its enrichment with healthy, dietary and fast meals, which are appreciated by representatives of generation Y. On the food market, information about

118
the composition of products and dishes is very important to them and they most often use such information.
The results of direct research also indicate that among 10 trends of consumer behaviour expected for 2019, the respondents are most in line with the trend "everyone is an expert", "I can take care of myself" and "return to the sources". It should be underlined that the trends described in the theoretical part concerning generation Y on the food market are not clearly visible in the results of direct research. This may be related to the nature of the conducted research, the research technique used (inability to deepen statements and their declarativeness) and the sample size.
Bibliography Angus A., Westbrook G., Top 10 Global Consumer Trends 2019. Euromonitor International, 2019 Baran M., Kłos M., Pokolenie Y – prawdy i mity w kontekście zarządzania pokoleniami, Marketing i Rynek 5/2014 Bartlett M., Analyst: understanding what shapes generation can help the … . Credit Union Journal, No. 8(21)/2004 Bywalec Cz., Konsumpcja a rozwój gospodarczy i społeczny, C.H.Beck, Warszawa 2010,s.195 Dalton P., Managing the generation. ABA Washington News, No. 11(19)/2003 Gołąb-Andrzejak E., Konsumenci pokolenia Y – nowe wyzwanie dla komunikacji marketingowej, Handel Wewnętrzny 2016/2 Kisiel P., Millenialsi – nowy uczestnik życia społecznego, Studia Socialia Cracoviensia 8 nr 1/2016 Kucharska B., Innowacje w handlu detalicznym w kreowaniu wartości dla klienta. Uniwersytet Ekonomiczny w Katowicach, Katowice 2014 Kucharska B., Food in retailers' commercial offer - possibilities of building relationships with consumers, Olsztyn Economic Journal, nr 14/2019 Miller R.K., Washington K., Consumer Behavior 2011: Millennial Consumers, Richard K. Miller and Associates (RKMA), Loganville 2011 Polski rynek handlu spożywczego w 2010-2020 roku. Roland Berger Report, 2016 Rich M., Millennial students and technology choices for information searching. The Electronic Journal of Business Research Methods, No. 6(1)/2008. Sowa I., Nowe trendy w zachowaniach młodych konsumentów wyzwaniem dla współczesnego handlu. Zeszyty Naukowe Uniwersytetu Szczecińskiego nr 777. Problemy Zarządzania, Finansów i Marketingu nr 32/2013 [www1] https://encyklopedia.pwn.pl/haslo/pokolenie;3959194.html [www2]https://poradnikprzedsiebiorcy.pl/-pokolenia-w-pracy-pokolenie-y [www3] http://www.portalspozywczy.pl/handel/wiadomosci/glodny-jak-millenials-czyli-jak-pokolenie-y-kupuje-zywnosc,145251.html; [www4] http://www.odzywianie.info.pl/przydatne-informacje/artykuly/art,jak-odzywia-sie-pokolenie-millenialsow.html; [www5] http://www.national-geographic.pl/ludzie/obsesja-jedzenia-kim-sa-ludzie-z-pokolenia-mniam [www6] http://www.poradnikhandlowca.com.pl/aktualnosci-gospodarka/kpmg-milenialsi-szansa-czy-zagrozenie-dla-handlu-lokalnego; [www7] https://www.polskieradio.pl/42/273/Artykul/1729078,Millenialsi-lubia-nowosci-produkty-regionalne-i-rzemieslnicze-oraz-polskie.html [www8] http://www.portalspozywczy.pl/handel/wiadomosci/pokolenie-y-to-bardzo-swiadomi-konsumenci,137873.html

119
Streszczenie Celem artykułu jest identyfikacja zachowań pokolenia Y na rynku żywności kontekście dominujących trendów konsumenckich. Realizacji celu artykułu posłużyły studia literaturowe, informacje pochodzące z czasopism branżowych oraz badania bezpośrednie przeprowadzone przez autorów artykułu. Rozpoznania trendów konsumenckich dokonano na podstawie wtórnych źródeł informacji, wykorzystując również raport Top 10 Global Consumer Trends 2019 Euromonitor International. Raport stał się także inspiracją do podjęcia badań bezpośrednich, które zostały zrealizowane techniką ankiety audytoryjnej wśród przedstawicieli pokolenia Y. Wyniki przeprowadzonych badań i analiz wskazują, że pokolenie Y określane jako „mniam” to niezwykle ważny podmiot na rynku żywności – duży liczebnie, młody, innowacyjny, aktywny, szybki, wymagający, wyjątkowy oraz bardzo ważny dla podmiotów podaży na rynku żywności. To zachowania tej grupy konsumentów wyznaczają współczesne trendy na rynku i konieczność podejmowania działań zgodnych z tymi trendami w zakresie oferty, jej dostępności, a także różnorodności oraz ceny. Słowa kluczowe: pokolenie Y, zachowania konsumentów, rynek żywności, trendy JEL Code: D11 D12 J11 Information about authors:
Dr Barbara Kucharska Dr Mirosława Malinowska University of Economics in Katowice Department of Markets and Consumption ul. 1 Maja 50, 40-287 Katowice e-mail: [email protected], ORCID 0000-0001-7467-2502 e-mail: [email protected], ORCID 0000-0003-0669-3330

120
22 (71) 2019 DOI 10.22630/PEFIM.2019.22.71.30
Iwona Lupa-Wójcik Pedagogical University of Krakow
STUDENT ATTITUDES TOWARD THE USE OF CHATBOTS IN CUSTOMER SERVICE
The article addresses an important and current problem related to the use of chatbots in
customer service, according to students. The aim of the research was to recognize the attitude of respondents to chatbots in the context of customer service and to determine the development prospects for their use in this area. The research examined the recognizability of chatbots among respondents, the frequency of contact between respondents and chatbots, as well as the impression (feeling) of respondents using chatbots. As a research method, student survey was used. Research has shown that chatbots are still a new tool for respondents, however they have great potential in customer service, as they are user-friendly and are very useful in the area of customer service. Research has shown that the role of chatbots in this area should increase. This can have a good effect on the image of the brand / company. Key words: chatbots, customer service, social media, marketing automation, helpline, Messenger JEL Code: M3
Introduction Currently, in the age of social media, the need for instant customer service has become a pressing problem for companies. They are required to respond immediately to thousands of customer inquiries that appear very quickly. It is not surprising that the marketing automation trend is developing strongly, and the use of chatbots in customer service as well.
The purpose of this article is to recognize the attitude of respondents to chatbots in the context of customer service and to determine the prospects for their use in this regard from the point of view of users. As the main hypothesis it was assumed that the vast majority of respondents had contact with chatbots, although in many cases they were not aware of it, and assess their usefulness in the field of customer service. The role of chatbots in customer service should increase and it can have a good impact on the image of the brand / company.
Literature review Over the last few years, many scientific studies have been conducted on chatbots and their use in customer service. In 2007, Bayan Abu Shawar and Eric Atwell discussed their usefulness in various areas of life, such as education, information retrieval, business or e-commerce1. The authors defined them as “computer programs that interact with users using natural languages”2 and they pointed out that the beginnings of this type of technology date back to the 1960's. Also, in 2007, works by Huang, Jizhou, Ming Zhou, 1B.A. Shawar, E. Atwell: Chatbots: are they really useful?,Ldv forum. Vol. 22. No. 1. 2007. 2Ibidem, p. 29.

121
and Dan Yang, similarly defined chatbot as a “conversational agent that interacts with users in a certain domain or on a certain topic with natural language sentences”3. R. Dale in 2016 wrote a work entitled "The return of the chatbots", exploring what had changed in the last decades due to the use of chatbots, since they have such a long history4. During this time, many studies were carried out related to the technical aspects of using chatbots in conversation with people. For example, authors have wondered why people use chatbots5. An interesting study is also shown by J. Hill, W.R. Ford and I.G. Farreras, presenting “a comparison between human–human online conversations and human–chatbot conversations”6. This type of research has undoubtedly contributed to the development of chatbots in customer service.
In the area of communication with clients, chatbots have also been used by companies for a long time. Understanding the concept of chatbot very widely (as in this article), one can give many examples of using chatbots in customer service, e.g. automatic e-mails sent after making a purchase in an online store. Courier companies also use chatbots for customer service on a large scale. One can read a lot about chatbots in customer communication in A. Braun's book from 20037. However, the real revolution associated with the use of chatbots in customer service came with the development of social media in this area, which was noticed, for example, by A. Xu, Z. Liu, Y. Guo, V. Sinha, & R. Akkiraj8.
Currently, chatbots are present on many company websites, providing customer support while making purchase decisions and even replacing the helpline to some extent. Many companies develop chatbots on Messenger, which is currently the most popular communicator in Poland and in the world9, closely related to Facebook. It is anticipated that by 2020, 80% of companies in the world will use chatbots, and by 2022, banks may automate up to 90% of customer interaction with chatbots10. However chatbots on Messenger are still new to users, and their wider use in customer service may raise doubts. For example “46% of Internet users in the US would rather receive online support from a live person, even if the chatbot can save them a lot of time”11. Customers fear that chatbots hinder contact with a live person (50.7%) and give too many unhelpful answers (47.5%)12. Therefore the use of chatbots in customer service is a big challenge for companies.
3J. Huang, M. Zhou, D. Yang: Extracting Chatbot Knowledge from Online Discussion Forums, IJCAI. Vol. 7. 2007, p. 423. 4R. Dale: The return of the chatbots, Natural Language Engineering 22.5 (2016): 811-817. 5P.B. Brandtzaeg, A. Følstad: Why people use chatbots, International Conference on Internet Science. Springer, Cham, 2017. 6J. Hill, W.R. Ford, I.G. Farreras: Real conversations with artificial intelligence: A comparison between human–human online conversations and human–chatbot conversations." Computers in Human Behaviour 49 (2015): 245-250. 7A. Braun, Chatbots in der Kundenkommunikation. Springer-Verlag, 2013. 8Xu, Anbang, et al.: A new chatbot for customer service on social media. Proceedings of the 2017 CHI Conference on Human Factors in Computing Systems. ACM, 2017. 9 https://napoleoncat.com/stats/ (28.02.2019). 10Chatbot Report 2019: Global Trends and Analysis, https://chatbotsmagazine.com/chatbot-report-2019-global-trends-and-analysis-a487afec05b(14.10.2019). 11 Ibid. 12 Ibid.

122
Methodology The aim of the research was to recognize the attitude of respondents to chatbots in the context of customer service and to determine the development prospects for their use in this area. The following sub-objectives have been indicated:
• determining the recognizability of chatbots among respondents, • recognition of the frequency of contact of respondents with chatbots, • examining the feelings of respondents in relation to chatbots, • determining the suitability of chatbots in customer service, • recognizing the possibilities of developing the use of chatbots in the context of
customer service. As the main hypothesis, it was assumed that the vast majority of respondents had
contact with chatbots, although in many cases they were not aware of it. They assess relatively well the usefulness of chatbots in the field of customer service. The role of chatbots in customer service should increase and it can have a good impact on the image of the brand / company.
The following specific hypotheses were formulated: H1: Respondents, despite the very frequent use of various types of internet services
(eg e-mail, Facebook, Messenger, internet shopping), in many cases cannot determine if they have ever met with any chatbot.
H2: Respondents can determine contact with a given chatbot only after being asked about it directly (giving an example).
H3: Respondents positively assess the usefulness of pop-ups chatbots on the websites of companies and of chatbots in Messenger.
H4: In the opinion of the respondents, chatbots have a beneficial effect on the image of the brand or company that uses them in customer service.
H5: According to respondents, chatbots are a good alternative to other communication channels in the field of customer service, and their development in this direction is desirable.
A survey was used to verify the hypotheses. The questionnaire consisted of 12 questions regarding the attitude of respondents to chatbots, as well as the usefulness of these tools in customer service. In addition, the questionnaire contained two metrics questions about gender and age of the respondents. The questionnaire was sent in electronic form to students of the Pedagogical University of Krakow (Poland). Students constitute a group of "technologically advanced" consumers, which means that they set the directions of trends. All surveyed students are internet users. If the hypothesis that the knowledge and use of chatbots in this group is small is confirmed, it should be assumed that also in other groups of Internet users these attitudes will not be different.
The research sample was 120 people. The study is a pilot. Respondents were mainly women (83%). Men constituted the decided minority (17%). The respondents were mainly aged 18-25 (96%). The research was carried out in February 2019.
Findings To verify the hypotheses, information on how often the respondents use selected internet services, such as e-mail, Facebook, Messenger or an online store (including Allegro - the

Polish equprobabilityexample, tlarge scaleon this top
As mathey nevershop onlin(36% - som
Figure 1.TheFigure 1.TheSource: Auth
Generexamined w
Figure 2. ConSource: Auth
online
I do nit's ha
3
uivalent of eBy, or rather ththe use of coue in customer ic is summariany as 95% o
r do), and neare, and 33% -
metimes, 31%
e frequency of usee frequency of usehor’s own research
rally, surveyewhether they
ntact of respondehor’s own research
Messenger
e shop (including Allegro)
courier services
Google services
not know, ard to say32%
Bay), was dehe certainty thurier services service (e.g.zed in Figure
of respondentsrly 80% - Facrather often. M - rather often
e of selected serve of selected servh.
ed students usdeclared cont
ents with chatboth.
0,0 20,0
probably not9%
etermined. Ushat the respon
was also beefor tracking s1.
s very often ucebook. In addMany people n).
vices by respondevices by respoden
e selected intact with a cha
(according to the
40,0 60,0
rather yes18%
no never3%
sing these sendents had coen verified, asshipments). T
use Messengerdition, 42% oalso use, for e
nts (N=120) ts (N=120)
ernet servicesatbot (Figure 2
emselves)(N=120
80,0 100,
yes of 40
rvices meansontact with chs they use ch
The informatio
r (only 2% indf respondentsexample, cour
s on a large sc2).
0)
,0
very often
rather often
sometimes
rather rarely
very rarely
never
don't know /say
course0%
123
s very high hatbots. For hatbots on a on collected
dicated that s sometimes rier services
cale. It was
y
/ hard to

124
40% of the surveyed students decided that they had contact with a chatbot, while 32% were unable to determine this issue. This data means that there is still an average awareness about chatbots among the respondents. The H1 hypothesis was confirmed that respondents - despite the very frequent use of various types of internet services (e.g. e-mail, Facebook, Messenger, internet shopping) - in many cases cannot determine if they have ever met with any chatbot.
Anticipating such research results, students were asked how often they meet specific chatbots, e.g. pop-up chat windows on websites where they are invited to a conversation about the company's offer etc., Google Assistant, chatbots on Messenger, which provide specific information, e.g. about the weather, about company competitions, etc., chatbots on e-mail (they send information, e.g. about subscribing to a newsletter, about purchasing an item, etc.) or other (Figure 3).
Figure 3. Frequency of contact of respondents with selected chatbots(N=120) Source: Author’s own research.
It turns out that only 6% of the surveyed students have never encountered chat
windows on the websites of various companies, 11% - with email chat chats and 13% - with Google Assistant. Slightly more of the respondents indicated that they had never met with chatboxes on Messenger. These results confirm the H2 hypothesis that respondents can determine contact with a given chatbot only after being asked about it directly. In general, however, knowledge and awareness among the studied group of students about chatbots is rather average.
In the further stage of the research, to obtain more precise results, the questions for the respondents were limited to only two types of chatbots: pop-up chat windows on websites and to chatbots on Messenger.
First of all, the ratio of respondents to pop-up chat windows on websites will be discussed. The respondents were asked how often they use this type of chat to get more
0,0 20,0 40,0 60,0 80,0 100,0
Pop-up chat windows on websites where you are
invited to a conversation eg about the company's offer
Chatbots on Messengeer, which provide specific
information, eg about the weather, about company …
Google Assistant
Chatbots on the e-mail (they send information, eg about
subscribing to the newsletter, about purchasing the item, …
Other
often
sometimes
rarely
never
don't know / hard to say
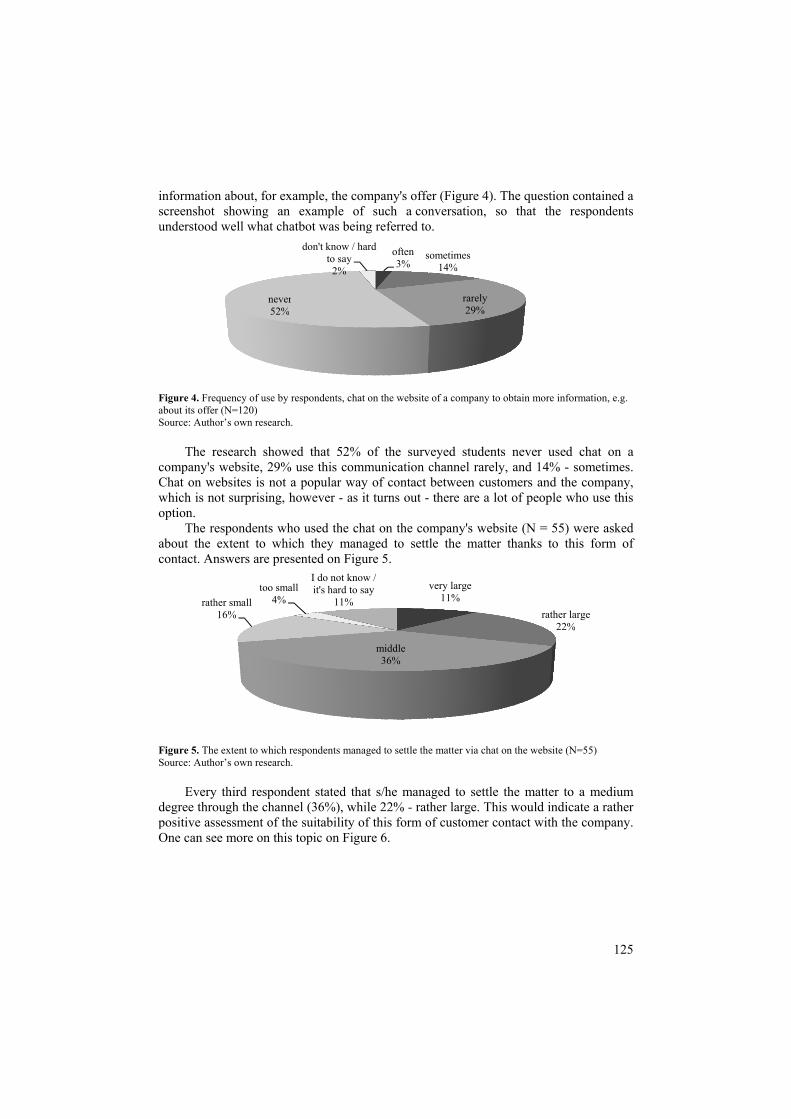
informatioscreenshotunderstood
Figure 4. Freabout its offeSource: Auth
The r
company'sChat on wwhich is noption.
The rabout the contact. An
Figure 5. TheSource: Auth
Every
degree thropositive asOne can se
rath
n about, for ext showing and well what ch
equency of use byr (N=120)
hor’s own research
research show website, 29%
websites is notot surprising,
espondents wextent to wh
nswers are pre
e extent to whichhor’s own research
y third responough the chanssessment of thee more on thi
neve52%
her small16%
too sm4%
xample, the con example ohatbot was bei
y respondents, ch
h.
wed that 52%% use this comt a popular wahowever - as
who used the chich they manesented on Fig
h respondents manh.
ndent stated thnnel (36%), whhe suitability is topic on Fig
er%
don't know / hto say
2%
mallI do not knit's hard to
11%
ompany's offeof such a coning referred to
at on the website
% of the survmmunication cay of contact s it turns out -
chat on the conaged to settgure 5.
naged to settle the
hat s/he manahile 22% - ratof this form o
gure 6.
often3%
shard
middle36%
ow / say
er (Figure 4). Tnversation, so.
of a company to
veyed studentchannel rarelybetween cust there are a lo
mpany's websle the matter
e matter via chat
aged to settle ther large. Thiof customer co
sometimes14%
rarely 29%
very large11%
The question o that the r
obtain more info
ts never usedy, and 14% - omers and theot of people w
site (N = 55) r thanks to th
on the website (N
the matter tois would indicontact with th
rather l22%
125
contained a respondents
ormation, e.g.
d chat on a sometimes. e company,
who use this
were asked his form of
N=55)
o a medium cate a rather e company.
arge%

126
Figure 6. Respondents' assessment of the usefulness of chat on websites for a client seeking information about a company and its offer (N=120) Source: Author’s own research.
Respondents rate the usefulness of popups on websites by an average (38%) or rather high (26%). Therefore it can be concluded that such solutions are useful in customer service.
Similarly, the ratio of respondents to chatbots on Messenger was examined. First, they were asked whether they had ever had a dialogue with a chatbot on Facebook or Messenger (a screenshot from the example of such a conversation was helpfully inserted in the questionnaire). Answers have been compiled on Figure 7.
Most of the respondents (60%) never had conversations with chatbot on Messenger. Only nearly every third surveyed student used this type of functionality (31%). It shows that the awareness and knowledge among students about chatbots in Messenger is generally low, which may be surprising, as respondents very often and on a large scale use this communicator. Moreover, the results of qualitative research published in the Report "Polish chatbots 2018" are confirmed, from which it appears that although respondents recruited for research (N = 20) are active users of the Messenger communicator, "the majority of them during the study have been in contact with chatbot for the first time in their life". The authors concluded that "chatbots are still a novelty". However, from these surveys it also follows that in spite of this the respondents did not have difficulties in communicating with a chatbot and carrying out the tasks entrusted to them (business scenarios). The vast majority of users received chatbots very positively. The participants of the research declared that in the future a similar task (e.g. the purchase of a cinema ticket) would be readily performed again in this new contact channel. Also important was the conclusion that chatbots have low "entry barriers" for new users, and Internet users are already open to first contacts with chatbots13.
13 Ibidem.
7,50%
21,70%
38,30%
25,80%
6,70%
0,00%
5,00%
10,00%
15,00%
20,00%
25,00%
30,00%
35,00%
40,00%
45,00%
1 - very low 2 3 4 5 - very high

Figure 7. ConSource: Auth
Chatbthe contexwere askedmanaged to
Figure 8. TheSource: Auth
It tur
Messengerbe assessed
0,00%
5,00%
10,00%
15,00%
20,00%
25,00%
30,00%
35,00%
40,00%
45,00%
50,00%
nducting convershor’s own research
bots on Messext of customerd about their fo settle the ma
e feelings of the rhor’s own research
rns out that 4r had average d as rather pos
d
8,10%
1 - very bad
sations with chatbh.
enger were alr service. Thofeelings from tatter thanks to
respondents in relh.
46% of respfeelings, and
sitive.
no60%
don't know / hard to say
9%
13,50%
2 - rather bad
bot on Messenger
lso positively ose who usedthis conversat
o this channel
lation to conversa
ondents who d 24% - rather
45,90%
3 - avarage
r by respondents (
assessed by d this communtion (Figure 8(Figure 9).
ations with chatb
had conversr good. Their
yes31%
24,30%
e 4 - rather g
(N=120)
surveyed respnication chan) and to what
ot on Messenger
sations with r overall impr
%
8,10
good 5 - very
127
pondents in nnel (N=37)
extent they
(N=37)
chatbot on ressions can
0%
y good

128
Figure 9. Theon MessengerSource: Auth
Everymanaged tChatbots o
Basedrespondentchatbots in
It wascompany th
Figure 10. Ruses them in Source: Auth
Almo
of a brandgood. It sehave a benservice.
Finallarea of cus
ra
0,00%5,00%
10,00%15,00%20,00%25,00%30,00%35,00%40,00%45,00%50,00%
e extent to whichr (N=37)
hor’s own research
y third responto a rather laron Messenger d on the prets positively
n Messenger ins also importahat uses them
espondents' assescustomer service
hor’s own research
ost half of respd or company eems that - witneficial effect
ly, the respondstomer service
ather small5%
too1
1,70%
1 - very bad
h respondents man
h.
ndent stated trge extent (32is also assesse
esented researassess the usn customer seant to verify
m in customer s
ssment of the imp(N=120)
h.
pondents (43%that uses the
th some cautioon the image
dents were aske: are they hel
middle32%
o small11%
I do noit's har
8
12,50%
2 - rather bad
naged to settle the
that thanks to2%) or mediued positively.rch results, Hsefulness of crvice. the impact ofservice (Figur
pact of using chat
%) assess the iem in customon - one can a
e of a brand or
ked what theylpful and symp
very1
e
ot know / rd to say8%
43,30%
d 3 - avarag
e matter through
o chatbot on um (32%). Th
H3 hypothesichatbots popp
f chatbots on re 10).
tbots on the imag
impact of usinmer service, as
accept the H4r company tha
y think about tpathetic (nice
y large1%
rather larg33%
%
35,80
ge 4 - rather
conversation with
Messenger the general us
s can be accping up on w
the image of
e of the brand / c
ng chatbots ons medium, an4 hypothesis that uses them i
the use of cha), or rather irr
ge
0%
6,7
r good 5 - ve
h the chatbot
things were sefulness of
cepted that websites and
f a brand or
ompany that
n the image d 36% - as hat chatbots in customer
atbots in the ritating, and
70%
ery good

129
above all, whether they can be a good alternative to helpline and whether their development in this direction is desirable. Answers have been compiled on Figure 11.
Figure 11. Respondents' assessment of using chatbots in the field of customer service (N=120) Source: Author’s own research.
According to 53% of surveyed students, chatbots are helpful in customer service, and according to 43% - they are nice. However for many of the respondents chatbots can be annoying (28% - definitely yes, 27% - rather yes). Probably it is mainly due to the opinion about chatbots on websites (they can disturb users when they pop up). Respondents appreciate the fact that chatbots respond quickly (40% - rather yes, 33% - definitely yes) and are not difficult to use (43% - probably not, 31% - definitely not). This confirms the previously quoted conclusions from the Report that chatbots - although they are new to many users - have a "low threshold" to entry, as they are user-friendly14.
Over half of the respondents think that chatbots are a better solution than helpline (35% - rather yes, 19% - definitely yes). They can also replace helpline (33% - rather yes, 16% - definitely yes). Students admit that they represent the future in customer service (36% - rather yes, 17% - definitely yes).
The above research results allow us to accept the H5 hypothesis that chatbots are a good alternative to other communication channels in the field of customer service, and their development in this direction is desirable. Therefore, all hypotheses have been verified positively.
14 Raport. Polskie chatboty 2018, K2 Digital Transformation, p. 72.
0,0 20,0 40,0 60,0 80,0 100,0
They are helpful
They are annoying
They are nice
They are a better solution than a helpline
They are quick in response
They are difficult to use
They can replace the helpline
They represent the future of customer service
definitely yes rather yes I do not know / it's hard to say rather not definitely not

130
Conclusions The obtained research results have achieved the purpose of the research, which was the recognition of the respondents' attitude to chatbots in the context of customer service and defining the development prospects for their use in this area. Studies have shown that respondents, despite the very frequent use of various types of internet services (e.g. e-mail, Facebook, Messenger, internet shopping), in many cases cannot determine if they have ever encountered any chatbot (H1). Respondents can determine contact with a given chatbot only after being asked for it directly (H2). At the same time their attitude towards chatbots is rather positive. Rather, they positively assess the usefulness of chatbots popping up on websites (although these are sometimes irritating) and chatbots in Messenger in customer service (H3). Chatbots also have a beneficial effect on the image of the brand or company that uses them in customer service (H4). Moreover, they are a good alternative to other communication channels in the field of customer service (such as helpline), and their development in this direction is desirable (H5). Surprising in the research is that students - although they are frequent Messenger users - still have low awareness about chatbots in this communicator. They are still new to them. On the other hand, chatbots are user-friendly, which definitely supports the belief that their role in customer service should increase. It will have a good effect on the image of the brand / company. Thus, the main hypothesis was confirmed.
References Abdul-Kader S.A., Woods J.C.: Survey on chatbot design techniques in speech conversation systems." International Journal of Advanced Computer Science and Applications 6.7 (2015). Xu, Anbang, et al.: A new chatbot for customer service on social media. Proceedings of the 2017 CHI Conference on Human Factors in Computing Systems. ACM, 2017. Brandtzaeg P.B., Følstad A.: Why people use chatbots, International Conference on Internet Science. Springer, Cham, 2017. Braun A., Chatbots in der Kundenkommunikation. Springer-Verlag, 2013. Dale R.: The return of the chatbots, Natural Language Engineering 22.5 (2016). Hill J., Ford W.R., Farreras I.G.: Real conversations with artificial intelligence: A comparison between human–human online conversations and human–chatbot conversations." Computers in Human Behavior 49 (2015): 245-250. Huang J., Zhou M., Yang D.: Extracting Chatbot Knowledge from Online Discussion Forums, IJCAI. Vol. 7. 2007. Radziwill N.M., Benton M.C.: Evaluating quality of chatbots and intelligent conversational agents. arXiv preprint arXiv:1704.04579 (2017). Raport. Polskiechatboty 2018, K2 Digital Transformation, 2018. Shawar B.A., Atwell E.: Chatbots: are they really useful?, Ldv forum. Vol. 22. No. 1. 2007. Shawar A.B., Atwell E.: Using dialogue corpora to train a chatbot, Proceedings of the Corpus Linguistics 2003 conference. 2003. Yan M. et al.: Building a chatbot with serverless computing." Proceedings of the 1st International Workshop on Mashups of Things and APIs. ACM, 2016. https://napoleoncat.com/stats/ (28.02.2019).

131
Information about author:
Dr. Iwona Lupa-Wójcik Institute of Law, Administration and Economy Pedagogical University of Krakow Podchorążych 2, 30-084 Kraków, Poland e-mail: [email protected] ORCID: 0000-0003-1673-7077

132
22 (71) 2019 DOI 10.22630/PEFIM.2019.22.71.31
Grzegorz Maciejewski Uniwersytet Ekonomiczny w Katowicach
Sylwia Mokrysz Mokate SA
NEW TRENDS IN CONSUMPTION ON THE COFFEE MARKET
The aim of the article is to present trends in consumption, which currently affect or will
affect the behaviour of coffee consumers in the next 2-5 years. The article is written in the form of theoretical considerations supported by an analysis of source materials. It presents the main megatrends, consumer trends and product trends observed on the coffee market. It also describes relations between the aforementioned phenomena and consumer behaviour. The analysis of the collected data made it possible to conclude that the main trends determining consumer behaviour are naturalness and sustainability, health and nutrition, multisensory experience, convenience, digitalisation and individualisation. In order to meet these trends, producers and sellers of coffee will also want to gain an influence on the choices and preferences of coffee consumers by supporting and developing such product trends as: craft coffee time, the ice age is coming, ready to drink coffee, co-branding to dial up indulgence, convenient formats go premium, the rise of super coffee or the world of smart vending machines. Keywords: megatrends, consumer trends, trends on the food and beverages market, product trends, coffee market JEL Codes: D12, E21, M30
Introduction The 21st century has become the age of the consumer - an educated, conscious consumer, but also one that is impatient, disloyal and capricious1. Enterprises wishing to maintain or increase their competitiveness are forced to continuously and actively monitor changes in consumer behaviour, not only to keep up with buyers of their products, but to overtake them, creating a world in which consumers would like to live. The emerging megatrends and consumer trends are indicative of the expected future consumer behaviours.
The purpose of the article is to show new consumer trends and corresponding product trends in view of the identified megatrends, affecting the functioning of economies as well as entire societies. The article is written in the form of theoretical considerations supported by the analysis of data from secondary sources. The area of observations consists of entities operating on the coffee market.
This paper is organised as follows: the Theoretical Framework section defines the concepts of megatrends, consumer trends, product trends and the relationship between these concepts. Next, the Materials and Methods section presents the source materials used in the article and the method of their analysis. The Results and Discussion section begins with a 1 G. Maciejewski: The Contemporary Consumer in the Face of Megatrends in Consumption [in:] Olejniczuk-Merta A. (ed.): The Transformation of Consumption and Consumer Behaviour, IBRKK, Warsaw 2012, p.29.
133
short description of the coffee market. Then, this section presents a description of the most important current trends and megatrends combined with a discussion on the impact of the most dynamically developing product trends on purchasing behaviour and coffee consumption. The manuscript ends with conclusions made on the basis of the analysis carried out and a discussion of results. The conclusions from the presented material do not fully cover the subject, however, they can play a part in the discussion of observed changes taking place in consumer behaviour, as well as in B2C relations. The data presented may also be useful for companies involved in the production and sale of coffee in the process of building their competitive advantage, based on permanent ties with consumers.
Theoretical framework The concept of a trend has been present in reference materials since the mid-twentieth century, finding its place first in mathematical and economic sciences to describe changes in charts and sequences of numbers, and then in sociological or marketing sciences to describe changes in culture, worldviews or lifestyles2. Ph. Kotler describes a trend as "the direction or series of events characterised by a certain momentum and durability"3. B. Mróz defines the term 'trend' as "changes taking place over time in social or market phenomena, the direction of which can be measured by means of specific indicators, scales or indexes".4 In turn, T. Zalega, under the term 'trend', understands the direction of current development in a given field or, in a more general sense, the monotonic component of the given feature's dependence on time5. Trends can thus be short- or long-term in nature, and in regard to their range: can be global (megatrends) or regional (microtrends). The specific features of trends are volatility, coexistence (mutual overlap) and divergence (the simultaneous creation of trends and counter-trends)6.
Ph. Kotler, referred to above, distinguishes between different trends on account of their durability, dividing them into temporary fashion, trends and megatrends. He describes temporary fashion as an unpredictable short-term change devoid of greater economic, social or political significance. Trends and megatrends, in the opinion of Ph. Kotler, are more durable and easier to predict. A trend outlines the shape of the future, it is a long-term phenomenon, which can be observed in the behaviour of consumers and enterprises in many markets. The formation and development of a trend is confirmed by reliable values of economic, social and demographic indicators appearing at the same time7. Megatrends, in turn, are unquestionably connected with globalisation8. According to J. Naisbitt, megatrends identify all socio-economic or structural processes that form
2 M. Raymond: The Trend Forecaster`s Handbook, Laurence King Publishing, London 2014, p. 14. 3 Ph. Kotler: Marketing, Dom Wydawniczy Rebis, Poznań 2005, p. 159. 4 B. Mróz: Konsument w globalnej gospodarce. Trzy perspektywy, Oficyna Wydawnicza SGH, Warsaw 2013, pp. 115-116. 5 T. Zalega: Nowe trendy i makrotrendy w zachowaniach konsumenckich gospodarstw domowych w XXI wieku, Konsumpcja i Rozwój 2(5)/2013, pp. 3-4. 6 J. Tkaczyk: Konsumpcja i konsument – nowe trendy. Handel Wewnętrzny, May - June 2012, pp. 126-127; S. Dybka: Trendy w zachowaniach konsumentów jako czynnik determinujący rozwój przedsiębiorstw, Studia Ekonomiczne. Zeszyty Naukowe Uniwersytetu Ekonomicznego w Katowicach 338/2017, p. 82. 7 Ph. Kotler: Marketing, op.cit., p. 159. 8 M. Maciaszczyk: Wybrane megatrendy i ich możliwy wpływ na konsumentów niepełnosprawnych ruchowo, Handel Wewnętrzny, 5(364)/2016, p.162.

134
slowly, but when they do come into existence, have an impact on all areas of life for a certain time9. In addition, megatrends can have an impact on every person and can change and shape the future of the whole world10. The concept of a megatrend may also be defined as certain unchanging economic, social, political and cultural trends, as well as phenomena occurring in the process of the civilisational development of society, which has various conditions and embraces the whole planet, conditioning key goals and directions of human development11 that leave an imprint on the environment12. Megatrends thus identify sets of certain economic, social or environmental patterns of behaviour that change people's way of life as well as the products that these people need13. Recalling the paper "The Impact of megatrends on western governments" by futurologist F. de Meyer, megatrends can be presented as long-lasting, fast-spreading trends that strongly influence society in many dimensions and evoke the conviction of their inevitability14.
The concept of a megatrend is close to the concept of a macrotrend, which H. Mruk defines as "objective, long-term directions of general consumer choices, behaviours and preferences" or as "significant social, economic, political and technological changes that form slowly, but when they come into existence, affect consumer behaviour for 7-10 years and even longer"15. The antonym of a macrotrend is a microtrend, the existence of which is indicated by B. Mróz referencing the work of M.J. Penn and E. Kinney Zalesne. The authors assume that it is not a few mega-forces that determine how the world works, but the multiple choices forming microtrends - small forces that can direct a small fraction of the population, as small as 1%, but which nevertheless greatly shape entire societies16.
To fully show the role which trends play in consumer behaviour, it is worth referring to the views of H. Vejlgaard, who works in trend forecasting. This researcher defines a trend as a process of change, which is drawn from a psychological, economic or sociological perspective, which may be short- or long-term, and regional or global17. Taking this into consideration, it is possible to agree with T. Zalega that "a trend in consumer behaviour is understood as a specific direction of change in the consumer's modelled lifestyle, acting in an objective way, independent of his will and consciousness"18. Looking at this issue from the
9 J. Pieriegud: Wykorzystanie megatrendów do analizy przyszłościowego rozwoju sektorów gospodarki, [in:] Gajewski J., Paprocki W., Pieriegud J., Megatrendy i ich wpływ na rozwój sektorów infrastrukturalnych, Instytut Badań nad Gospodarką Rynkową – Gdańska Akademia Bankowa, Gdańsk 2015, p.15. 10 P. Zmyślony, A. Niezgoda: Popyt turystyczny. Uwarunkowania i perspektywy rozwoju, Wydawnictwo Akademii Ekonomicznej, Poznań 2003, p. 194. 11 S. Marek, M. Białasiewicz (ed.): Podstawy nauki o organizacji. Przedsiębiorstwo jako organizacja gospodarcza, PWE, Warsaw 2011, 389. 12 K. Borodako: Foresight w zarządzaniu strategicznym, C.H. Beck, Warsaw 2009, p.90. 13 S. Hajkowicz, J. Moody: Our future world. An analysis of global trends, shocks and scenarios, CSIRO, Canberra 2010, p.2. 14 F. de Meyer: The impact of megatrends on western governments, Institute for Future Insights, Available online: https://www.slideshare.net/fdemeyer/the-impact-of-megatrends-on-western-governments, (accessed on 09 February 2019); M. Maciaszczyk: Wybrane megatrendy …, op. cit. p. 163. 15 H. Mruk: Makrotrendy a zachowania konsumentów [in:] Kędzior Z. (ed.): Konsument. Gospodarstwo domowe. Rynek, CBiE Akademii Ekonomicznej w Katowicach, Katowice 2007, p.9. 16 M.J. Penn, E. Kinney Zalesne: Mikrotrendy. Małe siły, które niosą wielkie zmiany, MT Biznes, Warsaw, p.13. 17 H. Vejlgaard: Anatomy of trend, McGraw-Hill, New York 2008, p.9. 18 T. Zalega: New consumer trends [in:] Burchard-Dziubińska M. (ed.), Towards a green economy. From ideas to practice, Wydawnictwo Uniwersytetu Łódzkiego, Łódź 2015, p. 80.

135
perspective of Ph. Kotler, it can be said that trends in the sphere of consumption arise as a result of influencing consumer purchasing behaviour in a broadly understood environment (social, economic, legal, political, demographic and technological), which, in turn, affects changes in their consumption patterns19.
According to F. Shaw, emerging consumer trends influence the way enterprises operate, thus creating new rules for the functioning of modern organisations20. The impact of new consumer trends on enterprises, therefore, results in changes in the behaviours of these entities, which on the one hand try to keep up with the changing consumer, and on the other hand start to shape consumer behaviour, preferences and choices. In the latter situation, we can speak about the creation of product trends by enterprises. Relations between megatrends, consumer trends, product trends and consumer behaviour are presented in Figure 1.
Figure 1. Relations between megatrends, consumer trends, product trends and consumer behaviour Source: Authors’ own study.
Materials and method The sources of the article include the results of research on consumer behaviour and the coffee market, conducted by renowned research agencies and consulting companies in 2015-2019.
First, research on megatrends, which are about to change the world over the next 20 years, carried out by the Ernst & Young (EY) consulting company, is presented. The data presented by EY are the result of analyses based on reference materials and primary research carried out in renowned research centres from around the world21. Next, data from the Euromonitor International research agency is presented concerning the top 10 global consumer trends that could have the greatest impact on consumer behaviour in 2019 and subsequent years. The data were obtained as a result of direct quantitative research carried out in the autumn of 2018 by 14 regional company offices operating
19 Ph. Kotler, G. Armstrong, J. Saunders, V. Wong: Marketing. Podręcznik europejski, PWE, Warsaw 2002, pp.188-210. 20 F. Shaw: Uncertainty and the New Consumer, Foresight, 4/2009. 21 Megatrends 2015. Making sense of a world in motion, EYGM Limited 2015, pp.52-53.
Megatrends
Consumer trends Product trends
Consumer behaviour

136
globally 22. Subsequently, information on product trends currently observed on the coffee market is presented. This data comes from the reports of the research agency Mintel Group Ltd. published in 2018-2019.
The data collected made it possible to create a profile of the entities operating in the coffee market and to analyse the impact of megatrends and new trends in consumption on consumer behaviour on the coffee market.
The research for the needs of this study was carried out using the desk research method, deductive inference and the comparative method were used for data analysis. The descriptive and tabular form was used to present the obtained research results.
Results and discussion Megatrends affect consumer behaviour in the long run. EY, as the first of these trends, specifies the digital future (Table 1). In 2020, more than half of employees will belong to generations Y and Z. These are generations that grew up along with the development of digital technologies. Modern technologies like the internet of things, artificial intelligence, robotics, augmented and virtual reality change the methods of work and employee involvement23. They also affect everyday life, mobility, forms of spending free time and travel. Digital technologies are beginning to be present in every sphere of human life, and their presence is more and more awaited and desired.
Table 1. Trends affecting consumer behaviour in the coffee market
Megatrends Consumer trends Consumer trends on the food
and beverages market
Product trends on the coffee market
1. Digital future 2. Entrepreneurship
rising 3. Global
marketplace 4. Urban world 5. Resource planet 6. Health reimagined
1. Digitally together 2. Everyone is an
expert 3. I want it now! 4. Back to basics for
status 5. Conscious
consumers 6. Finding my
JOMO 7. I want a plastic
free world 8. We are ageless 9. I can look after
myself 10. Loner living
1. Naturalness and sustainability
2. Health and nutrition 3. Multisensory
experience 4. Convenience 5. Digitalisation 6. Individualisation
1. Craft coffee time 2. The ice age is
coming 3. Ready to drink
coffee 4. Co-branding to dial
up indulgence 5. Convenient formats
go premium 6. Migration of single-
serve coffee 7. The rise of super
coffee 8. The world of smart
vending machines
Source: Authors’ own research based on Megatrends 2015. Making sense of a world in motion, EYGM Limited 2015, pp.9-51; A. Angus, G. Westbrook: Top 10 global consumer trends 2019, Euromonitor International, London 2018, p.7-67; Consumer trends in food and beverages, Döhler Market Intelligence, Available online: http://www.portalspozywczy.pl/handel/wiadomosci/d-hler-6-mega-trendow-konsumenckich-ksztaltuje-dzisiaj-rynek-zywnosci-i-napojow,146783.html, (accessed on 09 February 2019); J. Forsyth: Coffee 2018. Global Annual Review, Mintel Group Ltd., London 2018, pp.4-21. 22 A. Angus, G. Westbrook: Top 10 global consumer trends 2019, Euromonitor International, London 2018, p. 69. 23 New megatrends will transform the human experience and reshape markets, societies and the global order, EY, Press release, 11 June 2018. Available online: https://www.ey.com/en_gl/news/2018/06/new-megatrends-will-transform-the-human-experience-and-reshape,(accessed on 09 February 2019).

137
Digitalisation creates almost unlimited possibilities of development, which supports the growing entrepreneurship, especially among young people. Currently, nearly 50% of entrepreneurs in the world are people between 25 and 44 years old. Importantly, growing entrepreneurship is also visible among women. EY estimates that 126 million women in the world have their own companies today, and about half of them employ workers.
Both of the megatrends support the development of another megatrend - a global marketplace. The differences between developed and fast developing countries will decrease. By 2030, rapidly developing countries will account for 47% of the global capital inflow, compared to 23% in 2010. The middle class of Asian countries, especially China and India, will become the driving force24. Increasing mobility will make companies around the world fight for talented individuals - human capital to maintain their competitive advantage. The further development of globalisation will be opposed by the advocates of isolation and anti-globalists, forming a counter-trend to it. These phenomena will be particularly visible in culture and politics. Anti-globalisation activities will be supported by national, ethnic and religious movements.
Another megatrend, indicated by experts from EY, is urbanisation. The number of cities and the number of people living in cities is increasing worldwide. In 2015, 54% of the world's population lived in cities. In 2050, 66% will be living in them. People move to cities to take advantage of the economic benefits they provide to their residents. Therefore, it is becoming necessary to implement a sustainable development policy, especially in the area of transportation (railways, highways, airports), access to water and electricity.
Sustainable development is the source of the development of the next megatrend called the resource planet. By 2030, the world's population will have increased by 1.2 billion people, and the world's 750 largest cities will gain 220 million new middle-class consumers. This situation will increase the demand for raw materials and natural resources by 33%. In 2035, annual electricity expenditure will reach $420 billion. Mankind must start to use its raw materials and resources responsibly, not only because of the progressive degradation of the environment, but also due to the finite availability of non-renewable resources. Modern mining technologies and technologies that renew the environment are to help achieve these goals.
The last of the trends indicated by EY is health reimagined. Expenditure on health protection already absorbs 10% of global GDP. It is becoming necessary to find new solutions so as to reduce costs and meet the increasingly higher expectations and needs of people. To achieve this, a new perspective on health is necessary, a new definition of health. It is necessary to abandon the existing, traditional health care and go in the direction of health management, and thus towards prevention, shaping healthy habits and healthy eating.
Each of the described megatrends shapes the existing and emerging consumer trends to a greater or lesser extent25. A. Angus and G. Westbrook have identified 10 new trends which influence consumer behaviour in 2019 and the subsequent years (Table 1).
24 M.A. Gonzalez-Perez, S. Gutierrez-Viana: Cooperation in coffee markets: The case of Vietnam and Colombia, Journal of Agribusiness in Developing and Emerging Economies 2(1)/2012, pp. 57-73. 25 D. Harrison: Ten global consumer trends in 2011, Strategic Direction 27(10)/2011, https://doi.org/10.1108/sd.2011.05627jaa.010.

138
The first two: digital together and everyone is an expert are strongly associated with the digital future megatrend. Over the last decade, technology has evolved from facilitating communication to enabling multidimensional interactions and collective experiences. People at that time had to deal with the technological and regulatory barriers that are now being overcome. Now they use the internet, video calls and virtual platforms to meet and collaborate with people around the world in real time. In the real world they are separate - digitally, they are together. Digitalisation means unlimited possibilities for computer games enthusiasts, social networking sites or educational websites. From dating to education, from work to controlling your health - everything can be done digitally together. Consumers are increasingly using Twitter, WhatsApp or Instagram to advise each other about what and where to buy best, sharing discount coupons, informing each other about discounts and bargains. Thanks to modern technologies, everyone is an expert. Many consumers lead very fast lives, are busy and don't want to wait. From businesses, they expect goods and services to be delivered as quickly and as simply as possible. More and more of them use applications that help them organise their lives, avoid street traffic jams or shorten waiting times in the queue.
I want it now! - this is a trend followed by people living life in the fast lane, who do not want to waste time shopping and handling current affairs. B. Mróz calls this trend "immediate gratification"26. Many modern consumers do not want to wait, do not want to postpone consumption, do not want it "later" - they want it "now", "immediately". Determinants of the development of this trend should be sought in the global marketplace megatrend and the development of communication technologies conducive to the diffusion and imitation of lifestyles and consumption patterns.
On the other hand, the urban world and resourceful planet megatrends strongly affect several consumer trends, which can be considered as counter-trends to those discussed above. These include back to basics for status, conscious consumers, finding my JOMO (joy of missing out) or I want a plastic free world. More and more consumers are becoming conscious consumers. They understand that they did not inherit the Earth from their parents, but only borrowed it from their children. They are aware of their choices and responsibilities for the future of the world. They are moving away from greedy consumerism and turning toward simplicity, better quality, and uniqueness. They seek authentic, diverse products and experiences that allow them to express their individuality. This group of consumers is not indifferent to animal welfare and the state of the natural environment. These are consumers who do not have to have everything. They say "less is more", turning FOMO (fear of missing out) into JOMO.
The last three consumer trends mentioned by A. Angus and G. Westbrook are I can look after myself, loner living and we are ageless. The health reimagined megatrend is the foundation of their development. The boundaries of old age are constantly shifting. People live longer, care about their health, appearance and well-being. They continue to develop themselves even when they are 70 years old. Consumers following the 'I can look after myself' trend are focused on the prevention of diseases, obesity and everyday stress, shifting the boundary of old age further and further. These consumers use the advice of specialists in physical and mental health, applications that show them a healthy diet and products prepared especially for them. They want to feel special and self-
26 B. Mróz: Konsument …, op. cit., p. 163.

139
sufficient. These consumers often also consciously reject marriage and even intercourse. They redefine lonely life into a lonely life that has been chosen. Reaching the age of 50+ years, they want to continue to enjoy the same things as their younger friends from the Z generation. They want products that will help them to keep their youthful body and spirit. They are often obsessed with new technologies, following the latest apps and smart devices. They do not think "we are old" about themselves, they think "we are ageless", "we are forever young!". Connecting the megatrends and consumer trends which have been presented to the food and drink market, of which the coffee market is a part, attention should be paid primarily to six trends introduced by Döhler Market Intelligence (Table 1). The first of these is the naturalness and sustainability trend, which results from the development of health reimagined and resourceful planet megatrends and the related consumer trends. A growing need to return to what is natural and simple has been noticeable on the food and beverage market for a long time. Consumers expect full transparency of what they are being offered for consumption. They appreciate products based on the clean & clear label formula, which means that the list of ingredients of products should be getting shorter and the information should be given in the most transparent way possible27. A contemporary consumer is an inquiring person who asks about the origin of the purchased product, its composition, production methods and, finally, the social responsibility of the producer28.
There are also more and more consumers who treat food as a long-term investment in health and a youthful appearance. Nowadays, in almost every category of the food industry, new products can be found whose creators have focused on strengthening health-promoting properties. Therefore, the second trend which will have a strong impact on consumer behaviour on the food and beverage market, is the health and nutrition trend. Consumers expect food producers to implement the free from formula, i.e. elimination of unwanted ingredients from the recipe, such as sugar, gluten or lactose, or the addition of commonly expected ingredients such as vitamins, minerals, protein, plant extracts and superfoods.
The next indicated trend is the experience multisensory trend, having its genesis in the digital future megatrend. Consumers will increasingly pay attention to the special role of the sense of taste, smell or sight in the perception of the sensory quality of food products. Consumers want to experience food products with all their senses. Producers of food and drinks should look for innovation not only in terms of flavour, but also in the area of the product formula itself. Multisensory experiences cannot be achieved with one component. It is a combination of aroma, colour and texture. Consumers expect new products that use the combinations of various textures of ingredients, e.g. crunchy with creamy, or crunchy with liquidy.
Digitalisation also has a direct effect on the development of the food and drink market. In the era of the growing popularity of social media, the consumer co-creates the brand, which is why producers and sellers must skillfully use the available digital tools 27 E. Dimara, D. Skuras: Consumer demand for informative labeling of quality food and drink products: a European Union case study, Journal of Consumer Marketing 22(2)/2005, p.90-100, https://doi.org/10.1108/07363760510589253. 28 E. Papista, P. Chrysochou, A. Krystallis, S. Dimitriadis: Types of value and cost in consumer – green brands relationship and loyalty behaviour. Journal Consumer Behaviour 17/2018, p.101–113.

140
in order to build and strengthen relationships with consumers. Consumers are becoming more and more comfort-loving and more focused on themselves and their needs. This situation is reflected in the last two trends - convenience and individualisation, whose beginnings can be found in the health reimagined megatrend and the I can look after myself, conscious consumers and I want it now! consumer trends. The contemporary consumer expects a convenient offer in the form of products fast and easy to prepare, and at the same time healthy, unique and tailored to individual needs. Mass production is losing interest. Today, everyone can easily find the "tailor-made", unique offer. What the consumer is looking for reflects his/her personality and lifestyle. Therefore, it should not be surprising that there will be an avalanche increase in consumer interest in craft beer or various craft products.
Consumers following the trends presented can also be seen on the coffee market. Consumers expect coffee that is easy to prepare, even ready for immediate consumption, high quality and yet affordable. Coffee which will stimulate you, but also improve the time spent at work or with friends. Coffee which entertains with its unusual combinations and intrigues with its original technological solutions29. Finally, coffee which improves the health condition of the person, and whose whole process of production and preparation takes place in accordance with the principles of sustainable development30. The actions of coffee producers and sellers responding to these expectations take the form of product trends.
The first thing to mention here is the very dynamic development of craft coffee and ready to drink coffee (RTD coffee) (Table 1.) Big coffee makers, but also chain coffee shops, invest in very good quality "craft" coffee. Their goal is to reach the more snobbish younger generation Y, who wants to stand out from other consumers (individualisation). According to J. Forsyth, craft coffees are currently enjoying the largest sales in the USA, but within the next few years this trend will spread all over the world. The RTD coffee trend meets the consumer trends such as convenience and multisensory experience, and even the health and nutrition trend. Coffee is becoming sparkling and fruity, coffee is filled with soluble grains, coffee is made with brain octane oil and butter from grass-fed cows, free from toxins. The RTD coffee trend coincides with the "The ice age is coming" trend.
Research by the Mintel Group proves that global investments in chilled coffee ready for consumption has recorded annual increases. Coffee producers want to reach younger consumers who like the taste, refreshment and pleasure of this version of coffee. Cold-brewed coffee helps to give the premium status to the ready-to-eat category, which is quickly growing. The premium status is also important for people who follow the "convenient formats go premium" trend. Consumers of coffee want convenience, but at the same time require good quality. These expectations create the possibility of giving premium status to such concepts as instant coffee, coffee capsules and ready-to-consume drinks.
29 S. Mokrysz: Consumer preferences and behaviour on the coffee market in Poland. Forum Scientiae Oeconomia, 4(4)/2016, p. 98-106; G. Maciejewski, S. Mokrysz, Ł. Wróblewski: Preferencje konsumentów wobec marek kaw dostępnych na polskim rynku – analiza porównawcza, Marketing i Rynek 4/2018, pp. 35-38. 30 G. Maciejewski, S. Mokrysz, Ł. Wróblewski: Segmentation of coffee consumers using sustainable values: Cluster analysis on the polish coffee market. Sustainability 11(3, 613)/2019, pp. 11-16; https://doi.org/ 10.3390/su1103 0613.
141
On the other hand, for coffee consumers who want a change, to have fun and new experiences, coffee makers propose co-branding to dial up indulgence. An example of this is the latte macchiato with a cream liqueur flavour of Tassimo and Bailey's. This product combines the taste of espresso, non-alcoholic cream liqueur and creamy foam.
More and more consumers are paying attention to health issues and are increasingly looking for coffee that provides health benefits31. This situation creates the possibility of developing the super coffee trend. For consumers following this trend, organic coffees, caffeine-free coffees, as well as coffee with health-enhancing additives such as proteins, vitamins, chia seeds and coconut oil are being developed32. According to research by the Mintel Group, this trend is expected to spread rapidly over the next two years.
Consumer trends of digitalisation, convenience and I want it now! Are converging into the response in the form of "The world of smart vending machines" trend. Over the next five years, it will become the norm to order coffee from vending machines equipped with the "face recognition" function, which can personalise orders. Robots will also replace baristas, all to improve cohesion, reduce costs and shorten waiting times.
The situation on the coffee market is very dynamic and just as some trends will spread, others will weaken or migrate. An example of a migrating trend is coffee capsules (single-serve coffee). The market in the US and western European countries has already been saturated with this type of coffee, but over the next years it has a good chance of spreading to Asia, in particular in China and South Korea.
Conclusion Consumer behaviour, in addition to internal determinants, is influenced by numerous external determinants, including megatrends, consumer trends and product trends. The latter ones are the producers' and sellers' response to the changing needs and preferences of consumers. The situation is not different in the coffee market, which is part of a larger food and drink market. Analysing the collected source materials, it can be assumed that, among consumer trends, the ones with the most impact on consumer behaviour on the coffee market will be naturalness and sustainability, health and nutrition as well as multisensory experience and convenience. Digitalisation and individualisation will also be important.
Coffee producers and sellers who want to maintain or strengthen their competitive advantage have to meet these trends – what is more, they have to become active market creators themselves. The response of the supply side to the reported consumer needs will include the development of craft coffees, ready-to-consume hot and cold brewed coffees, coffees that are convenient to prepare and at the same time have a high quality, coffees that improve the health condition of a person, surprise us with new flavours and ingredients used. These trends will gain strength in the near future, i.e. 2021-2024.
31 W.S. Sepúlveda, L. Chekmam, M.T. Maza, N.O. Mancilla: Consumers’ preference for the origin and quality attributes associated with production of specialty coffees: Results from a cross-cultural study. Food Research International 89/2016, p. 997–1003. 32 V. Kumar, J. Kaur, A. Panghal, S. Kaur, V. Handa: Caffeine: a boon or bane. Nutrition & Food Science 48(1)/2018, p.61-75, https://doi.org/10.1108/NFS-05-2017-0100.
142
References Angus A., Westbrook G: Top 10 global consumer trends 2019, Euromonitor International, London 2018 Borodako K.: Foresight w zarządzaniu strategicznym, C.H. Beck, Warszawa 2009 de Meyer F.: The impact of megatrends on western governments, Institute for Future Insights, Available online: https://www.slideshare.net/fdemeyer/the-impact-of-megatrends-on-western-governments, (accessed on 21 February 2019) Dimara E., Skuras D.: Consumer demand for informative labeling of quality food and drink products: a European Union case study, Journal of Consumer Marketing 22(2)/2005, https://doi.org/10.1108/07363760510589253 Dybka S.: Trendy w zachowaniach konsumentów jako czynnik determinujący rozwój przedsiębiorstw, Studia Ekonomiczne. Zeszyty Naukowe Uniwersytetu Ekonomicznego w Katowicach 338/2017 Gonzalez-Perez M.A., Gutierrez-Viana s.: Cooperation in coffee markets: The case of Vietnam and Colombia, Journal of Agribusiness in Developing and Emerging Economies 2012/ 2(1) Hajkowicz S., Moody J.: Our future world. An analysis of global trends, shocks and scenarios, CSIRO, Canberra 2010 Harrison D.: Ten global consumer trends in 2011, Strategic Direction 27(10)/2011, https://doi.org/10.1108/sd.2011.05627jaa.010 Kotler Ph., Armstrong G., Saunders J., Wong V.: Marketing. Podręcznik europejski, PWE, Warszawa 2002 Kotler Ph.: Marketing, Dom Wydawniczy Rebis, Poznań 2005 Kumar V., Kaur J., Panghal A., Kaur S., Handa V.: Caffeine: a boon or bane, Nutrition & Food Science 48(1)/2018, https://doi.org/10.1108/NFS-05-2017-0100 Maciaszczyk M.: Wybrane megatrendy i ich możliwy wpływ na konsumentów niepełnosprawnych ruchowo, Handel Wewnętrzny, 5(364)/2016 Maciejewski G., Mokrysz S., Wróblewski Ł.: Preferencje konsumentów wobec marek kaw dostępnych na polskim rynku – analiza porównawcza, Marketing i Rynek 4/2018 Maciejewski G., Mokrysz S., Wróblewski Ł: Segmentation of coffee consumers using sustainable values: Cluster analysis on the polish coffee market. Sustainability 11(3, 613)/2019, https://doi.org/10.3390/su1103 0613 Maciejewski G.: The Contemporary Consumer in the Face of Megatrends in Consumption [in:] Olejniczuk-Merta A. (ed.): The Transformation of Consumption and Consumer Behaviour, IBRKK, Warszawa 2012 Marek S., Białasiewicz M. (ed.): Podstawy nauki o organizacji. Przedsiębiorstwo jako organizacja gospodarcza, PWE, Warszawa 2011 Megatrends 2015. Making sense of a world in motion. EYGM Limited 2015 Mokrysz S.: Consumer preferences and behaviour on the coffee market in Poland, Forum Scientiae Oeconomia, 4(4)/2016 Mróz B.: Konsument w globalnej gospodarce. Trzy perspektywy, Oficyna Wydawnicza SGH, Warszawa 2013 Mruk H.: Makrotrendy a zachowania konsumentów [in:] Kędzior Z. (ed.): Konsument. Gospodarstwo domowe. Rynek, CBiE Akademii Ekonomicznej w Katowicach, Katowice 2007 New megatrends will transform the human experience and reshape markets, societies and the global order. EY, Press release, 11 June 2018. Available online: https://www.ey.com/en_gl/news/2018/06/new-megatrends-will-transform-the-human-experience-and-reshape,(accessed on 21 February 2019). Papista E., Chrysochou P., Krystallis A., Dimitriadis S.: Types of value and cost in consumer – green brands relationship and loyalty behaviour, Journal Consumer Behaviour 17/2018

143
Penn M.J., Kinney Zalesne E.: Mikrotrendy. Małe siły, które niosą wielkie zmiany, MT Biznes, Warszawa Pieriegud J.: Wykorzystanie megatrendów do analizy przyszłościowego rozwoju sektorów gospodarki [in:] Gajewski J., Paprocki W., Pieriegud J., Megatrendy i ich wpływ na rozwój sektorów infrastrukturalnych, Instytut Badań nad Gospodarką Rynkową – Gdańska Akademia Bankowa, Gdańsk 2015 Raymond M.: The Trend Forecaster`s Handbook, Laurence King Publishing, London 2014 Sepúlveda W.S., Chekmam L., Maza M.T., Mancilla N.O.: Consumers’ preference for the origin and quality attributes associated with production of specialty coffees: Results from a cross-cultural study, Food Research International 89/2016 Shaw F.: Uncertainty and the New Consumer, Foresight 4/2009 Tkaczyk J.: Konsumpcja i konsument – nowe trendy. Handel Wewnętrzny, May - June 2012 Vejlgaard H.: Anatomy of trend, McGraw-Hill, New York 2008 Zalega T.: New consumer trends [in:] Burchard-Dziubińska M. (ed.), Towards a green economy. From ideas to practice, Wydawnictwo Uniwersytetu Łódzkiego, Łódź 2015 Zalega T.: Nowe trendy i makrotrendy w zachowaniach konsumenckich gospodarstw domowych w XXI wieku, Konsumpcja i Rozwój 2(5)/2013 Zmyślony P., Niezgoda A.: Popyt turystyczny. Uwarunkowania i perspektywy rozwoju. Wydawnictwo Akademii Ekonomicznej, Poznań 2003
Nowe trendy w konsumpcji na rynku kawy
Streszczenie Celem artykułu jest przybliżenie trendów w konsumpcji, które oddziaływają obecnie lub będą oddziaływać w perspektywie 2-5 lat na zachowania konsumentów kawy. Artykuł ma charakter teoretycznych rozważań wspartych analizą materiałów źródłowych. Przedstawione w nim zostały główne megatrendy, trendy konsumenckie oraz trendy produktowe obserwowane na rynku kawy. Opisano w nim także relacje zachodzące między wymienionymi zjawiskami a zachowaniami konsumentów. Przeprowadzona analiza zgromadzonych danych pozwoliła stwierdzić, że główne trendy determinujące zachowania konsumentów to naturalność i zrównoważony rozwój, zdrowie i zdrowe odżywianie, wielozmysłowe doświadczenia, wygoda, digitalizacja oraz indywidualizacja. Producenci i sprzedawcy kawy wychodząc naprzeciw tym trendom, będą również chcieli sami uzyskać wpływ na wybory i preferencje konsumentów kawy wspierając i rozwijając takie trendy produktowe jak: czas kawy rzemieślniczej, epoka lodowcowa – kawy parzone na zimno, kawy gotowe do spożycia, łączenie marek dla większej przyjemności, kawa wygodna w formacie premium, czas super kawy czy świat inteligentnych automatów. Słowa kluczowe: megatrendy, trendy konsumenckie, trendy na rynku żywności i napojów, trendy produktowe, rynek kawy. JEL Codes: D12, E21, M30

144
Information about authors:
Dr hab. Grzegorz Maciejewski, prof. UE University of Economics in Katowice Faculty of Economics. Department of Markets and Consumption ul. 1-go maja 50 40-287 Katowice e-mail: [email protected] ORCID 0000-0002-1318-0747
Mgr Sylwia Mokrysz Mokate SA ul. Katowicka 265 a 43-450 Ustroń e-mail: [email protected]

145
22 (71) 2019 DOI 10.22630/PEFIM.2019.22.71.32
Anna Owczarczyk Siedlce University of Natural Sciences and Humanities
IMPACT OF PENSION SYSTEM REFORMS ON PUBLIC FINANCE EXPENDITURES IN POLAND
The social security system in each country, if it exists, plays a crucial role in supporting
citizens and specific expenditures of the public finance system. Its importance in public spending depends on many factors; in particular, on its source and on its form of financing benefits or pensions. The social security system in Poland is composed of a social insurance and welfare system, a health insurance system, unemployment and family benefits, from which are enumerated an old-age pension, invalidity pension, sickness and maternity insurance, insurance against accidents at work and occupational diseases, and health insurance. The Polish social security system often changes due to implementation of improvements or limits on public spending. The most famous reform took place in 1999 and introduced the largest number of changes in the sphere of pension security. Because the scale of public funds that are passed on to the social security system is very large, pension reforms should are crucial for improving the state of public finances.
The aim of the paper is to present changes that took place in the Polish pension system between 1999 and 2017 and how those changes influenced the amount of public expenditures. The study reviews the research hypothesis: frequent changes in the pension system have a negative impact on the state of Polish public finance. The study covers the years 1999-2017, as well as the previous four years before the implementation of the pension reform. Basic research materials used to conduct the research analysis were reports on implementation of the state budget, data prepared by the Social Insurance Institution and the Agricultural Social Insurance Fund as well as statistical data obtained from the Central Statistical Office. Key words: social security system, reform, public finance, Poland JEL Codes: H55
Introduction The social security system in each country, if it exists, plays a crucial role in supporting citizens and specific expenditures of the public finance system. Its importance in public spending depends on many factors, in particular, on its source and on its form of financing benefits or pensions.
The social security system in Poland is composed of a social insurance and welfare system, a health insurance system, unemployment and family benefits, from which are enumerated an old-age pension, invalidity pension, sickness and maternity insurance, insurance against accidents at work and occupational diseases, and health insurance1. The above-mentioned elements make up the social security system whose point is to guarantee social security. The national government organizes this system into
1 Your Social Security rights in Poland, European Commission 2013 online, available at: http://ec.europa.eu/employment_social/empl_portal/SSRinEU/Your%20social%20security%20rights%20in%20Poland_en.pdf (14.07.2018)

146
specialized institutions that perform specific tasks in their area of expertise. The key purpose of creating a social security system was to create security against all kinds of social risk, such as loss of a job, the added costs of parenthood, or death of the breadwinner.
The Polish social security system often changes, due to implementation of improvements or limits on public spending. The most famous reform took place in 1999 and introduced the largest number of changes in the sphere of pension security. Because the scale of public funds that are passed on to the social security system is very large, pension reforms are crucial for improving the state of public finances.
In 1999, the social insurance pay-as-you-go system was replaced by a notional defined contribution (NDC) system. Insured persons born before January 1, 1949, were still covered under the social insurance pay-as-you-go system. Insured persons born from January 1, 1949, to December 31, 1968, could choose the new NDC system only or the NDC and individual account system for old-age benefits. Until December 31, 2013, membership in the individual account system was mandatory for insured persons born after December 31, 1968. As of February 1, 2014, membership in the individual account system is voluntary for all insured persons2.
The aim of the paper is to present changes that took place in the Polish pension system between the years of 1999 and 2017 and how those changes influenced the condition of public finances. In the study, there will be a review of the research hypothesis that frequently occurring changes in the pension system have a negative impact on the state of Polish public finance. The paper should answer the questions below:
1) How often is the social security system subject to change and what changes does it concern?
2) What was the state expenditure on the Social Insurance Fund (FUS)? 3) What was the direction of state expenditure after introducing changes to the
social security system? 4) In what dimension did the pension reform influence the financial condition of
the social security system, and the state of public finance? The study covered the years 1999-2017, and the basic research materials that were
used to conduct research analysis were reports on the implementation of the state budget, data prepared by the Social Insurance Institution (ZUS), as well as statistical data obtained from the Central Statistical Office. Some analysis was made by MA Magdalena Gromek in an unpublished thesis “Changes in the social insurance system and their influence on the management of public finance” (“Zmiany w systemie ubezpieczeń społecznych i ich wpływ na zarządzanie finansami publicznymi” [Siedlce University of Natural Sciences and Humanities, under direction od dr Anna Świrska].)
Research results and discussion Social security systems appeared in Europe in the 19th century. Up until that time, different institutions and organizations took care of citizens among which can be
2 online, available at: https://www.ssa.gov/policy/docs/progdesc/ssptw/2016-2017/europe/poland.pdf (access: 14.07.2018

147
enumerated for example, communes, gilds, and churches3. Currently, almost each state and society has its own regulations and (mostly) public organization which delivers social security to citizens. The social security system is a major pillar of the modern economy. Its role is to satisfy the basic needs of the members of a society and guarantee some standards of living. Due to economic and social changes such as aging of societies, changes in the economy (maintaining high unemployment and small GDP growth), changes in society and politics, growing individualism, changes in family life, and a growing mobility of employees and employers, the social security system needs reforms and adjustments to the current economy4.
The most discussable part of the social security system is the part concerning pension insurance. It consists of putting aside financial surpluses that appear during the period of intense work for such a time when there are generally financial shortages, more specifically for the period of old age. The purpose of this insurance is to provide people who are retired the standard of living similar to that which they achieved during their period of professional activity. In Europe, which is the precursor of this type of security, there are different functioning models of pension systems. In most EU countries, the core of the pension system is based on the statutory earnings related to old-age pension schemes. The public pension system often provides also a minimum-guaranteed pension to those who do not qualify for the earnings-related scheme or have accrued only a small earnings-related pension. Minimum guarantee pensions are usually means-tested and are provided either by a specific minimum pension scheme or through a general social assistance scheme. For example, in Denmark, the Netherlands and Ireland, the public pension system provides in the first instance a flat-rate pension, which can be supplemented by earnings related to private occupational pension schemes5.
There can be enumerated three types of financing pension security systems: - Pay-as-you-go, - Private (capital), - Combination of pay-as-you-go and private. Nearly all Western European countries have implemented the system called pay-as-
you-go (PAYG) based on compulsory insurance, which is an intergenerational agreement. Benefits are paid out of contributions from current workers who, after reaching retirement age, will receive money from the next generation. In most countries, minimum guarantee pensions are covered by general taxes. Earnings-related schemes are often subsidized by the state budget.
Occupational and private pension schemes are introduced as well. Here, the future pension benefits can be related either to the salary and career length (defined-benefit system) or to paid contributions (defined-contribution system) 6.
3 Adamiak S., Chojnacka E., Walczak D., Social Security in Poland – Cultural, Historical and Economical Issue. Copernican Journal of Finance & Accounting. volume 2. issue 2, 2013, p.12 4 Grzebieniak A., Polski system ubezpieczeń społecznych – zalety i wady, Studia Gdańskie, t. IV, 2007, online, available at: http://www.studiagdanskie.gwsh.gda.pl/pdfy/studia4-7.pdf (access: 14.07.2018) 5 online, available at: http://ec.europa.eu/economy_finance/publications/pages/publication16034_en.pdf (access: 14.07.2018) 6 online, available at: http://ec.europa.eu/economy_finance/publications/pages/publication 16034_en.pdf (access: 14.07.2018)

148
The Polish pension system is a kind of combination of both PAYG and private, and its basic postulation is presented below.
The Polish PAYG system is strictly connected with public institutions responsible for the social security system, i.e. the Social Insurance Institution (ZUS) and the Agricultural Social Insurance Fund (KRUS which services farmers). The system functions correctly when the number of insured who pay contributions is significantly greater than the number of beneficiaries. When contributions are insufficient to pay benefits, the deficient amount is supplemented by subsidies from the state budget, thus it affects the amount of state expenditures. Due to the fact that the pay-as-you-go system is "sensitive" to demographic problems, and due to the increasing amounts that are transferred from the state budget to the system every year, changes and reforms are implemented. The basic purpose of these changes is to reduce the growth rate of amounts coming from the state budget.
Figure 1. Current Polish pension system Source: https://emerytura.pzu.pl/abc-emerytury (access: 14.07.2018).
The private system is related to both the second and third pillar. It consists of the fact that paid contributions are not earmarked for the current pensioners, but are invested and serve to finance future benefits for the insured who paid them. In the capital system, the employee throughout his professional activity postpones contributions that are invested in interest-bearing bank accounts. After retirement, the employee may have all capital together with interest or only monthly benefits from interest on capital, paid out for life. After death, capital may be inherited by the employee's family. As can be seen in
POLISH PENSION SYSTEM
So
cial
Insu
ranc
e In
stitu
tion
Ope
n Pe
nsio
n Fu
nds
+
sub-
acco
unt S
ocia
l Ins
uran
ce
Inst
itutio
n
- em
ploy
ee p
ensi
on sc
hem
es
-indi
vidu
al re
tirem
ent a
ccou
nts
-indi
vidu
al p
ensi
on se
curit
y ac
coun
ts
I PILLAR II PILLAR III PILLAR
OBLIGATORY MIXED: FACULTATIVE
+ OBLIGATORY
FACULTATIVE
PAYG

149
the chart, there is also some PAYG element to the second pillar. Although the employee decides on an Open Pension Fund (OFE), he is still obligated to transfer some contributions to the Social Insurance Institution. This is why the Polish pension system is often described as a mixed system.
The scale of public funds transferred from the state budget to the Insurance Institution is relatively significant if we compare the public expenditures to the deficit. Therefore, any changes introduced to the rules regarding the functioning of social insurance, to some extent are reflected in the amount of state expenditure, and sometimes in the size of the deficit or public debt.
The pension system had become a serious social and economic problem even before the political transformation. The legal act regulating pensions, passed in December 1982, was changed during the years 1983-1989 up to twelve times. Those changes were implemented by a trial and error method: increasing old pensions and later – newer ones, and everything depended on what effects the previous changes brought. These changes in the pension system carried out in the 1980's led to huge chaos: there were no proportions of benefits granted in different periods7.
The regulations of the pension security system that were in force until 1998 were subject to constant criticism. It was believed that this system was unfair and expensive. It was predicted that after a dozen or so years a financial collapse would occur. According to available sources, it can be concluded that one of the main disadvantages of the previous system was a number of incentives for early retirement and pension privileges for various professional groups.
In order to repair the social insurance system in force at that time, the Act of 13 October 1998 on the social insurance system and the Act of 17 December 1998 on pensions and disability benefits from the Social Insurance Fund were implemented. Thanks to these laws, on January 1, 1999, one of the most important reforms of the social insurance system in Poland took place. However, not all citizens and politicians were enthusiastic about the changes introduced by the reform. The biggest fear was how the introduced reform would affect the state budget, even though one of its tasks was to improve the state's financial situation. The so-called pension reform introduced by the government of Prime Minister Jerzy Buzek consisted of the fact that the existing pay-as-you-go system was replaced by a new mixed-capital pay-as-you-go system. In order to introduce the new system, universal pension companies were established to manage open pension funds. However, the changes introduced in 1999 did not take into account all citizens. Persons who in the year of the reform's implementation had not yet reached 30 years of age had to submit to the new system, which in turn was associated with obligatory access to pension funds. A second group of citizens between 30 and 50 years of age could choose whether to join the new system or whether they would prefer to remain in the old social security system. The last group of people, aged over 50, had no choice but to remain in the old system. The year 1999 was the beginning of the evolution that took place in the pension security system in the following years. Table 1 contains a summary of all significant changes that were introduced in years 1999-2017.
7 Wiktorow A. Polski system emerytalny po zmianie ustrojowej (1989–2014) Ubezpieczenia społeczne. Teoria i praktyka. Nr 6 (123) ZUS Warszawa 2014, pp. 4-12

150
All shown in Table 1, changes were introduced in order to improve the functioning of the current social security system, as well as to improve public finances and the financial condition of the Polish pension system; however, as statistics reveal, the effectiveness of these changes is not satisfactory. Regarding the social security system as an element of the public finance system, it is the largest expense item of the state budget each year, nearly 22% of total expenditures. All these expenses are subsidies to cover the deficit in ZUS and KRUS, and subsidies to cover pensions of soldiers, judges, prosecutors and police officers who are not in the general pension system (about 20 billion PLN)8. Table 1. Changes in the Polish pension system (1999-2017) Year Change Description 1999 Social security
system reform This marks the beginning of the evolution of the entire social security system. The current system was transformed and four funds were separated out within it: pension, sickness, disability benefit and accident insurance. The entire pension system was divided into a pay-as-you-go system and a capital system. Established Open Pension Funds (OFE) were managed by the Universal Pension Society (PTE). With the creation of the OFE, part of the pension contribution was transferred to the Universal Pension Society account. The reform also introduced provisions on the functioning of employee pension programs.
2000 Attempt to increase the attractiveness of employee pension programs
Due to the Act of March 2, 2000 amending the Act on Employee Pension Programs and certain other acts, financing of the basic contribution was changed; previously it was paid from the employee's salary, but since 2000 it began to be financed by the employer.
2003 Changes regarding uniform services
Uniform services were excluded from the general system and returned to the supply system.
2004 Changes in OPF functioning
The Act of August 27, 2003 amending the Act on the Organization and Operation of Pension Funds and certain other acts initiated a number of changes, such as changes in provisions concerning fees, the possibility of differentiation of fees due to the membership period being annulled or expired. Another change concerned the benefits collected by PTE on OFE assets. The act on individual retirement accounts also became applicable. The implementation of this law aimed to increase incentives for voluntary savings.
2005 Benefits for miners Introduction of privileges for miners: they pay contributions as a society within the general system; however, their pension is not linked to the amount of contributions.
2009 Creation of “bridging” pensions
It allowed for paying a pension to people working in special conditions that end their professional activity before reaching the effective retirement age.
2011 Changes regarding OFE
Lowering the amount of premiums to OFE from 7.3% to 2.3%.
2012 Changes in retirement age
Starting from January 2013, the retirement age was planned to be systematically increased by 1 month for every 4 months until the age of 67 for both women and men was reached.
2014 Further changes regarding OFE
Transferring 51.5% of OFE assets to a sub-account in ZUS (sub-accounts were introduced in May 2011), changes in the investment profile of OFE, liquidation of the minimum rate of return and reducing fees.
2017 Changes in the general pension system
Retirement age was lowered for women to 60, for men to 65. Changes in the amount of pensions: raising the minimum pension amount and valorizations.
Source: Author’s own study on the basis of M. Gromek thesis and available Internet sources. 8 online, available at: http://www.rp.pl/Budzet-i-Podatki/301139902-Budzet-2017-Co-piata-zlotowke-budzet-wyda-na-doplaty-do-emerytur.html (access: 14.07.2018)

151
In order to analyse the influence of pension system reforms on state expenditures, it is worth presenting transfers from the state budget to the Social Insurance Fund (FUS), which is the state special purpose fund established on 1 January 1999. The Fund is administered by the Social Insurance Institution. Incomes of the Social Insurance Fund come from9:
• social insurance contributions not subject to transfer to Open Pension Funds, • funds compensating contribution amounts transferred to Open Pension Funds, • payments from the State Budget and other institutions, intended for benefits
that ZUS has been commissioned to pay, with the exception of benefits financed under other budgetary chapters and payments from foreign institutions,
• interest on the FUS bank account, • a state budget subsidy, • resources of the Demographic Reserve Fund, • payments from Open Pension Funds as a result of the insured person reaching
an age lower by 10 years than the statutory retirement age. The FUS budget is in permanent deficit, regarding the difference between the
amount of social insurance contributions and the total expenditures of this institution. Thus, the state budget subsidy can be treated as a “lifebuoy”. On the one hand, it is additional income of FUS, but on the other – it is a great expenditure of the state budget; thus it should be analysed both as an aspect of FUS budget and an element of state budget.
Table 2 allows for an analysis of the budget of the Social Insurance Fund and the role of the subsidy in the financial condition of this institution.
During the years 1999 to 2017, the amount of collected contributions was not high enough to cover all FUS expenses. The sufficiency of social insurance contributions ranges from 68-79%. Each year finished with a high deficit, which in a free market economy would lead to bankruptcy of the enterprise. Due to the element of state interventionism and subsidy transferred to the FUS account, the FUS deficit could be reduced. Four times (in 2004, 2006, 2007, and 2017) even a surplus was noticeable. A very high surplus in 2017 was caused not only by a high subsidy from the state budget, but also by a cancelling of the nearly 39.15 billion PLN loan which the state budget gave to the Social Insurance Fund in 2009-2014.
The data presented above in Table 2 show that the FUS financial condition was not positive and it was characterized by a deficit in almost every year throughout the analysed period. Although the amounts of subsidy from the state budget fluctuated, it showed an upward tendency in general. Despite high subsidies from the state budget, the Social Insurance Fund was unable to cover all current expenses.
The main reforms introduced during the years 1999 – 2017 did not positively affect the financial situation of the Social Insurance Fund.
9 Online, available at: Social Security in Poland 2016.pdf https://www.zus.pl/documents/10182/167615/Social+Security+in+Poland/71ffe1b1-c142-48fa-a67b-0c7e1cec6eb6 (access: 14.07.2018)
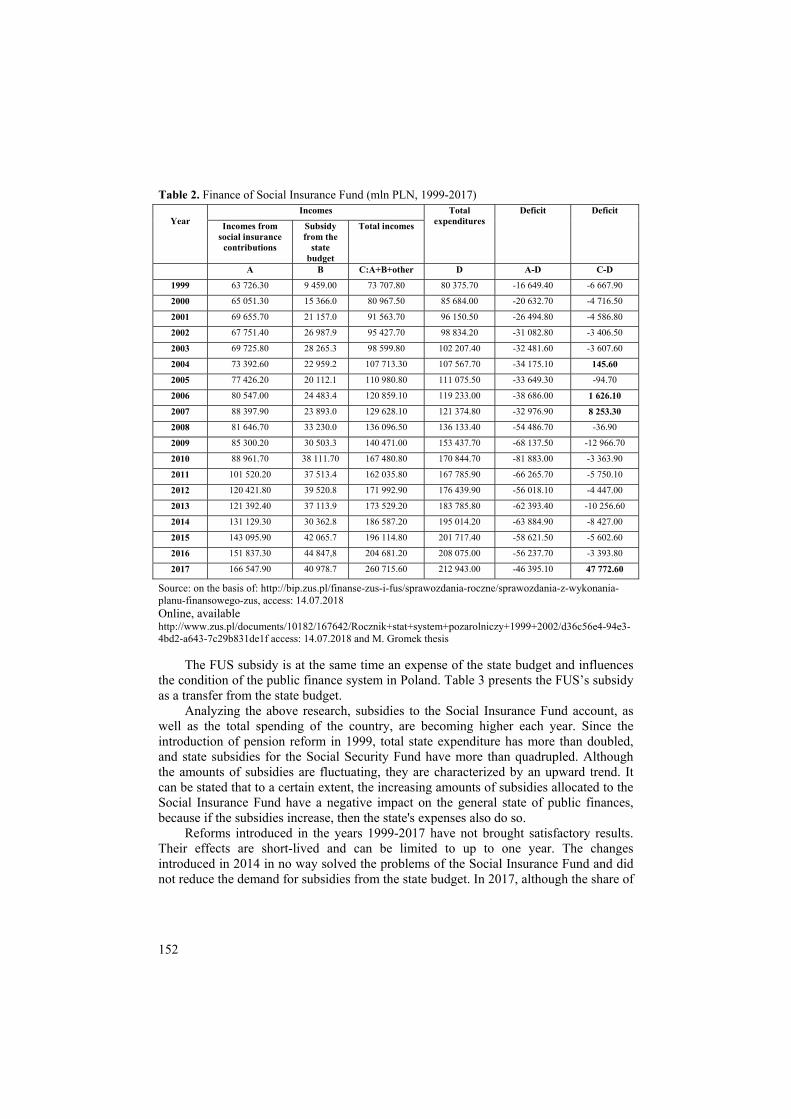
152
Table 2. Finance of Social Insurance Fund (mln PLN, 1999-2017)
Year Incomes Total
expenditures Deficit Deficit
Incomes from social insurance
contributions
Subsidy from the
state budget
Total incomes
A B C:A+B+other D A-D C-D
1999 63 726.30 9 459.00 73 707.80 80 375.70 -16 649.40 -6 667.90
2000 65 051.30 15 366.0 80 967.50 85 684.00 -20 632.70 -4 716.50
2001 69 655.70 21 157.0 91 563.70 96 150.50 -26 494.80 -4 586.80
2002 67 751.40 26 987.9 95 427.70 98 834.20 -31 082.80 -3 406.50
2003 69 725.80 28 265.3 98 599.80 102 207.40 -32 481.60 -3 607.60
2004 73 392.60 22 959.2 107 713.30 107 567.70 -34 175.10 145.60
2005 77 426.20 20 112.1 110 980.80 111 075.50 -33 649.30 -94.70
2006 80 547.00 24 483.4 120 859.10 119 233.00 -38 686.00 1 626.10
2007 88 397.90 23 893.0 129 628.10 121 374.80 -32 976.90 8 253.30
2008 81 646.70 33 230.0 136 096.50 136 133.40 -54 486.70 -36.90
2009 85 300.20 30 503.3 140 471.00 153 437.70 -68 137.50 -12 966.70
2010 88 961.70 38 111.70 167 480.80 170 844.70 -81 883.00 -3 363.90
2011 101 520.20 37 513.4 162 035.80 167 785.90 -66 265.70 -5 750.10
2012 120 421.80 39 520.8 171 992.90 176 439.90 -56 018.10 -4 447.00
2013 121 392.40 37 113.9 173 529.20 183 785.80 -62 393.40 -10 256.60
2014 131 129.30 30 362.8 186 587.20 195 014.20 -63 884.90 -8 427.00
2015 143 095.90 42 065.7 196 114.80 201 717.40 -58 621.50 -5 602.60
2016 151 837.30 44 847,8 204 681.20 208 075.00 -56 237.70 -3 393.80
2017 166 547.90 40 978.7 260 715.60 212 943.00 -46 395.10 47 772.60
Source: on the basis of: http://bip.zus.pl/finanse-zus-i-fus/sprawozdania-roczne/sprawozdania-z-wykonania-planu-finansowego-zus, access: 14.07.2018 Online, available http://www.zus.pl/documents/10182/167642/Rocznik+stat+system+pozarolniczy+1999+2002/d36c56e4-94e3-4bd2-a643-7c29b831de1f access: 14.07.2018 and M. Gromek thesis
The FUS subsidy is at the same time an expense of the state budget and influences the condition of the public finance system in Poland. Table 3 presents the FUS’s subsidy as a transfer from the state budget.
Analyzing the above research, subsidies to the Social Insurance Fund account, as well as the total spending of the country, are becoming higher each year. Since the introduction of pension reform in 1999, total state expenditure has more than doubled, and state subsidies for the Social Security Fund have more than quadrupled. Although the amounts of subsidies are fluctuating, they are characterized by an upward trend. It can be stated that to a certain extent, the increasing amounts of subsidies allocated to the Social Insurance Fund have a negative impact on the general state of public finances, because if the subsidies increase, then the state's expenses also do so.
Reforms introduced in the years 1999-2017 have not brought satisfactory results. Their effects are short-lived and can be limited to up to one year. The changes introduced in 2014 in no way solved the problems of the Social Insurance Fund and did not reduce the demand for subsidies from the state budget. In 2017, although the share of

153
public subsidies decreased, it should be recalled that the budget "lost" the amount of 40 mln PLN, because it redeemed the FUS loan.
Summing up, all changes introduced in the functioning of the entire social security system result in ever-increasing financial requirements on the system, which in turn have a negative impact on the overall state of public finances. Table 3. The share of transferred subsidy in total state expenditures (1999-2017)
Year Subsidy from the state State expenditures Share mln PLN bln PLN %
1999 9 459.0 138 401.2 6.8 2000 15 366.0 151 054.9 10.2 2001 21 157.0 172 885.2 12.2 2002 26 987.9 182 922.4 14.8 2003 28 265.3 189 153.6 14.9 2004 22 959.2 197 698.3 11.6 2005 20 112.1 208 132.9 9.7 2006 24 483.4 222 702.9 10.9 2007 23 893.0 252 323.9 9.5 2008 33 230.0 277 893.5 11.9 2009 30 503.3 298 028.5 6.9 2010 38111.7 294 893.9 12.9 2011 37 513.4 302 681.6 12.4 2012 39 520.8 318 001.9 12.4 2013 37 113.9 321 345.3 11.5 2014 30 362.8 312 519.5 9.7 2015 42 065.7 331 743.4 12.7 2016 44 847.8 360 843.1 12.4 2017 40 978.7 375 768.5 10.9
Source: Author’s own study on the basis of https://www.mf.gov.pl/ministerstwo-finansow/dzialalnosc/finanse-publiczne/budzet-panstwa/wykonanie-budzetu-panstwa and http://bip.zus.pl/finanse-zus-i-fus/sprawozdania-roczne/sprawozdania-z-wykonania-planu-finansowego-zus, access: 14.07.2018 http://www.zus.pl/documents/10182/167642/Rocznik+stat+system+pozarolniczy+1999+2002/d36c56e4-94e3-4bd2-a643-7c29b831de1f access: 14.07.2018 and M.Gromek thesis
Conclusions and implications The Polish social security system underwent a great transformation in 1999. The key change that resulted from the reform was replacing the system with a defined benefit with a defined contribution system in the first pillar and applying the principle of a defined contribution also in the second pillar of the new system10. Since the implementation of the above-mentioned reform, numerous changes have been made to the pension system which were aimed at improving the financial status of the social insurance and public finance spending. Unfortunately, changes introduced to improve
10 L. Oręziak, OFE katastrofa prywatyzacji emerytur w Polsce. Instytut Wydawniczy Książka i Prasa, Warszawa, 2014, p. 200

154
the current situation have not always been positively reflected in the finances of the social security system and the state budget.
On the basis of the conducted research it can be said that: • frequently introduced changes have not positively impacted the condition of
state expenditures, as the subsidies for the Social Insurance Fund and the total spending of the country are becoming higher each year in the analysed period; the consequence of such an allocation of public finance is the still increasing budget deficit.
• change in the year 2017 seems to be a merely political answer for the reform of 2012 and may cause a considerable growth in state expenses in the near future,
• such frequent changes cause confusion within society and may raise problems with the calculation of future pension for current employees,
• the character of introduced reforms (especially those of 1999, 2011, 2014) demands careful data collection of the contributions paid to ZUS, the OFE, or to both ZUS and the OFE. What is more, such frequent changes demand employees keep up with all legal acts that refer to the social security system in order to be aware of a proper calculation of their pensions. That is time consuming and makes unnecessary activity for ordinary people.
References Adamiak S., Chojnacka E., Walczak D., Social Security in Poland – Cultural, Historical and Economical Issue. Copernican Journal of Finance & Accounting. volume 2. issue 2, 2013 Gromek M., Zmiany w systemie ubezpieczeń społecznych i ich wpływ na zarządzanie finansami publicznymi, unpublished master thesis 2017, under direction: dr Anna Świrska, Siedlce University of Natural Sciences and Humanities Grzebieniak A., Polski system ubezpieczeń społecznych – zalety i wady, Studia Gdańskie, t. IV, 2007, online, available at: http://www.studiagdanskie.gwsh.gda.pl/pdfy/studia4-7.pdf Oręziak L. OFE katastrofa prywatyzacji emerytur w Polsce. Instytut Wydawniczy Książka i Prasa, Warszawa, 2014 Social Security in Poland.pdf 2016 Your Social Security rights in Poland, European Commission. (2013). online, available at: http://ec.europa.eu/employment_social/empl_portal/SSRinEU/Your%20social%20security%20rights%20in%20Poland_en.pdf) (access: 14.07.2018) Wiktorow A. Polski system emerytalny po zmianie ustrojowej (1989–2014) Ubezpieczenia społeczne. Teoria i praktyka. Nr 6 (123) ZUS Warszawa 2014 Web pages: https://www.mf.gov.pl/ministerstwo-finansow/dzialalnosc/finanse-publiczne/budzet-panstwa/wykonanie-budzetu-panstwa (access: 14.07.2018) http://bip.zus.pl/finanse-zus-i-fus/sprawozdania-roczne/sprawozdania-z-wykonania-planu-finansowego-zus (access: 14.07.2018) http://www.zus.pl/documents/10182/167642/Rocznik+stat+system+pozarolniczy+1999+2002/d36c56e4-94e3-4bd2-a643-7c29b831de1f (access: 14.07.2018) http://bip.zus.pl/finanse-zus-i-fus/sprawozdania-roczne/sprawozdania-z-wykonania-planu-finansowego-zus, http://www.zus.pl/documents/10182/167642/Rocznik+stat+system+pozarolniczy+1999+2002/d36c56e4-94e3-4bd2-a643-7c29b831de1f (access: 14.07.2018) http://www.rp.pl/Budzet-i-Podatki/301139902-Budzet-2017-Co-piata-zlotowke-budzet-wyda-na-doplaty-do-emerytur.html (access: 14.07.2018)
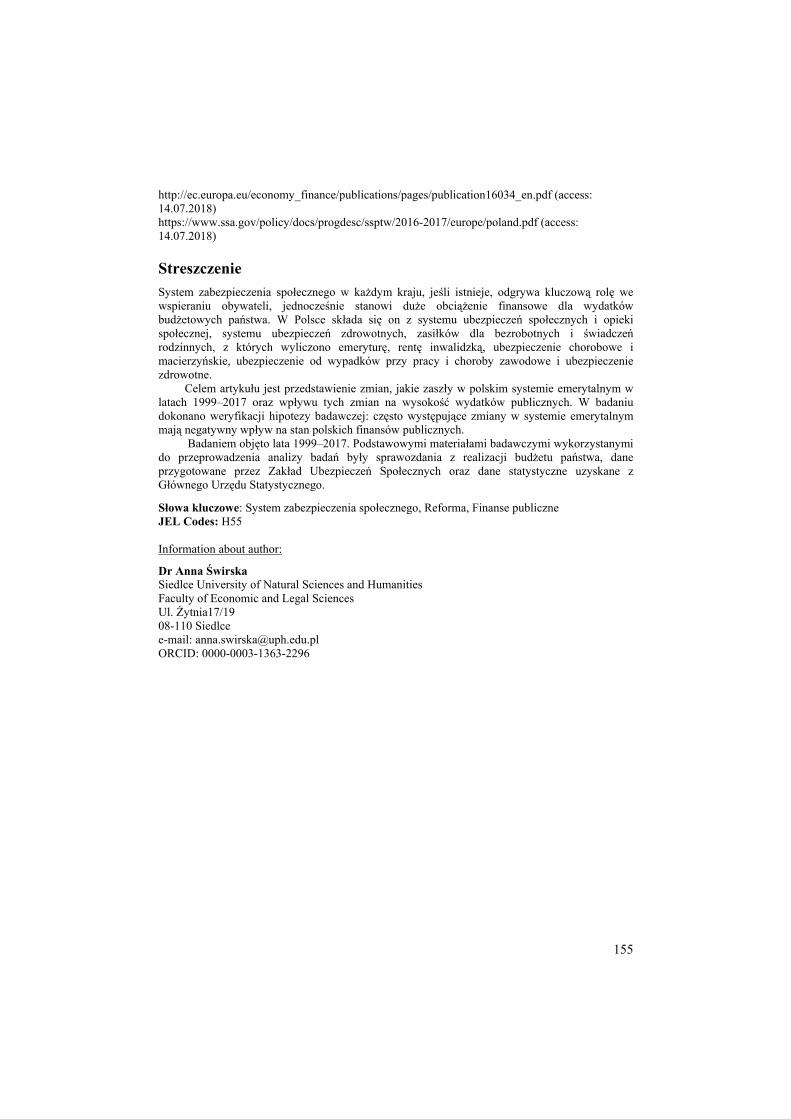
155
http://ec.europa.eu/economy_finance/publications/pages/publication16034_en.pdf (access: 14.07.2018) https://www.ssa.gov/policy/docs/progdesc/ssptw/2016-2017/europe/poland.pdf (access: 14.07.2018)
Streszczenie System zabezpieczenia społecznego w każdym kraju, jeśli istnieje, odgrywa kluczową rolę we wspieraniu obywateli, jednocześnie stanowi duże obciążenie finansowe dla wydatków budżetowych państwa. W Polsce składa się on z systemu ubezpieczeń społecznych i opieki społecznej, systemu ubezpieczeń zdrowotnych, zasiłków dla bezrobotnych i świadczeń rodzinnych, z których wyliczono emeryturę, rentę inwalidzką, ubezpieczenie chorobowe i macierzyńskie, ubezpieczenie od wypadków przy pracy i choroby zawodowe i ubezpieczenie zdrowotne.
Celem artykułu jest przedstawienie zmian, jakie zaszły w polskim systemie emerytalnym w latach 1999–2017 oraz wpływu tych zmian na wysokość wydatków publicznych. W badaniu dokonano weryfikacji hipotezy badawczej: często występujące zmiany w systemie emerytalnym mają negatywny wpływ na stan polskich finansów publicznych.
Badaniem objęto lata 1999–2017. Podstawowymi materiałami badawczymi wykorzystanymi do przeprowadzenia analizy badań były sprawozdania z realizacji budżetu państwa, dane przygotowane przez Zakład Ubezpieczeń Społecznych oraz dane statystyczne uzyskane z Głównego Urzędu Statystycznego.
Słowa kluczowe: System zabezpieczenia społecznego, Reforma, Finanse publiczne JEL Codes: H55 Information about author:
Dr Anna Świrska Siedlce University of Natural Sciences and Humanities Faculty of Economic and Legal Sciences Ul. Żytnia17/19 08-110 Siedlce e-mail: [email protected] ORCID: 0000-0003-1363-2296

156
22 (71) 2019 DOI 10.22630/PEFIM.2019.22.71.33
Iwona Pomianek Warsaw University of Life Sciences - SGGW
CLASSIFICATION OF BORDER SUBREGIONS
OF EASTERN POLAND ACCORDING TO THEIR LEVEL OF SOCIO-ECONOMIC DEVELOPMENT
The paper presents the classification of subregions (NUTS 3) with permanent border
crossings, in terms of the level of socio-economic development in 2008-2018. The study covered 9 subregions located in the following provinces: Warminsko-Mazurskie, Podlaskie, Lubelskie and Podkarpackie. Application of Hellwig's measure of development made it possible to group subregions according to three categories of the level of development: high, medium and low. The relatively high level of development characterized two metropolitan subregions: Olsztyński and Białostocki. Łomżyński subregion proved to be the weakest, but it was not completely devoid of any development potential. In comparison with the average values in the designated higher development classes, Łomżyński subregion was characterized by: positive natural increase, low values of indices describing ageing of local society and proportion of investment expenditure of local self-government units at a level similar to the leaders of the ranking. However, there is a concern that the relatively low level of spending of the EU funds and the persistent trend of population migration outflow, due to global trends of population ageing and depopulation of rural areas, may negatively affect the socio-economic situation of the subregion in the future. Key words: socio-economic development, demographic factors, infrastructure, spatial peripherality, economic peripherality, NUTS 3, Hellwig's measure of development JEL Code: R11
Introduction Poland’s eastern border areas, which are also the external border of the European Union, are often perceived as peripheral1 not only in geographical but also in developmental terms. Peripherality, by definition, is the result of many long-lasting processes that increase variation between regions, resulting in the separation of central and peripheral areas in the territory2. Taking into account the spatial criterion - areas with unfavourable 1 I. Pomianek: Poziom rozwoju społeczno-gospodarczego obszarów wiejskich województwa warmińsko-mazurskiego. Acta Sci. Pol. Oeconomia, 9(3)/2010, 227-239; J. Rakowska, Zróżnicowanie poziomu rozwoju gmin Polski Wschodniej. Roczniki Naukowe Stowarzyszenia Ekonomistów Rolnictwa i Agrobiznesu, T. 13, z. 2, 2011, 392-397; Balińska A.: Znaczenie turystyki w rozwoju gmin wiejskich na przykładzie obszarów peryferyjnych wschodniego pogranicza Polski. Wydawnictwo SGGW, Warszawa 2016. 2 K. Leszczewska: Aktywność ekonomiczna regionów peryferyjnych. Nierówności Społeczne a Wzrost Gospodarczy, zeszyt 17, 2010, 215-225; D. Panzera, P. Postiglione: Economic growth in Italian NUTS 3 provinces. The Annals of Regional Science 53(1), 2014, 273-293; A. Jakubowski, U. Bronisz: Granica Unii Europejskiej jako czynnik (dez)aktywizujący rozwój i konkurencyjność obszarów przygranicznych [w:] A. Grynia (red.): Wybrane aspekty rozwoju i konkurencyjności nowych krajów członkowskich Unii Europejskiej, Wydział Ekonomiczno-Informatyczny w Wilnie, Uniwersytet w Białymstoku, Wilno 2015, 638; J. Benedek, N.C. Veress: Economic disparities and changes in the convergence of the Romanian NUTS 2 and NUTS 3 regions. Romanian Review of Regional Studies, Volume IX, Number 1, 2013, 85-90; T. G. Grosse: Wybrane koncepcje teoretyczne i doświadczenia praktyczne dotyczące rozwoju regionów peryferyjnych. Studia

157
transportation connections with remote economic centres are defined as peripheral (e.g. in the theory of core and periphery)3. Assuming the economic criterion, peripheral areas include regions with low population density, low-urbanized, mainly rural, with a low level of economic development (GDP per capita below 75% of the EU mean) 4. Peripherality also results from long-lasting processes that deepen interregional diversity, leading to the separation of central regions and peripheries in the territory. Therefore, peripheral regions have low economic potential compared to other areas of the country5, and consequently - lower investment attractiveness resulting, among others, from insufficient markets, low transport accessibility, poor economic infrastructure (business environment) or lower, in comparison with other areas, quality of labour resources.
A. Czarnecki emphasizes the importance of location factors in economic activity related to location rent in determining initiation and development of non-agricultural functions in rural areas. The degree of spatial diversification (especially in rural areas) in terms of the level of economic activity, diversity of the structure or the level of saturation with enterprises, depends not only on the entrepreneurship and initiatives of residents, social capital, the economic situation of a municipality or a region. Spatial location factors play a special role, including location in the zone of direct influence of larger cities, proximity to important transportation routes, density of the urban network, location in the centre or on the peripheries of the region, or the administrative status of the municipality6.
In addition to location conditions, the financial capabilities of municipalities and poviats are also a factor in the economic development of subregions 7: revenues to the local budget, financial independence (autonomy), investment activity as well as acquisition and use of external financing sources8. On the other hand, investment projects, mostly in the area of technical infrastructure, should be conducted in such a Regionalne i Lokalne, Nr 1(27)2007, 34; I. Lengyel, B. Kotosz: The Catching up Processes of the Regions of the Visegrad Group Countries. Comparative Economic Research, 2018, 21, nr 4, 5-24; M. Proniewski: Rozwój regionów peryferyjnych w Unii Europejskiej, Wydawnictwo Uniwersytetu w Białymstoku, Białystok 2012, 130. 3 J.T. Hryniewicz, Teoria „centrum-peryferie” w epoce globalizacji. Studia Regionalne i Lokalne, Nr 2(40) 2010, 5-27. 4 R. Rudnicki: Peryferyjność położenia geograficzno-komunikacyjnego a wybrane wskaźniki rozwoju powiatów ziemskich, [w:] M. Wesołowska (red.): Wiejskie obszary peryferyjne – uwarunkowania i czynniki aktywizacji. Studia Obszarów Wiejskich, tom 26, Warszawa 2011, 36. 5 K. Leszczewska: Aktywność ekonomiczna regionów peryferyjnych. Nierówności Społeczne a Wzrost Gospodarczy, zeszyt 17, 2010, s. 215-225. 6 A. Czarnecki: Wpływ czynników lokalizacyjnych na rozwój działalności pozarolniczej na obszarach wiejskich. Roczniki Naukowe SERiA, tom VIII, zeszyt 4, 2006, s. 78. 7 A. Parlińska, H.B. Yavuz: Finances of municipalities governments in Poland and Turkey. Acta Sci. Pol. Oeconomia 16(4)2017, 123–132; Ł. Satoła, P. Pogan: Trwały rozwój lokalny w gminach o zróżnicowanej sytuacji finansowej, w: Zeszyty Naukowe Szkoły Głównej Gospodarstwa Wiejskiego w Warszawie Ekonomika i Organizacja Gospodarki Żywnościowej, nr 116, 2016, 119-131; M. Podstawka, B. Suchodolski: Rozwój lokalny i jego wyznaczniki na poziomie powiatu. Marketing i Rynek, r. 23, nr 10/2016, CD, 383-393; M. Chrzanowska, N. Drejerska: Statistical Comparative Analysis of Socio-Economic Development Level of Polish Border Regions (NUTS 3), Proceedings of the International Scientific Conference on Quantitative Methods in Economics - Multiple Criteria Decision Making XVIII, Vratna, Slovakia, The Slovak Society for Operations Research, Department of Operations Research and Econometrics, Faculty of Economic Informatics, University of Economics in Bratislava, May 25-27, 2016, 131. 8 Ł. Satoła: Zróżnicowanie wykorzystania funduszy Unii Europejskiej w układzie centrum - peryferia, Prace Naukowe Uniwersytetu Ekonomicznego we Wrocławiu, nr 320, 2013, 176-185.

158
way as to increase attractiveness of the area by removing existing barriers of social and economic development on both local and regional scale9. Development of housing and other economic functions is pushing agriculture out of suburban areas towards the periphery. In suburban areas, rapid development of the local non-agricultural labour market and the use of proximity of the urban market can be observed10. However, rural areas, located peripherally in relation to urban centres and main transportation routes, show a slight development of non-agricultural labour markets.
According to research conducted by K. Heffner, the number of people living in the countryside does not decrease and changes in rural areas are bidirectional. In the surroundings of urban agglomerations, the number of inhabitants increases (often significantly), while in many peripheral, less reachable, less attractive (e.g. landscape, ecological) zones the rural population is decreasing11. The oldest municipalities are located in Eastern Poland, which makes it the oldest region in Poland12. As rightly noted by J. Rakowska, in the case of marginalized areas in terms of economic and social development, the aging of local populations, not balanced by the inflow of external human potential, may result in a significant reduction in population, and in extreme cases – lead to depopulation of such areas in a relatively short time, along with all negative social and economic consequences accompanying this process on a local, regional and national scale13. This is even more important since – according to research conducted by E. Roszko-Wójtowicz and M. Grzelak – Podkarpackie and Warmińsko-Mazurskie regions took the last places in the analysis of diversity of the quality of life14. According to P. Śleszyński, a significant decrease in population is expected with the aging of the biological structure of the population. These changes will vary in space, and further depopulation of traditional peripheral regions is almost certain15.
Aim and methods Development is a concept of broad meaning. J.J. Parysek defines development as a process of transition from a given state or form to a more developed, complex, advanced one16. The aim of the paper was to compare the level of socio-economic development of Eastern Poland’s border subregions, which have border crossings only with the non-EU 9 M. Kowalska (red.), W. Knapik, M. Bogusz, B. Kiełbasa, A. Niedziółka, A. Piotrowska, Ł. Satoła: Rozwój lokalny obszarów wiejskich w perspektywie społeczno-ekonomicznej, Uniwersytet Rolniczy im. Hugona Kołłątaja, Europejskie Centrum Badawcze Drobnych Gospodarstw Rolnych, Kraków 2015, 22. 10 A. Łapińska: Rola przedsiębiorczości w kreowaniu wielofunkcyjności rozwoju terenów wiejskich. Wieś Jutra, październik 10(123)2008, 8. 11 K. Heffner: Wielofunkcyjność obszarów wiejskich w Polsce rzeczywistość czy mit? [w:] W. Kamińska, K. Heffner (red.): Obszary wiejskie, wielofunkcyjność, migracje, nowe wizje rozwoju, Studia KPZK, 2011, nr 133, s.10 12 J. Rakowska, 2016: Zróżnicowanie poziomu starości demograficznej Polski w ujęciu lokalnym, Studia Ekonomiczne i Regionalne = Economic and Regional Studies 2016, T. 9, nr 2, s. 13. 13 J. Rakowska, 2016: Zróżnicowanie poziomu starości demograficznej Polski w ujęciu lokalnym, Studia Ekonomiczne i Regionalne = Economic and Regional Studies 2016, T. 9, nr 2, s. 22. 14 E. Roszko-Wójtowicz, M.M. Grzelak: Wielowymiarowe ujęcie zróżnicowania poziomu jakości życia w województwach w Polsce. Zeszyty Naukowe Polityki Europejskie, Finanse i Marketing, nr 69/2018, 211. 15 P. Śleszyński: Demograficzne wyzwania rozwoju regionalnego Polski. [w:] Teoretyczne i aplikacyjne wyzwania współczesnej geografii społeczno-ekonomicznej, Studia KPZK, tom 183/2018, 225-247. 16 J.J. Parysek: Rozwój społeczno-gospodarczy oraz czynniki i uwarunkowania rozwoju. [w:] Teoretyczne i aplikacyjne wyzwania współczesnej geografii społeczno-ekonomicznej, Studia KPZK, tom 183/2018, 38.

159
countries (in 2008-2018). Therefore, the analysis was carried out on units of the NUTS-3 level. Table 1 presents the subregions qualified for the analysis. Out of 10 Polish border subregions located along the eastern border of the EU, Suwalski subregion was excluded from further analysis, as it not only does not have a permanent border crossing with Belarus (only periodically active pedestrian, bicycle and river crossing in Rudawka-Lesnaja), but also borders with the area of Lithuania, where there is no physical barrier between this country and the subregion. Table 1. Characteristics of the analysed border subregions of Eastern Poland
No.. Subregion Region Number of permanent border crossing
points* Qualification for the study road pedestrian raile total
1 Elbląski Warmińsko-Mazurskie 2 0 1 3 +
2 Olsztyński Warmińsko-Mazurskie 1 0 2 3 +
3 Ełcki Warmińsko-Mazurskie 1 0 0 1 +
4 Suwalski Podlaskie 0 0 0 0 - 5 Białostocki Podlaskie 2** 1** 2 4 + 6 Łomżyński Podlaskie 1 0 2 3 + 7 Bialski Lubelskie 3 0 1 4 +
8 Chełmsko-Zamojski Lubelskie 4 0 3 7 +
9 Krośnieński Podkarpackie 1 0 1 2 + 10 Przemyski Podkarpackie 3** 1** 2 5 +
* border crossing with Russia, Belarus or Ukraine ** including 1 pedestrian-road crossing Source: Author’s elaboration based on: The map of crossings and objects of the Polish Border Guard (Mapa przejść i obiektów Straży Granicznej) [in:] https://www.strazgraniczna.pl/pl/mapa-przejsc-i-obiektow/ (access: 20.06.2019); https://granica.gov.pl/przejsciap.php (access: 20.06.2019) and the Local Data Bank of the Statistics Poland (BDL GUS).
To complete the goal formulated in such way, a synthetic measure construction procedure, connecting many variables, was carried out. Data for the construction of the socio-economic development indicator, in addition to the sources listed in Table 1, were taken from the Local Data Bank of the Statistics Poland (the Central Statistical Office, BDL GUS). The construction of the measure consisted of a few stages. In the first stage, an essential selection of features for building the development indicator based on literature studies was made17. 17 See, among others: M. Chrzanowska, N. Drejerska: Statistical Comparative Analysis of Socio-Economic Development Level of Polish Border Regions (NUTS 3), Proceedings of the International Scientific Conference on Quantitative Methods in Economics - Multiple Criteria Decision Making XVIII, Vratna, Slovakia, The Slovak Society for Operations Research, Department of Operations Research and Econometrics, Faculty of Economic Informatics, University of Economics in Bratislava, May 25-27, 2016; N. Drejerska, M. Chrzanowska, Pomianek I.: Strefa podmiejska Warszawy: wybrane zagadnienia. Wydawnictwo SGGW, Warszawa 2014; A. Czarnecki: Wpływ czynników lokalizacyjnych na rozwój działalności pozarolniczej na obszarach wiejskich. Roczniki Naukowe SERiA, tom VIII, zeszyt 4, 2006, 78-82; T. Czyż: Poziom rozwoju społeczno-gospodarczego Polski w ujęciu subregionalnym, Przegląd Geograficzny, nr 84/2, 2012, 219-236; K. Leszczewska: Aktywność ekonomiczna regionów peryferyjnych. Nierówności Społeczne a Wzrost Gospodarczy, zeszyt 17, 2010, s. 215-225; A. Łapińska: Rola przedsiębiorczości w kreowaniu wielofunkcyjności rozwoju terenów wiejskich. Wieś Jutra, październik 10(123)2008, 8; J.J. Parysek: Rozwój
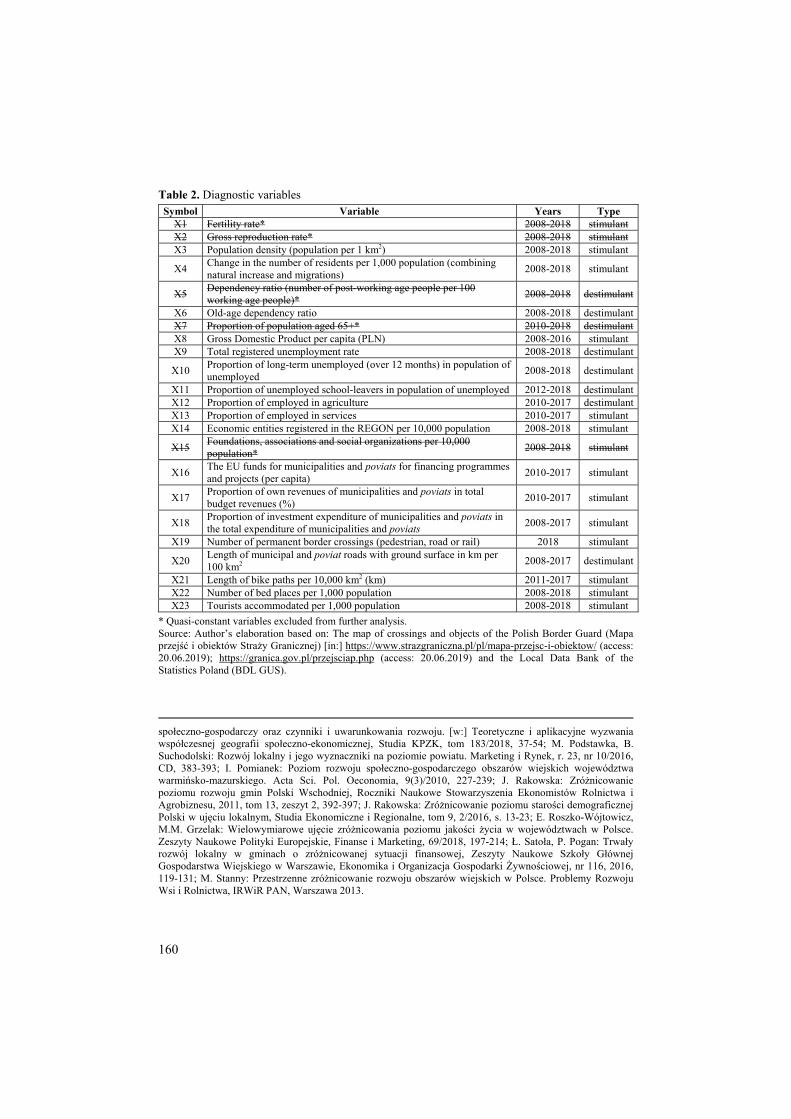
160
Table 2. Diagnostic variables Symbol Variable Years Type
X1 Fertility rate* 2008-2018 stimulant X2 Gross reproduction rate* 2008-2018 stimulant X3 Population density (population per 1 km2) 2008-2018 stimulant
X4 Change in the number of residents per 1,000 population (combining natural increase and migrations) 2008-2018 stimulant
X5 Dependency ratio (number of post-working age people per 100 working age people)* 2008-2018 destimulant
X6 Old-age dependency ratio 2008-2018 destimulant X7 Proportion of population aged 65+* 2010-2018 destimulant X8 Gross Domestic Product per capita (PLN) 2008-2016 stimulant X9 Total registered unemployment rate 2008-2018 destimulant
X10 Proportion of long-term unemployed (over 12 months) in population of unemployed 2008-2018 destimulant
X11 Proportion of unemployed school-leavers in population of unemployed 2012-2018 destimulant X12 Proportion of employed in agriculture 2010-2017 destimulant X13 Proportion of employed in services 2010-2017 stimulant X14 Economic entities registered in the REGON per 10,000 population 2008-2018 stimulant
X15 Foundations, associations and social organizations per 10,000 population* 2008-2018 stimulant
X16 The EU funds for municipalities and poviats for financing programmes and projects (per capita) 2010-2017 stimulant
X17 Proportion of own revenues of municipalities and poviats in total budget revenues (%) 2010-2017 stimulant
X18 Proportion of investment expenditure of municipalities and poviats in the total expenditure of municipalities and poviats 2008-2017 stimulant
X19 Number of permanent border crossings (pedestrian, road or rail) 2018 stimulant
X20 Length of municipal and poviat roads with ground surface in km per 100 km2 2008-2017 destimulant
X21 Length of bike paths per 10,000 km2 (km) 2011-2017 stimulant X22 Number of bed places per 1,000 population 2008-2018 stimulant X23 Tourists accommodated per 1,000 population 2008-2018 stimulant
* Quasi-constant variables excluded from further analysis. Source: Author’s elaboration based on: The map of crossings and objects of the Polish Border Guard (Mapa przejść i obiektów Straży Granicznej) [in:] https://www.strazgraniczna.pl/pl/mapa-przejsc-i-obiektow/ (access: 20.06.2019); https://granica.gov.pl/przejsciap.php (access: 20.06.2019) and the Local Data Bank of the Statistics Poland (BDL GUS).
społeczno-gospodarczy oraz czynniki i uwarunkowania rozwoju. [w:] Teoretyczne i aplikacyjne wyzwania współczesnej geografii społeczno-ekonomicznej, Studia KPZK, tom 183/2018, 37-54; M. Podstawka, B. Suchodolski: Rozwój lokalny i jego wyznaczniki na poziomie powiatu. Marketing i Rynek, r. 23, nr 10/2016, CD, 383-393; I. Pomianek: Poziom rozwoju społeczno-gospodarczego obszarów wiejskich województwa warmińsko-mazurskiego. Acta Sci. Pol. Oeconomia, 9(3)/2010, 227-239; J. Rakowska: Zróżnicowanie poziomu rozwoju gmin Polski Wschodniej, Roczniki Naukowe Stowarzyszenia Ekonomistów Rolnictwa i Agrobiznesu, 2011, tom 13, zeszyt 2, 392-397; J. Rakowska: Zróżnicowanie poziomu starości demograficznej Polski w ujęciu lokalnym, Studia Ekonomiczne i Regionalne, tom 9, 2/2016, s. 13-23; E. Roszko-Wójtowicz, M.M. Grzelak: Wielowymiarowe ujęcie zróżnicowania poziomu jakości życia w województwach w Polsce. Zeszyty Naukowe Polityki Europejskie, Finanse i Marketing, 69/2018, 197-214; Ł. Satoła, P. Pogan: Trwały rozwój lokalny w gminach o zróżnicowanej sytuacji finansowej, Zeszyty Naukowe Szkoły Głównej Gospodarstwa Wiejskiego w Warszawie, Ekonomika i Organizacja Gospodarki Żywnościowej, nr 116, 2016, 119-131; M. Stanny: Przestrzenne zróżnicowanie rozwoju obszarów wiejskich w Polsce. Problemy Rozwoju Wsi i Rolnictwa, IRWiR PAN, Warszawa 2013.
161
Concerning the formal criteria for selecting variables, measurable, available and complete diagnostic variables were used to construct the measure of subregions’ development. Some potential variables, significant in terms of the content, could not be included in the group of analysed variables, because in the LDB some information is not collected at levels below NUTS-2 (voivodships). The years 2008-2018 were adopted as the time range of the analysis. For some variables, this range was not available, so possibly the longest time range was adopted for them (see Table 2).
Preliminary data analysis using a coefficient of variation allowed eliminating quasi-constant variables. The coefficient of variation Vj is a relative measure of dispersion, the value of which is determined as the ratio of the standard deviation to the value of the arithmetic mean18. The critical value assumed V * = 0.10. It allowed eliminating the following variables: X1, X2, X5, X7 and X15. As a result, a set of 18 variables was obtained. Six variables were destimulants, the others were stimulants. Using the taxonomic development measure by Z. Hellwig19, the variables enabled division of the examined objects (subregions) into three classes differing in terms of the level of socio-economic development. It is one of the taxonomic methods, in which the aggregate measure is calculated as a synthetic indicator of the taxonomic distance of an object from the theoretical development pattern (the higher the value of the measure, the closer the object is to the pattern). The development measure (di) usually takes values in the range [0; 1]. The following classes (groups of subregions) have been distinguished:
− 1st class (high level of development): , − 2nd class (medium level of development): , − 3rd class (low level of development): ,
where: di is the value of synthetic measure calculated by Hellwig’s method, is the arithmetic mean of di, and is the standard deviation of di.
Moreover, the analysis used demographic and spatial ruralisation indicators. The first of them – the demographic ruralisation rate20 – was calculated as a percentage of population living in rural areas (out of the cities) in the total population in a subregion. The spatial ruralisation rate, on the other hand, was calculated as the percentage proportion of rural areas (beyond the administrative borders of cities) in the total area of a subregion.
Research results The calculations allowed ranking the subregions from the highest to the lowest value:
18 B. Borkowski, H. Dudek, W. Szczesny: Ekonometria, wybrane zagadnienia. Wydawnictwo Naukowe PWN, Warszawa, 2004. 19 Z. Hellwig: Zastosowanie metody taksonomicznej do typologicznego podziału krajów ze względu na poziom rozwoju i strukturę kwalifikowanych kadr. Przegląd Statystyczny, 4/1968, 307-328. 20 Wskaźnik ruralizacji zastosowany został m.in. w następujących pracach badawczych: K. Janc, K. Ł. Czapiewski: Wykształcenie czynnikiem wspierającym rozwój gospodarczy obszarów wiejskich [w:] B. Głębocki, U. Kaczmarek (red.): Obszary sukcesu na polskiej wsi. Studia Obszarów Wiejskich, Tom 8, Instytut Geografii i Przestrzennego Zagospodarowania PAN, Warszawa 2005; D. Śledź (red): Analiza sytuacji na regionalnym rynku pracy. Raport końcowy z realizacji zadań Polskiego Towarzystwa Statystycznego O/Olsztyn, Konsorcjum Olsztyńska Szkoła Biznesu – ASM Sp. z o.o. - Polskie Towarzystwo Statystyczne, Olsztyn 2005.

162
− 1st class (high level of development): 0.444, − 2nd class (medium level of development): 0.261 0.444, − 3rd class (low level of development): 0.148. The first place was taken by Olsztyński subregion with the measure of 0.519, amounting
to half of the reference value (the pattern =1.0). This means that some of the variables in this subregion might assume the most favourable values (or almost the best ones). Olsztyński and Białostocki subregions were included in the 1st class – with a high level of socio-economic development. There were six subregions in the group of the medium level of development. Łomżyński subregion took the last place and it was the only one classified in the 3rd class (the low level of development). Details were presented in Table 3. Table 3. Classification of subregions according to the level of socio-economic development
Place Subregion Value of di Class 1 Olsztyński 0.519 1 2 Białostocki 0.508 1 3 Elbląski 0.388 2 4 Krośnieński 0.308 2 5 Przemyski 0.244 2 6 Ełcki 0.238 2 7 Chełmsko-Zamojski 0.192 2 8 Bialski 0.158 2 9 Łomżyński 0.107 3
Source: Author’s calculation.
Figure 1. Spatial diversity of subregions in terms of the level of socio-economic development in 2008-2018 Source: Author’s elaboration.

163
Figure 1 presents spatial distribution of the subregions according to the socio-economic development classes. Olsztyński and Białostocki subregions, relatively best developed, are located in the northern part of the studied area. However, Łomżyński subregion, the last one in the ranking, is a West-South neighbour of Białostocki subregion.
The results are – to a large extent – consistent with the analysis of Polish subregions in terms of economic development and living standards conducted by T. Czyż 21 using data from 2008, which means that the average distribution of the subregions in the years 2008-2018 did not deviate significantly from the distribution in the base year.
Table 4 presents the average values of selected demographic indicators that characterize each of the subregions’ development classes. The most favourable values (the lowest for destimulants and the highest for stimulants) do not characterize only subregions with the high level of development (Olsztyński and Białostocki). In three cases out of seven, the best values of the indices was characterized by the Łomżyński subregion, indicated in the analysis as the weakest one. Considering positive population growth and quite low values of post-working-age population per 100 working-age population or proportion of population aged 65+ (compared to the average values in both higher development classes), it can be concluded that the demographic situation of Łomżyński subregion is not much unfavourable. Nevertheless, in the analysed period the population was decreasing there (caused by migrations), and as much as 53% of the population lived in the rural areas. Table 4. Average values of selected demographic indicators for the development classes
Demographic indicator Class 1 2 3*
Population density (population per 1 km2) 79.5 69.5 46.1 Change in the number of residents per 1000 population (combining natural increase and migrations) 0.9 -0.9 -3.6
Natural increase per 1000 population 0.0 -0.3 0.6 Old-age dependency ratio 20.2 20.5 24.5 Post-working-age population per 100 working-age population 29.0 28.4 26.0 Proportion of population aged 65+ (%) 15.3 15.0 13.5 Demographic ruralization index (%) 32 56 53 * values for Łomżyński subregion. Source: Author’s calculation.
The data presented in Table 5 more clearly indicate the dominance of high development subregions. The 1st class was characterized by almost 30% higher average GDP per capita and the proportion of employees in the services sector, as well as a higher rate of entrepreneurship, a higher proportion of own revenues in the budget (and thus a greater autonomy of the use of the budget funds) as well as a higher proportion of investment expenditure. There were also the lowest values of destimulants, such as the proportion of employed in the agricultural sector, the proportion of long-term unemployed and the proportion of registered unemployed graduates. Nevertheless, it was in Łomżyński subregion where the registered unemployment rate amounted to the lowest
21 T. Czyż: Poziom rozwoju społeczno-gospodarczego Polski w ujęciu subregionalnym, Przegląd Geograficzny, nr 84/2, 2012, 226 i 228.

164
average value. Considering this subregion, there was the lowest number of foundations, associations and social organizations registered (per 10,000 inhabitants) – but the gap between Łomżyński subregion and other classes was not significant. In the analysed period, in the same subregion, the proportion of investment expenditure of municipalities and poviats was almost equal to the proportion observed in Olsztyński and Białostocki subregions. In the future it may result in the improvement of other indicators, not only economic, but also infrastructural and demographic ones. This is significant because, as P. Śleszyński writes22, the low level of awareness of the inhabitants of peripheral villages and the lack of private financial resources are often important negative factors hindering infrastructural modernization. Table 5. Average values of selected economic indicators for the development classes
Economic indicator Class 1 2 3*
GDP per capita (PLN) 34 203.9 24 747.1 26 396.1 Proportion of employed in services (%) 61 44 37 Proportion of employed in agriculture (%) 16 35 43 Total registered unemployment rate (%) 13.9 16.2 11.0 Proportion of long-term unemployed (over 12 months) in population of unemployed (%) 37.4 40.2 38.9
Proportion of unemployed school-leavers in population of unemployed (%) 4.2 4.9 5.9 Economic entities registered in the REGON per 10000 population 930.5 727.9 693.8 Foundations, associations and social organizations per 10,000 population 31.8 32.8 31.3 Proportion of own revenues of municipalities and poviats in total budget revenues (%) 54.5 19.9 19.6
The EU funds for municipalities and poviats for financing programmes and projects (in PLN per capita) 10.0 26.0 8.6
Proportion of investment expenditure of municipalities and poviats in the total expenditure of municipalities and poviats (%) 20.0 16.6 19.5
* values for Łomżyński subregion. Source: Author’s calculation.
Table 6 presents the average values of selected infrastructure indicators. Subregions in the 1st class were characterized by the largest number of beds per 1000 inhabitants, partly the resultant number of tourists accommodated and the highest density of bicycle paths. On the other hand, in the 2nd class subregions there were relatively fewest municipal and poviat roads with a ground surface and the largest number of permanent border crossings. Values of spatial ruralisation were similar in the analysed groups, but the lowest value was observed in the 1st class.
22 P. Śleszyński: Wydatki związane z infrastrukturą techniczną [w:] Studia nad chaosem przestrzennym, Studia KPZK, tom 182/2018, 199.

165
Table 6. Average values of selected infrastructural indicators for the development classes
Infrastructural indicator Class
1 2 3* Tourist bed places per 1000 population 20.2 19.5 6.9 Tourists accommodated per 1000 population 732.4 496.2 291.2 Length of municipal and poviat roads with ground surface in km per 100 km2 43.4 38.1 61.5 Length of bike paths per 10,000 km2 (km) 218.4 130.3 104.0 Number of permanent border crossings 3.5 3.7 3.0 Spatial ruralization index (%) 95,7 96,8 96,2 * values for Łomżyński subregion. Source: Author’s calculation.
As research shows (among others: T. Czyż23, J. Sołtys and S. Dorocki24, M. Chrzanowska and N. Drejerska25) – the eastern border subregions have significantly lower development potential compared to other Polish and European subregions. Poland’s membership in the European Union, according to research by W. Bąba26, resulted in the “transfer” of this country from the group of “poor newly-acceded EU countries (2004-2006)” to the group of “medium-developed countries”, thanks to co-financing of numerous development projects from the EU budget. Hence, the lowest (in comparison to other development groups) average activity of Łomżyński subregion in terms of spending the EU funds in 2008-2018 may be pessimistic. Nevertheless, the national socio-economic policy should focus on this subregion and the other border subregions (especially non-metropolitan ones) in the coming years.
Conclusions The observed border subregions are located peripherally in relation to European and national centres of economic activity, while at the EU level they belong to NUTS-3 units with the lowest transport accessibility.
Among the main features of the studied subregions, determining their socio-economic situation, these should be mentioned: peripheral location, relatively low transport accessibility, resulting from this relatively low investment attractiveness, a low level of entrepreneurship, a dispersed settlement system, low population density, high population unemployment rate as well as low average income of residents.
Nevertheless, the studied area is diversified in terms of development. Two of the nine subregions analysed were classified into the class of a high level of development. 23 T. Czyż: Poziom rozwoju społeczno-gospodarczego Polski w ujęciu subregionalnym, Przegląd Geograficzny, nr 84/2, 2012, 219-236. 24 J. Sołtys, S. Dorocki: Non-metropolitan Industrial NUTS 3 Sub-regions in the European Union – Identification and Typology. Prace Komisji Geografii Przemysłu Polskiego Towarzystwa Geograficznego, Volume 30, Issue 2, 2016, 55-71 25 M. Chrzanowska, N. Drejerska: Statistical Comparative Analysis of Socio-Economic Development Level of Polish Border Regions (NUTS 3), Proceedings of the International Scientific Conference on Quantitative Methods in Economics - Multiple Criteria Decision Making XVIII, Vratna, Slovakia, The Slovak Society for Operations Research, Department of Operations Research and Econometrics, Faculty of Economic Informatics, University of Economics in Bratislava, May 25-27, 2016, 131. 26 W. Bąba: Changes in Level of Socio-Economic Development of EU Member Countries in the 2004-2013 Period - Taxonomic Analysis, Proceedings of the 3rd International Conference on European Integration 2016 (ICEI 2016), Technical University of Ostrava, Czech Republic, May 19-20, 2016

166
These are metropolitan subregions whose centres are the voivodship major cities: Olsztyn and Białystok. The favourable values of most of the analysed indicators result, to a large extent, from the impact of regional centres on a major part of the subregion’s area.
In the analysis, Łomżyński subregion, located in the southern part of the studied area, turned out to be the weakest subregion. The subregion’s biggest problems were related to the infrastructure, migration and the labour market. In 2008-2018, this subregion was also characterized by the lowest average values of the entrepreneurship index as well as foundations, associations and social organizations registered per 10,000 residents. Nevertheless, this region has got some development potential. Although the population decreased in the subregion during the analysed period, the natural increase rate was positive. Compared to the average values in the higher development classes, Łomżyński subregion was characterised by the most favourable values of such indices as: post-working-age population per 100 working-age population or proportion of population aged 65+. Besides, significant activity of local governments was manifested in a relatively high average investment expenditure, even though there was the lowest spending of the EU funds per capita. To sum up, it is hard to predict, if positive demographic variables mentioned above and budget activity continue, resulting in improvement in the socio-economic situation (or at least slowing down unfavourable changes). Global trends related to the ageing of the population as well as depopulation of rural areas may threaten socio-economic development not only of the weakest of the analysed subregions, but also of six subregions of the 2nd class.
References Balińska A.: Znaczenie turystyki w rozwoju gmin wiejskich na przykładzie obszarów peryferyjnych wschodniego pogranicza Polski. Wydawnictwo SGGW, Warszawa 2016. Bank Danych Lokalnych GUS [w:] https://bdl.stat.gov.pl/BDL/start (dostęp: 19.06.2019). Bąba W.: Changes in Level of Socio-Economic Development of EU Member Countries in the 2004-2013 Period - Taxonomic Analysis, Proceedings of the 3rd International Conference on European Integration 2016 (ICEI 2016), Technical University of Ostrava, Czech Republic, May 19-20, 2016. Benedek J., Veress N.C.: Economic disparities and changes in the convergence of the Romanian NUTS 2 and NUTS 3 regions. Romanian Review of Regional Studies, Volume IX, Number 1, 2013, 85-90. Borkowski B., Dudek H., Szczesny W.: Ekonometria, wybrane zagadnienia. Wydawnictwo Naukowe PWN, Warszawa, 2004. Chrzanowska M., Drejerska N.: Statistical Comparative Analysis of Socio-Economic Development Level of Polish Border Regions (NUTS 3), Proceedings of the International Scientific Conference on Quantitative Methods in Economics - Multiple Criteria Decision Making XVIII, Vratna, Slovakia, The Slovak Society for Operations Research, Department of Operations Research and Econometrics, Faculty of Economic Informatics, University of Economics in Bratislava, May 25-27, 2016. Czarnecki A.: Wpływ czynników lokalizacyjnych na rozwój działalności pozarolniczej na obszarach wiejskich. Roczniki Naukowe SERiA, tom VIII, zeszyt 4, 2006, 78-82. Czyż T.: Poziom rozwoju społeczno-gospodarczego Polski w ujęciu subregionalnym, Przegląd Geograficzny, nr 84/2, 2012, 219-236.

167
Drejerska N. Chrzanowska M. Pomianek I. Strefa podmiejska Warszawy: wybrane zagadnienia (Warsaw Suburban Area: Selected Issues). Wydawnictwo SGGW, Warszawa 2014. Heffner K.: Wielofunkcyjność obszarów wiejskich w Polsce rzeczywistość czy mit? [w:] W. Kamńska, K. Heffner (red.): Obszary wiejskie, wielofunkcyjność, migracje, nowe wizje rozwoju, Studia KPZK, 2011, nr 133, 10. Hellwig Z.: Zastosowanie metody taksonomicznej do typologicznego podziału krajów ze względu na poziom rozwoju i strukturę kwalifikowanych kadr. Przegląd Statystyczny, 4/1968, 307-328. Hryniewicz J.T.: Teoria „centrum-peryferie” w epoce globalizacji. Studia Regionalne i Lokalne, Nr 2(40) 2010, 5-27. https://granica.gov.pl/przejsciap.php (dostęp: 20.06.2019) Grosse T. G.: Wybrane koncepcje teoretyczne i doświadczenia praktyczne dotyczące rozwoju regionów peryferyjnych. Studia Regionalne i Lokalne, Nr 1(27)2007, 27-49. Jakubowski A., Bronisz U.: Granica Unii Europejskiej jako czynnik (dez)aktywizujący rozwój i konkurencyjność obszarów przygranicznych [w:] Grynia A. (red.): Wybrane aspekty rozwoju i konkurencyjności nowych krajów członkowskich Unii Europejskiej, Wydział Ekonomiczno-Informatyczny w Wilnie, Uniwersytet w Białymstoku, Wilno 2015, 627-639. Janc K., Czapiewski K. Ł.: Wykształcenie czynnikiem wspierającym rozwój gospodarczy obszarów wiejskich [w:] Głębocki B., Kaczmarek U. (red.): Obszary sukcesu na polskiej wsi. Studia Obszarów Wiejskich, Tom 8, Instytut Geografii i Przestrzennego Zagospodarowania PAN, Warszawa 2005. Kowalska M. (red.), Knapik W., Bogusz M., Kiełbasa B., Niedziółka A., Piotrowska A., Satoła Ł.: Rozwój lokalny obszarów wiejskich w perspektywie społeczno-ekonomicznej, Uniwersytet Rolniczy im. Hugona Kołłątaja ; Europejskie Centrum Badawcze Drobnych Gospodarstw Rolnych, Kraków 2015. Lengyel I., Kotosz B.: The Catching up Processes of the Regions of the Visegrad Group Countries. Comparative Economic Research, 2018, 21, nr 4, 5-24. Leszczewska K.: Aktywność ekonomiczna regionów peryferyjnych. Nierówności Społeczne a Wzrost Gospodarczy, zeszyt 17, 2010, s. 215-225. Łapińska A.: Rola przedsiębiorczości w kreowaniu wielofunkcyjności rozwoju terenów wiejskich. Wieś Jutra, październik 10(123)2008, 8. Mapa przejść i obiektów Straży Granicznej [w:] https://www.strazgraniczna.pl/pl/mapa-przejsc-i-obiektow/ (dostęp: 20.06.2019) Na Wschód nie na własnych nogach. Rząd zamyka piesze przejścia graniczne [w:] https://prawo.gazetaprawna.pl/artykuly/1393994,rzad-zamyka-piesze-przejscia-graniczne.html (dostęp: 20.06.2019). Panzera D., Postiglione P.: Economic growth in Italian NUTS 3 provinces. The Annals of Regional Science 53(1), 2014, 273-293. Parlińska A., Yavuz H.B.: Finances of municipalities governments in Poland and Turkey. Acta Sci. Pol. Oeconomia 16(4)2017, 123–132. Parysek J.J.: Rozwój społeczno-gospodarczy oraz czynniki i uwarunkowania rozwoju. [w:] Teoretyczne i aplikacyjne wyzwania współczesnej geografii społeczno-ekonomicznej, Studia KPZK, tom 183/2018, 37-54. Podstawka M., Suchodolski B.: Rozwój lokalny i jego wyznaczniki na poziomie powiatu. Marketing i Rynek, r. 23, nr 10/2016, CD, 383-393. Pomianek I.: Poziom rozwoju społeczno-gospodarczego obszarów wiejskich województwa warmińsko-mazurskiego. Acta Sci. Pol. Oeconomia, 9(3)/2010, 227-239. Proniewski M.: Rozwój regionów peryferyjnych w Unii Europejskiej, Wydawnictwo Uniwersytetu w Białymstoku, Białystok 2012. Rakowska J.: Zróżnicowanie poziomu rozwoju gmin Polski Wschodniej, Roczniki Naukowe Stowarzyszenia Ekonomistów Rolnictwa i Agrobiznesu, 2011, tom 13, zeszyt 2, 392-397.

168
Rakowska J.: Zróżnicowanie poziomu starości demograficznej Polski w ujęciu lokalnym, Studia Ekonomiczne i Regionalne, tom 9, 2/2016, s. 13-23. Roszko-Wójtowicz E., Grzelak M.M.: Wielowymiarowe ujęcie zróżnicowania poziomu jakości życia w województwach w Polsce. Zeszyty Naukowe Polityki Europejskie, Finanse i Marketing, 69/2018, 197-214. Rudnicki R.: Peryferyjność położenia geograficzno-komunikacyjnego a wybrane wskaźniki rozwoju powiatów ziemskich, [w:] M. Wesołowska (red.): Wiejskie obszary peryferyjne – uwarunkowania i czynniki aktywizacji. Studia Obszarów Wiejskich, tom 26, Warszawa 2011, 160-169. Satoła Ł.: Zróżnicowanie wykorzystania funduszy Unii Europejskiej w układzie centrum - peryferia, w: Prace Naukowe Uniwersytetu Ekonomicznego We Wrocławiu, nr 320, 2013, 176-185. Satoła Ł., Pogan P.: Trwały rozwój lokalny w gminach o zróżnicowanej sytuacji finansowej, Zeszyty Naukowe Szkoły Głównej Gospodarstwa Wiejskiego w Warszawie, Ekonomika i Organizacja Gospodarki Żywnościowej, nr 116, 2016, 119-131. Sołtys J., Dorocki S.: Non-metropolitan Industrial NUTS 3 Sub-regions in the European Union – Identification and Typology. Prace Komisji Geografii Przemysłu Polskiego Towarzystwa Geograficznego, Volume 30, Issue 2, 2016, 55-71. Stanny M.: Przestrzenne zróżnicowanie rozwoju obszarów wiejskich w Polsce (Spatial Diversification of Rural Development in Poland). Problemy Rozwoju Wsi i Rolnictwa, IRWiR PAN, Warszawa 2013. Śledź D. (red.): Analiza sytuacji na regionalnym rynku pracy. Raport końcowy z realizacji zadań Polskiego Towarzystwa Statystycznego O/Olsztyn, Konsorcjum Olsztyńska Szkoła Biznesu – ASM Sp. z o.o. - Polskie Towarzystwo Statystyczne, Olsztyn 2005. Śleszyński P.: Wydatki związane z infrastrukturą techniczną [w:] Studia nad chaosem przestrzennym, Studia KPZK, tom 182/2018, 196-228. Śleszyński P.: Demograficzne wyzwania rozwoju regionalnego Polski [w:] Teoretyczne i aplikacyjne wyzwania współczesnej geografii społeczno-ekonomicznej, Studia KPZK, tom 183/2018, 225-247.
Klasyfikacja podregionów przygranicznych Polski Wschodniej według poziomu rozwoju społeczno-gospodarczego
Streszczenie W artykule przeprowadzono klasyfikację podregionów (NUTS 3), na obszarze których znajdowały się stałe przejścia graniczne, pod względem poziomu rozwoju społeczno-gospodarczego. Badaniem objęto 9 podregionów usytuowanych w województwach: warmińsko-mazurskim, podlaskim, lubelskim oraz podkarpackim. Zastosowanie taksonomicznej miary rozwoju Hellwiga umożliwiło pogrupowanie podregionów wg trzech kategorii poziomu rozwoju: wysokiego, średniego oraz niskiego. Relatywnie wysoki poziom rozwoju charakteryzował dwa podregiony metropolitarne: białostocki i olsztyński. Najsłabszym okazał się podregion przemyski, jednak nie był on obszarem pozbawionym zupełnie potencjału rozwojowego. W porównaniu z przeciętnymi wartościami w wyznaczonych wyższych klasach rozwoju, podregion przemyski charakteryzowały: najniższy udział dróg gminnych i powiatowych o nawierzchni gruntowej i największa liczba stałych przejść granicznych. Mimo, że w badanym okresie w podregionie ubywało ludności, przyrost naturalny był dodatni. Ponadto, na terenie podregionu przemyskiego zarejestrowanych było najwięcej (w przeliczeniu na 10 tys. mieszkańców) fundacji, stowarzyszeń i organizacji społecznych, co świadczy o aktywności społecznej. Natomiast znacząca aktywność samorządów lokalnych przejawiała się w relatywnie wysokim przeciętnym wydatkowaniu środków z funduszy

169
unijnych, co w przyszłości może skutkować poprawą sytuacji społeczno-gospodarczej, m.in. w zakresie infrastruktury, rynku pracy i demografii. Słowa kluczowe: peryferyjność przestrzenna, peryferyjność gospodarcza, NUTS 3, miara rozwoju Hellwiga JEL Code: R11 Information about author:
dr inż. Iwona Pomianek Warsaw University of Life Sciences – SGGW Institute of Economics and Finance Department of Development Policy and Marketing ul. Nowoursynowska 166 02-787 Warsaw, Poland e-mail: [email protected] ORCID: 0000-0002-2858-2714

170
22 (71) 2019 DOI 10.22630/PEFIM.2019.22.71.34
Adrian Sadłowski Uniwersytet Kardynała Stefana Wyszyńskiego w Warszawie Skutki stosowania płatności redystrybucyjnej w zależności
od wariantu wdrożeniowego na przykładzie Polski
THE CONSEQUENCES OF USING DIFFERENT VARIANTS OF IMPLEMENTATION OF REDISTRIBUTIVE PAYMENT
– A CASE STUDY OF POLAND
W niniejszym opracowaniu, w ramach badań diagnostycznych, dokonano pomiaru aktualnego stopnia koncentracji pomocy dystrybuowanej w ramach systemu wsparcia bezpośredniego dla rolników w Polsce oraz przedstawiono jego zróżnicowanie regionalne. Z kolei w ramach badań symulacyjnych dokonano kwantyfikacji skutków redystrybucyjnych stosowania – w różnych wariantach – instrumentu wyrównującego przyznawane kwoty wsparcia między gospodarstwami. Może to stanowić podstawę oceny ex ante alternatywnych opcji wdrożeniowych płatności redystrybucyjnej. Badania doprowadziły m.in. do wyznaczenia przedziałów obszarowych gospodarstw korzystających na stosowaniu płatności redystrybucyjnej – w obecnym kształcie oraz w przykładowych wariantach alternatywnych. W części końcowej artykułu sformułowano kilka rekomendacji w zakresie projektowania płatności redystrybucyjnej na poziomie krajowym w zależności od celów, które mają być osiągane za pomocą tego instrumentu.
Słowa kluczowe: Wspólna Polityka Rolna, płatności bezpośrednie, płatność redystrybucyjna, Polska JEL Code: Q18
Wprowadzenie Zasadniczo od momentu przystąpienia do Unii Europejskiej stosowany w Polsce system wsparcia bezpośredniego dla rolników zawsze w dużym stopniu uzależniał kwotę otrzymanego wsparcia od powierzchni użytków rolnych w gospodarstwie. Z badań P. Gracy-Gelert odnoszących się do okresu 2005-2010, których celem było m.in. oszacowanie wpływu płatności bezpośrednich na zróżnicowanie dochodów gospodarstw domowych w Polsce, wynika, że pogłębiały one zróżnicowanie tych dochodów, trafiając przede wszystkim do bogatszych grup społecznych – rolników wielkoobszarowych.1 Z drugiej strony w systemie wsparcia bezpośredniego upatruje się istotnego czynnika hamującego pozytywne zmiany strukturalne w polskim rolnictwie, wskazując, że gospodarstwa generujące niskie dochody ze sprzedaży produktów rolnych często przedkładają coroczny, niewielki, ale stabilny dochód w postaci płatności bezpośrednich nad jednorazowy przychód ze sprzedaży ziemi dynamicznym gospodarstwom znacznie
1 P. Graca-Gelert: Wpływ funduszy unijnych na zróżnicowanie dochodów w Polsce – przykład dopłat bezpośrednich i rent strukturalnych. Nierówności Społeczne a Wzrost Gospodarczy, nr 38 (2/2014), s. 189.
171
silniej ukierunkowanym na produkcję towarową.2 Przy takim podejściu płatności kierowane do małych gospodarstw uznawane są jako czynnik petryfikujący niekorzystną strukturę obszarową polskiego rolnictwa, mimo że indywidualne kwoty trafiające do poszczególnych małych gospodarstw są stosunkowo niewielkie.
N. Baisakova i T. Herzfeld wymieniają redystrybucję środków na korzyść mniejszych gospodarstw wśród najważniejszych elementów ostatniej reformy Wspólnej Polityki Rolnej w I filarze.3 Polska od samego początku, to jest od 2015 r., korzysta z wprowadzonej w ramach tej reformy możliwości stosowania specjalnego instrumentu, którego celem jest zmniejszenie różnic między gospodarstwami w kwotach przyznanej pomocy, czyli tzw. płatności redystrybucyjnej. Z motywu 36 preambuły do rozporządzenia Parlamentu Europejskiego i Rady (UE) nr 1307/20134 odnoszącego się do płatności redystrybucyjnej wynika, że instrument ten ma być narzędziem zwiększenia skali wsparcia – w ramach systemu płatności bezpośrednich – dochodów małych gospodarstw rolnych ponad poziom wynikający z tego, że kwota pomocy przydzielonej w formie najbardziej powszechnego instrumentu wsparcia stosowanego w ramach tego systemu, czyli płatności podstawowej (w systemie opartym na uprawnieniach) bądź jednolitej płatności obszarowej (w systemie uproszczonym), zasadniczo jest proporcjonalna do powierzchni użytkowanych rolniczo gruntów w gospodarstwie. Instrument ten może być jednocześnie narzędziem stymulowania pozytywnych zmian strukturalnych w rolnictwie. Komisja Europejska dopuszcza bowiem nieobejmowanie płatnością początkowego przedziału hektarów w gospodarstwie. Jest równoznaczne z tym, że gospodarstwa o powierzchni nie większej niż górna granica tego początkowego przedziału nie będą beneficjentami płatności redystrybucyjnej, będą natomiast niejako ją finansować, bowiem otrzymają niższe wsparcie w postaci jednolitej płatności obszarowej niż w sytuacji, w której płatność redystrybucyjna nie byłaby stosowana.
Analizowanie w usystematyzowany sposób dylematów polityki gospodarczej i dokonanie prawidłowej oceny różnych możliwych działań państwa wymagają rozpoznania skutków różnych alternatywnych wariantów działania oraz stworzenia odpowiednich kryteriów oceny tych wariantów, mając na względzie zakładane cele.5 Celem opracowania jest wsparcie procesów decyzyjnych dotyczących projektowania płatności redystrybucyjnej w Polsce (w tym wprowadzania zmian w zasadach jej przyznawania lub poziomie finansowania) poprzez:
1) dokonanie – w ramach diagnozowania sytuacji wyjściowej – pomiaru aktualnego stopnia koncentracji pomocy,
2) przeprowadzenie symulacji, pozwalających na ocenę ex ante skutków redystrybucyjnych różnych wariantów wdrożeniowych, oraz
2 M. Kwasowski, S. Zaleski: Die Landwirtschaft in Polen fünf Jahre nach dem Beitritt zur Europäischen Union. Polen-Analysen, Nr. 51/09, Deutsches Polen-Institut Darmstadt und Forschungsstelle Osteuropa, Bremen 2009, s. 4. 3 N. Baisakova, T. Herzfeld: Aspekte der Agrarpolitik 2013. German Journal of Agricultural Economics, 63 (2014) (Supplement), s. 5. 4 Motyw ten brzmi następująco: „Uwzględniając potrzebę, aby jednolite wsparcie dla rolników posiadających małe gospodarstwa rolne było wystarczające, aby osiągnąć cel, jakim jest skuteczne wsparcie dochodu, należy zezwolić państwom członkowskim na ponowny rozdział wsparcia bezpośredniego między rolników poprzez przyznanie im dodatkowej płatności za pierwsze hektary.”. 5 J.E. Stiglitz: Ekonomia sektora publicznego. Wydawnictwo Naukowe PWN, Warszawa 2004, s. 20-21.

172
3) przedyskutowanie wyników przeprowadzonych badań. Tego rodzaju badania pozwalają bardziej świadomie i racjonalnie projektować kształt tego instrumentu – tak, aby stanowił on jak najlepsze narzędzie osiągania stawianych przed nim celów.
Metodyka badań i materiał źródłowy W ramach przeprowadzonych badań, wykorzystując metody ilościowe, dokonano symulacji skutków zastosowania alternatywnych opcji wdrożeniowych płatności redystrybucyjnej w Polsce, co umożliwiło przeprowadzenie komparatywnej analizy wariantowej. Zmierzono wpływ następujących zmian w zasadach przyznawania lub poziomie finansowania płatności redystrybucyjnej na średnią kwotę wsparcia na hektar w gospodarstwie w zależności od jego wielkości:
a) zwiększenie poziomu finansowania płatności redystrybucyjnej do maksymalnego dopuszczalnego przepisami unijnymi poziomu, to jest do 30% pułapu krajowego (wariant I).
b) maksymalne rozszerzenie przedziału hektarów objętego płatnością redystrybucyjną, to jest objęcie wsparciem „pierwszych hektarów” w gospodarstwie w liczbie nie większej niż 30 (wariant II).
c) zwiększenie poziomu finansowania płatności redystrybucyjnej do 30% pułapu krajowego, a jednocześnie objęcie wsparciem „pierwszych hektarów” w gospodarstwie w liczbie nie większej niż 30 (wariant III).
Do pomiaru nierównomierności rozdziału łącznej puli środków, rozdysponowywanych w ramach systemu wsparcia bezpośredniego, między poszczególnych rolników stanowiących zbiorowość beneficjentów tego systemu, posłużono się współczynnikiem Giniego.
Materiał źródłowy stanowiły dane Ministerstwa Rolnictwa i Rozwoju Wsi oraz Agencji Restrukturyzacji i Modernizacji Rolnictwa.
Zakres decyzyjności państwa członkowskiego Mając na względzie zasadę subsydiarności, przydzielono państwom członkowskim
Unii Europejskiej stosunkowo szerokie uprawnienia odnoszące się do płatności redystrybucyjnej. Obejmują one możliwość podjęcia decyzji o stosowaniu bądź niestosowaniu płatności redystrybucyjnej (jej wdrożenie jest bowiem fakultatywne dla państw członkowskich), o poziomie finansowania tego instrumentu (czyli wielkości środków przeznaczonych do wypłaty rolnikom w ramach płatności redystrybucyjnej) oraz o jego kształcie (czyli zasadach przyznawania tej płatności).
Zgodnie z przepisami unijnymi, w danym państwie członkowskim w ramach płatności redystrybucyjnej może zostać wypłacona rolnikom łączna kwota w wysokości nie przekraczającej 30% tzw. pułapu krajowego, to jest całkowitej puli środków przydzielonych temu państwu na dany rok do rozdysponowania w ramach systemu wsparcia bezpośredniego. Oprócz ograniczenia polegającego na określeniu maksymalnego dopuszczalnego łącznego poziomu wsparcia wszystkich beneficjentów płatności redystrybucyjnej, w przepisach unijnych ustanowiono jednocześnie zasadę, że stawka tej płatności nie może przekraczać 65% średniej krajowej płatności na hektar,

173
obliczonej jako stosunek pułapu krajowego na 2019 r. do powierzchni objętej jednolitą płatnością obszarową w 2015 r. Jest to więc ograniczenie polegające na określeniu maksymalnego dopuszczalnego jednostkowego poziomu wsparcia. W razie konieczności, czyli w przypadku gdy stosunek puli środków wydzielonej na finansowanie płatności redystrybucyjnej do powierzchni zatwierdzonej do tej płatności jest wyższy niż 65% średniej krajowej płatności na hektar, państwo członkowskie jest zobowiązane dokonać liniowej redukcji tak wyliczonej pierwotnej stawki płatności redystrybucyjnej, aby rzeczywiście obowiązująca stawka nie przekraczała dopuszczalnego limitu.
Poza wyznaczeniem poziomu finansowania płatności redystrybucyjnej (w granicach limitu ustanowionego w przepisach Unii Europejskiej) państwo członkowskie decyduje o kształcie tego instrumentu, wskazując przedział hektarów w gospodarstwie, który ma być objęty płatnością. Przedział ten musi się jednak mieścić w granicach wyznaczonych przepisami unijnymi. Dolną granicą przedziału, w którym musi się zawierać, bądź z którym musi się pokrywać przedział hektarów w gospodarstwie objęty płatnością redystrybucyjną, jest 0 ha. Natomiast górną granicę stanowi 30 ha albo średnia powierzchnia gospodarstwa w kraju6 – w zależności od tego, który z tych limitów jest wyższy. Ponadto państwo członkowskie ma możliwość progresywnego bądź degresywnego stopniowania stawki płatności w wyodrębnionych podprzedziałach hektarowych.
Zgodnie z propozycjami Komisji Europejskiej co do kształtu Wspólnej Polityki Rolnej po 2020 r.7, w kolejnej perspektywie finansowej państwa członkowskie mają mieć jeszcze większe możliwości kształtowania tego instrumentu8 na poziomie krajowym, przy czym ma to być instrument obligatoryjny dla państw członkowskich. Większa swoboda w kwestii kształtowania tego instrumentu na poziomie krajowym ma kilka źródeł. Po pierwsze, projektowane przepisy unijne, w przeciwieństwie do obecnie obowiązujących, nie określają górnej granicy przedziału hektarowego, do którego może być przyznawana płatność. Po drugie, projektowane przepisy przewidują odejście od ustanawiania dopuszczalnego poziomu finansowania płatności redystrybucyjnej. Po trzecie, projektowane przepisy unijne przewidują złagodzenie ograniczenia odnoszącego się do maksymalnego dopuszczalnego jednostkowego poziomu wsparcia poprzez zwiększenie dopuszczalnej relacji stawki płatności redystrybucyjnej do średniej krajowej płatności na hektar z 65% do 100%. Zmiany te zwiększą potencjał płatności redystrybucyjnej jako instrumentu oddziaływania na rzeczywistość gospodarczą, w tym niwelowania różnic między rolnikami w kwotach otrzymywanego wsparcia.
Wariant wdrożeniowy zastosowany w Polsce Od początku stosowania płatności redystrybucyjnej do bieżącego roku, czyli w okresie 2015-2019, poziom finansowania tego instrumentu w ujęciu kwotowym corocznie
6 Średnie wielkości gospodarstw rolnych w poszczególnych państwach członkowskich zestawiono w załączniku VIII do rozporządzenia Parlamentu Europejskiego i Rady (UE) nr 1307/2013. 7 Propozycje te znalazły wyraz w projekcie rozporządzenia Parlamentu Europejskiego i Rady (COM(2018) 392). 8 Przy czym w wyniku reformy Wspólnej Polityki Rolnej zmieni się nazewnictwo instrumentów wsparcia. Odpowiednikiem płatności redystrybucyjnej w nowym systemie płatności bezpośrednich ma być „uzupełniające redystrybucyjne wsparcie dochodu do celów stabilności”.

174
wzrastał, a w ujęciu względnym – wynosił co najmniej 8,3% pułapu krajowego. Średniorocznie na jego finansowanie przeznaczono niemal 289 mln EUR, co stanowi prawie 8,5% średniorocznego pułapu krajowego obliczonego dla tego okresu. Wysokość stawki płatności redystrybucyjnej w poszczególnych latach analizowanego okresu oscylowała w przedziale między 40 a 42 EUR/ha, a maksymalna kwota wsparcia w ramach tego instrumentu – w przedziale między 1 080 a 1 125 EUR. Informacje te zestawiono w tabeli 1. Tabela 1. Poziom finansowania i stawka płatności redystrybucyjnej oraz maksymalna kwota wsparcia na gospodarstwo w ramach tego instrumentu w Polsce w latach 2015-2019
Rok 2015 2016 2017 2018 2019
Poziom finansowania mln EUR 280,42 281,81 289,80 293,93 298,04
% pułapu krajowego 8,30% 8,30% 8,49% 8,57% 8,64%
Stawka EUR/ha 40,07 40,01 41,13 41,62 42,25 Maksymalna jednostkowa kwota wsparcia
EUR/gospodarstwo 1 081,89 1 080,27 1 110,51 1 123,74 1 140,76
Źródło: opracowanie własne na podstawie danych Ministerstwa Rolnictwa i Rozwoju Wsi.
Stawka płatności redystrybucyjnej w Polsce – jako że zgodnie z przepisami unijnymi nie może przekraczać 65% średniej krajowej płatności na hektar – nie może być wyższa niż 158,63 EUR/ha9. W odniesieniu do płatności redystrybucyjnej przyznawanej na obecnych zasadach ograniczenie to jest tylko pozorne. Przekroczenie poziomu 65% średniej krajowej płatności na hektar wymagałoby bowiem niemal czterokrotnego zwiększenia poziomu finansowania płatności redystrybucyjnej, podczas gdy – ze względu na limit w wysokości 30% pułapu krajowego – możliwe byłoby zwiększenie tego poziomu ok. 3,5-krotnie.
Kolejnym ograniczeniem przy projektowaniu rozwiązań dotyczących płatności redystrybucyjnej na poziomie krajowym – obok dopuszczalnego poziomu finansowania (wyrażonego jako odsetek pułapu krajowego) i dopuszczalnej wysokości stawki płatności (wyrażonej jako odsetek średniej krajowej płatności na hektar) – jest górna granica przedziału hektarów w gospodarstwie, który może być objęty wsparciem w ramach tego instrumentu. Ze względu na to, że średnia powierzchnia gospodarstwa w Polsce jest mniejsza niż 30 ha (wynosi 6 ha), w przypadku Polski tę górną granicę stanowi 30 ha.
Projektując płatność redystrybucyjną na poziomie krajowym uznano, że grupą docelową pomocy dystrybuowanej w ramach tego instrumentu mają być gospodarstwa średniej wielkości, które – nie osiągając tak dużych korzyści ze skali produkcji, jak gospodarstwa największe – dysponują jednak znaczącym potencjałem rozwojowym10. W związku z tym zdecydowano się na objęcie płatnością redystrybucyjną przedziału
9 Średnia krajowa płatność na hektar wynosi w przypadku Polski 244,05 EUR/ha. 10 Ministerstwo Rolnictwa i Rozwoju Wsi: Projekt systemu płatności bezpośrednich w latach 2015-2020. Warszawa 2015, s. 11.
175
hektarów (3; 30]11. Takie rozwiązanie dopuszcza Komisja Europejska, uznając je za szczególny przypadek gradacji stawki12 – z zerową stawką dla początkowego przedziału hektarów (0; 3]. Z noty informacyjnej Komisji Europejskiej dotyczącej implementacji przez państwa członkowskie płatności redystrybucyjnej w latach 2015-202013 wynika, że Polska jest jedynym krajem stosującym dolny próg w wysokości innej niż 0 ha.
Zatem płatność redystrybucyjna jest przyznawana w Polsce do nadwyżki powierzchni użytków rolnych w gospodarstwie, do której przyznano jednolitą płatnością obszarową, ponad 3 ha, nie większej jednak niż 27 ha. Stąd maksymalną roczną kwotę wsparcia pojedynczego gospodarstwa w ramach płatności redystrybucyjnej w danym roku stanowi iloczyn 27 ha i stawki płatności za dany rok. Kwoty w tej wysokości otrzymują wszystkie gospodarstwa, w których powierzchnia użytków rolnych objęta jednolitą płatnością obszarową wynosi przynajmniej 30 ha. Ich wysokość dla poszczególnych lat zestawiono w ostatnim wierszu tabeli 1.
Grupa obszarowa gospodarstw korzystająca na obecnie stosowanym rozwiązaniu Konsekwencją wydzielenia określonej kwoty na finansowanie płatności redystrybucyjnej jest niższy o tę właśnie kwotę poziom finansowania jednolitej płatności obszarowej. Dlatego stosowanie płatności redystrybucyjnej jest korzystne de facto tylko dla części jej beneficjentów. Każdy beneficjent płatności redystrybucyjnej jest bowiem jednocześnie beneficjentem jednolitej płatności obszarowej, zatem z punktu widzenia gospodarstwa będącego beneficjentem płatności redystrybucyjnej istotny jest bilans netto realokacji środków między tymi instrumentami, czyli różnica między przyznaną kwotą płatności redystrybucyjnej a ubytkiem wsparcia w ramach jednolitej płatności obszarowej. Obliczenie stawki jednolitej płatności obszarowej, która obowiązywałaby w sytuacji niestosowania płatności redystrybucyjnej, umożliwia wyznaczenie granicznych dla efektu redystrybucyjnego wielkości gospodarstw, stanowiących granice przedziałów powierzchniowych gospodarstw tracących/korzystających na stosowaniu płatności redystrybucyjnej.
Z przeprowadzonych obliczeń wynika, że w 2018 r. gospodarstwa o powierzchni mniejszej niż 5,9 ha oraz gospodarstwa o powierzchni większej niż 54,6 ha straciły na wprowadzeniu płatności redystrybucyjnej w obecnym kształcie. Dla tej populacji gospodarstw bilans stosowania płatności redystrybucyjnej jest ujemny. Każde z gospodarstw reprezentujących te grupy obszarowe otrzymałoby większą kwotę
11 Znalazło to odzwierciedlenie w art. 14 ustawy z dnia 5 lutego 2015 r. o płatnościach w ramach systemów wsparcia bezpośredniego (Dz. U. z 2017 r. poz. 278, ze zm.). 12 W przepisach projektowanych na kolejną perspektywę finansową taka możliwość jest dopuszczona wprost poprzez wskazanie, że płatność redystrybucyjna może być ukierunkowana na grupę gospodarstw średniej wielkości. W motywie 29 preambuły do rozporządzenia Parlamentu Europejskiego i Rady (COM(2018) 392) stwierdzono bowiem: „Z uwagi na potwierdzoną potrzebę promowania bardziej zrównoważonego podziału wsparcia na rzecz małych lub średnich gospodarstw rolnych w bardziej widoczny i mierzalny sposób, należy ustanowić na poziomie unijnym specjalną płatność niezwiązaną z wielkością produkcji na hektar, tj. uzupełniające redystrybucyjne wsparcie dochodu do celów stabilności. (…)”, a w art. 26 ust. 2 – „Państwa członkowskie zapewniają redystrybucję wsparcia od większych do mniejszych lub średnich gospodarstw rolnych przez zapewnienie redystrybucyjnego wsparcia dochodu (…)”. 13 European Commission: Redistributive payment. 2016, s. 4.

176
pomocy, gdyby nie stosowano płatności redystrybucyjnej, a w konsekwencji środki przeznaczone na jej finansowanie zostałyby rozdysponowane w ramach jednolitej płatności obszarowej.14 Z kolei gospodarstwa o powierzchni większej niż 5,9 ha, ale mniejszej niż 54,6 ha korzystają na stosowaniu płatności redystrybucyjnej w obecnym kształcie. W ich przypadku ubytek kwoty wsparcia w ramach jednolitej płatności obszarowej jest z nadwyżką kompensowany wielkością środków przyznanych w formie płatności redystrybucyjnej. Natomiast dla gospodarstw o granicznych powierzchniach stosowanie płatności redystrybucyjnej jest neutralne z punktu widzenia kwoty otrzymanej płatności. Zatem przedział wielkości gospodarstw korzystających na stosowaniu płatności redystrybucyjnej (5,9 ha; 54,6 ha) jest szerszy od przedziału hektarów w gospodarstwie, do których przyznawana jest ta płatność (3 ha; 30 ha], i przesunięty względem niego w prawo.
Ogólnie rzecz biorąc, gospodarstwa zyskujące na wprowadzeniu płatności redystrybucyjnej to te gospodarstwa, w których łączna kwota wsparcia w ramach jednolitej płatności obszarowej i płatności redystrybucyjnej podzielona przez powierzchnię użytków rolnych jest wyższa niż stawka jednolitej płatności obszarowej, która obowiązywałaby w sytuacji niestosowania płatności redystrybucyjnej. Obrazuje to rysunek 1, na którym linia ciągła wykreślona dla wariantu zastosowanego w 2018 r. przebiega nad poziomą kropkowaną kreską wykreśloną dla wariantu alternatywnego bez płatności redystrybucyjnej w przypadku gospodarstw o powierzchni większej niż 5,9 ha, ale mniejszej niż 54,6 ha.
14 Należy zauważyć, że płatności redystrybucyjnej nie otrzymują jedynie gospodarstwa o powierzchni do 3 ha. Zatem tylko część gospodarstw tracących na stosowaniu płatności redystrybucyjnej w obecnym kształcie nie otrzymuje tej płatności.

177
Rysunek 1. Wysokość średniej kwoty wsparcia na hektar w ramach jednolitej płatności obszarowej i płatności redystrybucyjnej (wariant zastosowany w 2018 r.) bądź wyłącznie w ramach jednolitej płatności obszarowej (wariant bez płatności redystrybucyjnej) w zależności od wielkości gospodarstwa Źródło: opracowanie własne na podstawie danych Agencji Restrukturyzacji i Modernizacji Rolnictwa.
W zastosowanym wariancie średnia kwota wsparcia na hektar gruntów jest stała
i równa stawce jednolitej płatności obszarowej jedynie dla gospodarstw o powierzchni nie większej niż 3 ha (obrazuje to poziomy początkowy odcinek ciągłej linii na rysunku 1). Wraz z przekroczeniem dolnej granicy przedziału hektarów w gospodarstwie objętego płatnością redystrybucyjną, średnia kwota wsparcia na hektar gruntów rośnie aż do osiągnięcia górnej granicy tego przedziału. Zatem najwyższą średnią osiągną gospodarstwa o powierzchni równej 30 ha (przy tej wielkości gospodarstwa wykres funkcji wykreślony na rysunku 1 linią ciągłą osiąga apogeum). Wraz z dalszym wzrostem wielkości gospodarstwa średnia kwota wsparcia na hektar maleje, zbliżając się asymptotycznie do linii poziomej, która byłaby wykreślona na wysokości stawki jednolitej płatności obszarowej (to jest 107,35 EUR/ha). Dzieje się tak dopóty, dopóki nie ujawnią się skutki stosowania tzw. mechanizmu redukcji płatności, ustanowionego w art. 11 rozporządzenia Parlamentu Europejskiego i Rady (UE) nr 1307/2013. W 2018 r. w Polsce stosowanie tego mechanizmu oddziaływało na gospodarstwa o powierzchni przekraczającej 1 397,3 ha15, dlatego od tego momentu dynamika spadku średniej kwoty wsparcia na hektar gruntów jest większa.
15 W Polsce zastosowano współczynnik redukcji w maksymalnej wysokości (czyli 100%), co oznacza, że pojedyncze gospodarstwo może otrzymać jednolitą płatność obszarową w kwocie nie większej niż 150 tys. EUR. Zatem graniczny próg wielkościowy gospodarstwa, którego przekroczenie skutkuje redukcją płatności, można obliczyć, dzieląc 150 tys. EUR przez stawkę jednolitej płatności obszarowej (107,35 EUR/ha).
100
110
120
130
140
150
0 2 4 6 8 10 12 14 16 18 20 22 24 26 28 30 32 34 36 38 40 42 44 46 48 50 52 54 56 58 60
wielkość gospodarstwa (ha)
Śred
ni p
ozio
m w
spar
cia
(EU
R/h
a)
wariant zastosowany w 2018 r. wariant bez płatności redystrybucyjnej
178
Natomiast w wariancie bez płatności redystrybucyjnej w przypadku wszystkich gospodarstw o powierzchni nie większej niż 1 172,5 ha16, średnia kwota wsparcia na hektar w ramach jednolitej płatności obszarowej i płatności redystrybucyjnej w istocie równałaby się stawce jednolitej płatności obszarowej. Rysunek 1 nie sięga tak dużych argumentów funkcji, dlatego średnia kwota wsparcia na hektar dla tego wariantu jest obrazowana dla całego ujętego na rysunku zakresu zmienności wielkości gospodarstwa linią poziomą (kropkowaną). Gospodarstwa przekraczające próg powierzchniowy w wysokości 1 172,5 ha byłyby objęte mechanizmem redukcji płatności, wskutek czego od tego momentu średnia kwota wsparcia na hektar malałaby wraz ze wzrostem wielkości gospodarstwa.
Symulacja skutków zastosowania przykładowych opcji alternatywnych Przedmiotem porównawczej analizy wariantowej w niniejszej części artykułu są następujące zmiany w obszarze poziomu finansowania lub kształtu płatności redystrybucyjnej na poziomie krajowym:
a) Wariant I – zwiększenie poziomu finansowania płatności redystrybucyjnej do maksymalnego dopuszczalnego przepisami unijnymi poziomu (to jest do 30% pułapu krajowego). Zwiększenie puli środków przeznaczonej na płatność redystrybucyjną odbywa się kosztem jednolitej płatności obszarowej. Konsekwencją zmiany poziomu finansowania płatności redystrybucyjnej jest zatem taka sama co do wartości bezwzględnej, a przeciwna co do kierunku zmiana poziomu finansowania jednolitej płatności obszarowej. W wariancie tym zasady przyznawania płatności redystrybucyjnej nie różnią się od dotychczas stosowanych, czyli wsparcie w ramach tego instrumentu kierowane jest do hektarów z przedziału (3; 30], a stawka płatności jest stała w całym przedziale hektarowym objętym pomocą.
b) Wariant II – maksymalne rozszerzenie przedziału hektarów objętego płatnością redystrybucyjną (to jest objęcie wsparciem „pierwszych hektarów” w gospodarstwie w liczbie nie większej niż 30). W wariancie tym przewiduje się zmianę zasad przyznawania płatności redystrybucyjnej przy zachowaniu obecnego rocznego poziomu finansowania tego instrumentu w ujęciu absolutnym, wynoszącego niecałe 294 mln EUR. Brak zmian w poziomie finansowania płatności redystrybucyjnej w ujęciu kwotowym oznacza automatycznie brak zmian (w stosunku do obecnie stosowanego rozwiązania) w kwotach jednolitej płatności obszarowej przyznanej poszczególnym gospodarstwom. Zmiana zasad przyznawania płatności redystrybucyjnej w porównaniu do dotychczas stosowanego rozwiązania polega na objęciu płatnością również hektarów z przedziału (0; 3]. Po tej modyfikacji przedział hektarowy, do którego kierowane jest wsparcie w
16 Tę graniczną wielkość gospodarstwa obliczono w ten sam sposób, jak dla wcześniej omawianego wariantu, czyli dzieląc 150 tys. EUR przez stawkę jednolitej płatności obszarowej, przy czym dla omawianego w tym miejscu wariantu stawka jednolitej płatności obszarowej jest wyższa (wynosi 127,93 EUR/ha), stąd w wyniku dzielenia otrzymano mniejszą graniczną wielkość gospodarstwa.

179
ramach płatności redystrybucyjnej, to (0; 30]. Biorąc pod uwagę unijne regulacje dotyczące płatności redystrybucyjnej, jest to najszerszy zakres hektarowy możliwy do zastosowania w przypadku Polski.
c) Wariant III – zwiększenie poziomu finansowania płatności redystrybucyjnej do 30% pułapu krajowego, a jednocześnie objęcie wsparciem „pierwszych hektarów” w gospodarstwie w liczbie nie większej niż 30. Wariant ten łączy w sobie obie opisane wyżej modyfikacje stanowiące warianty I i II.
Dokonano kwantyfikacji wpływu zastosowania tych wariantów na średnią kwotę wsparcia w gospodarstwie, a wyniki pomiarów zwizualizowano przy pomocy wykresów.
Wyniki symulacji obrazującej, jak kształtowałby się średni poziom wsparcia gospodarstwa rolnego na jednostkę powierzchni użytków rolnych (w ramach jednolitej płatności obszarowej oraz płatności redystrybucyjnej) w zależności od wielkości gospodarstwa oraz zastosowanego wariantu wdrożeniowego płatności redystrybucyjnej, przedstawiono na rysunku 2.
Z rysunku 2 wynika, że w stosunku do obecnie stosowanego wariantu: a) wariant I poprawia sytuację finansową gospodarstw o powierzchni większej niż
5,9 ha, ale mniejszej niż 54,6 ha kosztem wszystkich pozostałych gospodarstw; b) wariant II poprawia sytuację finansową gospodarstw o powierzchni do 9,0 ha
kosztem wszystkich pozostałych gospodarstw; c) wariant III poprawia sytuację finansową gospodarstw o powierzchni nie
przekraczającej 35,2 ha kosztem wszystkich pozostałych gospodarstw. Ponadto na podstawie rysunku 2 można stwierdzić, że wariant I cechuje największe, a wariant II najmniejsze zróżnicowanie średniego poziomu wsparcia na hektar między gospodarstwami.

180
Rysunek 2. Wysokość średniej kwoty wsparcia na hektar w ramach jednolitej płatności obszarowej i płatności redystrybucyjnej w zależności od wielkości gospodarstwa w różnych wariantach wdrożeniowych płatności redystrybucyjnej Źródło: opracowanie własne na podstawie danych Agencji Restrukturyzacji i Modernizacji Rolnictwa.
Dodatkowo można zauważyć, że w przypadku wariantów, w których dolna granica
przedziału objętego płatnością redystrybucyjną jest większa od 0 (wariant zastosowany w 2018 r. i wariant I), największą średnią kwotę wsparcia na hektar powierzchni gruntów otrzymałyby gospodarstwa o powierzchni równej górnej granicy przedziału hektarów w gospodarstwie objętego płatnością redystrybucyjną (wykres analizowanej funkcji osiąga apogeum dla 30). Natomiast w przypadku wariantów, w których płatność redystrybucyjna byłaby przyznawana od „pierwszych hektarów” (wariant II i wariant III) najwyższą kwotę wsparcia na hektar otrzymałyby gospodarstwa o powierzchni nie większej niż górna granica tego przedziału.
Koncentracja pomocy dystrybuowanej w ramach systemu wsparcia bezpośredniego Cechą charakterystyczną pomocy rozdzielanej w ramach systemu wsparcia bezpośredniego dla rolników jest duża koncentracja. Jest to konsekwencją – wynikającego z zasad przyznawania płatności – silnego związku między kwotą otrzymanego wsparcia a powierzchnią gospodarstwa, w warunkach dużego zróżnicowania gospodarstw pod względem wielkości mierzonej powierzchnią
50
70
90
110
130
150
170
190
0 2 4 6 8 10121416182022242628303234363840424446485052545658606264666870
wielkość gospodarstwa (ha)
Śred
ni p
ozio
m w
spar
cia
(EU
R/h
a)
wariant zastosowany w 2018 r. wariant alternatywny I
wariant alternatywny II wariant alternatywny III

użytkowanredystrybu
Rysunek 3. RbezpośrednieŹródło: oprac
Wspó
bezpośredn0,63. Ten sniższy, mim
Wartoto zobrazo2018 r. najlicznych gopolskim. pomoc zos
17 A. Sadłowanaliza nierówRolnej, 4(353
nych gruntówucyjna czy mec
Regionalne zróżngo w 2018 r.
cowanie własne n
ółczynnik konniego obliczonsam wskaźnikmo że wówczości współczyowane na kartjwiększa częśgospodarstw Natomiast na
stała rozdzielo
wski: Podział śrownomierności i in3) 2017, s. 175.
w. Koncentracchanizm redu
icowanie koncen
na podstawie dany
ncentracji pomny dla Polski
k obliczony dlzas nie stosowynnika Giniegogramie przedść pomocy zaaw wojewódz
ajbardziej rówona w wojewó
odków w ramachnstrumenty redys
cję tę zmniejkcji płatności
ntracji pomocy dy
ych Agencji Rest
mocy dystrybu na podstawiea 2014 r. wynano jeszcze pł
go są dość silndstawionym nabsorbowanejztwach Polskiwnomiernie, wództwie podlas
h systemu wsparcstrybucyjne wpro
szają instrum.
ystrybuowanej w r
trukturyzacji i Mo
uowanej w rae danych doty
niósł natomiasłatności redysnie zróżnicowna rysunku 3, przez dany ri Zachodniej
w porównaniu skim.
cia bezpośrednieowadzone w 2015
menty takie ja
ramach systemu w
odernizacji Rolni
amach systemyczących 201t 0,6117, a wię
strybucyjnej. wane regionaln
z którego wyegion trafiła d
oraz w wojdo innych w
ego pomiędzy be5 roku. Zagadnien
181
ak płatność
wsparcia
ctwa.
mu wsparcia 8 r. wynosi ęc był nieco
nie. Zostało ynika, że w do najmniej jewództwie ojewództw,
eneficjentów – nia Ekonomiki

182
Podsumowanie Przepisy Unii Europejskiej umożliwiają państwom członkowskim w dużym stopniu samodzielne zaprojektowanie płatności redystrybucyjnej. Daje to możliwość ukształtowania tego instrumentu stosownie do lokalnych uwarunkowań i priorytetów przyjętych na poziomie krajowym.
Płatność redystrybucyjna może być instrumentem pobudzania pozytywnych zmian strukturalnych w rolnictwie. Nieobejmowanie płatnością pewnego zakresu „pierwszych hektarów” (co jest równoznaczne z wyłączeniem najmniejszych rolników z grona beneficjentów tego instrumentu) pozwala silniej wesprzeć gospodarstwa o preferowanej wielkości, a wysoki poziom finansowania płatności redystrybucyjnej zapewnia przy tym stosunkowo duży rozdźwięk między średnim poziomem wsparcia na hektar w grupie gospodarstw o powierzchni mniejszej niż dolna granica przedziału objętego płatnością redystrybucyjną a gospodarstwami o preferowanej wielkości. Konsekwencją jest relatywne obniżenie zdolności konkurowania na rynku grupy najmniejszych gospodarstw, a jednocześnie stworzenie silniejszych bodźców do powiększania wielkości obszarowej gospodarstw w celu uzyskiwania wyższych kwot pomocy w przeliczeniu na hektar powierzchni gruntów. W ten sposób płatność redystrybucyjna może przyczyniać się do wzrostu poziomu koncentracji ziemi, a tym samym – do zwiększenia średniej wielkości gospodarstwa, zwłaszcza w drodze powiększania gospodarstw najmniejszych przy jednoczesnym spadku ich liczebności. Takie rozwiązanie może sprzyjać ewolucji sektora rolnego w kierunku sektora w większym stopniu zintegrowanego z otoczeniem i zdolnego do trwałego funkcjonowania na rynku.
Przeciwdziałaniu absorbcji stosunkowo dużej części środków przyznawanych w ramach systemu wsparcia bezpośredniego przez stosunkowo nieliczną grupę gospodarstw (czyli zmniejszaniu koncentracji pomocy dystrybuowanej w ramach tego systemu) sprzyja ustanowienie zasady przyznawania wsparcia w ramach płatności redystrybucyjnej od „pierwszych hektarów” oraz wydzielenie na finansowanie tego instrumentu maksymalnej dopuszczalnej przepisami unijnymi kwoty. Bardziej egalitarny podział środków dystrybuowanych w ramach systemu wsparcia bezpośredniego może mieć pewne uzasadnienie w związku z realizacją celów quasi-socjalnych oraz dążeniem do bardziej sprawiedliwego rozdysponowania środków, zasadniczo może jednak odbywać się kosztem obniżenia efektywności sektora w wytwarzaniu produktów rolnych.
Bibliografia Baisakova N., Herzfeld T.: Aspekte der Agrarpolitik 2013. German Journal of Agricultural Economics, 63 (2014) (Supplement). European Commission: Redistributive payment. 2016. Graca-Gelert P.: Wpływ funduszy unijnych na zróżnicowanie dochodów w Polsce – przykład dopłat bezpośrednich i rent strukturalnych. Nierówności Społeczne a Wzrost Gospodarczy, nr 38 (2/2014). Kwasowski M., Zaleski S.: Die Landwirtschaft in Polen fünf Jahre nach dem Beitritt zur Europäischen Union. Polen-Analysen, Nr. 51/09, Deutsches Polen-Institut Darmstadt und Forschungsstelle Osteuropa, Bremen 2009.

183
Ministerstwo Rolnictwa i Rozwoju Wsi: Projekt systemu płatności bezpośrednich w latach 2015-2020. Warszawa 2015. Projekt rozporządzenia Parlamentu Europejskiego i Rady ustanawiającego przepisy dotyczące wsparcia na podstawie planów strategicznych sporządzanych przez państwa członkowskie w ramach wspólnej polityki rolnej (planów strategicznych WPR) i finansowanych z Europejskiego Funduszu Rolniczego Gwarancji (EFRG) i z Europejskiego Funduszu Rolnego na rzecz Rozwoju Obszarów Wiejskich (EFRROW) oraz uchylającego rozporządzenie Parlamentu Europejskiego i Rady (UE) nr 1305/2013 i rozporządzenie Parlamentu Europejskiego i Rady (UE) nr 1307/2013 (COM(2018) 392). Rozporządzenie Parlamentu Europejskiego i Rady (UE) nr 1307/2013 z dnia 17 grudnia 2013 r. ustanawiające przepisy dotyczące płatności bezpośrednich dla rolników na podstawie systemów wsparcia w ramach wspólnej polityki rolnej oraz uchylające rozporządzenie Rady (WE) nr 637/2008 i rozporządzenie Rady (WE) nr 73/2009 (Dz. Urz. UE L 347 z 20.12.2013, s. 608, ze zm.). Sadłowski A.: Podział środków w ramach systemu wsparcia bezpośredniego pomiędzy beneficjentów – analiza nierównomierności i instrumenty redystrybucyjne wprowadzone w 2015 roku. Zagadnienia Ekonomiki Rolnej, 4(353) 2017. Stiglitz J.E.: Ekonomia sektora publicznego. Wydawnictwo Naukowe PWN, Warszawa 2004. Ustawa z dnia 5 lutego 2015 r. o płatnościach w ramach systemów wsparcia bezpośredniego (Dz. U. z 2017 r. poz. 278, ze zm.).
Summary The article describes a diagnostic study measuring the degree of concentration of the aid which is currently distributed under the direct support system for farmers in Poland; it also presents the regional differentiation in aid concentration. The author conducted a simulation test quantifying the redistributive effects of applying various variants of an instrument equalising the amounts of support granted to farms. This can make the basis for an ex-ante assessment of alternative options of the implementation of redistributive payment. The research enabled the identification of ranges of the areas of farms which benefit from the current shape of redistributive payment and which may benefit from alternative variants given as examples. The final part of the article contains several recommendations on how to design redistributive payment at a national level, depending on the goals to be achieved with this instrument.
Keywords: Common Agricultural Policy, direct payments, redistributive payment, Poland JEL: Q18 Informacja o autorze:
dr Adrian Sadłowski Uniwersytet Kardynała Stefana Wyszyńskiego w Warszawie Wydział Społeczno-Ekonomiczny ul. Wóycickiego 1/3, bud. 23 01-938 Warszawa e-mail: [email protected] ORCID: 0000-0003-2969-4926
184
22 (71) 2019 DOI 10.22630/PEFIM.2019.22.71.35
Bogdan Sojkin Magdalena Ankiel Poznań University of Economics
PURCHASE DETERMINANTS OF DURABLE GOODS FOR RESIDENTS OF LARGE CITIES IN POLAND
The article presents an analysis of purchase determinants for individual consumers of durable
goods in 6 large cities in Poland. The analysis has been based on the outcomes of consumer research carried out in the years 2016 and 2017 at Poznan University of Economics and Business, as well as on other research studies published in Polish publications. The results of the study demonstrate groups of determinants that shape the purchasing decisions of consumers of durable products, as well as their variability in years 2016 and 2017. Keywords: purchasing behavior, purchase determinants, analysis of variance, Poland JEL Codes: D12, D31, M31
Introduction The main objective of this article is to present a comparative analysis of the role and the importance of the purchase determinants of durable goods among residents of selected large cities in Poland (Warsaw, Wrocław, Lublin, Katowice, Białystok, and Poznań). The basic sources of information included in the article are: original material from research carried out in Poland by various research institutions, and the findings of an empirical study conducted in large cities in Poland, which was carried out systematically from 2010 by the Product Marketing Department of the Poznań University of Economics and Business in Poznań, Poland.
The empirical study presented in this article is a continuation and an extension of earlier research conducted in Poznań and the Wielkopolska Province, as well as in other large Polish cities. Earlier studies concentrated on other product categories, such as food, cosmetics, and household chemicals, and their findings are presented in various previous publications [Bartkowiak, Sojkin 2014; Sojkin, 2015; Bartkowiak, Sojkin 2015, Ankiel, Sojkin 2017; Bartkowiak, Sojkin 2017]. In the case of purchase determinants of durable goods, there are fewer articles in the literature, especially when compared to purchase determinants of food, cosmetics, and household chemicals. Also, the discussion regarding these goods and their purchasing determinants mainly focuses on the impact of three factors: price, quality, and brand (either of product, or producer), or mutual relations between those factors (i.e. price/quality). Analyses of other factors such as: product (its characteristics), or consumers and their relationship with the environment, are presented much less often. In English-based literature, this problem is also poorly covered, and in published studies in the
185
field, most focus is placed on selected cultural, social, demographic, psychological, and economic factors in various distribution channels. The main drawback of the publication was a very diversified enumeration of the studied factors, in particular their number (from 6 to 20), problems with definitions of variables, and the structure of the purchasing process [Furaiji, Łatuszyńska, Wawrzyniak 2012, Neethikumar, Aranganatha 2014, Ramya N., Ali M 2016, Kalaiselvi 2017]. Also, researchers in this field concentrate on different product categories such as television sets, refrigerators, furniture or ovens, with the concentration on age as the main control variable for consumer behavior [Hasan 2014, Johar 2015, Mashao, Sukdeo 2018, Zalega 2017].
This article is one of the few articles that present cross-sectional characteristics of the purchase determinants of durable goods among residents of large Polish cities. It is based on the prior identification of 35 key variables that determine purchasing behavior. It should be emphasized that the question of purchase determinants is important due to the systematic increase in the number of durable goods in Polish households, as well as to consumer expectations regarding their quality, usability, and durability1.
The main goal of the research was to identify the primary purchase determinants of durable goods and show their variability in the studied cities. According to the literature in the field, as well as opinions of experts, and representatives of trade enterprises, the most often indicated groups of factors that influence consumer choices are those related to the product (its physical, functional and structural characteristics), consumer (demographic, psychological, economic, and physiological characteristics), and the environment in which the consumer operates (economic, cultural, social, and infrastructural). One can often find obvious, though not always justified, arguments that the purchase of most products is determined by price, quality, and brand [Shopping habits ... 2013; Poles are buying ... 2016]. However, empirical in-depth consumer studies do not always confirm that those variables are critical determinants of consumer decisions.
Research methodology The study presented in this article was carried out between 2016 and 2017, in 6 major Polish cities (all over 250,000 inhabitants) located in different regions of the country. The selection of cities for research was related to the implemented project covering all regions of the country. Research was also carried out in the city of Gdańsk, but formal errors made during its implementation forced the authors to omit this city from their analyses.The size of the research sample in each city was between 350 and 550 consumers, and the research method used was a direct interview technique with a quota selection of the research unit (that included: gender, age, place of residence - district). IBM SPSS Statistics ver. 22 was used to analyze the research data. The main goal of the research was to identify the purchase determinants of durable goods, generally related to household appliances. For this purpose, a
1L. Piskiewicz, M. Radziukiewicz, Zasoby dóbr trwałych w gospodarstwach domowych, Przegląd Statystyczny, GUS, 10/2018, s. 37-55.

186
set of 35 variables was assessed by consumers to identify the relative importance of each factor concerning this segment of products. Those variables were identified in the earlier phase of the research that was conducted among residents of the city of Poznan and the Wielkopolskie voivodeship. Also, the findings were verified by the results of consumer surveys carried out by other research centers, as well as by new proposals submitted by participants during the research process. As a result, a set of 35 variables was identified that represented purchasing determinants of durable goods. The importance of each variable was determined on the five-point Likert scale, and the collected data were analyzed for variation in the variability of each factor based on a one-way analysis of variance - ANOVA2 [Kowal 1998]. The ANOVA method allowed to examine the statistical significance of each factor in cities (average values for the factor) and – based on post-hoc tests - to formulate conclusions regarding the differences/similarities in the behavior of residents in the studied cities.
Determinants of purchases of durable goods
Purchases of durable goods are generally made for households and are a reflection of their needs, which generate total demand as the sum of primary, duplicative, or replacement demand. Therefore, in each of them, the role and significance of determinants can be differentiated, but this issue in the conducted research was not taken into account, and this constitutes a certain cognitive, and interpretative limitation. Therefore, the obtained results in the form of arithmetic means should be treated as aggregated values of consumer assessments without taking into account the impact of the specificity of the need generated by the premise of purchase. The obtained values for purchase determinants of durable goods in each city are presented in Figure 1. Calculated mean values as weights/importance for each factor in each city show that the most important determinants of purchase of durable goods include the following: product quality ( = 4,33), price ( = 4,33 ), usefulness of the product ( = 4,17), product durability ( = 4,15), functionality ( = 4,17) and warranty ( = 4,11). In addition to the above-mentioned, the most important residents indicated as additional/complementary factors such as: improving the quality of life ( = 4,07), technical parameters ( = 4,02), utilization of the old product ( = 3,97), technical solutions ( = 3,88) and product design ( = 3,85).
The lowest values were attributed to: product packaging ( = 2,63), the effect of imitation ( = 2,40), special occasions ( = 2,95), fashion and trends ( = 3,04) and product financing ( = 3,07). Slightly higher values were achieved for: opinions of other people ( = 3,26) and ecological aspects ( = 3,16). It seems that low values of the first four determinants are understandable and fully justified, while the low values attributed to friends' opinions and environmental performance may surprise in the case of durable goods.
2 Values on the Likert scale: value 1 meant 'no significance', value 2 is 'irrelevant (not important)' factor, value 3 is 'moderately important (neither significant nor negligible)', value 4 is a 'significant (important) factor' while value 5 defined the factor as 'decisive (most important)'.

187
According to different studies and practical experience, Word of Mouth Marketing is a significant element of marketing communication in building a product and brand image of durable goods. Also, it is believed that the ecological character of the product is now a social value, and as such, it constitutes an important part of the decision-making process. Our data does not support those notions.
Factors AVERAGE
General Warszawa Wrocław Białystok Katowice Lublin Poznańprice
ecologicality functionality
warranty quality color
repair cost operation cost
country of ease of service
brand producer
fashion/trendy model
imitation effect packaging opinion of technical
life quality income level promotions
product habit
technical service
special occasion durability
uniqueness extra services
product terms of product
product design change in life wear/tear old
Figure 1. Importance of the determinants of buying durable goods Source: Authors’ own research.
Surprisingly low values were also attributed to the following determinants: country of origin ( = 3,17 ), brand ( = 3,57 ), and producer ( = 3,50 ). Those determinants in the past constituted significant premises for the selection of durable goods in Poland. However, globalization, technological progress (modern solutions), comparable value of durable goods

188
offered by almost all producers, and the competitiveness of the market portfolio, result in the diminishing role of those factors in the purchasing decisions of the respondents.
We believe that it is the reflection of the growing purchasing maturity of Polish residents of large cities and their much more advanced market experiences. While imitation, special occasions, packaging, or country of origin were essential determinants in purchasing decisions in the 1990s, they are currently much less important, and this trend seems to continue in the future. Elaborating the analysis through the cross-city comparisons, the following previously stated conclusions, concerning the entire studied population (average) were confirmed:
• price level, quality and functionality/usefulness of a durable good were recognized in each examined city as the most crucial purchase determinants;
• the country of origin, producer, and product brand are not significant determinants of purchasing these goods;
• packaging, the effect of imitation, special occasions, and fashion/trends were considered irrelevant in the purchase of these goods.
The next stage of the research process was a comparison of the significance of the purchase determinants of durable goods in the studied cities. With this regard, a one-way analysis of variance ANOVA was used [Wieczorkowska, Wierzbiński, 2011]. This method of comparing the average values of purchase determinants assumed the homogeneity of variance, which allowed to test the hypothesis about equality of mean values in cities. Obtained values of F statistics showed that the variance from all cities is higher than in each examined city.
Therefore, there were reasons to reject the hypothesis about the equality of the average values of the purchase determinants in the examined cities and the claim that in all cities the variability is significantly different (Table 1).
Hence, to find differences between cities, it was necessary to use the post hoc test (multiple comparison tests/homogeneous comparison tests S-N-K3) which allowed identifying groups of cities whose average level of determinants of food purchases differ significantly.
Further, medium groups (the average for the city) were obtained, which for the same group are not significantly different, while the average for cities included in other groups differs significantly (Table 1). In general, the comparison of the significance of purchase determinants of durable goods (average) in the examined cities, showed the existence of statistically significant differences for all factors. On the other hand, a detailed analysis of the results presented in Table 1 allows distinguishing groups of cities that showed similar importance of purchase determinants.
3 S-N-K – the Student-Newman-Keuls test compares all the averages in pairs using the studentized range distribution (for samples of equal size also performs comparisons with pairs of means within homogeneous subsets, using the step method). The average is sorted from the largest to the smallest, and the largest differences between them are tested first [https://www.ibm.com/support/knowledgecenter/pl].

189
Table 1. Comparison of the importance of the purchase determinants of durable goods
Factor City ANOVA F / p Warszawa Wrocław Białystok Katowice Lublin Poznań
Price 4,341 4,331 4,361 4,201 4,602 4,261 85,576*** Ecological aspects 3,253 2,741 3,153 3,313 3,714 2,962 42,964***
Functionality 4,304 3,911 4,264 4,173 4,334 4,082 49,147*** Warranty 4,152 3,911 4,283 4,021 4,343 4,021 43,503***
Product quality 4,493 4,251 4,372 4,271 4,392 4,231 51,539*** Colour 3,682 3,391 3,993 3,562 4,063 3,331 32,080***
Cost of repair 3,954 3,181 3,944 3,663 4,175 3,512 45,675*** Operating costs 4,195 3,301 4,064 3,763 4,245 3,662 52,194***
Country of origin 3,503 2,781 3,363 3,192 3,764 2,741 53,131*** Ease of use 4,043 3,822 3,882 3,802 4,224 3,661 26,571***
Brand 3,934 3,191 3,723 3,552 4,145 3,161 53,472*** Producer 3,793 3,091 3,632 3,512 3,923 3,211 33,833***
Fashion / trends 3,534 2,401 3,133 3,033 3,695 2,622 74,236*** Type 3,904 3,272 3,443 3,453 4,085 3,091 49,305***
The effect of imitation 2,834 1,711 2,413 2,052 3,425 2,102 141,838*** Packaging 2,754 1,971 2,894 2,523 3,795 2,212 115,970***
Opinion of other people 3,432 3,001 3,111 3,021 3,903 3,141 31,023***
Technical parameters 4,194 3,892 4,043 3,942 4,304 3,842 32,560*** Improving the quality
of life 4,203 3,741 4,243 3,932 4,404 3,952 46,118***
Income level 4,043 3,922 3,953 3,882 4,134 3,791 9,457*** Promotion 4,034 3,341 3,733 3,542 4,104 3,341 43,963***
Usefulness of the product 4,385 4,142 4,243 4,041 4,324 3,991 57,247***
Habit 3,954 3,181 3,904 3,773 4,255 3,562 47,947*** Technological
solutions 4,134 3,772 3,973 3,792 4,295 3,561 41,532***
Service 4,024 3,581 3,873 3,672 4,225 3,471 37,193*** Special occasion 3,183 2,151 3,464 2,572 3,715 2,712 92,532***
Product durability 4,303 4,152 4,212 4,112 4,283 3,981 47,220*** the uniqueness of the
product 3,344 2,491 3,424 3,223 3,735 2,712 64,972***
Additional services 3,694 3,031 3,463 3,322 3,985 3,011 46,256*** Product financing 3,333 2,742 3,383 2,852 3,804 2,621 55,566*** Terms of payment 3,363 3,112 3,343 2,972 3,884 2,761 39,188***
Product dimensions 4,003 3,682 3,873 3,251 4,134 3,261 56,056*** Design 4,053 3,752 4,003 3,762 4,204 3,551 35,046***
Change of life situation 3,453 2,531 3,634 3,222 3,824 3,152 41,590***
Product wear/tear 4,122 3,911 4,082 3,791 4,172 3,811 49,533*** values 1,2,3 ... in the upper index means membership in groups due to the importance of the factor in individual cities; F - value of F statistics; p - level of significance; * p≤ 0.05; ** p≤ 0.01; *** p≤ 0.001 Source: Authors’ own research.

190
Table 2 presents groups of cities from 1 to 5 concerning the six determinants which were indicated in the research as the most critical factors of the purchasing process. Table 2 illustrates the level of variation in the assessment of determinants' significance divided into groups, but with similar values achieved in each city. They are also considered the most significant when overall averages are compared.
Referring to the most critical purchase determinants, we can observe that in the case of prices, the group of cities was composed of Warsaw, Wrocław, Katowice, Białystok, Poznań, and Lublin, with the last city performing slightly differently. In other words - surveyed residents in almost every city pointed to the importance of this factor in their decisions of buying durable goods. Table 2. The most important determinants of the purchase of durable goods by groups of cities
Groups of cities
Determinants of purchase of durable goodPrice Quality Durability Usefulness Functionality Warranty
1 Lublin Warszawa Warszawa Lublin Warszawa
Warszawa Białystok
Lublin
Białystok Lublin
2
Warszawa Wrocław Białystok Katowice Poznań
Lublin Białystok
Wrocław Białystok Katowic
Lublin Katowice Warszawa
3 Wrocław Katowice Poznań
Poznań Białystok Poznań Poznań
Katowice Wrocław
4 Wrocław Wrocław
5 Katowice Poznań
Source: Authors’ own research.
In the case of quality, despite its undoubted importance (high arithmetic mean value), the indications for this factor were different in each city (three groups). On the other hand, the most diversified opinions were identified with regard to the usefulness of durable goods – as much as five groups of cities were distinguished. This determinant was the most important for the residents of Warsaw and Lublin
Summary
Analysis of the determinants of purchase of durable goods allowed to determine the significance of the identified factors and to indicate statistically significant differences in their variability between cities. The presented results of empirical research are confirmed by observations and research results of other institutions and research units, especially those concerning prices and quality of this group of goods. Very low importance of packaging, or the effect of imitation in the case of these goods, was what was expected, but quite a big surprise was the very low assessment of the determinants such as opinions of others (family,

191
friends), country of origin, producer, or brand. Nevertheless, in the case of other determinants of this product category, the formulation of unambiguous conclusions is no longer secure, and even in the case of the cities studied, it is possible to talk about the diversity in their meaning and variability.
The results of the empirical research allowed to confirm unambiguously the priority of price and the perceived quality as the main determinants of consumer decisions. From a practical point of view, the usefulness of this type of analysis boils down to two important dimensions:
• identification of the role and significance of the determinants in the purchasing decisions of clients (not only in the spatial aspect - but economic, demographic and social), and the identification of factors that affect the purchasing behavior of potential customers;
• application of the results by companies operating on this product market (durable goods) and their usefulness for shaping market policies and the selection of most useful tools in the marketing and sales of these products.
Bibliography
Bartkowiak P., Sojkin B., 2014, Determinanty zakupu towarów przez polskich konsumentów, Marketing i Rynek, nr 8. Bartkowiak P., Sojkin B., 2015, Wyznaczniki decyzji zakupowych towarów przez mieszkańców Poznania i Wielkopolski, Ruch Prawniczy, Socjologiczny i Ekonomiczny, nr 1, Poznań. Furaji, F; Latuszyńska, M, Wawrzyniak, A., 2012, An Empirical Study of the Factors Influencing Consumer Behavior in the Electric Appliance Market. Vol 6-3. Hasan A (2014) Consumer Brand Preference for Consumer Durable Goods With Reference to Lucknow District. International Journal of Economics and Management Science 4:217. doi: 10.4172/2162-6359.1000217 Johar, S. 2015, Consumer decision making behavior to purchase of durable goods. International Journal of Applied and Pure Science and Agriculture. Vol 1-15 https://www.ibm.com/support/knowledgecenter/pl Kowal J., 1998, Metody statystyczne w badaniach sondażowych rynku, Wydawnictwo Naukowe PWN, Warszawa – Wrocław. Mashao E.T., Sukdeo N., 2018, Factors that influence consumer behavior in the purchase of durable goods household products, Proceedings of the International Conference on Industrial Engineering and Operations Management, Paris, ss.1668-1678. Neethikumar P. AranganathaT., Determinants of Consumer Behavior towards Durable Goods. A case study of Home Appliances, International Journal of Multi Disciplinary Research - Vol 2 - Issue - 1 - January 2014. Piskiewicz L., M. Radziukiewicz, Zasoby dóbr trwałych w gospodarstwach domowych, Przegląd Statystyczny, GUS, 10/2018. Ramya N., Ali M., 2016, Factors affecting consumer buying behavior, International Journal of Applied Research 2(10). Sojkin B., 2015, Determinanty zakupów towarów konsumpcyjnych mieszkańców polskich miast, Marketing i Rynek, nr 8.
192
Syndicated Price Image Study 2013, ARC Rynek i Opinia, Vocatus, marzec/ kwiecień. Sojkin B., 2013, Zachowania zakupowe i konsumpcyjne mieszkańców i Wielkopolski, IBRKiK, Warszawa. Sojkin B., Bartkowiak P., 2017, Wyznaczniki decyzji zakupowych mieszkańców dużych miast w Polsce w odniesieniu do wybranych towarów FMCG, w: Nauki ekonomiczne w XXI wieku - dylematy, wyzwania, perspektywy. Jubileusz 70-lecia Wydziału Nauk Ekonomicznych Uniwersytetu Ekonomicznego we Wrocławiu / Zając Czesław ( ), 2017, red. Wydawnictwo Uniwersytetu Ekonomicznego we Wrocławiu, ISBN 978-83-7695-665-7, ss.241-250. Wieczorkowska G., Wierzbiński J., 2011, Statystyka od teorii do praktyki, Wydawnictwo Naukowe Scholar, Warszawa. Zalega T, 2017, Determinants considered by Polish seniors when purchasing food and some durable goods, Nierówności społeczne a Wzrost Gospodarczy, nr 51 (3/2017). Zwyczaje zakupowe Polaków, 2013, Shopping Show, Warszawa. Determinanty zakupu dóbr trwałego użytku przez mieszkańców dużych
miast w Polsce
Streszczenie W artykule zaprezentowano analizę czynników zakupu dóbr trwałego użytku w grupach indywidualnych klientów w 6 dużych miastach w Polsce. Analiza oparta została na wynikach badań konsumenckich przeprowadzonych w latach 2016 i 2017 na Uniwersytecie Ekonomicznym w Poznaniu oraz na wynikach innych badań opublikowanych w polskich czasopismach. W wynikach badania zaprezentowano zbiory determinant kształtujące decyzje zakupowe konsumentów dóbr trwałego użytku oraz ich zmienność w latach 2016-2017.
Słowa kluczowe: zachowania nabywcze, determinanty zakupu, analiza wariancji JEL Codes: D12, D31, M31 Information about authors:
prof. dr hab. Bogdan Sojkin Poznań University of Economics e-mail: [email protected] ORCID: 0000-0001-5468-8638
dr hab. Magdalena Ankiel Poznań University of Economics e-mail: [email protected] ORCID: 0000-0003-2594-1600

193
22 (71) 2019 DOI 10.22630/PEFIM.2019.22.71.36
Jacek Strojny Wiesław Musiał Uniwersytet Rolniczy im. Hugona Kołłątaja w Krakowie
Obszary wiejskie w systemie ekonomiczno-społecznym
państw Unii Europejskiej
RURAL AREAS IN THE SOCIO-ECONOMIC SYSTEM OF EU COUNTRIES
W opracowaniu podjęto problem identyfikacji i oceny obszarów wiejskich oraz pośrednich
wiejsko-miejskich krajów Unii Europejskiej. Dla wybranych czterech zmiennych opisujących ich; powierzchnię, udział ludności, udział zatrudnionych i wypracowaną wartość dodaną brutto (GVA) wykonano analizy tabelaryczne, analizę skupień oraz dokonano dyskryminacji informacji statystycznej przy zastosowaniu techniki drzew klasyfikacyjnych. Przeprowadzone badania wskazały na wielowymiarowe zróżnicowanie obszarów wiejskich oraz ich duże, choć zróżnicowane znaczenie w ekonomii poszczególnych krajów. Na wydzielonych stricte obszarach wiejskich krajów UE, które stanowią 49,7% powierzchni, zamieszkuje 34,7% ludności, 26,7% znajduje zatrudnienie na wsi, a udział w wypracowanej wartości dodanej wynosi 13%. Analiza taksonomiczna skutkowała wyodrębnieniem trzech grup (skupień) liczących po osiem państw. Polska w tej kompleksowej ocenie obszarów wiejskich jest podobna do Czech, Danii, Francji, Łotwy i Niemiec. Słowa kluczowe: obszary wiejskie UE, ludność na obszarach wiejskich, wartość dodana brutto (GVA) JEL Codes: Q18, R14, Q15
Wprowadzenie Zainteresowanie nauk ekonomicznych obszarami wiejskimi ma w Europie długą tradycje, lecz badania wskazują, że ich wcześniejsze funkcje gospodarcze i społeczne daleko odbiegały od obecnych. Do końca XIX wieku niemal na całym kontynencie europejskim wsie stanowiły naturalne skupiska ludności zajmujących się rolnictwem i rzemiosłem, głównie z nim związanym. W krajach podlegających silnym procesem industrializacji wsie, gdy były położone w pobliżu ośrodków przemysłowych, zwykle miast, było często wchłaniane urbanistycznie i poddawane selekcji demograficznej celem pozyskania siły roboczej dla rozwijającego się przemysłu. Z czasem wsie stanowiły, także miejsca lokalizacji rozbudowującego się od XIX wieku agrobiznesu, w tym głównie drobnego przetwórstwa żywności, produkcji materiałów budowlanych i narzędzi rolniczych. Obecnie także obszary wiejskie przechodzą intensywne przeobrażenia, których charakter jest regionalnie wysoce zróżnicowany ekonomicznie, społecznie i kulturowo. Nadal jednak Europa – w tym także Polska – pozostaje terytorium, na którym obszary wiejskie stanowią wg różnych klasyfikacji od 80%
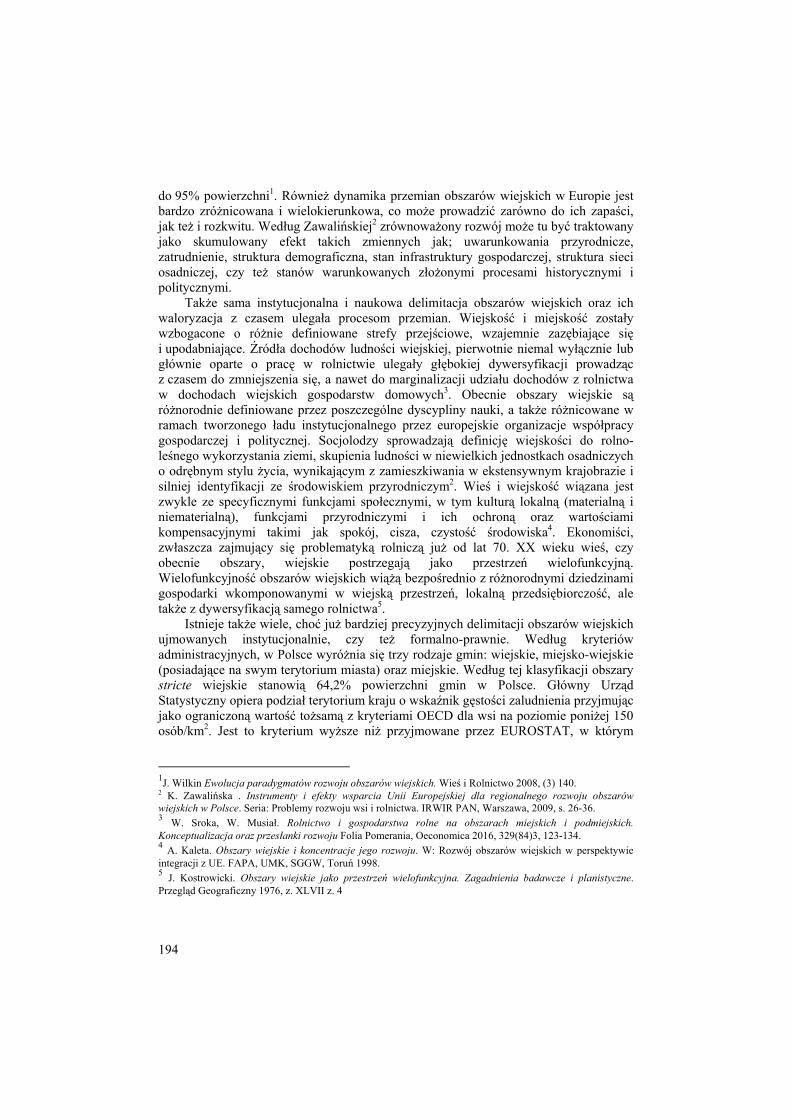
194
do 95% powierzchni1. Również dynamika przemian obszarów wiejskich w Europie jest bardzo zróżnicowana i wielokierunkowa, co może prowadzić zarówno do ich zapaści, jak też i rozkwitu. Według Zawalińskiej2 zrównoważony rozwój może tu być traktowany jako skumulowany efekt takich zmiennych jak; uwarunkowania przyrodnicze, zatrudnienie, struktura demograficzna, stan infrastruktury gospodarczej, struktura sieci osadniczej, czy też stanów warunkowanych złożonymi procesami historycznymi i politycznymi.
Także sama instytucjonalna i naukowa delimitacja obszarów wiejskich oraz ich waloryzacja z czasem ulegała procesom przemian. Wiejskość i miejskość zostały wzbogacone o różnie definiowane strefy przejściowe, wzajemnie zazębiające się i upodabniające. Źródła dochodów ludności wiejskiej, pierwotnie niemal wyłącznie lub głównie oparte o pracę w rolnictwie ulegały głębokiej dywersyfikacji prowadząc z czasem do zmniejszenia się, a nawet do marginalizacji udziału dochodów z rolnictwa w dochodach wiejskich gospodarstw domowych3. Obecnie obszary wiejskie są różnorodnie definiowane przez poszczególne dyscypliny nauki, a także różnicowane w ramach tworzonego ładu instytucjonalnego przez europejskie organizacje współpracy gospodarczej i politycznej. Socjolodzy sprowadzają definicję wiejskości do rolno-leśnego wykorzystania ziemi, skupienia ludności w niewielkich jednostkach osadniczych o odrębnym stylu życia, wynikającym z zamieszkiwania w ekstensywnym krajobrazie i silniej identyfikacji ze środowiskiem przyrodniczym2. Wieś i wiejskość wiązana jest zwykle ze specyficznymi funkcjami społecznymi, w tym kulturą lokalną (materialną i niematerialną), funkcjami przyrodniczymi i ich ochroną oraz wartościami kompensacyjnymi takimi jak spokój, cisza, czystość środowiska4. Ekonomiści, zwłaszcza zajmujący się problematyką rolniczą już od lat 70. XX wieku wieś, czy obecnie obszary, wiejskie postrzegają jako przestrzeń wielofunkcyjną. Wielofunkcyjność obszarów wiejskich wiążą bezpośrednio z różnorodnymi dziedzinami gospodarki wkomponowanymi w wiejską przestrzeń, lokalną przedsiębiorczość, ale także z dywersyfikacją samego rolnictwa5.
Istnieje także wiele, choć już bardziej precyzyjnych delimitacji obszarów wiejskich ujmowanych instytucjonalnie, czy też formalno-prawnie. Według kryteriów administracyjnych, w Polsce wyróżnia się trzy rodzaje gmin: wiejskie, miejsko-wiejskie (posiadające na swym terytorium miasta) oraz miejskie. Według tej klasyfikacji obszary stricte wiejskie stanowią 64,2% powierzchni gmin w Polsce. Główny Urząd Statystyczny opiera podział terytorium kraju o wskaźnik gęstości zaludnienia przyjmując jako ograniczoną wartość tożsamą z kryteriami OECD dla wsi na poziomie poniżej 150 osób/km2. Jest to kryterium wyższe niż przyjmowane przez EUROSTAT, w którym
1J. Wilkin Ewolucja paradygmatów rozwoju obszarów wiejskich. Wieś i Rolnictwo 2008, (3) 140. 2 K. Zawalińska . Instrumenty i efekty wsparcia Unii Europejskiej dla regionalnego rozwoju obszarów wiejskich w Polsce. Seria: Problemy rozwoju wsi i rolnictwa. IRWIR PAN, Warszawa, 2009, s. 26-36. 3 W. Sroka, W. Musiał. Rolnictwo i gospodarstwa rolne na obszarach miejskich i podmiejskich. Konceptualizacja oraz przesłanki rozwoju Folia Pomerania, Oeconomica 2016, 329(84)3, 123-134. 4 A. Kaleta. Obszary wiejskie i koncentracje jego rozwoju. W: Rozwój obszarów wiejskich w perspektywie integracji z UE. FAPA, UMK, SGGW, Toruń 1998. 5 J. Kostrowicki. Obszary wiejskie jako przestrzeń wielofunkcyjna. Zagadnienia badawcze i planistyczne. Przegląd Geograficzny 1976, z. XLVII z. 4

195
graniczna gęstość zaludnienia wynosi 100 osób/km2 6. Dla celów polityki gospodarczej, zwłaszcza krajowej stosowane są także różnorodne typologie obszarów wiejskich, w których wieloaspektowo i w sposób złożony metodycznie analizowany i kwantyfikowany jest ich rozwój gospodarczy, kapitał ludzki, kapitał ekonomiczny, czy też uwarunkowania przyrodnicze, ważne zwłaszcza dla rolniczo-wiejskich aspektów analiz7 8. Dijkstra i Poelmann9 wychodząc od klasyfikacji regionów wprowadzonej przez OECD proponują rozszerzenie jej na pięć kategorii w zależności od czasu dostępu do najbliższego miasta. Autorzy rozważają zasadność przeklasyfikowania regionów odległych (typowo wiejskich) na pośrednie jeżeli czasu dojazdu się zmniejsza. Dijkstra i Ruiz10 prowadzą rozważania nad wpływem czasu dojazdu do ośrodka miejskiego na zatrudnienie i demografię odległych regionów wiejskich.
Celem opracowania była ocena stanu i zakresu zróżnicowania oraz wielowymiarowości problemu i znaczenia obszarów wiejskich w poszczególnych krajach Unii Europejskiej. W opracowaniu dokonano oszacowania wpływu rozpatrywanych czynników na rozważane zagadnienie badawcze.
Metodyka badań Oceny znaczenia obszarów wiejskich w poszczególnych krajach Unii Europejskiej dokonano w oparciu o dane statystyczne EUROSTAT. Zmienne dobrano stosownie do standardowej metodologii oceny polityk rolnych11. W opracowaniu do badań stanu rozwoju i dynamiki zmian na obszarach wiejskich przyjęto cztery wymiary ich oceny, tj. zmienne charakteryzujące:
- udział obszarów wiejskich w ogólnej powierzchni danego kraju, - udział ludności zamieszkującej na obszarach wiejskich w całości struktury
demograficznej kraju, - odsetek zatrudnionych na obszarach wiejskich, - udział obszarów wiejskich w wypracowaniu wartości dodanej brutto.
Zagadnienie badawcze rozpatrywano dla 2000 i 2015 roku. Niemniej, baza danych statystycznych nie zawierała dla niektórych krajów pełnych informacji liczbowych. W przypadku braków danych, dla celów porównań międzyokresowych opierano się odpowiednio na pierwszym i ostatnim z lat, dla których były dostępne informacje statystyczne.
6 K. Zawalińska . Instrumenty i efekty wsparcia Unii Europejskiej dla regionalnego rozwoju obszarów wiejskich w Polsce. Seria: Problemy rozwoju wsi i rolnictwa. IRWIR PAN, Warszawa, 2009, s. 26-36. 7 A. Rosner. Zmiany rozkładu przestrzennego zaludnienia obszarów wiejskich. Wiejskie obszary zmniejszające zaludnienie i koncentracje ludności wiejskiej. Seria: Problemy rozwoju wsi i rolnictwa. IRWIR PAN, Warszawa 2012, s. 53-64. 8 M. Stanny. Poziom rozwoju obszarów wiejskich w Polsce - pomiar zjawiska złożonego. W: Rozwój wsi i rolnictwa w Polsce. Aspekty przestrzenne i regionalne red. Nauk A. Rosner. Seria: Problemy rozwoju wsi i rolnictwa. IRWIR PAN, Warszawa 2012, s. 93-100 9 Dijkstra Lewis, Poelmann Hugo, Remote Rural Regions - How proximity to a city influences the performance of rural regions, DG Regio, European Commission, Brussels 2008 10 Dijkstra Lewis, Ruiz Vicente. Refinement of the OECD regional typology: Economic Performance of Remote Rural Regions, DG Regio, European Commission, Brussels. 2010. 11 Rural Development in the EU. Statistical and Economic Information Report 2013, European Commission, Brussels.

196
Wzorce w zakresie podobieństw obszarów wiejskich wśród krajów UE wykrywano z wykorzystaniem grupowania odwołującego się do metody statystycznej określanej mianem analizy skupień. Segmentacji zbioru informacji statystycznej (dla czterech wskazanych powyżej zmiennych) dla ostatniego okresu badań dokonano z wykorzystaniem hierarchicznej analizy skupień. Podejście tego typu polega na sekwencyjnej próbie identyfikacji struktury skupień rozpatrywanych cech (zmiennych). Funkcją odległości między stanami cech obiektów była odległość euklidesowa. Aglomeracji obiektów dokonano w oparciu o algorytm Warda. Właściwością grupowania hierarchicznego jest brak jawnie zdefiniowanej globalnej funkcji oceny procesu. W to miejsce, celem wyodrębnienia par obiektów (analizowanych krajów) do łączenia lub rozdzielenia zbioru danych, szacowano lokalne oceny par skupień danego hierarchicznego grupowania. Stąd, różne lokalne funkcje oceny mogą skutkować odmiennymi efektami grupowania. Z jednej strony rozstrzygający głos badacza zapewniła elastyczność podejścia do wyróżniania podgrup analizowanego zbioru danych. Z drugiej strony, decyzje odnośnie kształtu delimitacji mogły prowadzić do znacznego zakresu arbitralności wyborów w odniesieniu do segmentacji danych. Niemniej, konieczność zachowania elastyczności ujęcia problemu badawczego wynika z braku jednoznacznych rekomendacji odnośnie charakteru finalnego grupowania. Proces poszukiwania wzorców w danych wykonano korzystając z analizy skupień12 13 14 15.
Badanie z użyciem analizy taksonomicznej objęły dwa powiązane etapy. Pierwszym była segmentacja zbioru informacji statystycznej na możliwie jednorodne grupy. Następnie przeprowadzono statystyczną charakterystykę wyodrębnionych skupień i nadanie im stosownych opisów. Grupowanie obiektów (tj. krajów) nakierowane było na separację zbioru państw UE na podgrupy, aby ich elementy były do siebie podobne, a jednocześnie jak najbardziej odmienne od pozostałych podzbiorów. Profilowania podgrup zidentyfikowanych na etapie analizy skupień dokonano z wykorzystaniem techniki drzew klasyfikacyjnych i regresyjnych (C&RT). Ta hierarchiczna procedura dyskryminacji zbioru danych znalazła odzwierciedlenie w graficznym diagramie w formie drzewa decyzyjnego. Oceny wypływu cech wykorzystywanych do tworzenia skupień na zmienną zależną – kategorie skupień – poszukiwano poprzez rekurencyjne podziały zbioru danych na podzbiory rozłączne metodą C&RT, którymi także identyfikowano podstawę tych podziałów. Budowa modelu wyjaśniającego zależności w zbiorze danych w oparciu o metodę nieparametryczną (jaką jest metoda drzew klasyfikacyjnych) uwalniała od konieczności znajomości rozkładów cech oraz nie wymaga spełnienia często restrykcyjnych założeń formalnych w tym zakresie16.
W opracowaniu zastosowano podział obszarów wiejskich na trzy kategorie: obszary wiejskie), obszary pośrednie (tj. wiejsko-miejskie) oraz razem ujmowane obszary wiejskie i pośrednie. Dla celów delimitacji przyjęto dane faktualne opisu podstaw typologii obszarów wiejskich według EUROSTAT. Obszary wiejskie stanowiły
12 D. Hand, H. Mannila, P. Smyth. Eksploracja danych. Wydawnictwa Naukowo-Techniczne, Warszawa 2005. 13 J. Koronacki, J. Ćwik. Statystyczne systemy uczące się. Exit, Warszawa 2008. 14 Larose D.L. Odkrywanie wiedzy z danych, wprowadzenie do eksploracji danych. Wydawnictwo Naukowe PWN, Warszawa 2007. 15 T. Marek. Analiza skupień w badaniach empirycznych. Metody SAHN. PWN, Warszawa 1989. 16 T. Marek. Analiza skupień w badaniach empirycznych. Metody SAHN. PWN, Warszawa 1989.

197
subregiony wyodrębnione na poziomie NUTS 3, które nie spełniały warunków wyznaczonych dla obszarów miejskich. Delimitacji dokonuje się w oparciu tzw. „gridy” (kwadraty 1x1 km wyznaczone przez linie siatki geograficznej). Dany „grid” jest kwalifikowany jako obszar miejski jeśli wypełnia oba poniższe warunki:
• gęstość zaludnienia na obszarze danego „gridu” wynosi powyżej 300 osób/km2, • minimalna liczba ludności na obszarze danego „gridu” wraz z ośmioma
sąsiadującymi „gridami” wynosi powyżej 5 tys. osób. Natomiast obszary pośrednie tj. wiejsko-miejskie wyodrębniane są w oparciu o kryteria 20-50% udziału ludności zamieszkującej tereny wiejskie. Analizy statystyczne poprzedzono inwentaryzacyjną oceną stanu i rozwoju obszarów wiejskich krajów UE, dla których EUROSTAT zgromadził obszerne (choć niepełne) bazy danych.
Analiza stanu obszarów wiejskich Unii Europejskiej Powierzchnia geograficzna Unii Europejskiej wynosi ogółem 4554,9 tys. km2. W skład tego obszaru wchodzi 4369,4 tys. km2 terenów lądowych oraz 132,3 tys. km2 zajmowanych przez wody. Ogólna powierzchnia obszarów wiejskich i pośrednich wynosi w UE-28 3883,8 tys. km2 z czego na obszary wiejskie przypada 1928,7 tys. km2, tj. 49,7%. Najwięcej w ujęciu bezwzględnym obszarów wiejskich jest we Francji i w Szwecji odpowiednio 582,4 tys. km2 i 381,2 tys. km2.

198
Tab
ela
1. P
owie
rzch
nia,
ludn
ość
zatru
dnie
nie
oraz
war
tość
dod
ana
brut
to (G
VA
) wyp
raco
wan
a na
obs
zara
ch w
iejs
kich
i pośr
edni
ch w
kra
jach
Uni
i Eur
opej
skie
j (ro
k 20
15)*
Kra
j
Pow
ierz
chni
a ob
szar
ów
wie
jski
ch i
pośr
edni
ch
(w k
m2 )
Ludn
ość
na o
bsza
rach
wie
jski
ch i
pośr
edni
ch (1
000
osób
)
Zatru
dnie
nie
na o
bsza
rach
wie
jski
ch i
pośr
edni
ch
(100
0 os
ób)
War
tość
dod
ana
brut
to (G
VA
) w
ypra
cow
ana
na o
bsza
rach
wie
jski
ch i
pośr
edni
ch (m
ln E
uro)
raze
m
w ty
m o
bsza
ry
wie
jski
e ra
zem
w
tym
na
obsz
arac
h w
iejs
kich
ra
zem
w
tym
na
obsz
arac
h w
iejs
kich
ra
zem
w
tym
na
obsz
arac
h w
iejs
kich
A
ustri
a 77
919
,0
63 0
72,0
5
902,
0 3
519,
0 2
847,
6 1
743,
7 19
8 46
0,0
103
681,
0 B
elgi
a 23
284
,0
9 93
9,0
5 24
8,0
954,
0 2
139,
7 35
1,5
146
961,
4 19
463
,9
Buł
garia
10
9 04
1,0
24 3
87,0
5
860,
0 94
3,0
2 31
7,7
351,
8 23
591
,5
3 58
3,5
Cho
rwac
ja
3
423,
0 1
834,
0 1
083,
3 53
8,9
25 0
62,0
12
794
,9
Cyp
r 9
251,
0 0,
0 84
8,0
0,0
350,
0 0,
0 15
588
,9
0,0
Cze
chy
67 3
56,0
28
933
,0
7 96
0,0
2 23
9,0
3 67
0,9
1 05
8,3
96 2
87,4
27
262
,0
Dan
ia
42 4
02,0
22
047
,0
4 40
0,0
1 63
2,0
2 02
4,3
744,
3 15
2 93
2,0
54 5
07,0
Es
toni
a 40
894
,0
36 9
00,0
73
7,0
590,
0 32
1,1
263,
6 6
430,
1 5
284,
3 Fi
nlan
dia
328
872,
0 27
8 88
1,0
3 86
8,0
2 20
2,0
1 58
9,1
897,
5 11
0 20
2,0
61 5
89,5
Fr
ancj
a 58
2 35
6,1
340
824,
8 42
970
,0
20 6
95,0
16
145
,9
7 93
4,5
1 01
6 90
2,0
468
055,
1 G
recj
a 12
4 55
3,0
87 1
98,0
5
905,
0 3
446,
0 1
865,
7 1
050,
0 67
791
,3
39 6
68,8
H
iszp
ania
38
7 94
2,0
85 5
61,0
17
285
,0
1 62
2,0
6 35
5,5
592,
9 32
9 96
2,8
30 0
29,4
H
olan
dia
21 4
94,0
87
7,0
4 41
6,0
106,
0 2
089,
0 50
,9
134
937,
0 3
354,
0 Ir
land
ia
68 8
76,0
62
815
,0
3 36
9,0
2 81
7,0
1 31
3,5
1 08
6,0
102
436,
5 83
062
,3
Litw
a 55
556
,0
8 87
5,0
2 09
7,0
252,
0 91
4,3
104,
6 20
142
,0
1 74
0,4
Luks
embu
rg
2 58
6,0
0,0
558,
0 0,
0 25
5,2
0,0
47 1
91,7
0,
0 Ło
twa
54 1
34,0
25
977
,0
969,
0 45
6,0
396,
3 18
6,5
6 62
0,2
3 05
1,0
Mal
ta
0,0
0,0
0,0
0,0
0,0
0,0
0,0
0,0
Nie
mcy
31
5 47
6,0
137
811,
0 46
340
,0
12 9
02,0
22
954
,6
6 76
6,1
1 32
4 65
6,0
351
817,
2 Po
lska
29
7 25
5,0
163
062,
0 28
711
,0
13 5
04,0
11
512
,8
5 46
5,6
229
018,
9 97
449
,4
Portu
galia
86
369
,0
72 8
28,0
5
563,
0 3
260,
0 2
334,
1 1
332,
2 71
883
,5
41 9
57,0
R
umun
ia
231
804,
3 16
1 67
7,7
17 2
29,0
10
675
,0
7 01
4,2
4 52
1,7
100
176,
4 52
202
,5
Słow
acja
46
982
,0
22 5
73,0
4
793,
0 2
033,
0 2
093,
6 88
2,7
51 1
25,5
20
530
,1
Słow
enia
20
273
,0
14 7
58,2
2
063,
0 1
211,
0 90
1,6
520,
6 33
578
,4
16 5
26,9
Sz
wec
ja
381
208,
0 10
8 16
3,0
4 88
5,0
891,
0 2
241,
6 40
8,7
165
014,
6 29
842
,0
Węg
ry
92 4
86,0
25
666
,0
8 08
1,0
1 86
9,0
3 38
2,9
741,
1 59
123
,3
11 1
69,2
W
ielk
a B
ryta
nia
178
517,
0 73
332
,0
16 5
22,0
2
372,
0 7
615,
7 1
131,
9 49
9 16
5,1
58 8
87,6
Wło
chy
236
871,
0 72
545
,0
31 6
76,0
5
818,
0 11
754
,2
2 10
0,0
742
912,
8 13
0 98
1,2
Raz
em
3 88
3 75
7,0
1928
703
,0
281
678,
0 97
842
,0
117
484,
0 40
826
,0
5 77
8 15
3,0
1728
490,
0 *
w p
rzyp
adku
bra
ków
dan
ych
osta
tnia
dos
tępn
a w
artość
, 0 –
bra
ki d
anyc
h Źr
ódło
: opr
acow
anie
wła
sne
na p
odst
awie
EU
RO
STA
T 20
18.
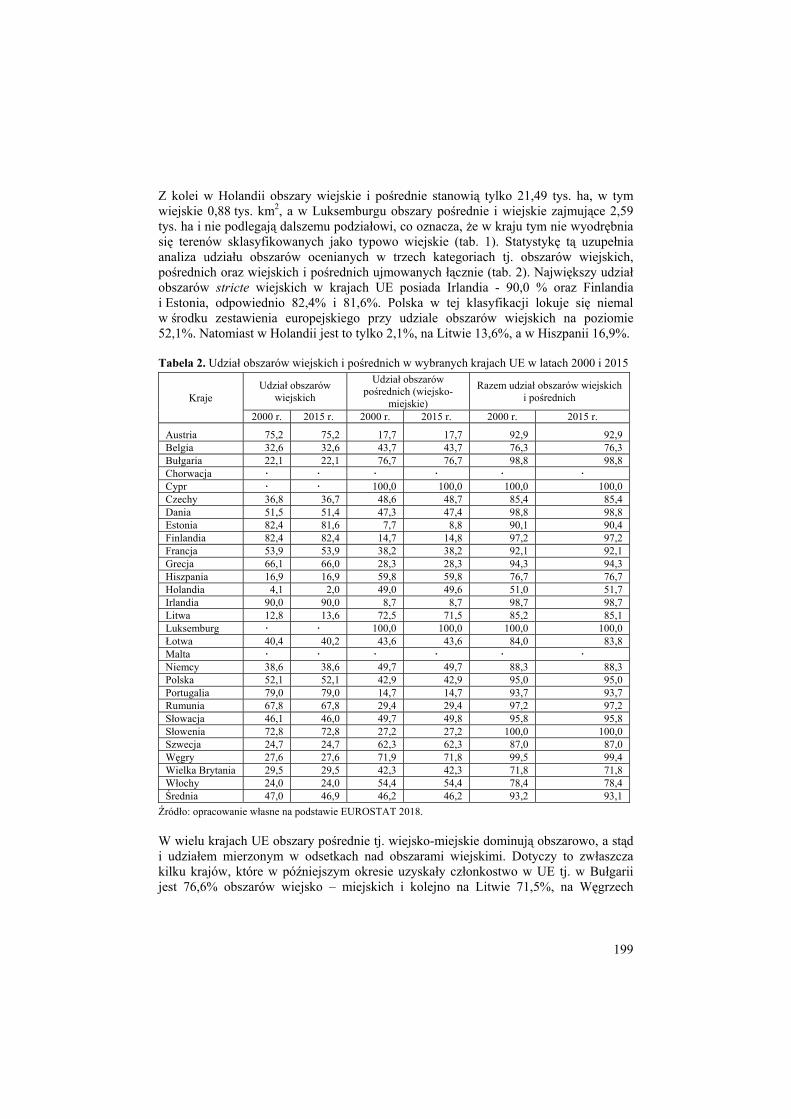
199
Z kolei w Holandii obszary wiejskie i pośrednie stanowią tylko 21,49 tys. ha, w tym wiejskie 0,88 tys. km2, a w Luksemburgu obszary pośrednie i wiejskie zajmujące 2,59 tys. ha i nie podlegają dalszemu podziałowi, co oznacza, że w kraju tym nie wyodrębnia się terenów sklasyfikowanych jako typowo wiejskie (tab. 1). Statystykę tą uzupełnia analiza udziału obszarów ocenianych w trzech kategoriach tj. obszarów wiejskich, pośrednich oraz wiejskich i pośrednich ujmowanych łącznie (tab. 2). Największy udział obszarów stricte wiejskich w krajach UE posiada Irlandia - 90,0 % oraz Finlandia i Estonia, odpowiednio 82,4% i 81,6%. Polska w tej klasyfikacji lokuje się niemal w środku zestawienia europejskiego przy udziale obszarów wiejskich na poziomie 52,1%. Natomiast w Holandii jest to tylko 2,1%, na Litwie 13,6%, a w Hiszpanii 16,9%. Tabela 2. Udział obszarów wiejskich i pośrednich w wybranych krajach UE w latach 2000 i 2015
Kraje Udział obszarów
wiejskich
Udział obszarów pośrednich (wiejsko-
miejskie)
Razem udział obszarów wiejskich i pośrednich
2000 r. 2015 r. 2000 r. 2015 r. 2000 r. 2015 r.
Austria 75,2 75,2 17,7 17,7 92,9 92,9 Belgia 32,6 32,6 43,7 43,7 76,3 76,3 Bułgaria 22,1 22,1 76,7 76,7 98,8 98,8 Chorwacja Cypr 100,0 100,0 100,0 100,0 Czechy 36,8 36,7 48,6 48,7 85,4 85,4 Dania 51,5 51,4 47,3 47,4 98,8 98,8 Estonia 82,4 81,6 7,7 8,8 90,1 90,4 Finlandia 82,4 82,4 14,7 14,8 97,2 97,2 Francja 53,9 53,9 38,2 38,2 92,1 92,1 Grecja 66,1 66,0 28,3 28,3 94,3 94,3 Hiszpania 16,9 16,9 59,8 59,8 76,7 76,7 Holandia 4,1 2,0 49,0 49,6 51,0 51,7 Irlandia 90,0 90,0 8,7 8,7 98,7 98,7 Litwa 12,8 13,6 72,5 71,5 85,2 85,1 Luksemburg 100,0 100,0 100,0 100,0 Łotwa 40,4 40,2 43,6 43,6 84,0 83,8 Malta Niemcy 38,6 38,6 49,7 49,7 88,3 88,3 Polska 52,1 52,1 42,9 42,9 95,0 95,0 Portugalia 79,0 79,0 14,7 14,7 93,7 93,7 Rumunia 67,8 67,8 29,4 29,4 97,2 97,2 Słowacja 46,1 46,0 49,7 49,8 95,8 95,8 Słowenia 72,8 72,8 27,2 27,2 100,0 100,0 Szwecja 24,7 24,7 62,3 62,3 87,0 87,0 Węgry 27,6 27,6 71,9 71,8 99,5 99,4 Wielka Brytania 29,5 29,5 42,3 42,3 71,8 71,8 Włochy 24,0 24,0 54,4 54,4 78,4 78,4 Średnia 47,0 46,9 46,2 46,2 93,2 93,1
Źródło: opracowanie własne na podstawie EUROSTAT 2018. W wielu krajach UE obszary pośrednie tj. wiejsko-miejskie dominują obszarowo, a stąd i udziałem mierzonym w odsetkach nad obszarami wiejskimi. Dotyczy to zwłaszcza kilku krajów, które w późniejszym okresie uzyskały członkostwo w UE tj. w Bułgarii jest 76,6% obszarów wiejsko – miejskich i kolejno na Litwie 71,5%, na Węgrzech
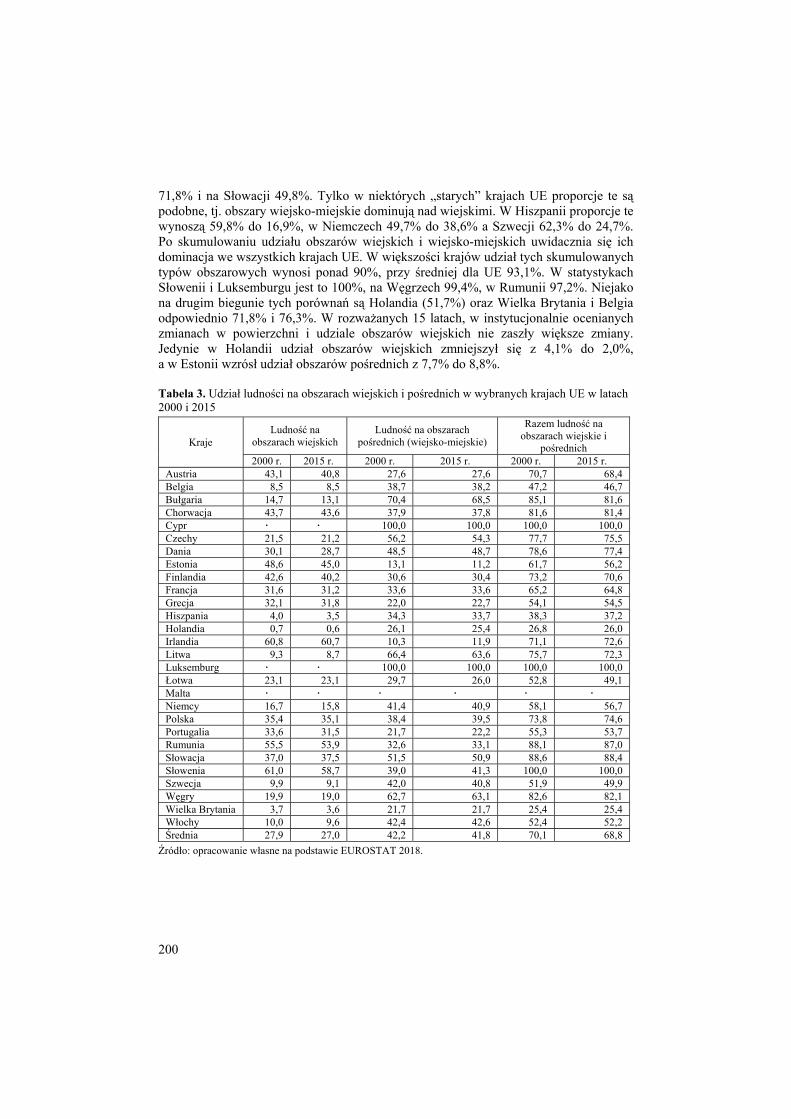
200
71,8% i na Słowacji 49,8%. Tylko w niektórych „starych” krajach UE proporcje te są podobne, tj. obszary wiejsko-miejskie dominują nad wiejskimi. W Hiszpanii proporcje te wynoszą 59,8% do 16,9%, w Niemczech 49,7% do 38,6% a Szwecji 62,3% do 24,7%. Po skumulowaniu udziału obszarów wiejskich i wiejsko-miejskich uwidacznia się ich dominacja we wszystkich krajach UE. W większości krajów udział tych skumulowanych typów obszarowych wynosi ponad 90%, przy średniej dla UE 93,1%. W statystykach Słowenii i Luksemburgu jest to 100%, na Węgrzech 99,4%, w Rumunii 97,2%. Niejako na drugim biegunie tych porównań są Holandia (51,7%) oraz Wielka Brytania i Belgia odpowiednio 71,8% i 76,3%. W rozważanych 15 latach, w instytucjonalnie ocenianych zmianach w powierzchni i udziale obszarów wiejskich nie zaszły większe zmiany. Jedynie w Holandii udział obszarów wiejskich zmniejszył się z 4,1% do 2,0%, a w Estonii wzrósł udział obszarów pośrednich z 7,7% do 8,8%. Tabela 3. Udział ludności na obszarach wiejskich i pośrednich w wybranych krajach UE w latach 2000 i 2015
Kraje Ludność na
obszarach wiejskich Ludność na obszarach
pośrednich (wiejsko-miejskie)
Razem ludność na obszarach wiejskie i
pośrednich 2000 r. 2015 r. 2000 r. 2015 r. 2000 r. 2015 r.
Austria 43,1 40,8 27,6 27,6 70,7 68,4 Belgia 8,5 8,5 38,7 38,2 47,2 46,7 Bułgaria 14,7 13,1 70,4 68,5 85,1 81,6 Chorwacja 43,7 43,6 37,9 37,8 81,6 81,4 Cypr 100,0 100,0 100,0 100,0 Czechy 21,5 21,2 56,2 54,3 77,7 75,5 Dania 30,1 28,7 48,5 48,7 78,6 77,4 Estonia 48,6 45,0 13,1 11,2 61,7 56,2 Finlandia 42,6 40,2 30,6 30,4 73,2 70,6 Francja 31,6 31,2 33,6 33,6 65,2 64,8 Grecja 32,1 31,8 22,0 22,7 54,1 54,5 Hiszpania 4,0 3,5 34,3 33,7 38,3 37,2 Holandia 0,7 0,6 26,1 25,4 26,8 26,0 Irlandia 60,8 60,7 10,3 11,9 71,1 72,6 Litwa 9,3 8,7 66,4 63,6 75,7 72,3 Luksemburg 100,0 100,0 100,0 100,0 Łotwa 23,1 23,1 29,7 26,0 52,8 49,1 Malta Niemcy 16,7 15,8 41,4 40,9 58,1 56,7 Polska 35,4 35,1 38,4 39,5 73,8 74,6 Portugalia 33,6 31,5 21,7 22,2 55,3 53,7 Rumunia 55,5 53,9 32,6 33,1 88,1 87,0 Słowacja 37,0 37,5 51,5 50,9 88,6 88,4 Słowenia 61,0 58,7 39,0 41,3 100,0 100,0 Szwecja 9,9 9,1 42,0 40,8 51,9 49,9 Węgry 19,9 19,0 62,7 63,1 82,6 82,1 Wielka Brytania 3,7 3,6 21,7 21,7 25,4 25,4 Włochy 10,0 9,6 42,4 42,6 52,4 52,2 Średnia 27,9 27,0 42,2 41,8 70,1 68,8
Źródło: opracowanie własne na podstawie EUROSTAT 2018.
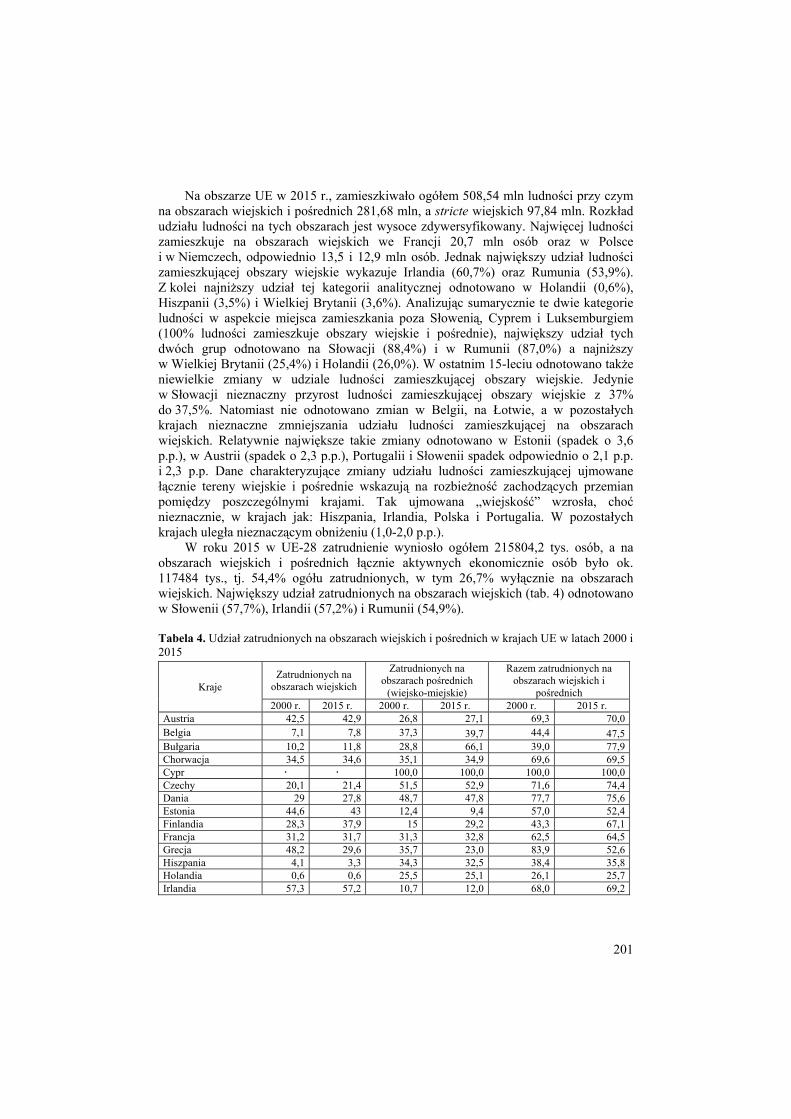
201
Na obszarze UE w 2015 r., zamieszkiwało ogółem 508,54 mln ludności przy czym na obszarach wiejskich i pośrednich 281,68 mln, a stricte wiejskich 97,84 mln. Rozkład udziału ludności na tych obszarach jest wysoce zdywersyfikowany. Najwięcej ludności zamieszkuje na obszarach wiejskich we Francji 20,7 mln osób oraz w Polsce i w Niemczech, odpowiednio 13,5 i 12,9 mln osób. Jednak największy udział ludności zamieszkującej obszary wiejskie wykazuje Irlandia (60,7%) oraz Rumunia (53,9%). Z kolei najniższy udział tej kategorii analitycznej odnotowano w Holandii (0,6%), Hiszpanii (3,5%) i Wielkiej Brytanii (3,6%). Analizując sumarycznie te dwie kategorie ludności w aspekcie miejsca zamieszkania poza Słowenią, Cyprem i Luksemburgiem (100% ludności zamieszkuje obszary wiejskie i pośrednie), największy udział tych dwóch grup odnotowano na Słowacji (88,4%) i w Rumunii (87,0%) a najniższy w Wielkiej Brytanii (25,4%) i Holandii (26,0%). W ostatnim 15-leciu odnotowano także niewielkie zmiany w udziale ludności zamieszkującej obszary wiejskie. Jedynie w Słowacji nieznaczny przyrost ludności zamieszkującej obszary wiejskie z 37% do 37,5%. Natomiast nie odnotowano zmian w Belgii, na Łotwie, a w pozostałych krajach nieznaczne zmniejszania udziału ludności zamieszkującej na obszarach wiejskich. Relatywnie największe takie zmiany odnotowano w Estonii (spadek o 3,6 p.p.), w Austrii (spadek o 2,3 p.p.), Portugalii i Słowenii spadek odpowiednio o 2,1 p.p. i 2,3 p.p. Dane charakteryzujące zmiany udziału ludności zamieszkującej ujmowane łącznie tereny wiejskie i pośrednie wskazują na rozbieżność zachodzących przemian pomiędzy poszczególnymi krajami. Tak ujmowana „wiejskość” wzrosła, choć nieznacznie, w krajach jak: Hiszpania, Irlandia, Polska i Portugalia. W pozostałych krajach uległa nieznaczącym obniżeniu (1,0-2,0 p.p.).
W roku 2015 w UE-28 zatrudnienie wyniosło ogółem 215804,2 tys. osób, a na obszarach wiejskich i pośrednich łącznie aktywnych ekonomicznie osób było ok. 117484 tys., tj. 54,4% ogółu zatrudnionych, w tym 26,7% wyłącznie na obszarach wiejskich. Największy udział zatrudnionych na obszarach wiejskich (tab. 4) odnotowano w Słowenii (57,7%), Irlandii (57,2%) i Rumunii (54,9%). Tabela 4. Udział zatrudnionych na obszarach wiejskich i pośrednich w krajach UE w latach 2000 i 2015
Kraje Zatrudnionych na
obszarach wiejskich
Zatrudnionych na obszarach pośrednich
(wiejsko-miejskie)
Razem zatrudnionych na obszarach wiejskich i
pośrednich 2000 r. 2015 r. 2000 r. 2015 r. 2000 r. 2015 r.
Austria 42,5 42,9 26,8 27,1 69,3 70,0 Belgia 7,1 7,8 37,3 39,7 44,4 47,5 Bułgaria 10,2 11,8 28,8 66,1 39,0 77,9 Chorwacja 34,5 34,6 35,1 34,9 69,6 69,5 Cypr 100,0 100,0 100,0 100,0 Czechy 20,1 21,4 51,5 52,9 71,6 74,4 Dania 29 27,8 48,7 47,8 77,7 75,6 Estonia 44,6 43 12,4 9,4 57,0 52,4 Finlandia 28,3 37,9 15 29,2 43,3 67,1 Francja 31,2 31,7 31,3 32,8 62,5 64,5 Grecja 48,2 29,6 35,7 23,0 83,9 52,6 Hiszpania 4,1 3,3 34,3 32,5 38,4 35,8 Holandia 0,6 0,6 25,5 25,1 26,1 25,7 Irlandia 57,3 57,2 10,7 12,0 68,0 69,2

202
Kraje Zatrudnionych na
obszarach wiejskich
Zatrudnionych na obszarach pośrednich
(wiejsko-miejskie)
Razem zatrudnionych na obszarach wiejskich i
pośrednich 2000 r. 2015 r. 2000 r. 2015 r. 2000 r. 2015 r.
Litwa 9,1 8,0 65,0 62,3 74,1 70,3 Luksemburg 100,0 100,0 100,0 100,0 Łotwa 22,8 21,5 26,2 24,2 49,0 45,7 Malta Niemcy 15,3 17,3 38,3 41,3 53,6 58,6 Polska 27,7 34,6 37,9 38,2 65,6 72,8 Portugalia 44,6 30,9 26,8 23,3 71,4 54,2 Rumunia 57,1 54,9 31,5 30,3 88,6 85,2 Słowacja 35,6 36,7 49,6 50,3 85,2 87,0 Słowenia 58,7 57,7 41,3 42,3 100 100,0 Szwecja 9,5 8,8 40,1 39,3 49,6 48,1 Węgry 18,2 17,7 62,3 63,3 80,5 81,0 Wielka Brytania 4,1 4,4 27,4 25,1 31,5 29,5 Włochy 13,1 9,6 34,2 43,9 47,3 53,5 Średnia 26,9 26,1 39,8 41,3 66,7 67,4 Źródło: opracowanie własne na podstawie EUROSTAT 2018. Na drugim biegunie zatrudnienia na obszarach wiejskich jest Holandia (0,6%), Hiszpania (3,3%) i Wielka Brytania (4,4%). W Polsce udział ten wynosi 34,6% i jest taki sam, jak w Chorwacji i zbliżony do krajów jak Słowacja (36,7%) i Finlandia (37,9%). Na obszarach pośrednich (wiejsko-miejskich) większy udział zatrudnionych niż na obszarach wiejskich odnotowano w takich krajach jak Bułgaria (różnica 54,3%), Litwa (różnice także 54,3%) oraz w Słowenii i na Węgrzech, różnice odpowiednio 30,5% i 45,6% Ogółem zatrudnienie na obszarach wiejskich i pośrednich wynosi, w analizowanych krajach UE 67,4%, poza Cyprem, Słowenią i Luksemburgiem (po 100%), a najwyższe odnotowano na Słowacji (87,0%), w Rumunii (85,2%) i na Węgrzech (81,0%), a najniższe w Holandii (25,7%) oraz w Wielkiej Brytanii (29,5%). W analizowanym okresie 15 lat obszary wiejskie i pośrednie ujmowane łącznie zmniejszyły swój potencjał w tym zakresie odpowiednio o 0,8 p.p., a na obszarach wiejskich i obszarach pośrednich zwiększyły o 1,5 p.p. Najwyższe spadki zatrudnienia na obszarach wiejskich odnotowano w Grecji o 18,6 p.p. Portugalii o 13,7 p.p. i we Włoszech 3,5 p.p. Najsilniej natomiast wzrosło zatrudnienie w Finlandii i w Polsce, odpowiednio o 9,6 p.p. i 6,9 p.p.
Ogólny potencjał gospodarczy analizowanych krajów UE oceniany poprzez wielkość i udział wartości dodanej brutto (GVA) wzrósł w latach 2000 – 2015 o 53,2%, tj. do poziomu 13261,8 mld €. Na obszarach wiejskich udział ten wyniósł w 2015 r. ogółem 1728,5 mld €, tj. 12,3%, a łącznie na analizowanych obszarach wiejskich i mieszanych 5778,1 mld €, tj. 43,6% ogólnego poziomu GVA. Najwyższa wartość dodana brutto wypracowywana jest na obszarach wiejskich we Francji (468,0 mln €) oraz w Niemczech (351,8 mld €), co wynika między innymi z wielkości i ogólnie dużego potencjału gospodarczego zlokalizowanego na obszarach wiejskich tych krajów. W Polsce GVA wypracowywana na obszarach wiejskich wynosi ok 97,5 mld € i jest porównywalna z Austrią (103,4 mld €) i znacznie wyższa aniżeli w Wielkiej Brytanii (58,9 mld €). Jednak najwyższy udział GVA jest wypracowywany na obszarach wiejskich Słowenii 49,2% oraz Irlandii (46,5%) (tab. 5).

203
Tabela 5. Udział wartości dodanej brutto (GVA) wypracowanej na obszarach wiejskich w krajach UE w latach 2000 i 2015
Kraje Udział GVA na
obszarach wiejskich Udział GVA na obszarach
pośrednich (wiejsko-miejskie)
Razem Udział GVA na obszarach wiejskich
i pośrednich 2000 r. 2015 r. 2000 r. 2015 r. 2000 r. 2015 r.
Austria 32,4 33,8 31,2 30,9 63,6 64,7 Belgia 5,4 5,3 33,7 34,7 39,1 40,0 Bułgaria 11,1 9,2 63,3 51,1 74,4 60,3 Chorwacja 37,3 34,0 33,3 32,6 70,6 66,6 Cypr - - 100,0 100,0 100,0 100,0 Czechy 19,1 18,0 47,3 45,5 66,4 63,5 Dania 26,0 23,5 43,7 42,4 69,7 65,9 Estonia 34,5 30,0 8,4 6,5 42,9 36,5 Finlandia 34,4 34,1 28,6 26,9 63,0 61,0 Francja 25,7 23,9 29,6 28,0 55,3 51,9 Grecja 26,8 25,5 18,8 18,1 45,6 43,6 Hiszpania 3,3 3,1 31,0 30,6 34,3 33,7 Holandia 0,6 0,5 22,0 21,5 22,6 22,0 Irlandia 50,3 45,3 8,7 10,6 59,0 55,9 Litwa 5,7 5,2 58,3 54,6 64,0 59,8 Luksemburg 100,0 100,0 100,0 100,0 Łotwa 14,4 14,3 19,9 16,7 34,3 31,0 Malta Niemcy 12,6 12,9 35,3 35,6 47,9 48,5 Polska 26,1 25,5 34,0 34,5 60,1 60,0 Portugalia 27,1 26,8 17,5 19,1 44,6 45,9 Rumunia 43,0 37,1 33,3 34,1 76,3 71,2 Słowacja 29,8 28,8 45,4 43,0 75,2 71,8 Słowenia 52,3 49,2 47,7 50,8 100,0 100,0 Szwecja 8,4 7,5 36,5 34,0 44,9 41,5 Węgry 13,6 12,0 51,5 51,6 65,1 63,6 Wielka Brytania 2,7 2,6 19,7 19,2 22,4 21,8 Włochy 8,9 8,8 41,7 41,2 50,6 50,1 Średnia 22,1 20,7 38,5 37,5 60,6 58,2
Źródło: opracowanie własne na podstawie EUROSTAT 2018. Około jednej trzeciej GVA tworzone jest na obszarach wiejskich takich krajów jak Austria (33,8%), Chorwacja (34,0%), Estonia (30,0%), Finlandia (34,1%) i Rumunia (37,1%). Polska z udziałem 25,5% jest podobna pod tym względem do Portugalii (26,8%), Grecji (25,5%) oraz Francji (23,9%) i Finlandii (34,1%). Średni udział GVA wytwarzanego na obszarach wiejskich ogółem w krajach UE w roku 2015 jest o 18,2 p.p. niższy niż na obszarach pośrednich. Zdecydowanie wyższy udział GVA wypracowywany jest na obszarach pośrednich w Belgii (o 29,4 p.p.), Bułgarii (o 41,9 p.p.) oraz Niemczech (o 22,7 p.p.), ale także na Węgrzech (o 39,6 p.p.). W Polsce różnice w tym zakresie nie są tak wielkie i wynoszą tylko około 9 p.p. Wyższe GVA wypracowywane jest na obszarach wiejskich aniżeli pośrednich w takich krajach jak Finlandia (o 7,2 p.p.), Grecja (o 7,4 p.p.) oraz Portugalia (o 7,7 p.p.).
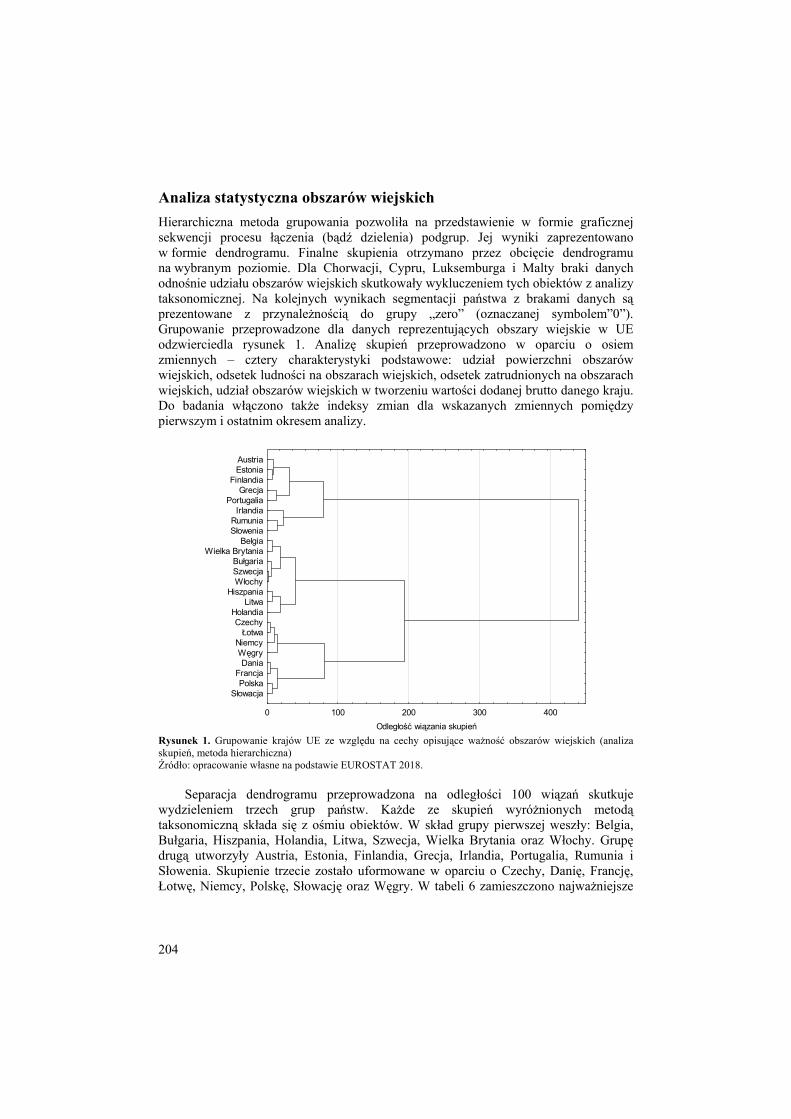
204
Analiza statystyczna obszarów wiejskich Hierarchiczna metoda grupowania pozwoliła na przedstawienie w formie graficznej sekwencji procesu łączenia (bądź dzielenia) podgrup. Jej wyniki zaprezentowano w formie dendrogramu. Finalne skupienia otrzymano przez obcięcie dendrogramu na wybranym poziomie. Dla Chorwacji, Cypru, Luksemburga i Malty braki danych odnośnie udziału obszarów wiejskich skutkowały wykluczeniem tych obiektów z analizy taksonomicznej. Na kolejnych wynikach segmentacji państwa z brakami danych są prezentowane z przynależnością do grupy „zero” (oznaczanej symbolem”0”). Grupowanie przeprowadzone dla danych reprezentujących obszary wiejskie w UE odzwierciedla rysunek 1. Analizę skupień przeprowadzono w oparciu o osiem zmiennych – cztery charakterystyki podstawowe: udział powierzchni obszarów wiejskich, odsetek ludności na obszarach wiejskich, odsetek zatrudnionych na obszarach wiejskich, udział obszarów wiejskich w tworzeniu wartości dodanej brutto danego kraju. Do badania włączono także indeksy zmian dla wskazanych zmiennych pomiędzy pierwszym i ostatnim okresem analizy.
0 100 200 300 400Odległość wiązania skupień
SłowacjaPolska
FrancjaDania
WęgryNiemcyŁotwa
CzechyHolandia
LitwaHiszpania
WłochySzwecjaBułgaria
Wielka BrytaniaBelgia
SłoweniaRumunia
IrlandiaPortugalia
GrecjaFinlandia
EstoniaAustria
Rysunek 1. Grupowanie krajów UE ze względu na cechy opisujące ważność obszarów wiejskich (analiza skupień, metoda hierarchiczna) Źródło: opracowanie własne na podstawie EUROSTAT 2018.
Separacja dendrogramu przeprowadzona na odległości 100 wiązań skutkuje wydzieleniem trzech grup państw. Każde ze skupień wyróżnionych metodą taksonomiczną składa się z ośmiu obiektów. W skład grupy pierwszej weszły: Belgia, Bułgaria, Hiszpania, Holandia, Litwa, Szwecja, Wielka Brytania oraz Włochy. Grupę drugą utworzyły Austria, Estonia, Finlandia, Grecja, Irlandia, Portugalia, Rumunia i Słowenia. Skupienie trzecie zostało uformowane w oparciu o Czechy, Danię, Francję, Łotwę, Niemcy, Polskę, Słowację oraz Węgry. W tabeli 6 zamieszczono najważniejsze

205
charakterystyki różnicujące zidentyfikowane grupy państw ze względu na rolę obszarów wiejskich. W tabeli tej przedstawiono również odpowiednie statystyki dla grupy oznaczonej numerem zero, której wydzielenie nie wynika z grupowania procedurą taksonomiczną, ale jest pokłosiem braków danych dla niektórych z rozpatrywanych zmiennych.
Najważniejszym czynnikiem zróżnicowania dla obszarów wiejskich UE zdaje się być udział powierzchni tej kategorii w ogóle terytorium kraju. 76,85% odsetkiem obszarów wiejskich charakteryzuje się skupienie drugie. Warunkuje to pośrednio wysokie udziały pozostałych z rozważanych wyróżników – w szczególności odsetka ludności zamieszkującej na obszarach wiejskich oraz udziału zatrudnionych na obszarach wiejskich. W grupie drugiej stosunkowo niższy jest natomiast udział wartości dodanej brutto wytwarzanej na obszarach wiejskich (35,36%). Skupienie to mimo najwyższych wartości każdej ze zmiennych cechuje się ich najniższym zróżnicowaniem względnym (mierzonym współczynnikiem zmienności). Nieznacznie większą dyspersję rozważanych cech obserwowano w grupie trzeciej. Natomiast najwyższe zróżnicowanie (porównywalne ze średnim dla całości zbioru) każdej ze zmiennych opisujących ważność obszarów wiejskich odnotowano z grupie pierwszej. Kontrastowo do skupienia o najwyższych wartościach, w grupie pierwszej występują najniższe wartości poszczególnych cech. Dodatkowo, mimo średniego 20,68% udziału obszarów wiejskich średnie wartości pozostałych trzech wskaźników oscylują jedynie w granicach 5-7%. Grupa trzecia wykazuje analogie pod względem struktury wskaźników do skupienia drugiego, jednak wartości cech są w niej niższe minimum o jedną trzecią. Tabela 6. Charakterystyka grup wyróżnionych metodą analizy skupień dla obszarów wiejskich
Oceniane zmienne Grupy wyróżnione dla obszarów wiejskich
0 1 2 3 Ogółem
Odsetek powierzchni obszarów wiejskich (%)
N 8 8 8 24 Średnia 20,68 76,85 43,31 46,95 Współczynnik zmienności 46,9% 10,4% 21,1% 53,4% Rozstęp 30,44 23,96 26,29 87,89 Minimum 2,11 66,03 27,59 2,11 Maksimum 32,55 90,00 53,89 90,00
Odsetek ludności na obszarach wiejskich (%)
N 1 8 8 8 25 Średnia 43,65 7,09 45,31 26,45 26,98 Współczynnik zmienności 57,8% 25,1% 29,7% 65,9% Rozstęp 0,00 12,51 29,21 21,70 60,06 Minimum 43,65 0,63 31,47 15,79 0,63 Maksimum 43,65 13,14 60,69 37,50 60,69
Odsetek zatrudnionych na obszarach wiejskich (%)
N 1 8 8 8 25 Średnia 34,57 6,80 44,26 26,09 26,07 Współczynnik zmienności 54,3% 25,6% 29,3% 65,9% Rozstęp 0,00 11,20 28,15 19,43 57,11 Minimum 34,57 0,63 29,59 17,27 0,63 Maksimum 34,57 11,83 57,74 36,70 57,74
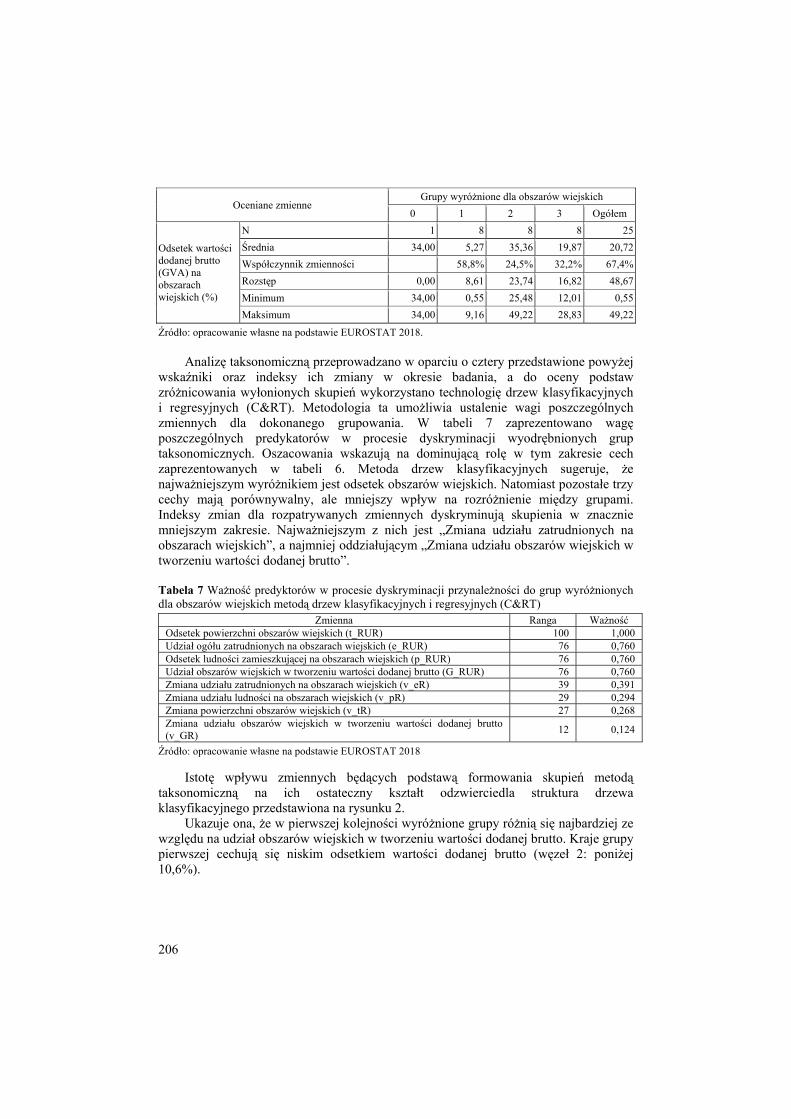
206
Oceniane zmienne Grupy wyróżnione dla obszarów wiejskich
0 1 2 3 Ogółem
Odsetek wartości dodanej brutto (GVA) na obszarach wiejskich (%)
N 1 8 8 8 25 Średnia 34,00 5,27 35,36 19,87 20,72 Współczynnik zmienności 58,8% 24,5% 32,2% 67,4% Rozstęp 0,00 8,61 23,74 16,82 48,67 Minimum 34,00 0,55 25,48 12,01 0,55 Maksimum 34,00 9,16 49,22 28,83 49,22
Źródło: opracowanie własne na podstawie EUROSTAT 2018.
Analizę taksonomiczną przeprowadzano w oparciu o cztery przedstawione powyżej wskaźniki oraz indeksy ich zmiany w okresie badania, a do oceny podstaw zróżnicowania wyłonionych skupień wykorzystano technologię drzew klasyfikacyjnych i regresyjnych (C&RT). Metodologia ta umożliwia ustalenie wagi poszczególnych zmiennych dla dokonanego grupowania. W tabeli 7 zaprezentowano wagę poszczególnych predykatorów w procesie dyskryminacji wyodrębnionych grup taksonomicznych. Oszacowania wskazują na dominującą rolę w tym zakresie cech zaprezentowanych w tabeli 6. Metoda drzew klasyfikacyjnych sugeruje, że najważniejszym wyróżnikiem jest odsetek obszarów wiejskich. Natomiast pozostałe trzy cechy mają porównywalny, ale mniejszy wpływ na rozróżnienie między grupami. Indeksy zmian dla rozpatrywanych zmiennych dyskryminują skupienia w znacznie mniejszym zakresie. Najważniejszym z nich jest „Zmiana udziału zatrudnionych na obszarach wiejskich”, a najmniej oddziałującym „Zmiana udziału obszarów wiejskich w tworzeniu wartości dodanej brutto”. Tabela 7 Ważność predyktorów w procesie dyskryminacji przynależności do grup wyróżnionych dla obszarów wiejskich metodą drzew klasyfikacyjnych i regresyjnych (C&RT)
Zmienna Ranga Ważność Odsetek powierzchni obszarów wiejskich (t_RUR) 100 1,000 Udział ogółu zatrudnionych na obszarach wiejskich (e_RUR) 76 0,760 Odsetek ludności zamieszkującej na obszarach wiejskich (p_RUR) 76 0,760 Udział obszarów wiejskich w tworzeniu wartości dodanej brutto (G_RUR) 76 0,760 Zmiana udziału zatrudnionych na obszarach wiejskich (v_eR) 39 0,391 Zmiana udziału ludności na obszarach wiejskich (v_pR) 29 0,294 Zmiana powierzchni obszarów wiejskich (v_tR) 27 0,268 Zmiana udziału obszarów wiejskich w tworzeniu wartości dodanej brutto (v_GR) 12 0,124
Źródło: opracowanie własne na podstawie EUROSTAT 2018
Istotę wpływu zmiennych będących podstawą formowania skupień metodą taksonomiczną na ich ostateczny kształt odzwierciedla struktura drzewa klasyfikacyjnego przedstawiona na rysunku 2.
Ukazuje ona, że w pierwszej kolejności wyróżnione grupy różnią się najbardziej ze względu na udział obszarów wiejskich w tworzeniu wartości dodanej brutto. Kraje grupy pierwszej cechują się niskim odsetkiem wartości dodanej brutto (węzeł 2: poniżej 10,6%).

207
ID=1 N=241
ID=3 N=162
ID=2 N=81
ID=4 N=83
ID=5 N=82
G_RUR
<= 10,6 > 10,6
t_RUR
<= 60,0 > 60,0
Grupa123
Rysunek 2. Dyskryminacja przynależności do grup wyróżnionych dla obszarów wiejskich (metoda drzew klasyfikacyjnych i regresyjnych C&RT) Źródło: opracowanie własne na podstawie EUROSTAT 2018. Pozostałe państwa zakwalifikowane do węzła 3 w największym stopniu są różnicowane ze względu na udział terytorialny obszarów wiejskich. Na kolejnym etapie węzeł ten jest dzielony na podgrupę o wartościach wskaźnika poniżej 60% (skupienie trzecie) oraz podgrupę, w której udział obszarów wiejskich w tendencji przekracza 60% (skupienie drugie).
Podsumowanie Podział obszarów wiejskich w krajach Unii Europejskiej na trzy kategorie delimitacji, tj. obszary wiejskie, pośrednie (wiejsko-miejskie) i miejskie ma charakter sformalizowany i stanowi podstawę ich klasyfikacji w statystykach EUROSTAT. Przeprowadzone badania obejmowały analizy i oceny zróżnicowania oraz wielowymiarowość i znaczenie powyżej wskazanych dwóch kategorii wiejskości. Dla wybranych czterech zmiennych opisujących; powierzchnię obszarów wiejskich, udział ludności, udział zatrudnionych i udział w wypracowanej wartości dodanej brutto (GVA) wykonano analizy tabelaryczne, analizę skupień oraz dokonano typologii wyróżnionych grup krajów przy zastosowaniu techniki drzew klasyfikacyjnych.
Przeprowadzone badania wskazały na wielowymiarowe zróżnicowanie obszarów wiejskich oraz ich duże, a nawet dominujące, znaczenie w gospodarce poszczególnych krajów. Na wydzielonych stricte obszarach wiejskich krajów UE, które stanowią 44,14% powierzchni lądowej, zamieszkuje 19,24% ludności. Największą powierzchnię obszarów wiejskich ma Francja i Finlandia (odpowiednio 340,82 tys. km2 i 278,88 tys. km2.

208
Natomiast największy udział obszarów stricte wiejskich wykazują takie kraje jak: Irlandia, Finlandia i Estonia tj. odpowiednio 90,0, 82,4 i 81,6%. Na przeciwnym biegunie tego podziału jest Holandia (2,1%), Litwa (13,6%) i Hiszpania (16,9%). Na obszarach wiejskich krajów UE zamieszkuje 97,8 mln mieszkańców, tj. 19,2% mieszkańców UE, a na obszarach wiejskich i pośrednich 55,3%. Największy udział ludności mieszkającej na obszarach wiejskich wykazuje Irlandia (60,7%) i Rumunia (53,9%). Z kolei najmniejszy udział tej kategorii analitycznej odnotowano w Holandii (0,6%) i Hiszpanii (3,5%). Na obszarach stricte wiejskich zatrudnionych jest 18,9% ludności aktywnej zawodowo, a na obszarach wiejskich i pośrednich 54,4%. Powyżej 50% ludności znajduje zatrudnienie na obszarach wiejskich, a takich krajów jak Słowenia (57,7%), Irlandia (57,2%) i Rumunia (54,9%). Jednakże na obszarach wiejskich wytwarza się tylko 13,0% wartości dodanej brutto (GVA), a na obszarach wiejskich i pośrednich 43,6%. Pod względem udziału GVA wypracowanej na obszarach wiejskich dodatnio wyróżniają się takie kraje jak Słowenia (49,2%) i Irlandia (46,5%), a najmniejszy udział odnotowano w Holandii (0,5%), Wielkiej Brytanii (2,6%) oraz Hiszpanii (3,1%).
Analiza skupień przeprowadzona dla ośmiu zmiennych – tj. czterech analizowanych powyżej wskaźników charakteryzujących obszary wiejskie oraz indeksy ich zmian w okresie badania – pozwoliła na wyodrębnienie trzech homogenicznych grup państw. Polska oraz kraje, jak: Czechy, Dania, Francja, Łotwa i Niemcy znalazły się w skupieniu trzecim. Czynnikiem najsilniej różnicującym obszary wiejskie w krajach UE jest udział ich powierzchni w ogólnej powierzchni kraju. Najwyższym odsetkiem obszarów wiejskich (76,85%) oraz najniższym zróżnicowaniem wyróżnia się skupienie drugie (Austria, Estonia, Finlandia, Grecja, Irlandia, Portugalia, Rumunia i Słowenia). Kontrastowo, w grupie tej stosunkowo niski jest udział wartości dodanej brutto (GVA) wytwarzanej na obszarach wiejskich (35,36%). Odmiennie, w grupie pierwszej (Belgia, Bułgaria, Hiszpania, Holandia, Litwa, Szwecja, Wielka Brytania oraz Włochy) ze średnim 20,7% udziałem obszarów wiejskich występują najniższe wartości poszczególnych cech oraz ich najwyższe zróżnicowanie. Grupy druga oraz trzecia posiadają podobne struktury rozpatrywanych wskaźników, jednak wartości cech są wyraźnie niższe w skupieniu trzecim.
Bibliografia Czarnecki A. Rola urbanizacji w wielofunkcyjnym rozwoju obszarów wiejskich. Seria: Problemy rozwoju wsi i rolnictwa. IRWIR PAN, Warszawa 2009, s. 21-27. Dijkstra Lewis, Poelmann Hugo, Remote Rural Regions - How proximity to a city influences the performance of rural regions, DG Regio, European Commission, Brussels 2008 Dijkstra Lewis, Ruiz Vicente. Refinement of the OECD regional typology: Economic Performance of Remote Rural Regions, DG Regio, European Commission, Brussels. 2010. Hand D., Mannila H., Smyth P. Eksploracja danych. Wydawnictwa Naukowo-Techniczne, Warszawa 2005. Kaleta A. Obszary wiejskie i koncentracje jego rozwoju. W: Rozwój obszarów wiejskich w perspektywie integracji z UE. FAPA, UMK, SGGW, Toruń 1998. Koronacki J., Ćwik J. Statystyczne systemy uczące się. Exit, Warszawa 2008. Kostrowicki J. Obszary wiejskie jako przestrzeń wielofunkcyjna. Zagadnienia badawcze i planistyczne. Przegląd Geograficzny 1976, z. XLVII z. 4 Larose D.L. Odkrywanie wiedzy z danych, wprowadzenie do eksploracji danych. Wydawnictwo Naukowe PWN, Warszawa 2007. Marek T. Analiza skupień w badaniach empirycznych. Metody SAHN. PWN, Warszawa 1989.

209
Rosner A. Zmiany rozkładu przestrzennego zaludnienia obszarów wiejskich. Wiejskie obszary zmniejszające zaludnienie i koncentracje ludności wiejskiej. Seria: Problemy rozwoju wsi i rolnictwa. IRWIR PAN, Warszawa 2012, s. 53-64. Rural Development in the EU. Statistical and Economic Information Report 2013, European Commission, Brussels. Sroka W., Musiał W. Rolnictwo i gospodarstwa rolne na obszarach miejskich i podmiejskich. Konceptualizacja oraz przesłanki rozwoju Folia Pomerania, Oeconomica 2016, 329(84)3, 123-134. Stanny M. Poziom rozwoju obszarów wiejskich w Polsce - pomiar zjawiska złożonego. W: Rozwój wsi i rolnictwa w Polsce. Aspekty przestrzenne i regionalne red. Nauk A. Rosner. Seria: Problemy rozwoju wsi i rolnictwa. IRWIR PAN, Warszawa 2012, s. 93-100 Wilkin J. Ewolucja paradygmatów rozwoju obszarów wiejskich. Wieś i Rolnictwo 2008, (3) 140. Zawalińska K. Instrumenty i efekty wsparcia Unii Europejskiej dla regionalnego rozwoju obszarów wiejskich w Polsce. Seria: Problemy rozwoju wsi i rolnictwa. IRWIR PAN, Warszawa, 2009, s. 26-36.
Summary The study undertakes the problem of identifying, cataloguing, and evaluating rural areas and intermediate areas of European Union countries, for four selected variables which describe: area, share of population, share of employed, and share of gross value added (GVA). Tabular analyses and cluster analysis ware conducted, and the statistical information was differentiated through classification trees. The research revealed multidimensional diversification of rural areas and their meaningful, although diverse, relevance within the economic systems of individual countries. 34,7% of the EU population reside in strictly rural areas, which make up 49,7% of the EU geographic area. The share of employed in rural areas in the EU amounts to 26,7%. Additionally, the contribution of the rural areas to elaborated gross value added adds up to 13%. The taxonomy resulted in the extraction of three groups (clusters), each containing eight countries. According to that comprehensive evaluation of rural areas, Poland is similar to the Czech Republic, Denmark, France, Latvia and Germany. Key words: EU rural areas, population of rural areas, employment on rural areas, gross value added (GVA) JEL Codes: Q18, R14, Q15 Informacja o autorach:
Dr hab. Strojny Jacek Uniwersytet Rolniczy im. Hugona Kołłątaja w Krakowie Wydział Rolniczo-Ekonomiczny Katedra Statystyki i Polityki Społecznej, Al. Mickiewicza 21 31-120 Kraków e-mail: [email protected] ORCID: 0000-0002-0577-377X
Prof. dr hab. Wiesław Musiał Uniwersytet Rolniczy im. Hugona Kołłątaja w Krakowie Wydział Rolniczo-Ekonomiczny Katedra Ekonomii i Gospodarki Żywnościowej Al. Mickiewicza 21 31-120 Kraków e-mail: [email protected] ORCID: 0000-0002-8213-4859

210
22 (71) 2019 DOI 10.22630/PEFIM.2019.22.71.37
Cezary Szydłowski Uniwersytet Łódzki
Rola audytu wewnętrznego w ocenie wydatków samorządów miejskich
THE ROLE OF INTERNAL AUDIT IN THE EVALUATION
OF URBAN LOCAL GOVERNMENT EXPENDITURES
Artykuł przedstawia rolę oraz zadania audytu wewnętrznego w ocenie wydatków publicznych w wybranym obszarze na przykładzie samorządów miejskich w Łodzi, Piotrkowie Trybunalskim oraz Skierniewicach. W toku badań ustalono m.in., że audyt wewnętrzny poprzez swoje zadania przyczynia się do racjonalniejszego wydatkowania środków finansowych z budżetu miasta na działania administracji publicznej. Ponadto wykazano również, że audyt wewnętrzny jest pomocnym narzędziem w dbaniu o ponoszenie uzasadnionych wydatków przez jednostki sektora finansów publicznych. Ocena oraz monitorowanie wydatków jest powinnością władzy publicznej w celu zapewnienia racjonalnej gospodarki finansowej danej jednostki samorządu terytorialnego.
Celem artykułu jest przedstawienie audytu wewnętrznego jako istotnego narzędzia wsparcia organów miasta w ocenie wydatków gmin miejskich w wybranym obszarze. Na potrzeby niniejszej publikacji jako przykład do analizy wybrano jednostki samorządu terytorialnego z województwa łódzkiego tj. miasta na prawach powiatu.
W niniejszym artykule jako metody badawcze wykorzystano studium przypadku, metodę analityczną, metodę wnioskowania oraz metodę badania dokumentów. Do przeprowadzenia niezbędnych analiz wykorzystano materiały udostępniane przez badane podmioty oraz dane dostępne w rejestrach publicznych, gromadzonych przez uprawnione do tego instytucje. Słowa kluczowe: finanse publiczne, audyt wewnętrzny, samorząd terytorialny JEL Codes: H-72, H-83
Wprowadzenie Finanse samorządu terytorialnego powinny być wydatkowane racjonalnie, zasadnie oraz adekwatnie do poziomu dochodów i ogólnego stanu środków finansowych w budżecie danej jednostki. Racjonalne wydatkowanie środków publicznych ma miejsce gdy jest celowe, oszczędne, terminowe, wynika z uchwały budżetowej oraz jest zgodne z przyjętymi przez jednostkę planami finansowymi.1 Nie jest to możliwe bez sprawowania nadzoru i kontroli nad tym procesem. Przydatnym narzędziem w tym zakresie jest audyt wewnętrzny, który poprzez swoje zadania dostarcza poszczególnym interesariuszom informacji i wskazówek dotyczących sytuacji finansowej jednostki samorządu terytorialnego. Prawidłowość, zasadność i racjonalność wydatkowania środków
1 J. Szołno-Koguc, Racjonalność wydatków publicznych a realizacja budżetowej zasady jedności [w:] Głuchowski, J., Pomorska, A., Szołno-Koguc, J. (red.), Ekonomiczne i prawne problemy racjonalizacji wydatków publicznych, Tom 1: Racjonalizacja wydatków publicznych � uwarunkowania i instrumenty, Uniwersytet Marii Curie – Skłodowskiej, Lublin, 2005 r., s. 140.
211
publicznych jest kluczowa dla procesu realizacji budżetu danej jednostki samorządu terytorialnego. Każdy wydatek powinien być zgodny z planem budżetu na dany rok oraz odpowiednio udokumentowany i zaewidencjonowany w systemach finansowo – księgowych jednostki. Ocena wydatków może obejmować różny zakres w zależności od celów realizowanego audytu.2 Rolą audytu wewnętrznego jest m.in. przeprowadzenie oceny planowania i realizacji budżetu jednostki. Zatem audyt wydatków jest jednym z kluczowych obszarów do prowadzenia oceny funkcjonowania jednostki sektora finansów publicznych przede wszystkim w zakresie realizacji budżetu.3 Każdorazowo audyt wewnętrzny w wybranym obszarze wydatków powinien obejmować poszczególne wydatki ekwiwalentne i redystrybucyjne. Warto wspomnieć, że końcowa ocena audytora w zakresie poszczególnych wydatków powinna uwzględniać szereg ograniczeń sektora publicznego, które dotyczą choćby polityki zakupowej czy też zasad budżetowania.4
Samorząd terytorialny realizuje wiele zadań własnych i zleconych z zakresu administracji rządowej w ramach, których świadczy usługi publiczne na rzecz danej społeczności. Obowiązujący w Polsce system administracji publicznej, wyznaczył administracji samorządowej bardzo ważną rolę służebną na rzecz danej wspólnoty (regionalnej lub lokalnej). Największy wpływ na bieżące życie każdego mieszkańca ma działalność samorządu terytorialnego na szczeblu gminy (w tym miasta na prawach powiatu). Gmina zapewnia swojej społeczności lokalnej usługi publiczne bez których nie jest możliwe bieżące funkcjonowanie danej społeczności i rozwój społeczno – gospodarczy. Realizacja tych zadań nie jest możliwa bez odpowiedniej infrastruktury technicznej, zasobów kadrowych oraz środków finansowych.
Wykonywanie przez gminę jej ustawowych zadań wymaga ponoszenia wydatków na ich realizację w tym także związanych z funkcjonowaniem administracji publicznej. Realizacja zadań przez samorząd gminny finansowana jest z danin publicznych, na które składają się poszczególni mieszkańcy zgodnie z obowiązującymi przepisami prawa w tym zakresie. W związku z tym bardzo istotne jest, aby środki finansowe zgromadzone w budżecie każdej jednostki samorządu terytorialnego były wydatkowane zgodnie z prawem i w zakresie niezbędnym do skutecznej realizacji zadań. Prowadzenie racjonalnej gospodarki finansowej (w tym zrównoważenia budżetu gminy w zakresie dochodów i wydatków) wymaga od jej kierownictwa sprawowania adekwatnego do potrzeb nadzoru nad dochodami i poszczególnymi wydatkami z jej budżetu.5 Bardzo ważne jest przy tym prowadzenie weryfikacji wydatków pod kątem możliwości ich sfinansowania, czyli pokrycie danego wydatku z dochodów do budżetu gminy.6
Jednym z obszarów działania samorządu, który generuje znaczne koszty działania każdej gminy są wydatki na administrację publiczną. Wydatki w powyższym obszarze budzą znaczne zainteresowanie poszczególnych interesariuszy w gminie (mieszkańców, przedsiębiorców itd.). W związku z tym istotne jest, aby również w tym obszarze racjonalnie wydatkowano środki publiczne z budżetu gminy. Istotne zadania w tym zakresie realizuje audyt wewnętrzny, który dokonuje oceny poszczególnych obszarów
2 J. Pfaff, Rewizja finansowa, Uniwersytet Ekonomiczny w Katowicach, 2011 r. s. 72-77. 3 A. Żabka, Efficiency of budget expenditure inthe process of creating framework conditions for local development. Planing and evaluation, Wyższa Szkoła Finansów i Prawa, Bielsko – Biała, 2017 r., s. 56-59. 4 J. E. Stiglitz, Ekonomia sektora publicznego, PWN, Warszawa 2004 r., s. 235-237. 5 M. Gazda, O procesie racjonalizacji wydatków publicznych, Ruch Prawniczy, Ekonomiczny i Socjologiczny, VOL 78, NR 1 (2016), Uniwersytet Adama Mickiewicza w Poznaniu, s. 169-179. 6 M. Dylewski, B. Filipiak, M. Gorzałczyńska-Koczkodaj, Finanse samorządowe. Narzędzia, decyzje, procesy, PWN, Warszawa 2006 r., s. 184-186.

212
działania danej jednostki sektora finansów publicznych. Ocena audytu wewnętrznego obejmuje wszystkie aspekty i obszary działania danej jednostki ze szczególnym zwróceniem uwagi na ocenę realizacji jej budżetu. Zatem audyt wydatków jednostki samorządu terytorialnego na funkcjonowanie samorządowej administracji publicznej stanowi istotny obszar, który zasługuje na analizę oraz ocenę.
Audyt wewnętrzny w jednostkach sektora finansów publicznych Zasady funkcjonowania audytu wewnętrznego oraz obligatoryjny obowiązek jego wdrażania w poszczególnych jednostkach sektora finansów publicznych zostały uregulowane w ustawie z dnia 27 sierpnia 2009 r. o finansach publicznych. Ustawa określiła również niezbędne kwalifikacje i kryteria jakie musi spełnić osoba wykonująca zawód audytora wewnętrznego. Głównym celem audytu wewnętrznego jest usprawnienie systemu sprawowania nadzoru i kontroli nad działalnością danej jednostki, szczególnie w zakresie gospodarki finansowej. Szczegółowe zasady prowadzenia audytu wewnętrznego w jednostkach sektora finansów publicznych, raportowania o jego wynikach i zasady sprawozdawczości w tym zakresie zostały określone w Rozporządzeniu Ministra Finansów z dnia 4 września 2015 r.7 Audyt wewnętrzny w Polsce jest realizowany zgodnie z międzynarodowymi zasadami, wytycznymi oraz metodami pracy. Przyczynił się do wielu zmian w jednostkach sektora finansów publicznych, które obejmowały m.in. wdrożenie procesu identyfikacji i zarządzania ryzykiem, zwiększenie nadzoru i kontroli nad realizacją zadań, usprawnienie poszczególnych procesów objętych audytem itd.
Audyt wewnętrzny zgodnie z treścią art. 272 ustawy o finansach publicznych z 2009 r. jest „działalnością niezależną i obiektywną, której celem jest wspieranie ministra kierującego działem lub kierownika jednostki w realizacji celów i zadań przez systematyczną ocenę kontroli zarządczej oraz czynności doradcze, ocena dotyczy w szczególności adekwatności, skuteczności i efektywności kontroli zarządczej w dziale administracji rządowej lub jednostce”. 8 Warto wspomnieć, że kierownicy jednostek sektora finansów publicznych w efekcie wprowadzenia audytu wewnętrznego uzyskali nowy instrument wspomagający procesy podejmowania decyzji, zarządzania ryzykiem oraz gospodarowania finansami będącymi w dyspozycji organu władzy publicznej. Audyt wewnętrzny z uwagi na swoją niezależność i brak zaangażowania w bezpośrednią działalność operacyjną jednostki przedstawia obiektywną ocenę badanego obszaru i proponuje jego usprawnienie. Audytorzy wewnętrzni w swojej pracy muszą kierować się międzynarodowymi standardami pracy oraz zasadami kodeksu etyki audytora wewnętrznego. Standardy stanowią dla audytorów wewnętrznych podstawowe wytyczne, określające sposób prowadzenia przez nich swoich czynności oraz zadań im przypisanych, w sposób zapewniający wysoką jakość wykonywanej pracy, obiektywizm, niezależność oraz profesjonalizm. Zachowanie obiektywnej, bezstronnej oceny audytowanego procesu zapewnia kierownikowi jednostki sektora finansów publicznych rzetelny ogląd sytuacji podmiotu w zakresie gospodarki finansowej.
Głównym celem audytu wewnętrznego jest wsparcie kierownictwa jednostki poprzez systematyczną ocenę poszczególnych obszarów działania danej instytucji, przy jednoczesnym uwzględnieniu oceny potencjalnych ryzyk. Ryzyko można zdefiniować jako
7 Rozporządzenie Ministra Finansów z dnia 4 września 2015 r. w sprawie audytu wewnętrznego oraz informacji o pracy i wynikach tego audytu (tj. Dz. U. z 2018 r., poz. 506). 8 Ustawa z dnia 27 sierpnia 2009 r. o finansach publicznych (tj. Dz. U. z 2019 r., poz. 869), art. 272.

213
„możliwość wystąpienia zdarzenia, które będzie miało wpływ na organizację. Istnieją dwa źródła ryzyka: zagrożenie bezpośrednie (zdarzenie szkodliwe), które powodują, że cele nie zostaną osiągnięte, szanse (zdarzenia korzystne), które dają możliwość skuteczniejszego osiągnięcia celów”.9 Audytorzy podczas swojej pracy obejmującej głównie analizę i weryfikację dokumentacji źródłowej (będącej podstawą do wydania oceny w badanym obszarze) muszą każdorazowo identyfikować oraz szacować potencjalne ryzyka występujące w tym obszarze. Analiza ryzyka w zakresie badanego obszaru musi odnosić się również do wdrożonego przez kierownictwo systemu kontroli wewnętrznej.10 Audytorzy wewnętrzni podczas prowadzenia czynności audytowych w zakresie realizowanego audytu (np. dochodów lub wydatków), zobligowani są do weryfikacji i oceny funkcjonującego w jednostce systemu kontroli zarządczej.11 Kontrola zarządcza to „ogół działań podejmowanych dla zapewnienia realizacji celów i zadań w sposób zgodny z prawem, efektywny, oszczędny i terminowy. Celem kontroli zarządczej jest zapewnienie w szczególności: zgodności działalności z przepisami prawa oraz procedurami wewnętrznymi; skuteczności i efektywności działania; wiarygodności sprawozdań; ochrony zasobów; przestrzegania i promowania zasad etycznego postępowania; efektywności i skuteczności przepływu informacji; zarządzania ryzykiem”.12 Kontrola bądź audyt wydatków jest zalecana przez ekspertów np. Banku Światowego narzędzie do prawidłowego zarządzania budżetem przez samorządy.13
Audytorzy wewnętrzni realizując swoje zadania oceniają m.in. proces gromadzenia środków budżetowych, systemy egzekucji należności, proces planowania budżetu jednostki oraz jego realizację w poszczególnych obszarach. Zajmują się również weryfikacją prawidłowego ewidencjonowania operacji finansowych w systemach finansowo – księgowych. Audyt wewnętrzny prowadząc ocenę danego zagadnienia (np. planowania budżetu) przyczynia się do ujawnienia ewentualnych nieprawidłowości lub efektywniejszego gospodarowania posiadanymi przez jednostkę środkami finansowymi. Ponadto audyt przyczynia się do identyfikacji i ograniczania ryzyk oraz oszczędności np. poprzez zmniejszenie kosztów działania jednostki.14
Audytorzy swoje wyniki pracy (sprawozdanie z audytu) przedstawiają kierownikowi jednostki sektora finansów publicznych, który na jego podstawie podejmuje kluczowe decyzje w odniesieniu do badanego obszaru.15 Bardzo duża dynamika zmian jaka następuje w otoczeniu prawnym i gospodarczym jednostek sektora finansów publicznych sprawia, że audyt wewnętrzny staje się kluczowym instrumentem wsparcia kierowników jednostki, a jego działania przyczyniają się do poprawy gospodarki finansowej podmiotu.
9 K. Czerwiński, Audyt wewnętrzny, InfoAudit Sp. z o.o., wyd. 1, Warszawa 2004 r., s. 60. 10 R. Moeller, Nowoczesny audyt wewnętrzny, Wolters Kluwer Polska, Warszawa 2011 r., s. 47. 11 T. Kiziukiewicz, H. Szymańska, Kontrola zarządcza w jednostkach sektora finansów publicznych [w:] T. Kiziukiewicz (red.), Audyt wewnętrzny w strukturze kontroli zarządczej, Difin, Warszawa 2013 r., s. 40-44. 12 Ustawa z dnia 27 sierpnia 2009 r. o finansach…, art. 68. 13 L. Morrell, M. Kopanyi, Managing Local Expenditures [w:] C. Farvacque-Vitkovic, M. Kopanyi (red.), Municipal Finances. A Handbook for Local Governments, International Bank for Reconstruction and Development / The World Bank, Washington DC, 2014 r. s. 220. 14 K H Spencer Pickett, The internal auditing handbook. Third edition, John Wiley & Sons Ltd, West Sussex, United Kingdom, 2010 r., s. 179-182. 15 H. Grocholski (red.), Praktyczne aspekty audytu wewnętrznego. Tom 1, Instytut Rachunkowości i Podatków, Warszawa 2004 r., s. 11-12.

214
Rola audytu wewnętrznego w ocenie wydatków na administrację publiczną w badanych samorządach miejskich Ponoszenie wydatków przez jednostkę sektora finansów publicznych jest jednym z kluczowych procesów realizowanych w ramach systemu finansów publicznych, który poddawany jest ocenie przez uprawnione do tego zewnętrzne organy kontroli jak również przez niezależnych audytorów wewnętrznych zatrudnionych w danej jednostce. Audytorzy wewnętrzni na podstawie prowadzonej analizy ryzyka wyznaczają obszary, które powinny być przez nich objęte niezależną oceną w jednostce. Wśród tych obszarów kluczowa jest gospodarka finansowa danej jednostki. Sektor finansów publicznych obejmuje bardzo dużo podmiotów, w tym również jednostki samorządu terytorialnego.
Poszczególne jednostki sektora finansów publicznych realizują swoje zadania w oparciu o środki finansowe gromadzone zgodnie z obowiązującymi przepisami prawa regulującymi m.in. ich dochody. Środki publiczne powinny być wykorzystywane efektywnie, skutecznie oraz zgodnie z ich przeznaczeniem określonym przepisami oraz decyzjami właściwych organów ustawodawczych lub uchwałodawczych. Zgodność ponoszenia wydatków z przepisami prawa jest w tym obszarze kluczowa. Ocena procesu gospodarowania i wydatkowania środków publicznych musi podlegać skutecznemu nadzorowi i audytowi przy jednoczesnym zdiagnozowaniu potencjalnych zagrożeń w tym obszarze. Należy podkreślić, że „przeznaczanie środków publicznych na określone cele znajduje odzwierciedlenie w wydatkach. Wydatkami publicznymi są wydatki ponoszone na realizację zadań publicznych. Są one ponoszone w celu zaspokojenia potrzeb zbiorowych i częściowo potrzeb indywidualnych”.16
Prawidłowe oszacowanie ryzyk związanych z niewłaściwym wydatkowaniem środków ma kluczowe znaczenie dla stabilności finansowej danej jednostki. Wynika to z konieczności równoważenia budżetu oraz racjonalnego wydatkowania środków przez samorządy na niezbędne cele i zadania wynikające z przepisów. W celu zapewnienia prawidłowego wydatkowania środków publicznych w sektorze finansów publicznych ustawodawca wprowadził przepisy o naruszeniu dyscypliny finansów publicznych.17 Katalog naruszeń dyscypliny finansów obejmuje również szereg przewinień związanych z nieprawidłowym wydatkowaniem środków publicznych. Zatem prowadzenie przez audytorów wewnętrznych oceny procesu wydatkowania przez jednostkę środków publicznych ma znaczenie z wielu względów, zarówno zarządczych jak i formalno – prawnych. Rola audytora w tym obszarze jest kluczowa, gdyż przeprowadzenie przez niego oceny procesu wydatkowania w wybranym zakresie, może przyczynić się do ustalenia potencjalnych zagrożeń i nieprawidłowości oraz do poprawy skuteczności działania poprzez wyeliminowanie stwierdzonych błędów w ocenianym obszarze. Ustalenie przez audytora wewnętrznego potencjalnego zagrożenia w badanym obszarze może umożliwić jego wyeliminowanie oraz uchronienie jednostki przed konsekwencjami związanymi ze zmaterializowaniem się tego ryzyka.
Rola audytu jest nie do przecenienia w procesie oceny gospodarki finansowej, gdyż badanie prawidłowości ponoszenia wydatków może przyczynić się do oszczędności lub
16 M. Podstawka, Podstawy finansów. Teoria i praktyka, SGGW, wyd. 2, Warszawa, 2011 r. s. 62. 17 Ustawa z dnia 17 grudnia 2004 r. o odpowiedzialności za naruszenie dyscypliny finansów publicznych, (tj. Dz. U. z 2018 r. poz. 1458).

215
też uniknięcia niezasadnego wydatku z budżetu. Ponoszenie wydatków przez daną jednostkę sektora finansów publicznych niestety zazwyczaj nie obejmuje bardzo ważnej kwestii jaką jest ich efektywność. „W zasadzie wydatkowaniu publicznych środków pieniężnych w Polsce nie towarzyszy ocena efektywnościowa. Formalne kryteria owego wydatkowania zastępują kryteria efektywności i racjonalności”.18
Zadania jednostek samorządu terytorialnego szczebla gminnego obejmują zarówno zadania własne jak i zlecone (tj. zadania z zakresu administracji rządowej).19 Ponadto trzeba mieć na uwadze, że przyjęte rozwiązania organizacyjno – prawne w zakresie funkcjonowania administracji publicznej w Polsce sprawiły, że niektóre gminy miejskie są także powiatem (miastem na prawach powiatu) i wykonują również jego zadania.20 Oznacza to konieczność ponoszenia przez takie jednostki wydatków z tytułu wykonywania zadań przypisanych dla samorządu szczebla gminnego i powiatowego, co wymaga zwiększonego nadzoru i kontroli.
Realizacja audytu wewnętrznego w zakresie oceny procesu wydatkowania środków publicznych przez jednostkę może obejmować każdy z działów, rozdziałów lub też paragrafów ujętych w klasyfikacji budżetowej. Prowadzenie audytów w zakresie realizacji budżetu gminy wpisuje się bezpośrednio w system kontroli zarządczej, w którym audyt wewnętrzny pełni ważną funkcję monitorującą cały proces. Ponadto audyt wydatków, może poprawić gospodarkę finansową jednostki. Uzyskane podczas audytu informacje oraz przedstawiona ocena procesu gospodarowania środkami publicznymi może być podstawą do podjęcia działań naprawczych bądź ograniczenia lub też zaniechania nieuzasadnionych wydatków z budżetu.21
Podstawą do przeprowadzenia audytu wydatków jest analiza planu finansowego jednostki (budżetu miasta na prawach powiatu). Obejmuje ona ocenę procesu planowania wydatków oraz ich wykonania w danym roku budżetowym. Kluczowa jest weryfikacja zgodności ponoszonych wydatków z planem finansowym oraz analiza dokumentów finansowych i zapisów w systemach finansowo – księgowych jednostki. Ocenie podlega również system kontroli finansowej danego wydatku. W ramach tego audytorzy analizują proces opisywania dokumentów finansowych danego wydatku, zgodnie z obowiązującą w jednostce instrukcją obiegu dokumentów finansowo – księgowych. Kluczowa jest również analiza sprawowania nadzoru nad wydatkami przez upoważnionych do tego pracowników jednostki. Ponadto ocenie podlega także zasadność danego wydatku. Stwierdzenie podczas audytu ewentualnych odstępstw od obowiązujących procedur i przepisów może świadczyć o braku skutecznych mechanizmów kontrolnych w tym zakresie. Poza tym bardzo ważne jest zidentyfikowanie oraz szacowanie potencjalnych ryzyk, stanowiących kluczowe zagrożenie jakim jest niezasadne wydatkowanie środków publicznych. Poza tym przy audycie wydatków konieczne jest również ustalenie, czy zachowano zasady budżetowe takie jak zasada równowagi, jawności, jedności, operatywności, jednorodności a przede
18 M. Podstawka, Nowoczesne zarządzanie wydatkami publicznymi, [w:] Polityki Europejskie, Finanse i Marketing, Nr 6 (55)/2011, SGGW, Warszawa, 2011 r., s. 89. 19 Ustawa z dnia 8 marca 1990 r. o samorządzie gminnym (t.j. Dz. U. z 2019 r. poz. 506). 20 Ustawa z dnia 5 czerwca 1998 r. o samorządzie powiatowym (t.j. Dz. U. z 2019 r. poz. 511). 21 D. E. Wildasin, Urban Public Finance, wyd. Routledge Taylor&Francis Group, New York, 2012 r., s. 36-62.

216
wszystkim zupełności (powszechności), która „oznacza, iż w budżecie uwzględnione powinny zostać wszystkie dochody i wydatki”.22
Większość wydatków z budżetu samorządu wynika z konieczności realizacji określonych zadań ustawowych. Świadczenie usług publicznych a zatem realizacja zadań samorządu wymaga ponoszenia wydatków na podległą jej administrację publiczną. Wydatki na funkcjonowanie administracji publicznej kształtują się na różnym poziomie, przede wszystkim w zależności od wielkości danej jednostki samorządu terytorialnego.
Tabela 1 zawiera ogólne zestawienie wybranych pozycji wydatków w dziale 750 – administracja publiczna dla 3 miast na prawach powiatu z województwa łódzkiego za lata 2013-2017, według danych na 31 grudnia danego roku.
Tabela 1. Wybrane pozycje wydatków z budżetów trzech miast na prawach powiatu z województwa łódzkiego za lata 2013-2017 w dziale 750 – administracja publiczna w zł wraz z dynamiką zmian (Łódź, Piotrków Trybunalski, Skierniewice)
Lata Łódź Piotrków Trybunalski Skierniewice
Dynamika 2013=100%
m. Łódź
Dynamika 2013=100% m.
Piotrków Trybunalski
Dynamika 2013=100%
m. Skierniewice
Wydatki ogółem w zł 2013 449 591 793 20 009 701 13 934 541 100% 100% 100% 2014 267 034 853 21 374 610 13 723 003 59% 107% 98% 2015 241 724 268 24 819 779 14 582 653 54% 124% 105% 2016 287 422 459 21 490 452 17 107 747 64% 107% 123% 2017 343 817 093 25 866 972 18 895 212 76% 129% 136%
Wydatki bieżące ogółem w zł 2013 179 117 773 19 313 636 13 844 990 100% 100% 100% 2014 177 882 238 19 667 949 13 679 129 99% 102% 99% 2015 204 199 210 20 568 174 14 528 462 115% 106% 105% 2016 189 546 936 20 941 306 16 255 023 106% 108% 117% 2017 230 025 588 24 221 119 18 183 040 128% 125% 131%
Wydatki bieżące na wynagrodzenia w zł 2013 90 081 211 12 979 032 7 803 156 100% 100% 100% 2014 92 066 782 13 201 959 8 128 889 102% 102% 104% 2015 93 200 625 13 784 480 8 903 330 103% 106% 114% 2016 95 438 248 14 137 805 10 504 174 106% 109% 135% 2017 105 856 552 16 173 738 11 457 492 118% 125% 147%
Wydatki majątkowe ogółem w zł 2013 270 474 019 696 065 89 551 100% 100% 100% 2014 89 152 615 1 706 660 43 874 33% 245% 49% 2015 37 525 058 4 251 605 54 191 14% 611% 61% 2016 97 875 523 549 146 852 724 36% 79% 952% 2017 113 791 506 1 645 853 712 172 42% 236% 795%
Źródło: opracowanie własne na podstawie danych z Banku Danych Lokalnych Głównego Urzędu Statystycznego (data pobrania 19 maja 2019 r. https://bdl.stat.gov.pl/BDL/dane/podgrup/tablica) według stanu danych na dzień 16 maja 2019 r.
22 M. Podstawka, Zasady budżetowania [w:] M. Podstawka (red.), Finanse, Instytucje. Instrumenty. Podmioty. Rynki. Regulacje., PWN, Warszawa, 2010 r. s. 121.

217
Tabela 1 poza ogólnym zestawieniem ponoszonych wydatków na samorządową administrację publiczną przez wybrane jednostki zawiera informację o dynamice tych wydatków. W przypadku miasta Łodzi wyraźnie widać, że wydatki ogółem na administrację publiczną w poszczególnych latach 2014-2017 ulegały zmniejszeniu w odniesieniu do bazowego roku 2013 (w 2017 r. o 24% w odniesieniu do 2013 r., tj. z 449.591.793 zł do 343.817.093 zł). Pomimo tego spadku wzrosły w Łodzi wydatki bieżące na wynagrodzenia pracowników (wzrost o 18% w 2017 r. w odniesieniu do roku bazowego tj. 2013 tj. z 90.081.211 zł w 2013 r. do 105.856.552 zł w 2017 r.).
Odmienna sytuacja miała miejsce w przypadku dwóch pozostałych miast tj. Piotrkowa Trybunalskiego i Skierniewic, ponieważ wydatki ogólne na administrację publiczną rosły w poszczególnych latach w odniesieniu do roku 2013 (wyjątkiem był rok 2014, wtedy miasto Skierniewice zmniejszyły wydatki rok do roku o 2%). Dodatkowo wzrost następował w poszczególnych kategoriach wydatków. Ponadto w przypadku miast Piotrków Trybunalski oraz Skierniewice w odróżnieniu od Łodzi zwiększono znacznie wydatki majątkowe w dziale 750 – administracja publiczna. Wynikało to z konieczności podejmowania przez kierowników jednostek działań mających na celu doposażenia sprzętowego pracowników urzędu oraz jednostek organizacyjnych poszczególnych miast. Konieczność realizacji nowych zadań przez samorządy skutkuje zwiększeniem wydatków na administracje. Przedmiotowe wydatki mogą być wynikiem zwiększenia zatrudnienia oraz potrzeby wyposażenia nowych pracowników w niezbędny sprzęt itd. Jednakże wzrost tych wydatków może być również spowodowany innymi czynnikami, które w trakcie audytu muszą być przedmiotem wnikliwej analizy.
Audyt wewnętrzny wydatków w dziale 750 - administracja publiczna w jednostce samorządu terytorialnego Realizacja audytu wydatków na administrację publiczną obejmuje przede wszystkim analizę zasadności ponoszonych wydatków. Zasadniczą część wydatków związanych z administracją publiczną stanowią wydatki bieżące, w tym przede wszystkim na wynagrodzenia pracowników urzędu. Ponadto część środków przeznaczana jest na wydatki majątkowe związane m.in. z koniecznością wyposażenia pracowników w niezbędny sprzęt. Realizacja audytu wydatków w wybranym dziale wymaga analizy poszczególnych wydatków w zakresie ich zasadności oraz zgodności z planem finansowym. Weryfikacja zasadności wydatku powoduje konieczność zapoznania się przez audytora z uzasadnieniem danego wydatku. Zgodnie z przyjętymi rozwiązaniami organizacyjnymi zadania audytu wewnętrznego w Urzędzie Miasta Piotrkowa Trybunalskiego realizuje audytor wewnętrzny z Biura Audytu Wewnętrznego i Kontroli.23
Kluczową pozycję w wydatkach jednostki samorządu terytorialnego (w dziale – 750 na administracja publiczna) stanowią wydatki na wynagrodzenia pracowników. Zmiany w tej pozycji wydatków determinowane były rotacją pracowników oraz wzrostem wynagrodzeń. Na zmianę poziomu zatrudnienia wpływało nakładanie nowych zadań, co każdorazowo potwierdzane jest w opisie / uzasadnieniu do danego wydatku. Podczas
23 http://www.bip.piotrkow.pl/index.php?idg=2&id=1056&x=36&y=8&z=17 [data pobrania 8.10.2019 r.].

218
audytu wydatków weryfikacja obejmuje ocenę wykonania danego wydatku z planem finansowym (planem budżetu wraz z jego zmianami) na dany rok oraz jego wpływ na budżet miasta. Na potrzeby niniejszej publikacji dokonano analizy wydatków w dziale – 750 na administracja publiczna) w mieście Piotrków Trybunalski (miasto na prawach powiatu w województwie łódzkim) za 2018 r. Do analizy wykorzystano informacje ze „Sprawozdania z realizacji budżetu Miasta Piotrkowa Trybunalskiego za 2018 r.”24
W przypadku audytu wewnętrznego wydatków na administrację publiczną cele ogólne audytu obejmują przede wszystkim: ocenę zgodności poszczególnych wydatków z budżetu miasta z obowiązującymi przepisami oraz wewnętrznymi procedurami, ocenę zasadności poszczególnych wydatków pod kątem ich racjonalności oraz weryfikację funkcjonowania systemu kontroli zarządczej w badanym obszarze. Tabela 2 Wydatki z budżetu Miasta Piotrkowa Trybunalskiego w 2018 według stanu na dzień 31 grudnia 2018 r. w rozdziale 750 – administracja publiczna wraz kwotą wydatków w zł na 1 mieszkańca oraz procentowym udziałem danego wydatku z rozdziału 750 w ogólnej kwocie wydatków z budżetu w 2018 r.
Lp. Wybrane wydatki z rozdziału 750 - administracja publiczna
Wydatki w zł z budżetu
miasta według stanu
na 31.12.2018 r.
Kwota wydatków w zł na jednego mieszkańca
na dzień 31.12.2018 (według stanu ludności
na 31.12.2018 r. - 73 670 osób)
% udział danego wydatku w ogólnej kwocie wydatków miasta w 2018 r.
1 Wydatki bieżące na
wynagrodzenia wraz ze składkami od nich naliczanymi
20 475 160 278 4,34%
2 Wydatki bieżące związane z realizacją ich zadań statutowych 4 763 963 65 1,01%
3 Wydatki bieżące na świadczenia na rzecz osób fizycznych 413 526 6 0,09%
4 Wydatki bieżące ogółem (suma wierszy 1 - 3) 25 652 649 348 5,44%
5 Wydatki majątkowe (inwestycje i zakupy inwestycyjne) 4 458 739 61 0,95%
6 Wydatki z budżetu ogółem (suma wierszy 4 - 5) 30 111 388 409 6,39%
Źródło: Opracowanie własne na podstawie Sprawozdania z wykonania budżetu Miasta Piotrkowa Trybunalskiego za 2018 r. oraz danych z Banku Danych Lokalnych Głównego Urzędu Statystycznego (https://bdl.stat.gov.pl/BDL/start).
Szczegółowe dane dotyczące poszczególnych wydatków zawierają sprawozdania finansowe (m.in. sprawozdanie z realizacji budżetu jednostki za dany rok). Podczas audytu niezbędna jest również analiza dokumentacji finansowej prowadzonej przez poszczególne komórki organizacyjne odpowiadające za gospodarowanie środkami budżetowymi (m.in. uzasadnienia merytoryczne wydatków). Kluczowe dane zawarto w tabeli 2, które obejmują wybrane informacje o wysokości poniesionych przez miasto Piotrków Trybunalski w 2018 r. wydatków w dziale 750 – administracja publiczna. Ponadto w tabeli ujęto również rozkład poszczególnych pozycji wydatków w 2018 r. na 24 Sprawozdanie z wykonania budżetu Miasta Piotrkowa Trybunalskiego za 2018 r. - http://www.bip.piotrkow.pl/index.php?idg=3&id=1843&x=56&y=2, data dostępu: [8 czerwca 2019 r.]

219
administrację publiczną w przeliczeniu na 1 mieszkańca Piotrkowa Trybunalskiego25. Dodatkowo poniższa tabela przedstawia procentowy udział poszczególnych wydatków z budżetu miasta Piotrkowa Trybunalskiego w ogólnej kwocie wydatków poniesionych przez miasto w badanym roku, które wyniosły ogółem na 31 grudnia 2018 r. 471 283 588 zł (przy ogólnej kwocie dochodów miasta – 432 733 130 zł (deficyt budżetu w wysokości 38 550 458 zł).26
Wydatki ogółem z budżetu miasta Piotrkowa Trybunalskiego na administrację publiczną w 2018 r. stanowiły łącznie 6,39% ogólnej kwoty wydatków z budżetu, która wyniosła na dzień 31 grudnia 2018 r. 471.283.588 zł.27 Wydatki bieżące na administrację publiczną stanowiły 85,19% ogólnej kwoty wydatków z budżetu miasta w 2018 r. Zgodnie z danymi tabeli 2 największe wydatki w 2018 r. w dziale 750 poniesiono na wynagrodzenia, tj. – 20.475.160 zł, co stanowiło 4,34% wydatków ogółem. Wydatki majątkowe na administrację w 2018 r. wyniosły ogółem 4.458.739 zł i stanowiły 0,95% ogółu wydatków z budżetu miasta. Analizując wydatki ogółem na administrację publiczną w Piotrkowie Trybunalskim (zgodnie z danymi w tabeli 1 i tabeli 2) rok do roku (2017/2018), wzrosły one z 25.866.972 zł w 2017 r. do 30.111.388 zł w 2018 r. (wzrost wydatków o 4.244.416 zł). Oznacza to utrzymywanie się tendencji wzrostowej, którą wyraźnie widać w danych za lata 2013-2017 zawartych w tabeli 1. Wskazuje to, że wydatki miasta Piotrkowa Trybunalskiego na bieżącą realizację zadań przez pracowników z każdym rokiem generują coraz większe koszty. Zaobserwowana tendencja wzrostowa powinna stanowić wskazówkę / zalecenie audytorów dla kierownictwa urzędu, aby dokonać dokładnej analizy potrzeb kadrowych jednostki w celu ewentualnego ograniczenia dynamiki wzrostu wydatków na wynagrodzenia w kolejnych latach.
Powyższe ustalenia związane są z potencjalnym ryzykiem utrzymywania w jednostce zatrudnienia pracowników na nieadekwatnym poziomie do liczby realizowanych zadań oraz realnego obciążenia pracą poszczególnych stanowisk pracy. Ustalenie zasadności przedmiotowego wydatku na wynagrodzenia wymaga przeprowadzenia dodatkowych analiz związanych z oceną relacji poziomu zatrudnienia do realizowanych zadań. W związku z powyższym kolejne zalecenie z audytu wydatków powinno dotyczyć konieczności przeprowadzenia odrębnego zadania audytowego w zakresie oceny efektywności pracy poszczególnych pracowników.
Poza wydatkami bieżącymi na administrację, część środków przeznaczono na inwestycje. Wydatki miasta na inwestycje w rozdziale 750 stanowiły 14,81% ogólnej kwoty wydatków z budżetu w 2018 r. Wydatki inwestycyjne w analizowanym rozdziale 750 stanowiły łącznie 0,95% ogólnej kwoty wydatków z budżetu miasta w 2018 r. Analiza poszczególnych wydatków w tym zakresie wykazała, że środki te przeznaczono m.in. na następujące zadania inwestycyjne:
zakup sprzętu komputerowego i oprogramowania - 36 900 zł, system kolejkowy dla budynków Urzędu Miasta – 45 315 zł,
25 Na podstawie danych z Banku Danych Lokalnych Głównego Urzędu Statystycznego https://bdl.stat.gov.pl/BDL/start [data dostępu: 8 czerwca 2019 r.] ogólna liczba mieszkańców miasta na dzień 31 grudnia 2018 r. wynosiła 73 670 osób. 26 Sprawozdanie z wykonania budżetu Miasta Piotrkowa Trybunalskiego za 2018 r. – kwoty wydatków zostały zaokrąglone do pełnych złotych. 27 Sprawozdanie z wykonania budżetu Miasta Piotrkowa Trybunalskiego za 2018 r.

220
termomodernizacja i adaptacja budynku na potrzeby Urzędu Miasta – 4 342 048 zł.28 Poszczególne wydatki inwestycyjne zostały zrealizowane z planem budżetu na
2018 r., zatem były ujęte w pierwotnym planie finansowym jednostki. Zgodnie z powyższymi danymi wydatki inwestycyjne w rozdziale 750 stanowiły niewielki udział w ogólnych wydatkach (poniżej 1%). Zatem można stwierdzić, że kluczowym wydatkiem na funkcjonowanie administracji są koszty osobowe. Poszczególne wydatki były realizowane według procedury obiegu i kontroli dokumentów finansowo – księgowych.29 Stwierdzenie w trakcie audytu ewentualnych odstępstw od procedury może skutkować np. naruszeniem przepisów w tym dyscypliny finansów publicznych. Ponadto stwarza to poważne zagrożenie nieprawidłowego wydatkowania środków z budżetu miasta.
Przeprowadzona analiza wydatków z budżetu na administrację publiczną uwidoczniła, że niezależny audyt wydatków jest niezbędny dla racjonalizacji wydatków w odniesieniu do pozostałych działów budżetu. Kompleksowy audyt wszystkich wydatków urzędu w tym zakresie byłby przydatny, gdyż mógłby przyczynić się do zracjonalizowania wydatków całej jednostki. Skuteczniejsze gospodarowanie wydatkami publicznymi byłoby pożądane szczególnie w obszarze wydatków bieżących na wynagrodzenia, które stanowią największą pozycję w wydatkach w dziale 750 i dynamicznie wzrastały w poszczególnych latach (tabela 1) objętych badaniem.
Audytowanie wydatków samorządów lokalnych jest standardem w państwach demokratycznych. Ich zakres, cele oraz podmioty uprawnione do audytu określa prawo danego państwa. Przykładowo National Audit Office jako uprawniony podmiot przeprowadza audyty wydatków władz lokalnych w Wielkiej Brytanii. Przedstawiane raporty z audytów potwierdzają, że monitorowanie wydatków publicznych jest niezbędne do sprawnego zarządzania finansami samorządów lokalnych.30 Audyt wydatków budżetowych, w tym na administrację publiczną prowadzi również Unia Europejska. Analizy wydatków przedstawiane w raportach Unii Europejskiej dotyczą wszystkich państw członkowskich ogółem jak i każdego państwa odrębnie. Aktualne dane z 2019 r. dotyczące wydatków Unii Europejskiej w okresie programowania 2014-2020 za lata 2014-2018 dowodzą, że wydatki na administrację publiczną ogółem mają tendencję wzrostową, gdyż wzrosły z 9.656,2 mln Euro w 2017 r. do 9.943,5 mln Euro w 2018 r.31
Mając powyższe na uwadze można stwierdzić, że audyt wydatków samorządu terytorialnego w Polsce niezależnie od zakresu lub obszaru jakiego dotyczy jest w pewnym zakresie tożsamy z działaniami podejmowanymi w krajach Unii Europejskiej. Wynika to w dużej mierze z faktu, że metodyka audytu prowadzonego w Polsce opiera się na sprawdzonych światowych rozwiązaniach w tym zakresie a problem ograniczania i racjonalizacji wydatków ogółem dotyczy większości państw na świecie.
28 Sprawozdanie z wykonania budżetu Miasta Piotrkowa Trybunalskiego za 2018 r. 29 Zarządzenie Nr 230 Prezydenta Miasta Piotrkowa Trybunalskiego z dnia 1 czerwca 2017 r. w sprawie wprowadzenia instrukcji obiegu i kontroli dokumentów finansowo – księgowych ze zm. (dostęp 2 czerwca 2019 r. - http://www.bip.piotrkow.pl/upload/20170602131058zxysva9ffl1u.pdf 30 https://www.nao.org.uk/report/local-authority-governance-2/ - dostęp [26.11.2019 r.]. 31 https://ec.europa.eu/budget/graphs/revenue_expediture.html - dostęp [26.11.2019 r.].

221
Podsumowanie Przedmiotem badania był audyt wydatków budżetowych w wybranych miastach na prawach powiatu w dziale 750 administracja publiczna. Przeprowadzenie audytu wydatków pozwoliło stwierdzić, że w 2 z 3 analizowanych miast wystąpiła dynamika wzrostu ogólnych wydatków z budżetu na administrację publiczną (w latach 2013-2017). W każdym z 3 analizowanych miast nastąpił wzrost wydatków na wynagrodzenia pracowników ogółem. Ponadto szczegółowa analiza wydatków za 2018 r. w Piotrkowie Trybunalskim wskazała, że wzrost wydatków w ocenianym dziale - 750 ma tendencję wzrostową, gdyż zwiększył się o 4.244.416 zł w stosunku do wydatków w roku 2017 r.
Audyt wydatków w dziale 750 wykazuje, że właściwym byłoby przeprowadzenie kompleksowego audytu wydatków, a wnioski z niego mogłyby przyczynić się do zrównoważenia budżetu miasta Piotrkowa Trybunalskiego, którego deficyt w 2018 r. wyniósł ogółem 38.550.458,10 zł. Istotnym ograniczeniem w przeprowadzonych badaniach był brak dostępu do szczegółowych danych z systemów finansowo – księgowych ocenianych jednostek samorządu, które zawierają uzasadnienia danego wydatku. Dostęp do tych danych umożliwiłby pełniejszą analizę badanego obszaru.
Przeprowadzona analiza wydatków z budżetu samorządu miejskiego jest przykładem możliwości wykorzystania audytu wewnętrznego jako narzędzia racjonalizacji wydatków danej jednostki sektora finansów publicznych. Audyt wydatków jest zatem ważnym instrumentem przyczyniającym się do usprawnienia gospodarki finansowej danej jednostki a przez to całego sektora finansów publicznych.
Bibliografia Czerwiński K., Audyt wewnętrzny, InfoAudit Sp. z o.o., wyd. 1, Warszawa 2004 r., M. Dylewski, B. Filipiak, M. Gorzałczyńska-Koczkodaj, Finanse samorządowe. Narzędzia, decyzje, procesy, PWN, Warszawa 2006 r. C. Farvacque-Vitkovic, M. Kopanyi (red.), Municipal Finances. A Handbook for Local Governments, International Bank for Reconstruction and Development / The World Bank, Washington DC, 2014 r. M. Gazda, O procesie racjonalizacji wydatków publicznych, Ruch Prawniczy, Ekonomiczny i Socjologiczny, VOL 78, NR 1 (2016), Uniwersytet Adama Mickiewicza w Poznaniu, s. 169-179. Grocholski H. (red.), Praktyczne aspekty audytu wewnętrznego. Tom 1, Instytut Rachunkowości i Podatków, Warszawa 2004 r. Głuchowski, J., Pomorska, A., Szołno-Koguc, J. (red.), Ekonomiczne i prawne problemy racjonalizacji wydatków publicznych, Tom 1: Racjonalizacja wydatków publicznych � uwarunkowania i instrumenty, Uniwersytet Marii Curie – Skłodowskiej, Lublin, 2005 r. Kiziukiewicz T.(red.), Audyt wewnętrzny w strukturze kontroli zarządczej, Difin, Warszawa, 2013r. Moeller Robert, Nowoczesny audyt wewnętrzny, Wolters Kluwer Polska, Warszawa 2011 r. J. Pfaff, Rewizja finansowa, Uniwersytet Ekonomiczny w Katowicach, 2011 r. Pickett K. H. Spencer, The internal auditing handbook. Third edition, John Wiley & Sons Ltd, West Sussex, United Kingdom, 2010 r. M. Podstawka, Podstawy finansów. Teoria i praktyka, SGGW, wyd. 2, Warszawa, 2011 r. M. Podstawka, Nowoczesne zarządzanie wydatkami publicznymi, [w:] Polityki Europejskie, Finanse i Marketing, Nr 6 (55)/2011, SGGW, Warszawa, 2011 r. M. Podstawka, Zasady budżetowania [w:] M. Podstawka (red.), Finanse, Instytucje. Instrumenty. Podmioty. Rynki. Regulacje., PWN, Warszawa, 2010 r.

222
Stiglitz J. E., Ekonomia sektora publicznego, PWN, Warszawa 2004 r. D. E. Wildasin, Urban Public Finance, wyd. Routledge Taylor&Francis Group, New York, 2012 r. A. Żabka, Efficiency of budget expenditure inthe process of creating framework conditions for local development. Planing and evaluation, Wyższa Szkoła Finansów i Prawa, Bielsko – Biała, 2017 r. Rozporządzenie Ministra Finansów z dnia 4 września 2015 r. w sprawie audytu wewnętrznego oraz informacji o pracy i wynikach tego audytu, (tj. Dz. U. z 2018 r., poz. 506). Ustawa z dnia 27 sierpnia 2009 r. o finansach publicznych, tj. (Dz. U. z 2019 r., poz. 869). Ustawa z dnia 17 grudnia 2004 r. o odpowiedzialności za naruszenie dyscypliny finansów publicznych, (t.j. Dz. U. z 2018 r. poz. 1458). Ustawa z dnia 14 lutego 2003 r. o rachunkowości (Dz.U. 2003, nr 49, poz. 408). Ustawa z dnia 8 marca 1990 r. o samorządzie gminnym (t.j. Dz. U. z 2019 r. poz. 506). Ustawa z dnia 5 czerwca 1998 r. o samorządzie powiatowym (t.j. Dz. U. z 2019 r. poz. 511). Sprawozdanie z wykonania budżetu Miasta Piotrkowa Trybunalskiego za 2018 r. dostęp: [8 czerwca 2019 r.] - http://www.bip.piotrkow.pl/index.php?idg=3&id=1843&x=56&y=2). Zarządzenie Nr 230 Prezydenta Miasta Piotrkowa Trybunalskiego z dnia 1 czerwca 2017 r. w sprawie wprowadzenia instrukcji obiegu i kontroli dokumentów finansowo – księgowych ze zm. Dostęp [2 czerwca 2019 r.] - http://www.bip.piotrkow.pl/upload/20170602131058zxysva9ffl1u.pdf Bank Danych Lokalnych - https://bdl.stat.gov.pl/BDL/start. http://www.bip.piotrkow.pl/index.php?idg=2&id=1056&x=36&y=8&z=17 dostęp [8.10.2019 r.]. https://www.nao.org.uk/report/local-authority-governance-2/ - dostęp [26.11.2019 r.]. https://ec.europa.eu/budget/graphs/revenue_expediture.html - dostęp [26.11.2019 r.].
Summary The article presents the role and tasks of internal audit in the assessment of public expenditures in a selected area for municipal governments in Łódź, Piotrków Trybunalski and Skierniewice in Poland. The research found, among other things, that internal audits contribute to a more rational spending of funds from the city budget on public administration activities. In addition, it has also been shown that internal audit is a helpful tool in ensuring reasonable expenses for public finance sector entities. The assessment and monitoring of expenses is the responsibility of public authorities, to ensure rational financial management of a given local government unit.
The aim of the article is to present internal audit as an important tool to support city authorities in assessing the expenditure of municipalities in a selected area. For the purposes of this publication, local government units from the Łódź Voivodeship, i.e. a city with district status, were selected as an example for analysis. In this article, case study, analytical method, inference method and document examination method were used as research methods. To make the necessary analyses, materials made available by the surveyed entities and data available in public registers collected by authorized institutions were used. Key words: internal audit, expenses, public sector, local government units, Poland JEL Codes: H-72, H-83 Informacja o autorze:
Dr Cezary Szydłowski University of Łódz Faculty of Economics and Sociology, Department of Finance and Accounting SME e-mail: [email protected] ORCID: 0000-0002-7454-2908
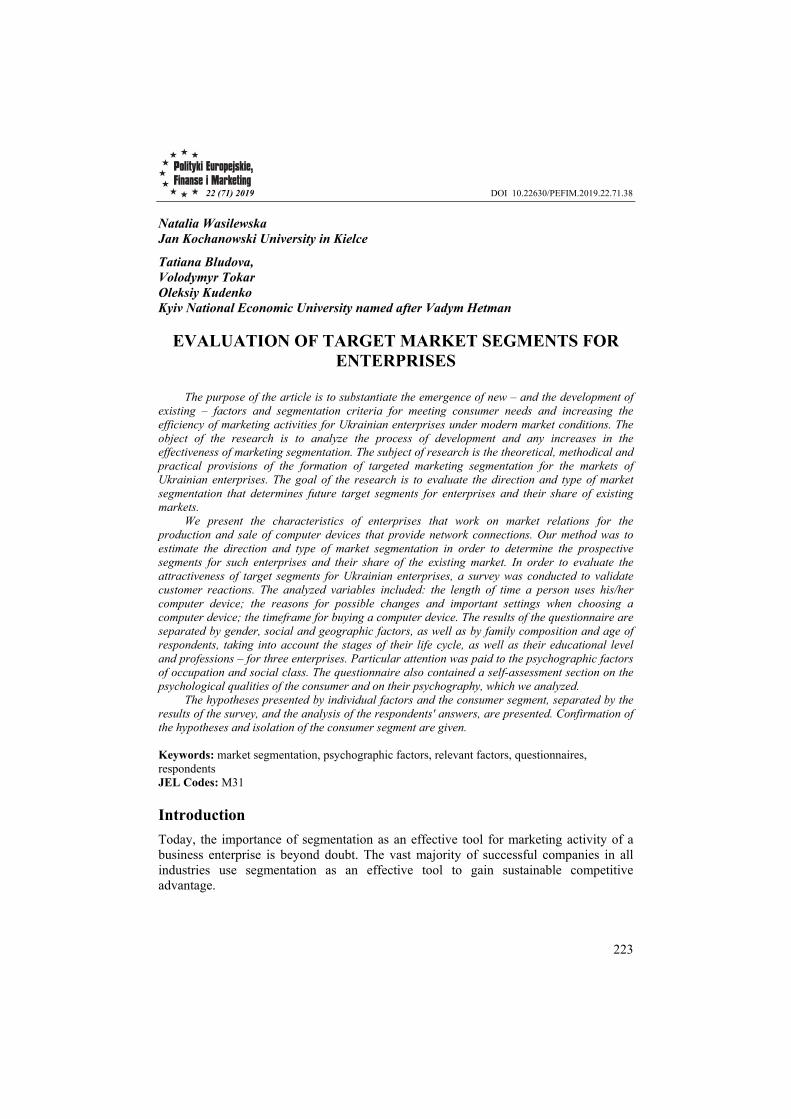
223
22 (71) 2019 DOI 10.22630/PEFIM.2019.22.71.38
Natalia Wasilewska Jan Kochanowski University in Kielce
Tatiana Bludova, Volodymyr Tokar Oleksiy Kudenko Kyiv National Economic University named after Vadym Hetman
EVALUATION OF TARGET MARKET SEGMENTS FOR
ENTERPRISES
The purpose of the article is to substantiate the emergence of new – and the development of existing – factors and segmentation criteria for meeting consumer needs and increasing the efficiency of marketing activities for Ukrainian enterprises under modern market conditions. The object of the research is to analyze the process of development and any increases in the effectiveness of marketing segmentation. The subject of research is the theoretical, methodical and practical provisions of the formation of targeted marketing segmentation for the markets of Ukrainian enterprises. The goal of the research is to evaluate the direction and type of market segmentation that determines future target segments for enterprises and their share of existing markets.
We present the characteristics of enterprises that work on market relations for the production and sale of computer devices that provide network connections. Our method was to estimate the direction and type of market segmentation in order to determine the prospective segments for such enterprises and their share of the existing market. In order to evaluate the attractiveness of target segments for Ukrainian enterprises, a survey was conducted to validate customer reactions. The analyzed variables included: the length of time a person uses his/her computer device; the reasons for possible changes and important settings when choosing a computer device; the timeframe for buying a computer device. The results of the questionnaire are separated by gender, social and geographic factors, as well as by family composition and age of respondents, taking into account the stages of their life cycle, as well as their educational level and professions – for three enterprises. Particular attention was paid to the psychographic factors of occupation and social class. The questionnaire also contained a self-assessment section on the psychological qualities of the consumer and on their psychography, which we analyzed.
The hypotheses presented by individual factors and the consumer segment, separated by the results of the survey, and the analysis of the respondents' answers, are presented. Confirmation of the hypotheses and isolation of the consumer segment are given. Keywords: market segmentation, psychographic factors, relevant factors, questionnaires, respondents JEL Codes: M31
Introduction Today, the importance of segmentation as an effective tool for marketing activity of a business enterprise is beyond doubt. The vast majority of successful companies in all industries use segmentation as an effective tool to gain sustainable competitive advantage.

224
By separating consumer segments and providing them with relevant goods and services, a company can retain and expand its market share, obtain target profits and make optimal use of available resources. Accordingly, segmentation is a sensitive and dynamic tool that must respond quickly to changes in the social and economic life of society.
Table 1. Market segmentation methods
Market segmentation methods
Application and essence
Segmentation by benefits McDonald M, Dunbar I (2004)1
The method is based on the construction of a model of consumer behavior, and involves three consecutive stages: 1. Determining the benefits that interest the consumer, and their importance 2. Identifying differences in lifestyle that lead to benefit segmentation. Consumer grouping by these estimates. 3. Determining whether the benefit segments have a variety of product views and competing brands.
Segmentation network building Dolnicar S, Leisch F (2010)2
The method is used at the macro-segmentation level to highlight the underlying markets. A combination of variables characterizing functions, consumers, and technology is considered. According to the results of the analysis, there are primary segments that give the maximum percentage of benefits.
Multi-dimensional classification Wood SN (2006) 3
The essence of the method lies in the simultaneous, multidimensional classification of signs of consumer behavior. Consumers that are similar in a number of characteristics (e.g., demographic, psychographic, etc.) are combined in one type. The degree of similarity between people of one type should be higher than that of people of different types. The method enables segmentation of consumers by the most important attribute.
Division by groups Cliff K (2009) 4
Objects are grouped consecutively. Usually, one of the features is recorded as system-forming. This allows the formation of subgroups in which this feature is more important than features of other consumers of the product.
Functional maps Dolnicar S, Leisch F (2017) 5
The method involves double segmentation by product and consumer. Such aspects may be: - single-factor, when double market segmentation is performed by one factor for a homogeneous product group; - multifactorial, when analyzing to which consumer groups a specific product model is assigned, and which parameters are most important for market promotion.
Source: Developed by authors.
At the same time, changes in consumer behavior, preferences and consumer lifestyles lead to the emergence of new and development of existing factors and segmentation criteria to better meet consumer needs and increase the efficiency of enterprise marketing activities. Kumar (2008) 6 has constructed a blockchain based on
1 McDonald M, Dunbar I (2004). Market Segmentation: How to Do It, How to Profit from It.Elsevier ButterworthHeinemann. Oxford. 2 Dolnicar S, Leisch F (2010) Evaluation of structure and reproducibility of cluster solutions using the bootstrap. Mark Lett 21:83–101. 3 Wood SN (2006) Generalized additive models: an introduction with R. Chapman and Hall/CRC, Boca Raton 4 Wallenburg, C. M. and Lukassen, P. (2011). Proactive Improvement of Logistics Service Providers as Driver of Customer Loyalty, European Journal of Marketing, Vol. 45, No: 3, pp. 438-454. 5Dolnicar S, Leisch F (2017) Using segment level stability to select target segments in data-driven market segmentation studies. Mark Lett 28(3):423–436. 6 Kumar, N. (2008). Marketing as Strategy Leading to Successs, Prague: Grada Publishing (in Czech).

225
the management of the value of networks from manufacturers to end consumers and offers a comprehensive perception of the value chain.. Kotler, P. and Keller, L.G. (2013)
7 analyze the increased value for the customer. Kowalkowski (2011) 8 views customer value as an integrated configuration. Kourdi, J. (2011) 9 states that the form and design of products and services should also reflect the big picture.
Wallenburg, C. M. and Lukassen, P. (2011) 10 emphasize the importance of intangible attributes of customer value (emotional and social), which constitute assets that lead to deepening customer relationships. E-commerce behavior is carefully described by Wiedmann et al., 201011. Baron, S. and Harris, K., 2010 12 note that the concept of customer satisfaction can lead to long-term relationships with customers. Table 1 demonstrates the methods of segmentation.
It is worth mentioning, that the multidimensional segmentation foresees the building of consumer groups in terms of psychographics, demographics, socio-economic or other indicators, as noted by Wood, S. N. (2006). As a result, the researcher receives several groups of consumers who are similar.
Dolnicar S, Leisch F (2017) emphasize that the functional card method identifies a group of consumers meeting certain product characteristics.
Therefore, market segmentation methods are interconnected, as has been proved by Anderson, E. W., Fornell, C., & Mazvacheryl, S. K. (2004)13 (Table 2). Table 2. Market segmentation factors Types of factors Objective Subjective (psychographic)
Non-specific marketing factors
Demographic: -sex; -age.
Personal features: - psychotype,
- ideology, - perception and benefits,
- behavior. Marketing-
specific factors Socio-economic:
- income; - education;
- consumer lifecycle; - classification of residential areas;
- use of media.
Lifestyle: - values; - hobby;
- entertainment; - style of interaction with other people;
- judgments. Source: Developed by authors.
7 Kotler, P. and Keller, L.G. (2013). Marketing Management, Prague: Grada Publishing (in Czech). 8 Kowalkowski, CH. (2011). Dynamics of Value Propositions: Insights from Service-Dominant Logic, European Journal of Marketing, Vol.45, No:1/2, pp. 277-294. 9 Kourdi, J. (2011). Marketing Century: How Marketing Drives Business and Shapes Society, Chichester: John Wiley & Sons. 10 Wallenburg, C. M. and Lukassen, P. (2011). Proactive Improvement of Logistics Service Providers as Driver of Customer Loyalty, European Journal of Marketing, Vol. 45, No: 3, pp. 438-454. 11 Wiedmann, K.P., Hennigs, N., Pankalla, L., Kassubek, M., Seegebarth, B. and Reeh, M.O. (2010). Online Distribution of Pharmaceuticals: Investigating Relations of Consumers’ Value Perception, Online Shopping Attitudes and Behaviour in a Epharmacy Context, Journal of Customer Behaviour, Vol. 9, No. 2, pp. 175-199. 12 Baron, S. and Harris, K. (2010). Toward an Understanding of Customer Perspectives on Experiences. Journal of Services Marketing, 24(7), pp. 518-531 13Anderson, E. W., Fornell, C., & Mazvacheryl, S. K. (2004).Customer satisfaction and shareholder value.Journal of Marketing, 68(4), 172–185. Retrieved from http://dx.doi.org/10.1509/jmkg.68.4.172.42723.

226
The methodological basis of the research is the specific research methods: analytical and logical method, method of analysis and synthesis to distinguish modern marketing strategies according to the level of market segmentation and their role in the process of strategic marketing, as well as analysis of questionnaires to approve customer reactions.
However, there are a number of issues related to the marketing analysis of the Ukrainian market vis-à-vis the global market of computer devices that provide network connections, as well as the study of the segmentation levels of the Ukrainian market. They require new methodological approaches to identify current segmentation criteria confirming the relevance of existing segments, which is one of the most urgent problems for the marketing activity of enterprises under current conditions.
Thus today, market segmentation is not just an option, but also a necessity for any enterprise that seeks to operate effectively and to develop in the face of increased competition and growing demands of potential and existing consumers. Nevertheless, in order to be effective, market segmentation should not be used as an isolated tool, but should complement and develop the overall corporate strategy of enterprise development.
Therefore, identifying new topical segmentation criteria along with confirming the relevance of existing segmentation is one of the most pressing problems for an enterprise's marketing activities in today's context.
In order to evaluate the attractiveness of target segments of Ukrainian enterprises, a survey was conducted to validate customer reactions.
Research result The results and analysis of questionnaires to validate customer reactions Table 3 shows the companies that work in the field of market relations for the manufacture and sale of computer devices with network connectivity. Table 3. Characteristics of enterprises for the production and sale of computers
Enterprise (Market period)
Company profile
Samsung Electronics Ukraine Company
(20 years)
Samsung Electronics is the world leader in the production of telecommunications and digital media equipment, as well as in the field of digital convergence technology. Wholesale of electrical and electronic goods - digital media (LCD panels and software)
"Navigator" (22 years)
Manufacturer of the full range of TM Impression computer systems: desktops, laptops, servers (including blade systems), graphic stations and a wide range of consumer solutions (tablets, monoblocks, laptops, ultrabooks). The leader in the volume of production and sales of desktops in Ukraine, the distributor of IT products of leading world manufacturers, providing IT consulting, design, implementation of corporate networks, customer support. Exports goods to the following countries: Kazakhstan, South Korea, The company imports goods from the following countries: China, Hong Kong (Hong Kong), South Korea, The Netherlands, Russia
"Quasar" (20 years)
Largest manufacturer of PV energy products, integrated circuits and silicon wafers in Eastern Europe. The plant is one of the five largest manufacturers of photovoltaic modules and autonomous power plants based on them. The plant manufactures and offers a complete range of PV power products, ranging from photovoltaic converters of any size and shape, mono or polycrystalline modules, from 1 to 200 watts, and ending with solar chargers and power supplies of various power and functionality
Source: Developed by authors.

227
Bludova (2005)14 notes that when conducting any type of questioning, it is necessary to determine the size of the sample. Note that the sample size is determined by the formula:
0
0 11
nn nN
= −+; (1)
where N is the size of the aggregate - the number of potential consumers of products of selected enterprises in the area; n is the minimum sample size given that the sample of consumers who buy computer devices with online connectivity in online stores selling products of a select group of companies is being investigated.
The following sample size was determined for the enterprises: 156 persons - Samsung Electronics Ukraine Company; 143 persons - Navigator; 137 persons are "Quasar". Figure 1 shows a breakdown of the answers to the question: "How much time per day do you use your computer device?"
Figure 1. The length of time you use your computer device Source: Developed by authors. Note that in the life of each person there comes a time when it becomes necessary to change an existing computer or buy a new one. Of course, in any configuration - a new or first computer device will satisfy almost all expectations for innovative technology, though it may be far from the optimal choice. And it is unwise to spend money on what will quickly depreciate. In this case, it is somewhat easier for experienced users to make the right choice because they are aware of their preferences and have an idea of what tasks they will be faced with when choosing a new computer device.
Figure 2 shows the percentages of the answers to the reasons for the possible change of the computer device. Therefore, we see the need to identify the segment of consumers who want to buy a new model of computer device. Note that if, for example, a consumer uses a computer device to visit websites, play simple games (such as Alawar or mini-games that are on social networks), and also to listen to music on a computer device, then a powerful computer is needed.
14 T. Bludova (2005). Probability Theory: Educ. guide Lviv. NBU National Bank, 2005– 319 p. (In Ukrainian )
05
10152025303540
1-2 years
2-3 years
3-4 years
4-5 years
5-6 years
6-7 years
7-8 years
8-9 years
9-10 years
10-11 years
Quasar
Samsung
Navigator
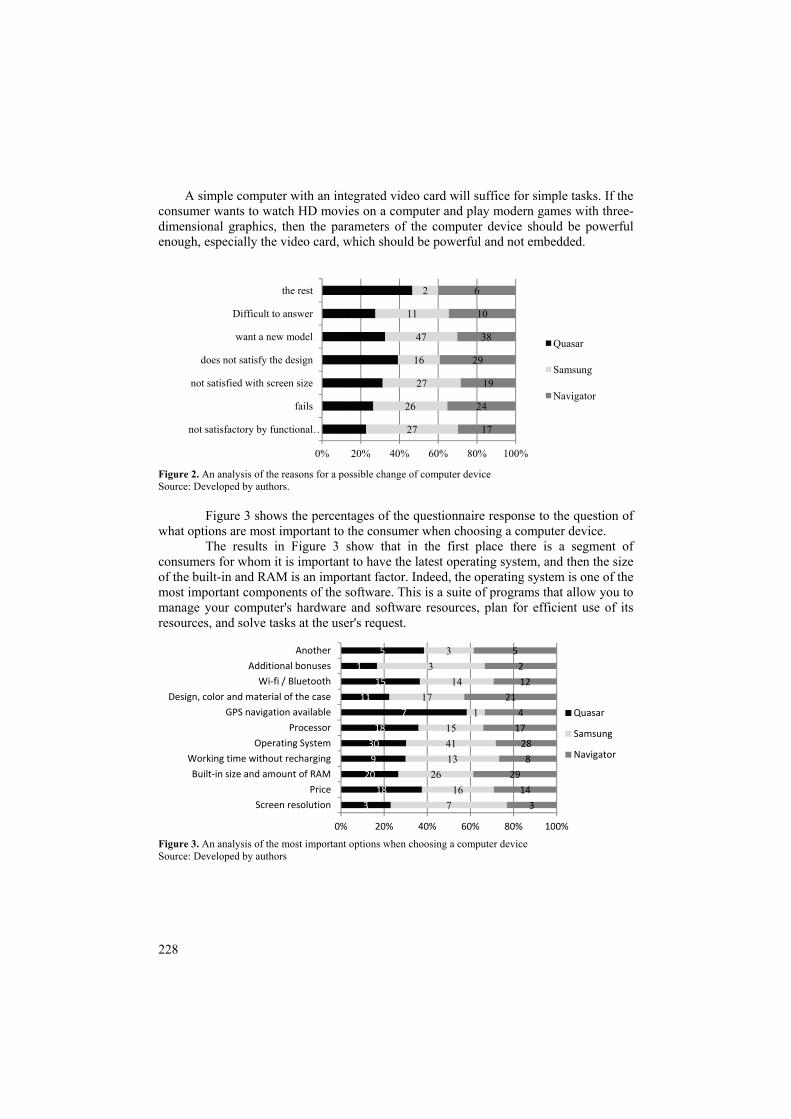
228
A simple computer with an integrated video card will suffice for simple tasks. If the consumer wants to watch HD movies on a computer and play modern games with three-dimensional graphics, then the parameters of the computer device should be powerful enough, especially the video card, which should be powerful and not embedded.
Figure 2. An analysis of the reasons for a possible change of computer device Source: Developed by authors.
Figure 3 shows the percentages of the questionnaire response to the question of what options are most important to the consumer when choosing a computer device.
The results in Figure 3 show that in the first place there is a segment of consumers for whom it is important to have the latest operating system, and then the size of the built-in and RAM is an important factor. Indeed, the operating system is one of the most important components of the software. This is a suite of programs that allow you to manage your computer's hardware and software resources, plan for efficient use of its resources, and solve tasks at the user's request.
Figure 3. An analysis of the most important options when choosing a computer device Source: Developed by authors
13
18
21
29
41
8
7
27
26
27
16
47
11
2
17
24
19
29
38
10
6
0% 20% 40% 60% 80% 100%
not satisfactory by functional …
fails
not satisfied with screen size
does not satisfy the design
want a new model
Difficult to answer
the rest
Quasar
Samsung
Navigator
3
18
20
9
30
18
7
11
15
1
5
716
26134115
117
143
3
3
14
29
8
28
17
4
21
12
2
5
0% 20% 40% 60% 80% 100%
Screen resolution
Price
Built-in size and amount of RAM
Working time without recharging
Operating System
Processor
GPS navigation available
Design, color and material of the case
Wi-fi / Bluetooth
Additional bonuses
Another
Quasar
Samsung
Navigator

229
The operating system ensures the interaction of programs with external devices and with each other; allocates RAM; recognizes various situations that occur when executing programs by notifying the user. RAM, in turn, is a temporary repository of files that are often used or copied. As a rule, 4 Gigabytes of RAM will be enough for a computer of unpretentious users, but the advanced user will need all 8 Gigabytes of RAM.
Figure 4. Analysis of the purchase time of a computer device Source: Developed by authors.
Figure 4 shows the percentages of the questionnaire response to the question of how long ago the computer device you used was purchased. As shown in Figure 4, a significant number of consumers purchased a computer device from one to one and a half years ago. This is to say that the modern user wants to keep up with all the news in the space of improving computer devices.
It should be noted that recently scientists are working on the creation of a computer that can understand human voice commands. It has been proven that electronic circuits in computers of the new generation are similar to the structure of the human brain, so such computers are capable of learning on their own. In the near future, a computer user will speak to their machine in their native language. This means that your computer is even more accessible and much easier to manage.
Gender, social and geographical segmentation survey results Undoubtedly, technique is an integral part of the everyday life of a contemporary, regardless of gender. At the wheel of cars - both men and women, similar to the use of computer devices. This statement is true and for Internet users, which is confirmed by sociological data of 2016, there is no gender imbalance (Table 4). Table 4. Gender Internet users Sociological Institution Male users,% Female users,% КМІС 51 49 GfK Ukraine 50,9 49,1 InMind 50 50 Source: Developed by authors.
13
18
20
19
39
18
7
2
1
17
16
26
19
56
15
2
3
2
11
14
29
21
41
17
4
5
1
0% 10% 20% 30% 40% 50% 60% 70% 80% 90% 100%
Difficult to answer
More than 3 years ago
From 2 to 3 years
From one and a half to 2 years
From 1 to one and a half years
9 months to 1 year
6 months to 9 months
From 3 to 6 months
Less than 3 months
Quasar
Samsung
Navigator

230
Table 5. Survey results for geographic segmentation Enterprise The sample size Males Females Nationality (Ukrainians)
Quasar 137 69 - 50,3% 68 - 49,7% 95,7% Samsung 156 86 - 55,1% 70 - 44,9% 91,3% Navigator 143 81 - 56,6% 62 - 43,4% 93,9% Source: Developed by authors.
To confirm this pattern, a survey was conducted on the gender of consumers of computer devices and the results for determining geographical factors are presented in Table 5. Almost all respondents are Ukrainian, and on average half of respondents are male and half are female.
Today, an interesting demographic question arises regarding the identification of families and their characteristics. This issue plays an important role in market segmentation. After all, families and their "varieties" are many. Therefore, the right definition of the focus of the society will help to conduct the right marketing policy, taking into account the segmentation.
Figure 5 presents the survey results, which show the distribution of the three enterprises by family composition and age of respondents.
Figure 5. Distribution by composition of families, age of respondents of enterprises Source: Authors’ elaboration.
Analyzing Figure 5, we can conclude the segment of respondents aged 26-35 years and 16-25 years living in families with 3-4 people. Figure 6 presents the results of the survey, which show the distribution of life cycle stages of the respondents.
0102030405060
from 12 to 15 years
16-25 years 26-35 years 36-45 years 46-60 years from 61 years
Quasar
Samsung
Navigator
0
20
40
60
80
100
Quasar Samsung Navigator
2 persons
With - 4 persons
5 people and more

231
Figure 6. Distribution of respondents according to the life cycle stages of the three enterprises Source: Developed by authors.
As can be seen from Figure 6, the largest segment here is a family of 3-4 persons, aged 26-35 years, with the largest purchase of a computer device by a young family with a child over 6 years of age 15.
Bludova T.V., Tokar V.V. (2013) 16 emphasize that computer technologies have a great influence on the development of science, technology, business and many other spheres of human activity. The specifics of different professions play a role in the choice of goods. Figure 7 presents a diagram of the type of profession of respondents. Figure 7 shows that the distribution of respondents by occupation by district has the same characteristics. As you can see, you can select a segment of managers and students. This segment is characteristic of all three enterprises.
Figure. 7. Distribution of respondents by type of professions of the three enterprises Source: Developed by authors.
It should be noted that in terms of religious beliefs, almost all respondents (an average of 96.7%) turned out to be Orthodox.
Figure 8 presents a diagram of the distribution of respondents by level of education.
15 Kumar, N. (2008). Marketing as Strategy Leading to Successs, Prague: Grada Publishing (in Czech). 16 Bludova T.V., Tokar V.V. (2013). Modeling of innovation and investment activity in the context of economic security of the enterprise // Effective Economics. - 2013. - № 2. - [Electronic resource]. - Access mode: http://nbuv.gov.ua/UJRN/efek_2013_2_58 (In Ukrainian )
522
221119
4213
3
228
1618
4832
84
425
1527
3329
37
0% 20% 40% 60% 80% 100%
singletonyoung family
young family with young childrena young family with a young child …
young family with a child over 6 …older couple with children
spouses without childrensingle elderly without children
Quasar
Samsung
Navigator
3
8
30
9
36
8
27
11
5
17
6
36
13
41
4
21
14
4
7
4
39
9
28
5
27
21
3
0% 10% 20% 30% 40% 50% 60% 70% 80% 90% 100%
government officials
technical specialists
managers
middle management
students
pensioners
service workers
teachers
unemployed
Quasar
Samsung
Navigator
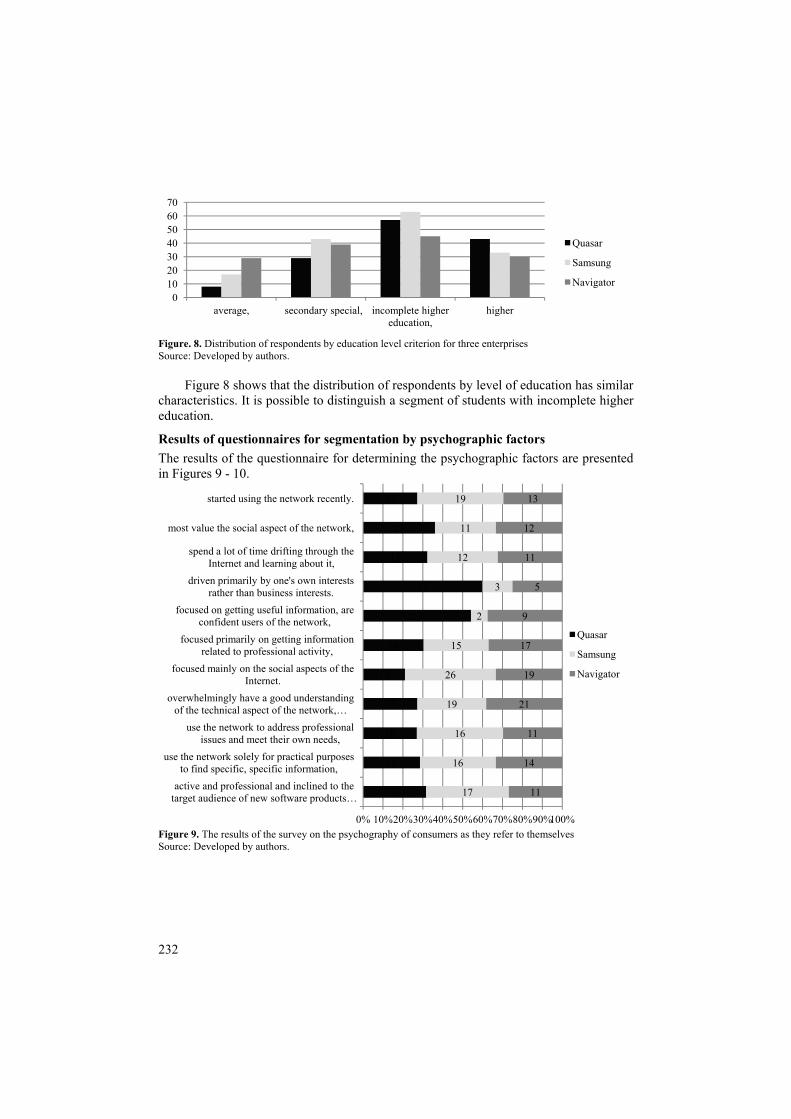
232
Figure. 8. Distribution of respondents by education level criterion for three enterprises Source: Developed by authors.
Figure 8 shows that the distribution of respondents by level of education has similar characteristics. It is possible to distinguish a segment of students with incomplete higher education.
Results of questionnaires for segmentation by psychographic factors The results of the questionnaire for determining the psychographic factors are presented in Figures 9 - 10.
Figure 9. The results of the survey on the psychography of consumers as they refer to themselves Source: Developed by authors.
010203040506070
average, secondary special, incomplete higher education,
higher
Quasar
Samsung
Navigator
13
12
10
15
12
14
13
12
11
13
12
17
16
16
19
26
15
2
3
12
11
19
11
14
11
21
19
17
9
5
11
12
13
0% 10%20%30%40%50%60%70%80%90%100%
active and professional and inclined to the target audience of new software products …
use the network solely for practical purposes to find specific, specific information,
use the network to address professional issues and meet their own needs,
overwhelmingly have a good understanding of the technical aspect of the network, …
focused mainly on the social aspects of the Internet.
focused primarily on getting information related to professional activity,
focused on getting useful information, are confident users of the network,
driven primarily by one's own interests rather than business interests.
spend a lot of time drifting through the Internet and learning about it,
most value the social aspect of the network,
started using the network recently.
Quasar
Samsung
Navigator
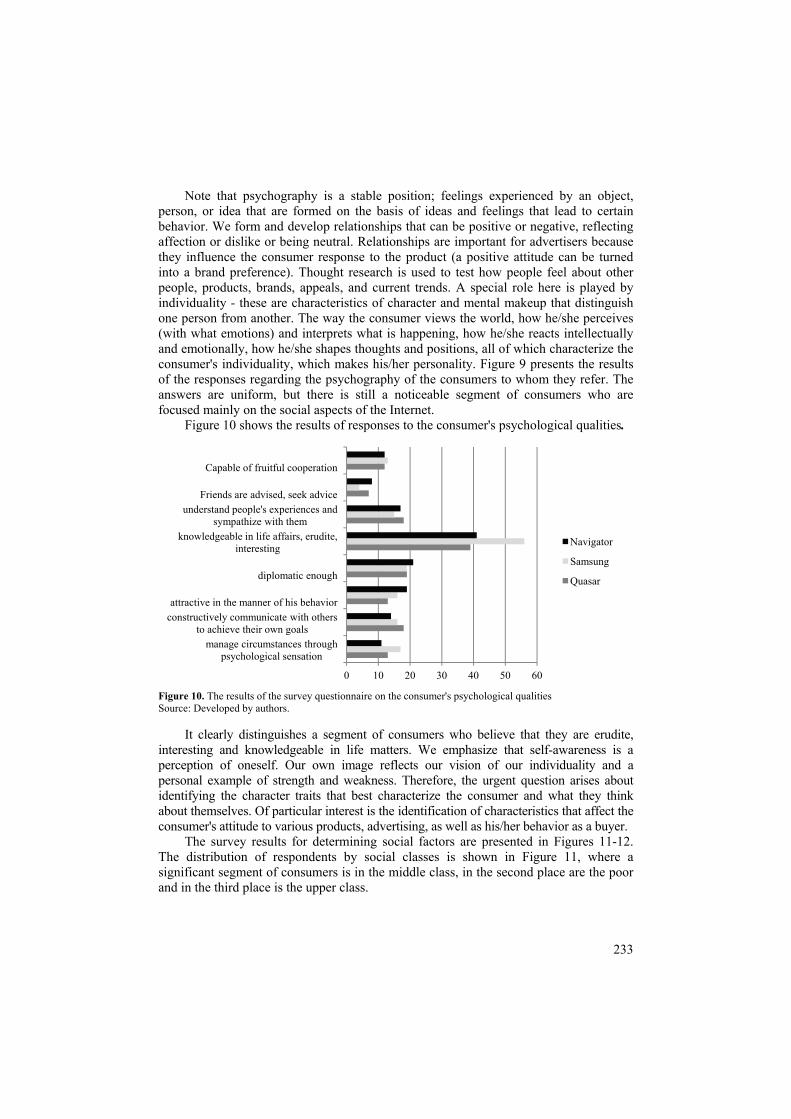
233
Note that psychography is a stable position; feelings experienced by an object, person, or idea that are formed on the basis of ideas and feelings that lead to certain behavior. We form and develop relationships that can be positive or negative, reflecting affection or dislike or being neutral. Relationships are important for advertisers because they influence the consumer response to the product (a positive attitude can be turned into a brand preference). Thought research is used to test how people feel about other people, products, brands, appeals, and current trends. A special role here is played by individuality - these are characteristics of character and mental makeup that distinguish one person from another. The way the consumer views the world, how he/she perceives (with what emotions) and interprets what is happening, how he/she reacts intellectually and emotionally, how he/she shapes thoughts and positions, all of which characterize the consumer's individuality, which makes his/her personality. Figure 9 presents the results of the responses regarding the psychography of the consumers to whom they refer. The answers are uniform, but there is still a noticeable segment of consumers who are focused mainly on the social aspects of the Internet.
Figure 10 shows the results of responses to the consumer's psychological qualities.
Figure 10. The results of the survey questionnaire on the consumer's psychological qualities Source: Developed by authors.
It clearly distinguishes a segment of consumers who believe that they are erudite, interesting and knowledgeable in life matters. We emphasize that self-awareness is a perception of oneself. Our own image reflects our vision of our individuality and a personal example of strength and weakness. Therefore, the urgent question arises about identifying the character traits that best characterize the consumer and what they think about themselves. Of particular interest is the identification of characteristics that affect the consumer's attitude to various products, advertising, as well as his/her behavior as a buyer.
The survey results for determining social factors are presented in Figures 11-12. The distribution of respondents by social classes is shown in Figure 11, where a significant segment of consumers is in the middle class, in the second place are the poor and in the third place is the upper class.
0 10 20 30 40 50 60
manage circumstances through psychological sensation
constructively communicate with others to achieve their own goals
attractive in the manner of his behavior
diplomatic enough
knowledgeable in life affairs, erudite, interesting
understand people's experiences and sympathize with them
Friends are advised, seek advice
Capable of fruitful cooperation
Navigator
Samsung
Quasar

234
Figure 11. Distribution of respondents by social classes Source: Developed by authors.
The breakdown of respondents by occupation is given in Figure 12, where a significant segment of consumers are employees, second place students and third place entrepreneurs.
Figure 12. Distribution of respondents by occupation Source: Developed by authors. Figure 13 presents the results of the responses regarding the devices purchased by the respondents. A significant segment stood out for tablets, followed by smartphone purchases.
Figure 13. Buying Device Features You give preference to devices by respondents Source: Developed by authors.
0
20
40
60
80
100
Quasar Samsung Navigator
The poor
Of average prosperity
0
10
20
30
40
50
60
Schoolboy Student Official Entrepreneur Housewife
Quasar
Samsung
Navigator
01020304050607080
Cellphone Smartphone Tablet others
Quasar
Samsung
Navigator

235
Figure 14 shows the results of the survey of respondents' answers to the question of the characteristics of the devices that were preferred during the purchase.
Figure 14. Characteristics of respondents' preferred devices Source: Developed by authors. As can be seen from Figure 14, the segment of consumers that prefers 3G connectivity is currently distinguished. In the second place comes the game component.
Conclusions Similarly, the questionnaire survey of respondents' answers was processed to evaluate the relevant factors. The results are presented in Table 6. The best performance is Samsung Electronics Ukraine Company. In second place is Navigator. Table 6. Evaluation of relevant factors of enterprises
Enterprise What manufacturers
are known to the respondents
Advantage at the same
price
The level of prices for products of the
enterprise
Products are always on sale
Samsung Electronics Ukraine Company 55 44 high
57
"Navigator" 35 37 receptive 38 "Quasar" 10 19 receptive 5
Source: Authors’ elaboration. Thus, we combine the results in Table 7, which presents the hypotheses, individual and segment factors. Table 7. Confirmation of hypotheses and isolation of the consumer segment
Hypothesis (factor) Separation of consumer segment Most consumers use 6-7 hours a day; the existing device is not satisfactory in terms of functional characteristics; important in choosing is the price and processor; device purchased up to 1 year ago (Behavioral)
The length of the time corridor for using a computer device is 4-5 hours. Consumers who want to buy a new model of computer device. Consumers who need an up-to-date operating system and then the size of the built-in and RAM are important.
Most consumers are men aged 26-35, married, have two children, with an average monthly income of 2000-5000
Almost all respondents are Ukrainian, and on average half of the respondents are male and half are female. 26-35 years old and 16-25 year olds living in families with 3-4 people, with
20
18
31
19
41
8
29
26
27
16
47
11
23
24
30
18
38
10
0% 10% 20% 30% 40% 50% 60% 70% 80% 90% 100%
Screen diagonal;
The amount of internal memory;
Game component
Work time;
3G connection;
Quality of housing materials;
Quasar
Samsung
Navigator
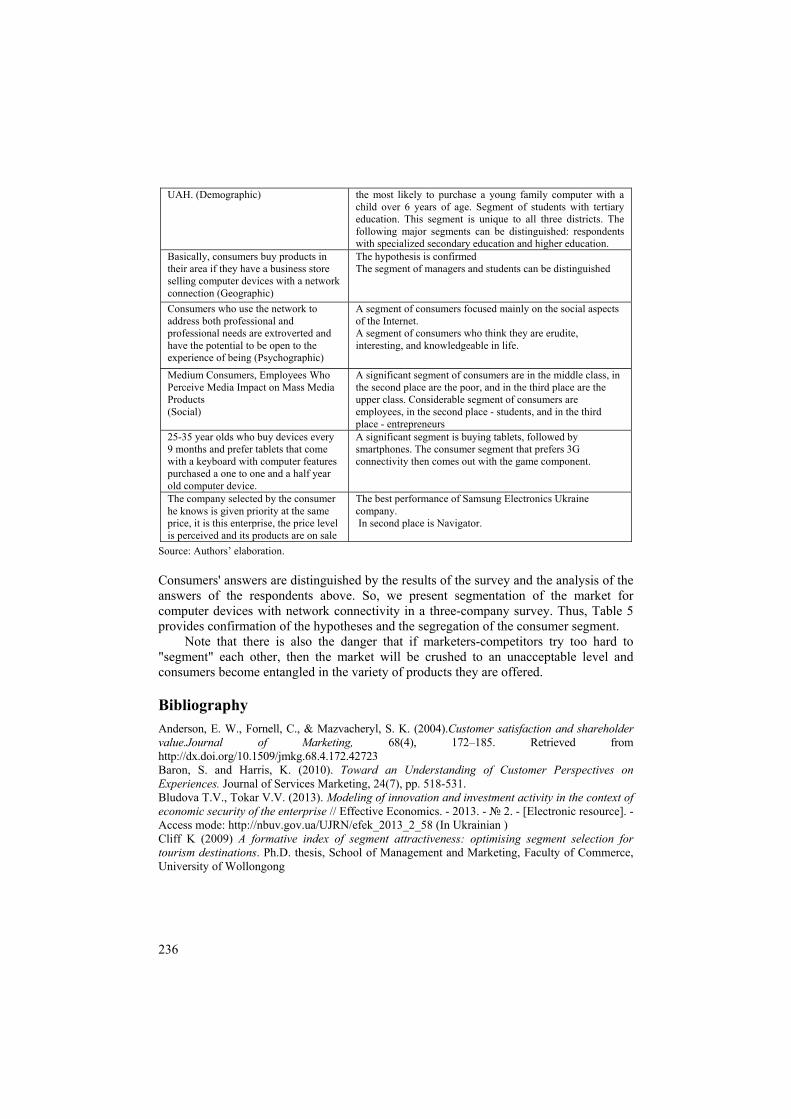
236
UAH. (Demographic) the most likely to purchase a young family computer with a child over 6 years of age. Segment of students with tertiary education. This segment is unique to all three districts. The following major segments can be distinguished: respondents with specialized secondary education and higher education.
Basically, consumers buy products in their area if they have a business store selling computer devices with a network connection (Geographic)
The hypothesis is confirmed The segment of managers and students can be distinguished
Consumers who use the network to address both professional and professional needs are extroverted and have the potential to be open to the experience of being (Psychographic)
A segment of consumers focused mainly on the social aspects of the Internet. A segment of consumers who think they are erudite, interesting, and knowledgeable in life.
Medium Consumers, Employees Who Perceive Media Impact on Mass Media Products (Social)
A significant segment of consumers are in the middle class, in the second place are the poor, and in the third place are the upper class. Considerable segment of consumers are employees, in the second place - students, and in the third place - entrepreneurs
25-35 year olds who buy devices every 9 months and prefer tablets that come with a keyboard with computer features purchased a one to one and a half year old computer device.
A significant segment is buying tablets, followed by smartphones. The consumer segment that prefers 3G connectivity then comes out with the game component.
The company selected by the consumer he knows is given priority at the same price, it is this enterprise, the price level is perceived and its products are on sale
The best performance of Samsung Electronics Ukraine company. In second place is Navigator.
Source: Authors’ elaboration. Consumers' answers are distinguished by the results of the survey and the analysis of the answers of the respondents above. So, we present segmentation of the market for computer devices with network connectivity in a three-company survey. Thus, Table 5 provides confirmation of the hypotheses and the segregation of the consumer segment.
Note that there is also the danger that if marketers-competitors try too hard to "segment" each other, then the market will be crushed to an unacceptable level and consumers become entangled in the variety of products they are offered.
Bibliography Anderson, E. W., Fornell, C., & Mazvacheryl, S. K. (2004).Customer satisfaction and shareholder value.Journal of Marketing, 68(4), 172–185. Retrieved from http://dx.doi.org/10.1509/jmkg.68.4.172.42723 Baron, S. and Harris, K. (2010). Toward an Understanding of Customer Perspectives on Experiences. Journal of Services Marketing, 24(7), pp. 518-531. Bludova T.V., Tokar V.V. (2013). Modeling of innovation and investment activity in the context of economic security of the enterprise // Effective Economics. - 2013. - № 2. - [Electronic resource]. - Access mode: http://nbuv.gov.ua/UJRN/efek_2013_2_58 (In Ukrainian ) Cliff K (2009) A formative index of segment attractiveness: optimising segment selection for tourism destinations. Ph.D. thesis, School of Management and Marketing, Faculty of Commerce, University of Wollongong

237
Dolnicar S, Leisch F (2010) Evaluation of structure and reproducibility of cluster solutions using the bootstrap. Mark Lett 21:83–101 Dolnicar S, Leisch F (2017) Using segment level stability to select target segments in data-driven market segmentation studies. Mark Lett 28(3):423–436 Kotler, P. and Keller, L.G. (2013). Marketing Management, Prague: Grada Publishing (in Czech). Kourdi, J. (2011). Marketing Century: How Marketing Drives Business and Shapes Society, Chichester: John Wiley & Sons. Kowalkowski, CH. (2011). Dynamics of Value Propositions: Insights from Service-Dominant Logic, European Journal of Marketing, Vol.45, No:1/2, pp. 277-294. Kumar, N. (2008). Marketing as Strategy Leading to Successs, Prague: Grada Publishing (in Czech). McDonald M, Dunbar I (2004). Market Segmentation: How to Do It, How to Profit from It.Elsevier ButterworthHeinemann. Oxford. T. Bludova (2005). Probability Theory: Educ. guide Lviv. NBU National Bank, 2005– 319 p. (In Ukrainian ) Wallenburg, C. M. and Lukassen, P. (2011). Proactive Improvement of Logistics Service Providers as Driver of Customer Loyalty, European Journal of Marketing, Vol. 45, No: 3, pp. 438-454. Wiedmann, K.P., Hennigs, N., Pankalla, L., Kassubek, M., Seegebarth, B. and Reeh, M.O. (2010). Online Distribution of Pharmaceuticals: Investigating Relations of Consumers’ Value Perception, Online Shopping Attitudes and Behaviour in a Epharmacy Context, Journal of Customer Behaviour, Vol. 9, No. 2, pp. 175-199. Wood SN (2006) Generalized additive models: an introduction with R. Chapman and Hall/CRC, Boca Raton. Information about authors:
Natalia Wasilewska - Doctor of Economics, professor UJK, Jan Kochanowski University in Kielce Faculty of Social Sciences, Department of Economics and Management, 114/118 Słowackiego St., 97-300 Piotrków Trybunalski, e-mail: [email protected], ORCID: 0000-0001-8638-4735 Tatiana Bludova – Doctor of Economics, professor, Kyiv National Economic University named after Vadym Hetman Marketing Faculty , Advanced Mathematics Department, 54/1 Prospect Peremogy, Kyiv city e-mail: [email protected], ORCID: 0000-0001-7011-5645 Volodymyr Tokar – Doctor of Economics, professor, Kyiv National Economic University named after Vadym Hetman Department of International Finance, e-mail: [email protected], ORCID: 0000-0002-1879-5855 Oleksiy Kudenko – Assistant of Marketing Faculty Kyiv National Economic University named after Vadym Hetman Advanced Marketing Department, e-mail: [email protected]

238
22 (71) 2019 DOI 10.22630/PEFIM.2019.22.71.39
Robert Wolny University of Economics in Katowice, Poland
THE DEVELOPMENT OF PROSUMPTION ON THE POLISH E-SERVICES MARKET
In the information age, the growth of prosumer behavior would not be possible without the
development of ICT technologies. The interactivity of contemporary media creates favourable conditions for the development of prosumption (a combination of “production” and “consumption.”) The article presents the problem of the behaviors of e-service consumers and demonstrates the results of a qualitative study which was conducted in 2018. For the purpose of the study, non-participant observation was adopted: conversations on internet forums dedicated to e-services were followed. Key words: prosumption, prosumer, e-services, ICT, non-participant observation JEL Codes: M31, L86
Introduction Technological development, in particular, the revolution in information technology (IT), has changed the way society and the economy function, and has impacted the functioning of the service market. One symptom of the new economic reality and of virtualization is the emergence of the e-service market. The changes in consumer interest in e-services are the result of changes in consumer attitudes to Internet networks and various ICT technologies. In recent years, the Internet, various mobile devices and online applications have significantly impacted the behaviour of market entities. The service sector has seen dynamic development of ICT, and the level of modernization in ICT determines the level of modernity for the whole economy.
The popularization of ICT technologies (mainly in the service sector) has significantly influenced consumer behaviour, bringing changes not only to the place of purchase but also to the subject and frequency of purchase, information gathered and many other issues. The shift of consumer behaviour to e-behaviour1 is also a step towards prosumption.
The aim of the article is to identify and exemplify prosumer behaviour for consumers on the e-service market and also to present a new product solution for this market.
Development of prosumption Although the term prosumption is a coinage of the words production and consumption, its etymology has not been clearly defined. The phenomenon of prosumption is described as a mixture of consumption and production processes until the distinctions between them become less clear2. According to Guido and Peluso3, Alvin Toffler, who introduced the
1 M. Jaciow, R. Wolny: Polski e-konsument. Typologia, zachowania, OnePress, Gliwice 2011, p. 10. 2 B. Jung B: Kapitalizm postmodernistyczny. „Ekonomista” 1997, nr 5–6, p. 720.

239
term in his book “The Third Wave” in 1980, is known as the precursor of prosumption. Prosumption might be the effect of the following tendency: consumption is involved in the production process – the producer becomes a consumer, so production is involved in consumption – the consumer becomes a producer. Prosumption might also be described as a desire to possess products which are in accordance with consumer conceptions. Thanks to individual choices and activities, consumers become co-producers of a given product4. Toffler5 describes situations which indicate that consumers are taking over some functions which were previously attributed to producers; for instance: • Consumers are focused on: purchasing new products and exchanging broken/
damaged items for new ones; using the scope of available services in order to perform all the activities pertaining to restoration, servicing and storage of the purchased products on their own; performing (on their own) a greater number of services which had been previously performed outside the household;
• Consumers consciously become involved in the process of design and preparation of goods and services, which makes them become creative consumers. The determinants of the development of prosumption might be divided into two
categories. The first distinguishes so-called general determinants (biological, economic, social, cultural and technological factors) which are connected with consumption as it is more broadly understood. These determinants also influence prosumption (a particular example of consumption). The second category distinguishes the factors which are specific to prosumption6, which are: • The increase of free time and the need to fulfil it in an attractive way; • The possibility of working from home and combining it with consumption
activities; • The development of education; • Changes in the work culture and redefining the role of labour in human life: the
evolution of labour towards creativity. Other factors which are involved in the development of prosumption include:
economic and social trends, technological development, knowledge and research development, and the activities of companies (Figure 1).
For Toffler, the main source of prosumption was a developing self-help movement (emergence of organizations and consumer societies whose main aim was providing help by exchanging experiences, observations and advice) and the involvement of consumers in dealing with issues which were previously performed by companies, e.g. through the growth of self-service activities in the process of customer service or involving consumers in the process of product design7. It must be stressed that ICT development contributes to the development of prosumption and an increase in the number of
3 G. Guido, A. M. Peluso: Preconditions for the diffusion of prosumption among firms: a case study approach. „Problems and Perspectives in Management” 2008, Vol. 6, Issue 4, p. 65. 4 D. Gach: Pozyskiwanie i wykorzystywanie wiedzy klientów. „E-Mentor” 2008, nr 23, p. 57. 5 A. Toffler: Trzecia fala. PIW, Warszawa 1997, p. 79. 6 Cz. Bywalec, L. Rudnicki: Konsumpcja, PWE, Warszawa 2002, p. 145. 7 Toffler A., 1997. Trzecia fala. PIW Warszawa, p 420.

240
prosumers. It is even believed that each Internet user is a prosumer, although not every prosumer is a user of the network8.
Figure 1. Factors which allow the development of prosumption Source: Author’s study based on: S. V. Troye, Ch. Xie: The active consumer: Conceptual, methodological, and managerial challenges of prosumption. Norwegian School of Economics and Business Administration, 2007, p. 16.
A prosumer might also be called a person who describes or comments on products (brands) on internet websites, while sharing at the same time his/her knowledge and remarks not only with other consumers, but producers as well9. There are a vast number of places on the Internet in which prosumer behaviour can be observed (these are places where prosumers are able to put their comments or opinions about products and/or exchange their opinions with other prosumers). Such places include: vertical portals (vortals), corporate portals, social networking websites, blogs and internet forums10. Social networking websites and internet forums are places which are most popular among prosumers.
Prosumers’ level of involvement in the information transfer varies. Some prosumers merely express their opinion about the product (they recommend it or not to others). However, there are some active prosumers who try to participate in designing or improving the service offer. Figure 2 presents the stages of development of prosumer behaviours on the e-service market. 8 I. A. Baruk, A. Iwanicka: Prosumpcja internetowa vs. Prosumpcja pozainternetowa. Prace Naukowe Uniwersytetu Ekonomicznego we Wrocławiu 2016, nr 459, p. 184. 9 K. Domańska: Kim jest prosument. „Marketing w praktyce” 2009, nr 29, p. 37. 10 M. Bartosik-Purgat: Social networking sites as a channel for delivering information about durable products and its impact on purchasing decisions. “Acta Scientiarum Polonorum Oeconomia” 2018, nr 17 (1), p. 8; R. Wolny: Prosumpcja i prosument na rynku e-usług. „Konsumpcja i Rozwój” 2013, nr 1(4), p. 156.
consumers – prosumers and value creators
- focusing on prosumption processes
- focusing on non-material values of the products in consumer
consciousness
economic and social trends- increase of free time- increase of labor cost
- need for personalisation of the offer
technological development
- Internet development- ICT technology
development
company activiteis
- oustsourcig of some activities from consumers
- the implementaion of consumer knowledge in the
process of product development research method
development
- qualitative techniques- eye tracking
knowledge development- creativity
- pursuing goals- postmodernism
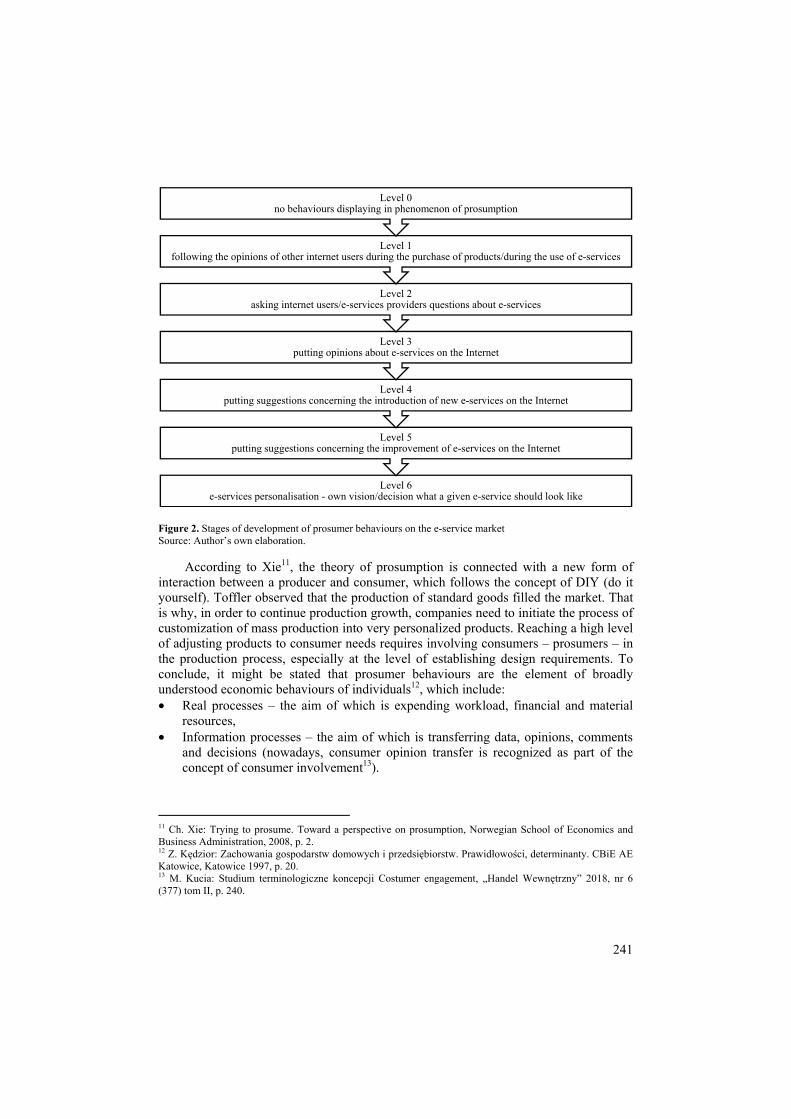
241
Figure 2. Stages of development of prosumer behaviours on the e-service market Source: Author’s own elaboration.
According to Xie11, the theory of prosumption is connected with a new form of interaction between a producer and consumer, which follows the concept of DIY (do it yourself). Toffler observed that the production of standard goods filled the market. That is why, in order to continue production growth, companies need to initiate the process of customization of mass production into very personalized products. Reaching a high level of adjusting products to consumer needs requires involving consumers – prosumers – in the production process, especially at the level of establishing design requirements. To conclude, it might be stated that prosumer behaviours are the element of broadly understood economic behaviours of individuals12, which include: • Real processes – the aim of which is expending workload, financial and material
resources, • Information processes – the aim of which is transferring data, opinions, comments
and decisions (nowadays, consumer opinion transfer is recognized as part of the concept of consumer involvement13).
11 Ch. Xie: Trying to prosume. Toward a perspective on prosumption, Norwegian School of Economics and Business Administration, 2008, p. 2. 12 Z. Kędzior: Zachowania gospodarstw domowych i przedsiębiorstw. Prawidłowości, determinanty. CBiE AE Katowice, Katowice 1997, p. 20. 13 M. Kucia: Studium terminologiczne koncepcji Costumer engagement, „Handel Wewnętrzny” 2018, nr 6 (377) tom II, p. 240.
Level 6e-services personalisation - own vision/decision what a given e-service should look like
Level 5putting suggestions concerning the improvement of e-services on the Internet
Level 4putting suggestions concerning the introduction of new e-services on the Internet
Level 3putting opinions about e-services on the Internet
Level 2asking internet users/e-services providers questions about e-services
Level 1 following the opinions of other internet users during the purchase of products/during the use of e-services
Level 0no behaviours displaying in phenomenon of prosumption
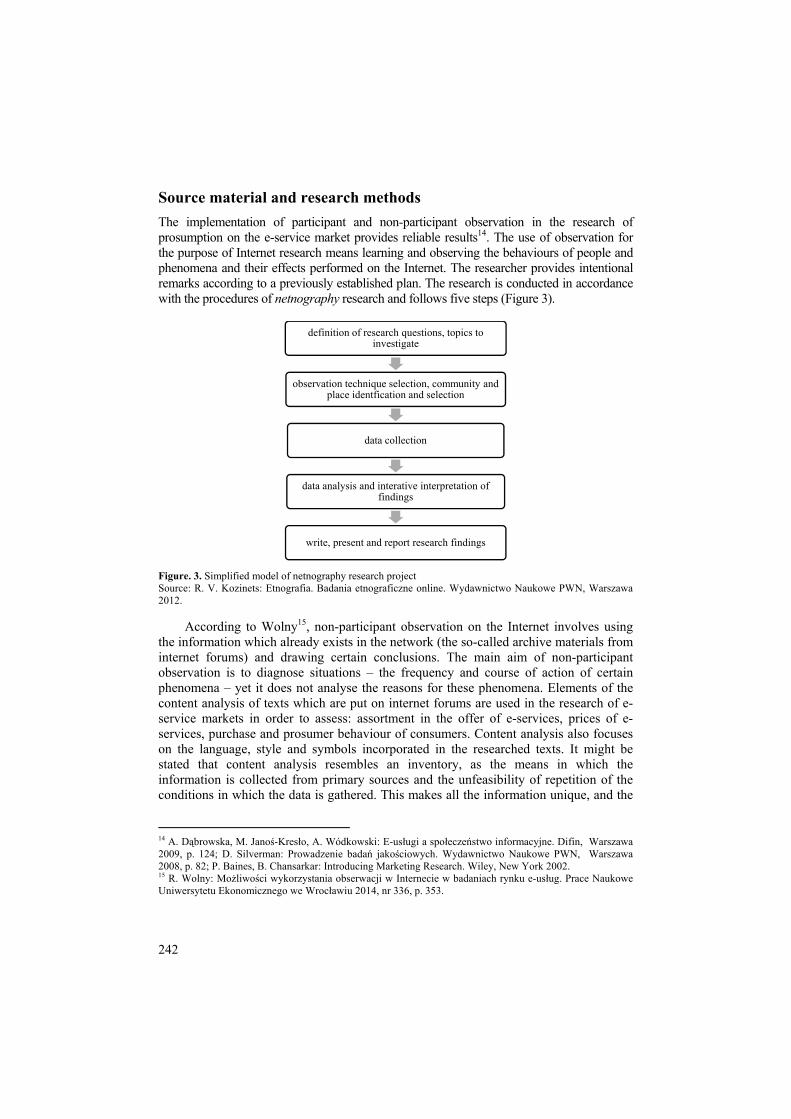
242
Source material and research methods The implementation of participant and non-participant observation in the research of prosumption on the e-service market provides reliable results14. The use of observation for the purpose of Internet research means learning and observing the behaviours of people and phenomena and their effects performed on the Internet. The researcher provides intentional remarks according to a previously established plan. The research is conducted in accordance with the procedures of netnography research and follows five steps (Figure 3).
Figure. 3. Simplified model of netnography research project Source: R. V. Kozinets: Etnografia. Badania etnograficzne online. Wydawnictwo Naukowe PWN, Warszawa 2012.
According to Wolny15, non-participant observation on the Internet involves using
the information which already exists in the network (the so-called archive materials from internet forums) and drawing certain conclusions. The main aim of non-participant observation is to diagnose situations – the frequency and course of action of certain phenomena – yet it does not analyse the reasons for these phenomena. Elements of the content analysis of texts which are put on internet forums are used in the research of e-service markets in order to assess: assortment in the offer of e-services, prices of e-services, purchase and prosumer behaviour of consumers. Content analysis also focuses on the language, style and symbols incorporated in the researched texts. It might be stated that content analysis resembles an inventory, as the means in which the information is collected from primary sources and the unfeasibility of repetition of the conditions in which the data is gathered. This makes all the information unique, and the
14 A. Dąbrowska, M. Janoś-Kresło, A. Wódkowski: E-usługi a społeczeństwo informacyjne. Difin, Warszawa 2009, p. 124; D. Silverman: Prowadzenie badań jakościowych. Wydawnictwo Naukowe PWN, Warszawa 2008, p. 82; P. Baines, B. Chansarkar: Introducing Marketing Research. Wiley, New York 2002. 15 R. Wolny: Możliwości wykorzystania obserwacji w Internecie w badaniach rynku e-usług. Prace Naukowe Uniwersytetu Ekonomicznego we Wrocławiu 2014, nr 336, p. 353.
definition of research questions, topics to investigate
observation technique selection, community and place identfication and selection
data collection
data analysis and interative interpretation of findings
write, present and report research findings

243
informative value of such data is significant. Finally, as far as the research of the market of e-services is concerned, there is no alternative way, so far, of data collection.
The article demonstrates the results of the primary research of 146 internet forums dedicated to the market of e-services. For the purpose of the research, non-participant observation was implemented. The observation covered the period from January 2017 to June 2018. The qualitative data obtained during the research was compiled in 2018. The total number of internet users of the researched forums was 51 154 (46.6% men and 36.1 % women). It was not possible to identify the sex of 17% of the participants – neither upon the users’ nickname, nor the user’s style. The most significant number of participants (17 333) expressed their comments on forums dedicated to e-banking, whereas the lowest number of participants (4208) expressed their comments on forums dedicated to e-administration. The total number of posts which were put online during the period of 18 months was 54 473. The largest number is represented by posts on e-banking internet forums (19 132); the lowest on e-administration forums (4872). Table 1 presents basic characteristics of the researched forums. Table 1. Basic characteristics of the researched forums
Source: Author’s own research.
Results and discussion The implementation of non-participant observation resulted in the identification of consumer behaviour at levels 3,4 and 5 (see Figure 2). The results clearly show that internet users demonstrate willingness to share both positive and negative opinions about given phenomena. Positive opinions were mostly expressed by e-consumers on the internet forums dedicated to e-education, e-culture and e-administration, whereas e-banking and e-insurance forums were dominated by negative opinions (Table 2). Table 2. Opinions about e-services on internet forums (in %)
Source: Author’s own research.
Type Number of internet forums
Participants of internet forums Number of
posts Total in this
women men Sex unidentified
e-banking 30 17333 4952 8985 3396 19132 e-culture 30 13455 6952 5128 1375 15225 e-education 30 9206 5268 1968 1970 9886 e-insurance 28 4952 1374 2852 726 5358 e-administration 28 4208 1255 2068 885 4872
total 146 51154 18477 23825 8852 54473
Type of e-service Opinions negative neutral positive
e-banking 57,8 6,7 35,6 e-culture 33,7 1,7 64,6 e-education 18,9 9,5 71,6 e-insurance 57,3 7,5 35,2 e-administration 36,8 3,9 59,2
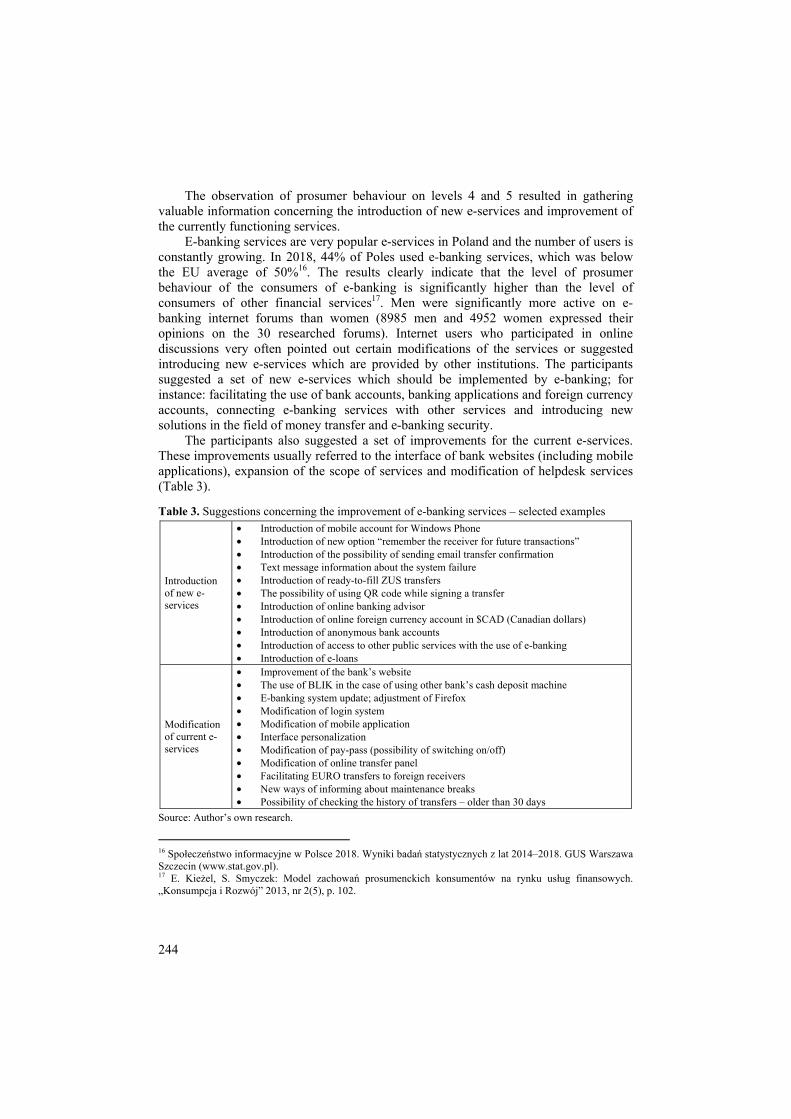
244
The observation of prosumer behaviour on levels 4 and 5 resulted in gathering valuable information concerning the introduction of new e-services and improvement of the currently functioning services.
E-banking services are very popular e-services in Poland and the number of users is constantly growing. In 2018, 44% of Poles used e-banking services, which was below the EU average of 50%16. The results clearly indicate that the level of prosumer behaviour of the consumers of e-banking is significantly higher than the level of consumers of other financial services17. Men were significantly more active on e-banking internet forums than women (8985 men and 4952 women expressed their opinions on the 30 researched forums). Internet users who participated in online discussions very often pointed out certain modifications of the services or suggested introducing new e-services which are provided by other institutions. The participants suggested a set of new e-services which should be implemented by e-banking; for instance: facilitating the use of bank accounts, banking applications and foreign currency accounts, connecting e-banking services with other services and introducing new solutions in the field of money transfer and e-banking security.
The participants also suggested a set of improvements for the current e-services. These improvements usually referred to the interface of bank websites (including mobile applications), expansion of the scope of services and modification of helpdesk services (Table 3). Table 3. Suggestions concerning the improvement of e-banking services – selected examples
Introduction of new e-services
• Introduction of mobile account for Windows Phone • Introduction of new option “remember the receiver for future transactions” • Introduction of the possibility of sending email transfer confirmation • Text message information about the system failure • Introduction of ready-to-fill ZUS transfers • The possibility of using QR code while signing a transfer • Introduction of online banking advisor • Introduction of online foreign currency account in $CAD (Canadian dollars) • Introduction of anonymous bank accounts • Introduction of access to other public services with the use of e-banking • Introduction of e-loans
Modification of current e-services
• Improvement of the bank’s website • The use of BLIK in the case of using other bank’s cash deposit machine • E-banking system update; adjustment of Firefox • Modification of login system • Modification of mobile application • Interface personalization • Modification of pay-pass (possibility of switching on/off) • Modification of online transfer panel • Facilitating EURO transfers to foreign receivers • New ways of informing about maintenance breaks • Possibility of checking the history of transfers – older than 30 days
Source: Author’s own research.
16 Społeczeństwo informacyjne w Polsce 2018. Wyniki badań statystycznych z lat 2014–2018. GUS Warszawa Szczecin (www.stat.gov.pl). 17 E. Kieżel, S. Smyczek: Model zachowań prosumenckich konsumentów na rynku usług finansowych. „Konsumpcja i Rozwój” 2013, nr 2(5), p. 102.
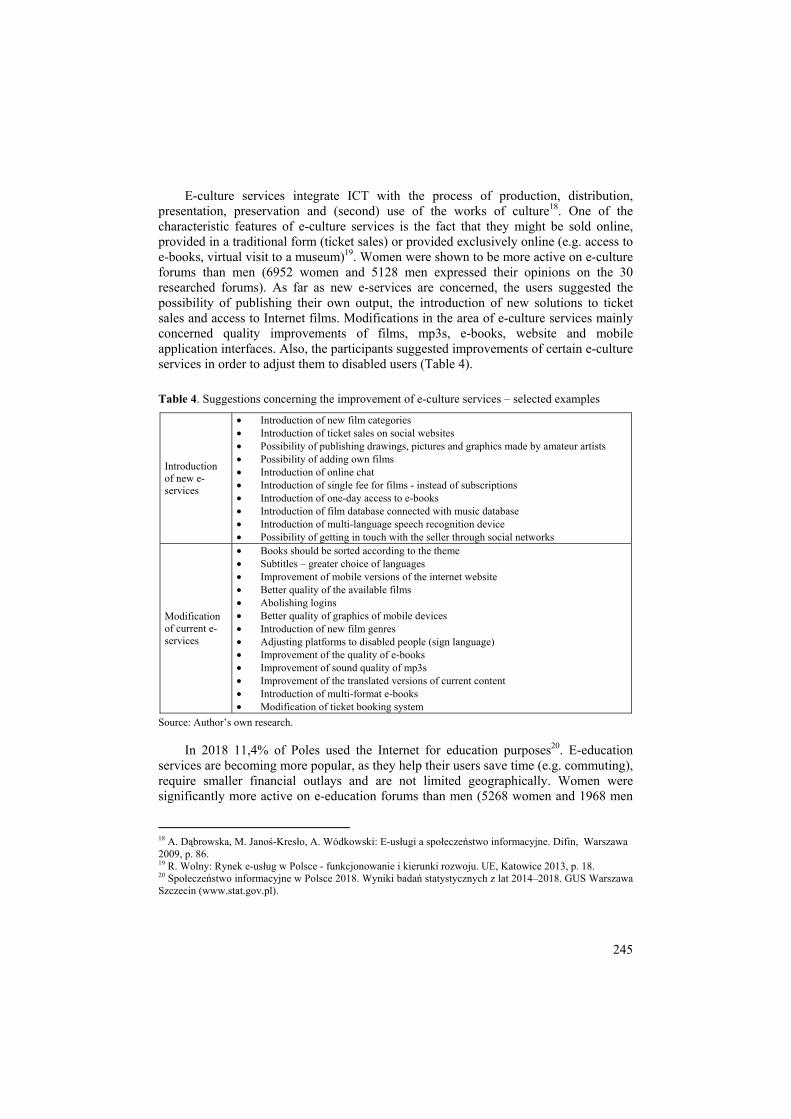
245
E-culture services integrate ICT with the process of production, distribution, presentation, preservation and (second) use of the works of culture18. One of the characteristic features of e-culture services is the fact that they might be sold online, provided in a traditional form (ticket sales) or provided exclusively online (e.g. access to e-books, virtual visit to a museum)19. Women were shown to be more active on e-culture forums than men (6952 women and 5128 men expressed their opinions on the 30 researched forums). As far as new e-services are concerned, the users suggested the possibility of publishing their own output, the introduction of new solutions to ticket sales and access to Internet films. Modifications in the area of e-culture services mainly concerned quality improvements of films, mp3s, e-books, website and mobile application interfaces. Also, the participants suggested improvements of certain e-culture services in order to adjust them to disabled users (Table 4).
Table 4. Suggestions concerning the improvement of e-culture services – selected examples
Introduction of new e-services
• Introduction of new film categories • Introduction of ticket sales on social websites • Possibility of publishing drawings, pictures and graphics made by amateur artists • Possibility of adding own films • Introduction of online chat • Introduction of single fee for films - instead of subscriptions • Introduction of one-day access to e-books • Introduction of film database connected with music database • Introduction of multi-language speech recognition device • Possibility of getting in touch with the seller through social networks
Modification of current e-services
• Books should be sorted according to the theme • Subtitles – greater choice of languages • Improvement of mobile versions of the internet website • Better quality of the available films • Abolishing logins • Better quality of graphics of mobile devices • Introduction of new film genres • Adjusting platforms to disabled people (sign language) • Improvement of the quality of e-books • Improvement of sound quality of mp3s • Improvement of the translated versions of current content • Introduction of multi-format e-books • Modification of ticket booking system
Source: Author’s own research.
In 2018 11,4% of Poles used the Internet for education purposes20. E-education services are becoming more popular, as they help their users save time (e.g. commuting), require smaller financial outlays and are not limited geographically. Women were significantly more active on e-education forums than men (5268 women and 1968 men
18 A. Dąbrowska, M. Janoś-Kresło, A. Wódkowski: E-usługi a społeczeństwo informacyjne. Difin, Warszawa 2009, p. 86. 19 R. Wolny: Rynek e-usług w Polsce - funkcjonowanie i kierunki rozwoju. UE, Katowice 2013, p. 18. 20 Społeczeństwo informacyjne w Polsce 2018. Wyniki badań statystycznych z lat 2014–2018. GUS Warszawa Szczecin (www.stat.gov.pl).
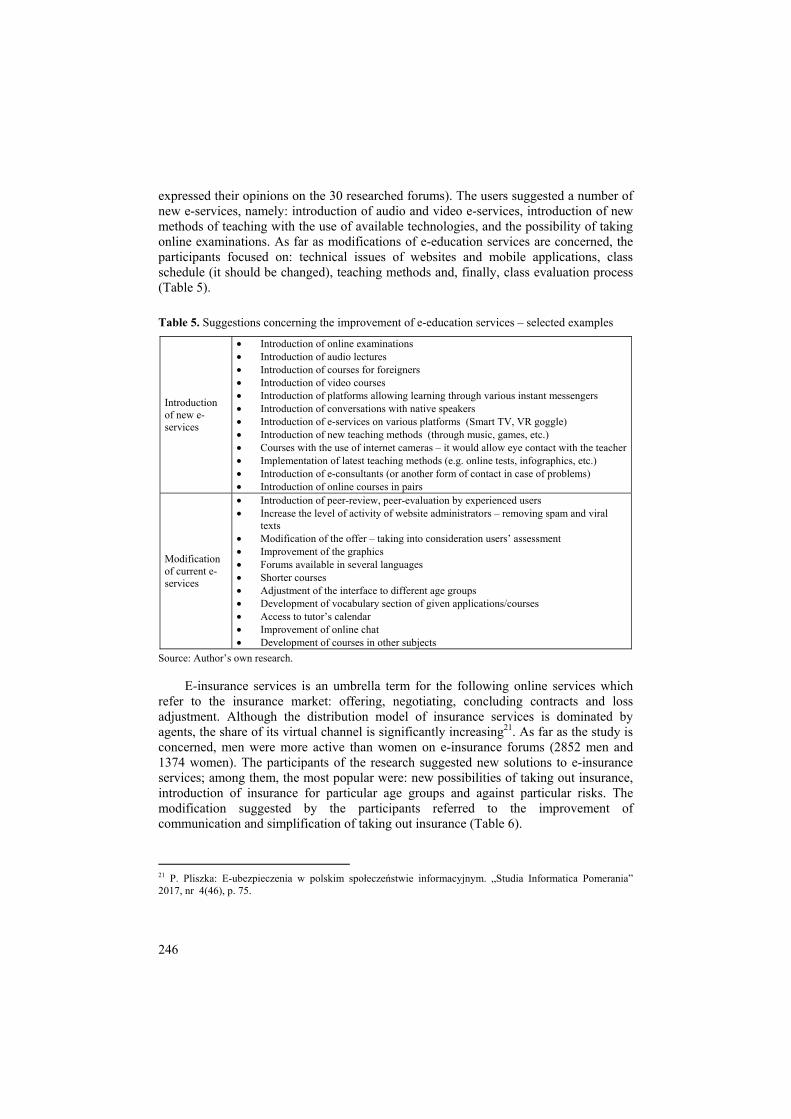
246
expressed their opinions on the 30 researched forums). The users suggested a number of new e-services, namely: introduction of audio and video e-services, introduction of new methods of teaching with the use of available technologies, and the possibility of taking online examinations. As far as modifications of e-education services are concerned, the participants focused on: technical issues of websites and mobile applications, class schedule (it should be changed), teaching methods and, finally, class evaluation process (Table 5).
Table 5. Suggestions concerning the improvement of e-education services – selected examples
Introduction of new e-services
• Introduction of online examinations • Introduction of audio lectures • Introduction of courses for foreigners • Introduction of video courses • Introduction of platforms allowing learning through various instant messengers • Introduction of conversations with native speakers • Introduction of e-services on various platforms (Smart TV, VR goggle) • Introduction of new teaching methods (through music, games, etc.) • Courses with the use of internet cameras – it would allow eye contact with the teacher • Implementation of latest teaching methods (e.g. online tests, infographics, etc.) • Introduction of e-consultants (or another form of contact in case of problems) • Introduction of online courses in pairs
Modification of current e-services
• Introduction of peer-review, peer-evaluation by experienced users • Increase the level of activity of website administrators – removing spam and viral
texts • Modification of the offer – taking into consideration users’ assessment • Improvement of the graphics • Forums available in several languages • Shorter courses • Adjustment of the interface to different age groups • Development of vocabulary section of given applications/courses • Access to tutor’s calendar • Improvement of online chat • Development of courses in other subjects
Source: Author’s own research.
E-insurance services is an umbrella term for the following online services which refer to the insurance market: offering, negotiating, concluding contracts and loss adjustment. Although the distribution model of insurance services is dominated by agents, the share of its virtual channel is significantly increasing21. As far as the study is concerned, men were more active than women on e-insurance forums (2852 men and 1374 women). The participants of the research suggested new solutions to e-insurance services; among them, the most popular were: new possibilities of taking out insurance, introduction of insurance for particular age groups and against particular risks. The modification suggested by the participants referred to the improvement of communication and simplification of taking out insurance (Table 6).
21 P. Pliszka: E-ubezpieczenia w polskim społeczeństwie informacyjnym. „Studia Informatica Pomerania” 2017, nr 4(46), p. 75.
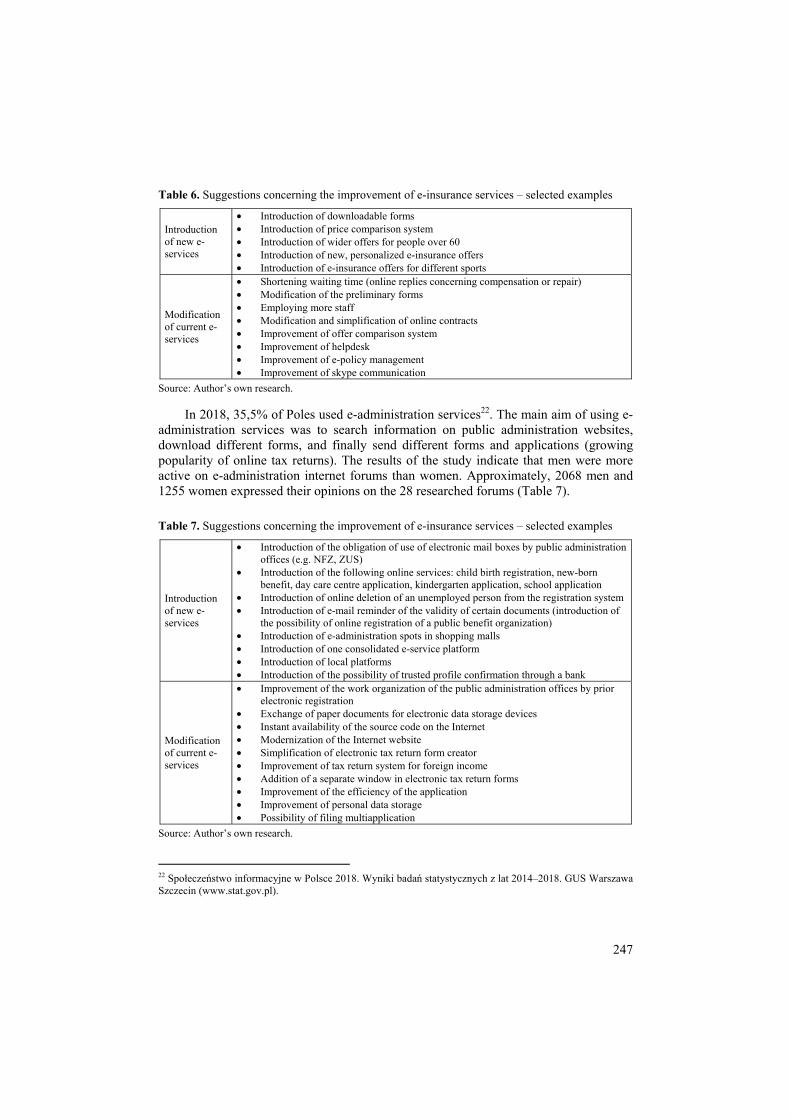
247
Table 6. Suggestions concerning the improvement of e-insurance services – selected examples
Introduction of new e-services
• Introduction of downloadable forms • Introduction of price comparison system • Introduction of wider offers for people over 60 • Introduction of new, personalized e-insurance offers • Introduction of e-insurance offers for different sports
Modification of current e-services
• Shortening waiting time (online replies concerning compensation or repair) • Modification of the preliminary forms • Employing more staff • Modification and simplification of online contracts • Improvement of offer comparison system • Improvement of helpdesk • Improvement of e-policy management • Improvement of skype communication
Source: Author’s own research.
In 2018, 35,5% of Poles used e-administration services22. The main aim of using e-administration services was to search information on public administration websites, download different forms, and finally send different forms and applications (growing popularity of online tax returns). The results of the study indicate that men were more active on e-administration internet forums than women. Approximately, 2068 men and 1255 women expressed their opinions on the 28 researched forums (Table 7).
Table 7. Suggestions concerning the improvement of e-insurance services – selected examples
Introduction of new e-services
• Introduction of the obligation of use of electronic mail boxes by public administration offices (e.g. NFZ, ZUS)
• Introduction of the following online services: child birth registration, new-born benefit, day care centre application, kindergarten application, school application
• Introduction of online deletion of an unemployed person from the registration system • Introduction of e-mail reminder of the validity of certain documents (introduction of
the possibility of online registration of a public benefit organization) • Introduction of e-administration spots in shopping malls • Introduction of one consolidated e-service platform • Introduction of local platforms • Introduction of the possibility of trusted profile confirmation through a bank
Modification of current e-services
• Improvement of the work organization of the public administration offices by prior electronic registration
• Exchange of paper documents for electronic data storage devices • Instant availability of the source code on the Internet • Modernization of the Internet website • Simplification of electronic tax return form creator • Improvement of tax return system for foreign income • Addition of a separate window in electronic tax return forms • Improvement of the efficiency of the application • Improvement of personal data storage • Possibility of filing multiapplication
Source: Author’s own research.
22 Społeczeństwo informacyjne w Polsce 2018. Wyniki badań statystycznych z lat 2014–2018. GUS Warszawa Szczecin (www.stat.gov.pl).

248
The participants suggested the introduction of new e-services for people with children, new possibilities of self-service and the possibility of consolidation of e-services. The suggestions concerning the modification of e-services included: technical issues of the public administration websites, form filing procedures and improvement of security.
Conclusions The virtualization of services might contribute to the development of the e-service market in two ways: first, the introduction of e-services attracts new consumers; second, the e-service environment creates favourable conditions for the development of prosumption. The prosumption of e-services allows further development and improvement of the services, which might also result in attracting new consumers. A prosumer is more than just a consumer. It is a person who possesses broad knowledge of e-services and demonstrates this knowledge to others, especially in decision-making processes. Prosumers want to participate in creating the offer of products and services. Technological progress and the development of ICT technologies have significantly influenced the development of prosumption and online prosumption. It might be expected that in future the phenomenon of e-service co-creation and active participation in designing individualized e-services will grow. Such phenomenon might be perceived as the highest form of prosumption.
The presented research results indicate that consumers on the e-services market are active prosumers. Consumers engage in internet forums dedicated to the market of e-services. Prosumer behaviors identified in the research process are associated with putting opinions about e-services (level 3) and putting suggestions concerning the improvement of e-services or in the introduction of new e-services on the Internet (levels 4 and 5).
Undoubtedly, new e-services which were suggested by internet users are not revolutionary; however, the implementation of selected solutions might be appreciated by the users and will broaden the scope of e-services. As far as participation in different forms of prosumer behaviours is concerned, it might be concluded that prosumption is developing; thus, one might expect significant growth of the phenomenon in future.
Bibliography Baines P., Chansarkar B.: Introducing Marketing Research, Wiley, New York 2002 Bartosik-Purgat M.: Social networking sites as a channel for delivering information about durable products and its impact on purchasing decisions, Acta Scientiarum Polonorum Oeconomia, 17(1)/2018 Baruk I. A., Iwanicka A.: Prosumpcja internetowa vs. Prosumpcja pozainternetowa, Prace Naukowe Uniwersytetu Ekonomicznego we Wrocławiu, 459/2016 Bywalec Cz., Rudnicki L.: Konsumpcja, PWE, Warszawa 2002 Dąbrowska A., Janoś-Kresło M., Wódkowski A.: E-usługi a społeczeństwo informacyjne, Difin Warszawa 2009 Domańska K.: Kim jest prosument, Marketing w praktyce, 29/2009 Gach D.: Pozyskiwanie i wykorzystywanie wiedzy klientów, E-Mentor, 23/2008 Guido G., Peluso A. M.: Preconditions for the diffusion of prosumption among firms: a case study approach, Problems and Perspectives in Management. Vol. 6, Issue 4/2008

249
Jaciow M., Wolny R.: Polski e-konsument. Typologia, zachowania, OnePress, Gliwice 2011 Jung B.: Kapitalizm postmodernistyczny, Ekonomista, 5–6/1997 Kędzior Z.: Zachowania gospodarstw domowych i przedsiębiorstw. Prawidłowości, determinanty, CBiE AE Katowice, Katowice 1997 Kieżel E, Smyczek S.: Model zachowań prosumenckich konsumentów na rynku usług finansowych, Konsumpcja i Rozwój, 2(5)/2013 Kozinets R. V.: Etnografia. Badania etnograficzne online, Wydawnictwo Naukowe PWN Warszawa 2012 Kucia M.: Studium terminologiczne koncepcji Costumer engagement, Handel Wewnętrzny, 6 (377)/2018 Pliszka P.: E-ubezpieczenia w polskim społeczeństwie informacyjnym, Studia Informatica Pomerania, 4(46)/2017 Silverman D.: Prowadzenie badań jakościowych, Wydawnictwo Naukowe PWN, Warszawa 2008 Społeczeństwo informacyjne w Polsce 2018. Wyniki badań statystycznych z lat 2014–2018, GUS Warszawa Szczecin (www.stat.gov.pl). Toffler A.: Trzecia fala, PIW, Warszawa 1997 Troye S. V., Xie Ch.,: The active consumer: Conceptual, methodological, and managerial challenges of prosumption, Norwegian School of Economics and Business Administration, 2007 Wolny R.: Możliwości wykorzystania obserwacji w Internecie w badaniach rynku e-usług, Prace Naukowe Uniwersytetu Ekonomicznego we Wrocławiu, 336/2014 Wolny R.: Prosumpcja i prosument na rynku e-usług, Konsumpcja i Rozwój, 1(4)/2013 Wolny R., Rynek e-usług w Polsce - funkcjonowanie i kierunki rozwoju, UE, Katowice 2013 Xie Ch.: Trying to prosume. Toward a perspective on prosumption, Norwegian School of Economics and Business Administration, 2008
Rozwój prosumpcji na rynku E-usług w Polsce
Streszczenie W dobie społeczeństwa informacyjnego wzrost zachowań prosumenckich nie byłby możliwy bez rozwoju technologii ICT. Interaktywność współczesnych mediów sprzyja rozwojowi zjawiska prosumpcji. Artykuł przedstawia zagadnienia związane z postępowaniem nabywców e-usług i prezentuje wyniki badań jakościowych. Badania przeprowadzono techniką obserwacji nieuczestniczącej w 2018 roku śledząc uczestników dyskusji na branżowych forach internetowych poświęconych e-usługom. Artykuł ma charakter badawczy. Słowa kluczowe: prosumpcja, prosument, e-usługi, ICT, obserwacja nieuczestnicząca. Jel Code: M31, L86 Information about author:
dr hab. Robert Wolny, prof. UE University of Economics in Katowice Faculty of Economics Department of Markets and Consumption 40-287 Katowice ul. 1 Maja 50 e-mail: [email protected] ORCID: 0000-0003-4088-718X

250
22 (71) 2019 DOI 10.22630/PEFIM.2019.22.71.40
Joanna Wyrobek Cracow University of Economics
Paul Lane Grand Valley State University
IMPACT OF INTERNATIONALIZATION ON THE
CAPITAL STRUCTURE OF COMMERCIAL COMPANIES
International enterprises (in this paper, international companies are understood as companies that sell their products and services abroad) are precious for the national economy because, through their experience in international sales, they stimulate the development of other companies in the same industry and their subcontractors. The knowledge that these companies have gained on international markets through the spillover effect spreads on their suppliers, as well as through imitation or cooperation on their competitors. Also, international companies (in the meaning: domestic export companies) are often the first to use new technological solutions and product innovations, which contributes to the modernization of products in the entire business sector. Dynamic and robust international companies usually also build networks with entities from different countries in order to cooperate on development, negotiation, and sales, which also encourages similar activities of their competitors. For all these reasons, national governments should take action to help to export companies, or at least monitor the problems that such entities report. The purpose of the publication is to draw attention to the higher demand for the debt that exists in such enterprises and to discuss the reasons for this. In particular, the purpose of the publication was to verify 2 research hypotheses: H1: Internationalization increases indebtedness of a company measured with the debt to equity ratio, and H2: The scale of internationalization (measured with the share of foreign sales to total sales) is positively related to the level of indebtedness (measured with the debt to equity ratio). For both hypotheses we found no grounds to reject these hypotheses. In the opinion of the authors, the demand for debt from exporters should be monitored, especially in terms of the availability of this form of financing for exporters from the SME sector. The paper used the Arellano-Bond model and data downloaded from the Orbis database for years 2007 – 2017.
Keywords: multinational companies, indebtedness, corporate finance, capital structure JEL Codes: G32, C33, B17
Introduction The purpose of the paper is to empirically verify the relationship between internationalization and the debt to equity ratio in commercial, non-financial companies. The literature review suggests that the direction of this relationship is not known, as there are as many publications that show that internationalization increases indebtedness ratios as there are publications that support the opposite opinion (that internationalization decreases debt levels in the capital structure). The paper attempts to empirically verify the direction of this relationship using large, representative samples of companies from four countries: Bosnia and Hercegovina, Ireland, France, and the United Kingdom.

251
Theoretical background Research on the impact of internationalization on the company's capital structure seems to begin from the so-called classical models of capital structure, in particular from the Modligiani-Miller model1 (the version which excludes taxes and bankruptcy costs), which was later augmented by Senbet2 into a model which proved that in the absence of taxes and bankruptcy costs, capital structure does not affect the value of the international enterprises (that is, companies that operate in foreign markets).
Similar conclusions were drawn by Stiglitz3 who, however, pointed out that in imperfect markets there are at least three factors that create the relationship between the market value of a company and the capital structure: different interest rates on deposits and loans, changes in credit risk as the level of debt increases and the fact that bonds of different companies are not the same from the risk perspective.
The list of imperfections was extended by the work of Errunza and Senbet4, who added to it the following factors: the competition of a foreign company with domestic companies, which by definition contradicts the assumptions of a perfect market and the existence of entry barriers to foreign markets. In the opinion of researchers, these market imperfections must affect the capital structure of enterprises that enter foreign markets.
Another essential market imperfection is income taxes, which, according to the Black model5, not only affect the capital structure because of their existence but also because their effective rate is different in different countries. Black showed that the CAPM model does not work in such a world, and this disables a proper arbitrage between markets; international companies take advantage of that and operate at the lower average cost of capital than domestic companies. The same conclusions were drawn by Lee and Zechner6, who showed that in countries with high taxes the companies use more debt than in countries with low taxes. According to Shaked7, in the world of taxes, uncertainty of economic conditions and bankruptcy costs, international companies observe lower volatility of profits. This translates into lower costs of potential bankruptcy, which allows them to use higher debt ratios.
Another argument for the importance of internationalization in determining the capital structure and for the higher indebtedness of international companies was set forth
1 F. Modigliani, M. Miller: The Cost of Capital, Corporation Finance and the Theory of Investment American ‘, Economic Review 48/1958, pp. 261-297. 2 L.W. Senbet: International Capital Market Equilibrium and Multinational Firm Financing and Invest Policies, Journal of Financial and Quantitative Analysis 14/1979, pp.455-480. 3 J.E. Stiglitz: A Re-Examination of the Modigliani-Miller Theorem, American Economic Review 59/1969, pp. 784-793. 4 V.R. Errunza, L.W. Senbet: The Effect of International Operations on the Market Value of the Firm: Theory and Evidence, Journal of Finance 36/1981, pp. 401-417. 5 F. Black: International Capital Market Equilibrium with Investment Barriers, Journal of Financial Economics 1, 1974, pp. 337-352. 6 M.H. Lee, J. Zechner: Debt, Taxes, and International Equilibrium, Journal of International Money and Finance 3/1984, pp. 343-355. 7 I. Shaked: Are Multinational Corporations Safer? Journal of International Business Studies spring/2986, pp. 83-101.

252
by Lewellen8, Shapiro9 (1996), Chkir and Cosset10 (2001), Kedia and Mozumdar,11 who claimed that international companies use debt to neutralize the political risk in a particular foreign country.
The list of imperfections which make international companies use different capital structure than domestic companies also includes agency costs, which according to Lee and Kwok12 are higher for the international companies. This is because, being located in various countries, they are more challenging to control in terms of risk of wealth transfer from bondholders to shareholders. We assume that debtholders are risk-averse, and internationalization involves entering foreign markets, which is very risky. Therefore, it is advantageous for risk-preferring shareholders but not bondholders. According to Lee and Kwok13 (and also Doukas and Pantzalis14), this argument suggests that debt ratios should be lower for international companies. The same conclusions were formed by Myers15, Jensen and Meckling16 and Stulz17 who believed that assets of the international company are similar to the call option and being so risky they are not considered as suitable security for a debt, which reduces the amount of debt such companies are capable of borrowing. Jensen’s18 paper provides counterargument to this opinion which is based on the free cash flow hypothesis: high agency conflicts should lead to higher debt ratios because debt mitigates agency conflicts by removing free cash flows from the disposal of the management, and this introduces external control every time management searches for funds in the market for new investment projects.
Even though the authors of the theoretical models discussed above do not agree on whether internationalization increases or decreases debt levels, their models agree about one thing: market imperfections make the value of international companies dependent on the capital structure. To provide more evidence about the direction of this relationship, we are going to analyze the empirical research results.
8 W.G. Lewellen: A Pure Financial Rationale for the Conglomerate Merger, Journal of Finance 26/1971, pp. 521–537. 9 A.C. Shapiro: Financial Structure and Cost of Capital in the Multinational Corporation, Journal of Financial and Quantitative Analysis, 13(2)/1978, pp. 211-226. 10 I.E. Chkir, J. Cosset: Diversification strategy and capital structure of multinational corporations, Journal of Multinational Financial Management 11/2001, pp.17-37. 11 P.P. Kedia, A. Mozumdar: Foreign Currency Denominated Debt: An Empirical Examination, Journal of Business, 76(4)/2003, pp. 521-546. 12 K. C. Lee, C.C.Y. Kwok: Multinational Corporations vpp. Domestic Corporations: International Environmental Factors and Determinants of Capital Structure, Journal of International Business Studies, 19(2)/1988, pp. 195-217. 13 K. C. Lee, C.C.Y. Kwok: Multinational …,1988, pp. 195-217. 14 J.A. Doukas J. A., C. Pantzalis : Geographic diversification and agency costs of debt of multinational firms, Journal of Corporate Finance 9/2003, pp.59-92. 15 P.P.C. Myers: Determinants of Corporate Borrowing, Journal of Financial Economics 5/1977, pp. 147-175. 16 M. Jensen, W. Meckling: Theory of the firm: Managerial behavior, agency costs, and capital structure, Journal of Financial Economics, 3/1976, pp. 305-360. 17 R. Stulz: Managerial discretion and optimal financing policies, Journal of Financial Economics 26/1990, pp. 3-27. 18 M.C. Jensen: Agency Costs of Free Cash Flow, Corporate Finance and Takeovers, The American Economic Review, 76(2)/1986, May 1986, pp. 321-349.

253
Literature review The positive relationship between internationalization and share of debt in the capital structure is suggested by works of the following authors:
(1) Mansi and Reeb19 (US companies), Singh and Nejadmalayeri20 (French companies) and Reeb et al.21 (US companies) who believe that internationalization opens the door for the currency risk, which increases the risk of investing in equity but at the same time allows geographical profit diversification which stabilizes the profits and lowers the cost of debt.
(2) Kedia and Mozumdar22 (large American companies) who justified this relationship by the exposition to the currency and political risk and that one of the forms of protection against these risks is contracting on the markets’ local (export) debt.
(3) Heston and Rouwenhorst23 (return on indexes of 12 European countries) and Agmon and Lessard24 (US companies listed on NYSE). The authors suggested that higher indebtedness is due to lower bankruptcy risk through international diversification.
(4) Singh et al.25 (large US companies) who suggested that the share of debt increases with the size of the assortment and not with internationalization and that by controlling the size of the assortment, international companies have lower debt than domestic companies with the increase in the share of exports in sales.
A negative relationship between internationalization and the share of debt is suggested by the following authors:
(1) Kim and Lyn26 (research-based on international US companies) and Lee and Kwok27 (international comparisons for 51 countries), who explained this dependency by the dissatisfaction of lenders with the increased risk of international companies and uncertainty of future cash flows.
19 P.P.A. Mansi, D.M. Reeb: Corporate diversification: what gets discounted?, Journal of Finance 57/2002, pp. 2167–2183. 20 M. Singh, A. Nejadmalayeri: Internationalization, Capital Structure, and Cost of Capital: Evidence from French Corporations, Journal of Multinational Financial Management 14/2004, pp. 153-169. 21 D.M. Reeb, P.P.A. Mansi, J.M. Allee: Firm Internationalization and the Cost of Debt Financing: Evidence from Non-Provisional Publicly Traded Debt, Journal of Financial and Quantitative Analysis 36/2001, pp. 395–414. 22 P.P. Kedia, A. Mozumdar: Foreign …, 2003, pp. 521-546. 23 P.P.L. Heston, K.G. Rouwenhorst: Does Industrial Structure Explain the Benefits of International Diversification?, Journal of Financial Economics 36/1994, pp. 3–27. 24 D.M. Reeb, P.P.A. Mansi, J.M. Allee, Firm…. 2001, pp. 395–414. 25 M. Singh, W.N. Davidson, J. Suchard: Corporate Diversification Strategies and Capital Structure, Quarterly Review of Economics and Finance 43/2003, pp. 147–167. 26 W.S. Kim, E.O. Lyn: Foreign direct investment theories, entry barriers, and reverse investments in US manufacturing industries, Journal of International Business Studies, 18(2)/1987, pp. 53-67. 27 K.C. Lee, C.C.Y. Kwok: Multinational Corporations vpp. Domestic Corporations: International Environmental Factors and Determinants of Capital Structure, Journal of International Business Studies, 19(2)/1988, pp. 195-217.

254
(2) Chen et al.28 (US companies), Doukas and Pantzalis29 (US companies), Lee and Kwok30, Michel, and Shaked31, Shapiro32 explained this relationship with high agency costs and high bankruptcy costs.
(3) Ethier33 (US companies) believed that low indebtedness was caused by high levels of intangible assets in international companies, which could not be used as a debt security.
(4) Burgman34 (US companies listed on NYSE) and Fatemi35 (US companies) suggested that international companies have more investment opportunities than domestic companies, and this reduces conflicts over free cash flows, which are retained in a company and used for new projects. This reduces the need to take out new loans.
(5) Kwok and Reeb36 (32 countries, including 12 emerging markets) formulated the hypothesis that the relationship between internationalization and capital structure depends on the relationship between three types of risk: the risk of a given international company, the risk of operating in the country of origin of the international company, and the risk of countries to which the international company sends its goods. If the risk on the domestic market is higher than on foreign markets (and an international company), then internationalization will increase the level of debt. If the risk on the domestic market is lower than foreign markets (and the risk of an international company), then the debt will decrease. The results of Kwok and Reeb37 confirmed the negative correlation between internationalization and debt for US companies (as opposed to the results of the research and Chen et al.38, Chkir and Cosset39), but also indicated that especially for companies from developing markets, the higher the company's involvement in foreign sales, the higher its debt will be.
(6) Low and Chen40 (2004, 30 countries) confirmed the lower indebtedness of international US corporations; however, they failed to find this relationship for companies from other countries.
28 C. J.P. Chen, C.S.A. Cheng, J. He, J. Kim: An Investigation of the Relationship between International Activities and Capital Structure, Journal of International Business Studies, 28(3)/1997, pp. 563-577. 29 J.A. Doukas, C. Pantzalis: Geographic … ,2003, pp.59-92. 30 K.C. Lee, C.C.Y. Kwok: Multinational …, 1988, pp. 195-217. 31 A. Michel, I. Shaked: Multinational Corporations vs. Domestic Corporations: Financial Performance and Characteristics, Journal of International Business Studies, 17(3)/1986, pp. 89-100. 32 A.C. Shapiro: Financial …,1978, pp. 211-226. 33 W. J. Ethier: The Multinational Firm, Quarterly Journal of Economics 101/1996, pp. 805–834. 34 T.A. Burgman: An Empirical Examination of Multinational Corporate Capital Structure, Journal of International Business Studies, 27(3)/1996, pp. 553-570. 35 A.M. Fatemi: The Effect of International Diversification on Corporate Financing Policy, Journal of Business Research, 16(1)/1988, pp. 17-30. 36 C.C.Y. Kwok, D.M. Reeb: Internationalization and Firm Risk: An Upstream-Downstream Hypothesis, Journal of International Business Studies, 31(4)/2000, pp. 611-629. 37 C.C.Y. Kwok, D.M. Reeb : Internationalization… , 2000, pp. 611-629. 38 C.J.P. Chen, C.S.A. Cheng, J. He, J. Kim: An Investigation … , 1997, pp. 563-577. 39 I.E. Chkir, J. C. Cosset: Diversification …, 2001, pp.17-37. 40 P.Y. Low, K.H. Chen: Diversification and Capital Structure: Some International Evidence, Review of Quantitative Finance and Accounting, 23(1)/2004, pp. 55-71.

255
As one can see from the publication summary, empirical research also does not give definite answers about the direction of the dependency between internationalization and the level of debt. Some authors provide evidence that it is positive, other authors believe that it is negative. Finally, Kwok and Reeb41 suggested that the relationship is conditional and dependent on the risk differences between countries. This is why we, the authors of this paper, decided to check for the direction of this relationship using a newer data sample, which covered the years 2007 – 2017.
Research method The selection of the model used for estimating the empirical relationship between internationalization and indebtedness included the following observations and conditions:
- Dependent and independent variables were auto-correlated, which required a model which deals with this problem and produces unbiased estimators of model coefficients;
- The model must allow for the partial adjustment of the endogenous variables over time (due to their autocorrelation);
- Specific characteristics of companies remain constant over time – for example, the industry or company size;
- The model should produce correct estimators for a limited data sample; - Individual effects should include omitted variables; - The expected relationship is linear; - The model should be able to manage auto-correlation and heteroscedasticity
inside objects, but not between them; - idiosyncratic errors are not correlated between objects; - variables used in the model are stationary. Described characteristics led to the implementation of the Blundell-Bond model, as
it deals well with variables that are not perfectly stationary, and with auto-correlated variables. It also produces good estimators for small samples and works well with weak instrumental variables.
To select the best model for the data, we used the bootstrap technique, which meant that we estimated numerous models with all possible combinations of variables from variables groups (variables were strongly correlated within these groups and not significantly correlated between these groups) and chose the model with the highest predictive power. The majority voting of models also allowed to determine the relationship between debt levels and internationalization. We rejected models where control variables (variables which impact on capital structure and are known and are not questionable) had coefficients suggesting the dependency in the opposite direction.
Data was cleared of outliers by removing observations that were higher or lower by two standard deviations from the mean. It was necessary because the model we used is not resistant to such outliers. The method of two-stage estimation with resistant residues was used. Hence we did not run the Pearson test but only Arellano-Bond.
The overall form of the model was as given in equation 1:
41 C.C.Y. Kwok, D.M. Reeb: Internationalization … , 2000, pp. 611-629.

256
∑ γ β x (1)
where are explanatory variables, – group effects, ~ 0, – residual errors, i- object number, t –period, k – time-delays, DE – debt to equity ratio.
Among exogenous variables (which are discussed below) there was either the discrete variable that identified which company (object) was an international or the variable which represented the foreign sales share in total sales revenues. We wanted to empirically verify whether foreign sales variables had a significant impact on the indebtedness ratio.
Table 1 shows the groups of variables used to estimate the model; each group represents another potential determinant of a company’s capital structure (a Table with a variable summary is presented in Appendix 1). 1. Debt measures represent different attempts to measure the dependent variable, which is the capital structure of a company. We tried using the following variables: DEBT_A (liabilities divided by total net assets), DEBTOR (binary variable assuming one if the level of debt in the enterprise exceeds 80%), INDEBT_ST (relation of short-term liabilities to long-term liabilities), LT_LT_A (relation of long-term interest liabilities to total assets), LT_ST_A (relation of short-term interest liabilities to total assets), NONINTERESTLIAB_A - share of trade liabilities in total (net) assets.
Due to the strong relationship between current debt ratios and their values from the previous period (enterprises' decisions as to the form of financing strongly depend on the current capital structure and amount of debt), delayed debt ratios (respectively) were introduced as independent variables: DEBT_A_t_1, DEBTOR_t_1, INDEBT_ST_t_1 , LT_LT_A_t_1, LT_ST_A_t_1, DE_3 (average for the last 3 years), DEBT_A_3, DEBTOR_3, INDEBT_ST_3, LT_LT_A_3, LT_ST_A_3.
2. Internationalization was measured with the following variables: EXPORT_OPERREVENUE which measures the intensity of foreign sales, EXPORTER which is a binary variable and distinguishes international companies from domestic companies, EXPORT_100, EXPORTFROM50, EXPORTFROM25, EXPORTFROM10 distinguished companies with international sales share close to 100 %, above 50%, 25% and 10% of total sales.
3. Productivity was measured with the following variables: PRODUCTIVITY, which represented the residuals from the production function, EQUIPMENT, which measured the number of net fixed assets per employee, PRODUCTIVITY_A and PRODUCTIVITY_E which measured sales related to fixed assets and sales divided by the number of employees. A negative correlation between productivity and debt was expected.
4. Profitability measures which included: ROSF - return on equity, ROA - return on assets, ROE - equity, ROSF - share capital, ROS - return on sales, ROSF_3, ROE_3, ROA_3 is the average for the last three years. We expected a negative correlation between profitability and debt.
5. Liquidity measures included the following variables: CURR – current liquidity ratio, CF_S – average balance of cash flows for the last 3 years divided by sales, SUFFICIENCY a binary variable which indicated the company’s ability to cover the most essential expenses (dividend estimation, purchases of fixed assets, repayment of

257
loans) from operating cash surplus. The group of liquidity ratios has been supplemented with ratios measuring the length of the operating cycle because they are considered to be an extension of the entity’s liquidity analysis: CKON net working capital cycle, inventory, liabilities, and receivables cycle: STOCKCYCLE, CREDITCYCLE, and COLLECTIONPERIOD.
6. Credit collateral. Ratios from this group measure the share of non-current assets in total assets, as non-current assets are used to secure long-term loans and interest liabilities. Therefore, this group included the following indicators: the share of non-current assets in total assets AT_A, the share of non-current assets in total assets ATR_A, the share of tangible assets in total assets (part of current assets has been added here). Additionally, the interest coverage ratio INTEREST_COVER calculated as an operating result related to interest was used.
7. Development possibilities. The entity's debt also depends on the development opportunities available on the market. In industries where there is no innovation, there is usually intense price competition that reduces profits, and this often makes companies unable to repurchase depreciated assets, and companies must use debt. On the other hand, excellent development opportunities increase the costs of bankruptcy and are, to some extent, a guarantee that bankruptcy will not happen, which positively affects the possibility of obtaining debt. Therefore, the possibility of a non-linear relationship between debt and investment opportunities was adopted. The following variables were used as measures of development possibilities: DEVELOPMENT which reflects the available sources of self-financing (for the previous period), TEMPOS variable measuring the rate of sales change (annual change), chngFA_A measures the level of investment in fixed assets, REINVESTMENT shows how much profit the company retained for future development.
8. Tax shields. Tax shields have a positive or negative impact on increasing debt, depending on whether the interest shield or non-interest shields are analyzed. In the case of interest shield (SHIELD_INT), its amount is positively related to debt. The opposite is true for other shields: advertising, depreciation, provisions (SHIELD_ADV, SHIELD_PROV, SHIELD_INT).
9. Size of the entity was measured with the following variables (the larger the company, the more secure it is and the more debt it can use): SIZE, i.e., the natural logarithm of employment, EMPLOYEES – employment in persons, OPERREVENUE - the company's logarithm of sales measured in euros.
10. The risk was measured with the following variables: devEBITDA, devEBITDAI, devOPERREV, devCASHFLOW, which mean, respectively: standard deviation of profits without depreciation, taxes, and interest; profits without depreciation, taxes, interest and capital expenditures, turnover and operating flow balances. Also, we used ratios measuring the degree of operational and financial and total leverage (DOL1, DFL1, DFL, DTL). On top of that, we used the results of the following bankruptcy prediction models: ZSCORE, EMSCORE, TAFFLER, CBBF1, and INSOLVENCY2.
11. Position in the industry. The company's profitability is determined by the industry situation and the uniqueness (perceived by customers) of the company's offer. Therefore, companies with a better position in the industry receive funds more easily from lenders, which leads to the assumption of a positive relationship between a strong position in the industry and market monopolization and debt. The following variables

258
were adopted as measures of position in the industry: MARKETSHARE, i.e. the share of turnover of a given enterprise in the total turnover of companies from a given sector, HERFEXP, H2, H3, H4 – which means respectively the Herfindahl-Hirsch index for exporters (industry-specific), for all companies grouped in industries according to 2, 3.., digit nace code, COMPETITORS – the number of direct competitors listed in the Orbis database.
12. Corporate transformations. During corporate mergers and transformations, financial indicators of companies lose comparability and rationality. Therefore, we introduced a binary variable to signal such situations.
13. Age of the entity because usually, the level of debt increases with the age of the company. Therefore, we used the variable: AGE representing the age of the company.
14. Control and possession. The variables in this group are based on the theory of conflicts between shareholders, lenders, and management. One of the measures of the level of these conflicts is the amount of free cash flow at the disposal of the management board and the dividend, which reduces the free cash flow. It is assumed that the higher the dividend, the lower the conflicts, and the higher the entity's debt will be (variable CONTROL). Other research suggests that in private companies, the debt is higher than in state-owned companies, hence the PRIVATE variable introduced, which takes the value 1 for private companies and 0 for state-owned companies.
15. Development of the financial sector and technological advancement of the economy. According to the results of earlier studies, the worse the economic situation in a given country's economy, the higher the average indebtedness of enterprises (due to the decrease in profitability). Therefore we used the following variables describing the macroeconomic situation in a country: RECESSION (takes the value of 1 if there was a decrease in real GDP year on year in), GDPREALGROWTHRATE (measures the change of real GDP year on year), PUBDEBT measures the level of public debt to GDP, INTEREST measures the level of interest rates in the country (the lower it is, the higher will be the enterprise’s debt). The measures of the country's economic development included: the existence of a stock exchange (STOCKMARKET = 1 if there is a stock exchange in a given country) and GDPPERCAPITA showing the level of GDP per capita in the country. A positive relationship was expected between the level of development and the level of debt (due to lower risk).
16. Cost of capital. We expected a positive relationship between the level of debt and the cost of equity (variable RISKPREMIUM) and a negative relationship between the debt and the cost of debt (variable KD). We also tested the general level of interest rates (the variable INTEREST_RATES).
17. Artificial variables distinguished various types of business activities in which companies operated (NACE), forms of ownership (private or state-owned company), and the INDEPENDENT variable distinguished companies which had subsidiaries (or not).
The data sample we used was downloaded from the Orbis database and included unconsolidated and consolidated financial statements of commercial companies. If a company was a part of a bigger group, we only used the financial statement of the holding. We removed all observations where total assets were not equal to equity plus liabilities, and we removed outliers. The selection of countries depended on the availability of export sales information in the database. The data covered the period 2007 – 2017.

259
The estimated models were to verify the following research hypotheses: H1: Internationalization increases indebtedness of a company measured with the debt to equity ratio, H2: The scale of internationalization (measured with the share of foreign sales to total sales) is positively related to the level of indebtedness (measured with the debt to equity ratio).
Results The results of model estimation for four (BA – Bosnia and Herzegovina, FR – France, UK – the United Kingdom and IR – Ireland) countries are presented in Table 1 and Table 2. Table 1 shows the basic model parameters. The number of groups represents the number of companies that were used for the estimation. The number of observations is the total number of observations because every company's financial statements could be given for more than one year. The number of instruments represents the number of second and further lag differences of variables that were used in the estimation of the model (they have to be independent on the residuals). Wald chi2 statistic shows the result of the test based on the MLE estimators for the model with and without constraints (“a model with constraints” means that we remove all independent variables from the model and comparative predictive power of both models – with and without independent variables) and the prob>chi2 statistic shows the probability that this difference is statistically significant. The next two lines represent the Arrelano-Bond test for the absence of the second-order serial correlation in disturbances – if the hypothesis is not rejected, then there is no serial correlation. Since p-values > 0.05 then there is no serial autocorrelation (z-value represents the value of the test statistic). We used the two-step robust estimation with the Windmeijer’s finite-sample correction for the two-step covariance matrix (we had to use robust estimation).
Table 1. Model estimation parameters for the dependency between debt to equity ratio and a binary variable representing international companies country BA FR UK IR no of obs 5258 14807 1618 160 no of groups 1350 3602 870 98 no of instruments 33 33 35 26 Wald chi2(4) 102.04 2055.66 476.59 60.95 Prob>chi2 0 0 0 0 abond2 z-value -0.76 -0.14 -0.47 -0.56 abond2 p-value 0.45 0.89 0.64 0.58 Source: Authors’ own research.
Table 2 shows parameters of the model in which we wanted to find the relationship
between the debt to equity ratio and the discrete variable which determines whether a company has more than 10% of its sales as foreign sales (variable exporter) (less than 10% of export sales could result from random, unplanned transactions with foreign companies operating in the domestic market).
As can be seen in Table 1 and 2, estimated parameters confirm the positive dependency between indebtedness and internationalization. Statistically significant

260
determinants included: a binary variable identifying firms with foreign sales exceeding 10% of total sales revenues, the cost of debt (negative dependency), bankruptcy risk measured with bankruptcy prediction models (negative dependency), total asset productivity (negative dependency), growth of fixed assets in total assets (positive dependency), return on equity and return on sales (negative dependency), growth rate of sales (positive dependency) and the size of a company (positive dependency). Therefore, the model confirmed that selling more than 10% of sales abroad has a positive impact on the indebtedness of a company.
Table 1. Model estimation results for the dependency between debt to equity ratio and a binary variable representing international companies (dependent variable DE_t) Country/variable name BA FR UK IR DE_t_1 L1.DE L1.DE L1.DE L1.DE estim 0.75 0.67 0.55 0.45 z 8.61 25.68 8.04 3.37 p 0,001 0,001 0,001 0.007 DE_t_2 L2.DE estim 0.05 z 3.79 p 0,001 FOREIGNSALES exporter exporter exporter exporter estim 7.10 0.15 0.03 0.06 z 2.01 1.86 2.74 1.80 p 0.04 0.06 0.01 0.07 INSOLVENCY EMScore EMScore estim -0.05 -0.01 z -9.95 -3 p 0,001 0.003 CAPITAL kd kd kd estim -1.85 -0.001 -0.001 z -2.10 -3.43 -5.23 p 0.04 0.001 0.001 TFP productivity_a productivity_a estim -5.62 -0.04 z -1.97 -6.29 p 0.05 0,001 GROWTH chngFA_a chngFA_a estim 0.14 0.10 z 9.79 2.6 p 0.001 0.01 PROFITABILITY roe cf_s estim -20.72 -0.09 z -3.11 -6.79 p 0.001 0,001 TEMPO f1.tempos estim 0.09 z 1.90 p 0.06 SIZE size_s estim 0.04 z 2.06

261
Country/variable name BA FR UK IR p 0.04 CONS cons cons cons cons estim 10.97 0.08 0.26 0.29 z 2.64 1.68 1.42 3.51 p 0.01 0.09 0.16 0.001 Source: Authors’ own research.
Tables 3 and 4 show the results of the model estimation, where one of the explanatory variables was the share of foreign sales in total sales revenues. If such a relationship exists, then for moderately indebted companies, the share of debt could depend on the level of their internationalization. As can be seen in Table 3, the AR(2) test did not show serial autocorrelation.
As can be seen in Table 4, although it could be the effect of using a large data sample, estimation results confirm the positive relationship between the level of internationalization (measured with the share of foreign sales in total sales) and the indebtedness of a business. Statistically significant determinants included (on top of the share of foreign sales in total sales ratio): the risk of bankruptcy (negative dependency), the cost of debt (negative dependency), total assets productivity (negative dependency), increase of fixed assets in total assets (positive dependency), current liquidity ratio (positive dependency), return on equity (negative dependency), interest rates (negative dependency) and the growth rate of sales (positive dependency). The estimated models (at least) did not deny the possibility that the scale of internationalization may be linearly related to the indebtedness level of a company.
Table 3. Model estimation results for the dependency between the debt to equity ratio and the foreign sales share in total sales country BA FR UK IR no of obs 10889 282345 1618 164 no of groups 3557 60002 870 51 no of instruments 31 33 33 34 Wald chi2(4) 3322.76 214.66 516.2 149.23 Prob>chi2 0 0 0 0 abond 2 z 1.05 0.81 -0.64 -0.02 abond 2 p 0.29 0.42 0.52 0.99 Source: Authors’ own research. Table 4. Model estimation results for the dependency between the debt to equity ratio and the foreign sales share in total sales (dependent variable DE_t) country BA FR UK IR DE_t_1 L1.DE L1.DE L1.DE L1.DE estim 0.83 0.46 0.50 0.10 z 44.09 1.99 6.31 1.94 p 0 0.047 0 0.052 DE_t_2 L2.DE estim 0.04 z 2.31 p 0.02 FOREIGNSALES export_operrevenue export_operrevenue export_operrevenue export_operrevenue
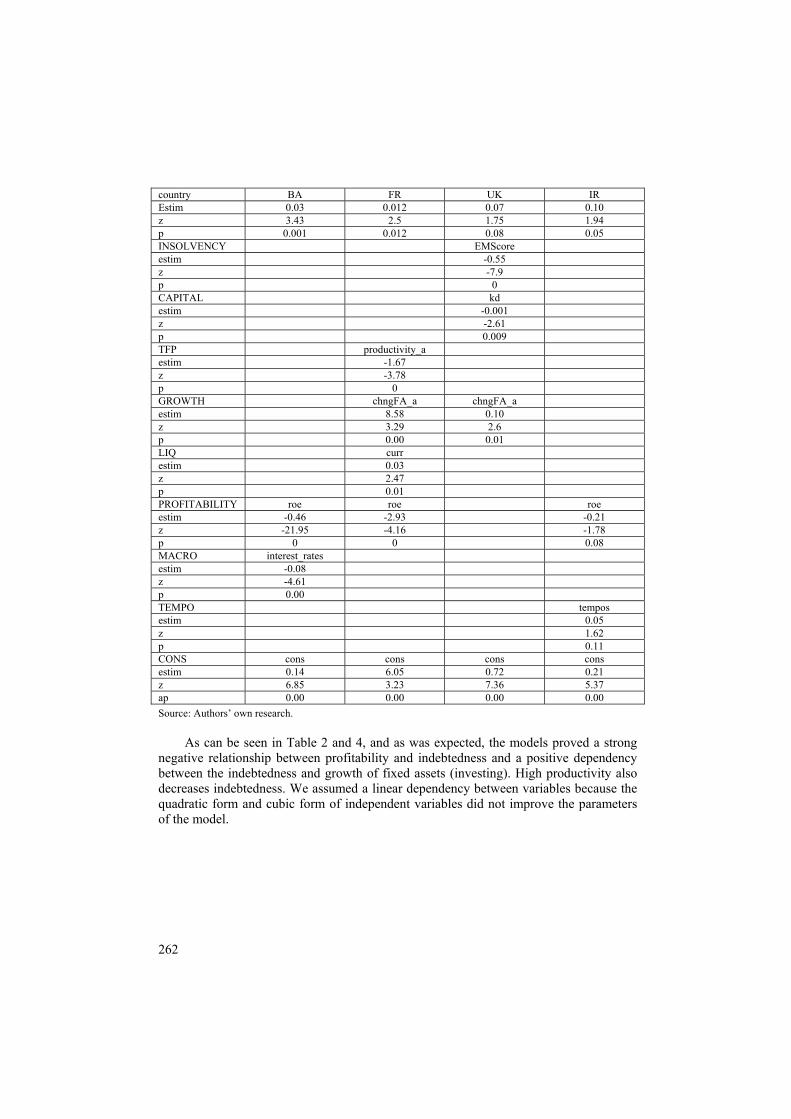
262
country BA FR UK IR Estim 0.03 0.012 0.07 0.10 z 3.43 2.5 1.75 1.94 p 0.001 0.012 0.08 0.05 INSOLVENCY EMScore estim -0.55 z -7.9 p 0 CAPITAL kd estim -0.001 z -2.61 p 0.009 TFP productivity_a estim -1.67 z -3.78 p 0 GROWTH chngFA_a chngFA_a estim 8.58 0.10 z 3.29 2.6 p 0.00 0.01 LIQ curr estim 0.03 z 2.47 p 0.01 PROFITABILITY roe roe roe estim -0.46 -2.93 -0.21 z -21.95 -4.16 -1.78 p 0 0 0.08 MACRO interest_rates estim -0.08 z -4.61 p 0.00 TEMPO tempos estim 0.05 z 1.62 p 0.11 CONS cons cons cons cons estim 0.14 6.05 0.72 0.21 z 6.85 3.23 7.36 5.37 ap 0.00 0.00 0.00 0.00 Source: Authors’ own research.
As can be seen in Table 2 and 4, and as was expected, the models proved a strong
negative relationship between profitability and indebtedness and a positive dependency between the indebtedness and growth of fixed assets (investing). High productivity also decreases indebtedness. We assumed a linear dependency between variables because the quadratic form and cubic form of independent variables did not improve the parameters of the model.

263
Conclusions and recommendations The empirical findings of this paper did not provide grounds that would make us reject the research hypotheses we put in this paper. Models that we estimated confirmed that internationalization increases indebtedness of a company measured with the debt to equity ratio (H1 hypothesis) and that the scale of internationalization (measured with the share of foreign sales to total sales) is positively related to the level of indebtedness (measured with the debt to equity ratio) (H2 hypothesis).
Regardless of whether companies we analyzed come (in the meaning: have their headquarters) from an economically developed country or a developing country, if one excludes over-indebted enterprises, all research results show that the companies increase their level of debt along with their level of internationalization. Possible reasons for this situation can be found in theoretical studies presented at the beginning of the article. These reasons include lower operational risk of international enterprises resulting from geographical sales diversification, higher product attractiveness, and brand strength, which allows the company to sell its products on international markets, lower risk, and costs of bankruptcy of international enterprises. Additional reasons that may cause an increase in debt, according to the authors of this study, include: better quality of assets used as collateral for loans, higher sales dynamics forcing additional annual increases in funding necessary to cope with the increase in net working capital demand, greater availability of attractive investment projects and lower risk of their failure, because enterprises able to survive in foreign markets have extensive knowledge and experience in implementing such projects. Also, according to signaling theory, if a company implements very attractive investment projects with relatively low risk, it would try to finance them with debt, because it does not risk defaulting on this debt, and limits the claims of capital donors to the amount of interest and loan installments. The market responds positively to such situations, and therefore such actions increase the value of the company.
Government policy recommendations resulting from these observations are such that enterprises entering foreign markets and increasing their share in such markets need large amounts of capital, and although they should deal with its acquisition on their own, it is worth talking with banks about possible problems with providing them with additional financing. Especially small and medium-sized entities, which generally have problems with obtaining financing, may suffer from a lack of capital. There are opinions that the situation of capital shortage cannot be observed using empirical data, because enterprises that lack capital do not invest, and therefore the only thing that can be seen in the empirical data is the slow pace of development.
References Agmon T., Lessard D.R.: Investor Recognition of Corporate International Diversification, Journal of Finance, 32(4)/1977, pp. 1049-55, https://EconPaperpp.repec.org/RePEc:bla:jfinan:v:32:y:1977:i:4:p:1049-55. Black, F.: International Capital Market Equilibrium with Investment Barriers, Journal of Financial Economics 1, 1974, pp. 337-352. Burgman T. A.: An Empirical Examination of Multinational Corporate Capital Structure, Journal of International Business Studies, 27(3)/1996, pp. 553-570. Chen C. J. P., Cheng C. S. A., He, J., Kim, J.: An Investigation of the Relationship between International Activities and Capital Structure, Journal of International Business Studies, 28(3)/1997, pp. 563-577.

264
Chkir I. E. , Cosset J. C.: Diversification strategy and capital structure of multinational corporations, Journal of Multinational Financial Management 11/2001, pp.17-37. Doukas J. A., Pantzalis C.: Geographic diversification and agency costs of debt of multinational firms, Journal of Corporate Finance 9/2003, pp.59-92. Errunza, V. R., Senbet L.W.: The Effect of International Operations on the Market Value of the Firm: Theory and Evidence, Journal of Finance 36/1981, pp. 401-417. Ethier W.J.: The Multinational Firm, Quarterly Journal of Economics 101/1996, pp. 805–834. Fatemi A. M.: The Effect of International Diversification on Corporate Financing Policy, Journal of Business Research, 16(1)/1988, pp. 17-30. Heston PP.L., Rouwenhorst K.G.: Does Industrial Structure Explain the Benefits of International Diversification?, Journal of Financial Economics 36/1994, pp. 3–27. Jensen M., Meckling W.: Theory of the firm: Managerial behavior, agency costs, and capital structure, Journal of Financial Economics, 3/1976, pp. 305-360. Jensen M.C.: Agency Costs of Free Cash Flow, Corporate Finance and Takeovers, The American Economic Review, 76(2)/1986, May 1986, pp. 321-349. Kedia PP., Mozumdar A.: Foreign Currency Denominated Debt: An Empirical Examination, Journal of Business, 76(4)/2003, pp. 521-546. Kim W.S., Lyn E.O.: Foreign direct investment theories, entry barriers, and reverse investments in US manufacturing industries, Journal of International Business Studies, 18(2)/1987, pp. 53-67. Kwok C. C. Y., Reeb, D. M.: Internationalization and Firm Risk: An Upstream-Downstream Hypothesis, Journal of International Business Studies, 31(4)/2000, pp. 611-629. Lee K. C., Kwok C. C. Y.: Multinational Corporations vpp. Domestic Corporations: International Environmental Factors and Determinants of Capital Structure, Journal of International Business Studies, 19(2)/1988, pp. 195-217. Lee, M. H., Zechner J.: Debt, Taxes, and International Equilibrium, Journal of International Money and Finance 3/1984, pp. 343-355. Lewellen W.G.: A Pure Financial Rationale for the Conglomerate Merger, Journal of Finance 26/1971, pp. 521–537. Low P. Y., Chen K. H.: Diversification and Capital Structure: Some International Evidence, Review of Quantitative Finance and Accounting, 23(1)/2004, pp. 55-71. Mansi, PP.A., Reeb D.M.: Corporate diversification: what gets discounted?, Journal of Finance 57/2002, pp. 2167–2183. Michel A., Shaked I.: Multinational Corporations vs. Domestic Corporations: Financial Performance and Characteristics, Journal of International Business Studies, 17(3)/1986, pp. 89-100. Modigliani F., Miller M.: The Cost of Capital, Corporation Finance and the Theory of Investment American ‘, Economic Review 48/1958, pp. 261-297. Myers PP. C., Determinants of Corporate Borrowing, Journal of Financial Economics 5/1977, pp. 147-175. Reeb D.M., Mansi PP.A., Allee J.M.: Firm Internationalization and the Cost of Debt Financing: Evidence from Non-Provisional Publicly Traded Debt, Journal of Financial and Quantitative Analysis 36/2001, pp. 395–414. Senbet, L. W.: International Capital Market Equilibrium and Multinational Firm Financing and Invest Policies, Journal of Financial and Quantitative Analysis 14/1979, pp.455-480. Shaked I.: Are Multinational Corporations Safer? Journal of International Business Studies spring/2986, pp. 83-101. Shapiro A. C.: Financial Structure and Cost of Capital in the Multinational Corporation, Journal of Financial and Quantitative Analysis, 13(2)/1978, pp. 211-226. Singh M., Davidson W.N., Suchard J.: Corporate Diversification Strategies and Capital Structure, Quarterly Review of Economics and Finance 43/2003, pp. 147–167. Singh M., Nejadmalayeri A.: Internationalization, Capital Structure, and Cost of Capital: Evidence from French Corporations, Journal of Multinational Financial Management 14/2004, pp. 153-169.
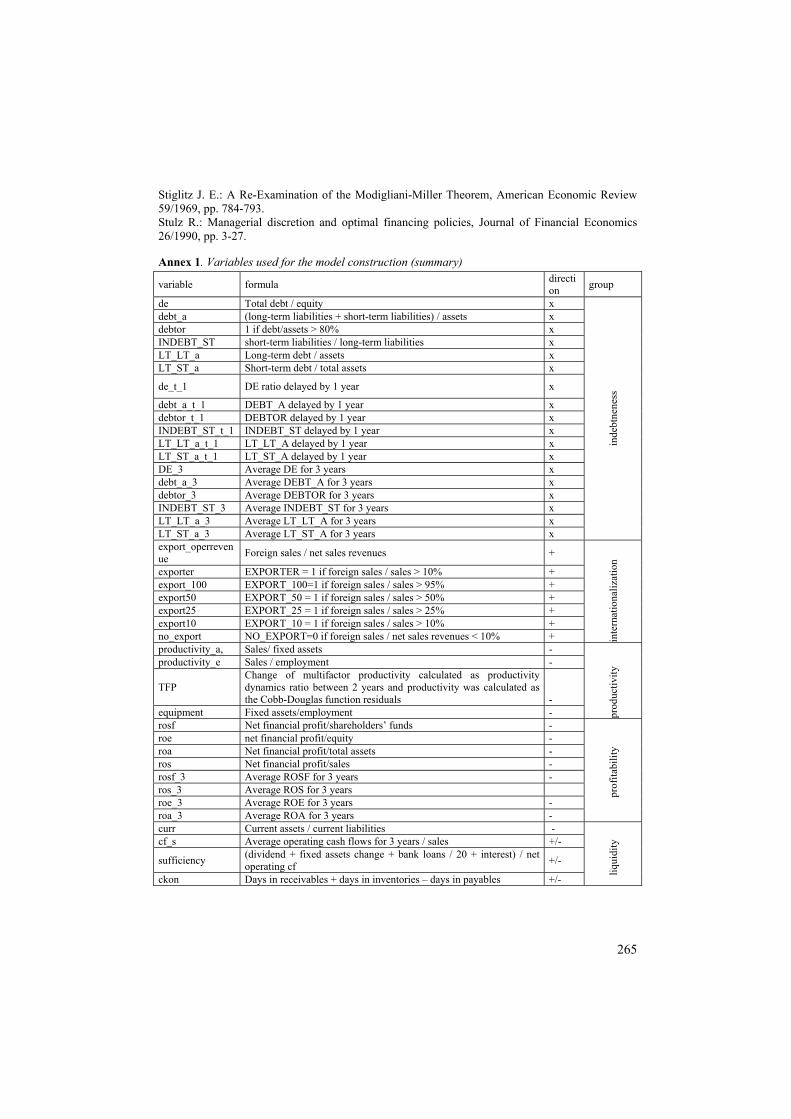
265
Stiglitz J. E.: A Re-Examination of the Modigliani-Miller Theorem, American Economic Review 59/1969, pp. 784-793. Stulz R.: Managerial discretion and optimal financing policies, Journal of Financial Economics 26/1990, pp. 3-27. Annex 1. Variables used for the model construction (summary)
variable formula direction group
de Total debt / equity x
inde
btne
ness
debt_a (long-term liabilities + short-term liabilities) / assets x debtor 1 if debt/assets > 80% x INDEBT_ST short-term liabilities / long-term liabilities x LT_LT_a Long-term debt / assets x LT_ST_a Short-term debt / total assets x
de_t_1 DE ratio delayed by 1 year x
debt_a_t_1 DEBT_A delayed by 1 year x debtor_t_1 DEBTOR delayed by 1 year x INDEBT_ST_t_1 INDEBT_ST delayed by 1 year x LT_LT_a_t_1 LT_LT_A delayed by 1 year x LT_ST_a_t_1 LT_ST_A delayed by 1 year x DE_3 Average DE for 3 years x debt_a_3 Average DEBT_A for 3 years x debtor_3 Average DEBTOR for 3 years x INDEBT_ST_3 Average INDEBT_ST for 3 years x LT_LT_a_3 Average LT_LT_A for 3 years x LT_ST_a_3 Average LT_ST_A for 3 years x export_operrevenue Foreign sales / net sales revenues +
inte
rnat
iona
lizat
ion
exporter EXPORTER = 1 if foreign sales / sales > 10% + export_100 EXPORT_100=1 if foreign sales / sales > 95% + export50 EXPORT_50 = 1 if foreign sales / sales > 50% + export25 EXPORT_25 = 1 if foreign sales / sales > 25% + export10 EXPORT_10 = 1 if foreign sales / sales > 10% + no_export NO_EXPORT=0 if foreign sales / net sales revenues < 10% + productivity_a, Sales/ fixed assets -
prod
uctiv
ity productivity_e Sales / employment -
TFP Change of multifactor productivity calculated as productivity dynamics ratio between 2 years and productivity was calculated as the Cobb-Douglas function residuals -
equipment Fixed assets/employment - rosf Net financial profit/shareholders’ funds -
prof
itabi
lity
roe net financial profit/equity - roa Net financial profit/total assets - ros Net financial profit/sales - rosf_3 Average ROSF for 3 years - ros_3 Average ROS for 3 years roe_3 Average ROE for 3 years - roa_3 Average ROA for 3 years - curr Current assets / current liabilities -
liqui
dity
cf_s Average operating cash flows for 3 years / sales +/-
sufficiency (dividend + fixed assets change + bank loans / 20 + interest) / net operating cf +/-
ckon Days in receivables + days in inventories – days in payables +/-
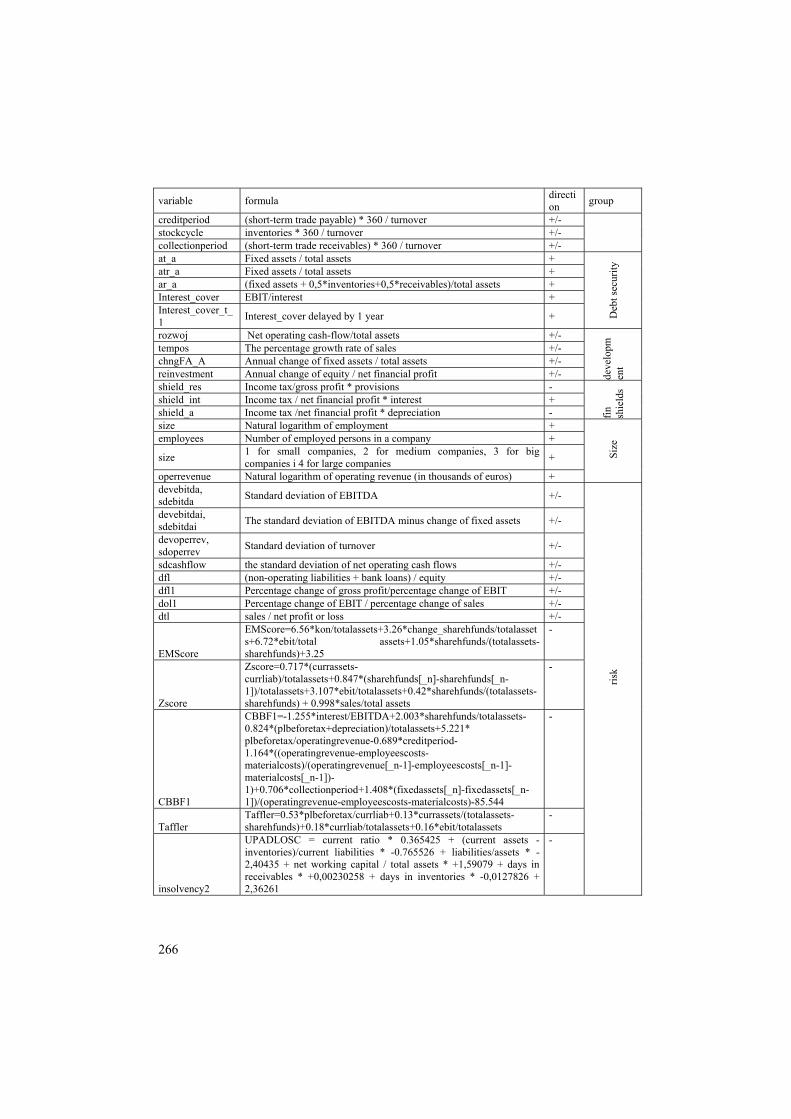
266
variable formula direction group
creditperiod (short-term trade payable) * 360 / turnover +/- stockcycle inventories * 360 / turnover +/- collectionperiod (short-term trade receivables) * 360 / turnover +/- at_a Fixed assets / total assets +
Deb
t sec
urity
atr_a Fixed assets / total assets + ar_a (fixed assets + 0,5*inventories+0,5*receivables)/total assets + Interest_cover EBIT/interest + Interest_cover_t_1 Interest_cover delayed by 1 year +
rozwoj Net operating cash-flow/total assets +/-
deve
lopm
ent
tempos The percentage growth rate of sales +/- chngFA_A Annual change of fixed assets / total assets +/- reinvestment Annual change of equity / net financial profit +/- shield_res Income tax/gross profit * provisions -
fin
shie
lds
shield_int Income tax / net financial profit * interest + shield_a Income tax /net financial profit * depreciation - size Natural logarithm of employment +
Size
employees Number of employed persons in a company +
size 1 for small companies, 2 for medium companies, 3 for big companies i 4 for large companies +
operrevenue Natural logarithm of operating revenue (in thousands of euros) + devebitda, sdebitda Standard deviation of EBITDA +/-
risk
devebitdai, sdebitdai The standard deviation of EBITDA minus change of fixed assets +/-
devoperrev, sdoperrev Standard deviation of turnover +/-
sdcashflow the standard deviation of net operating cash flows +/- dfl (non-operating liabilities + bank loans) / equity +/- dfl1 Percentage change of gross profit/percentage change of EBIT +/- dol1 Percentage change of EBIT / percentage change of sales +/- dtl sales / net profit or loss +/-
EMScore
EMScore=6.56*kon/totalassets+3.26*change_sharehfunds/totalassets+6.72*ebit/total assets+1.05*sharehfunds/(totalassets-sharehfunds)+3.25
-
Zscore
Zscore=0.717*(currassets-currliab)/totalassets+0.847*(sharehfunds[_n]-sharehfunds[_n-1])/totalassets+3.107*ebit/totalassets+0.42*sharehfunds/(totalassets-sharehfunds) + 0.998*sales/total assets
-
CBBF1
CBBF1=-1.255*interest/EBITDA+2.003*sharehfunds/totalassets-0.824*(plbeforetax+depreciation)/totalassets+5.221* plbeforetax/operatingrevenue-0.689*creditperiod-1.164*((operatingrevenue-employeescosts-materialcosts)/(operatingrevenue[_n-1]-employeescosts[_n-1]-materialcosts[_n-1])-1)+0.706*collectionperiod+1.408*(fixedassets[_n]-fixedassets[_n-1])/(operatingrevenue-employeescosts-materialcosts)-85.544
-
Taffler Taffler=0.53*plbeforetax/currliab+0.13*currassets/(totalassets-sharehfunds)+0.18*currliab/totalassets+0.16*ebit/totalassets
-
insolvency2
UPADLOSC = current ratio * 0.365425 + (current assets -inventories)/current liabilities * -0.765526 + liabilities/assets * -2,40435 + net working capital / total assets * +1,59079 + days in receivables * +0,00230258 + days in inventories * -0,0127826 + 2,36261
-

267
variable formula direction group
herfexp Herfindahl-Hirshman index calculated for foreign sales for companies with the same 3 NACE digits +
Mar
ket
shar
e/po
sitio
n
H3sales Herfindahl –Hirschman index based on sales (calculated separately for every country) for 3-digit NACE subgroups +
H4sales Herfindahl –Hirschman index based on sales (calculated separately for every country) for 4-digit NACE subgroups +
marketshare Net sales revenues of a company / total sales in the industry + competitors Number of direct competitors -
korp KORP = 1 if fixed assets grew by more than 100% or current ratio grew by 100% + M&A
age Company’s age age
control Share of dividends in net financial profit calculated as changes in equity without share capital/net financial profit + control
private_owned 1 for non-state owned companies + ownership banks Bank sector total assets / GDP + Financial
sector bankloans_pkb Household loans / GDP + deterioration 1 if real GDP decreased +
economic situation in a country
gdprealgrowthrate the real growth rate of GDP + pubdebt gross public debt / GDP + interest_rates Risk free rate in a country of a company’s headquarters -
stockmarket 1 if there exists a stock market in the country of a company’s headquarters +
gdppercapita GDP per capita + kd Cost of debt = interest / debt - cost of
capital riskpremium Risk-free rate in a country of a company’s headquarters +
status Active 1; Inactive (no precision) 2; Active (dormant) 3; Dissolved (merger) 4; Dissolved 5; Bankruptcy 6; Inactive (no precision) 7; In liquidation 8; n.a. 0
nace, nace3 3 and 4-digit NACE code czas year
dependent 1 if a company owns subsidiaries and 0 if a company does not have subsidiaries
Information about authors:
dr hab. inż. Joanna Wyrobek, prof. UEK Corporate Finance Department Cracow University of Economics Ul. Rakowicka 27, 31-510 Kraków, Polska e-mail: [email protected] ORCID: 0000-0002-8536-0851
Prof. Paul Lane L. William Seidman Center Marketing Department Grand Valley State University 50 Front Ave SW, SCB 3086 Grand Rapids, Michigan 49504 e-mail: [email protected] ORCID: 0000-0003-0759-3796
Copyright © 2022 FDOKUMEN


![Siedem dokumentów o obchodach stulecia Wojny Ojczyźnianej 1812 r. w szkołach opatowskich [w:] Pomiędzy światem polityki a życiem naukowym. Księga jubileuszowa dedykowana profesorowi](https://static.fdokumen.com/doc/165x107/63450cc438eecfb33a065fe0/siedem-dokumentow-o-obchodach-stulecia-wojny-ojczyznianej-1812-r-w-szkolach.jpg)
![Europejskie regionalne strategie innowacji jako źródło wzorców dla Polski [European regional innovation strategies as a pattern source for Poland]](https://static.fdokumen.com/doc/165x107/63331603576b626f850db341/europejskie-regionalne-strategie-innowacji-jako-zrodlo-wzorcow-dla-polski-european.jpg)


![Progospodarczy obszar polityki edukacyjnej władz lokalnych [PRO-ECONOMIC AREA OF LOCAL AUTHORITIES EDUCATION POLICY]](https://static.fdokumen.com/doc/165x107/6332f4ca576b626f850da64d/progospodarczy-obszar-polityki-edukacyjnej-wladz-lokalnych-pro-economic-area-of.jpg)
![Wybrane problemy rosyjskiej polityki migracyjnej, [w:] Szanse i wyzwania europejskiej polityki migracyjnej w XXI w., „Rocznik Nauk Społecznych”, red. naukowa A. Szabaciuk, nr](https://static.fdokumen.com/doc/165x107/63276217da2da540ff042582/wybrane-problemy-rosyjskiej-polityki-migracyjnej-w-szanse-i-wyzwania-europejskiej.jpg)