Political Efficacy and Participation in Twenty-Seven Democracies: How Electoral Systems Shape...
24
B.J.Pol.S. 37, 000–000 Copyright © 2007 Cambridge University Press doi:10.1017/S0000000000000000 Printed in the United Kingdom Political Efficacy and Participation in Twenty-Seven Democracies: How Electoral Systems Shape Political Behaviour JEFFREY A. KARP AND SUSAN A. BANDUCCI* Advocates of proportional representation (PR) often cite its potential for increasing citizen involvement in politics as one of PR’s fundamental advantages over plurality or first-past-the-post systems. The assumption is that plurality electoral systems distort the translation of votes into seats, discouraging and alienating small party supporters and other political minorities. In contrast, PR systems are believed to provide greater opportunities for representation which are assumed to instil greater efficacy and participation. We examine this theory linking institutions to electoral participation across a diverse set of countries using data from the Comparative Study of Electoral Systems. Using a multi-level approach we find evidence consistent with the expectations about the negative influence of disproportional systems on political minorities. Voters are also likely to have stronger partisan preferences in PR systems, which enhances political efficacy and increases voter participation. The effects of PR, however, are not all positive; broad coalitions, which are likely to be a feature of these systems, reduce political efficacy. While the size of the advantage tends to vary, most of the research on electoral systems and turnout agrees that proportional representation (PR) systems have a turnout advantage. Although any one vote is unlikely to be decisive in an election, electoral systems can alter the degree to which votes can matter. Votes for minor parties in PR systems are likely to matter more in determining the overall partisan distribution of seats in a legislature than in plurality systems where minor parties often find it difficult to translate their votes into seats. Past research on electoral systems and turnout has assumed that the disproportion- ality between seats and votes in plurality systems instils in voters the feeling that their vote does not matter, and, as a result, they may be less likely to vote. As such, attitudes towards the likely impact of one’s vote are assumed to act as an intervening variable between electoral rules and electoral participation. The extant comparative literature, however, has relied almost entirely on aggregate data to examine the influence of electoral systems on voter turnout and, therefore, has never explicitly measured efficacy, the feeling that one’s vote is potentially decisive. With the collection of cross-national election studies under the Comparative Study of Electoral Systems (CSES), it is now possible to examine how attitudes are shaped by electoral rules and how these attitudes influence turnout. We first review the evidence regarding the relationship between electoral systems, political efficacy, strength of partisan attachments and turnout. Based on this past research, we test a model of efficacy and electoral participation that combines electoral system and individual level effects. ELECTORAL SYSTEMS AND TURNOUT Most empirical studies that attempt to measure the impact of institutional arrangements on turnout do so by employing aggregate data across a number of countries with different * Department of Politics, University of Exeter. The authors would like to thank Sarah Birch and the Journal’s anonymous reviewers for their constructive comments.
Transcript of Political Efficacy and Participation in Twenty-Seven Democracies: How Electoral Systems Shape...

B.J.Pol.S. 37, 000–000 Copyright © 2007 Cambridge University Press
doi:10.1017/S0000000000000000 Printed in the United Kingdom
Political Efficacy and Participation in Twenty-SevenDemocracies: How Electoral Systems Shape PoliticalBehaviour
JEFFREY A. KARP A N D SUSAN A. BANDUCCI*
Advocates of proportional representation (PR) often cite its potential for increasing citizen involvement inpolitics as one of PR’s fundamental advantages over plurality or first-past-the-post systems. The assumptionis that plurality electoral systems distort the translation of votes into seats, discouraging and alienating smallparty supporters and other political minorities. In contrast, PR systems are believed to provide greateropportunities for representation which are assumed to instil greater efficacy and participation. We examinethis theory linking institutions to electoral participation across a diverse set of countries using data from theComparative Study of Electoral Systems. Using a multi-level approach we find evidence consistent with theexpectations about the negative influence of disproportional systems on political minorities. Voters are alsolikely to have stronger partisan preferences in PR systems, which enhances political efficacy and increasesvoter participation. The effects of PR, however, are not all positive; broad coalitions, which are likely to bea feature of these systems, reduce political efficacy.
While the size of the advantage tends to vary, most of the research on electoral systemsand turnout agrees that proportional representation (PR) systems have a turnout advantage.Although any one vote is unlikely to be decisive in an election, electoral systems can alterthe degree to which votes can matter. Votes for minor parties in PR systems are likely tomatter more in determining the overall partisan distribution of seats in a legislature thanin plurality systems where minor parties often find it difficult to translate their votes intoseats. Past research on electoral systems and turnout has assumed that the disproportion-ality between seats and votes in plurality systems instils in voters the feeling that their votedoes not matter, and, as a result, they may be less likely to vote. As such, attitudes towardsthe likely impact of one’s vote are assumed to act as an intervening variable betweenelectoral rules and electoral participation. The extant comparative literature, however, hasrelied almost entirely on aggregate data to examine the influence of electoral systems onvoter turnout and, therefore, has never explicitly measured efficacy, the feeling that one’svote is potentially decisive. With the collection of cross-national election studies under theComparative Study of Electoral Systems (CSES), it is now possible to examine howattitudes are shaped by electoral rules and how these attitudes influence turnout. We firstreview the evidence regarding the relationship between electoral systems, politicalefficacy, strength of partisan attachments and turnout. Based on this past research, we testa model of efficacy and electoral participation that combines electoral system andindividual level effects.
ELECTORAL SYSTEMS AND TURNOUT
Most empirical studies that attempt to measure the impact of institutional arrangementson turnout do so by employing aggregate data across a number of countries with different
* Department of Politics, University of Exeter. The authors would like to thank Sarah Birch and the Journal’sanonymous reviewers for their constructive comments.

2 K A R P A N D B A N D U C C I
electoral systems.1 Although both the model specification and the selection of cases variessignificantly from one study to another, most find that higher turnout is associated withcountries that have proportional representation.2 These studies, however, are notconclusive when it comes to explaining how factors associated with PR facilitate higherturnout. For example, in an analysis of turnout in nineteen democracies over two decades,Jackman finds that proportional systems have a turnout advantage of about 9 percentagepoints over the most disproportional systems.3 However the advantage is offset by theeffects of multipartism, a characteristic of PR systems, which reduces turnout by as muchas 12 percentage points.
In another study, Blais and Carty compare turnout in twenty parliamentary democracieswith varying electoral systems from 1919 to 1985 and find turnout is about 7 per cent higherin PR systems than in plurality systems.4 However, they are unable to explain the reasonfor the difference as none of their measures through which PR is assumed to affect turnout(disproportionality, number of parties and competitiveness) are significant. A more recentstudy by Blais and Dobrzynska supports Jackman’s initial conclusions; both proportion-ality and competitiveness foster higher turnout but the number of parties decreases turnout.They conclude that PR has both positive and negative effects on turnout and the overallimpact is positive with PR countries having 3 per cent higher turnout.5
Because these studies are largely based on aggregate data, questions remain aboutwhose electoral participation is most likely to be affected by electoral arrangements.Without individual level data it is difficult to assess the importance of such individualcharacteristics as party preference and political efficacy and how these factors are relatedto the electoral system. In the following section we address four issues in the extantliterature: (1) the influence of disproportionality, (2) the influence of multipartism, (3) therole of partisan attachments and (4) the impact of the electoral system on politicalminorities.
EFFECTS OF THE ELECTORAL SYSTEM
The literature on electoral systems and turnout has proposed several paths linking efficacyand turnout to the electoral system. First, electoral systems have an influence ondisproportionality of outcomes which can affect efficacy and turnout. Systems that distortthe translation of votes into seats may alienate and discourage small or ‘minor’ party
1 G. Bingham Powell Jr, ‘American Voter Turnout in Comparative Perspective’, American Political ScienceReview, 80 (1986), 17–43; Andre Blais and Agnieszka Dobrzynska, ‘Turnout in Electoral Democracies’, EuropeanJournal of Political Research, 33 (1998), 239–61. One notable exception is Cees van der Eijk and Mark Franklin,who examine the relative importance of institutional and individual level factors on electoral participation inelections to the European Parliament. These elections, however, by the authors’ accounts are ‘second order’elections that are widely perceived as unimportant and consequently ‘fail to function as proper elections’ (Ceesvan der Eijk and Mark Franklin, eds, Choosing Europe? The European Electorate and National Politics in theFace of Union (Ann Arbor: University of Michigan Press, 1996)).
2 Arend Lijphart, Patterns of Democracy: Government Forms and Performance in Thirty-Six Countries(New Haven, Conn.: Yale University Press, 1999), pp. 284–6.
3 Robert Jackman, ‘Political Institutions and Voter Turnout in Industrial Democracies’, American PoliticalScience Review, 81 (1987), 405–23
4 Andre Blais and R. K. Carty, ‘Does Proportional Representation Foster Voter Turnout’, European Journalof Political Research, 18 (1990), 167–81.
5 Blais and Dobrzynska, ‘Turnout in Electoral Democracies’, p. 251.

Political Efficacy and Participation in Twenty-Seven Democracies 3
supporters who are not fairly represented.6 A loss in political efficacy is likely to resultin lower levels of political participation.7 Most of the cross-national studies on turnoutshow that disproportionality reduces turnout and this finding is consistent with theassumption that an unequal translation of votes into seats diminishes some people’s senseof political efficacy leading them to abstain.8 Yet we do not know from these studieswhether and to what extent political efficacy varies across electoral systems. Aside fromefficacy, disproportionality may also influence turnout by shaping the strategies of partiesand their candidates. Parties may campaign more actively when their chances of gainingrepresentation improve.9
Secondly, electoral systems influence the number of political parties and multipartismcan affect efficacy and turnout. Multipartism has been found to have both a negative andpositive effect on turnout.10 Jackman infers that in multiparty systems where coalitiongovernments are the norm, citizens are discouraged from voting when the formation ofgovernment is decided by political elites rather than by election outcomes.11 Therefore,as the number of parties and the likelihood of coalition governments increases, efficacyand the probability of voting will decline. However, election returns from Swisscommunes, where majority and PR electoral systems are used, suggest that part of the boostin turnout gained in PR systems is from the increased number of parties.12 Such a findingis consistent with the expectation that parties increase turnout by mobilizing voters,strengthening partisan attachments and offering greater choice. These differing effects ofmultipartism indicate that a persuasive case can be made for either positive or negativeeffects. On the one hand, multipartism should promote efficacy and stimulate turnout byoffering voters more choice. But, on the other hand, voters may also feel less efficaciouswhen coalitions are the norm and governments are determined by party elites.
Thirdly, multipartism can also positively influence turnout by affecting strength ofpartisan attachments. Multi-party systems are more likely to occur under PR rules and inthese systems there is a greater likelihood that parties will strive to distinguish themselvesideologically.13 If parties fail to offer a clear choice to voters, as they are hypothesized to
6 Shaun Bowler, David Lanoue and Paul Savoie, ‘Electoral Systems, Party Competition, and Strength ofPartisan Attachment: Evidence from Three Countries’, Journal of Politics, 56 (1994), 991–1007; Shaun Bowlerand David Lanoue, ‘Strategic and Protest Voting for Third Parties: The Case of the Canadian NDP’, WesternPolitical Quarterly, 45 (1992), 485–99.
7 Gabriel Almond and Sidney Verba, The Civic Culture: Political Attitudes and Democracy (Princeton,N.J.: Princeton University Press, 1963); Pippa Norris, Electoral Engineering: Voting Rules and Political Behavior(New York: Cambridge University Press, 2004).
8 Blais and Dobrzynska, ‘Turnout in Electoral Democracies’; van der Eijk and Franklin, Choosing Europe?;Mark N. Franklin, ‘Electoral Participation’ in Laurence LeDuc, Richard G. Niemi and Pippa Norris, eds,Comparing Democracies: Elections and Voting in Global Perspective (Thousand Oaks, Calif.: Sage, 1996).
9 Jeffrey A. Karp, Susan A. Banducci and Shaun Bowler, ‘Getting Out the Vote: Party Mobilization in aComparative Perspective’, British Journal of Political Science, 37 (2007), XXX–XXX.
10 Jackman, ‘Political Institutions and Voter Turnout in Industrial Democracies’; Mark Gray and Miki Caul,‘Declining Voter Turnout in Advanced Industrial Democracies, 1950–1997: The Effects of Declining GroupMobilization’, Comparative Political Studies, 33 (2000), 1091–122; Andrea Ladner and Henry Milner, ‘Do VotersTurn Out More under Proportional then Majoritarian Systems? The Evidence from Swiss Communal Elections’,Electoral Studies, 18 (1999), 235–50.
11 Jackman, ‘Political Institutions and Voter Turnout in Industrial Democracies’.12 Ladner and Miller, ‘Do Voters Turn Out More under Proportional then Majoritarian Systems?’.13 Richard S. Katz, A Theory of Parties and Electoral Systems (Baltimore, Md.: Johns Hopkins University
Press, 1980).

4 K A R P A N D B A N D U C C I
do in two-party systems, voters are more likely to abstain.14 The larger number of partiesand a tendency not to converge to the ideological centre in PR systems should increasethe options from which voters can choose and result in fewer abstentions. Moreover, votersare more likely to have strong attachments to parties that cater more specifically to theirneeds, as opposed to catch-all parties that appeal to the median voter. Strength of partisanattachments has been found to be related to the electoral system. In systems that fosterextreme parties, voters develop stronger attachments.15 Past research has also shown thatvoters with strong party attachments are more likely to be interested in politics, have higherlevels of efficacy and are more likely to vote.16
Finally, there is little discussion of which voters will be advantaged or disadvantagedby the electoral arrangements; there may be a differential impact both in terms of efficacyand participation. For example, large-party supporters under plurality rules are nothypothesized to be discouraged from voting by the electoral system. However, it is difficultto distinguish between large-party and small-party supporters in the absence of individualdata. Anderson and Guillory suggest that status as a political minority is an importantvariable when examining the influence of political institutions and satisfaction withdemocracy.17 Those supporting parties that were not in government were more likely tobe satisfied with democracy in consensual systems that aim to restrain majority rule byrequiring or encouraging the sharing of power between the majority and the minority.18
In contrast, in majoritarian systems, where power is concentrated in the hands of themajority, persons who recall voting for the losing party were more dissatisfied. Theimplementation of PR in New Zealand after a history of plurality elections also providesevidence that those supporting small parties were more likely to increase in efficacy andparticipation after the transition to a proportional system.19
DIRECT AND INDIRECT EFFECTS ON VOTER PARTICIPATION
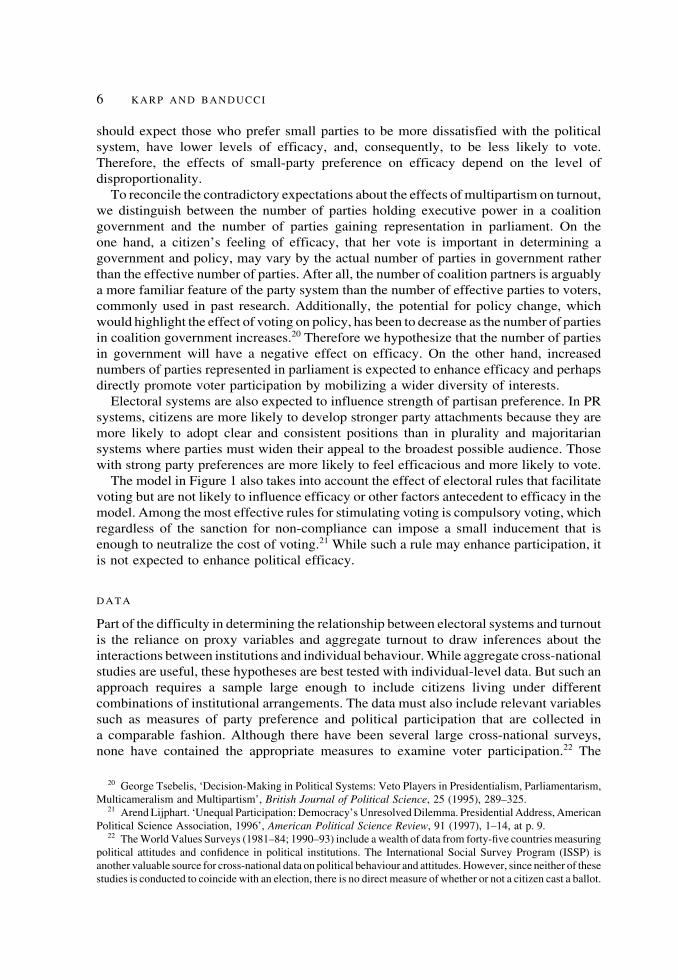
Figure 1 illustrates the expected relationships between electoral systems, efficacy andturnout that we can draw from the discussion above. The figure illustrates that a numberof factors associated with the electoral system directly affect participation and indirectlyaffect participation through efficacy. The direct and indirect effects of disproportionalityare central to the model. We expect that disproportionality reduces both efficacy andturnout and conditions the relationship between minor-party preferences and efficacy.When institutional rules make it more difficult for small parties to gain representation, we
14 Anthony Downs, An Economic Theory of Democracy (New York: Harper and Row, 1957).15 Bowler, Lanoue and Savoie, ‘Electoral Systems, Party Competition, and Strength of Partisan Attachment’.16 Angus Campbell, Phillip E. Converse, Warren E. Miller and Donald E. Stokes, The American Voter (New
York: Wiley & Sons, 1960); Sidney Verba, Norman H. Nie and Jae-On Kim, Participation and Political Equality:A Seven-Nation Comparison (Cambridge: Cambridge University Press, 1978).
17 Christopher J. Anderson and Christine A. Guillory, ‘Political Institutions and Satisfaction with Democracy:A Cross-National Analysis of Consensus and Majoritarian Systems’, American Political Science Review,91 (1997), 66–81.
18 Arend Lijphart. Democracies (New Haven, Conn.: Yale University Press, 1984).19 Susan A. Banducci, Todd Donovan and Jeffrey A. Karp, ‘Proportional Representation and Attitudes about
Politics: Evidence from New Zealand’, Electoral Studies, 18 (1999), 533–55; Jack Vowles, Peter Aimer, SusanBanducci and Jeffrey Karp, eds, Voter’s Victory? New Zealand’s First Election Under ProportionalRepresentation (Auckland: Auckland University Press, 1998); Jeffrey A. Karp and Susan A. Banducci, ‘TheImpact of Proportional Representation on Turnout: Evidence from New Zealand’, Australian Journal of PoliticalScience, 34 (1999), 363–77.

Political Efficacy and Participation in Twenty-Seven Democracies 5
Fig
.1.
Sche
mat
icre
pres
enta
tion
ofel
ecto
ral
syst
emef
fect
son
effic
acy
and
part
icip
atio
n
Not
e:D
ashe
dlin
ein
dica
tes
that
the
rela
tions
hip
depe
nds
onth
eel
ecto
ral
syst
em,
the
type
ofru
les
ordi
spro
port
iona
lity
(in
the
case
ofsm
all-
part
ypr
efer
ence
)
6 K A R P A N D B A N D U C C I
should expect those who prefer small parties to be more dissatisfied with the politicalsystem, have lower levels of efficacy, and, consequently, to be less likely to vote.Therefore, the effects of small-party preference on efficacy depend on the level ofdisproportionality.
To reconcile the contradictory expectations about the effects of multipartism on turnout,we distinguish between the number of parties holding executive power in a coalitiongovernment and the number of parties gaining representation in parliament. On theone hand, a citizen’s feeling of efficacy, that her vote is important in determining agovernment and policy, may vary by the actual number of parties in government ratherthan the effective number of parties. After all, the number of coalition partners is arguablya more familiar feature of the party system than the number of effective parties to voters,commonly used in past research. Additionally, the potential for policy change, whichwould highlight the effect of voting on policy, has been to decrease as the number of partiesin coalition government increases.20 Therefore we hypothesize that the number of partiesin government will have a negative effect on efficacy. On the other hand, increasednumbers of parties represented in parliament is expected to enhance efficacy and perhapsdirectly promote voter participation by mobilizing a wider diversity of interests.
Electoral systems are also expected to influence strength of partisan preference. In PRsystems, citizens are more likely to develop stronger party attachments because they aremore likely to adopt clear and consistent positions than in plurality and majoritariansystems where parties must widen their appeal to the broadest possible audience. Thosewith strong party preferences are more likely to feel efficacious and more likely to vote.
The model in Figure 1 also takes into account the effect of electoral rules that facilitatevoting but are not likely to influence efficacy or other factors antecedent to efficacy in themodel. Among the most effective rules for stimulating voting is compulsory voting, whichregardless of the sanction for non-compliance can impose a small inducement that isenough to neutralize the cost of voting.21 While such a rule may enhance participation, itis not expected to enhance political efficacy.
DATA
Part of the difficulty in determining the relationship between electoral systems and turnoutis the reliance on proxy variables and aggregate turnout to draw inferences about theinteractions between institutions and individual behaviour. While aggregate cross-nationalstudies are useful, these hypotheses are best tested with individual-level data. But such anapproach requires a sample large enough to include citizens living under differentcombinations of institutional arrangements. The data must also include relevant variablessuch as measures of party preference and political participation that are collected ina comparable fashion. Although there have been several large cross-national surveys,none have contained the appropriate measures to examine voter participation.22 The
20 George Tsebelis, ‘Decision-Making in Political Systems: Veto Players in Presidentialism, Parliamentarism,Multicameralism and Multipartism’, British Journal of Political Science, 25 (1995), 289–325.
21 Arend Lijphart. ‘Unequal Participation: Democracy’s Unresolved Dilemma. Presidential Address, AmericanPolitical Science Association, 1996’, American Political Science Review, 91 (1997), 1–14, at p. 9.
22 The World Values Surveys (1981–84; 1990–93) include a wealth of data from forty-five countries measuringpolitical attitudes and confidence in political institutions. The International Social Survey Program (ISSP) isanother valuable source for cross-national data on political behaviour and attitudes. However, since neither of thesestudies is conducted to coincide with an election, there is no direct measure of whether or not a citizen cast a ballot.

Political Efficacy and Participation in Twenty-Seven Democracies 7
Comparative Study of Electoral Systems (CSES) overcomes these limitations by relyingon indigenous teams of researchers to administer a common module of questions eitherbefore or directly after a national election.23 We rely on data primarily from Module 1(1996–2001) and supplement available data from other countries participating only inModule 2 (2001–06) to maximize the total number of countries that could be included foranalysis.24 Our sample of countries along with their electoral systems are listed inAppendix Table A1. These unique data allow one to examine how institutions constrainindividual behaviour in ways not previously possible. The diverse sample of countriesavailable in the CSES also offers an advantage over other studies that often rely on datafrom advanced industrial states. Not only is there greater variation in context but individuallevel factors such as socio-economic status will have a greater range of values.25
The sample of countries can be divided into three general types of electoral systems:proportional representation, plurality or majoritarian, and mixed systems that combineplurality with PR in one chamber.26 Eighteen of the twenty-seven countries in our sampleuse PR to determine the overall partisan composition of the lower house. Among thesesystems, the diversity in electoral arrangements results in substantial variation in the degreeto which translation of votes into seats results in proportionality. Among the factorsaccounting for differences is district magnitude which can have a strong impact onproportionality, with larger districts being associated with greater proportionality.27 Twoof the countries, the Netherlands and Israel, have a single national district electing 150 and120 members, respectively. Germany, New Zealand and Mexico also have a mixedmember proportional (MMP) system, where about half of the members in parliament areselected by closed party lists to correct partisan imbalances resulting from the election ofelectorate candidates by plurality rules. Japan, Hungary, Russia, South Korea and Ukrainehave non-corrective mixed systems, where some candidates are elected in single-memberdistricts by either majority (as in the case in Hungary) or plurality (as in the case of Japan)
23 CSES Secretariat, ‘The Comparative Study of Electoral Systems Final Report of the 1995–96 PlanningCommittee’ (Center for Political Studies: Ann Arbor: University of Michigan, 1996), � http://www.umich.edu/� nes/cses/final report.html �
24 The Comparative Study of Electoral Systems � www.cses.org � . CSES Module 1 Full Release (dataset).(Ann Arbor: University of Michigan, Center for Political Studies, 2003). This analysis relies on the 4 August 2003‘full release’ of Module 1 (1996–2001). To increase the number of countries, data from the 29 June 2005 versionof Module 2 (2001–06) have also been added. These countries include Belgium, Finland and Ireland. Countriesholding only presidential elections have been excluded. Other countries that were included in this release havebeen excluded because of missing values or incomplete information. For further information about the CSES see:� http://www.umich.edu/ � nes/cses/cses.htm � .
25 Neil Nevitte, Andre Blais, Elisabeth Gidengil and Richard Nadeau, ‘Socio-economic Status and Non-Voting:A Cross National Comparative Analysis’ (paper presented at the 18th World Congress of the International PoliticalScience Association, Quebec, 2000).
26 At first glance, the CSES may appear to under-represent the number of plurality countries. The sampleincludes Canada, the United Kingdom and the United States. There are, however, few other plurality countrieswith established national election studies that could have been included (i.e. India). Similarly, according to Farrell’sclassification there are only three countries (Australia, France and Mali) with a majoritarian system. See DavidM. Farrell, Electoral Systems: A Comparative Introduction (New York: Palgrave, 2001), at p. 8. Given the smallsample, we consider plurality and majority systems together since these systems represent one form of democracythat produce essentially the same electoral trends while PR systems represent another. See Farrell, ElectoralSystems, at p. 63; Lijphart, Patterns of Democracy and G. Bingham Powell Jr, Elections as Instruments ofDemocracy: Majoritarian and Proportional Visions (New Haven, Conn.: Yale University Press, 2000).
27 Richard S. Katz, Democracy and Elections (New York: Oxford University Press, 1997), p. 134.

8 K A R P A N D B A N D U C C I
rules, while others in the same chamber are elected by PR. The difference is that the PRcomponent is not used as a corrective.28
Some countries also employ thresholds; higher thresholds are designed to keep thesmallest parties out of parliament and affect the proportionality of seats to votes. In somecases, the threshold varies depending on whether a single party is standing alone or togetherwith other parties (as is the case in the Czech Republic and Poland). In other cases, thethreshold is both local and national, as is the case in Germany and New Zealand, whereparties can enter parliament by either winning a constituency seat or by winning more than5 per cent of the party vote.
Among the PR systems, Poland, Slovenia, the Czech Republic and Spain produce themost disproportional outcomes. These countries have either higher thresholds or smalldistrict magnitudes. The small district magnitude in Spain has repeatedly allowedthe winning party to get a majority of seats with a plurality of votes.29 Australia uses thealternative vote for the lower house to achieve a majority. Instead of casting a single votefor a candidate, voters rank their preferences. If no candidate receives a majority, thecandidate who receives the smallest number of first preferences is eliminated andthe second preferences are then transferred to the other candidates until one candidatereceives a majority. In the 1996 election, the system produced more disproportional resultsthan any of the countries with mixed or PR systems but was somewhat more proportionalthan Britain or Canada.
METHODS AND MEASUREMENT
Our schematic representation in Figure 1 hinges on the role of efficacy as an interveningvariable between the electoral system and the decision to vote. Therefore, measuringwhether or not voters feel their vote makes a difference is important to the overall model.Since the introduction in the cross-national work on political culture and participation, themeasurement of political efficacy has been the subject of debate.30 Internal efficacy refersto an ‘individual’s self-perceptions that they are capable of understanding politics andcompetent enough to participate in a political act such as voting’.31 In contrast, externalefficacy refers to ‘expressed beliefs about political institutions’ and the belief that leadersand institutions are responsive to the participation of individuals.32 If we intend to assessthe extent of the psychological effect or how features of the electoral system affect efficacy,
28 Hungary also has a mixed system where 176 members are elected by majority in single-member districtsand 152 members are elected by PR. An additional fifty-eight national seats are used to correct some of thedistortions that remain (see Andre Blais and Louis Massicotte, ‘Electoral Systems’ in Laurence LeDuc, RichardG. Niemi, and Pippa Norris, eds, Comparing Democracies: Elections and Voting in Global Perspective (ThousandOaks, CA: Sage, 1996), p. 66). Since it is not entirely corrective, we classify it as a mixed system.
29 Blais and Massicote, ‘Electoral Systems’, p. 57; Richard Gunther, ‘Electoral Laws, Party Systems, and Elites:The Case of Spain’, American Political Science Review, 83 (1989), 835–59. Disproportionality in Spain can alsobe attributed to malapportionment. See Arend Lijphart, Electoral Systems and Party Systems: A Study ofTwenty-Seven Democracies, 1945–1990 (Oxford: Oxford University Press, 1994), at p. 126–8.
30 Almond and Verba, The Civic Culture.31 Warren E. Miller, Arthur H. Miller and Edward J. Schneider, American National Election Studies Data
Sourcebook, 1952–1978 (Cambridge, Mass.: Harvard University Press, 1980); Richard G. Niemi, Stephen C. Craigand Franco Mattei. ‘Measuring Internal Political Efficacy in the 1988 National Election Study’, American PoliticalScience Review, 85 (1991), 1407–13; Stephen C. Craig, ‘Political Efficacy and Trust: A Report on the NES PilotStudy Items’, Political Behavior, 12 (1990), 289–314.
32 Miller, Miller and Schneider, American National Election Studies Data Sourcebook, 1952–1978.

Political Efficacy and Participation in Twenty-Seven Democracies 9
we are then interested in how the translation of seats to votes and elections affect the aspectsof efficacy that are related to parties and elections.
Of the CSES items, the question that measures this aspect of efficacy asks respondentsto place themselves on the following scale: ‘Some people say that no matter who peoplevote for, it won’t make any difference to what happens. Others say that who people votefor can make a difference to what happens.’ The variable ranges from 1 to 5 with positivevalues indicating higher levels of efficacy.33 This question is the most direct measure ofevaluations of the efficacy of a vote available and, thus, how the electoral system translatesvotes into seats. In terms of face validity, this question asks respondents to evaluate themeaningfulness of voting, a component of elections as an accountability mechanism, and,therefore, should be the most direct measure of the feelings of efficacy that can be attributedto the act of voting.34
To measure party preference, we rely on a series of items that measure evaluations ofup to six parties employing a ten-point scale ranging from ‘Strongly like’ to ‘Stronglydislike’. Using this series of party evaluations, the preferred party can be identified as theparty that is most positively evaluated by the respondent. The CSES also asks respondentswhether they think of themselves as being close to any political party and if so to identifythat party (additional parties are coded only if the respondent volunteers). This measureis analogous to the traditional party identification measure associated with the Universityof Michigan electoral school.35 The problem with this measure is that a majority ofrespondents in the sample claim not to be close to any party.36 In comparison, 74 per centof the sample evaluate one party more highly than another. About 22 per cent of the sampleevaluated more than one party equally, while just 4 per cent said that they were unawareor did not know about any of the parties. Therefore, we rely on the party preference measurefor the analysis and report instances where the results would differ if the party closenessmeasure were used instead.
An indicator of how much someone favours a party can be obtained by taking the valuegiven on the likes and dislikes scale that ranges from 0 to 10. We refer to this as strengthof party preference though it should be noted that this is not the same thing as the traditionalparty identification measure. High values indicate a strong preference for a party (orparties) while lower values indicate a weaker preference. Less than 1 per cent of the samplewho evaluated at least one party failed to rank a single party above 0. If the preference
33 About 3 per cent of the total cases are missing, of which less than half are coded as ‘don’t know’. Thesemissing cases are not evenly distributed across countries. Some of these missing values correspond to missingvalues on other variables suggesting that the problem is not unique to this variable. Since we cannot be sure whythese cases are missing, they have been dropped from the analysis.
34 Empirical evidence also supports this view. We compared the CSES measure with other measures of efficacyavailable in four national election studies. The findings are consistent with Acock, Clarke and Stewart who findthat a two-factor solution to the efficacy indicators fits across a number of countries. See Alan Acock, Harold D.Clarke and Marianne C. Stewart, ‘A New Model for Old Measures: A Covariance Structure Analysis of PoliticalEfficacy’, Journal of Politics, 47 (1985), 1062–84. In all four election studies, the CSES item loaded most stronglywith the other items measuring external efficacy. Therefore, there is clear evidence that the CSES item measuresan aspect of external efficacy. These results can be obtained at � http://www.jkarp.com/bjps/ � .
35 Samuel H. Barnes, M. Kent Jennings, Ronald Inglehart and Barbara Farah, ‘Party Identification and PartyCloseness in Comparative Perspective’, Political Behavior,10 (1988), 215–31.
36 Specifically 43 per cent of the sample responded that they were close to a political party and 5 per cent refusedto answer the question. Moreover, fewer people feel close to small parties. For example, in the United States, onlyten respondents consider feel close to the Reform party while eighty-six respondents express a preference for thatparty over the Republican and Democratic parties.

10 K A R P A N D B A N D U C C I
is for one of the two largest parties, the respondent is identified as having a preference fora large party. Generally, parties that receive at least 20 per cent of the vote are classifiedas large parties. For example, in Germany, the Christian Democratic Union (CDU) andthe Social Democratic Party of Germany (SPD) are classified as large parties, receiving41 and 28 per cent of the vote in 1998 respectively. In most countries, this classificationscheme produces two large parties but in some countries, such as Canada, Norway andUkraine, only one party received at least 20 per cent of the vote. All others are coded assmall parties.
One of the frequently cited limitations with using survey data involves the validity ofthe responses, particularly with regard to political participation. It is not uncommon inelection studies to find that the proportion of respondents who report voting is far greaterthan the aggregation of election returns. One of the theories commonly advanced to explainthis discrepancy is that non-voters are motivated to give a socially desirable response.Voter validation studies in the United States have confirmed that a bias towardsover-reporting exists where the overwhelming majority of error occurs among non-voterswho claim to have voted, rather than vice versa.37 According to voter validation studiesin the United States, about 15–30 per cent falsely claim to have voted compared to lessthan 5 per cent of voters who falsely deny having voted.38 Similar results have been foundelsewhere.39 It has been assumed that the social desirability bias is a general human traitthat affects everyone equally but recent research suggests that respondents are also likelyto be influenced by the electoral context.40 Nevertheless, since mis-reporting occursprimarily among non-voters, the overall bias between reported and actual turnout in anygiven country will depend on the proportion of non-voters. The CSES advisedcollaborators to ask the question in a way that minimized over-reporting.41 For the purposesof our analysis, non-responses to this question were assumed to be non-voters.Unfortunately, it is not possible to estimate the degree of over-reporting in the CSES asonly a handful of election studies are able to independently verify whether a respondentcast a ballot. Therefore, we have weighted the data by the actual turnout on the basis ofthe age-eligible population to correct for these differences, so that non-voters, who areunder-represented in the surveys, are given more weight. We have also weighted the datato correct for unequal sample sizes across countries.
37 Brian D. Silver, Barbara A. Anderson and Paul R. Abramson, ‘Who Overreports Voting?’ American PoliticalScience Review, 80 (1986), 613–24; Michael W. Traugott and John P Katosh, ‘Response Validity in Surveys ofVoting Behavior’, Public Opinion Quarterly, 43 (1979), 359–77.
38 Aage R. Clausen, ‘Response Validity: Vote Report’, Public Opinion Quarterly, 32 (1968), 588–606; Traugottand Katosh, ‘Response Validity in Surveys of Voting Behavior’; Silver, Anderson and Abramson, ‘WhoOverreports Voting?’
39 Kevin Swaddle and Anthony Heath. ‘Official and Reported Turnout in the British General Election of 1987’,British Journal of Political Science, 19 (1989), 537–70; Donald Granberg and Soren Holmberg, ‘Self-ReportedTurnout and Voter Validation’, American Journal of Political Science, 35 (1991), 448–59; Karp and Banducci,‘The Impact of Proportional Representation on Turnout’.
40 Andre Blais, To Vote or Not to Vote: The Merits and Limits of Rational Choice Theory (Pittsburgh: Universityof Pittsburgh Press, 2000), p. 176; Henry E. Brady, Sydney Verba and Kay Lehman Schlozman, ‘Beyond SES:A Resource Model of Political Participation’, American Political Science Review, 89 (1995), 271–95, p. 292;Jeffrey A. Karp and David Brockington, ‘Social Desirability and Response Validity: A Comparative Analysis ofOver-reporting Voter Turnout in Five Countries’ Journal of Politics, 67 (2005), 825–40.
41 For example the British Election Study asked, ‘Talking to people about the general election, we have foundthat a lot of people didn’t manage to vote. How about you – did you manage to vote in the general election?’Similarly in Switzerland the question was asked, ‘On average, about half of the electorate casts a ballot at federalelections. How about you? Did you cast a ballot at the federal elections on October 24?’

Political Efficacy and Participation in Twenty-Seven Democracies 11
PARTISAN DIFFERENCES IN EFFICACY AND TURNOUT BY ELECTORAL SYSTEM
Figure 1 shows that the electoral system should influence both efficacy and the natureof partisan preferences, so we first examine these differences across the three types ofelectoral systems in Table 1. Not surprisingly, in plurality and majoritarian systems morepeople prefer large parties than in PR or mixed systems. About a third of the electorateexpresses a preference for small parties in PR compared to about a fifth in plurality ormajoritarian systems. Excluding Canada, just 12 percent express a preference for smallparties in the remaining plurality systems and Australia. Mixed systems have the highestproportion without a single preference suggesting that these systems might encouragemultiple party attachments. These systems also have the highest proportion who do notexpress a preference for any of the parties. As is evident from Table 1, citizens in PRsystems have the strongest preferences, while those in plurality systems have the weakest.Specifically, about 30 per cent strongly preferred a party in plurality systems comparedto 39 per cent in PR systems.42 Together these findings are consistent with expectationsthat PR systems increase the options for which voters can choose which helps to fosterstronger attachments to political parties.
Table 2 reports the influence of party preference on efficacy and turnout by electoralsystem. Despite the cultural differences between PR countries, they have far higher levelsof efficacy than those found in plurality systems. Canada has the lowest levels of efficacyof any country in the sample, with just 14 per cent placing themselves in the top categoryof efficacy. Moreover the differences in efficacy between those who prefer large and smallparties are substantial in plurality systems and virtually negligible the mixed systems.Those who prefer large parties in PR systems are also more likely than those preferringsmall parties to feel efficacious though the difference is not as great. A closer examinationof these differences within plurality and majority countries (not reported in the table)indicates that the difference is largest in the United States and smallest in Canada.
TABLE 1 Distribution of Party Preferences by Electoral System
Most preferred party
Large Small No single Strongly Don’tparty party preference like know n
PR 40.2 29.8 26.0 38.5 4.0 22,575Mixed (non-corrective) 38.8 21.9 34.1 37.8 5.2 6,215Plurality/Majority 54.9 21.0 21.9 29.9 2.2 5,009Total 42.1 27.0 26.9 37.1 3.9 33,799
Note: Data are weighted to adjust for unequal sample size and over-reported vote. Eachcountry’s sample is approximately 1250. ‘No single preference’ indicates those who gave thesame score for two or more parties. ‘Don’t know’ indicates those who responded ‘Don’t know’on all party rankings.
42 The proportion claiming to be close to a party is slightly higher in plurality systems than in PR systems.However, the proportion who are very close to a party is the same across systems (see � http://www.jkarp.com/bjps/ � ). Given the strong theoretical expectations that attachments to parties varies across electoral systems andthe lack of variance in party proximity measures suggests that our alternative measure (which does vary acrosssystems) is more appropriate.

12 K A R P A N D B A N D U C C I
TABLE 2 Political Efficacy and Participation by Electoral System and PartyPreference
Most preferred party
DifferenceLarge Small No single Strongly (Large �party party preference like Small) Total
Efficacy*PR 48.3 40.0 38.4 55.3 8.4 42.8Mixed (non-corrective) 39.3 38.8 34.9 49.7 0.5 36.8Plurality/Majority 35.8 20.8 27.6 47.1 15.0 30.7Total 46.8 25.5 24.4 53.3 21.4 39.9
Reported TurnoutPR 77.7 76.5 67.2 82.1 1.2 72.9Mixed (non-corrective) 68.0 66.5 57.0 74.2 1.4 61.5Plurality/Majority 71.8 67.7 62.0 83.0 4.2 68.1Total 74.9 74.0 64.2 80.7 0.9 70.1
*Figures indicate percentage who are in the highest category of efficacy. Data are weighted(as above).
Nevertheless, those who prefer small parties in each of the plurality and majority countriesfeel less efficacious than those who prefer large parties, which provides support for ourinitial hypothesis that these types of systems discourage those who prefer small parties.Similar results are found when using the party closeness measure.43 The gap betweenlarge-party and small-party identifiers is twice as great in plurality systems when comparedto PR systems.
Lower levels of efficacy are also evident among those not having a single partypreference. Those who are neither strongly like nor strongly dislike parties are lessefficacious than those who strongly like parties. Similarly those who do not considerthemselves to be close to a party are less likely to be efficacious than those who considerthemselves to be very close. Of course it is possible that the causal arrow may be reversedand that the differences observed here simply indicate that the least efficacious citizensare likely to care less about parties than the most efficacious. If this were true one shouldexpect those with low levels of efficacy to dislike all parties. But this is not the case. Theaverage ranking of parties is only weakly correlated with efficacy (r � 0.09) while thesingle highest ranking is strongly correlated with efficacy (r � 0.47). This indicates thatcitizens who strongly like a particular party are likely to have higher levels of efficacy andthey are also likely to hold quite different views about other parties. In short, positiveevaluations of parties in general are not related to efficacy but evaluations of specificparties are. This relationship suggests that it is much more likely that strong attachmentsmake voters feel more efficacious rather than efficacy making voters more positive aboutparties in general.
The bottom section of Table 2 reports voter participation by electoral system and partypreference. The differences in participation between plurality and PR systems match those
43 These results can be obtained at � http://www.jkarp.com/bjps/ � .

Political Efficacy and Participation in Twenty-Seven Democracies 13
found by others. In our sample, the PR systems on average have about 5 per cent higherturnout than in the plurality and majoritarian systems. The difference increases whenAustralia, which has compulsory voting, is excluded. These findings approximate thoseof Blais and Carty who found a 7 per cent difference comparing twenty parliamentarydemocracies over a sixty-year period.44 The results show that those who prefer small partiesin all systems but PR are, on average, less likely to participate than large party supporters.Those with no single preference are also less likely to participate than those with large partypreference. Larger differences are evident among those who did express a preference forany party suggesting that lacking a party preference has a large influence on turnout.
INDIVIDUAL AND SYSTEMIC DETERMINANTS OF EFFICACY AND TURNOUT
Our initial examination of the data suggests some support for our hypotheses. In particular,the findings demonstrate that electoral systems can influence party preferences and shapeattitudes about efficacy. We now turn to a multivariate analysis to investigate this issuefurther. To estimate the psychological effect, a measure of the disproportionality of thesystem is included in the model.45 Since disproportionality is likely to disadvantage smallparties, we include an interaction term between small-party preference and disproportion-ality. Other dummy variables are used to identify the nature of party preferences leavingthose who prefer large parties in the referent category. We also include strength of partypreference (as discussed above), which should be positively associated with both efficacyand turnout. Those who do not express a party preference are coded 0 on this scale whilethose with the strongest preferences are coded 10.46 We expect those who are older as wellas those with higher levels of education to feel more efficacious and be more likely to vote.To ease the interpretation of the coefficient, education, which has eight categories, has beenstandardized to range from low education (0) to high education (1). Age and gender arealso used in the model as controls.
Along with disproportionality, several other contextual variables are included to testhypotheses discussed earlier. The number of parties gaining over 2 per cent of the seatsin parliament is used to measure diversity in representation. To measure the effects ofcoalition government, we use the number of parties represented in government prior to theelection.47 Although increased representation of parties in parliament may lead to broadercoalition governments, the two measures are not highly correlated (r � 0.35). There is alsoa reason to believe that where the outcome is expected to be close citizens may feel moreefficacious and be more likely to participate.48 To take this into account, we control forthe closeness of the election by including a measure of the difference between the two top
44 Blais and Carty, ‘Does Proportional Representation Foster Voter Turnout.’45 The measure is derived from Gallagher’s least squares index and is based on the election when the survey
was conducted. See Michael Gallagher. ‘Proportionality, Disproportionality and Electoral Systems’, ElectoralStudies, 10 (1991), 33–51.
46 The models were estimated with and without ‘No preference’ (which account for less than 5 per cent of thesample) to determine whether this influenced the effects for strength of preference. The effects remained the same.
47 Franklin uses the size of the largest party to measure the decisiveness of elections. While this measure maybe correlated with the size of a government coalition it is not necessarily the same. See Mark N. Franklin, VoterTurnout and the Dynamics of Electoral Competition in Established Democracies Since 1945 (New York:Cambridge University Press, 2004).
48 Franklin, Voter Turnout and the Dynamics of Electoral Competition in Established Democracies Since 1945.

14 K A R P A N D B A N D U C C I
vote Winners at the national level.49 Because the sample includes countries in variousstages of democratic development, a dummy variable is used to identify the eight newdemocracies in the sample (see Appendix Table A1 for coding). Australia, Belgium,Mexico and one canton in Switzerland have compulsory voting, though these countriesdiffer in how the law is enforced. Since this is one electoral rule that is intended to increasethe likelihood of voting, but is not designed to influence efficacy, we include a dummyvariable in the turnout model as a control.
Our method of estimating the effects of institutional and individual level factors onefficacy and participation must take into account two features of the data. First, thevariables in which we are interested are measured at two different levels – the individuallevel (unweighted n � 45,268) and the country level (n � 27). In our model, we alsosuggest that there is cross-level interaction between small-party preference (an attributemeasured at the individual level) and disproportionality (an attribute measured at thecountry level). Secondly, and not unrelated to the first, the CSES dataset is comprised bypooling cross-sectional election studies from individual countries. Therefore, respondentsare sampled from different clusters (countries). If individuals living within each countryshare common characteristics on unmeasured variables, as they are likely to do, theassumption that the error variance will be independent across countries is violated. Becausethe data are multi-level and sampled from within units, most conventional methods ofestimation will underestimate standard errors, particularly at the second or macro level,leading to a higher probability of rejection of a null hypothesis. Therefore, we rely onestimation techniques that are specific to modelling multilevel data structures.50 In ouranalysis, this estimation method does not significantly affect coefficients but it doesestimate more consistent standard errors, particularly at the macro-level, when some of theassumptions about variance are violated.51
RESULTS
All models reported were estimated using MLwiN (version 2.02). The results of the modelpredicting the highest level of vote efficacy are reported in Table 3.52 To facilitate theinterpretation of the logit coefficients we also report the unlogged coefficient whichrepresents how much the odds of having the highest level of efficacy are increased by aone-unit change in the independent variable. In response to the hypotheses set out earlier,there are three important points that should be noted. First, citizens who prefer small partiesare less likely to feel efficacious than citizens who prefer large parties. The negativeinteraction term between small-party preference and disproportionality indicates that theseeffects increase as the system becomes more disproportional.
49 It was not possible to apply the measure below the national level in all districted systems because of missingdata in a number of countries.
50 Marco R. Steenbergen and Bradford Jones, ‘Modeling Multilevel Data Structures’, American Journal ofPolitical Science, 46 (2002), 218–37; Stephen W. Raudenbush and Anthony S. Bryk, Hierarchical Linear Models:Applications and Data Analysis Methods (Thousand Oaks, Calif.: Sage, 2002).
51 Estimations based on treating the data as structured by a single level of measurement and adjusting forstandard errors for clustering at the country level are available from the authors. When comparing estimates fromtraditional logit models to multilevel logit models, the largest differences occur in the estimation of standard errorsfor factors measured at the country level.
52 We report the results of a binary logit model predicting only the highest level of efficacy. In other analyses(available from the authors), we estimated an ordered logit model. The results are essentially the same althoughthe coefficients are obviously altered.

Political Efficacy and Participation in Twenty-Seven Democracies 15
TABLE 3 Multi-level Model of Efficacy: Logit Estimates
Robust OddsCoef. s.e. ratio†
Level 1 VariablesSmall party preferred � 0.11* (0.05) 0.90No single party � 0.08** (0.04) 0.93Strength of preference 0.15** (0.02) 1.17Age (in 10s) 0.07** (0.01) 1.07Education 0.21** (0.09) 1.23Female 0.01 (0.02) 1.01
Level 2 VariablesParties in parliament � 0.04 (0.06) 0.96Parties in government � 0.40** (0.14) 0.67New democracies 0.01 (0.21) 1.01Disproportionality � 0.08** (0.03) 0.93Competitiveness 0.02 (0.02) 1.02
Cross-level InteractionDisproportionality � small party preferred � 0.02** (0.01) 0.98
Constant � 0.46 (0.55)
Random Effects Level 2Intercept 0.70** (0.23)Strength of Preference 0.003** (0.00) 1.00Total Variance (individual level variables only) 0.70Total Variance (full model) 0.61Chi-square fixed effects 315.49 (14df)Chi-square random effects 10.86 (2df)Number of level one units 33,595Number of level two units 27
**p � 0.01; *p � 0.05†Odds ratio is the unlogged coefficient which represents the odds that a citizen increases tothe highest level of efficacy given a one unit change in the independent variable.
Secondly, strength of party preference has the strongest impact of any of the variablesin the model. Moving from the weakest party preference to the strongest increases the oddsof having the highest level of efficacy by over four times.53 These effects are consistentlystrong in every country when the models are estimated separately and the effect variessignificantly within countries. We have taken this into account by allowing for randomeffects of strength of party preference at the country level.54
Third, the number of parties represented in government has a negative impact onefficacy. This finding is consistent with the expectation that voters will feel they have lessinfluence when there are broad coalitions. This result provides the most direct evidencethat voters are sensitive to the decisiveness of elections and helps to explain why broad
53 The odds ratio for a ten unit change in strength of party preference is 4.48.54 Including the random effects for strength of party preference also has the effect of increasing the variance
of the intercept. Therefore, the variance component reported in the above paragraph calculated without the randomeffects included for strength of preferemce differs from that reported in Table 3.

16 K A R P A N D B A N D U C C I
coalitions may depress low voter turnout. While broad based coalitions depress efficacy,the number of parties in parliament appears to have no effect at all.55 Other factorsstrongly influencing efficacy are age and the level of formal education. Numerous studieshave demonstrated that the well educated are likely to have a strong sense of politicalefficacy.56 Age is also known to influence efficacy though some studies have failed to finda significant relationship.57
We now turn to an examination of the relationship between efficacy and voterparticipation.58 Because efficacy is assumed to be a link between the electoral system andvoter participation, one of our main interests is how contextual factors moderate therelationship between efficacy and voter participation. Figure 2 is used to illustrate howthe influence of efficacy on the probability of voting varies across the twenty-sevencountries in our sample, and how these effects change with the addition of macro-levelvariables. The top of Figure 2 shows the effect of efficacy on voting in each of thetwenty-seven countries in the sample. The dark line represents the population averagedslope while the lighter lines indicate the slope in each country. These probabilities are basedon estimating an individual-level model only with random effects for the intercept and forefficacy. The variation in the intercept (along the y-axis) for each slope indicates significantvariation across countries in the probability of voting and the differences in the slopeindicate that the strength of the effect of efficacy varies across countries, though the effectis always positive. The bottom of Figure 2 shows the random effects of efficacy once themacro-level variables have been added to the model. The addition of the macro-levelvariable reduces the variation in the intercepts between the countries as well as reducingthe variation in the slope of efficacy for the individual countries. The figures illustrate that,while efficacy has an impact on voting, contextual factors play a role in moderating theseeffects.
The coefficient estimates for the full model predicting the likelihood of voting arepresented in Table 4. Strength of partisan preference also has a large influence on theprobability of voting independent of efficacy; those with the strongest preference are eighttimes more likely to vote than those with no preference at all.59 These results provide abetter understanding for how PR systems influence turnout; they do so in part by fosteringstronger party preferences (see Table 1). Although not included in the reported analysis,
55 The number of parties in parliament and disproportionality are correlated ( � 0.54). When disproportionalityis not included in the model, the number of parties has a stronger influence. Several transformations of thesevariables were tested. In the end, the linear function performed the best.
56 Bernadette C. Hayes and Clive S. Bean, ‘Political Efficacy: A Comparative Study of the United States, WestGermany, Great Britain and Australia’, European Journal of Political Research, 23 (1993), 261–80.
57 Almond and Verba, The Civic Culture; Cliff Zukin, Scott Keeter, Molly Andolina, Krista Jenkins and MichaelX. Delli Carpini, A New Engagement? Political Participation, Civic Life, and the Changing American Citizen(Oxford: Oxford University Press, 2006), at pp. 118–19.
58 It is possible that the relationship between efficacy and participation is reciprocal. That is, once citizens haveparticipated, their level of efficacy will increase. Unfortunately, our reliance on cross-sectional data makes it almostimpossible to test this hypothesis. See Steven E. Finkel, ‘Reciprocal Effects of Participation on Political Efficacy:A Panel Analysis’, American Journal of Political Science, 29 (1985), 891–913, p. 894. Moreover, to ourknowledge the efficacy measure used by the CSES does not appear to have been asked both before and after anelection so it is not possible to test the hypothesis with other data. Nevertheless, we believe that it is reasonableto characterize the relationship as one where efficacy influences voter participation. In terms of face validity, thequestion about efficacy is asked in the present tense rather than in the past tense, which forces citizens to thinkin more general terms rather than in the context of the recent electoral outcome and their past participation.
59 Similar to the efficacy model, the effect of strength of party preference varies significantly across countries.Therefore, like the efficacy model, we have allowed for random effects at the country level.

Political Efficacy and Participation in Twenty-Seven Democracies 17
(a) Base model with random effects for intercept and efficacy
(b) Model with random effects controlling for macro level characteristics
Fig. 2. Effects of efficacy on the probability of voting
we also investigated whether citizens holding more negative opinions about parties weremore or less motivated to participate in the political process.60 While PR systems tend tofoster stronger positive evaluations of parties (see Table 1), they also appear to encouragestronger negative opinions as well. In PR systems, 56 per cent of respondents gave a party
60 In this case, we constructed a variable that measured the lowest party evaluation. If a person strongly dislikedone party and strongly liked another, they would receive a high score on both preference measures.

18 K A R P A N D B A N D U C C I
TABLE 4 Multi-level Model of Voter Participation: Logit Estimates
Robust OddsCoef. s.e. ratio†
Level 1 VariablesSmall party preferred � 0.13 (0.07) 0.88No single party � 0.18** (0.06) 0.84Strength of preference 0.21** (0.02) 1.23Age (in 10s) 0.21** (0.01) 1.23Education 1.14** (0.18) 3.13Female � 0.07 (0.04) 0.93Efficacy 0.21** (0.02) 1.23
Level 2 VariablesParties in parliament 0.13 (0.08) 1.14Parties in government � 0.40** (0.14) 0.67New democracies � 0.92** (0.30) 0.40Disproportionality � 0.02 (0.03) 0.98Competitiveness 0.05** (0.02) 1.05Compulsory voting 1.35** (0.39) 3.86
Constant 1.93** (0.56)
Random EffectsConstant 0.32** (0.08)Efficacy 0.01** (0.004)Total Variance (individual level variables only) 0.43Total Variance (full model) 0.29Chi-square fixed effects 768.94 (15df)Chi-square random effects 19.54 (2df)Number of level one units 33,361Number of level two units 27
**p � 0.01; *p � 0.05; ap � 0.10†Odds ratio is the unlogged coefficient which represents the odds that a citizen votes givena one unit change in the independent variable.
a score of 1 or 0 on the ten-point scale. The results indicate that holding more negativeopinions, while not as strong as the influence of positive evaluations, neverthelessincreases the odds of voting. The effects of the individual-level control variables in themodel are also largely consistent with expectations; both age and education serve toenhance voter participation.
As noted above, citizens are less likely to believe that their vote matters in systems thatproduce large coalitions. The size of the government coalition also has a direct and negativeimpact on voting even after controlling for efficacy. This indicates that coalition sizereduces voter participation independent of political efficacy. We suspect that partymobilization is a factor, though we have no direct way of measuring it with these data.Another possible explanation is that Switzerland, a country with large coalitions and lowturnout, may be driving the results.61 National competitiveness is positive and significant,
61 When efficacy is omitted from the model and Switzerland is included as a dummy variable, coalition sizeis no longer significant. Franklin argues that it is not the size of the coalition, but rather the fact that there is littlealternation in power in Switzerland that accounts for low voter turnout. See Franklin, Voter Turnout and theDynamics of Electoral Competition in Established Democracies Since 1945.

Political Efficacy and Participation in Twenty-Seven Democracies 19
indicating that voter participation is likely to increase when the margin of victory narrowsbetween parties. Another contextual difference that appears to reduce voter participationis a country’s level of democratization. Citizens in emerging democracies are less likelyto vote than in older democracies. This finding is consistent with previous literature relyingon aggregate data.62 Parties in newer democracies are likely to be poorly organized, poorlyresourced and inexperienced in mobilization efforts and citizens report fewer contacts withpolitical parties in emerging democracies.63 While we are unable to test this hypothesisdirectly, the lack of party organization in new democracies is likely to be a factor inexplaining lower voter participation in these countries, particularly when one considers theresults in Table 3, which indicate that democratization has no impact on efficacy.
While in the expected direction, the coefficient for the number of parties representedin parliament is just approaching statistical significance, suggesting that greater diversityin parliament may not be enough to boost voter participation. Compulsory voting morethan triples the odds of voting.64 While disproportionality depresses efficacy, it fails todirectly influence voter participation.65
Comparing the voter turnout and efficacy models, the individual and macro-levelinstitutional variables help to explain more of the variance in voter participation than inefficacy across the twenty-seven countries in our sample. Moreover, the macro-levelvariables help to explain more of the variance in voter participation than in efficacy.Specifically, the amount of variance is reduced by about a third in the voter participationmodel when macro-level variables are added to the individual-level model, while in theefficacy model the reduction in variance is less than 10 per cent. In the voter turnout model,while 43 per cent of the variance can be explained by individual level factors, the additionof the macro-level variables reduces the total variance in voter participation to 29 per cent.In comparison, the total variance in the individual-level model predicting efficacy is 0.70compared to 0.61 when macro-level variables are added to the model.
The results discussed above illustrate how various characteristics of the electoral systemcan have a positive or negative influence on a citizen’s likelihood of voting. However,many of these variables are not independent of one another. A country that adopts PR, forexample, will reduce disproportionality and increase the number of parties in government,which will improve efficacy. But in adopting PR, it will make coalition government morelikely, which will have a negative effect. To estimate the full impact of the electoral system,we report predicted probabilities of voting across a range of ‘real world’ examples. Theseestimates, which are derived from the model in Table 4 are reported in Table 5. In a‘British’-style system, with single-party government and few parties, an average citizenhas a likelihood of voting of 0.65. In a ‘Dutch’-style system, with a proportional system,broad coalitions and many parties, the probability of an average citizen voting with thesame level of efficacy is 0.63. If, as in Norway’s case, PR is combined with single-partygovernment, the likelihood of voting increases more to 0.76. Compulsory voting, can also
62 Norris, Electoral Engineering.63 Sarah Birch, ‘Single-member District Electoral Systems and Democratic Transition’, Electoral Studies,
24 (2005), 281–301; Jeffrey A. Karp and Susan A. Banducci, ‘Party Mobilization and Political Participation inNew and Old Democracies’, Party Politics, 13 (2007), 217–34.
64 The effect is lower when all of the countries with compulsory voting are considered together irrespectiveof how the law is enforced. When considered separately, the impact is greatest for Australia and Belgium, wherethe level of enforcement is viewed as being stricter than in Mexico.
65 We also examined whether candidate based or party list systems influenced efficacy. These factors were notsignificant.

20 K A R P A N D B A N D U C C I
TABLE 5 Likelihood of Voting under Different Systems
‘Belgian’ style:‘Norwegian’ broad‘Korean’ style:
‘British’ style: style:‘Dutch’ style:coalition coalitions,single-party many parties,single-party government, broadgovernment, old democracy,many parties,government, coalitions,many parties,few parties, compulsorymany parties,new
old democracydemocracy votingold democracyold democracy
Mean 0.65 0.46 0.63 0.76 0.87
EfficacyLow 0.52 0.33 0.49 0.64 0.79High 0.71 0.53 0.69 0.80 0.90
Note: Estimates derived from Table 4. Items that vary are set at their mean values for eachcountry ‘style’ (see Appendix Table A1). Party Preference is set at the residual category (largeparty) and female is set to 1. All other variables are held constant at their mean values in thesample.
partly compensate for the negative effects of broad coalitions, as is evident in a‘Belgian’-style system where a citizen has a probability of voting of 0.87. In a newdemocracy with coalition government, the likelihood of voting is substantially reduced.In a ‘Korean’-style system, an average citizen has a likelihood of voting of 0.46. Theestimates in Table 5 also show how efficacy, which itself is influenced by the electoralsystem, can alter a citizen’s probability of voting. While an average citizen in a‘Norwegian’-style system is expected to have a higher likelihood of voting than a citizenin a ‘British’-style system, the expected increase from the ‘British’ to the ‘Norwegian’-style system is not nearly as substantial as moving from low to high efficacy within anysystem. In the ‘British’ case, a citizen with a low level of efficacy has a likelihood of votingof just 0.52 as compared to 0.71 for a citizen with a high level of efficacy. These effectsillustrate the relative importance of individual level factors, which have largely beenignored in cross-national studies of turnout as well as contextual factors. Proportionalityenhances overall turnout and these effects appear to be psychological, by reducing theproportion of citizens who believe their vote makes little difference in elections.
DISCUSSION
While previous research has found that PR systems are often associated with higherturnout, the reliance on aggregate data has made it difficult to explain just why this is thecase. Electoral rules are thought to influence political attitudes and behaviour by offeringincentives or disincentives to vote. A common assumption in many cross-nationalaggregate studies of turnout is that some voters are discouraged from participating becausetheir vote is less likely to make a difference in systems that distort the translation of votesinto seats. Voting is assumed to be more ‘satisfying’ for more voters in PR systems thanunder plurality rules because fewer votes are wasted. Aside from providing more effectiverepresentation for small parties, PR is viewed as the most appropriate method forguaranteeing the direct representation of minorities.66
66 Katz, Democracy and Elections.

Political Efficacy and Participation in Twenty-Seven Democracies 21
Our results provide support for the assumption that attitudes and behaviour are likelyto be influenced by institutional arrangements. Recent studies that have relied onindividual-level data have reached similar conclusions. For instance, devices such as directdemocracy can encourage a greater sense of efficacy and possibly civic engagement.67 Inan analysis of European elections that provides one of the few examples whereindividual-level data are used to examine turnout in a cross-national context, Franklinobserves that electoral rules such as Sunday or postal voting and compulsory voting canplay an important role in stimulating electoral participation.68
Although those preferring small parties have lower levels of efficacy than those witha preference for large parties, the differences between them are smaller in proportionalsystems. These findings are analogous to those of Anderson and Guillory who find thatthe losers are likely to be less dissatisfied in consensus systems than in plurality systems.69
It also complements recent evidence from New Zealand, where political minoritiesexperienced a greater shift in efficacy and participation than other voters following achange from a plurality to a PR system.70
Aside from minimizing the differences between political minorities, proportionalsystems appear to enhance overall participation by fostering stronger party preferences.This result is consistent with expectations that catch-all parties, because they need to appealto the broadest base of support, do not foster strong preferences. Given the strongrelationship between strength of preferences and voting, the stronger preferences foundin PR systems lead one to expect higher overall rates of turnout. The results alsocomplement other cross-national research that concludes that the threat of ideologicallyextreme parties helps to strengthen partisan attachments.71 Our analysis also suggests thatstrong preferences appear to counter the psychological effects produced by the electoralsystem. This conclusion is not new, the strength of partisan attachments has beenrecognized as an important influence on participation since the earliest voting studies.72
Yet such individual level factors have largely been neglected in cross-national studies ofturnout because of the lack of available data. Our analysis suggests that psychologicalfactors measured at the individual level are also important determinants of electoralparticipation. More importantly, these factors can be influenced by institutionalarrangements.
67 Shaun Bowler and Todd Donovan, ‘Democracy, Institutions and Attitudes about Citizen Influence onGovernment’, British Journal of Political Science, 32 (2002), 371–90; Bruno S. Frey, Marcel Kucher andAlois Stutzer. ‘Outcome, Process and Power in Direct Democracy: New Econometric Results’, Public Choice,107 (2001), 271–93.
68 Van der Eijk and Franklin, Choosing Europe?; Franklin, ‘Electoral Participation’. In other models notreported here we found no evidence that postal or Sunday voting influenced voter participation in the CSES sample.
69 Anderson and Guillory, ‘Political Institutions and Satisfaction with Democracy’. It is also possible thatelectoral outcomes can influence winners and losers’ sense of political efficacy. Although one might hypothesizethat efficacy is partly influenced by whether one voted for a winner or loser, we should also expect the indicatorto tap into more long-term feelings about the political system. See Susan A. Banducci and Jeffrey A. Karp, ‘HowElections Change the Way Citizens View the Political System: Campaigns, Media Effects, and Electoral Outcomesin Comparative Perspective’, British Journal of Political Science, 33 (2003), 443–67, p. 464. Thus these observeddifferences are most likely a consequence of long-term loss rather than being the result of the more immediateelectoral outcome.
70 Banducci, Donovan and Karp, ‘Proportional Representation and Attitudes about Politics’; and ‘The Impactof Proportional Representation on Turnout’.
71 Bowler, Lanoue and Savoie, ‘Electoral Systems, Party Competition, and Strength of Partisan Attachment’.72 Campbell et al., The American Voter.

22 K A R P A N D B A N D U C C I
Finally, our analysis provides a resolution to the disagreement in the cross-nationalturnout literature on the effects of multipartism. While some suggest multipartismdiscourages voter participation because voters have less say in the formation ofgovernments, others suggest that multipartism encourages participation through the effectsof greater competition and party mobilization. This disagreement has been difficult toresolve without measuring efficacy directly. We find that the number of parties representedin parliament has no influence on political efficacy and while positively associated withvoter participation, the number of parties in parliament is not quite statistically significant.In contrast, there is more support for the assumption that broad coalition governmentsdepress efficacy which can discourage voter participation. Such a finding suggests thatwhile proportional systems may foster positive attitudes and behaviour, the formation ofbroad based power-sharing agreements could partly offset these advantages.
APPENDIX
TABLE A1 Sample of Countries and their Institutional Characteristics
Coalition Compulsory NewElectoral system Country Disproportionality Parties size voting democracy
PR Systems Belgium 4.6 9 6 Yes NoCzech
Republic 4.4 6 2 No YesDenmark 0.7 10 2 No NoFinland 3.0 5 3 No NoIceland 2.0 5 2 No NoIreland 6.4 7 2 No NoIsrael 1.7 10 2 No NoNetherlands 1.1 6 3 No NoNorway 3.7 7 1 No NoPoland 9.8 4 1 No YesPortugal 5.4 5 2 No NoSlovenia 2.6 7 2 No YesSpain 5.5 4 1 No NoSweden 1.0 7 1 No NoSwitzerland 2.7 6 4 No† No
MMP Systems Germany 2.6 6 2 No NoMexico 7.1 3 1 Yes YesNew
Zealand 2.9 5 1 No No
Mixed Systems Hungary 8.4 6 1 No YesJapan 8.8 5 3 NoKorea 8.8 4 2 No YesRussia 5.5 9 2 No YesUkraine 2.4 10 1 No Yes
Plurality Systems Canada 13.3 5 1 No NoUnited
Kingdom 16.8 3 1 No NoUnited
States 4.2 2 2 No No
Majority Systems Australia 10.2 3 2 Yes No
†In Switzerland, compulsory voting is used only in the canton of Schaffhausen.

Political Efficacy and Participation in Twenty-Seven Democracies 23
TABLE A2 Coding for Large and Small Party Preference
Country Large Parties Small Parties
Liberal, Australian LaborAustralia National (Country), Australian Democrats,Greens
None All parties in Wallonia and FlandersBelgium
Progressive Conservative, NDP, Reform, BlocLiberalCanadaQuebecois
CSSD, ODSCzech KDU-CSL, KSCM, ODA, SPR-RSCRepublic
Denmark Conservative (KF), Centre Democrat (CD),Social Democrat (SD),Socialist People (SF), Danish People (DF)Liberal Party (V)
National Coalition, Left Alliance, SwedishFinland Social Democrat, CentreParty People’s Party, Christian Democrats, Green
League
CSU, FDP, Greens, PDS, Republikaner, DVUCDU, SPDGermany
Hungary FKGP, MDF, MIEP, SZDSZ, Munkaspart,Fidesz-MPP, MSZPMDNP
Alliance, IndependenceIceland Progressive, Left Greens, Liberal
Fianna Fail, Fine GaelIreland Green, Labour, Progressive Democrats, SinnFein
Israel Likud, Avoda Shas, Mafdal, Meretz, Tzomet
Democratic Party of Japan, Social DemocraticLiberal Democratic Party,JapanNew Frontier Party Party, Japan Communist Party, New party
Harbinger, New Socialist Party, FreeDomUnion
Korea Grand National Party, United Liberal Democrats, DemocraticMillenium Democratic Peoples Party, New Korean Party of the Hope,
Democratic Liberal PartyParty
Mexico PAN, PRI, PRD PT, PVEM, PC, PPS, PDM
Netherlands Christian Democratic Appeal (CDA), D66,Labour (PvdA), People’sParty for Freedom and GroenLinks, SGP, GPV, RPFDemocracy (VVD)
New Zealand National, Labour Act, Alliance, New Zealand First, ChristianCoalition
Labor Party Christian People’s Party, Center Party,NorwaySocialist Left Party, Conservative Party,Progress Party
Poland Movement for the Reconstruction of Poland,Solidarity Election Action,Democratic Left Alliance Polish Peasant Party, Freedom Union, Union
of Labor
Social Democratic Party, Popular Party, Unitary Democratic Coalition,PortugalSocialist Party Left Block, Portuguese Communist Workers’
Party
Russia Fatherland All Russia, Union of Right Forces,Communist Party of theYablokoRussian Federation,
Yedinstvo (Unity)

24 K A R P A N D B A N D U C C I
TABLE A2 (Continued)
Country Large Parties Small Parties
Slovenia Liberal Democratic Party Slovenian People’s Party (NSi), Social(LDS) Democratic Party (SDSS), Christian
Democrats (NSi), United List of SocialDemocrats (ZLSD), Democratic Party ofRetired Persons (DeSUS)
CDS, United Left (IU), Convergence & UnityPeople’s Party (PP),SpainSocialist Party (PSOE) (CiU), Basque Nationalist Party (PNV)
Sweden’s SocialSweden Left Party (Vp), Centre Party (C), PeopleParty’s Liberals (Fpl), Christian DemocratsDemocratic Worker’s Party
(SAP), Moderate Rally (KD)Party (M),
Green Party (GPS)Switzerland Swiss People’s Party(SPS), Social Democrat(SPS), Free Thinking
Ukraine Communist party of People’s Rukh of Ukraine, Socialist party ofUkraine Ukraine, Social-Democratic Party,
People’s-Democratic party
Liberal Democrats, Scottish National Party,Conservative, LabourUnitedPlaid CymruKingdom
Democrat, Republican Reform partyUnited States
Note: Interviewers were instructed to ask about all parties likely to be represented in parliament.In circumstances where there were more than six parties, interviewers were instructed to askabout the six most relevant parties.