Policy Options to support the Rural Job Opportunity Creation ...
66
Policy Options to support the Rural Job Opportunity Creation Strategy in Ethiopia Boulanger, P., Ferrari, E., Mainar Causapé, A., Sartori, M., Beshir, M., Hailu, K., Tsehay, S. 2019 EUR 29949 EN
-
Upload
khangminh22 -
Category
Documents
-
view
3 -
download
0
Transcript of Policy Options to support the Rural Job Opportunity Creation ...

Policy Options to support the Rural Job Opportunity Creation Strategy in Ethiopia
Boulanger, P., Ferrari, E.,
Mainar Causapé, A., Sartori, M.,
Beshir, M., Hailu, K., Tsehay, S.
2019
EUR 29949 EN
This publication is a Science for Policy report by the Joint Research Centre (JRC), the European Commission’s science and knowledge
service . It aims to provide evidence-based scientific support to the European policymaking process. The scientific output expressed does not imply a policy position of the European Commission. Neither the European Commission nor any person acting on behalf of th e
Commission is responsible for the use that might be made of this publication. For information on the methodology and quality underlying the data used in this publication for which the source is neither Eurostat nor other Commission services, users should contact the
referenced source . The designations employed and the presentation of material on the maps do not imply th e expression of any opinion whatsoever on the part of the European Union concerning the legal status of any country, te rritory, city or area or of its au thorities, or
concerning the delimitation of its frontie rs or boundaries.
Contact information Name: Emanuele Ferrari
Address: Calle Inca Garcilaso, 41092, Seville Email: [email protected]
Te l.: 0034 954 48 84 61
EU Science Hub https://ec.europa.eu/jrc
JRC117916
EUR 29949 EN
PDF ISBN 978-92-76-11265-5 ISSN 1831-9424 doi:10.2760/76450
Print ISBN 978-92-76-11264-8 ISSN 1018-5593 doi:10.2760/74605
Epub ISBN 978-92-76-14144-0 ISSN 1831-9424 doi:10.2760/891921
Luxembourg: Publications Office of the European Union, 2019
© European Union, 2019
The reuse policy of the European Commission is implemented by the Commission Decision 2011/833/EU of 12 December 2011 on the
reuse of Commission documents (OJ L 330, 14.12.2011, p . 39). Except otherwise noted, the reuse of this document is authorised under the Creative Commons Attribution 4.0 International (CC BY 4.0) licence (https://creativecommons.org/licenses/by/4.0/). This means that
reuse is allowed provided appropriate credit is given and any changes are indicated. For any use or reproduction of photos or other material that is not owned by the EU, permission must be sought directly from the copyright holders.
All content © European Union, 2019, except: photo cover [image #1, Young African Schoolgirl Writing Doing her Homework © Riccardo
Nie ls Mayer – stock.adobe.com]; [image #2, Africa, Ethiopia. Lonely road. Landscape nature around ©svetlana485 – stock.adobe.com].
How to cite this report: Boulanger, P., E. Ferrari, A. Mainar Causapé, M. Sartori, M. Beshir, K. Hailu, S. Tsehay, Policy Options to support the Rural Job Opportunity Creation Strategy in Ethiopia, EUR 29949 EN, Publications Office of the European Union, Luxembourg, 201 9, ISBN
978-92-76-11265-5, doi:10.2760/76450, JRC117916.
i
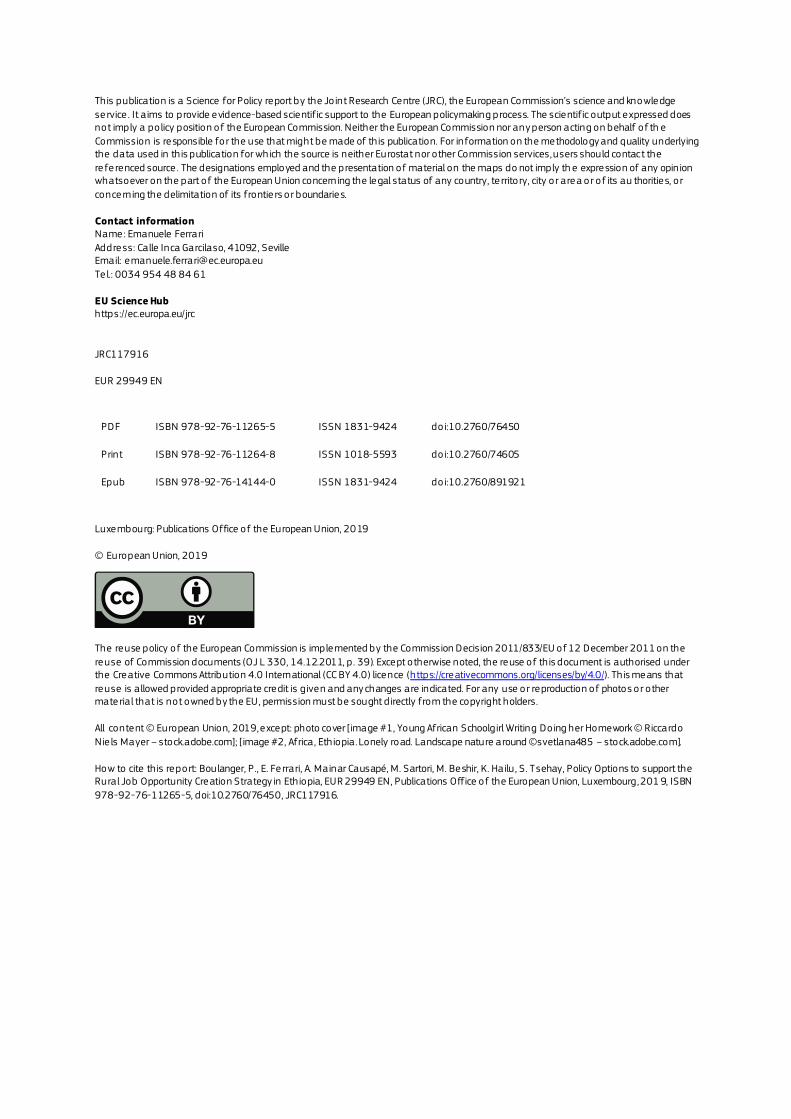
Contents
Abstract................................................................................................................................................................................................................................................................. 1
Acknowledgements..................................................................................................................................................................................................................................... 2
Executive summary ....................................................................................................................................................................................................................................3
1 Introduction............................................................................................................................................................................................................................................... 4
2 Policy context ..........................................................................................................................................................................................................................................6
3 Data and Model.....................................................................................................................................................................................................................................8
3.1 Social Accounting Matrix..................................................................................................................................................................................................8
3.2 Job multipliers analysis ................................................................................................................................................................................................. 12
3.3 The Model: DEMETRA ....................................................................................................................................................................................................... 15
4 Scenarios..................................................................................................................................................................................................................................................16
4.1 Scenario development ....................................................................................................................................................................................................16
4.2 Scenario assumptions .....................................................................................................................................................................................................19
4.3 Scenario descriptions.......................................................................................................................................................................................................19
4.3.1 Baseline......................................................................................................................................................................................................................19
4.3.2 Industrial parks and agro-processing industrial parks - Agropark........................................................................ 21
4.3.3 Rural roads and other infrastructure development - Road ......................................................................................... 22
4.3.4 Irrigation ....................................................................................................................................................................................................................23
4.3.5 Extension services in rural areas for livestock activities - Livestock..................................................................23
4.3.6 Productive Safety Net Programme (PSNP) – Labour subsidy ................................................................................... 24
4.3.7 Rural education and skills enhancement - Skills .................................................................................................................. 24
5 Results........................................................................................................................................................................................................................................................26
5.1 Job, income and migration .........................................................................................................................................................................................26
5.2 Agricultural markets .........................................................................................................................................................................................................34
5.3 Welfare indicators and public finance............................................................................................................................................................. 38
5.4 Sustainable Development Goals........................................................................................................................................................................... 39
6 Conclusion and recommendations.................................................................................................................................................................................... 44
6.1 Conclusions ............................................................................................................................................................................................................................... 44
6.2 Recommendations.............................................................................................................................................................................................................. 45
References.......................................................................................................................................................................................................................................................46
List of abbreviations and definitions.......................................................................................................................................................................................48
List of figures ...............................................................................................................................................................................................................................................49
List of tables.................................................................................................................................................................................................................................................. 51
Annexes.............................................................................................................................................................................................................................................................. 52
Annex 1. Supplementary figures ........................................................................................................................................................................................ 52
Annex 2. Additional scenarios ............................................................................................................................................................................................... 55
Annex 3. On-line resources...................................................................................................................................................................................................... 57

1
Abstract
In 2017, the Ministry of Agriculture and Natural Resources of Ethiopia adopted the Rural Job Opportunity Creation Strategy (RJOCS) to address a lack of job opportunities in rural areas, and related effects such as migration to urban areas and poverty. This report assesses the likely effects of six policy options, in terms of jobs opportunity creation and key macroeconomic indicators. It employs a dynamic Computable General Equilibrium (CGE) model developed by the Joint Research Centre (JRC) tailored to the Ethiopian context.
The analysis of the Ethiopian economy, through multipliers based on a specifically developed database, shows that livestock has the greatest employment generation capacity, followed by cash crops, food crops and agri-food industry. This means that policies focusing on rural and agri-food sectors should have great potential to create job opportunities.
All scenarios show the capacity of the Ethiopian agriculture and food industry to generate job opportun ities and improve conditions for workers and their families, with particularly positive effects under the scenarios supporting agroparks and developing workers’ skills through education.
2
Acknowledgements
The authors would like to acknowledge the continuous support from the Delegation of the European Union to Ethiopia, especially Teriessa Jalleta and Dominique Davoux, as well as Andualem Telaye and Firew Woldeyes from the Policy Studies Institute (PSI).
The authors would also like to acknowledge the support from colleagues of the data science team of the Economics of Agriculture Unit at the JRC, in particular Arnaldo Caivano and Javier Castro Malet, for their contribution in setting the data visualisation system and the online mash-up of this report.
Special thanks go to former colleague Hasan Dudu (now at the World Bank) for his contribution to setting up this project and the modelling framework. JRC colleagues Kamel Louhichi, Felix Rembold, Simone Salotti , Umed Temurshoev, Nigussie Tefera Uregia provided useful comments. Giampiero Genovese, Head of the Economics of Agriculture Unit, provided constant and inspiring support.
Authors
Pierre Boulanger, Emanuele Ferrari, Alfredo Mainar Causapé and Martina Sartori, European Commission, Jo int Research Centre (JRC), Seville, Spain.
Mohammed Beshir and Kidanemariam Hailu, Policy Studies Institute (PSI).
Solomon Tsehay, Addis Ababa University, College of Development Studies.
3
Executive summary
To address a lack of job opportunities in rural areas, especially for young people, and related effects such as migration to urban areas and poverty, the Ministry of Agriculture and Natural Resources of the Federal Democratic Republic of Ethiopia adopted a Rural Job Opportunity Creation Strategy (RJOCS) in 2017. Th is report aims to quantify several policy options within the framework of the RJOCS. It uses the Dynamic Equilibrium Model for Economic development, Resources and Agriculture (DEMETRA) , which is a national Computable General Equilibrium (CGE) model developed in-house by the Joint Research Centre (JRC) of the European Commission and tailored to the Ethiopian context.
Policy context
Six policy scenarios simulate the existing policy mixes of the Ethiopian government. Beyond the RJOCS, these include key documents such as the second Growth and Transformation Plan (GTP II) and the Climate Resilient Green Economy (CRGE) Strategy. The identified scenarios address the development of : ( i ) industria l agro-processing parks, (ii) rural roads and infrastructure, (iii) irrigation facilities, (iv) livestock extension services, (v) productive safety net programme (PSNP) or labour subsidy, and (vi) rural skills enhancement.
Key conclusions
The analysis of the Ethiopian economy through multipliers shows that livestock has the greatest employment generation capacity, followed by cash crops, food crops and agri-food industry. Th is means that polic ies focusing on rural and agri-food sectors should have great potential to create job opportunities.
Policy scenarios show good absorption capacity and job creation possibilities for agri -food sectors if stimulated by specific policies, particularly with increasing investments in agro-processing industrial parks (agropark). The report sheds some light on the need for prioritisation in public spending, consistent with policy objectives. That being said, modelling outcomes should be considered with caution and should in no way be considered forecasts of any future impacts of simulated shocks.
Main findings
All scenarios simulated show potential for agriculture and food sectors to increase job creation, particularly if stimulated with investment policies such as the development of agroparks. The increase in labour demand brings about an almost universal increase in wages under most scenarios. Th is increase is particu larly significant under scenarios specifically designed to increase labour productivity, such as the skills scenari o which is helping to create better jobs with higher pay. Total employment is barely affected by the policies simulated. This is also due to the structure of the model and lack of available data on Ethiopian employment or underemployment
An additional effect of policies fostering rural job opportunities is the reduction in worker migration towards urban areas, in particular Addis Ababa. The positive outlook associated with the policies simulated is underlined by the increase in production factor income and consequently household income assoc iated with most scenarios. The only one associated with a decline in income is the labour subsidy. This scenario is able to support the income of the poorest, but at the same time creates distortion in the economy, reduci ng overall economic activity compared to the baseline. To avoid these negative effects, this policy should be accompanied by pro-growth ones to avoid a decrease in Ethiopian economic growth.
Related and future JRC work
Enhancing the analysis of Sustainable Development Goal indicators and better capturing strong dynamics such as demography or climate change will represent critical improvements.

4
1 Introduction
About 80% of the Ethiopian population lives in rural areas (Central Statistics Agency (CSA), 2016). Al though the unemployment rate in rural areas is estimated to be around 2% (MoANR, 2017), the majority of the rural population are young people with limited access to land or other means of agricultural production; most of them plan to quit agricultural production in the near future (Bezu and Holden, 2014) although rural non-farm employment opportunities are quite limited (Schmidt and Bekele, 2016). The lack of job opportunities in rural areas is one of the core reasons for the migration of young people to urban areas (Atnafu e t al., 2014) . According to a recent study, 28% of young people in the Blue Nile Basin in Amhara and Oromia permanently migrated to urban areas between 2010 and 2014 (Kosec et al., 2017). However, an already h igh rate of unemployment in urban areas of 16.5% (MoANR, 2017) indicates that those who move to cities for better job opportunities face significant constraints in finding jobs.
The Ministry of Agriculture and Natural Resources (MoANR) of the Federal Democratic Republic of Ethiopia has developed and adopted a Rural Job Opportunity Creation Strategy (RJOCS) (MoANR, 2017) to consolidate the government’s rural job opportunity creation activities, at federal and regional levels, in line with the priorities of the second Growth and Transformation Plan (GTP II) and the Climate Resilient Green Economy (CRGE) Strategy.
The RJOCS is targeting rural job seekers, primarily unemployed and underemployed women and men over 15 years of age, literate or illiterate, and those without regular and sufficient income. Potential beneficiaries of the strategy also include landless and early school leavers, technical and vocational trainees, un ivers ity graduates, farmers evicted from their land due to the expansion of urbanisation and industrialisation, and those who need special support because of disability.
The RJOCS aims to harness all achievements recorded so far in social services and infrastructure development in rural areas, including:
rural road development: expansion and access to road connectivity;
human health care services: health posts, health centres and hospitals;
animal health services: veterinary posts/clinics;
provision of drinking water: putting in place institutions responsible for the provision of drinking water for humans and livestock;
telecommunication services: telephone, mobile and internet services;
education: pre-school and adult education, elementary, secondary, technical and vocational tra ining institutions;
rural financial institutions: banks, saving and credit unions, multipurpose cooperatives;
training centres: farmer and pastoralist training centres;
irrigation facilities; water users’ associations, construction and maintenance crews;
other rural infrastructure facilities such as market infrastructures and the forthcoming agro-industrial parks.
The RJOCS also aspires to harness private sector development and market linkages, and increase access to new technologies, innovations, and applications brought by increasing connectivity. The strategy aims to capitalise on the following enablers:
prioritising unemployed and youth and women in job opportunity creation;
providing more emphasis on the marginalised in job opportunity creation;
contributing to the reduction of poverty through prioritising in job opportunity creation those li ving with a high poverty profile;
enhancing local and national growth and transformation through promoting job opportunity creation;
associating job opportunity creation with the development of rural entrepreneurship;
creating jobs to incentivise job seekers to spend more time on their job, generate better remuneration and engage in sustainable jobs;
5
empowering young people: letting the youth guide their own issues, hear their vo ice and use the ir wisdom;
integrating national economic growth and transformation with job opportunity creation.
The RJOCS has four strategic pillars:
Pillar 1: Entrepreneurship/self-employment - private development
Pillar 2: Wage employment, labour markets
Pillar 3: National rural employment guarantee scheme: expanded productive p ublic workfare programme
Pillar 4: Livelihood diversification
However, despite its importance, the RJOCS is neither quantified in its objectives, nor has it been accompanied by an impact assessment or cost-benefit analysis for the economy, making it difficult to prioritise government investments and monitor the impacts of the strategy. Furthermore, the strategy has not yet defined its needs in terms of operational policies and specific institutional arrangements.
This report fills the gap by proposing a quantitative analysis of the policy options within the framework of the RJOCS. It uses the Dynamic Equilibrium Model for Economic development, Resources and Agriculture (DEMETRA), a single-country Computable General Equilibrium (CGE) model developed by the Jo int Research Centre (JRC) of the European Commission and tailored to a developing country context. The rest of the report is organised as follows: section 2 provides a brief description of the policy context; section 3 describes the model and the data used in the study, and shows an analysis of employment multipliers; section 4 introduces the simulated policies; and section 5 reports the main results from the simulations. The last section concludes and provides some policy recommendations.
6
2 Policy context
Agriculture is the backbone of the Ethiopian economy. The sector employs 78% of the country’s labour force (CSA, 2016). It is characterised by subsistence farming, heavily dependent on erratic rainfall. Most farmers are smallholders, practising low input and low output farming on highly fragmented land (CSA, 2016) . Th is causes open and tacit underemployment that exacerbates rapid rural-urban migration . Accord ing to the Ethiopia Urban Migration Survey (UMS) the rate of rural-urban migration was 15% in 2008, and it was projected to reach as high as 39% between 2009 and 2014 (World Bank, 2010). This trend signifies that an increasing number of people will migrate to urban areas, taking into account that nearly 80% of the population currently lives in rural areas (CSA, 2016). Typically, people moving to urban areas do not have the required skills to engage in formal productive economic activities, and therefore often engage in low re turn activities and are vulnerable to food insecurity and poverty (Battersby, 2011).
The low absorptive and employment generation capacity of urban areas urged the Ethiopian government to design strategies to create employment opportunities for rural youth. Unti l re cently, unemployment was considered an urban phenomenon; hence policies focused on reducing urban unemployment. For example, the first Growth and Transformation Plan (GTP I) placed more emphasis on combating urban unemployment in Ethiopia. The rural component of GTP I was mainly focused on improving agricultural productivit y and less attention was given to employment creation. This amplified rural unemployment and rural-urban migration, while urban unemployment fell from 18.9% to 16.9% between 2010 and 2016.
In light of recent migration dynamics, creating job opportunities for youth in rural areas became part of various policy packages. Unlike GTP I, GTP II identified agriculture as an enabler of rural youth employment. The plan provided support to educated youth to engage in agricultural investment. One of the measures considered was increased supply of agricultural inputs and enhanced utilisation of agricultural technologies . This measure should enhance provision of the necessary support for domestic and selected foreign investors to enable them to participate in transformative agriculture (NPC, 2016).
Creating employment opportunities for rural youth in rural areas was also mainstreamed by sectoral p lans and growth programmes: the Agriculture Growth Programme (AGP), Livestock Master Plan (LMP), Livestock and Fisheries Sector Plan (LFSP) and Sustainable Land Management Programme (SLMP). The AGP aims to generate rural employment through improving agricultural productivity and commercialisation of targeted smallholder farmers, increasing participation by women and youth, and contributing to dietary divers ity and household consumption (MOA, 2015). The LMP and the LFSP aim to transform the livestock sector. Young people are among the primary beneficiaries of these programmes. The SLMP plays a crucial role in addressing climate resilience and the green economy; it mainstreamed green economy needs into sectoral programmes at all levels and has been configured to the safety net programmes.
The government endorsed the Rural Job Opportunity Creation Strategy (RJOCS) in May 2017. The stra tegy targets rural job seekers, primarily the unemployed and underemployed over 15 years of age, and those without regular and sufficient income. Potential beneficiaries of the RJOCS also include landless and early school leavers, technical and vocational trainees, university graduates, farmers evicted from their land due to urbanisation and industrialisation, and those who need special support because of d isability. The strategy relies on four pillars to generate employment opportunities for youth: (1) entrepreneurship and self-employment, (2) wage employment in labour markets, (3) national rural employment guarantee scheme, and (4) rural livelihood diversification. The RJOCS identified the main job opportunities under each pillar. For instance, agriculture (crop and livestock), natural resource, and non-farm activities are identified as the main job opportunity under the entrepreneurship and self-employment pillar (MoANR, 2017).
1. Entrepreneurship/self-employment
Educated youth could be attracted to entrepreneurship and self-employment opportunities. To this end, young job seekers are encouraged to participate in micro, small and medium enterprises, and to engage in activitie s suited to the environmental context and economic development. Rural enterprise development is implemented in the form of cluster or business community models. These approaches ease management; fac ilitate technical support including service provision, knowledge and technology transfer; and forge an interface between businesses and enhanced value chain. The main opportunities for rural entrepreneur development include agriculture (crop and livestock), natural resource-based, and non-farm activities. These sectors mainly embrace fruit and vegetable production, spice production, improved seed production, an imal and fishery sector, livestock, camel development, pig farming1, fishery, apiculture, silk production, animal feed production ,
1 P ig farming is an important activity in view of growing demand, but requires more engagement to break cultural and religious taboos.
7
hides and skins, off-farm/non-farm sectors, small business enterprises, small-scale industries such as wood and metal workshops, tailoring and sewing, weaving and pottery making.
2. Wage employment, labour markets
This part of the strategy targets job seekers who have specific ski lls and knowledge and are willing to transfer. This is a way of linking rural youth to existing job opportunities in rural and urban areas through the provision of information. This component focuses on finding rural youth permanent jobs in rural institutions/cooperatives, the private sector and lowest government hierarchy, and temporary employment opportunities in megaprojects such as sugar factories or dam construction. Overseas employment opportunities have also been part of the policy package, through providing skills/language tra ining for the rural unemployed.
3. Productive public workfare programme
The government places a focus on employing the rural labour force in labour-intensive p rogrammes and initiatives. The major job opportunities are in wage employment in rural socioeconomic development priorities (infrastructure, natural resource management, irrigation, etc.). Job seekers will be provided with suff ic ient working days and income through wages to support their livelihoods. Districts (woredas ) will p roduce their respective plans for job opportunities and will ensure job seekers access the information. Job seekers will be selected through self-targeting, community targeting and administrative targeting. A strong and sufficient annual financial budget will be allocated to create rural job security. Among rural employment guarantee schemes, the pertinent ones are: community watershed development through social mobilisation, Un iversal Road Access Programme (URAP), small-scale irrigation schemes, Sustainable Land Management Programme (SLMP), and Productive Safety Net Programme (PSNP).
4. Livelihood diversification
This component focuses on diversifying the source of livelihoods of households vulnerable to various income shocks. This programme is more appropriate to underemployed than to unemployed people. Gove rnmental and non-governmental organisations support livelihood interventions to improve househo ld and individual incomes, build household assets and strengthen saving, to enhance the living standard of the rural population. There are also instances of financial allocation in the form of grants and community revolving fund, aiming to support the poor to engage in income-generating activities. Through time, the implementation approach has also been improving: moving from supply to demand driven and to value chain build ing e fforts . Empirical evidence indicates that the provision and utilisation of loan financing and a saving culture has improved throughout the country. The approaches to be followed in enhancing livelihood d iversif ication are social enterprise development that supports the poor, and business-oriented livelihood pathways (farm, off -farm and employment opportunities).
8
3 Data and Model
3.1 Social Accounting Matrix
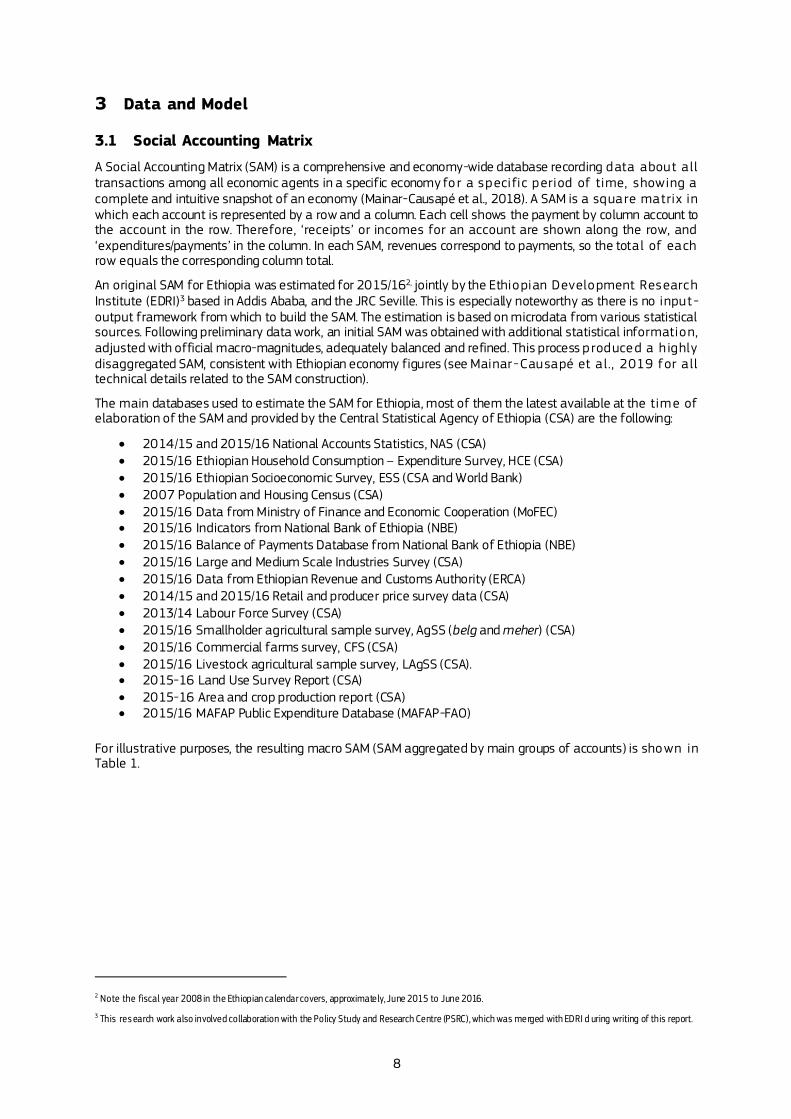
A Social Accounting Matrix (SAM) is a comprehensive and economy-wide database recording data about a ll transactions among all economic agents in a specific economy for a specific period of time, showing a complete and intuitive snapshot of an economy (Mainar-Causapé et al., 2018). A SAM is a square matrix in which each account is represented by a row and a column. Each cell shows the payment by column account to the account in the row. Therefore, ‘receipts’ or incomes for an account are shown along the row, and ‘expenditures/payments’ in the column. In each SAM, revenues correspond to payments, so the total of each row equals the corresponding column total.
An original SAM for Ethiopia was estimated for 2015/162, jointly by the Ethiopian Development Research Institute (EDRI)3 based in Addis Ababa, and the JRC Seville. This is especially noteworthy as there is no input -output framework from which to build the SAM. The estimation is based on microdata from various statistical sources. Following preliminary data work, an initial SAM was obtained with additional statistical information, adjusted with official macro-magnitudes, adequately balanced and refined. This process p roduced a h ighly disaggregated SAM, consistent with Ethiopian economy figures (see Mainar -Causapé et a l., 2019 for a ll technical details related to the SAM construction).
The main databases used to estimate the SAM for Ethiopia, most of them the latest available at the time of elaboration of the SAM and provided by the Central Statistical Agency of Ethiopia (CSA) are the following:
2014/15 and 2015/16 National Accounts Statistics, NAS (CSA) 2015/16 Ethiopian Household Consumption – Expenditure Survey, HCE (CSA) 2015/16 Ethiopian Socioeconomic Survey, ESS (CSA and World Bank) 2007 Population and Housing Census (CSA) 2015/16 Data from Ministry of Finance and Economic Cooperation (MoFEC) 2015/16 Indicators from National Bank of Ethiopia (NBE) 2015/16 Balance of Payments Database from National Bank of Ethiopia (NBE) 2015/16 Large and Medium Scale Industries Survey (CSA) 2015/16 Data from Ethiopian Revenue and Customs Authority (ERCA) 2014/15 and 2015/16 Retail and producer price survey data (CSA) 2013/14 Labour Force Survey (CSA) 2015/16 Smallholder agricultural sample survey, AgSS (belg and meher) (CSA) 2015/16 Commercial farms survey, CFS (CSA) 2015/16 Livestock agricultural sample survey, LAgSS (CSA). 2015-16 Land Use Survey Report (CSA) 2015-16 Area and crop production report (CSA) 2015/16 MAFAP Public Expenditure Database (MAFAP-FAO)
For illustrative purposes, the resulting macro SAM (SAM aggregated by main groups of accounts) is shown in Table 1.
2 Note the fiscal year 2008 in the Ethiopian calendar covers, approximately, June 2015 to June 2016. 3 This res earch work also involved collaboration with the Policy Study and Research Centre (PSRC), which was merged with EDRI d uring writing of this report.
9
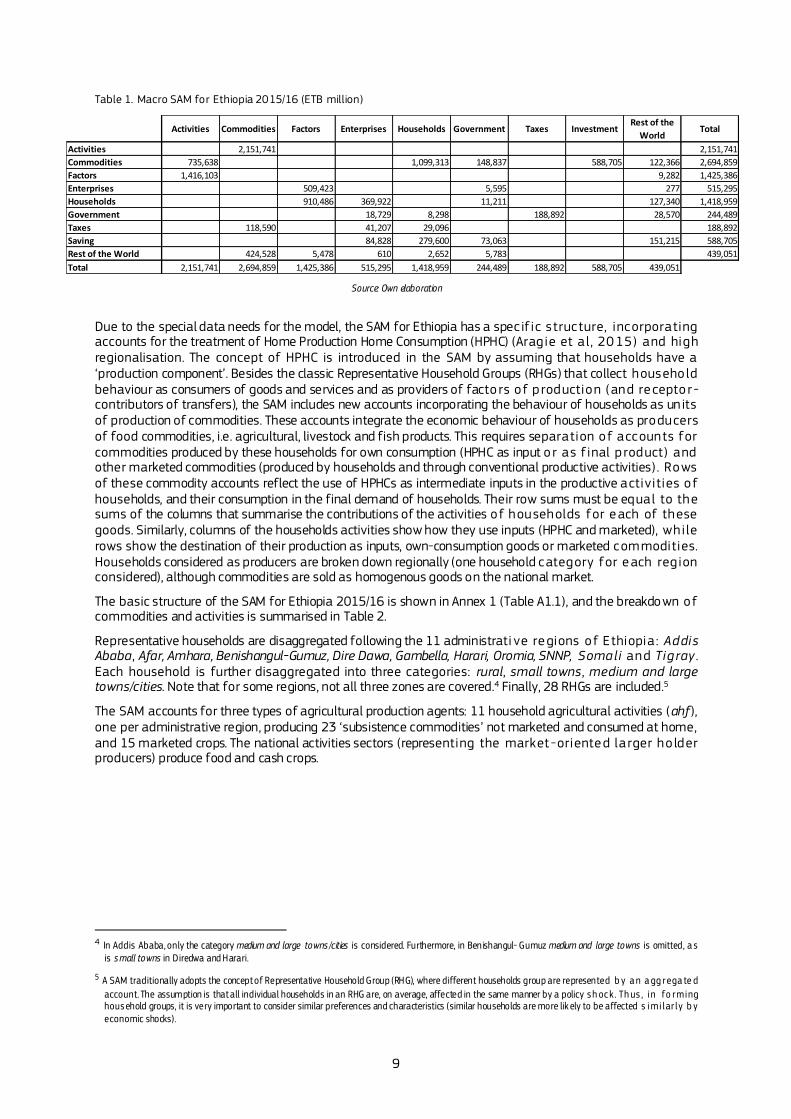
Table 1. Macro SAM for Ethiopia 2015/16 (ETB million)
Source: Own elaboration
Due to the special data needs for the model, the SAM for Ethiopia has a spec if ic structure, incorporating accounts for the treatment of Home Production Home Consumption (HPHC) (Aragie et a l, 2015) and high regionalisation. The concept of HPHC is introduced in the SAM by assuming that households have a ‘production component’. Besides the classic Representative Household Groups (RHGs) that collect househo ld behaviour as consumers of goods and services and as providers of factors of p roduction (and receptor -contributors of transfers), the SAM includes new accounts incorporating the behaviour of households as un its of production of commodities. These accounts integrate the economic behaviour of households as producers of food commodities, i.e. agricultural, livestock and fish products. This requires separation of accounts for commodities produced by these households for own consumption (HPHC as input or as f inal p roduct) and other marketed commodities (produced by households and through conventional productive activities) . Rows of these commodity accounts reflect the use of HPHCs as intermediate inputs in the productive activities of households, and their consumption in the final demand of households. Their row sums must be equal to the sums of the columns that summarise the contributions of the activities of households for each of these goods. Similarly, columns of the households activities show how they use inputs (HPHC and marketed), while rows show the destination of their production as inputs, own-consumption goods or marketed commodities. Households considered as producers are broken down regionally (one household category for each region considered), although commodities are sold as homogenous goods on the national market.
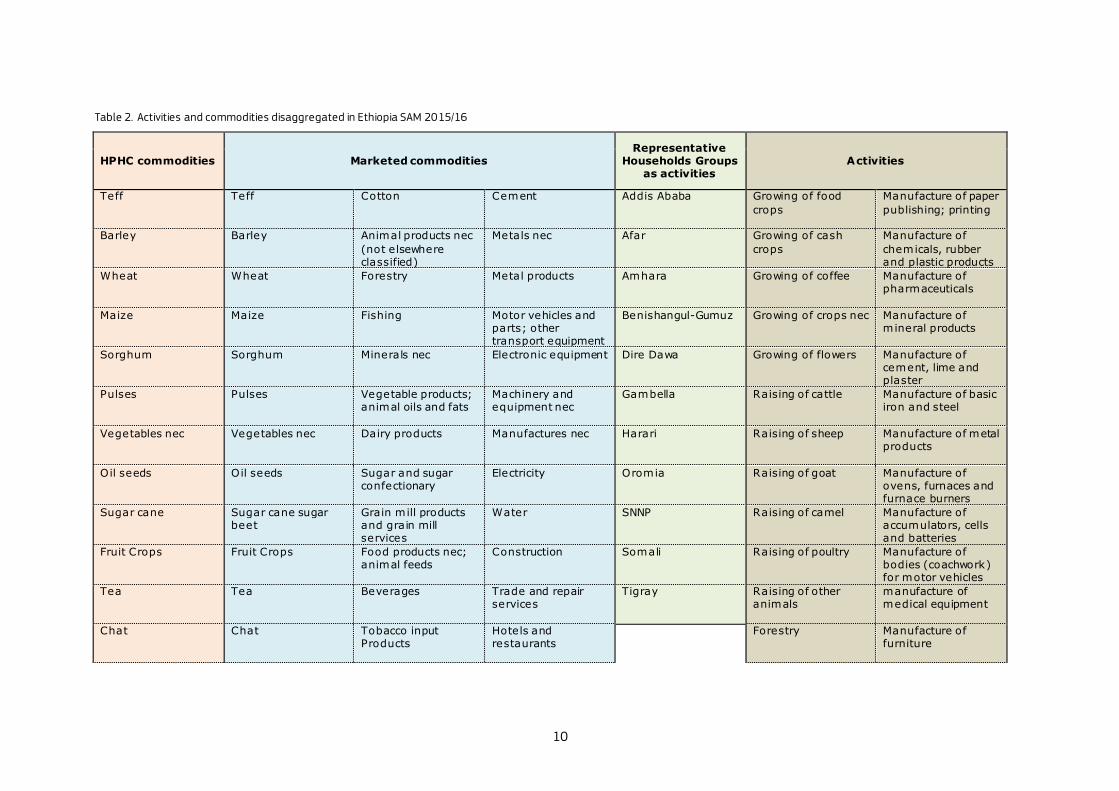
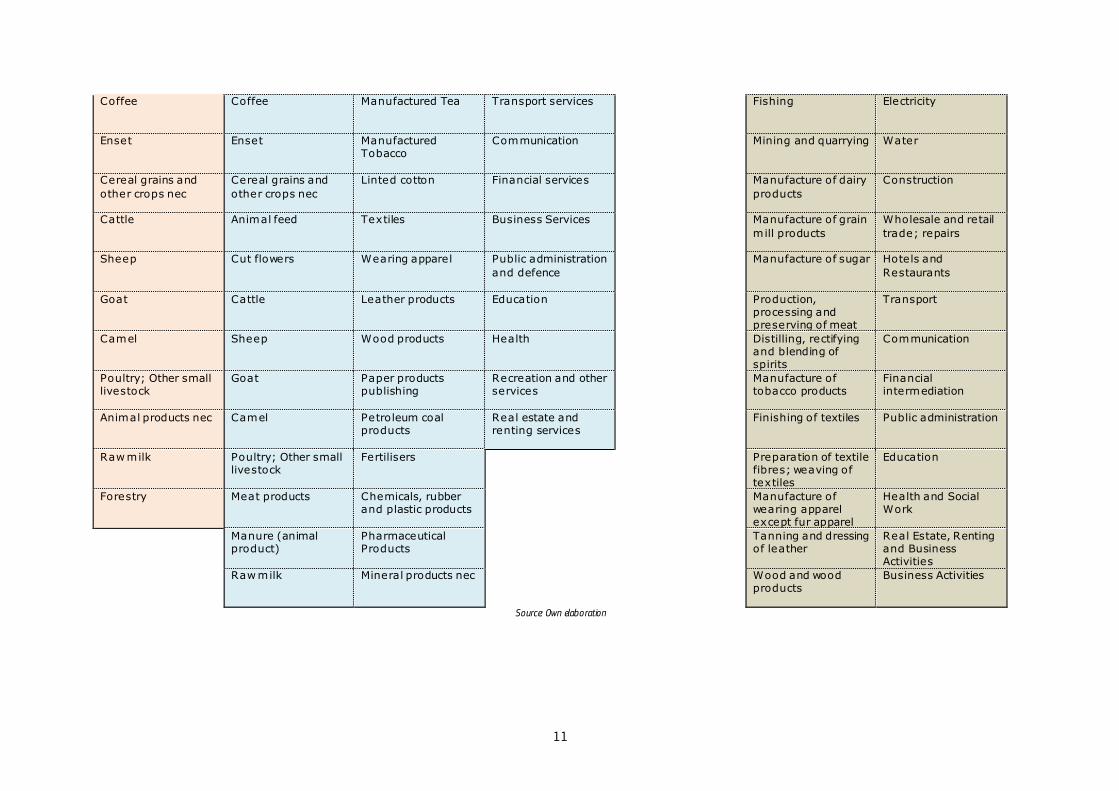
The basic structure of the SAM for Ethiopia 2015/16 is shown in Annex 1 (Table A1.1), and the breakdown of commodities and activities is summarised in Table 2.
Representative households are disaggregated following the 11 administrati ve regions of Ethiopia : Addis Ababa, Afar, Amhara, Benishangul-Gumuz, Dire Dawa, Gambella, Harari, Oromia, SNNP, Somali and Tigray . Each household is further disaggregated into three categories: rural, small towns, medium and large towns/cities. Note that for some regions, not all three zones are covered.4 Finally, 28 RHGs are included.5
The SAM accounts for three types of agricultural production agents: 11 household agricultural activities (ahf), one per administrative region, producing 23 ‘subsistence commodities’ not marketed and consumed at home, and 15 marketed crops. The national activities sectors (representing the market -oriented larger ho lder producers) produce food and cash crops.
4 In Addis Ababa, only the category medium and large towns /cities is considered. Furthermore, in Ben ishangul- Gumuz medium and large towns is omitted, a s
is s mall towns in Diredwa and Harari.
5 A SAM traditionally adopts the concept of Representative Household Group (RHG), where different households group are represented b y a n a gg rega te d
account. The assumption is that all individual households in an RHG are, on average, affected in the same manner by a policy s h oc k . Th us , i n fo rming household groups, it is very important to consider similar preferences and characteristics (similar households are more lik ely to be affected s imi lar ly b y economic shocks).
Activities Commodities Factors Enterprises Households Government Taxes InvestmentRest of the
WorldTotal
Activities 2,151,741 2,151,741
Commodities 735,638 1,099,313 148,837 588,705 122,366 2,694,859
Factors 1,416,103 9,282 1,425,386
Enterprises 509,423 5,595 277 515,295
Households 910,486 369,922 11,211 127,340 1,418,959
Government 18,729 8,298 188,892 28,570 244,489
Taxes 118,590 41,207 29,096 188,892
Saving 84,828 279,600 73,063 151,215 588,705
Rest of the World 424,528 5,478 610 2,652 5,783 439,051
Total 2,151,741 2,694,859 1,425,386 515,295 1,418,959 244,489 188,892 588,705 439,051
10
Table 2. Activities and commodities disaggregated in Ethiopia SAM 2015/16
HPHC commodities Marketed commodities Representative
Households Groups as activities
Activities
Teff Teff Cotton Cement Addis Ababa Growing of food
crops
Manufacture of paper
publishing; printing
Barley Barley Animal products nec
(not elsewhere classified)
Metals nec Afar Growing of cash
crops
Manufacture of
chemicals, rubber and plastic products
Wheat Wheat Forestry Metal products Amhara Growing of coffee Manufacture of pharmaceuticals
Maize Maize Fishing Motor vehicles and parts; other transport equipment
Benishangul-Gumuz Growing of crops nec Manufacture of mineral products
Sorghum Sorghum Minerals nec Electronic equipment Dire Dawa Growing of flowers Manufacture of cement, lime and plaster
Pulses Pulses Vegetable products; animal oils and fats
Machinery and equipment nec
Gambella Raising of cattle Manufacture of basic iron and steel
Vegetables nec Vegetables nec Dairy products Manufactures nec Harari Raising of sheep Manufacture of metal products
Oil seeds Oil seeds Sugar and sugar confectionary
Electricity Oromia Raising of goat Manufacture of ovens, furnaces and furnace burners
Sugar cane Sugar cane sugar beet
Grain mill products and grain mill services
Water SNNP Raising of camel Manufacture of accumulators, cells and batteries
Fruit Crops Fruit Crops Food products nec; animal feeds
Construction Somali Raising of poultry Manufacture of bodies (coachwork) for motor vehicles
Tea Tea Beverages Trade and repair services
Tigray Raising of other animals
manufacture of medical equipment
Chat Chat Tobacco input Products
Hotels and restaurants
Forestry Manufacture of furniture
11
Coffee Coffee Manufactured Tea Transport services Fishing Electricity
Enset Enset Manufactured Tobacco
Communication Mining and quarrying Water
Cereal grains and
other crops nec
Cereal grains and
other crops nec
Linted cotton Financial services Manufacture of dairy
products
Construction
Cattle Animal feed Textiles Business Services Manufacture of grain
mill products
Wholesale and retail
trade; repairs
Sheep Cut flowers Wearing apparel Public administration
and defence
Manufacture of sugar Hotels and
Restaurants
Goat Cattle Leather products Education Production, processing and preserving of meat
Transport
Camel Sheep Wood products Health Distilling, rectifying and blending of spirits
Communication
Poultry; Other small livestock
Goat Paper products publishing
Recreation and other services
Manufacture of tobacco products
Financial intermediation
Animal products nec Camel Petroleum coal products
Real estate and renting services
Finishing of textiles Public administration
Raw milk Poultry; Other small livestock
Fertilisers
Preparation of textile fibres; weaving of textiles
Education
Forestry Meat products Chemicals, rubber and plastic products
Manufacture of wearing apparel except fur apparel
Health and Social Work
Manure (animal product)
Pharmaceutical Products
Tanning and dressing of leather
Real Estate, Renting and Business Activities
Raw milk Mineral products nec
Wood and wood products
Business Activities
Source: Own elaboration

12
Three types of labour are considered: skilled, semi-skilled and unskilled. Each labour type is reg ionalised by administrative region; the SAM thus accounts for 33 types of labour. The capital factor is disaggregated into land, livestock and non-agricultural capital.
The SAM considers specific accounts for direct taxes, indirect taxes on commodity sales ( inc luding value-added taxes), and import taxes to address fiscal policies.
In summary, the SAM for Ethiopia 2015/16 consists of 227 accounts: 61 activities (11 of them accounts for households as producers), producing 71 marketed and 23 HPHC commodities, using 3 types of labour (skilled, unskilled and semi-skilled) in 11 administrative regions (33 labour accounts), 3 types of capita l, 3 types of taxes, 28 regionalised RHGs and one account each for margins, saving-investment, enterprises, government and rest of the world.
To satisfy the simulation needs of this report, an extended version of the SAM has been estimated with 255 accounts. This SAM splits the capital land factor into 22 accounts, since land is divided into irrigated and non-irrigated for each administrative region. Furthermore, the investments account is disaggregated into roads , irrigation and other investments (which includes all other investments types). Moreover, input subsid ie s are separated from the indirect tax account for specific commodities. A commodity extension services has been disaggregated from the production of public administration services.
3.2 Job multipliers analysis
Derived from the SAM and Input-output framework, the analysis of linear multipliers is a useful tool to assess the potential of economic sectors to generate output and employment. Due to strong assumptions needed to derive multipliers (especially the assumption of Leontief technologies, with fixed prices and no substitution elasticities), the results should be taken with some caution, even if the comparability of the multi -sectoral qualitative analysis and its usefulness is not jeopardised. Results show employment multipliers6, providing the number of additional jobs per million Birr (ETB 1 million) of additional exogenous demand (and subsequent production) for each group of commodities.
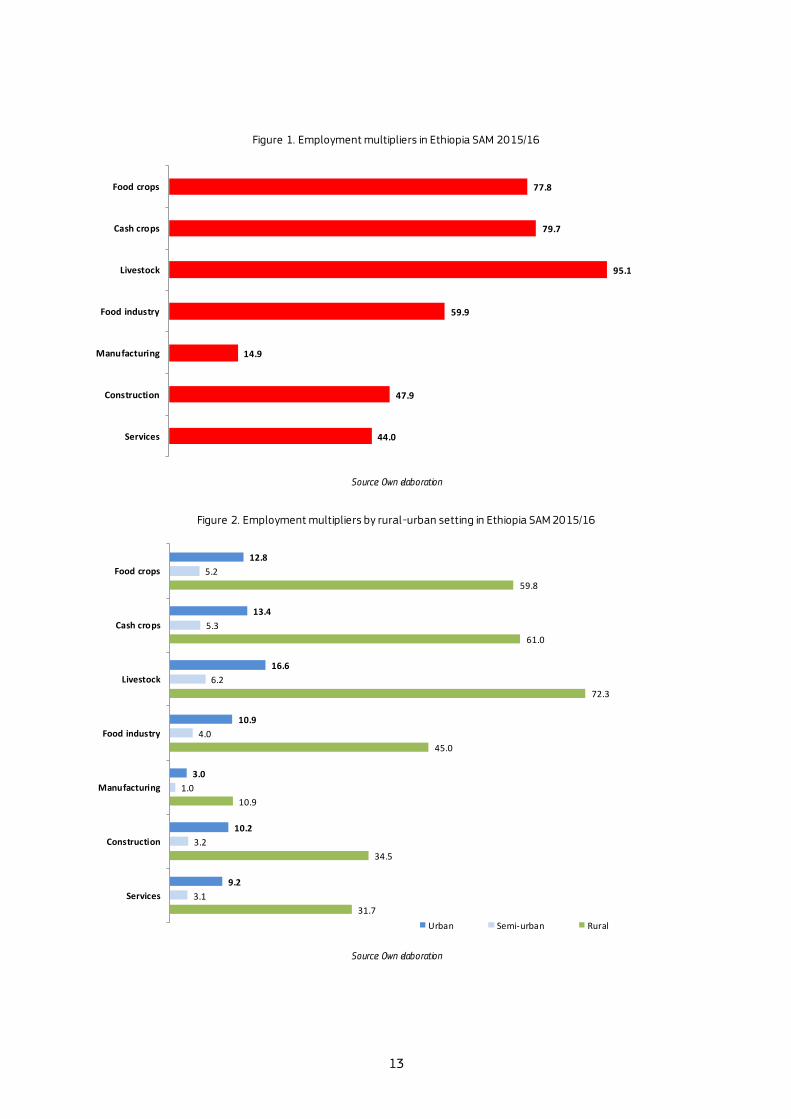
The picture of the Ethiopian economy shows that, under current conditions, livestock activities are those with the highest employment generation capacity (more than 95 jobs per million b irr of exogenous demand) , followed by cash crops (79.7) and food crops (77.8). The agri-food industry can generate almost 60 jobs , while construction would produce 48 jobs per million birr, compared to 44 jobs for the service sectors . Manufacturing is the lowest labour-intensive sector and would barely reach 15 jobs created per million birr of exogenous demand (Figure 1).
There are larger discrepancies between rural and urban settings (Figure 2). Given the current structure of the Ethiopian economy, agriculture, the food industry and the manufacturing sector have the greatest absorption capacity for job creation in rural areas of the country, as compared to urban and semi-urban areas.
6 Multipliers are based on the SAM Leontief inverse M = (I–A)-1, where the matrix A is the so-called coefficient matrix (whose elements are the element s o f
the SAM divided by the total of their corresponding column) and each element mij in M depicts the output requirements of account i to increase the final demand of account j by one unit. These are the output multipliers. Employment multipliers are obtained using a diagonal matri x (E) populated with t h e
ratio of the number of jobs per unit of output value 6. Naming Ma the submatrix of M forming by the productive accounts rows and t h e c o mmodi t i es
columns, the expression of the employment multiplier, Me, is Me=E Ma. Employment multipliers are obtained using a diagonal matrix (E) populated with the ratio of the number of jobs per unit of output value6. Naming Ma the s ubmatrix of M forming by the productive accounts rows and the commodities
columns, the expression of the employment multiplier, Me, is Me=E Ma.
13
Figure 1. Employment multipliers in Ethiopia SAM 2015/16
Source: Own elaboration
Figure 2. Employment multipliers by rural-urban setting in Ethiopia SAM 2015/16
Source: Own elaboration
77.8
79.7
95.1
59.9
14.9
47.9
44.0
Food crops
Cash crops
Livestock
Food industry
Manufacturing
Construction
Services
12.8
13.4
16.6
10.9
3.0
10.2
9.2
5.2
5.3
6.2
4.0
1.0
3.2
3.1
59.8
61.0
72.3
45.0
10.9
34.5
31.7
Food crops
Cash crops
Livestock
Food industry
Manufacturing
Construction
Services
Urban Semi-urban Rural
14
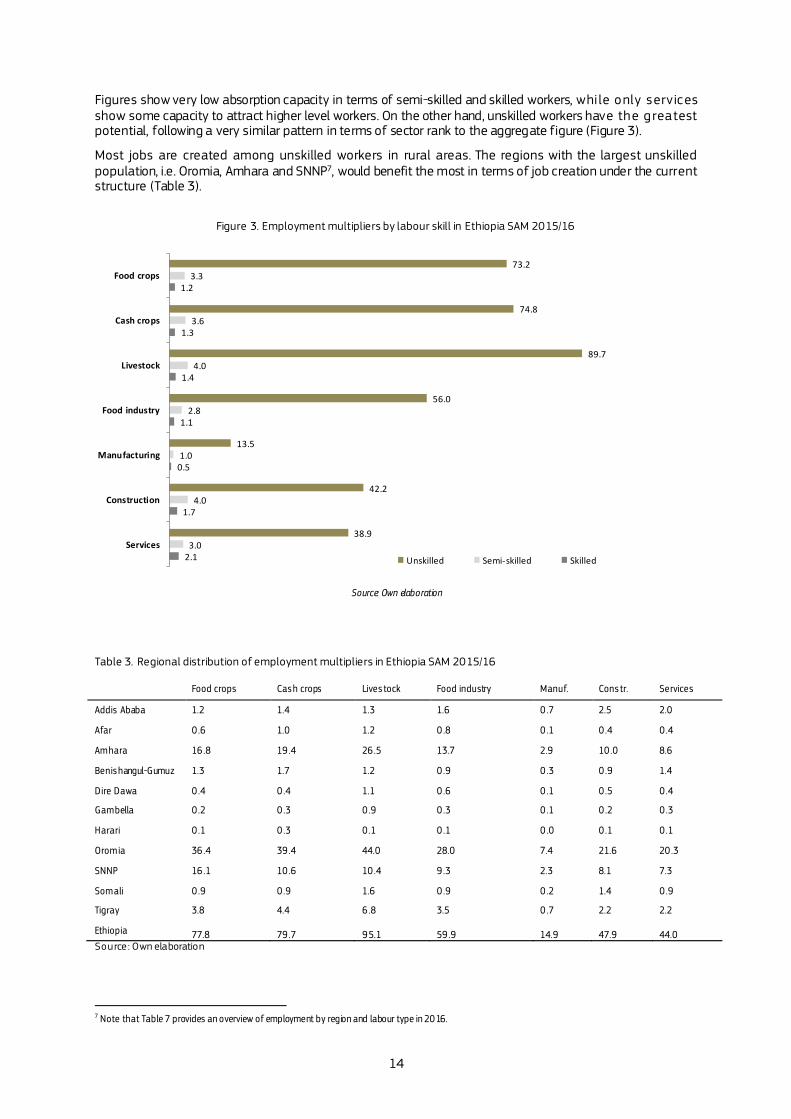
Figures show very low absorption capacity in terms of semi-skilled and skilled workers, while only services show some capacity to attract higher level workers. On the other hand, unskilled workers have the greatest potential, following a very similar pattern in terms of sector rank to the aggregate figure (Figure 3).
Most jobs are created among unskilled workers in rural areas. The regions with the largest unskilled population, i.e. Oromia, Amhara and SNNP7, would benefit the most in terms of job creation under the current structure (Table 3).
Figure 3. Employment multipliers by labour skill in Ethiopia SAM 2015/16
Source: Own elaboration
Table 3. Regional distribution of employment multipliers in Ethiopia SAM 2015/16
Food crops Cash crops Lives tock Food industry Manuf. Cons tr. Services
Addis Ababa 1.2 1.4 1.3 1.6 0 .7 2.5 2.0
Afar 0 .6 1.0 1.2 0 .8 0 .1 0 .4 0 .4
Amhara 16 .8 19 .4 26 .5 13.7 2.9 10 .0 8.6
Benis hangul-Gumuz 1.3 1.7 1.2 0 .9 0 .3 0 .9 1.4
Dire Dawa 0 .4 0 .4 1.1 0 .6 0 .1 0 .5 0 .4
Gambella 0 .2 0 .3 0 .9 0 .3 0 .1 0 .2 0 .3
Harari 0 .1 0 .3 0 .1 0 .1 0 .0 0 .1 0 .1
Oromia 36 .4 39 .4 44.0 28.0 7.4 21.6 20 .3
SNNP 16 .1 10 .6 10 .4 9 .3 2.3 8.1 7.3
Somali 0 .9 0 .9 1.6 0 .9 0 .2 1.4 0 .9
Tigray 3.8 4.4 6 .8 3.5 0 .7 2.2 2.2
Ethiopia 77.8 79 .7 95.1 59 .9 14.9 47.9 44.0 Source : Own elaboration
7 Note that Table 7 provides an overview of employment by region and labour type in 2016.
73.2
74.8
89.7
56.0
13.5
42.2
38.9
3.3
3.6
4.0
2.8
1.0
4.0
3.0
1.2
1.3
1.4
1.1
0.5
1.7
2.1
Food crops
Cash crops
Livestock
Food industry
Manufacturing
Construction
Services
Unskilled Semi-skilled Skilled
15
3.3 The Model: DEMETRA
DEMETRA is an extended version of the single-country CGE model documented in Aragie et al. (2017) , based on McDonald (2007). It incorporates a series of additional behavioural relationships to better account for economic relationships in developing countries, in particular in the least developed and sub-Saharan African countries. This version of the model includes several enhanced features compared to its original form. Firstly, it includes a recursive dynamic version, with a new approach to handle domestic migration. In addition , the model accounts for impacts of investments on physical and human capita l, an enhanced vers ion of the treatment of demographics, and the inclusion of a completely flexible nested production. For additional details on the modelling techniques, see Boulanger et al. (2018a) and Boulanger et al. (2018b).
The recursive dynamics version accounts for physical capital accumulation due to investments and the demographic evolution of the country (i.e. population and labour force). The demographic profile is influenced by the evolution of human capital (i.e. labour productivity), as birth and death rates are linked to spending on health (reduction of death rate) and education services (reduction of birth rate). Dynamic equations of the model include the increase in irrigated land due to investments in irrigation infrastructure; the increase in labour, fertiliser and seed productivity due to spending on extension services; and the reduction in trade and transportation costs due to investments in roads. The model links different investment types with d ifferent capital factors and distinguishes the investments in roads and irrigation from the other type of investments.
The domestic migration flows account for the response of households and labour types to d ifferences in household incomes and wages in different regions. As household incomes and wages increase, more people migrate to that region. The model also includes an exogenous migration share which accounts for the baseline projected rate of urbanisation.
The production side of the model allows for completely flexible constant e lastic ity of substitution (CES) nesting. In the agricultural sectors, the intermediate inputs are perfectly complementary (i.e. under a Leontief production function). Different labour and capital types are imperfect substitutes, allowing producers to switch to less expensive labour or more productive labour or capital types. Fertilisers are substitutable for land , although with a low elasticity of substitution. Land, labour, capital and intermediate input composites are combined with a CES production at the top nest and hence are all imperfect substitutes . The structure of production in the other sectors is standard: intermediate input composite, labour and capital are imperfect substitutes. However, intermediate inputs are combined in a Leontief nest, i.e. they are perfect complements.
The model includes a detailed description of the public budget dedicated to agriculture, to precisely a llocate recurrent (extension, education, health) expenditures, investments (irrigation, road, other) and subsidies (input, labour, capital and other), and to calculate whether or not the commitment under the Malabo Declaration to dedicate 10% of public expenditure to agriculture is achieved.
16
4 Scenarios
4.1 Scenario development
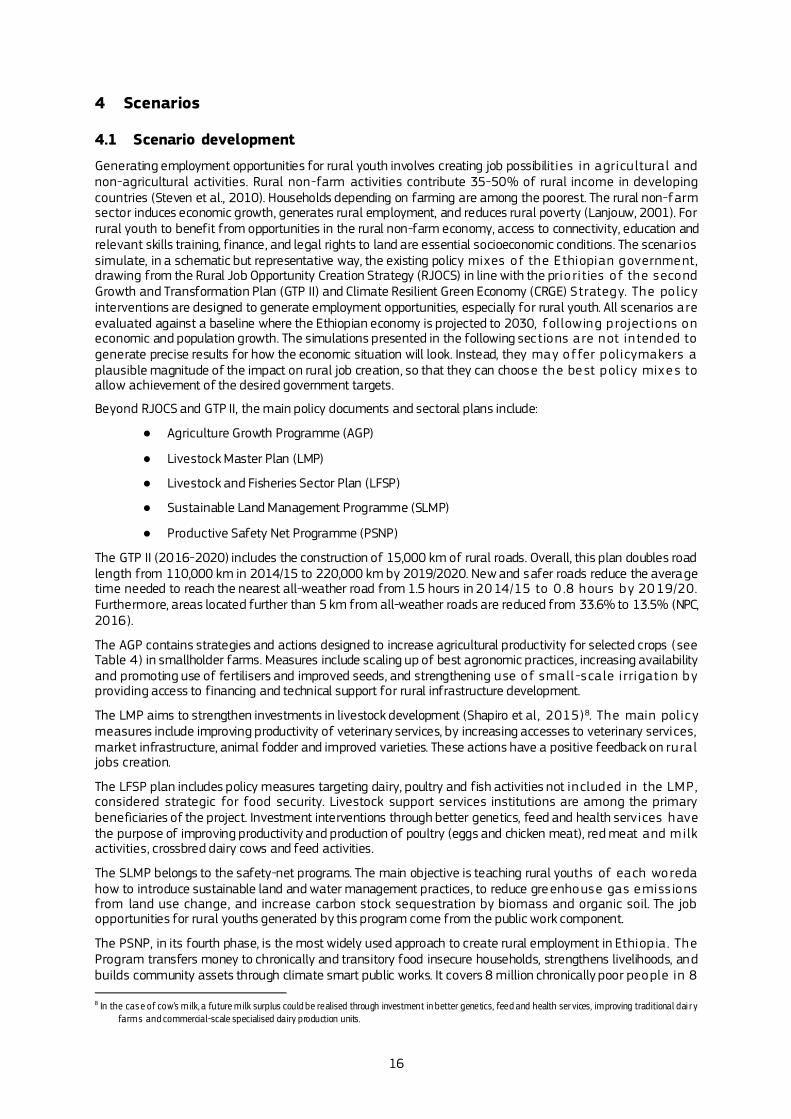
Generating employment opportunities for rural youth involves creating job possibilities in agricu ltural and non-agricultural activities. Rural non-farm activities contribute 35-50% of rural income in developing countries (Steven et al., 2010). Households depending on farming are among the poorest. The rural non-farm sector induces economic growth, generates rural employment, and reduces rural poverty (Lanjouw, 2001). For rural youth to benefit from opportunities in the rural non-farm economy, access to connectivity, education and relevant skills training, finance, and legal rights to land are essential socioeconomic conditions. The scenarios simulate, in a schematic but representative way, the existing policy mixes of the Ethiopian government, drawing from the Rural Job Opportunity Creation Strategy (RJOCS) in line with the prio rities of the second Growth and Transformation Plan (GTP II) and Climate Resilient Green Economy (CRGE) Strategy. The po licy interventions are designed to generate employment opportunities, especially for rural youth. All scenarios are evaluated against a baseline where the Ethiopian economy is projected to 2030, following p rojections on economic and population growth. The simulations presented in the following sections are not in tended to generate precise results for how the economic situation will look. Instead, they may offer policymakers a plausible magnitude of the impact on rural job creation, so that they can choose the best policy mixes to allow achievement of the desired government targets.
Beyond RJOCS and GTP II, the main policy documents and sectoral plans include:
● Agriculture Growth Programme (AGP)
● Livestock Master Plan (LMP)
● Livestock and Fisheries Sector Plan (LFSP)
● Sustainable Land Management Programme (SLMP)
● Productive Safety Net Programme (PSNP)
The GTP II (2016-2020) includes the construction of 15,000 km of rural roads. Overall, this plan doubles road length from 110,000 km in 2014/15 to 220,000 km by 2019/2020. New and safer roads reduce the average time needed to reach the nearest all-weather road from 1.5 hours in 2014/15 to 0 .8 hours by 2019/20. Furthermore, areas located further than 5 km from all-weather roads are reduced from 33.6% to 13.5% (NPC, 2016).
The AGP contains strategies and actions designed to increase agricultural productivity for selected crops (see Table 4) in smallholder farms. Measures include scaling up of best agronomic practices, increasing availability and promoting use of fertilisers and improved seeds, and strengthening use of small -scale irrigation by providing access to financing and technical support for rural infrastructure development.
The LMP aims to strengthen investments in livestock development (Shapiro et al, 2015)8. The main policy measures include improving productivity of veterinary services, by increasing accesses to veterinary services, market infrastructure, animal fodder and improved varieties. These actions have a positive feedback on rural jobs creation.
The LFSP plan includes policy measures targeting dairy, poultry and fish activities not included in the LMP, considered strategic for food security. Livestock support services institutions are among the primary beneficiaries of the project. Investment interventions through better genetics, feed and health services have the purpose of improving productivity and production of poultry (eggs and chicken meat), red meat and milk activities, crossbred dairy cows and feed activities.
The SLMP belongs to the safety-net programs. The main objective is teaching rural youths of each woreda how to introduce sustainable land and water management practices, to reduce greenhouse gas emiss ions from land use change, and increase carbon stock sequestration by biomass and organic soil. The job opportunities for rural youths generated by this program come from the public work component.
The PSNP, in its fourth phase, is the most widely used approach to create rural employment in Ethiop ia . The Program transfers money to chronically and transitory food insecure households, strengthens livelihoods, and builds community assets through climate smart public works. It covers 8 million chronically poor people in 8 8 In the case of cow’s milk, a future milk surplus could be realised through investment in better genetics, feed and health ser vices, improving traditional dai r y
farms and commercial-scale specialised dairy production units.
17
regions and could be extended to cover the remaining regions. It also p rovides a contingency budg et to support local communities in dealing with local shocks and a federal contingency budget to support the food needs on the annual humanitarian appeal. Aside from increasing food security, these policies enhance productive watersheds, rural infrastructures and water retention structures and reduce water run-off, as well as strengthening the capability of local administrators.
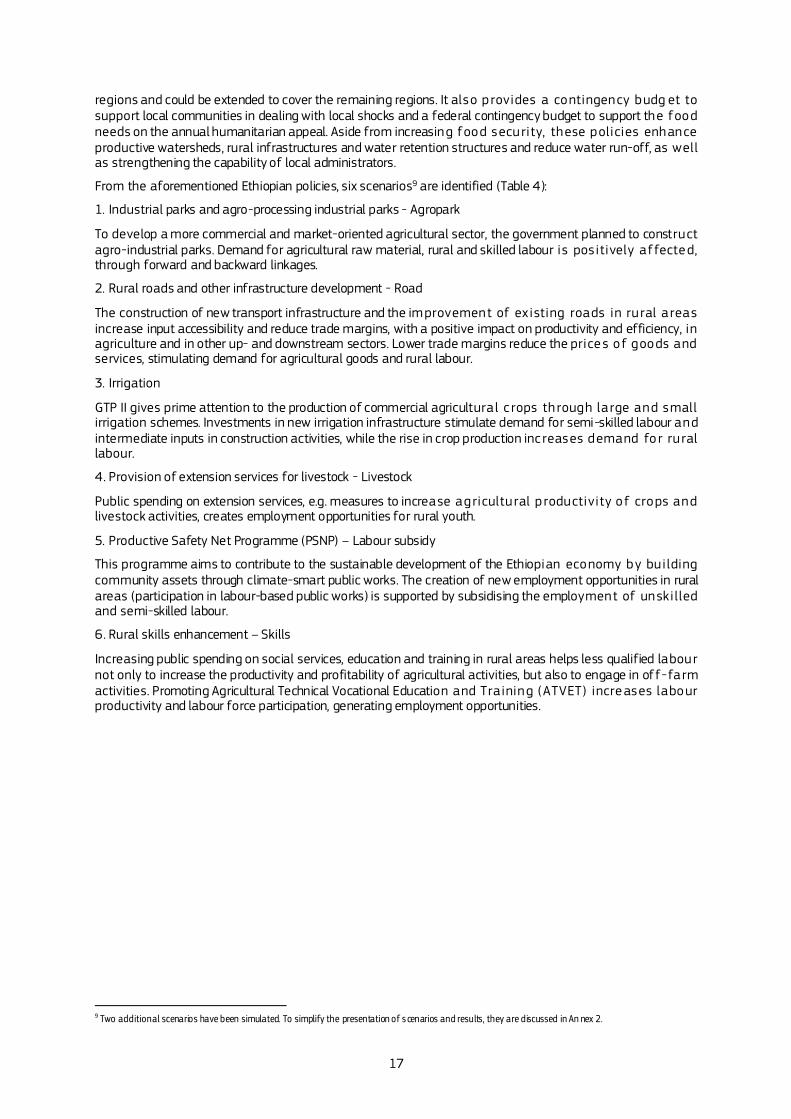
From the aforementioned Ethiopian policies, six scenarios9 are identified (Table 4):
1. Industrial parks and agro-processing industrial parks - Agropark
To develop a more commercial and market-oriented agricultural sector, the government planned to construct agro-industrial parks. Demand for agricultural raw material, rural and skilled labour is pos itively affected, through forward and backward linkages.
2. Rural roads and other infrastructure development - Road
The construction of new transport infrastructure and the improvement of ex isting roads in rural areas increase input accessibility and reduce trade margins, with a positive impact on productivity and efficiency, in agriculture and in other up- and downstream sectors. Lower trade margins reduce the prices of goods and services, stimulating demand for agricultural goods and rural labour.
3. Irrigation
GTP II gives prime attention to the production of commercial agricultural c rops through large and small irrigation schemes. Investments in new irrigation infrastructure stimulate demand for semi-skilled labour and intermediate inputs in construction activities, while the rise in crop production inc reases demand for rural labour.
4. Provision of extension services for livestock - Livestock
Public spending on extension services, e.g. measures to increase agricultural p roductivity of crops and livestock activities, creates employment opportunities for rural youth.
5. Productive Safety Net Programme (PSNP) – Labour subsidy
This programme aims to contribute to the sustainable development of the Ethiopian economy by building community assets through climate-smart public works. The creation of new employment opportunities in rural areas (participation in labour-based public works) is supported by subsidising the employment of unskilled and semi-skilled labour.
6. Rural skills enhancement – Skills
Increasing public spending on social services, education and training in rural areas helps less qualified labour not only to increase the productivity and profitability of agricultural activities, but also to engage in off-farm activities. Promoting Agricultural Technical Vocational Education and Training (ATVET) increases labour productivity and labour force participation, generating employment opportunities.
9 Two additional scenarios have been simulated. To simplify the presentation of s cenarios and results, they are discussed in An nex 2.
18
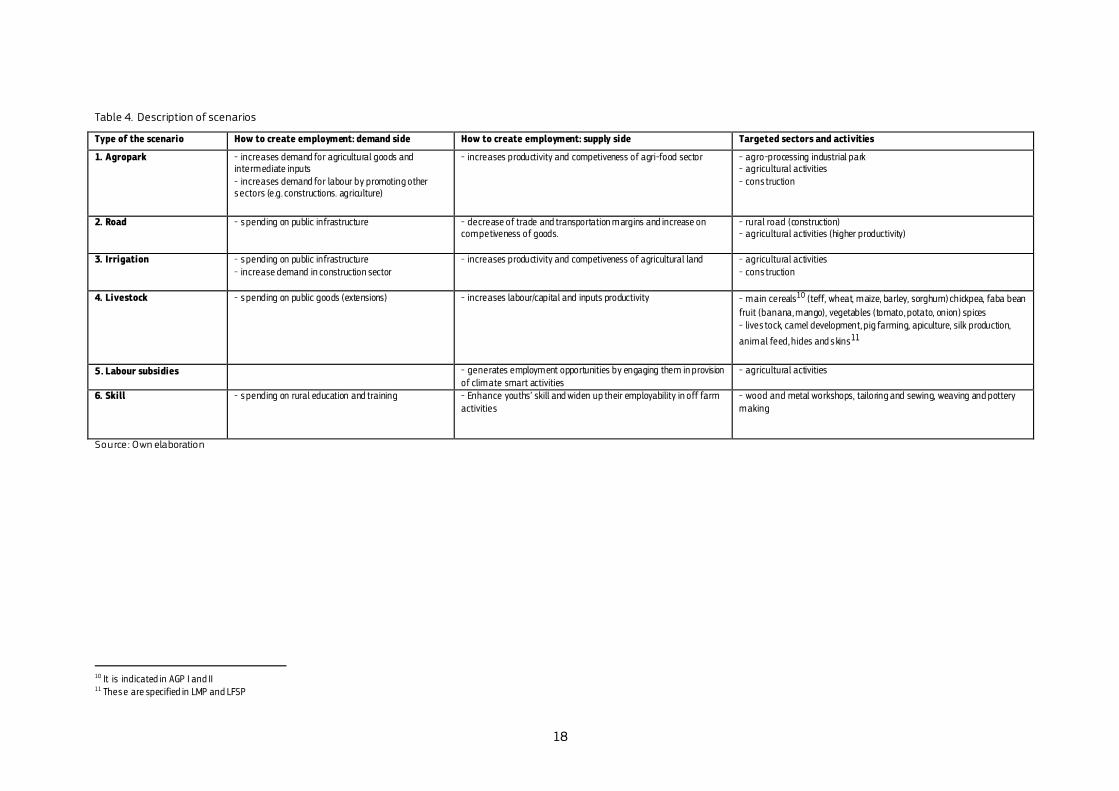
Table 4. Description of scenarios
Type of the scenario How to create employment: demand side How to create employment: supply side Targeted sectors and activities
1. Agropark - increases demand for agricultural goods and intermediate inputs - increases demand for labour by promoting other s ectors (e .g. constructions. agriculture)
- increases productivity and competiveness of agri-food sector - agro-processing industrial park - agricultural activities - cons truction
2. Road - s pending on public infrastructure - decrease of trade and transportation margins and increase on competiveness of goods.
- rural road (construction) - agricultural activities (higher productivity)
3. Irrigation - s pending on public infrastructure - increase demand in construction sector
- increases productivity and competiveness of agricultural land - agricultural activities - cons truction
4. Livestock - s pending on public goods (extensions) - increases labour/capital and inputs productivity
- main cereals10 (teff, wheat, maize, barley, sorghum) chickpea, faba bean
fruit (banana, mango), vegetables (tomato, potato, onion) spices - lives tock, camel development, pig farming, apiculture, silk production,
animal feed, hides and s kins11
5. Labour subsidies - generates employment opportunities by engaging them in provision of climate smart activities
- agricultural activities
6. Skill - s pending on rural education and training - Enhance youths’ skill and widen up their employability in off farm activities
- wood and metal workshops, tailoring and sewing, weaving and pottery making
Source : Own elaboration
10 It is indicated in AGP I and II 11 These are specified in LMP and LFSP
19
4.2 Scenario assumptions
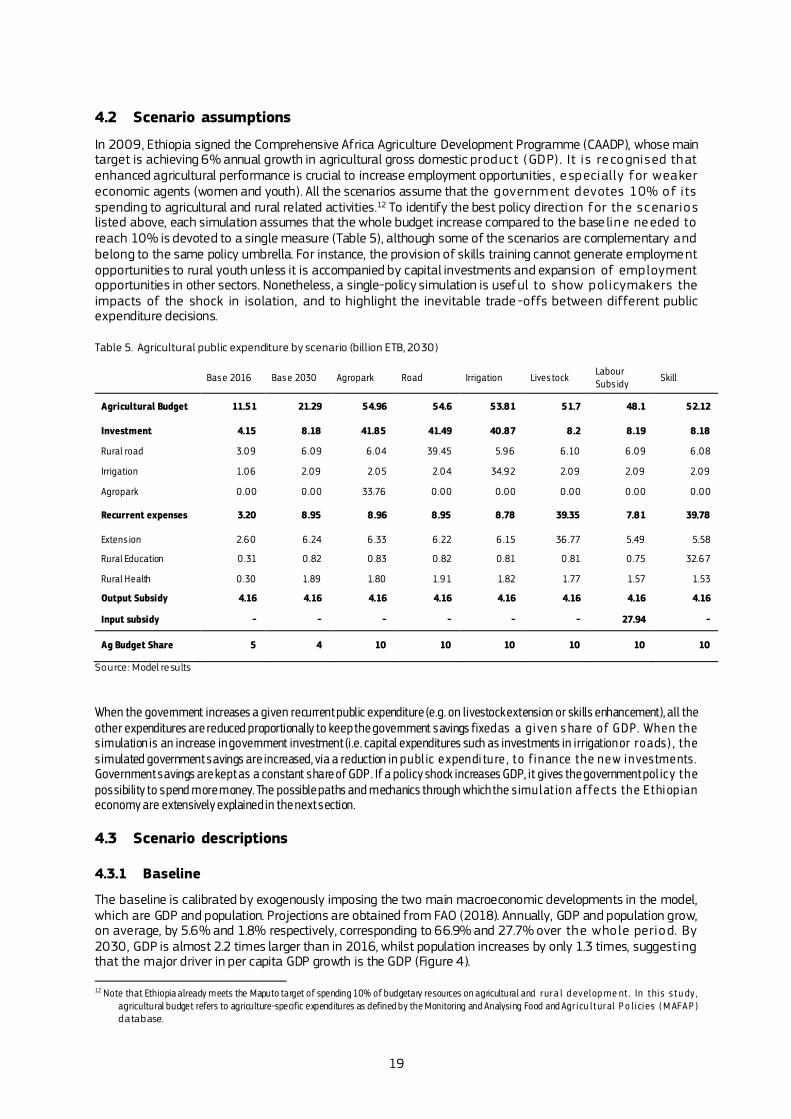
In 2009, Ethiopia signed the Comprehensive Africa Agriculture Development Programme (CAADP), whose main target is achieving 6% annual growth in agricultural gross domestic product (GDP) . It is re cognised that enhanced agricultural performance is crucial to increase employment opportunities , e specially for weaker economic agents (women and youth). All the scenarios assume that the government devotes 10% of its spending to agricultural and rural related activities.12 To identify the best policy direction for the scenarios listed above, each simulation assumes that the whole budget increase compared to the base line needed to reach 10% is devoted to a single measure (Table 5), although some of the scenarios are complementary and belong to the same policy umbrella. For instance, the provision of skills training cannot generate employment opportunities to rural youth unless it is accompanied by capital investments and expansion of employment opportunities in other sectors. Nonetheless, a single-policy simulation is useful to show policymakers the impacts of the shock in isolation, and to highlight the inevitable trade -offs between different public expenditure decisions.
Table 5. Agricultural public expenditure by scenario (billion ETB, 2030)
Base 2016 Base 2030 Agropark Road Irrigation Lives tock
Labour Subs idy
Skill
Agricultural Budget 11.51 21.29 54.96 54.6 53.81 51.7 48.1 52.12
Investment 4.15 8.18 41.85 41.49 40.87 8.2 8.19 8.18
Rural road 3.09 6 .09 6 .04 39 .45 5.96 6 .10 6 .09 6 .08
Irrigation 1.06 2.09 2.05 2.04 34.92 2.09 2.09 2.09
Agropark 0 .00 0 .00 33.76 0 .00 0 .00 0 .00 0 .00 0 .00
Recurrent expenses 3.20 8.95 8.96 8.95 8.78 39.35 7.81 39.78
Extens ion 2.60 6 .24 6 .33 6 .22 6 .15 36 .77 5.49 5.58
Rural Education 0 .31 0 .82 0 .83 0 .82 0 .81 0 .81 0 .75 32.67
Rural Health 0 .30 1.89 1.80 1.91 1.82 1.77 1.57 1.53
Output Subsidy 4.16 4.16 4.16 4.16 4.16 4.16 4.16 4.16
Input subsidy - - - - - - 27.94 -
Ag Budget Share 5 4 10 10 10 10 10 10
Source : Model results
When the government increases a given recurrent public expenditure (e.g. on livestock extension or skills enhancement), all the other expenditures are reduced proportionally to keep the government savings fixed as a g i ven s hare of GDP. When the s imulation is an increase in government investment (i.e. capital expenditures such as investments in irrigation or roads) , the s imulated government savings are increased, via a reduction in publ ic e xpendi tu re , to fi nance the new i nvestments . Government savings are kept as a constant share of GDP. If a policy shock increases GDP, it gives the government pol icy the possibility to spend more money. The possible paths and mechanics through which the s imu lat ion affe cts the Ethi op ian economy are extensively explained in the next section.
4.3 Scenario descriptions
4.3.1 Baseline
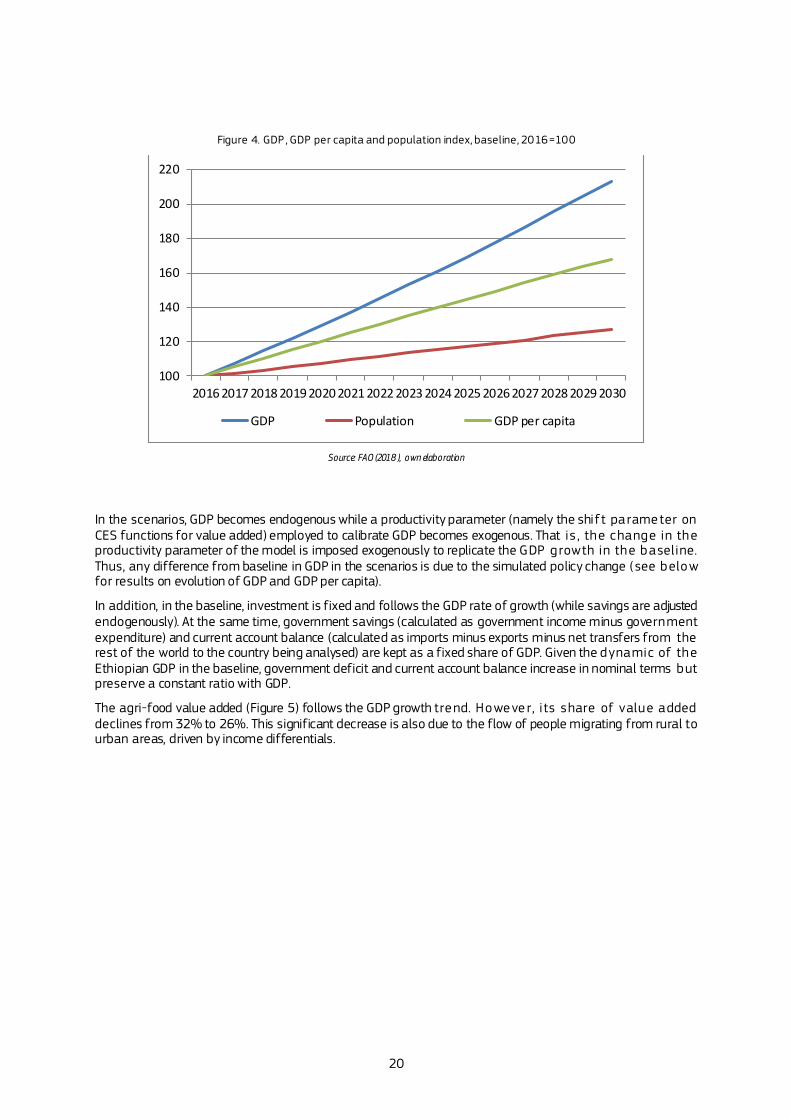
The baseline is calibrated by exogenously imposing the two main macroeconomic developments in the model, which are GDP and population. Projections are obtained from FAO (2018). Annually, GDP and population grow, on average, by 5.6% and 1.8% respectively, corresponding to 66.9% and 27.7% over the whole period. By 2030, GDP is almost 2.2 times larger than in 2016, whilst population increases by only 1.3 times, suggesting that the major driver in per capita GDP growth is the GDP (Figure 4).
12 Note that Ethiopia already meets the Maputo target of spending 10% of budgetary resources on agricultural and r ura l d evelop me nt . In t hi s s t u dy ,
agricultural budget refers to agriculture-specific expenditures as defined by the Monitoring and Analysing Food and Agr i cu l t ural P o l i ci es ( M AFA P ) database.
20
Figure 4. GDP , GDP per capita and population index, baseline, 2016=100
Source: FAO (2018 ), own elaboration
In the scenarios, GDP becomes endogenous while a productivity parameter (namely the shift parameter on CES functions for value added) employed to calibrate GDP becomes exogenous. That is , the change in the productivity parameter of the model is imposed exogenously to replicate the GDP growth in the baseline. Thus, any difference from baseline in GDP in the scenarios is due to the simulated policy change (see below for results on evolution of GDP and GDP per capita).
In addition, in the baseline, investment is fixed and follows the GDP rate of growth (while savings are adjusted endogenously). At the same time, government savings (calculated as government income minus government expenditure) and current account balance (calculated as imports minus exports minus net transfers from the rest of the world to the country being analysed) are kept as a fixed share of GDP. Given the dynamic of the Ethiopian GDP in the baseline, government deficit and current account balance increase in nominal terms but preserve a constant ratio with GDP.
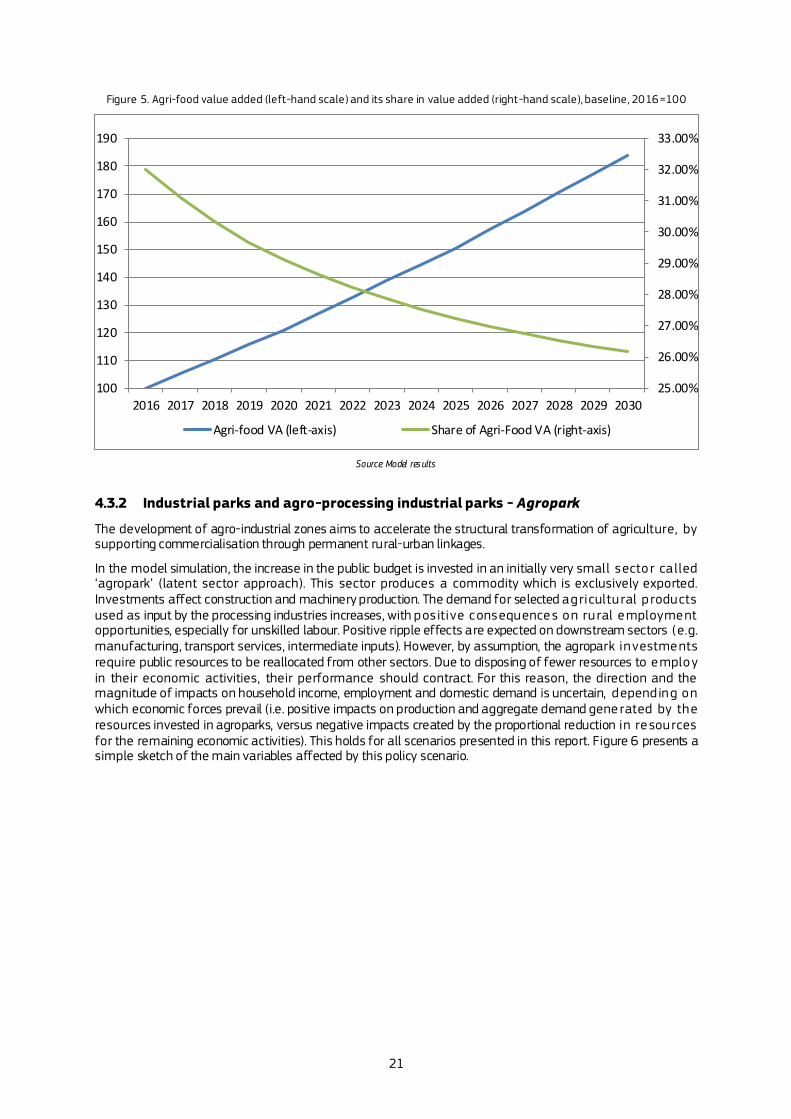
The agri-food value added (Figure 5) follows the GDP growth trend. Howeve r, its share of value added declines from 32% to 26%. This significant decrease is also due to the flow of people migrating from rural to urban areas, driven by income differentials.
100
120
140
160
180
200
220
2016 2017 2018 2019 2020 2021 2022 2023 2024 2025 2026 2027 2028 2029 2030
GDP Population GDP per capita
21
Figure 5. Agri-food value added (left-hand scale) and its share in value added (right-hand scale), baseline, 2016=100
Source: Model res ults
4.3.2 Industrial parks and agro-processing industrial parks - Agropark
The development of agro-industrial zones aims to accelerate the structural transformation of agriculture, by supporting commercialisation through permanent rural-urban linkages.
In the model simulation, the increase in the public budget is invested in an initially very small sector called ‘agropark’ (latent sector approach). This sector produces a commodity which is exclusively exported. Investments affect construction and machinery production. The demand for selected agricultural p roducts used as input by the processing industries increases, with pos itive consequences on rural employment opportunities, especially for unskilled labour. Positive ripple effects are expected on downstream sectors (e.g. manufacturing, transport services, intermediate inputs). However, by assumption, the agropark investments require public resources to be reallocated from other sectors. Due to disposing of fewer resources to employ in their economic activities, their performance should contract. For this reason, the direction and the magnitude of impacts on household income, employment and domestic demand is uncertain, depending on which economic forces prevail (i.e. positive impacts on production and aggregate demand gene rated by the resources invested in agroparks, versus negative impacts created by the proportional reduction in resources for the remaining economic activities). This holds for all scenarios presented in this report. Figure 6 presents a simple sketch of the main variables affected by this policy scenario.
25.00%
26.00%
27.00%
28.00%
29.00%
30.00%
31.00%
32.00%
33.00%
100
110
120
130
140
150
160
170
180
190
2016 2017 2018 2019 2020 2021 2022 2023 2024 2025 2026 2027 2028 2029 2030
Agri-food VA (left-axis) Share of Agri-Food VA (right-axis)
22
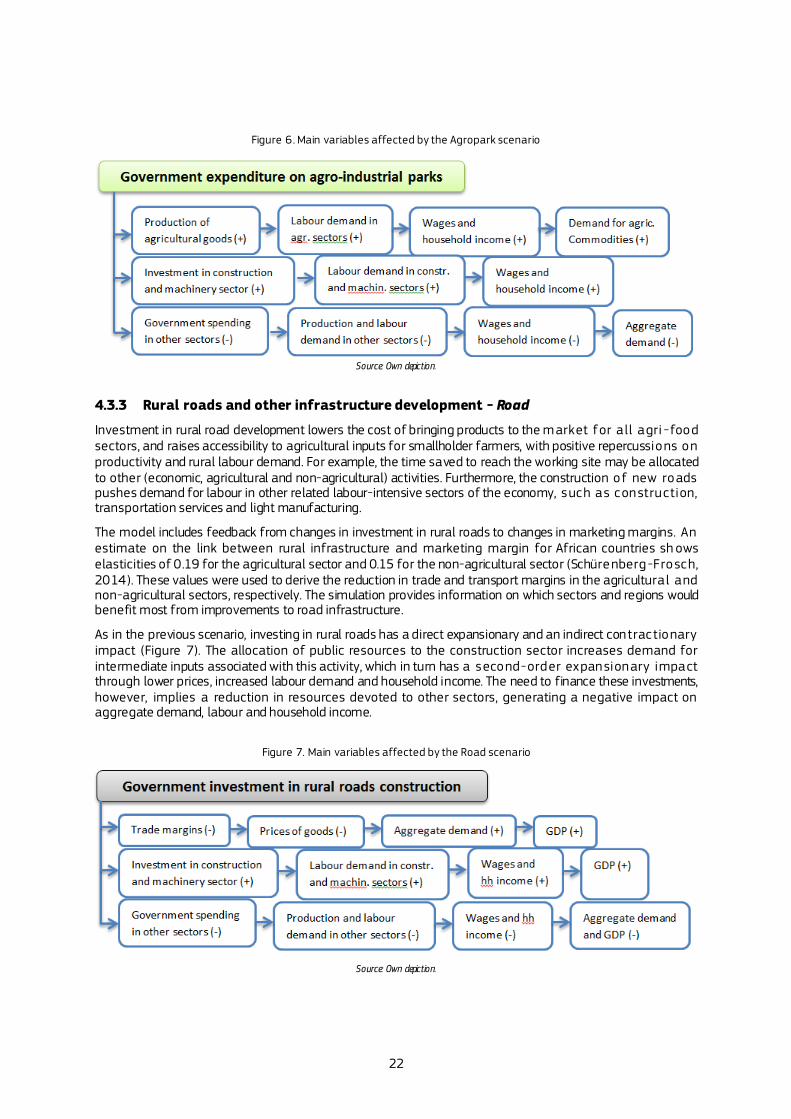
Figure 6. Main variables affected by the Agropark scenario
Source: Own depiction.
4.3.3 Rural roads and other infrastructure development - Road
Investment in rural road development lowers the cost of bringing products to the market for a ll agri -food sectors, and raises accessibility to agricultural inputs for smallholder farmers, with positive repercussions on productivity and rural labour demand. For example, the time saved to reach the working site may be allocated to other (economic, agricultural and non-agricultural) activities. Furthermore, the construction of new roads pushes demand for labour in other related labour-intensive sectors of the economy, such as construction, transportation services and light manufacturing.
The model includes feedback from changes in investment in rural roads to changes in marketing margins. An estimate on the link between rural infrastructure and marketing margin for African countries sh ows elasticities of 0.19 for the agricultural sector and 0.15 for the non-agricultural sector (Schürenberg -Frosch, 2014). These values were used to derive the reduction in trade and transport margins in the agricultural and non-agricultural sectors, respectively. The simulation provides information on which sectors and regions would benefit most from improvements to road infrastructure.
As in the previous scenario, investing in rural roads has a direct expansionary and an indirect contractionary impact (Figure 7). The allocation of public resources to the construction sector increases demand for intermediate inputs associated with this activity, which in turn has a second-order expansionary impact through lower prices, increased labour demand and household income. The need to finance these investments, however, implies a reduction in resources devoted to other sectors, generating a negative impact on aggregate demand, labour and household income.
Figure 7. Main variables affected by the Road scenario
Source: Own depiction.
23
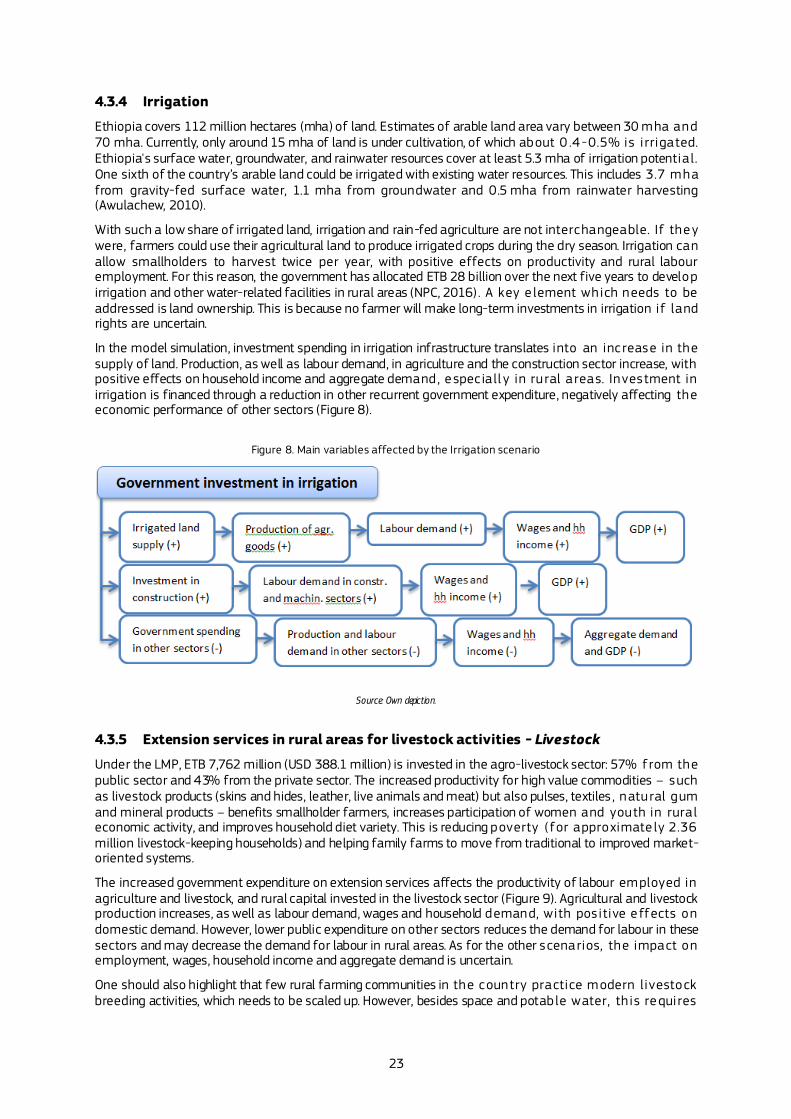
4.3.4 Irrigation
Ethiopia covers 112 million hectares (mha) of land. Estimates of arable land area vary between 30 mha and 70 mha. Currently, only around 15 mha of land is under cultivation, of which about 0 .4 -0.5% is irrigated. Ethiopia's surface water, groundwater, and rainwater resources cover at least 5.3 mha of irrigation potentia l. One sixth of the country’s arable land could be irrigated with existing water resources. This includes 3.7 mha from gravity-fed surface water, 1.1 mha from groundwater and 0.5 mha from rainwater harvesting (Awulachew, 2010).
With such a low share of irrigated land, irrigation and rain-fed agriculture are not interchangeable. If they were, farmers could use their agricultural land to produce irrigated crops during the dry season. Irrigation can allow smallholders to harvest twice per year, with positive effects on productivity and rural labour employment. For this reason, the government has allocated ETB 28 billion over the next five years to develop irrigation and other water-related facilities in rural areas (NPC, 2016) . A key e lement which needs to be addressed is land ownership. This is because no farmer will make long-term investments in irrigation if land rights are uncertain.
In the model simulation, investment spending in irrigation infrastructure translates into an inc rease in the supply of land. Production, as well as labour demand, in agriculture and the construction sector increase, with positive effects on household income and aggregate demand, espec ia ll y in rural areas. Investment in irrigation is financed through a reduction in other recurrent government expenditure, negatively affecting the economic performance of other sectors (Figure 8).
Figure 8. Main variables affected by the Irrigation scenario
Source: Own depiction.
4.3.5 Extension services in rural areas for livestock activities - Livestock
Under the LMP, ETB 7,762 million (USD 388.1 million) is invested in the agro-livestock sector: 57% from the public sector and 43% from the private sector. The increased productivity for high value commodities – such as livestock products (skins and hides, leather, live animals and meat) but also pulses, textiles , natural gum and mineral products – benefits smallholder farmers, increases participation of women and youth in rural economic activity, and improves household diet variety. This is reducing poverty (for approximate ly 2.36 million livestock-keeping households) and helping family farms to move from traditional to improved market-oriented systems.
The increased government expenditure on extension services affects the productivity of labour employed in agriculture and livestock, and rural capital invested in the livestock sector (Figure 9). Agricultural and livestock production increases, as well as labour demand, wages and household demand, with pos itive e ffects on domestic demand. However, lower public expenditure on other sectors reduces the demand for labour in these sectors and may decrease the demand for labour in rural areas. As for the other scenarios, the impact on employment, wages, household income and aggregate demand is uncertain.
One should also highlight that few rural farming communities in the country practice modern livestock breeding activities, which needs to be scaled up. However, besides space and potable water, th is requires
24
substantial initial capital. Lack of rural credit facilities, especially for rural youth, is a critica l challenge to engaging in modern livestock breeding.
Figure 9. Main variables affected by the Livestock scenario
Source: Own depiction.
4.3.6 Productive Safety Net Programme (PSNP) – Labour subsidy
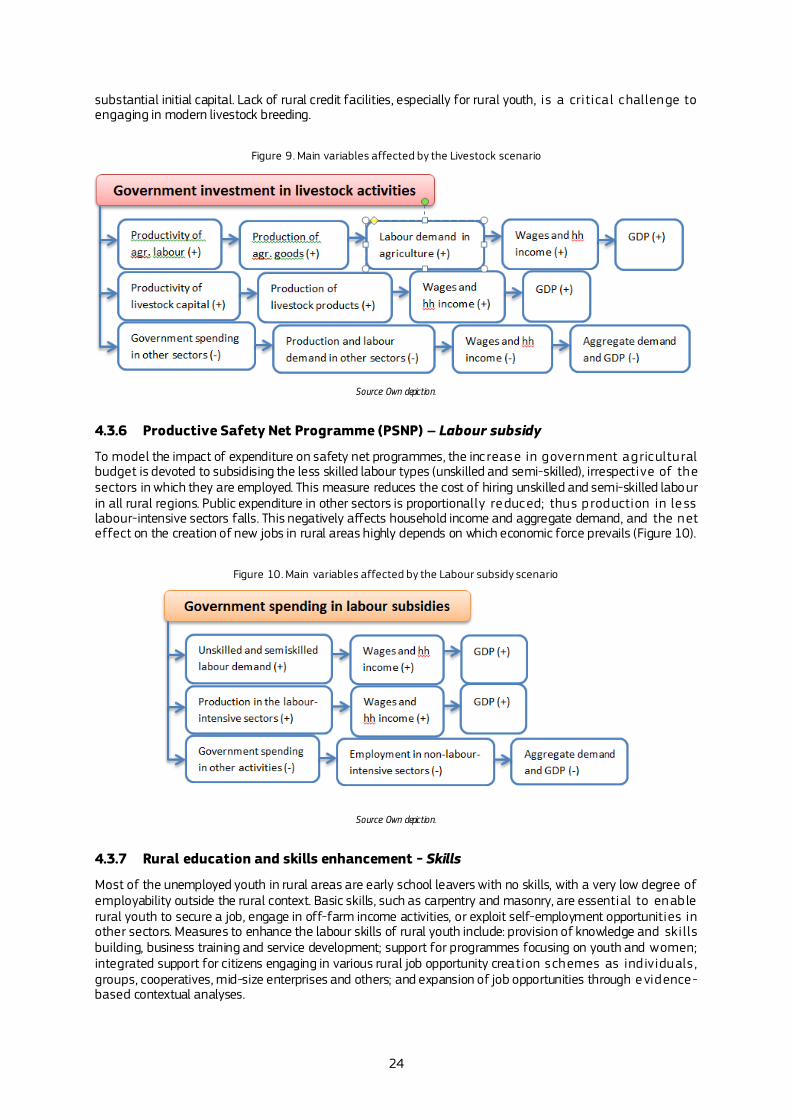
To model the impact of expenditure on safety net programmes, the inc rease in government agricultural budget is devoted to subsidising the less skilled labour types (unskilled and semi-skilled), irrespective of the sectors in which they are employed. This measure reduces the cost of hiring unskilled and semi-skilled labour in all rural regions. Public expenditure in other sectors is proportionally reduced; thus p roduction in le ss labour-intensive sectors falls. This negatively affects household income and aggregate demand, and the net effect on the creation of new jobs in rural areas highly depends on which economic force prevails (Figure 10).
Figure 10. Main variables affected by the Labour subsidy scenario
Source: Own depiction.
4.3.7 Rural education and skills enhancement - Skills
Most of the unemployed youth in rural areas are early school leavers with no skills, with a very low degree of employability outside the rural context. Basic skills, such as carpentry and masonry, are essential to enable rural youth to secure a job, engage in off-farm income activities, or exploit self-employment opportunities in other sectors. Measures to enhance the labour skills of rural youth include: provision of knowledge and skills building, business training and service development; support for programmes focusing on youth and women; integrated support for citizens engaging in various rural job opportunity creation schemes as ind ividuals , groups, cooperatives, mid-size enterprises and others; and expansion of job opportunities through evidence-based contextual analyses.
25
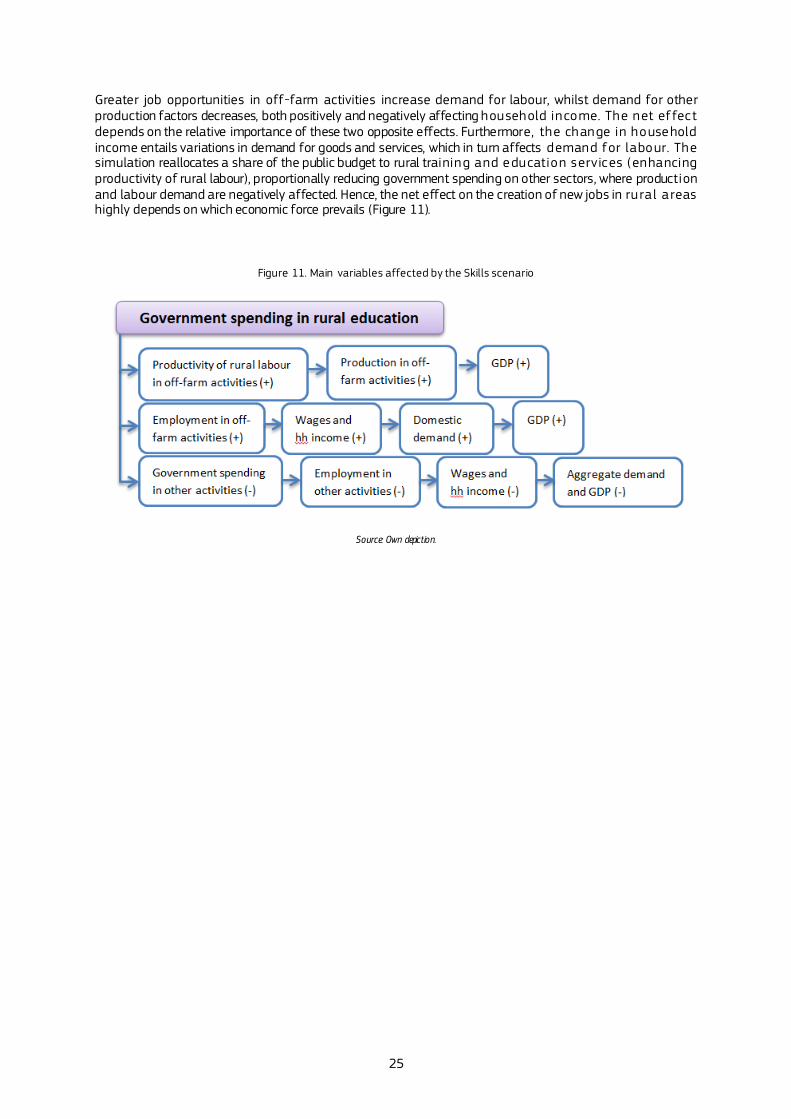
Greater job opportunities in off-farm activities increase demand for labour, whilst demand for other production factors decreases, both positively and negatively affecting household income. The net effect depends on the relative importance of these two opposite effects. Furthermore, the change in household income entails variations in demand for goods and services, which in turn affects demand for labour. The simulation reallocates a share of the public budget to rural training and education services (enhancing productivity of rural labour), proportionally reducing government spending on other sectors, where production and labour demand are negatively affected. Hence, the net effect on the creation of new jobs in rural areas highly depends on which economic force prevails (Figure 11).
Figure 11. Main variables affected by the Skills scenario
Source: Own depiction.

26
5 Results
Most of the results presented in this section refer to the year 2030, and are expressed as percentage change with respect to the baseline scenario for the same year. Therefore, numbers ind icate by how much the indicator varies in response to the application of a policy scenario in that year.
5.1 Job, income and migration
All policy scenarios have minor impacts on employment by production factor (Table 6). This is mainly due to the structure of the model and to availability of data. According to data extracted from the Inte rnational Labour Organization (ILO) household budget survey, unemployment in Ethiopia is relatively low (on ave rage around 10%, excluding higher figures for Addis Ababa where average unemployment is more than 25%). Given the exogenous growth in GDP and population growth, unemployment is fully absorbed during the baseline period in all regions but the capital city. This means that the potentia l to c reate additional jobs compared to the baseline is limited to the movement of workers among sectors and regions , but within an almost zero-sum game. The data (in particularly related to own production and informal workers) and model do not fully capture the phenomenon of underemployment, so although the impact on job creation presented gives indications of the impact of policies on the labour market, figures should be treated with some caution.
Under these conditions, labour employment grows most under the labour subsidy scenario as this policy stimulates demand for labour, especially rural labour. On the other hand, the increase in skills under the skills scenario makes workers more productive, reducing the number of workers needed to produce the same amount of output.
The impacts on capital employment are however more diversified. The agropark scenario inc reases the demand for capital the most (3.15%), given the boost to the development of cap ita l - in tens ive sectors. However, other scenarios seem to dampen demand for capital, and this is likely due to the substitution effect at play between the three primary production factors and the production factor in tens ity of the sector affected by the policy scenario. The only impact envisaged for land is under the irrigation scenario (0.13%).
Table 6. Employment by production factor (% change from base, 2030)
Baseline 2016
Baseline 2030
Agropark Road Irrigation Lives tock Labour Subs idy
Skill
Labour 101,674 129 ,181 -0 .02 0 .00 0 .00 0 .00 0 .03 -1.64
Skilled 4,663 4,532 -0 .01 -0 .03 -0 .17 0 .07 0 .12 -0 .27
Semi-s killed 7,534 8,618 1.19 0 .03 -0 .04 -0 .28 0 .94 -0 .99
Uns killed 89 ,480 116 ,052 -0 .11 0 .00 0 .01 0 .01 -0 .04 -1.74
Land 13,931,790 13,933,354 0 .13
Non-Irrigated 13,743,016 13,743,016
Irrigated 188,774 190 ,332 0 .83
Capital 549 ,685 3,491,689 3.15 0 .11 -2.34 -0 .71 -0 .04 0 .00 Source : Model results
NB: Labour and land for baseline 2016 and 2030 values are expressed in physical units (millio n s o f worke d h ours a nd hecta res , respective ly). Capital baseline values are in billion ETB.
Focusing on labour employment by type and location (Table 7), the less qualified labour types (unskilled and semi-skilled) are more favoured under the labour subsidy scenario. Changes in Addis Ababa, which is experiencing some moderate decreases under many scenarios, particularly under unskilled labour, are mainly due to a decrease in the movement of workers towards the capital city compared to the baseline, and thus a reduction in the urbanisation growth rate (Figure 15). The agropark scenario increases demand for labour, especially the semi-skilled type. Apart from some negligible negative impacts, unskilled labour turns out to be the labour type benefiting the most from the simulated policies. This result is pos itive for the Eth iopian economy, where unskilled labour accounts for about 90% of the labour force. Indeed, to better understand the real magnitude of the policy impacts, it is important to interpret the percentage changes together with absolute baseline values.

27
Table 7. Employment by region and labour type (% change from base, 2030)
Base 2016 Base 2030 Agropark Road Irrigation Lives tock Labour Subsidy Skills
Skilled 4,663 4,532 -0 .01 -0 .03 -0 .17 0 .07 0 .12 -0 .27
Addis Ababa 1,506 1,670 -0 .01 0 .00 0 .00 0 .01 0 .00 -0 .01
Afar 63 55 0 .48 -0 .40 -0 .40 0 .27 -1.92 0 .46
Amhara 533 419 1.06 -0 .10 -0 .31 0 .45 -0 .18 -2.59
Benis hangul-Gumuz 40 51 0 .00 0 .00 0 .00 0 .02 0 .02 -2.33
Dire Dawa 27 21 -1.05 -0 .53 -0 .43 0 .72 -1.82 -2.53
Gambella 40 40 -1.15 -0 .10 -0 .13 0 .38 -0 .65 -3.34
Harari 13 9 -5.36 -0 .80 -0 .80 0 .57 -2.62 -4.10
Oromia 1,277 1,240 -0 .36 -0 .20 -0 .42 -0 .30 0 .00 0 .90
SNNP 957 845 0 .05 0 .21 -0 .03 0 .33 1.06 -0 .45
Somali 74 57 -3.67 -0 .44 -0 .03 0 .03 -0 .75 -1.36
Tigray 133 125 1.99 0 .24 -0 .26 1.31 -0 .22 -3.55
Semi-skilled 7,534 8,619 1.19 0 .03 -0 .04 -0 .28 0 .94 -0 .99
Addis Ababa 846 1,856 -0 .03 0 .08 0 .40 -0 .15 -0 .26 -0 .77
Afar 115 104 3.56 0 .39 0 .06 0 .30 0 .23 -2.10
Amhara 1,220 1,204 2.70 0 .08 -0 .10 -0 .02 2.06 -1.66
Benis hangul-Gumuz 100 128 0 .00 -0 .01 0 .00 0 .01 0 .02 -2.28
Dire Dawa 261 192 0 .10 -0 .29 0 .09 -0 .65 -0 .31 -2.34
Gambella 72 55 -1.63 0 .15 0 .09 -0 .51 -0 .35 -1.90
Harari 42 31 -1.89 -0 .03 -0 .10 -1.09 -0 .22 -2.95
Oromia 3,152 3,328 0 .68 -0 .05 -0 .30 -0 .51 1.16 -0 .70
SNNP 952 962 2.81 0 .21 0 .00 -0 .33 1.63 -0 .57
Somali 267 243 0 .69 -0 .23 0 .24 -0 .05 -0 .81 -2.89
Tigray 507 516 3.26 0 .05 -0 .05 0 .18 1.77 -0 .69
Unskilled 89 ,480 116 ,053 -0 .11 0 .00 0 .01 0 .01 -0 .04 -1.74
Addis Ababa 2,852 4,647 -2.21 -0 .02 0 .22 0 .44 -1.74 -0 .43
Afar 1,031 1,110 0 .04 0 .00 0 .00 0 .01 0 .00 -0 .87
Amhara 19 ,434 23,851 0 .00 0 .00 0 .00 0 .00 0 .04 -1.52
Benis hangul-Gumuz 1,926 2,470 -0 .01 0 .00 0 .01 0 .01 0 .03 -2.41
Dire Dawa 833 1,041 0 .01 0 .00 0 .01 0 .01 0 .09 -0 .96
Gambella 437 481 -0 .01 0 .00 0 .00 0 .00 0 .02 -1.24
Harari 201 256 -0 .02 0 .00 0 .00 0 .00 0 .08 -1.30
Oromia 41,349 55,067 -0 .03 0 .00 0 .00 -0 .01 0 .04 -1.98
SNNP 14,566 18,678 -0 .02 -0 .01 0 .00 0 .00 0 .03 -1.84
Somali 2,186 2,318 0 .00 0 .00 0 .00 0 .00 0 .01 -0 .81
Tigray 4,665 6 ,135 -0 .01 0 .00 0 .00 0 .01 0 .02 -1.48 Source : Model results
NB: Values in base 2016 and 2030 are expressed in millions of worked hours.
All policy scenarios except labour subsidy manage to reduce unemployment in the Addis Ababa region (Figure 12). In particular, the skills scenario, which has the advantage of increasing labour productivity, makes labour more attractive and increases wages. The effect on the Addis Ababa labour market is due to a decrease in the rate of workers moving to Addis Ababa from other regions. For instance, under the agropark scenario, the number of unskilled workers moving to Addis Ababa is reduced by 10% compared to the baseline, reducing the pressure on the capital city labour market.
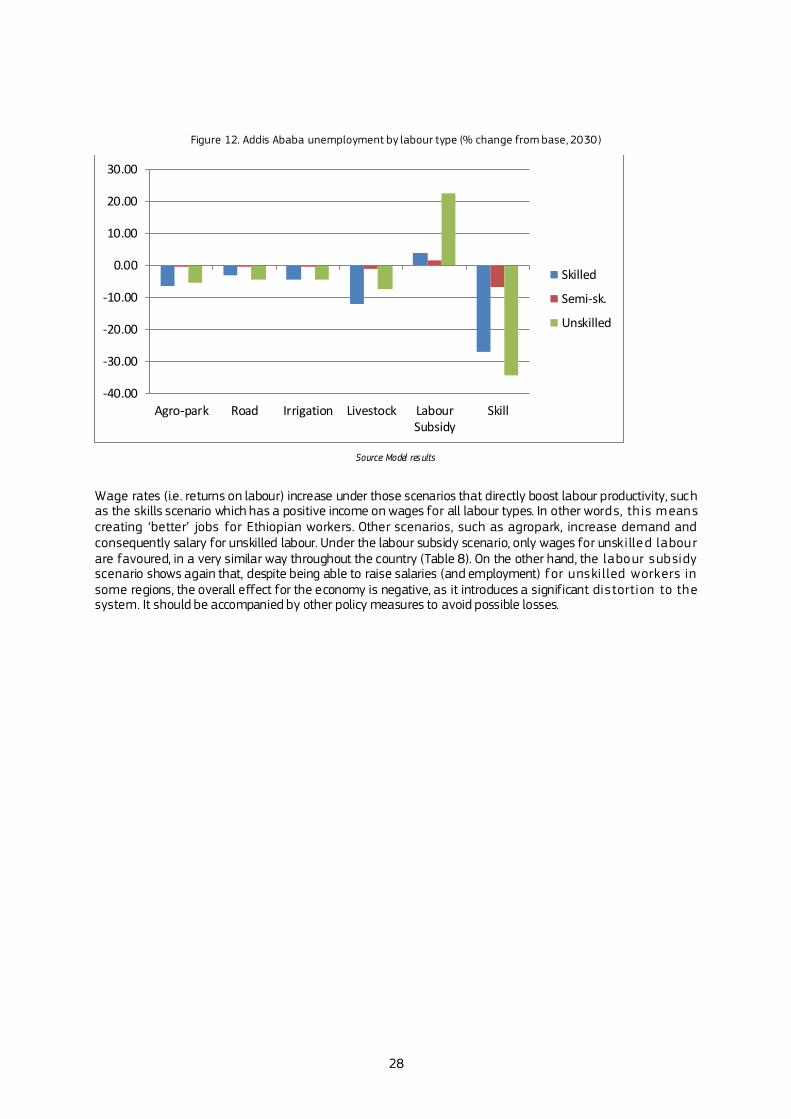
28
Figure 12. Addis Ababa unemployment by labour type (% change from base, 2030)
Source: Model res ults
Wage rates (i.e. returns on labour) increase under those scenarios that directly boost labour productivity, such as the skills scenario which has a positive income on wages for all labour types. In other words, th is means creating ‘better’ jobs for Ethiopian workers. Other scenarios, such as agropark, increase demand and consequently salary for unskilled labour. Under the labour subsidy scenario, only wages for unskilled labour are favoured, in a very similar way throughout the country (Table 8). On the other hand, the labour subsidy scenario shows again that, despite being able to raise salaries (and employment) for unskilled workers in some regions, the overall effect for the economy is negative, as it introduces a significant distortion to the system. It should be accompanied by other policy measures to avoid possible losses.
-40.00
-30.00
-20.00
-10.00
0.00
10.00
20.00
30.00
Agro-park Road Irrigation Livestock LabourSubsidy
Skill
Skilled
Semi-sk.
Unskilled
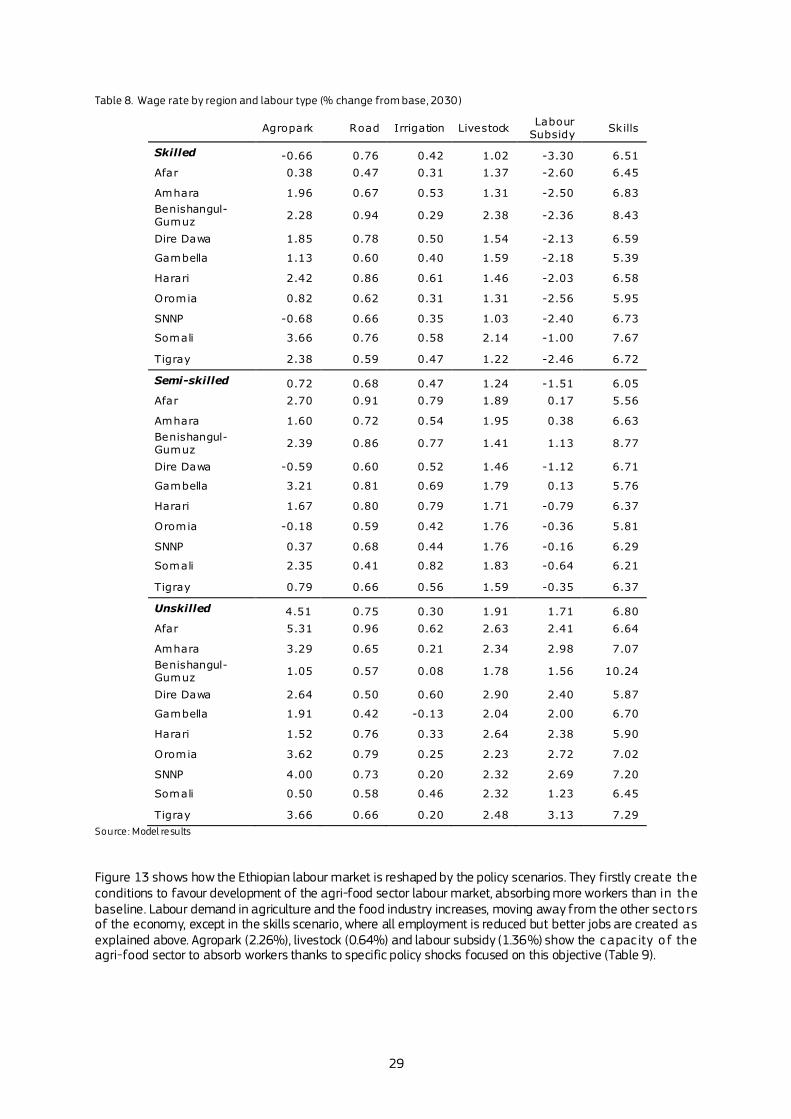
29
Table 8. Wage rate by region and labour type (% change from base, 2030)
Agropark Road Irrigation Livestock Labour
Subsidy Skills
Skilled -0.66 0.76 0.42 1.02 -3.30 6.51
Afar 0.38 0.47 0.31 1.37 -2.60 6.45
Amhara 1.96 0.67 0.53 1.31 -2.50 6.83
Benishangul-Gumuz
2.28 0.94 0.29 2.38 -2.36 8.43
Dire Dawa 1.85 0.78 0.50 1.54 -2.13 6.59
Gambella 1.13 0.60 0.40 1.59 -2.18 5.39
Harari 2.42 0.86 0.61 1.46 -2.03 6.58
Oromia 0.82 0.62 0.31 1.31 -2.56 5.95
SNNP -0.68 0.66 0.35 1.03 -2.40 6.73
Somali 3.66 0.76 0.58 2.14 -1.00 7.67
Tigray 2.38 0.59 0.47 1.22 -2.46 6.72
Semi-skilled 0.72 0.68 0.47 1.24 -1.51 6.05
Afar 2.70 0.91 0.79 1.89 0.17 5.56
Amhara 1.60 0.72 0.54 1.95 0.38 6.63
Benishangul-Gumuz
2.39 0.86 0.77 1.41 1.13 8.77
Dire Dawa -0.59 0.60 0.52 1.46 -1.12 6.71
Gambella 3.21 0.81 0.69 1.79 0.13 5.76
Harari 1.67 0.80 0.79 1.71 -0.79 6.37
Oromia -0.18 0.59 0.42 1.76 -0.36 5.81
SNNP 0.37 0.68 0.44 1.76 -0.16 6.29
Somali 2.35 0.41 0.82 1.83 -0.64 6.21
Tigray 0.79 0.66 0.56 1.59 -0.35 6.37
Unskilled 4.51 0.75 0.30 1.91 1.71 6.80
Afar 5.31 0.96 0.62 2.63 2.41 6.64
Amhara 3.29 0.65 0.21 2.34 2.98 7.07
Benishangul-Gumuz
1.05 0.57 0.08 1.78 1.56 10.24
Dire Dawa 2.64 0.50 0.60 2.90 2.40 5.87
Gambella 1.91 0.42 -0.13 2.04 2.00 6.70
Harari 1.52 0.76 0.33 2.64 2.38 5.90
Oromia 3.62 0.79 0.25 2.23 2.72 7.02
SNNP 4.00 0.73 0.20 2.32 2.69 7.20
Somali 0.50 0.58 0.46 2.32 1.23 6.45
Tigray 3.66 0.66 0.20 2.48 3.13 7.29
Source : Model results
Figure 13 shows how the Ethiopian labour market is reshaped by the policy scenarios. They firstly create the conditions to favour development of the agri-food sector labour market, absorbing more workers than in the baseline. Labour demand in agriculture and the food industry increases, moving away from the other sectors of the economy, except in the skills scenario, where all employment is reduced but better jobs are created as explained above. Agropark (2.26%), livestock (0.64%) and labour subsidy (1.36%) show the capac ity of the agri-food sector to absorb workers thanks to specific policy shocks focused on this objective (Table 9).
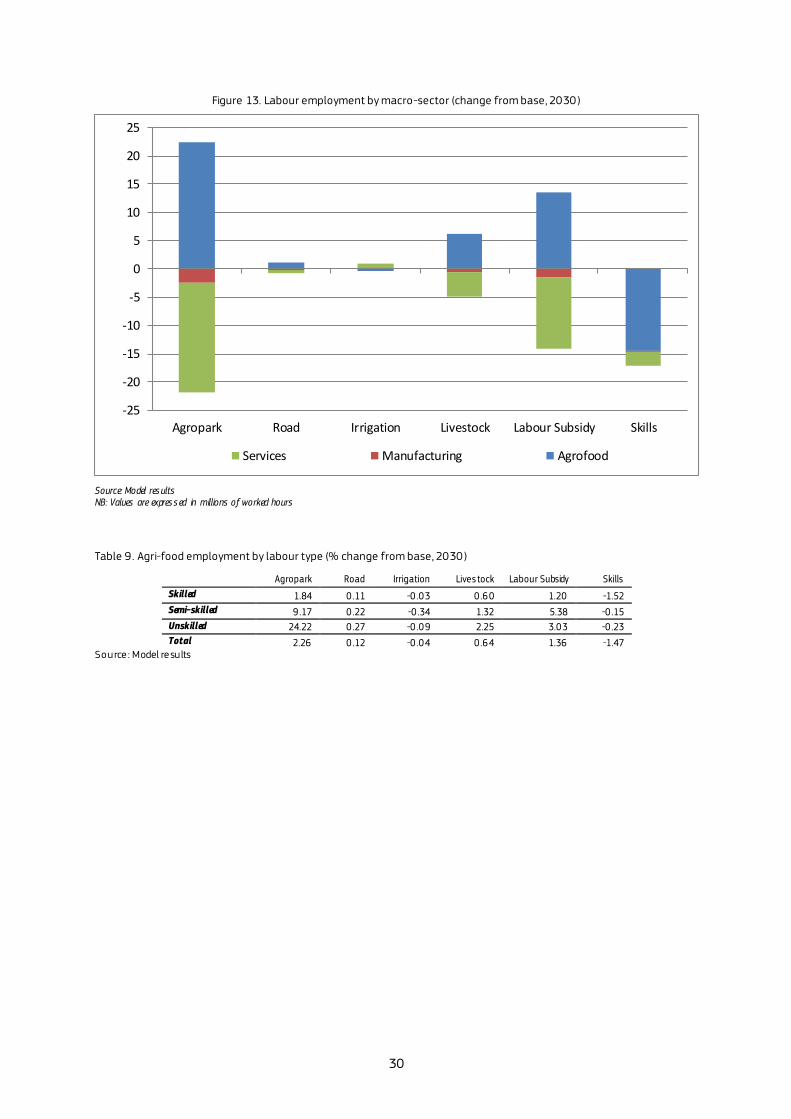
30
Figure 13. Labour employment by macro-sector (change from base, 2030)
Source: Model res ults NB: Values are expres s ed in millions of worked hours
Table 9. Agri-food employment by labour type (% change from base, 2030)
Agropark Road Irrigation Lives tock Labour Subsidy Skills
Skilled 1.84 0 .11 -0 .03 0 .60 1.20 -1.52
Semi-skilled 9 .17 0 .22 -0 .34 1.32 5.38 -0 .15
Unskilled 24.22 0 .27 -0 .09 2.25 3.03 -0 .23
Total 2.26 0 .12 -0 .04 0 .64 1.36 -1.47 Source : Model results
-25
-20
-15
-10
-5
0
5
10
15
20
25
Agropark Road Irrigation Livestock Labour Subsidy Skills
Services Manufacturing Agrofood
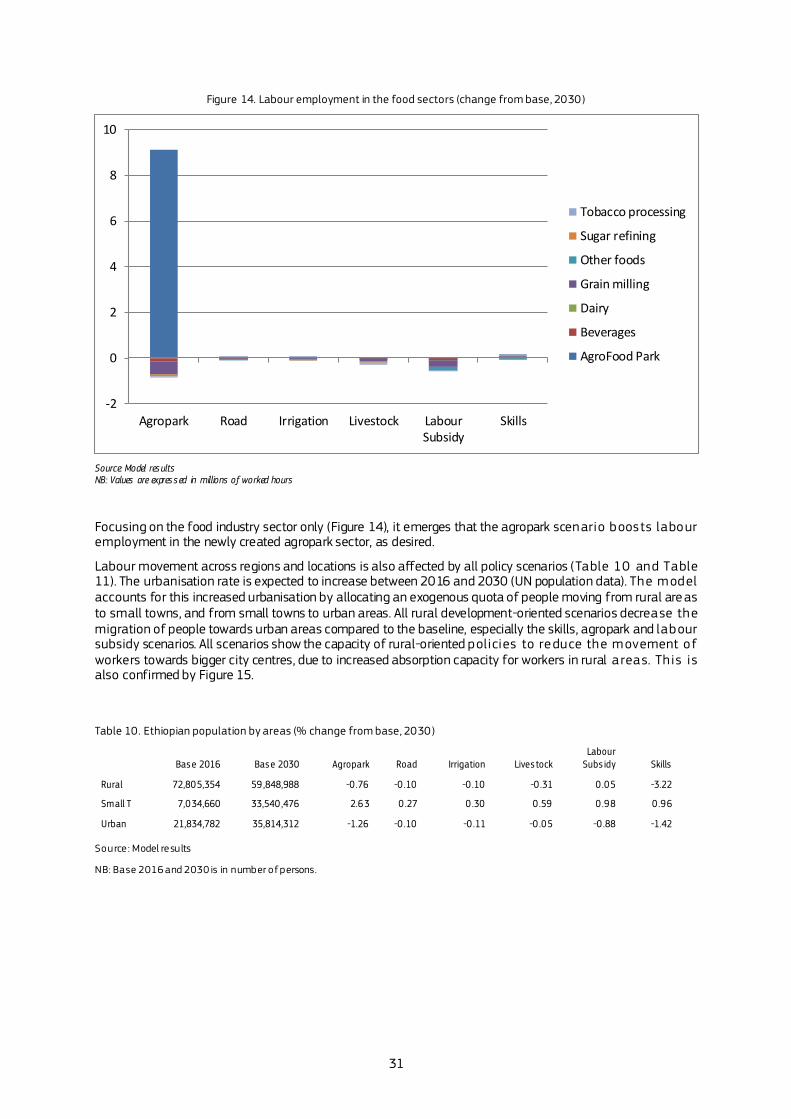
31
Figure 14. Labour employment in the food sectors (change from base, 2030)
Source: Model res ults NB: Values are expres s ed in millions of worked hours
Focusing on the food industry sector only (Figure 14), it emerges that the agropark scenario boosts labour employment in the newly created agropark sector, as desired.
Labour movement across regions and locations is also affected by all policy scenarios (Table 10 and Table 11). The urbanisation rate is expected to increase between 2016 and 2030 (UN population data). The model accounts for this increased urbanisation by allocating an exogenous quota of people moving from rural areas to small towns, and from small towns to urban areas. All rural development-oriented scenarios decrease the migration of people towards urban areas compared to the baseline, especially the skills, agropark and labour subsidy scenarios. All scenarios show the capacity of rural-oriented policies to reduce the movement of workers towards bigger city centres, due to increased absorption capacity for workers in rural areas. Th is is also confirmed by Figure 15.
Table 10. Ethiopian population by areas (% change from base, 2030)
Base 2016 Base 2030 Agropark Road Irrigation Lives tock Labour
Subs idy Skills
Rural 72,805,354 59 ,848,988 -0 .76 -0 .10 -0 .10 -0 .31 0 .05 -3.22
Small T 7,034,660 33,540 ,476 2.63 0 .27 0 .30 0 .59 0 .98 0 .96
Urban 21,834,782 35,814,312 -1.26 -0 .10 -0 .11 -0 .05 -0 .88 -1.42
Source : Model results
NB: Base 2016 and 2030 is in number of persons.
-2
0
2
4
6
8
10
Agropark Road Irrigation Livestock LabourSubsidy
Skills
Tobacco processing
Sugar refining
Other foods
Grain milling
Dairy
Beverages
AgroFood Park
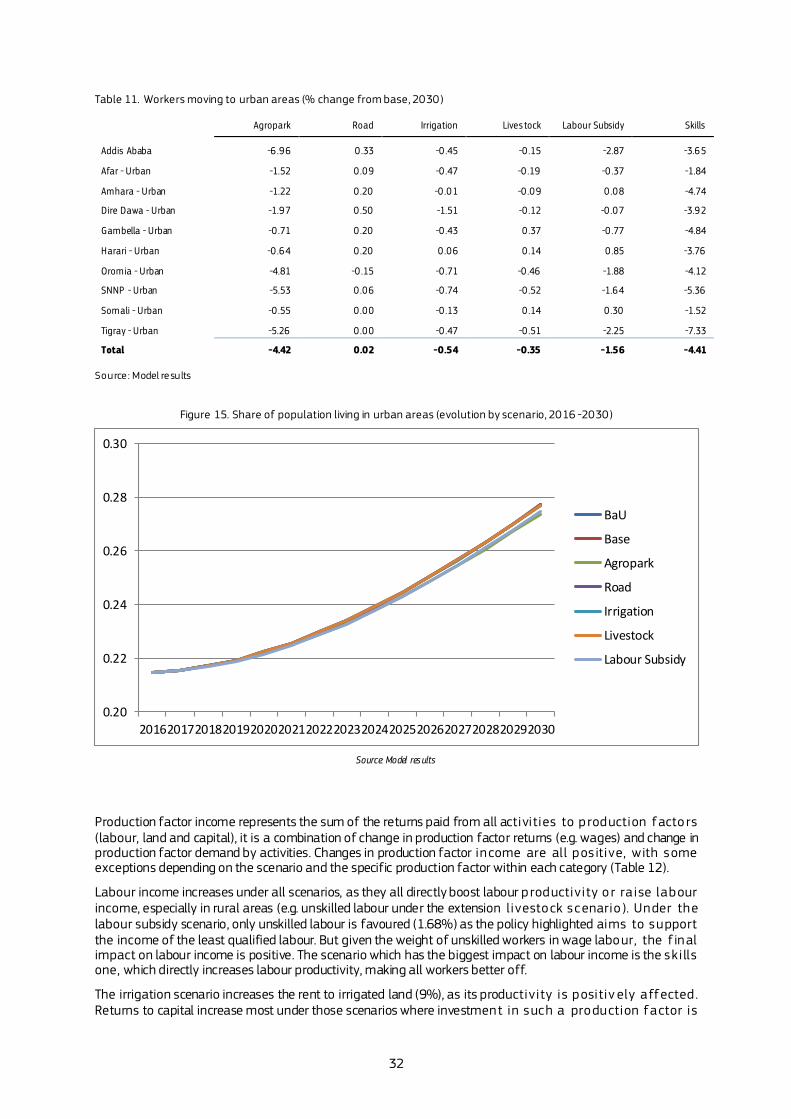
32
Table 11. Workers moving to urban areas (% change from base, 2030)
Agropark Road Irrigation Lives tock Labour Subsidy Skills
Addis Ababa -6 .96 0 .33 -0 .45 -0 .15 -2.87 -3.65
Afar - Urban -1.52 0 .09 -0 .47 -0 .19 -0 .37 -1.84
Amhara - Urban -1.22 0 .20 -0 .01 -0 .09 0 .08 -4.74
Dire Dawa - Urban -1.97 0 .50 -1.51 -0 .12 -0 .07 -3.92
Gambella - Urban -0 .71 0 .20 -0 .43 0 .37 -0 .77 -4.84
Harari - Urban -0 .64 0 .20 0 .06 0 .14 0 .85 -3.76
Oromia - Urban -4.81 -0 .15 -0 .71 -0 .46 -1.88 -4.12
SNNP - Urban -5.53 0 .06 -0 .74 -0 .52 -1.64 -5.36
Somali - Urban -0 .55 0 .00 -0 .13 0 .14 0 .30 -1.52
Tigray - Urban -5.26 0 .00 -0 .47 -0 .51 -2.25 -7.33
Total -4.42 0.02 -0.54 -0.35 -1.56 -4.41
Source : Model results
Figure 15. Share of population living in urban areas (evolution by scenario, 2016 -2030)
Source: Model res ults
Production factor income represents the sum of the returns paid from all activities to p roduction factors (labour, land and capital), it is a combination of change in production factor returns (e.g. wages) and change in production factor demand by activities. Changes in production factor income are all pos itive, with some exceptions depending on the scenario and the specific production factor within each category (Table 12).
Labour income increases under all scenarios, as they all directly boost labour p roductivity or ra ise labour income, especially in rural areas (e.g. unskilled labour under the extension livestock scenario ). Under the labour subsidy scenario, only unskilled labour is favoured (1.68%) as the policy highlighted aims to support the income of the least qualified labour. But given the weight of unskilled workers in wage labour, the f inal impact on labour income is positive. The scenario which has the biggest impact on labour income is the ski lls one, which directly increases labour productivity, making all workers better off.
The irrigation scenario increases the rent to irrigated land (9%), as its productivity is positiv ely affected . Returns to capital increase most under those scenarios where investment in such a production factor is
0.20
0.22
0.24
0.26
0.28
0.30
201620172018201920202021202220232024202520262027202820292030
BaU
Base
Agropark
Road
Irrigation
Livestock
Labour Subsidy
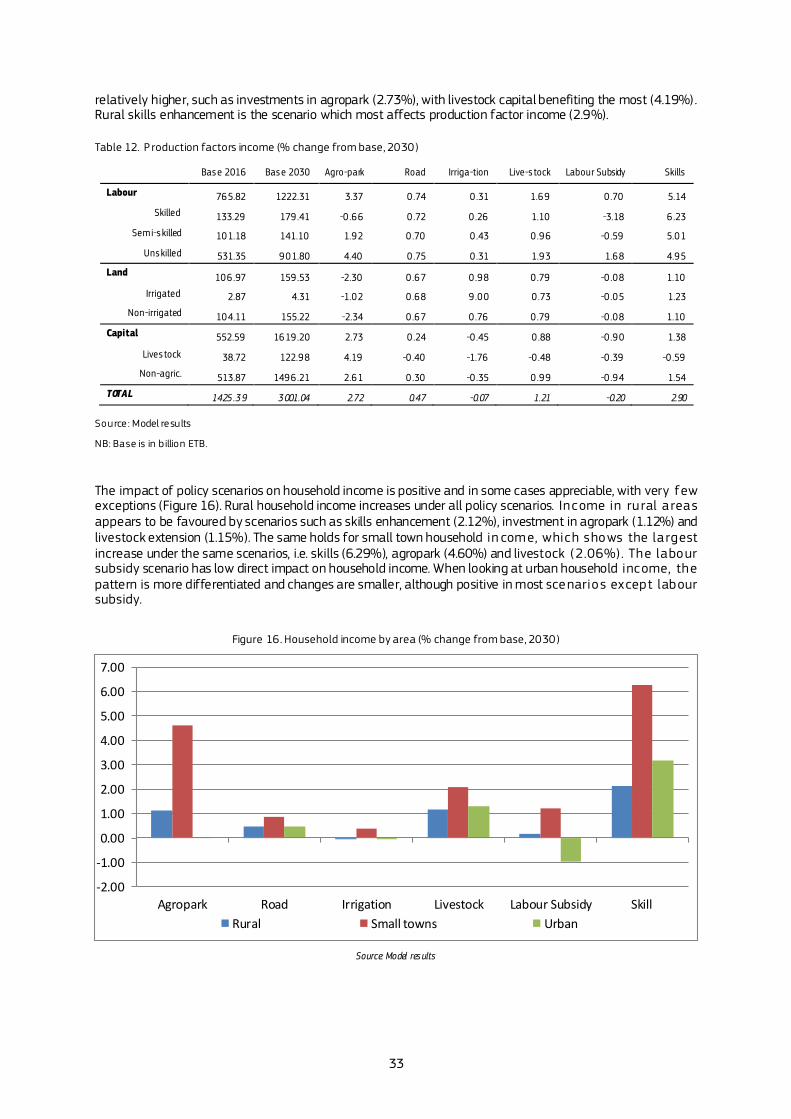
33
relatively higher, such as investments in agropark (2.73%), with livestock capital benefiting the most (4.19%). Rural skills enhancement is the scenario which most affects production factor income (2.9%).
Table 12. P roduction factors income (% change from base, 2030)
Base 2016 Base 2030 Agro-park Road Irriga-tion Live-s tock Labour Subsidy Skills
Labour 765.82 1222.31 3.37 0 .74 0 .31 1.69 0 .70 5.14
Skilled 133.29 179 .41 -0 .66 0 .72 0 .26 1.10 -3.18 6 .23
Semi-s killed 101.18 141.10 1.92 0 .70 0 .43 0 .96 -0 .59 5.01
Uns killed 531.35 901.80 4.40 0 .75 0 .31 1.93 1.68 4.95
Land 106 .97 159 .53 -2.30 0 .67 0 .98 0 .79 -0 .08 1.10
Irrigated 2.87 4.31 -1.02 0 .68 9 .00 0 .73 -0 .05 1.23
Non-irrigated 104.11 155.22 -2.34 0 .67 0 .76 0 .79 -0 .08 1.10
Capital 552.59 1619 .20 2.73 0 .24 -0 .45 0 .88 -0 .90 1.38
Lives tock 38.72 122.98 4.19 -0 .40 -1.76 -0 .48 -0 .39 -0 .59
Non-agric. 513.87 1496 .21 2.61 0 .30 -0 .35 0 .99 -0 .94 1.54
TOTAL 1425 .3 9 3 001.04 2.72 0.47 -0.07 1.21 -0.20 2.90
Source : Model results
NB: Base is in billion ETB.
The impact of policy scenarios on household income is positive and in some cases appreciable, with very few exceptions (Figure 16). Rural household income increases under all policy scenarios. Income in rural areas appears to be favoured by scenarios such as skills enhancement (2.12%), investment in agropark (1.12%) and livestock extension (1.15%). The same holds for small town household in come, which shows the largest increase under the same scenarios, i.e. skills (6.29%), agropark (4.60%) and livestock (2.06%). The labour subsidy scenario has low direct impact on household income. When looking at urban household income, the pattern is more differentiated and changes are smaller, although positive in most scenarios except labour subsidy.
Figure 16. Household income by area (% change from base, 2030)
Source: Model res ults
-2.00
-1.00
0.00
1.00
2.00
3.00
4.00
5.00
6.00
7.00
Agropark Road Irrigation Livestock Labour Subsidy Skill
Rural Small towns Urban

34
5.2 Agricultural markets
All scenarios increase agri-food production, except the labour subsidy scenario which p resents a small decrease (0.25%) (Table 13). Investing in agropark benefits agri-food production the most (19.04%), while building new transport infrastructure and improving rural roads and improving rural education increase non agri-food production.
All scenarios except labour subsidy benefit HPHC production, with rural skills enhancement being the most effective (4.27%). Together with rural road improvement, these are the only scenarios which present positive effects in the production of every agri-food (except cut flowers for the skills scenario) and non agri -food product.
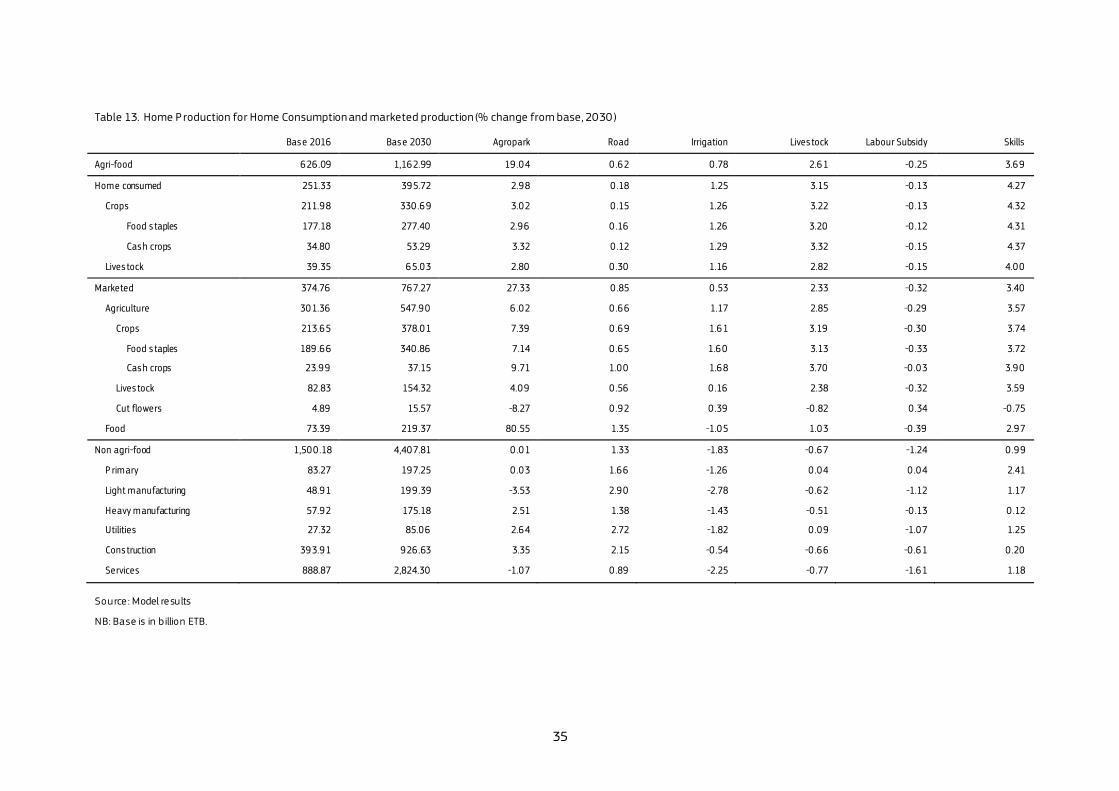
35
Table 13. Home P roduction for Home Consumption and marketed production (% change from base, 2030)
Base 2016 Base 2030 Agropark Road Irrigation Lives tock Labour Subsidy Skills
Agri-food 626 .09 1,162.99 19 .04 0 .62 0 .78 2.61 -0 .25 3.69
Home consumed 251.33 395.72 2.98 0 .18 1.25 3.15 -0 .13 4.27
Crops 211.98 330 .69 3.02 0 .15 1.26 3.22 -0 .13 4.32
Food s taples 177.18 277.40 2.96 0 .16 1.26 3.20 -0 .12 4.31
Cash crops 34.80 53.29 3.32 0 .12 1.29 3.32 -0 .15 4.37
Lives tock 39 .35 65.03 2.80 0 .30 1.16 2.82 -0 .15 4.00
Marketed 374.76 767.27 27.33 0 .85 0 .53 2.33 -0 .32 3.40
Agriculture 301.36 547.90 6 .02 0 .66 1.17 2.85 -0 .29 3.57
Crops 213.65 378.01 7.39 0 .69 1.61 3.19 -0 .30 3.74
Food s taples 189 .66 340 .86 7.14 0 .65 1.60 3.13 -0 .33 3.72
Cash crops 23.99 37.15 9 .71 1.00 1.68 3.70 -0 .03 3.90
Lives tock 82.83 154.32 4.09 0 .56 0 .16 2.38 -0 .32 3.59
Cut flowers 4.89 15.57 -8.27 0 .92 0 .39 -0 .82 0 .34 -0 .75
Food 73.39 219 .37 80 .55 1.35 -1.05 1.03 -0 .39 2.97
Non agri-food 1,500 .18 4,407.81 0 .01 1.33 -1.83 -0 .67 -1.24 0 .99
P rimary 83.27 197.25 0 .03 1.66 -1.26 0 .04 0 .04 2.41
Light manufacturing 48.91 199 .39 -3.53 2.90 -2.78 -0 .62 -1.12 1.17
Heavy manufacturing 57.92 175.18 2.51 1.38 -1.43 -0 .51 -0 .13 0 .12
Utilities 27.32 85.06 2.64 2.72 -1.82 0 .09 -1.07 1.25
Cons truction 393.91 926 .63 3.35 2.15 -0 .54 -0 .66 -0 .61 0 .20
Services 888.87 2,824.30 -1.07 0 .89 -2.25 -0 .77 -1.61 1.18
Source : Model results
NB: Base is in billion ETB.
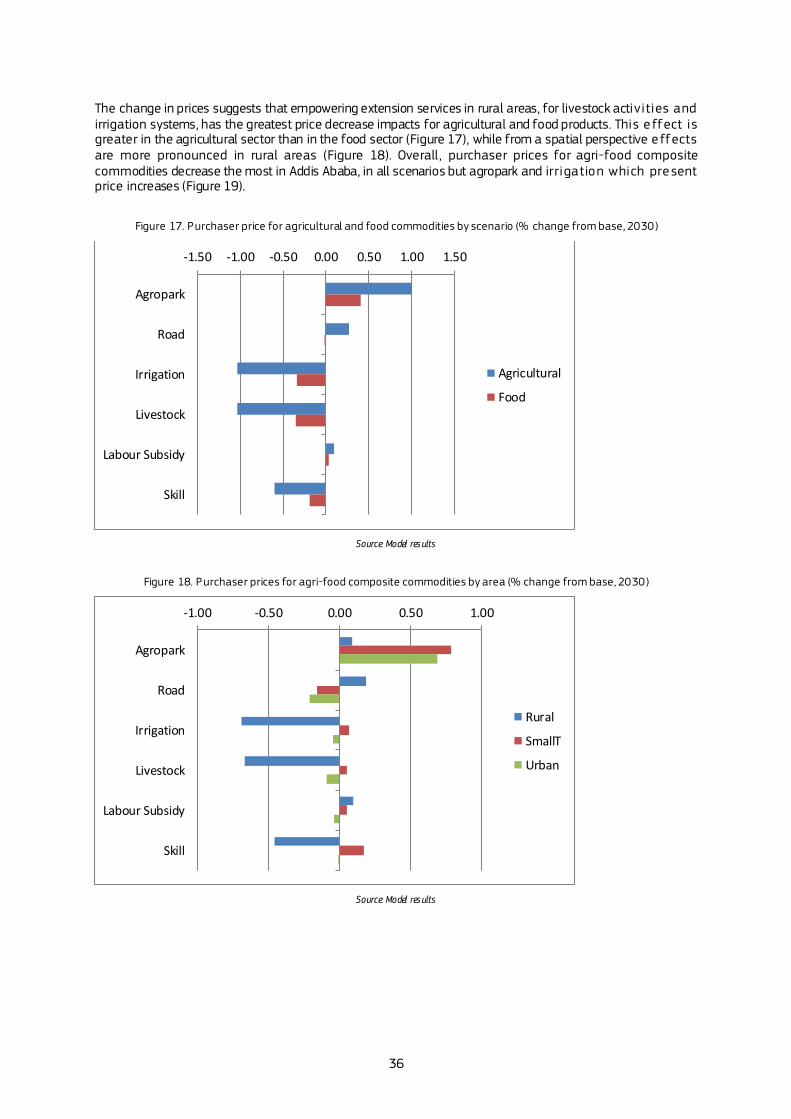
36
The change in prices suggests that empowering extension services in rural areas, for livestock activities and irrigation systems, has the greatest price decrease impacts for agricultural and food products. This e ffect is greater in the agricultural sector than in the food sector (Figure 17), while from a spatial perspective e ffects are more pronounced in rural areas (Figure 18). Overall, purchaser prices for agri-food composite commodities decrease the most in Addis Ababa, in all scenarios but agropark and irrigation which present price increases (Figure 19).
Figure 17. Purchaser price for agricultural and food commodities by scenario (% change from base, 2030)
Source: Model res ults
Figure 18. Purchaser prices for agri-food composite commodities by area (% change from base, 2030)
Source: Model res ults
-1.50 -1.00 -0.50 0.00 0.50 1.00 1.50
Agropark
Road
Irrigation
Livestock
Labour Subsidy
Skill
Agricultural
Food
-1.00 -0.50 0.00 0.50 1.00
Agropark
Road
Irrigation
Livestock
Labour Subsidy
Skill
Rural
SmallT
Urban
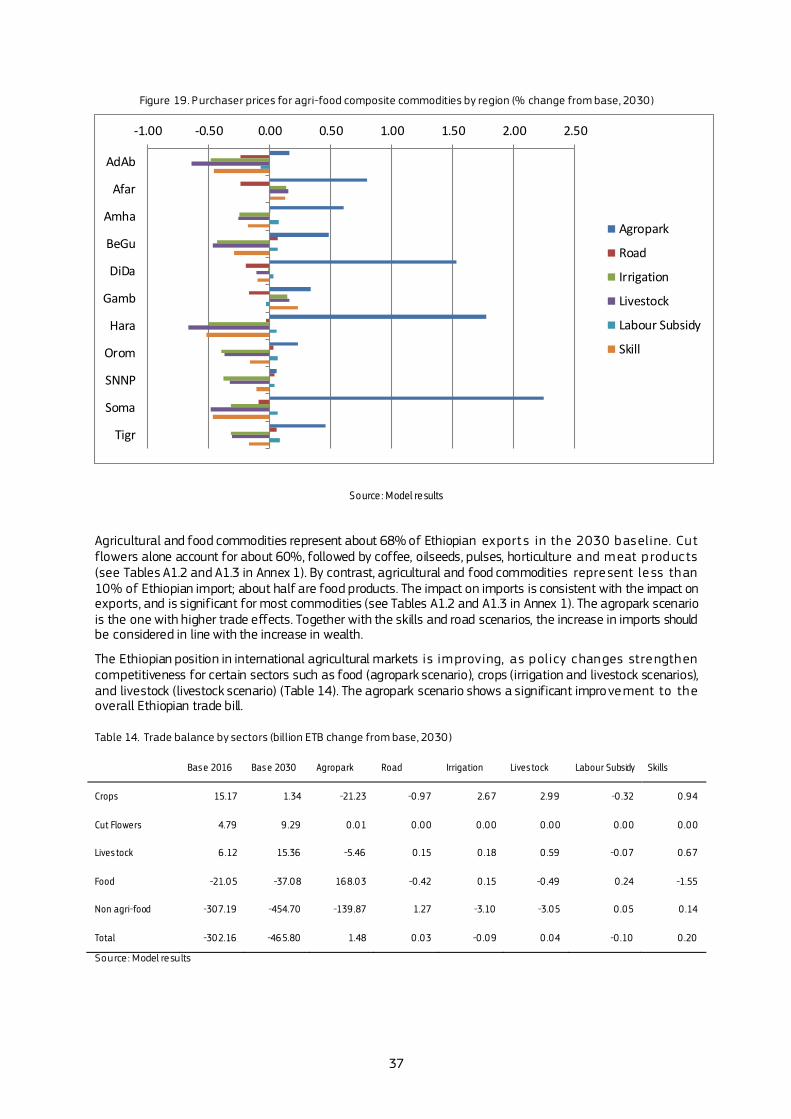
37
Figure 19. Purchaser prices for agri-food composite commodities by region (% change from base, 2030)
Source : Model re sults
Agricultural and food commodities represent about 68% of Ethiopian export s in the 2030 baseline. Cut flowers alone account for about 60%, followed by coffee, oilseeds, pulses, horticulture and meat p roducts (see Tables A1.2 and A1.3 in Annex 1). By contrast, agricultural and food commodities represent le ss than 10% of Ethiopian import; about half are food products. The impact on imports is consistent with the impact on exports, and is significant for most commodities (see Tables A1.2 and A1.3 in Annex 1). The agropark scenario is the one with higher trade effects. Together with the skills and road scenarios, the increase in imports should be considered in line with the increase in wealth.
The Ethiopian position in international agricultural markets is improving, as policy changes strengthen competitiveness for certain sectors such as food (agropark scenario), crops (irrigation and livestock scenarios), and livestock (livestock scenario) (Table 14). The agropark scenario shows a significant improvement to the overall Ethiopian trade bill.
Table 14. Trade balance by sectors (billion ETB change from base, 2030)
Base 2016 Base 2030 Agropark Road Irrigation Lives tock Labour Subsidy Skills
Crops 15.17 1.34 -21.23 -0 .97 2.67 2.99 -0 .32 0 .94
Cut Flowers 4.79 9 .29 0 .01 0 .00 0 .00 0 .00 0 .00 0 .00
Lives tock 6 .12 15.36 -5.46 0 .15 0 .18 0 .59 -0 .07 0 .67
Food -21.05 -37.08 168.03 -0 .42 0 .15 -0 .49 0 .24 -1.55
Non agri-food -307.19 -454.70 -139 .87 1.27 -3.10 -3.05 0 .05 0 .14
Total -302.16 -465.80 1.48 0 .03 -0 .09 0 .04 -0 .10 0 .20
Source : Model results
-1.00 -0.50 0.00 0.50 1.00 1.50 2.00 2.50
AdAb
Afar
Amha
BeGu
DiDa
Gamb
Hara
Orom
SNNP
Soma
Tigr
Agropark
Road
Irrigation
Livestock
Labour Subsidy
Skill
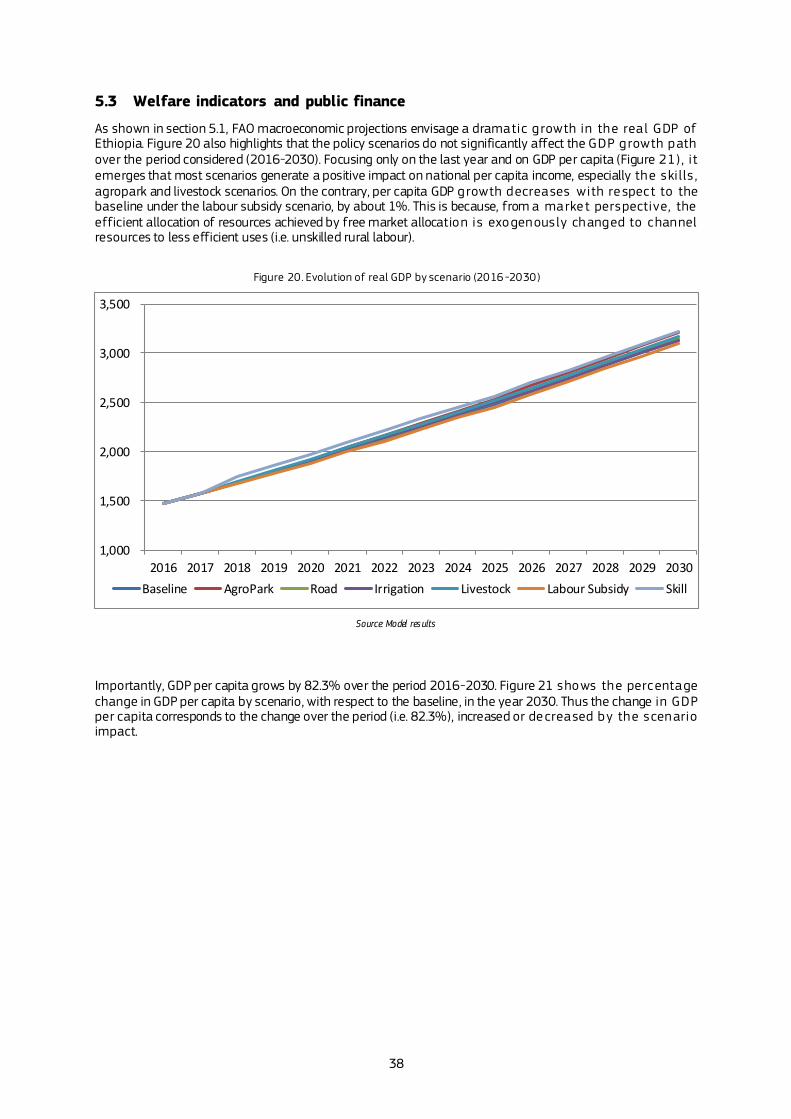
38
5.3 Welfare indicators and public finance
As shown in section 5.1, FAO macroeconomic projections envisage a dramatic growth in the real GDP of Ethiopia. Figure 20 also highlights that the policy scenarios do not significantly affect the GDP growth path over the period considered (2016-2030). Focusing only on the last year and on GDP per capita (Figure 21) , it emerges that most scenarios generate a positive impact on national per capita income, especially the ski lls , agropark and livestock scenarios. On the contrary, per capita GDP growth decreases with respect to the baseline under the labour subsidy scenario, by about 1%. This is because, from a marke t perspective, the efficient allocation of resources achieved by free market allocation is exogenously changed to channel resources to less efficient uses (i.e. unskilled rural labour).
Figure 20. Evolution of real GDP by scenario (2016 -2030)
Source: Model res ults
Importantly, GDP per capita grows by 82.3% over the period 2016-2030. Figure 21 shows the percentage change in GDP per capita by scenario, with respect to the baseline, in the year 2030. Thus the change in GDP per capita corresponds to the change over the period (i.e. 82.3%), increased or decreased by the scenario impact.
1,000
1,500
2,000
2,500
3,000
3,500
2016 2017 2018 2019 2020 2021 2022 2023 2024 2025 2026 2027 2028 2029 2030
Baseline AgroPark Road Irrigation Livestock Labour Subsidy Skill
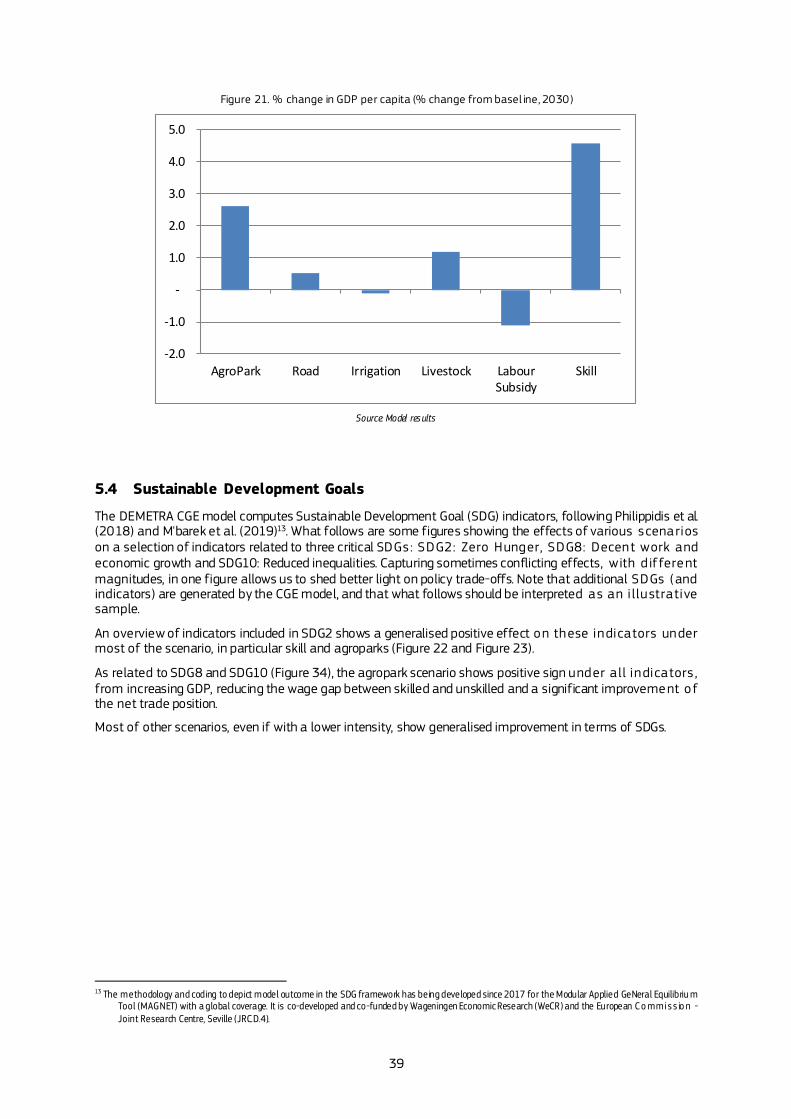
39
Figure 21. % change in GDP per capita (% change from basel ine, 2030)
Source: Model res ults
5.4 Sustainable Development Goals
The DEMETRA CGE model computes Sustainable Development Goal (SDG) indicators, following Philippidis et al. (2018) and M'barek et al. (2019)13. What follows are some figures showing the effects of various scenarios on a selection of indicators related to three critical SDGs: SDG2: Zero Hunger, SDG8: Decent work and economic growth and SDG10: Reduced inequalities. Capturing sometimes conflicting effects, with d ifferent magnitudes, in one figure allows us to shed better light on policy trade-offs. Note that additional SDGs (and indicators) are generated by the CGE model, and that what follows should be interpreted as an i llustrative sample.
An overview of indicators included in SDG2 shows a generalised positive effect on these indicators under most of the scenario, in particular skill and agroparks (Figure 22 and Figure 23).
As related to SDG8 and SDG10 (Figure 34), the agropark scenario shows positive sign under a ll indicators , from increasing GDP, reducing the wage gap between skilled and unskilled and a significant improvement of the net trade position.
Most of other scenarios, even if with a lower intensity, show generalised improvement in terms of SDGs.
13 The methodology and coding to depict model outcome in the SDG framework has being developed since 2017 for the Modular Applied GeNeral Equilibriu m
Tool (MAGNET) with a global coverage. It is co-developed and co-funded by Wageningen Economic Research (WeCR) and the European C o mmis s io n - Joint Research Centre, Seville (JRC.D.4).
-2.0
-1.0
-
1.0
2.0
3.0
4.0
5.0
AgroPark Road Irrigation Livestock LabourSubsidy
Skill
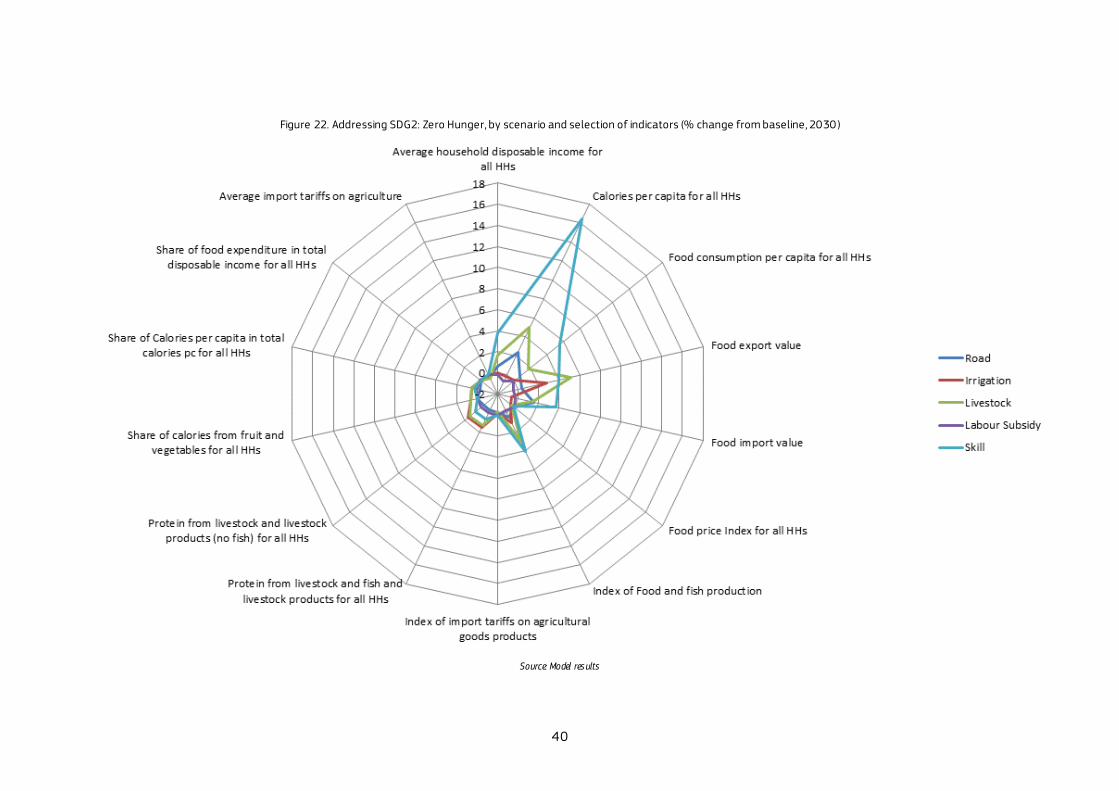
40
Figure 22. Addressing SDG2: Zero Hunger, by scenario and selection of indicators (% change from baseline, 2030)
Source: Model res ults
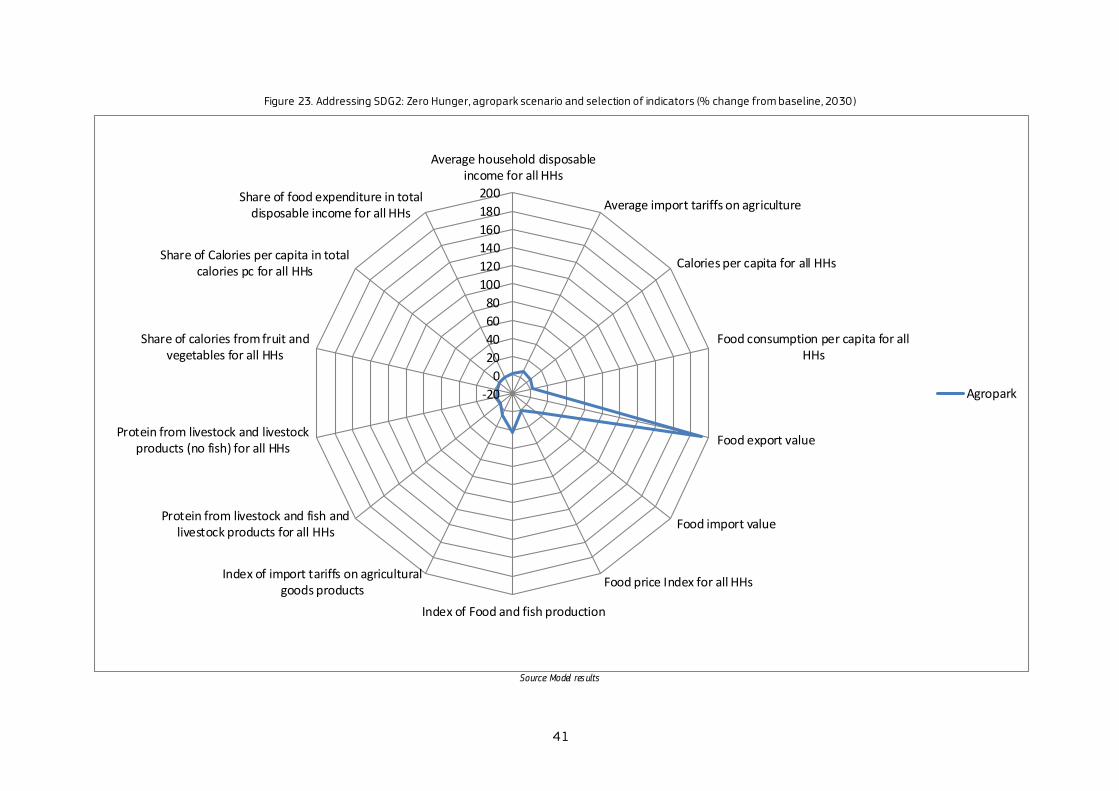
41
Figure 23. Addressing SDG2: Zero Hunger, agropark scenario and selection of indicators (% change from baseline, 2030)
Source: Model res ults
-20
0
20
40
60
80
100
120
140
160
180
200
Average household disposableincome for all HHs
Average import tariffs on agriculture
Calories per capita for all HHs
Food consumption per capita for allHHs
Food export value
Food import value
Food price Index for all HHs
Index of Food and fish production
Index of import tariffs on agriculturalgoods products
Protein from livestock and fish andlivestock products for all HHs
Protein from livestock and livestockproducts (no fish) for all HHs
Share of calories from fruit andvegetables for all HHs
Share of Calories per capita in totalcalories pc for all HHs
Share of food expenditure in totaldisposable income for all HHs
Agropark
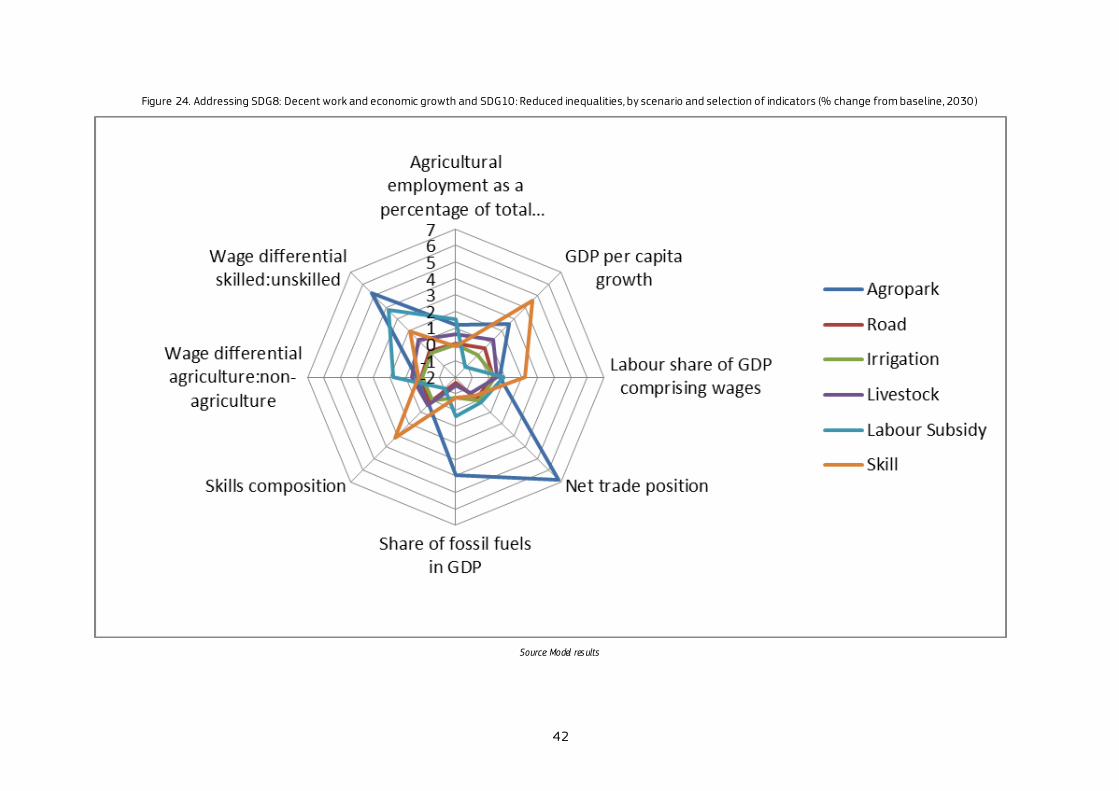
42
Figure 24. Addressing SDG8: Decent work and economic growth and SDG10: Reduced inequalities, by scenario and selection of indicators (% change from baseline, 2030)
Source: Model res ults
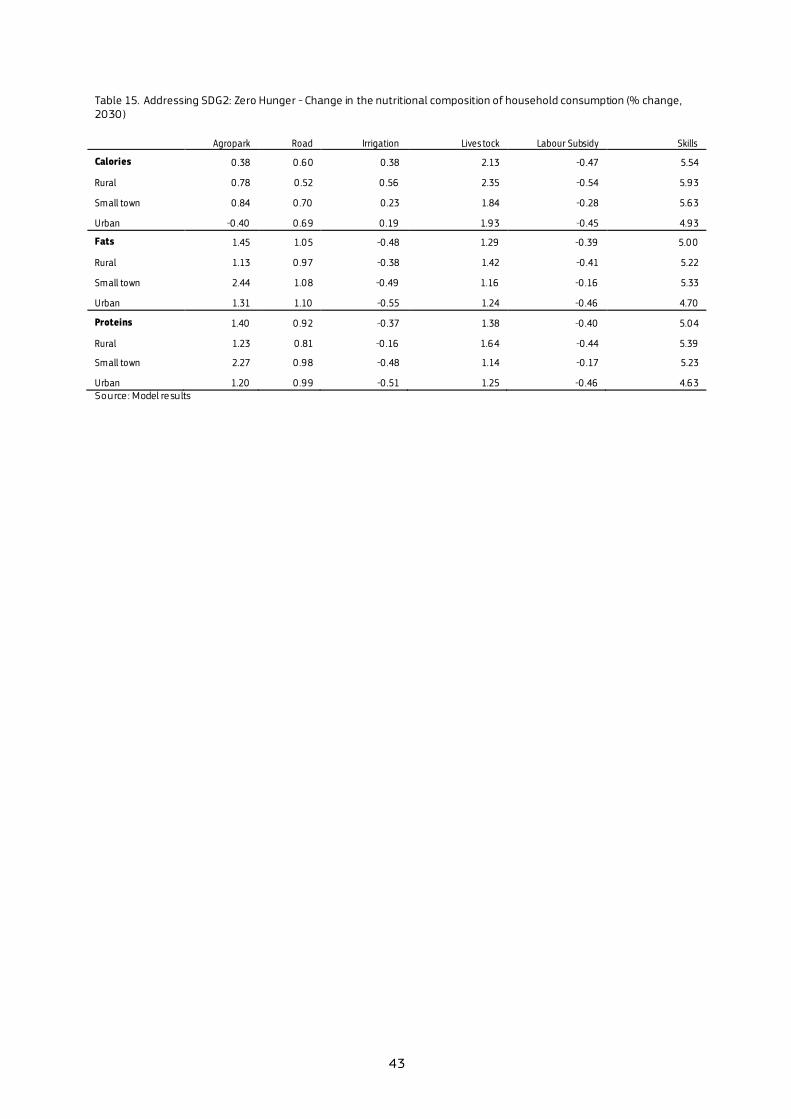
43
Table 15. Addressing SDG2: Zero Hunger - Change in the nutritional composition of household consumption (% change, 2030)
Agropark Road Irrigation Lives tock Labour Subsidy Skills
Calories 0 .38 0 .60 0 .38 2.13 -0 .47 5.54
Rural 0 .78 0 .52 0 .56 2.35 -0 .54 5.93
Small town 0 .84 0 .70 0 .23 1.84 -0 .28 5.63
Urban -0 .40 0 .69 0 .19 1.93 -0 .45 4.93
Fats 1.45 1.05 -0 .48 1.29 -0 .39 5.00
Rural 1.13 0 .97 -0 .38 1.42 -0 .41 5.22
Small town 2.44 1.08 -0 .49 1.16 -0 .16 5.33
Urban 1.31 1.10 -0 .55 1.24 -0 .46 4.70
Proteins 1.40 0 .92 -0 .37 1.38 -0 .40 5.04
Rural 1.23 0 .81 -0 .16 1.64 -0 .44 5.39
Small town 2.27 0 .98 -0 .48 1.14 -0 .17 5.23
Urban 1.20 0 .99 -0 .51 1.25 -0 .46 4.63 Source : Model results
44
6 Conclusion and recommendations
6.1 Conclusions
This report provides a quantitative assessment of policy options to support the Rural Job Opportunity Creation Strategy in Ethiopia. It also describes the Ethiopian political context and economy, with a focus on employment generation capacity, based on a recent and disaggregated SAM developed by the JRC, and a linear multipliers model.
The report proposes an ex ante assessment of policy options, with a focus on the labour market, employing a CGE model that fits key developing country specificities, such as the own supply of food by semi-subsistence households (both through the HPHC module and the multiple-output structure of the CGE model), calibrated on a SAM for Ethiopia for 2015, jointly estimated by the Ethiopian Development Research Institute and the JRC.
The main findings of the study are as follows.
All of the simulated scenarios show potential for increasing job creation in the agricultural and food sectors, particularly if stimulated with investment policies such as the expansion of agroparks.
The increase in labour demand brings about an increase in wages under almost all scenarios. Th is increase is particularly significant under scenarios specifically designed to increase labour productivity such as the skill-based one, which aims to help create better-paid jobs.
An additional effect of policies fostering rural job opportunities is the reduction of workers migration towards urban areas, in particular Addis Ababa.
Total employment is barely affected by the simulated policies . Th is is partly due to the model structure and lack of available data on real levels of employment or underemployment.
The positive outlook associated with the simulated policies is underlined by the increase in production factor income and consequently in household income associated with most scenarios.
The only scenario associated with a decline in income is the one based on labour subsidies . Th is scenario is able to support the income of the poorest but at the same time creates a distortion in the economy which reduces the overall economic activity compared to the baseline. To avoid these negative effects, this policy should be accompanied by others designed to avoid a decrease in Ethiopian economic growth.
Fostering agro-industrial parks benefits food production the most with a massive increase in food exports and an improvement of the trade bill. This scenario also increases agri -food p rices in the Ethiopian market.
Livestock extension services and irrigation have the greatest impact in terms of reduction in the price of agricultural and food products.
Enhancing skills on the one hand, while fostering extension services in rural areas targeting livestock production on the other, are the most effective policy options for food and nutrition security.
Investing in road infrastructure and education has the greatest effects on the production of non agri-food products, allowing for a broader development of the economy.
The simulated scenarios have a positive effect on most of the indicators underpinning critical SDGs, such as SDG2: Zero Hunger, SDG8: Decent work and economic growth and SDG10: Reduced inequalities.
This study is based on simulations performed using a CGE economic model. These models provide a schematic representation of the economy which cannot reproduce reality in its full complexity. The quality of the model output is directly related to the input data and to the parameters associated with the shocks imposed on the model. The effort expended in the production of an accurate and updated database is huge; nevertheless, missing data and the lack of publicly accessible datasets might bias some of the results. Not all parameters can be econometrically estimated and, despite the fact that some of them are available in the literature, scenario results should not be considered as definite numerical forecasts of the future impacts of a given policy but rather be interpreted as a way of understanding the forces that each shock unleashes.
45
It should also be emphasised that only the economic impacts of the shocks analysed are fully depicted by the model. Environmental impacts (e.g. water availability and the sustainable withdrawal of water and other natural resources, particularly relevant to the irrigation scenario) or social impacts (e.g. non-economic reasons behind the decision to migrate) are only partially taken into account because of the characteristics of the model. Finally, as the institutional framework behind any policy reform or change cannot be modelled, the model implicitly assumes political stability in the country and assumes that reforms will (in the medium term) bring expected results. The uncertainty behind all model assumptions is relevant in defining the final results of any policy reform in any country.
To conclude, it is worth emphasising that the JRC constantly strives to increase the scope and quality of the models employed for policy analysis. There is ongoing enhancement of modules to improve analysis of demography, household demand for final goods, nutritional indicators, inclusion of water and connections with other natural resources, environmental indicators and the SDGs.
6.2 Recommendations
Based on an assessment of the social and economic impacts of the various policy interventions , th is report suggests the following recommendations in connection with the Rural Job Opportunity Creation Strategy in Ethiopia. Only policy directions are offered rather than concrete details, the construction of which we consider as separate work that must be done after overall policy directions are agreed by the bodies concerned.
1. Allocate a significant share of total public resources to the agricultural sector, as part of a broad structural transformation agenda.
The level of expenditures in support of food and agriculture still falls short of the 10% target. With this level of expenditure on agriculture, it would be difficult to achieve the envisaged structural transformation agenda. Therefore, a greater share of total public resources should be allocated to the agricultural sector. The effect on job opportunity creation in the agricultural and food industry sector is substantial.
2. Accelerate government investment in the livestock sector.
The analysis shows that livestock commodities have the greatest positive impact on employment generation, output and value added. Thus, accelerating government investment in the livestock sector should be considered. As available resources are limited, the government may need to redirect its investment more towards the livestock sector in order to unleash Ethiopia’s livestock potential.
3. Provide public support for the development of industrial parks and agro-processing industrial parks
The government of Ethiopia should continue to support and encourage the development of industria l parks and agro-processing industrial parks. As indicated by the model results, doing so generates the greatest gains in terms of job creation, especially for semi-skilled labour, in the sector. Moreover, it results in a s ignif icant improvement in the income of rural households, thereby reducing the poverty level in rural areas. The development of the sector will also be helpful in reducing the movement of workers towards bigger cities due to an increased absorption capacity of workers in rural areas. Rural-urban migration in Ethiop ia currently poses a social challenge. The sector also brings about significant improvement in the country’s trade deficit by increasing export earnings. Overall, the development of agro -industrial parks speeds up the structural transformation of agriculture, by supporting commercialisation through permanent rural-urban linkages , and has significant positive impacts on per-capita GDP.
4. Promote expenditure on education to enhance human capital productivity.
The government should increase expenditure on education, particularly in Agricultural Technical Vocational Education and Training (ATVET). This enhances labour productivity and labour force participation, generating employment opportunities. It also results in an increase in the wages and incomes of workers associated with the creation of "better" (more skilled) jobs, and has the advantage of reducing population pressure in the long run.
46
References
Aragie, E. (2015), Climate Change and Semi-subsistence Agricultural Households, PhD Thesis, Oxford Brookes University, Oxford.
Aragie, E., Dudu, H., Ferrari, E., Mainar Causape, A., McDonald, S., Thierfelder, K. (2017), STAGE_DEV - A variant of the STAGE model for developing countries, EUR 28627 EN, JRC Technical Report, Publications Office of the European Union, Luxembourg, doi:10.2760/90737.
Atnafu, A., Oucho, L., Zeitlyn, B. (2014), Poverty, Youth and Rural-Urban Migration in Ethiopia , Working Paper 17, Migrating out of Poverty Research Programme Consortium, University of Sussex, Brighton.
Awulachew, S.B., Erkosa, T., Namara, R. E. (2010), Irrigation Potential in Ethiopia: Constraints and Opportunities for Enhancing the System, International Water Management Institute.
Banerjee, A.V. (2013), ‘Microcredit Under the Microscope: What Have We Learned in the Past Two Decades , and What Do We Need to Know?’, Annual Review of Economics, Vol. 5, pp. 487–519.
Battersby, J. (2011), ‘Urban food insecurity in Cape Town, South Africa: an alternative approach to food access’, Development Southern Africa Vol. 28, Issue 4, pp. 545–561.
Bezu, S., Holden, S. (2014), ‘Are Rural Youth in Ethiopia Abandoning Agriculture?’, World Development, Vol. 64, pp. 259-272.
Boulanger, P., Dudu, H., Ferrari, E., Mainar-Causapé, A., Angelucci, F., Baborska, R., Meilland, T. (2018a), Allocations budgétaires optimales et options de réformes pour le sec teur agrico le dans le P lan Sénégal Emergent 2019-2023 , EUR 29574 FR, JRC Science for Policy Report, Publications Office of the European Union, Luxembourg, doi:10.2760/729645.
Boulanger, P., Dudu, H., Ferrari, E., Mainar Causapé, A., Balié, J., Battaglia, L. (2018b), Policy options to support the Agriculture Sector Growth and Transformation Strategy in Kenya: A CGE Analysis, EUR 29231, JRC Science for Policy Report, Publications Office of the European Union, Luxembourg, doi:10.2760/091326.
Central Statistics Agency (CSA) (2016), Statistical report on the 2016 urban employment unemployment survey, Statistical bulletin 581, Addis Ababa.
Dorosh, P., Wang, H.G., You, L., Schmidt, E. (2012), ‘Road connectivity, population, and crop production in Sub -Saharan Africa’, Agricultural Economics, Vol. 43, Issue 1, pp. 89–103.
Food and Agriculture Organization of the United Nations (FAO) (2018), The future of food and agriculture: Alternative Pathways to 2050, Rome. http://www.fao.org/3/I8429EN/i8429en.pdf.
Kosec, K., Ghebru, H., Holtemeyer, B., Mueller, V., Schmidt, E. (2017), The Effect of Land Inheritance on Youth Employment and Migration Decisions: Evidence from Rural Ethiopia, ESSP Working Paper 104, In ternational Food Policy Research Institute, Addis Ababa.
Lanjouw, J.O., Lanjouw, P. (2001), ‘The rural non-farm sector: issues and evidence from developing countries’ , Agricultural Economics, Vol. 26, Issue 1, pp. 1-23.
Mainar-Causapé, A.J., Ferrari, E., McDonald, S. (2018), Social Accounting Matrices : bas ic aspects and main steps for estimation, EUR 29297 EN, JRC Technical Report, Publications Office of the European Un ion, Luxembourg, doi:10.2760/010600.
Mainar-Causapé, A.J., Ferrari, E., Mengistu A. T., Woldeyes F. B., Dessie E., Ayalew Z., Yeshineh A. (2019) , Ethiopia Social Accounting Matrix 2015/16, EUR 29902 EN, JRC Technical Report, Publications Off ice of the European Union, Luxembourg, doi:10.2760/974668.
M’barek, R.; Philippidis, G.; Ronzon, T. (2019), Alternative Global Transition Pathways to 2050: Prospects for the Bioeconomy - An application of the MAGNET model with SDG insights, EUR 29862, JRC Technical Report, Publications Office of the European Union, Luxembourg, ISBN 978-92-76-11335-5, doi:10.2760/594847.
McDonald, S. (2007), A STatic Applied General Equilibrium Model: Technical Documentation STAGE Ve rsion 1 , Department of Economics and Strategy, Oxford Brookes University, Oxford.
Ministry of Agriculture (MOA) (2015), Agricultural Growth Program II (AGP II), Program Design Document, Addis Ababa.
47
Ministry of Agriculture and Natural Resources (MoANR) (2017), Rural Job Opportunity Creation Strategy, Addis Ababa.
National Planning Commission (NPC) (2016), Growth and Transformation Plan II (GTP II), 2015/16-2019/20, Addis Ababa.
Philippidis, G., Bartelings, H., Helming, J., M’barek, R., Ronzon, T., Smeets, E., van Meijl, H., Shutes, L. (2018), The MAGNET model framework for assessing policy coherence and SDGs: Application to the bioeconomy , EUR 29188 EN, JRC Technical Report, Publications Office of the European Union, Luxembourg, doi:10.2760/560977.
Schmidt, E., Bekele, F. (2016), Rural youth and employment in Ethiopia, ESSP Working Paper 98, International Food Policy Research Institute, Addis Ababa.
Schürenberg-Frosch, H. (2014), ‘Improving Africa's Roads: Modelling Infrastructure Investment and Its Effect on Sectoral Production Behaviour’, Development Policy Review, Vol. 32, Issue 3, pp. 327-353.
Shapiro, B.I., Gebru, G., Desta, S., Negassa, A., Nigussie, K., Aboset, G., Mechal, H (2015), Ethiopia livestock master plan, ILRI Project Report, International Livestock Research Institute, Nairobi.
Haggblade, S., Hazell, P., Reardon, T. (2010), ‘The Rural Non-farm Economy: Prospects for Growth and Poverty Reduction’, World Development, Vol. 38, Issue 10, pp. 1429–1441.
Urgessa, T. (2015), ‘The Determinants of Agricultural Productivity and Rural Household Income in Ethiopia’ , Ethiopian Journal of Economics, Vol. 24, Issue 2.
World Bank (2010), The Ethiopian Urban Migration Study 2008: The Characteristics, Motives and Outcomes of Migrants to Addis Ababa, Technical Report 55731-ET, Poverty Reduction and Economic Management, African Region, World Bank, Washington DC.
Zeleke, G., Asfaw, W., Tolosa, D., Alemu, B., Trutmann, P. (2008), Seasonal Migration and Rural Livelihoods in Ethiopia: An Empirical Study, Working Paper 3, Working Paper Series on Rural-Urban Linkage Theme of the Global Mountain Program (GMP), Addis Ababa.

48
List of abbreviations and definitions
AGP Agriculture Growth Programme
ATVET Agricultural Technical Vocational Education and Training
CAADP Comprehensive Africa Agriculture Development Programme
CES constant elasticity of substitution
CGE Computable General Equilibrium
CSA Central Statistics Agency
CRGE Climate Resilient Green Economy
DEMETRA Dynamic Equilibrium Model for Economic Development, Resources and Agriculture
EDRI Ethiopian Development Research Institute
FAO Food and Agriculture Organization of the United Nations
GDP Gross Domestic Product
GTP I Growth and Transformation Plan I (2010-2015)
GTP II Growth and Transformation Plan II (2015-2020)
HPHC Home Production Home Consumption
ILO International Labour Organization
JRC Joint Research Centre
LFSP Livestock and Fisheries Sector Plan
LMP Livestock Master Plan
MAFAP Monitoring and Analysing Food and Agricultural Policies
nec not elsewhere classified
mha million hectares
MoANR Ministry of Agriculture and Natural Resources
RJOCS Rural Job Opportunity Creation Strategy
SAM Social Accounting Matrix
SDGs Sustainable Development Goals
SLMP Sustainable Land Management Programme
SNNP Southern Nations, Nationalities, and Peoples' Region
USD US dollar
49
List of figures
Figure 1. Employment multipliers in Ethiopia SAM 2015/16................................................. 13
Figure 2. Employment multipliers by rural-urban setting in Ethiopia SAM 2015/16 ......................... 13
Figure 3. Employment multipliers by labour skill in Ethiopia SAM 2015/16 .................................. 14
Figure 4. GDP, GDP per capita and population index, baseline, 2016=100................................... 20
Figure 5. Agri-food value added (left-hand scale) and its share in value added (right-hand scale), baseline, 2016=100.................................................................................................. 21
Figure 6. Main variables affected by the Agropark scenario ................................................. 22
Figure 7. Main variables affected by the Road scenario ..................................................... 22
Figure 8. Main variables affected by the Irrigation scenario................................................. 23
Figure 9. Main variables affected by the Livestock scenario ................................................ 24
Figure 10. Main variables affected by the Labour subsidy scenario ......................................... 24
Figure 11. Main variables affected by the Skills scenario ................................................... 25
Figure 12. Addis Ababa unemployment by labour type (% change from base, 2030) ....................... 28
Figure 13. Labour employment by macro-sector (change from base, 2030) ................................ 30
Figure 14. Labour employment in the food sectors (change from base, 2030) .............................. 31
Figure 15. Share of population living in urban areas (evolution by scenario, 2016-2030) ................... 32
Figure 16. Household income by area (% change from base, 2030) ........................................ 33
Figure 17. Purchaser price for agricultural and food commodities by scenario (% change from base, 2030) 36
Figure 18. Purchaser prices for agri-food composite commodities by area (% change from base, 2030).... 36
Figure 19. Purchaser prices for agri-food composite commodities by region (% change from base, 2030) .. 37
Source: Model results .......................................................................................... 37
Figure 20. Evolution of real GDP by scenario (2016-2030) ................................................. 38
Figure 21. % change in GDP per capita (% change from baseline, 2030).................................... 39
Figure 22. Addressing SDG2: Zero Hunger, by scenario and selection of indicators (% change from baseline, 2030)....................................................................................................... 40
Figure 23. Addressing SDG2: Zero Hunger, agropark scenario and selection of indicators (% change from baseline, 2030) ............................................................................................. 41
Figure 24. Addressing SDG8: Decent work and economic growth and SDG10: Reduced inequalities, by scenario and selection of indicators (% change from baseline, 2030) ................................................ 42
Figure A2.1. Main variables affected by the Extension scenario ............................................. 55
Figure A2.2. Main variables affected by the Revolving fund scenario........................................ 56
Figure A3.1. QR code – DataM URL .............................................................................. 57
Figure A3.2. QR code – RJOC Report ............................................................................. 57
Figure A3.3. QR Code –bulk download Ethiopian SAM .............................................................. 58
Figure A3.4. QR Code –dashboard Ethiopian SAM.................................................................. 58
Figure A3.5. QR Code –Jobs calculator for Ethiopia ................................................................ 59
Figure A3.6. QR Code – Jobs calculator .......................................................................... 59
Figure A3.7. Jobs calculator quick guide.......................................................................... 60

50
Figure A3.8. QR Code –Country Dashboards ...................................................................... 61
Figure A3.9. QR Code – Country Fiche of Ethiopia ................................................................. 61
51
List of tables
Table 1. Macro SAM for Ethiopia 2015/16 (ETB million) ....................................................... 9
Table 2. Activities and commodities disaggregated in Ethiopia SAM 2015/16 ............................... 10
Table 3. Regional distribution of employment multipliers in Ethiopia SAM 2015/16 ......................... 14
Table 4. Description of scenarios ........................................................................... 18
Table 5. Agricultural public expenditure by scenario (billion ETB, 2030) ..................................... 19
Table 6. Employment by production factor (% change from base, 2030).................................... 26
Table 7. Employment by region and labour type (% change from base, 2030) .............................. 27
Table 8. Wage rate by region and labour type (% change from base, 2030) ................................ 29
Table 9. Agri-food employment by labour type (% change from base, 2030) ............................... 30
Table 10. Ethiopian population by areas (% change from base, 2030) ...................................... 31
Table 11. Workers moving to urban areas (% change from base, 2030) .................................... 32
Table 12. Production factors income (% change from base, 2030).......................................... 33
Table 13. Home Production for Home Consumption and marketed production (% change from base, 2030) 35
Table 14. Trade balance by sectors (billion ETB change from base, 2030) .................................. 37
Table 15. Addressing SDG2: Zero Hunger - Change in the nutritional composition of household consumption (% change, 2030)........................................................................................... 43
Table A1.1. Basic structure of flows in the Ethiopia SAM 2015/16 .......................................... 52
Table A1.2. Exports by sectors (% change from baseline, 2030) ............................................ 53
Table A1.3. Imports by sectors (% change from baseline, 2030) ............................................ 54

52
Annexes
Annex 1. Supplementary figures
Table A1.1. Basic structure of flows in the Ethiopia SAM 2015/16
Source : Own elaboration
ch cm m ahf a flab fland flivst fcap_agfcap_na hh enter gov dirtax indtax saltax facttax imptax i_s row
HPHC commodities (ch) X X
Marketed commodities (cm) X X X X X X X
Margins (m) X
Households as activities semi-
subsistence (ahf)X X
Activities (a) X
Labour factor (flab) X X X
Land factor (fland) X X
Livestock (flivst) X X
Capital agricultural (fcap_ag) X X
Capital non-agricultural (fcap_na) X
Households (hh) X X X X X X X X
Enterprises (enter) X X X X X X
Government (gov) X X X X X X X X
Direct taxes (dirtax) X X
Indirect taxes (indtax) X
Sales taxes (saltax) X
Factor taxes (facttax) X
Imports taxes (imptax) X
Save/Investment (i_s) X X X X
Rest of the World (row) X X X X
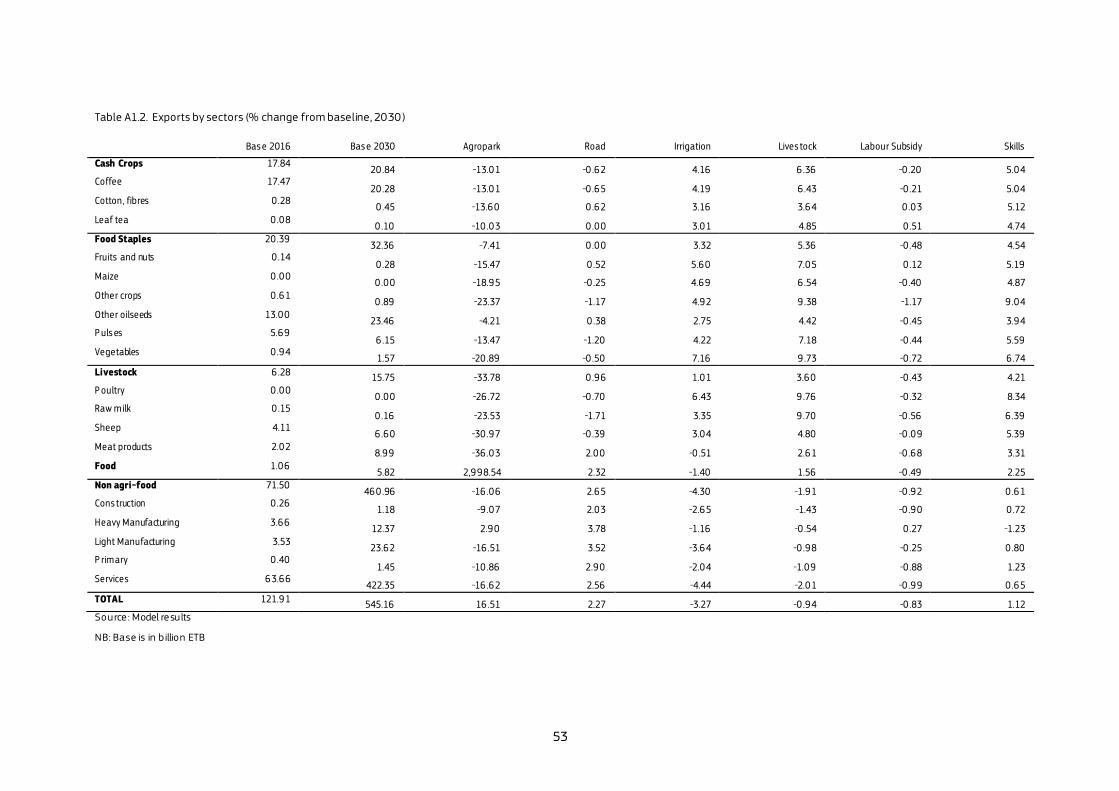
53
Table A1.2. Exports by sectors (% change from baseline, 2030)
Base 2016 Base 2030 Agropark Road Irrigation Lives tock Labour Subsidy Skills
Cash Crops 17.84 20 .84 -13.01 -0 .62 4.16 6 .36 -0 .20 5.04
Coffee 17.47 20 .28 -13.01 -0 .65 4.19 6 .43 -0 .21 5.04
Cotton, fibres 0 .28 0 .45 -13.60 0 .62 3.16 3.64 0 .03 5.12
Leaf tea 0 .08 0 .10 -10 .03 0 .00 3.01 4.85 0 .51 4.74
Food Staples 20 .39 32.36 -7.41 0 .00 3.32 5.36 -0 .48 4.54
Fruits and nuts 0 .14 0 .28 -15.47 0 .52 5.60 7.05 0 .12 5.19
Maize 0 .00 0 .00 -18.95 -0 .25 4.69 6 .54 -0 .40 4.87
Other crops 0 .61 0 .89 -23.37 -1.17 4.92 9 .38 -1.17 9 .04
Other oilseeds 13.00 23.46 -4.21 0 .38 2.75 4.42 -0 .45 3.94
P uls es 5.69 6 .15 -13.47 -1.20 4.22 7.18 -0 .44 5.59
Vegetables 0 .94 1.57 -20 .89 -0 .50 7.16 9 .73 -0 .72 6 .74
Livestock 6 .28 15.75 -33.78 0 .96 1.01 3.60 -0 .43 4.21 P oultry 0 .00
0 .00 -26 .72 -0 .70 6 .43 9 .76 -0 .32 8.34 Raw milk 0 .15
0 .16 -23.53 -1.71 3.35 9 .70 -0 .56 6 .39 Sheep 4.11
6 .60 -30 .97 -0 .39 3.04 4.80 -0 .09 5.39 Meat products 2.02
8.99 -36 .03 2.00 -0 .51 2.61 -0 .68 3.31 Food 1.06
5.82 2,998.54 2.32 -1.40 1.56 -0 .49 2.25 Non agri-food 71.50
460 .96 -16 .06 2.65 -4.30 -1.91 -0 .92 0 .61 Cons truction 0 .26
1.18 -9 .07 2.03 -2.65 -1.43 -0 .90 0 .72 Heavy Manufacturing 3.66
12.37 2.90 3.78 -1.16 -0 .54 0 .27 -1.23 Light Manufacturing 3.53
23.62 -16 .51 3.52 -3.64 -0 .98 -0 .25 0 .80 P rimary 0 .40
1.45 -10 .86 2.90 -2.04 -1.09 -0 .88 1.23 Services 63.66
422.35 -16 .62 2.56 -4.44 -2.01 -0 .99 0 .65
TOTAL 121.91 545.16 16 .51 2.27 -3.27 -0 .94 -0 .83 1.12 Source : Model results
NB: Base is in billion ETB
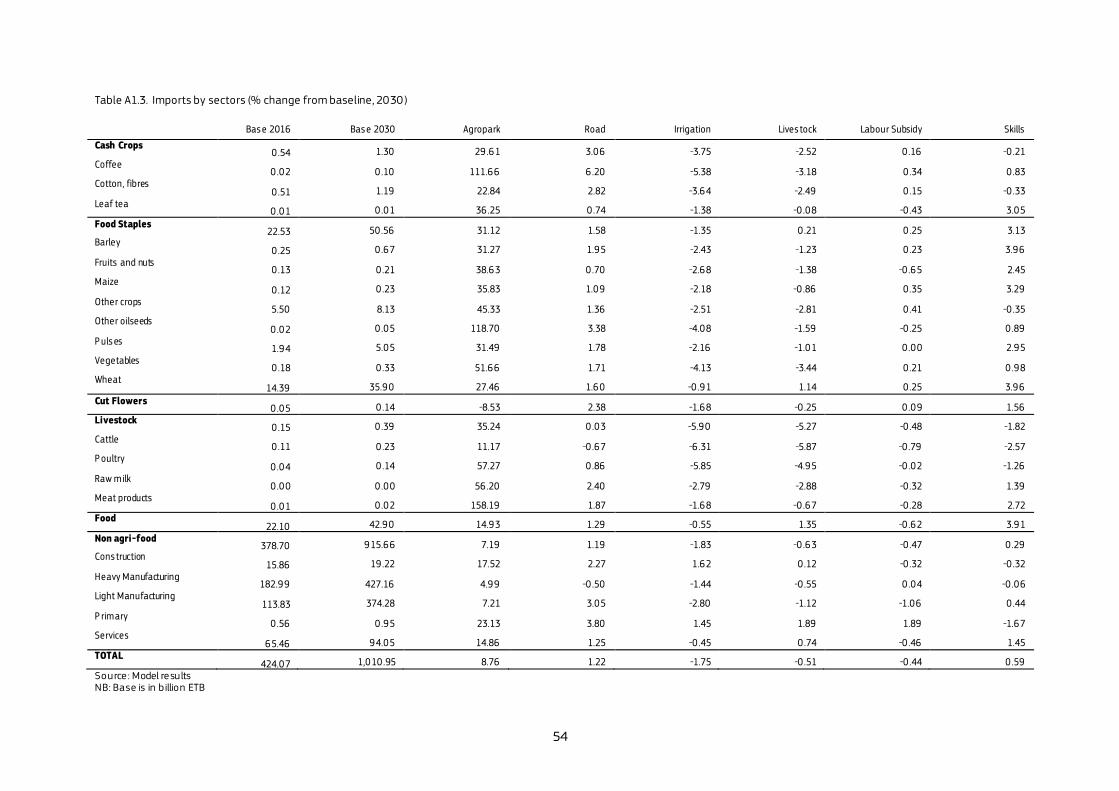
54
Table A1.3. Imports by sectors (% change from baseline, 2030)
Base 2016 Base 2030 Agropark Road Irrigation Lives tock Labour Subsidy Skills
Cash Crops 0 .54 1.30 29 .61 3.06 -3.75 -2.52 0 .16 -0 .21
Coffee 0 .02 0 .10 111.66 6 .20 -5.38 -3.18 0 .34 0 .83
Cotton, fibres 0 .51 1.19 22.84 2.82 -3.64 -2.49 0 .15 -0 .33
Leaf tea 0 .01 0 .01 36 .25 0 .74 -1.38 -0 .08 -0 .43 3.05
Food Staples 22.53 50 .56 31.12 1.58 -1.35 0 .21 0 .25 3.13
Barley 0 .25 0 .67 31.27 1.95 -2.43 -1.23 0 .23 3.96
Fruits and nuts 0 .13 0 .21 38.63 0 .70 -2.68 -1.38 -0 .65 2.45
Maize 0 .12 0 .23 35.83 1.09 -2.18 -0 .86 0 .35 3.29
Other crops 5.50 8.13 45.33 1.36 -2.51 -2.81 0 .41 -0 .35
Other oilseeds 0 .02 0 .05 118.70 3.38 -4.08 -1.59 -0 .25 0 .89
P uls es 1.94 5.05 31.49 1.78 -2.16 -1.01 0 .00 2.95
Vegetables 0 .18 0 .33 51.66 1.71 -4.13 -3.44 0 .21 0 .98
Wheat 14.39 35.90 27.46 1.60 -0 .91 1.14 0 .25 3.96
Cut Flowers 0 .05 0 .14 -8.53 2.38 -1.68 -0 .25 0 .09 1.56
Livestock 0 .15 0 .39 35.24 0 .03 -5.90 -5.27 -0 .48 -1.82
Cattle 0 .11 0 .23 11.17 -0 .67 -6 .31 -5.87 -0 .79 -2.57
P oultry 0 .04 0 .14 57.27 0 .86 -5.85 -4.95 -0 .02 -1.26
Raw milk 0 .00 0 .00 56 .20 2.40 -2.79 -2.88 -0 .32 1.39
Meat products 0 .01 0 .02 158.19 1.87 -1.68 -0 .67 -0 .28 2.72
Food 22.10 42.90 14.93 1.29 -0 .55 1.35 -0 .62 3.91
Non agri-food 378.70 915.66 7.19 1.19 -1.83 -0 .63 -0 .47 0 .29
Cons truction 15.86 19 .22 17.52 2.27 1.62 0 .12 -0 .32 -0 .32
Heavy Manufacturing 182.99 427.16 4.99 -0 .50 -1.44 -0 .55 0 .04 -0 .06
Light Manufacturing 113.83 374.28 7.21 3.05 -2.80 -1.12 -1.06 0 .44
P rimary 0 .56 0 .95 23.13 3.80 1.45 1.89 1.89 -1.67
Services 65.46 94.05 14.86 1.25 -0 .45 0 .74 -0 .46 1.45
TOTAL 424.07 1,010 .95 8.76 1.22 -1.75 -0 .51 -0 .44 0 .59
Source : Model results NB: Base is in billion ETB
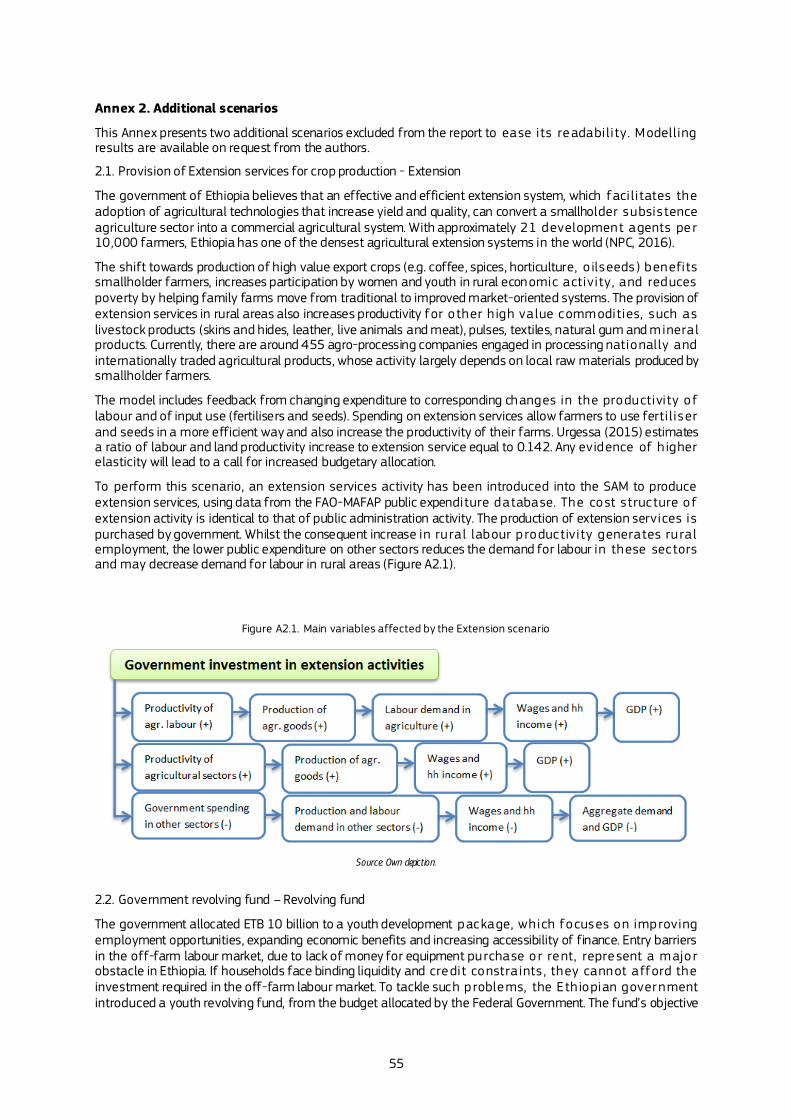
55
Annex 2. Additional scenarios
This Annex presents two additional scenarios excluded from the report to ease its readability. Modelling results are available on request from the authors.
2.1. Provision of Extension services for crop production - Extension
The government of Ethiopia believes that an effective and efficient extension system, which facilitates the adoption of agricultural technologies that increase yield and quality, can convert a smallholder subsistence agriculture sector into a commercial agricultural system. With approximately 21 development agents pe r 10,000 farmers, Ethiopia has one of the densest agricultural extension systems in the world (NPC, 2016).
The shift towards production of high value export crops (e.g. coffee, spices, horticulture, o ilseeds) benefits smallholder farmers, increases participation by women and youth in rural economic activity, and reduces poverty by helping family farms move from traditional to improved market-oriented systems. The provision of extension services in rural areas also increases productivity for o ther h igh value commodities, such as livestock products (skins and hides, leather, live animals and meat), pulses, textiles, natural gum and mineral products. Currently, there are around 455 agro-processing companies engaged in processing nationally and internationally traded agricultural products, whose activity largely depends on local raw materials produced by smallholder farmers.
The model includes feedback from changing expenditure to corresponding changes in the productivity of labour and of input use (fertilisers and seeds). Spending on extension services allow farmers to use ferti liser and seeds in a more efficient way and also increase the productivity of their farms. Urgessa (2015) estimates a ratio of labour and land productivity increase to extension service equal to 0.142. Any evidence of h igher elasticity will lead to a call for increased budgetary allocation.
To perform this scenario, an extension services activity has been introduced into the SAM to produce extension services, using data from the FAO-MAFAP public expenditure database. The cost structure of extension activity is identical to that of public administration activity. The production of extension services is purchased by government. Whilst the consequent increase in rural labour p roductivity generates rural employment, the lower public expenditure on other sectors reduces the demand for labour in these sectors and may decrease demand for labour in rural areas (Figure A2.1).
Figure A2.1. Main variables affected by the Extension scenario
Source: Own depiction.
2.2. Government revolving fund – Revolving fund
The government allocated ETB 10 billion to a youth development package, which focuses on improving employment opportunities, expanding economic benefits and increasing accessibility of finance. Entry barriers in the off-farm labour market, due to lack of money for equipment purchase or rent, represent a major obstacle in Ethiopia. If households face binding liquidity and credit constra ints , they cannot afford the investment required in the off-farm labour market. To tackle such p roblems, the Eth iopian government introduced a youth revolving fund, from the budget allocated by the Federal Government. The fund’s objective
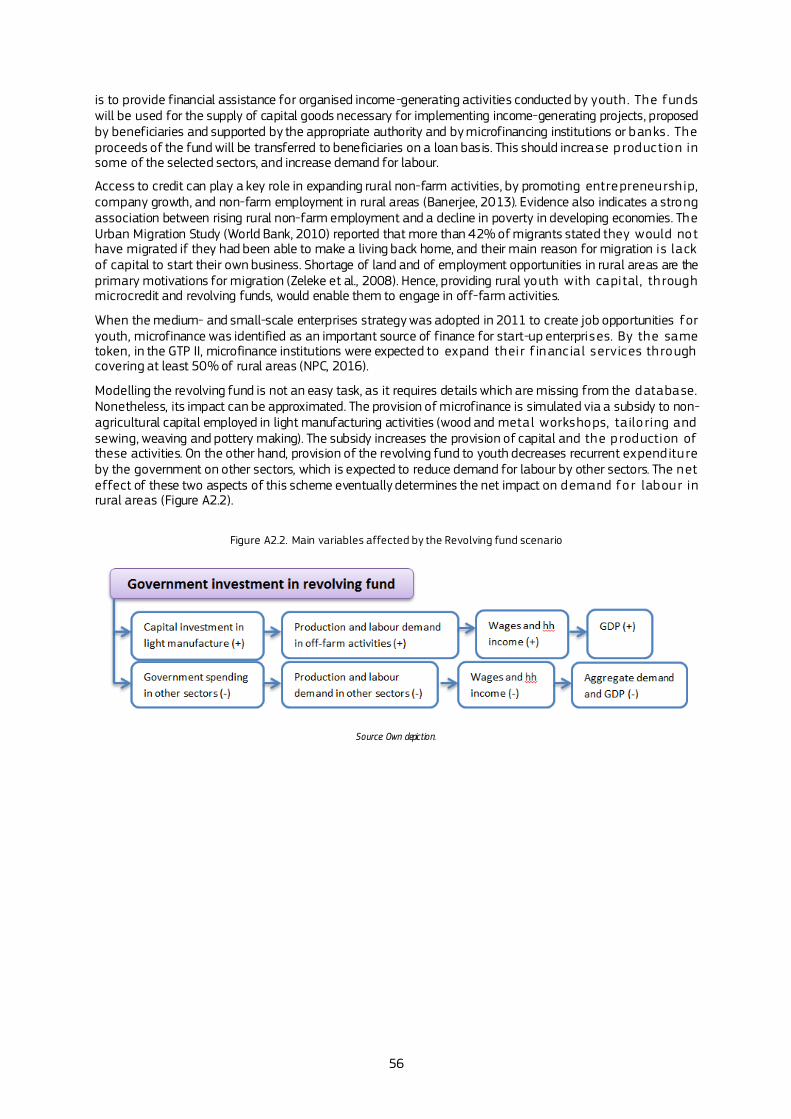
56
is to provide financial assistance for organised income-generating activities conducted by youth . The funds will be used for the supply of capital goods necessary for implementing income-generating projects, proposed by beneficiaries and supported by the appropriate authority and by microfinancing institutions or banks . The proceeds of the fund will be transferred to beneficiaries on a loan basis. This should increase p roduction in some of the selected sectors, and increase demand for labour.
Access to credit can play a key role in expanding rural non-farm activities, by promoting entrepreneurship, company growth, and non-farm employment in rural areas (Banerjee, 2013). Evidence also indicates a strong association between rising rural non-farm employment and a decline in poverty in developing economies. The Urban Migration Study (World Bank, 2010) reported that more than 42% of migrants stated they would not have migrated if they had been able to make a living back home, and their main reason for migration is lack of capital to start their own business. Shortage of land and of employment opportunities in rural areas are the primary motivations for migration (Zeleke et al., 2008). Hence, providing rural youth with capital, through microcredit and revolving funds, would enable them to engage in off-farm activities.
When the medium- and small-scale enterprises strategy was adopted in 2011 to create job opportunities for youth, microfinance was identified as an important source of finance for start-up enterprises. By the same token, in the GTP II, microfinance institutions were expected to expand their f inanc ia l services through covering at least 50% of rural areas (NPC, 2016).
Modelling the revolving fund is not an easy task, as it requires details which are missing from the database. Nonetheless, its impact can be approximated. The provision of microfinance is simulated via a subsidy to non-agricultural capital employed in light manufacturing activities (wood and metal workshops, ta ilo ring and sewing, weaving and pottery making). The subsidy increases the provision of capital and the p roduction of these activities. On the other hand, provision of the revolving fund to youth decreases recurrent expenditure by the government on other sectors, which is expected to reduce demand for labour by other sectors. The net effect of these two aspects of this scheme eventually determines the net impact on demand for labour in rural areas (Figure A2.2).
Figure A2.2. Main variables affected by the Revolving fund scenario
Source: Own depiction.
57
Annex 3. On-line resources
Most of the results presented in this report and the 2015/16 Social Accounting Matrix of Ethiopi a are available on the public website “Data portal of agro-economic Modelling" (DataM) run by JRC. Links can be also accessed with the below QR codes.
Figure A3.1. QR code – DataM URL
https ://datam.jrc.ec.europa.eu
Source: JRC, 2017.
Using DataM users can access and analyse main results of the report through an interactive infographics
Figure A3.2. QR code – RJOC Report
https ://datam.jrc.ec.europa.eu/datam/mashup/RJOC_ETHIOPIA
Source: JRC, 2019.
Using DataM, users can make a bulk download of the SAM in a ZIP file (Dataset_JRC_-_Social_accounting_matrix_-_Ethiopia_-_2015_16.zip) containing a homonymous CSV file. The hyperlink for the direct bulk download is in Figure A3
58
Figure A3.3. QR Code –bulk download Eth iopian SAM
https ://datam.jrc.ec.europa.eu/datam/perm/dataset/fac56b11-140a-46fa-9ae1-8b67e7dc0dcc/download/Dataset_JRC_-_Social_accounting_ma tr i x _-_Eth io pia _-_2015_2016.zip
Source: JRC, 2019.
For the SAM, users may explore and analyse the data through an interactive dashboard placed in the home page of the website (Figure A4) under the PANAP section14.
Figure A3.4. QR Code –dashboard Eth iopian SAM
https ://datam.jrc.ec.europa.eu/datam/mashup/SAM_ET_201516
Source: JRC, 2019.
Furthermore, based on the Social Accounting Matrix, the DataM "jobs calculator" allows making easy interactive simulations of the effects on employment in Ethiopia due to changes in export of given products or services.
14 The organization in sections of the home page of DataM might change in the future, however the direct links to dashboard and files, and realted QR codes ,
are permanent.
59
Figure A3.5. QR Code –Jobs calculato r fo r Eth iopia
https ://datam.jrc.ec.europa.eu/datam/mashup/JOBS_CALCULATOR?SAM=ET
Source: JRC, 2019.
To date, the job calculator works also, at time of writing, with EU and 2 other African countries.
Figure A3.6. QR Code – Jobs calculato r
https ://datam.jrc.ec.europa.eu/datam/mashup/JOBS_CALCULATOR
Source: JRC, 2019.
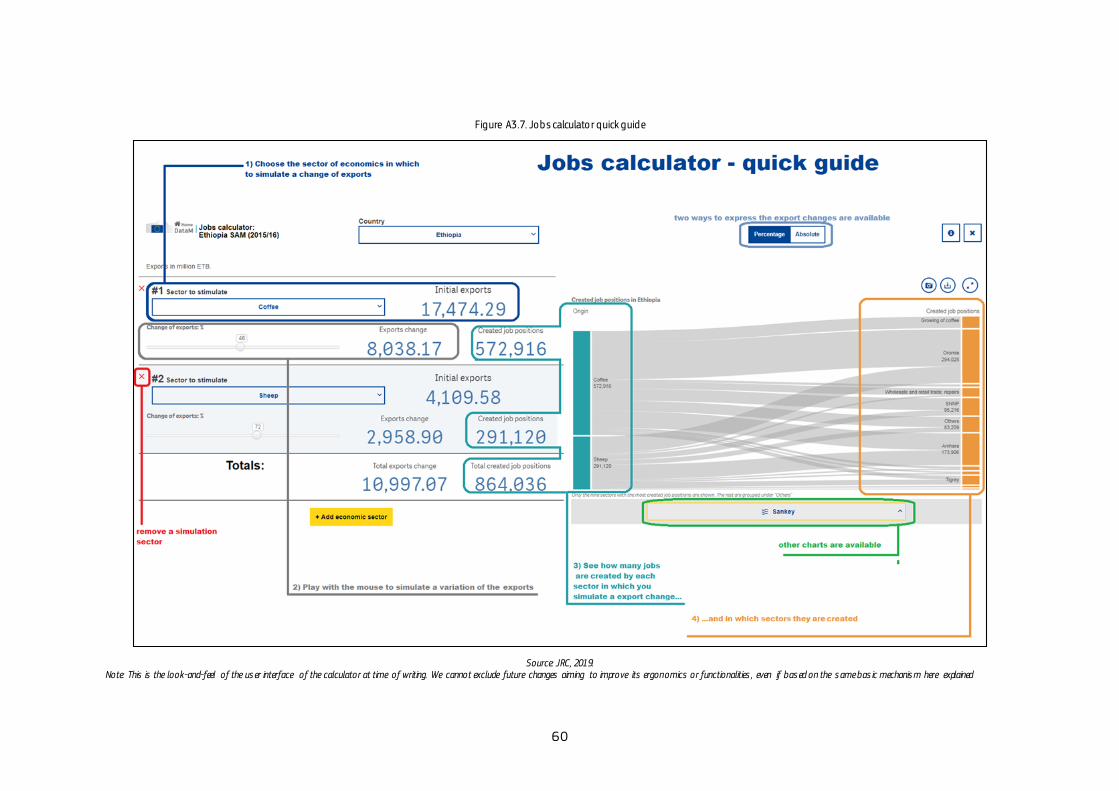
60
Figure A3.7. Jobs calculato r quick guide
Source: JRC, 2019.
Note: This is the look-and-feel of the us er interface of the calculator at time of writing. We cannot exclude future changes aiming to improve its ergonomics or functionalities , even if bas ed on the s ame bas ic mechanis m here explained
61
Finally, DataM offers the "Country Dashboards" a one-stop-shop infographics about food/nut ri ti on se curi ty and re levant macroeconomics and agro-economic indicators produced by several organizations and gathered by country.
Figure A3.8. QR Code –Country Dashboards
https ://datam.jrc.ec.europa.eu/datam/mashup/COUNTRY_DASHBOARDS
Source: JRC, 2019.
Find below the direct link to the fiche of Ethiopia.
Figure A3.9. QR Code – Country Fiche of Eth iopia
https ://datam.jrc.ec.europa.eu/datam/mashup/COUNTRY_DASHBOARDS?iso2=ET
Source: JRC, 2019.
GETTING IN TOUCH WITH THE EU
In person
All over the European Union there are hundreds of Europe Direct information centres. You can find the address of the centre nearest you at: https://europa.eu/european-union/contact_en
On the phone or by email
Europe Direct is a service that answers your questions about the European Union. You can contact this service :
- by freephone: 00 800 6 7 8 9 10 11 (certain operators may charge for these calls),
- at the following standard number: +32 22999696, or
- by e lectronic mail via: https://europa.eu/european-union/contact_en
FINDING INFORMATION ABOUT THE EU
Online
Information about the European Union in all the official languages of the EU is available on the Europa website at: https://europa.eu/european-union/index_en
EU publications
You can download or order free and priced EU pub lications from EU Bookshop at: https://publications.europa.eu/en/publications. Multip le copies of free publications may be obtained by contacting Europe Direct or your local information centre (see
https://europa.eu/european-union/contact_en).
KJ-1
A-2
9949-E
N-N
doi:10.2760/76450
ISBN 978-92-76-11265-5