PN ~r--q:t~
102
PN 0! ?._C( l\IARKET STUDY FOR FRESH FRUITS AND VEGETABLES IN SELECTED SOUTHEAST ASIAN COUNTRIES Preparedfor The Agricultural .Marketing Development Project Amman, Jordan At the request of The Agricultural :Marketing Organization, Amman, Jordan and The Sigma One Corporation, Raleigh, Durham, North Carolina Under Contract to the US Agency for International DevelopmenJ Prepared by: Ahmed A. Araji and Ra'ed F. Hattar June, 1995
-
Upload
khangminh22 -
Category
Documents
-
view
3 -
download
0
Transcript of PN ~r--q:t~

PN ~r--q:t~0! ?._C( (~
l\IARKET STUDY FOR FRESH FRUITS AND VEGETABLESIN SELECTED SOUTHEAST ASIAN COUNTRIES
Preparedfor
The Agricultural .Marketing Development ProjectAmman, Jordan
At the request ofThe Agricultural :Marketing Organization, Amman, Jordan
andThe Sigma One Corporation, Raleigh, Durham, North Carolina
Under Contract to theUS Agency for International DevelopmenJ
Prepared by:
Ahmed A. Araji and Ra'ed F. Hattar
June, 1995

,~.
ABOUTTHEAUTHORS
Dr. Ahnzed A. Araji is ProfessorofAgricultural Econolnics at theUniversity of Idaho. He served
.as Consultant to plan andorganize this study.
Mr. Ra'ed F. Hattar has a MSc.degree in AgriculturalEcono111ics. He is a ll1enzber ofthe Export Prol1zotionDepartl1zent, at the AgriculturalMarketing Organization.

I
A CKNO lVLEDGJIEJ.VT
The authors wish to extend their appreci(1tion to the Agricultural AfarketingOrgani=ation and the United States Agencyfor International Development forfimdingthis Study.
1Ve are indebted to many individuals and organi=ations for their contribution to thisstudy. 1Ve extend our appreciation to A1r. Jamil Zureigat andMr. Richard Peters forcoordinating this project. In Thailand, the cooperation ofthe following organizationis greatly appreciated: (1) The Department ofAgricultural Research, Ministry ofAgriculture, (2) The Department ofAgricultural and Resource Economics, KasetsartUnil'ersity, (3) The Bangkok Chamber ofCommerce, (I) The ASEANAgriculturalDevelopment Planning Center, and (5) The Department ofAgricultural Statistics.We would also like to thank the manager ofT/wi Cargo Terminal, the manager ofsupermarket chains, andfmils and vegetables wholesalers for their cooperation.
In Malaysia, we extend our deep gratitude to the following organi=ations forfacilitating ourfield study: (1) The ASEAN Food Handling Bureau, (2) The FederalAgricultural A1arketing Authority, (3) The Trade Advis01y Bureau, (I) PuO-a JVorldTrade Center, (5) The Kuala Lumpur Fruits 1¥holesale Association, (6) The KualaLumpur Vegetables Wholesale Association, (7) The Selayang Wholesale CentralAlarket, (8) Kelang Container Terminal, (9) Malaysian International ShippingCorporation, and (10) Malaysian Agricultural Research and Development Institute.JVe would also like to express our appreciation to the manager ofCold StorageTrading and managers ofSupermarket Chains for their cooperation.
In Singapore, the authors are indebted to the following organizations for theirassistance in providing data requiredfor this Study: (1) The Singapore TradeDevelopment Board, (2) The Singapore Department ofStatistics, (3) The SingaporeAir Transport Service Catering, (I) The Pasir Panjang Wholesale Center, (5) TheSingapore Public Health Division, (6) NTUS Co-operative, and (7) PSA ColdStorage. QUI' appreciation is also extended to the managers ofthe SupermarketChains for providing data on quantity, quality, andprice offi-esh produce.
The authors H'ould like to express their gratitude and sincere appreciation to Mrs.Laurette Mansour, Executive Project Secretwy, for the many hours she devoted inhandling the communications befweenAmman and each ofAlalaysia, Singapore andThailand. 1Ve are also indebted to Laurette for her help in typing andpreparing thefinal manuscript.
1l

rI
PARTl
PART II
PART III
l\L-\RKET STUDY FOR FRESH FRUITS A~D VEGETABLESIN SELECTED SOUTHEAST ASIAN COUNTRIES .
TABLE OF CONTENTS
INTRODUCTIONDemography, National Account and Food Importl\IalaysiaSingaporeThailand
FRESH FRUITS AND VEGETABLESTRADE DISTRIBUTION CHANNELS:MalaysiaSingaporeThailand
IMPORT OF FRESH FRUITS ANDVEGETABLESBYl\1ALAYS~,
SINGAPORE AND THAILAND
l\1ALAYSIA FRUITS Il\lPORTSFresh orangesOrange juicel\landarinsGrapefruitLemonsGrapesMelonsApples
MALAYSIA VEGETABLES L"'\IPORTAsparagusBroccoliCauliflowerCarrotsCeleryLettuceRound Cabbage
iii
11133
781113
17
181821212828283538
3838424242474747

.:\
SINGAPORE FRUITS L'IPORT 54Fresh oranges 54Orange juice 54l\fandarins 54Grapefruit 60Lemons 60Grapes 60l\'felons 67Apples 67
SINGAPORE VEGETABLE IMPORTS 67Broccoli 67Cabbage 73Cauliflower 73Carrots 73Celery and Leafy Vegetables 73Tomatoes 82
THAILAND FRUIT AND VEGETABLE IMPORTS 85Apples 85Grapes 85Broccoli 86
PART IV SUl\ll\IARY AND CONCLUSIONCONCLUSION
iv
8790

LIST OF FIGURES
Page
Figure 1 Distribution Channels for Fresh Fruits and Vegetables 9
in :l\falaysia
Figure 2 Distribution Channels for Fresh Fruits and Vegetables 12in Singapore
Figure 3 Distribution Channels for Fresh Fruits and Vegetables 15in Thailand
Figure 4-A :l\falaysia Total Imports of Fresh Oranges by Quantity 20and Value, 1988 - 1994
Figure 4-B . Fresh Oranges l\farket Share by Exporting Country, 20l\lalaysia 1993
Figure 5-A l\lalaysia Total Imports of :l\fandarins by Quantity 27and Value, 1988 - 1993
Figure 5-B :Mandarins Market Share by Exporting Country, 27l\1alaysia 1993
Figure 6-A l\lala)'sia Total Imports of Grapefruits by Quantity 30and Value, 1993 - 1994
Figure 6-B Grapefruits l\farket Share by Exporting Country, 30l\lalaysia 1993
Figure 7-A l\falaysia Total Imports of Lemons by Quantity 32and Value, 1988 - 1993
Figure 7-B Lemons :l\Iarket Share by Exporting Country, 32l\falaysia 1993
Figure 8-A l\falaysia Total Imports of Table Grapes by Quantity 3-1and Value, 1988 - 1993
Figure 8-B Tables Grapes Market Share by Exporting Country, 3-1l\lalaysia 1993
v

Page
Figure 9-A l\fala)'sia Total Imports of Melons by Quantity 37and Value, 1988 - 1993
Figure 9-,B Melon :\Iarket Share by Exporting Country, 37Malaysia 1993
Figure 10-A - l\fala)'sia Total Imports of Asparagus by Quantity 41and Value, 1988 - 1993
Figure 10-B - Asparagus Market Share by Exporting Country, 41l\lalaysia 1993
Figure 11-A - Malaysia Total Imports of Broccoli and Cauliflower 44by Quantity and Value, 1988 - 1993
Figure 11-B - Broccoli and Cauliflower :Market Share by Exporting 44. Country, l\Ialaysia, 1993
.Figure 12-A - l\lalaysia Total Imports of Carrots by Quantity 46and Value, 1988 - 1993
Figure 12-B - Carrots :Market Share by Exporting Country, 46Malaysia, 1993
Figure 13-A - l\lalaysia Total Imports of Celery by Quantity 49and Value, 1988 - 1993
Figure 13-B - Celery l\Iarket Share by Exporting Country, 49:Malaysia, 1993
Figure 14-A - l\falaysian Total Imports of Lettuce by Quantity 51and Value, 1988 - 1993
Figure 14-B - Lettuce Market Share by Exporting Country, 51l\lala)'sia, 1993
Figure 15-A - l\lala)'sia Total Imports of Round Cabbage by Quantity 53and Value, 1988 - 1993
Figure 15-B - Round Cabbage l\Iarket Share by Exporting Country, 53:Malaysia, 1993
Figure 16-A - Singapore Total Imports of Oranges by Quantity 56and Value, 1988 - 1994
VI

Page
Figure 16-B - Oranges .Market Share by Exporting Country, 56Singapore, 1994
Figure 17-A - Singapore Total Imports of Mandarin by Quantity 59and Value, 1988 - 1994
Figure 17-B - :Mandarin Market Share by Exporting Country, 59Singapore, 1994
Figure 18-A - Singapore Total Imports of Grapefruits by Quantity 62and Value, 1988 - 1994
Figure 18-B - Grapefruit :Market Share by Exporting Country, 62Singapore, 1994
Figure 19-A - Singapore Total Imports of Lemons by Quantity and 64. and Value, 1988 - 1994
Figure 19-B - Lemon :Market Share by Exporting Country, 64Singapore, 1994
Figure 20-A - Singapore Total Imports of Grapes by Quantity and 66Value, 1988 - 1994
Figure 20-B - Grapes :Market Share by Exporting Country, 66Singapore, 1994
Figure 21-A - Singapore Total Imports of Melons by Quantity and 69Value, 1988 - 1994
Figure 21-B - Melon :Market Share by Exporting Country, 69Singapore, 1994
Figure 22-A - Singapore Total Imports of Broccoli by Quantity and 72Value, 1988-1994
Figure 22-B - Broccoli Market Share by Exporting Country, 72Singapore, 1994
Figure 23-A - Singapore Total Imports of Cabbage by Quantity 75and Value, 1988 - 1994
Figure 23-B - Cabbage Market Share by Exporting Country, 75Singapore, 1994
vii

Page
Figure 24-A - Singapore Total Imports of Cauliflower by Q~antity 77and Value, 1988 - 1994
Figure 24-B - Cauliflower :Market Share by Exporting Country, 77Singapore, 1994
Figure 25-A - Singapore Total Imports of Carrots by Quantity 79and Value, 1988 - 1994
Figure 25-B - Carrots 1\farket Share by Exporting Country, 79Singapore, 1994
Figure 26-A - Singapore Total Imports of Leafy or Stem Vegetables 81. by Quantity and Value, 1988 - 1994
Figure 26-B - Leafy or Stem Vegetables l\larket Share by Exporting 81Country, Singapore, 1994
Figure 27-A - Singapore Total Imports of Tomato by Quantity 84and Value, 1988 - 1994
Figure 27-B - Tomato Market Share by Exporting Country, 84Singapore, 1994
viii

LIST OF TABLES
Table 1 Populationt Gross National Product (GNP)t Per Capita 2Income (PCl)t and Food Import (Fl)t :Mala)'sia 1983-1994
Table 2 Population, Gross National Product (GNP)t Per Capita 4Income (PCl)t and Food Import (FI)t Singapore 1983-1994
Table 3 Populationt Gross National Product (GNP), Per Capita 5Income· (PCI), and Food Import (FI), Thailand 1983-1994
Table 4 :Malaysia Imports of Fresh Orangest 1988 - 1994 19
Table 5 Frozen Orange Juicet Ready for Immediate Consumptiont 22Imported by 1\fala:ysia 1993-1994
Table 6 Frozen Orange Juice, Not Ready for Immediate Consumptiont 23Imported by l\iala)'sia 1993-1994
Table 7 Unfrozen Orange Juice, Ready for Immediate Consumption, 24Imported by l\falaysia 1993-1994
Table 8 Unfrozen Orange Juice, Not Ready for Immediate 25Consumption, Imported by :Malaysia 1993-1994
Table 9 l\falaysia Imports of 1\landarins, 1988 - 1994 26
Table 10 l\fala)'sia Imports of Grapefruitst 1988 - 1994 29
Table 11 l\falaysia Imports of Lemons, 1988 - 1994 31
Table 12 l\falaysia Imports of Grapest 1988 - 1994 33
Table 13 l\falaysia Imports of 1\lelons (Cantaloupe), 1988 - 1994 36
Table 14 Apple Imports by l\falaysia, 1993 - 1994 39
Table 15 l\fala)'sia Imports of Asparagus, 1988 - 1994 40
IX

Page
Table 16 l\1ala)'sia Imports of Cauliflower & Broccoli, 1988 - 1994 43
Table 17 :Malaysia Carrot Imports, 1988 - 1994 45
Table 18 :l\1alaysia Imports of Celery, 1988 - 1994 48
Table 19 .Mala)'sia Imports of Lettuce, 1988 - 1994 50
Table 20 :l\fala)'sia Round Cabbage Imports, 1988 - 1994 52
Table 21 Singapore Orange Imports, 1988 - 1994 55
Table 22 Orange Juice Imports by Singapore, 1993 57
Table 23 . Singapore :Mandarin Imports, 1988 - 1994 58
Table 24 Singapore Grapefruit Imports, 1988 - 1994 61
Table 25 Singapore Lemon Imports, 1988 - 1994 63
Table 26 Singapore Grape Imports, 1988 - 1994 65
Table 27 Singapore :l\felon Imports, 1988 - 1994 68
Table 28 Apple Imports by Singapore 70
Table 29 Singapore Broccoli Imports, 1988 - 1994 71
Table 30 Singapore Cabbage Imports, 1988 - 1994 74
Table 31 Singapore Cauliflower Imports, 1988 - 1994 76
Table 32 Singapore Carrots Imports, 1988 - 1994 78
Table 33 Singapore Leafy or Stem Vegetable Imports, 1988 - 1994 80
Table 34 Singapore Tomato Imports, 1988 - 1994 83
x

l\I.ARKET STUDY FOR F~ESH FRUITS AND VEGETA~LES
IN SELECTED SOUTHEAST ASIAN COUNTRIES
PART I
INTRODUCTION
Southeast Asia is one of the \Vorld's fastest grown region. Among countries in Southeast Asiathat have shown high rate ofeconomic growth in recent years are: Malaysia, Singapore andThailand. The Gross National Product (GNP) of this sub-region has been increasing at animpressive average annual rate of 15.7 percent. Average annual increase in Per Capita Income(PCI) of the sub-region has exceeded 13 percent. Rapid rate ofeconomic growth andincrease in PCI have reflected in increase in the consumption of high quality food products andthus significant increase in food import. Food import by Malaysia, Singapore and Thailandhas been increasing at an average annual rate of 14.58 during the 1983-1990 period. Totalfood import by this sub-region exceeded $8.89 billion in 1991 and is estimated at $ 11.94billion in 1994. High quality fresh fruit and vegetables accounts for a significant part of totalfood import by this sub-region. The demography and a briefnational account ofeach of thethree countries in this sub-region of Southeast Asia is outlined in the following section.
l\Jalaysia
Malaysia had an average annual population growth rate of2.4 percent. Malaysia's populationincreased from 14.8 million in 1983 to 18.2 million in 1991. Population of Malaysia isestimated at about 19.5 million in 1994 (Table 1). In recent years the GNP ofMalaysia hasbeen increasing at an average annual rate of8.8 percent. Malaysia's GNP is estimated at over$58 billion in 1994. In recent years PCI in Malaysia has been increasing at an average annualrate of8.6 percent and is estimated at $2973 in 1994 (Table 1). All economic indicators pointtoward continuous economic growth with a projected annual grmvth rate ofover 8 percentthrough the 1990s.
Rapid economic growth and increase in PCI have increased consumers demand for importedfood products. Food import, excluding fishery products, by Malaysia has been increasing atan average annual rate of 10.46 percent since ]983 and by over 14 percent in recent years.Food import, excluding fishery products, increased from $ 1.56 billion in 1983 to about $3.64billion in 1994. In general, for every one percent increase in PCI Malaysia's food importincreased by 1.2 percent. The imports offresh fruit and vegetables have been increasing at anaverage annual rate ofover 6.3 percent.
1

"" ...
r,'-
Table 1:I
Population, Gross National Product (GNP), Per Capita Income (PCI), andFood Import (FI), l\fala)'sia 1983 - 1994
Year Population GNP PCI FI(1000) (l\1illion) (US$) (10,000 US$)
(US$)
1983 14,888 28,246 1,897 156,108
1984 15,270 31,702 2,076 173,074
1985 15,681 29,048 1,852 161,831
1986 16,109 25,897 1,608 139,081
1987 16,526 29,634 1,793 155,964
1988 16,942 32,747 1,933 195,561
1989 17,353 35,589 2,051 240,360
1990 17,763 40,451 2,277 252,097
1991 18,193 45,054 2,476 289,101
1992 18,629 49,108 2,636 312,229
1993 19,076 53,479 2,803 337,457
1994 19,534 58,078 2,973 364,116
Source: Asean Agricultural Development Planning Center. Agricultural Statistical YearBook on Food, Agriculture and Forestry. Kasetsart University, Chaterchat,Bangkok, Thailand.
Department of Statistics. Year Book of Statistics. Singapore.
2

I'
;\
Singapore.
Singapore population has been increasing at an average annual rate of about 2 percent since1983. The population of Singapore is estimated at over 2.93 million in 1994 (Table 2).During the 1983-1994 period the Singapore economy grew at an impressive annual rate of14.6 percent. The Singaporian GNP at current market price increased ITom $ 17,298 millionin 1983 to $ 63, I03 million in 1994. The Singapore PCI increased by an average annual rateof 16.2 percent and reached an estimated $19,223 in 1994 (Table 2). Singapore ranks topamong developed nations in economic growth. Singapore also has one of the \\Torld's highestPCI.
Singapore high economic performance and rapid increase in PCI have increased consumers'demand for goods and services in general and for high quality food products in particular.Food imports, excluding fishery products, reached an estimated $ 2.57 billion in 1994. Foodimports have been increasing at an average annual rate ofabout 5 percent since the early1980's (Table 2). .
In general, for every one percent increase in PCI, food imports increased by 0.57 percent. Ofall food products, the imports offresh fruits is the highest. Fruits imports increased from$348.8 million in 1983 to $ 579.6 million in 1993 at an average annual rate of6.6 percent.The imports offresh fruit and vegetables have increased from $ 190.4 million in 1983 to $246.1 million in 1993 at an average annual rate ofover 2.9 percent. An estimated 30 percentof the imported fresh fruits and vegetables by Singapore is exported to other ASEANCountries, primarily to Brunei, Indonesia, T\1alaysia, and Thailand (Table 2).
Thailand
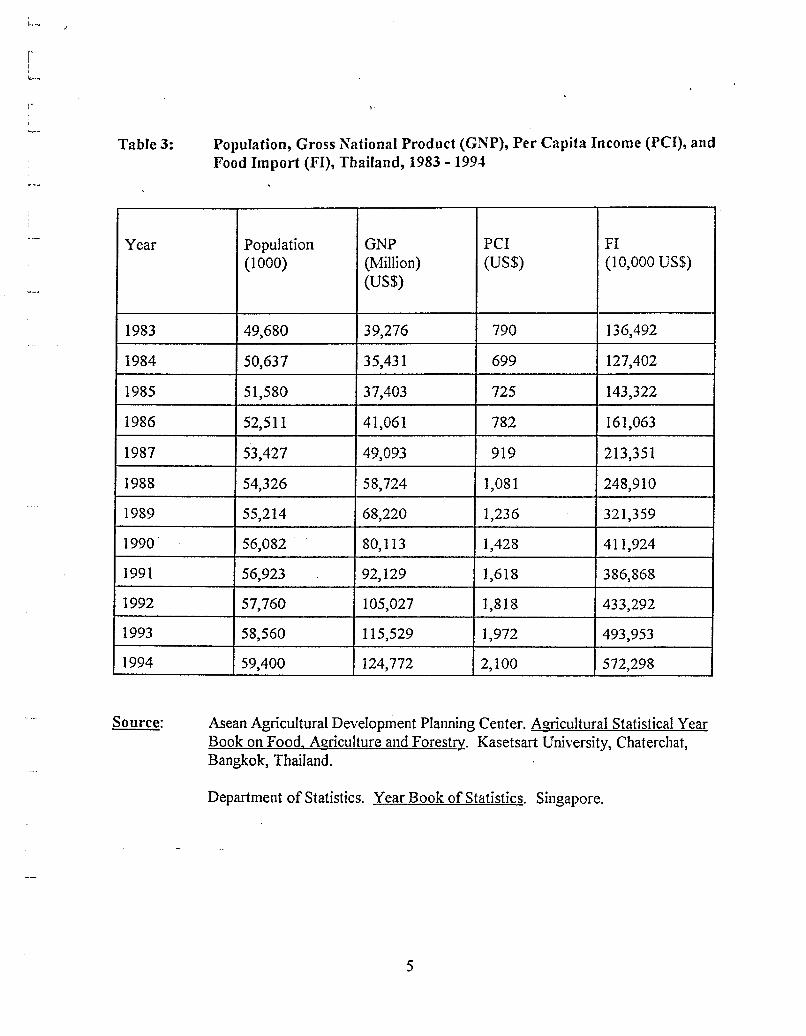
Thailand population has increased at an average annual rate of 1.8 percent since 1983. Totalpopulation ofThailand was estimated at over 59.4 million in 1994. Thailand population isprojected to exceed 64 million in year 20001
• The GNP of Thailand has been increasing at anaverage annual rate of7.9 percent during the 1980-1990 period. In recent years, however, theThai economy has been growing at an annual rate over 16 percent. The GNP of Thailand isestimated at over $ 124 billion in 1994. Thailand's PCI increased at an average annual rate ofover 13 percent during the 1983-1994 period. The Thai PCI is estimated at about $ 2100 in1994 (Table 3).
The results of the 1992 household Socio-Economic survey show that household income has
National Economic and Social Development Board. Population Statistics.Human Resource Planning Division. Kingdom of Thailand.
3

Table 2: Population, Gross National Product (GNP), Per Capita Income (PCI), andFood Import (FI), Singapore 1983 - 1994
Year Population GNP PCI FI(1000) (Million) (US$) (10,000 US$)
(US$)
1983 2,502 17,298.0 6,913 147,661
1984 2,529 19,134.2 7,565 174,860
1985 2,558 18,330.3 7,165 . 141,880
1986 2,586 18,187.7 7,032 153,731
1987 ~,613 20,534.1 7,858 158,207
1988 2,647 24,816.8 9,375 196,831
1989 2,685 28,887.9 10,758 193,648
1990 2,705 36,798.9 13,148 202,719
1991 2,763 44,801.0 14,798 223,583
1992 2,818 49,389.0 16,132 234,538
1993 2,874 55,843.8 17,600 245,796
1994 2,932 63,103.5 19,223 257,815
Source: Asean Agricultural Development Planning Center. Agricultural Statistical YearBook on Food, Agriculture and Forestry. Kasetsart University, Chaterchat,Bangkok, Thailand.
Department of Statistics. Year Book of Statistics. Singapore.
4
r"Ii,.....
r'
Table 3: Population, Gross National Product (GNP), Per Capita Income (PCI), andFood Import (FI), Thailand, 1983 - 1994
Year Population GNP PCI FI(1000) (Million) (US$) (10,000 US$)
(US$)
1983 49,680 39,276 790 136,492
1984 50,637 35,431 699 127,402
1985 51,580 37,403 725 143,322
1986 52,511 41,061 782 161,063
1987 53,427 49,093 919 213,351
1988 54,326 58,724 1,081 248,910
1989 55,214 68,220 1,236 321,359
1990 56,082 80,113 1,428 411,924
1991 56,923 92,129 1,618 386,868
1992 57,760 105,027 1,818 433,292
1993 58,560 115,529 1,972 493,953
1994 59,400 124,772 2,100 572,298
Source: Asean Agricultural Development Planning Center. Agricultural Statistical YearBook on Food, Agriculture and Forestry. Kasetsart University, Chaterchat,Bangkok, Thailand.
Department of Statistics. Year Book of Statistics. Singapore.
5

increased by 25 percent between 1990 afld 1992. Household income increased from $ 2700in 1990 to about $ 3389 in 1992. Average annual household expenditures was estimated at $3,133 in 1992. Household expenditures on food account for about 32 percent of householdincome. Family expenditures on fruits and vegetables account for 12 percent of familyexpenditures on food and for over 3.7 percent of family income2
•
As Thailand's PeI increased, the consumption of fruits and vegetables has also increased. AsPCI increased the consumption pattern in Thailand has shifted from lower grade fruits andvegetables to those of high quality3. The change in consumption pattern toward high qualityfood resulted in a significant increase in the import offood in general and fruits and vegetablesin particular. Food imports increased from $ 1.36 billion in 1983 to over $ 5.72 billion in1994, at an average annual growth rate ofover 15 percent. The value of fresh fruits importsincreased from $ 8.3 million in 1983 to over 75 million in 1994 at an average annual rate of18.4 percent. The consumption offiuits in Thailand has increased at an average annual rate of3.21 percent and the consumption ofvegetables has increased at an annual rate of2.09percent. All economic indicators point toward continuous economic growth through the1990s and increasing demand for imported high quality fresh fruits and vegetables.
2
3
Somporn, Isvilanoda. "Vegetables and Fruits in Thailand". Department of.Agricultural and Resource Economics, Kasetsart University, Bangkok, Thailand,1993.
National Statistical Office. "Report of the 1992 Household Socio-EconomicSurvey". Office of the Prime Minister, Bangkok, Thailand.
6

r>
1
PART II
FRESH FRUIT AND VEGETABLE TRADEDISTRIBUTION CHANNELS
The fresh fruit and vegetable market distribution system in ~1alaysia, Singapore and Thailandbasically follows the classic pattern of importer to wholesaler to retailer. The comparativeimportance of each of the various channels is changing. The distribution channels vary indifferent countries and according to product. The market distribution system for fresh fruitsand vegetables are rapidly developing to accommodate expanding economies with increasingconsumer demand. The system ranges from highly advanced in Singapore to less developed inThailand. The Malaysian distribution channels are rapidly developing in all segments of themarketing chain.
The expanding role of the private sector, associated with the rapid development of free marketsystems, in tlus sub-r~gion is changing the relative importance ofeach of the various stages inthe market distribution chain. The expanding role of national and multi-national supermarketchains, with food retail stores in several countries in Southeast Asia, has increased thecomparative importance of the retail sector. Relative to the import and wholesale sectors, therole of the retail sector in the marketing chain will continue to increase in the future.Increased per capita income and increase in the percentage ofwomen in labor force of thesesocieties \\'i.1I increase the advantage ofone-stop shopping offered by supermarkets.
Political stability, rapid economic growth, and increased demand for fresh produce hasenhanced increasing private investments in the development of the market distributionchannels. Over the past few years significant investments by the private sector were made inthe development of the retail sector for consumer goods in general and for fresh produce inparticular. The retail distribution channels for fresh produce in this sub-region has beenundergoing significant structural changes. OnIy a few years ago small independent retailersand specialty shops accounted for the greater part of the retail turnover in fresh produce.Today, however, this leading role has been increasingly taken over by the Supermarkets andother multiple outlets. The small retailers often buy and sell whatever products are available inthe morning at the wholesale market. The multiples prefer dependable supplies over 52 v-;eeksa year of high quality products packed and presented in accordance with pre-determinedspecifications. This development in turn requires greater adjustments from foreign exporters,importers and wholesalers to accommodate the new practices retailing of fresh produce. Ascompetition at the retail level increases and the trade becomes more consumer oriented,supermarkets will be forced to reduce prices and provide consumers with high qualityproducts.
The increasing role of the supermarkets within the marketing chains on one hand andincreasing competition among supermarket chains for the consumer's dollars on the other
7

hand have set two marketing developments in motion. First, for economic and other logisticreasons and because of the multinational nature of most chain supem1arkets operating in thesub-region, the chain supermarkets in Malaysia, Singapore and Thailand have initiated a realtrend toward an integrated retail-import marketing system. Many chain supem1arkets ini\1alaysia and Singapore, and to a small extent in Thailand, have integrated forward andengaged in direct import of fresh produce from foreign producers and foreign exporters.Other chain supem1arkets in Malaysia, Singapore and Thailand are studying the feasibility ofacompletely integrated system. In general, chain supermarkets are developing their importexpertise and increasingly seeking direct contact with foreign producers and foreign exporters.Second, importers/wholesalers, realizing the increasing role of supem1arkets in the marketingchain, are integrating backward to the retail sector through consignment arrangements \vithsupem1arket chains. The integration process in the fruit and vegetable trade channels isexpected to continue until most costs associated with intermediaries are reduced or eliminated.
The structure of the fruit and vegetable trade channels in each ofMalaysia, Singapore andThailand is described in detail in the sections below.
l\lalaysia
I'olitical stability and the socio-economic progress of Malaysia are rapidly moving the countryto free market systems. Depending on the kind of produce, most fruit and vegetables at thepresent time are subject to a 5-10 percent import duty except those imported from ASEANcountries. The fruit and vegetable trade in Malaysia is conducted by the public and privatesectors. The public sector import is handled by the Federal Agricultural Marketing Authority(FAI\L\). At the present time an estimated 40 percent ofannual Malaysia's import offreshfruits and vegetables is conducted by FAMA and 60 percent by the private sector. However,the public sector role is rapidly declining and the import function ofFAi\fA will be transferredto the private sector within a few years. The domestic distribution channels, includingwholesale and retail, are controlled by the private sector. Private importers/wholesalers andFMfA directly and independently negotiate with foreign producers and foreign exporters forthe import offresh fruits and vegetables. Most imports are conducted on eIF basis.
The 1\'\'0 major suppliers of fresh fruits and vegetables to Malaysia are Australia and theUnited States. Private fruit and vegetable organizations in Australia and the United Statessuch as the Australian Horticultural Board, the California Table Grape Commission,'Vashington Apple Commission, SUNKIST Co-operative maintain promotion centers inSingapore. In cooperation with their respective embassies, the Australian and United Statesorganizations have an extensive promotion campaign organized by their central promotionoffices in Singapore. The promotion campaigns are generally for one week and are conductedin each country at least two times per year for each major product they export to the subregion. The fruit and vegetable commissions and board in Australia and the United States donot engage in import negotiations. This function is left entirely to private producers andexporters.
The normal distribution pattern for imported fresh fruit and vegetables on the Malaysia marketis shown in Figure I. The distribution channel follow the classic pattern of importer towholesaler to retailer. 1\105t importers are also \vholesalers. The importers/wholesalers have
8

f',
Figure 1 Distributio~ Channels for Fresh Fruit and Vegetables inMalaysia
Foreign Producers/Exporters
Private Sector 1/Importers/Wholesalers~:~~-\~~,~
Federal AgriculturalMarketing Authority
(FAMA)
J~
Wholesalers
\} ", \}
Chains Caterers Secondary"----? Supermarkets Wholesalers
,II
1 ,IJ 1Mobil e West Independentretails Markets Grocers
9
ChainsSupermarkets

premises in the wholesale market and carry out normal trading in both imported and domesticproduce. The importers/wholesalers distribute fruits and vegetables to a rapidly developingchain ofsupermarkets, secondary wholesalers, and the catering sector. The secondary\'1'holesalers generally distribute to independent stores, greengrocers, wet markets and mobileretailers.
The share of supennarket chains and other multiple outlets in !\falaysia retail trade hasincreased considerably during the last ten years. The role of supermarket chains in Malaysia'afruit and vegetable trade is projected to increase significantly in the future. Most supermarketchains are multi-national with expansion plans in several different locations in Kuala Lumpur,Shah Alam and other developing urban areas ofMalaysia.
At the present, supennarket chains obtain the major portion of their requirements of fresh fiuitand vegetables from importer and importers/wholesalers. Very small portion of theirrequirements are imported directly from foreign producers and exporters. However, foreconomic and other logistic reasons and because of their multi-national nature, there is anemerging trend among most supermarket chain's to integrate forward to the import sector.This trend is primarily stimulated by the high costs associated with the number ofintermediaries in the fruit and vegetable trade. Some supermarket chains have alreadyengaged in direct import from foreign producers and exporters on a limited basis. However,all supermarket chains in Malaysia are studying the feasibility of forward integration. It isprojected that within a few years most supermarket chains will integrate forward and engagein direct import ofa significant portion of their fruit and vegetables. The extent of forwardintegration by Malaysia's supemlarket chains will be influenced by two factors. The twofactors are: (1) Availability of cold storage facilities either Olvned or rented by the chains, and(2) The training ofpersonnel and the availability of import expertise.
The other emerging development in fruit and vegetable trade is backward integration byimporters/exporters to the retail sector. This is conducted on a limited basis throughconsignment arrangements between the chains and the importers/wholesalers. Thisarrangement is based on a commission charged by the supermarket chains for space rent andlabor costs for shelving and selling the imported fresh produce delivered to the supennarket.The arrangement is new and still experimental.
The infra-structure in Malaysia is very \"ell developed with modem transportation andhighway systems. New modem airport with cold storage facilities to accommodate theexports and imports of perishables, is being constructed. T,,·,'o major seaports with modemcontainer temunal and cold storage facilities are operational. A modem wholesale marketwith cold storage facilities is under construction in Kuala Lumpur and is scheduled to open atthe end of 1995.
10

SI~GAPORE
Singapore depends exclusively on the outside world for its food supply, including fresh fruitsand vegetables. The fruit and vegetable marketing system is completely controlled by theprivate sector and free from any government interference. Imports of fresh produce is subjectto a 3 percent duty. The marketing distribution channels are highly advanced. As indicated inthe previous section, major exporting countries, primarily Australia and the United Statesmaintain promotion centers in Singapore. The promotion centers in Singapore develop andconducted all promotional activities for all products in tIlis sub-region of Southeast Asia. Allimports, however, are directly negotiated between importers and foreign exporters or foreignproducers.
The structure of the fresh fruit and vegetable distribution system in Singapore is shown inFigure 2. The trade channels basically follow the classic pattern of importer to wholesaler toretailer. The comparative importance of each of the various trade channels is changing with astrongly emerging retail sector. Most importers are also wholesalers. Theimporters/wholesalers also function as re-exporters. An estimated 30 percent ofthe importedfresh fruits and vegetables is re-exported primarily to Brunei, Indonesia, Malaysia, andThailand. The import/wholesale segment of the marketing chain is highly developed andequipped with all modem facilities. Most importers/wholesalers have their own cold storagein addition to utilizing available space from a number of firms specializing in cold storage. Allimporters/wholesalers have premises in the major wholesale market in Singapore and carry outnormal trading in foreign and domestic markets. The domestic trading function oftheimporters/wholesalers is the distribution of fresh produce to a well organized supermarketchains, catering sector, and secondary wholesalers.
The share of the supennarket chains and other multiple outlets in Singapore retail trade hasincreased considerably during the past 10 years and is expected to rise further in the future.An estimated 60 percent of fresh fruit and vegetable retail trade is presently handled bysupermarket chains and multiple outlets. As in the case ofMalaysia, most supermarket chainsare multi-national with stores in several countries in Southeast Asia. The supermarket chainsare rapidly expanding in Singapore and other countries. An increasing volume of freshproduce is being handled annually by the multi-national supermarket chains. Tllis developmenthas caused most supermarket chains to study the economic feasibility of forward integration tothe import sector and utilize the economy ofscale and other benefits associated with acompletely integrated system. At the present, supermarket chains obtain part or all of theirsupply of fresh produce from importers/wholesalers. One common trading practice is thatsupermarket chains and importers/exporters negotiate contracts specifYing quantity, quality,and price ofeach product. The contract may also provide for delivery and pre-packing ifnecessary. The other trading process is that the purchasing agent of the chain negotiates ,vithimporters/wholesalers and secure on a ,veekly or monthly basis the supply required by allstores in his/her chain.
The process offresh produce purchase by supennarket chains is rapidly changing. Most majorsupermarket chains have integrated to the import sector and presently secure up to 40 percentof their stores supply through direct import. These chains maintain their own cold storage and
II

Figure 2 Distribution Channels for Fresh Fruit and Vegetables inSingapore
Foreign Producers/Exporters 1-------------..
Importers/wholesalers
~---~/'~{ Re-Export I
"/ Caterers Secondary
Wholesalers.Chains ~~~--~
Supermarkets
IIndependent Retailersl
12
Green grocersl

are planning to increase their import to cover up to 70 percent of their required supply withina few years. The other' emerging arrang~ment in retail trade is consignment agreementsbetween supermarket chains and importers/wholesalers or between foreign exporters and thesupermarket chains. In short, the retail trading sector in Singapore is dynamic, higWyadvanced, well managed and has a ,,,'ell trained personnel in all aspects offresh producetrading.
The catering sector, especially restaurants, hotels and airlines, is another large consumer ofimported fresh fruits and vegetables. Singapore is becoming more and more the financial andbusiness center for Southeast Asia. The unique geographic location of Singapore and thepolitical development in Hong Kong have increased demand for Singapore as a regionalbusiness and financial center. Singapore presently experience a booming restaurant, hotel andairline business. The demand for fresh fruits and vegetables by the catering sector is projectedto increase for high quality products.
The Singapore Airline Transport Service (SATS) is the one major single caterer offreshproduce in Singapore. The SATS catering provide food service for ~2 international andregional airlines. It purchases over 12 thousand tons of fresh produce annually. At thepresent SATS catering service purchases the major segment of the fresh produce it requiresfrom importers/whol~salers and directly imports a small portion from foreign producers andexporters. However, SATS catering is planning to integrate to the import sector on a largescale. Purchasing executives of SATS are investigating foreign sources for the supply of theirfresh produce. The SATS catering maintain a very modern cold storage facilities. Foreeconomic and logistic reasons this catering service prefers to reduce the number ofintermediaries and plans to secure its requirements of fresh produce through direct importfrom foreign producers and exporters. The SATS catering service is noted for its emphasis onfreshness, crispiness and very high quality fruits and vegetables.
The infrastructure in Singapore is one of the best in the world. By the nature of its uniquelocation in the region, Singapore is increasingly becoming a major shipping center. Its portfacilities are very modem and equipped with the most advanced technology, including coldstorage and container terminals. Feeder ship lines between Singapore and other ASEANcountries are frequent and timely. Customs and other clearing procedures are organized, fastand well managed. It takes less than six hours to clear a container from the time of its landing.Singapore airport is very modern and has modem cold storage and other perishable handlingfacilities. The airport serves all major international and regional airlines. Singapore also hasseveral firms specialize in cold storage with available space for different quantity and storagetime.
Thailand
The fresh fruit and vegetable trade market in Thailand is not as free nor organized as themarkets in Singapore and Malaysia. Two major factors affect the import offruits andvegetables to Thailand. They are: (1) Legal restriction and heavy import duty, and (2) theoligopolistic structure of the import sector.
13

C"
To protect domestic producers, the government ofThailand has imposed heavy importrestrictions on some fruit and subjected 9ther fruit to high import duties. The legal restrictionson citrus products, especially fresh orange, is such that for all practical purpose the legalimport of fresh orange is impossible in order to protect domestic orange production fromdisease and insects. In addition to the legal restrictions on fresh orange, the government hasalso imposed heavy import duties on all imported fresh fruits and vegetables, other than thoseimported from ASEAN countries. The import duties on fresh produce was 60 percent of theCIF value up to December 1994. It was reduced to 45 percent in January 1995. Importduties on fresh fruits and vegetables is expected to be decreased to 30 percent of the ClFvalue in January 1996. Thailand, hO\vever, is rapidly moving to free market systems. Thailandis now a member of the General Agreement on Trade and Tariff (GATT). All import dutieswill gradually be reduced to comply with the provisions of GATT.
Politically, Thailand is reducing the public sector role and rapidly moving to free marketsystems. The government of Thailand has initiated the necessary legislation process to movethe country to free market systems. However, the economic structure of the fresh fruits andvegetables iiuport segment of the trade channels will remain an obstacle to free trade. Theimport offresh fruits and vegetables is controlled by a few firms. This segment of the fruit andvegetable distribution is a classic case ofoligopoly. Six firms control 96 percent of the fiuitand vegetable imports. Individual importers conduct all imports from small office located inthe private residence. Contact with foreign exporters is conducted by telephone and fax.
The structure ofthe fiuit and vegetable trade channels in Thailand follow the classic pattern ofimporter to wholesaler to retailer (Figure 3). In contrast to Malaysia and Singapore, thecomparative importance of the import sector is greater than the wholesale and retail segmentof the distribution channels. Typically, importers do not function as wholesalers. Importersmaintain their cold storage facilities and truck distribution network. They supply their closenet ofwholesalers with fresh imported produce on a daily or \veekly basis. By the nature oftheir small number and their control of the import segment, importers influence both quantityand prices of imported fresh produce. The prevailing structure of the import segment in thedistribution chain has set in motion two trends. First, an increasing number ofyoungentrepreneurs are analyzing the import market and making entry preparation. Second, anemerging desire by supermarket chains to integrate fOf\vard to the import sector. Bothdevelopments will speed u p movement toward free and open import trade.
The wholesale segment of the distribution chalmels is distinct without direct link orpartnership with importers. Market wholesalers have premises in the wholesale markets andcarry out wholesale trading in both imported and domestic produce. Few wholesalers in eachof the hvo wholesale markets in Bangkok specialize in imported produce. The two majorwholesale markets in Bangkok are privately owned and open to all domestic and importedfresh produce for a small fee. The premises of the market where wholesalers handle importedfresh produce are equipped with modern facilities, including cold storage, office andcommunication systems. Whole-salers supply their network of customers of secondarywholesalers, caterers, supermarket chains, and multiple outlets with their weekly or dailyrequirements of fresh produce. \Vholesalers, generally, do not have delivery systems. Thesecondary wholesalers supply fruit and vegetables to independent retailers, greengrocers,farnler markets, and wet markets.
14

Figure 3 Distribution Channels for Fresh Fruit and Vegetables inThail and
Foreign Producers/Exporters
Importers I
Wholesalers I
...,Supermarkets
chainsScondary
Wholesalers
15
"IndependentRetailers
... /
Caterers

The supem1arket chains is one area of the retail sector that are rapidly expanding all over themetropolitan area ofBangkok and other expanding urban areas of Thailand. Severaldomestic and multi-national supem1arket chains are entering the retail market in Thailand.The changing socio-economic structure of the Thai society is increasing consumer demand forone stop shopping and thus the expansion of supem1arket retail. As in Malaysia andSingapore, and for similar economic and logistic reasons, some supennarket chains arepartially integrated. Others are studying the economic feasibility of forward integration. ThefOf\\'ard integration tendency by supermarket chains in Thailand is strongly influenced by theoligopolistic control ofa few importers. Supennarket chains in Thailand are looking for newsuppliers, making contact with foreign producers and exporters, building their own coldstorage, and training personnel in the import of fresh produce. In general, the comparativeimportance of the retail sector, especially supennarket chains, in Thailand food distributionsystem is increasing.
The catering sector in Thailand is composed of Thai Airlines, restaurants, hotels and otherinstitutions. Rapid economic growth in Thailand has increased international travel anddemand for new modern hotels. TIllS development plus increasing consumer demand forrestaurants and outside eating are increasing demand by the catering sector for imported freshfruits and vegetables.
The infra-structure in Thailand is much less developed than those of Singapore and Malaysia.Bangkok, the main population center, depends on feeder systems from Singapore or HongKong for its imported goods..The sea port, about 20 kilometers from Bangkok, is equippedwith modem facilities, including cold storage and container terminals. Bangkok airport ismodern and expanding. It receives most international airlines and provides free cold storagefor perishables for 3 days. Transportation and delivery witilln Bangkok is a major problem fordistribution of fresh produce within the city.
16

PART IIII
Il\IPORT OF FRESH FRUITS AND VEGETABLES BYl\IALAYSIA, SI~GAPOREAND THAILAND
Along with other countries in Southeast Asia, :Malaysia, Singapore and Thailand are becomingmajor markets for fresh fruits and vegetables. The sub-region ,,~th its population ofabout 82million has a high economic grov.1h and increasing per capita income \vhich have reflected inincreasing demand for imported food. The import offresh fruits and vegetables by thesubregion have expanded rapidly in recent years. In addition to an impressive economicgro\:V1h in the subregion, the increase in fruit and vegetable imports was influenced by se\'eralfactors. First, consumer's increasing awareness of the value of fresh produce in their dailydiet. Second, the development of the infra-structure and the marketing channels essential forthe distribution of fresh produce. Third, the declining value of the US dollar against mostinternational currencies.
Consumers world \vide are becoming more educated, health conscious, and aware of the valueoffresh produce in their daily diet. The per capita consumption offresh produce has doubledin the developed and most developing countries of the world during the last few years withincreasing proportion of household food expenditures allocated to the purchase of freshproduce. Political stability, transformation to free market systems, and rapid rate ofeconomicgrowth have stimulated increasing public and private investments in infra-structure,transportation systems, and the development of modern trade distribution systems. Mostinternational trade transactions are conducted in US dollars. During the 1988-1994 period thedollar lost 8 percent of its value against the Malaysian ringgit, 32 percent of its value againstthe Singapore dollar, and 2 percent of its value against the Thai baht. All these developmentsled to a significant improvement in the import-export sector of the economy ofthis subregionin general and the imports of fresh produce in particular.
This sub-region of Southeast Asia imports a variety of fruits and vegetables from a largenumber ofcountries. Citrus products, apple and grapes are the major fruit items that areimported in large quantity. The United States and Australia are the major suppliers of freshfruits to this sub-region. Carrots, cauliflower, broccoli, celery, round cabbage, and iceberglettuce are the major vegetable products imported by the sub-region in large quantities fromnumerous countries of the world. Jordan produces most of the fruits and practically all of thevegetable products imported by Malaysia, Singapore and Thailand. But Jordan's export offruits and vegetables to countries in this sub-region is very small. Jordan has a significantbalance of trade deficit with all of these countries. However, evaluation of the type andquality ofproducts imported by this sub-region and Jordan's production ofthese productsindicates that Jordan has potential to export certain types offruits and vegetables to this subregion and thus improve its balance of trade.
The following sections evaluate the import ofmajor fruits and vegetables by 1\falaysia,Singapore, and Thailand by quantity, elF price and source of export.
17

::\IALAYSIAI
Malaysia produces a number of vegetables and tropical fruits and also imports a variety offresh fruits and vegetables. It is rapidly becoming a major southeast Asian market for freshfruits and vegetables. The import of fresh produce increased significantly during the last 5 to6 years. Major fruit and vegetable products imported by Malaysia, for which Jordan may haveexport potential, are discussed in the following section.
Fresh Oranges
Malaysian imports of fresh oranges during the 1988-1994 period are shown in Table 4 andFigure 4-A. The total quantity of imported oranges to Malaysia remained relatively the sameduring the 1988-1992 period at about 35-39 thousand tons. The import offresh orangesincreased to 59,508 metric tons in 1993 or an increase of 52 percent over the 1992 importedquantity. The 1994 quantity imported oforanges does not include the December importedquantity. Malaysia imports fresh oranges from over 16 countries. However, Australia and theUnited States are the two major suppliers offresh oranges to the ~1alaysianmarkets.Australia and the United States account for over 76 percent of the imported oranges toMalaysia. China and Portugal, the other two non-ASEAN countries, provide 18 percent and2 percent, respectively, of the fresh oranges imported by Malaysia. ~falaysia also importsoranges from Thailand and Indonesia (Figure 4-B). Both Thailand and Indonesia are membersofASEAN and their products are subject to less than 3 percent duty. The quality oforangesimported from both Thailand and Indonesia, however, is low quality compared to orangesimported from the rest ofthe world.
Average elF price of imported oranges has declined from $635 per ton in 1988 to about $440per ton in 1994. The average CIF price includes the low price of the low quality orangesimported from Thailand and Indonesia. The CIF price of Australian imported oranges hasdeclined from $653 per ton in 1988 to $466 per ton in 1994, or a decline ofover 40 percentduring 6 year period. The ClF price of US imported oranges declined from $747 per ton in1988 to $531 per ton in 1993 or 40 percent decline during this period. The CIF value andquantity of imported oranges from the US in 1994 was effected by heavy frost in the Westernpart of the US that caused significant crop damage. Thus, the statistical data for the USoranges in 1994 does not represent the US share of the market in a typical year.
Oranges in Malaysia, as in other countries of Southeast Asia, are sold by the piece at the retailstores. The desired quality is the Thin-Skin orange that has sweet taste and rich orangecolor. The desired size is 113-138 pieces in 20 Kg box. On the average, this is equivalent to6-7 pieces per Kg. The United States SUNKIST Cooperative is providing the desired size andquality at a relatively higher CIF price than Australia and other countries. The results of thefield study conducted with Malaysian importers/wholesalers and at retail stores in March,1995 show that the import price for high quality oranges ranges between $650-$906 per tondepending on the season and the size. The wholesale price ranges between $900 - $ ])20 perton. And the retail price ranges between $] ,600-$1 ,900 per ton. The import-wholesale pricespread is about 28 percent and the wholesale-retail price spread is about 46 percent.
]8

.....\J;l
TABLE 4; MALAYSlA IMPORTS OF FRESH ORANGES,1988 - 1994
Y E A R1988 1989 1990 1991 1992 1993 1994 (JAN - NOV)
SOURCE QUANTIT VAL QUANTI VALU QUANTlT VAL QUANTIT VAL QUANTIT VAL QUANTII' VALUE QUANTIf VALli _(TON) $(fON (fON)$7rON (TON) ${[ON (TON) $rrON (TUN) $"(N1'1 11'ON) ${[ON (TON) SrroN
AU~"TRALIA 12812 653 11623 743 13202 674 . 16692 676 18965 539 11))76 466 13272 466U.S.A 14811 747 15366 763 15948 694 7681 833 14344 641 16991 531 135 345TIWLAND 4107 214 6345 187 4712 217 1574 218 3608 221 10798 232 1 479CHINA 550 595 752 603 979 594 1086 502 1001 535 932 445 510 436INDONESIA 0 0 0.34 528 3 499 2 126 32 229 863 122 4<136 311PORTUGAL 29 602 31 549 153 463 326 564 740 450 976 419 2 290ARGENTINA 824 418 576 393 0 0 0 0 0 0 0 0 0 0TAIWAN 141 671 197 670 143 572 238 612 114 580 62 620 132 64SCYPRUS 20 538 107 468 56 442 228 449 55 461 1 517 0.30 382PAK..C>--rAN 39 673 119 586 105 517 110 610 39 688 35 584 0 0EYGPT .52 427 8 580 35 558 47 479 74 502 35 397 109 461OTI-IERS 75.08 703 116.98 648 130.56 564 305.47 752 257.04 572 239.83 460 343.07 376TOTAL 33460 634 35241 641 35466 617 30289 683 39228 545 59508 438 ?JN41 440
,,-

,FIGURE 4-A
MALAYSIA TOTAL IMPORTS OF FRESH ORANGES8Y QUANTITY AND VALUE, 1988 - 1993
$27,OOO,O~
$26,000,000
$25,000,000
$24,000,000 W::J..J<t:
$23,000,000 >
$22,000,000
$21 ,000,COO
$20,000,000
60'001,----;---,-----;---'1---..-----.--,-
, II! ! I ! ! +
;5000 ·········!···················i····················!···················i····················,··············· ·"fi·········f • I : : • I
! Ii! i !!I . iii ! ;I f" j .!
50000 ·········r···················T···················r·····..···········1···················-r········· ./' j .>- i 1 ! i !:!t:! Ii! J i~ 45000 L. l.. i ~ ·f·········)····.·····A" I ! ! Ii. I--.. I ! I :. I::J I' • I' i! Ia I' I!:'
I ,t.... f I : - I40000 ~········r··....····....·~;r··T·· ..··...'""'·.::.·~·~·:···!·· ..······..······....·T········ .. ·····..·· .. ·: .. /···· ....·.. ·· .. ·· .... l··..·u
•••
i I" I "fe, Ii: I!"' I I ...... I' ;' III' . .....,.. A
35000 1".............. I ...••.•..••••.•.. I ········_.;,:····t········· ·..-·~··-r··················T········: I J ',I .,..... I II I I r I 1I ! I ' I i
300ool-'----Ir------;-----t---~---+---+_--L
1~ 1~ 1~ 1~ 1~ 1m
YEAR
[ -- QUANTITY (TON) -0+-- VALUE (US$) ~
FIGURE 4-8
FRESH ORANGES MARKET SHARE BY EXPORTINGCOUNTRY, MALAYSIA 1993
TAIWAN (0.1 %)INDONESIA (1.5%) OTHERS (0.4%)
THAILAND (18.1 %)
AUSTRALIA (48 0%)
ORTUGAL (1.6%)EYGPT (01%)
20

Orange Juice
In addition to fresh oranges, Malaysia imports several types of orange juice from 15' differentcountries. The imported orange juice are classified into: (l) frozen ready for immediateconsumption, (2) frozen not ready for immediate consumption, (3) unfrozen ready forimmediate consumption, and (4) unfrozen not ready for immediate consumption. In 1994,Malaysia import~d 492,329 liters of frozen orange juice ready for immediate consumption atan average elF price of $.82 per liter. This was an increase of 26 percent over the quantityimported in 1993. Australia, Belgium and Korea accounted for over 56 percent of the importof this type of orange juice (Table 5).
In 1994, Malaysia imported 629,596 liters of frozen orange juice not ready for immediateconsumption at an average CIF price of $1.97 per liter. The United States accounted for 32percent of this total at a CIF price of$2.53 per liter. The United States, Brazil, and Australiaaccounted for over 73 percent of the import of this type of orange juice in 1994. The 1994import was 26 percent greater than the quantity imported in 1993 (Table 6).
An estimated 177,414 liters ofunfrozen orange juice that was ready for immediateconsumption was imported by Malaysia in 1994 at an average CIF price of $.87 per liter. The1994 imported quantity was 22 percent less than the imported quantity in 1993 and the CIFprice in 1994 was 21 percent less than CIF price in 1993 (Table 7). Malaysia also importsunfrozen orange juice that is not ready for immediate consumption. In 1994, Malaysiaimported 462,105 liters of this type oforange juice at an average CIF price of $1.99 per libre.The quantity imported in 1994 was 17 percent less than in 1993 but the CIF price was over 11percent higher. The United States was the major supplier of this type oforange juice at CIFprice of $2. 50 per litre. The United States, Brazil, Taiwan, and Australia supplied about 70percent of this type oforange juice (Table 8). In general, Malaysia imported over 1.76 millionliters ofall types oforange juice in 1994.
1\Jandarins
Mandarins is the second major citrus product imported by Malaysia. The imports of freshmandarins have increased rapidly during the 1988-I994 period. Malaysia imported 8,668 tonsof mandarins at an average CIF price of $ 656 per ton in 1988. The quantity imported ofmandarins by Malaysia in 1993 was 23,173 tons at an average CIF price $ 461 per ton.Between 1988 and 1993 mandarins imports increased by 168 percent and CIF price decreasedby 43 percent (Table 9 and Figure 5-A). Statistical data for 1994 are unavailable. Chinaaccounts for about 93 percent of the mandarins imports to Malaysia (Figure 5-B). Fresh citrusin general and mandarins in particular is used as gift that is exchanged during Chinese NewYear. And, thus, Chinese mandarin is preferred by the Chinese population in Malaysia.
The CIF price per ton ofmandarins in 1993 dropped significantly due to large quantity ofmandarin imported from China at significantly lower price than in previous years. ClF price ofmandarins from China in 1993 was 70 percent of the average CIF price in the previous year.
21

Table 5: Frozen Orange Juice, Ready for Immediate Consumption, Imported byMalaysia, 1993-1994.
Source YEAR
1993 1994Quantity CIF Value Quantify CIF Value
(Lt.) (SILt.) (Ll) (SILL)
Australia 33,858 1.57 72900 0.88
Belgium 111,492 0.75 73096 0.7
C)·pros - - 720 1.3
Germany - - 4702 0.75
Jordan - - 23969 0.49
Korea 79161 0.5 130424 0.64
l\fala)"sia - - 27552 0.95
Netherlands - - 41076 0.99
New Zealand 1942 2.04 15281 1.9-1
Singapore 57486 0.92 65059 0.98
Switzerland - - 2160 0.89
Thailand 17280 0.36 12995 1.02
U.K. - - 4320 0.5
U.s. 90121 0.8 18073 0.73
Total 391341 0.83 492329 0.82
22

;T
!
Table 6: Frozen orange juice, not ready for immediate consumption, imported byl\fala)'sia, 1993-1994.
YEAR
Source 1993 1994Quantity CIFVaL Quantity CIFVaL
(Lt.) (SILt.) (Lt.) (SILt.)
Australia 38939 2043 84643 1.95
Brazil 107547 1.33 175905 1.28
Canada 3000 2.92 1350 2.67
China 4800 0.7 - -France 29400 2.34 4·noo 2.35
Japan 370 2.22 7950 2.2
Korea 7738 0.57 12589 0.44
Netherlands 3600 5.05 4627 5,4
New Zealand 13778 2.23 59927 1.88
Singapore 37359 1.01 15399 1.42
Taiwan - - 7866 1.14
Thailand - - 1440 1.01
V.K. 4475 2.89 12902 3.57
U.S. 225347 2.18 200596 1.97
Total 503355 1.82 629596 1.97
23

\.,,, ......
i,I....-..
Table 7: Unfrozen Orange Juice; Ready for Immediate Consumption, Imported byMalaysia, 1993-1994.
YEAR
Source 1993 1994
Quantity CIFVaL Quantity CIFVaL(Lt.) (SILt.) (Lt.) (SILt.)
Australia -10804 0.95 66814 1.08
Germany 2-100 1.37 - -Hong Kong -1379 1.05 - -Indonesia 16480 0.8 - -Japan 4500 0046 - -Korea 68522 1.29 22971 0.43
Netherlands 2400 0.58
New Zealand 1101 1.02 3464 1.02
Singapore 53222 0.76 31570 0.95
South Africa - - 3600 0048
Taiwan - - 2000 0.79
Thailand 2592 1.03 6942 1.05
V.K. - - 2400 0,48
U.S. 17064 1.09 17073 1.15
215465 1.05 177414 0.87
24

Table 8: Unfrozen Orange Juice, Not Ready for Immediate Consumption,Imported By :Mala)'sia, 1993-1994
YEAR
1993 1994
Source Quantity CIF Value Quantity CIFValue(Lt.) (SILt.) (Lt) (SILt.)
Australia 57,346 2.09 49,223 2.42Belize -- -- 4,200 1.78Brazil 127,944 1.46 93,870 1.51China -- -- 18,000 1.09Japan 18,907 2.14 20,597 2.35Korea 15,829 1.17 3,309 1.19Netherlands 630 4.60 1,020 1.84New Zealand 750 2.90 37,100 1.43Singapore 33,253 0.84 41,262 0.92Taiwan 12,756 1.99 53,074 2.25Thailand 1,080 1.76 2,400 2.94U.K. 5,564 2.82 14,808 3.49U.S. 121,065 2.07 123,389 2.50
Total 395,171 1.78 462,105 1.99
25

N0\
TABLE 9: MALAYSIA IMPORTS OF MANDARINS, 1988 - 1994
Y E A R1988 1989 1990 1991 1992 1993 1994(JAN - NOV)
SOURCE QUANTI VAL QUANTI VALU QUANTIT VALU QUANTI VALLJ QLJANTIT VALU QUANTIT VALUE QLJANTIT VALUE .TrON}$7io (iON)$7'FON (TON) $(roN (TON) ${fON (TON}$TfON (ION) $7iON (rON) $fl'ON
CHINA 7431 650 8884 6P1 9630 682 10124 648 13108 616 21464 459 NA NATAIWAN 988 733 910 765 955 650 530 715 604 635 498 490 NA NAHONGKON 1 759 35 894 14 1670 155 791 264 057 718 441 NA NAPAKlSTAN 70 589 73 662 81 574 422 554 363 606 02 569 NA NAAUSTRAUA 64 728 50 824 54 739 55 734 100 694 323 532 NA NASWITZERLA 1 572 101 494 108 700 5 420 NA NAU.S.A 29 446 5 464 27 503 6 500 35 479 6 461 NA NATHAILAND 83 334 10 346 3 324 3 191 8 657 NA NAOTHERS 2 565 59 631 10 1294 55 875 46 794 69 539 NA NA[TOTAL 8668 656 10027 698 1cfo74 678 11455 651 14522 621 23173 461 NA NA

'FIGUR~ 5-A
MALAYSIA TOTAL IMPORTS OF MANDARINSBY QUANTITY & VALUE, 1988 - 1993
:000 .:.......::.:.:.:.::::.::.::.....:..•::: •• ::••• :::•..::':':.:':':::?f.:::.:::::: ~ 0,000,000
~ 1SOOO ••••••••••••••••••••••••••••••••.•••.•••.•••••.•••••••. .•.••••••••.••••.•.••.•••••. •••••.••.. •••••.••••••••••••••• $S,OOO,OOO
~ WZ 16000 $6,000,000 :3~ ~o 14000 ......•....................~ .
Z$1,000,000
12000 ..........•.•....................................................................................................
$6,000,00010000 . .
199319921991BOOO'-'----,----..-----,-----,------r---~--l..$5.000,OOO
1SSS 1SS9 1990
YEAR
r---- QUANTITY (fON) -+-- VALUE (US$) ~
FIGURE 5-8
MANDARINS MARKET SHARE BY EXPORTINGCOUNTRY, MALAYSIA 1993
27

The results of the field study conducted with importers/wholesalers and managers ofsupermarkets show that there is a 33 percent spread between wholesale and retail prices inmandarins trading. The price spread bet\\'een import and wholesale is about 22 percent. Thequality desired is the fiml, juicy and easy peeling type of mandarins.
Grapefruits
Grapefruits is new introduction to Southeast Asia. In general, the majority of the populationofMalaysia is not accustom to grapefruits. It is generally purchased by very small andselected segment of the population and by hotels and restaurants for foreign visitors. The typeofgrapefruits desired by consumers in this Subregion is the Ruby and thin skin grapefruits,Malaysia imported 223 tons ofgrapefruits in 1994 at an average CIF price of $ 639 per ton.The quantity ofgrapefruits imported in 1994 was 46 percent more than in 1988 and the CIFprice was 16 percent higher (Table 10 and Figure 6-A). The United States accounts for 55percent ofthe grapefruit import to Malaysia at a eIF price 15 percent higher than the average.Australia accounts for about 27 percent of the grapefruits imports to Malaysia.
Lemons
Malaysia has importe~ an average of329 tons of lemons per year during the 1988-1994 periodat an average CIF price of $660 per ton (Table 11 and Figure 7-A). Australia and the UnitedStates are the major suppliers oflemons to 11alaysia accounting for 53-72 percent of the totalannual imports (Figure 7-B). Lemons import by Malaysia have declined significantly between1988 and 1992. However, lemons import increased significantly in 1993 and 1994. In 1993Malaysia imported 418 tons of lemons at an average CIF price of $418 per ton. In 1994lemon imports increased to 491 tons at an average eIF price of $544 per ton.
Grapes
In addition to fresh oranges, table grapes is the other major fruit imported by Malaysia. Theimports of table grapes have expanded rapidly during the 1988 - 1994 period at an averageannual rate ofover 25 percent (Table 12 and Figure 8-A). The imports of table grapesincreased from 3513 ton in 1988 to 9707 tons in 1994. Average CIF price per ton hasdeclined from $ 1521 per ton in 1988 to $ 992 per ton in 1994, or a decline of34 percent.The United States is the major supplier of table grapes to Malaysia followed by Australia andChile (Figure 8-B). The United States share of the Malaysian imported table grapes markethas been increasing since 1988 reaching 68 percent in 1993 and 60 percent in 1994. TheUnited States table grapes also receives the highest CIF price in the Malaysian market. Theimports of table grapes from the United States increased from 1800 tons in 1988 to 5788 tonin 1994, or an increase of221 percent. The CIF price of table grapes from the United Statesdeclined form $ 1610 per ton in 1988 to $ 1031 per ton in 1994, or a decrease of 56 percent.In general, increase quantity ofimported of table grapes was influenced by a significantreduction in price.
28

'"\0
TABLE 10: MAlAYSIA IMPORTS OF GRAPEFRUITS,1000 -1994
y E A R1006 1909 1990 1991 1992 1903 1994 (JAN - NOV)
SOURCE QUANTIT VALU QUANTIT VALU QUANTliY VALUE QUANTIT VALU QUANTIT VALU QUANTIT VALUE QUANTIT VALUE=(fON}$7f6N {TON) $rrON (TON) $7iON TrONr:rrroN {TON}:lfITON (rONr-f(i"oN-(rON} :$rtOW=
U.S.A 50 591 44 766 . 46 U56 22 631 26 824 77 G14 122 130.AUSTRAUA 52 557 36 590 20 514 16 814 20 571 57 509 GO 504
ITHAlLAND 12 239 3 399 44- 228 0 0 11 242 5 . 217 16 273INDONESIA 0 0 0 0 0 0 0 0 40 202 3' 231 2 229CYPRUS 4 499 D 447 D 450 0 0 0 0 0.42 547 0.14 ' 611CHINA 0 0 0 0 1 342 3 496 2 225 0 395 2 461PORTUGAL 0.30 612 1 002 6 566 0 0 0 0 3 650 1 655OTHERS 1 623 1 1075 2 634 0 0 2 972 1 470 7 -127
!fOTAl 120 539 93 664 136 530 41 694 100 455 154 S'/3 Z23 tkl9
r

$90,000
rL
FIGURE 6-A
MALAYSIA TOTAL IMPORTS OF GRAPEFRUITSBY QUANTITY & VALUE, 1988·1993
'6 I I " j I j
I 1 I I I $80,000140 ·········,.···················T····················,··· 1"" 1" "f .
I I i I I I $70,000, .••••••...•.•••••••...••.•..t j 1 -1 .
~ 1'/ I I I I $60,000 ~~ 100 .••••.•..•.••••...••..••. ..•.1" ················T······ "1" , .. ···············f..······ -J
5 ., ·········1····_·············-[-···············1········ ····,·· ··vi···············j-······· ::: ~~ ·········[··················1···················"/·····........... ;71 ··········T..······_······r······· ::::
'9S9 15'90 '991 1992 1003
YEAR
[-R- QUANTITY (TON) -+- VALUE (US$) ~
FIGURE 6-8
GRAPEFRUITS MARKET SHARE BY EXPORTINGCOUNTRY, MALAYSIA 1993
AUSTRALIA (37.2%)
U.SA (!50.1%)
30

TABLE 11: MAlAYSIA IMPORTS OF LEMONS, 1908 - 1994
",
f -
~.....
y E A R1988 1900 1990 1991 1992 1993 1994 (JAN - NOV)
SOURCE QUANTI VAL QUANTI VALU QUANTIT VALU QUANTI VALU QUANTIT VALU QUANTIT VALUE QUANTIT VALUErrON)-srro (rON) $TrON rrON"}${ioN (TON) $1iON \iO-N)${ITfN (TCfN) $(r5N (iaN) :&"{fofr
AUSTRALIA 179 626 175 609 64 631 U6 792 103 713 159 620 1~D 62U-U.S.A 145 669 90 763 21 844 50 819 45 728 112 G48 100 650PORTUGAL 3 669 4 740 5 663 25 688 38 739 65 683 58 752NEw-LELAND 26 752 38 793 14 677 12 698 30 675 23 692 5 194CYPRUS 19 480 49 565 9 613 15 709 7 730 20 586 28 6~
THAILAND 66 240 6 290 3 221 0 0 14 247 2 267 8 3~m
INDONESIA 2 57 0 0 0 0 0 0 0 0 6 290 70 104SOUTHAFRlC 0 0 0 0 0 0 0 0 0 0 0 0 4D 400SPAIN 0 791 3 550 0 687 14 793 0 0 27 645 1 1000OTHERS 9 621 6 749 3 "112 4 750 6 821 5 787 6 5JG
TOTAL 450 581 380 660 118 667 205 774 243 692 418 637 491 544

FIGURE 7-A
MALAYSIA TOTAL IMPORTS OF LEMONSBY QUANTITY &VALUE, 1988 - 1993
,:;;o-r--=-i===:;===::;:==:::;::===;:===::;:=~$3Xl.OOJl ! i ! ! !Ii! ! I ~
400 ....•...+j.·.;·.;·~::::::·_·~·~~··················t·····-··········"I"· ··················!··············~?i .. ······ $2;;o.O~
~ 'SO ········,············1\·······1··············1········I·~··'·"".000
!Z 300 ········T··················11····\········I···················I·······:~~~]! /.... 3~ 250 11 •••••••••••••••••••1 \ 11' ········;;1~::::············ ; "1""....... $150.~ ~
\\ 1'. I :
'00 ······r··················,···········'\C;f"·/·········· , ,........ $' 00,000
:: , J;..... ,················,,············r····· $50,000
19813 1969 1990 1e91 1ee2 1993
YEAR
r-- QUANTITY (TON) --+ •. VALUE (U8$) ~
FIGURE 7-8
LEMONS MARKET SHARE BY EXPORTINGCOUNTRY, MALYSIA 1993
OTHERS (3.0%)
SPAIN (S.4%hCYPRUS (4.1%) ~g~~
NEWZElAND (5.5%);L~~>S<:~
PCR11JG.AL (15.5%)
32
AUSTRAUA (38.0%)

TAOLE 12: MALAYSIA IMPORTS OF GRAPES, 1980 - 1994
i- r .
'""'""
y E A R1908 1009 1990 . 1991 1992 1993 1094 (JAN - NOV)
SOURCE QUANTIT VALUE QUANTIT VALUE QUANTITY VALUE QUANTIT VALU QUANTIT VALU QUANTIT VALUE QUANTIT VALUECetC!N) !;YtO~ I=<fON}$7tON rrON)~iToN (iON) $/TOt\I (fON) ~VION (TON~$iT6N=(fON) $iToN
U.S.A IDOO 1010 2129 1500 2775 1483 3428 1519 2152 2313 5591 1609 57U8 1031AUSTRALIA 1440 1564 1043 1610 1067 1342 1642 1260 1806 1256 1519 007 1940 919CHILE 50 1209 92 1105 142 1754 406 1291 454 1630 090 1103 1020 9"/9THAILAND 181 401 969 408 542 457 42 309 29 460 155 501 100 420CHINA 5 1154 1 997 4 1109 5 864 11 942 11 1001 117 1015NEWZELAND 5 1035 31 1091 6 '589 0.28 1050 62 296 1 764 6 090SWITZERLAN ERR ERR 16 1345 12 1449 13 1500 26 1303 13 2363PORTUGAL 5 1128 2 1467 5 1152 3 899 7 628 14 1173 20 1180OTHERS 2 1634 10 1369 21 1107 12 1118 89 1875 14 921 105 751[OIAL II 3513 1521 4281 1309 4578 1333 5550 1415 4703 1212 8220 10·1"6 9i(U 992

FIGURE 8-A
MALAYSIA TOTAL IMPORTS OF TABLE GRAPESBY QUANTITY & VALUE, 1988· 1993
8500. . I . : ,$~,O:>O,iJ')o
8000 11' 1[ .. ···········:·····~··..···,,··········I·················;t········ $8,500,000
I, I i j /:!7500 ·········/··················T··················r······ ,'( [ //.1"....... $8,000,000
7000 ·········j···················,···················l··············/1\················[,···,······1····1'··,····· $7,500,~~ 6500 ·········j···················r··················f········!...···r\~ ..··········Ir-·· f···· ..Jr.... ·· ~~ 6000 ·········j""················r················T..·../········r····\········· / ,......... $7,000,O:X) ~>
a 5500······1··················17'···· 1 .. '\"1/ 1.... $6,500,000
5000 ········i··················· ·········~~~·~·f ..···· ·········r········· ·'·~·i~r··············l········· $8,000,0004500 ..•..............•.•...........:.;,...... .. ··················t··················*·········..······t········
:: ·•.."~·~····!·················f················I···················1··············\······· :::::1?8S 1S8S 1990 1991 1992 1993
YEAR
r--- QUANTITY (fON) --+-, VALUE (US$) ~
FIGURE 8-8
TABLE GRAPES MARKET SHARE BY EXPORTINGCOUNTRY, MALAYSIA 1993
THAILAND (1.9%)
CHILE (10.9%) I...,..."o---7"'iXl
SWITZERlAND (0,3%)___
OTHERS (0.5%).SA (67.9%)
34

Malaysia imports several different varieties oftable grapes. Import statistics by varieties arenot available. However, information obtained from importersl\vholesalers indicates that RedGlobe, Thompson Seedless, Red Flame and Superior are the major Table grapes varietiesimported by Malaysia. Red Globe is the top imported variety and receive the highest price atall stages of the market channels. The results of the field survey and interviews conductedwith importers I \\'holesalers and purchasing managers of supermarkets chains during MarchApril, 1995 in Kuala Lumpur and vicinities show that the importer price ranges behveen$1,800 to $2,300 per metric ton depending on the season and the quality ofgrapes. Theimporter-\vholesaler price spread is generally between 22-24 percent and the wholesale-retailprice spread is between 40-55 percent. The qualities of Red Globe preferred by consumers aredark red, large, crunchy, and compact cluster s\veet grapes. Thompson Seedless is second toRed Globe in consumers preference and quantity imported. It is generally 5-7 percent less inprice than the Red Globe. The qualities of Thompson Seedless preferred by consumers arelarge, firm texture, sweet and compact duster grapes. The Red Flame and Superior varietiesare imported in small quantities and generally at times when Red Globe and ThompsonSeedless are not available or hard to obtain. The prices of Red Flame and Thompson Seedlessare about the same as Thompson Seedless. In addition to the above four varieties oftablegrapes, !\1alaysia also import small quantity ofBlack Exotic and Rubby varieties.
Consumer demand fot high quality grapes is projected to expand at an annual growth rate of10-15 percent. Grapes is preferred by consumers in Southeast Asia and the imports of thistype offmit will continue to increase in the future.
l\Ielon
:Malaysia imports small quantities of Cantaloupe primarily from Australia by Air. The importofCantaloupe by Malaysia increased from 69 tons in 1993 to about 91 tons in 1994, or anincrease of32 percent (Table 13 and Figure 9-A). The high retail price Cantaloupe, rangingbehveen $3-$4.8 per Kg., is seen by the trade is the major obstacle to sale. In addition,Malaysia produce some varieties ofmelon and import a honeydew variety from Thailand.Australia controls 97 percent of the market (Figure 9-B).
35

TABLE 13: MALAYSIA IMPORTS OF MELONS (CANTELOPE), 1988 - 1994
I -'
y E A R1988 1989 1990 1991 1992 1993 1994
SOURCE QUANTIT VALUE QUANTIT VALUE QUANTIT VALUE QUANTIT VALUE QUANTIT VALUE QUANTIT VALUE QUANTIT VAl\.JETFON"")$7l'ON (TON) f,/iON (TON) ${fON (TON)~7ioN (TON) $/iON 1TClN,--:fVfoN (mN)~rf()N
AUStRALiA 60 913 44 8B9 51.70 873 10.21 1149 25 1011 86 776 UU 8GUU.S.A 2 987 1 744 8.00 541 0.44 1062 1 527 a 85-' 0 1142PAKISTAN 7 805 4 762 0.11 562 0.00 0 0 a a 0 a 0JAPAN 1 15034 1 11187 0.80 6872 0.10 4210 a a a 0 0 afRANCE a 3454 . a 5880 0.90 565 0.00 a a a a a a aAUSTRIA a a a a 0.32 736 0.00 a a a a 0 a aNEWZELANO a a 0.30 611 0.00 a 0.00 0 0 0 0 0 a aHONGKONG a 0 0 a 0.07 3593 0.00 a 0 0 0 a 0 aOTHERS 0.05 4359 a a 0.34 723 0.00 a 1 2115 3 1193 2 3107rrOTAL 69 1030 50 1061 62 905 11 1174 27 1034 89 788 90 905
\..N~

FIGURE 9-A
MALAYSIA TOTAL IMPORTS OF MELONSBY QUANTITY &VALUE, 1988·1993
:····k··········.1···········j··········!···········f:·.. ....J... ::,:70 ....•.. t<'<;<~J··········r···· .. I···.. ···+·········II······· $$O,ro,
~Z- ' ····I·..·....~·····,·,·,·~··· ..···.. ···J·..·· .. 1··/·l······· $$0,007 ~50 _................... ···················f··\· r·····.;1······················ ....J
~ ~a
30 .•....... ]"".•...•.•.••...••.•......................•.•..•.••... \. : ~;, .•..•....................••...
20 r..· · ·..· \l7/·:.. j ·..·..·..· ·~."1 $10,000
1965 1989 1990 1991 1992 1993
YEAR
[-- QUANTITY (TON) ••+., VALUE (US$) ~
FIGURE 9-8
MELONS MARKET SHARE BY EXPORTINGCOUNTRY, MALAYSIA 1993
37

Apples
In addition to citrus products and table grapes, for which Jordan has export potential,r\'falaysia also imports a large quantity of high quality apples from 14 foreign countries. Appleis the single major fruit imported by the three countries in this part of Southeast Asia. Appleimports by :Malaysia haye been grown at over 10 percent per year for the last few years. RedDelicious and Yellow Delicious are the two most imported varieties. During the first 10months of 1994, :Malaysia imported 44,793 tons of apples. This was 11 percent higher than itsimport in 1993. An estimated 43 percent ofMalaysia's apple imports are from the UnitedStates, 23 percent from Australia, and 16 percent from New Zealand. The remaining 18percent is from 11 different countries in the world (Table 14).
As quantity of imported apples increased, CIF price decreased. Between 1993 and 1994,average CIF price ofimported apple declined from $609 per ton to $581 per ton. TIus reflectsa decrease of 5 percent in price associated with 11 percent increase in quantity imported. TheUnited States share of the market increased from 33 percent in 1993 to 43 percent in 1994.The increase in the United States share of the apple market was at the expense ofAustralia.The CIF price ofapples imported from the United States declined from $678 per ton in 1993to $602 per ton in 1994, or a decrease of over 11 percent. Australia's share of the MalaysianappIes market declined by about 11 percent between 1993 and 1994 and the CIF price ofAustralian apples decteased by over 1 percent. New Zealand share of the market increased byabout 14 percent which was associated with a 5 percent decrease in its CIF price per ton.
Analysis of consumers preference in 1\falaysia indicates growing demand for apple.Improvement in the quality ofapple, a well-organized promotional campaign by the\Vaslungton State Apple Commission and the Australian Horticultural Board will increaseconsumers demand for imported apples.
Asparagus
Malaysians are gradually developing a taste for Asparagus. The imports of Asparagus byMalaysia have increased significantly during the 1988-1994 period (Table 15 and FigurelO-A). Only 19 tons ofasparagus 'were imported in 1988 at an average CIF price of$1430.In 1994, however, Malaysia imported 115 tons ofasparagus from several countries at anaverage CIF price of$587. Thailand accounts for 53 percent of the imported asparagus in1994. The Thai asparagus is generally low quality and enters Malaysia at less than 3 percentduty. It has a relatively low CIF price of $348 per ton. China entered the Malaysia asparagusmarket at a relatively large volume for the first time in 1994. Cluna accounted for over 18percent of the imported Malaysian asparagus in 1994 at a low price of $436 per ton. Australiaexports of asparagus to Malaysia has been increasing gradually since 1988. It increased to 33tons in 1993 and declined to 21.5 tons in 1994 (Figure la-B). The CIF price ofAustralianasparagus declined from $2355 per ton in 1988 to $790 per ton in 1994. The United Statesshare of the Malaysian asparagus market reached 5.7 percent in 1994 at ClF price of$1977per ton.
38

Table 14: Apple I.rnports by Malaysia, 1993-199'"
YEAR
1993 1994
Source Quantity ClFVal Quantity ClF(Ton) (S/ton) (Ton) (S/ton)
Australia 11394 548 10179 5..H
Canada 128 603 172 635
Chile 2672 551 3144 552
China 2653 413 2166 376
France 3579 594 2186 572
Japan 22 1545 14 2321
Korea 289 865 129 820
New Zealand 6106 680 6937 646
Portugal 54 523 18 537
USA 13248 678 19385 602
Others 74 580 ..f8I 525
Total 40219 609 44793 581
39

.e:o
TABLE 15: MALAYSIA IMPORTS OF ASPARAGOS, 1988 -1994
Y E A R1908 1989 1990 1991 1992 1993 1994 (JAN - NOV)
SOURCE QUANTITY VALU QUANTITY VALUE QUANTITY VALUE QUANTITY VALU QUANTITY VALUE QUANTITY VALUE QUANTIT VALUE(ION) S/ION {flThl}l;TroN (TON~nON (FON) $TJl:lN (TON) $/iON (l'ON) $(lON (TON} :{;7r~
-fHAlLAND 12.4 1402 12.1 459- 11.3 245 3.5 16T1 6.2 1221 78.9 322 61.1 348AUSTRAUA 1.7 2355 4.0 1582 17.6 1147 19.4 1077 16.7 1614 33.8 933 21.5 780CHINA 0.1 1336 0.2 082 0.8 382 21.2 430U.S.A 0.1 1309 1.1 2702 0.7 1220 0.3 3885 5.4 3726 2.5 1072 6.6 1977MAlAYSIA 3.0 1065 1.5 1022 0.8 1516 0.1 1472 0.7 1034 4.6 999 2.3 8B3NEWZELAND 0.2 1639 1.3 2632 0.2 0511 2.4 2651 4.3 1119 1.1 762TftJWAN 1.3 1255 0.2 710 1.1 927 0.4 878 0.1 3083 0.9 674 0.1 059SINGAPORE 0.2 • 1659 0.02 4256 1.2 814 0.6 3687 0.3 9535 0.02 1412 0.7 . 1539OTHERS 0.0 3690 0.03 10013 0.6 1555 0.1 .**** 0.2 5321 0.6 6278 0.5 6314[TOTAL I 19 1430 19 899 35 904 25 1339 32 2063 126 581 115 587

FIGURE 10-A
MALAYSIA TOTAL IMPORTS OF ASPARAGOSBY QUANTITY & VALUE, 1988 - 1993
19931992199119901989
140 I I I, I i $SO,OC¢
, >0 •.••••••.j ····················1··················\····················1········· j......... $1~':>O
?: '00 ·······l·················· ···············/·················1············ .j........... ···1·· ~.~~ eo ········r················ ················,··············r·········r········r····· $50.':>0 3:§ 60 ·········I···················· ····················1··· ·····..········1····.. ..............•......... $40,000 ~r'1t , I I....., ..L----:.........!
4 p' ,. ···················1········· $30,m
20 .••.•... •...•.•..••.•... ····················l·····..·············l·············........ $20,000
o I I $10,000
YEARS
r--- QUANTITY (TON) --+- VALUE CUSS) ~
FIGURE 10-8
ASPARAGOS MARKET SHARE BY EXPORTINGCOUNTRY, MALAYSIA 1993
AUSTRALIA (28.7%)
. THAIl.A."IJD (62.5%)
41

" --
Broccoli
Broccoli is increasingly becoming a vegetable item desired in the diet of the upper incomehealth conscious segment of the Southeast Asian population. Malaysia imports fresh broccoliprimarily from Australia and the United States. Small quantities also imported from six othercountries, including European countries. The imports of broccoli increased from 3652 tons in1988 to about 8764 tons in 1994, or an increase of 140 percent (Table 16 and Figure II-A).The CIF prices of imported broccoli have also increased during this period. The ClF price forbroccoli imported from Australia increased by 12 percent, from the United States by over 39percent, and from other countries by 147 percent. In 1994, the ClF price for Australianbroccoli was $1053 per ton, for United States broccoli was $1202, and for other countrieswas $2267 per ton. Australia controls over 87 percent of the market (Figure II-B). Analysisofweekly quantity sold by supem1arkets indicates strong demand for broccoli by the upperand the upper-middle income segments of the population in Kuala Lumpur. Fresh producemanagers in most supermarkets predict continuous strong demand for broccoli in the future.
Cauliflower
Malaysia produces cauliflower and imports cauliflower from other Southeast Asian Countries.Major suppliers ofcauliflower are Taiwan, Thailand, China and Indonesia (Table 16) In 1995,Malaysia imported an estimated 2755 tons ofcauliflower. Over 85 percent of the cauliflowerimported by Malaysia was from Taiwan at an average ClF price of $604 per ton. As itsdomestic production increased, Malaysia reduced its import ofcauliflower. In 1994, Malaysiaimported only 778 tons ofcauliflower, primarily from Taiwan, Thailand and China. The eIFprice of the cauliflower imported from Taiwan was $407 per ton, from China was $400 perton, and from Thailand was $219 per ton. Both Taiwan and China are not members oftheASEAN countries and thus their products are subject to a higher duty than products importedfrom Thailand. In addition, the quality ofcauliflower imported from Taiwan and China ishigher than the cauliflower imported from Thailand.
Carrots
Carrots are a major vegetable product imported by ~.falaysia. Carrot imports have beenincreasing at an average annual rate of 11 percent during the 1988-1994 period. Carrotimports increased from 10,800 ton in 1988 to 17,350 ton in 1994. Carrot imports by Malaysiapeaked in 1993 to 19,777 ton (Table 17 and Figure 12-A). Australia is the major supplier ofcarrots to Malaysia accounting for about 93 percent of the market (Figure 12-B). AverageClF price of imported carrots increased from $483 per ton in 1988 to $648 per ton in 1994, oran increase ofover 34 percent. Australian carrots receive the highest price in the Malaysianmarket. In 1994, the eIF price for Australian carrots was $668 per ton.
The quality ofcarrots demanded by consumers is rich orange color, smooth surface, about 22.5 centimeters in diameter, and about 15 centimeters in length. Carrots are shipped fromAustralia by sea freight in 20 kg boxes.
42

TAOLE 16: MALAYSIA IMPORTS OF CAULIFLOWER & 8ROCCOU, 1988 -1994
, r
I..s:..~
Y E A R1988 1989 1990 1991 1992 1993 1994 (JAN - NOV)
SOURCE QUANTllY VALUE QUANTllY VALUE QUANTITY VALUE QUANTllY VALUE QUANTllY VALUE QUANTllY VALUE QUANTIT VALUEr- 1fITN} $7TON (TON) $lt'ON {IO~:fiiioN (ION) $/TON rrON)-ilf{iON (T()N) $tfO'N [l'ON} ~;rrof~r
AUSTRALIA 3570 942 4081 1110 4060 1115 4475 11048 65B1 995 6931 B90 O©2 105JTAIWAN 2~ 604 1813 459 1871 466 1519 473 1122 444 005 395 347 407THAILAND 177 163 561 190 328 205 108 234 65 231 379 214 397 219U.S.A 66 002 111 1109 276 1173 235 1433 126 1175 55 1308 02 1202CHINA 43 199 35 512 44 362 153 638 50 494 24 309 34 400INDONESIA 167 108 23 221 22 186 6 716 3 261 0.1 252 1 1170OTHERS 16 915 48 596 32 679 36 490 6 1537 35 1812 50 2267TOTAL 6377 769 6672 847 6632 879 6532 970 7954 911 10226 830 9542 . 1000-

FIGURE ll-A
MALAYSIA TOTAL IMPORTS OF BROCCOLIBY QUANTITY & VALUE, 1988 - 1993
10500 I I I ! I I $S.5C?C«l
1 ·········1··················1···················1'··················1"··················1············ ,......... f;s,ooo,ooo~SOO .••.••••.1••••••••••••••••.••.•••••••••••.•••••. 1.•••••••••..•••••••1" , ,. .
I ! I I J I $7,500.000i· 19000 ········T··················r··················t·······.............................. f······· j" •••••••.
~ _ I I I I I I $7,000.000 ill~ 8;>00 ·········[·················T················T················T···..··········T·· ·············T······· $6,500,000 3:§ 8000 ···························]···················1"7- :;:o 7500 ................•.•.•.....~ l~ $6,000.000
7000 ········t··········· ·····f················f··_·············,····· ············I················-r······ $',OlO,OOO
:' 1·····r·············r············I··········r·········'r" ::':':fges 19S9 1990 1991 1992 1993 ••
YEAR
[---- QUANTITY (TON) -+-VALUE (US$) ~
FIGURE 11-8
BROCCOLI MARKET SHARE BY EXPORTINGCOUNTRY, MALAYSIA 1993
TAAVAN (7.9%)THAILAND (3.7%) ~!=l=l
OTHERS (1.1%) :;"
44·

TABLE 17: MALAYSIA CARROTS IMPORTS, 1988 - 1994
y E A R
1988 1989 1990 1991 1992 199:3 1994 (JAN - NOV)
-
SOURCE QUANT1T VALUE QUANTIT VALUE QUANTIlY VALUE QUANTllY VALU QUANTITY VALUE QUANTIT VALUE QUANTIT VALUE
(TON) $!TON (TON) ${TON (TON) $!TON (TON) $!TON (TON) ${roN (TON) ${roN (TON) $tfON
AU~TRAllA 7384 b97.9 7971 592 10490 568 12660 638 15576 569 10126 5JO 16167 6GBINDONESIA 2451 136.3 3067 136 1477 135 754 139 603 137 1109 143 751 150TAIWAN 447 413.7 500 301 463 298 183 355 126 435 61 422 114 527U.S.A 306 574.7 349 521 54 499 44 740 42 844 52 520 47 :3GJTHAILAND 78 162 247 177 307 179 21 209 1 302 137 174" 55 2:34NEWZELAN 0 0 0.1 701 0.01 7176 0 0 0 0 130 353 139 476CHINA 6 377.5 12 516 7 462 26 536 52 477 26 380 15 305MAlAYSIA 16 345.1 4 397 4 41 3 391 13 470 70 478 10 455OTHERS 23 1570 40 524 79 455 34 1193 17 1698 66 1857 51 2947TOTAL 10800 483.1 12139 455 12881 498 13725 608 16430 554 19777 516 17:350 648

FIGURE 12-A
MALAYSIA TOTAL IMPORTS OF CARROTSBY QUANTITY & VALUE, 1988 - 1993
1993196919S5
20000 I ! I I I ,$11,COO,COOI I j i f1ClOOO ····························1························· ,..................•.........
1:' J... I... 1. L. .J.. ;.I:':~t........ $10,000,000
17000 ..•.....1.. 1... 1 L. J ~~ J.. .I I I ,.... i $9,000,000
~ 1SOOO ········l..·················/·················..t······· J.;.,; ~.< j .[......... UJ
~ , 5OOO ••••••r I j-- "/f... . I.. j $e.ooo.oo> ::J>~
<5 '4000 ········,····································r····/··· 1················1··················1·········13000 11 /.......... :/F. t i t......... $1,000,00>
12000 ········r····/·r·~:~:;,..~l·················r················f-··················t········· $6,000,000
: :I-L·_···_····+v:_.. ~_·~·__····;:··_:..:..··;;_··;;~·.....+·!_f!··_···_····_···_···-r-l"_····_···_···_····_···-r-r_···_····_···_···_···+T_····_···_···_···_····+r_···--l.·····$5,000,000
1S90 1991 1992
YEAR
[---- QUANTITY (YON) --+ •. VALUE (US$) ~
FIGURE 12-8
CARROTS MARKET SHARE BY EXPORTINGCOUNTRY, MALAYSIA 1993
46

Celery
Malaysia imports a limited quantity ofcelery. Celery imports by Malaysia increased from1425 ton in 1988 to 2072 ton in 1994 (Table 18 and Figure 13-A). Australia and the UnitedStates are the two major suppliers ofcelery to Malaysia. Australia controls 50 percent of thecelery import market and the United States controls 40 percent (Figure 13-B). Tahvanaccounts for 7.5 percent of the imported celery to .l\..falaysia. The CIF price increased from$531 per ton in 1988 to $588 per ton in 1994. Australian celery receives the highest price inthe Malaysian market. In 1994, the CIF price for Australian celery was $648 per ton followedby the United States with $568 per ton.
Lettuce
Malaysia imports a limited quantity oficeberg lettuce. The import of iceberg lettuce has beenincreasing at a rapid rate in recent years. Imports of iceberg lettuce increased from 151 tons in1988 to 1408 tons in 1994, or an increase of 1106 percent (Table 19 and Figure 14-A). Thesignificant increases in lettuce imports occurred in 1993 and 1994. Australia and the UnitedStates control over 94 percent of the iceberg lettuce market (Figure 14-B). The CIF averageprice for lettuce in 19.94 was $758 per ton. Australian lettuce received the highest price of$886 per ton in 1994.'
Round Cabbage
Malaysia imports a large quantity of round cabbage. The imports ofround cabbage byMalaysia remained relatively the same during the 1988-1994 period at almost constant CIFprice per ton. In 1988 Malaysia imported 20,537 tons ofround cabbage at an average CIFprice of$164.30. In 1994, Malaysia imported 27,302 tons of round cabbage at an averageCIF price of$161.50 per ton (Table 20 and Figure IS-A). Indonesia is the largest supplier ofround cabbage to the Malaysian market accounting for about 94 percent of:rvralaysia's totalimports ofround cabbage (Figure IS-B). Indonesia CIF price is the lowest at about $149 perton in 1994. Countries in Southeast Asia are the only exporters of round cabbage to Malaysia.
47

~
OJ
TABLE 10: MALAISIA IMPORTS OF CELERY, 1908 ·1994
Y E A R
1903 1909 1990 1991 1992 1993 1994 (JAN - NOV)SOURCE QUANTIT VALUE QUANTIT VALUE QUANTIT VALUE QUANTIT VALUE QUANTITY VALUE QUANT VALUE QUANTIT YALUE
(rON) ${fON (mN")$rrON (TON) $fION (IUN) WON {IUN) $/ION (YONf$7foN (ION) $7f'oNAUSTRAUA 656 636 507 706 625 723 403 812 490 772 1052 617 1040 640U.S.A 452 535 621 577 779 569 649 656 619 692 733 600 034 568TAIWN-J 1JO 460 10J 300 113 346 187 319 182 360 101 J15 154 31JTHAILAND 174 106 21 205 17 203 2 211 2 190CHINA O.J J44 1 410 8 J44 4 J43 1 717 5 503 J6 441MALAYSIA 7 305 2 474 0.19 550 6 ·485 0.30 1089 2 662 0.22 G07HONGKON 0.01 5038 2 909 1 900 . 4 O(h)
OTHERS 5 290 3 381 3 370 5 382 0.10 7897 4 413 1 110nTOTAL 1425 531 1339 612 1540 609 1252 653 ·1294 676 1980 582 2072 5BO

FIGURE 13-A
MALAYSIA TOTAL IMPORTS OF CELERYBY QUANTIRY &VALUE, 1988 - 1993
2 I I I I· i $1,200,000
1900 / ···················f·················· / , $1,150,000
,.00·····1············· ·········t······I···········I······ ~··I·· :::~:::~ 1700 ·········1····················1'··················.,···· "[ , ) ······r······· $1,000,000 ~Z 1600 ......•...•...•..•...•....................•......•............. ··•..1··················· :. ·········T········ -J
~ 1500 ......•..I. ..l. 1.~.. . ..1../ ..1......... $950,000 ~1400 I!... I.~.. II'.. >,"'.:;.I :;._..t .1,1...... ::
, ,,,,11:I 1r' ! I
1300 ......•...:~~>:;...... ··················T·············· T·················; ·················l..····· $800,000
1200 . I '$7500001S8a . 1989 1990 1991 . 1992 19S3 •
YEAR
r-- QUANTITY (TON) ....... VALUE (US$) ~
FIGURE 13-8
CELERY MARKET SHARE BY EXPORTINGCOUNTRY, MALAYSIA 1993
USA (37.0%)
49
AUSTRAUA (53.1 %)

TABLE 19: MAlAYSIA IMPORTS OF LETTUCE, 1900 -1994
r ~r·" _.-
I
v,c::l
y E A R1008 1909 1990 1991 1992 199J 1994 (JAN - NOV)
SOURCE QUANTI VALUE QUANTI VALUE QUANTIT VALUE QUANTI VALUE QUANTIT VALUE QUANTIT VALUE QUANTIT VALUE
~rrON)S7'iON (iON}$JiON (ToNT:f;7ioN (iON) $7i0N (Tl5N)~rrON -lTON) $(foN (iON) :tiTON]
AUSTRALIA 109 1206 ~OJ---=
942 4J U45 42 1023 197.5 221 1040 5J£J 9J1 UUGU.S.A 11 505 9 405 14 576 19.2 671 51 532 1G7 482 052 GIOTAiWAN 22 407 9 406 0 0 0.0 382 2 267 2 769 10 JJJTHAILAND 4 340 3 191 14 210 0.0 0 0 0 6 221 10 194NETHERLAND 0 0 0 0 0 5769 0.0 0 J 2190 1G 1920 11 201"1
CHINA 0 0 2 29B 12 2J1 0.5 530 0 0 17 J1J 2 . 4£JIINDONESIA 2 382 0 0 16 119 0.0 0 0 0 0 0 J 114
MALAYSIA 4 748 ;) 620 1 587 0.9 694 3 ~~2 2 1029 1 673OTHERS 0.13 2886 0.52 3491 9.05 2329 0.0 0 7.96 942 2 1227 3.33 1932
rr01FAL I 151 809 ,a '/07 10B 754 219 iT52 iS8 951 '/52 832 i40ll i5U

FIGURE 14.-A
MALAYSIA TOTAL IMPORTS OF LETIUCEBY QUANTITY $ VALUE. 1988· 1993
1991199019$91965
6~0. I I I i I $700,OXl. 1 I I
I I 'j !:700 •.••••••. , •••••• .. ••..r·....·....·......, ·....·....·r····..· ·....·/·.. ··.... ··..·)71..······· $6JO,0Cl:>
600 ·· ·1· ·····r············..··· ..r· ··········· ..·r···..·· ·..·····j··..·········,,·····/········· $5:>O,Ci:>:>
~ 500 ,.. j ! + j j .
i= I I I I I I $400,0:>:> ~Z 400 ••••• ..··f ···· ···..·· ;- / ,......... ....J
:§ I I !: I $300,Ci~ ~I ••• .o 300 _ ······..·..·..··..·T;:v•• -~...... ·· .. ··· 1 •..
2¢0 ••••••-I·:~~·············I·············_·········::/<i····················,····················I $':,000100 \.............. . \ $1 ,iXlO'-'... .... ~ !...... I
O-l.--+-__r--__+-__-il .j-I---+--1.$0
YEAR
(-'-<I- QUANTITY (TON) ••+ .. VALUE (US$) ~
FIGURE 14.-8
LETIUCE MARKET SHARE BY EXPORTINGCOUNTRY, MALAYSIA 1993
OTHERS (1.6%)
51
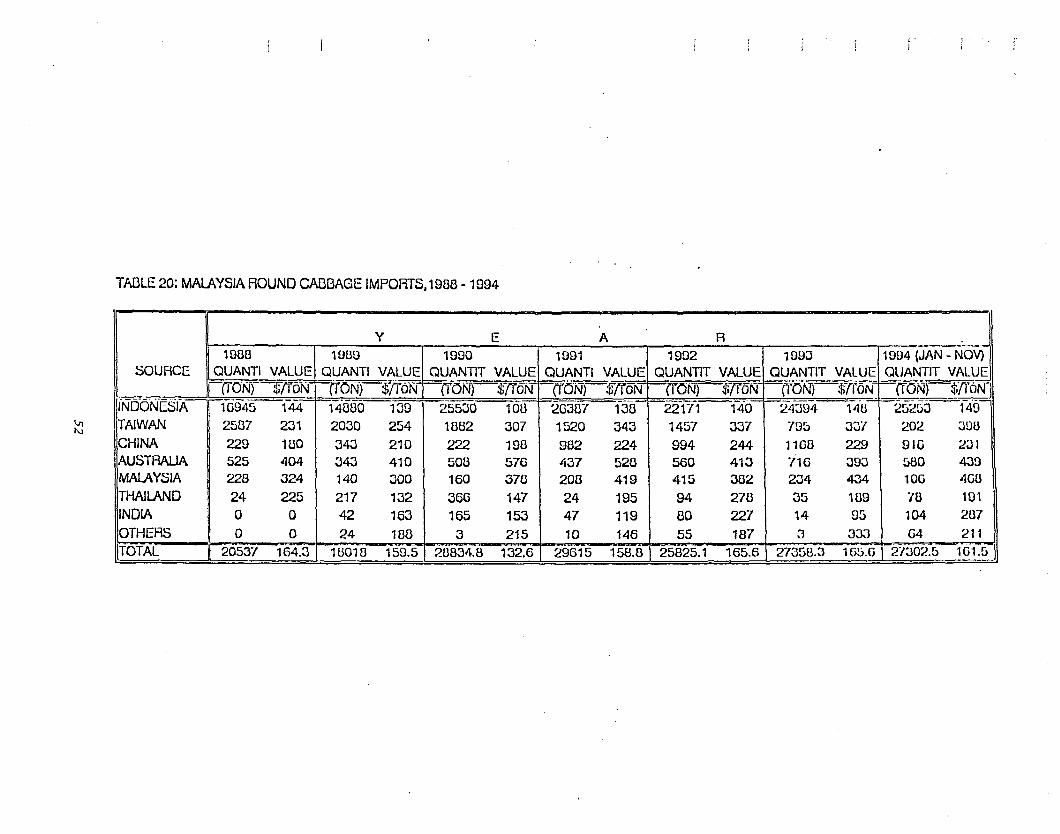
\ttI\.:l
TABLE 20: MALAYSIA ROUND CABBAGE IMPORTS.19B8 - 1994
YEA· R .~1933 1930 1990 1991 1992 199:3 1994 (JAN - NOV)
SOURCE QUANTI VALUE QUANTI VALUE QUANTIT VALUE QUANTI VALUE QUANTIT VALUE QUANT1T VALUE QLJANTIT VALUE
~"".,,--crrONf$!rON 11 ON) $/ToN· (ION) $7roN :-(rON) $JrON (TON) $iToN (rON) $7r0N.~ (fON) :ii/roN]- .- - .- . .' . .,., - - - .==
INDONESIA 10945 144 14880 139 25530 108 2G387 138 22171 140 24;)94 14B 2::J2::J3 14~
TAIWAN 25137 231 2030 254 11382 307 1520 343 1457 337 795 331 202 30BCHINA 229 180 343 210 222 198 982 224 994 244 11GB 229 9W 231AUSTRAUA 525 404 343 410 5013 570 437 520 560 413 71G 3D3 GUO 439MAlAYSIA 228 324 140 300 160 370 208 419 415 302 2:34 434 lOG 4G3T/-WlJ\ND 24 225 217 132 366 147 24 195 94 278 35 109 10 191
INDIA 0 0 42 163 165 153 47 119 00 227 14 95 104 287OTHERS 0 0 24 18B 3 215 10 146 55 187 3 33.1 64 211
TOTAL 2053-/ 164.3 13018 159.5 28834.8 132.6 29615 158.8 25825.1 165.6 27353.3 165.G 2"1302.5 lGl.5!

FIGURE 15-A
MALAYSIA TOTAL IMpORTS OF ROUND CABBAGEBY QUANTITY & VALUE, 1988 - 1993
300:)J. I I .. I i $4.SXJ,C1Y.l
, , : i~;-.... I ,J $4,SO~,O~28X1O ·········f·················T···········..··· r··········j"·:·r····· ·...~<··r·····~·>;.·r···r········ $4,40:),0:>0
~ 2= ·····..j.············r········t!··j·········r·······/····· :::::: ~~ 24000 ········l·················r 71"·················[""··············I··················r ::::::: ~o 22000 .•.•..•.......•.••••...••...........{ j. J.••••••••••••••••••1 1.. .:, j i I $3,400,000
I"..: I j
2DOOO ········f·:~'~<]··/··········r··································r·················I········ :::::18000 I I $2,800,00:'>
, S8a 1SS9 1eoo , 991 , 9&2 1993
YEAR
(-oJ- QUANTllY (fON) n+_. VALUE (US$) ~
FIGURE 15-8
ROUND CABBAGE MARKET SHARE BY EXPORTINGCOUNTRY, MALAYS!A 1993
CHl~T(.1.~~-\3.7%)
TAf'NAN (2.9%) ;,.,
53

~......
SI~GAPORE
Singapore is becoming the major distribution center for fresh fruits and vegetables for the sixASEA~ countries ofBrunei, Indonesia, Malaysia, Philippines, Singapore and Thailand. Alarge quantity ofall types of fresh produce imported by Singapore for its 0'vn populationconsumption and for re-export to other members of ASEAN countries. Singapore, generally,imports the highest quality offresh produce from many countries of the world. The import ofmajor fruits and vegetables by Singapore is discussed in the following section.
Fresh Oranges
Singapore imports a large quantity of fresh oranges from over 18 different countries in theworld. The import of fresh oranges by Singapore remained fairly stable during the 1988-1994period at about 45,000 tons per year. Singapore imports offresh oranges reached its peak of52,167 ton in 1993 (Table 21 and Figure 16-A). The United States controls about 37 percentof the imported orange market in Malaysia followed by Australia with 34 percent, SouthAfrica \\lith 15 percent, and Israel with about 8 percent (Figure 16-B). Average CIF price fororanges imported by Singapore decreased from $967 per ton in 1988 to $753 per ton in 1994,or a decrease of 28 percent. Oranges exported from the United States received the highesteIF price per ton. In 1994, average CIF prices for United States oranges was $874 per tonfollowed by China with $792 per ton, Pakistan with $720 per ton and Australia with $711 perton. Oranges imported from South Africa had a CIF price of $595 per ton in 1994 andoranges imported from Israel had a CIF price of $502 per ton.
The quality oforanges preferred in Singapore is the rich orange color, think skin, juicy, andsweet. The size preferred is 113 pieces in 20-21 kg. box. Generally, the SUNKIST-naveloranges are the preferred variety. Oranges at the retail stores are generally sold by pieces.The average retail price for high quality oranges ranges between $1,900 - $2, I00 per ton. Thewholesale-retail price spread ranges between 45-50 percent and the import-wholesale pricespread ranges between 20-25 percent.
Orange Juice
Singapore imported 8.9 million of all type of orange juice in 1993 from 19 different countriesat an average CIF price of$I.41 per liter. The United States controls 29 percent of theorange juice market in Singapore. The CIF price of orange juice imported from the UnitedStates was $2.03 per liter, the highest among other importing countries (Table 22).
l\fandarin
Singapore imports of mandarins rapidly increased during the 1988-1994 period at an averageannual rate ofover 12 percent. During this period the imports ofmandarins increased from]5, I 90 ton to 28,377 ton, or an increase ofabout 87 percent. The average CIF price declinedfrom $980 per ton in 1988 to $697 per ton in 1994, or a decrease of29 percent (Table 23 andFigure 17-A).
54

TABl.E 21: SINGAPORE ORANGE IMPORTS.1988 -1994
r~- . r
V,v,
y E A R \1966 1969 1990 1991 1992 1993 . 1994 ~
SOURSE QUANTITY VALUE QUANTITY VALUE QUANTITY VALUE QUANTITY VALUE QUANTITY VALUE QUANTITY VALUE QUANTITY VALUEio=--(TO~ (S/TON) (TON) ($iTON) (TON)' ($rro"Nf (TON) ($frON) (TON) ($rrONf
.- ......... ~-_ (TONL =J:!f0~(TON) (${fON)
usjf_., _ . t ::0==
~~ - . - . - - " . ..:so ~":"""...~--'-":21130 990 20561 1060 21392 936 5962 1220 17306 391 15009 D02 17010 074
iAU~TRAUA 0303 93~ 0231 936 11015 909 22700 975 16119 799 23045 711 10144 711S.AFRICA CS9S 974 7182 979 . 542G 9SG 7026 1111 7071 1102 7697 870 C4GO 595ISRAIl. 3278 13G1 2993 10BO 209G 996 3658 939 3447 839 1850 7u1 1204 502CHINA 2247 908 1C32 964 2111 637 2201 648 1705 753 695 740 702 '/92
rrHAI1.ANO 1459 610 1455 603 417 625 437 413 0 0 0 0 - 0 0rrAIWAN 798 1023 591 104D 529 932 244 . BOG 362 625 195 509 71 1090lARGANTINA 1640 604 500 629 0 0 0 0 0 0 0 0 0 0CYPRUS 266 759 223 777 269 621 727 957 60 005 0 0 0 0HONGKON 0 0 69 1052 144 951 115 968 341 775 293 631 590 GCCEGYPT 372 467 0 0 0 0 223 555 104 1070 521 551 279 540MOZAM61Q 0 0 0 0 0 0 0 0 1259 971 0 0 0 0PAKASTAN 102 799 276 574 59 G36 179 522 267 511 164 137 157 120S.ARA6IA 0 0 0 0 0 0 0 0 0 0 817 952 0 0
MALA'fZlA 201 560 61 615 142 106 0 0 143 G63 0 0 0 0OTHERS 162 1025 259 1039 102 1272 293 . 1373 113 1391 273 1106 147 1101~TAL..-- IC~903
. - 1-013-------0----,
967 44Q1W '{OO2 43702 954 ,iii65 5-03f7 ai9 621-67 799 45532--753J

FIGURE 16-A
SINGAPHORE TOTAL IMPORTS OF OPANGESBY QUANTIlY & VALUE, 1988 - 1994
530-: .k. I · , I I I S46f'C'O~V52fl1.~ •••••.. _/' ••••::,••::::•••! ! !><iii················,········
"+ I .l·..··········+. i
51 ..·····"1·..·············I:::··:·::.:~·······t··· ..~:~:/:·:·r·············Y:·- :~~ 1". . ,....... $4.ff'i>(lfi!.V
>- SAA ..··..·t·..···:..·····T········::..··::·;.v:·,..::········T···· r········:·,·..;:{··· ·········T··..·· $42/'VOfi!.V
~ <.~w ······T..···....·····r..····..····..r···········T··· ···· ·T··..··········l\··· ······T··..·· ~
~ ~5~~ ······r······..······!·············-r·····..····..T·..··..·· ····r·············T·'··· ····T····.. $40~pro ~a .(70(. ••••••~ L t _ _ .
:6l'M .~~~t~:: ..::::·::~:I=:==:::t~:::::::::::1::·: ..:~:::=:1t:::::::::::::.t:::.:~~: I!::~::: ::::i I I ! . I \ ..
.f-/()('t{) ••••..·~···..• •..·~·· •• ..·····~····..• ••..i·········· 1" \:!........ .
43 I I ! I ! ! + S:UPOt.1p£lt)19€3 l.Q!9 U/Otl 1991 1992 1993 J.O'9-1
YEAR
1--- QUANTllY (TON) ....+.... VAL~E (USB·) f
FIGURE 16-8
ORANGES MARKET SHARE BY EXPORTINGCOUNTRY. SINGAPORE 1994
HOSGKONG (1.3%)CHl,VA(I.7%h
S.AFRIC.4. (:u.g..2%~}~'~lllEGYPT (0.6% Jt.
56

"
Table 22: Orange Juice Imports by Singapore 1993
Quantit)· CIF Val.
Source(Lt.) (SILt.)
Australia 8"2,.1.13 1.81
Austria 108,"60 0.75
Belgium 35748 0.76
Brazil 994,962 1.80
China 273,792 1.32
Cnrus 71685 0.65
Denmark 212177 2.57
Germany J36995 3.85
. Israel 579005 1.53
Japan 61111 1.22
Korea 1815821 0.9
l\1ala~'sia 7..5217 1,47
Mozambique 419..0 0.74
Netherlands 89179 0.86
OC Africa 91687 1.11
Switzerland 48053 0.96
Taiwan 166896 1.21
Thailand 36728 0.97
US 2546379 2.03
Total 8898284]AI
57

~
TABLE 23: SINGAPORE MANDARINS IMPORTS,1988 ·1994
y E A R1988 1989 1990 1991 1992 1993 1994
SOURSE QUANTITY VALUE QUANTITY VALUE QUANTITY VALUE QUANTITY VALUE QUANTITY VALUE QUANTITY VALUE QUANTITY VALUE
_.<I:0Nt (S{T(::>N) (TON) (SITON) (r?~). . (SiTON) {TON) (SITCiN) (fON) (StrbN) ('ttiN) (str?~l {TON) (SirON]I .,- --,. 1=<-2171;{ =646-rNA 6362 930 6021 910 6320 687 9961 872 150G9 780 14849 697AIWAN 6050 1035 5398 932 4912 971 4302 925 4221 670 2920 729 143G 768
PAKASTAN 254 616 453 654 1041 623 3296 694 2864 546 1524 G30 1798 657
~ONGKONG 69 1165 120 675 200 690 624 880 1654 863 1597 629 1922 622USTRALIA 252 1630 453 1591 498 1696 746 1644 645 1412 1215 1371 1351 1570
IJAPAN 2G 1603 16 2158 7 2381 7 4062 20 2440 34 2166 22 2462
rAILAND 122 449 0 0 0 0 0 0 0 0 0 0 0 0SPAIN 16 1339 0 0 44 1393 0 0 0 0 0 0 20 1429
IS.AFRICA 0 0 0 0 0 0 0 0 0 0 0 0 56 712IOTHERS 19 940 16 670 39 977 89 936 23 647 53 505 55 671
. .2637'1 "697][~O!~L. Jt=i5~-90 980 ~ ~144i7 930 f506'1 923 16927 tllf5 24896 797 22f92 745

FIGURE 17-A
ISINGAPORE TOTAL 1r....'iPORTS OF MANDARINSBY QUANTI1Y & VALUE, 1988 - 1994
:;C'M~! 'ii + j ... I~1(1pl>(lj":""
::::.·::J:...·I::.:.J·:J./f:\.·j:Et·· ':"WMiii i./: \ i;· i $J~P.¥fl(;,:}
~ 14~"·I··I·+·V· NJ;·/ "'~ft,. ~~ Z:XIt"I{J ········[················1················1..············-j·t······· j 1/. ,....... -J
5 Z(lOW .••.••.J I 1 /~..~ / t j $16/~pl~ ~IS.W ..••..+.'~ J _I/ j :.. ! I I..... ";~P'"
I I 1/ I I I I16(1(1{} ·······t··········:,:::t·······::::::·-t· ····························T···············r·············..T······· $I4jX1{)jJ(li)
1401XJ j----.", .......! I I ! I S13/"C:IOf'!"lO
19S5 1989 19.~ 1991 1992 1993 1994
YEAR
I--a- QUANTllY (TON) ....+.... VALUE (U8&)
FIGURE 17-8
MANDARINS MARKET SHARE BY EXPORTING ICOUNTRY, SINGAPORE 1994 l
59

China is the principle supplier ofmandarins to the Singapore market. It controls about 76percent of the mandarins market in Singapore. Taiwan, Pakistan, Hong Kong, and Australiasupplied 23 percent of the mandarin imp~rted by Singapore. About one percent v\,'as importedfrom several other countries (Figure 16-B). Mandarins from Japan had a CIF price of $2,462per ton in 1994. Australian mandarins had a CIF price of $1,5 70 per ton. Mandarins fromChina had a CIF price of $646 per ton. The retail-wholesale and wholesale-import pricespreads for mandarins are the same as those for oranges. The quality ofmandarins preferredby Singapore is the same as that in Malaysia.
Grapefruit
Singapore imports a limited quantity ofgrapefruit. In 1988, Singapore imported 955 tons ofgrapefruit. In 1994, it imported 2,351 tons. Average CIF prices for grapefruit declined from$1040 per ton in 1988 to $722 per ton in 1994, or a decrease ofover 30 percent (Table 24and Figure 18-A). The United States supplied 30 percent of the grapefruit imported bySingapore in 1994 at a CIF price of $820 per ton. Israel, South Afiica, Malaysia, Australiaand Thailand supplied 69 percent. Less than one percent was supplied by several othercountries (Figure 18-B).The retail-wholesale and the wholesale-import price spreads is similar to oranges. The qualityofgrapefruit desired by consumers in Singapore is the Ruby-thin skin variety.
Lemons
Singapore imported 5200 tons oflemons in 1994. This was an increase of27.5 percent overthe 1988 imported quantity. Average CIF price of lemons decreased from $628 per ton in1988 to $511 per ton in 1994 (Table 25 and Figure 19-A). Malaysia is the major supplier oflemons to the Singapore market accounting for about 51 percent of total Singapore imports.The remaining 49 percent was imported from several countries (Figure 19-B). The Malaysianlemon is generally oflower quality and has the lowest CIF prices. The CIF price oftheimported Malaysian lemon was $261 per ton in 1994. Lemons imported from Thailandgenerally had the highest CIF prices during the last 6 years. In 1994, lemons imported fromThailand had a CIF price of$1247 per ton, from the United States $960 per ton, from Cyprus$914 per ton and from Australia $844 per ton.
Grapes
Singapore import of table grapes increased from 8122 tons at an average CIF price of $2422per ton in 1988 to 12,096 tons at average CIF price of $2,249 per ton in 1994. The imports oftable grapes by Singapore increased by about 49 percent during this period and the averageCIF price decreased by over 7 percent (Table 26 and Figure 20-A). The United States is theprinciple supplier of table grapes to Singapore. In 1994, the United States share of the tablegrape market in Singapore was over 59 percent and its grapes had the highest eIF price of$2,338 per ton. Australia controlled about 22 percent of the market at a CIF price of $2,276per ton. Chile market share of the Singapore table grapes market was over 13 percent at aCIF price of $1 ,978 per ton. About 94.4 percent of the table grapes market is controlled bythe United States, Australia and Chile (Figure 20-B).
60

TAOLE 24: SINGAPORE GRAPEFRUlT IMPORTS,19DO -1994
1 r" ---
0\....
Y E A R1980 1909 1990 1991 1992 1993 1994
SOURSE QUANTIIT VALUE QUANTITY VALUE QUANTIIT VALUE QUANTlIT VALUE QUANTIIT VALUE QUANTIIT VALUE QUANTITY VALUEr&ON) (SirON) . (fON) ($ffON) (fON) (SffON) (TON) ($ffO~) -(fON) (SffON) (TON) <PON) (fON). (srrONLI
U~A r ~19 1010 408 9G6 227 1324 490 1006 7GC 1020 617 1071 701 620
ISRAIL 101 1144 76 1089 546 903 123 973 296 112ij 15(j D50 102 (j30
S.AFRICA 109 1046 213 1012 156 1194 65 1612 130 1267 105 1003 114 uD4MALAYSIA 0 0 0 0 0 0 0 0 0 0 0 0 035 577AUSTRAUA 0 0 12 2133 20 1696 149 1039 143 603 104 1230 148 g45
IrHILAND 0 0 0 0 0 0 0 0 0 0 45 410 429 791CYPRUS 52 013 22 947 64 893 O· 0 0 0 0 0 0 0OTHERS 14 1276 17 805 3 2163 18 992 22 1326 40 1280 22 893
fl'OTAL..JC=955 1if40 10-16
-f100 {()52 {OG7 1"029 2351 722]828 1()"02 f100 845 fi55
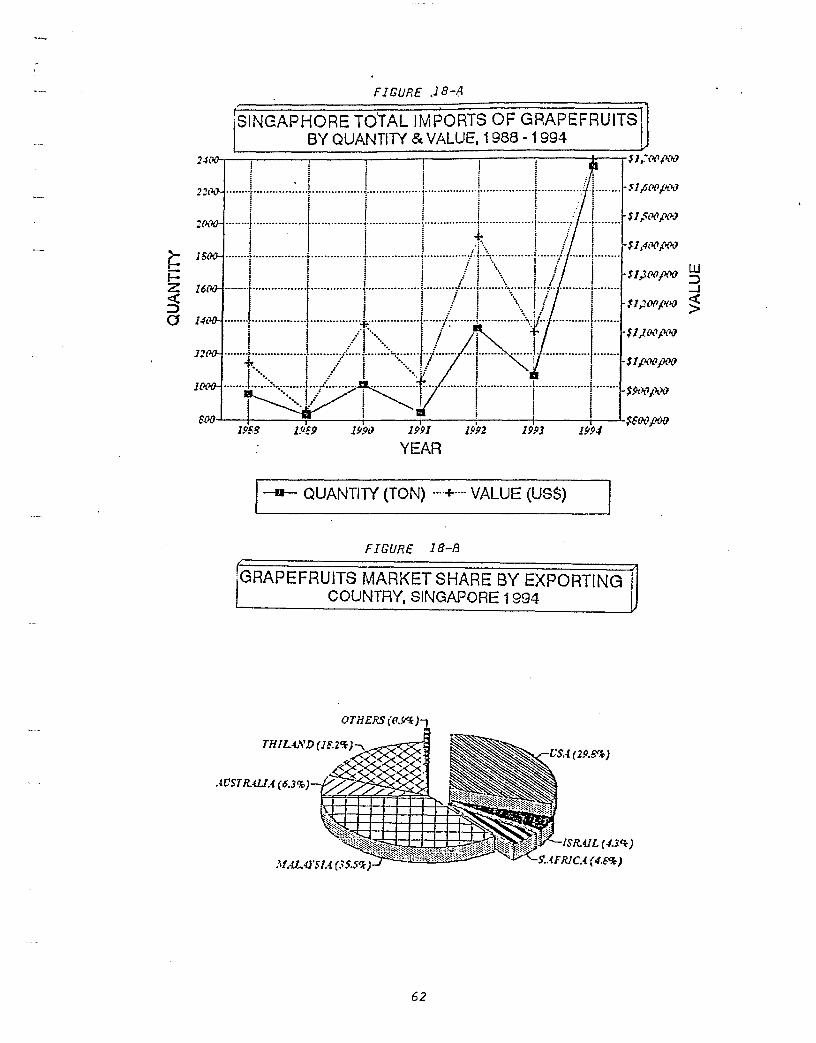
1
FIGURE .18-/1
'SINGAPHORE TOTAL IMPORTS OF GRAPEFRUITSBY QUANTITY & VALUE. 1988 - 1994
24{'~-=:;:'===:::,===:;:,==::::;:,===,~=~:;==~~:::;:J$;;;];:(I{II'<'){JI j I I I II I ! i f I 'iI . ! i i ! , ! ! tl r.hfl ( ...~·.. ·..···r··.. ·......·.... ··· .. ···r.···.··· ..··.····j·· .. ·..·...···· .. ····1···· .. · .. ··· .... ·····, .. ·· ..·· .. ··········t .. ··· .. ····· .... :. ·f···.... •.. • • "..." .... ·,.I{v
I I i j i i .' iI I i I ! i ,: I $I,$Mj»J.............;. L .: ( ( , 0' ., I ' i i j ' iI I I ! + I II I I •• \ I '$1,4t'l(lPN·· ·..··f or ·· o i···· ···· {· ..·..··· .. ······;!·1·::':.:.:.·· t / ·f· ..· .I I I I / I \\ ,/ I $l,3N1f*O ~
········[···············T···············r··············j"······/..··r····..·,·:·:,:.:···j·/· ··········1··..···· $I,2(1{1tl£J() ~........; [ '4- ! / ! \.:/.. ············i········
.....J .L /.I::>:~ ..i..l ~ .t ../. $1)Ot1fN
t···.... I ./' I ..1/ r·····~: I SlPt~po<J········I~······:,··::~::··I··/··········· I ··············l·· 1 1
1
'........ $9r.'lt1;'\'I(}
".'/ I . i Isoo I ". $tQOjXIO
If/58 UJ€9 1!19iJ 1991 J.f/92 19.QJ unYEAR
1-11- QUANTITY (TON) ...+ ... VALUE (US$)
FIGURE 18-8
'GRAPEFRUITS MARKET SHARE BY EXPORTING ICOUNTRY, SINGAPORE 1994 I
OTH£RS((I·fJ'%h
62

TA6LE 25: SINGAPORE LEMONS lMPORTS,1988 -1994
,.:
J\....
y E A R196a 1009 1990 1991 1992 1993 1994
SOURSE QUANTITY VALUE QUANTITY VALUE QUANTITY VALUE QUANTITY VALUE QUANTITY VALUE QUANTITY VALUE QUANTITY VALUE(TON) -($rrON) {TON}{"irroN) (TON) ($IiO~) (TON) ($(rON) (TON) ($;TON) {TO~_ ($rrON)
~~
MALIziA(TON) (srrON21
1944 254 1736 272 1616 253 2G95 263 2649 277 3375 311 2047 201AUSTRAUA 540 933 412 667 5G3 666 710 862 668 756 500 095 610 644S.AFRICA 384 1015 435 1017 512 1031 449 1112 561 1096 633 944 725 595ISRAJl 136 937 426 790 296 1076 526 954 745 603 671 674 325 722USA 645 1052 274 1075 161 1154 316· 1275 J45 933 580 905 4<i7 aGO[cYPRUS 288 1333 412 795 304 761 204 1030 87 883 122 D64 121;; 914~PAlN 100 917 77 904 0 0 258 1073 0 0 130 78J 0 0
~HAILAND 0 0 29 1560 42 1460 16B. 9B1 114 1457 114 1034 42 1247IrURKY 26 755 0 0 0 0 0 0 44 622 50 1000 0 0laTHERS 16 1042 14 1105 12 1687 67 1337 41 1670 65 962 51 1109((OrAL 1C=4C)'io 628 3817 6"f9 350-6 642 5387 652 6474 593 63ia 567 &200 6-f1]
-

FIGURE 19-A
iSINGAPHORE TOTAL IMPORTS OF LEMONS IBY QUANTIlY 8< VALUE, 1988 -1994 I6$'NI-T--==============::.;:.===.~~$Jp{~p..'rJ
t.. jtt,.......................:..............•...............·/···::::'·'<)7········\,·················· ::::::
, / '.......................................................J~ \ .;' \ $3,M(1f<IJ illj \:>..·· · · · ·..· ········ l ..· \........... ~
i. \, $2,5(l1.1ftlO >I \.................................................................................................................i-.......
oft! $2p(}(ljI(XJ
.......~: / _ $',1"1'0.
~I-Z $(
:5a
Js,~O(J...L-..,.-,---..-----=1II-----r----r----r-----.----k$2.z(){)ll()-)1988 l!iSfJ 1990 19!Jl 1992 19.oJ 1994
YEAR
1-101- QUANTllY (TON) ....+.... VALUE (US$)
FIGURE .19-:-8
SINGAPHORE TOTAL IMPORTS OF LEMONSBY QUANTITY & VALUEs 1988 - 1994
!>1.illU.4. ($..f.8'l-)
64

0\
""
TAOl.l; 26; SINGAPORE GRAPES IMPORTS,1966 -1994
y E A R196B 19139 1990 1991 1992 1993 1994
SOURSE QUANTITY VALUE QUANTITY VALUE QUANTITY VALUE QUANTITY VALUE QUANTITY VALUE QUANTITY VALUE QUANTITY VALUE(TONY ($fTON) (TON) (SrfON) (TON) -($fTON) (TONY ($fTON) (TON) -(SrroN) (TON) (SrrON) (TON)
_.,.~
---._~
(SfTON)USA 4261 2537 5471 2399 6216 2313 7525 2294 6022 2234 1245 2379 715lJ 2336~USTRALIA 3246 2356 2670 2390 :3000 2343 4076 2376 4440 2337 2579 2470 2649 2276CHIl.l; 207 1669 449 1240 396 2231 999 2~26 1246 2425 1105 2166 1(,13 1976BOSlWANA 306 2120 247 2157 35G 2159 314 2363 367 2376 14 2361 0 0S.AFRiCA 0 0 0 0 0 0 0 0 14 2041 . 355 2379 400 1450HONGKONG 0 0 40 1922 14 2u79 0 0 0 0 26 2275 fJ7 2950MAUSJA 0 0 0 0 15 3492 0 0 0 0 0 0 119 2066CHINA 0 0 0 0 0 0 20 1456 30 1944 19 2193 26 3066IZRAIL 0 0 25 976 0 0 50 1266 0 0 0 0 13 2015LEBANON 16 1455 32 1166 0 0 0 0 0 0 0 0 0 0OTHERS 84 1129 74 1528 99 2465 69 2663 49 2235 40 2589 42 2523
rrCi.t'.'_L :=J 8122 2422 9016 2314 1-oei(fa 2317 13053 2337 12-168 22¥)5 figo5 23(;9 1-201i6 2249--

FIGURE 20-A
!SINGAPORE TOTAL Ir~PORTS OF GRAPES IBY QUANTI1Y & VALUE, 1988 -1994 I
::: J .! l t......I···············J················I······· :::::I! I I I ""! 1 I .
I 1./ I '~'I """ $2€pMI;.WJ12M? ..· ,....·..··..· ·f •··..•·•·..··r ···;· .. ···..· ·· ·..T·· ····· ~ ~ ..
~ ! i !:' I I I i~ ! I I ,/ J I I IZ 11(1{)() , , 1'..; • ··• • • •..•..• ··r · · ·· .§ I I }/ I I I $U~frJO
1_ ······T·········,'1>/·/·········r··;····················r··················· mpcPpcP
9(1(1() ,......... • _ ..t',· i I I i I $20PMjX}cJ
s()(/t] I I $18jJ(l(JJX'O1958 1989 19.00 1991 1991 1993 1994
YEAR
[-n- QUANTI1Y (TON) --*_. VALUE (US$) ~
FIGURE 20-8
GRAPES MARKET SHARE BY EXPORTINGCOUNTRY, SINGAPORE 1994
OTHERS ((I.7lfp)
CHILE (lJJ'k)
S_-4FRlC.4 (J.4%) ·~~~illHO:"-GKOSG (O.6't,~ ~
~:::::,\~~~
c.:S•.f (59.2%)
66

The variaties of table grapes preferred by consumers in Singapore differ from those inMalaysia. The distribution oftable grapes sale in supermarkets in Singapore is: 50 percentThompson seedless, 30 percent Red Fla,me, and 20 percent Red Globe. The Singapore marketdemand the highest quality oftable grapes \vith minimum chemical residue. The quality ofgrapes demanded by the Singapore market is similar to that described for Malaysia. Theretail-wholesale price spread ranges between 35-40 percent and the wholesale-import pricespread is between 18-22 percent.
1\Jelons
Singapore imports ofmelons increased from 475 ton in 1988 to 2,666 ton in 1994. Theaverage CIF price increased from $1070 per ton in 1988 to $1155 per ton in 1994 (Table 27and Figure 21-A). Australia controls 89 percent of the Singapore melons market (Figure21-B). In 1994 the CIF price ofAustralian melons was $1206 per ton.
Apples
Apples are the major fruit commodity imported by Singapore. In 1994, Singapore importedabout 51,000 ton ofapples at an average CIF price of $1 ,091 per ton. The United States,New Zealand, and Australia control 74 percent of the apples market in Singapore. The UnitedStates market share o'fthe apples market is 37 percent, the New Zealand share is 21 percent.and the Australian share is 15 percent. In 1994, the CIF price ofapple imported from theUnited States was $1114 per ton, from New Zealand was $1,014 per ton and from Australiawas $I, I99 per ton (Table 28).
Broccoli
Singapore import of broccoli increased from 1,190 ton at CIF price of $2, 195 per ton in 1988to 3,795 ton at CIF price of $2,031 per ton in 1994. The import of broccoli increased at anaverage annual rate of 31.3 percent during the 1988-1994 period (Table 29 and Figure 22-A).Australia controls 80 percent ofthe broccoli market in Singapore (Figure 22-B). In 1994, theCIF price per ton of broccoli imported from Australia was $1944 and it was about 6 percentbelow the average CIF price for all broccoli imported by Singapore. The United Statescontrols over 13 percent ofthe broccoli market. The 1994 CIF price ofbroccoIi importedfrom the United States to Singapore was $2471 per ton and it was 22 percent higher than theaverage CIF price ofall imported broccoli. Taiwan has 2.5 percent of the broccoli market inSingapore. In 1994 the CIF price ofbroccoIi imported from Taiwan was $2505 per ton or23.3 percent above the average CIF price for all broccoli imported in that year. New Zealandcontrols about 3.7 percent of the broccoli market in Singapore. The New Zealand CIF pricein 1994 was $2305 per ton and it was 13.5 percent greater than the average CIF price ofimported broccoli. Japan exports a limited quantity of broccoli to Singapore accounting forless than 1 percent of the broccoli market. But broccoli imported from Japan had a CIF priceof $8677 per ton.
Broccoli consumption by consumers in Singapore is rapidly increasing. Demand for broccoli
67

TABLE 27: SINGAPORE MELONS IMPORTSJ1966 -1994
y E A R1968 1989 1990 1991 1992 1993 1994
SOURSE QUANTITY VALUE QUANTITY VALUE QUANTITY VALUE QUANTITY VALUE QUANTITY VALUE QUANTITY VALUE QUANTITY VALUE
AlisTRALIA(TON) (SrrON) (TON) ($trO-N) (T6N) -($rrONY (r6N) (S{tON) {TC)Ny ($tfON) (TON) -(SrtON) (TON) -(SrTON)
91 1223 1302 1130 1412 1233 156-~1234 2118 1134 2064 1219 2371 1206CHINA 304 940 672 635 275 814 384 798 416 788 283 778 222 6176AKISTAN 0 0 72 967 68 647 0 0 0 0 0 0 0 0JAPAN 0 0 5 3452 21 2834 47 735 6 5357 9 4497 9 4696SPAIN 34 1471 38 1222 0 0 0 0 0 0 0 0 0 0IRAN 39 1160 0 0 0 0 0 0 0 0 0 0 0 0USA 0 0 12 1786 0 0 0 0 0 0 0 0 0 0SRlLANKA 0 0 0 0 0 0 0 0 12 1389 0 0 0 0OTHERS 7 2296 11 2002 22 1163 30 1310 9 1786 22 2354 66 658
l!<YfAL I 475 1070 2112 {152 1Yse ff68 2\'>30--
2378 f189 2668 f155J1141 2561 1091

FIGURE 21-A
SINGAPORE TOTAL IMPORTS OF MELONSBY QUANTllY & VALUE. 1988 • 1994
;fIl:~-;-,===:;,====~,===::;,;::::==;::,===~,====:;'~T$J,.<;~~I Ii! ! ! !I I I': : I ,
I : I ! L J A·······I················t:·::::lll...·...·.·...·~·····1····~:~_F-srr'··I········ ",WI<"
......"1" r" '~~',. .1E>·y<·········!·················!···············l······· ~2,.<;{Ij1pro
I I.,·-·~" I I j I W.................. ·/"t--:·:·:·:·:·:·:·¥················I·················\· 1 1 $2ptXJjlClO 3
i I I I' I I I ~1 ;1..·..·/················I"···············r ··,·················1················· $1,5()QjlClO
1 ; I I I IS(If) •••••. iir········· ················_···············T··············T······ $1jX1OfJO(}
• '-. I I I I I S'<"I<"19S8 1959 1~.O{J 1991 19112 1993 19P4
YEAR
(--- QUANTIlY (TON) --*_. VALUE CUSS) ~
FIGURE 21-8
MELONS MARKET SHARE BY EXPORTINGCOUNTRY, SINGAPORE 1994
JAl'A.V (O.3%)
CHINA. (S.3'!c)OTHERS (2.5'!c), ~i;:"<:'~
69

Table 28:I
Apple Imports by Singapore, 1993 - 1994
YEAR
1993 1994Source
Quantity CIF Value Quantity CIF(Ton) (Sfton) (fon) (Slton)
Australia 10039 1200 7683 1199
Botswana ...20 1199 - -Canada 1210 1082 2142 928
Chile 1775 720 991 716
China 993 1289 1318 956
France 85...7 9...3 6255 908
Israel 133 901 - -Japan 158 3631 157 3980
Korea 1352 2258 578 2144
l\fala~'sia 112 1070 222 968
New Zealand 10191 1-176 10898 1014
OC Africa 973 1134 ]593 1008
US 13984 1280 19019 1114
Other 95 1046 92 1525
Total ...9982 12...... 50948 1091
70
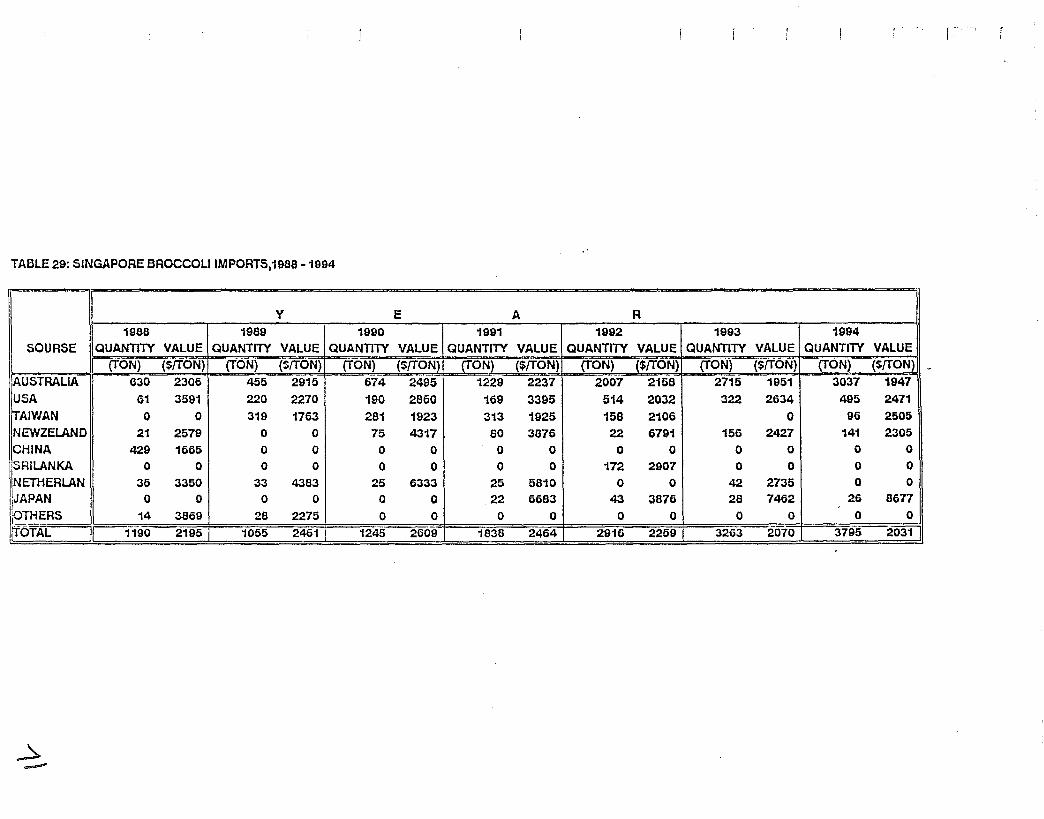
TABLE 29: SINGAPORE BROCCOU IMPORTS,198e -1994
y E A R1988 1989 1990 1991 1992 1993 1994
SOURSE QUANTITY VALUE QUANTITY VALUE QUANTITY VALUE QUANTITY VALUE QUANTITY VALUE QUANTITY VALUE QUANTITY VALUE(fON) ($rrON) (TON) (SrrON) (tON) (SrrON) [TON} ($trON) (rON) ($rrON) (TON) ($(rON) (rON) ($ttbN)
~USTliAllA 630 2306 455 2915 674 2495 1229 2237 2007 2156 2715 1951 3037 1947USA 61 3591 220 2270 190 2660 169 3395 514 2032 322 2634 495 2471
IAIWAN 0 0 319 1763 261 1923 313 1925 158 2106 0 96 2505
INEWZELAND 21 2579 0 0 75 4317 eo 3876 22 6791 156 2427 141 2305CHINA 429 1665 0 0 0 0 0 0 0 0 0 0 0 0
SRILANKA 0 0 0 0 0 0 0 0 172 2907 0 0 0 0
IINETHERLAN 35 3350 33 4383 25 6333 25 5810 0 0 42 2735 0 0jJAPAN 0 0 0 0 0 0 22 6683 43 3876 28 7462 26 8677lOTHERS 14 3869 28 2275 0 0 0 0 0 0 0 0 0 0/TOTAL I 1190 2195 1055 2461 1245 2609 1838 2464 2916 2259 3263 2070 3795 2031
~--

FIGURE 22-A.
'SINGAPORE TOTAL IMPORTS OF BROCCLIBY QUANTIlY & VALUE, 1988 - 1994
[--- QUANTllY (TON) --*_. VALUE CUSS) ~
FIGURE 22-8
BROCCOLI MARKET SHARE BY EXPORTINGCOUNTRY SINGAPORE, 1994
JAP•.f.N (fJ.i'f)NEWZEL4.ND (J.7%)
USA (JJ.(l'to}I~'~~~1T•.f1W.-LV (2S'l) ~
72

is projected to increase at a rapid rate in the future. The quality of broccoli demanded by thesupermarkets is short stem, finn, completely green head, and free ofany yellow spots.
Cabbage
Singapore imports ofcabbage have decreased from the highest level of 19,792 tons in 1988 toan average of 12,000 ton per year during 1989-1993. But import of cabbage by Singaporeincreased to 18,394 ton in 1994. Average CIF price of cabbage remained the same at about$455 per ton during the 1988-1994 period (Table 30 and Figure 23-A). China controls about49 percent of the cabbage market in Singapore (Figure 23-B). Malaysia controls about 23percent of the cabbage market in Singapore at a relatively low CIF price of $304 per ton. In1994, Australia controlled 13.3 percent of the Singapore cabbage market at a CIF price of$853 per ton. Taiwan, Thailand, Hong Kong and Viet Nam supplied about 15 percent of totalcabbage imported by Singapore in 1994. Japan and the United States each had less than onepercent of the cabbage market at CIF price of $1880 per ton and $668 per ton, respectively.
Cauliflower
Singapore imports ofcauliflower remained the same during the 1988-1994 period at about5,500-6,500 tons. Average CIF price was almost constant at about $1,320 per ton between1988-1991. Average elF price declined in 1992 and 1993 and increased to $1188 per ton in1994 (Table 31 and Figure 24-A). Australia controls over 92 percent of the cauliflmvermarket in Singapore (Figure 24-B). In 1994, Australian cabbage received a CIF price of$1207 per ton. The desired cauliflower quality is short stem, finn head, uniform color, andabout 1-1.5 Kg per head.
Carrots
Singapore imports of carrots increased at an average annual rate of 3.5 percent during the1988-1994 period. Average CIF price ofimported carrots during tItis period declined from$795 per ton in 1988 to $691 per ton in 1994 (Table 32 and Figure 25-A). Australia controls93 percent of the carrots market (Figure 25-B). The 1994 CIF price of imported Australiancarrots was $697 per ton (Table 32). The desired quality of carrots is similar to that inl\falaysia-deep orange COIOf, smooth surface, 2-2.5 centimeters in diameter and about 15centimeters in length. Limited quantity of baby carrots are imported by Singapore AirTransport Service Catering.
Leafy or Stem Vegetables
Singapore imports ofleafy or stem vegetables expanded at an average annual rate of about 9percent during the 1988-1994 period. Celery is the principle leafy or stem vegetable importedby Singapore. Average CIF price of these products remained relatively the same during thisperiod at about $1050-$]200 per ton (Table 33 and Figure 26-A). The United States andAustralia control over 96 percent of the imported leafy and stem vegetables market inSingapore. In 1994, the United States share of this market increased to 66 percent comparedto previous years average of 40-46 percent (Figure 26-B). The CIF price of the products
73

~
TA6LE 30: SINGAPHORE CA66AGE IMPORTS, 198a -1994
y E A R1988 1989 1990 1991 1992 1993 1994
SOURSE QUANTI1Y VALUE QUANTI1Y VALUE QUANTI1Y VALUE QUANTITY VALUE QUANTITY VALUE QUANTITY VALUE QUANTI1Y VALUE(rON) ($tto"N) (rON) (SirON) (TON) ($rtON) (TON) ($tTON) (TON) ($ttON) (tON) ($/TON) -(T~~ ($~ON\
CHINA 4058 407 3236 387 3994 384 3578 3-72 3721 361 4850 392 8933 -404
MALAYSIA 5319 226 3783 245 1778 233 2815 244 4736 241 3341 248 4211 - 304TAIWAN 7404 518 3736 516 5109 572 2295 637 2474 597 1939 471 1112 491AUSTRAUA 2223 724 969 846 1197 901 1924 857 2019 889 2509 605 2434 853THAILAND 684 922 347 921 359 933 284 1017 190 1131 168 726 166 688HONG KONG 45 569 49 364 87 438 48 335 182 363 498 391 953 422
VITNAM 0 0 0 0 0 0 0 0 0 0 66 406 483 320JAPAN 27 1389 89 943 43 1274 45 1521 47 1178 55 1634 38 16S0USA 0 0 14 1190 47 1178 27 992 41 769 0 0 49 668OTHERS 32 967 32 632 0 0 3 595 31 730 82 617 15 1071[OrAL 1~792 456 1-2255 440 12614 510 11019 602 13441 467 13-500 455 1-8394 451

FIGURE 23-A
(SINGAPORE TOTAL IMPORTS OF CABBAGEBY QUANTITY &VALUE. 1988 - 1994
~(I(WJ''''--~====::;:'====::;::l==:::;,===;:.====~,;==~,=;'S9..t;(}{I/II'iJ. I I. I I I I
l!'OOO ..••.. 1. ······· ·..j..·· ..·· ·····[··..···· ·..·r:·..·······..··,· ,j (..... S9fXl(lj){1r)
j\ I I I I i ~1~(IM [.\ ········r-..··..··..·..r··· ·····r ····..·····I ..· ·.. ·· ..··1..··.. ··..··(1'···.. $S..<;.o(Ipro
Z;(IM •···..·1"""\····..····l"....·....·..··'[·· · ·····r·····..·····..··,·..· ····.. t·····../;~:l ..······ $~~P.'iJ
~ moo j1 "\·····.. /·····..·..·..·..·, ·..··..·····1..· ··· ·/· ..·· ·..-t-···Z/·..··1
1 $7~((IPt'iJ 3~ 1$«1(} \ ·••••• •..···r·..·······..··j..··..·.··..···..·,·..·..·..·..···"l}t..·..··· $7jI{I{Ij){l() ~
14000 •••••••j \ ····· ····~~*I:·~~..·..·····.. -I·..····..··..··· ·..··..········..l / .1........ S6~O(IjJ(}O" " '.. ------- , ~L
13(l{J(} .•••••.•••••••••••••\ ;r..····"j..·····~' ··,.I····..···;·, ., ··············..1·············· of'vjX!(JjXIi}.,,' '..,'
1Z000 ~. !~ .l ······~·l:~· .1. $S~()(1POO
11(){I() • I ' I I I $5fXIOfXIO1968 19S9 1990 1P9I 1991 1993 1994
YEAR
[ --- QUANTITY (TON) --* -. VALUE CUSS) ~
FIGURE 23-8
CABBAGE MARKET SHARE BY EXPORTINGCOUNTRY. SINGAPORE 1994
BIN.4. (48.6%)
75

~0\
TABLE 31: SINGAPHORE CAUUFLOWER IMPORTS,198B -1994
y E A R1986 1969 1990 1991 1992 1993 1994
SOURSE QUANTITY VALUE QUANTITY VALUE QUANTITY VALUE QUANTITY VALUE QUANTITY VALUE QUANTITY VALUE QUANTITY VALUE
AUSTRALIA(to-Nf ($rtbN) (tON) ($/TON) (tON) ($trON) (TON) ($!to"N) (TON) ($(tON} (TON) ($/tbN) (TON) _($tTON)1
2754 1474 3394 1487 3441 1474 4175 1411 5533 126B 5145 1164 6350 1207CHINA 85 756 27 1168 24 769 117 an 0 0 0 0 4G 802KOAlA 0 0 15 1230 0 0 0 0 0 0 0 0 0 0TAIWAN 2136 1150 1404 049 1680 991 1194 1081 920 1040 504 626 320 1023USA 65 1326 56 1052 97 1669 159 1374 211 1120 36 1034 48 1513BELGIUM 0 0 0 0 15 1270 24 1091 22 1026 36 959 0 0HONGKON 0 0 0 0 0 0 0 0 0 0 0 0 105 573OTHERS 8 1116 28 1127 10 714 10 1190 52 710 30 913 9 1389~OTAL I 5050 1322 4924 1324 5298 1314 5679 1330 6738 1{92 6753 f1"54 68is 1188

. -;. .
FIGURE 24-A,
I:SINGAPORE TOTAL IMPORTS OF CAULlFLOVVERj'
BY COUNTRY & VALUE. 1988 - 1994 ,,:x(" tt,'l7:l/,7(J
. . ~--l•.'X- ~ !·· ····..· · :·:·rl't ··r~'~·'·;·tl
!-~.~._ ,'-t'·.MO./" -._---~,'-' /., ,.
~ .= ······································· ..~:>~~~·'7'·················································:····1~:::: 3~ "". :~,., ,.,';;i,<e:.:.·:·:··T·········:············ ".'"'.~ ;::
J':7X-~ t(p:J!'p:4
t.I;(~/'I:'O
YEAR
( -II- QUANTllY (TON) --~_. VALUE (U8&) ~
FrGURE .24-B
·CAULIFLOWER MARKET SHARE BY EXPORTINGCOUNTRY, SINGAPORE 1994
77

'-lCO
TABLE 32: SINGAPORE CARROTS IMPORTS, 1988 -1994
y E A R1G88 1989 1990 1991 1992 1993 1994
SOURSE QUANTITY VALUE QUANTITY VALUE QUANTITY VALUE QUANTITY VALUE QUANTIlY VALUE QUANTITY VALUE QUANTIlY VALUE
(TON) ($rtON) (rON) ($fTON) (TON) ($rfbN) (TON) ($rtON) (iON) ($fTON) -(tON) (${tON) (TON) ($trON)IAUSTRALIA 6742 791 8065 760 9699 660 11116 653 12019 644 11217 599 11201_ u97TAIWAN 167 606 641 615 220 666 160 662 102 646 122 634 199 562USA 634 921 426 815 50 645 12 1468 13 1646 27 1014 151 568NEWZEALAND 0 0 0 0 0 0 0 0 0 0 453 678 369 . 581BELGIUM 22 1163 38 967 77 1005 46 693 71 664 46 802 0 0FRANCE 0 0 0 0 0 0 0 0 0 0 0 112. 500JAPAN 6 2460 0 0 11 2273 13 2106 11 2327 34 1383 13 2701CHINA 42 411 0 0 0 0 0 0 0 0 0 0 0 0NETHERLAND 0 0 0 0 0 0 8 2232 30 1409 0 0 0 0KOREA 0 0 23 125 0 0 0 0 0 0 0 0 0 0
OTHERS 139 544 41 1147 27 904 8 2232 51 1144 14 1403 45 92G
/faTAL I 9710 795 9211 773 10284 6GG 11357 657 12246 650 1{913 607 {2090 69'1

FIGURE 25-A
'SINGAPORE TOTAL IMPORTS OF CARROTSBY QUANTITY &VALUE, 1988 -1994
.~ 'J:X-p"t,l.- " I . I I I I ~ , ..! I' !:1........j i ..1 j••••••.: ! ,~y '-S~;W;t:lO
•••••••. 1
1
' '1 .1 I.....J :lt ;/ ~ ~!PX>:.I(JI " i \. ,I I
?: j I / i \ ! f I I~PC>,'W•.r, r I' r\ I I. 1!.J
~ m ·······r~·············r················ ·····r;~/········ ·····'\······T···/········T······· 71r<',-r" 3~·_····_··\.~···········_·············r ·····---~f:········I·········.\\··If···-····r······l"p~ ;;
........ ···········\.;t:······· ·······7l..· ················I···············'f··········r·····L~, _ _.- _.: '~<l················ __······_·r············]···_······ ] ~:::
:!#$! 1~' 11;.0 ,n: :''1 :"~J l1U
YEAR
(-- QUANTITY (TON) U*_. VALUE CUSS) ~
FIGURE 25-8
CARROTS MARKET SHARE BY EXPORTINGCOUNTRY. SINGAPORE 1994
OTHERS (4.3%)
NEWZE.4.l.4.'I'D (J.1%)
If.;
19

TABLE 33: SINGAPORE LEAFY OR STEM VEGETABLES IMPORTS,1988 -1994
y E A R1988 1989 1990 1991 1992 1993 1994
SOURSE QUANTITY VALUE QUANTITY VALUE QUANTITY VALUE QUANTITY VALUE QUANTITY VALUE QUANTITY VALUE QUANTITY VALUE(TON) ($/TON) (TON) ($/TON) (TON) (${rON) (fON) ($,rfON) {fON} ($/TON) (TON) ($/TON) (fON) ($/TON)
AusfRAuA 2914 1249 2925 1189 21)94 1882 2882 1828 3947 1375 4250 1376 2894 1383USA 1417 1026 2150 1109 2480 1017 2888 965 3280 994 3900 876 6290 179TAIWAN 820 1222 1525 789 954 680 802 959 970 791 72 4679 0 0CHINA 703 771 871 1080 0 0 0 0 0 0 0 0 0 0JAPAN 9 7077 0 0 90 4802 0 0 83 6096 0 0 126 5060NETHERlAND 0 0 0 0 105 5125 0 0 82 5444 0 0 118 4146SOUTH AFRICA 0 0 0 0 0 0 0 0 101 2057 171 3665 12 3522BELGIUM 0 0 15 1548 40 1905 21 2891 42 3557 61 2976 55 3669NEWZELAND 0 0 10 3988 21 3430 32 2511 31 2189 34 3064 37 4022HONGKONG 16 3943 7 2296 0 0 0 0 95 1472 0 0 0 0OTHERS 0 0 0 0 0 0 0 0 0 0 4 4167 4 4911(fOTAl I 5879 1150 7503 1078 6284 1460 6625 1353 8631 1272 8512 1244 9536 1095

FIGURE 26-A
.SINGAPHORE TOTAL IMPORTS OF LEAFYBY QUANTllY &VALUE, 1988 - 1994
::K<: • iii i ,7!.---' I i ImW';·1;1
,,~ ······I··········I····'······j·/ I···~·:·::t"" ..-"-*···T""m,.JI':, ••••••••! L J 1 ,'.' : 1..~ J u· ..·-11(t.~~
.. I I ! ~,/ f i ~ r ,
I ! I !" -- ! !Ii, i' ~ ----~ :········1··················\···········......1·....····....·..r/·· .. ··· ....·"j"·..····· I··· ......·..····r···..·· f·,~x.!'~
:<' ········I··················I······~~>?'·r·:·~·:·:-·~·_·t·· ···· ..·..1············ ··/·..·······..·....,········ Nn:,?:t) 3.......................... .... ,.. , , · · ······ ·..1··· ··..····.. , ..··..··· !)'X-:>XJ >~
i Je " I I· I , I........1" ,:~;f ·····..1· ··········..r ······ 1 ·..····· ,····..··· ·..·1"··..·.. ~,'v:;n:J
's ········l···~~/~~:·..··i..············ .;......... ··..r ·..·····l······..········I..··....·····..··t..······ 1)X,~(}
......... ~······· ..············..···..··.. ··..·······..···..·r..·······..···..·,..·..··········.. ·1··..··..·..·..············· 1P.>:>P:'""' I I I I I I:$roo-L--+-..:..----+---+----i-----+----+----+---LI~)'X>Pt)
;.~8 . 1~' ;1;.0 lS'" ;$'$'1 :$'93
YEAR
[---- QUANTllY (TON) --*-. VALUE (USS) ~
FIGURE 26-8
LEAFY MARKET SHARE BY EXPORTINGCOUNTRY. SINGAPORE 1994
OTHERS (1.1%).'\'ETHERL4.SD (1.2%h
~'" AVSTRAU.4. (S(I.3'1<)
1.U'.4.-"I' (1.3'1<)
81

imported from the United States was $779 per ton in 1994. Celery is main vegetable in thisgroup of vegetables that the United States exports to Singapore. In 1994, Australia controlled30 percent of the market for leafy and stem vegetables at CIF price of $1383 per ton.
Tomatoes
Singapore imports of tomato increased from 7974 tons in 1988 to 8,752 tons of tomato in1994 from several countries in the \Vorld (Table 34 and Figure 27-A). 1\1alaysia and Thailandcontrolled 78 percent of the tomato market at elF price ranging between $350 to $359 perton (Figure 27-B). Malaysia and Thailand are members of the ASEAN countries and theirtomato is generally low quality at low CIF price. Australia controlled about 20 percent of thetomato market in 1994 at CIF price of $1 ,207 per ton. Netherlands exported 54 tons oftomato at CIF price of $3,483 per ton. Japan and Belgium exported limited quantity oftomato at high eIF price of $7,738 per ton and $3,333 per ton, respectively. The high pricetomatoes from Netherlands, Belgium and Japan are organically grown, uniform size, rich redCOIOf, chemical residue free with long shelf life.
82

TA6LE 34; SINGAPORE TOMATO IMPORTS,196a ~ 1994, .
Q)I.N
y E A R1988 1989 1990 1991 1992 1993 1994
SOURSE QUANTITY VALUE QUANTITY VALUE QUANTITY VALUE QUANTITf VALUE QUANTITf VALUE QUANTITY VALUE QUANTITY VALUE(fON) {$fTON} (fONf {$rTON} (fON) ($/rON) (fON) ($fTON)- (TON) {$rrON} (fONf {$fTON} (fON)- ($frcm-) J
MALAYSiA '--~6361 234 4963 229 3937 249 3682 292 3860 294 4134 304 4922 3~O
THILAND 569 273 763 318 6GO 347 964 313 1386 351 1794 369 1961 3~9
AUSTRAUA 904 133B 534 1270 456 1505 1361 1122 95G 1215 1401 1174 1734 1201CHINA 85 420 23 802 0 0 0 0 0 0 0 46 463NETHERLAN 17 4167 17 3291 6 3373 5 4762 9 4299 20 3423 G4 3403USA 21 2466 0 0 16 1637 0 0 4 3869 0 0 0 0TAIWAN 9 1567 0 0 0 0 0 0 0 0 0 0 Q 0JAPAN 0 0 0 0 0 0 0 0 0 0 4 D7DO :3 773G6ELGIUM 0 0 0 0 0 0 0 ,0 0 0 0 0 5 3JJ3OTHERS 8 2G79 16 1360 4 4315 9 2644 30 1071 56 670 a 1414[OiAl 1[791'4 3'02 6ifa 342 507'9 393 (}O41 490 0245 4r)9 i409 600 1=0762 647J

· FJGURE 27-A
,SINGAPHORE TOTAL Irv1PORTS OF TOMATOBY QUANTITY & VALUE, 1988 -1994
I I I' I' iii l~px.p;4Ii! 101I If: i /'··..··r···········r···········I·····:········r······I······j·71····, f
t.''''',''-''
....... i J "f "f.················"f··················I~~~:;;,···········f·········~W~p.u
E; ········t···· I"··············..·t·················t··················~ _ : j..•.....•
~ " ·····-1······· ······1················1···············1:············1·::/,~~::·I·················II!····· ,::~: >~:::J L\ I'" ----- ':t I r
(J I: ········l··~"'·~<:··· '1~ ·················r······~~~/'·I·············:·:··;" ·············1··················/········ ;~7".......... .................~"';;',. j ·..·..·..·······i .. ··:;;I'...·..· · , J t ··· ..
: ·······f···:··········r·:·:·:·-'·,f· ·······f-_···········j·················j··········I····... .:::193! : 19-e~ U''iJ :'91 1'92 1993 1'9-4
YEAR
[-II-. Qu~nTY (TOt:-J) --*_. VALUE (US&) ~
F[GURE 27.-8
TOMATO MARKET SHARE BY EXPORTINGCOUNTRY. SINGAPORE 1994
OTHERS (0.2%)
MAL41'Sl.'" (S6.11:1r-)
84

THAILAND, .
Thailand produces most of the vegetables it consumes. It has surplus which it exports to otherASEAN countries. Import data for individual fruits or vegetables products are not availablefor Thailand. However, data obtained from department of customs shows that the total valueof fruits and vegetables imported by Thailand increased from $ 61. 8 million in 1989 to$ 177.35 million in 1993, or an increase of 199 percent. Apples, grapes and stone fruits arethe major fiuits imported by Thailand. Import data is only available for apples. Oranges areprevented from entering Thailand. With the exception of potato, Thailand import very smallamount of fresh vegetables. Broccoli one vegetable product that Thailand began to import forwhich Jordan may have export potential.
Apples
The consumption of imported apples has been increasing at a rapid rate. This is due in part toa well organized promotional campaign by Apple Commission in the United States. Availableimport data shows that apple import by Thailand increased from 527 ton at about $ 1032 perton in 1990 to 23,571 ton at $ 1126 per ton in 1993. Apples import in recent years increasedsignificantly. In 1994.. Thailand imported an estimated 35,356 ton ofapples from the UnitedStates, Canada, France and Chile. The average CIF price in 1994 was $ 1434 per ton. TheRed Delicious is the variety of apple preferred by consumers. The sell ofapple bysupennarkets has been increasing at 8-10 percent annually during the last few years. Applesare bought by importers directly from brokers in the United States on CIF basis.
Grapes
As in Malaysia and Singapore, demand for imported table grapes is increasing at a rapid rate.The results ofthe survey conducted "\vith wholesalers and supennarkets managers in Bangkok,indicate that imported table grapes consumption has been increasing at 10-15 percent per yearduring the last few years. Strong future demand is projected. Data on the quantity of freshtable grapes imported by Thailand is not published and remain controlled by importers.However, price data for 1994-1995 was obtained through personal interview with severalwholesalers and supennarkets managers. The CIF price ranges between $ 3,000 -$ 4,000 perton depending on the variety and the season. Custom duty on grapes was 60 percent of theCIF value in 1994 and 45 percent of the CIF value in January 1995.
Red Globe is the best selling variety followed by the Thompson Seedless and Rubby Seedless.Importers buy grapes directly from brokers in the United States, Australia and Chile on CIFbasis. The average wholesale price for Red Globe ranges between $ 7.3 to $ 8.3 per kg, andthe retail price ranges between $ 9.2 to $ 13 per kg. Thompson Seedless prices are about 4percent less than the prices ofRed Globe. The Rubby Seedless prices are about 8 percent lessthan the price ofRed Globe. Table grapes in Thailand are purchased by the upper income andmiddle-upper income segments of the population. The qualities demanded are the same asthose in Malaysia and Singapore.
85

Broccoli
The sell of broccoli in supennarkets in Bangkok has been increasing at a rapid rate in recentyears. Most of the broccoli is imported from the United States and Australia. Exact quantityor elF price ofbroccoli imported by Thailand is not kno\Vl1. However, the retail price rangesbetween $ 3.5 to $ 4.5 per kg for short stem and high quantity broccoli. Chain supennarketsmanagers predict that their sell of broccoli v,-ill increase as the proportion of high and middleincome groups increases and as the number of foreign visitors increases.
86

r,
PART IV
SU:\Il\IARY AND CONCLVSIONS
Southeast Asia is one of the \\Torld's fastest grO\vn region. 11alaysia, Singapore and Thailandhave the fastest expanding economies in the region. The Gross National Product (G:N""P) ofthis sub-region has been increasing at an average annual rate of over 15 percent. Averageannual increase in Per Capita Income (PCI) of this sub-region has exceeded 13 percent inrecent years. Rapid economic growth and increase in PCI have reflected in increase demandfor high quality imported food products. Food imports by l\1alaysia, Singapore, and Thailandhave been increasing at an average annual rate ofover 14 percent. Total food imports by thissub-region was estimated at about $ 12 billion in 1994. High quality fresh fruits andvegetables represent a significant portion oftotal food imports. It is estimated by managers ofsupermarkets that fresh imported produce consumption is increasing at annual rate of 10-25percent in recent years.
The market distribution channels for fresh fruits and vegetables are rapidly developing. Thedistribution channels in Malaysia, Singapore and Thailand basically follow the classic patternof importer to wholesaler to retailer. The comparative importance of each ofthe tradechannels, however, is rapidly changing. The market distribution system for fresh fruits andvegetables ranges from highly advanced in Singapore to less developed in Thailand. TheMalaysian distribution chalmels are rapidly developing with the application ofadvancetechnology in all segments ofthe marketing chain.
The expanding role of national and multi-national supermarket chains has increased thecomparative importance of the retail sector in the fresh produce handling system. The retailsector has been undergoing significant structural changes. The leading role in fresh produceretailing is increasingly taken over by the supermarkets. As competition at the retail levelincreases and the trade becomes more consumer oriented, supermarkets are considering betteralternatives to offer consumers high quality of fresh produce at lower prices. Thesedevelopments have increased trend toward forward integration by supermarket chains andbacbvard integration by importers / wholesalers. A more integrated distribution system israpidly emerging. Multi-national supernlarket chains are directly importing increasing portionoftheir fresh produce from foreign producers and foreign exporters. On the other hand, someimporters / exporters are integrating backward to the retail sector through consignmentarrangements with supermarket chains.
Consumers worldwide are becoming more educated, health concious and a\\'are of the valueoffresh produce in their daily diet. Increasing proportion of household food expenditures inthis sub-region of Southeast Asia is allocated to the purchase of fresh produce. The rapidexpansion offresh produce imports by :Malaysia, Singapore, and Thailand is influenced by a
87

rapid increase in PCI, development of the infra-structure, and improvement in the freshproduce trade distribution channels. This sub-region of Southeast Asia imports a largevarieties offresh produce from several different regions of the \VorJd. Fresh citrus products,apple, and table grapes are the major fruit products that are imported in large quantity. Inaddition, a large quantity of orange juice is also imported annually. Broccoli, cabbage,cauliflower, carrots, celery and iceberg lettuce are the vegetable products imported in largequantity by ~lalaysia and Singapore.
Jordan has a significant balance of trade deficit with each ofMalaysia, Singapore andThailand. However, evaluation of the type and quality offresh fruits and vegetables importedby this sub-region and Jordan's production of these products indicates that Jordan haspotential to export fruits and vegetables to this sub-region. The fresh fruits for which Jordanhas export potential to this sub-region are: (1) oranges, (2) mandarins, (3) grapefruits, (4)lemons, and (5) table grapes. In addition to fresh fruits, Jordan has potential to export orangejuice. The vegetable products for which Jordan has export potential to this sub-region are:(1) broccoli, (2) cauliflower, (3) carrots, (4) celery, and (5) iceberg lettuce. Jordan also has agood opportunity to export high quality tomato to Singapore.
The sub-region ofMalaysia, Singapore, and Thailand imports a large quantity offreshoranges. The desired. quality of fresh oranges is thin skin, deep orange color, juicy and sweet.The size preferred is 113 piece in 20 kg box. The Sunkist Navel Orange is generally the mostpreferred variety. Malaysia and Singapore jointly import about 110 thousand ton of freshoranges annually. Australia and the United States are the principle exporters offresh orangesto these countries. Australia controls 48 percent and the United States controls 29 percent ofthe orange markets in :Malaysia and Singapore. Thailand has various regulations that preventnormal import offresh oranges. These regulations are intended to protect local production.All fresh oranges are imported on eIF basis. Generally, payments are made to exporters after20 days ofdelivery. The CIF price ofAustralian imported oranges by Malaysia rangesbetween $ 460 to $ 500 per ton. The CIF price oforanges imported from the United States byMalaysia ranges between $ 530 to $ 600 per ton. The CIF price ofAustralian orangesimported by Singapore ranges between $ 710 to $ 750 per ton. The CIF price ofimportedoranges from the United States by Singapore ranges between $ 870 per ton to $ 900 per ton.In addition to fresh oranges, Malaysia & Singapore import over 10 million litres oforangejuice annually.
Malaysia and Singapore imports an estimated 50 thousand tons ofmandarins annualIy. China,Taiwan, Hong Kong, Pakistan and Australia are the principle suppliers. The CIF price ofmandarins imported by Malaysia ranges between $450 to $ 550 per ton. The CIF price ofmandarins imported by Singapore ranges between $ 650 to $ 1,500 per ton. The quality ofmandarins desired is firm, juicy, sweet, and easy peeling fruit.
Malaysia and Singapore import an estimated 2,600 tons of fresh grapefruits annually. TheUnited States, Israel, South Africa, and Australia are the major suppliers ofgrapefruits to thissub-region. The Rubby - thin skin fruit is the preferred variety ofgrapefruits. The CIF pricefor grapefruits imported by Singapore ranges from a low of $ 630 per ton for Israeli productto a high of $ 945 per ton for Australian product. The imported graefruit from the UnitedStates has a CIF price of $ 820 per ton.
88

Malaysia and Singapore import about 57,00 tons offresh lemons annually from severalcountries in the World. High quality lemons are imported from Australia, the United States,South Afiica, Israel, and Cyprus. The CIF price ranges between $ 600 per ton to $ 950 perton.
Large quantity oftable grapes is imported by Malaysia, Singapore and Thailand. Red Globe,Thompson Seedless, and Rubby Seedless are the preferred varieties. An estimated 22thousand tons oftable grapes are imported by Malaysia and Singapore annually. Data forquantity of fresh table grapes imported by Thailand is not available. The United States,Australia, and Chili control over 94 percent of the imported table grapes market in Malaysiaand Singapore. The average CIF prices for imported table grapes by Malaysia range between$ 2,100 to $ 2,600 per ton. The CIF price for table grapes imported by Singapore rangesbetween $ 1,980 per ton to $ 2,400 per ton. The CIF price for table grapes imported byThailand ranges between $ 3,000 to $ 4,000 per ton.
An estimated 12,500 tons ofbroccoli is imported by Malaysia and Singapore. Data forbroccoli imported by Thailand is not available. Australia, United States, Taiwan and NewZealand are the major exporters of broccoli to Malaysia and Singapore. Australia controls 80percent of the broccoli market. The CIF price ranges between $ 1,202 to $ 2,200 per ton inMalaysia, and $ 1,950 to $ 2,500 per ton in Singapore. The quality of broccoli desired is shortstem, firm, and green head.
Malaysia and Singapore import an estimated 7,700 ton of Cauliflower per year. The desiredcauliflower quality is short stem, firm, unifoffi1 color, and about 1- 1.5 kg per head. Australiais the major supplier ofcauliflower, accounting for over 92 percent of the market share. TheCIF price ofcauliflower imported from Australia is over $ 1,200 per ton and from the UnitedStates is over $ 1,500 per ton.
Malaysia and Singapore import about 30 thousand tons of Carrots each year. Australiacontrols about 93 percent of the carrots market. In 1994, the CIF price of carrots importedfrom Australia was $ 668 per ton in Malaysia and $ 697 per ton in Singapore. The quality ofcarrots desired is rich orange colour, smooth surface, 2-2.5 centimeters in diameter, and about15 centimeters in length.
Over 11 thousand tons of Celery and other leafy or stem vegetables are imported annually byMalaysia and Singapore. Australia and the United States are the major exporters ofthesetypes ofvegetables. In 1994, Australia controlled 52 percent of the Malaysian market and 30percent of the Singapore market. The United States controlled 40 percent of the Celerymarket in Malaysia and 66 percent of the market in Singapore. In 1994, the CIF price forimported Australian and United States Celery by Malaysia was $ 648 per ton and $ 568 perton, respectively. The CIF price ofAustralian and United States leafy and stem vegetablesimported by Singapore was $ 1,383 and $ 779 per ton, respectively.
89

CONCLUSIONS
The fruits and vegetables market in Malaysia and Singapore is dynamic and rapidly expanding.The market is free with a well developed distribution channels. In Thailand the market forimported fresh produce is expanding and rapidly moving toward free market systems. Thedistribution channels for fruits and vegetables in Thailand is developing. The import marketsfor fresh produce in this sub-region of Southeast Asia is very competitive with products beingimported from several different regions of the \\TorId. The United States and Australia controlthe significant share of the market for most major imported fresh produce.
The competitive advantage ofAustralia and the United States for fresh fruits and vegetables inthis sub-region is influenced by many factors. Both the United States and Australia have largeproduction capacity and are able to supply the desired quantity and quality ofa variety of freshproduce at competitive prices. In addition, the demostic production and marketing systems inboth the United States and Australia are higWy developed and able to adjust to a rapidlychanging import markets in this sub-region. Furthermore, both sea and air transportation linesbetween the United States and this sub-region and behveen Australia and this sub-region arecompetitive, timely, higWy organized, and equipped with all advanced technology essential forthe transfer offresh produce. The United States, in particular, and Australia, in general, havean excellent grading system and apply the most advanced scientific methods in their postharvest treatments of exported fresh produce. The competitive advantage of Australia and theUnited States further enhanced by the organized promotion campaign conducted in this subregion by commodity commissions in the United States and the Australian HorticulturalBoard. Australian and the United States products are becoming household items at thehomes of most upper and middle income groups ofthe population in Malaysia, Singapore, andThailand.
The import markets in this sub-region are open and presently accomodate products fromseveral countries in the \\TorId in addition to Australia and the United States. The importmarket for fresh produce in this sub-region of Southeast Asia is becoming increasingly qualityconscious. The fresh produce import markets adhere to a very specific grading standard,product quality, and chemical residue control. Singapore in particular, and Malaysia andThailand to a large e:x1ent adopted the United States Department ofAgricultural GradingStandard, the United States Food and Drug Administration Chemical Residue Tolerance, andEuropean quality specifications. Quality and Shelflife of fresh produce are influenced by aset of post-harvest treatments. Pre-cooling, grading, packaging and other technolgicallyadvanced post-harvest treatment are essential for a successful entry to the import markets inthis sub-region. This is particularly true for those products that will be shipped by sea in orderto reduce quality loss and improve the she1f1ife of the products. For Jordan to capture part oftlus expanding import market, producers and/or exporters of fresh fruits and vegetables mustimplement all essential modem post-harvest technology, including chemical residue control.Program to improve the application ofpost-harvest technology for fresh fruits and vegetables
90

in Jordan is outlined in detail in the Strategic Plan developed for the Agricultural MarketingOrganization!.
Jordan competitive position in this sub-region of Southeast Asia will also depend upon a welldeveloped low-cost international transportation system. At the present time the Australiangovernment heavily subsidize aire cargo shipment of fresh produce from Australia to countriesin this sub-region. This has enhanced Australia's competitive advantage compared to otherexporting countries. Direct air cargo links between Jordan and each ofMalaysia, Singaporeand Thailand are well developed. The sea route is not direct but is via feeder ships fromAqaba to Jada, Saudi Arabia. Geographically, Jordan has transportation advantage toSoutheast Asia compared to the United States, South America, and Europe. Australia iscloser than Jordan to major ports in this sub-region. Transportation cost will effect Jordan'sentry to the markets in this sub-region. Several transportation feasibility studies are outlinedin the Strategic Plan. The results of these studies, if conducted, will determine the mode androute for efficient transfer of Jordan's fresh produce to the export markets in Southeast Asianmarket.
Analysis of the markets in Malaysia, Singapore, and Thailand show that Jordan producesseveral products with the quality demanded by these markets. However, the quality ofJordan's fruits and vegetables are not known to consumers, retailers, and most importers Iwholesalers. There is a positive attitudes among all segments of the marketing chain to helppromote Jordanian fresh produce. Several international agricultural exhibits are held annuallyin these countries. Practically, all supermarkets chains expressed interest in promotingJordanian products in their stores. In order to enhance Jordan's successful entry into themarkets in these countries, it is higWy recommended that the private and public sectors inJordan organize Jordan \Veek to promote Jordanian fresh fruits and vegetables. Jordan's\Veek to promote fresh produce in supermarkets may be organized to coinside with the timingof agricultural exhibit in each country.
Araji, A.A. "Export Plan for Fresh Fruits and Vegetables". AgriculturalJ\farketing Development Project and U.S. Agency for International Development,Amman, Jordan, December, 1994.
91