Plotting Amsterdam. New techniques for research of urban development
15
JAAP EVERT ABRAHAMSE-MENNE KOSIAN PLOTTING AMSTERDAM. NEW TECHNIQUES FOR RESEARCH OF URBAN DEVELOPMENT Abstract The Landscape Department of the Cultural Heritage Agency of the Netherlands has been working on a GIS-cartography project, focusing on a large set of historical data that has come down to us from the seventeenth century. In the Dutch Golden Age, the province of Holland went through a period of rapid economic and urban development. Some cities were extended in several stages. Recent research has shown how functionality, beauty and profitability were the mutually dependent objectives of urban development. In the process of expansion, grounds in the newly planned areas were divided into lots, most of which were put up for auction. This resulted in a number of data sets, quite unique in nature, consisting of detailed maps and auction records, specifically linked to the urban parcellation struc- ture. Amsterdam’s extensions were designed according to rapidly evolving insights into urbanism and the management of urban space. First observations show that GIS research of financial and ownership data yields new perspec- tives on the history of urbanism on the micro-scale of parcellation and can contribute to our knowledge of economic and urban history, of the functioning of early modern towns – and the modern city centers they evolved into. Keywords: Urban history, Dutch Republic, spatial planning, urban GIS, urban morphology Introduction During the Dutch Golden Age, some of the cities in the province of Holland, like Amsterdam, went through a period of rapid economic and urban development. The costs of city extensions were high. Huge amounts of money were spent on public works. At the same time, budgets were tight. Tax rates were low and the city government didn’t have much financial scope. To recover some of the costs, the city had to make as much money out of the extensions as possible. In the longer term, the city could count on higher tax and excise revenues, because of the higher number of inhabitants and compa- nies. But land sales were the main source of income during an expansion project. There were two ways of raising the revenues out of ground sales. At first, the num- ber of marketable parcels was to be maximised. In order to create the highest possible number of building plots, the extensions were composed of regular building blocks, as far as possible. Every block was divided up in parcels in a regular way. This way, as many parcels as possible could be laid out in Amsterdam’s extensions. The second way
-
Upload
cultureelerfgoed -
Category
Documents
-
view
2 -
download
0
Transcript of Plotting Amsterdam. New techniques for research of urban development
Jaap EvErt abrahamsE-mEnnE Kosian
plotting amsterdam. new techniques for research of urban development
Abstractthe landscape department of the cultural heritage agency of the netherlands has been
working on a gis-cartography project, focusing on a large set of historical data that has come down to us from the seventeenth century. in the dutch golden age, the province of holland went through a period of rapid economic and urban development. some cities were extended in several stages. recent research has shown how functionality, beauty and profitability were the mutually dependent objectives of urban development.
in the process of expansion, grounds in the newly planned areas were divided into lots, most of which were put up for auction. this resulted in a number of data sets, quite unique in nature, consisting of detailed maps and auction records, specifically linked to the urban parcellation struc-ture. amsterdam’s extensions were designed according to rapidly evolving insights into urbanism and the management of urban space.
first observations show that gis research of financial and ownership data yields new perspec-tives on the history of urbanism on the micro-scale of parcellation and can contribute to our knowledge of economic and urban history, of the functioning of early modern towns – and the modern city centers they evolved into.Keywords: urban history, dutch republic, spatial planning, urban gis, urban morphology
Introductionduring the dutch golden age, some of the cities in the province of holland, like
amsterdam, went through a period of rapid economic and urban development. the costs of city extensions were high. huge amounts of money were spent on public works. at the same time, budgets were tight. tax rates were low and the city government didn’t have much financial scope. to recover some of the costs, the city had to make as much money out of the extensions as possible. in the longer term, the city could count on higher tax and excise revenues, because of the higher number of inhabitants and compa-nies. but land sales were the main source of income during an expansion project.
there were two ways of raising the revenues out of ground sales. at first, the num-ber of marketable parcels was to be maximised. in order to create the highest possible number of building plots, the extensions were composed of regular building blocks, as far as possible. every block was divided up in parcels in a regular way. this way, as many parcels as possible could be laid out in amsterdam’s extensions. the second way
2 Jaap EvErt abrahamsE-mEnnE Kosian
of raising revenues was the ground price. this objective could be achieved by putting up as much ground as possible for auction.
this resulted in a number of different, but comparable data sets in cities like amsterdam, rotterdam or leiden. these are quite exceptional in nature, as they con-sist of detailed maps and auction records, specifically linked to the urban parcellation structure. these data sets consist mainly of two different types: on the one hand there are ground distribution maps (uitgiftekaarten), on the other the auction books (veilboeken)1. the distribution maps show the exact situation of the plots within one or more blocks between streets and or canals. the auction books give detailed infor-mation on the transaction. the geographical component in the auction books often consists of mentioning the first parcel of the block and describing the following en-tries from there (“on the corner of that and that street the first parcel, measuring …feet […], the adjacent parcel from there […]” etc.). this combination of data in the distribution maps and auction books is of huge historical importance for the study of urban development, socio-economic stratification of cities and urban morphology.
as amsterdam was by far the largest and fastest growing city in the golden-age netherlands, it was obviously the best place to study urban expansion, parcellation and functional processes. in cooperation with the amsterdam city archives, the landscape department of the dutch cultural heritage agency has therefore started a project to disclose some of these data sets, starting with the data from amsterdam. to link the socio-economic data to specific locations a new type of gis had to be developed to cope with the changing urban layout, and with the relative georeferenc-ing in the auction books. in this paper we would like to give an insight into this new gis, but before that we need to include a short introduction to dutch urbanism in the golden age and the urban development of amsterdam.
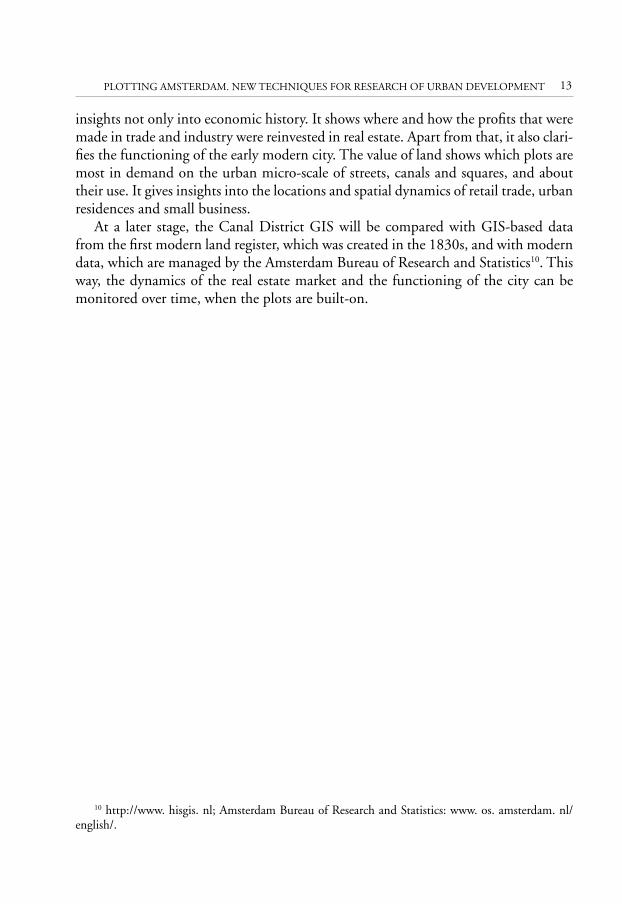
Amsterdam’s Third Extension between 1585 and 1663, amsterdam’s built-up area increased by more than five-
fold (tav. via). in the 17th century, the city was expanded in two phases, which we call the third and fourth extensions. 2 amsterdam was confronted with an unprec-edented increase in population in the years following the fall of antwerp in 15853. this period saw a spectacular spurt of urban sprawl outside the city’s walls. shortly thereafter, the first large-scale city expansion was initiated. this phase in amsterdam’s urban development is called the third extension.
1 m. hamElEErs-e. schmitz, Amsterdamse uitgiftekaarten 1586-1769: Basis van de stedelijke verkave-ling, “Jaarboek amstelodamum” 88, 1996, pp. 45–64.
2 for an overview of urban development: J.e. abrahamsE, De grote uitleg van Amsterdam. Stad-sontwikkeling in de zeventiende eeuw, bussum, thoth, 2010.
3 for general information, see: J. israEl, The Dutch Republic: Its Rise, Greatness and Fall, 1477-1806, oxford, clarendon press, 1995.
plotting amsterdam. new techniques for research of urban development 3
in 1609, amsterdam obtained permission from the states of holland, the provin-cial authorities, to extend its territorial jurisdiction. a year later, the extension com-menced with the layout of a new harbour area. the first plans called for an expansion all around the city, but these were revised to include only the west side. in 1613, new fortifications were constructed. the completion of the fortifications was followed by the construction of buildings and the necessary infrastructure behind the newly ex-panded fortifications. large suburbs had been built illegally. at this time, these were not demolished, but were absorbed within the city’s new fortifications in order to not antagonise their inhabitants, as the city’s government was well aware of the potential for disturbances of the public order. the Jordaan district was not a newly designed area of town, but an incorporation of these suburbs. the landscape structure of the medieval peat reclamations was preserved here. the preservation of this area led to a fragmentation of the extension.
during this expansion phase, the city council proved to a large extent unable to manage the planning, design and construction process properly. the expansion of amsterdam occurred in the context of unbridled urban expansion, which was marked by the regents’ growing anxiety regarding public order, the limited financial resources, and a lack of expertise. the results were that the grandiose expansion plan at first was confined to the west side of the city, and then fell apart into a number of smaller elements, that formed separate city parts: the harbour, the quarter around haarlemmerdijk, the canal belt and the Jordaan quarter. this caused fragmentation of the urban structure.
the most important urban innovation of this period was the introduction of an exclusive residential zone, the now famous canal district. industrial activities were prohibited in this area. luxurious homes were built according to strict rules. the ca-nal belt was the most successful part of amsterdam’s extension, not only aesthetically, but functionally and financially as well. the grand canals attracted all of the attention and became the standard for the subsequent expansion.
The Fourth Extensiona new shortage of building lots arose shortly thereafter. as a result, parts of the
city were restructured and some new streets and quarters were created by filling in small sections of the amstel river and the iJ. but despite these efforts, haphazard urbanisation again took over. new fortification and extension plans were drawn up after stadholder william ii’s failed attack on Amsterdam in 1650.
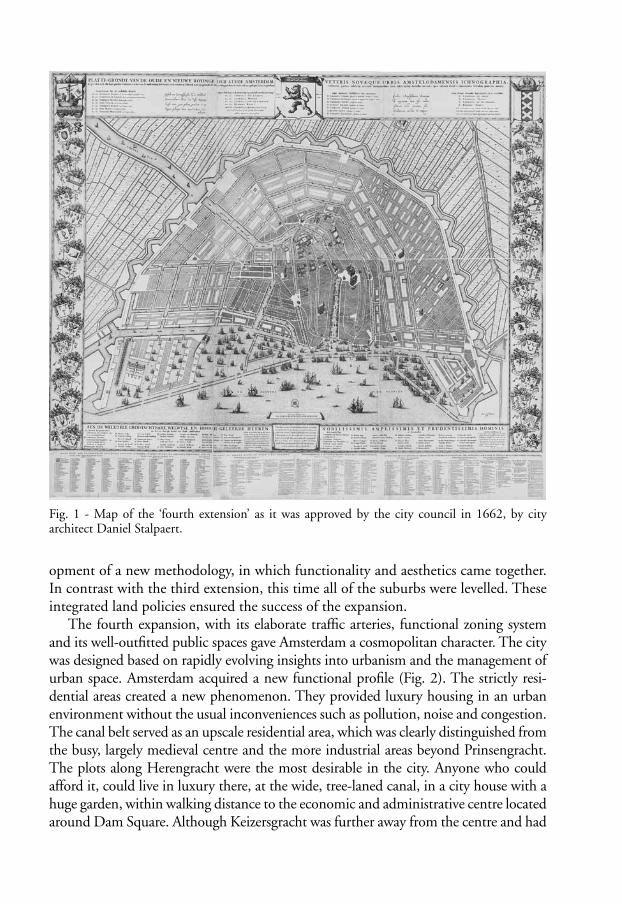
in 1662, a new extension plan was approved for the area between the leidsegracht and the nieuwe vaart (fig. 1). previous experiences were brought to the new plans, which led to a well-considered, coherent scheme. the plans were rooted in the further elaboration of the canal belt concept. to facilitate the execution of this scheme, all of the necessary land was expropriated. the fourth extension was the result of the devel-
4 Jaap EvErt abrahamsE-mEnnE Kosian
opment of a new methodology, in which functionality and aesthetics came together. in contrast with the third extension, this time all of the suburbs were levelled. these integrated land policies ensured the success of the expansion.
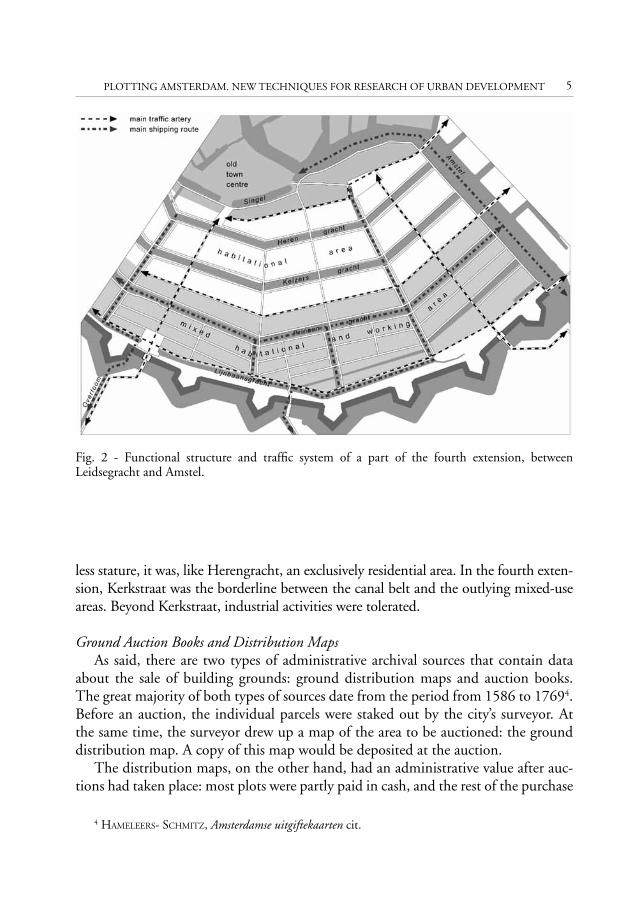
the fourth expansion, with its elaborate traffic arteries, functional zoning system and its well-outfitted public spaces gave amsterdam a cosmopolitan character. the city was designed based on rapidly evolving insights into urbanism and the management of urban space. amsterdam acquired a new functional profile (fig. 2). the strictly resi-dential areas created a new phenomenon. they provided luxury housing in an urban environment without the usual inconveniences such as pollution, noise and congestion. the canal belt served as an upscale residential area, which was clearly distinguished from the busy, largely medieval centre and the more industrial areas beyond prinsengracht. the plots along herengracht were the most desirable in the city. anyone who could afford it, could live in luxury there, at the wide, tree-laned canal, in a city house with a huge garden, within walking distance to the economic and administrative centre located around dam square. although Keizersgracht was further away from the centre and had
fig. 1 - map of the ‘fourth extension’ as it was approved by the city council in 1662, by city architect daniel stalpaert.
plotting amsterdam. new techniques for research of urban development 5
less stature, it was, like herengracht, an exclusively residential area. in the fourth exten-sion, Kerkstraat was the borderline between the canal belt and the outlying mixed-use areas. beyond Kerkstraat, industrial activities were tolerated.
Ground Auction Books and Distribution Mapsas said, there are two types of administrative archival sources that contain data
about the sale of building grounds: ground distribution maps and auction books. the great majority of both types of sources date from the period from 1586 to 17694. before an auction, the individual parcels were staked out by the city’s surveyor. at the same time, the surveyor drew up a map of the area to be auctioned: the ground distribution map. a copy of this map would be deposited at the auction.
the distribution maps, on the other hand, had an administrative value after auc-tions had taken place: most plots were partly paid in cash, and the rest of the purchase
4 hamElEErs- schmitz, Amsterdamse uitgiftekaarten cit.
fig. 2 - functional structure and traffic system of a part of the fourth extension, between leidsegracht and amstel.
6 Jaap EvErt abrahamsE-mEnnE Kosian
price was mortgaged, with the ground as a collateral security. rent and principal pay-ments to the city were registered in the auction books. this way, the city kept track of all owners who did not pay in cash. apart from that, conflicts might raise over ground properties, during which this register might be of convenience.
building grounds were auctioned by the block. within these blocks, each parcel had a number. in the auction books, a typical description of a lot would look like this: “a parcel of ground, marked no. 1, at the herengracht, on the west side in the park marked “a”, wide at the front 25 feet, and at the back 33 feet, long at the north side 22 feet and at the south side 30 feet, next to it is leidsegracht at the north side, and lot no. 2 at the south side, at the front side the street and at the back no. 42”. after this description of the plot on sale, the books contain the plot prices and details about the buyers. of course, their names are always included, but in some cases their occupation and place of residence are also mentioned.
A GIS for archival dataurban historical research is often characterized by a multitude of written sources.
any city archive contains a wealth of information related to the everyday affairs of the city. many of these sources, although referring to actual (historic) locations within the city, do not give an exact geographical reference. many records refer to urban blocks, districts or parishes. sources on criminal activity often mention the event as having happened “on the corner of…”, “in front of the house owned by …”, or “between alley X and alley Y”. but even more geographically linked data frequently are not as exact as we would like them to be. when the dutch cities auctioned off the building plots in their newly developed areas in the 17th century, these transactions were registered in auction books. although the entries specifically describe a plot, a location in the city, the description often is given relative to the neighbouring plots, or to a street corner. and although we often have the help of distribution maps depicting the auctioned plots, since these maps give only a small part of the city, georeferencing hem is not easy.
of course, we have street names, but they might have been renamed, replaced or even disappeared in the modern city. historical maps give a good insight into the city’s morphology, but only rarely contain information on street names.
the traditional way of georeferencing and vectorizing historic maps into a gis is there-fore ideal to show the city’s shape, yet unsuitable for georeferencing archival data5. in the tra-ditional method, the shapes of the historic map are copied with their physical characteristics (land use, surface type, area). it is impossible to search it on descriptive features like corners of streets. another problem that might arise with the traditional way of vectorizing historic
5 m.c. Kosian, GISing dead-reckoning; historic maritime maps in GIS, in: w. börnEr-s. Uhlirz- l. DollhofEr (eds.), proceedings of the 13th (2008) vienna conference on heritage and new technol-ogy, 2009.
plotting amsterdam. new techniques for research of urban development 7
maps is that it can be hard to find enough “exact” reference points within the modern city. building lines could have been changed, streets widened, even entire blocks have disappeared in modern urban renewal campaigns. especially for the older backstreet areas this could be a problem since they were mostly redeveloped in the 19th and 20th century.
The Historic Street Databaseanother way of putting historic maps into a gis uses the same method as modern
navigation devices. in a car navigation system it is possible to get directions to the corner of that and that street. this is done by having a database of streets that is com-piled by line elements over the center lines of the street. these elements are individual gis objects spanning from crossroad to crossroad (tav. viib). this way one street can consist of multiple objects with the street name as a common data field. this way it is possible to query on two names, which have one point in common; the corner of the two streets. vectorizing a historic map this way not only gives the possibility to link descriptive data to exact geographical positions, it also is a relatively quick way to digitize maps.
a secondary advantage is that this street map is linked to the modern street data-base on which you can use a lot of crossroads as main reference points. redeveloped areas can therefore be reconstructed by pinpointing the crossroads around it and drawing the streets on the historic map relative to these boundary points. a compa-rable method was used for the project Locating London’s Past. 6.
we now have a database of streets of one particular historic map. to this set we can add data such as modern, and if known, historic street names. we also can add chronological data. in the historic street database we built for this project two time fields were created: one field for the terminus post quem, the date the street appeared on a map for the first time, and one for the terminus ante quem, the date the street stopped appearing. for streets still in existence the end date is set into the future. now several historic maps can be put into the same database. the result is a maze of lines, but with a simple query a street map of a specific year can be constructed. every street on this map has a modern name (if still in existence) and one or more alternative (historical) names. using the fixed crossroad nodes from this gis database, it was quite easy to georeference the distribution maps of the auctioned plots and link the socio-economic data from the auction books to them.
Reconstructing city plans with the Historic Street Databasealthough the historic street database can be used as a tool to link archival data to
a map, it is hardly a city map itself. it can be used to give a street layout of a city for a specific year, but it depicts only the centerlines of the streets. in order to use it as a tool to create historic street maps, another data field needs to be added. in this field every
6 location london’s past: http://www. locatinglondon. org/.
8 Jaap EvErt abrahamsE-mEnnE Kosian
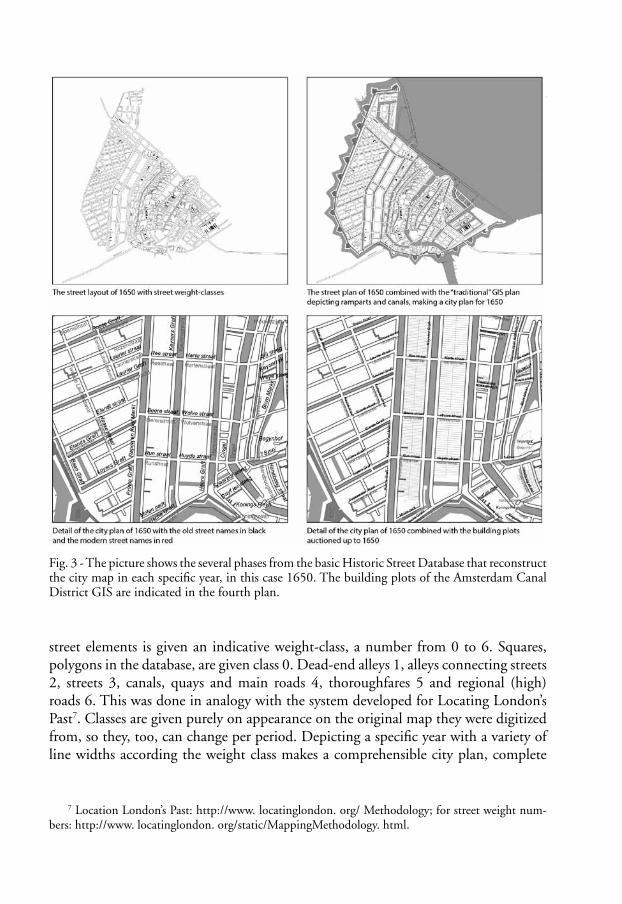
street elements is given an indicative weight-class, a number from 0 to 6. squares, polygons in the database, are given class 0. dead-end alleys 1, alleys connecting streets 2, streets 3, canals, quays and main roads 4, thoroughfares 5 and regional (high) roads 6. this was done in analogy with the system developed for locating london’s past7. classes are given purely on appearance on the original map they were digitized from, so they, too, can change per period. depicting a specific year with a variety of line widths according the weight class makes a comprehensible city plan, complete
7 location london’s past: http://www. locatinglondon. org/ methodology; for street weight num-bers: http://www. locatinglondon. org/static/mappingmethodology. html.
fig. 3 - the picture shows the several phases from the basic historic street database that reconstruct the city map in each specific year, in this case 1650. the building plots of the amsterdam canal district gis are indicated in the fourth plan.
plotting amsterdam. new techniques for research of urban development 9
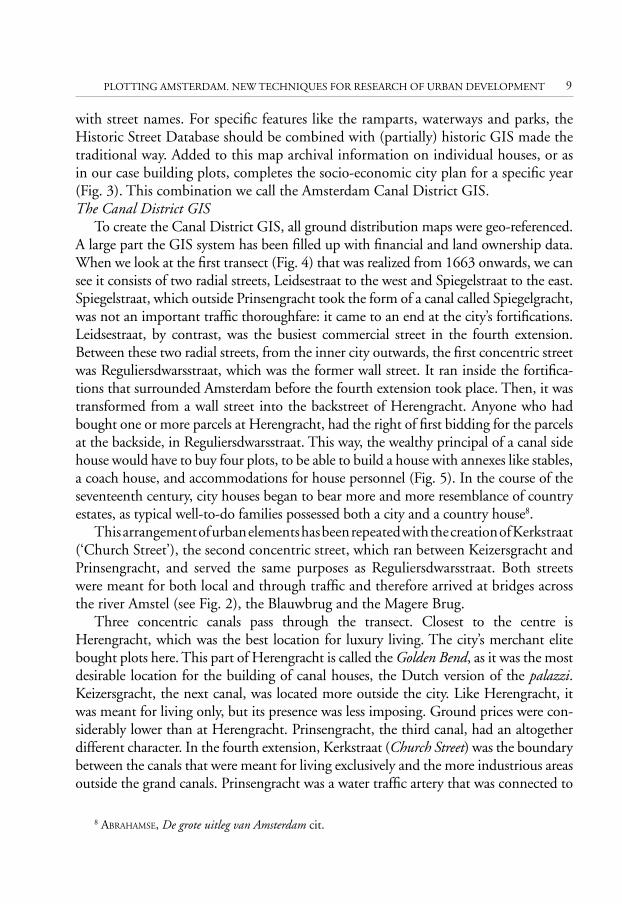
with street names. for specific features like the ramparts, waterways and parks, the historic street database should be combined with (partially) historic gis made the traditional way. added to this map archival information on individual houses, or as in our case building plots, completes the socio-economic city plan for a specific year (fig. 3). this combination we call the amsterdam canal district gis. The Canal District GIS
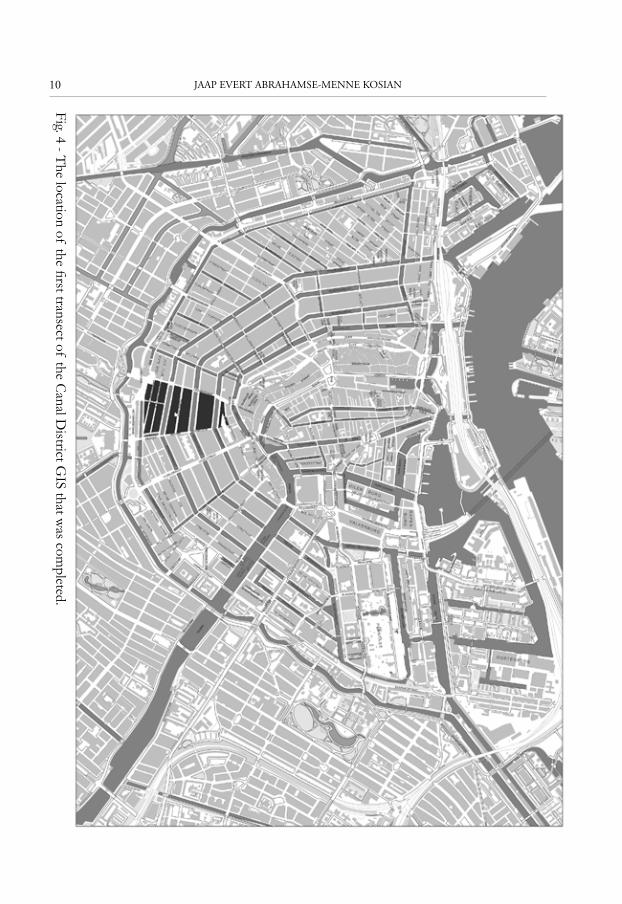
to create the canal district gis, all ground distribution maps were geo-referenced. a large part the gis system has been filled up with financial and land ownership data. when we look at the first transect (fig. 4) that was realized from 1663 onwards, we can see it consists of two radial streets, leidsestraat to the west and spiegelstraat to the east. spiegelstraat, which outside prinsengracht took the form of a canal called spiegelgracht, was not an important traffic thoroughfare: it came to an end at the city’s fortifications. leidsestraat, by contrast, was the busiest commercial street in the fourth extension. between these two radial streets, from the inner city outwards, the first concentric street was reguliersdwarsstraat, which was the former wall street. it ran inside the fortifica-tions that surrounded amsterdam before the fourth extension took place. then, it was transformed from a wall street into the backstreet of herengracht. anyone who had bought one or more parcels at herengracht, had the right of first bidding for the parcels at the backside, in reguliersdwarsstraat. this way, the wealthy principal of a canal side house would have to buy four plots, to be able to build a house with annexes like stables, a coach house, and accommodations for house personnel (fig. 5). in the course of the seventeenth century, city houses began to bear more and more resemblance of country estates, as typical well-to-do families possessed both a city and a country house8.
this arrangement of urban elements has been repeated with the creation of Kerkstraat (‘church street’), the second concentric street, which ran between Keizersgracht and prinsengracht, and served the same purposes as reguliersdwarsstraat. both streets were meant for both local and through traffic and therefore arrived at bridges across the river amstel (see fig. 2), the blauwbrug and the magere brug.
three concentric canals pass through the transect. closest to the centre is herengracht, which was the best location for luxury living. the city’s merchant elite bought plots here. this part of herengracht is called the Golden Bend, as it was the most desirable location for the building of canal houses, the dutch version of the palazzi. Keizersgracht, the next canal, was located more outside the city. like herengracht, it was meant for living only, but its presence was less imposing. ground prices were con-siderably lower than at herengracht. prinsengracht, the third canal, had an altogether different character. in the fourth extension, Kerkstraat (Church Street) was the boundary between the canals that were meant for living exclusively and the more industrious areas outside the grand canals. prinsengracht was a water traffic artery that was connected to
8 abrahamsE, De grote uitleg van Amsterdam cit.
10 Jaap EvErt abrahamsE-mEnnE Kosian
Fig. 4 - The location of the first transect of the C
anal District G
IS that was com
pleted.
plotting amsterdam. new techniques for research of urban development 11
the iJ sea-branch on both the west and east sides of the city, via locks in the sea-dykes. this canal was not meant for luxury living, but for trade and industry. there was no need for gardens. warehouses always occupied the full surface area of the building lots. so many blocks are fully built-in, without much space between buildings.
beyond prinsengracht was a mixed-use district, meant for small-sized residences and many types of industry. the layout of blocks and streets was small-scaled, com-pared to the canal ring area, but quite spacious in comparison with the cramped inner city. outside this mixed-use district, just within the city’s fortifications, ran lijnbaansgracht (Rope-yard Canal), named after the rope-yards that were situated
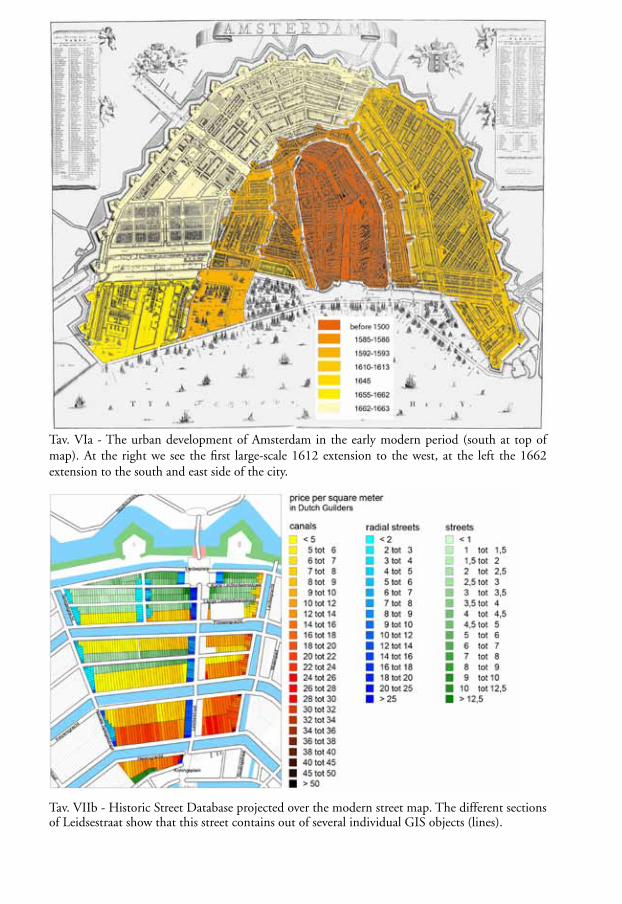
tav. viia shows plot sizes in the transect. there is a clear relation between plot sizes and their prescribed land use. the largest building parcels are located at herengracht and Keizersgracht. in the elaborate functional setup of the fourth extension, these two canals were meant for luxury housing for the city’s elite. the most prominent feature was a huge garden, situated at the back of the house. layout of these gardens was en-forced by regulations: at the canals, nobody had the right to build anything more than 100 feet behind the building line. this way, large-scale continuous garden areas would come into existence on the inside of the building blocks. the need for large houses and large gardens accounts for the large parcel measurements. beyond prinsengracht, many small parcels were laid out, for both middle-class housing and all kinds of small-scale enterprises. these grounds were meant to be affordable, especially to the people who had been forced to leave their houses en grounds because of the city extension9.
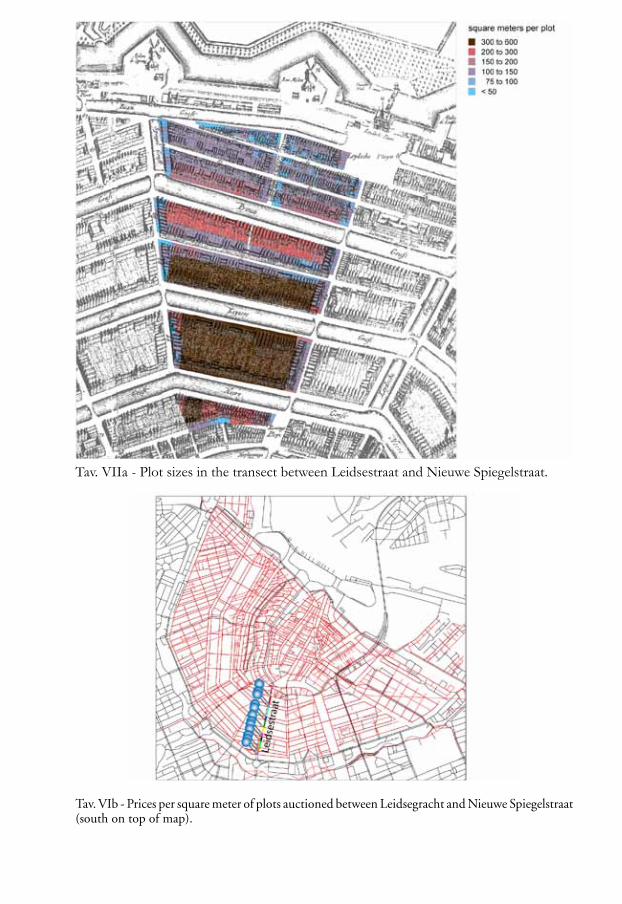
when we look into the prices that were paid for plots (tav. vib), first of all it be-comes clear that location is a determining factor. plot prices were highest near the city
9 Ibidem.
fig. 5 - the layout of a typical canal block with backstreet and radial streets, and the distribution of buildings.
12 Jaap EvErt abrahamsE-mEnnE Kosian
centre and fell as they were located closer to the city’s borders. when we take a look into prices per square meter, it also becomes clear that the plot price is determined by the location of a plot within the entity of the canal or street. but it also becomes clear that, before we analyse ground prices, the transect should be divided up, so that only units are compared that are actually comparable. for instance, the large parcels on herengracht were meant for luxury housing and gardens. prices per unit for plots on herengracht were the highest, despite the fact that a large part of these plots could not be built upon. comfort, space and presentability were the main qualities, while beyond prinsengracht, the attention was focussed on affordability and functional flex-ibility. in short, parcels on herengracht were meant for showing off and ostenta-tiously spending money on architecture. they were an expression of consumption, while parcels beyond prinsengracht were meant as a means of production. therefore, both function and location should be part of the equation.
in tav-vib, three distinct types of plots are indicated in different ranges of colour-ing: the first type, indicated in red, orange and yellow, are located on the canals. the second type, indicated in green, are located in streets and the third type, indicated in blue, are located at the main radial streets, i. e. the shopping and commerce streets. this classification of different types of building plots gives insights into the price-making forces. we see that the green-coloured building plots, the ones that were meant for the city’s middle class and for industry, are priced on the basis of accessibil-ity. the influence of the presence of the main radial street, leidsestraat (on the right side) becomes clear, as ground prices raise as plots lie closer to this main traffic route. the other radial street, spiegelstraat, must have been a busy street, but no thorough-fare, for it ended at the city’s fortifications. its influence on ground prices was by no means as strong as that of leidsestraat.
the parcels in the radial streets themselves (in blue) were used for shops. they should be considered as commercial real estate, bought by entrepreneurs. the main price-making force for this type of building plot was the amount of traffic that went by the store fronts to be built there. the main factor was visibility. that accounts for the corner plots being the costliest building grounds of the transect, and probably of the fourth extension as a whole. the corners of radial streets and canals have ever since been the best shop locations of the canal ring district.
anyone who bought a parcel of land at an auction, was entitled to buy the ad-jacent parcel for the same price. especially on herengracht and Keizersgracht, but also on prinsengracht, many plots were bought in pairs, with the obvious intention of building a large canal house. on the radial streets, most plots were sold separately. this might be explained from the relatively high land prices and the most efficient use of floor area for retail purposes. these plots were used by craftsmen and shopkeepers, who generally owned smaller capitals than the buyers on the grand canals.
from these observations, we can conclude that research of ground prices yields
plotting amsterdam. new techniques for research of urban development 13
insights not only into economic history. it shows where and how the profits that were made in trade and industry were reinvested in real estate. apart from that, it also clari-fies the functioning of the early modern city. the value of land shows which plots are most in demand on the urban micro-scale of streets, canals and squares, and about their use. it gives insights into the locations and spatial dynamics of retail trade, urban residences and small business.
at a later stage, the canal district gis will be compared with gis-based data from the first modern land register, which was created in the 1830s, and with modern data, which are managed by the amsterdam bureau of research and statistics10. this way, the dynamics of the real estate market and the functioning of the city can be monitored over time, when the plots are built-on.
10 http://www. hisgis. nl; amsterdam bureau of research and statistics: www. os. amsterdam. nl/english/.
Tav. VIa - The urban development of Amsterdam in the early modern period (south at top of map). At the right we see the first large-scale 1612 extension to the west, at the left the 1662 extension to the south and east side of the city.
Tav. VIIb - Historic Street Database projected over the modern street map. The different sections of Leidsestraat show that this street contains out of several individual GIS objects (lines).
Tav. VIIa - Plot sizes in the transect between Leidsestraat and Nieuwe Spiegelstraat.
Tav. VIb - Prices per square meter of plots auctioned between Leidsegracht and Nieuwe Spiegelstraat (south on top of map).