ADA: an open-source software platform for plotting and ...
12
Full Terms & Conditions of access and use can be found at https://www.tandfonline.com/action/journalInformation?journalCode=tapy20 Applied Phycology ISSN: (Print) (Online) Journal homepage: https://www.tandfonline.com/loi/tapy20 ADA: an open-source software platform for plotting and analysis of data from laboratory photobioreactors Lydia J. Mapstone, Henry N. Taunt, Jing Cui, Saul Purton & Tom G. R. Brooks To cite this article: Lydia J. Mapstone, Henry N. Taunt, Jing Cui, Saul Purton & Tom G. R. Brooks (2022) ADA: an open-source software platform for plotting and analysis of data from laboratory photobioreactors, Applied Phycology, 3:1, 16-26, DOI: 10.1080/26388081.2021.2023632 To link to this article: https://doi.org/10.1080/26388081.2021.2023632 © 2022 The Author(s). Published by Informa UK Limited, trading as Taylor & Francis Group. View supplementary material Published online: 07 Feb 2022. Submit your article to this journal Article views: 101 View related articles View Crossmark data
-
Upload
khangminh22 -
Category
Documents
-
view
2 -
download
0
Transcript of ADA: an open-source software platform for plotting and ...

Full Terms & Conditions of access and use can be found athttps://www.tandfonline.com/action/journalInformation?journalCode=tapy20
Applied Phycology
ISSN: (Print) (Online) Journal homepage: https://www.tandfonline.com/loi/tapy20
ADA: an open-source software platform forplotting and analysis of data from laboratoryphotobioreactors
Lydia J. Mapstone, Henry N. Taunt, Jing Cui, Saul Purton & Tom G. R. Brooks
To cite this article: Lydia J. Mapstone, Henry N. Taunt, Jing Cui, Saul Purton & Tom G. R. Brooks(2022) ADA: an open-source software platform for plotting and analysis of data from laboratoryphotobioreactors, Applied Phycology, 3:1, 16-26, DOI: 10.1080/26388081.2021.2023632
To link to this article: https://doi.org/10.1080/26388081.2021.2023632
© 2022 The Author(s). Published by InformaUK Limited, trading as Taylor & FrancisGroup.
View supplementary material
Published online: 07 Feb 2022. Submit your article to this journal
Article views: 101 View related articles
View Crossmark data

ADA: an open-source software platform for plotting and analysis of data from laboratory photobioreactorsLydia J. Mapstone a, Henry N. Taunt a, Jing Cui a, Saul Purton a and Tom G. R. Brooks b
aAlgal Research Group, Department of Structural and Molecular Biology, University College London, London, UK; bUnited Kingdom of Great Britain and Northern Ireland
ABSTRACTAlgal biotechnology has received significant attention over the past two decades in fields ranging from biofuels to cosmeceuticals. However, the development of domesticated or genetically engineered microalgal strains for commercial applications depends on accurate and reliable growth data. To this end, several companies have developed lab-scale photobioreactors (PBRs) that enable precision control of conditions and automated growth recording. Whilst the transition from manual control of conditions and measurements to automated systems has allowed research-ers to greatly improve the accuracy and scope of cultivation experiments, it has also presented novel challenges. The most pertinent of these being the analysis of the copious quantities of data produced. A standard PBR experiment can contain tens or even hundreds of thousands of data points, and often features outliers, noise, and a requirement for datasets to be calibrated with a standard curve or merged with replicates. Furthermore, complex analysis of multiple curves may be required in order to extract information such as the gradient or fit to a growth model. This can be laborious, time consuming and is not standardized between research groups. Proprietary software provided with most PBRs tends to lack these more advanced features and is typically unable to process data from other PBR manufacturers. To address these issues, we have developed the Algal Data Analyser (ADA), an open-source software platform providing the tools to rapidly plot and analyse microalgal data. ADA can simultaneously interpret datasets from three major PBR suppliers (Algenuity, Industrial Plankton, Photon Systems Instruments), and can also incorporate data from manual readings. Users can rapidly produce standardized, publication ready plots, and analyse multiple growth curves in parallel. Future iterations of ADA will include compatibility with datasets from other PBR suppliers as they become available, with the aim of making it a universal platform for all PBR data.
ARTICLE HISTORY Received 28 September 2021 Accepted 19 December 2021
KEYWORDS Cyanobacteria; data analysis software; growth curves; microalgae; microalgal cultivation; photobioreactors
1. Introduction
The past two decades have seen significant interest in the industrial application of microalgae (i.e., unicellular eukaryotic algae and cyanobacteria) as part of the grow-ing bioeconomy (Fabris et al. 2020; Castiglia, Landi, & Esposito, 2021). These photosynthetic microorganisms offer the potential for rapid, low-cost and sustainable production of a wide range of natural and recombinant compounds using simple inputs of light, CO2 and basic nutrients, but without the requirement for arable land. Microalgae encompass hundreds of thousands of spe-cies spread across the Tree of Life, and are adapted to growth in almost all habitats on the planet (Guiry, 2012; Malavasi, Soru, & Cao, 2020). Microalgae therefore represent a rich, but largely untapped resource of nat-ural compounds with potential as bioactives, pigments, polymers, and commodity biochemicals (Abu-Ghosh, Dubinsky, Verdelho, & Iluz, 2021; Balasubramaniam,
Gunasegavan, Mustar, Lee, & Mohd Noh, 2021; Madadi, Maljaee, Serafim, & Ventura, 2021). Moreover, recent advances in genetic engineering tech-nologies combined with ever-increasing ‘omics data now open the door to designer strains engineered for light-driven synthesis of a myriad of commercially important recombinant proteins or novel metabolites (Fabris et al. 2020; Liu et al., 2021).
Algal biotechnology studies have been conducted at all levels of the value chain, ranging from high-volume, low-value products such as biofuels and feed/food ingredients (Khan, Shin, & Kim, 2018), through speci-ality compounds such as oleochemicals and isoprenoids (Sebesta & Peebles, 2020; Veetil, Angermayr, & Hellingwerf, 2017) and nutraceuticals (Kratzer & Murkovic, 2021), all the way to low-volume, high- value products such as recombinant therapeutic
CONTACT Saul Purton [email protected] data for this article can be accessed here
APPLIED PHYCOLOGY 2022, VOL. 3, NO. 1, 16–26 https://doi.org/10.1080/26388081.2021.2023632
BritishPhycologicalSocietyUnderstanding and using algae
© 2022 The Author(s). Published by Informa UK Limited, trading as Taylor & Francis Group. This is an Open Access article distributed under the terms of the Creative Commons Attribution License (http://creativecommons.org/licenses/by/4.0/), which permits unrestricted use, distribution, and reproduction in any medium, provided the original work is properly cited.
proteins, which have been successfully expressed in Chlamydomonas reinhardtii and other algal platforms (Dyo & Purton, 2018; Rosales-Mendoza et al., 2020). Despite the orders-of-magnitude differences in the bio-mass volumes needed for different products, a common feature is the requirement for detailed knowledge of the growth parameters for each chosen algal strain. For large volume systems, cultivation will typically involve growth outdoors using open ponds or extensive tubular photobioreactors (PBRs) (Borowitzka, 1999) so it is essential to know how a culture will respond to daily and seasonal environmental changes. Small volume platforms will routinely involve indoor cultivation using high precision PBRs that are fitted with artificial illumination and capable of very tight control over growth parameters (Kirnev, Carvalho, Vandenberghe, Karp, & Soccol, 2020). Here, detailed data is required to understand how growth performance and product yield can be optimized in the bioreactor in order to maximize productivity.
Traditionally, laboratory studies of microalgal growth parameters have been conducted using conven-tional systems such as shake flasks in orbital incubators, magnetically stirred reactors, bubble columns, and scaled down 96-well plate systems (Fields, Ostrand, & Mayfield, 2018). Although effective for many types of experiment such as novel strain identification and basic optimization of culture conditions (Pereira et al., 2011; Zhao et al., 2018), these manual cultivation platforms lack the programmable features needed to model com-plex environmental conditions, or the resolution and accuracy of data to precisely fine-tune industrial pro-cesses (Daneshvar et al., 2021). As a result, researchers are increasingly moving towards automated and pro-grammable PBR systems. These can take the form of benchtop or small pilot-scale reactors where culture conditions can be modelled on real-world data, or can be data collection modules that are attached to active production platforms. In either case, output readings such as data on optical density of the culture, tempera-ture, pH, dissolved oxygen, lighting and fluorescence are taken automatically, sometimes as often as every 10 sec. Compared to manual measurements which might be taken every few hours, this represents a massive improvement in resolution of data, but also presents a challenge for the analysis of such data which can conceivably reach into the hundreds of thousands of discrete data points.
With such large datasets even traditionally straight- forward processes like plotting the data on a graph become difficult; standard consumer software packages such as Microsoft Excel can struggle when dealing with so much data leading to instability and crashes. More
complex processes such as noise reduction and statisti-cal analysis are also not normally available on such programs. Specialist software such as R and Matlab are specifically designed to deal with large amounts of data so perform much better. However, this is typically at the cost of a user-friendly experience resulting in a steep learning curve. Even for users proficient in such lan-guages, statistical analysis such as fitting data to models often requires highly specific data analysis scripts to be written for each experiment. This takes considerable time, and this frequently results in analytical differences between (and even within) research groups.
Commercial PBRs are normally shipped with pro-prietary software for controlling growth conditions and experimental parameters, as well as real-time data visua-lization and analysis. Such software is typically limited in scope and is only compatible with data from the PBR in question. The closed, proprietary nature of such packages also prevents the addition of further features and prohibits the direct cross-platform comparison of data.
Here we present a novel, free, and open-source soft-ware application designed to simplify and standardize the processing and analysis of microalgal growth data produced from PBRs. The Algal Data Analyser (ADA) software is compatible with data formats from several commercially available PBRs, as well as manually col-lected data, and is easily extendable to new formats. The software combines the ease-of-use of consumer- orientated products, with the computational and statis-tical power of dedicated packages, all while maintaining an algal focus.
In the following section we detail the design and development of the software, and in section 3 we illus-trate the usage and applications of ADA.
2. Software design and development
2.1. ADA implementation
ADA was developed with the Python programming language, chosen for its high-quality scientific packages, wide adoption and ease of use for future extensions by new collaborators. The Graphical User Interface (GUI) components were created using the PyQt package, which provides bindings to the Qt toolkit allowing for cross-platform support with no extra configuration. The data processing and analysis tools were developed using the NumPy array proces-sing package (Harris et al., 2020) and the SciPy scientific computing package (Virtanen et al., 2020). The Matplotlib plotting library (Hunter, 2007) was used for data visualization.
APPLIED PHYCOLOGY 17
ADA can be installed as a desktop application, with installers provided for Mac OS 10.12–10.15 and Windows 10 so that no knowledge of program-ming is required for general users. For operating systems (OS) that do not have an installer available, it is also possible to run ADA directly from the source code, available on GitHub (Brooks, 2021). Python is an interpreted language so there is no OS specific compilation process, and a convenience script is provided so that the application can be run with only the Python3 interpreter and the pip package manager needing to be pre-installed. This also allows users with some programming experience to easily modify and extend the software.
2.2. Application design
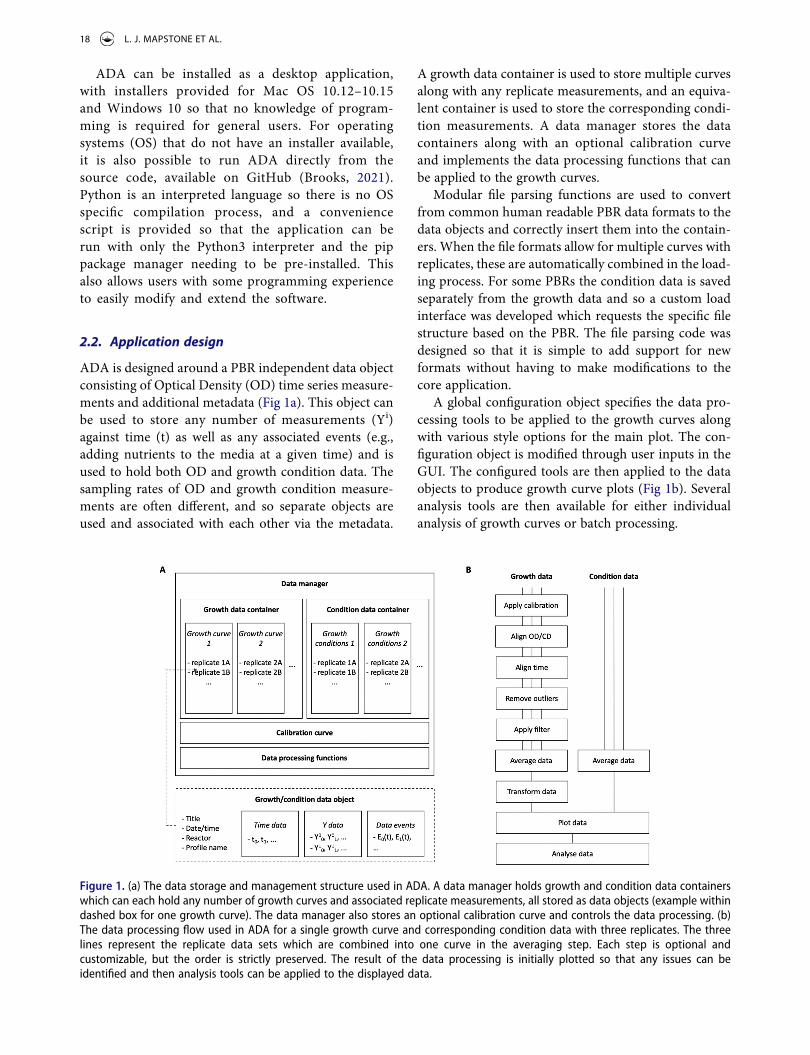
ADA is designed around a PBR independent data object consisting of Optical Density (OD) time series measure-ments and additional metadata (Fig 1a). This object can be used to store any number of measurements (Yi) against time (t) as well as any associated events (e.g., adding nutrients to the media at a given time) and is used to hold both OD and growth condition data. The sampling rates of OD and growth condition measure-ments are often different, and so separate objects are used and associated with each other via the metadata.
A growth data container is used to store multiple curves along with any replicate measurements, and an equiva-lent container is used to store the corresponding condi-tion measurements. A data manager stores the data containers along with an optional calibration curve and implements the data processing functions that can be applied to the growth curves.
Modular file parsing functions are used to convert from common human readable PBR data formats to the data objects and correctly insert them into the contain-ers. When the file formats allow for multiple curves with replicates, these are automatically combined in the load-ing process. For some PBRs the condition data is saved separately from the growth data and so a custom load interface was developed which requests the specific file structure based on the PBR. The file parsing code was designed so that it is simple to add support for new formats without having to make modifications to the core application.
A global configuration object specifies the data pro-cessing tools to be applied to the growth curves along with various style options for the main plot. The con-figuration object is modified through user inputs in the GUI. The configured tools are then applied to the data objects to produce growth curve plots (Fig 1b). Several analysis tools are then available for either individual analysis of growth curves or batch processing.
Figure 1. (a) The data storage and management structure used in ADA. A data manager holds growth and condition data containers which can each hold any number of growth curves and associated replicate measurements, all stored as data objects (example within dashed box for one growth curve). The data manager also stores an optional calibration curve and controls the data processing. (b) The data processing flow used in ADA for a single growth curve and corresponding condition data with three replicates. The three lines represent the replicate data sets which are combined into one curve in the averaging step. Each step is optional and customizable, but the order is strictly preserved. The result of the data processing is initially plotted so that any issues can be identified and then analysis tools can be applied to the displayed data.
18 L. J. MAPSTONE ET AL.

2.3. Data processing tools
The data processing tools configured through the GUI are used to prepare the growth data for producing plots or batch-processing the data by applying transformations, reducing statistical noise and removing outliers in the data from systematic errors in the PBRs. If a calibration/ standard curve is provided (i.e., a mapping of OD to calibrated optical density (CD)), the calibration is applied by taking the measured OD and interpolating between the two closest data points in the standard curve to find the corresponding CD. If the OD is below or above the range of the standard curve, a one-degree polynomial fit of the first or last two standard curve points is used to estimate the CD.
Measurement and PBR calibration errors can result in the misalignment of multiple growth curves in terms of time and/or OD. These offsets can be corrected by shift-ing all of the readings by t0i ¼ ti � t0 where t0 is the first time point in the growth curve and OD0i ¼ ODi � OD0 þ
ODstart where ODstart is the user defined starting OD. Comparisons of growth rates at different phases are facili-tated by the ability to align different curves in time at specific OD readings, X, by shifting the time points by t0i ¼ ti � tOD¼X.
The next step in the pipeline is the removal of outliers from erroneous PRB readings which can affect noise filtering and model fitting. An algorithm was developed for the automatic removal of measurement errors that are seen as large spikes in the data. The mean difference between data points is calculated as
D ¼PN� 1
i¼0 jODi � ODiþ1j
N � 1
where N is the total number of data points. A point is removed if the difference from the previous data point is greater than X · D, where X is a threshold multiplier with a default value of 20 that can be modified by the user. It is also possible to remove any points in unphysical regions, such as OD < 0, by specifying minimum and maximum OD values.
It is also possible to reduce the statistical noise in the data by applying a Savitsky-Golay filter (Savitzky & Golay, 1964). This filter works by fitting an N degree polynomial to a given time window around each data point and then replacing the data point with the fit result at that time. The default values for the degree of the polynomial and size of the time window in ADA have been shown to work well on microalgal growth data, but they are also configurable in the application.
When replicate measurements are added, the data are averaged and the resultant means and standard deviations are calculated for each time point. If the sampling rate or time offset differs between replicates, the time points of the first curve are used and the equivalent replicate points are obtained by interpolating the replicate data at that time. It is also possible to average both the growth and condition data over a given time window for single and replicate measurements. In this case, both the mean time and Y reading are calculated along with the standard deviation of the Y readings in each window.
After calibration, statistical and systematic uncertainty reduction, and averaging, it is also possible to transform the OD readings to lnðOD=OD0Þ in order to visually compare the exponential growth phase of different curves. In the case where the data have been averaged, the stan-dard deviations are transformed by σ0OD ¼ σOD=OD.
2.4. Data analysis tools
There are a number of data analysis tools that can be applied to either the raw or processed data to extract growth model parameters. An interactive cursor tool allows users to inspect the exact (ti, Yi) coordinates and measure gradients, m, along the growth curves as m ¼ Y1 � Y0ð Þ= t1 � t0ð Þ. The cursor can also be used to display annotated data events on the curves.
Growth models can be fitted to the curves using the SciPy curve_fit (Virtanen et al., 2020) function. The cur-rently supported growth models are:
● Linear: OD ¼ p1 � t þ p0● Quadratic: OD ¼ p2 � t2 þ p1 � t þ p0● Exponential: OD ¼ p0 � exp p1 � tð Þ
● Zwietering, Jongenburger, Rombouts, & Van’t Riet (1990): OD ¼ OD0 þ
A� OD01þexp 4�μ=Að Þ� λ� tð Þþ2ð Þ
, where OD0 is the starting absorbance, A is the biomass yield, μ is the maximum growth rate and λ is the lag time.
A generic growth model object is used to interface with the data manager which makes it trivial to add new models as they are needed.
The growth parameters extracted from fits can be used to identify correlations with changes in growth conditions. When multiple curves are loaded with their corresponding varied condition data, the user can select the fit parameter and condition to study, as well as the time range over which to perform the fit. The para-meters will be calculated for each curve along with the
APPLIED PHYCOLOGY 19

average of the condition measurements over the same range. The Pearson correlation coefficient between the parameter, X, and the condition, Y, is then calculated as
ρ ¼covðX;YÞ
σX � σY
where cov X;Yð Þ is the covariance between X and Y, and the σX=Y are the standard deviations of X and Y.
3. Usage and applications of ADA
3.1. The user interface
The ADA user interface is separated into several tabs for ease of access to various configuration options without crowding the window with information. The first win-dow shown to the user is the “Plotting” tab (Fig 2). This is where data is uploaded, plotted and saved. This win-dow also contains tools for conducting data analysis. The user can then begin editing the raw plot by switch-ing to the tabs at the top labelled “Axis”, “Data”, “Legend”, “Style”, “Stats” and “Advanced”.
ADA’s functionality can be split into two compo-nents, data processing and data analysis. The data pro-cessing tools enable the user to rapidly plot the raw output from the PBR and create graphs to a high stan-dard ready for publication. The data analysis tools can be used to extract quantitative information from the growth curve/s loaded into the software. The following sections showcase the processing and analysis functions.
3.2. Displaying data with ADA
3.2.1. Loading dataCurrently ADA can support data from commercial PBRs produced by Algenuity, Industrial Plankton and Photon System Instruments. Each of these data-sets can be uploaded separately, or in parallel if the user wants to show growth curves from different PBRs on the same graph. Alternatively, if the user has growth data which was recorded manually using a laboratory spectrophotometer, they can download a template Comma Separated Variable (CSV) file directly from ADA and use spreadsheet software to input the readings before uploading them to ADA. This template also allows the user to add additional growth condition data such as light intensity, pH, etc., which can then be uploaded to ADA to produce a plot consistent with the other PBR growth curves. The Algem Pro and Algem HT24 PBRs produced by Algenuity contain separate files for OD readings and condition data. These can be uploaded into ADA separately or simultaneously. Data from the PBRs made by Industrial Plankton and Photon System Instruments is assimilated into single CSV and OpenDocument Spreadsheet Document (ODS) files, respectively. When these files are loaded to ADA the user can quickly separate out the optical density data from the condition data if they wish to produce plots showing only one of these datasets. Datasets from different PBRs can be uploaded and displayed together on the same plot for comparison.
Figure 2. ADA’s main window used for uploading datasets, plotting and saving graphs with additional tools for analysis.
20 L. J. MAPSTONE ET AL.

3.2.2. Loading standard curves for data calibrationAn issue of using OD as a measurement of growth in PBRs is the non-linearity of readings based on light scattering as algal cultures reach high cell densities. Here, almost all of the actinic light used for measure-ment in the spectrophotometer can be blocked by the sample resulting in marginal increases in OD values as the density increases further. Consequently, a culture in late exponential phase of growth might give an OD750 reading of 4.0, but a subsequent doubling of the cell density might give a new reading of 4.2, rather than the expected value of 8.0 as illustrated in Fig 3a. Some PBRs combat this by enabling the user to set up a standard curve; during the first growth experiment the user takes samples and either takes note of the cell count or dilutes the culture and records the reading on
a laboratory spectrophotometer. These can then be recorded next to the OD reading from the PBR spec-trophotometer and therefore allow adjustment of the OD to the actual culture density.
If the user has however conducted growth experi-ments without previously setting up a standard curve, or the first standard curve they produced was not accu-rate, or the PBR does not have a capacity to compute a standard curve, the growth data will be unreliable when the microalgal culture reaches the late exponential or stationary growth phase. ADA makes it possible for the user to retrospectively add a standard curve to the loaded data to address this potential problem (Fig 3). ADA will accept a .CSV file which contains one column for the cells/mL and the next column containing the associated OD reading from the PBR.
Figure 3. Standard curves can be produced by the user and loaded into ADA. (a) an example of a standard curve table which can be uploaded into ADA and has been plotted. (b) An example of raw OD data (left) and the same data when it has been calibrated with the standard curve (right).
Figure 4. Steps the user can take to clean noisy data. (a) PBR data can occasionally contain outliers. (b) Outliers can be removed by selecting ADA’s automatic removal function (in this example) or manually setting a range. (c) Data can also be smoothed by using the Savitzky–Golay smoothing filter.
APPLIED PHYCOLOGY 21

3.2.3. Cleaning dataPBR data can often contain outliers due to a lack of homogeneity in a cell culture or a technical glitch during recording of a data point (Fig 4a). The for-mer is a particular problem with filamentous or colonial species of microalgae, but can also arise due to cell clumping within cultures or stochastic variations in the degree of cell settlement (if mixing of the culture is paused when taking a reading). The user can either apply the “auto-remove outliers” algorithm (Section 2.3) or specify the OD range where they know outliers will fall (Fig 4b). To reduce the statistical noise in datasets the user can apply the Savitzsky–Golay smoothing filter (Savitzky & Golay, 1964), also described in Section 2.3 (Fig 4c).
3.2.4. Loading replicate datasetsManually combining replicate data can be time consum-ing and error prone. ADA allows the user to rapidly combine data set replicates either from PBRs designed to take replicates (such as Algenuity’s Algem HT24) or from separate runs of individual reactors. ADA uses standard deviation as the default for showing variation between the datasets, and the user can switch to show standard error of the mean. The user can choose to
display the variation between replicates in two ways: either by continually shading the area around the mean (Fig 5a), or by using error bars.
3.2.5. Condition dataOne of the primary goals of automated PBRs is to investigate growth under carefully controlled abiotic conditions, such as light intensity, temperature and pH. Therefore, the output of PBRs often contains readings of the set conditions during each run. Whatever the condition data variable, the PBR records can be loaded onto the Y2 axis, which will appear in a drop-down menu allowing the user to rapidly produce plots for each parameter as illustrated in Fig 5b. In cases where the condition data is noisy (e.g., pH or temperature readings), the user can specify a time window over which to average the condition data. For example, if 10 is selected, ADA will take the average of the condition readings every ten hours and display the mean with standard deviation error bars (Fig 5b).
3.2.6. Axes configurationPlot and axis titles and unit labels are set automatically from the input files but can be changed by the user with full support of special characters using LaTeX com-mands. In circumstances where the user wants to plot
Figure 5. Examples of data processing features in ADA applied to microalgal growth data. (a) Replicates can be merged and variation between datasets shown as standard deviation (as in this example) or standard error. (b) Example of how axes can be altered; a condition (Y2) axis can be added with the data averaged over specified time points and the growth axis can be converted to a log scale. (c) X and Y axis can be rapidly changed at the beginning of runs for situations where the PBR software has malfunctioned. In this example the OD was adjusted to start at 0 for each growth curve. (d) The style of each plot can be altered. In this example the colour-blind palette was used with the user then changing one line to aqua using a “dashed-dot” line style with a larger font displayed for the labels.
22 L. J. MAPSTONE ET AL.

a specific section of the growth curve, they enter the value range of interest for that particular axis. It can also be helpful to identify the exponential phase in micro-algal growth experiments. To do this the user can apply a logarithmic scale to the OD data, and the linear region will correspond to this phase (Fig 5b).
In some cases, PBR software can mis-align growth plots, either showing parallel growth curves starting at different times, or curves with different starting ODs as a result of measuring errors from starting cultures that are very dilute. ADA allows the user to quickly rectify these mis-alignments by selecting to either align the X (time) axis to 0 or choosing a unit on the Y (growth) axis which was the known starting OD for each of the reactors (Fig 5c). Finally, the X axis units can be quickly changed to show seconds, minutes, hours or days.
3.2.7. Final changes to plot styleLegends for the growth (OD) and condition axis are configured in the Legends window. Some PBR files include extra information such as the date, reactor name and the specified growth conditions (profile) to each dataset. This can be chosen to be part of the legend by selecting which information is required from a drop- down menu by the user. All components of the plot style
(legend/title fonts, text size, line colour, line style and grid overlay) are readily customizable, enabling produc-tion of publication standard graphs (Fig 5d).
3.3. ADA’s data analysis tools
3.3.1. Analysis of individual growth curvesADA allows the user to fit individual growth curves between two user-specified time points using the various growth models described in Section 2.4. Starting predic-tions and upper and lower bounds for the model para-meters can be specified by the user to improve the performance of the fits. The fit result will be overlaid on the growth curve plot and the fitted parameters can be displayed on the plot with their corresponding uncertain-ties. When replicates are used the standard deviations between measurements are included in the fit to improve the parameter estimation.
In addition to the standard mathematical functions (linear, quadratic and exponential), the user can choose to fit the logarithmic Zweitering model to their data (Zwietering et al., 1990). This is a standard model used to compare microbial growth in batch cultures and con-siders the entire sigmoidal curve to calculate growth rate and predict biomass. Cultures of the unicellular
Figure 6. Examples of data analysis possible with ADA. (a) Data can be fitted to line or growth models. Here, the Zweitering growth model (Zwietering et al., 1990) for Synechocystis sp PCC 6803 is fitted to an averaged triplicate growth curve and the fit parameters displayed. (b) Gradients can be measured by the user on individual growth curves. (c) Example dataset analysed to produce Table 1. (d) Example of a correlation plot, showing the maximum growth rate calculated from the Zweitering model against temperature, demonstrating a strong correlation of increased growth rate to increased temperature for Arthrospira platensis.
APPLIED PHYCOLOGY 23

cyanobacterium Synechocystis sp. PCC 6803 were found have a good fit to the Zweitering model (Fig 6a). The authors have also recorded good fits from growth curves of the unicellular green algae Chlorella sorokiniana and Chlamydomonas reinhardtii, and the filamentous cyano-bacterium Arthrospira platensis, demonstrating ADA’s applicability to modelling a wide variety of microalgal species (Supplementary materials, page 12).
Individual growth curves can also be annotated to display the gradient between two time points. This draws a line between the points chosen on the curve, with the gradient indicated on the plot (Fig 6b).
3.3.2. Taking readings from multiple growth datasetsADA can perform batch processing and analysis of multiple plotted growth curves by producing a table displaying multiple measurements (Table 1, Fig 6c) which can be exported as a .CSV file. The fields available for batch processing are:
(1) The reactor name.(2) Growth profile title.(3) The time for a sample to reach to a user specified
OD.(4) The average of a condition variable (e.g., pH)
between two user-specified time points.(5) The exact value of condition data at a user-
specified time point.(6) The fitted parameters and associated uncertain-
ties of a growth model between two user- specified time points.
3.3.3. Creating correlation plotsTo determine whether a condition variable is influencing microalgal growth, it is helpful to examine whether a correlation exists between them. Once the user has determined the best model to fit to their growth datasets, they can use this model to determine the effect of a condition variable which has been changed across mul-tiple runs. For example, if the Zweitering model has been shown to fit well, the user can choose to then plot one of the parameters of the model (such as the maximum growth rate, µ) against the variable of interest (such as
temperature). The Pearson correlation coefficient can then be calculated and displayed to identify potential effects the variable might have on growth (Fig. 6d).
3.4. Using ADA in microalgal research
The overall aim of ADA is to make analysis of the large datasets produced in these PBR systems rapid and uni-form. To date, there is no open-source software which can plot and analyse microalgal growth data to achieve these aims. Rapid analysis is currently difficult to achieve because some PBRs do not contain any plotting software, relying on the user to analyse plots using spreadsheet software. This requires significant data manipulation each time a run is conducted to display plots, and features such as reducing noise, adjusting starting OD and fitting models take a significant length of time to implement. Although some PBRs do come with plotting software, new users need to learn it each time and the software may not come with all the features available in ADA, such as producing correlation plots. In situations where multiple PBRs have been used – for example if a researcher has gone from using a small- scale Algem system to the larger Industrial Plankton PBRs – using uniform plots for publication allows read-ers to compare the presented results. Currently, uniform analysis comparison between PBRs is difficult as each system displays the raw data differently, relying on the user to manually standardize the dataset if they want to display the same style plot or make comparisons between systems. ADA allows users to quickly make plots of the same style using different PBR data and, if required, plot the same growth curve from each PBR onto the same graph.
There are other commercially available lab-scale PBR systems which are not yet compatible with ADA. These include the systems produced by Phenometrics, Xanthella and Infors. In addition, handmade PBRs with data capture capabilities have been developed in many algal groups (e.g., Díaz, Inostroza, & Acién Fernández, 2019; Khichi, Rohith, Gehlot, Dutta, & Ghosh, 2019) and there is an ongoing effort to develop
Table 1. ADA generated table displaying information specified by the user for graph shown in Fig 3c.File 1 2 3 4
Profile Flashing 60 Hz-50DC Flashing 60 Hz-25DC Flashing 60 Hz-10DC Constant LightReactor 13134A 14486B 14486A 12982AGradient of CD at between 0.2 and 0.6 0.019 0.015 0.007 NoneGradient of OD at between 0.4 and 0.6 0.023 0.029 0.016 0.017Time (h) to OD of 0.6 33 29.5 41.5 36.5Average temperature between 25 and 75 h 30.16 29.91 29.95 35.72Average total light between 100 and 150 h 4900 4900 4900 4900Zweitering fit of OD between 0 and 175 h,
parameter: maximum growth rate (µ)0.029 0.019 0.008 0.003
24 L. J. MAPSTONE ET AL.

specialist PBR systems as part of regenerative life sup-port systems for human space exploration (Fahrion, Mastroleo, Dussap, & Leys, 2021). If example datasets for these systems are provided to the authors, compat-ibility can be easily built into later ADA versions. Features of ADA can also be expanded by request, and such requests should be submitted via the ADA GitHub page (Brooks, 2021).
4. Conclusions
Automated lab-scale PBRs are proving to be critical for characterizing new microalgal strains and optimizing their cultivation for both basic research and industrial applications. Various PBR systems are commercially available – from small-scale analytical systems to large- scale production systems – and more are in development. Standardizing the method of presenting and analysing outputs from PBRs will enable the microalgal community to reach their findings and share new information more quickly, as well as lowering the barriers to entry for those new to the field. ADA is a free and open-source software package which will enable this standardization, allowing users to easily master data analysis and produce publica-tion-ready plots from multiple PBRs. New versions of this software can be produced to provide support for new PBR data formats and add new processing and analysis tools when requested by researchers. Details on how to download ADA, together with tutorials on using the software, can be found in the supplementary materials.
Acknowledgments
We thank Photon System instruments and Industrial Plankton for providing example datasets to build ADA. We also thank researchers in our group at UCL and those in the group of Professor Alison Smith (University of Cambridge) who served as beta-testers and provided valuable feedback on the ADA software.
Disclosure statement
No potential conflict of interest was reported by the authors.
Funding
This work was supported by the UK’s Biotechnology and Biological Sciences Research Council under Grants [BB/ J014567/1, BB/R016534/1 and BB/S009825/1], and the European Commission’s Horizon 2020 programme under Grant [H2020 REA 774078].
ORCID
Lydia J. Mapstone http://orcid.org/0000-0003-0410-6825Henry N. Taunt http://orcid.org/0000-0003-3443-9102Jing Cui http://orcid.org/0000-0003-3928-0460Saul Purton http://orcid.org/0000-0002-9342-1773Tom G. R. Brooks http://orcid.org/0000-0003-1684-2221
References
Abu-Ghosh, S., Dubinsky, Z., Verdelho, V., & Iluz, D. (2021). Unconventional high-value products from microalgae: A review. Bioresource Technology, 329, 124895.
Balasubramaniam, V., Gunasegavan, R., Mustar, S., Lee, J. C., & Mohd Noh, M. F. (2021). Isolation of industrial impor-tant bioactive compounds from microalgae. Molecules, 26, 943.
Borowitzka, M. A. (1999). Commercial production of micro-algae: Ponds, tanks, tubes and fermenters. Journal of Biotechnology, 70, 313–321.
Brooks, T. (2021) Algal data analyser. Github. https://github. com/tgrbrooks/ADA
Castiglia, D., Landi, S., & Esposito, S. (2021). Advanced appli-cations for protein and compounds from microalgae. Plants, 10, 1686.
Daneshvar, E., Sik Ok, Y., Tavakoli, S. T., Sarkar, B., Shaheen, S. M., Hong, H., . . . Bhatnagar, A. (2021). Insights into upstream processing of microalgae: A review. Bioresource Technology, 329, 124870.
Díaz, J. P., Inostroza, C., & Acién Fernández, F. G. (2019). Fibonacci-type tubular photobioreactor for the production of microalgae. Process Biochemistry, 86, 1–8.
Dyo, Y., & Purton, S. (2018). The algal chloroplast as a synthetic biology platform for production of therapeutic proteins. Microbiology, 164, 113–121.
Fabris, M., Abbriano, R. M., Pernice, M., Sutherland, D. L., Commault, A. S., Hall, C. C., & Ralph, P. J. (2020). Emerging technologies in algal biotechnology: Toward the establishment of a sustainable, algae-based bioeconomy. Frontiers in Plant Science, 11, 279.
Fahrion, J., Mastroleo, F., Dussap, C., & Leys, N. (2021). Use of photobioreactors in regenerative life support systems for human space exploration. Frontiers in Microbiology, 12, 699525.
Fields, F. J., Ostrand, J. T., & Mayfield, S. P. (2018). Fed-batch mixotrophic cultivation of Chlamydomonas reinhardtii for high-density cultures. Algal Research, 33, 109–117.
Guiry, M. D. (2012). how many species of algae are there? Journal of Phycology, 48, 1057–1063.
Harris, C. R., Millman, K. J., van der Walt, S. J., Gommers, R., Virtanen, P., Cournapeau, D., & Oliphant, T. E. (2020). Array programming with NumPy. Nature, 585, 357–362.
Hunter, J. D. (2007). Matplotlib: A 2D graphics environment. Computing in Science & Engineering, 9, 90–95.
Khan, M. I., Shin, J. H., & Kim, J. D. (2018). The promising future of microalgae: Current status, challenges, and opti-mization of a sustainable and renewable industry for bio-fuels, feed, and other products. Microbial Cell Factories, 171, 1–21.
APPLIED PHYCOLOGY 25
Khichi, S. S., Rohith, S., Gehlot, K., Dutta, B. C., & Ghosh, S. (2019). Online estimation of biomass, lipid and nitrate dynamic profile using innovative light evolution kinetic model in flat panel airlift photobioreactor for Botryococcus braunii under varying light conditions. Bioresource Technology Reports, 6, 6–14.
Kirnev, P., Carvalho, J., Vandenberghe, L., Karp, S. G., & Soccol, C. R. (2020). Technological mapping and trends in photobioreactors for the production of microalgae. World Journal of Microbiology and Biotechnology, 36, 42.
Kratzer, R., & Murkovic, M. (2021). Food ingredients and nutraceuticals from microalgae: Main product classes and biotechnological production. Foods, 10, 1626.
Liu, D., Liberton, M., Hendry, J. I., Aminian-Dehkordi, J., Maranas, C. D., & Pakrasi, H. B. (2021). Engineering biol-ogy approaches for food and nutrient production by cyanobacteria. Current Opinion in Biotechnology, 67, 1–6.
Madadi, R., Maljaee, H., Serafim, L., & Ventura, S. (2021). Microalgae as contributors to produce biopolymers. Marine Drugs, 19, 466.
Malavasi, V., Soru, S., & Cao, G. (2020). Extremophile micro-algae: The potential for biotechnological application. Journal of Phycology, 56, 559–573.
Pereira, H., Barreira, L., Mozes, A., Florindo, C., Polo, C., Duarte, C. V., . . . Varela, J. (2011). Microplate-based high throughput screening procedure for the isolation of lipid-rich marine microalgae. Biotechnology for Biofuels, 4, 61.
Rosales-Mendoza, S., García-Silva, I., González-Ortega, O., Sandoval-Vargas, J. M., Malla, A., & Vimolmangkang, S. (2020). The potential of algal biotechnology to produce anti-viral compounds and biopharmaceuticals. Molecules, 25, 4049.
Savitzky, A., & Golay, M. J. E. (1964). Smoothing and differ-entiation of data by simplified least squares procedures. Analytical Chemistry, 36, 1627–1639.
Sebesta, J., & Peebles, C. A. (2020). Improving heterologous protein expression in Synechocystis sp. PCC 6803 for alpha-bisabolene production. Metabolic Engineering Communications, 10, e00117.
Veetil, V. P., Angermayr, S. A., & Hellingwerf, K. J. (2017). Ethylene production with engineered Synechocystis sp PCC 6803 strains. Microbial Cell Factories, 16, 34.
Virtanen, P., Gommers, R., Oliphant, T. E., Haberland, M., Reddy, T., Cournapeau, D., . . . Vázquez-Baeza, Y. (2020). SciPy 1.0: Fundamental algo-rithms for scientific computing in Python. Nature Methods, 17, 261–272.
Zhao, Q., Chen, A. N., Hu, S. X., Liu, Q., Chen, M., Liu, L., & Wang, C.-Y. (2018). Microalgal microscale model for microalgal growth inhibition eva-luation of marine natural products. Scientific Reports, 8, 10541.
Zwietering, M. H., Jongenburger, I., Rombouts, F. M., & Van’t Riet, K. (1990). Modeling of the bacterial growth curve. Applied and Environmental Microbiology, 56, 1875–1881.
26 L. J. MAPSTONE ET AL.