Plasma lactate accumulation and distance running performance
7
l"" <J ( MEDICINE AND SCIENCE IN SPORTS Vol. 11, No.4, pp. 338-344, 1979 Plasma lactate accumulation and distance running performance ABSTRACT FARRELL, PETER A., JACK H. WILMORE, EDWARD F. COYLE, JOHN E. BILLING, and DAVID L. COSTILL. Plasma lactate accumulation and distance running performance. Med. Sci. Sports. Vol. 11, no. 4, pp. 338-344, 1979. Laboratory and field assessments were made on eighteen male distance runners. Per- formance data were obtained for distances of 3.2,9.7, 15, 19.3 km (n = 18) and the marathon (n = 13). Muscle fiber composition ex- pressed as percent of slow twitch fibers (%ST), maximal oxygen consumption (V02max), running economy (V02 for a treadmill ve- locity of 268 m/min), and the V02 and treadmill velocity corre- sponding to the onset of plasma lactate accumulation (OPLA) were determined for each subject. %ST (R2: .47), V02max (r2: .83), running economy (r2:.49), V02 in mllkg min corresponding to the OPLA (r2: .91) and the treadmill velocity corresponding to the OPLA (r2:.91) were significantly (p<.O5) related to perform- ance at all distances. Multiple regression analysis showed that the treadmill velocity corresponding to the OPLA was most closely related to performance and the addition of other factors did not significantly raise the multiple R values suggesting that these other variables may interact with the purpose of keeping plasma lactates low during distance races. The slowest and fastest mar- athoners ran their marathons 7 and 3 m/min faster than their treadmill velocities corresponding to their OPLA which indi- cates that this relationship is independent of the competitive level of the runner. Runners appear to set a race pace which al- lows the utilization of the largest possible V02 which just avoids the exponential rise in plasma lactate. MUSCLE FIBER COMPOSITION, RUNNING ECONOMY, VOzMAX Many factors have been identified as having an influ- ence on success in distance running. The observation of significant relationships between Vozmax, fraction of slow twitch fibers, the fraction of Vozmax which can be utilized and performance have implicated these factors as being associated with success in distance running (6,7,8,9,11, 19,42,56,57). Daniels (15) has suggested that running econ- omy may be related to performance, with running econ- omy defined as the oxygen consumption (mllkg min) for a given standardized submaximal treadmill velocity. Several investigations have demonstrated large individual varia- tions in running economy between subjects (14,15,37) yet this factor has not been investigated in terms of perform- ance. Exhaustive exercise of a prolonged duration is charac- terized by relatively low plasma lactate levels (1,7,12,30). Another common finding is that individuals can exercise Submitted for publication December. 1978. Accepted for publication August, 1979. PETER A. FARRELL, JACK H. WILMORE, EDW ARD F. COYLE, JOHN E. BILLING, and DAVID L. COSTILL Exercise and Sport Science Laboratory The University of Arizona Tucson, AZ 85721 up to a certain critical intensity with little or no accumu- lation of lactate in the plasma (16,31,33,44,52). However, when this critical intensity is surpassed, lactate begins to accumulate exponentially (24,44). Costill and Fox (12) have demonstrated that experienced marathoners utilize approximately 75 percent of their Vozmax during their best marathons. Later, Costill et al. (14) demonstrated that experienced runners can utilize approximately 70% of their Vozmax before lactate begins to accumulate in the plasma. . The above findings suggest that many factors are related to success in distance running and that runners may set a race pace which closely approximates the running velocity at which lactate begins to accumulate in the plasma. The present investigation was undertaken to investigate these factors as correlates to performance at several race dis- tances. METHODS Eighteen experienced male distance runners volun- teered to participate in the study. Table 1 summarizes their physical characteristics and responses to maximal ex- ercise. Running experience ranged from one to ten years. Body composition was determined by body density as- sessment using the hydrostatic weighing procedures of Behnke and Wilmore (2). Residual lung volume was deter- mined by the nitrogen dilution technique (54). The Siri (49) equation was used to estimate relative fat from total body density. The procedures of Bergstrom (3) were employed to obtain muscle biopsies from the lateral head of the gas- trocnemius. This muscle was chosen based on the report of Costill et al. (10) that this muscle is metabolically more ac- tive than are the thigh muscles during distance running. Tissue slices were stained by the following procedures: 1) NADHz Tetrazolium Reductase (41), 2) Myosin ATPase, pH 4.3, 4.5, 4.6 pre-incubations (35), and 3)Alpha-Glycer- ophosphate Dehydrogenase (53). The primary stain used for fiber typing was the Alpha-Glycerophosphate Dehy- drogenase stain and when the typing of anyone fiber was questionable the other stains were used as cross references. The mean number of fibers counted per subject was 391 :J:168 SD fibers. 338
Transcript of Plasma lactate accumulation and distance running performance

l""<J
( MEDICINE AND SCIENCE IN SPORTS
Vol. 11, No.4, pp. 338-344, 1979
Plasma lactate accumulation and distancerunning performance
ABSTRACT
FARRELL, PETER A., JACK H. WILMORE, EDWARD F.COYLE, JOHN E. BILLING, and DAVID L. COSTILL. Plasmalactate accumulation and distance running performance. Med.Sci. Sports. Vol. 11, no. 4, pp. 338-344, 1979. Laboratory and fieldassessments were made on eighteen male distance runners. Per-formance data were obtained for distances of 3.2,9.7, 15, 19.3 km
(n = 18) and the marathon (n = 13). Muscle fiber composition ex-pressed as percent of slow twitch fibers (%ST), maximal oxygenconsumption (V02max), running economy (V02 for a treadmill ve-locity of 268 m/min), and the V02 and treadmill velocity corre-sponding to the onset of plasma lactate accumulation (OPLA)were determined for each subject. %ST (R2: .47), V02max (r2:.83), running economy (r2:.49), V02 in mllkg min correspondingto the OPLA (r2: .91) and the treadmill velocity corresponding tothe OPLA (r2:.91) were significantly (p<.O5) related to perform-ance at all distances. Multiple regression analysis showed that thetreadmill velocity corresponding to the OPLA was most closelyrelated to performance and the addition of other factors did notsignificantly raise the multiple R values suggesting that theseother variables may interact with the purpose of keeping plasmalactates low during distance races. The slowest and fastest mar-athoners ran their marathons 7 and 3 m/min faster than their
treadmill velocities corresponding to their OPLA which indi-
cates that this relationship is independent of the competitivelevel of the runner. Runners appear to set a race pace which al-lows the utilization of the largest possible V02 which just avoidsthe exponential rise in plasma lactate.
MUSCLE FIBER COMPOSITION, RUNNING ECONOMY, VOzMAX
Many factors have been identified as having an influ-ence on success in distance running. The observation ofsignificant relationships between Vozmax, fraction of slowtwitch fibers, the fraction of Vozmax which can be utilized
and performance have implicated these factors as beingassociated with success in distance running (6,7,8,9,11,19,42,56,57). Daniels (15) has suggested that running econ-omy may be related to performance, with running econ-omy defined as the oxygen consumption (mllkg min) for agiven standardized submaximal treadmill velocity. Severalinvestigations have demonstrated large individual varia-tions in running economy between subjects (14,15,37) yetthis factor has not been investigated in terms of perform-ance.
Exhaustive exercise of a prolonged duration is charac-terized by relatively low plasma lactate levels (1,7,12,30).Another common finding is that individuals can exercise
Submitted for publication December. 1978.Accepted for publication August, 1979.
PETER A. FARRELL, JACK H. WILMORE,EDW ARD F. COYLE, JOHN E. BILLING, andDAVID L. COSTILL
Exercise and Sport Science LaboratoryThe University of ArizonaTucson, AZ 85721
up to a certain critical intensity with little or no accumu-lation of lactate in the plasma (16,31,33,44,52). However,when this critical intensity is surpassed, lactate begins toaccumulate exponentially (24,44). Costill and Fox (12)have demonstrated that experienced marathoners utilizeapproximately 75 percent of their Vozmax during theirbest marathons. Later, Costill et al. (14) demonstrated that
experienced runners can utilize approximately 70% oftheir Vozmax before lactate begins to accumulate in theplasma. .
The above findings suggest that many factors are relatedto success in distance running and that runners may set arace pace which closely approximates the running velocityat which lactate begins to accumulate in the plasma. Thepresent investigation was undertaken to investigate thesefactors as correlates to performance at several race dis-tances.
METHODS
Eighteen experienced male distance runners volun-teered to participate in the study. Table 1 summarizestheir physical characteristics and responses to maximal ex-ercise. Running experience ranged from one to ten years.
Body composition was determined by body density as-sessment using the hydrostatic weighing procedures ofBehnke and Wilmore (2). Residual lung volume was deter-mined by the nitrogen dilution technique (54). The Siri (49)equation was used to estimate relative fat from total bodydensity. The procedures of Bergstrom (3) were employedto obtain muscle biopsies from the lateral head of the gas-trocnemius. This muscle was chosen based on the report ofCostill et al. (10) that this muscle is metabolically more ac-tive than are the thigh muscles during distance running.Tissue slices were stained by the following procedures: 1)NADHz Tetrazolium Reductase (41), 2) Myosin ATPase,
pH 4.3, 4.5, 4.6 pre-incubations (35), and 3)Alpha-Glycer-ophosphate Dehydrogenase (53). The primary stain usedfor fiber typing was the Alpha-Glycerophosphate Dehy-drogenase stain and when the typing of anyone fiber wasquestionable the other stains were used as cross references.The mean number of fibers counted per subject was391 :J:168 SD fibers.
338

"
~,FACTORS EFFECTING PERFORMANCE
TABLE1.Meancharacteristicsof the subjects(N= 18).
Subject Age Ht Wt Relative SlowBodyFat Twitch
~ ~ ~ % %
X 28 180 70.2 , 9.3 63.9S.D. 9.0 6.7 8.1 3.4 9.5range 18,54 173,193 55-84.2 5.0,16.8 42-79
'aLA. representsthe differencebetweenpre-exerciseand3 min postexercisestandingvalues.
Prior to data collection, the subjects were familiarizedwith all pertinent laboratory procedures using a ten min-ute treadmill run identical to those which would follow.
The relationships betweenV02, treadmill velocity, andplasma lactate were determined for each subject by a se-ries (X = 8) of ten minute steady state runs. No more than
one run was performed on any single day and, if possiblewere spaced at weekly intervals. Treadmill velocities weredetermined by twice timing 30 revolutions of the mea-sured belt. If the times differed by more than :1:0.1 sec athird determination was made. This procedure results inan accuracy of :I: 1 m/min. The steady state tests spannedthe time interval of performance (i.e. distance road races)data collection. The range of treadmill velocities spannedthe range of running velocities for the average race pacefrom the marathon to the 9.7 km race for all subjects. Sev-eral runners ran the 3.2 km races at velocities above the
highest treadmill velocity at which they were tested. \102was measured continuously and displayed at minute inter-vals using a system of instruments involving a volume tur-bine, OM-ll oxygen analyzer and LB-2 carbon dioxideanalyzer. This instrument has been validated (55) and fur-ther validation was conducted in our laboratory prior tothe study. Before and after each test, the analyzers werecalibrated with gases of known concentration. The con-centration of these gases was verified throughout the studyby the Scholander technique (45). Volume was measuredwith a biased flow turbine which was calibrated before and
after each day's testing using a calibrated syringe at theflow rate estimated for that day's testing. Heart rate wasdetermined at the end of each minute from suitably placedleads using a Quinton, Model 623-A, ECG Monitoring Sys-tem.
Blood samples were obtained without stasis from aprominent forearm vein before and after' each test. TIlepre-test sample was taken after a minimum of ten minutesof standing and the post-test sample was taken immedi-
ately (within 30 sec) after the test with the subject standingon the treadmill. The concentration of lactate in the
plasma was determined using a standard enzymatic tech-nique (47). All lactate values presented in this paper aredelta values (post minus pre values).
After the subjects had completed three or four steadystate runs, V02max was determined on two separate occa-
. sions. The protocol selected was similiar to that described
by Costill and Fox (12) and was adapted to the ability ofthe runner (i.e. slower velocities for the runners of lesser
339
aLA'
mM
10.81.38.5.13.1
45 6050 55
\1°2 (ml/kg mill) 0 -
0-0 ,,~,;ty- ;o"ot. / /.-. VO,-I.".t. y.
-liO: g
/'.(1- --- 0...0-8 0_"""- ~o/ I
214 2681\ b 322241 295
Treadmill Velocity m/min
Figure I-Relationship between treadmill velocity and delta lactate oroxygen consumption (mllkg min) and delta lactate for a representativesubject.
ability). The range of time to exhaustion was 6.0-10.5 min,with a coefficient of variation for duplicate tests of :I:1.96percent (r = .95), an acceptable reliability coefficient ac-cording to Saltin and Astrand (43). The following criteriafor a maximal effort were established and met for each sub-
ject in at least one of the duplicate tests: 1) an R value(Vc02/Vo2» 1.10, 2) post tests lactates >8mM as sug-gested by Saltin and Astrand (43), and 3) and increase inVo2 of less than 100 mllmin with an increasing exerciseintensity during the last minute of exercise. The subjectsremained standing on the treadmill during the initial threeminutes of recovery.
Two methods were used for the determination of theOPLA and the data used were obtained from the ten min-
ute treadmill runs. In method A a visual inspection wasmade of the graph for each individual relating delta lac-tate, treadmill velocity and oxygen consumption. Figure 1is an example of these relationships. When plotting deltalactate with treadmill velocity, visual inspection indicatedthat the portion of the graph above the OPLA exhibited an
exponential trend for ten subjects; however, eight subjectsdisplayed a linear rise in lactate. Hermansen and Stensvold(24) and Saltin and Karlsson (44) have found this rise to beexponential, while Senay and Kok (46) and Williams et al.
(56) have treated it as linear while recognizing it to be ex-ponential.
"102max HeartRate "IE BTPS
ml/kg min Max.BPM I min
61.7 190 154.27.5 6.9 16.446.3-73.7 178-200 125-178
40r
6
5
4
DeltaLactate 3
mM
2
,-.-340
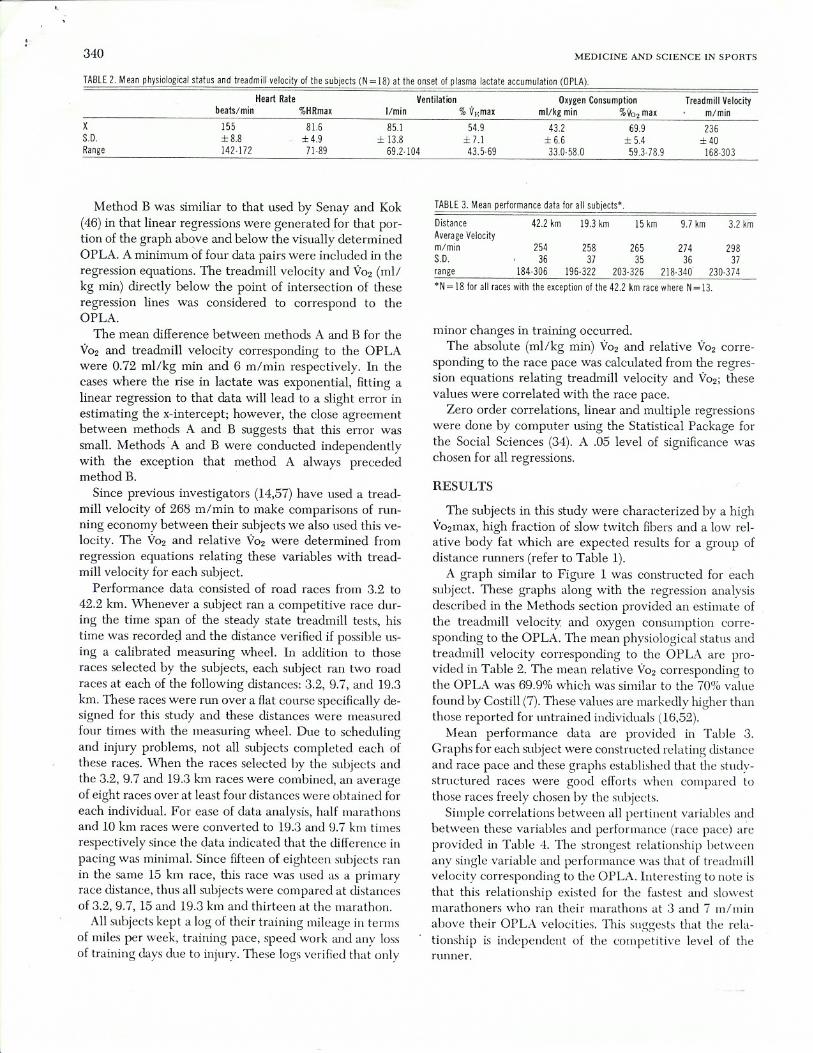
TABLE2. Meanphysiologicalstatusandtreadmillvelocityof thesubjects(N= 18)at the onsetof plasmalactateaccumulation(OPLA).
MEDICINE AND SCIENCE IN SPORTS
XS.D.Range
Method B was similiar to that used by Senay and Kok(46) in that linear regressions were generated for that por-tion of the graph above and below the visually determinedOPLA. A minimum of four data pairs were included in theregression equations. The treadmill velocity and Voz (mllkg min) directly below the point of intersection of theseregression lines was considered to correspond to theOPLA.
The mean difference between methods A and B for the
Voz and treadmill velocity corresponding to the OPLAwere 0.72 mllkg min and 6 m/min respectively. In thecases where the rise in lactate was exponential, fitting alinear regression to that data will lead to a slight error inestimating the x-intercept; however, the close agreementbetween methods A and B suggests that this error wassmall. Methods A and B were conducted independentlywith the exception that method A always precededmethod B. .
Since previous investigators (14,57) have used a tread-mill velocity of 268 m/min to make comparisons of run-ning economy between their subjects we also used this ve-locity. The Voz and relative Voz were determined fromregression equations relating these variables with tread-mill velocity for each subject.
Performance data consisted of road races from 3.2 to
42.2 km. \Vhenever a subject ran a competitive race dur-ing the time span of the steady state treadmill tests, histime was recorded and the distance verified if possible us-ing a calibrated measuring wheel. In addition to thoseraces selected by the subjects, each subject ran two roadraces at each of the following distances: 3.2, 9.7, and 19.3km. These races were run over a fiat course specifically de-signed for this study and these distances were measured
four times with the measuring wheel. Due to schedulingand injury problems, not all subjects completed each ofthese races. \Vhen the races selected by the subjects andthe 3.2,9.7 and 19.3 km races were combined, an averageof eight races over at least four distances were obtained foreach individual. For ease of data analysis, half marathonsand 10 km races were converted to 19.3 and 9.7 km times
respectively since the data indicated that the difference in
pacing was minimal. Since fifteen of eighteen ~l.lbjects ranin the same 15 km race, this race was used as a primaryrace distance, thus all subjects were compared at distancesof 3.2,9.7,15 and 19.3 km and thirteen at the marathon.
All subjects kept a log of their training mileage in termsof miles per week, training pace, speed work and any lossof training days due to injury. These logs verified that only
TABLE3. Meanperformancedatafor all subjects*'
Distance
AverageVelocitym/min 254 258 265 274 298S.D. 36 37 35 36 37range 184-306 196-322 203-326 218-340 230-374
*'N= 18for all raceswith the exceptionof the 42.2km racewhereN= 13.
42.2km 19.3km 15km 9.7 km 3.2kin
minor changes in training occurred.The absolute (mllkg min) Voz and relative Voz corre-
sponding to the race pace was calculated from the regres-sion equations relating treadmill velocity and Voz; thesevalues were correlated with the race pace.
Zero order correlations, linear and multiple regressionswere done by computer lL'iing the Statistical Package forthe Social Sciences (34). A .05 level of significance waschosen for all regressions.
RESULTS
The subjects in this study were characterized by a highVozmax, high fraction of slow twitch fibers and a low rel-ative body fat which are expected results for a group ofdistance runners (refer to Table 1).
A graph similar to Figure 1 was constructed for eachsubject. These graphs along with the regression analysisdescribed in the Methods section provided an estimate ofthe treadmill velocity and oxygen consumption corre-sponding to the OPLA. The mean physiological status andtreadmill velocity corresponding to the OPLA are pro-vided in Table 2. The mean relative Voz corresponding tothe OPLA was 69.9% which was similar to the 70% value
found by Costill (7). These values are markedly higher thanthose reported for untrained individuals (16,52).
Mean performance data are provided in Table 3.Graphs for each ~l.lbject were constructed relating distanceand race pace and these graphs established that the study-structured races were good efforts when compared tothose races freely chosen by the subjects.
Simple correlations between all pertinent variables ,mdbetween these variables and performance (race pace) a;eprovided in Table 4. The strongest relationship betweenany single variable and performance was that of treadmillvelocity corresponding to the OPLA. Interesting to note isthat this relationship existed for the fastest and slowestmarathoners who ran their marathons at 3 and 7 m/min
above their OPLA velocities. This suggests that the rela-. tionship is independent of the competitive level of the
runner.
HeartRate Ventilation OxygenConsumption TreadmillVelodtybeats/min %HRmax I/min % VEmax ml/kg min %Vozmax m/min
155 81.6 85.1 54.9 43.2 69.9 236:J:8.8 .. :I:4.9 :J: 13.8 :1:7.1 :I: 6.6 :1:5.4 :f: 40142.172 71-89 69.2-104 43.5-69 33.0-58.0 59.3-78.9 168.303

>,
FACTORS EFFECTING PERFORMANCE 341
19.3km 15km
TABLE4. Zeroordercorrelationsbetweenthe racepacefor all distancesandall pertinentvariablesandbetweenall pertinentvariables.
OPLAVEL42.2km**
19.3km .98*15.0km .98* .98*9.7km .96* .98* .98*3.2km .92* .94* .95* .96*
Eft. -.49* -.56* -.59* -.60* -.59*%ST .53* .49* .54* .48* .47*Vozmax .91* .91* .89* .86* .83*OPLAVEL .98* .97* .97* .96* .91*OPLAV02 .89* .91* .91* .89* .85*Vozatracepace .89* .94* .94* .91' .87*%Vozmaxatracepace .07 .34 .37 .35 .33
**42.2km=racepaceformarathon,Eft.=V02requiredforatreadmillvelocityof268m/min,reST=numberofslowtwitchfibers/totalnumberoffiberscountedx 100,OPLAVEL= treadmillvelocitycorrespondingtotheonsetofplasmalactateaccumulation,0PLAV02=oxygenconsumptioncorrespondingtotheOPLA,'102racepace=oxygenconsumptionfortheaverageracepaceofthatdistance,%V02max=relativeoxygenconsumptionfortheaverageracepaceforthatdistance.
*significantat p<.Q5
TABLE5. Multiple regressionanalysisfor selectedvariablesandthe 15 kilometerracepace.
Variable B
OPLAVel* .60'102max .89% ST .27Eft -.51
OPLAV02 .22Constant 67.00
*OPLAVEL=treadmilivelocitycorrespondingto the onsetof plasmalactateaccumulation,'102max=maximaloxygenconsumption,% ST=number of slowtwitch fibers/total numberof fiberscountedXI00, Eft=V02 requiredfor atreadmillvelocityof 268m/min, OPLAV02=oxygenconsumption(ml/kg min)correspondingto the OPLA.
**significantat p<.05
R.971**.974**.975**.976**.976**
5.659**1.82.87.198.036
Multiple regression analyses were performed using racepace as the dependent variable with running economy,V02max, muscle fiber composition (expressed as percent oftotal population which are slow twitch fibers), treadmillvelocity and oxygen consumption (mllkg min) corre-sponding to theOPLA as independent variables. An ex-ample of this stepwise analysis is provided in Table 5. Forall distances, the treadmill velocity corresponding to theOPLA was most closely related to performance thus ac-counting for the largest amount of variation in race pace.V02max and %ST were the next most closely associatedvariables, while running economy and the oxygen con-sumption corresponding to the OPLA were least associ-ated. The multiple R did not rise significantly with the ad-dition of variables to the OPLA velocity.
The relationship between running economy and per-formance in the 19.3 km race is provided in Figure 2. Sim-ilar relationships were found for other distances (Table 4).The range in \102 values corresponding to a treadmill ve-locity of 268 m/min wa..; 43.5 - 55.6 mllkg min which issomewhat larger than the range of 48.5 - 54.8 mllkg minreported by Costill et al. (14). However, the mean valuesfor the two studies were similar, i.e. 50.2 and 51.2 mllkgmin respectively. Bransford and Howley (5) found thisvalue to be SO.8 mllkg min and Wyndham et al. (57) re-ported a value of .51.2mllkg min.
9.7km '102max3.2km Eft. %ST
-.10-.45-.62*-.38
.45
.51*
.51*.88'.86* .93*
300
,~.56I,q5}, ~ - 5 )061' I + 5"
5" ~ ! 30 . I.'"
28019.3k.",.Pw 260mi.;"
2'0
220
200
40 6050
V02 Iml/',.,"I" 2".,.,"
Figure 2-Relationship between running economy, defined in this studyas the oxygen consumption for a treadmill velocity of 268 m/min, andthe average race pace for the 19.3 km race.
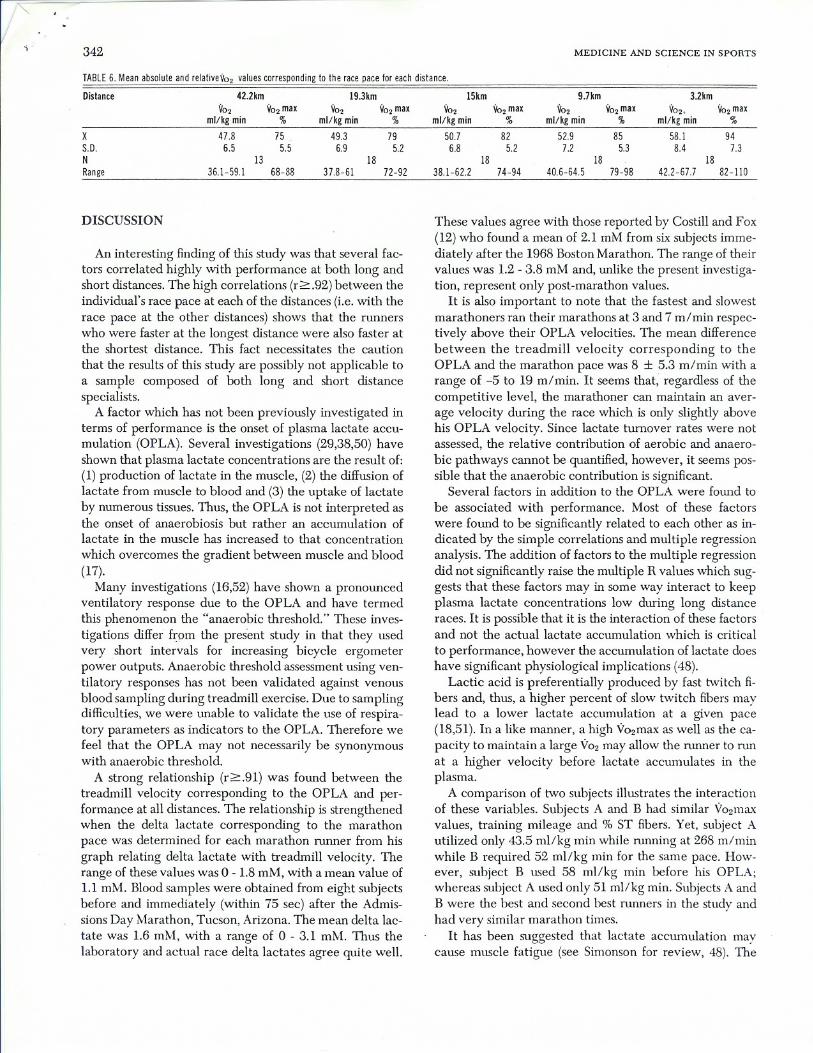
The data presented in Table 6 demonstrates that all run-ners possessed the ability to utilize a large fraction of their\102max during the race distances investigated. Costill etal. (14) fOlmd that a similar group of runners utilized anestimated 51.1 mllkg min and 86% V02max while runninga ten mile race. These values are in close agreement withthe 50.7 mllkg min and 82% \102max values found in thepresent study. The relative \102corresponding to the mar-athon pace was 75% which is identical to the value re-ported by Costill and Fox (12) for a group of highly expe-rienced and well-trained marathoners. No relationship(r:::::37, not significant at 0.05 level) was found between therelative V02 at the race pace 'and performance; however,the relationship between absolute \102 (mllkg min) at therace pace and performance was found to be highly signif-icant (n> .87) which suggests that performance is moreclosely related to the ability to maintain a large absoluteoxygen consumption independent of what fraction thisrepresents of the \102max.
l~
342
TABLE6. MeanabsoluteandreiativeV02valuescorrespondingto the racepacefor eachdistance.
MEDICINE AND SCIENCE IN SPORTS
DISCUSSION
An interesting finding of this study was that several fac-tors correlated highly with performance at both long andshort distances. The high correlations (r2:.92) between theindividual's race pace at each of the distances (i.e. with therace pace at the other distances) shows that the runnerswho were faster at the longest distance were also faster atthe shortest distance. This fact necessitates the caution
that the results of this study are possibly not applicable toa sample composed of both long and short distancespecialists.
A factor which has not been previously investigated interms of performance is the onset of plasma lactate accu-mulation (OPLA). Several investigations (29,38,50) haveshown that plasma lactate concentrations are the result of:(1) production of lactate in the muscle, (2) the diffusion oflactate from muscle to blood and (3) the uptake of lactateby numerous tissues. Thus, the OPLA is not interpreted asthe onset of anaerobiosis but rather an accumulation oflactate in the muscle has increased to that concentration
which overcomes the gradient between muscle and blood(17).
Many investigations (16,52) have shown a pronouncedventilatory response due to the OPLA and have termedthis phenomenon the "anaerobic threshold." These inves-
tigations differ from the present study in that they usedvery short intervals for increasing bicycle ergometerpower outputs. Anaerobic threshold assessment using ven-tilatory responses has not been validated against venousblood sampling during treadmill exercise. Due to samplingdifficulties, we were unable to validate the use of respira-tory parameters as indicators to the OPLA. Therefore wefeel that the OPLA may not necessarily be synonymouswith anaerobic threshold.
A strong relationship (r2:.91) was found between thetreadmill velocity corresponding to the OPLA and per-formance at all distances. The relationship is strengthenedwhen the delta lactate corresponding to the marathonpace was determined for each marathon runner from hisgraph relating delta lactate with treadmill velocity. Therange of these values was 0 - 1.8mM, with a mean value of1.1 mM. Blood samples were obtained from eight subjectsbefore and immediately (within 75 sec) after the Admis-sions Day Marathon, Tucson, Arizona. The mean delta lac-tate was 1.6 mM, with a range of 0 -3.1 mM. Thus thelaboratory and actual race delta lactates agree quite well.
These values agree with those reported by Costill and Fox(12) who found a mean of 2.1 mM from six subjects imme-diately after the 1968 Boston Marathon. The range of theirvalues was 1.2 - 3.8 mM and, unlike the present investiga-tion, represent only post-marathon values.
It is also important to note that the fastest and slowestmarathoners ran their marathons at 3 and 7 m/min respec-tively above their OPLA velocities. The mean differencebetween the treadmill velocity corresponding to theOPLA and the marathon pace was 8 :I: 5.3 m/min with arange of -5 to 19 m/min. It seems that, regardless of thecompetitive level, the marathoner can maintain an aver-age velocity during the race which is only slightly abovehis OPLA velocity. Since lactate turnover rates were notassessed, the relative contribution of aerobic and anaero-
bic pathways cannot be quantified, however, it seems pos-sible that the anaerobic contribution is significant.
Several factors in addition to the OPLA were fow1d to
be associated with performance. Most of these factorswere found to be significantly related to each other as in-dicated by the simple correlations and multiple regressionanalysis. The addition of factors to the multiple regressiondid not significantly raise the multiple R values which sug-gests that these factors may in some way interact to keepplasma lactate concentrations low during long distanceraces. It is possible that it is the interaction of these factorsand not the actual lactate accumulation which is critical
to performance, however the accumulation of lactate doeshave significant physiological implications (48).
Lactic acid is preferentially produced by fast twitch fi-bers and, thus, a higher percent of slow twitch fibers maylead to a lower lactate accumulation at a given pace(18,51). In a like manner, a high \'02max as well as the ca-pacity to maintain a large \'02 may allow the rwmer to runat a higher velocity before lactate accumulates in theplasma.
A comparison of two subjects illustrates the interactionof these variables. Subjects A and B had similar \'02maxvalues, training mileage and % ST fibers. Yet, subject Autilized only 43.5 mllkg min while running at 268 m/minwhile B required 52 mllkg min for the same pace. How-ever, subject Bused 58 mllkg min before his OPLA;whereas subject A used only 51 mllkg min. Subjects A andB were the best and second best runners in the study andhad very similar marathon times.
It has been suggested that lactate accumulation maycause muscle fatigue (see Simonson for review, 48). The
Distance 42.2km 19.3km 15km 9.7km 3.2km'102 '102max '102 '102max '102 '102max '102 '102max '102. '102max
rot/kgmin % rot/kgmin % rot/kgmin % rot/kgmin % rot/kgmin %
X 47.8 75 49.3 79 50.7 82 52.9 85 58.1 94S.D. 6.5 5.5 6.9 5.2 6.8 5.2 7.2 5.3 8.4 7.3N 13 18 18 18 18Range 36.1-59.1 68-88 37.8-61 72-92 38.1-62.2 74-94 40.6-64.5 79-98 42.2-67.7 82-110

v~~~
:
FACTORS EFFECTING PERFORMANCE
acidosis resulting from excessive lactate accumulationcauses a major shift in the acid-base balance (40), howeverin prolonged exercise this degree of acidosis does not occur(1,30). During prolonged high intensity exercise fat be-comes an increasingly important substrate (21,22) and sev-eral studies have demonstrated an inhibition of fat utiliza-
tion by acidosis (4,20,25,26,27,28). Although the presentinvestigation studied neither fat utilization nor acidosis,the findings are compatible with the concept that large ac-cumulations of lactate should be avoided during distanceraces due to the possible inhibition of fat utilization withthe consequence of a greater dependence on carbohy-drates. This increased carbohydrate utilization may resultin glycogen depletion which has been associated with ex-haustion during prolonged exercise (13,23).
An alternative interpretation of the physiological signif-icance of low plasma lactate levels is that a small amountof this acid is necessary to maintain free fatty acid levels atan optimal level (4). This slight inhibition of fat mobiliza-tion may allow the runner to maximally utilize carbohy-drate in preference to fat which is a less efficient fuel.
Some of the conclusions of the present study are pre-. dieted on the ability to equate treadmill and overland data.Pugh (39) has shown that the oxygen consumption whilerunning on a track is higher than that required for the samevelocity on the treadmill due to wind resistance. However,Pugh's data have been questioned by McMiken and Dan-
iels (32) on the basis that the study involved two groups,one of which ran on the treadmill and the other on the
track. Recently, McMiken and Daniels (32) have shown
REFERENCES
1. ASTRAND,P.O., 1. fuLLBACK, R. HEDMAN,and B. SALTIN.Blood lac-
tates after prolonged severe exercise. I. Appl. Physio/. 18:619-622,1963. .
2. BEHNKE,A.R. ANDJ.R. WILMORE. Evaluation and regulation of bodybuild and composition. Englewood Cliffs, N.J.: Prentice-Hall, Inc.,pp. 22-24, 1974.
3. BERGSTROM,J. Muscle electrolytes in man. Scand. I. Clin. Lab. In-vest. 68:11-13, 1962.
4. BOYD, A.E., S.R. GIAMBER, M. MAGER,and H.E. LEBOVITZ.Lactate
inhibition of lipolysis in exercising man. Metabolism. 23:531-542,1974.
5. BRANSFORD,D.R. and E.T. HOWLEY. Oxygen cost of running intrained and untrained men and women. Med. Sci. Sports. 9:41-44,1977.
6. COSTILL, D.L. The relationship between selected physiological var-iables and distance running performance. J. Sports Med. 7:61-66,1967.
7. COSTILL,D.L. Metabolic responses during distance running. I. Appl.Physiol. 28:251-255, 1970.
8. COSTILL, D.L. Physiology of marathon running. lAMA 221:1024-1029, 1972.
9. COSTILL, D.L., G. BRANAM;D. EDDY, and K. SPARKS.Determinants
of marathon running success. Int. Z. angew. Physiol. 29:249-254,1971.
10. COSTILL, nL., J. DANIELS, W. EVANS, \V. FINK, G. 'KRAHENBUHL,and B. SALTIN. Skeletal muscle enzymes and fiber composition in
. male and female track athletes. I. Appl. Physiol. 40:149-154, 1976.11. COSTILL, D.L., W.J. FINK, and M.L. POLLOCK.Muscle fiber compo-
sition and enzyme activities of elite distance runners. Med. Sci.Sports. 8:96-100, 1976.
343
that, at treadmill velocities up to 260 m/min, there is nodifference in oxygen consumption between track andtreadmill running. Since many of the data preseBted in thepresent study were obtained at velocites above this veloc-ity, it is possible that the treadmill data underestimate theenergy cost associated with actual road race conditions.
This means that the subjects may be running at a higherfraction of their V02max than that estimated from tread-
mill data. The oxygen cost would be even higher underconditions which result in thermal stress, uneven terrain or
a high wind velocity.In summary, the most important finding of this study is
that the onset of plasma lactate accumulation is closely re-lated to the race pace for long distance races. This rela-tionship seems to be independent of the competitive levelof the runner. Other factors, such as muscle fiber compo-sition, V02max, running economy, and the capacity ofmaintaining a large V02during the race may intereact withthe integrated purpose of maintaining low plasma lactatelevels during the race.
Current addresses of authors:Jack H. Wilmore, Department of Physical Education, University
of Arizona, Tucson, Arizona 53201.John E. Billing, University of Connecticut, Department of Physi-
cal Education, Storrs, Conn. 06208.David L. Costill, Ball State University, Human Performance Lab-
oratory, Muncie, Indiana 47306.Peter A. Farrell, Department of Human Kinetics, University of
Wisconsin-Milwaukee, Milwaukee, Wisconsin 53201.Edward F. Coyle, Department of Preventive Medicine, Washing-
ton University, St. Louis, Missouri 63110.
12. COSTILL, D.L. and E.L. Fox. Energetics of marathon running. Med.Sci. Sports. 1:81-86, 1969.
13. COSTILL, D.L., P.D. GOLWICK, E.D. JANSSON,B. SALTIN, and E.M.STEIN. Glycogen depletion pattern in human muscle fibers duringdistance running. Acta. Physiol. Scand. 89:374-383, 1973.
14. COSTILL, D.L., H. THOMASON,and E. ROBERT.Fractional utilizationof the aerobic capacity during distance running. Med. Sci. Sports.5:248-252, 1973.
15. DANIELS, J. Physiological characteristics of champion male athletes.Res. Quart. 45:342-348, 1974.
16. DAVIS, J.A., P. VODAK,J.H. WILMORE, J. VODAK,and P. KURTZ.An-aerobic threshold and maximal aerobic power for three modes of ex-ercise. I. Appl. Physiol. 41:544-550, 1976.
17. DIAMANT,B., J. KARLsSON,and B. SALTIN.Muscle tissue lactate aftermaximal exercise in man. Acta. Physiol. Scand. 72:383-384, 1968.
18. ESSEN, B. and T. HAGGMARK.Lactate concentration in type I and IImuscle fibers during muscular contraction in man. Acta. Physiol.Scand. 95:344-346, 1975.
19. FOSTER, C., J.T. DANIELS, and RA. YARBROUGH.Physiological andtraining correlates of marathon running. Australian J. of Sports Med.9:56-61, 1977.
20. FREDHOLM, B.B. Fat mobilization and blood lactate concentration.
In: Muscle metabolism during exercise. Pernow, B. and B. Saltin, ern.New York, N.Y.: Plenum Press, pp. 249-255. 1971.
21. GOLWICK, P.D. Free fatty acid turnover and the availability of sub-strates as a limiting factor in prolonged exercise. Ann. N. Y. Acad.Sci. 301:64-72, 1977.
22. HAVEL, R.J. Influence of intensity and duration of exercise on supplyand use of fuels. In: l\Jllscle metabolism during exercise. Pernow, B.and B. Saltin, eds. New York, N.Y.: Plenum Press, pp. 315-325, 1971.

r.
~
344
23. HERMANSEN,L., E. HULTMAN,and B. SALTIN. Muscle glycogen dur-ing prolonged severe exercise. Acta. Physiol. Scand. 71:129-139,1967.
24. HERMANSEN,L. and 1. STENSVOLD.Production and removal of lactate
during exercise in man. Acta. Physiol. Scand. 86: 191-201, 1972.25. HJEMDAHL,P. and B.B. FREDHOLM.Direct antilipolytic effect of aci-
dosis in rat adipocytes. Acta. Physiol. Scaml. 101:294-301, 1977.26. HULTMAN, E. Studies on muscle metabolism of glycogen and active
phosphate in man with special reference to exercise and diet. Scand.J. Clin. Lab. Invest. 19:suppl. 94, 1967.
27. 1ssEKuTz, B., JR. and H.1. MILLER. Plasma free fatty acids during ex-ercise and the effect of lactic acid. Proc. Soc. Expl. Bioi. Med.110:237-239, 1962.
28. ISSEKUTZ,B., JR., W.A.S. SHAW, and T.B. ISSEKUTi. Effect of lactateon FF A and glycerol turnover in resting and exercising dogs. ]. Appl.Physiol. 39:349-353, 1975.
29. JORFELDT,L. Turnover of HC-1( + )-Lactate in human skeletal mus-cle during exercise. In: Muscle metabolism during exercise. Pernow,B. and B. Saltin, eds. New York, N.Y.: Plenum Press, pp. 409-417,1971.
30. KARLSSON,J. Lactate in working muscles after prolonged exercise.Acta. Physiol. Scand. 82:123-130, 1971.
31. MARGARIA,R, RT. EDWARDS,and D.B. DILL. The possible mecha-nisms of contracting and paying the oxygen debt and role of lacticacid in muscular contraction. Am. J. Physiol. 106: 689-715, 1933.
32. McMIKEN, D.F. and IT. DANIELS. Aerobic requirements and maxi-mum aerobic power in treadmill and track running. Med. Sci. Sports.8:14-17,1976.
33. NAGLE,F., D. ROBINHOLD,E. HOWLEY,J. DANIELS,G. BAPTISTA,andK. STOEDEFALKE.Lactic acid accumulation during running at sub-maximal aerobic demands. Med. Sci. Sports. 2:182-186,1970.
34. NIE, N.H., C.H. HULL, lG. JENKINS, K STEINBRENNER,and D.H.BENT. Statistical package for the social sciences. New York, N.Y.:McGraw Hill Book Company, 1975.
35. PADYKULA,H.A. and E. HERMAN.The specificity of the histochemi-cal method of adenosine triphosphate. J. Histochem. Cytochem.3:170--195,1955.
36. PAUL, P. and \V.L. HOLMES.Free fatty acid and glucose metabolismduring increased energy expenditure and after training. Med. Sci.Sports. 7:176-184, 1975.
37. POLLOCK,M.L. Submaximal and maximal working capacity of elitedistance runners. Part I: Cardiorespiratory Aspects. Ann. N. ¥. Acad.Sci. 301:310-322, 1977.
38. POORTMANS,lR., J. BOSSCHEand R. LECLERCQ. Lactate uptake byinactive forearm during progressive leg exercise. ]. Appl. Physiol.45:835-839, 1978.
39. PUGH,LG.C. Oxygen uptake -in track and treadmill running withobservations on the effect of air resistance. ]. Physiol. 207:823-83.5,1970.
MEDICINE AND SCIENCE IN SPORTS
40. OSNES, J. and L. HERMANSEN.Acid-base balance after maximal ex-ercise of short duration. ]. Appl. Physiol. 32:59-6.3, 1972.
41. NOVIKOFF,A.B., W. SHIN, and J. DRUCKER.Mitochondriallocaliza-tion of oxidation enzymes: staining results witli two tetrazoliumsalts. ]. Biophys. Biochem. Cytol. 9:47-61, 1961.
42. RusKo, H., M. HAvu, and E. KARVINEN.Aerobic performance capac-ity in athletes. Eur. J. Appl. Physiol. 38:1.51-159, 1978.
43. SALTIN, B. and P.O. ASTRAND.Maximal oxygen uptake in athletes. J.Appl. Physiol. 23:3.53-3.58, 1967.
44. SALTIN, B. and J. KARLSSON.Muscle ATP, CP, and lactate duringexercise after physical conditioning. In: Muscle metabolism duringexercise. Pernow, B. and B. Saltin, eds. New York, N.Y.: Plenum
Press, pp. 395-.399, 1971.4.5. SCHOLANDER,P.F. Analyzer for accurate estimation of respiratory
gases in one-half cubic centimeter samples. ]. Bioi. Chem. 167:235-2.50, 1947.
46. SENAY,LC. and R KOK.Effects of training and heat acclimatizationon blood plasma contents of exercising men. J. Appl. Physiol. 43:591-.599, 1977.
47. Sigma Technical Bulletin 826. St. Louis, Mo.: Sigma Chemical Co.,1968.
48. SIMONSON, E., editor. Physiology of work capacity and fatigue.Charles C. Thomas, Springfield, Ill., pp. 5-28, 1971.
49. SIRI, W.F. Body composition from fluid spaces and density. Univer-sity of California, Donner Laboratory of Medical Physics Report,March 19, 19.56.
.50. STAINSBY,W.N. and RG. WELCH. Lactate metabolism of contract-
ing dog skeletal muscle in situ. Am. J. Physiol. 211:177-183, 1966..51. TESCH, P., B. SJODIN, and J. KARLSSON.Relationship between lactate
accumulation, LDH activity, LDH isoenzyme and fiber type distri-bution in human skeletal muscle. Acta. Physiol. Scand. 103:40--46,1978.
.52. WASSERMAN,K, B.J. WHIPP, S.N. KOYAL,and \V.L. BEAVER.Anaer-obic threshold and respiratory gas exchange during exercise. ]. Appl.Physiol. 3.5:235-243, 1973. .
.53. W ATIENBURG, L.W. and J.O. LoNG. Effects of coenzyme QlO andmenadione on succinate dehydrogenase activity as measured by tet-razolium salt reduction. J. Histochem. Cytochem. 8:296-303, 1960.
.54. WILMORE, J.H. A simplified method for the determination of residuallung volume. J. Appl. Physiol. 27:96-100, 1969.
5.5. WILMORE, J.H., lA. DAVIS,and A.c. NORTON.An automated systemfor assessing metabolic and respiratory function during exercise. J.Appl. Physiol. 40:619-624, 1976.
.56. WILLIAMS, C.G., A.J.N. DuR~AN, M.J. VON RAHDEN, and C.RWYNDlL~M.The capacity for endurance work in highly trained men.Int. Z. angew. Physiol. einschl. Arbeitsphysiol. 26:141-149, 1968.
.57. WYNDHAM, C.H., N.B. STRYDOM,A.Y. VAN RENSBURG,and A.J.S.BENADE.Physiological requirements for world-class performances inendurance running. S. Afr. Med.]. 43:996-1002, 1969.