Physically active students’ intentions and self-efficacy towards healthy eating

Plane stress fracture toughness of physically aged plasticized PETG
as assessed by the essential work of fracture (EWF) method
J. Karger-Kocsisa,*, T. Baranyb, E.J. Moskalac
aInstitut fur Verbundwerkstoffe GmbH, Technische Universitat Kaiserslautern, P.O. Box 3049, D-67653 Kaiserslautern, GermanybDepartment of Polymer Engineering and Textile Technology, Faculty of Mechanical Engineering,
Budapest University of Technology and Economics, H-1111 Budapest, HungarycEastman Chemical Co., Research Laboratories, Kingsport, TN 37662-5150, USA
Received 5 February 2003; received in revised form 27 June 2003; accepted 30 June 2003
Abstract
The plane stress fracture toughness of amorphous copolyester (PETG) sheets plasticized by various amount of neopentylglycol dibenzoate
(NPGDB in 0, 5, 10 and 20 wt%) was studied in as-received (AR) and rejuvenated (RJ) states by adopting the essential work of fracture
(EWF) method. EWF tests were performed on deeply double-edge notched tensile loaded (DDEN-T) specimens at various deformation rates
(2,10 and 100 mm/min) at room temperature. It was established that physical aging strongly affected the EWF terms. The specific yielding-
related EWF increased with increasing deformation rate and decreased with increasing plasticizer content. The specific non-essential work
and its necking-related constituent, which changed parallel to each other, remained constant up to 10 wt% NPGDB content and decreased
afterwards. The plastic zone in the DDEN-T specimens was formed by cold drawing which is governed by the entanglement structure. This
was demonstrated by the shape recovery of the plastic zone in the broken DDEN-T specimens after heating them above the Tg of the related
PETG compound.
q 2003 Elsevier Ltd. All rights reserved.
Keywords: Amorphous copolyester; Plasticizer; Essential work of fracture (EWF)
1. Introduction
Recently, the essential work of fracture (EWF) approach
has gained acceptance for assessing the toughness of ductile
polymers, especially in their sheet form (plane stress
conditions prevails). It was shown earlier that amorphous
copolyesters are likely the best model materials for the EWF
approach as all prerequisites of the method are met [1–3].
The EWF response of amorphous (co)polyesters was
already studied as a function of testing conditions (e.g.
specimen thickness [4], strain rate [5,6], notching method-
ology [7], temperature [8]), molecular composition [9] and
molecular weight [10]. On the other hand, less information
is available on the effects of physical aging and plasticiza-
tion. The physical aging of thermoplastic (co)polyesters was
addressed only by Liu and Nairn [11] and by us [3]. This is
quite surprising considering the fact that the mechanical
performance of glassy polymers strongly changes with
progressing aging. Note that the effect of aging associated
generally with severe embrittlement that can be ‘erased’ by
heating the material beyond its glass transition ðTgÞ and
keeping there for a few minutes (rejuvenation procedure).
The ‘age’ of the copolyester is usually estimated by
considering the increase in the yield strength if the related
function (i.e. yield strength vs aging time under isothermal
conditions) is known.
The effect of plasticization on mechanical properties is
also of great importance. Of particular interest is the
phenomenon known as antiplasticization, which may occur
at low plasticizer loadings. Antiplasticization results in an
increase in stiffness and yield strength despite the reduced
Tg of the plasticizer/polymer mixture [12]. At higher
loadings, the plasticizer serves to reduce stiffness and Tg
concurrently.
The goal of this study was to determine the effects of
strain rate, physical aging and plasticizer content on the
EWF response of an amorphous copolyester.
0032-3861/03/$ - see front matter q 2003 Elsevier Ltd. All rights reserved.
doi:10.1016/S0032-3861(03)00590-1
Polymer 44 (2003) 5691–5699
www.elsevier.com/locate/polymer
* Corresponding author. Tel.: þ49-631-2017203; fax: þ49-63-120-171-
98.
E-mail address: [email protected] (J. Karger-Kocsis).

2. EWF method
The EWF theory, credited to Broberg ([1–3,13] and
references therein) splits the total energy required to
fracture a precracked specimen in two components: the
essential ðWeÞ and non-essential work ðWpÞ of fracture,
respectively. We is needed to fracture the polymer in the
process zone and thus generate new surfaces. Wp is the
actual work consumed in the outer plastic region where
various energy dissipation mechanism take place. The total
fracture energy, Wf ; calculated from the area of the force-
elongation curves, can thus be expressed by (cf. Fig. 1(a)):
Wf ¼ We þ Wp ð1Þ
Considering the surface- (i.e. Lt) and volume-dependence
(i.e. L2t) of the constituent terms, Eq. (1) can be rewritten
into the specific terms:
Wf ¼ weLt þ bwpL2t ð2Þ
wf ¼wf
Lt¼ we þ bwpL ð3Þ
where L is the ligament length, t is the specimen thickness
and b is a shape factor related to the form of the plastic zone.
The basic prerequisite of the EWF method is that the
ligament ðLÞ of the specimen should be fully yielded before
the crack propagation starts. Based on Eq. (3), we can be
estimated from the interception of the linear regression of
the plot of wf vs L with the wf-axis: we or more exactly the
critical value of we under mode I plane strain conditions
ðwe;IÞ should represent a material parameter. On the other
hand, the slope ðbwpÞ of the wf vs L resistance curves, or
more exactly wp; is a direct measure of the resistance to
crack growth.
It was found that we is a composite term under plane-
stress conditions consisting of yielding ðwe;yÞ and necking þ
tearing ðwe;nÞ components. The force-elongation behavior
displayed in Fig. 1(a) allowed us to partition between the
specific work of fracture required for yielding ðwyÞ and that
consumed by necking þ tearing ðwnÞ: As a consequence the
data reduction given by Eq. 3 is changing for ([1–3,14] and
references therein):
wf ¼ wf;y þ wf;n ¼ we þ bwpL ð4Þ
wf;y ¼ we;y þ b0wp;yL ð5Þ
wf;n ¼ we;n þ b00wp;nL ð6Þ
So, the specific EWF ðweÞ is a combined term under plane-
stress conditions:
we ¼ we;y þ we;n ð7Þ
This energy partitioning has been proved experimentally for
many ductile polymer sheets ([1–3] and references therein).
3. Experimental
3.1. Materials
Plasticized copolyester sheets were produced by com-
pounding Eastar PETG 6763 from Eastman Chemical
Company (Kingsport, TN, USA) with neopentylglycol
dibenzoate (NPGDB) in a twin-screw extruder
(T ¼ 220–240 8C; 90 rpm) followed by chill roll ðT ¼ 65 8
CÞ sheeting. The NPGDB content was varied between 0 and
20 wt%. According to gel permeation chromatography
results, the number-average ðMnÞ and weight-average
ðMwÞ molecular weights were found in the range (1.1–
1.4) £ 104 and (3.5–3.9) £ 104 g/mol, respectively. Tg
values of the compounds with 0, 5, 10 and 20 wt%
NPGDB were 77, 60, 49 and 36 8C, respectively. Sheets
with a thickness of approximately 0.3 mm were studied both
in as-received (AR) and rejuvenated (RJ) stages. AR
corresponds to a storage time of about 2 years at ambient
temperature and 50% relative humidity. Rejuvenation of the
sheets was performed in a thermostatic oven 10 8C above
the Tg of the related compound for 15 min. In order to keep
the sheet form, the sheets were sandwiched between two
preheated glass plates (of ca. 4 mm thickness each).Fig. 1. (a) Characteristic force-elongation curves showing the energy
partitioning. (b) Dimension of the DDEN-T specimens.
J. Karger-Kocsis et al. / Polymer 44 (2003) 5691–56995692

3.2. Material characterization
Dynamic mechanical thermal analysis (DMTA) was
performed on rectangular specimens in tensile mode on an
Eplexor Quaimeter 25N (Gabo, Ahlden, Germany) using a
frequency of 10 Hz and a heating rate of 2 8C/min. The
static and oscillating loads were set for 3 and ^ 1.5 N,
respectively, and the temperature range covered was 2100
to þ 100 8C.
Differential scanning calorimetry (DSC) traces were
recorded on a Mettler DSC 821 device in the temperature
range from 2100 to þ300 8C at a heating and cooling rate
of 20 8C/min.
3.3. Specimens and their testing
The specimens were oriented along the machine (film
production) direction. Static tensile mechanical properties
were determined on dumbbells (type 1B according to EN
ISO 527) at room temperature (RT) with various defor-
mation rates (v ¼ 2; 10 and 100 mm/min). For the EWF
study, double deeply edge-notched specimens (DDEN-T)
were used by subjecting them to tensile loading at RT at the
aforementioned deformation rate. The dimensions of the
DDEN-T specimen are given in Fig. 1(b). The free ligament
of the DDEN-T specimens ranged from L ¼ 5 to 25 mm.
The shape factor (b—cf. Eqs. (2)–(4)) was determined by
Fig. 2. Change in the storage modulus ðE0Þ and mechanical loss factor ðtan dÞ as a function of temperature for the antiplasticized PETG.
Fig. 3. DSC heating traces taken on the samples containing 5 and 20 wt% antiplasticizer in AR and RJ stages, respectively.
J. Karger-Kocsis et al. / Polymer 44 (2003) 5691–5699 5693

viewing the height of the ‘plastic zone’ post mortem using a
light microscope [4,5,14].
3.4. Fractography
The fracture surface of the DDEN-T specimens was
inspected in a scanning electron microscope (Jeol JSM
5400, Japan) after sputtering with a Au/Pd alloy.
4. Results and discussion
4.1. Antiplasticization
Fig. 2 shows the complex storage modulus ðE0Þ and
mechanical loss factor ðtan dÞ as a function of temperature
for the NPGDB modified PETG in the RJ stage. The
plasticization reflected by a continuous decrease in the Tg
due to increasing NPGDB is well resolved in the DMTA
traces. Further, adding NPGDB to PETG results in slightly
enhanced stiffness in the sub Tg region—cf. the E0 vs T
traces in Fig. 2. At the same time the intensity of the
secondary relaxation peak at T < 260 8C decreases with
increasing NPGDB content. These changes are character-
istic for a diluent termed antiplasticizer [12].
DSC traces in Fig. 3 demonstrate the difference in the AR
and RJ stages for the samples containing 5 and 20 wt%
antiplasticizer. As expected, increasing aging is associated
with a more prominent enthalpy relaxation peak, which may
be a suitable measure of physical aging [11]. Note that
enthalpy relaxation is still present after rejuvenation for the
sample with 20 wt% plasticizer. This can be traced to the
rather small difference between the related Tg and RT where
storage and testing occurred. Recall, that the effect of
physical aging is the more pronounced the closer the Tg of
the polymer to the storage temperature.
4.2. EWF response
Characteristic force-elongation curves of the DDEN-T
specimens at comparable ligament length showing the
effects of deformation rate, physical aging and plasticizer
content are depicted in Fig. 4.
Note that the energy partitioning, shown in Fig. 1(a),
could be adopted for all test series where the specimens
failed ductilely. This was, however, not always the
case—see later. Recall that the specific work of fracture
Fig. 4. (a) Force-deformation curves of DDEN-T specimens ðL ¼ 17 mmÞ of PETG in AR (left) and RJ stages (right) showing the effect of deformation rate at
the same ligament length. (b) Force-deformation curves of DDEN-T specimens ðL ¼ 17 mmÞ of PETG in RJ stage showing the effect of antiplasticizer content.
J. Karger-Kocsis et al. / Polymer 44 (2003) 5691–56995694

parameters were determined according to Eqs. (4)–(6) by
a linear fitting of the corresponding work of fracture as a
function of ligament. As will be disclosed later, the
related correlation coefficient ðR2Þ was always higher
than 0.90. Table 1 lists the specific EWF ðweÞ and its
constituents ðwe;y and we;nÞ as a function of both defor-
mation rate and aging for the plasticized PETG. Table 1
also contains the static mechanical data, viz. E modulus
ðEÞ and yield strength ðsyÞ; measured on dumbbells.
Attention should be paid to the fact that both E and sy
of the plasticized sheets fairly agree with those of the
unmodified PETG at least up to 10 wt% NPGDB content
(cf. RJ data in Table 1). This is a clear indication of the
antiplastication due to NPGDB. One can see that
rejuvenation and deformation rate usually cause a
decrease in we: However, it is more straightforward to
focus on the yielding related specific EWF, we;y: Recall
that this term is considered as a material parameter
Table 1
Static tensile mechanical and specific essential work of fracture parameters for the antiplasticized PETG sheets
Material Stage Deformation rate (mm/min) Static tensile
(MPa)
Specific essential work (kJ/m2)
E sy we we;n we;y
PETG As received (AR) 2 2230 49.1 51.0 38.0 13.0
10 2125 53.1 50.7 35.1 15.6
100x 2160 55.8 35.6 17.9 17.7
Rejuvenated (RJ) 2 1885 41.3 36.1 25.1 10.9
10 1870 44.7 35.5 23.6 11.9
100 1955 48.9 30.9 14.4 16.1
PETG þ 5 wt% NPGDB As received (AR) 2 2390 49.6 31.6 17.2 14.4
10 – – Brittle
100 – – Brittle
Rejuvenated (RJ) 2 2085 43.6 35.5 24.3 11.1
10 2120 48.1 36.8 25.0 11.8
100x 2160 54.5 19.9 8.4 11.4
PETG þ 10 wt% NPGDB As received (AR) 2 – – Brittle
10 – – Brittle
100 – – Brittle
Rejuvenated (RJ) 2 2245 43.0 34.8 24.7 10.1
10 2270 48.7 34.5 22.0 12.5
100 2470 58.0 Brittle
PETG þ 20 wt% NPGDB As received (AR) 2 1370 23.1 36.1 29.2 6.9
10 1730 33.0 37.3 26.7 10.4
100 – – Brittle
Rejuvenated (RJ) 2 1665 29.8 30.3 23.2 6.5
10 1870 35.3 30.8 21.0 9.7
100 2145 46.6 Brittle
x the maximum ligament threshold was reduced owing to the onset of brittle fracture.
Fig. 5. Change in we;y as a function of aging, deformation rate and antiplasticizer content.
J. Karger-Kocsis et al. / Polymer 44 (2003) 5691–5699 5695

which represents the inherent toughness [1–4,15]. Fig. 5
shows that we;y increases with increasing deformation
rate and decreases with increasing plasticizer content.
The latter substantiates the plasticizing effect of NPGDB.
Table 1 contains a further very useful relationship. Plotting
the corresponding we;y against sy a fair linear correlation can
be deduced—cf. Fig. 6. The correlation in Fig. 6 suggests a
relationship between the static tensile and EWF responses. As
a consequence, the effect of aging can be traced by we;y in
addition to sy (which is the present praxis) [3].
Fig. 6. we;y and sy plot for the antiplasticized PETG sheets investigated.
Table 2
Specific non-essential work of fracture parameters for the antiplasticized PETG sheets
Material Stage Deformation rate (mm/min) Specific non-essential work of fracture (MJ/m3)
Eq. 4 Eq. 5 Eq. 6
bwp R2 bp b0wp,y R2 b0 0wp,n R2
PETG As received (AR) 2 6.6 0.98 0.061 1.1 0.98 5.5 0.98
10 6.6 0.98 0.056 1.1 0.90 5.5 0.98
100x 8.5 0.99 0.076 1.2 0.93 7.3 0.98
Rejuvenated (RJ) 2 7.5 0.99 0.067 1.3 0.99 6.4 0.99
10 7.5 0.99 0.065 1.3 0.98 6.2 0.99
100 8.7 0.99 0.083 1.5 0.98 7.2 0.99
PETG þ 5 wt% NPGDB As received (AR) 2 7.5 0.94 0.061 1.1 0.96 6.3 0.93
10 Brittle
100 Brittle
Rejuvenated (RJ) 2 7.9 0.99 0.066 1.1 0.97 7.0 0.99
10 7.5 0.99 0.066 1.0 0.95 6.5 0.99
100x 9.6 0.99 0.078 1.3 0.97 8.1 0.99
PETG þ 10 wt% NPGDB As received (AR) 2 Brittle
10 Brittle
100 Brittle
Rejuvenated (RJ) 2 7.5 0.99 0.063 1.0 0.94 6.5 0.99
10 7.4 0.99 0.074 0.9 0.93 6.5 0.99
100 Brittle
PETG þ 20 wt% NPGDB As received (AR) 2 6.3 0.99 0.071 1.3 0.98 5.0 0.99
10 6.2 0.99 0.086 1.1 0.97 5.0 0.99
100 Brittle
Rejuvenated (RJ) 2 6.4 0.99 0.065 1.2 0.97 5.2 0.99
10 6.4 0.99 0.071 1.0 0.97 5.3 0.99
100 brittle
bp is dimensionless; x at a given deformation rate means that the maximum threshold ligament was reduced owing to brittle fracture.
J. Karger-Kocsis et al. / Polymer 44 (2003) 5691–56995696
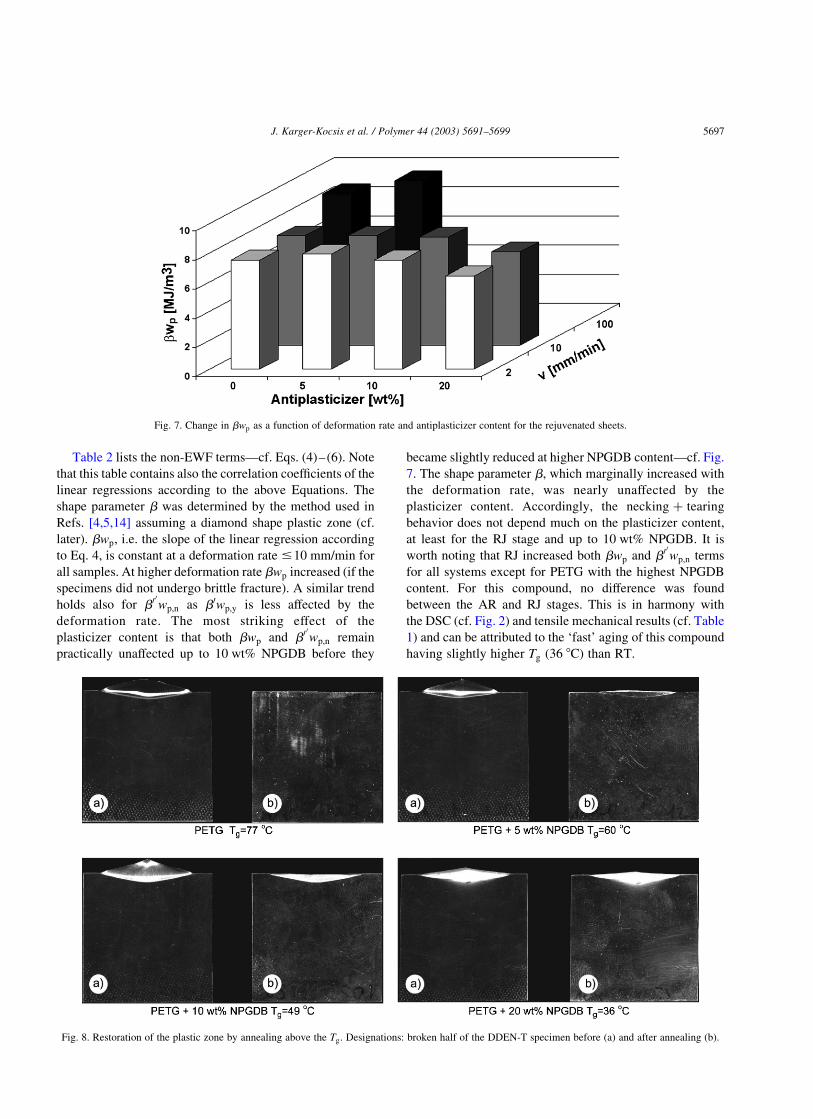
Table 2 lists the non-EWF terms—cf. Eqs. (4)–(6). Note
that this table contains also the correlation coefficients of the
linear regressions according to the above Equations. The
shape parameter b was determined by the method used in
Refs. [4,5,14] assuming a diamond shape plastic zone (cf.
later). bwp; i.e. the slope of the linear regression according
to Eq. 4, is constant at a deformation rate #10 mm/min for
all samples. At higher deformation rate bwp increased (if the
specimens did not undergo brittle fracture). A similar trend
holds also for b0 0wp;n as b0wp;y is less affected by the
deformation rate. The most striking effect of the
plasticizer content is that both bwp and b0 0wp;n remain
practically unaffected up to 10 wt% NPGDB before they
became slightly reduced at higher NPGDB content—cf. Fig.
7. The shape parameter b; which marginally increased with
the deformation rate, was nearly unaffected by the
plasticizer content. Accordingly, the necking þ tearing
behavior does not depend much on the plasticizer content,
at least for the RJ stage and up to 10 wt% NPGDB. It is
worth noting that RJ increased both bwp and b0 0wp;n terms
for all systems except for PETG with the highest NPGDB
content. For this compound, no difference was found
between the AR and RJ stages. This is in harmony with
the DSC (cf. Fig. 2) and tensile mechanical results (cf. Table
1) and can be attributed to the ‘fast’ aging of this compound
having slightly higher Tg (36 8C) than RT.
Fig. 7. Change in bwp as a function of deformation rate and antiplasticizer content for the rejuvenated sheets.
Fig. 8. Restoration of the plastic zone by annealing above the Tg: Designations: broken half of the DDEN-T specimen before (a) and after annealing (b).
J. Karger-Kocsis et al. / Polymer 44 (2003) 5691–5699 5697

4.3. Failure
Fig. 8 displays macrophotographs of the ligament area of
failed DDEN-T specimens cut with various plasticizer
contents before and after annealing just above the related Tg
ðTg þ 10 8C for 15 minÞ: Note that this condition agrees
with that of the rejuvenation. Based on Fig. 8 one can claim
that the plastic zone in the DDEN-T specimens was formed
by cold drawing, instead of true plastic deformation, as this
zone fully recovers (except PETG with 20 wt% NPGDB—
cf. Fig. 8). This recovery process is governed by the
entanglement network. It was suggested that the entangle-
ment network controls the fracture mechanical response of
amorphous polymer glasses [2]. The finding that bwp and
b00wp;n did not change with the plasticizer content (NPGDB
content #10 wt%) suggests that the entanglement charac-
teristics were also not affected. Increasing stress whitening
and less complete recovery of the plastic zone can be
noticed at high NPGDB content (cf. pictures b) of the
samples with 10 and 20 wt% NPGDB in Fig. 8). This
suggests that cold drawing might have been accompanied
with strain-induced crystallization. This aspect, documented
for amorphous polyethylene terephthalate [16], will be
evaluated in future studies.
It has been already demonstrated in Tables 1 and 2 that
aged specimens subjected to increasing deformation rates
failed in a brittle manner (cf. Fig. 9). A ductile/brittle
transition was also observed to occur as a function of the
ligament length under the same experimental conditions. In
such cases, the ‘valid’ ligament range was reduced before
determining the specific work of fracture terms.
5. Conclusions
Based on this work devoted to assessing the plane stress
fracture toughness of PETG sheets plasticized by neopen-
tylglycol dibenzoate (NPGDB) in physically aged (as
received, AR) and rejuvenated (RJ) stages using the EWF
method, the following conclusions can be drawn.
– Progressive physical aging can be followed by the
increase in the yielding-related specific EWF term.
This term correlates well with the yield strength, which
is widely used to trace the aging.
– The specific yielding-related EWF increased with
increasing deformation rate (from 2 to 100 mm/min)
and decreased with increasing NPGDB content (from 0
to 20 wt%).
– The specific non-EWF and its necking-related con-
stituent changed parallel to each other. They were
fairly constant for the compounds at each deformation
rate up to 10 wt% NPGDB and decreased above this
threshold.
– The plastic zone in the specimens was formed by cold
drawing as it was recovered by heating the broken
specimens above the Tg of the related compound. The
onset of stress whitening and a less complete recovery
of the plastic zone at high NPGDB content may be
attributed to strain-induced crystallization phenomena.
References
[1] Karger-Kocsis J. In: Williams JG, Pavan A, editors. Fracture of
polymers, composites and adhesives, 27. Oxford: Elsevier Science;
2000. p. 213.
[2] Karger-Kocsis J. In: Fakirov S, editor. Handbook of thermoplastic
polyesters, vol. 1. Wiley-VCH: Weinheim; 2002. p. 717.
[3] Karger-Kocsis J, Moskala EJ. SPE-ANTEC 2002;60:1751.
[4] Karger-Kocsis J, Czigany T, Moskala EJ. Polymer 1997;38:4587.
[5] Karger-Kocsis J, Czigany T, Moskala EJ. Polymer 1998;39:3939.
[6] Ching ECY, Li RKY, Mai Y-W. Polym Engng Sci 2000;40:310.
[7] Poon WKY, Ching ECY, Cheng CY, Li RKY. Polym Test 2001;20:
395.
[8] Arkhireyeva A, Hashemi S. J Mater Sci 2002;37:3675.
Fig. 9. SEM picture taken on the fracture surface of the DDEN-T specimens of PETG with 20 wt% NPGDB content with deformation rate of 2 (left) and
100 mm/min (right).
J. Karger-Kocsis et al. / Polymer 44 (2003) 5691–56995698

[9] Mouzakis DE, Karger-Kocsis J, Moskala EJ. J Mater Sci Lett 2000;
19:1615.
[10] Karger-Kocsis J, Moskala EJ. Polym Bull 1997;39:503.
[11] Liu C-H, Nairn JA. Polym Engng Sci 1998;38:186.
[12] Chartoff RP. In: Turi EA,, editors, 2nd ed. Thermal characterization of
polymeric materials, vol. 1. New York: Academic Press; 1981. p. 662.
[13] Mai Y-W, Wong S-C, Chen X-H. In: Paul DR, Bucknall CB, editors.
Polymer blends formulations and performance, vol. 2. New York:
Wiley; 1999. p. 17.
[14] Karger-Kocsis J, Moskala EJ. Polymer 2000;41:6301.
[15] Karger-Kocsis J, Ferrer-Balas D. Polym Bull 2001;46:507.
[16] Karger-Kocsis J, Moskala EJ, Shang PP. J Therm Anal Calorim 2001;
63:671.
J. Karger-Kocsis et al. / Polymer 44 (2003) 5691–5699 5699
Copyright © 2022 FDOKUMEN