Physically large displays improve performance on spatial tasks
29
Physically Large Displays Improve Performance on Spatial Tasks DESNEY S. TAN Microsoft Research DARREN GERGLE Northwestern University and PETER SCUPELLI and RANDY PAUSCH Carnegie Mellon University Large wall-sized displays are becoming prevalent. Although researchers have articulated qualita- tive benefits of group work on large displays, little work has been done to quantify the benefits for individual users. In this article we present four experiments comparing the performance of users working on a large projected wall display to that of users working on a standard desktop monitor. In these experiments, we held the visual angle constant by adjusting the viewing distance to each of the displays. Results from the first two experiments suggest that physically large displays, even when viewed at identical visual angles as smaller ones, help users perform better on mental rotation tasks. We show through the experiments how these results may be attributed, at least in part, to large displays immersing users within the problem space and biasing them into using more efficient cognitive strategies. In the latter two experiments, we extend these results, showing the presence of these effects with more complex tasks, such as 3D navigation and mental map formation and mem- ory. Results further show that the effects of physical display size are independent of other factors that may induce immersion, such as interactivity and mental aids within the virtual environments. We conclude with a general discussion of the findings and possibilities for future work. Categories and Subject Descriptors: H.5.2 [Information Interfaces and Presentation]: User Interfaces—Screen design, user-centered design, graphical user interfaces; J.4 [Social and Behav- ioral Sciences]—Psychology General Terms: Design, Experimentation, Human Factors, Performance Additional Key Words and Phrases: Large display, field of view, visual angle, spatial task, immer- sion, presence, 3D navigation, mental map formation, human memory Authors’ addresses: D. S. Tan, Microsoft Research, One Microsoft Way, Redmond, WA 98052; email: [email protected]; P. Scupelli, R. Pausch, Carnegie Mellon University, 5000 Forbes Ave., Pitts- burgh, PA 15213; email: {pgs,pausch}@cs.cmu.edu; D. Gergle, Northwestern University, Frances Searle Building, Evanston, IL 60208; email: [email protected]. Permission to make digital or hard copies of part or all of this work for personal or classroom use is granted without fee provided that copies are not made or distributed for profit or direct commercial advantage and that copies show this notice on the first page or initial screen of a display along with the full citation. Copyrights for components of this work owned by others than ACM must be honored. Abstracting with credit is permitted. To copy otherwise, to republish, to post on servers, to redistribute to lists, or to use any component of this work in other works requires prior specific permission and/or a fee. Permissions may be requested from Publications Dept., ACM, Inc., 1515 Broadway, New York, NY 10036 USA, fax: +1 (212) 869-0481, or [email protected]. C 2006 ACM 1073-0616/06/0300-ART3 $5.00 ACM Transactions on Computer-Human Interaction, Vol. 13, No. 1, March 2006, Pages 71–99.
Transcript of Physically large displays improve performance on spatial tasks
Physically Large Displays ImprovePerformance on Spatial Tasks
DESNEY S. TAN
Microsoft Research
DARREN GERGLE
Northwestern University
and
PETER SCUPELLI and RANDY PAUSCH
Carnegie Mellon University
Large wall-sized displays are becoming prevalent. Although researchers have articulated qualita-
tive benefits of group work on large displays, little work has been done to quantify the benefits for
individual users. In this article we present four experiments comparing the performance of users
working on a large projected wall display to that of users working on a standard desktop monitor.
In these experiments, we held the visual angle constant by adjusting the viewing distance to each
of the displays. Results from the first two experiments suggest that physically large displays, even
when viewed at identical visual angles as smaller ones, help users perform better on mental rotation
tasks. We show through the experiments how these results may be attributed, at least in part, to
large displays immersing users within the problem space and biasing them into using more efficient
cognitive strategies. In the latter two experiments, we extend these results, showing the presence of
these effects with more complex tasks, such as 3D navigation and mental map formation and mem-
ory. Results further show that the effects of physical display size are independent of other factors
that may induce immersion, such as interactivity and mental aids within the virtual environments.
We conclude with a general discussion of the findings and possibilities for future work.
Categories and Subject Descriptors: H.5.2 [Information Interfaces and Presentation]: User
Interfaces—Screen design, user-centered design, graphical user interfaces; J.4 [Social and Behav-ioral Sciences]—Psychology
General Terms: Design, Experimentation, Human Factors, Performance
Additional Key Words and Phrases: Large display, field of view, visual angle, spatial task, immer-
sion, presence, 3D navigation, mental map formation, human memory
Authors’ addresses: D. S. Tan, Microsoft Research, One Microsoft Way, Redmond, WA 98052; email:
[email protected]; P. Scupelli, R. Pausch, Carnegie Mellon University, 5000 Forbes Ave., Pitts-
burgh, PA 15213; email: {pgs,pausch}@cs.cmu.edu; D. Gergle, Northwestern University, Frances
Searle Building, Evanston, IL 60208; email: [email protected].
Permission to make digital or hard copies of part or all of this work for personal or classroom use is
granted without fee provided that copies are not made or distributed for profit or direct commercial
advantage and that copies show this notice on the first page or initial screen of a display along
with the full citation. Copyrights for components of this work owned by others than ACM must be
honored. Abstracting with credit is permitted. To copy otherwise, to republish, to post on servers,
to redistribute to lists, or to use any component of this work in other works requires prior specific
permission and/or a fee. Permissions may be requested from Publications Dept., ACM, Inc., 1515
Broadway, New York, NY 10036 USA, fax: +1 (212) 869-0481, or [email protected]© 2006 ACM 1073-0616/06/0300-ART3 $5.00
ACM Transactions on Computer-Human Interaction, Vol. 13, No. 1, March 2006, Pages 71–99.

72 • D. S. Tan et al.
1. INTRODUCTION
Even though we have experience in designing both real and virtual worlds,Ishii and Ullmer [1997] observe that the two worlds remain largely disjointand that there exists “a great divide between the worlds of bits and atoms.” Intheir work, they identify input devices as bridges that serve to connect the twoworlds. They focus on understanding how physical objects and architecturalsurfaces can be used to control digital objects in the virtual world. Using theirtangible interfaces, they attempt to build computing environments that supporthuman thought and action.
However, little effort has been spent on understanding the design of thephysical computer and its associated display devices [Buxton 2001]. Most workin this area has focused on pragmatic issues surrounding the changing formfactors of displays, but few researchers have devoted much attention to under-standing how physical affordances of these displays fundamentally affect hu-man perception and thought. As such, design principles have been uniformlyapplied across a variety of display devices that offer different cognitive andsocial affordances.
With recent advances in technology, large wall-sized displays are becomingprevalent. Although many researchers have articulated qualitative benefitsof group work on large displays (e.g. Swaminathan and Sato [1997]), muchless has been done to systematically quantify and exploit these benefits forindividual users. Furthermore, within the work aimed at quantifying benefits oflarge displays, little has been done to understand physical size as an importantdisplay characteristic that affects task performance.
In this article, we describe a series of experiments comparing the perfor-mance of users working on a large projected wall display to that of users work-ing on a standard desktop monitor. Because we were interested in isolating theeffects of physical size, we kept the visual angle subtended from the user to eachof the two displays constant by adjusting the viewing distances appropriately(see Figure 1). We also held other factors such as resolution, refresh rate, color,brightness, contrast, and content as constant as possible across displays. Sincethe information content shown by each of the displays was equivalent, it wouldbe reasonable to expect that there would be no difference in performance onone display or the other. However, we will show that this is not the case, andthat physical size is indeed an important display characteristic that must beconsidered as we craft our display systems.
Results suggest that physically large displays, even at identical visual anglesas small displays, increase performance on spatial tasks such as 3D navigationas well as mental map formation and memory. We show through the experi-ments, how these results might be attributed, at least in part, to large displaysimmersing users and biasing them into adopting more efficient cognitive strate-gies. Furthermore, the effects caused by physically large displays seem to be in-dependent of other factors that may induce immersion or increase performance.For example, even though interactivity and mental aids such as distinct land-marks and rich textures within virtual worlds increase task performance on thetasks tested, they did not affect the benefits that large displays offer to users.
ACM Transactions on Computer-Human Interaction, Vol. 13, No. 1, March 2006.

Physically Large Displays Improve Performance on Spatial Tasks • 73
Fig. 1. Basic experimental setup maintaining visual angles between the small and the large dis-
plays by adjusting the distance appropriately.
2. RELATED WORK
In constructing complex workspaces, researchers have pursued the use of largedisplays for collaborative tasks [Chou et al. 2001; Elrod et al. 1992; Raskar et al.1998; Streitz et al. 1999; Tani et al. 1994]. Large displays in these settings areeasy for all users to see and interact with [Guimbretiere 2002], providing a con-duit for social interaction. Some of these researchers have begun to documentperformance increases for groups working on large displays [Dudfield et al.2001].
While much work has focused on collaboration, less has been done to de-sign for and objectively measure individual gains on large displays. To thisend, researchers have explored the use of large displays as a means to providecontextual information to the individual. For example, Baudisch et al. [2002]provide a large low-resolution overview of the working context around a smallerhigh-resolution focal screen.
Other researchers have realized that large displays may afford users agreater sense of presence, which may benefit performance of certain tasks.Slater and Usoh [1993] define presence as “a state of consciousness, the (psy-chological) sense of being in the virtual environment.” They distinguish it fromimmersion, which they define to be an objective description of the technology,describing “the extent to which computer displays are capable of delivering . . .
illusion of reality to the senses of the human participant.” In most currentmodels, the sense of presence is seen as the direct outcome of immersion.
The more inclusive, extensive, surrounding, and vivid the display, the higherthe potential of presence [Bystrom et al. 1999]. In fact, when users are presentin Virtual Environments (VEs), the location of their physical bodies is oftenconstrued as being contained within that space rather than looking at it fromthe outside. It is in this state that users are most effective in VEs. Tan et al.[2001] utilize large peripheral projection displays to show different scenes ofdistinct ‘places’ that the user can use as cues to remember more information.They claim that the greater the sense of presence invoked in the user by thelarge display, the better the memory for learned information. They do not,
ACM Transactions on Computer-Human Interaction, Vol. 13, No. 1, March 2006.

74 • D. S. Tan et al.
however, articulate explanations for the increased sense of presence on thelarge display. We discuss several factors that may cause this effect.
One of these factors is field of view (FOV). Large displays are not often placedat a distance that is proportional to their increase in size over small displays.Due to space constraints, they are typically relatively closer and cast a largerretinal image, thus offering a wider FOV. It is generally agreed that wider FOVscan increase “immersion” in VEs [Lin et al. 2002; Prothero and Hoffman 1995].Researchers in the entertainment industry have reported that larger displaysfilling a wider FOV can increase the level of involvement experienced by users[Childs 1988]. Czerwinski et al. [2002] report evidence that a wider field of viewoffered by a large display leads to an increased sense of presence and improvedperformance in 3D navigation tasks, especially for females. They documentprior literature suggesting that restricting FOV leads to negative impacts onperceptual, visual, and motor performance in various tasks, possibly becauseusers find it difficult to transfer real world experience and cognition into theVE. Arthur [2000] provides a comprehensive review of the effects of FOV ontask performance, especially as carried out in head-mounted displays.
Despite the large amount of work done in comparing FOVs, few researchershave isolated the effects of physical size and distance on task performance or thesense of presence. To examine the psychophysical effects of distance and size,Chapanis and Scarpa [1967] conducted experiments comparing the readabilityof physical dials at different distances. They used dials of different sizes andmarkings that were proportional to the viewing distance so as to keep visualangles constant. Surprisingly, they found that beyond 28 inches away, dialsadjusted to subtend the same visual angle were read more easily at greaterdistances. The effects they found were, however, relatively small.
In a more recent study, Patrick et al. [2000] compared various display tech-nologies, with comparable visual angles, and their effects on the spatial infor-mation users acquired by navigating through a VE. They found that while usersperformed significantly worse in forming cognitive maps and remembering theenvironment on a desktop monitor, they performed no differently using a head-mounted display or a large projection display. They attributed part of this effectto a higher level of presence afforded by the size of the projection display, whichcompensated for the immersion afforded by the head tracking. In our work, wefurther explore the effects of display size and distance, with constant FOV orvisual angle, on users’ sense of presence and performance on various tasks.
In our work, we chose to explore mental rotation tasks because presentation,degree of immersion, and level of performance have been extensively measuredfor these tasks. In their work, Suzuki and Nakata [1988] had students performa mental rotation task similar to that of Shepard and Metzler [1971]. Userswere asked to judge whether pairs of figures, each of which had been rotatedto different degrees, were identical in shape or not. They found, as Shepardand Metzler did, that mean reaction times increased linearly with the angu-lar difference between figures. They also discovered that wider visual angles,corresponding to wider retinal size, of the objects slowed the speed of rotation.However, in this study, viewing distance, given constant visual angle, did notseem to affect reaction times.
ACM Transactions on Computer-Human Interaction, Vol. 13, No. 1, March 2006.
Physically Large Displays Improve Performance on Spatial Tasks • 75
Fig. 2. Top view schematic of the experimental setup. We maintained constant visual angles by
varying display size and distance accordingly.
Building on this work, Wraga et al. [2000] measured spatial knowledge bythe time it took users to update their orientation after changing it. Resultsshowed that users were faster at spatial updating when they imagined rotat-ing themselves in the environment rather than when rotating the environmentaround themselves. Carpenter and Proffitt [2001] extended these findings byexamining egocentric rotations in each of the three possible rotation planes.They replicated the finding that egocentric rotation, or rotating one’s self, wasfaster than exocentric rotation, rotating the environment, but only for planesin which users had experience rotating or locomoting. Tlauka [2002] foundsimilar results by comparing rotations of images presented horizontally orvertically.
Despite the deep understanding this body of literature offers, there seemsto be a gap in work isolating the effects of display size and distance, givena constant visual angle, for performance on tasks. Because of the emergenceof large displays in the workplace and in consideration of everyday desktopcomputing tasks, we decided to evaluate how display size affects performanceon spatial orientation and reading comprehension tasks.
3. GENERAL EXPERIMENTAL SETUP
3.1 Equipment
We used two displays for each of the experiments, an Eiki Powerhouse One LCDprojector and a standard-sized desktop monitor. In the first two experiments,we used an 18′′ Sony Trinitron E400 CRT monitor as the desktop monitor. Inthe other experiments, we replaced this with an 18′′ NEC MultiSync 1810XLCD monitor. All displays ran at a resolution of 1024 × 768, updated at arate of 60 Hz, and were calibrated to be of roughly equivalent brightness andcontrast. We mounted the projector from the ceiling and projected onto a whitewall. The image projected on the wall was 76′′ wide by 57′′ tall (see Figure 2).
ACM Transactions on Computer-Human Interaction, Vol. 13, No. 1, March 2006.

76 • D. S. Tan et al.
The image on the monitor was 14′′ wide by 10.5′′ tall. We set the two displaysup so that when either display was viewed from a specific spot in the room,the visual angle and hence the size of the retinal image, would be identical.We assumed a comfortable viewing distance of 25′′ for the monitor. In order toget an image of identical perceived size, the projection was set up to be 136′′
away from the user. The center points of all displays were set to be at seatedeye-height, approximately 48′′ above the ground.
Since the environmental context around each display could potentially affectusers, we decided to keep the context as constant as possible by only movingthe displays within the environment rather than having the user turn to facea different display with different environmental context. Hence, we carefullymarked the position of the monitor so that it could be moved in and out asnecessary.
We ran the exploratory and first two experiments on a single 800 MHz Dellcomputer equipped with a dual headed nVidia GeForce2 MX graphics card. Wecontrolled the activation and deactivation of the displays using the Windows2000 multiple monitor API so that only one display was active at any given time.For these experiments, the user provided input using an IBM USB numerickeypad with keys we had marked for the experiment. We ran the latter twoexperiments on a 1.33 GHz computer with a GeForce4 MX graphics card. Thevirtual environments updated at 60 frames per second. We used a switchboxto send the graphics output to only one of the displays at any given time. Theuser provided input with the control stick and trigger button on a Radioshack26-444 joystick.
3.2 Keeping Color, Brightness, Contrast Constant
We did several things to equate display characteristics such as color, brightness,and contrast across the various displays. Initially, we used a spectral radiometerand a colorimeter to measure the spectral distribution of the light coming offthe displays as well as the tristimulus values of this distribution when variousimages were displayed. Unfortunately, as observed by MacIntyre and Cowan[1992], calibration done to an exact radiometric or colorimetric standard isboth expensive and laborious. This is especially true of our setup, in which wewere trying to calibrate different display technologies. Calibration is furthercomplicated by human visual phenomena such as light, dark, chromatic, ortransient adaptations [Milner and Goodale 1996].
To confirm our calibrations, we took Tjan’s [1996] view that a “human ob-server is always needed to carry out a color matching experiment.” In fact,we assumed this to be the case for brightness and contrast as well. Aftercalibrating the displays, we had groups of people view the two sets of dis-plays. With questions such as “which screen do you think is brighter?” or“which screen has better contrast?” we were able to confirm that display set-tings were as close as we could get them. We iterated this process until userscould not make these distinctions between the displays. It is also worth notingthat the quality of the large projection display was probably poorer than thatof the desktop monitor in all these regards. There is little reason to believe
ACM Transactions on Computer-Human Interaction, Vol. 13, No. 1, March 2006.

Physically Large Displays Improve Performance on Spatial Tasks • 77
that the degraded quality would elicit any of the effects that we saw in theexperiments.
3.3 Keeping Users’ Heads Still
Another concern with the setup was that the visual angle calculations wereonly valid for a single point in the room. This meant that if users moved theirheads from that point, the visual angles were no longer maintained betweenthe two displays. This would cause complication in interpreting results. Eventhough the most controlled solution would have been to fasten the user’s headin place to prevent any movement, we decided against this because it wouldmake the experiment both uncomfortable and unrealistic.
Instead, we marked the spot around which the user’s eyes should have beencentered by stretching fishing line from two stands, one on either side of theuser. A mark in the center of the line indicated the exact spot in the roomwhere the retinal images would be of identical size. For each user, we adjustedthe chair so that they were seated comfortably with their eyes as close to thespot as possible and told them not to further move the chair. We then removedthe fishing line. In the rare case where users moved their heads or chair toomuch during the study, we readjusted their position before proceeding. In theinitial pilot testing we found that the range of motion was rarely more than 2′′
to 3′′ in any direction.At various stages in this work, we also ran informal tests to validate exper-
imental results when users’ eyes were either a little too close or too far fromthe desired point in the room and saw similar effects to those observed in theexperiments. Hence, we are fairly confident that the small head movementspermitted within the setup did not directly account for the effects seen acrossthe experiments, and we were able to run the studies in a more realistic taskenvironment that allows us to make claims with a greater degree of externalvalidity.
4. EXPLORATORY EXPERIMENTS
In an early set of experiments we showed that although there were no ob-servable differences on a reading task, users performed about 26% better ona spatial orientation task done on the large display as compared to a smallerone, even when we held visual angles and other display characteristics constant[Tan et al. 2003].
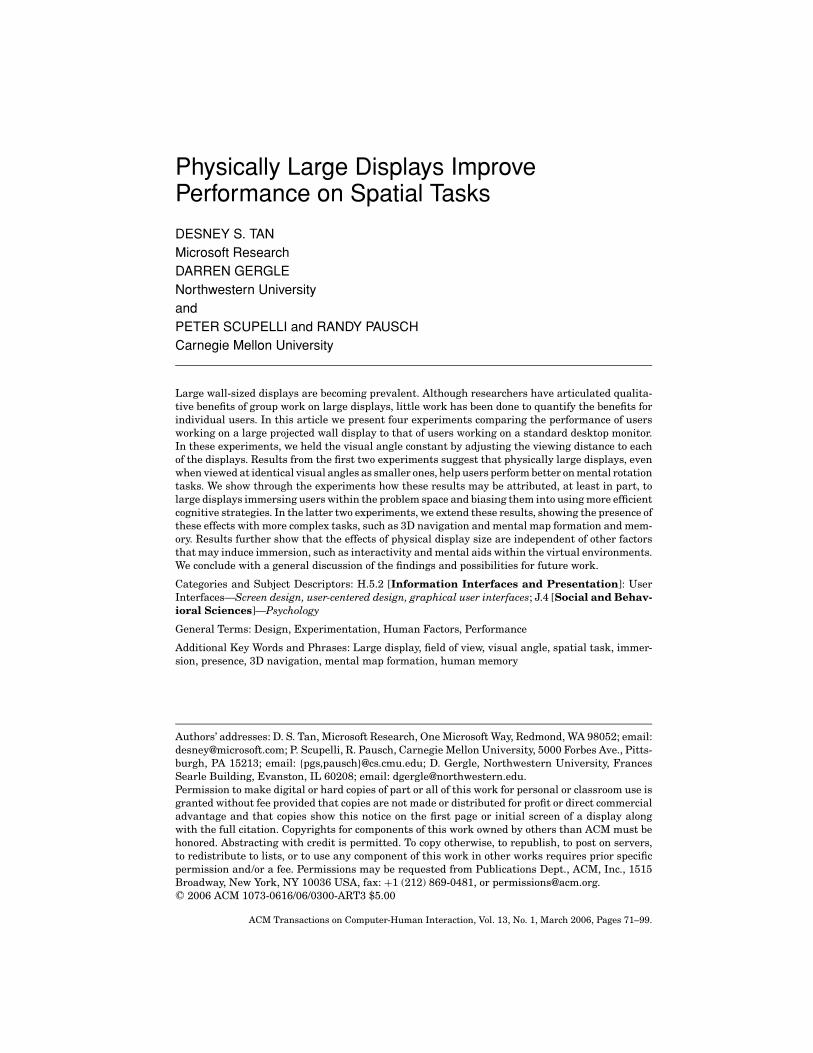
We used the Guilford-Zimmerman Spatial Orientation test [Guilford andZimmerman 1948]. Results from this test have been shown to correlate highlywith wayfinding ability [Infield 1991]. Each question in this test contained twopictures seen from the prow, or front, of a boat along with a multiple choiceanswer key (see Figure 3). The user was asked to imagine that each picturewas taken with a camera fastened rigidly to the boat so that the camera bobbedup and down, slanted, and turned with the boat. First, the user looked at the toppicture to see where the boat was initially heading. This heading is representedby the dot in the answer key. Next, the user looked at the bottom picture anddetermined the change in orientation of the boat. The line in each of the possible
ACM Transactions on Computer-Human Interaction, Vol. 13, No. 1, March 2006.
78 • D. S. Tan et al.
Fig. 3. Sample question from the Guilford-Zimmerman Spatial Orientation test. The correct an-
swer for this question is option 5.
answers represents the new orientation of the boat relative to the previousheading. Finally, the user selected the answer with the number keys, confirmedthe answer with the enter key, and proceeded to the next question. Users had5 minutes to answer 30 questions in each section, and were told to work asquickly and accurately as possible.
The fact that we found differences in the spatial task but not the readingcomprehension task led us to believe that there may be an interaction betweenthe task and the display size. We hypothesized that the performance differenceon the spatial orientation task was due to the way the image was perceived andthus the strategy with which users performed the task. In pilot studies, we triedusing questionnaires as well as structured interviews to determine the strategyusers employed, but found these methods to be inconclusive. Users were notable, either implicitly or explicitly, to articulate their cognitive strategy. Hence,we designed Experiment 1 to explore this more deeply.
5. EXPERIMENT 1: LARGE DISPLAYS BIAS USERSINTO EGOCENTRIC STRATEGIES
One explanation that accounts for performance differences in spatial orienta-tion tasks is the choice of cognitive coordinate systems used to perform the task.This choice usually has implications on the particular strategy and hence theefficiency of performing the task. Just and Carpenter [1985] propose two strate-gies that might be used to perform the Guilford-Zimmerman test: an egocentricstrategy and an exocentric one. Users performing the task egocentrically takea first-person view and imagine rotating their bodies within the environment.Users performing the task exocentrically take a third-person view and imagineobjects rotating around each other in space. There is reasonable evidence inpsychology research suggesting that egocentric strategies are more efficient forreal world tasks (e.g. Carpenter and Proffitt [2001]). Hence,
Hypothesis 1a: Simple instructions and training prior to the test aresufficient to bias users into adopting either the egocentric strategy orthe exocentric one when they perform the task.
Hypothesis 1b: The egocentric strategy is more efficient than the exo-centric one for this spatial orientation task.
The instructions for the Guilford-Zimmerman test are carefully worded so asnot to bias strategy choice one way or another. This allows users to either
ACM Transactions on Computer-Human Interaction, Vol. 13, No. 1, March 2006.

Physically Large Displays Improve Performance on Spatial Tasks • 79
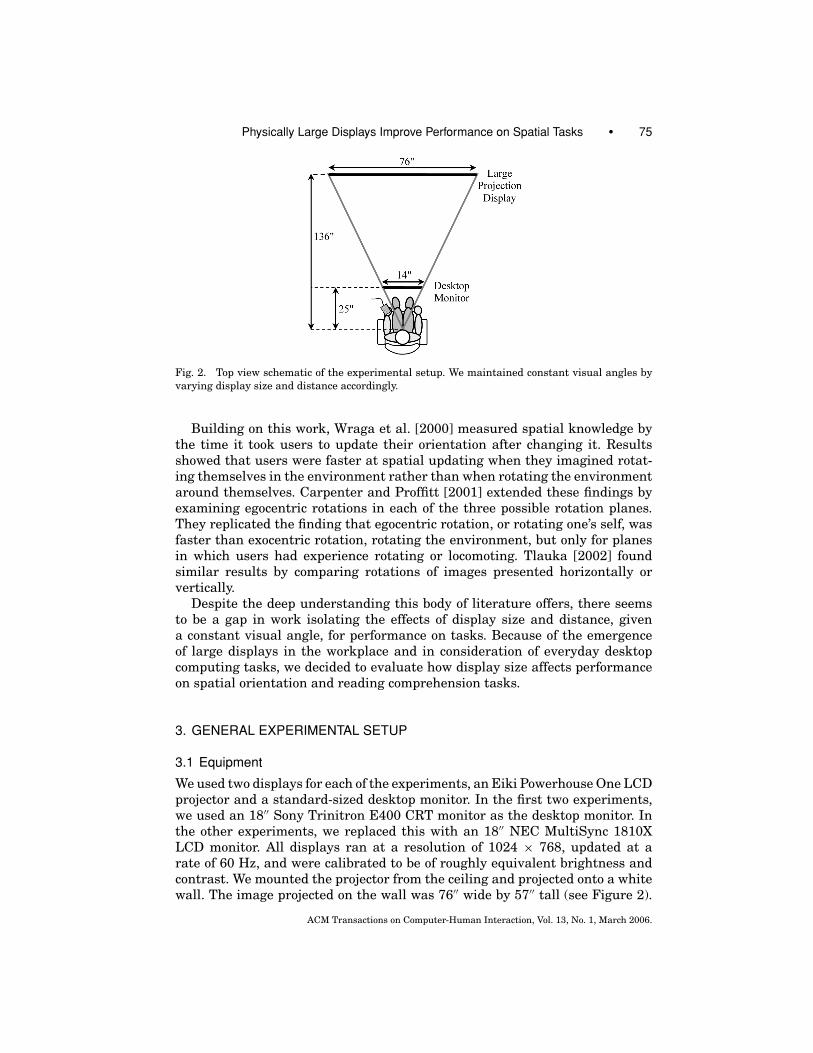
Fig. 4. (left) Numeric keypad input device used in the first three experiments. User working on
the small (center) and large (right) displays.
imagine themselves on the boat looking through the camera as the boat moveswithin the environment (egocentric), or outside the environment as the boat ro-tates within it (exocentric). We believed that as users became more immersedin the task on the large display they were more likely to adopt the egocentricstrategy. Since egocentric rotations have been shown to be quicker, this couldexplain the performance increase we observed on the large display. Thus,
Hypothesis 1c: With no explicit strategy provided, display size auto-matically biases users into adopting one or the other of the strategies.Small displays bias users into adopting an exocentric strategy, andlarge displays bias users into adopting an egocentric strategy.
5.1 Participants
Forty-two (18 female) college students from the Pittsburgh area, who didnot participate in the exploratory experiments, participated in this one. Wescreened users to have normal or corrected-to-normal eyesight. The averageage of users was 21.8 (21.7 for males, 22.2 for females), ranging from 18 to 35years of age. The experiment took about an hour and users were paid for theirparticipation.
5.2 Procedure
After users filled out a background survey, we gave them the numeric keypadand had them sit comfortably in the chair (see Figure 4). As previously de-scribed, we adjusted the height and position of their chair so that the center oftheir eyes was as close to the marked fishing line as possible. Once they wereviewing the displays from the spot in the room that provided retinal images ofidentical size, we removed the fishing line. At this point, we instructed usersnot to further adjust the chair or move it around.
Instructions for the original Guilford-Zimmerman test did not explicitly biasa user into any particular strategy. It describes a boat within a scene, withno indication of the user’s place within this environment. The instructionstell users only to “note how the position of the boat has changed in the sec-ond picture in relation to the original position in the first picture.” From thisinstruction set, we created two others, one that intentionally biased usersinto an egocentric strategy and another that biased them into an exocentric
ACM Transactions on Computer-Human Interaction, Vol. 13, No. 1, March 2006.

80 • D. S. Tan et al.
strategy. The egocentric instructions describe a scene in which users are askedto imagine themselves physically on the boat as it moves within the environ-ment. The egocentric instructions now read, “You are standing on top of a boatthat is on the movie set. The crew is moving the boat as you are on the boat.Two pictures are taken, one before the boat moves and one after. In each itemyou are to note how the position of the tip of the boat has changed in relation tothe painted backdrop.” The exocentric instructions describe the boat as a rigidprop mounted to the ground with the scene on a backdrop that is moving withrespect to the boat. Hence, the instructions given are, “You are standing on topof a boat firmly attached to the floor of the movie set. The crew is moving apainted backdrop on the set. Two pictures are taken, one before the paintedbackdrop is moved and one after. In each item you are to note how the positionof the painted set backdrop has changed relative to the tip of the boat on themovie set.” For the entire instruction and stimulus set, see Tan [2005]. Afterbalancing for Gender, we randomly assigned each participant to one of the threeInstruction Types: Egocentric Instructions, Exocentric Instructions, or OriginalGuilford-Zimmerman Instructions.
We gave users paper-based instructions appropriate for the condition theywere in. They then tried three practice questions. For these questions, the sys-tem provided users with immediate feedback explaining the correct answers.After they had completed the practice questions, users performed the test onboth the small and the large display, which we will refer to as the Display Sizemanipulation. The order of Display Size was counterbalanced across users.Users were not given feedback for the test questions. The 60 test questionswere randomized and broken into two sets. Users had 5 minutes to answer 30questions in each of the two conditions, and were told to work as quickly and ac-curately as possible. Users had a 30 second rest interval between each condition.
After users completed the tests, they filled out a questionnaire indicatingtheir preference for the conditions in each of the tasks. They were also encour-aged to comment on their opinion of the displays.
5.3 Results
First we present performance results for the spatial orientation task, and thenwe examine the preference data.
5.3.1 Effects of Strategies on Task Performance. We analyzed data for thespatial orientation task at the summary level. The dependent variable wasthe percentage of correct responses (number correct/number attempted). Timedifferences between different Display Sizes were not significantly different andwere therefore dropped from the final models. Levels of significance did notchange either way. We analyzed the percentage of correct responses with a2 (Display Size) × 3 (Instruction Type) × 2 (Position) × 2 (Gender) repeatedmeasures analysis of variance (RM-ANOVA). The Position variable refers to theorder in which a given user worked on each level of the Display variable, andallowed us to explore ordering as well as skill transfer effects across Displays.We analyzed Instruction Type, Position, and Gender as between-subjects factorsand Display Size as a within-subject factor.
ACM Transactions on Computer-Human Interaction, Vol. 13, No. 1, March 2006.

Physically Large Displays Improve Performance on Spatial Tasks • 81
Fig. 5. Main effects of Strategy, with users performing significantly better with Egocentric Instruc-
tions than Exocentric ones. Also, results suggest that users with Unbiased Instructions perform
with exocentric strategies when using the Small Display, and with egocentric strategies when using
the Large Display. Error bars represent standard error.
Overall, we found a significant effect of Instruction Type (F(2, 37) = 3.866,p = .030; see Figure 5). Paired comparisons showed a significant differencebetween the egocentric and the exocentric instruction sets (p = .01), with usersgetting a higher percentage of questions correct with egocentric instructionsthan the exocentric ones (66.5% vs. 47.2%, respectively).
We conducted planned contrasts to see if users who were explicitly instructedto use a given strategy performed any differently from users who implicitlychose a strategy due to the Display Size. We found no significant differencesbetween users in the exocentric condition and the unbiased small display con-dition, which was assumed to elicit an exocentric strategy (t(40) = .079, p =.9371). Similarly, we found no significant differences between users in the ego-centric condition and the unbiased large display condition, assumed to elicit anegocentric strategy (t(40) = 0.953, p = .3463). Rather than pooling Display Sizein the exocentric and egocentric conditions, we also conducted tests comparingperformance on the small display in the exocentric condition to the small dis-play in the unbiased condition, as well as the large display in the egocentriccondition to the large display in the unbiased condition. In both cases, therewere no significant differences. These results, seen in Figure 5, replicate find-ings from the initial experiments as well as provide support for our hypothesisthat large displays provide a greater sense of presence and bias users into usingegocentric strategies.
5.3.2 Preference Data. We gathered preference data from the participantsat the conclusion of the experiment. The merged preference data for all threeInstruction Type conditions were not significantly in favor of the large display.We explored whether or not users in the different Instruction Types viewed thevalue of the displays differently. We found in paired comparisons that users withthe egocentric instructions and the unbiased instructions preferred the largedisplay significantly more than users given the exocentric instructions for ‘Ease
ACM Transactions on Computer-Human Interaction, Vol. 13, No. 1, March 2006.

82 • D. S. Tan et al.
of Seeing’ (p = .034 and p = .046, respectively) and marginally significantly morein ‘Confidence in Rotation’ (p = .064 and p = .077, respectively). However, wedid not see any significant differences in ‘Overall Preference’ across InstructionTypes, suggesting that effects were probably not driven entirely by displaycharacteristics and subjective preference. In general, these satisfaction ratingscomplement the performance results nicely.
5.4 Summary
Although we were not able to directly measure choice of cognitive strategy in ourpilot experiments, results from this experiment indicate that users performedbetter when they used an egocentric strategy than when they used an exocentricone. Also, simple instructions and training were indeed sufficient to bias usersinto adopting one or the other of the strategies. In the absence of an explicitstrategy, users seem to have chosen an exocentric one when working on thesmall display and the much more efficient egocentric one when working onthe large display. Results from this experiment suggest that, given a constantvisual angle, the size of a display implicitly affects choice of cognitive strategyand hence performance in spatial orientation tasks. While we assert that thisstrategy choice is due to large displays offering a greater level of immersion,explicitly demonstrating the causality remains future work.
In the next experiment, we provide additional support and insight into thisexplanation. If the explanation is correct, and the cause of the observed per-formance benefits is the implicit choice of an egocentric strategy, we wouldexpect not to see benefits in tasks for which egocentric strategies do nothelp.
6. EXPERIMENT 2: LARGE DISPLAYS DO NOT AID EXOCENTRIC TASKS
While Guilford [1972] considered a single spatial orientation factor in his work,other researchers (e.g. Lohman [1979]) have identified three related spatialability factors: spatial egocentrism, the ability of the observer to imagine theirbody in a different position so that they can figure out how a stimulus arraywill appear from another perspective; spatial relations, the ability to identifycertain objects when seen from different positions; and visualization, the abilityto form a mental image of something that is not visible.
The Guilford-Zimmerman Spatial Orientation test used in the first experi-ment allowed the user to use either spatial egocentrism or exocentric spatialrelations strategies to perform the task. It was the choice of these strategies,biased either by prior instructions or by the size of the display that accountedfor the observed performance differences. In this experiment, we picked tasksthat did not seem like they would benefit from doing the task with a spatiallyegocentric strategy. Thus,
Hypothesis 2: Large displays bias users into using egocentric strate-gies and do not increase performance on ‘intrinsically exocentric’ tasksfor which egocentric strategies are not useful.
ACM Transactions on Computer-Human Interaction, Vol. 13, No. 1, March 2006.

Physically Large Displays Improve Performance on Spatial Tasks • 83
6.1 Participants
Twenty-four (12 female) college students from the Pittsburgh area, who did notparticipate in the previous experiments, participated in this one. As before, wescreened users to have normal or corrected-to-normal eyesight. The averageage of users was 24.1 (24.4 for males, 23.8 for females), ranging from 18 to 44years of age. The experiment took about an hour and users were paid for theirparticipation.
6.2 Procedure
We used the same hardware setup as in the previous experiments. The tasksused in this experiment were selected because they are object-centric problemsand have been described as inherently exocentric tasks that would not benefitfrom having the user imagine their body within the problem space (i.e., theywould not benefit from the participants using an egocentric strategy). The firsttwo tasks, the Card test and the Cube test, are subtests S-1 and S-2 of theETS Kit of Factor-Referenced Cognitive Tests [Ekstrom et al. 1976]. The testsare inspired by Thurstone’s cards and cubes [Thurstone and Thurstone 1941].The third task, the Shepard-Metzler test [Shepard and Metzler 1971], is a taskcommonly used to study mental rotation. We used a subset of questions fromthis test.
Before beginning the tasks, subjects filled out a background questionnaireand adjusted themselves in the chair so that their eyes were as close to theappropriate point in the room that ensured equivalent visual angles betweendisplays. Subjects then did each of the Card Test, the Cube Test, and theShepard-Metzler Test, in that order. This experiment was a within-subjects de-sign, with each subject performing each of the tasks in both the Large Displayand Small Display conditions in an order that was counterbalanced betweensubjects. Finally, they completed a preference survey.
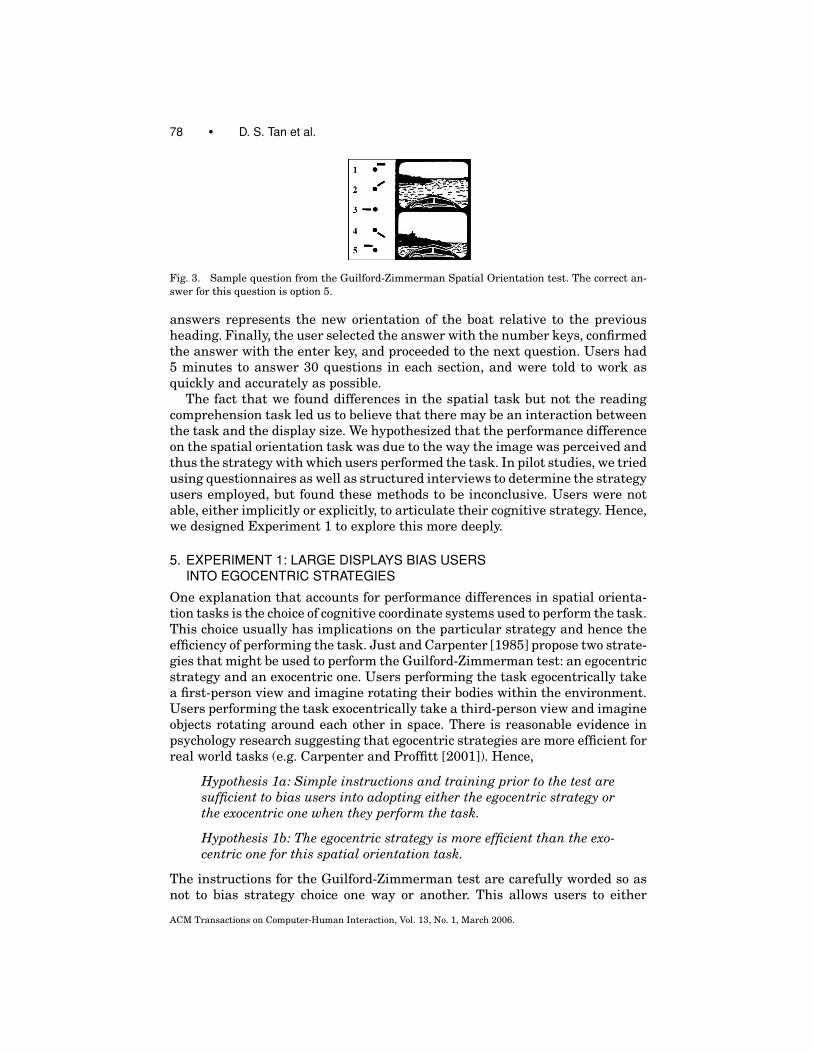
6.2.1 Card Test. In each question of this test, the user saw two cards, eachwith the image of an irregular shape (see Figure 6). The two cards showedeither the same shape or mirror images of the shape, rotated to different de-grees. The user’s task was to mentally rotate the cards in the plane and deter-mine if they represented the same shape or if they were mirror images of eachother.
The original paper-based test presented a single base image to which eightother images were compared. Each section of the test was printed on a singlepage with 10 such rows of questions, for a total of 80 questions. In the computer-based version of this test, we showed each pair of cards one pair at a time,advancing to the next pair only when the user responded to the question. Theleft card in each pair corresponded to the base shape in the paper-based test.Users had 3 minutes to complete each set of 80 questions.
6.2.2 Cube Test. In each question of this test, the user saw two cards, eachwith the drawing of a cube containing different characters in different orienta-tions on each face (see Figure 6). Users were told that no character appeared onmore than one face of a given cube. The user’s task was to mentally rotate the
ACM Transactions on Computer-Human Interaction, Vol. 13, No. 1, March 2006.

84 • D. S. Tan et al.
Fig. 6. Exocentric tests that do not benefit from egocentric strategies, or user imagining their
bodies within the problem space. In each, the user has to mentally rotate images to determine if
they can be of the same object.
cubes and determine if the drawings could have represented the same physicalcube, or if they were definitely different cubes.
Similar to the Card test, the paper-based test presented each set of 21 dis-tinct pairs simultaneously on a single page. In the computer-based version,we showed each pair one at a time, again advancing only when the userhad provided an answer. Users had 3 minutes to complete each set of 21questions.
6.2.3 Shepard-Metzler Test. This test is similar to the Card test exceptthat the mental rotation task is three-dimensional. Each question presents twodrawings of objects in space (see Figure 6). Each object consists of 10 solid cubesattached face-to-face to form a rigid arm-like structure. Users had to mentallyrotate the objects in space in order to determine if they were the same object, orif they were different. Once they indicated their answer, the system advancedto the next question.
The original Shepard-Metzler stimuli of 70 line drawings consisted of 10different objects in 7 positions of rotation about a vertical axis. These 7 positionspermit the construction of at least two unique pairs at each angular difference inorientation from 0 to 180 degrees, in 20-degree increments. In this experiment,we created two equivalent subsets of the test, each with 60 questions: 6 objects ×5 angles (20, 60, 100, 140 and 180 degrees) × 2 answers (same or differentobject). We presented each pair to users one at a time. Users had no time limit forthis task, but were reminded to perform the questions as quickly and accuratelyas possible.
6.3 Results
As before, we first present performance on the spatial orientation task, andthen we examine the preference data.
ACM Transactions on Computer-Human Interaction, Vol. 13, No. 1, March 2006.

Physically Large Displays Improve Performance on Spatial Tasks • 85
Fig. 7. Users performed no differently on any of the tasks whether using the Small or the Large
Display. Egocentric strategies do not help on exocentric tasks. Error bars represent standard error.
6.3.1 Exocentric Task Performance. Since we did not expect effects acrossexperiments, we analyzed each of the tests independently. We modeled thedata for each of the three tasks at the summary level, analyzing the percentageof correct responses (number correct/number attempted) for each test with a2 (Display Size) × 2 (Position) × 2 (Gender) repeated measures analysis ofvariance (RM-ANOVA). As before, Position refers to the order in which userssaw each level of the Display factor. We saw similar results when we used theabsolute number of correct answers as the dependent measure. We analyzedGender and Position as between-subjects factors and Display Size as a within-subjects factor.
We saw no effects of Display Size in each of the three tests, with no significantdifference in percentage of correct responses for the Card test (F(1, 19) = 1.473,p = .240), the Cube test (F(1, 19) = 0.012, p = .914), or the Shepard-Metzlertest (F(1, 19) = 0.5108, p = .475). The effect sizes for these tests ranged fromnegligible to small/medium (d = .56, d = .05, and d = .32, respectively). Hencewe are most confident in the results for the Cube test and least confident inthose for the Card test. However, given the converging results of all three tests,we believe that the egocentric benefits do not impact these exocentric tasks.These results can be seen in Figure 7. Likewise, none of the other main effectsor interactions was significant for this dependent measure.
When we compared the average time spent per question on each of the tests,we found no significant interactions with the display manipulation. One pointworth noting is that when we conducted an analysis at trial level, similar tothat performed in the original Shepard and Metzler [1971] experiments, wefound comparable results. We found significant effects (F(1, 2267) = 32.704,p < .001) suggesting that the larger the angle of mental rotation required toalign the two objects, the longer it took users to decide whether the objects werethe same or if they were different. In fact, the relationship between angle ofrotation and time spent on the question was a linear trend, as predicted.
ACM Transactions on Computer-Human Interaction, Vol. 13, No. 1, March 2006.

86 • D. S. Tan et al.
6.3.2 Preference Data. Overall we found no significant differences in pref-erence when users were asked to rate the two displays on a 5-point Likert scaleof 1 = “Strongly Disagree” to 5 = “Strongly Agree”. The questions were ‘infor-mation on this display was easy to see’ (M = 4.33 vs. M = 4.13 for small vs.large display), ‘the task was easy to do on this display’ (M = 3.79 vs. M = 3.70for small vs. large display), and ‘overall I liked this display’ (M = 4.13 vs. 3.79for small vs. large display). This corresponds well with performance data.
6.4 Summary
Even though there is evidence that the tests used in this experiment utilizesimilar cognitive abilities as the Guilford-Zimmerman task, namely spatialorientation and mental rotation, we asserted that users would not benefit fromimagining their bodies within the problem space due to the object-centric natureof stimuli. There was no reason to believe that imagining their body within theproblem space would help with these tasks. Results indeed showed that usersdid not experience the same benefits on these exocentric tasks that they didon the Guilford-Zimmerman task. In fact, users performed just as well whenthey worked on the small display as on the large display. This finding providesadditional support to the explanation that performance benefits were due to anincreased sense of presence that biased users into egocentric strategies, strate-gies that were not useful for intrinsically exocentric tasks. It also implies thatwe must be very careful in applying the finding as large display benefits only ap-ply to tasks that can be performed more effectively using egocentric strategies.
It was initially advantageous to use well-validated and established psychol-ogy tests in order to understand the particular psychophysical phenomena inwhich we were interested. Although effects were easy to interpret, these testshad several shortcomings: (1) they were designed to isolate and study very con-trolled spatial abilities and did not take into account tasks in which compoundabilities would be used; (2) the stimuli were often contrived two-dimensional,black and white images; and (3) they were static multiple choice tests that didnot require the user to interact with the virtual environment.
In the following experiments, we extend the work by applying findings tomore ecologically valid tasks. We incrementally increase the complexity of spa-tial abilities used in order to see if the current effects continue to be robust.We also use fairly rich dynamic three-dimensional virtual environments andincrementally increase the complexity of these environments by adding cuessuch as distinct landmarks and textures in order to see how the effects holdup in the presence of other cues. Finally, we test for the reliability of the largedisplay effects when the user actively interacts with the virtual environment.Interactivity could potentially immerse the user within a virtual environmentand cause them to perform better, hence negating some of the benefits affordedby large displays.
7. EXPERIMENT 3: LARGE DISPLAYS AID MAP FORMATION AND MEMORY
Results discussed thus far show that information presented on physically largedisplays provides a greater level of immersion and allows users to perform
ACM Transactions on Computer-Human Interaction, Vol. 13, No. 1, March 2006.
Physically Large Displays Improve Performance on Spatial Tasks • 87
certain tasks more effectively than on smaller desktop displays, even wheninformation is viewed at equivalent visual angles.
In separate work, we have also shown that users perform 3D navigation tasksrequiring path integration more efficiently on large displays than on smallerones, even when identical scenes were viewed at equivalent visual angles [Tanet al. 2004). In those experiments, we have further shown that the distractionimposed by active navigation control using a joystick may outweigh any addi-tional cues it might have provided, at least for the set of tasks we tested. How-ever, effects induced by interactivity seem to be independent of those inducedby display size. Our follow-up investigation showed that locomotion errors weresmall and that our results could mainly be attributed to wayfinding errors.
In this experiment, we extend these results to include a mental map forma-tion and memory task. In this task, the user explores a virtual world in orderto build a cognitive map of the environment. Using this cognitive map, the userthen navigates to several specified targets as quickly as they can. Users whobuild and remember better cognitive maps should be able to navigate to thetargets with shorter distances and in less time.
There exists a vast body of work on general principles in 3D navigation.Thorndyke and Hayes-Roth [1982], as well as many others (e.g. Ruddle et al.[1999]; Waller et al. [1998]), have studied the differences in spatial knowledgeacquired from maps and exploration. Darken and others have explored cognitiveand design principles as they apply to large virtual worlds [Darken and Sibert1996]. All this work recognizes that 3D navigation is a complex cognitive taskrequiring the use of a series of interrelated spatial abilities. We believe thatbenefits of large displays for simple spatial tasks extend to more complex ones,hence,
Hypothesis 3a: Users perform better in mental map formation andmemory tasks when using physically large displays due to the in-creased likelihood that they adopt egocentric strategies.
In separate work, some researchers have found that the acquisition of spatialknowledge is facilitated by active navigation control (e.g. Cutmore et al. [2000];Philbeck et al. [2001]). These researchers claim that proprioceptive cues pro-vided by the input devices as well as cognitive benefits of decision-makingimmerse users more within the virtual environments and aid in encodingmental representations of the environments. Others however, have reportedopposite results, showing that active control hurts performance in variousnavigation tasks (e.g. Booth et al. [2000]). Flach [1990] argues that the dif-ferent results could be due to the tradeoffs imposed by control of attention,kinds of information available, sensitivity to information, as well as activitiesinvolved.
We decided to explore both how level of interactivity in the virtual environ-ment affects mental map formation and memory in our 3D navigation task, aswell as how it interacts with effects caused by varying the physical size of dis-plays. While prior literature provides evidence of active control helping in somesituations and hurting in others, we expected users to perform better when theyhad interactive control using the joystick due to the additional cues afforded by
ACM Transactions on Computer-Human Interaction, Vol. 13, No. 1, March 2006.

88 • D. S. Tan et al.
Fig. 8. (left) First person view of the world, including walls, target, and fence (right). Map view of
an example world. The user never saw this view.
the physical manipulation. Therefore,
Hypothesis 3b: Users perform better in the path integration taskwhen they are interactively moving themselves through the virtualenvironment.
Finally, we expected the benefits of the large display to be robust against otherfactors that could potentially provide a similar heightened sense of presence.Specifically,
Hypothesis 3c: The effects induced by physical display size are inde-pendent of those induced by interactivity.
7.1 Participants
Sixteen (8 female) intermediate to experienced computer users from the GreaterPuget Sound area participated in the experiment. We screened users to benongamers who played less than 3 hours of video games per week. We alsoscreened users to be fluent in English and to have normal or corrected-to-normaleyesight. The average age of users was 36.0 (33.7 for males, 38.3 for females),ranging from 19 to 47 years of age. The experiment took about an hour and ahalf and users were given software gratuities for their participation.
7.2 Procedure
We created five different 3D virtual worlds using Touchdown Entertainment’sJupiter game development platform. Each of these worlds was a square roomwith edges 30 meters long. The room was bounded by a fence to prevent usersfrom wandering outside of it (see Figure 8). Seven walls were randomly dis-tributed throughout the environment. To ensure a well-distributed pattern ofwalls, we ensured that: (1) the average length of walls, approximately 7 meters,was comparable across the worlds, and (2) that each quadrant of the world hada roughly equivalent number and length of wall segments. We then distributedfour red target cubes, one in each quadrant of the world. Each cube was uniquelymarked and could be identified by the number of dots (one to four) found oneach of its faces. Within this world users had basic joystick controls. Pushingthe stick forward and backward, moved them forward and backward; pushing
ACM Transactions on Computer-Human Interaction, Vol. 13, No. 1, March 2006.

Physically Large Displays Improve Performance on Spatial Tasks • 89
Fig. 9. The joystick used (left); User working on the small display (center) and the large display
(right).
the stick left or right turned them left or right. They moved at a maximumspeed of 2.5 meters per second, and turned at a maximum rate of 30 degreesper second.
We used a mental map formation and memory task to test how each of themanipulations affected the way users performed in various 3D virtual environ-ments. We broke the task into two phases: the learning phase, and the recallphase. In the learning phase, we gave users 4 minutes to explore the worldand learn both the structure of the environment as well as the location of thevarious target cubes within the world. In the recall phase, we placed users inrandom locations within the world and had them move to specified targets asquickly as possible. These random locations were chosen such that the optimalpath to the specified target was always 20 meters long. Users were asked to findeach of the target cubes twice, for a total of eight trials per world. Note that theenvironments did not contain any distinct landmarks or textures (see Figure8). The only way to remember the location of targets was to build a mental mapusing the structure of walls within the environment.
Dependent measures in this experiment included: (a) the distance movedfrom the start-point to the target in the recall phase; (b) the time required forthe user to find each of the targets.
This was a 2 (Display Size: Small vs. Large) × 2 (Interactivity: Passive View-ing vs. Active Joystick) within-subjects design. In the Active Joystick condition,users utilized the joystick to move themselves through the environment as theyexplored it in the learning phase (see Figure 9). In the Passive Viewing con-dition, users had no control of their movement in the learning phase. Instead,they viewed a movie of themselves moving through the environment. In pi-lot tests, we used the output from one user’s Active Joystick condition as thestimulus for another’s Passive Viewing condition. However, we found that mostusers moved themselves in somewhat unpredictable motions through the envi-ronment. This either caused an unreasonably high level of motion sickness inviewers, or was so jerky as to be ineffective in helping to learn the environment.Hence for the Passive Viewing condition we scripted a smooth path designedto explore the environment by moving in between every pair of walls at leasttwice in a systematic manner.
Prior to beginning the test, users completed a background questionnaire aswell as a spatial ability test. We used the Paper Folding test (VZ-2) from the
ACM Transactions on Computer-Human Interaction, Vol. 13, No. 1, March 2006.

90 • D. S. Tan et al.
Kit of Factor-Referenced Cognitive Tests [Ekstrom et al. 1976]. This test is awell-validated spatial orientation test that is commonly used to indicate gen-eral spatial ability. Users were then given detailed instructions and performedthe task in the tutorial world. Following this, users performed the task in allfour conditions, each in one of the four different environments. The conditionsand the specific worlds were balanced across users. Finally, users filled out apreference questionnaire.
7.3 Results
We used a mixed model analysis of variance (ANOVA) in which Display Sizeand Interactivity were repeated and Gender was treated as a between-subjectsfactor. We included all 2-way and 3-way interactions in the analysis. Since thiswas a completely within-subjects design, observations were not independentand we modeled User as a random effect nested within Gender. We originallyincluded two covariates in the model: distance moved in the learning phase, andthe Spatial Abilities score. However, we removed these from the final analysesbecause they were not significant. Distance moved in the learning phase wasnot significantly different in any of the conditions, and Spatial Abilities did notinteract with any of the manipulations. The estimates and significance levelsof the main factors of interest did not change in any significant fashion and theoverall model fit was improved.
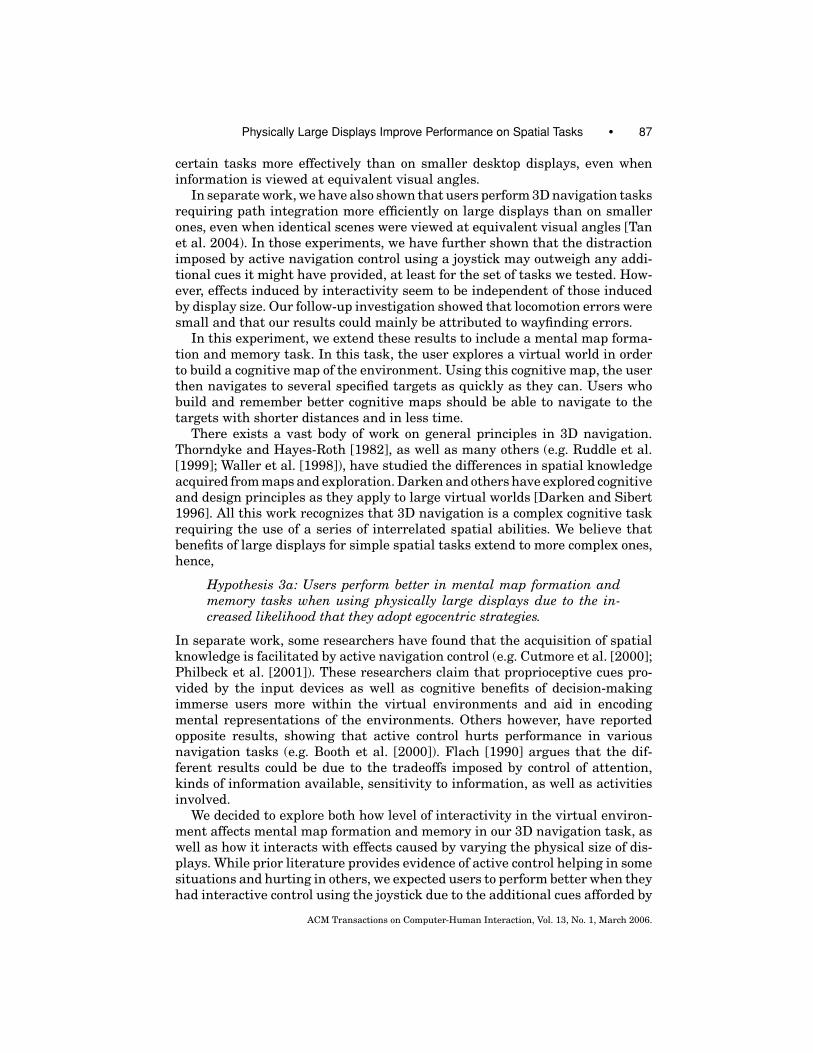
In this experiment, we found a significant effect of Display Size (F(1, 487) =26.745, p < .001), with the Large Display resulting in users moving shorterdistances to find the targets than the Small one (35.31 vs. 39.93 meters, re-spectively). We also observed a significant effect of Interactivity (F(1, 487) =14.219, p < .001), with trials in the Active Joystick condition demonstratingshorter distances moved than trials in the Passive Viewing condition (20.94 vs.24.30 meters, respectively). Interacting with the environment seemed to aidusers with the map formation and memory task. We saw no interaction be-tween Display Size and Interactivity (F(1, 487) = 0.909, p = .341), suggestingthat the manipulations were independent of one another. These results can beseen in Figure 10. Finally, we saw a main effect of Gender (F(1, 487) = 9.119, p =.003), with males performing better than females (32.25 vs. 42.97, respectively).We saw no interactions between Gender and any of the manipulations.
The results for time required to find each of the targets matched find-ings using the distance moved metric. We found significant effects of DisplaySize (F(1, 487) = 71.179, p < .001), Interactivity (F(1, 487) = 38.026, p < .001),and Gender (F(1, 487) = 5.259, p = .022). There were no other significant effectsor interactions. This is not surprising, as many subjects moved around at closeto the top speeds even when they did not immediately know their way aroundthe environment.
7.4 Summary
This experiment adds further validity to our previous findings. In this exper-iment, we continued to see benefits of using large displays even with a fairlycomplex task requiring the use of numerous spatial skills. Like other tasks
ACM Transactions on Computer-Human Interaction, Vol. 13, No. 1, March 2006.
Physically Large Displays Improve Performance on Spatial Tasks • 91
Fig. 10. Main effects of Interactivity and Display Size. In this experiment, users benefited from
Active Control. There were again no interactions between manipulations. Error bars represent
standard error.
that benefit from the use of large displays, the map formation and memorytask benefited from having users adopt an egocentric frame of reference whilenavigating.
In this experiment, we found that active navigation control helped userslearn and remember environments more effectively. In fact, they performedabout 10% better when they controlled their movement than when they watcheda video of themselves moving through the environment. Interestingly, and im-portantly, effects of interactivity were still independent of effects induced bydisplay size.
One shortcoming of this experiment is that the virtual environments usedwere still fairly sterile and controlled. They did not contain distinct landmarksor textures, which would be expected to exist in a more ecologically valid en-vironment. We did this so that we could better understand the nature of thetask and basic results before moving into a more complex environment in whichother factors could contribute to effects observed. We conducted the next exper-iment to explore how robust these effects were in the presence of a multitudeof additional cues found in more typical virtual environments.
8. EXPERIMENT 4: ECOLOGICAL VALIDITY OF RESULTS
This experiment extends previous results by testing the effects of display sizein a much more ecologically valid environment. Thus,
Hypothesis 4: Even in an environment crafted with cues such as dis-tinct landmarks and rich textures to be realistic and memorable, usersperform better in mental map formation and memory tasks when us-ing physically large displays due to the increased likelihood that theyadopt egocentric strategies.
8.1 Participants
Sixteen (8 female) college students from the Pittsburgh area who were inter-mediate to experienced computer users participated in the study. We screened
ACM Transactions on Computer-Human Interaction, Vol. 13, No. 1, March 2006.
92 • D. S. Tan et al.
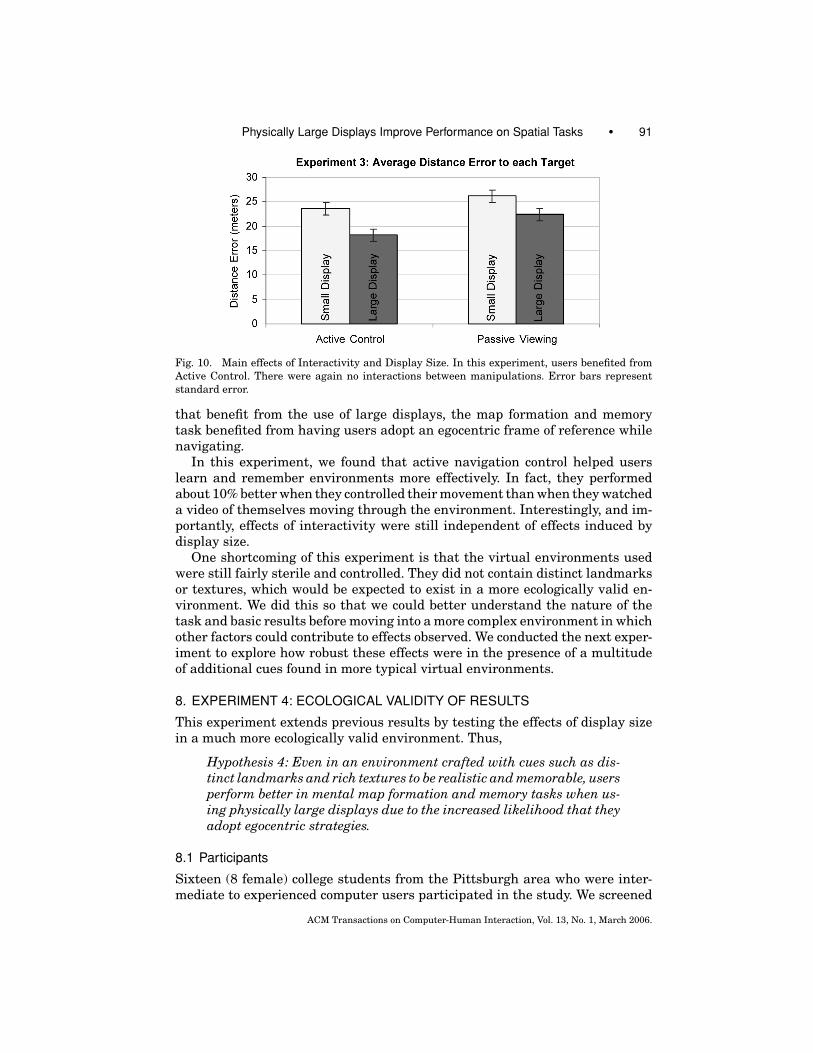
Fig. 11. First person view of the world, which contains distinct landmarks and rich textures in
Experiment 4. The target is the flag seen in the lower right of the screen.
users to be nongamers who played less than 3 hours of video games per week.We also screened users to be fluent in English and to have normal or corrected-to-normal eyesight. The average age of users was 23.9 (24.6 for males, 23.1 forfemales), ranging from 18 to 31 years of age. The experiment took about anhour and a half and users were paid for their participation.
8.2 Procedure
We used the same mental map formation and memory task as in Experiment 3.In the learning phase, users were allowed to explore a virtual environment for4 minutes. In the recall phase, they had to locate specific targets from randomlocations within the world. These locations were randomly distributed to bedistances of 50 meters away from the targets.
We used an off-the-shelf copy of Unreal Tournament 2003 (Epic Games) forthis experiment. Unreal Tournament is a first-person shooter and can be con-sidered to utilize a state-of-the-art rendering engine and virtual environments.In fact, virtual environments in this game are specifically crafted to be realistic,or immersive, and memorable for players (see Figure 11). Unreal Tournamentcomes with a game-mode called ‘capture the flag.’ Each of the worlds in thisgame has two team flags. In order to score, one team must touch the enemy flagand return it to their home base. We used these flags as targets to find withinthe environment.
Unreal Tournament comes with development tools for editing maps as wellas for scripting simple behaviors within the worlds. We made two modificationsto the game in order to run the experiment. First, we instrumented the gameso that we could log the dependent measures: (a) the distance moved from thestart-point to the target in the recall phase; (b) the time required for the user tofind each of the targets. Second, we had initially left several computer enemiesin the game to serve as further distraction while the user performed the mentalmap formation and memory task. However, in pilot tests, users got so carried
ACM Transactions on Computer-Human Interaction, Vol. 13, No. 1, March 2006.
Physically Large Displays Improve Performance on Spatial Tasks • 93
away chasing and shooting enemies that they forgot all about their main task.As such, we removed all enemy characters as well as weapon pickups from theworlds in the actual tests.
We chose worlds from the standard set of worlds that ship with the game aswell as from upgrade packages created by gamers and distributed on variouswebsites. Through pilot tests, we selected five of these worlds from an initialpool of twelve, such that we had one small tutorial world, two Easy Worlds, andtwo Difficult Worlds. The Easy Worlds both covered about 1000 square metersand the Difficult Worlds covered a little more than twice that amount of space.Additionally, the Difficult Worlds were much harder to learn and navigate dueto the complexity of structures and cues within the environment. For example,one such world had a maze of underground caverns and tunnels to navigate.Pilot tests suggested that each pair of worlds, the Easy Worlds and the DifficultWorlds, were of roughly similar difficulty within our task.
We eliminated the Interactivity manipulation from the previous experiment,and hence this experiment was a 2 Display Size (small vs. large) × 2 Difficulty(easy vs. hard) within-subjects design. The orders of Display Size and Difficultywere independently balanced between users.
8.3 Results
We used the same analysis model as in the previous two experiments, replac-ing the Interactivity manipulation with the Difficulty one in this experiment.While we saw dampened effect sizes from the previous experiment, possibly dueto the dilution caused by the addition of cues within the environments, we ob-served similar findings. We found a significant effect of Display Size (F(1, 604) =11.900, p < .001), with the large display resulting in users detouring by shorterdistances to find the targets than the small one (14.71 vs. 16.35 meters, respec-tively). We also observed a significant effect of Difficulty (F(3, 604) = 108.996,p < .001), with trials in the easy worlds demonstrating shorter distances movedthan trials in the difficult worlds. We saw a significant interaction between Dis-play Size and Difficulty (F(3, 604) = 4.041, p = .007). The large display seemedto be more helpful with trials in the difficult worlds. Finally, we saw a main ef-fect of Gender (F(1, 604) = 6.699, p = .010), with males performing better thanfemales (12.94 vs. 18.14 meters, respectively). We saw no interactions betweenGender and any of the manipulations.
Again, the results for time required to find each of the targets matched find-ings using the distance moved metric, with a significant effect of Display Size(F(1, 604) = 4.281, p = .039), Difficulty (F(3, 604) = 294.510, p < .001), andGender (F(1, 604) = 7.319, p = .007), but no other main effects or interactions.
8.4 Summary
This experiment shows that benefits of large displays are independent of cuesthat may be used in real-world virtual environments to increase immersionand memorability, such as distinct landmarks and rich textures. This is animportant property if we are to apply the summary of results to useful real-world tasks, such as training and simulation, or games and entertainment.
ACM Transactions on Computer-Human Interaction, Vol. 13, No. 1, March 2006.

94 • D. S. Tan et al.
Also, it implies that we can continue to exploit the benefits of large displayseven in the presence of other techniques that induce performance increases.
9. GENERAL DISCUSSION OF EXPERIMENTAL RESULTS
The series of experiments described in this article demonstrate that physicaldisplay size is an important factor to consider when designing display sys-tems. Results suggest that physically large displays, even at identical visualangles as small displays, immerse users and bias them into adopting egocen-tric strategies. These strategies increase performance on spatial tasks such as3D navigation as well as mental map formation and memory, which can be rep-resented using egocentric coordinate systems. Furthermore, the effects causedby physically large displays seem to be independent of other factors that mayinduce immersion or increase performance. For example, even though inter-activity and mental aids such as distinct landmarks and rich textures withinvirtual worlds increase task performance on the tasks tested, they did not affectthe benefits that large displays offer to users.
In fact, with very little effort on the part of the designer, the system builder,or the user, large displays offer the potential to improve performance on a fairlybroad range of tasks. Also, because effects are independent of other aids tested,large displays continue to offer improvements even in the presence of otherperformance aids.
It could be argued that the magnitude of effects was not amazingly large, andthat 10% to 26% increases are not enough to warrant the additional cost andphysical space that large displays require. However, given that the theoreticalinformation content shown on the small and the large displays were the same,and hence that the retinal images created when viewing one display or theother were the same, it is interesting that these results exist at all.
Furthermore, it should be noted that performance gains even of this magni-tude could be important in the domains for which we think these results aremost useful, namely games and entertainment, as well as training and sim-ulation. Games and entertainment is a large market that continues to grow,and that could benefit significantly from even a small portion of the demo-graphic preferring and upgrading to large displays. In training and simulation,any small increase in performance could potentially lead to fairly large impli-cations. For example, imagine firefighters who could navigate to targets 10%quicker or could better find alternate routes when they become obstructed be-cause they trained on large displays. Before we can build such applications,we must explore how strategies learned on large displays transfer to the realworld, especially since we did not see training transfer results between displaysin any of our experiments. This remains future work.
The behavioral effect and choice of different strategy depending on the phys-ical size of the display is perhaps more interesting than the raw magnitudeof performance increases. The magnitude of the effect is heavily dependent onthe particular task as well as the surrounding context in which the task isperformed. However, the behavioral effect can be attributed to a much morefundamental cognitive mechanism, which may form an important component
ACM Transactions on Computer-Human Interaction, Vol. 13, No. 1, March 2006.

Physically Large Displays Improve Performance on Spatial Tasks • 95
of the way we perceive and interact with the world around us. Even though wewere not able to directly measure causality, the experiments as a group providestrong support for our hypothesis that the performance increase on large dis-plays can be attributed to the choice of cognitive strategy. We hypothesize thatthis strategy switch was induced in part by a higher level of immersion whenusing the large display. While this has been postulated in previous literature[e.g. Bystrom et al. 1999], large displays have also been shown to mediate otherpsychological factors such as emotional arousal and attention [Reeves et al.1999]. Validating exactly why users change their cognitive strategy remainsfuture work.
It should also be noted how robust the results were to the types of taskstested, as well as to the demographic for which this applied. Because the experi-ments were performed both with college students from Carnegie Mellon Univer-sity as well as with a wide range of people recruited from the general populationin the Greater Puget Sound area, we can say with relatively high degree of con-fidence that the results are representative of a large portion of the population.
Informal observations across the demographic yielded other interesting de-sign considerations. For example, people with bifocals usually preferred read-ing and performing the tasks on the large display. This was because they weremuch more comfortable working on surfaces that were further away. Depend-ing on demographic, users would compare the large display to a movie screenor a classroom board, but most indicated that they were more engrossed bythe large display. Unfortunately, it was difficult to get users to articulate thelevel of immersion or the actual strategy they used to perform tasks. In fact, inpilot experiments as well as in the actual experiments, we tried various meth-ods including multiple choice and ranking questions, magnitude questions us-ing Likert scales, subjective open-answer questions, and informal interviews.While preference ratings generally matched performance results, none of thesemethods was effective in deriving definitive responses or insights regardingstrategy used. Instead, we had to resort to carefully designing the experimentssuch that we ended up with a series of performance results suggesting that thestrategy hypothesis is the most likely explanation for the effects observed.
As a final note, although we observed effects of gender and spatial abilityacross many of these tasks, we did not pursue these further. These effects havebeen fairly well documented in the literature and were not the focus of ourexperiments. While Czerwinski et al. [2002] suggest that females benefit sig-nificantly more than males in 3D navigation tasks using displays with widefields of view, we saw no such effect for Display Size in our studies. We foundno interactions between any of the manipulations and these factors, indicatingthat nothing surprising was happening with these effects. We have found noevidence suggesting that physical display size aids any part of the demographicmore or less so than any other group.
10. FUTURE WORK
Although we did not intentionally calibrate the absolute size of the images inany of the experiments, images shown on the large display were close to being
ACM Transactions on Computer-Human Interaction, Vol. 13, No. 1, March 2006.

96 • D. S. Tan et al.
life-sized. This might be an interesting point in the size-performance curveas it is usually assumed to represent the optimal size at which users will beimmersed (e.g. Brooks [1999]). However, more work is required to determinethe shape of the curve as one increases display size from a traditional desktopdisplay to a large wall-sized display and then beyond. It would be interesting tosee if the strategy change is an abrupt shift that happens when a certain sizeis achieved or if it is more continuous across a series of sizes. Also, it would beinteresting to see what happens when images get larger than life. This wouldallow us to gain a deeper understanding of display size and how it relates toimmersion and presence.
Another potentially interesting realm of study has to do with the factorsthat best allow us to perceive physical size. There are numerous factors suchas optical accommodation and convergence, stereo vision, parallax, and envi-ronmental context, but we do not have a clear understanding of how each ofthese contributes to the effects and how they interact with each other. We be-lieve that this could form an entire research agenda, and would add not onlyto our understanding of large displays, but of the human visual and perceptualsystems in general.
Building upon an understanding of what it is that allows us to perceive size,we believe that it is also important for us to completely understand what it isabout that size that causes us to become more immersed and to adopt differentstrategies when performing spatial tasks. For example, if these results could bepartially attributed to the novelty of the large displays, then results would bea little less useful theoretically, but it would be very interesting to find out thatthey were due to certain fundamental biases in our neural circuitry. Again, thisremains future work.
Before we fully understand the design principles derived from these experi-ments within real world scenarios, there are a few other areas to consider. Forexample, we must look beyond behavioral responses and performance results,and understand how large displays affect other things such as simulator sick-ness. In our experiments, we saw no indication that large displays would causeany more or less illness, but we cannot draw any conclusions because almostno one got sick in the experiments.
Also, we must fully examine the interaction of other display characteristics,such as field of view or resolution. Maintaining constant visual angles wasmerely a means to isolate and study physical display size as an interesting char-acteristic. We do not propose that large displays should be intentionally usedat equivalent visual angles to their smaller counterparts. Instead, we shouldclearly understand the interactions between display size and these other factorsso that we can design display systems that make optimal use of large displays.
Finally, we believe that we must explore training transfer between differenttypes of displays and between the virtual world and the real one. None of ourexperiments showed any ordering effects, suggesting that the strategy changewas a rather ephemeral one, changing quickly, depending on which display theuser was currently using. However, given the length of our tasks, we would behesitant to draw conclusions about any longer term training transfer effects;this will have to be studied in more detail.
ACM Transactions on Computer-Human Interaction, Vol. 13, No. 1, March 2006.
Physically Large Displays Improve Performance on Spatial Tasks • 97
ACKNOWLEDGMENTS
We thank Mary Czerwinski and her Visualization and Interaction group,Dennis Proffitt and his Perceptual Psychology Lab, the Stage 3 Research Lab,Jessica Hodgins, Scott Hudson, and Azizan Aziz for stimulating discussionson multiple display systems. Susan Fussell and Robert Kraut provided insightinto the analyses.
REFERENCES
ARTHUR, K. W. 2000. Effects of field of view on performance with head-mounted displays. DoctoralDissertation, University of North Carolina, Chapel Hill, NC.
BAUDISCH, P., GOOD, N., BELLOTI, V., AND SCHRAEDLEY, P. 2002. Keeping things in context: A com-
paritive evaluation of focus plus context screens, overviews, and zooming. In Proceedings of theCHI 2002 Conference on Human Factors in Computing Systems, 259–266.
BOOTH, K., FISHER, B., PAGE, S., WARE, C., AND WIDEN, S. 2000. Wayfinding in a virtual environment.
Graphics Interface 2000.BROOKS, F. P. 1999. What’s real about virtual reality? IEEE Computer Graphics and Applications,
19, 6, 16–27.
BUXTON, W. 2001. Less is more (More or less). In The Invisible Future: The Seamless Integrationof Technology in Everyday Life. P. Denning, Ed. McGraw Hill: New York, NY, 145–179.
BYSTROM, K. E., BARFIELD, W., AND HENDRIX, C. 1999. A conceptual model of the sense of presence
in virtual environments. Presence: Teleoperators and Virtual Environments 8, 2, 241–244.
CARPENTER, M. AND PROFFITT, D. 2001. Comparing viewer and array mental rotations in different
planes. Memory & Cognition 29, 441–448.
CHAPANIS, A. AND SCARPA, L. C. 1967. Readability of dials at difference distances with constant
viewing angle. Human Factors 9, 5, 419–426.
CHILDS, I. 1988. HDTV-putting you in the picture. IEE Rev. 34, 7, 261–265.
CHOU, P., GRUTESER, M., LAI, J., LEVAS, A., MCFADDIN, S., PINHANEZ, C., VIVEROS, M., WONG, D., AND
YOSHIHAMA, S. 2001. BlueSpace: Creating a personalized and context-aware workspace. IBMTech. Rep. RC22281.
CUTMORE, T. R. H., HINE, T. J., MABERLY, K. J., LANGFORD, N. M., AND HAWGOOD, G. 2000. Cognitive
and gender factors influencing navigation in a virtual environment. Int. J. Hum. Comput. Studies53, 223–249.
CZERWINSKI, M., TAN, D. S., AND ROBERTSON, G. G. 2002. Women take a wider view. In Proceedingsof the CHI 2002 Conference on Human Factors in Computing Systems, 195–202.
DARKEN, R. AND SIBERT, J. 1996. Navigating in large virtual worlds. Int. J. Hum.-Comput. Inter-action 8, 1, 49–72.
DUDFIELD, H. J., MACKLIN, C., FEARNLEY, R., SIMPSON, A., AND HALL, P. 2001. Big is better? Human
factors issues of large screen displays with military command teams. In Proceedings of People inControl 2001, 304–309.
EKSTROM, R. B., FRENCH, J. W., HARMAN, H., AND DERMEN, D. 1976. Kit of factor-referenced cognitive
tests. In Educational Testing Service: Princeton, NJ.
ELROD, S., BWEE, R., GOLD, R., GOLDBERG, D., HALASZ, F., JANSSEN, W., LEE, D., MCCAU K., PEDERSEN, E.,
PIER, K., TANG, J., AND WELCH, B. 1992. Liveboard: A large interactive display supporting group
meetings, presentations and remote collaboration. In Proceedings of the CHI 1992 Conference onHuman Factors in Computing Systems, 599–607.
EPIC GAMES. Unreal Tournament. http://www.unrealtournament.com
FLACH, J. 1990. Control with an eye for perception: Precursors to an active psychophysics. Ecol.Psych. 2, 83–111.
GUILFORD, J. P. 1972. Thurstone’s primary mental abilities and structure-of-intellect abilities.
Psyc. Bull. 77, 2, 129–143.
GUILFORD, J. P. AND ZIMMERMAN, W. S. 1948. The Guilford-Zimmerman aptitude survey. J. Appl.Psych. 32, 24–34.
GUIMBRETIERE, F. 2002. Fluid interaction for high resolution wall-size displays. Doctoral Disser-
tation, Stanford University, Stanford, CA.
ACM Transactions on Computer-Human Interaction, Vol. 13, No. 1, March 2006.

98 • D. S. Tan et al.
INFIELD, S. E. 1991. An investigation into the relationship between navigation skill and spatial
abilities. Doctoral Dissertation, University of Washington, Seattle, WA. Dissertation Abstracts
International, 52(5-B), 2800.
ISHII, H. AND ULLMER, B. 1997. Tangible bits: Towards seamless interfaces between people, bits
and atoms. In Proceedings of the CHI 1997 Conference on Human Factors in Computing Systems,
234–241.
LIN, J. J., DUH, H. B. L., PARKER, D. E., ABI-RACHED, H., AND FURNESS, T. A. 2002. Effects of field
of view on presence, enjoyment, memory, and simulator sickness in a virtual environment. In
Proceedings of IEEE Virtual Reality Conference 2002, 164–171.
LOHMAN, D. 1979. Spatial ability: A review and reanalysis of the correlational literature. Tech.Rep., N.8. Stanford University, Aptitude Research Project, School of Education.
PATRICK, E., COSGROVE, D., SLAVKOVIC, A., RODE, J. A., VEWATTI, T., AND CHISELKO, G. 2000. Using a
large projection screen as an alternative to head-mounted displays for virtual environments. In
Proceedings of the CHI 2000 Conference on Human Factors in Computing Systems, 478–485.
PHILBECK, J. W., KLATZKY, R. L., BEHRMANN, M., LOOMIS, J. M., AND GOODRIDGE, J. 2001. Active
control of locomotion facilitates nonvisual navigation. J. Exper. Psych. Human Perception andPerformance 27, 141–153.
PROTHERO, J. D. AND HOFFMAN, H. D. 1995. Widening the field of view increases the sense of
presence within immersive virtual environments. Human Interface Technology Laboratory Tech.Rep., University of Washington, Seattle, WA, R-95-4.
RASKAR, R., WETCH, G., CUTTS, M., LAKE, A., STESIN, L., AND FUCHS, H. 1998. The office of the future:
A unified approach to image-based modeling and spatially immersive displays. In Proceedings ofSIGGRAPH 1998 International Conference on Computer Graphics and Interactive Techniques,
179–188.
REEVES, B., LANG, A., KIM, E. Y., AND TATAR, D. 1999. The effects of screen size and message content
on attention and arousal. Media Psych. 1, 1, 49–67.
RUDDLE, R., PAYNE, S., AND JONES, D. 1999. The effects of maps on navigation and search strategies
in very-large-scale virtual environments. J. Exper. Psych. Applied, 5, 54–75.
SHEPARD, R. N. AND METZLER, J. 1971. Mental rotations of three-dimensional objects. Science 171,
3972, 701–703.
SLATER, M. AND USOH, M. 1993. Presence in immersive virtual environments. In Proceedings ofthe IEEE Conference—Virtual Reality Annual International Symposium, 90–96.
STREITZ, N. A., GEIBLER, J., HOLMER, T., KONOMI, S., MULLER-TOMFELDE, C., REISCHI, W., REXROTH, P.,
SEITZ, P., AND STEINMETZ, R. 1999. i-LAND: An interactive landscape for creativity and inno-
vation. In Proceedings of the CHI 1999 Conference on Human Factors in Computing Systems,
120–127.
SUZUKI, K. AND NAKATA, Y. 1988. Does the size of figures affect the rate of mental rotation? Per-ception & Psychophysics 44, 1, 76–80.
SWAMINATHAN, N. AND SATO, S. 1997. Interaction design for large displays. Interactions 4, 1, 15–
24.
TAN, D. S. 2005. Exploiting the Cognitive and Social Benefits of Physically Large Dislpays (Doc-
toral Dissertation, Carnegie Mellon University, 2004). Dissertation Abstracts International 65,
9, 4681.
TAN, D. S., GERGLE, D., SCUPELLI, P., AND PAUSCH, R. 2003. With similar visual angles, larger
displays improve performance on spatial tasks. In Proceedings of the CHI 2003 Conference onHuman Factors in Computing Systems, 217–224.
TAN, D. S., GERGLE, D., SCUPELLI, P., AND PAUSCH, R. 2004. Physically large displays improve path
integration in 3D virtual navigation tasks. In Proceedings of the CHI 2004 Conference on HumanFactors in Computing Systems, 439–446.
TAN, D. S., STEFANUCCI, J. K., PROFFITT, D. R., AND PAUSCH, R. 2001. The Infocockpit: Providing
location and place to aid human memory. Workshop on Perceptive User Interfaces 2001.
TANI, M., MASATO, H., KIMIYA, Y., KOICHIRO, T., AND FUTAKAWA, M. 1994. Courtyard: Integrating
shared overview on a large screen and per-user detail on individual screens. In Proceedings ofthe CHI 1994 Conference on Human Factors in Computing Systems, 44–50.
THORNDYKE, P. AND HAYES-ROTH, B. 1982. Differences in spatial knowledge acquired from maps
and navigation. Cog. Psych. 14, 560–589.
ACM Transactions on Computer-Human Interaction, Vol. 13, No. 1, March 2006.
Physically Large Displays Improve Performance on Spatial Tasks • 99
THURSTONE, L. L. AND THURSTONE, T. G. 1941. Factorial studies of intelligence. Psychometric Mono-graph, 2.
TLAUKA, M. 2002. Switching imagined viewpoints: The effects of viewing angle and layout size.
Brit. J. Psych. 93, 193–201.
WALLER, D., HUNT, E., AND KNAPP, D. 1998. The transfer of spatial knowledge in virtual environ-
ment training. Presence: Teleoperators and Virtual Environments 7, 2, 129–143.
WRAGA, M., CREEM, S. H., AND PROFFITT, D. R. 2000. Updating displays after imagined object and
viewer rotations. J. Exper. Psych. Learning, Memory, and Cognition, 26, 1, 151–168.
Received January 2005; revised July 2005; accepted July 2005 by Terry Winograd
ACM Transactions on Computer-Human Interaction, Vol. 13, No. 1, March 2006.