PIRELLI & C. S. P.A - UTL Repository
50
MASTER OF SCIENCE IN FINANCE MASTER’S FINAL WORK PROJECT EQUITY RESEARCH: PIRELLI & C. S.P.A JOÃO ANTÓNIO MÁLIAS FRANCO OCTOBER 2019
-
Upload
khangminh22 -
Category
Documents
-
view
1 -
download
0
Transcript of PIRELLI & C. S. P.A - UTL Repository

MASTER OF SCIENCE IN FINANCE
MASTER’S FINAL WORK PROJECT
EQUITY RESEARCH: PIRELLI & C. S.P.A
JOÃO ANTÓNIO MÁLIAS FRANCO
OCTOBER 2019

MASTER OF SCIENCE IN FINANCE
MASTER’S FINAL WORK PROJECT
EQUITY RESEARCH: PIRELLI & C. S.P.A
JOÃO ANTÓNIO MÁLIAS FRANCO
SUPERVISOR:
JOSÉ MIGUEL BAPTISTA DOS SANTOS DE ALMEIDA
OCTOBER 2019

i
Abstract
This report was elaborated as the final work of ISEG's Master in Finance program following the directions
and structure specified for the purpose. In more detail, this project specifically follows the CFA Institute
recommendations adopted by the University.
The purpose of the report is to assemble an investment proposition for Pirelli & C. S.p.A. Therefore a
detailed valuation of the company will be included in this report. The reason behind the selection of the
company to study was solely due to the Equity Research course attended in the previous semester. In
the course I had the opportunity to study the industry where Pirelli operates and my interested in learning
a little more about this company, one of the largest companies in the world to operate in the Tyre and
Rubber Industry, increased.
The price calculated for Pirelli's share was obtained by applying the Discounted Cash Flow (DCF) model
as a type of an absolute valuation and it was confirmed by the relative valuation obtained using the
comparable multiples method. At the end the recommendation of this report is to buy the stock as a
price of €5.51 is expected for the year-end 2019, which represents a 17% appreciation from the share
price at the date of the report. This report also analyzes the risk of investing in Pirelli and the buy
recommendation did preserve, even considering the potential risks that the company faces in being
dependent on the automotive sector and the price of the raw materials.
This report was prepared in accordance with public information available on the 2nd of September.
Information after that period was not considered.
JEL classification: G10; G32; G34
Keywords: Equity Research; Investment Recommendation; Valuation; Mergers & Acquisitions; Pirelli & C. S.p.A

ii
Resumo
Este relatório foi elaborado como projeto final do programa de Mestrado de Finanças do ISEG e
seguindo as indicações e estrutura indicadas para o mesmo efeito. Em mais detalhe, este projeto segue
especificamente as recomendações do CFA Institute, adotadas pela faculdade.
O objetivo do relatório é a elaboração de uma recomendação de investimento na Pirelli & C. S.p.A. e
portanto irá ser incluído neste relatório uma avaliação detalhada da empresa. O motivo da seleção da
empresa a estudar deveu-se unicamente à unidade curricular de Equity Research, leccionada no
semestre anterior à elaboração deste projecto, na qual estudei a indústria em que a Pirelli opera tendo
despertado o meu interesse para aprender um pouco mais sobre a esta empresa, uma das maiores a
operar na Indústria de Pneus e Borracha mundialmente.
O preço calculado para a acção da Pirelli foi obtido ao aplicar o modelo dos Fluxos de Caixa
Descontados (DCF), como avaliação absoluta, e confirmado pela avaliação relativa obtida através do
método dos múltiplos comparáveis. A recomendação deste relatório é de Compra, tendo sido calculado
um preço de € 5.51 para o final do ano de 2019, o que representa uma valorização de 17% face ao
preço da acção à data do relatório.
Neste relatório é também analisado o risco do investimento na Pirelli e foi mantida a recomendação de
Compra, mesmo considerando os potenciais riscos que a empresa enfrenta ao ser depende do sector
automóvel e do preço das matérias-primas.
Este relatório foi elaborado de acordo com a informação pública disponível no dia 2 de Setembro,
informação posterior a essa data não foi considerada.
Classificação JEL: G10; G32; G34
Palavras-chave: Equity Research; Recomendação de Investimento; Avaliação de Empresas, Fusões e Aquisições; Pirelli & C. S.p.A

iii
Acknowledgements
This project represents the end of an important stage of my life, five years of studying in the amazing institution that ISEG is.
To my family, my dad Manuel, my mom Margarida, my brother Luís and both my grandmothers, Maria de Lurdes and Mariana, thank you for being with my in this journey and for helping me with everything I needed, every time I needed, for giving me all the possibilities to made this journey possible. And for my grandfather António Málias, that even no longer being among us, always believed and supported me and my family.
To my girlfriend Rita for the unconditional support, encouragement and help.
To all my friends, for every moment along this journey and the unbelievable friendship.
To my supervisor José Miguel de Almeida for the patience and availability.

iv
Index Abstract .................................................................................................................................................... i Resumo.................................................................................................................................................... ii
Acknowledgements ............................................................................................................................... iii
Index ....................................................................................................................................................... iv
Report Snapshot .....................................................................................................................................1
Business Description .............................................................................................................................2
Corporate Governance ...........................................................................................................................4
Industry Overview and Competitive Positioning ................................................................................6
Investment Summary .......................................................................................................................... 12
Valuation............................................................................................................................................... 13
Financial Analysis ............................................................................................................................... 20
Investment Risks ................................................................................................................................. 21
Appendices .......................................................................................................................................... 24
Appendix 1: Statement of Financial Position (PIRC) ......................................................................... 24
Appendix 2: Income Statement (PIRC) ................................................................................................3
Appendix 3: Cash-Flow Statement (PIRC) ...........................................................................................4
Appendix 4: Key Financial Ratios .........................................................................................................5
Appendix 5: Analyses of Historical Revenues ......................................................................................6
Appendix 7: Income Statement Forecast .............................................................................................7
Appendix 8: Balance Sheet Forecast ...................................................................................................9
Appendix 9: Capex Forecast ............................................................................................................. 10
Appendix 10: Amortizations, Depreciation and Impairments Forecast ............................................. 10
Appendix 11: Working Capital Indicators and Projected Working Capital ........................................ 11
Appendix 12: Forex Forecast ............................................................................................................ 11
Appendix 13: Valuation Methods ....................................................................................................... 12
Appendix 14: WACC Assumptions .................................................................................................... 14
Appendix 15: Levered Beta Forecast ................................................................................................ 14
Appendix 16: WACC forecast ............................................................................................................ 14
Appendix 17: Stable Growth Model ................................................................................................... 15
Appendix 18: Free Cash Flow to the Firm ......................................................................................... 15
Appendix 18: Market Valuation – Peer Selection .............................................................................. 16
Appendix 19: Sensitivity Analyses Tables ......................................................................................... 17
References ........................................................................................................................................... 18
Abbreviations & Notes ...........................................................................................................................2

v
List of figures Figure 1 – Revenues Growth & Gross Margin ........................................................................................ 1 Figure 2 - Main Players % of Revenues invested in R&D ....................................................................... 1 Figure 3 - Pirelli's History Chronogram.................................................................................................... 2 Figure 4– Revenues by vehicles in 2018 ................................................................................................ 2 Figure 5 – Revenues by Market .............................................................................................................. 2 Figure 6 – Prestige Car Manufactures .................................................................................................... 3 Figure 7 – Premium car Manufactures .................................................................................................... 3 Figure 8 – Business segment weight in company sales ......................................................................... 3 Figure 9 - Business segment weight in company adj. EBIT .................................................................... 3 Figure 10 – Pirelli’s Specialties product line ............................................................................................ 4 Figure 11 – Pirelli’s CEO Mr. Marco Tronchetti Provera ........................................................................ 4 Figure 12- Pirelli’s Chairman Mr. Ning Gaoning ...................................................................................... 5 Figure 13 - Pirelli's Stock distribution ...................................................................................................... 5 Figure 14 - Board of Directors Composition ............................................................................................ 6 Figure 15 – Board of Directors Committee caption ................................................................................. 6 Figure 16 - Evolution of Tyres sold Worldwide (Billion Units) ................................................................. 6 Figure 17 – Market Share of Main Industry Players ................................................................................ 7 Figure 18 – Real GDP % Growth YoY .................................................................................................... 7 Figure 19 – Industry players by Market Capitalization ............................................................................ 7 Figure 20 - Number of Cars Sold worldwide (in Mn Units) ...................................................................... 8 Figure 21 – Passenger Car Sales in Selected Countries (in MN units) .................................................. 8 Figure 22 - World GDP and Automobile Production (in Mn units) .......................................................... 8 Figure 23 - Pirelli's raw materials consumptions in 2018 ........................................................................ 9 Figure 24 - Crude Oil $/Barrel and Natural Rubber $/kg ......................................................................... 9 Figure 25 - Changes in Industry top 3 players ........................................................................................ 9 Figure 26 - Tyre & Rubber Players in Tiers of Ebitda Margin ............................................................... 10 Figure 27 - porter's five forces ............................................................................................................... 10 Figure 28 – High Value Segment Growth .............................................................................................. 12 Figure 29 - Net Debt and Ebitda Margin Evolution ................................................................................ 12 Figure 30 - Monte Carlo Simulation Results .......................................................................................... 13 Figure 31 – Evolution of Revenues by Region ...................................................................................... 13 Figure 32 - Forecasted Revenues for 2019-2023 ................................................................................. 14 Figure 33 – Inflation Rate Forecast 2019-2023 ..................................................................................... 14 Figure 34 -High Value growth vs Standard Value growth ..................................................................... 14 Figure 35 – Oil Prices forecast .............................................................................................................. 15 Figure 36 – Capex decomposition : maintenance vs Investment.......................................................... 15 Figure 37 - Operational profit to keep constant as revenues growth .................................................... 15 Figure 38 - Interest coverage ratio to growth faster than paid interest ................................................. 16 Figure 39 - Hedging strategies projected results .................................................................................. 16 Figure 40 - Inventory days vs Receivables days ................................................................................... 16 Figure 41 - Long-Term Debt increase in a controled way ..................................................................... 17 Figure 42 - Capital Structure evolution .................................................................................................. 18 Figure 43 - Cost of Equity to keeping the Wacc Pace ........................................................................... 18 Figure 44 - Tier 1 Comparables ............................................................................................................ 19 Figure 45 - Tier 2 comparables ............................................................................................................. 19 Figure 46 - Tier 3 comparables ............................................................................................................. 19 Figure 47 - Cars Sold in Million Units .................................................................................................... 20 Figure 48 - Cars and commercial vehicles production .......................................................................... 20 Figure 49 - Research & Development expenditures ............................................................................. 20 Figure 50 - Revenues increasing as profitabily goes down ................................................................... 20 Figure 51- Monte Carlo Simulation Results ........................................................................................... 23

vi
List of Tables Table 1 – Pirelli’s Market data ............................................................................................................ 1 Table 2 – Mr. Marco Tronchetti Provera Curriculum Vitae Highlights ......................................... 4 Table 3– Mr. Ning Gaoning Curriculum Vitae Highlights ................................................................ 5 Table 4 - Governance lines ................................................................................................................. 5 Table 5 - 2018 Board of Directors Remuneration ............................................................................ 6 Table 6 – Valuation Summary........................................................................................................... 12 Table 7 - Terminal Cost of Equity Impact on Price Target ........................................................... 13 Table 8 - Forecast of Revenues Drivers ......................................................................................... 14 Table 9 - Discounted Cash-Flow Outputs ....................................................................................... 17 Table 10 - Free Cash Flows Forecast ............................................................................................. 17 Table 12 - Multiples by company ..................................................................................................... 19 Table 13 - Market Based Valuation Results ................................................................................... 19

1
Date: 01/09/2019 Ticker: PIRC:IM (Bloomberg)
Current Price: €4.73 Spot Rate (EUR/USD): 1.0989
Recommendation: BUY (17% Upside) Target Price: €5.51 - Medium Risk
Source: Bloomberg
Closing Price (September 2nd) € 4.7352-week price range 4.43 - 6. 77Average daily volume 4.04 MShares outstanding 1 BMarket Capitalization 5.188 BFree float 38.16%Dividend yield (2019F) 3.46%
Market ProfileTABLE 1 – PIRELLI’S MARKET DATA
FIGURE 1 – REVENUES GROWTH & GROSS MARGIN
Source: Author estimative, Company Data
FIGURE 2 - MAIN PLAYERS % OF REVENUES INVESTED IN R&D
Source: Reported information
Automobiles & Parts FTSE MIB - Milan Stock Exchange
Report Snapshot
This report issues a BUY recommendation for Pirelli C. & S.p.A (PIRC), with a price
target of €5.51/sh at December 31st based on Discounted Cash Flow (DCF) model,
implying a 17% upside potential from the current share price, €4.73/sh, closing price
from the September 2nd. This investment is evaluated as having a Medium Risk level,
especially given the dependences of the automobile industry and raw materials price.
The main drivers for the recommendation are:
Focus in the fastest growing segment of the market. Pirelli business strategy of
becoming the only 100% consumer brand company with focus in the High Value
Segment (tyres with rim sizes larger than 18’’ and 17’’ specialties) is expected to give
return in the short-term as the segment keeps outperforming the market and growing at
a double digit rate.
A company looking to reinforce the leadership in the segment. In an industry where
low cost players are gaining weight in the recent years, Pirelli looks to differentiate as a
high-quality provider focused in consumer innovations. To be able to deliver this value
proposition the company heavy invests in Research & Development, being the market
player with higher percentage of revenues invested (Figure 2).
4,50
5,00
5,50
6,00
6,50
7,00
7,50
8,00
17% Upside Potential
€5.51
€ 4.71

2
Source: Author estimative, Company Data
FIGURE 5 – REVENUES BY MARKET
Source: Author estimative, Company Data
FIGURE 4– REVENUES BY VEHICLES IN 2018
Business Description Pirelli & C. S.p.A is one of the world’s leading tyre producers and provider. It is also
the only producer in the industry to exclusively focus on the Consumer business (tyres
for cars, motorcycles and bicycles).
BRIEF HISTORY Founded in 1872 as an Italian producer of rubber products and its derivatives, Pirelli
has a distinctive industrial tradition characterized by a sustainable management model,
which has always been associated with its capacity for innovation, product quality and
brand strength.
In March 2015, ChemChina acquired Pirelli in a deal worth €7.1 billion. The state-owned
company is China’s largest chemical company and parent company of China National
Tyre & Rubber Company. The operation lead to a Pirelli’s delist from the Milan Stock
Exchange.
Two years after, in March 2017, Pirelli decided to spin off its industrial business in a
reorganization process build to focus only on the Consumer business. The main goal
was to strengthen their position in the High Value segment, providing products with the
highest levels of performance, safety, quietness and grip on the road surface.
On October 2017, the company returned to the Milan Stock Exchange and has been
included in the FTSE index, which includes the largest Italian brands. The IPO allowed
Pirelli to gather €2.275 billion, the biggest in Europe in 2017.
CONSTANT INVESTMENT IN R&D Pirelli has one of the highest levels of Research & Development expenditures in the
industry, which represents 6.5% of the High Value segment revenues. Also counts with
a portfolio of approximately 6000 active patents, reinforcing the high hierarchy position
that investments in technology have in the company strategic plans.
OPERATIONS Pirelli’s major success is due to the great structure of its operation. In 2018, the
company had revenues of €5.195 million, of which ~93% were from car tyres and ~7%
from Moto tyres (Figure 4), originating a high adj. EBIT margin of 19.3%.
The High Value segment was responsible for about 64% of the generated revenues
(Figure 8) and 83% of the generated EBIT (Figure 9), reflecting the impact of the
company’s strategy.
By channel is possible to split into two of them: The Original Equipment and the
Replacement, where the O.E was responsible for 25% of total revenues and
Replacement for about 75%. Moreover, those revenues were project by a strong
presence of the brand in the market with more than 15,900 points of sale in over 160
countries, counting with a high exposure in the three major markets for High Value tyres:
Europe (43% of total revenues); NAFTA (19%) and APAC (17%) (Figure 5).
Source: Company Website
FIGURE 3 - PIRELLI'S HISTORY CHRONOGRAM

3
FIGURE 8 – BUSINESS SEGMENT WEIGHT IN COMPANY SALES
Source: Author estimative, Company Data
Source: Author estimative, Company Data
FIGURE 9 - BUSINESS SEGMENT WEIGHT IN COMPANY ADJ. EBIT
The production capacity topped 75 million car tyres in 2018 of which around 60% was
suited to the manufacture of High Value tyres. The company counted 19 operating
factories, located in 12 different countries, where 80% of the total production is
originated in low cost countries giving Pirelli a competitive advantage.
FOCUS ON THE HIGH VALUE SEGMENT
Pirelli focuses on the most technologically demanding segments that are considered
high growth and high profitability.
The High Value segment can be identified through the following categories:
> Prestige: tyres designed and developed in partnership with car manufacturers
belonging to the Prestige Car segment (Figure 6) which are subject to specific
homologations;
> New Premium: tyres with a rim diameter ≥18 inches, aimed primarily but not
exclusively at motor vehicles belonging to the Auto Prestige and Auto Premium
segments (Figure 7).
> Specialties and Super Specialties (Figure 10): tyres with a high technological
content for vehicles of every class, which meet the needs of specific applications or
customizations for the final consumer, regarding the size of the rim diameter.
> Premium Motorcycle: tyres for high-end motorcycles that ensure high performance.
These categories will be joined by the products and services for connected vehicles and
for the Velo world activities that were launched in 2017.
COMPANY STRATEGY Pirelli’s strategy aims to maximize returns for shareholders while achieving increasing
levels of turnover and profitability year after year.
To accomplish that goal the company defined three main strategic orientations:
• Allocation of investments, development of innovations and reaching operational
improvements in the High Value segment while reducing the company’s presence on
the Standard predominant markets.
• Creation of consumer relevant businesses inside the Automotive and Motorcycle
industry, while at the same time developing solutions and services for connected
vehicles for Prestige and Premium users.
• Achievement of an efficiency plan linked to industrial and product activities equal to
1% of revenues to improve productivity, simplification of processes and optimization of
costs.
Main actions for High Value > Acceleration of the homologation program with the Prestige and Premium car
manufacturers, giving Pirelli a more accurate forecast of future demand needs.
> Development of an unprecedented product innovation program helping the
company in obtaining a Specialties range closer of the consumers and aligned with the
regional diversification.
FIGURE 6 – PRESTIGE CAR MANUFACTURES
Source: Own; Multiple Car Brand
FIGURE 7 – PREMIUM CAR MANUFACTURES
Source: Own; Multiple Car Brand

4
FIGURE 10 – PIRELLI’S SPECIALTIES PRODUCT LINE
Source: Company Presentation
Source: Company Website
Curriculum Vitae
Age: 71 Economics and Business Administration Degree in Bocconi University27 years as Pirelli's CEOCEO of Telecom ItaliaSource: Reference for Business
TABLE 2 – MR. MARCO TRONCHETTI PROVERA CURRICULUM VITAE HIGHLIGHTS
FIGURE 11 – PIRELLI’S CEO MR. MARCO TRONCHETTI PROVERA
> Increase in distribution coverage through channels and points of sale where Pirelli
exercises greater control and records higher sales: Car dealers; Tier 1 distributors;
Pirelli Retail and E-commerce.
> Enrichment of the Pirelli DNA with a strong Consumer “gene” with the creation
of the new Consumer Marketing function, profiling consumers to ensure a more
personalized, qualified and capable of serving Prestige and Premium consumers.
> Strengthening of the Motorcycle business through synergies with Metzeler
(subsidiary of Pirelli), by occupying complementary market segments and creating new
relationships with motorcycle manufacturers.
> Launch of the two new Velo and Cyber™ businesses: Pirelli intends to consolidate
its leadership in the markets in which it currently operates and expand its presence by
striking new high potential segments.
Re-conversion of Pirelli Standard capacity
With the new focus on the High Value segment, Pirelli, intends to reduce the standard
capacity about 7 million units between 2016 and 2020. Three of those are intended to
be converted into High Value, allowing the company to serve growing regions.
Transformation program
In order to digitizing the planning, production, distribution and consumer profiling
processes, Pirelli intends to implement four inter-functional programs:
> Demand forecast for both short and long term.
> Smart Manufacturing and Flexible Factory program, which responds in a faster
and more flexible way to the stakeholders needs.
> Supply Chain Program, which aims to offer a contextualized service with a
personalized touch.
> Prestige program, which aims to get to know the end consumer more closely
(manufacturers and owners of Prestige cars) to fully understand their needs in order to
identify new opportunities.
Corporate Governance Pirelli current position as a “Pure Consumer Tyre Company“ and the separation of the
previous industrial activities are results of the public takeover bid on the company’s
entire share capital made in 2015 by Marco Polo Industrial Holding S.p.A, a vehicle
formed by ChemChina, Camfin and LTI, which was merged by absorption in Pirelli
during 2016.
Mr. Marco Tronchetti Provera (Figure 11) is Pirelli’s CEO since 1992 and since October
2015, following the company’s takeover, he conciliates the CEO duties with Executive
Vice Chairman responsibilities. With 33 years of working experience in Pirelli (since
1986), Marco Provera has a degree in Economics and Business Administration from

5
Bocconi University of Milan and early on the seventies developed a sea transport
business for his family company.
Board of Directors Mr. Ning Gaoning (Figure 12) is the Chairman of the Board of Director since August
2018, being appointed as Chairman of China National Chemical Corporation Limited
(ChemChina) in the same year. Graduated in Economics from Shandong University in
1983 and since 1987 holds an MBA degree from the Business School of the University
of Pittsburgh in the United States. He is a certified senior international business
engineer with years of experience in top management position in various companies.
Pirelli’s model of corporate governance implements a traditional system of
administration and control, with a 15 seats Board of Directors responsible for managing
the business and a Board of Statutory Auditors entrusted of monitoring the
administration and compliance.
The appointment of the Board of Directors (Figure 14) is the following:
o 8 directors appointed by ChemChina (4 independent), including the Chairman;
o 4 directors appointed by Marco Tronchetti Provera & C. S.p.A. (1 independent),
Director of Pirelli's Board of Directors;
o Indications of the Global Offer Coordinators nominated in the IPO context;
o 1 minority independent (without the vote of the majority shareholder).
The board has established five internal committees:
o Audit, Risk, Sustainability and Corporate Governance Committee;
o Related-party Transactions Committee;
o Remuneration Committee;
o Appointments and Successions Committee;
o Strategies Committee.
Source: Company Website
FIGURE 12- PIRELLI’S CHAIRMAN MR. NING GAONING
TABLE 4 - GOVERNANCE LINES
Source: Company Presentation
Curriculum Vitae
Age: 61 MBA Degree in Pittsburgh UniversityChina Resources CEO Chairman of Sinochem Group2019 Asia Business Leader of the Year
Source: World Economic Forum
TABLE 3– MR. NING GAONING CURRICULUM VITAE HIGHLIGHTS
FIGURE 13 - PIRELLI'S STOCK DISTRIBUTION
Source: Own; Company Presentation Report

6
Remuneration System Pirelli’s remuneration system is governed by a specific Policy approved by the
Shareholders' meeting (May 15, 2018), which define the following rules:
Guidelines on compensation mix for senior Management;
No golden parachutes;
No severance agreements;
Claw back clauses in both MBO and LTI plans;
Non-compete agreement;
Four-year Retention Plan: to guarantee the continuity of management.
Industry Overview and Competitive Positioning Overview Tyre and Rubber industry sales are expected to grow at a CAGR of 7.7% from 2018FY
market and high barriers leads to a high concentration, thus, top 5 companies account
for 50% of the total market share in 2018 (Figure 17).
The market reached around 1.87 billion units in 2018 and is expected to reach around
2.71 billion units sold by 2023 (Figure 16).
The High Value Segment, where Pirelli originated around 64% of 2018 revenues,
registered 238 million units sold in the same year representing a worldwide 11.86%
CAGR between 2014 and 2018 and according to the same source is expected a 9.2%
CAGR for the next five years.
Source: Company Annual Report
FIGURE 14 - BOARD OF DIRECTORS COMPOSITION
FIGURE 16 - EVOLUTION OF TYRES SOLD WORLDWIDE (BILLION UNITS)
Source: Smithers
Name Position 2018 RemunerationMarco Tronchetti Provera Vice Chairma 5 048 582.00 € Ning Gaoning Chairman 480 062.00 € Yang Xingqiang Director 90 000.00 € Bai Xinping Director 145 000.00 € Giorgio Luca Bruno Director 1 367 683.00 € Laura Cioli Director 110 000.00 € Domenico De Sole Director 150 000.00 € Fan Xihaoua Director 90 000.00 € Ze'ev Goldberg Director 90 000.00 € Giovanni Lo Storto Director 69 617.00 € Marisa Pappalardo Director 100 000.00 € Cristina Scocchia Director 125 000.00 € Tao Haisu Director 90 000.00 € Giovanni Tronchetti Provera Director 227 493.00 € Wei Yintao Director 90 000.00 € Total 8 273 437.00 €
Remuneration of the Board of Directors
TABLE 5 - 2018 BOARD OF DIRECTORS REMUNERATION
Source: Annual Report
Caption's Table
Audit, Risk, Sustainability & Corporate Governance CommitteeRemuneration CommitteeAppointments and Sucessions CommitteeStrategies CommitteeRelated-Parties Transactions Committee
Source: Own table; Company Presentation Report
FIGURE 15 – BOARD OF DIRECTORS COMMITTEE CAPTION

7
17%13%
8%
8%
4%3%
3%1%
43%
BridgestoneCorp
Michelin
Goodyear Tire& Rubber Co
ContinentalAG
SumitomoRubberIndustries LtdPirelli & C SpA
Hankook TireCo Ltd
Nokian Tyresplc
Others
FIGURE 17 – MARKET SHARE OF MAIN INDUSTRY PLAYERS
Source: Thomson Reuters, Own Computation
25%
17%
5%
28%3%
6%4%4%4%
4%
BridgestoneCorp
Michelin
Goodyear Tire &Rubber Co
Continental AG
SumitomoRubberIndustries LtdPirelli & C SpA
Hankook TireCo Ltd
Nokian Tyresplc
Others
Source: Thomson Reuters, Own Computation
FIGURE 19 – INDUSTRY PLAYERS BY MARKET CAPITALIZATION
FIGURE 18 – REAL GDP % GROWTH YOY
Sources: International Monetary Fund
I. MACROECONOMIC ENVIRONMENT
A 2018 with sustainable growth and a similar 1H2019 With global GDP growth of +3.3% (Figure 18) the world economy continues the recovery
of the previous year. The Euro countries faced an average growth of +2.0%
representing a slowdown when compared to 2017 mainly due to trade uncertainty and
political conflicts.
On the other hand, United States had a year of increasing investment, consumption and
employment rate which lead to an GDP growth of +2.9% in 2018, yet faced a slowdown
in the 1H2019, growing at +2.2%.
China kept the strong economic performance of the prior year growing at more than two
times the world’s pace in 2018. It had a growth rate of +6.6% despite the credit and
trade tensions with the United States.
Political tensions limit industry profitability Traditional players are based in developed countries, as Germany and U.S., where a
stable governmental activity results in a political risk factor of 1 out of 7i. Nonetheless,
manufacturers are being attracted towards the developing markets, such as India and
China, due to attractive opportunities of increased tyre demand and lower production
costs. Significant political risk, factor 4 out of 7ii, related to unstable government actions,
that often leads to trade wars, unemployment and high inflation levels. Overall, political
tensions, just as the US trade war with China, can jeopardise the industry profitability
with tariffs burdens.
Asian economic expansion provides positive outlook for Demand
While advanced economies are expanding at a CAGR of 1.8% (Figure 18), Emerging
and Developing Asia regions are outperforming those economies at a CAGR of 6.3%
(Figure 18). Economic development in emerging countries opens new niches for tyre
manufacturers by providing lower production costs, lower regulation and an enhanced
customer base.
Segment protected by no close substitutes
Consumer preferences are moving towards more ecological vehicles and car-sharing
mobility because of cultural and lifestyle changes. Nevertheless, demand for tyres is
shielded due to the crucial role tyres have as a component of social cultural changing
trends.
Technological Innovation enhances a premium segment Greater integration of technology into tyres is a cornerstone for companies to move into
the premium segments, which is expected to grow 11.9% YoY, from 2018F to 2023F.
Moreover, R&D investments allow to cut down production costs while improving
profitability margins by 18%iii from 2010YE to 2018YE.
Sustainability and Environmental awareness shape the future Manufacturing tyre process involves the use of many chemicals, leading to potential
environmental hazards. Efforts have been made towards the decrease in waste from

8
dismantling and recycling of end of life vehicles and production more environmentally
friendly. Furthermore, in response to the demand of car manufacturing clients, the tyre
producers make regular improvement on the rolling resistance of their products to
reduce fuel consumption, which is the direct cause of CO2 emissions.
Higher Regulatory requirements improve transparency Safety concerns have led to increased regulation and transparency over the last 10
years. Tyre labelling requirements allow comparisons between different tyres in
measures such as performance, fuel efficiency and noise. Regulatory requirements
make it harder for low cost competitors to pierce and survive on the market.
II. KEY DRIVERS
Automobile demand is highly correlated with Tyre and Rubber Industry. From 2015YE
to 2018YE global demand for automobiles has shown a considerable increase of 3.92%
YoY (Figure 20), mainly driven by emerging markets, where countries like China are
experiencing an increase of vehicle demand of 16% YoY.
Moreover, tyre sales can be divided into two categories, Original Equipment and
Replacement Tyres. Car sales increased at 2.88% of CAGR from 2007YE to 2017YE
(Figure 21) and demand for OE, as a crucial component of newly supplied vehicles, is
expected to follow the overall trend.
Replacement tyre sales are related to the number of cars in circulation and the life
expectancy of tyres.
Improvements in rubber quality and better road conditions have been growing the mid-
life tyre expectancy (30,000 km for automobiles tyres), leading to a decline of the
replacement turnover. However, cars are driven more frequently, making it necessary
to buy replacements every 18 monthsiv.
In other hand Premium & Prestige Car PARC is developing at a higher pace, 8.0%
CAGR was observed between 2016 and 2018 and with no signs of slowing down the
Premium & Prestige segment is estimated to keep outperforming the market at 7.8%
CAGR for 2019F-2023F.
Raw Materials The main boosters of costs are natural rubber and synthetic rubber. Natural rubber is
obtained through rubber trees, which requires warm climates. While, synthetic rubber
can be produced from petrochemical feedstock with crude oil and butadiene as the main
inputs.
Accordingly, an increase in the oil price/butadiene leads to more costly synthetic rubber,
which increases demand for natural rubber and makes it more expensive (Figure 24).
0
5
10
15
20
25
China USJapan Germany
Source: The international Organization of Motor Vehicles Manufacturers
FIGURE 21 – PASSENGER CAR SALES IN SELECTED COUNTRIES (IN MN UNITS)
-10123456
0
20
40
60
80
100
120
Commercial vehicles
GDP Growth
Cars
Sources: IMF and The International Organization of Motor Vehicles Manufacturers
FIGURE 22 - WORLD GDP AND AUTOMOBILE PRODUCTION (IN MN UNITS)
72,61
77,2579,02
81,5
60
65
70
75
80
85
2015 2016 2017 2018e
FIGURE 20 - NUMBER OF CARS SOLD WORLDWIDE (IN MN UNITS)
Source: The international Organization of Motor Vehicles Manufacturers

9
FIGURE 23 - PIRELLI'S RAW MATERIALS CONSUMPTIONS IN 2018
Sources: Pirelli’s Company Presentation
54%
46%
2004
Bridgestone + Michelin + Goodyear Others
38%
62%
2017
Bridgestone + Michelin + Goodyear Others
Source: Multiples companies Annual Reports
FIGURE 25 - CHANGES IN INDUSTRY TOP 3 PLAYERS
When looking at 2018 figures, the inputs variations were characterized by increases in
the price of energy resources and Butadiene (main raw material in synthetic rubber),
and a decrease on the price of natural rubber:
Brent (oil) recorded an average price for the year of 72 USD per barrel,
representing an increase in +31.0% compared to the average price in 2017.
Despite that, oil price closed the year on a downfall with December averaging
58 USD per barrel. In the 1H2019, Brent prices average 64 USD per barrel and
the U.S. Energy Information forecasts the price to be around 65 USD per barrel,
maintaining a price range similar to the first half of the year.
Butadiene closed 2018 with an annual average of 1011 €/ tonne, which was a
drop of 10% compared to the annual average price in 2017 (1112€/tonne). The
downward trend stayed in the 1H2019 with Butadiene prices reducing and a
similar behavior is expected for the rest of the year. The commodity is
forecasted to average close to 950€/tonne in 2019.
Natural Rubber price is bouncing back after strong decline in 2018, the
commodity closes the previous year averaging 1365 USD per tonne, which
represented a price fall of 20% relative to 2017YE, where Natural Rubber price
was 1651 USD/tonne in average. Relative to the 1H2019 a recovery was felt,
and the price is expected to average 1450 USD per tonne in 2019.
III. PEER ANALYSIS
The companies more representative of the Tyre and Rubber Industry, ranked by market
share and size, are: (1) Bridgestone; (2) Michelin; (3) Goodyear; (4) Continental; (5)
Sumitomo; (6) Pirelli; (7) Nokian and (8) Hankook (Figure 18).
In 2004YE, the main 3 tyre manufacturers (Bridgestone, Michelin and Goodyear)
accounted for 54% of the total market, whereas in 2017YE it reduced to 38% (Figure
25), due to the entry of new players from emerging countries, as a result of an economic
expansion from Asia and Pacific.
The traditional players are investing in a product differentiation strategy, focusing on
brand recognition, product quality and safety. This leads to a loyal customer base
through more reliable and above-average products, which is reflected into a
corresponding ASP 31% higher than Low Cost companies. Therefore, to protect gross
margins of 30%, traditional players are moving towards the premium segment of tyres,
which is Pirelli’s case, where product quality is in high demand.
The High Value segment have two main players with completely different strategies,
business models and market approaches. Pirelli has positioned herself as a premium
brand that compromises to deliver a global high value. On other hand, Nokian business
model is totally focused on winter tyres. At this moment, they are the only players on
0,5
1
1,5
2
2,5
3
20
40
60
80
100
120
140
Crude Oil Natural Rubber
Source: Bloomberg
FIGURE 24 - CRUDE OIL $/BARREL AND NATURAL RUBBER $/KG

10
the industry with EBIT margins close to 20% where the “full-liners” like Bridgestone,
Michelin, Goodyear and Continental have EBIT margins of around 11%.
By opposition, the low-cost players, mainly Asiatic brands follow a cost efficiency
strategy, which allows them to deliver the product at an ASP of € 58 and still be
profitable. Gross margins of 21.9% are established through a light cost structure and
EBIT Margin slightly lower the 10% are the average for those players.
Activities based on emerging economies allow labour expenditures to be lower. In
addition, Asian companies tend to produce tyres with a smaller percentage of natural
rubber, thus more synthetic rubber, at the expense of the overall product quality.
IV. PORTER’S FIVE FORCES
Competition within the industry (High) We are talking about an industry moderately concentrated, with top 5 market companies
having a concentration ratio of roughly 50%. Low levels of product differentiation, within
each segment, translates into price competition..
Companies are now trying to gain advantage over competitors by investing in other
parameters such as performance, reputation and customer service. Decreasing
operating margins due to the competitive environment and growing influence of low-
cost Asian competitors, means the industry profitability is dependent on input prices.
Industry sales are expected to grow at a CAGR of 7.7% from 2018YE to 2023YE (Figure
16). Consequently, firms need to fight for market share, which contributes for the overall
high level of competition within the industry.
Bargaining Power of Buyers (Moderate) Contractual agreements for Original Equipment Manufacturers (OEM’s) influence
positively the bargaining power of suppliers. Not only the price of tyres remains stable,
irrespectively of market price, but also Original Equipment Manufacturers are able to
negotiate prices due to their scale.
Moreover, on the Replacement market, large retail chains are able to put pressure to
lower prices when buying in larger quantities. However, dispersed small size buyers
cannot achieve such bargaining power.
Overall, buyers do not have viable substitute products to tyres, but low switching costs
makes it easy for them to change between different tyre brands, resulting in a moderate
bargaining power.
Bargaining Power of Suppliers (Moderate) The manufacturing and processing of both natural and synthetic rubber is dominated
by few large world players. Hence, the existence of cartels for natural rubber and
petroleum such as OPEC, translates in higher bargaining power of suppliers.
Tyre production is highly sensitive to price fluctuations of rubber and other petroleum
derivatives since it is dependent on large amounts of those raw materials. There is a
5- Critical 4- High 3- Moderate 2-Low
1- Insignificant Source: Industry Data, Group Computations
FIGURE 27 - PORTER'S FIVE FORCES
FIGURE 26 - TYRE & RUBBER PLAYERS IN TIERS OF EBITDA MARGIN
Sources: Pirelli’s Company Presentation

11
correlation between oil prices and rubber prices (figure 24) and, as explained before,
the increase of oil price increases syntactic rubber price. This will result on a utilization
of higher percentages of natural rubber in tyre production which will ultimately lead to a
natural rubber price increase.
To mitigate the dependence on few providers of raw materials, some manufactures
started to perform backward integration, as in the case of Goodyear, where the
company produces some percentage of its rubber needs. Accordingly, this leads to a
moderate bargaining power of suppliers.
Threat of New Entrants (Low) The industry has high barriers to entry. In general terms, most tyres are relatively
undifferentiated, meaning that companies to be profitable, need to produce in large
quantities to achieve economies of scale. High capital expenditures are required, so it
is challenging for new entrants to match the scale of the existing producers.
Furthermore, a substantial amount of R&D is required to develop and test new tyre
models, whose approvals are difficult and costly to get due to strict legal and safety
regulations. Brand recognition makes it difficult to enter in the market with an unknown
product, contributing to a low threat of new entrants.
Threat of Substitutes Products (Low) There are no viable substitutes for tyres. However, it is necessary to take in
consideration that a higher environmental awareness could lead individuals towards the
usage of public transportation, which would affect the number of vehicle usage, leading
to a respective decrease in demand for tyres. Counterfeit tyres small market share and
low expectations of growth do not represent a significant threat to the industry.
V. SWOT ANALYSIS
A mature industry that does not seem to suffer great changes during decades. The high
barriers lifted by the experienced players hidden behind giant economies of scale,
countless capital spilled on technology and the lack of substitutes are strengths that
characterize the industry. The global trend of emerging markets growth and
infrastructures development, the electrical cars and even safety regulations are
opportunities on a reinsuring future for the organisations. Due to a highly competitive
industry environment, arising from low product diversification and significant exit
barriers, profitability margins tend to be low. Higher regulatory pressures and legal
requirements derived from growing global environmental awareness can harm the
current industry profitability. Moreover, the double effect of oil, both as a raw material
input for synthetic rubber and as a key driver for car usage, constitutes a threat to the
industry.
12
FIGURE 28 – HIGH VALUE SEGMENT GROWTH
Source: Author estimative, Company Data
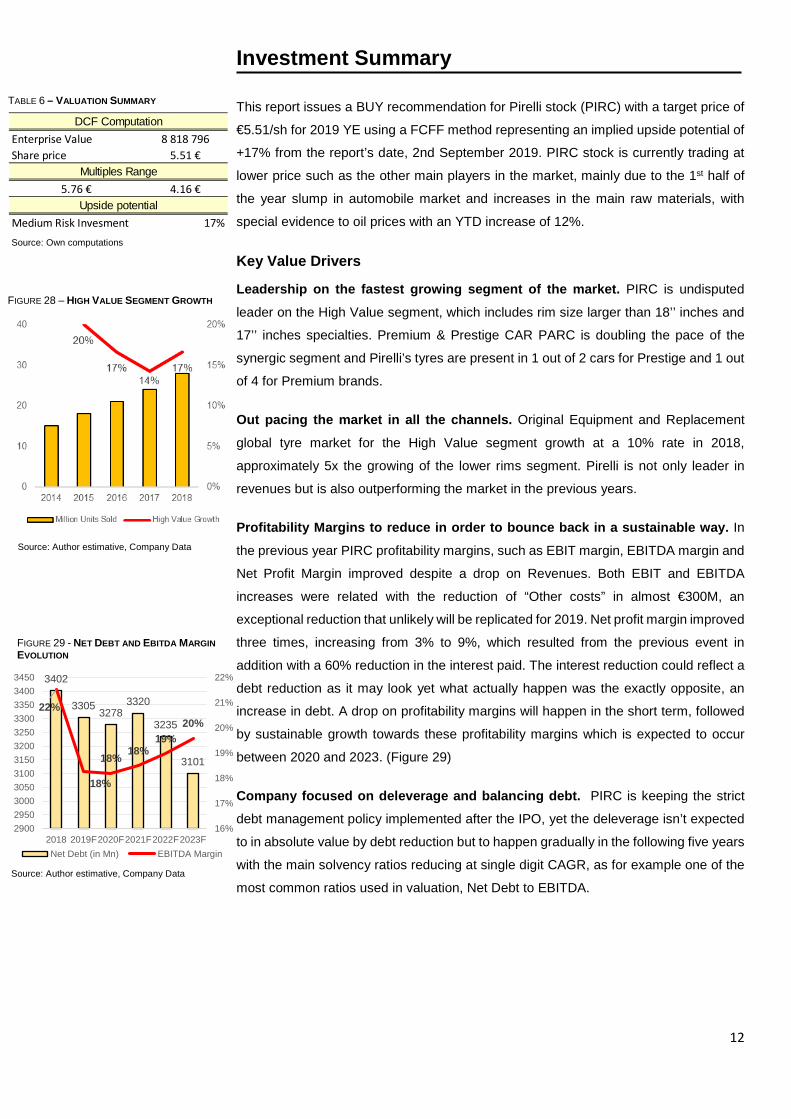
Investment Summary
This report issues a BUY recommendation for Pirelli stock (PIRC) with a target price of
€5.51/sh for 2019 YE using a FCFF method representing an implied upside potential of
+17% from the report’s date, 2nd September 2019. PIRC stock is currently trading at
lower price such as the other main players in the market, mainly due to the 1st half of
the year slump in automobile market and increases in the main raw materials, with
special evidence to oil prices with an YTD increase of 12%.
Key Value Drivers
Leadership on the fastest growing segment of the market. PIRC is undisputed
leader on the High Value segment, which includes rim size larger than 18’’ inches and
17’’ inches specialties. Premium & Prestige CAR PARC is doubling the pace of the
synergic segment and Pirelli’s tyres are present in 1 out of 2 cars for Prestige and 1 out
of 4 for Premium brands.
Out pacing the market in all the channels. Original Equipment and Replacement
global tyre market for the High Value segment growth at a 10% rate in 2018,
approximately 5x the growing of the lower rims segment. Pirelli is not only leader in
revenues but is also outperforming the market in the previous years.
Profitability Margins to reduce in order to bounce back in a sustainable way. In
the previous year PIRC profitability margins, such as EBIT margin, EBITDA margin and
Net Profit Margin improved despite a drop on Revenues. Both EBIT and EBITDA
increases were related with the reduction of “Other costs” in almost €300M, an
exceptional reduction that unlikely will be replicated for 2019. Net profit margin improved
three times, increasing from 3% to 9%, which resulted from the previous event in
addition with a 60% reduction in the interest paid. The interest reduction could reflect a
debt reduction as it may look yet what actually happen was the exactly opposite, an
increase in debt. A drop on profitability margins will happen in the short term, followed
by sustainable growth towards these profitability margins which is expected to occur
between 2020 and 2023. (Figure 29)
Company focused on deleverage and balancing debt. PIRC is keeping the strict
debt management policy implemented after the IPO, yet the deleverage isn’t expected
to in absolute value by debt reduction but to happen gradually in the following five years
with the main solvency ratios reducing at single digit CAGR, as for example one of the
most common ratios used in valuation, Net Debt to EBITDA.
Enterprise Value 8 818 796Share price 5.51 €
5.76 € 4.16 €
Medium Risk Invesment 17%Upside potential
DCF Computation
Multiples Range
TABLE 6 – VALUATION SUMMARY
Source: Own computations
3402
3305 32783320
3235
3101
22%
18%
18% 18%19%
20%
16%
17%
18%
19%
20%
21%
22%
290029503000305031003150320032503300335034003450
2018 2019F2020F2021F2022F2023FNet Debt (in Mn) EBITDA Margin
FIGURE 29 - NET DEBT AND EBITDA MARGIN EVOLUTION
Source: Author estimative, Company Data

13
0
1000
2000
3000
4000
5000
6000
-5,5
€-4
,0 €
-2,5
€-1
,0 €
0,5
€2,
0 €
3,5
€5,
0 €
6,5
€8,
0 €
9,5
€11
,0 €
12,5
€14
,0 €
15,5
€17
,0 €
FCFF
FIGURE 30 - MONTE CARLO SIMULATION RESULTS
Source: Oracle Crystal Ball; Author computations
0
500
1000
1500
2000
2500
3000
3500
2018 2019 2020 2021 2022 2023Europe NAFTA APAC
LatAM MEAI Russia
FIGURE 31 – EVOLUTION OF REVENUES BY REGION
Source: Own computations
Investment Risks
PIRC faces some risks of diverse natures, Market & Economic Risks, as the high
exposure to the automobile sector and changes in the raw materials can have enormous
impact in the company results especially given the high uncertainty in both, thus, a close
monitoring and precautionary measures are crucial.
Other risks that requires attention given the proportions that may be related are the
Reputational Risks, in a situation where a PIRC product defect is a cause for a
significant accident it can be extremely harmful for company’s reputation and the
relationship with manufactures can be compromised. This is even more relevant given
Pirelli value proposition and positioning in the industry as a high-quality deliver player.
Two methodologies were applied in order to understand how impactful some of those
investment risk can be to PIRC, which are a Monte Carlo Simulation and a Sensitivity
Analysis. The results can be seen in the Figure 30, the mean of the price target using
Monte Carlo Simulation was €5.51, implying a 17% upside potential for PIRC stock. The
simulation also identified the Cost of Revenues as the variable with the most negative
impact on the price target, from the ones stressed to the test, and Terminal Revenues
as the one with more relevance in price upswings. The sensitivity analysis performed
pinpointed the scenario of -20% in the Cost of Equity as the scenario which lead to a
higher target price, €7.60 per share. (Table 7)
Valuation Two different approaches were used in order to evaluate the company: absolute
valuation and relative valuation.
Absolute Valuation: Discount Cash Flow Approach
The absolute valuation method which fit Pirelli’s business model the most, and therefore
the one selected to compute the share price, was the Discounted Cash Flow Method
(DCF). The Dividend Discount Model (DDM) was also performed, yet the results were
inconclusive and did not have practical value for two main reasons, the lack of historical
dividend payments, since the ChemChina acquisition in 2015 that the company does
not pay dividend to their shareholders, and the uncertainty of dividend distribution, the
dividend pay-out is in proportion of Pirelli’s future net income results.
The most applicable DCF model for PIRC share price, given the available information,
is the Free Cash Flow to the Firm (FCFF). The FCFF was used as the main cash-flow
proxy to evaluate the company’s equity value and since the company is changing their
capital structure the Free Cash Flow to the Equity (FCFE) cannot be perform with
accuracy and detail needed for an investment recommendation.
Price Target
6.94% 7.60 €
7.38% 6.99 €
7.81% 6.44 €
8.25% 5.95 €
8.68% 5.51 €
9.11% 5.12 €
9.55% 4.76 €
9.98% 4.43 €
10.42% 4.13 €
Term
inal
Cos
t of E
quity
TABLE 7 - TERMINAL COST OF EQUITY IMPACT ON PRICE TARGET
Source: Own computations

14
3,54%
5,05%
6,09%7,19%
8,09%
0%1%2%3%4%5%6%7%8%9%
0
1000
2000
3000
4000
5000
6000
7000
8000
2018 2019 2020 2021 2022 2023
Revenues Forecast (in Mn €)
Revenues Growth Rate
FIGURE 32 - FORECASTED REVENUES FOR 2019-2023
Source: Own computations
2019F 2020F 2021F 2022F 2023F
# of Tyres sold (in millions) 62 598 64 075 66 280 69 227 72 940
High Value Segment 38 710 42 816 47 359 52 387 57 952 % >18 31 080 34 499 38 294 42 506 47 182 11%
Specialities 7 630 8 317 9 065 9 881 10 770 9%
Standard Value Segment 23 888 21 260 18 921 16 840 14 988 -11%
Average Selling Price
High Value Segment 95 96 98 99 101 Growing at inflation rate
Standard Value Segment 71 72 73 74 75
Inflation Rate 0.76% 1.19% 1.24% 1.44% 1.54%
Assumption2019F-2023F
Source:Statista
TABLE 8 - FORECAST OF REVENUES DRIVERS
Forecast Analysis
Revenues to grow at 6% CAGR driven by a strong High Value segment
Total Revenues were forecasted by segment, a High Value segment and a Standard
Value Segment (Figure 34), these distinction was crucial given the different growth rate
in the premium side of the business and the disinvestment on Standard production
capacity, a goal set in the IPO strategy. The same methodology was used for both
segments and was based on two main assumptions, which are the following:
Average Selling Price (ASP) – High Segment ASP decrease in the historical
period (2016-2018), mainly driven by increase in competition on the segment,
economies of scales on the production side and efficiency improvements.
However, the company does not plan on keeping R&D investment for
profitability, instead the company is investing on new product development.
In the Standard Segment, prices are relatively constant for Pirelli’s products,
with no capacity to set prices in this segment the company will remain as price
taker, yet the Asian low-cost companies do not represent a threat.
o Forecast to growth at inflation rate (Figure 33) between 2019F-2023F
for both segments. H.V. range 95€-101€ and S.V. range 70€-75€
Number of tyres sold – H.V. Segment is expected to keep outperforming the
industry, however the previous growth rates (14% for 2018 and 13% for 2017)
are projected to slow down given the macroeconomic scenario for the
Automobile sector. The recommendation assumes a conservative approach.
o Forecasted 11% CAGR for 2019F-2023F on tyres sold with rims size
bigger than 18’ and 9% CAGR for 2019F-2023F for specialities, this
growth difference is in line with the previous years.
o The company plans to keep reducing the production capacity in the
S.V. and disinvesting in less profitable economies and products.
Assumed to maintain the 2018 decrease of total units sold plus an extra
1% for the conservative approach for the industry taken in this
recommendation.
3 687 4 127
4 622 5 186
5 825
1 691 1 523 1 372 1 239 1 120 -
1 000
2 000
3 000
4 000
5 000
6 000
7 000
2019F 2020F 2021F 2022F 2023F
High Value Standard Value
FIGURE 34 -HIGH VALUE GROWTH VS STANDARD VALUE GROWTH
Source: Own computations
0,76%
1,19% 1,24%
1,44%1,54%
0,00%
0,20%
0,40%
0,60%
0,80%
1,00%
1,20%
1,40%
1,60%
1,80%
2019F 2020F 2021F 2022F 2023F
FIGURE 33 – INFLATION RATE FORECAST 2019-2023
Source: International Monetary Fund

15
372 400 429 461 496
112 109110
117129
0
100
200
300
400
500
600
700
2019F 2020F 2021F 2022F 2023F
D&A Investment Capex
FIGURE 36 – CAPEX DECOMPOSITION : MAINTENANCE VS INVESTMENT
Source: Own computation
By channel and region, the breakdown of the revenues forecast is the following:
o Replacement channel assumed to continue being responsible by 75% of
revenues while Original Equipment generates the remaining 25%.
o Regional breakdown forecast will take into consideration PIRC strategy for the
following years and an increase of Europe (+2%), NAFTA (+1%) and APAC
(+3%) is projected in detriment of South America (-5%) while MEAI and Russia
are forecasted to remain the same in % of total sales. (Figure 31)
Raw materials prices – A crucial element of the business model
Raw materials are crucial for companies operating in this sector, as main drivers of cost
of revenues are three commodities: Brent Oil; Natural Rubber and Butadiene. Oil takes
a more important role when compared with the other two given the multiples way it can
affect the business, directly in the production of the tyre as it is used in synthetic rubber
and other derivatives but also indirectly, oil prices are a crucial driver on the automobile
industry.
In the forecasted period, oil prices are projected to drop until 2020, from 2018’s 71
USD/barrel to 59 USD/barrel in 2020 (Figure 35). From 2020F to 2023F, oil price is
forecasted to recover for numbers close to 2018 (Figure 35). However, given the nature
of oil industry, volatile and unpredictable, is highly difficult to forecast future prices. PIRC
hedge this risk as much as possible, and since oil prices are projected to keep around
the 55-75 range the company is expected to react according to the market and to keep
Gross Margins around the 35%, which will be the assumption for the forecasted period.
Mandatory Capital Expenditures in fixed assets and R&D
In this industry, PP&E have a tremendous impact on the company and play a key role
in a business jeopardized by economies of scale. In PIRC case, PP&E represents 25%
of Total Assets and these percentage is forecasted to grow until 29% in last forecasted
year. In a mature industry like these where Asian low-cost players have consumed the
standard-low part of the sector, there is little room for competitive advantages based on
cost leaving product quality, differentiation and brand recognition as value creators for
companies like Pirelli. In order to stay ahead of the market is crucial to invest in R&D
and production efficiency, leading to constant CAPEX in new investments. In the
forecasted period will be assume a CAPEX investment of 9% of sales (Figure 36),
around the same in the previous two years, to keep IPO strategy goal. As the
depreciation concerns, will be forecasted a constant level of 6.51% of PP&E,
maintaining the previous year’s numbers (Figure 36). For Amortizations an identical
approach will be made to perform the forecast, around 3% of amortization of Intangible
Assets, excluding goodwill.
Financial Income remains stable with Argentina’s Hyperinflation effect to be brief
Interest receive for financial instruments is projected as an average of the previous 3
years.
$71,00
$65,00
$59,00
$64,00
$69,00
$75,00
$50
$55
$60
$65
$70
$75
$80
2018 2019 2020 2021 2022 2023
FIGURE 35 – OIL PRICES FORECAST
Source: U.S. Energy Information Administration
0
1000
2000
3000
4000
5000
6000
7000
8000
2019F 2020F 2021F 2022F 2023F
Total Revenues Gross Profit Operational Profit
FIGURE 37 - OPERATIONAL PROFIT TO KEEP CONSTANT AS REVENUES GROWTH
Source: Own computation

16
Hyperinflation effect: During the course of the third quarter of 2018, the inflation rate
accumulated over the past three years in Argentina exceed 100%. This led the Group
to adopt the accounting standard IAS 29 - Financial Reporting in Hyper-inflationary
Economies. Following IMF, hyperinflation in Argentina is forecasted for both 2019 and
2020, with the cumulative past three years inflation rate <100% only for 2021-2023.
Resulting in income of around €8.5 million for both 2019 and 2020.
The costs for using debt to stay at historical
Interest paid to banks and other financial institutions for the use of debt average 4.3%
of Total Debt for the previous 3 years, although the company have been restructuring
debt structure and deals with the banking sector.
For the forecasted period is projected a cost for the use of debt of 4.3%. Commissions
and Other Expenses remained equal to 2018 values for the forecasted period given the
difficulty in project both values with precision.
Forex hedging plays a major role in the financial balance
Pirelli hedges for changes in forex, in the previous years Pirelli received in average
€6 865 million for every 0.01 positive change in the spot rate while paid €35 769 million
for every negative change. Hedging strategy used to protect the company historically
paid €19 404 million when the spot rate negatively changed 0.01 while resulted in
€12 764 million loss when the opposite verifies.
Those values were assumed for 2019F-2023F (Figure 39). Using Euro Forecast
Forward, from Bloomberg software the results of the hedging strategies were
forecasted, a more detail table can be seen on appendix 12.
A look into the evolution of the Working Capital Indicators
PIRC management of capital is heavily composed by three operational variables,
inventory and account receivables on the asset side and account payables on the
liabilities side, which this report will go in detail:
o Inventory: In 2018, 48% of current assets were inventory related. The firm
operated with 78 inventory days (Figure 40) and an inventory rotation of 4.6.
o Receivables: Accounted for 27% of current assets in the previous year, Pirelli
worked with 44 receivables days (Figure 40) and a receivables rotation of 8.3.
o Payables: The company most significant part of Working Capital, accounting
for 54% of current liabilities and more than twice of account receivables.
Account payables weighted 30% of revenues in 2018 and operationally worked
with 2.3 of payable rotation.
-131
34 27
-36
7
71
-64-51
19
-13
-150
-100
-50
0
50
100
2019F 2020F 2021F 2022F 2023F
Net Gain/Loss Hedge Result
FIGURE 39 - HEDGING STRATEGIES PROJECTED RESULTS
Source: Own computations
1,64
2,032,26
2,61
3,17
0,0
0,5
1,0
1,5
2,0
2,5
3,0
3,5
185
190
195
200
205
210
215
220
2019F 2020F 2021F 2022F 2023F
Interest PaidInterest Coverage Ratio (x)
FIGURE 38 - INTEREST COVERAGE RATIO TO GROWTH FASTER THAN PAID INTEREST
Source: Own computations
0
10
20
30
40
50
60
70
80
90
2018 2019F 2020F 2021F 2022F 2023F
Inventory Days Receivables Days
FIGURE 40 - INVENTORY DAYS VS RECEIVABLES DAYS
Source: Own computations
17
FCFF = EBIT * (1 – Marginal Tax Rate) + D&A – Net increase in NWC - CAPEX
To forecast Pirelli working capital a similar approach was made for these three
components, a moving average of the previous 3 years, which allows to take into
consideration both the trend of the previous historical years but also maintain the
correlation that exists between adjacent years.
Other possible approach was setting a goal for the company working capital indicators,
either by a company strategy, which is not the case, or by assuming a convergence to
industry average, which was considered not the best approach because of the
operational differences explained along the report between Pirelli and their peers.
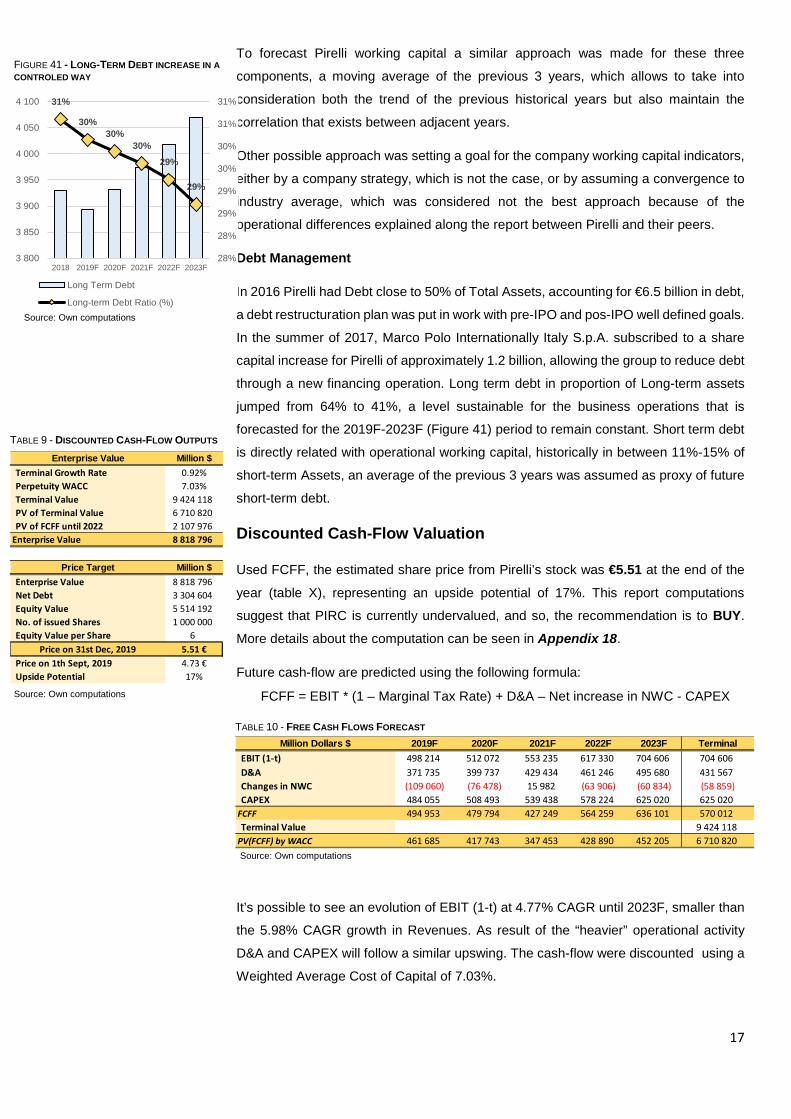
Debt Management
In 2016 Pirelli had Debt close to 50% of Total Assets, accounting for €6.5 billion in debt,
a debt restructuration plan was put in work with pre-IPO and pos-IPO well defined goals.
In the summer of 2017, Marco Polo Internationally Italy S.p.A. subscribed to a share
capital increase for Pirelli of approximately 1.2 billion, allowing the group to reduce debt
through a new financing operation. Long term debt in proportion of Long-term assets
jumped from 64% to 41%, a level sustainable for the business operations that is
forecasted for the 2019F-2023F (Figure 41) period to remain constant. Short term debt
is directly related with operational working capital, historically in between 11%-15% of
short-term Assets, an average of the previous 3 years was assumed as proxy of future
short-term debt.
Discounted Cash-Flow Valuation
Used FCFF, the estimated share price from Pirelli’s stock was €5.51 at the end of the year (table X), representing an upside potential of 17%. This report computations
suggest that PIRC is currently undervalued, and so, the recommendation is to BUY. More details about the computation can be seen in Appendix 18.
Future cash-flow are predicted using the following formula:
It’s possible to see an evolution of EBIT (1-t) at 4.77% CAGR until 2023F, smaller than
the 5.98% CAGR growth in Revenues. As result of the “heavier” operational activity
D&A and CAPEX will follow a similar upswing. The cash-flow were discounted using a
Weighted Average Cost of Capital of 7.03%.
Million Dollars $ 2019F 2020F 2021F 2022F 2023F TerminalEBIT (1-t) 498 214 512 072 553 235 617 330 704 606 704 606D&A 371 735 399 737 429 434 461 246 495 680 431 567Changes in NWC (109 060) (76 478) 15 982 (63 906) (60 834) (58 859)CAPEX 484 055 508 493 539 438 578 224 625 020 625 020
FCFF 494 953 479 794 427 249 564 259 636 101 570 012Terminal Value 9 424 118
PV(FCFF) by WACC 461 685 417 743 347 453 428 890 452 205 6 710 820
TABLE 10 - FREE CASH FLOWS FORECAST
Source: Own computations
31%
30%30%
30%29%
29%
28%
28%
29%
29%
30%
30%
31%
31%
3 800
3 850
3 900
3 950
4 000
4 050
4 100
2018 2019F 2020F 2021F 2022F 2023F
Long Term Debt
Long-term Debt Ratio (%)
FIGURE 41 - LONG-TERM DEBT INCREASE IN A CONTROLED WAY
Source: Own computations
Enterprise Value Million $Terminal Growth Rate 0.92%Perpetuity WACC 7.03%Terminal Value 9 424 118PV of Terminal Value 6 710 820PV of FCFF until 2022 2 107 976
Enterprise Value 8 818 796
Price Target Million $Enterprise Value 8 818 796Net Debt 3 304 604Equity Value 5 514 192No. of issued Shares 1 000 000Equity Value per Share 6
Price on 31st Dec, 2019 5.51 €Price on 1th Sept, 2019 4.73 €Upside Potential 17%
TABLE 9 - DISCOUNTED CASH-FLOW OUTPUTS
Source: Own computations

18
The discount rate was computed based on the following assumptions:
Capital Structure
The company is still in a period of capital restructuration following the IPO, in 2017.
The delivering strategy is in process and for the forecasted period was assumed that
the company would converge to industry figures. The terminal value was set for a D/E
of 67.98%, the industry average, and in 2018 the company had 84.38% debt to equity
ratio.
Cost of Debt
For the forecast period a constant cost of debt was assumed to be equal to the actual
cost. The company is in a mature state and have a large importance in Italy which is
reflected in a stable relation with the banks and other financial institutions. An average
of the previous three years cost of debt was used as forecast based on the previous
argumentation, as result was applied a 4.31% rate for cost of debt. The effective tax
rate of 18.48% was assumed for the forecasted period with similar arguments.
Cost of equity
Cost of equity was forecasted using the formula:
Taking in consideration the changing capital structure for the forecast period and the
following components assumptions:
o Country Risk Premium – Country Risk Premium for Italy was 3.06%, assumed
data from Damodaran computations.
o Market Risk Premium – Market Risk Premium was forecast to be 5.96%, also
following Damodaran computation’s method and assumed United States
market risk.
o Risk Free Rate – The Risk-Free rate used for WACC computation was 0.92%,
the 10 years Italy Treasury Bond.
Levered Beta
Using the regression of Pirelli returns with FTSE MIB index returns, the actual
systematic risk of Pirelli was 0.997 (Appendix 15). The unlevered beta was computed
using the following formula: Unlevered Beta = 𝐿𝐿𝐿𝐿𝐿𝐿𝐿𝐿𝐿𝐿𝐿𝐿𝐿𝐿 𝐵𝐵𝐿𝐿𝐵𝐵𝐵𝐵
�1+ (1−𝑡𝑡𝑡𝑡𝑡𝑡 𝑟𝑟𝑡𝑡𝑡𝑡𝑟𝑟) ∗ 𝐷𝐷𝑟𝑟𝐷𝐷𝑡𝑡𝐸𝐸𝐸𝐸𝐸𝐸𝐸𝐸𝑡𝑡𝐸𝐸 �
Resulting in 0.591 Unlevered Beta for companies operating in the Tyre & Rubber
industry without any debt. Those systematic risk was allocated only to the portion of the
business that is noncash, it was assumed a 4.95% as Cash to Firm Value since it is the
Industry average (Damodaran).
Levered beta was finally computed using the Unlevered Beta adjusted for cash and the
Pirelli capital structure for the forecasted period.
0%
10%
20%
30%
40%
50%
60%
70%
80%
Weight of Equity Weight of Debt
FIGURE 42 - CAPITAL STRUCTURE EVOLUTION
Source: Own computations
3%
4%
5%
6%
7%
8%
9%
10%
11%
2019F 2020F 2021F 2022F 2023F Terminal
Evolution of Re Evolution of RdWACC
FIGURE 43 - COST OF EQUITY TO KEEPING THE WACC PACE
Source: Own computations

19
TV = 𝐹𝐹𝐹𝐹𝐹𝐹𝐹𝐹∗(1+𝑔𝑔)𝑊𝑊𝑊𝑊𝐹𝐹𝐹𝐹−𝑔𝑔
Terminal Value Assumptions
The Terminal Value (TV) was computed using the Perpetuity Growth Model approach,
where the WACC assumed a value on the perpetuity equal to the 2023 WACC rate and
the Growth Rate was computed using the Stable Growth Model. More details on the
Appendix 16.
Multiples Valuation
As a mature company on a stable industry, the standard multiples are suitable to
perform a market-based valuation. The ratios used were EV/Revenues, EV/EBITDA
and EV/EBIT, all of them enterprise value multiples, equity multiples, like P/E, were not
include on the analysis given the impossibility in obtaining data, especially of the Asian
players.
The results (Table 12) obtained showed Pirelli’s with EV/EBIT and EV/EBITDA multiples
above the industry players and a lower EV/Revenues went compared with their peers,
which is coherent with the company position and business model and are directly
related with the higher EBIT and EBITDA margin.
The share price range computed from the multiples was between 5.76 and 4.16 (Table
13), with EV/Revenues multiple of 1.74x and EV/EBITDA of 8.82x. Since Pirelli’s does
not have any company with a similar business model, a 100% consumer based
company with strong focus on the High Value segment, some adjustatment were made,
therefore the recommendation did consider the following assumptions: o Three Tiers of Comparables given the similiarly with Pirelli
o Tier 1, included similar margins and market position (Figure 44);
o Tier 2, European full liners (Figure 45);
o Tier 3, International full liners (Figure 46).
o Weigthed average mean was assumed in front of the median given the smaller
sample.
o Weigthed average ponderaded the tiers the following way, 70% for Tier 1, 20%
for tier 2 and 10% for tier 3.
Low-cost asian were excluded as peers.
EBITDA 1 117 579
EBIT 703 056Sales 5 194 471
5.76 4.16
Pirelli's
Share Price Range
TABLE 12 - MARKET BASED VALUATION RESULTS
Source: Own Computations
FIGURE 45 - TIER 2 COMPARABLES
Source: Company Website
FIGURE 44 - TIER 1 COMPARABLES
Source: Company Website
Ponderation EV/EBITDA EV/EBIT EV/Sales
Tier 1 Compararison - Similiar EBITDA Margin and Market Position
70% Nokian 7.37x 9.21x 2.15x
Tier 2 - European Full Linears
10% Michelin 5.78x 8.81x 1.02x10% Continental 4.39x 6.75x 0.615x
Tier 3 - International Full Linears
5% Bridgestone 5.59x 8.44x 0.93x5% Goodyear 4.64x 7.76x 0.58x
6.68 8.82 1.74
5.68 8.62 0.98
Weighted Mean
Median
TABLE 11 - MULTIPLES BY COMPANY
Source: Own Computations
FIGURE 46 - TIER 3 COMPARABLES
Source: Company Website

20
Financial Analysis
Tyres & Rubber: A stable industry, which high levels of dependence
Pirelli operates in a stable industry, as one of the more mature companies of the sector
yet facing the constant challenge of dependence of the automobile sector and raw
materials prices. The slowdown of automobile production in the last two years did affect
Pirelli growth, especially the High Value segment that after a growth of 14% in 2018 and
15% in 2017, is forecasted to growth at an 11% CAGR until 2023.
Leading player in innovation and R&D
As a company focused on deliver consumer value for the High Value Segment, Pirelli
needs constant investment in Research and Development and a mindset focused in
innovation. With around €200 million invested in R&D in 2016 and close to €220 million
in 2018, the company is forecasted to growth its R&D investment at an average of 5.5%
every year between 2019F-2023F.
Operating efficiency to improve in the following years
After some years of instability in operations with the disinvestment in the industrial part
of the business and more recently in the reduction on production capacity in the
Standard Segment, is expected an improvement on operational efficiency in the
following years. Total Assets Turnover, Inventory Turnover and Fixed Assets Turnover
to growth at positive rates until 2023F. The Cash Conversion Cycle will improve at a
CAGR of 10%, the company will be able to convert the investment into returns faster by
reducing the 11 days of CCC in 2018 to 6 days in 2023F, boosted by improvements in
inventory days while keeping the payables period stable.
Five years of ripple profitability
Profitability margins are expected to drop until 2021 (Figure 50) given the payment of
differed expenses and a Euro drop versus the Dollar in 2019 that will have impact in the
next 2-3 years. 2018 was also an exceptional year in profitability terms, with low debt
costs enhancing all major ratios, yet the consequences will be felt until 2021. The 2021-
2023F years are projecting a return to the 2018’s profitability levels but with a
sustainable growth (Figure 50).
Liquidity and Solvency reflecting an improved debt management
As one of the main concerns after the acquisition, the debt management indicators will
improve. As for the Solvency Ratios, a reduction of Long-Term Debt Ratio and Debt to
Equity Ratio reflect the converging period that the company will feel in the near future
as it reduces debt proportions. Interest Coverage Ratio is expected to growth at an 8.7%
CAGR until 2023, jumping from 2.09x to 3.17x.
77,379 78,6
77
50
55
60
65
70
75
80
85
2016 2017 2018 2019FCars sold in million units
Source: Statista
FIGURE 47 - CARS SOLD IN MILLION UNITS
0102030405060708090
100
2012 2013 2014 2015 2016 2017 2018cars commercial vehicles
FIGURE 48 - CARS AND COMMERCIAL VEHICLES PRODUCTION
Source: Own Computations
219 222 233247
265286
0
50
100
150
200
250
300
350
2018 2019F 2020F 2021F 2022F 2023F
Research & DevelopmentSource: Own Computations
FIGURE 49 - RESEARCH & DEVELOPMENT EXPENDITURES
14%
11% 11% 11% 12%12%
0%
2%
4%
6%
8%
10%
12%
14%
16%
0
1 000
2 000
3 000
4 000
5 000
6 000
7 000
8 000
2018 2019F2020F2021F2022F2023F
Revenues EBIT Margin
FIGURE 50 - REVENUES INCREASING AS PROFITABILY GOES DOWN
Source: Own Computations

21
Investment Risks
In this chapter the report will look at the risks that could potentially affect the company performance. The risks were segmented into four categories taken into account the nature and scope they affect the company operations both in the short but also in the long term, which are, Market & Economic Risks (M&ER), Operational Risks (OR), Legal Risks (LR) and Reputational Risks (RR).
Market & Economic Risk | Worldwide economic conditions (M&ER1)
Global economic conditions such the trade war between United States and China and the environment of uncertainty around Brexit can slowdown international trading and have detrimental effects on investment, market confidence of business and, more generally, on consumers.
Market & Economic Risk | Controversial Brexit Scenario (M&ER2)
Represent both macroeconomic risks, related with forex volatilities and duties, as well as operational risks, possibility of delays in the supply chain for not only raw materials but also for finished products used in the operations.
Market & Economic Risk | Heavy expose to automobile industry (M&ER3)
Not only a decline on vehicles demand will impact revenues from cars manufactures but also the replacement market that heavily relies on national trends, such as consumer spending, fuel prices and local market variables. Two of the major social and technological concerns regarding the long term health of the automobile sector are the urbanisation phenomenon and the values and behaviours of the younger generations, owning a car or obtaining a driving license do not have the same importance for the new generations as it had in previous older generations, which were way more cars dependents.
Market & Economic Risk | Exchange Rate Fluctuations (M&ER4)
The global exposure of the companies within this industry require business transactions in numerous currencies. As a result, foreign appreciations have a negative impact on the P&L. The positions subject to this risk are mainly receivables and payables in foreign currency, and to mitigate this risk Pirelli enters hedging positions using forward contracts. The company also gave translation risk related with subsidiaries operating in other currencies, yet the management decided not to adopt hedging policies for these exposures.
Market & Economic Risk | Change in Raw Material Prices (M&ER5)
The main raw materials used in production are natural rubber, synthetic rubber and oil derivatives, in particular chemicals and carbon black. The prices for these goods and components are exposed to considerable market fluctuations. Operating margins are negatively affected by price increases since the companies do not have substitutes for the inputs only some strategies to reduce the impact of such events

22
Market & Economic Risk | Changes in Interest Rates (M&ER6)
Represents the risk related with the exposure to the variability of the future cash flows of financial assets or liabilities. Regarding that, Pirelli hedge using interest rate swaps and cross currency interest rate swaps in order to mitigate financial losses originated from the use of debt instruments.
Operational Risk | Credit Risk (OR1)
Refers to risks related with the exposure to possible losses resulting from the counterparty failure to pay its commercial and financial obligations and therefore the group will not be able to recover the value of assets sold. The company tries to mitigate this risk by defining costumer profiles associated with credit limits that in case of being exceeded will lead to a request of guarantees from the costumers.
Operational Risk | Operations Disruptions (OR2)
With globally dispersed operations Pirelli is expose to a broad range of externalities, as for example natural disasters and wars. Nevertheless, the vast majority of the company’s factories are based on developed countries, where measures of risk mitigation are implemented according to the country to overcome possible disruptions.
Operational Risk | Information Technology System Failures (OR3)
The industry complexity of operations increases the dependence on efficient functioning computing and IT systems. Failure of such technical systems due to externalities leads to significant operational losses. Pirelli focus on the prevention and mitigation of this risk using security systems against unauthorised access and business data solutions.
Legal Risk | Regulation (LR1)
New or revised laws, as the ones for labelling systems and regulations regarding tyre performance, limit and change the scope of business activities, while raising operating costs. Overall, operating margins will struggle with heavier regulations.
Legal Risk | Intellectual property (LR2)
Heavy investments on R&D in order to improve the competitive position and to keep up the market innovations. On that regard, intellectual property is an important business resource and the risk of infringement on other company’s property rights needs to be well managed to avoid compensatory damages and extra costs.
Legal Risk | Intellectual property (LR3)
Possible legal, fiscal, trade or labour disputes will always be a risk factor for a company, Pirelli looks to prevent and mitigate any penalties from such events.
Reputation Risk | Reputation (RR1)
Traditional companies depend mainly on the brand name as a driver to differentiate themselves from low cost providers. Pirelli is one of those cases and the company does not only look to differentiate from low cost providers but also from the full liners, especially in the high value segment. As a result, a reputation deterioration could have significant effects on their operations.

23
-82%
-3%
-7%
3%
-13%
0%
52%
Sensivity Price Distribution
Cost of Revenues Cost of DebtCountry Risk Premium Terminal Growth RateMarket Risk Premium Terminal CapexTerminal Revenues
Price Target
6.94% 7.60 €
7.38% 6.99 €
7.81% 6.44 €
8.25% 5.95 €
8.68% 5.51 €
9.11% 5.12 €
9.55% 4.76 €
9.98% 4.43 €
10.42% 4.13 €
Term
inal
Cos
t of E
quity
Price Target
4.77% 6.67 €
5.07% 6.36 €
5.36% 6.06 €
5.66% 5.78 €
5.96% 5.51 €
6.26% 5.26 €
6.56% 5.03 €
6.85% 4.81 €
7.15% 4.59 €
Mar
ket R
isk
Prem
ium
Price Target
563 685 3.86 €
598 915 4.27 €
634 145 4.68 €
669 375 5.10 €
704 606 5.51 €
739 836 5.93 €
775 066 6.34 €
810 297 6.76 €
845 527 7.17 €
Term
inal
EB
IT (1
-t)
Price Target
3.45% 5.93 €
3.67% 5.82 €
3.88% 5.72 €
4.10% 5.61 €
4.31% 5.51 €
4.53% 5.42 €
4.75% 5.32 €
4.96% 5.23 €
5.18% 5.14 €
Cos
t of D
ebt
Reputation Risk | Product Defects (RR2)
On an industry where product defects can have severe repercussions, companies tend to have customer safety as top priority. Any recalls or defects will originate not only practical damages, litigation costs and replacement costs but will also have a huge impact on companies’ reputation. For Pirelli product defects represent a bigger treat than for the rest of the industry given the company business model and the crucial role that the relationship with premium manufactures and costumers can be affected.
Risk to price target
In this section will be analyzed the impact that the risks described in the previous section, and other crucial parts of the FCFF model, have in the company price target. To perform the analyses two approaches were computed: Sensitivity Analysis and a Monte Carlo Simulation.
The variables selected to perform the analyses were among others, the cost of revenues, terminal value of revenues, terminal CAPEX and WACC component like cost of debt, country risk premium and market risk premium.
Monte Carlo Simulation
The simulation was run 100 000 times using Crystal Ball, with seven variables being tested in order to understand which one have the major impact on price.
A summary table of the statists shows the mean of the price target computed by the Simulation was €5.55, representing an upside potential of 17% versus the base case and a median of €5.40. Both metrics are near the price target computed in the DCF valuation.
Relative to the impact of the variables analyzed on the Monte Carlo Simulation, can be concluded that Cost of Revenues is the main driver for falls in the share price and Terminal Revenues the main driver for stock valorization. All the WACC components tested push the price down with Market Risk Premium being the more relevant in that regard. Terminal Growth Rate have a positive impact in the price yet was expected to have a more significant impact.
The normal distribution gives 57% probability for BUY recommendation to be correct.
Sensitivity Analysis
In the sensitivity analysis eight variables were also tested with both positive and negative scenarios of 5%/10%/15%/20% versus the actual value to see how much a variation of a variable affects the share price.
Four tables of sensitivity analysis were elaborated, where the variable with major impact of each one of those table are shown below. The higher price target happens when the cost of equity faced a reduction of 20% versus the actual value, in that scenario the share price reached €7.6 representing a 61% upside versus the share price at September 2nd. Terminal EBIT (1-t) did also performed well when faced the 20% positive scenario yet was also the variable which gave the lowest share price when stressed for a negative 20% scenario. The complete table, including all the variables can be seen in the appendix 19.
Monte Carlo Statistics
Trials 100 000
Mean 5.55 €
Median 5.40 €
Skewness 0.247
Kurtosis 3.172
Minimum -9.920
Maximum 30.763
Range Width 40.682
Mean Std. Error 0.012
0
1000
2000
3000
4000
5000
6000
-5,5
€-4
,0 €
-2,5
€-1
,0 €
0,5
€2,
0 €
3,5
€5,
0 €
6,5
€8,
0 €
9,5
€11
,0 €
12,5
€14
,0 €
15,5
€17
,0 €
FCFF
FIGURE 51- MONTE CARLO SIMULATION RESULTS
Source: Own Computations

24
Appendices
Appendix 1: Statement of Financial Position (PIRC)
Consolidated Balance Sheet €'000 2016 2017 2018 2019F 2020F 2021F 2022F 2023F
CAGR 2018-2023F
Property, plant and equipment 3 556 635 2 980 294 3 092 927 3 321 875 3 543 766 3 763 520 3 986 963 4 219 580 6.41%
Goodwill 2 351 263 1 877 363 1 886 862 1 886 862 1 886 862 1 886 862 1 886 862 1 886 862 0.00%
Other Intangible Assets 4 145 626 4 016 341 3 896 476 3 779 849 3 666 713 3 556 963 3 450 498 3 347 220 -2.99%
Investments in associates and J.V. 47 010 17 480 72 705 72 705 72 705 72 705 72 705 72 705 0.00%
Other financial assets 198 691 229 519 68 781 68 781 68 781 68 781 68 781 68 781 0.00%
Deferred tax assets 147 964 111 553 74 118 52 562 37 276 26 435 18 747 13 295 -29.08%
Other receivables 226 868 204 051 225 707 218 875 218 875 218 875 218 875 218 875 -0.61%
Tax receivables 11 864 27 318 16 169 16 169 16 169 16 169 16 169 16 169 0.00%
Derivative financial instruments 0 878 20 134 20 134 20 134 20 134 20 134 20 134 0.00%
Non-Current Assets 10 685 921 9 464 797 9 353 879 9 437 813 9 531 281 9 630 444 9 739 734 9 863 622 1.07%
Inventories 1 055 639 940 668 1 128 466 1 080 659 1 116 033 1 228 968 1 292 434 1 397 585 4.37%
Trade receivables 679 321 652 487 627 968 682 259 699 264 744 904 802 869 863 478 6.58%
Other receivables 275 622 400 538 416 651 408 595 408 595 408 595 408 595 408 595 -0.39%
Securities held for trading 48 597 33 027 27 196 37 956 39 873 42 299 45 341 49 010 12.50%
Cash and cash equivalents 1 532 977 1 118 437 1 326 900 1 284 397 1 384 261 1 427 926 1 613 455 1 866 419 7.06%
Tax receivables 64 395 35 461 41 393 47 083 47 083 47 083 47 083 47 083 2.61%
Derivative financial instruments 23 989 27 770 98 567 50 109 50 109 50 109 50 109 50 109 -12.66%
Current Assets 3 680 540 3 208 388 3 667 141 3 591 058 3 745 218 3 949 883 4 259 884 4 682 278 5.01%
Total Assets 14 366 461 12 733 914 13 031 697 13 028 871 13 276 499 13 580 327 13 999 618 14 545 900 2.22% Borrowings from banks and other financial institutions 5 945 999 3 897 089 3 929 079 3 893 819 3 932 382 3 973 294 4 018 384 4 069 497 0.70%
Other payables 87 421 74 435 83 287 83 287 83 287 83 287 83 287 83 287 0.00% Provisions for liabilities and charges 170 992 127 124 138 327 138 327 138 327 138 327 138 327 138 327 0.00%
Provisions for deferred tax liabilities 1 452 169 1 216 635 1 081 605 933 868 806 310 696 176 601 085 518 982 -13.66%
Employee benefit obligations 368 100 274 037 224 312 224 312 224 312 224 312 224 312 224 312 0.00%
Tax payables 3 374 2 399 2 091 2 091 2 091 2 091 2 091 2 091 0.00%
Derivative financial instruments 0 54 963 16 039 16 039 16 039 16 039 16 039 16 039 0.00%
Non-Current Liabilities 8 028 055 5 646 682 5 474 740 5 291 743 5 202 748 5 133 526 5 083 525 5 052 536 -1.59% Borrowings from banks and other financial institutions 642 047 559 168 800 145 695 183 730 278 774 722 830 425 897 630 2.33%
Trade payables 1 498 492 1 673 642 1 604 677 1 654 276 1 749 953 1 850 528 1 983 205 2 146 264 5.99%
Other payables 783 079 565 254 436 752 595 028 595 028 595 028 595 028 595 028 6.38% Provisions for liabilities and charges 45 987 45 833 33 876 41 899 41 899 41 899 41 899 41 899 4.34%
Employee benefit obligations 0 0 5 475 0 0 0 0 0 n.a.
Tax payables 41 773 48 416 65 503 51 897 51 897 51 897 51 897 51 897 -4.55%
Derivative financial instruments 52 170 17 910 59 602 43 227 43 227 43 227 43 227 43 227 -6.22%
Current Liabilities 3 063 548 2 910 223 3 006 030 3 081 510 3 212 283 3 357 302 3 545 681 3 775 945 4.67%
Total Liabilities 11 091 603 8 556 905 8 480 770 8 373 253 8 415 032 8 490 828 8 629 206 8 828 481 0.81%
Share Capital 1 342 281 1 904 375 1 904 375 1 904 375 1 904 375 1 904 375 1 904 375 1 904 375 0.00%
Reserves 1 784 952 2 096 927 2 204 180 2 469 603 2 638 587 2 829 690 3 042 951 3 296 802 8.38%
Net Income 147 625 175 707 442 372 281 640 318 505 355 434 423 086 516 241 3.14%
Total Equity 3 274 858 4 177 009 4 550 927 4 655 618 4 861 467 5 089 499 5 370 412 5 717 418 4.67%

2
Common Size Balance Sheet (% of Total Assets) 2016 2017 2018 2019F 2020F 2021F 2022F 2023F
Property, plant and equipment 24.8% 23.4% 23.7% 25.5% 26.7% 27.7% 28.5% 29.0% Goodwill 16.4% 14.7% 14.5% 14.5% 14.2% 13.9% 13.5% 13.0% Other Intangible Assets 28.9% 31.5% 29.9% 29.0% 27.6% 26.2% 24.6% 23.0% Investments in associates and J.V. 0.3% 0.1% 0.6% 0.6% 0.5% 0.5% 0.5% 0.5% Other financial assets 1.4% 1.8% 0.5% 0.5% 0.5% 0.5% 0.5% 0.5% Deferred tax assets 1.0% 0.9% 0.6% 0.4% 0.3% 0.2% 0.1% 0.1% Other receivables 1.6% 1.6% 1.7% 1.7% 1.6% 1.6% 1.6% 1.5% Tax receivables 0.1% 0.2% 0.1% 0.1% 0.1% 0.1% 0.1% 0.1% Derivative financial instruments 0.0% 0.0% 0.2% 0.2% 0.2% 0.1% 0.1% 0.1% Non-Current Assets 74.4% 74.3% 71.8% 72.4% 71.8% 70.9% 69.6% 67.8% Inventories 7.3% 7.4% 8.7% 8.3% 8.4% 9.0% 9.2% 9.6% Trade receivables 4.7% 5.1% 4.8% 5.2% 5.3% 5.5% 5.7% 5.9% Other receivables 1.9% 3.1% 3.2% 3.1% 3.1% 3.0% 2.9% 2.8% Securities held for trading 0.3% 0.3% 0.2% 0.3% 0.3% 0.3% 0.3% 0.3% Cash and cash equivalents 10.7% 8.8% 10.2% 9.9% 10.4% 10.5% 11.5% 12.8% Tax receivables 0.4% 0.3% 0.3% 0.4% 0.4% 0.3% 0.3% 0.3% Derivative financial instruments 0.2% 0.2% 0.8% 0.4% 0.4% 0.4% 0.4% 0.3%
Current Assets 25.6% 25.2% 28.1% 27.6% 28.2% 29.1% 30.4% 32.2% Total Assets 100.0% 100.0% 100.0% 100.0% 100.0% 100.0% 100.0% 100.0% Borrowings from banks and other financial institutions 41.4% 30.6% 30.2% 29.9% 29.6% 29.3% 28.7% 28.0% Other payables 0.6% 0.6% 0.6% 0.6% 0.6% 0.6% 0.6% 0.6% Provisions for liabilities and charges 1.2% 1.0% 1.1% 1.1% 1.0% 1.0% 1.0% 1.0% Provisions for deferred tax liabilities 10.1% 9.6% 8.3% 7.2% 6.1% 5.1% 4.3% 3.6% Employee benefit obligations 2.6% 2.2% 1.7% 1.7% 1.7% 1.7% 1.6% 1.5% Tax payables 0.0% 0.0% 0.0% 0.0% 0.0% 0.0% 0.0% 0.0% Derivative financial instruments 0.0% 0.4% 0.1% 0.1% 0.1% 0.1% 0.1% 0.1% Non-Current Liabilities 55.9% 44.3% 42.0% 40.6% 39.2% 37.8% 36.3% 34.7% Borrowings from banks and other financial institutions 4.5% 4.4% 6.1% 5.3% 5.5% 5.7% 5.9% 6.2% Trade payables 10.4% 13.1% 12.3% 12.7% 13.2% 13.6% 14.2% 14.8% Other payables 5.5% 4.4% 3.4% 4.6% 4.5% 4.4% 4.3% 4.1% Provisions for liabilities and charges 0.3% 0.4% 0.3% 0.3% 0.3% 0.3% 0.3% 0.3% Employee benefit obligations 0.0% 0.0% 0.0% 0.0% 0.0% 0.0% 0.0% 0.0% Tax payables 0.3% 0.4% 0.5% 0.4% 0.4% 0.4% 0.4% 0.4% Derivative financial instruments 0.4% 0.1% 0.5% 0.3% 0.3% 0.3% 0.3% 0.3% Current Liabilities 21.3% 22.9% 23.1% 23.7% 24.2% 24.7% 25.3% 26.0% Total Liabilities 77.2% 67.2% 65.1% 64.3% 63.4% 62.5% 61.6% 60.7% Share Capital 9.3% 15.0% 14.6% 14.6% 14.3% 14.0% 13.6% 13.1% Reserves 12.4% 16.5% 16.9% 19.0% 19.9% 20.8% 21.7% 22.7% Net Income 1.0% 1.4% 3.4% 2.2% 2.4% 2.6% 3.0% 3.5% Total Equity 22.8% 32.8% 34.9% 35.7% 36.6% 37.5% 38.4% 39.3%

3
Appendix 2: Income Statement (PIRC)
Income Statement €'000 2016 2017 2018 2019F 2020F 2021F 2022F 2023F CAGR 2018-2023F
Revenues from sales and services 4 976 396 5 352 283 5 194 471 5 378 394 5 649 917 5 993 761 6 424 714 6 944 661 5.98% Geographic Distribution of Sales Europa - 2 238 000 2 234 200 2 420 277 2 542 463 2 697 192 2 891 121 3 125 098 6.94% NAFTA - 983 900 1 004 100 1 075 679 1 129 983 1 198 752 1 284 943 1 388 932 6.70% Asia & Pacific - 806 200 890 200 1 075 679 1 129 983 1 198 752 1 284 943 1 388 932 9.30% South America - 915 700 691 900 430 272 451 993 479 501 513 977 555 573 -4.29% Midle East & Africa & India - 248 900 207 100 215 136 225 997 239 750 256 989 277 786 6.05% Russia & CIS - 159 600 167 000 161 352 169 498 179 813 192 741 208 340 4.52% Cost of revenue (1 540 516) (1 859 837) (1 818 199) (1 882 577) (1 977 617) (2 097 971) (2 248 816) (2 430 811) 5.98%
Changes in inventories (22 406) 140 258 201 416 106 423 106 423 106 423 106 423 106 423 -11.98%
Gross Margin 3 413 474 3 632 704 3 577 688 3 602 240 3 778 723 4 002 213 4 282 321 4 620 273 5.25% R&D (208 614) (211 500) (219 000) (221 584) (232 770) (246 936) (264 691) (286 113) 5.49% Sales and marketing expenses (557 253) (592 286) (542 668) (586 442) (616 048) (653 540) (700 529) (757 223) 6.89% Personnel expenses (986 308) (1 034 647) (1 067 579) (1 110 730) (1 155 625) (1 202 335) (1 250 933) (1 301 496) 4.04% Depreciation, Amortization & Impairments (342 584) (371 457) (414 523) (371 735) (399 737) (429 434) (461 246) (495 680) 3.64% Other costs (1 330 866) (1 380 874) (1 096 494) (1 320 430) (1 387 091) (1 471 507) (1 577 309) (1 704 959) 9.23% Other income 696 225 628 533 483 205 638 802 659 835 699 992 750 321 811 044 10.91% Net impairment loss on financial assets - - (21 273) (22 133) (22 459) (23 332) (24 442) (25 602) 3.77% Increase in fixed assets for internal work 2 378 3 110 3 700 3 175 3 336 3 539 3 793 4 100 2.08% Operating Income 686 452 673 583 703 056 611 163 628 163 678 658 757 284 864 346 4.22% Net income from equity investments (20 019) (6 855) (4 980) (4 980) (4 980) (4 980) (4 980) (4 980) 0.00%
Financial Income 42 806 128 540 139 730 112 506 76 780 62 845 56 625 46 305 -
19.82% Financial expenses (469 996) (491 150) (336 041) (373 199) (309 250) (300 509) (289 926) (272 393) -4.11% EBT 239 243 304 118 501 765 345 490 390 713 436 014 519 004 633 277 4.77% Income Taxes (75 256) (40 848) (52 964) (63 850) (72 208) (80 580) (95 917) (117 036) 17.18% Net Income from continuing operations 163 987 263 270 448 801 281 640 318 505 355 434 423 086 516 241 2.84% Net Income from discontinued operations (16 362) (87 563) (6 429) 0 0 0 0 0 n.a. Total Net Income 147 625 175 707 442 372 281 640 318 505 355 434 423 086 516 241 3.14%
Common-Size Income Statement (% of Revenues) 2016 2017 2018 2019F 2020F 2021F 2022F 2023F
Revenues from sales and services 100.0% 100.0% 100.0% 100.0% 100.0% 100.0% 100.0% 100.0% Geographic Distribution of Sales Europa - 41.8% 43.0% 45.0% 45.0% 45.0% 45.0% 45.0% NAFTA - 18.4% 19.3% 20.0% 20.0% 20.0% 20.0% 20.0% Asia & Pacific - 15.1% 17.1% 20.0% 20.0% 20.0% 20.0% 20.0% South America - 17.1% 13.3% 8.0% 8.0% 8.0% 8.0% 8.0% Middle East & Africa & India - 4.7% 4.0% 4.0% 4.0% 4.0% 4.0% 4.0% Russia & CIS - 3.0% 3.2% 3.0% 3.0% 3.0% 3.0% 3.0% Cost of revenue 31.0% 34.7% 35.0% 35.0% 35.0% 35.0% 35.0% 35.0% Changes in inventories 0.5% 2.6% 3.9% 2.0% 1.9% 1.8% 1.7% 1.5% Gross Margin 68.6% 67.9% 68.9% 67.0% 66.9% 66.8% 66.7% 66.5% R&D 4.2% 4.0% 4.2% 4.1% 4.1% 4.1% 4.1% 4.1% Sales and marketing expenses 11.2% 11.1% 10.4% 10.9% 10.9% 10.9% 10.9% 10.9% Personnel expenses 19.8% 19.3% 20.6% 20.7% 20.5% 20.1% 19.5% 18.7% Depreciation, Amortisation and Impairments 6.9% 6.9% 8.0% 6.9% 7.1% 7.2% 7.2% 7.1% Other costs 26.7% 25.8% 21.1% 24.6% 24.6% 24.6% 24.6% 24.6% Other income 14.0% 11.7% 9.3% 11.9% 11.7% 11.7% 11.7% 11.7% Net impairment loss on financial assets - - 0.4% 0.4% 0.4% 0.4% 0.4% 0.4% Increase in fixed assets for internal work 0.1% 0.1% 0.1% 0.1% 0.1% 0.1% 0.1% Operating Income 13.8% 12.6% 13.5% 11.4% 11.1% 11.3% 11.8% 12.4% Net income from equity investments -0.4% -0.1% -0.1% -0.1% -0.1% -0.1% -0.1% -0.1% Financial Income 0.9% 2.4% 2.7% 2.1% 1.4% 1.0% 0.9% 0.7% Financial expenses 9.4% 9.2% 6.5% 6.9% 5.5% 5.0% 4.5% 3.9% EBT 4.8% 5.7% 9.7% 6.4% 6.9% 7.3% 8.1% 9.1% Income Taxes 1.5% 0.8% 1.0% 1.2% 1.3% 1.3% 1.5% 1.7% Net Income from continuing operations 3.3% 4.9% 8.6% 5.2% 5.6% 5.9% 6.6% 7.4% Net Income from discontinued operations 0.3% 1.6% 0.1% 0.0% 0.0% 0.0% 0.0% 0.0% Total Net Income 3.0% 3.3% 8.5% 5.2% 5.6% 5.9% 6.6% 7.4%

4
Appendix 3: Cash-Flow Statement (PIRC)
Cash Flow Statement €'000 2016 2017 2018 2019F 2020F 2021F 2022F 2023F CAGR 2018-2023F
Operating Activities 953 780 671 444 840 933 919 435 919 899 912 237 1 099 117 1 227 174 7.85% Operational Income 686 452 673 583 703 056 611 163 628 163 678 658 757 284 864 346 4.22% D&A 342 584 371 457 414 523 371 735 399 737 429 434 461 246 495 680 3.64% Income Tax (75 256) (40 848) (52 964) (63 850) (72 208) (80 580) (95 917) (117 036) 17.18% ΔOther Operating Assets 0 22 817 (21 656) 6 832 0 0 0 0 n.a. Operational Assets Held for Sale 0 (60 729) 50 052 10 677 0 0 0 0 n.a. ΔDeferred Taxes & Investment Tax Credit 0 (199 123) (97 595) (126 181) (112 271) (99 294) (87 403) (76 650) -4.72% ΔNWC 0 (95 713) (154 483) 109 060 76 478 (15 982) 63 906 60 834 -183.00% Investment Activities (340 000) (459 470) (518 225) (484 055) (508 493) (539 438) (578 224) (625 020)
CapEX (340 000) (489 000) (463 000) (484 055) (508 493) (539 438) (578 224) (625 020) 6.18% Investments in associates and J.V. 0 29 530 (55 225) 0 0 0 0 0 n.a. Financing Activities (447 209) (2 364 290) (227 481) (300 934) (198 887) (201 731) (193 190) (179 956) Interest paid (490 015) (498 005) (341 021) (378 179) (314 230) (305 489) (294 906) (277 373) -4.05% Interest receive 42 806 128 540 139 730 112 506 76 780 62 845 56 625 46 305 -19.82% ΔDebt 0 (2 048 910) 31 990 (35 260) 38 563 40 912 45 090 51 113 9.83% ΔDerivative financial instruments 0 54 085 (58 180) 0 0 0 0 0 n.a. Change in Cash 134 446 212 520 171 067 327 702 422 198 n.a.
Beginning 1 326 900 1 284 397 1 384 261 1 427 926 1 613 455 End 1 461 346 1 496 917 1 555 328 1 755 628 2 035 653
Common-Size Cash-Flow Statement (% of Operational CF) 2016 2017 2018 2019F 2020F 2021F 2022F 2023F
Operating Activities 100.0% 100.0% 100.0% 100.0% 100.0% 100.0% 100.0% 100.0% Operational Income 72.0% 100.3% 83.6% 66.5% 68.3% 74.4% 68.9% 70.4% D&A 35.9% 55.3% 49.3% 40.4% 43.5% 47.1% 42.0% 40.4% Income Tax -7.9% -6.1% -6.3% -6.9% -7.8% -8.8% -8.7% -9.5% ΔOther Operating Assets 0.0% 3.4% -2.6% 0.7% 0.0% 0.0% 0.0% 0.0% Operational Assets Held for Sale 0.0% -9.0% 6.0% 1.2% 0.0% 0.0% 0.0% 0.0% ΔDeferred Taxes & Investment Tax Credit 0.0% -29.7% -11.6% -13.7% -12.2% -10.9% -8.0% -6.2% ΔNWC 0.0% -14.3% -18.4% 11.9% 8.3% -1.8% 5.8% 5.0% Investment Activities -35.6% -68.4% -61.6% -52.6% -55.3% -59.1% -52.6% -50.9% CapEX -35.6% -72.8% -55.1% -52.6% -55.3% -59.1% -52.6% -50.9% Investments in associates and J.V. 0.0% 4.4% -6.6% 0.0% 0.0% 0.0% 0.0% 0.0% Financing Activities -46.9% -352.1% -27.1% -32.7% -21.6% -22.1% -17.6% -14.7% Interest paid -51.4% -74.2% -40.6% -41.1% -34.2% -33.5% -26.8% -22.6% Interest receive 4.5% 19.1% 16.6% 12.2% 8.3% 6.9% 5.2% 3.8% ΔDebt 0.0% -305.1% 3.8% -3.8% 4.2% 4.5% 4.1% 4.2% ΔDerivative financial instruments 0.0% 8.1% -6.9% 0.0% 0.0% 0.0% 0.0% 0.0% Change in Cash 14.6% 23.1% 18.8% 29.8% 34.4%
Beginning 144.3% 139.6% 151.7% 129.9% 131.5% End 158.9% 162.7% 170.5% 159.7% 165.9%

5
Appendix 4: Key Financial Ratios
Key Financial Ratios CAGR 2018-2023F
Liquidity Ratios 2018 2019F 2020F 2021F 2022F 2023F
Current Ratio (x) 1.22 1.17 1.17 1.18 1.20 1.24 0.33%
Quick Ratio (x) 0.84 0.81 0.82 0.81 0.84 0.87 0.59%
Cash Ratio (x) 0.47 0.43 0.45 0.44 0.47 0.51 1.37%
Operating Efficiency Ratios 2018 2019F 2020F 2021F 2022F 2023F
Total Assets Turnover (x) 0.40 0.41 0.43 0.44 0.46 0.48 3.67%
Accounts Receivables Turnover (x) 8.27 7.88 8.08 8.05 8.00 8.04 -0.56%
Collection Period (days) 44.13 46.30 45.17 45.36 45.61 45.38 0.56%
Inventory Turnover (x) 4.60 4.98 5.06 4.88 4.97 4.97 1.54%
Days in Inventory (days) 79.29 73.34 72.10 74.84 73.43 73.45 -1.52%
Payables Turnover (x) 3.24 3.25 3.23 3.24 3.24 3.24 -0.01%
Payables Period (days) 112.76 112.27 113.05 112.69 112.67 112.80 0.01%
Operating Cycle (days) 123.42 119.64 117.27 120.20 119.04 118.84 -0.75%
Cash Cycle (days) 10.66 7.37 4.22 7.51 6.37 6.03 -10.76%
Fixed Assets Turnover 0.56 0.57 0.59 0.62 0.66 0.70 4.86%
Profitability Ratios 2018 2019F 2020F 2021F 2022F 2023F
Gross Profit Margin (%) 69% 67% 67% 67% 67% 67% -0.69%
EBITDA Margin (%) 22% 18% 18% 18% 19% 20% -1.86%
EBIT Margin (%) 14% 11% 11% 11% 12% 12% -1.66%
Net Profit Margin (%) 9% 5% 6% 6% 7% 7% -2.68%
ROA (%) 3% 2% 2% 3% 3% 4% 0.89%
ROCE (%) 7% 6% 6% 7% 7% 8% 2.74%
ROE (%) 10% 6% 7% 7% 8% 9% -1.46%
EPS (x) 0.44 0.28 0.32 0.36 0.42 0.52 3.14%
Solvency Ratios 2018 2019F 2020F 2021F 2022F 2023F
Long-term Debt Ratio (%) 30% 30% 30% 29% 29% 28% -1.49%
Debt to Equity Ratio (x) 1.04 0.99 0.96 0.93 0.90 0.87 -3.52%
Equity Multiplier (x) 2.86 2.80 2.73 2.67 2.61 2.54 -2.34%
Debt to EBITDA 4.40 4.54 4.41 4.17 3.87 3.65 -3.66%
Interest Coverage Ratio (x) 2.09 1.64 2.03 2.26 2.61 3.17 8.69%
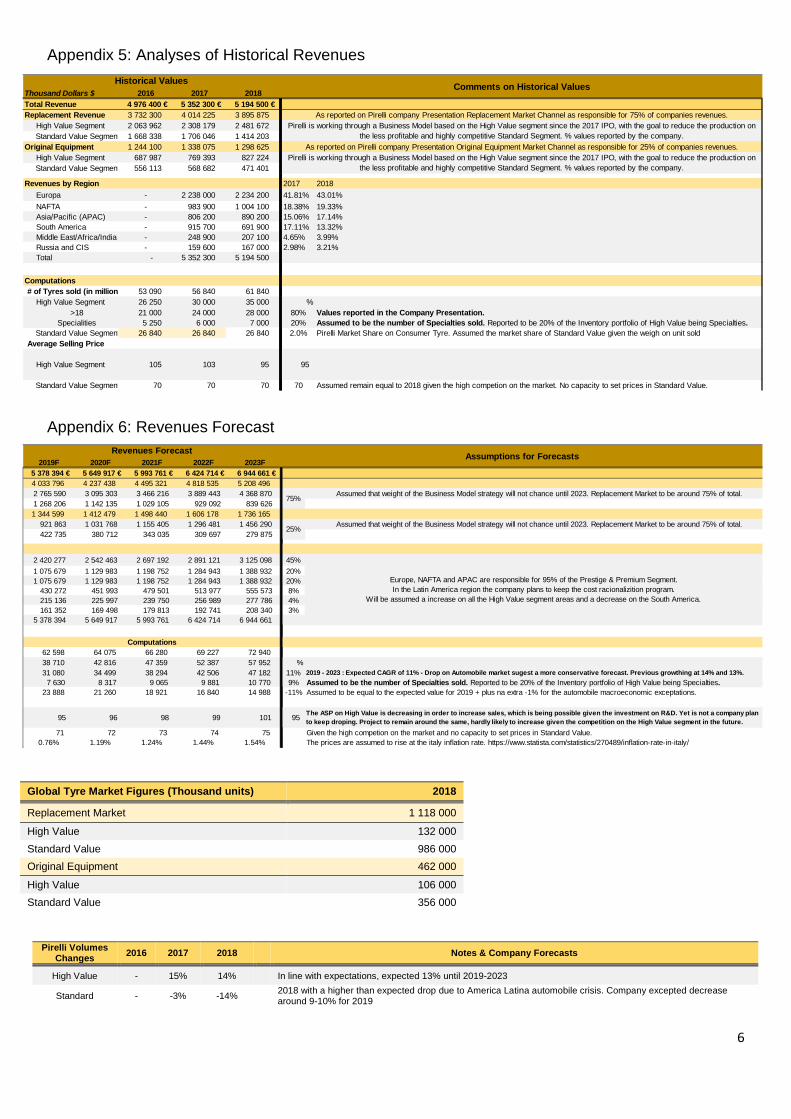
6
Appendix 5: Analyses of Historical Revenues
Appendix 6: Revenues Forecast
Global Tyre Market Figures (Thousand units) 2018
Replacement Market 1 118 000
High Value 132 000 Standard Value 986 000 Original Equipment 462 000
High Value 106 000 Standard Value 356 000
Pirelli Volumes Changes 2016 2017 2018 Notes & Company Forecasts
High Value - 15% 14% In line with expectations, expected 13% until 2019-2023
Standard - -3% -14% 2018 with a higher than expected drop due to America Latina automobile crisis. Company excepted decrease around 9-10% for 2019
Thousand Dollars $ 2016 2017 2018Total Revenue 4 976 400 € 5 352 300 € 5 194 500 € Replacement Revenue 3 732 300 4 014 225 3 895 875 High Value Segment 2 063 962 2 308 179 2 481 672
Standard Value Segment 1 668 338 1 706 046 1 414 203 Original Equipment 1 244 100 1 338 075 1 298 625 High Value Segment 687 987 769 393 827 224
Standard Value Segment 556 113 568 682 471 401
Revenues by Region 2017 2018 Europa - 2 238 000 2 234 200 41.81% 43.01% NAFTA - 983 900 1 004 100 18.38% 19.33% Asia/Pacific (APAC) - 806 200 890 200 15.06% 17.14% South America - 915 700 691 900 17.11% 13.32% Middle East/Africa/India - 248 900 207 100 4.65% 3.99% Russia and CIS - 159 600 167 000 2.98% 3.21% Total - 5 352 300 5 194 500
Computations# of Tyres sold (in millions 53 090 56 840 61 840
High Value Segment 26 250 30 000 35 000 % >18 21 000 24 000 28 000 80% Values reported in the Company Presentation.
Specialities 5 250 6 000 7 000 20% Assumed to be the number of Specialties sold. Reported to be 20% of the Inventory portfolio of High Value being Specialties.Standard Value Segment 26 840 26 840 26 840 2.0% Pirelli Market Share on Consumer Tyre. Assumed the market share of Standard Value given the weigh on unit sold
Average Selling Price
High Value Segment 105 103 95 95
Standard Value Segment 70 70 70 70 Assumed remain equal to 2018 given the high competion on the market. No capacity to set prices in Standard Value.
Comments on Historical ValuesHistorical Values
As reported on Pirelli company Presentation Replacement Market Channel as responsible for 75% of companies revenues.
As reported on Pirelli company Presentation Original Equipment Market Channel as responsible for 25% of companies revenues.
Pirelli is working through a Business Model based on the High Value segment since the 2017 IPO, with the goal to reduce the production on the less profitable and highly competitive Standard Segment. % values reported by the company.
Pirelli is working through a Business Model based on the High Value segment since the 2017 IPO, with the goal to reduce the production on the less profitable and highly competitive Standard Segment. % values reported by the company.
2019F 2020F 2021F 2022F 2023F 5 378 394 € 5 649 917 € 5 993 761 € 6 424 714 € 6 944 661 €
4 033 796 4 237 438 4 495 321 4 818 535 5 208 496 2 765 590 3 095 303 3 466 216 3 889 443 4 368 870 Assumed that weight of the Business Model strategy will not chance until 2023. Replacement Market to be around 75% of total. 1 268 206 1 142 135 1 029 105 929 092 839 626
1 344 599 1 412 479 1 498 440 1 606 178 1 736 165 921 863 1 031 768 1 155 405 1 296 481 1 456 290 Assumed that weight of the Business Model strategy will not chance until 2023. Replacement Market to be around 75% of total. 422 735 380 712 343 035 309 697 279 875
2 420 277 2 542 463 2 697 192 2 891 121 3 125 098 45% 1 075 679 1 129 983 1 198 752 1 284 943 1 388 932 20% 1 075 679 1 129 983 1 198 752 1 284 943 1 388 932 20% 430 272 451 993 479 501 513 977 555 573 8% 215 136 225 997 239 750 256 989 277 786 4% 161 352 169 498 179 813 192 741 208 340 3% 5 378 394 5 649 917 5 993 761 6 424 714 6 944 661
62 598 64 075 66 280 69 227 72 940 38 710 42 816 47 359 52 387 57 952 % 31 080 34 499 38 294 42 506 47 182 11% 2019 - 2023 : Expected CAGR of 11% - Drop on Automobile market sugest a more conservative forecast. Previous growthing at 14% and 13%. 7 630 8 317 9 065 9 881 10 770 9% Assumed to be the number of Specialties sold. Reported to be 20% of the Inventory portfolio of High Value being Specialties. 23 888 21 260 18 921 16 840 14 988 -11% Assumed to be equal to the expected value for 2019 + plus na extra -1% for the automobile macroeconomic exceptations.
95 96 98 99 101 95 The ASP on High Value is decreasing in order to increase sales, which is being possible given the investment on R&D. Yet is not a company plan to keep droping. Project to remain around the same, hardly likely to increase given the competition on the High Value segment in the future.
71 72 73 74 75 Given the high competion on the market and no capacity to set prices in Standard Value. 0.76% 1.19% 1.24% 1.44% 1.54% The prices are assumed to rise at the italy inflation rate. https://www.statista.com/statistics/270489/inflation-rate-in-italy/
Assumptions for Forecasts
Europe, NAFTA and APAC are responsible for 95% of the Prestige & Premium Segment.In the Latin America region the company plans to keep the cost racionalizition program.
Will be assumed a increase on all the High Value segment areas and a decrease on the South America.
Computations
75%
25%
Revenues Forecast

7
Appendix 7: Income Statement Forecast
Income Statement Forecast 2016 2017 2018 2019F 2020F 2021F 2022F 2023F Assumptions
Gro
ss M
argi
n
Revenue Total 4 976 400 5 352 300 5 194 500 5 378 394 5 649 917 5 993 761 6 424 714 6 944 661 See "Revenues"
Replacement Channel 3 732 300 4 014 225 3 895 875 4 033 796 4 237 438 4 495 321 4 818 535 5 208 496 See "Revenues" Original Equipment Channel 1 244 100 1 338 075 1 298 625 1 344 599 1 412 479 1 498 440 1 606 178 1 736 165
Changes in inventories
Last 3 years average 106 423 106 423 106 423 106 423 106 423 106 423 Assumed for 2019F-2023F to be the average of the past 3 years.
Cost of revenue
Cost of revenue in % of sales 31% 35% 35% 1 882 577 1 977 617 2 097 971 2 248 816 2 430 811
Assumed that strong R&D investments will not be invested on productivity for the next 5 years, but instead on developing new products.
35%
Yet is not expected to see a drop on Gross Margin on the following years. Assumed for 2019F-2023F a 65% Gross Margin equal to the previous two.
Ope
ratin
g In
com
e
R&D
Evolution of R&D in % of Sales 4.2% 4.0% 4.2% 221 584 232 770 246 936 264 691 286 113
Assumed to keep a constant level of R&D investment for the next 5 year as part of the IPO Strategic plan of around 4 % of Sales
Average of the previous 3 years 4.1%
Sales and marketing expenses
Evolution of Sales and marketing expenses 11.2% 11.1% 10.4% 586 442 616 048 653 540 700 529 757 223
Pirelli has already a strong and well-established Marketing and Sales Policy which the company doesn’t plan to change soon. Partnerships with F1, which sponsorship deal goes until 2023, and with the international recognize football team, Inter Milan, as main equipment sponsor will remain.
Expected Growth = Average 10.9%
Personnel Expenses
Previous years Personnel Expenses 986 308 1 034 647 1 067 579 1 110 730 1 155 625 1 202 335 1 250 933 1 301 496
Assumed to growth for 2019F-2023F at CAGR of 3,88% equal to the average growth of previous two years. No reasons to except severe decrease or increase, given that a constant growth will be assumed.
Growth YoY 4.90% 3.18%
4.04% Depreciation, Amortization and Impairments
Previous years Dep., Amo. and Imp. 342 584 371 457 414 523 371 735 399 737 429 434 461 246 495 680 See Auxiliary Table in below
Other Costs
Previous years Other Costs 1 330 866 1 380 874 1 096 494 1 320 430 1 387 091 1 471 507 1 577 309 1 704 959 Assumed as % of Revenues given the nature of the expense. Assumed the average of the 3 previous years for the forecast
As % of Sales 26.74% 25.80% 21.11%
Average of the previous 3 years 24.55%
Other Income Previous years Other Income 696 225 628 533 483 205 638 802 659 835 699 992 750 321 811 044 The 2018 decrease was mainly due to
the fact that raw materials are no longer supplied to the Prometeon Group by the British subsidiary Pirelli International Plc.
As % of Sales 13.99% 11.74% 9.30%
Assumption for the Forecast period 11.68% Will be assumed the 2018 value in percentage of Sales given the new condition stated above.
Net Impairment loss on financial assets
- - 21 273 22 133 22 459 23 332 24 442 25 602
As explained on the 2018 Annual Report, "Net Impairment loss on financial assets" appears for the first time as a result of IFRS 15 new ruling.
Impairments on Trade Receivables 12 019 13 058 13 384 14 257 15 367 16 527
As percentage of Trade Receivables 1.91%
It contemplates 12 019 of impairments on Trade Receivables + 9 254 of impairments on Other Trade Receivables.
Impairments on Other Trade Receivables 9 254 9 075 9 075 9 075 9 075 9 075 Will be assumed a constant % of Trade Receivables and Other Trade Receivables for 2019F-2023F equal to 2018 % for both.
As percentage of Other Trade Receivables 2.22%
Increase in fixed assets for internal work
Previous years Increase in fixed assets for internal work 2 378 3 110 3 700 3 175 3 336 3 539 3 793 4 100 Assumed as % of Revenues given the
nature of the expense. Assumed the average of the 3 previous years for the forecast As % of Sales 0.05% 0.06% 0.07%
Average of the previous 3 years 0.06%

8
Earn
ings
Bef
ore
Taxe
s
Net Income from Equity Investments
Share of net income of associates and j.v. (1 227) (8 252) (11 560) (11 560) (11 560) (11 560) (11 560) (11 560)
Hard to value item given is nature. Will be assumed as constant and equal to the previous year.
Gains on equity investments 8 297 5 997 4 007 4 007 4 007 4 007 4 007 4 007 Hard to value item given is nature. Will be assumed as constant and equal to the previous year.
Losses on equity investments (33 739) (14 434) (1 603) (1 603) (1 603) (1 603) (1 603) (1 603)
Hard to value item given is nature. Will be assumed as constant and equal to the previous year.
Dividends 6 650 9 834 4 176 4 176 4 176 4 176 4 176 4 176 Hard to value item given is nature. Will be assumed as constant and equal to the previous year.
Financial Income Interest Income 32 254 17 098 17 176 22 938 24 096 25 562 27 400 29 618
As % of Securities held for trading 66% 52% 63%
Income Interest will be assumed as a % of Securities Held for Trading. For 2019F-2023F an average of the previous 3 years will be assumed.
Average of the previous 3 years 60.43%
Hyperinflation impact 8 536 8 536 8 536 0 0 0
During the course of the third quarter of 2018, the inflation rate accumulated over the past three years in Argentina exceed 100%. This led the Group to adopt the accounting standard IAS 29 - Financial Reporting in Hyper-inflationary Economies
Assumption: In Hyperinflation periods the effect will be equal to 2018
https://knoema.com/wgtxgoc/argentina-inflation-forecast-2019-2024-and-up-to-2060-data-and-charts Following IMF forecast is forecasted hyperinflation in Argentina for both 2019 and 2020, with the cumulative past three years inflation rate <100% only for 2021-2023.
Other financial income 10 552 9 285 9 627 9 821 9 821 9 821 9 821 9 821 Hard to value item given is nature. Will be assumed as constant and equal to the average of the previous 3 years.
Net gains on exchange rates - 102 157 - 0 34 327 27 462 0 6 865
Using both FX Historical & FX Forecast spreadsheet. See table below for the Exchange Rate and related derivatives assumptions.
Fair value measurement of currency derivatives - - 104 391 71 211 0 0 19 404 0
Using both FX Historical & FX Forecast spreadsheet. See table below for the Exchange Rate and related derivatives assumptions.
Financial Expenses
Interest (330 742)
(255 096)
(103 975)
(197 990)
(201 168)
(204 851)
(209 199) (214 304) Financial Interest will be assumed as a % of Total Borrowings
from banks and other financial institutions. For 2019F-2023F an average of the previous 3 years will be assumed.
As % of Total Borrowings fr.banks & o/financial institutions
-5.02% -5.72% -2.20%
Average of the previous 3 years -4.31%
Commissions (58 187) (29 587) (20 522) (20 522) (20 522) (20 522) (20 522) (20 522) Hard to value item given is nature. Will be assumed as constant and equal to the previous year.
Other financial expenses (8 694) (9 250) (13 183) (13 183) (13 183) (13 183) (13 183) (13 183) Hard to value item given is nature. Will be assumed as constant and equal to the previous year.
Net losses on exchange rate (18 100) - (192
437) (131 272) 0 0 (35 769) 0
Using both FX Historical & FX Forecast spreadsheet. See table below for the Exchange Rate and related derivatives assumptions.
Net interest costs on employee benefit obligations (9 547) (7 295) (5 446) (8 083) (8 410) (8 750) (9 103) (9 471)
As % of Personnel Expenses -0.97% -0.71% -0.51%
Costs on employee benefits obligations will be assumed as a % of Personnel Expenses, the company does not plan to change renumeration policy. For 2019F-2023F an average of the previous 3 years will be assumed.
Average of the previous 3 years -0.73% Valuation at fair value of securities held for trading (12) - - 0 0 0 0 0 Ignored given the almost non-existing of significance
Fair value measurement of exchange rate derivatives (38 744) (189
922) - 0 (63 818) (51 054) 0 (12 764)
Using both FX Historical & FX Forecast spreadsheet. See table below for the Exchange Rate and related derivatives assumptions.
Valuation at fair value of other derivatives (5 970) 0 (478) (2 149) (2 149) (2 149) (2 149) (2 149) Hard to value item given is nature. Will be assumed as
constant and equal to the average of the previous 3 years.
Net
Inco
me
Income Taxes Previous Years Income
Taxes (75 256) (40 848) (52 964) (63 850) (72 208) (80 580) (95 917) (117 036)
Effective Tax Rate -31.46% -13.43% -10.56%
Average from the previous years, assumed to be equal for the upcoming years. 2016 will be exclude given the extreme value.
Average of the previous 3 years -18.48% Industry average for Europe is around 17% which is coherent with the assumed forecast.
Net Income from discontinued Operations
0 0 0 0 0
The "Net income(loss) from discontinued operations" was relative to Industrial Business units in Argentina and China, both sold on 2018 in result with the new Consumer only strategy.

9
Appendix 8: Balance Sheet Forecast
InventoriesEvolution of Inventories 1 055 639 940 668 1 128 466 1 080 659 1 116 033 1 228 968 1 292 434 1 397 585 See table below
Inventories Turnover 4.71 5.69 4.60 3.73 3.80 3.66 3.73 3.73Trade ReceivablesEvolution of Trade Receivables 679 321 652 487 627 968 682 259 699 264 744 904 802 869 863 478 See table below
Trade Rotation 7.33 8.20 8.27 5.91 6.06 6.03 6.00 6.03Other receivables
Evolution of Other receivables 275 622 400 538 416 651 408 595 408 595 408 595 408 595 408 595 The increase from 2016 to 2017 was mainly attributed to an indirect tax receivables in Brazil. It will be assumed to maintain the brazilian indirect tax receivables until 2023F.
408 595 Hard to value item given is nature. An average of the previous 2 years will be assumed to forecast 2019F-2023F.
Securities held for tradingEvolution of Securities held for trading 48 597 33 027 27 196 37 956 39 873 42 299 45 341 49 010
Weight on Sales (%) 0.98% 0.62% 0.52%0.71%
Cash and cash equivalentsEvolution of Cash and cash equivalents 1 532 977 1 118 437 1 326 900 1 284 397 1 384 261 1 427 926 1 613 455 1 866 419 See Cash Flow StatmentTax Receivables (Short term)
Evolution of Tax Receivables (Short term) 64 395 35 461 41 393 47 083 47 083 47 083 47 083 47 083 Hard to value item given is nature. Will be assume as constant and equal to the average of the previous 3 years.
47 083 Refers to receivables for advance payments on taxes for the financial year and to corporate income tax receivables from previous financial years recorded by the Brazilian and Argentine companies
Derivative Financial Instruments (Short term)Evolution of Derivative Financial Instruments (S 23 989 27 770 98 567 50 109 50 109 50 109 50 109 50 109
50 109 Assets Held for Sale
Evolution of Assets Held For Sale 0 60 729 10 677 0 0 0 0 0
The "Net income(loss) from discontinued operations" was relative to Industrial Business units in Argentina and China, both sold on 2018 in result with the new Consumer only strategy . The 10677 represented exclusively by land and buildings was sold on 13 February 2019.
Assumed the company aims to maintain the same level of % Revenues, since they assume investments on Marketable Securities as part of their strategy.
No changes in Derivatives Instruments will be assumed the company policy and account nature.
Average of the Previous 2 years (excluded 2016)
Average of the previous 3 years
Average of the previous 3 years
Curr
ent A
sset
s
Average of the previous 3 years
Balance Sheet 2016 2017 2018 2019F 2020F 2021F 2022F 2023F AssumptionsProperty and equipment
Evolution of Property and equipment 3 556 635 2 980 294 3 092 927 3 321 875 3 543 766 3 763 520 3 986 963 4 219 580 Gross 3 935 819 3 647 450 3 921 000 4 405 055 4 913 548 5 452 987 6 031 211 6 656 230 Addition of the Investment CapEX - see table below.
Acumulated Depreciation 379 184 667 156 828 073 1 083 181 1 369 782 1 689 466 2 044 248 2 436 650 Accumulated depreciation assumed to remain at the current level of Gross PP&E
21%Goodwill
Evolution of Goodwill 2 351 263 1 877 363 1 886 862 1 886 862 1 886 862 1 886 862 1 886 862 1 886 862
2018's Goodwill was 1,886,862 thousand, of which 1,877,363 thousand was recorded at the time of acquisition of the Group in Sep.2015. The residual portion refers to provisionally goodwill. Its assumed for 2019F-2023F only the goodwill of the acquisition
Other Intangible Assets
Evolution of Intangible assets 4 145 626 4 016 341 3 896 476 3 779 849 3 666 713 3 556 963 3 450 498 3 347 220 Other intagible assets are assumed to decrease at the amortization rate until 2023F. No investment in Intangible Assets is expected for the forecasted period, therefore noone will be assumed.See table below.
Investments in associates and J.V.volution of Investments in associates and J.V. 47 010 17 480 72 705 72 705 72 705 72 705 72 705 72 705
of which Associates 32 446 12 529 8 419 8 419 8 419 8 419 8 419 8 419 of which Joint Ventures 14 564 4 951 64 286 64 286 64 286 64 286 64 286 64 286
0.00%
Other Financial AssetsEvolution of Other Financial Assets 198 691 229 519 68 781 68 781 68 781 68 781 68 781 68 781
0.00%
Deferred tax assetsEvolution of Deferred tax assets 147 964 111 553 74 118 52 562 37 276 26 435 18 747 13 295
Growth YoY -24.61% -33.56%-29.08%
Other Receivables
Evolution of Other Receivables 226 868 204 051 225 707 218 875 218 875 218 875 218 875 218 875 Hard to value item given is nature. Will be assume as constant and equal to the average of the previous 3 years.
218 875 Tax Receivables (Long term)
Evolution of Other Receivables 11 864 27 318 16 169 16 169 16 169 16 169 16 169 16 169 Hard to value item given is nature. Will be assume as constant and equal to the previous year.
16 169 Refers to receivables for advance payments on taxes for the financial year and to corporate income tax receivables from previous financial years recorded by the Brazilian and Argentine companies
Derivative Financial Instruments (Long term)
Evolution of Derivative Financial Instruments (L 0 878 20 134 20 134 20 134 20 134 20 134 20 134 No changes in Derivatives Instruments will be assumed the company policy and account nature.
10 506
The company Fiscal Optimatizion Policy will be assumed as mainting the evolution of the previous years. Assume for 2019F-2023F to growth at the average of the previous 3 years.
The investment on Assoaciates decreased from 2016 - 2018 because of a investment disposal in 28th Dec 2017 which liquidation was only
On January 1 2018, the new IFRS 9 was applied which led to a reclassification of the 2017's 229 519 to 80 492. Decreases of around 3 000 were from investment liquidation and around 8 000 of reclassifications.Will be assume the actual level of Other Financial Assets will remain the same for 2019F-2023F.
%
Assumed value to the forecast
Yoy decrease on J.V. value
Amortization
The 2017 decrease was purely share of net income of around 10 000 thousands. On 2018 an equal share of loss happend while on the October 9th an investment of 65 222 thousand was made on a new Joint Venture (Consumer tyre manufacturing in China) which record a loss of 936 thousand. The forecast 2019F-2023F will assume that the investment in J.V. will remain the same.
Average of the previous 2 years
Non
Curr
ent A
sset
s
Assumed growth
Average of the previous 3 years

10
CAPEX 2016 2017 2018 2019F 2020F 2021F 2022F 2023F AssumptionsTotal Capex 340 000 489 000 463 000 484 055 508 493 539 438 578 224 625 020
% of Revenue 6.83% 9.14% 8.91%
9.00%
Maintenance CapEX 25% 20% 25% 121 014 127 123 134 860 144 556 156 255 Investment Capex 75% 80% 75% 363 042 381 369 404 579 433 668 468 765
Company expectations for 2019F CapEX are ~ 430. Yet on previous year company tended to undervalue the needs for CapEX (2018 projected was 8% of Revenues). In order to keep up with the IPO strategy a 9% of revenues CAPEX seems reasonable.Historical information from Company Presentation. Will be assumed to be around 25% of Total CapEX to Maintenance.
Assumption
Depreciation, Amortisation and Impairments 2016 2017 2018 2019F 2020F 2021F 2022F 2023F AssumptionsAmortisation 114 961 120 196 125 220 116 627 113 136 109 750 106 465 103 278
Amortisation Rate per Year 2.77% 2.99% 3.21%2.99%
Depreciation 227 623 250 673 269 084 255 108 286 601 319 685 354 782 392 402 Depreciation Rate per Year 5.78% 6.87% 6.86%
6.51%Impairments in PP&E 0 588 20 219 0 0 0 0 0
Impairments as % of PP&E 0.00% 0.02% 0.65%0.22%
Amortisation is calculated on a straight-line basis and begins when the asset is available for use. Goodwill is an intangible asset with an indefinite useful life and is therefore not subject to amortisation.Depreciation are calculated on a straight-line basis and begins when the asset is available for use. Depreciation of year 1 = Gross PP&E*Depreciation Rate
Assumed 0 to Forecasts given non significanceAverage of the 3 years
Average of the 3 years
Average of the 3 years
Appendix 9: CAPEX Forecast
Appendix 10: Amortizations, Depreciation and Impairments Forecast
Borrowings from banks and other financial institutions
Evolution of Long Term Borrowings 5 945 999 3 897 089 3 929 079 3 893 819 3 932 382 3 973 294 4 018 384 4 069 497
On June 27, 2017, Marco Polo International Italy S.p.A. subscribed to a share capital increase for Pirelli & C. S.p.A. of approximately euro 1.2 billion, which allowed the Group to reduce its bank debt by the same amount through the new financing operation.
% of Long Term Debt / Long Term Assets 63.57% 41.29% 41.22%
41.26%
Other payablesEvolution of Other payables 87 421 74 435 83 287 83 287 83 287 83 287 83 287 83 287
83 287 Provisions for liabilities and charges
Evolution of Provisions for liabilities and charges 170 992 127 124 138 327 138 327 138 327 138 327 138 327 138 327 138 327
Provisions for deferred tax liabilities
Evolution of Deferred Tax Liabilities 1 452 169 1 216 635 1 081 605 933 868 806 310 696 176 601 085 518 982 The company Fiscal Optimatizion Policy will be assumed as mainting the evolution of the previous years. Assume for 2019F-2023F to growth at the average of the previous 3 years.
Growth YoY -16.22% -11.10%
-13.66%
Employee benefit obligations
Evolution of Employee benefit obligations 368 100 274 037 224 312 224 312 224 312 224 312 224 312 224 312
224 312 Tax payables
Evolution of Tax payables 3 374 2 399 2 091 2 091 2 091 2 091 2 091 2 091
2 091
Derivative financial instruments
Evolution of Derivative financial instruments 0 54 963 16 039 16 039 16 039 16 039 16 039 16 039 No changes in Derivatives Instruments will be assumed the company policy and account nature.
16 039 Assumed to be constant over the next five years.
Hard to value item given is nature. Will be assume as constant and equal to the previous year.
As of the date of this report no changes on the Company Policy regrading Employee Benefits are expect for the foreseen future. The forecast 2019F-2023F will assume that the benefits related to employee obrigations will remain the same.
Mostly related to national and regional income taxes in different countries. Given it's hard to value nature, will be assume as constant and equal to the previous year.
The majority of the provision for deferred taxes are related with the completion of the allocation of the price paid by Marco Polo for the acquisition of the Pirelli Group in 2016.
Will be assume that the Company will keep the same propotion of Long Term Debt to Long Term Assets. 2016 will be excluded given the 1.2billion debt reduction explained before. An average of the previous two years will be assume to forecast 2019F-2023F.
Hard to value item given is nature. Will be assume as constant and equal to the previous year.
Average of the Previous 2 years (excluded 2016)
Assumption for the Forecast period
Assumption for the Forecast period
Assumption for the Forecast period
Average of the previous 3 years
Non
Curr
ent L
iabi
litie
s
Average of the previous 2 yearsBorrowings from banks and other financial institutionsEvolution of Short Term Borrowings 642 047 559 168 800 145 695 183 730 278 774 722 830 425 897 630
% of Short Term Debt / Short Term Assets 12.90% 10.45% 15.40%
12.93% An average of the previous three years will be assume to forecast 2019F-2023F.
Trade PayablesEvolution of Trade Payable 1 498 492 1 673 642 1 604 677 1 654 276 1 749 953 1 850 528 1 983 205 2 146 264 See table below
Payables Rotation 2.4 2.4 2.3 3.25 3.23 3.24 3.24 3.24Other payables
Evolution of Other payables 783 079 565 254 436 752 595 028 595 028 595 028 595 028 595 028 595 028
Provisions for liabilities and chargesEvolution of Provisions for liabilities and charges 45 987 45 833 33 876 41 899 41 899 41 899 41 899 41 899
41 899 Employee benefit obligations
Evolution of Employee benefit obligations 0 0 5 475 0 0 0 0 0 2018 value refers to a portion of the second instalment of the retention plain which will be liquidated during the first half-year of 2019. Therefore it will be assume 0 for the 2019F-2023F.
Tax payablesEvolution of Tax payables 41 773 48 416 65 503 51 897 51 897 51 897 51 897 51 897
51 897 Derivative financial instruments
Evolution of Derivative financial instruments 52 170 17 910 59 602 43 227 43 227 43 227 43 227 43 227 No changes in Derivatives Instruments will be assumed the company policy and account nature.
43 227 Assumed to be constant over the next five years.
Hard to value item given is nature. Will be assume as constant and equal to the average of the previous 3 years.
Mostly related to national and regional income taxes in different countries. Given it's hard to value nature, will b assume as constant and equal to the
Will be assume that the Company will keep the same propotion of Short Term Debt to Short Term Assets.
Hard to value item given is nature. Will be assume as constant and equal to the average of the previous 3 years.
Average of the Previous 3 years
Curr
ent L
iabi
litie
s
Average of the previous 3 years
Average of the previous 3 years
Average of the previous 3 years
Average of the previous 3 yearsShare Capital
Share Capital Growth 1 342 281 1 904 375 1 904 375 1 904 375 1 904 375 1 904 375 1 904 375 1 904 375 1 904 375
ReservesReserves Growth 1 784 952 2 096 927 2 204 180 2 469 603 2 638 587 2 829 690 3 042 951 3 296 802
60%Dividends
0 0 0 176 949 112 656 127 402 142 174 169 235
40%
No issuance of new capital or acquisition of own shares/treasury shares are expected for 2019F-2023F. Will be assume to maintain equal to 2018.
Assumed for the forecast period that all net income that is not distributed as dividend will be retained as a reserve.
On August 31,2017, the Board of Directors adopted a dividend policy for 2018-2020 to provide a average distribution of 40% of net income as dividend. For 2021-2023 will be assume a payout of 40% aswell.
Equi
ty
Expected Share Capital
Dividends Growth

11
Working Capital 2016 2017 2018 2019F 2020F 2021F 2022F 2023FCurrent Assets 2 147 563 2 089 951 2 340 241 2 306 661 2 360 956 2 521 957 2 646 429 2 815 860
Inventories 1 055 639 940 668 1 128 466 1 080 659 1 116 033 1 228 968 1 292 434 1 397 585Accounts Recivables 679 321 652 487 627 968 682 259 699 264 744 904 802 869 863 478Other Recivables 364 006 463 769 556 611 505 786 505 786 505 786 505 786 505 786Securities held for trading 48 597 33 027 27 196 37 956 39 873 42 299 45 341 49 010Current Liabilities 3 063 548 2 910 223 3 006 030 3 081 510 3 212 283 3 357 302 3 545 681 3 775 945
Borrowings from banks and other financial institutions 642 047 559 168 800 145 695 183 730 278 774 722 830 425 897 630Accounts Payables 1 498 492 1 673 642 1 604 677 1 654 276 1 749 953 1 850 528 1 983 205 2 146 264Other Payables 877 022 631 580 561 857 690 153 690 153 690 153 690 153 690 153Other Provisions 45 987 45 833 39 351 41 899 41 899 41 899 41 899 41 899NWC (915 985) (820 272) (665 789) (774 849) (851 327) (835 345) (899 251) (960 086)ΔNWC 95 713 154 483 (109 060) (76 478) 15 982 (63 906) (60 834)
Historical Derivatives 2016 2017 2018 CommentsEUR/USD 1.05 1.20 1.15Net Gain/Loss - 102 157 (192 437)
Result of a 0,01 positive change - 6 865 - Result for a change of + 0,01 on the EUR/USD Spot Rate on Net Gains in Exchange Rate.Result of a 0,01 negative change - - 35 769 Result for a change of - 0,01 on the EUR/USD Spot Rate on Net Loss in Exchange Rate.
Hedging Result - (189 922) 104 391Result of a 0,01 positive change - (12 764) - Result for a change of + 0,01 on the EUR/USD Spot Rate on the Hedge Result in Exchange Rate Derivatives.
Result of a 0,01 negative change - (19 404) Result for a change of - 0,01 on the EUR/USD Spot Rate on the Hedge Result in Exchange Rate Derivatives.
Appendix 11: Working Capital Indicators and Projected Working Capital
Appendix 12: Forex Forecast
Working Capital Management Indicadors 2016 2017 2018 2019F 2020F 2021F 2022F 2023F AssumptionsInventory
Inventory Days 76 63 78 72.3 71.1 73.8 72.4 72.4Inventory Rotation 4.7 5.7 4.6
ReceivablesReceivables Days 49.0 44.0 44.0 45.7 44.6 44.7 45.0 44.8
Receivables Rotation 7.3 8.2 8.3Payables
Payables Days 30.1% 31.3% 30.9% 30.8% 31.0% 30.9% 30.9% 30.9%Payables Rotation 2.4 2.4 2.3
Inventory Days will be assume equal to the moving average of the last 3 years. Moving average will be used because of the existing correlation.
Receivable Days will be assume equal to the moving average of the last 3 years. Moving average will be used because of the existing correlation.
Payables Days will be assume equal to the moving average of the last 3 years. Moving average will be used because of the existing correlation.
Forecast Derivatives 2019F 2020F 2021F 2022F 2023F CommentsEUR/USD 1.11 1.16 1.20 1.19 1.20 Bloomberg FX forecastVariation -0.04 0.05 0.04 -0.01 0.01Net Gain/Loss (131 272) 34 327 27 462 (35 769) 6 865 Will be assume for 2019F-2023F the same results for 0,01 +/- changes on Net Gains/LossHedge Result 71 211 (63 818) (51 054) 19 404 (12 764) Will be assume for 2019F-2023F the same results for 0,01 +/- changes on the Hedging Results

12
𝑛𝑛 = Life of the asset 𝐹𝐹𝐹𝐹𝐹𝐹𝐵𝐵 = Free Cash Flow 𝑟𝑟 = Discount rate
𝐷𝐷𝐷𝐷𝐷𝐷𝐵𝐵 = Expected Dividends per share 𝑘𝑘𝐿𝐿= Cost of equity 𝐷𝐷𝐷𝐷𝐷𝐷1 = Expected Dividends per share one year from now 𝑔𝑔 = Growth rate of dividends
Appendix 13: Valuation Methods
There is a wide range of models in practice, ranging from the simpler to the most sophisticated. These models often
make very different assumptions, but they do share some common characteristics (Damodoran, 2012).
In general terms, there are three approaches to valuation: The Discounted Cash Flow valuation, the Relative valuation
and Contingent Claim valuation. However, we are going to give more relevance to the two fist ones mentioned.
Discounted Cash Flow Valuation (DCF):
The first method, Discounted Cash Flow (DCF) valuation, attempts to foresee the value of a company today, based on
projections of the expected future cash flows.
This approach has its foundation in the Net Present Value (NPV) rule, where the value of any asset is the present value
of the expected future cash flows which are discounted by a certain discount rate.
𝑁𝑁𝐷𝐷𝑁𝑁 = �𝐹𝐹𝐹𝐹𝐹𝐹𝐵𝐵
(1 + 𝑟𝑟)𝐵𝐵
𝑛𝑛
𝐵𝐵=0
This valuation model can vary a couple of dimensions, we are going to analyze three paths to the discounted cash flow
valuation, the Equity Valuation Model, the Firm Valuation Model and the Adjusted Present Value Model (APV).
Equity Valuation Model:
The Equity Valuation Model evaluates the company from the shareholder perspective. The value of equity is obtained
by discounting the expected cash flows to equity, i.e. the residual cash flows after meeting all expenses, reinvestment
needs, tax obligations, and interest and principal payments) at the cost of equity.
This model follows two main approaches, the Dividend Discount Model (DDM) and the Free Cash Flow to Equity (FCFE).
o Dividend Discount Model (DDM):
This approach is a quantitative model used for predicting the value of a company’s stock taking into consideration that
when an investor buys a stock, he generally expects to get cash flows through the dividends during the period he holds
the stock and an expected price ate the end of the holding price. Therefore, the value of a stock is the net present value
of the dividends that the investor expects to obtain discounted at a rate appropriated (Fernandez. 2013).
Value per share of stock = �𝐷𝐷𝐷𝐷𝐷𝐷𝐵𝐵
(1 + 𝑘𝑘𝐿𝐿)=
𝐷𝐷𝐷𝐷𝐷𝐷1
(𝑘𝑘𝐸𝐸 − 𝑔𝑔)
𝐵𝐵=∞
𝐵𝐵1
o Free Cash Flow of Equity (FCFE):
The FCFE metric is usually used to define the value of a company and is considered an alternative of the DDM approach.
In fact, one way to describe a free cash flow to equity model is that it represents a model where we discount potential
dividends rather than actual dividends (Damodoran, 1994).
𝑁𝑁𝑉𝑉𝑉𝑉𝑉𝑉𝑉𝑉 𝑜𝑜𝑜𝑜 𝐸𝐸𝐸𝐸𝑉𝑉𝐸𝐸𝐸𝐸𝐸𝐸 = �𝐹𝐹𝐹𝐹𝐹𝐹𝐸𝐸𝐵𝐵
(1 + 𝑘𝑘𝐿𝐿)𝐵𝐵
𝐵𝐵=𝑛𝑛
𝐵𝐵=1
With: FCFE = Net Income + Depreciation - Capital Expenditures - ∆ Non-cash WC - (New Debt Issued - Debt Payment)

13
Firm Valuation Model:
FCFF model is a measurement of a company’s profitability after the expenses and reinvestments. The main use of this
model is to evaluate companies that reaches a steady state after some years and starts to grow at a stable growth rate.
It can be estimated by computing the present value of the FCFF, discounted at the Weighted Average Cost of Capital
(WACC) assuming a stable growth rate (Damodoran, 2006).
The FCFF is the sum of the cash flows to all claim holders in the firm, including stockholders, bondholders and preferred
stockholders and the WACC rate is the cost of the different components of financing that the firm uses, weighted by their
market value proportions (Damodoran 2012).
𝑁𝑁𝑉𝑉𝑉𝑉𝑉𝑉𝑉𝑉 𝑜𝑜𝑜𝑜 𝐹𝐹𝐸𝐸𝑟𝑟𝐹𝐹 = �𝐹𝐹𝐹𝐹𝐹𝐹𝐹𝐹𝐵𝐵
(1 + 𝑊𝑊𝑊𝑊𝐹𝐹𝐹𝐹)+
𝐹𝐹𝐹𝐹𝐹𝐹𝐹𝐹𝑛𝑛+1(𝑊𝑊𝑊𝑊𝐹𝐹𝐹𝐹 − 𝑔𝑔𝑛𝑛)�
(1 + 𝑊𝑊𝑊𝑊𝐹𝐹𝐹𝐹)𝑛𝑛
𝐵𝐵=𝑛𝑛
𝐵𝐵=1
With: FCFF = After-Tax Operating Income - Capital Expenditures + Depreciations - ∆ Non-cash WC
𝑊𝑊𝑊𝑊𝐹𝐹𝐹𝐹 = � 𝐸𝐸𝑁𝑁
∗ 𝑘𝑘𝐿𝐿 � + �𝐷𝐷𝑁𝑁
∗ 𝑘𝑘𝐿𝐿� ∗ (1 − 𝑇𝑇)
Where:
𝐸𝐸 = Market value of the firm’s Equity 𝐷𝐷 = Market value of the firm’s Debt 𝑁𝑁 = Total Value of Capital (Equity + Debt) 𝑘𝑘𝐿𝐿 = Cost of Equity 𝑘𝑘𝐿𝐿 = Cost of Debt 𝑇𝑇 = Tax Rate Adjusted Present value model (APV):
In the APV method, we estimate the value of the firm in three steps. It begins by assessing the value of the firm without
debt. As we add debt to the firm by discounting the expected FCFF at the unlevered cost of equity, we consider the net
effect on value by considering the benefits and the costs of borrowing. Then, we consider the net present value of the
interest tax savings generated by borrowing a given amount of cash and lastly, we estimate the effect of the previous
step on the probability of the firm go bankrupt and the expected cost of bankruptcy (Damodoran, 2012).
Value of Firm = Value of Business with no debt + Present Value of Expected Tax Benefits – Expected Bankruptcy Cost
Relative Valuation:
A Relative Valuation model is a type of business valuation method that estimates the firm’s financial worth by considering
the price of comparable firms, such as competitors or industry peers.
To assess the firms’ value, some multiples based on the Company’s Capitalization, based on the Company’s Value and
Growth-Referenced multiples (Fernandez, 2002) are computed by using common variables such as earning, cash flows,
book value or sales.

14
Shares Outstanding 1 000 000 In thousand sharesShare Price at 31/12/2018 5.44 €Market Capitalization 5 438 560 € In thousand eurosBook value of Total Debt 4 589 002 € In thousand euros2018 D/E 84.38%Cash 1 326 900 €Risk Free Rate 0.92% 10 years Treasury Bond : https://www.bloomberg.com/markets/rates-bonds2018 Levered Beta (regression of the returns) 0.997 Computed in the Spreadsheet "Beta Computation"
Data from damodaran: http://pages.stern.nyu.edu/~adamodar/New_Home_Page/datacurrent.html projects a Beta for "Rubber& Tires" in Europe of 0,98
Unlevered Beta 0.591 Beta for companies in Tyres & Rubber Industry witout any debtUnlevered Beta adjusted for cash 0.622 Putting all the Beta risk on the portion of the business that is non cash
4.95% Will be assume that Cash/Firm Value of the Industry - Data from damodaran: http://pages.stern.nyu.edu/~adamodar/New_Home_Page/datacurrent.ht
Market Risk Premium 5.96% Data from damodaran: http://pages.stern.nyu.edu/~adamodar/New_Home_Page/datafile/ctryprem.html
Country Risk Premium 3.06% Data from damodaran: http://pages.stern.nyu.edu/~adamodar/New_Home_Page/datafile/ctryprem.html
Industry Weight of Equity on Enterprise Value 67.98% Will be assume that Pirelli will converge to industry average. The actual Debt to Equity ratio is higher given the 2015 Debt Restructuration and company acquisition.Data from damodaran: http://pages.stern.nyu.edu/~adamodar/New_Home_Page/datafile/dbtfund.html
Industry Weight of Debt on Enterprise Value 32.02% ComputedCost of Debt Forecast 4.31% Assumed that cost of debt will be equal to book interest rateEffective Tax Rate Forecast 18.48% From Assumptions spreadsheet
Assumptions Explanation / Source
2018FY 2019F 2020F 2021F 2022F 2023F TerminalCost of Equity
Beta levered 1.01 0.98 0.94 0.91 0.89 0.86Evolution of Re 10.04% 9.73% 9.44% 9.17% 8.91% 8.68%Cost of Debt
Evolution of Rd 3.52% 3.52% 3.52% 3.52% 3.52% 3.52%WACC
Weight of Equity 54.24% 56.53% 58.82% 61.11% 63.40% 65.69% 67.98%Weight of Debt 45.76% 43.47% 41.18% 38.89% 36.60% 34.31% 32.02%Pre-tax WACC R[U] 7.55% 7.50% 7.44% 7.39% 7.34% 7.28%WACC 0.00% 7.21% 7.17% 7.13% 7.10% 7.06% 7.03%
SUMMARY OUTPUT
Regression StatisticsMultiple R 0.5724R Square 0.3277Adjusted R Square 0.3263Standard Error 0.0148Observations 498.0000
ANOVAdf SS MS F Significance F
Regression 1 0.0531 0.0531 241.7305 1.08469E-44Residual 496 0.1090 0.0002Total 497 0.1622
Coefficients Standard Error t Stat P-value Lower 95% Upper 95% Lower 95.0% Upper 95.0%Intercept 0.000 0.001 -0.670 0.503 -0.002 0.001 -0.002 0.001X Variable 1 0.997 0.064 15.548 0.000 0.871 1.123 0.871 1.123
Appendix 14: WACC Assumptions
Appendix 15: Levered Beta Forecast
Appendix 16: WACC forecast

15
Million Dollars $ 2019F 2020F 2021F 2022F 2023F TerminalEBIT (1-t) 498 214 512 072 553 235 617 330 704 606 704 606D&A 371 735 399 737 429 434 461 246 495 680 431 567Changes in NWC (109 060) (76 478) 15 982 (63 906) (60 834) (58 859)CAPEX 484 055 508 493 539 438 578 224 625 020 625 020
FCFF 494 953 479 794 427 249 564 259 636 101 570 012Terminal Value 9 424 118
PV(FCFF) by WACC 461 685 417 743 347 453 428 890 452 205 6 710 820
Auxiliar - Return on Assets 2019F 2020F 2021F 2022F 2023FEBIT (1-t) 498 214 512 072 553 235 617 330 704 606Total Assets 13 028 871 13 276 499 13 580 327 13 999 618 14 545 900
Return on Assets 3.82% 3.86% 4.07% 4.41% 4.84%
Auxiliar - EBIT (1-t) 2019F 2020F 2021F 2022F 2023FEBIT 611 163 628 163 678 658 757 284 864 346Tax Rate 18.48% 18.48% 18.48% 18.48% 18.48%
EBIT (1-t) 498 214 512 072 553 235 617 330 704 606
Enterprise Value Million $Terminal Growth Rate 0.92%Perpetuity WACC 7.03%Terminal Value 9 424 118PV of Terminal Value 6 710 820PV of FCFF until 2022 2 107 976
Enterprise Value 8 818 796
Price Target Million $Enterprise Value 8 818 796Net Debt 3 304 604Equity Value 5 514 192No. of issued Shares 1 000 000Equity Value per Share 6
Price on 31st Dec, 2019 5.51 €Price on 1th Sept, 2019 4.73 €Upside Potential 17%
2019F 2020F 2021F 2022F 2023F TerminalCAPEX 484 055 508 493 539 438 578 224 625 020 625 020D&A 371 735 399 737 429 434 461 246 495 680 431 567Changes in NWC (109 060) (76 478) 15 982 (63 906) (60 834) (58 859)EBIT (1-t) 498 214 512 072 553 235 617 330 704 606 704 606
Reinvestment Rate 0.65% 6.30% 22.77% 8.60% 9.72% 19.10%ROA 3.82% 3.86% 4.07% 4.41% 4.84% 4.20%D/E 78.17% 71.95% 65.74% 59.53% 53.31% 47.10%Cost of debt 3.52% 3.52% 3.52% 3.52% 3.52% 3.52%Taxes 18.48% 18.48% 18.48% 18.48% 18.48% 18.48%
ROE 4.57% 4.57% 4.87% 5.33% 5.90% 4.83%
Growth Rate 0.0% 0.3% 1.1% 0.5% 0.6% 0.92%
Appendix 17: Stable Growth Model
Appendix 18: Free Cash Flow to the Firm
Industry number: assuming that the company will converge to industry figures on the long run

16
Ponderation EV/EBITDA EV/EBIT EV/Sales
Tier 1 Compararison - Similiar EBITDA Margin and Market Position70% Nokian 7.37x 9.21x 2.15x
Tier 2 - European Full Linears10% Michelin 5.78x 8.81x 1.02x10% Continental 4.39x 6.75x 0.615x
Tier 3 - International Full Linears5% Bidgestone 5.59x 8.44x 0.93x5% Goodyear 4.64x 7.76x 0.58x
5.68 8.62 0.98
5.59 8.44 0.93
Weighted Mean
Median
EV/EBITDA 7 467 035EV/EBIT 6 197 651EV/SALES 9 060 822
Enterprise Values
EBITDA 1 117 579EBIT 703 056Sales 5 194 471
Pirelli's
Net Debt 3 304 604
5.76 4.16
Share Price Range
Appendix 18: Market Valuation – Peer Selection
Peers Selection
Continental, Michelin, Goodyear and Bridgestone are the biggest players in the market, operating as "full-liners" and maintaining an average EBITDA margin of 11%.
Pirelli and Nokian have a different business model, Pirelli as main player on High Value segment and Nokian with Winter Tyres as core business, both companies have EBITDA margins of around 18%. These 6 companies are responsible for 49% of Total tyre sales in 2018.
Both Sumitomo and Hankook are excluded from the comparable peers given the nature of the business and the regional differences, both companies mainly operate on the Asiatic market.
Tier 1 was given a weight of 70% in the mean with only Nokian have similar margin and market position. Tier 2 and Tier 3 were weighted 10% and 5% respectably, companies operating in the sector as full liners have little comparison with Pirelli, all of them have non-tyres business with considerable weight in sales and all of them have industrial tyres as part of the business. To perform a market valuation with more detail and accuracy was needed some non-available information like the weight in sales/Ebit and Ebitda in every comparable company.
The results are the following:
Peers EV EBITDA EBIT Sales EV/EBITDA EV/EBIT EV/SalesContinental 27 310 6 252 4 044 44 404 4.368 6.753 0.615Bridgstone 3 397 129 607 767 402 732 3 650 111 5.590 8.435 0.931Nokian 3 431 466 372 1 596 7.366 9.214 2.150Michelin 22 459 3 894 2 550 22 028 5.768 8.807 1.020Goodyear 8 981 1 936 1 158 15 475 4.639 7.755 0.580Sumitomo -32 721 440 - - 4 395 899 - - -Hankook 4 803 340 1 280 645 702 651 6 795 089 3.751 6.836 0.707Pirelli 7 818 1 118 703 5 194 6.996 11.120 1.505

17
-20% -15% -10% -5% 0% 5% 10% 15% 20%
$5.51 3.45% 3.67% 3.88% 4.10% 4.31% 4.53% 4.75% 4.96% 5.18%-20% 0.74% 6.13 6.02 5.91 5.81 5.70 5.60 5.50 5.40 5.31-15% 0.78% 6.08 5.97 5.86 5.76 5.65 5.55 5.46 5.36 5.27-10% 0.83% 6.03 5.92 5.81 5.71 5.61 5.51 5.41 5.32 5.22
-5% 0.87% 5.98 5.87 5.76 5.66 5.56 5.46 5.37 5.27 5.180% 0.92% 5.93 5.82 5.72 5.61 5.51 5.42 5.32 5.23 5.145% 0.97% 5.88 5.77 5.67 5.57 5.47 5.37 5.28 5.19 5.10
10% 1.01% 5.83 5.72 5.62 5.52 5.42 5.33 5.23 5.14 5.0515% 1.06% 5.78 5.67 5.57 5.48 5.38 5.28 5.19 5.10 5.0120% 1.10% 5.73 5.63 5.53 5.43 5.33 5.24 5.15 5.06 4.97
Cost of Debt
Risk
Fre
e Ra
te
-20% -15% -10% -5% 0% 5% 10% 15% 20%
$5.51 563 685 598 915 634 145 669 375 704 606 739 836 775 066 810 297 845 527-20% -47 087 3.72 4.13 4.55 4.96 5.38 5.79 6.21 6.62 7.03-15% -50 030 3.75 4.17 4.58 5.00 5.41 5.83 6.24 6.65 7.07-10% -52 973 3.79 4.20 4.62 5.03 5.44 5.86 6.27 6.69 7.10
-5% -55 916 3.82 4.24 4.65 5.06 5.48 5.89 6.31 6.72 7.140% -58 859 3.86 4.27 4.68 5.10 5.51 5.93 6.34 6.76 7.175% -61 802 3.89 4.30 4.72 5.13 5.55 5.96 6.38 6.79 7.21
10% -64 745 3.92 4.34 4.75 5.17 5.58 6.00 6.41 6.83 7.2415% -67 688 3.96 4.37 4.79 5.20 5.62 6.03 6.45 6.86 7.2820% -70 631 3.99 4.41 4.82 5.24 5.65 6.07 6.48 6.90 7.31
Terminal EBIT (1-t)
Term
inal
Cha
nges
in N
WC
-20% -15% -10% -5% 0% 5% 10% 15% 20%
$5.51 2.45% 2.60% 2.75% 2.91% 3.06% 3.21% 3.37% 3.52% 3.67%-20% 4.77% 7.39 7.20 7.02 6.84 6.67 6.51 6.35 6.19 6.04-15% 5.07% 7.03 6.85 6.68 6.52 6.36 6.20 6.05 5.90 5.76-10% 5.36% 6.69 6.52 6.36 6.21 6.06 5.91 5.77 5.63 5.50
-5% 5.66% 6.37 6.22 6.07 5.92 5.78 5.64 5.51 5.38 5.250% 5.96% 6.07 5.93 5.79 5.65 5.51 5.38 5.26 5.14 5.025% 6.26% 5.79 5.65 5.52 5.39 5.26 5.14 5.02 4.91 4.79
10% 6.56% 5.53 5.40 5.27 5.15 5.03 4.91 4.80 4.69 4.5815% 6.85% 5.28 5.15 5.04 4.92 4.81 4.70 4.59 4.48 4.3820% 7.15% 5.04 4.92 4.81 4.70 4.59 4.49 4.39 4.29 4.19
Mar
ket R
isk
Country Risk Premium
-20% -15% -10% -5% 0% 5% 10% 15% 20%
$5.51 6.94% 7.38% 7.81% 8.25% 8.68% 9.11% 9.55% 9.98% 10.42%-20% 3.86% 7.26 6.69 6.18 5.72 5.31 4.93 4.59 4.27 3.99-15% 4.11% 7.34 6.76 6.24 5.78 5.36 4.98 4.63 4.31 4.02-10% 4.35% 7.43 6.84 6.31 5.83 5.41 5.02 4.67 4.35 4.06
-5% 4.59% 7.51 6.91 6.37 5.89 5.46 5.07 4.71 4.39 4.090% 4.83% 7.60 6.99 6.44 5.95 5.51 5.12 4.76 4.43 4.135% 5.07% 7.68 7.06 6.51 6.01 5.57 5.17 4.80 4.47 4.16
10% 5.31% 7.77 7.14 6.58 6.08 5.62 5.22 4.85 4.51 4.2015% 5.55% 7.86 7.22 6.65 6.14 5.68 5.27 4.89 4.55 4.2420% 5.80% 7.96 7.30 6.72 6.20 5.74 5.32 4.94 4.59 4.28
Terminal Cost of Equity
Retu
rn o
n Eq
uity
Appendix 19: Sensitivity Analyses Tables

18
References
→ Damodaran, A. (1994). Damodaran on valuation: Security analysis for investment and corporate finance. (1st
Ed.), John Wiley & Sons.
→ Damodaran, A. (2006). Valuation Approaches and Metrics: A Survey of the Theory and Evidence. Stern School
of Business.
→ Damodaran, A. (2012). Investment Valuation: Tools and Techniques for determining the value of Any Asset.
Stern School of Business (2nd Ed.), John Wiley & Sons.
→ Defusco, R. A., Mcleavey, D. W. and Pinto, J. E. (2007). Quantitative Investment Analysis. CFA Institute
Investment Series, (2nd Ed.), John Wiley & Sons
→ Fernández, P. (2002). Valuation Using Multiples: How Do Analysts Reach Their Conclusions? IESE Business
School Research Paper.
→ Fernández, P. (2013). Company valuation methods. IESE Business School Working Paper.
→ Kaplan, S. N. and Ruback, R. S. (1995). The valuation of cash flow forecasts: An empirical analysis. Journal of
Finance
→ Koller, T., Goedhart, M. and Wessels, D. (2010). Valuation, Measuring and Managing the Value of Companies.
5th edition, McKinsey & Company
→ Oil Price Forecast 2019 – 2050, Accessed on: https://www.thebalance.com/
→ Pirelli’s, Accessed on: https://www.pirelli.com
→ Porter, M.E. (2008). The Five Competitive Forces that Shape Strategy. Harvard Business Review 86, No.1
→ Robinson, T. R.; Henry, E.; Pirie, W.L.; Broihahn, M.A. and Cope, A.T. (2015). International Financial Statement
Analysis. (3rd Ed), CFA Institute Investment Series. New Jersey, John Wiley & Sons, Inc.
→ Short-Tern Energy Outlook, Accessed on: https://www.eia.gov/outlooks/steo/

2
Abbreviations & Notes
PIRC – Pirelli & C. S.p.A
ASP – Average Selling Price
BN - Billions
CAGR – Compounded Annual Growth Rate
GDP – Gross Domestic Product
YE – Year End
R&D – Research and Development
OE – Original Equipment, i.e., tires that are part of new vehicles produced from the factories.
OEM´s – Original Equipment Manufacturers, i.e., BMW, Mercedes, Porsche, Audi, etc.
OPEC – Organisation of the Petroleum Exporting Countries
RT – Replacement Tires, i.e., sold as a result from previous tires wearing out
TREAD - Transportation Recall Enhancement, Accountability and Documentation
ELVs – End of Life Vehicles
R&D – Research & Development
H.V. – High Value
S.V. – Standard Value
D.C.F – Discounted Cash Flow
i Political Risk Yearbook: Developed Countries. 1- very low risk; 7- very high risk. ii Political Risk Yearbook: Developing Countries. 1- very low risk; 7- very high risk. iii CSI Market Database iv Bryan Garnier, Tyres & Rubber products