Pilot project for intensive surveillance of hail events in Terres de Ponent (Lleida
21
Pilot project for intensive surveillance of hail events in Terres de Ponent (Lleida) M. Aran ⁎ , A. Sairouni, J. Bech, J. Toda, T. Rigo, J. Cunillera, J. Moré Servei Meteorològic de Catalunya-Generalitat de Catalunya, c/. Berlín, 38-48, 08029 Barcelona, Spain Accepted 27 September 2005 Abstract Hail is one of the most fearsome meteorological phenomena for agricultural areas. The harvest of the whole year can be destroyed in only a few minutes. A pilot project to characterise hail events and identify hail with the help of radar observations is described in this paper. This pilot project was carried out in Terres de Ponent, an area of about 200,000 ha in Lleida (Catalonia), in the NE of the Iberian Peninsula. The aim of the project was to characterise hail events, directly by radiosounding data and radar images, and indirectly by the evaluation of the radiosonde forecasted by the Numerical Weather Prediction (NWP) Mesoscale Atmospheric Simulation System (MASS) and several instability indices. In the first stage of the project several instability indices were calculated during the 5 months of the campaign and a comparison of these indices with those obtained with radiosounding data from Barcelona and Zaragoza was performed. An operative image of the probability of hail distribution in Catalonia (every 6 min, hourly and daily) was also made using the Waldvogel method for its detection. As a starting point, an empirical fit of POH (probability of hail) obtained recently in the Netherlands (POH = 0.319 + 0.133·ΔH, where ΔH is the difference between the 45 dBZ echo top height from radar image and the isozero forecast). Complementary to this, to detect the hail at the beginning of spring, the process was repeated with the 35 dBZ echo top. In a second stage of the project, the calculated POH was compared with the hail events measured by 171 hailpads of the observational network of the Agrupació de Defensa Vegetal (ADV) of Terres de Ponent and a new fit of the POH formula was obtained. It was also the aim of this second stage to validate the forecasted radiosoundings by the NWP MASS model in Lleida and Barcelona. Finally, a comparison between the radiosounding data from Barcelona, Lleida and Zaragoza was made to verify which radiosounding (Barcelona or Zaragoza) is more representative of the Lleida area. © 2006 Elsevier B.V. All rights reserved. Keywords: Hail event; Probability of hail; Radar observations; Echo top; Isozero height 1. Introduction Hail is one of the most fearsome meteorological phenomena for agricultural areas. An intense hailfall can produce devastating socio-economic effects, destroying the harvest of a year in only a few minutes. Therefore there is a great interest in diagnosing and forecasting meteorological situations associated with hail events and, in particular, in the real-time identification of the occurrence of hail in a particular thunderstorm cell. This information may be useful either before the event, in Atmospheric Research 83 (2007) 315 – 335 www.elsevier.com/locate/atmos ⁎ Corresponding author. Fax: +34 935676102. E-mail address: [email protected] (M. Aran). 0169-8095/$ - see front matter © 2006 Elsevier B.V. All rights reserved. doi:10.1016/j.atmosres.2005.09.013
-
Upload
independent -
Category
Documents
-
view
1 -
download
0
Transcript of Pilot project for intensive surveillance of hail events in Terres de Ponent (Lleida
3 (2007) 315–335www.elsevier.com/locate/atmos
Atmospheric Research 8
Pilot project for intensive surveillance of hail eventsin Terres de Ponent (Lleida)
M. Aran ⁎, A. Sairouni, J. Bech, J. Toda, T. Rigo, J. Cunillera, J. Moré
Servei Meteorològic de Catalunya-Generalitat de Catalunya, c/. Berlín, 38-48, 08029 Barcelona, Spain
Accepted 27 September 2005
Abstract
Hail is one of the most fearsome meteorological phenomena for agricultural areas. The harvest of the whole year can bedestroyed in only a few minutes. A pilot project to characterise hail events and identify hail with the help of radar observationsis described in this paper. This pilot project was carried out in Terres de Ponent, an area of about 200,000 ha in Lleida(Catalonia), in the NE of the Iberian Peninsula.
The aim of the project was to characterise hail events, directly by radiosounding data and radar images, and indirectly by theevaluation of the radiosonde forecasted by the Numerical Weather Prediction (NWP) Mesoscale Atmospheric Simulation System(MASS) and several instability indices. In the first stage of the project several instability indices were calculated during the 5months of the campaign and a comparison of these indices with those obtained with radiosounding data from Barcelona andZaragoza was performed. An operative image of the probability of hail distribution in Catalonia (every 6 min, hourly and daily)was also made using the Waldvogel method for its detection. As a starting point, an empirical fit of POH (probability of hail)obtained recently in the Netherlands (POH=0.319+0.133·ΔH, where ΔH is the difference between the 45 dBZ echo top heightfrom radar image and the isozero forecast). Complementary to this, to detect the hail at the beginning of spring, the process wasrepeated with the 35 dBZ echo top.
In a second stage of the project, the calculated POH was compared with the hail events measured by 171 hailpads of theobservational network of the Agrupació de Defensa Vegetal (ADV) of Terres de Ponent and a new fit of the POH formula wasobtained. It was also the aim of this second stage to validate the forecasted radiosoundings by the NWP MASS model in Lleidaand Barcelona. Finally, a comparison between the radiosounding data from Barcelona, Lleida and Zaragoza was made to verifywhich radiosounding (Barcelona or Zaragoza) is more representative of the Lleida area.© 2006 Elsevier B.V. All rights reserved.
Keywords: Hail event; Probability of hail; Radar observations; Echo top; Isozero height
1. Introduction
Hail is one of the most fearsome meteorologicalphenomena for agricultural areas. An intense hailfall can
⁎ Corresponding author. Fax: +34 935676102.E-mail address: [email protected] (M. Aran).
0169-8095/$ - see front matter © 2006 Elsevier B.V. All rights reserved.doi:10.1016/j.atmosres.2005.09.013
produce devastating socio-economic effects, destroyingthe harvest of a year in only a few minutes. Thereforethere is a great interest in diagnosing and forecastingmeteorological situations associated with hail eventsand, in particular, in the real-time identification of theoccurrence of hail in a particular thunderstorm cell. Thisinformation may be useful either before the event, in

Fig. 2. Scheme of the two MASS model operational simulation chains.
316 M. Aran et al. / Atmospheric Research 83 (2007) 315–335
order to trigger hail-prevention systems, or afterwards, toevaluate the extension and intensity of damage in theaffected areas.
Moreover, the existence of hail in weather radarobservations may impact very seriously on the qualityof quantitative precipitation estimates (QPE). Usually,it causes an overestimation of precipitation at groundlevel when calculating rain rates with a standardreflectivity (Z) and rainfall rate (R) relationship.However, in some cases, hail may compensate theunderestimation produced by the existence of updraftsin convective precipitation (Collier, 1996). Addition-ally, for C and X band radars, hail may also beresponsible for intense attenuation behind hail cells.Therefore, radar QPE applications require a reliablehail detection procedure within a generic precipitationtype identification as recently reviewed by Salek et al.(2004).
This paper is focused on a collaborative pilotproject to monitor a rich agricultural area of about
Fig. 1. Geographical domains of the different MASS model simulations (toNetwork, indicating also radar locations (crosses), radiosonde stations (circlthe ADV “Terres de Ponent” (bottom).
200,000 ha in Lleida (Catalonia, NE Spain), oftenaffected by hailfall (Pascual, 2002; Segala et al., 2002;Sánchez et al., 2003; Tudurí et al., 2003). In thiscontrol area, there is a hailpad network of 173 nodesmaintained by the Agrupació de Defensa Vegetal(ADV) of Terres de Ponent.
The aim of the project is to characterise hail events,diagnosing them with radiosounding data and radarobservations, and also with the evaluation of radiosondeforecasts obtained with the NWP MASS model and
p left). Coverage of the Catalan Meteorological Service Weather Radare) and the hailpad network area of Lleida (top right). Hailpad Network of
Fig.3.E
xampleof
compu
tatio
nof
theprobabilityof
hail(POH35
)for
the17
thof
Aug
ust200
4case
stud
y:(a)13
.48UTCradarecho
-top
,(b)
12UTCisozeromod
elforecast,(c)13
.48UTCPOH,(d)
13UTCPOH
hourly
maxim
umand(e)17
thAug
ustPOH
daily
maxim
um.
317M. Aran et al. / Atmospheric Research 83 (2007) 315–335

Fig. 4. Isozero forecast selection scheme for every hour of the day with a three hourly resolution considering the 00 and 12 UTC MASS model runs.
318 M. Aran et al. / Atmospheric Research 83 (2007) 315–335
several instability indices. Moreover, a comparisonbetween the radiosounding data from Barcelona,Zaragoza and Lleida (specially setup for this pilotproject) was performed to verify which radiosounding(Barcelona or Zaragoza) is more representative of theLleida area.
The region studied is shown in Fig. 1, which depictsthe different geographical simulation domains of theMASS model, the radar network coverage considered inthis study and the hailpad network.
2. Probability of hail
2.1. Methodology
From the point of view of weather radar observa-tions, hailstones produce a different echo pattern whencompared to raindrops; in general hail is associated withvery high radar reflectivities. However, the mostsignificant feature is the fact that reflectivities in thevertical (Zv) and horizontal polarization planes (Zh)produce similar values because hailstones are, onaverage, approximately spherical unlike raindrops ofsimilar size which are oblate. Therefore, dual polariza-tion radar systems allow discrimination between hailand liquid precipitation (Seliga et al., 1982). Moreover,
Fig. 5. Temporal evolution of the temperature difference between Lleida and Bhail events are indicated with square symbols.
there are other techniques based on dual-wavelengthradar observations (Atlas and Ludlam, 1961; Feral et al.,2003). However, as most operational radars use singlefrequency and non-polarimetric transmitters, manyapplications are still based on single polarization andsingle frequency observations.
The procedure applied in the present study is basedon the method of Waldvogel et al. (1979), whichcombines the radar information and temperatureobtained by the NWP model. This method determinesthe probability of hail (POH) by means of the differencebetween the height of the freezing level (obtained by themodel) and the maximum height at which a reflectivityis greater than a given threshold obtained by the radar.The POH is calculated as follows:
POH ¼ 0:319þ 0:133⁎ðZR−ZMÞ ð1Þ
where ZR is the radar observed 45 dBZ echo top heightand ZM is the model derived isozero height forecast(both magnitudes expressed in km). According to thisformulation, the higher the radar echo is detected abovethe isozero level, the more likely it is caused by hail. Theconstants of this expression were determined empirical-ly with observations in the Netherlands (Holleman,2001). In the following sections a more detailed
arcelona at 500 hPa. Julian days are indicated in the horizontal axis and

Fig. 6. Temporal evolution of the dew point depression (DPD) difference between Lleida and Barcelona at 925 hPa. Julian days are indicated in thehorizontal axis.
319M. Aran et al. / Atmospheric Research 83 (2007) 315–335
discussion is given of the implementation of the methodin the field project campaign and its verification usinghailpad observations.
2.2. Data used
2.2.1. Radiosonde dataThe sondes launched at Barcelona and Lleida
stations, operated by the Catalan Meteorological Service(Meteocat), are RS-80 units manufactured by Vaisala, asare the Zaragoza radiosondes of the Spanish Meteoro-logical Institute (INM). The Vaisala RS-80 system wasdesigned according to the World MeteorologicalOrganization (WMO) requirements on this type ofinstrument (Vaisala, 1997). It has been widely usedoperationally though some limitations have been foundin temperature and humidity measurements, usuallyassociated with extreme conditions (Luers and Eskridge,1995; Miloshevich et al., 2001).
2.2.2. Radar dataRadar data are composites made up by polar volumes
obtained from the Meteocat Weather Radar Network(Fig. 1). The network is composed of three C-bandradars, operated at long (240 km) and short (130 km)ranges, which allows Doppler filtering. The pixel
Fig. 7. Frequency histograms of Total Totals Index (°C) and Lifted Index (°C
resolution is approximately 1 km2 and one volumescan is available every 6 min. The data acquisition cycleincludes a 0.6° elevation sweep at long range and 14elevations at short range. More technical details of theradar network are given in Bech et al. (2004).
Radar products used in the present study are echotops (maximum height of radar echoes with an intensityequal or higher than 12, 35, and 45 dBZ). The images ofthe radars were composed using the maximum valuemethod for each pixel where more than one radar wasavailable. These images are integrated in a domain of260×262 pixels.
2.2.3. NWP Model dataThe MASS model is a mesoscale limited area model
based on a primitive equation system and vertical sigmalevels (Kaplan et al., 1982; Codina et al., 1997). Ahydrostatic version (MASS 5.13) is currently usedoperationally at Meteocat. Daily operational runsinclude four simulations every 12 h, all of them with21 vertical sigma levels (Fig. 2).
The first simulation is initialised with GlobalForecast System (GFS) data from the National Centersfor Environmental Prediction (NCEP) and also radio-sonde, METAR and SYNOP observations. It coversmost of Europe and NW Africa with an approximate
) indices for hail events (in black) and without hail (in grey) in Lleida.
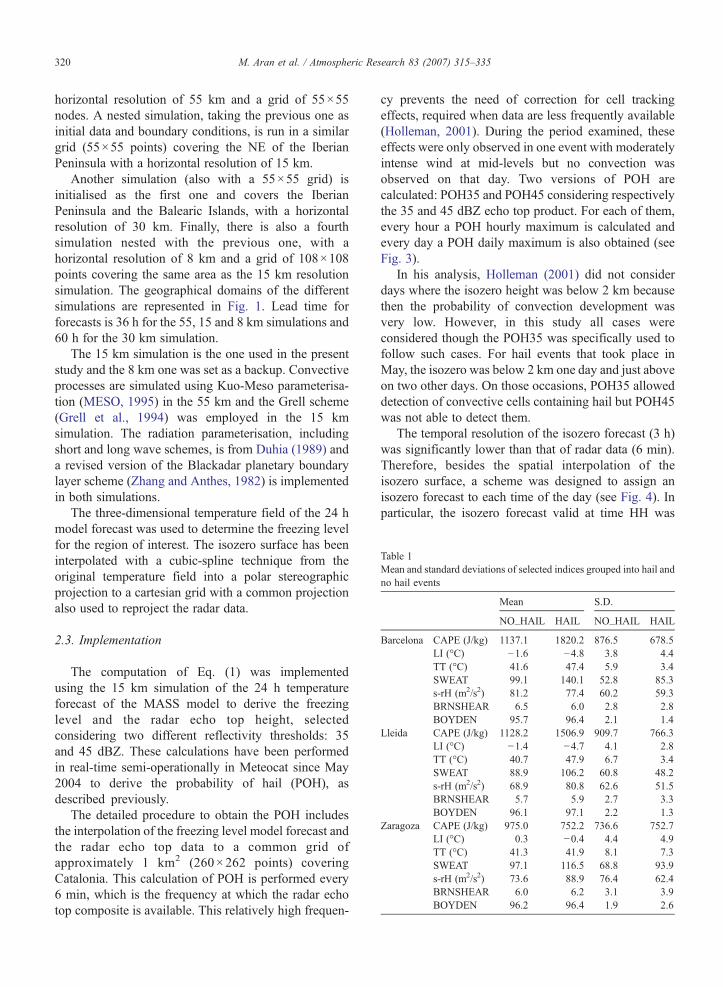
Table 1Mean and standard deviations of selected indices grouped into hail andno hail events
Mean S.D.
NO_HAIL HAIL NO_HAIL HAIL
Barcelona CAPE (J/kg) 1137.1 1820.2 876.5 678.5LI (°C) −1.6 −4.8 3.8 4.4TT (°C) 41.6 47.4 5.9 3.4SWEAT 99.1 140.1 52.8 85.3s-rH (m2/s2) 81.2 77.4 60.2 59.3BRNSHEAR 6.5 6.0 2.8 2.8BOYDEN 95.7 96.4 2.1 1.4
Lleida CAPE (J/kg) 1128.2 1506.9 909.7 766.3LI (°C) −1.4 −4.7 4.1 2.8TT (°C) 40.7 47.9 6.7 3.4SWEAT 88.9 106.2 60.8 48.2s-rH (m2/s2) 68.9 80.8 62.6 51.5BRNSHEAR 5.7 5.9 2.7 3.3BOYDEN 96.1 97.1 2.2 1.3
Zaragoza CAPE (J/kg) 975.0 752.2 736.6 752.7LI (°C) 0.3 −0.4 4.4 4.9TT (°C) 41.3 41.9 8.1 7.3SWEAT 97.1 116.5 68.8 93.9s-rH (m2/s2) 73.6 88.9 76.4 62.4BRNSHEAR 6.0 6.2 3.1 3.9BOYDEN 96.2 96.4 1.9 2.6
320 M. Aran et al. / Atmospheric Research 83 (2007) 315–335
horizontal resolution of 55 km and a grid of 55×55nodes. A nested simulation, taking the previous one asinitial data and boundary conditions, is run in a similargrid (55×55 points) covering the NE of the IberianPeninsula with a horizontal resolution of 15 km.
Another simulation (also with a 55×55 grid) isinitialised as the first one and covers the IberianPeninsula and the Balearic Islands, with a horizontalresolution of 30 km. Finally, there is also a fourthsimulation nested with the previous one, with ahorizontal resolution of 8 km and a grid of 108×108points covering the same area as the 15 km resolutionsimulation. The geographical domains of the differentsimulations are represented in Fig. 1. Lead time forforecasts is 36 h for the 55, 15 and 8 km simulations and60 h for the 30 km simulation.
The 15 km simulation is the one used in the presentstudy and the 8 km one was set as a backup. Convectiveprocesses are simulated using Kuo-Meso parameterisa-tion (MESO, 1995) in the 55 km and the Grell scheme(Grell et al., 1994) was employed in the 15 kmsimulation. The radiation parameterisation, includingshort and long wave schemes, is from Duhia (1989) anda revised version of the Blackadar planetary boundarylayer scheme (Zhang and Anthes, 1982) is implementedin both simulations.
The three-dimensional temperature field of the 24 hmodel forecast was used to determine the freezing levelfor the region of interest. The isozero surface has beeninterpolated with a cubic-spline technique from theoriginal temperature field into a polar stereographicprojection to a cartesian grid with a common projectionalso used to reproject the radar data.
2.3. Implementation
The computation of Eq. (1) was implementedusing the 15 km simulation of the 24 h temperatureforecast of the MASS model to derive the freezinglevel and the radar echo top height, selectedconsidering two different reflectivity thresholds: 35and 45 dBZ. These calculations have been performedin real-time semi-operationally in Meteocat since May2004 to derive the probability of hail (POH), asdescribed previously.
The detailed procedure to obtain the POH includesthe interpolation of the freezing level model forecast andthe radar echo top data to a common grid ofapproximately 1 km2 (260×262 points) coveringCatalonia. This calculation of POH is performed every6 min, which is the frequency at which the radar echotop composite is available. This relatively high frequen-
cy prevents the need of correction for cell trackingeffects, required when data are less frequently available(Holleman, 2001). During the period examined, theseeffects were only observed in one event with moderatelyintense wind at mid-levels but no convection wasobserved on that day. Two versions of POH arecalculated: POH35 and POH45 considering respectivelythe 35 and 45 dBZ echo top product. For each of them,every hour a POH hourly maximum is calculated andevery day a POH daily maximum is also obtained (seeFig. 3).
In his analysis, Holleman (2001) did not considerdays where the isozero height was below 2 km becausethen the probability of convection development wasvery low. However, in this study all cases wereconsidered though the POH35 was specifically used tofollow such cases. For hail events that took place inMay, the isozero was below 2 km one day and just aboveon two other days. On those occasions, POH35 alloweddetection of convective cells containing hail but POH45was not able to detect them.
The temporal resolution of the isozero forecast (3 h)was significantly lower than that of radar data (6 min).Therefore, besides the spatial interpolation of theisozero surface, a scheme was designed to assign anisozero forecast to each time of the day (see Fig. 4). Inparticular, the isozero forecast valid at time HH was

Fig.8
.500
hPageopotentialheight
(thick
line)
andtemperature
(dottedlin
e)analysisof
the12th
ofJune
2004
12UTC(Left).Surface
pressure
(thick
line)
andtemperature
(dottedlin
e)of
the
samedate.
321M. Aran et al. / Atmospheric Research 83 (2007) 315–335
322 M. Aran et al. / Atmospheric Research 83 (2007) 315–335
combined with echo top observations collected betweenH−1:00 and H+1:54.
On the other hand, taking into account themaximum lead time (24 h) of the 15 km simulationand the time at which forecasts are available, aprocedure to warrant that forecasts are available allday was designed, as shown in Fig. 4. For example,between 00:00 and 12:00 UTC the isozero used isselected from the MASS model run initialised at12 UTC the previous day and between 12:00 and23:59 the forecast used corresponds to the simulationinitialised at 00 UTC on the same day.
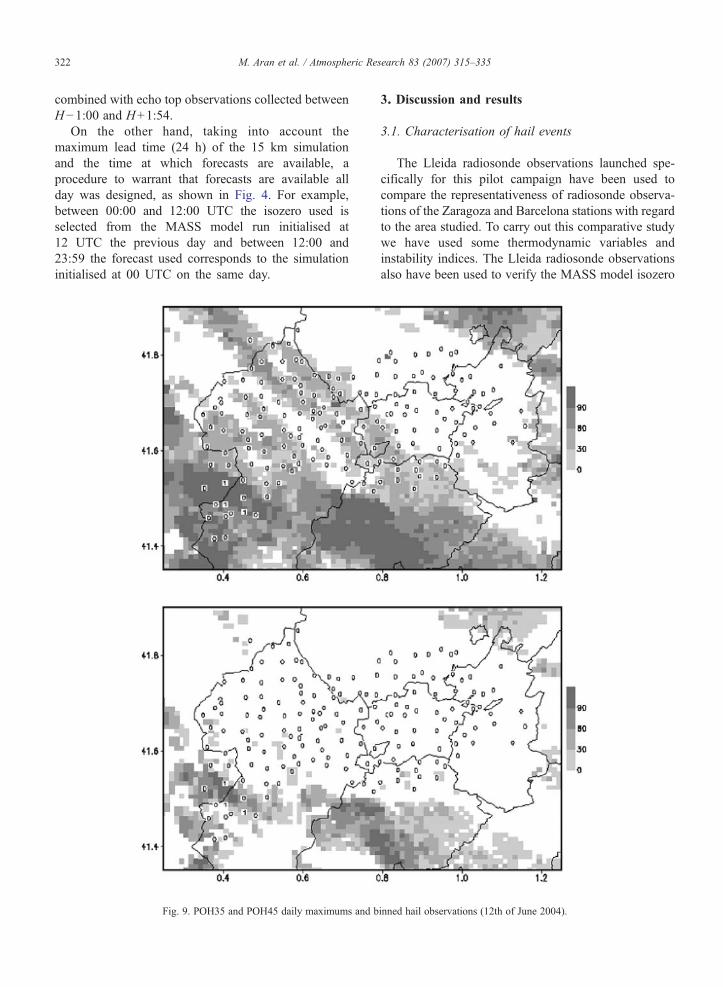
Fig. 9. POH35 and POH45 daily maximums and b
3. Discussion and results
3.1. Characterisation of hail events
The Lleida radiosonde observations launched spe-cifically for this pilot campaign have been used tocompare the representativeness of radiosonde observa-tions of the Zaragoza and Barcelona stations with regardto the area studied. To carry out this comparative studywe have used some thermodynamic variables andinstability indices. The Lleida radiosonde observationsalso have been used to verify the MASS model isozero
inned hail observations (12th of June 2004).

Fig. 10. Skew–T plots of the 12th June 2004 at 1200 UTC at Zaragoza (A), Lleida (B) and Barcelona (C).
323M. Aran et al. / Atmospheric Research 83 (2007) 315–335

Fig. 10 (continued).
324 M. Aran et al. / Atmospheric Research 83 (2007) 315–335
forecasts (see Section 3.3) and to characterise theatmospheric environment of hail days. Hereafter, a hailevent is defined as a day that hail is observed in one ofthe hailpads of the control area.
In the field campaign of this project carried outduring 2004, hailfall events were not especially intense.In 168 days, there were 14 with hail observed in thehailpad network, with 78 hailpads impacted during thewhole period and 2344 not impacted.
The 14 hail days are associated with differentsynoptic situations. The most usual situation (6 cases)was the circulation of a low-pressure system at higherlatitudes (around 40°N) in the 500 hPa level. In onlyfour cases there was a marked upper level troughcoming from the NW of the Iberian Peninsula towardsthe region of interest and on another 3 days thedepression was located at lower latitudes (35°N) withthe cold core over the SW coast of Spain. Finally theremaining hail day considered was associated with aretrograde low pressure system coming from the centreof Europe.
In these synoptic situations, westerly winds predom-inate over 700 hPa; only in the three cases where the low
was centred over the SW of Spain there were southerlywinds. The remaining day had easterly winds. Surfacelow pressure systems showed similar positions to upperlevel lows, though their centre usually drifted to the east.Below 40°N this fact implied a predominance of S andSE winds, while in higher latitude lows, winds are againmostly from W or S (not shown).
These comments are referred to the situationsexamined and no attempts to generalise can be made.Pascual (2002) performed an analysis with a muchlarger data set of the Zaragoza station and found a widevariety of synoptic situations associated with hail daysin the Lleida area.
Regarding the vertical distribution of temperatureand moisture, average monthly differences betweenBarcelona and Lleida are relatively small. However,there are some substantial daily variations (Fig. 5).Positive differences correspond to the presence of theaxis of a trough over Barcelona, while negativevariations are usually associated with slight displace-ments of the axis to Lleida. In lower levels theorography and the proximity of the sea modulate themoisture content up to 700 hPa. In Fig. 6 it may be

Table 2A selection of variables and indices related to convection and hail(12th June 2004)
LI(°C)
CAPE(J/kg)
PW(cm)
TT(°C)
Wet Bulb Zero(m MSL)
s-rH(m2/s2)
Zaragoza −5.5 2030 2.54 48.6 3202 33Lleida −2.6 1111 2.42 47.6 3197 61Barcelona −0.6 643 2.55 44.8 3381 95
325M. Aran et al. / Atmospheric Research 83 (2007) 315–335
observed that big differences are found in moisturecontent at 925 hPa between Lleida and Barcelona.Lleida, located inland, is much drier than Barcelona,which is very much influenced by the presence of thesea. Therefore, the representativeness of the radiosondeof Barcelona depends strongly on the synoptic situation.A more detailed discussion of the differences exhibitedin the case studies of 12th and 14th June is given inSection 3.2.
The number of hail days examined is relatively lowto obtain results that might be generalised. However,from Fig. 7 it is clear that hail days show a largerproportion of values above 46 of Total Totals Index(TT), and of Lifted Index (LI) below −4. Moreover, nohail day had a LI above 2 but there were days with LIvalues below −4 were no hail was observed. On theother hand, on days without hail there are not more than10 cases with TT values above 48.
Other instability indices have been calculated for thetemporal period examined, as shown in Table 1. Ingeneral it may be seen that values obtained for TT, LIand for the convective available potential energy(CAPE) are different on hail and no hail days. Howeverother indices such as BOYDEN (Boyden, 1963) orSWEAT (Miller, 1972) do not exhibit big differencesthat allow discrimination of hail days.
The table also shows that for Lleida and Zaragozadata the average of the storm relative helicity between0 and 3 km (s-rH) is higher on days with hail; inBarcelona the behaviour is completely different. Thisresult might indicate that the vertical wind profile ofLleida is much more similar to Zaragoza than toBarcelona, which at low levels is usually dominated bythe sea breeze circulation (Redaño et al., 1991).Standard deviation for all indices is relatively high,for two main reasons: firstly the sample size isrelatively small; secondly the synoptic situation of nohail days is very broad. Probably more conclusiveresults could be obtained if different features werediscriminated on the days with no hail; for example ifdays without hail were separated into thunderstorm andno thunderstorm days.
3.2. Case studies
3.2.1. 12th June 2004During the days before 12th June 2004, a high-
pressure system dominated the area of study. The axis ofthe ridge, originally oriented from N to S, moved to theWof Portugal and, on the following days, inclined to theeast. Subsidence reinforced gradually over WesternEurope increasing remarkably the temperature below850 hPa. Meanwhile a thermal low developed over theIberian Peninsula, favouring in the afternoon moderateconvection in mountain areas of central Spain and weakconvection in the Pyrenees.
On 12th June, apart from the thermal low mentioned,the existence of a relatively small upper level troughmoving from north to south caused additional dynam-ical forcing (Fig. 8). Rain gauges in the study arearecorded 5 mm, but others located in the rest ofCatalonia, particularly in mountain areas, showed highervalues exceeding locally more than 20 mm in 30 min.Three different hailpads, located in the SWof the area ofstudy (Fig. 9), reported small hail (diameter sizebetween lentil and chick-pea).
Both in Lleida and Barcelona, the subsidenceassociated with the already existing ridge modulatedthe shape of the radiosonde (Fig. 10). This shaperesembles the “load gun” shape quoted by Miller (1972)when describing super-cell environments. Above600 hPa the layer is very dry and apparently all themoisture is concentrated below that level. However, asmentioned by Weisman and Klemp (1986), the moistlayer should be even thinner and not extend above 2 kmin order to have an environment prone to super-celldevelopment. Precipitable water observed (Table 2)show low values, a factor that contributes to the growthof hailstones inside the thunderstorm cloud. Moreover,both CAPE and LI reached levels associated with highpotential of severe weather (Weisman and Klemp,1986). The s-rH had low values, but in the Barcelonaradiosonde were more remarkable. The convectivetemperature was high but was largely exceeded bysurface temperatures.
The lightning detection network system operated byMeteocat recorded that day a ratio of intra-clouddischarges and cloud-to-ground flashes (IC/CG) of1.17. Most of them took place between 12 and18 UTC and affected the inland areas of Catalonia,including the region of study.
The 1 km CAPPI radar sequence of the event (notshown) indicated the existence of two types ofstructures. Firstly, some isolated convective cellsdeveloped in the northern mountain region of Catalonia.
326 M. Aran et al. / Atmospheric Research 83 (2007) 315–335
Fig.11.500hP
ageopotentialh
eight(thicklin
e)andtemperature
(dottedlin
e)analysisof
the14th
ofJune
2004
12UTC(Left).S
urface
pressure(thick
line)
andtemperature(dottedlin
e)of
thesame
date.
327M. Aran et al. / Atmospheric Research 83 (2007) 315–335
They grew and evolved to a well organised squall-line,which crossed the northern part of the area studied,moving to the SSE and showing an intense convectiveactivity until it reached the coastline. Secondly, the areaof interest was swept by several convective structurescoming from the west. They were not particularly wellorganised, though multicell storms–with some interac-tion between them–may be identified.
The location and evolution of the main cells affectingthe area studied is reflected in the daily maximumprobability of hail POH35 product (Fig. 9), based on theradar echo top of observations equal to or above 35 dBZ.The product shows many pixels with probabilities above90% though only three hailpads recorded hail on thatevent. Alternatively, the POH45 (with a threshold of45 dBZ echo tops) depicts more sharply the presence ofvertical development and hail bearing cells.
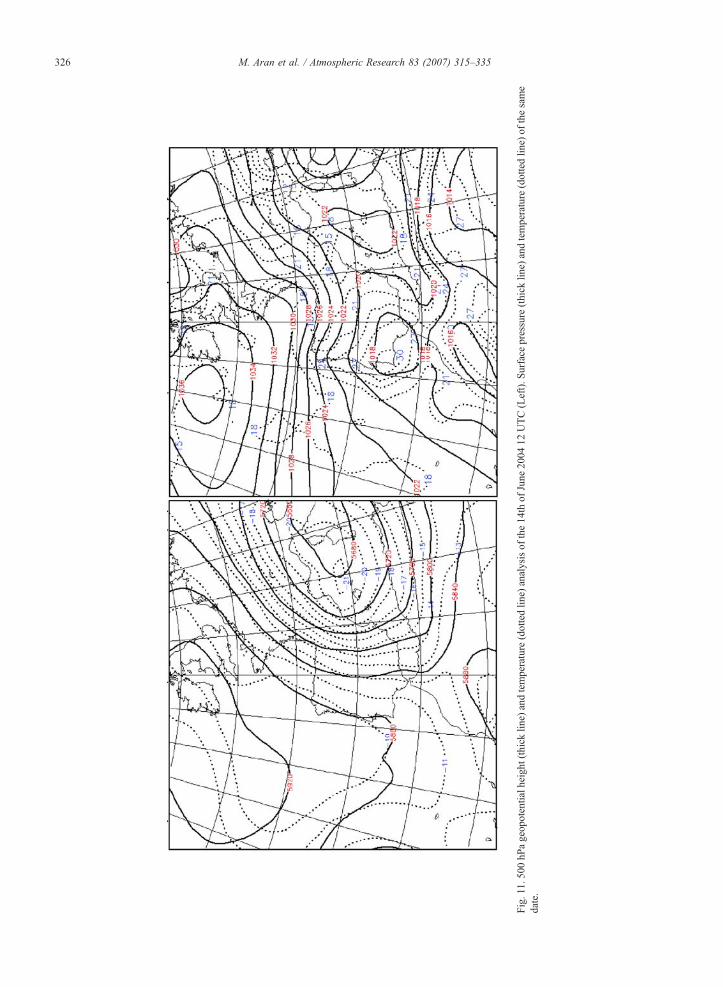
3.2.2. 14th June 2004Between 12th and 15th June a cyclogenetic process
began in northern Europe. In the maximum develop-ment stage, on 14th June, the depression was locatedover the Mediterranean Sea, approximately in front ofthe NE coast of Spain (Fig. 11). The cold core at 500 hPawas over Barcelona (the radiosonde indicated −22 °C).The tropopause altitude dropped abruptly (more than3 km in 48 h) above the area of study on 14th June, asshown in Table 3.
On 14th June, the surface high-pressure area over theN of the Iberian Peninsula and the low-level low overthe Gulf of Lion, favoured the formation of anorographic dipole pattern in the NE of Catalonia. Thisdipole is typically characterised by a relative surface lowextending from the Pyrenees to the S of Catalonia(Bénech et al., 1998). The convergence areas, located infront of the central coast at the beginning of the day,progressed to the coast and locally inland. The SE windintensified in the area of study (more than 10 m/s) and aconvergence line was formed to the north of this area,enhancing the convective activity of the cells reachingthis zone. Mesoscale forcing, assessed with s-rH, wasmore important in Lleida where it rose from 61 m2/s2 to146 m2/s2.
On this day, synoptic forcing was more intense thanon 12th June. However, the previous subtropical air mass
Table 3Tropopause height (m MSL) in Zaragoza, Lleida and Barcelona
Tropopause (m MSL) Zaragoza Lleida Barcelona
12 June 12.887 12.243 12.41514 June 9.529 8.602 8.785
was replaced by another one of polar maritime origin butslightly modified as it moved across Europe. Thecontrast of the two air masses between the Barcelonaand Zaragoza stations was remarkable and the thermalborder was located approximately in Lleida. In Barce-lona, the cold advection was clear at all vertical levels(Fig. 12), with a marked decrease in moisture in lowlevels but not that much in Zaragoza (see Tables 2 and 4).Daily highs did not exceed the convective temperature,so thermal forcing did not play a major role.
Two hailpads located in the northern part of the areastudied were affected by small hail (similarly to theprevious hail day).
The IC/CG ratio for this day was of 1.43. Thelightning took place throughout the day and clustered ina few isolated thunderstorms, most of them on the coastor over the sea, but some others in mountain areas or flatlands (as the region of interest).
The radar images showed that one of the mostimportant structures affected the area of Lleida. Itdeveloped in the eastern Pyrenees and propagated to theSSW, growing significantly in the centre of Catalonia. Itarrived in the area of study in its dissipation stage(characterised by stratiform precipitation predominanceover convective), but some convective cores where stillpresent, especially in the northern part. Once again, thedaily POH35 maximum helped to locate storm tracksbut POH45 distinguished far better where hailfalloccurred (not shown).
3.2.3. 17th August 2004The synoptic situation is characterised by a deep
low centred in the NW of the Iberian Peninsula, whichintensified progressively, reaching at the end of the day990 hPa at surface level. On the other hand, asecondary low formed at midday centred over theNE of Spain with a surface pressure level of 1008 hPa.The 12 UTC satellite image (not shown) indicated thepresence of a pre-frontal cloud band to the west of thearea of study, crossing the Iberian Peninsula from W toE. The mesoscale surface wind analysis between 12and 15 UTC revealed the existence of a convergencezone in the region of study. Between 14 and 18 UTC,when the frontal system crossed the NE of the IberianPeninsula, rainfall amounts above 40 mm wererecorded in the southern part of Catalonia; in theregion of study the maximum amount collected was15 mm (11 mm fell in only 30 min). Part of thisprecipitation was small hail and was recorded in 9hailpads.
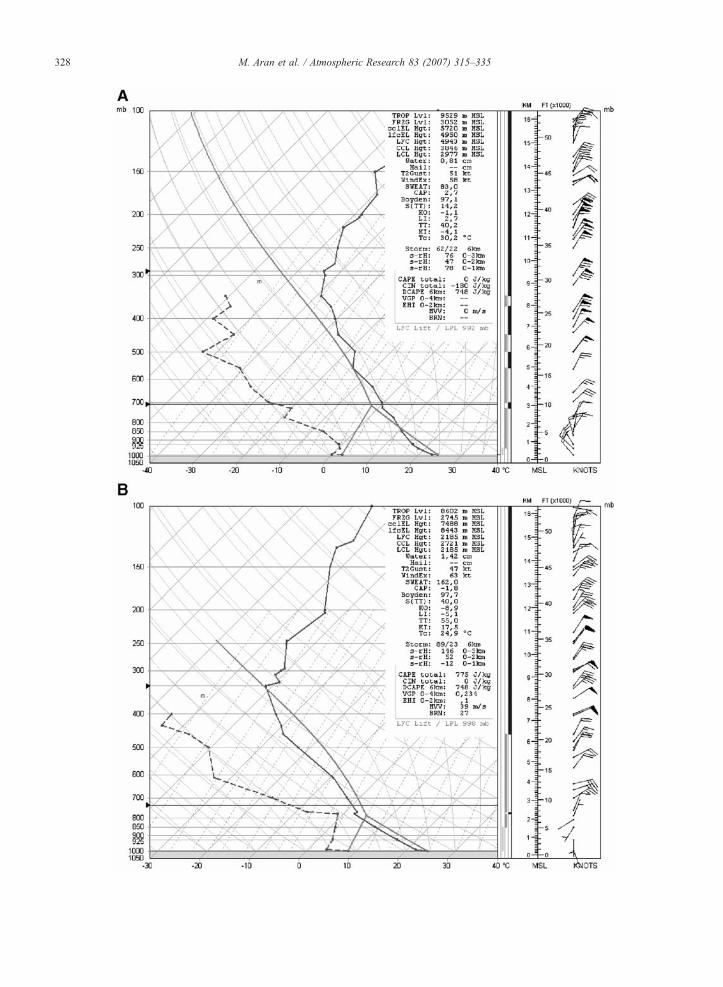
The radiosonde data of Lleida (Fig. 13) showed aclear increase of moisture above the 600 hPa level.
328 M. Aran et al. / Atmospheric Research 83 (2007) 315–335

Fig. 12. Skew–T plots of the 14th June 2004 at 1200 UTC at Zaragoza (A), Lleida (B) and Barcelona (C).
329M. Aran et al. / Atmospheric Research 83 (2007) 315–335
The LI, TT and CAPE indicated unstable conditionsand convection (Table 5), and a clear possibility ofthunderstorm (Weisman and Klemp, 1986). However,in this case, the s-rH did not point clearly tothunderstorm conditions. Similar values of the indiceswere found for the Barcelona radiosonde. Precipitablewater found in Lleida was 2.16 cm, a relatively highvalue but not indicative of the presence of hail. Inaddition, it should be noted that the wet bulb isozerois slightly above 3000 m. Under these conditions, ifhail existed it should be small. The Barcelonaradiosonde shows that both precipitable water andwet bulb zero suggested a low probability of hail inthis coastal zone.
Table 4A selection of variables and indices related to convection and hail(14th June 2004)
LI(°C)
CAPE(J/kg)
PW(cm)
TT(°C)
Wet Bulb Zero(m MSL)
s-rH(m2/s2)
Zaragoza 2.7 0 0.81 40 1981 76Lleida −5.1 775 1.42 55 2330 146Barcelona −6.3 1493 1.68 50 2290 57
During this event the IC/CG ratio was of 2.40. Thisvalue indicates that 17th August 2004 was one of thedays with a highest IC/CG ratio of the year.
The radar images showed that some convectivecores affected the area of study but the most activestructures did not take place in this area. Mostconvection developed inland, in the central part ofCatalonia. A few structures came from the west but, asthey moved very quickly, did not produce high rainfallamounts.
The highest values of maximum POH on that dayappeared in two areas, following the lightning datadistribution pattern: one in the south (with valuesabove 90%) and another in the centre of Catalonia,following a band parallel to the coast, at approximately50 km from the sea, with wide areas of POH above90%. Part of this band struck the region of interest,where 9 hailpads were impacted by hail.
3.3. NWP isozero forecasts
The 15 km resolution MASS model forecast hasbeen used to derive the isozero height required in the

Fig. 13. Skew–T plots of the 17th August 2004 at 1200 UTC at Lleida (A) and Barcelona (B).
330 M. Aran et al. / Atmospheric Research 83 (2007) 315–335
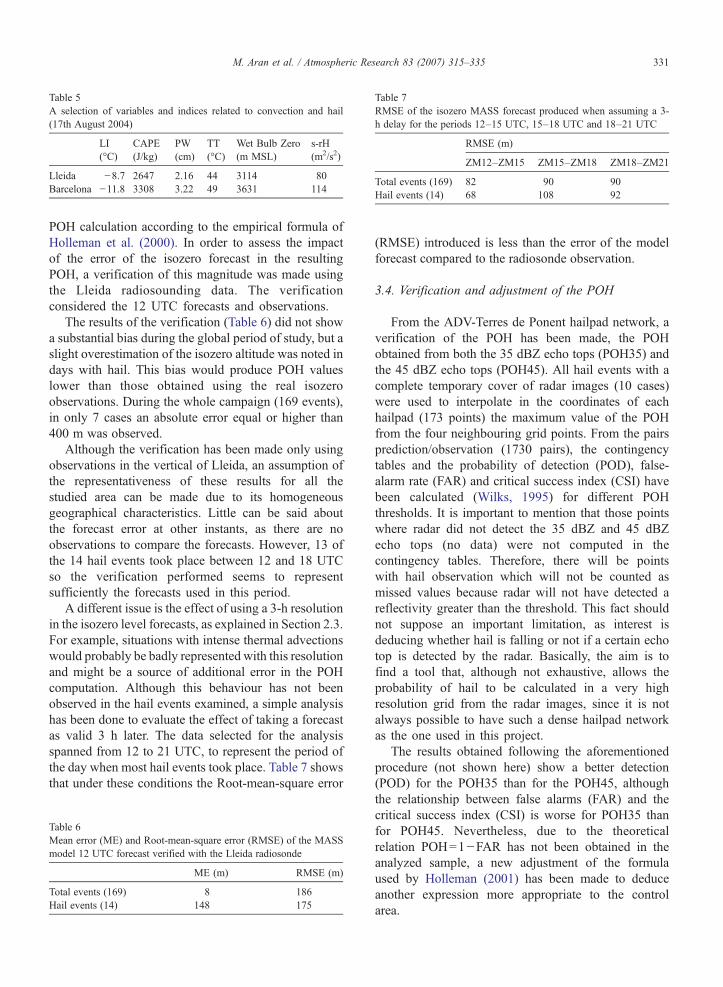
Table 5A selection of variables and indices related to convection and hail(17th August 2004)
LI(°C)
CAPE(J/kg)
PW(cm)
TT(°C)
Wet Bulb Zero(m MSL)
s-rH(m2/s2)
Lleida −8.7 2647 2.16 44 3114 80Barcelona −11.8 3308 3.22 49 3631 114
Table 7RMSE of the isozero MASS forecast produced when assuming a 3-h delay for the periods 12–15 UTC, 15–18 UTC and 18–21 UTC
RMSE (m)
ZM12–ZM15 ZM15–ZM18 ZM18–ZM21
Total events (169) 82 90 90Hail events (14) 68 108 92
331M. Aran et al. / Atmospheric Research 83 (2007) 315–335
POH calculation according to the empirical formula ofHolleman et al. (2000). In order to assess the impactof the error of the isozero forecast in the resultingPOH, a verification of this magnitude was made usingthe Lleida radiosounding data. The verificationconsidered the 12 UTC forecasts and observations.
The results of the verification (Table 6) did not showa substantial bias during the global period of study, but aslight overestimation of the isozero altitude was noted indays with hail. This bias would produce POH valueslower than those obtained using the real isozeroobservations. During the whole campaign (169 events),in only 7 cases an absolute error equal or higher than400 m was observed.
Although the verification has been made only usingobservations in the vertical of Lleida, an assumption ofthe representativeness of these results for all thestudied area can be made due to its homogeneousgeographical characteristics. Little can be said aboutthe forecast error at other instants, as there are noobservations to compare the forecasts. However, 13 ofthe 14 hail events took place between 12 and 18 UTCso the verification performed seems to representsufficiently the forecasts used in this period.
A different issue is the effect of using a 3-h resolutionin the isozero level forecasts, as explained in Section 2.3.For example, situations with intense thermal advectionswould probably be badly represented with this resolutionand might be a source of additional error in the POHcomputation. Although this behaviour has not beenobserved in the hail events examined, a simple analysishas been done to evaluate the effect of taking a forecastas valid 3 h later. The data selected for the analysisspanned from 12 to 21 UTC, to represent the period ofthe day when most hail events took place. Table 7 showsthat under these conditions the Root-mean-square error
Table 6Mean error (ME) and Root-mean-square error (RMSE) of the MASSmodel 12 UTC forecast verified with the Lleida radiosonde
ME (m) RMSE (m)
Total events (169) 8 186Hail events (14) 148 175
(RMSE) introduced is less than the error of the modelforecast compared to the radiosonde observation.
3.4. Verification and adjustment of the POH
From the ADV-Terres de Ponent hailpad network, averification of the POH has been made, the POHobtained from both the 35 dBZ echo tops (POH35) andthe 45 dBZ echo tops (POH45). All hail events with acomplete temporary cover of radar images (10 cases)were used to interpolate in the coordinates of eachhailpad (173 points) the maximum value of the POHfrom the four neighbouring grid points. From the pairsprediction/observation (1730 pairs), the contingencytables and the probability of detection (POD), false-alarm rate (FAR) and critical success index (CSI) havebeen calculated (Wilks, 1995) for different POHthresholds. It is important to mention that those pointswhere radar did not detect the 35 dBZ and 45 dBZecho tops (no data) were not computed in thecontingency tables. Therefore, there will be pointswith hail observation which will not be counted asmissed values because radar will not have detected areflectivity greater than the threshold. This fact shouldnot suppose an important limitation, as interest isdeducing whether hail is falling or not if a certain echotop is detected by the radar. Basically, the aim is tofind a tool that, although not exhaustive, allows theprobability of hail to be calculated in a very highresolution grid from the radar images, since it is notalways possible to have such a dense hailpad networkas the one used in this project.
The results obtained following the aforementionedprocedure (not shown here) show a better detection(POD) for the POH35 than for the POH45, althoughthe relationship between false alarms (FAR) and thecritical success index (CSI) is worse for POH35 thanfor POH45. Nevertheless, due to the theoreticalrelation POH=1−FAR has not been obtained in theanalyzed sample, a new adjustment of the formulaused by Holleman (2001) has been made to deduceanother expression more appropriate to the controlarea.
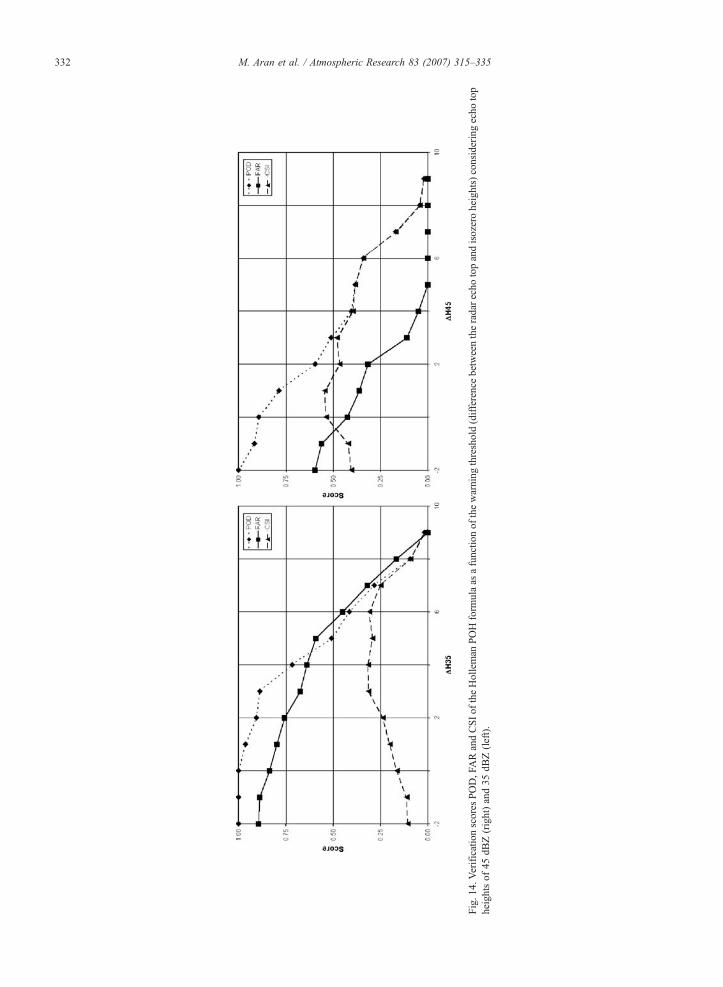
Fig.14.Verificationscores
POD,FARandCSIof
theHolleman
POHform
ulaas
afunctio
nof
thewarning
threshold(differencebetweentheradarecho
topandisozeroheights)consideringecho
top
heightsof
45dB
Z(right)and35
dBZ(left).
332 M. Aran et al. / Atmospheric Research 83 (2007) 315–335
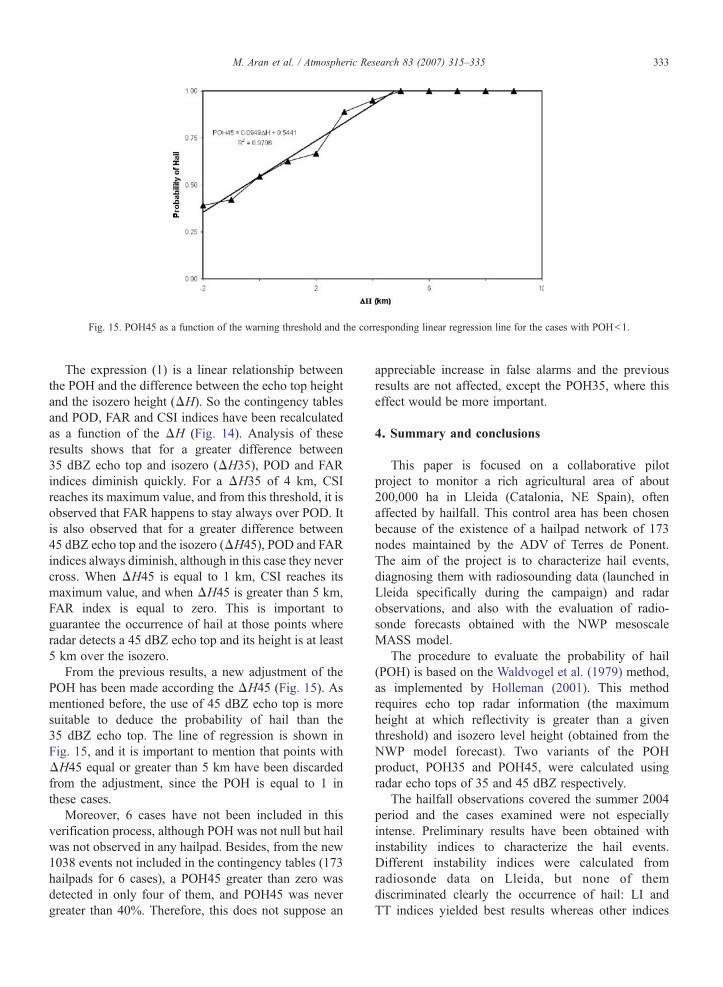
Fig. 15. POH45 as a function of the warning threshold and the corresponding linear regression line for the cases with POH<1.
333M. Aran et al. / Atmospheric Research 83 (2007) 315–335
The expression (1) is a linear relationship betweenthe POH and the difference between the echo top heightand the isozero height (ΔH). So the contingency tablesand POD, FAR and CSI indices have been recalculatedas a function of the ΔH (Fig. 14). Analysis of theseresults shows that for a greater difference between35 dBZ echo top and isozero (ΔH35), POD and FARindices diminish quickly. For a ΔH35 of 4 km, CSIreaches its maximum value, and from this threshold, it isobserved that FAR happens to stay always over POD. Itis also observed that for a greater difference between45 dBZ echo top and the isozero (ΔH45), POD and FARindices always diminish, although in this case they nevercross. When ΔH45 is equal to 1 km, CSI reaches itsmaximum value, and when ΔH45 is greater than 5 km,FAR index is equal to zero. This is important toguarantee the occurrence of hail at those points whereradar detects a 45 dBZ echo top and its height is at least5 km over the isozero.
From the previous results, a new adjustment of thePOH has been made according the ΔH45 (Fig. 15). Asmentioned before, the use of 45 dBZ echo top is moresuitable to deduce the probability of hail than the35 dBZ echo top. The line of regression is shown inFig. 15, and it is important to mention that points withΔH45 equal or greater than 5 km have been discardedfrom the adjustment, since the POH is equal to 1 inthese cases.
Moreover, 6 cases have not been included in thisverification process, although POH was not null but hailwas not observed in any hailpad. Besides, from the new1038 events not included in the contingency tables (173hailpads for 6 cases), a POH45 greater than zero wasdetected in only four of them, and POH45 was nevergreater than 40%. Therefore, this does not suppose an
appreciable increase in false alarms and the previousresults are not affected, except the POH35, where thiseffect would be more important.
4. Summary and conclusions
This paper is focused on a collaborative pilotproject to monitor a rich agricultural area of about200,000 ha in Lleida (Catalonia, NE Spain), oftenaffected by hailfall. This control area has been chosenbecause of the existence of a hailpad network of 173nodes maintained by the ADV of Terres de Ponent.The aim of the project is to characterize hail events,diagnosing them with radiosounding data (launched inLleida specifically during the campaign) and radarobservations, and also with the evaluation of radio-sonde forecasts obtained with the NWP mesoscaleMASS model.
The procedure to evaluate the probability of hail(POH) is based on the Waldvogel et al. (1979) method,as implemented by Holleman (2001). This methodrequires echo top radar information (the maximumheight at which reflectivity is greater than a giventhreshold) and isozero level height (obtained from theNWP model forecast). Two variants of the POHproduct, POH35 and POH45, were calculated usingradar echo tops of 35 and 45 dBZ respectively.
The hailfall observations covered the summer 2004period and the cases examined were not especiallyintense. Preliminary results have been obtained withinstability indices to characterize the hail events.Different instability indices were calculated fromradiosonde data on Lleida, but none of themdiscriminated clearly the occurrence of hail: LI andTT indices yielded best results whereas other indices

334 M. Aran et al. / Atmospheric Research 83 (2007) 315–335
(like BOYDEN or SWEAT) did not provide additionalinformation to discriminate these days.
Additional radiosonde observations from Zaragozaand Barcelona stations have been used to assess therepresentativeness of the Lleida radiosonde. Thisrepresentativeness depends strongly on the synopticsituation. Moreover, taking into account the meanvalues of instability indices, it was found that Barcelonais often more similar to Lleida than Zaragoza, except insome indices such as the s-rH, which considers thevertical structure of the wind in lower levels. Neverthe-less, the data set was relatively small to draw moreconclusive results.
Three case studies have been presented: 12th and14th June and 17th August 2004. Two of them havebeen examined to illustrate the importance of thesynoptic situation to decide which radiosonde observa-tions are more representative of the control area. OnJune 12th, Zaragoza and Lleida were very similar–anddifferent from Barcelona–but only 2 days later, thesituation was the opposite. In the third case, August17th, a squall line, many thunderstorms and hailfallaffected different areas of Catalonia including thecontrol area (9 hailpads were impacted by hail).
Moreover, the Lleida radiosounding data was used toverify the MASS model isozero forecasts showing aslight overestimation of the isozero altitude on days withhail. This bias would produce POH values lower thanthose obtained using the real isozero observations. Onthe other hand, the effect of using 3-h resolution in theisozero forecasts was also analyzed and showed that theRMSE introduced with this temporal resolution was lessthan the error of the model forecast compared to theradiosonde observation at 12 UTC.
Finally, the verification of the method used and a newadjustment of the POHwere studied, both for the POH35and POH45 products. A new adjustment of the formulaused by Holleman (2001) with the observed data showedthat the POH45 product was better than the POH35 andthe occurrence of a hail event (POH equal to 1) waswarranted when the difference between the isozeroheight and the 45 dBZ echo top was greater than 5 km.
The results shown in this study could be enhanced byincluding more hail events from other years and moreobservation sites outside the control area. Furtheranalysis of the radiosonde data should be made, forexample discriminating the thunderstorm days in thecases without hail. However, the first results summa-rized in this paper indicate that the POH product hasproven useful for monitoring the occurrence of hail bymerging the MASS model forecasts and weather radarobservations.
Acknowledgments
The authors would like to thank ADV of Terres dePonent, Meteorological Office in Lleida (INM), Depart-ment of Agriculture, Livestock and Fisheries of theGovernment of Catalonia who made possible to launchthe radiosonde in Lleida. We are very grateful to I.Holleman (KNMI), A. Redaño (University of Barce-lona) and the personnel of Meteocat, especially to N.Pineda, J.R. Miró, A. Atencia and M. Soler for theirvaluable contribution to this study.
References
Atlas, D., Ludlam, F.H., 1961. Multi-wavelength radar reflectivity ofhail storms. Q. J. Royal Meteorol. Soc. 87, 523–534.
Bech, J., Vilaclara, E., Pineda, N., Rigo, T., López, J., O'Hora, F.,Lorente, J., Sempere, D., Fàbregas, F.X., 2004. The weather radarnetwork of the Catalan Meteorological Service: description andapplications. European Conference on Radar in Meteorology andHydrology (ERAD)—COST 717 Final Seminar. ERAD Publica-tion Series, vol 2. Copernicus GmbH (c). ISBN: 3-936586-29-2,pp. 416–420.
Bénech, B., Koffi, E., Druilhet, A., Durand, P., Bessemoulin, P.,Campins, J., Jansa, A., Terliuc, B., 1998. Dynamic characteristicsof regional flows around the Pyrénées in view of the PYREXexperiment: Part I. Analysis of the pressure and wind fields andexperimental assessment of the applicability of the linear theory.J. Appl. Meteorol. 37, 32–52.
Boyden, C.J., 1963. A simple instability index for use as a synopticparameter. Met. Mag. 92.
Codina, B., Sairouni, A., Bech, J., Redaño, A., 1997. OperationalApplication of a nested mesoscale numerical model in Catalonia(Meteo'96 Project). INM/WMO International Symposium ofCyclones and Hazardous Weather in the Mediterranean. ISBN:84-7632-329-8, pp. 657–667.
Collier, C.G., 1996. Applications of Weather Radar Systems. JohnWiley & Sons. 390 pp.
Duhia, J., 1989. Numerical study of convection observed during theWinter Monsoon Experiment using a mesoscale two-dimensionalmodel. J. Atmos. Sci. 46, 3077–3107.
Feral, L., Sauvageot, H., Soula, S., 2003. Hail detection using S and C-band radar reflectivity difference. J. Atmos. Ocean. Technol. 20,233–248.
Grell, G.A., Duhia, J., Stauffer, D.R., 1994. A description of fifth-generation Penn State/NCAR Mesoscale Model (MM5). NCARtechnical Note, NCAR/TN 398+STR, 138 pp. [available fromNational Centre for Atmospheric Research, P.O Box 3000,boulder, CO 80307].
Holleman, I. 2001. Hail detection using single-polarization radar.Scientific report WR-2001-01, Royal Netherlands MeteorologicalInstitute (KNMI).
Holleman, I., Wessels, H.R.A., Onvlee, J.R.A., Barlag, S.J.M., 2000.Development of a Hail-Detection-Product. Phys. Chem. Earth, B25, 1293–1297.
Kaplan, M.L., Zack, J.W., Wong, V.C., Tuccillo, J.J., 1982. A Sixth-Order Mesoscale Atmospheric Simulation System Applicable toResearch and Real-Time Forecasting Problems. In: Sasaki, Y.
335M. Aran et al. / Atmospheric Research 83 (2007) 315–335
(Ed.), Symposium on Mesoscale Meteorology. CIMMS, Norman,OK, pp. 38–84.
Luers, J.K., Eskridge, R.E., 1995. Temperature correction for the VIZand Vaisala radiosondes. J. Appl. Meteorol. 34, 1241–1253.
MESO, Inc., 1995. MASS Reference Manual Version 5.5. MESO,120 pp. Available from MESO, Inc., 185 Jordon Road, Troy, NY12180.
Miller, R.C., 1972. Notes on Analysis of Severe-Storm ForecastingProcedures of the Air Force Global Weather Central. AFGWCTech. Rep. 200 (Rev.), Air Wea. Serv., Scott AFB, IL, 181 pp.
Miloshevich, L.M., Völmel, H., Paukuunen, A., Heymsfield, A.,Oltmans, S., 2001. Characterisation and correction of relativehumidity measurements from Vaisala RS-80A radiosondes at coldtemperatures. J. Atmos. Ocean. Technol. 18, 135–156.
Pascual, R. 2002. Granizo en el llano de Lleida. 11 p. INM. Tempowebtraining module. Freely available at: http://www.inm.es/web/sup/ciencia/divulga/tempoweb/mcr6/index.htm.
Redaño, A., Cruz, J., Lorente, J., 1991. Main features of sea breeze inBarcelona. Meteorol. Atmos. Phys. 46, 175–179.
Salek M., Cheze, J-L., Handwerker, J., Delobbe, L., Uijlenhoet, R.,2004. Radar techniques for identifying precipitation type andestimating quantity of precipitation. COST 717 Publication, EU,51 pp., ISBN 92-898-004-6.
Sánchez, J.L., Fernández, M.V., Fernández, J.T., Tuduri, E., Ramis, C.,2003. Analysis of mesoscale convective systems with hailprecipitation. Atmos. Res. 67–68, 573–588 (July–September).
Segala, S., Sairouni, A., Bech, J., 2002. Hail forecasts with NWPderived instability indices. Abstracts book, 4th Plinius Conferenceon Mediterranean Storms, Mallorca, Spain. European GeophysicalSociety, p. 26.
Seliga, T.A., Aydin, K., Cato, C.P., Bringi, V.N., 1982. Use of thedifferential reflectivity radar technique for observing convectivesystems. In: Agee, E.M., Asai, T. (Eds.), Cloud Dynamics. Reidel,pp. 285–300.
Tudurí, E., Romero, R., López, L., García, E., Sánchez, J.L., Ramis,C., 2003. The 14 July 2001 hailstorm in northeastern Spain:diagnosis of the meteorological situation. Atmos. Res. 67–68,541–558 (July–September 2003).
Vaisala, 1997. RS-80 Radisondes. Technical Information. A571en1997-08. Available at: http://www.vaisala.com.
Waldvogel, A., Federer, B., Grimm, P., 1979. Criteria for Detection ofhail cells. J. Appl. Meteorol. 18, 1521–1525.
Weisman, M.L., Klemp, J.B., 1986. Characteristics of IsolatedConvective Storms. In: Ray, P.S. (Ed.), Mesoscale Meteorologyand Forecasting. Amer. Meteor. Soc, pp. 331–357.
Wilks, D.S., 1995. Statistical Methods in the Atmospheric Sciences.Academic Press. 467 pp.
Zhang, D., Anthes, R.A., 1982. A high-resolution model of theplanetary boundary layer-sensitivity tests and comparisons withSESAME-79 data. J. Appl. Meteorol. 21, 1594–1609.