
Lecture notes for Physics 10154: General Physics I - Texas ...
Upload
khangminh22Category
view
5download
0
PHYSICSPART – II
TEXTBOOK FOR CLASS XII


PHYSICSPART – II
TEXTBOOK FOR CLASS XII

First Edition
March 2007 Chaitra 1928
Reprinted
December 2007 Agrahayana 1929December 2008 Pausa 1930
December 2009 Pausa 1931
January 2011 Pausa 1932
January 2012 Magha 1933
December 2012 Agrahayana 1934November 2013 Kartika 1935
PD 400T RNB
© National Council of Educational
Research and Training, 2007
115.00
Printed on 80 GSM paper with NCERT
watermark
Published at the Publication Division by the
Secretary, National Council of Educational
Research and Training, Sri AurobindoMarg, New Delhi 110 016 and printed at SPA
Printers (P) Ltd. B 17/3, Okhla Industrial
Area, Phase-II, New Delhi 110020
ISBN 81-7450-631-4 (Part I)
ISBN 81-7450-671-3 (Part II)
ALL RIGHTS RESERVED
q No part of this publication may be reproduced, stored in a retrieval system
or transmitted, in any form or by any means, electronic, mechanical,photocopying, recording or otherwise without the prior permission of the
publisher.
q This book is sold subject to the condition that it shall not, by way of trade,be lent, re-sold, hired out or otherwise disposed of without the publisher’s
consent, in any form of binding or cover other than that in which it ispublished.
q The correct price of this publication is the price printed on this page, Any revised
price indicated by a rubber stamp or by a sticker or by any other means is incorrectand should be unacceptable.
OFFICES OF THE PUBLICATION
DIVISION, NCERT
NCERT CampusSri Aurobindo MargNew Delhi 110 016 Phone : 011-26562708
108, 100 Feet RoadHosdakere Halli ExtensionBanashankari III Stage
Bengaluru 560 085 Phone : 080-26725740
Navjivan Trust Building
P.O.NavjivanAhmedabad 380 014 Phone : 079-27541446
CWC Campus
Opp. Dhankal Bus StopPanihatiKolkata 700 114 Phone : 033-25530454
CWC ComplexMaligaon
Guwahati 781 021 Phone : 0361-2674869
Publication Team
Head, Publication : Ashok SrivastavaDivision
Chief Production : Kalyan Banerjee
Officer
Chief Business : Gautam Ganguly
Manager
Chief Editor : Naresh Yadav
(Contractual Service)
Editor : R.N. Bhardwaj
(Contractual Service)
Assistant Production : Atul SaxenaOfficer
Cover, Layout and Illustrations
Shweta Rao
FOREWORD
The National Curriculum Framework (NCF), 2005 recommends that children’s life at school mustbe linked to their life outside the school. This principle marks a departure from the legacy of bookishlearning which continues to shape our system and causes a gap between the school, home andcommunity. The syllabi and textbooks developed on the basis of NCF signify an attempt to implementthis basic idea. They also attempt to discourage rote learning and the maintenance of sharpboundaries between different subject areas. We hope these measures will take us significantlyfurther in the direction of a child-centred system of education outlined in the National Policy onEducation (NPE), 1986.
The success of this effort depends on the steps that school principals and teachers will take toencourage children to reflect on their own learning and to pursue imaginative activities and questions.We must recognise that, given space, time and freedom, children generate new knowledge by engagingwith the information passed on to them by adults. Treating the prescribed textbook as the sole basisof examination is one of the key reasons why other resources and sites of learning are ignored.Inculcating creativity and initiative is possible if we perceive and treat children as participants inlearning, not as receivers of a fixed body of knowledge.
These aims imply considerable change in school routines and mode of functioning. Flexibility inthe daily time-table is as necessary as rigour in implementing the annual calendar so that therequired number of teaching days are actually devoted to teaching. The methods used for teachingand evaluation will also determine how effective this textbook proves for making children’s life atschool a happy experience, rather than a source of stress or boredom. Syllabus designers have triedto address the problem of curricular burden by restructuring and reorienting knowledge at differentstages with greater consideration for child psychology and the time available for teaching. The textbookattempts to enhance this endeavour by giving higher priority and space to opportunities forcontemplation and wondering, discussion in small groups, and activities requiring hands-onexperience.
The National Council of Educational Research and Training (NCERT) appreciates the hardwork done by the textbook development committee responsible for this book. We wish to thank theChairperson of the advisory group in science and mathematics, Professor J.V. Narlikar and theChief Advisor for this book, Professor A.W. Joshi for guiding the work of this committee. Severalteachers contributed to the development of this textbook; we are grateful to their principals formaking this possible. We are indebted to the institutions and organisations which have generouslypermitted us to draw upon their resources, material and personnel. We are especially grateful tothe members of the National Monitoring Committee, appointed by the Department of Secondaryand Higher Education, Ministry of Human Resource Development under the Chairpersonship ofProfessor Mrinal Miri and Professor G.P. Deshpande, for their valuable time and contribution. Asan organisation committed to systemic reform and continuous improvement in the quality of itsproducts, NCERT welcomes comments and suggestions which will enable us to undertake furtherrevision and refinement.
Director
New Delhi National Council of Educational20 November 2006 Research and Training

PREFACE
It gives me pleasure to place this book in the hands of the students, teachers and the
public at large (whose role cannot be overlooked). It is a natural sequel to the Class XI
textbook which was brought out in 2006. This book is also a trimmed version of the
textbooks which existed so far. The chapter on thermal and chemical effects of currenthas been cut out. This topic has also been dropped from the CBSE syllabus. Similarly,
the chapter on communications has been substantially curtailed. It has been rewritten
in an easily comprehensible form.
Although most other chapters have been based on the earlier versions, several parts
and sections in them have been rewritten. The Development Team has been guided bythe feedback received from innumerable teachers across the country.
In producing these books, Class XI as well as Class XII, there has been a basic
change of emphasis. Both the books present physics to students without assuming
that they would pursue this subject beyond the higher secondary level. This new view
has been prompted by the various observations and suggestions made in the NationalCurriculum Framework (NCF), 2005. Similarly, in today’s educational scenario where
students can opt for various combinations of subjects, we cannot assume that a physics
student is also studying mathematics. Therefore, physics has to be presented, so to
say, in a stand-alone form.
As in Class XI textbook, some interesting box items have been inserted in manychapters. They are not meant for teaching or examinations. Their purpose is to catch
the attention of the reader, to show some applications in daily life or in other areas of
science and technology, to suggest a simple experiment, to show connection of concepts
in different areas of physics, and in general, to break the monotony and enliven the
book.Features like Summary, Points to Ponder, Exercises and Additional Exercises at
the end of each chapter, and Examples have been retained. Several concept-basedExercises have been transferred from end-of-chapter Exercises to Examples with
Solutions in the text. It is hoped that this will make the concepts discussed in the
chapter more comprehensible. Several new examples and exercises have been added.Students wishing to pursue physics further would find Points to Ponder and Additional
Exercises very useful and thoughtful. To provide resources beyond the textbook andto encourage eLearning, each chapter has been provided with some relevant website
addresses under the title ePhysics. These sites provide additional materials on specific
topics and also provide learners the opportunites for interactive demonstrations/experiments.
The intricate concepts of physics must be understood, comprehended andappreciated. Students must learn to ask questions like ‘why’, ‘how’, ‘how do we know
it’. They will find almost always that the question ‘why’ has no answer within the domainof physics and science in general. But that itself is a learning experience, is it not? On
the other hand, the question ‘how’ has been reasonably well answered by physicists inthe case of most natural phenomena. In fact, with the understanding of how things
happen, it has been possible to make use of many phenomena to create technologicalapplications for the use of humans.
For example, consider statements in a book, like ‘A negatively charged electron isattracted by the positively charged plate’, or ‘In this experiment, light (or electron)
behaves like a wave’. You will realise that it is not possible to answer ‘why’. This questionbelongs to the domain of philosophy or metaphysics. But we can answer ‘how’, we can
find the force acting, we can find the wavelength of the photon (or electron), we can
determine how things behave under different conditions, and we can develop instruments
which will use these phenomena to our advantage.
It has been a pleasure to work for these books at the higher secondary level, alongwith a team of members. The Textbook Development Team, the Review Team and Editing
Teams involved college and university teachers, teachers from Indian Institutes of
Technology, scientists from national institutes and laboratories, as well as higher
secondary teachers. The feedback and critical look provided by higher secondary
teachers in the various teams are highly laudable. Most box items were generated bymembers of one or the other team, but three of them were generated by friends and
well-wishers not part of any team. We are thankful to Dr P.N. Sen of Pune, Professor
Roopmanjari Ghosh of Delhi and Dr Rajesh B Khaparde of Mumbai for allowing us to
use their box items, respectively in Chapters 3, 4 (Part I) and 9 (Part II). We are very
thankful to the members of the Review and Editing Workshops to discuss and refinethe first draft of the textbook. We also express our gratitude to Prof. Krishna Kumar,
Director, NCERT, for entrusting us with the task of presenting this textbook as a part of
the national effort for improving science education. I also thank Prof. G. Ravindra, Joint
Director, NCERT, for his help from time-to-time. Prof. Hukum Singh, Head, Department
of Education in Science and Mathematics, NCER T, was always willing to help us in ourendeavour in every possible way.
We welcome suggestions and comments from our valued users, especially students
and teachers. We wish our young readers a happy journey into the exciting realm of
physics.
A. W. JOSHI
Chief AdvisorTextbook Development Committee
viii
TEXTBOOK DEVELOPMENT COMMITTEE
CHAIRPERSON, ADVISORY COMMITTEE FOR TEXTBOOKS IN SCIENCE AND MATHEMATICS
J.V. Narlikar, Emeritus Professor, Inter-University Centre for Astronomy and Astrophysics
(IUCAA), Ganeshkhind, Pune University Campus, Pune
CHIEF ADVISOR
A.W. Joshi, Honorary Visiting Scientist, National Centre for Radio Astrophysics (NCRA), Pune
University Campus, Pune (Formerly Professor at Department of Physics, University of Pune)
MEMBERS
A.K. Ghatak, Emeritus Professor, Department of Physics, Indian Institute of Technology,
New Delhi
Alika Khare, Professor, Department of Physics, Indian Institute of Technology, Guwahati
Anjali Kshirsagar, Reader, Department of Physics, University of Pune, Pune
Anuradha Mathur, PGT , Modern School, Vasant Vihar, New Delhi
Atul Mody, Lecturer (S.G.), VES College of Arts, Science and Commerce, Mumbai
B.K. Sharma, Professor, DESM, NCERT, New Delhi
Chitra Goel, PGT, Rajkiya Pratibha Vikas Vidyalaya, Tyagraj Nagar, New Delhi
Gagan Gupta, Reader, DESM, NCERT, New Delhi
H.C. Pradhan, Professor, Homi Bhabha Centre of Science Education (TIFR), Mumbai
N. Panchapakesan, Professor (Retd.), Department of Physics and Astrophysics, University of
Delhi, Delhi
R. Joshi, Lecturer (S.G.), DESM, NCERT, New Delhi
S.K. Dash, Reader, DESM, NCERT, New Delhi
S. Rai Choudhary, Professor, Department of Physics and Astrophysics, University of Delhi, Delhi
S.K. Upadhyay, PGT, Jawahar Navodaya Vidyalaya, Muzaffar Nagar
S.N. Prabhakara, PGT, DM School, Regional Institute of Education (NCERT), Mysore
V.H. Raybagkar, Reader, Nowrosjee Wadia College, Pune
Vishwajeet Kulkarni, Teacher (Grade I ), Higher Secondary Section, Smt. Parvatibai Chowgule
College, Margao, Goa
MEMBER-COORDINATOR
V.P. Srivastava, Reader, DESM, NCERT, New Delhi

ACKNOWLEDGEMENTS
The National Council of Educational Research and Training acknowledges the valuable
contribution of the individuals and organisations involved in the development of Physics Textbookfor Class XII. The Council also acknowledges the valuable contribution of the following academics
for reviewing and refining the manuscripts of this book:
Anu Venugopalan, Lecturer, School of Basic and Applied Sciences, GGSIP University, Delhi;A.K. Das, PGT, St. Xavier’s Senior Secondary School, Delhi; Bharati Kukkal, PGT, Kendriya
Vidyalaya, Pushp Vihar, New Delhi; D.A. Desai, Lecturer (Retd.), Ruparel College, Mumbai;Devendra Kumar, PGT, Rajkiya Pratibha Vikas Vidyalaya, Yamuna Vihar, Delhi; I.K. Gogia, PGT,
Kendriya Vidyalaya, Gole Market, New Delhi; K.C. Sharma, Reader, Regional Institute of Education
(NCERT), Ajmer; M.K. Nandy, Associate Professor, Department of Physics, Indian Institute ofTechnology, Guwahati; M.N. Bapat, Reader, Regional Institute of Education (NCERT), Mysore;
R. Bhattacharjee, Asstt. Professor, Department of Electronics and Communication Engineering,Indian Institute of Technology, Guwahati; R.S. Das, Vice-Principal (Retd.), Balwant Ray Mehta
Senior Secondary School, Lajpat Nagar, New Delhi; Sangeeta D. Gadre, Reader, Kirori Mal College,
Delhi; Suresh Kumar, PGT, Delhi Public School, Dwarka, New Delhi; Sushma Jaireth, Reader,Department of Women’s Studies, NCERT, New Delhi; Shyama Rath, Reader, Department of Physics
and Astrophysics, University of Delhi, Delhi; Yashu Kumar, PGT, Kulachi Hans Raj Model School,Ashok Vihar, Delhi.
The Council also gratefully acknowledges the valuable contribution of the following academics
for the editing and finalisation of this book: B.B. Tripathi, Professor (Retd.), Department of Physics,Indian Institute of Technology, New Delhi; Dipan K. Ghosh, Professor, Department of Physics,
Indian Institute of Technology, Mumbai; Dipanjan Mitra, Scientist, National Centre for RadioAstrophysics (TIFR), Pune; G.K. Mehta, Raja Ramanna Fellow, Inter -University Accelerator
Centre, New Delhi; G.S. Visweswaran, Professor, Department of Electrical Engineering, Indian
Institute of Technology, New Delhi; H.C. Kandpal, Head, Optical Radiation Standards, NationalPhysical Laboratory, New Delhi; H.S. Mani, Raja Ramanna Fellow, Institute of Mathematical
Sciences, Chennai; K. Thyagarajan, Professor, Department of Physics, Indian Institute ofTechnology, New Delhi; P.C. Vinod Kumar, Professor, Department of Physics, Sardar Patel
University, Vallabh Vidyanagar, Gujarat; S. Annapoorni, Professor, Department of Physics and
Astrophysics, University of Delhi, Delhi; S.C. Dutta Roy, Emeritus Professor, Department ofElectrical Engineering, Indian Institute of Technology, New Delhi; S.D. Joglekar, Professor,
Department of Physics, Indian Institute of Technology, Kanpur; V. Sundara Raja, Professor, SriVenkateswara University, Tirupati.
Special thanks are due to Hukum Singh, Professor and Head, DESM, NCERT for his support.
The Council also acknowledges the support provided by the APC office and the administrativestaff of the DESM; Deepak Kapoor, Incharge, Computer Station; Inder Kumar, DTP Operator;
Mohd. Qamar Tabrez, Copy Editor ; Rishi Pal Singh, Sr. Proof Reader, NCERT andAshima Srivastava, Proof Reader in shaping this book.
The contributions of the Publication Department in bringing out this book are also duly
acknowledged.
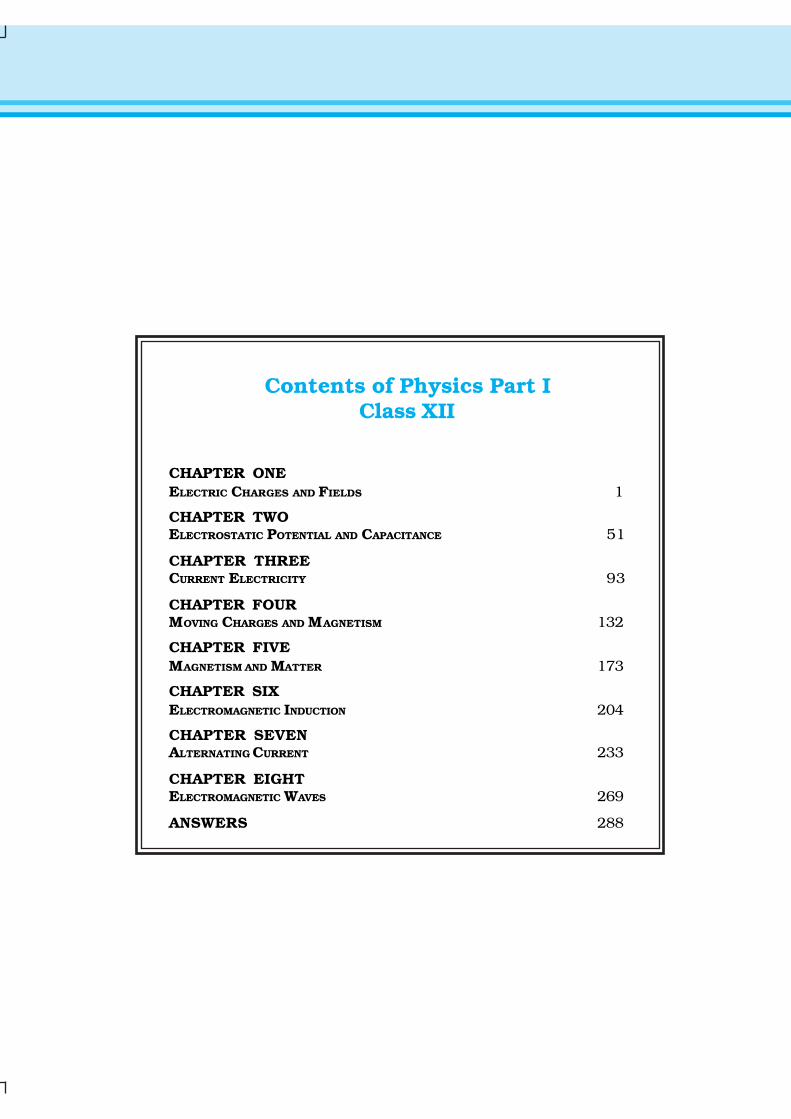
Contents of Physics Part IClass XII
CHAPTER ONE
ELECTRIC CHARGES AND FIELDS 1
CHAPTER TWOELECTROSTATIC POTENTIAL AND CAPACITANCE 51
CHAPTER THREECURRENT ELECTRICITY 93
CHAPTER FOURMOVING CHARGES AND MAGNETISM 132
CHAPTER FIVE
MAGNETISM AND MATTER 173
CHAPTER SIX
ELECTROMAGNETIC INDUCTION 204
CHAPTER SEVENALTERNATING CURRENT 233
CHAPTER EIGHTELECTROMAGNETIC WAVES 269
ANSWERS 288
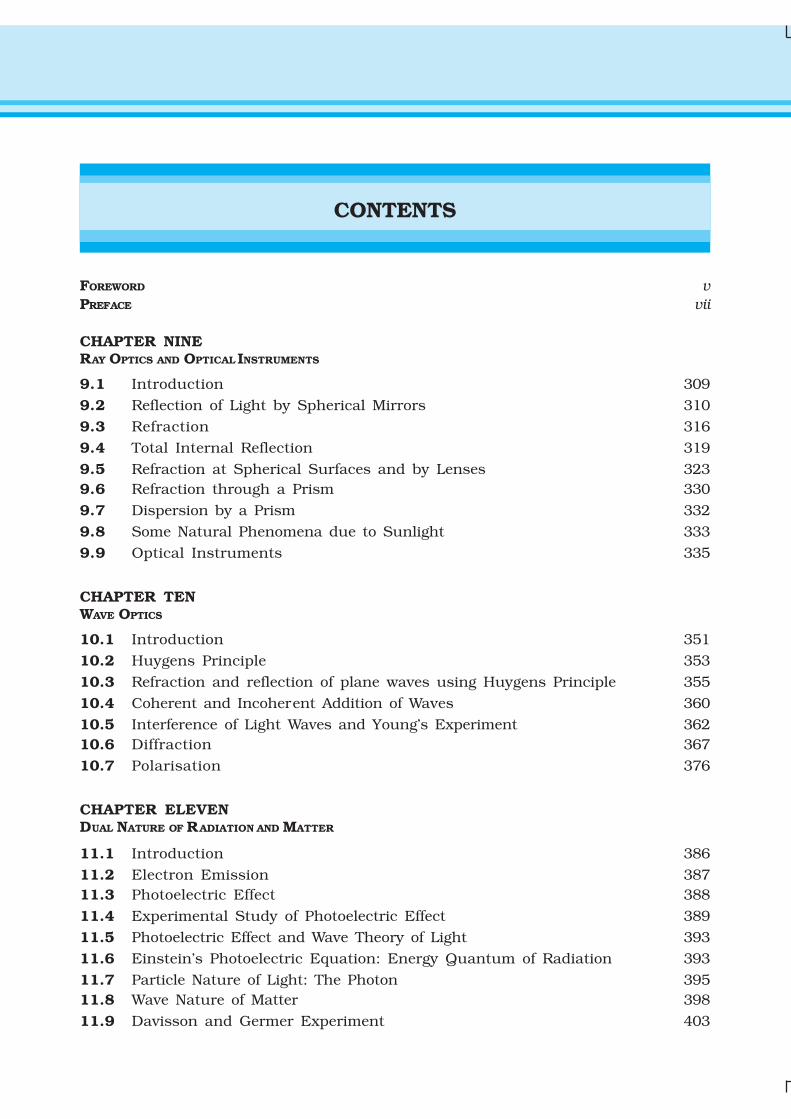
CONTENTS
FOREWORD v
PREFACE vii
CHAPTER NINERAY OPTICS AND OPTICAL INSTRUMENTS
9.1 Introduction 309
9.2 Reflection of Light by Spherical Mirrors 310
9.3 Refraction 316
9.4 Total Internal Reflection 319
9.5 Refraction at Spherical Surfaces and by Lenses 323
9.6 Refraction through a Prism 330
9.7 Dispersion by a Prism 332
9.8 Some Natural Phenomena due to Sunlight 333
9.9 Optical Instruments 335
CHAPTER TENWAVE OPTICS
10.1 Introduction 351
10.2 Huygens Principle 353
10.3 Refraction and reflection of plane waves using Huygens Principle 355
10.4 Coherent and Incoherent Addition of Waves 360
10.5 Interference of Light Waves and Young’s Experiment 362
10.6 Diffraction 367
10.7 Polarisation 376
CHAPTER ELEVENDUAL NATURE OF RADIATION AND MATTER
11.1 Introduction 386
11.2 Electron Emission 387
11.3 Photoelectric Effect 388
11.4 Experimental Study of Photoelectric Effect 389
11.5 Photoelectric Effect and Wave Theory of Light 393
11.6 Einstein’s Photoelectric Equation: Energy Quantum of Radiation 393
11.7 Particle Nature of Light: The Photon 395
11.8 Wave Nature of Matter 398
11.9 Davisson and Germer Experiment 403
CHAPTER TWELVEATOMS
12.1 Introduction 414
12.2 Alpha-particle Scattering and Rutherford’s Nuclear Model of Atom 415
12.3 Atomic Spectra 420
12.4 Bohr Model of the Hydrogen Atom 422
12.5 The Line Spectra of the Hydrogen Atom 428
12.6 DE Broglie’s Explanation of Bohr’s Second Postulate of Quantisation 430
CHAPTER THIRTEENNUCLEI
13.1 Introduction 438
13.2 Atomic Masses and Composition of Nucleus 438
13.3 Size of the Nucleus 441
13.4 Mass-Energy and Nuclear Binding Energy 442
13.5 Nuclear Force 445
13.6 Radioactivity 446
13.7 Nuclear Energy 451
CHAPTER FOURTEENSEMICONDUCTOR ELECTRONICS: MATERIALS, DEVICES AND SIMPLE CIRCUITS
14.1 Introduction 467
14.2 Classification of Metals, Conductors and Semiconductors 468
14.3 Intrinsic Semiconductor 472
14.4 Extrinsic Semiconductor 474
14.5 p-n Junction 478
14.6 Semiconductor diode 479
14.7 Application of Junction Diode as a Rectifier 483
14.8 Special Purpose p-n Junction Diodes 485
14.9 Junction Transistor 490
14.10 Digital Electronics and Logic Gates 501
14.11 Integrated Circuits 505
CHAPTER FIFTEENCOMMUNICATION SYSTEMS
15.1 Introduction 513
15.2 Elements of a Communication System 513
15.3 Basic Terminology Used in Electronic Communication Systems 515
15.4 Bandwidth of Signals 517
15.5 Bandwidth of Transmission Medium 518
15.6 Propagation of Electromagnetic Waves 519
xiv

15.7 Modulation and its Necessity 522
15.8 Amplitude Modulation 524
15.9 Production of Amplitude Modulated Wave 525
15.10 Detection of Amplitude Modulated Wave 526
ADDITIONAL INFORMATION 528
APPENDICES 532
ANSWERS 534
BIBLIOGRAPHY 552
INDEX 554
xv
COVER DESIGN
(Adapted from http://nobelprize.org andthe Nobel Prize in Physics 2006)
Different stages in the evolution ofthe universe.
BACK COVER
(Adapted from http://www.iter.org and
http://www.dae.gov.in)
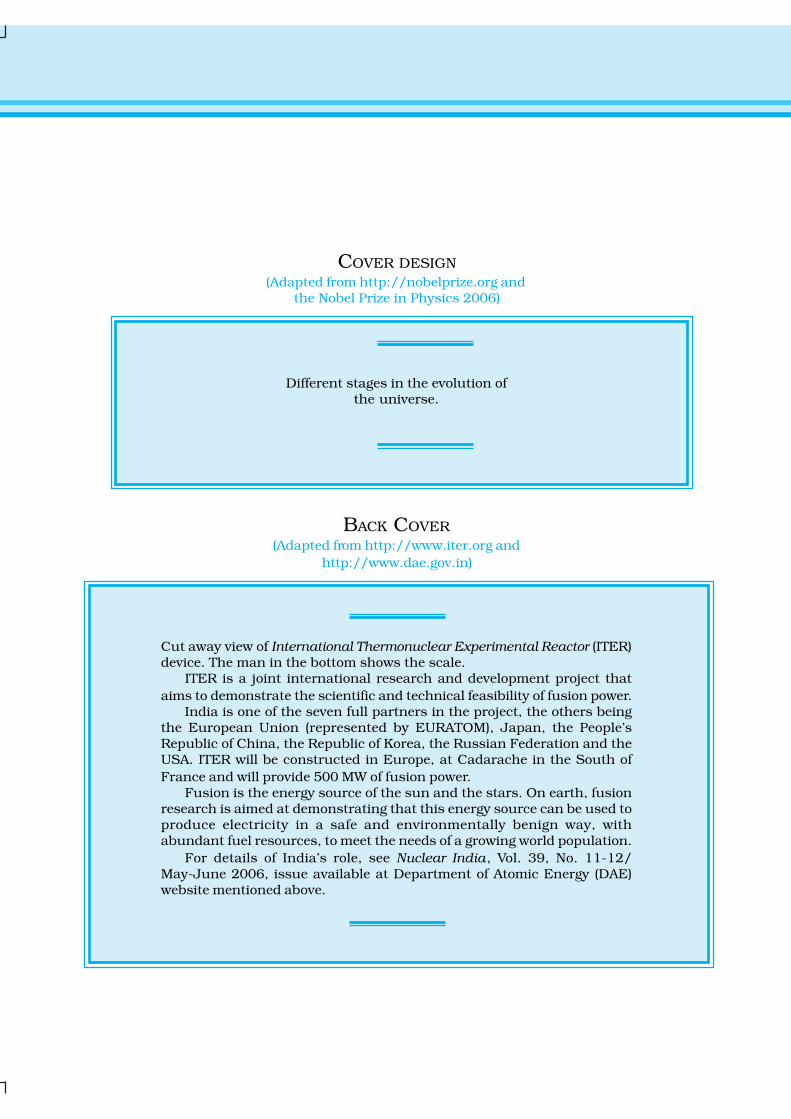
Cut away view of International Thermonuclear Experimental Reactor (ITER)device. The man in the bottom shows the scale.
ITER is a joint international research and development project that
aims to demonstrate the scientific and technical feasibility of fusion power.India is one of the seven full partners in the project, the others being
the European Union (represented by EURATOM), Japan, the People’sRepublic of China, the Republic of Korea, the Russian Federation and theUSA. ITER will be constructed in Europe, at Cadarache in the South of
France and will provide 500 MW of fusion power.Fusion is the energy source of the sun and the stars. On earth, fusion
research is aimed at demonstrating that this energy source can be used toproduce electricity in a safe and environmentally benign way, withabundant fuel resources, to meet the needs of a growing world population.
For details of India’s role, see Nuclear India , Vol. 39, No. 11-12/May-June 2006, issue available at Department of Atomic Energy (DAE)website mentioned above.

First Edition
March 2007 Chaitra 1928
Reprinted
December 2007 Agrahayana 1929December 2008 Pausa 1930
December 2009 Pausa 1931
January 2011 Pausa 1932
January 2012 Magha 1933
December 2012 Agrahayana 1934November 2013 Kartika 1935
PD 400T RNB
© National Council of Educational
Research and Training, 2007
115.00
Printed on 80 GSM paper with NCERT
watermark
Published at the Publication Division by the
Secretary, National Council of Educational
Research and Training, Sri AurobindoMarg, New Delhi 110 016 and printed at
Chaar Dishayen Printers, G-39 to 41,
Sector-3, Noida 201 301 (UP)
ISBN 81-7450-631-4 (Part I)
ISBN 81-7450-671-3 (Part II)
ALL RIGHTS RESERVED
q No part of this publication may be reproduced, stored in a retrieval system
or transmitted, in any form or by any means, electronic, mechanical,photocopying, recording or otherwise without the prior permission of the
publisher.
q This book is sold subject to the condition that it shall not, by way of trade,be lent, re-sold, hired out or otherwise disposed of without the publisher’s
consent, in any form of binding or cover other than that in which it ispublished.
q The correct price of this publication is the price printed on this page, Any revised
price indicated by a rubber stamp or by a sticker or by any other means is incorrectand should be unacceptable.
OFFICES OF THE PUBLICATION
DIVISION, NCERT
NCERT CampusSri Aurobindo MargNew Delhi 110 016 Phone : 011-26562708
108, 100 Feet RoadHosdakere Halli ExtensionBanashankari III Stage
Bengaluru 560 085 Phone : 080-26725740
Navjivan Trust Building
P.O.NavjivanAhmedabad 380 014 Phone : 079-27541446
CWC Campus
Opp. Dhankal Bus StopPanihatiKolkata 700 114 Phone : 033-25530454
CWC ComplexMaligaon
Guwahati 781 021 Phone : 0361-2674869
Publication Team
Head, Publication : Ashok SrivastavaDivision
Chief Production : Kalyan Banerjee
Officer
Chief Business : Gautam Ganguly
Manager
Chief Editor : Naresh Yadav
(Contractual Service)
Editor : R.N. Bhardwaj
(Contractual Service)
Assistant Production : Atul SaxenaOfficer
Cover, Layout and Illustrations
Shweta Rao

Chapter Nine
RAY OPTICSAND OPTICALINSTRUMENTS
9.1 INTRODUCTION
Nature has endowed the human eye (retina) with the sensitivity to detectelectromagnetic waves within a small range of the electromagneticspectrum. Electromagnetic radiation belonging to this region of thespectrum (wavelength of about 400 nm to 750 nm) is called light. It ismainly through light and the sense of vision that we know and interpretthe world around us.
There are two things that we can intuitively mention about light fromcommon experience. First, that it travels with enormous speed and second,that it travels in a straight line. It took some time for people to realise thatthe speed of light is finite and measurable. Its presently accepted valuein vacuum is c = 2.99792458 × 10⁸ m s–1. For many purposes, it sufficesto take c = 3 × 10⁸ m s–1. The speed of light in vacuum is the highestspeed attainable in nature.
The intuitive notion that light travels in a straight line seems tocontradict what we have learnt in Chapter 8, that light is anelectromagnetic wave of wavelength belonging to the visible part of thespectrum. How to reconcile the two facts? The answer is that thewavelength of light is very small compared to the size of ordinary objectsthat we encounter commonly (generally of the order of a few cm or larger).In this situation, as you will learn in Chapter 10, a light wave can beconsidered to travel from one point to another, along a straight line joining
Physics
310
them. The path is called a ray of light, and a bundle of such raysconstitutes a beam of light.
In this chapter, we consider the phenomena of reflection, refractionand dispersion of light, using the ray picture of light. Using the basiclaws of reflection and refraction, we shall study the image formation byplane and spherical reflecting and refracting surfaces. We then go on todescribe the construction and working of some important opticalinstruments, including the human eye.
PARTICLE MODEL OF LIGHT
Newton’s fundamental contributions to mathematics, mechanics, and gravitation often blindus to his deep experimental and theoretical study of light. He made pioneering contributionsin the field of optics. He further developed the corpuscular model of light proposed byDescartes. It presumes that light energy is concentrated in tiny particles called corpuscles.He further assumed that corpuscles of light were massless elastic particles. With hisunderstanding of mechanics, he could come up with a simple model of reflection andrefraction. It is a common observation that a ball bouncing from a smooth plane surfaceobeys the laws of reflection. When this is an elastic collision, the magnitude of the velocityremains the same. As the surface is smooth, there is no force acting parallel to the surface,so the component of momentum in this direction also remains the same. Only the componentperpendicular to the surface, i.e., the normal component of the momentum, gets reversedin reflection. Newton argued that smooth surfaces like mirrors reflect the corpuscles in asimilar manner.
In order to explain the phenomena of refraction, Newton postulated that the speed ofthe corpuscles was greater in water or glass than in air. However, later on it was discoveredthat the speed of light is less in water or glass than in air.
In the field of optics, Newton – the experimenter, was greater than Newton – the theorist.He himself observed many phenomena, which were difficult to understand in terms ofparticle nature of light. For example, the colours observed due to a thin film of oil on water.Property of partial reflection of light is yet another such example. Everyone who has lookedinto the water in a pond sees image of the face in it, but also sees the bottom of the pond.Newton argued that some of the corpuscles, which fall on the water, get reflected and someget transmitted. But what property could distinguish these two kinds of corpuscles? Newtonhad to postulate some kind of unpredictable, chance phenomenon, which decided whetheran individual corpuscle would be reflected or not. In explaining other phenomena, however,the corpuscles were presumed to behave as if they are identical. Such a dilemma does notoccur in the wave picture of light. An incoming wave can be divided into two weaker wavesat the boundary between air and water.
9.2 REFLECTION OF LIGHT BY SPHERICAL MIRRORS
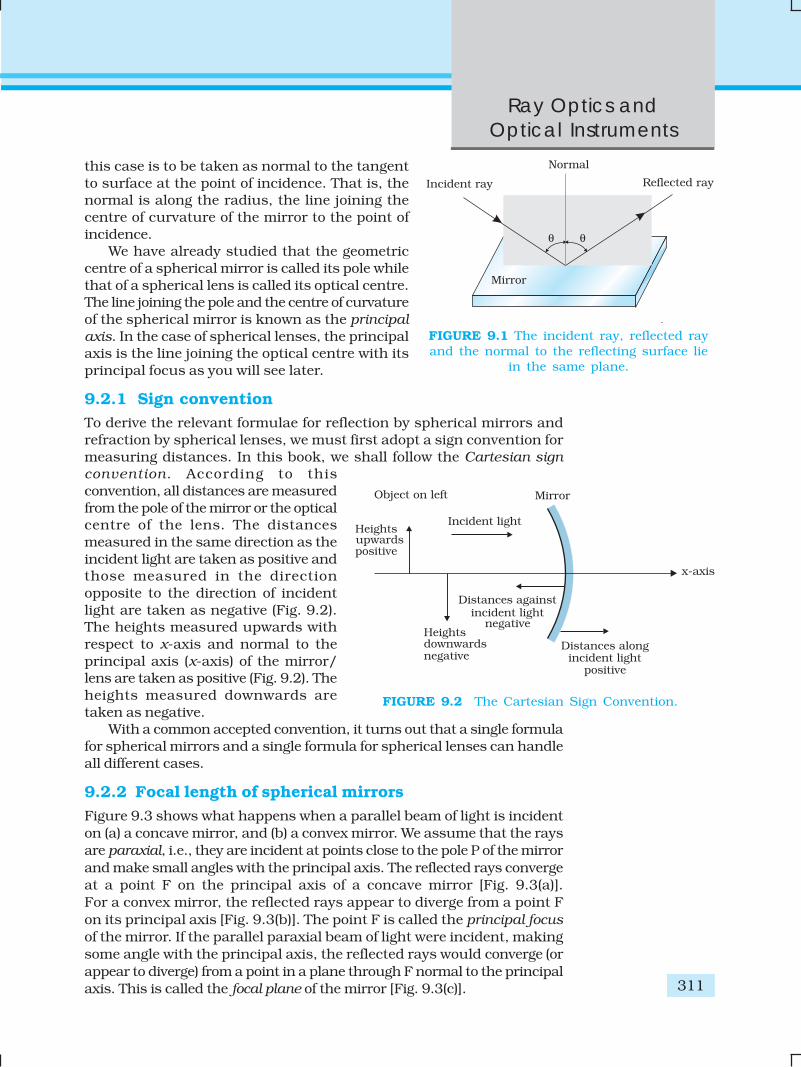
We are familiar with the laws of reflection. The angle of reflection (i.e., theangle between reflected ray and the normal to the reflecting surface orthe mirror) equals the angle of incidence (angle between incident ray andthe normal). Also that the incident ray, reflected ray and the normal tothe reflecting surface at the point of incidence lie in the same plane(Fig. 9.1). These laws are valid at each point on any reflecting surfacewhether plane or curved. However, we shall restrict our discussion to thespecial case of curved surfaces, that is, spherical surfaces. The normal in
Ray Optics andOptical Instruments
311
this case is to be taken as normal to the tangentto surface at the point of incidence. That is, thenormal is along the radius, the line joining thecentre of curvature of the mirror to the point ofincidence.
We have already studied that the geometriccentre of a spherical mirror is called its pole whilethat of a spherical lens is called its optical centre.The line joining the pole and the centre of curvatureof the spherical mirror is known as the principalaxis. In the case of spherical lenses, the principalaxis is the line joining the optical centre with itsprincipal focus as you will see later.
9.2.1 Sign conventionTo derive the relevant formulae for reflection by spherical mirrors andrefraction by spherical lenses, we must first adopt a sign convention formeasuring distances. In this book, we shall follow the Cartesian signconvention. According to thisconvention, all distances are measuredfrom the pole of the mirror or the opticalcentre of the lens. The distancesmeasured in the same direction as theincident light are taken as positive andthose measured in the directionopposite to the direction of incidentlight are taken as negative (Fig. 9.2).The heights measured upwards withrespect to x-axis and normal to theprincipal axis (x-axis) of the mirror/lens are taken as positive (Fig. 9.2). Theheights measured downwards aretaken as negative.
With a common accepted convention, it turns out that a single formulafor spherical mirrors and a single formula for spherical lenses can handleall different cases.
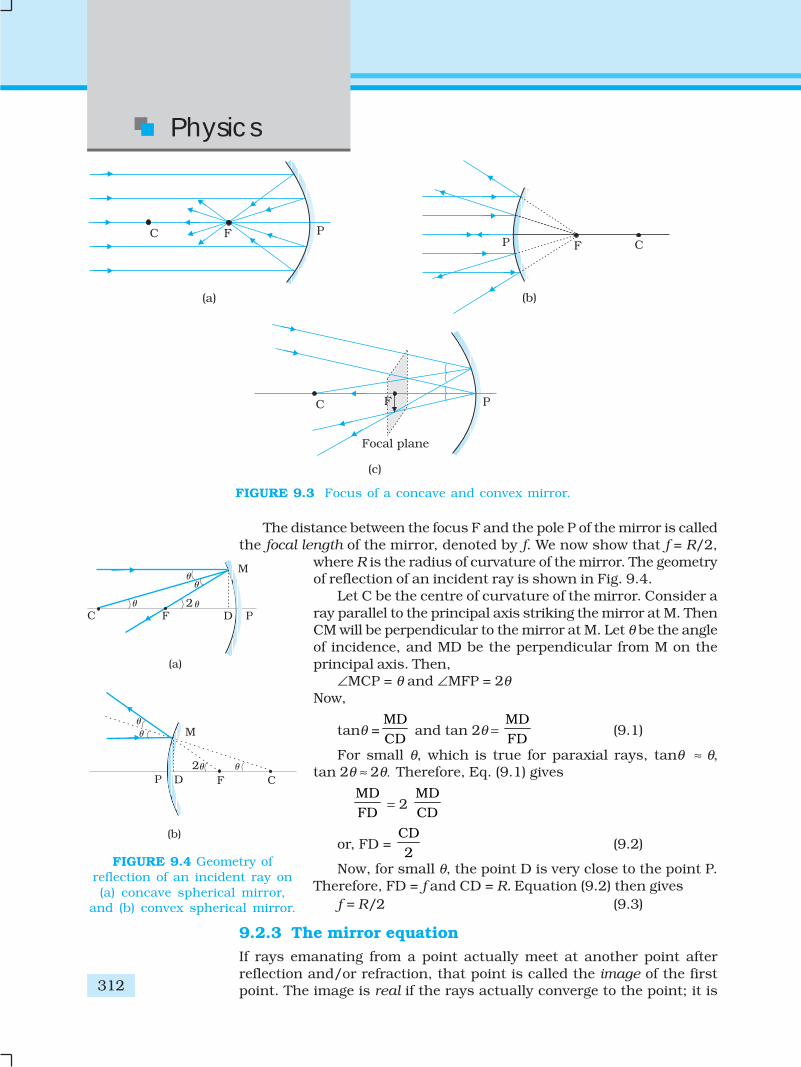
9.2.2 Focal length of spherical mirrorsFigure 9.3 shows what happens when a parallel beam of light is incidenton (a) a concave mirror, and (b) a convex mirror. We assume that the raysare paraxial, i.e., they are incident at points close to the pole P of the mirrorand make small angles with the principal axis. The reflected rays convergeat a point F on the principal axis of a concave mirror [Fig. 9.3(a)].For a convex mirror, the reflected rays appear to diverge from a point Fon its principal axis [Fig. 9.3(b)]. The point F is called the principal focusof the mirror. If the parallel paraxial beam of light were incident, makingsome angle with the principal axis, the reflected rays would converge (orappear to diverge) from a point in a plane through F normal to the principalaxis. This is called the focal plane of the mirror [Fig. 9.3(c)].
FIGURE 9.1 The incident ray, reflected rayand the normal to the reflecting surface lie
in the same plane.
FIGURE 9.2 The Cartesian Sign Convention.
Physics
312
The distance between the focus F and the pole P of the mirror is calledthe focal length of the mirror, denoted by f. We now show that f = R/2,
where R is the radius of curvature of the mirror. The geometryof reflection of an incident ray is shown in Fig. 9.4.
Let C be the centre of curvature of the mirror. Consider aray parallel to the principal axis striking the mirror at M. ThenCM will be perpendicular to the mirror at M. Let θ be the angleof incidence, and MD be the perpendicular from M on theprincipal axis. Then,
∠MCP = θ and ∠MFP = 2θNow,
tanθ =MDCD
and tan 2θ = MDFD
(9.1)
For small θ, which is true for paraxial rays, tanθ ≈ θ,tan 2θ ≈ 2θ. Therefore, Eq. (9.1) gives
MDFD
= 2 MDCD
or, FD = CD2
(9.2)
Now, for small θ, the point D is very close to the point P.Therefore, FD = f and CD = R. Equation (9.2) then gives
f = R/2 (9.3)
9.2.3 The mirror equationIf rays emanating from a point actually meet at another point afterreflection and/or refraction, that point is called the image of the firstpoint. The image is real if the rays actually converge to the point; it is
FIGURE 9.3 Focus of a concave and convex mirror.
FIGURE 9.4 Geometry ofreflection of an incident ray on(a) concave spherical mirror,
and (b) convex spherical mirror.
Ray Optics andOptical Instruments
313
virtual if the rays do not actually meet but appearto diverge from the point when producedbackwards. An image is thus a point-to-pointcorrespondence with the object establishedthrough reflection and/or refraction.
In principle, we can take any two raysemanating from a point on an object, trace theirpaths, find their point of intersection and thus,obtain the image of the point due to reflection at aspherical mirror. In practice, however, it isconvenient to choose any two of the following rays:(i) The ray from the point which is parallel to the
principal axis. The reflected ray goes throughthe focus of the mirror.
(ii) The ray passing through the centre ofcurvature of a concave mirror or appearing to pass through it for aconvex mirror. The reflected ray simply retraces the path.
(iii) The ray passing through (or directed towards) the focus of the concavemirror or appearing to pass through (or directed towards) the focusof a convex mirror. The reflected ray is parallel to the principal axis.
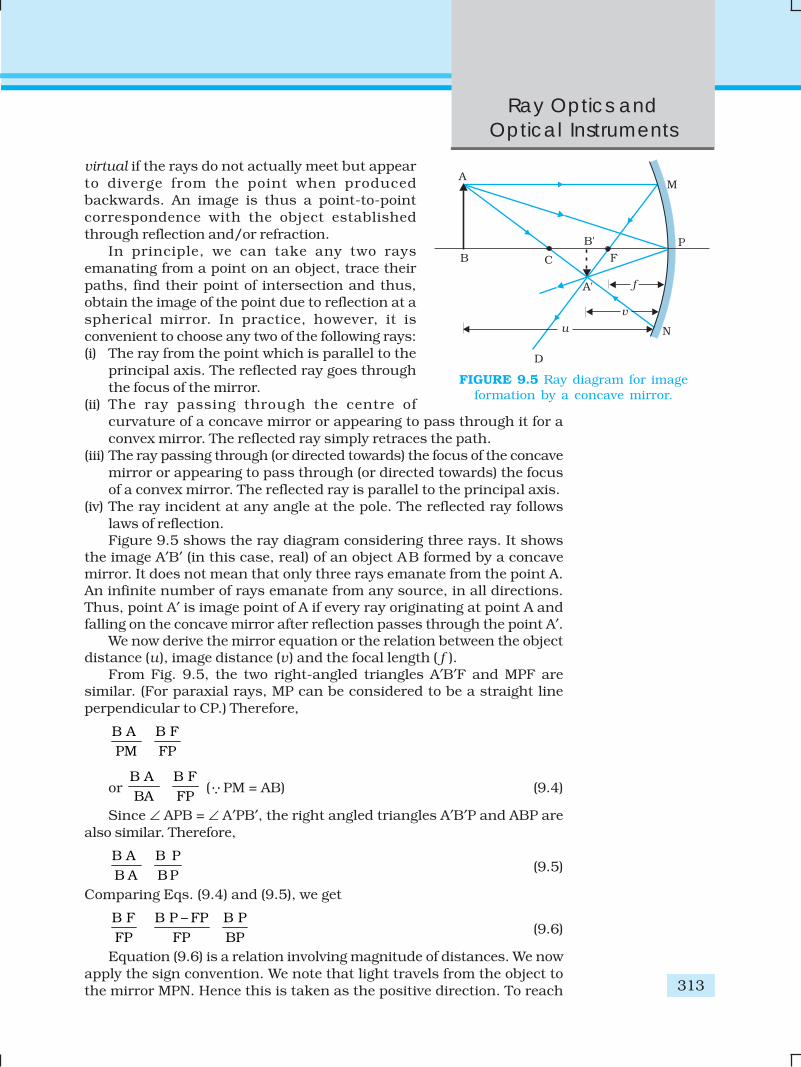
(iv) The ray incident at any angle at the pole. The reflected ray followslaws of reflection.Figure 9.5 shows the ray diagram considering three rays. It shows
the image A′B′ (in this case, real) of an object AB formed by a concavemirror. It does not mean that only three rays emanate from the point A.An infinite number of rays emanate from any source, in all directions.Thus, point A′ is image point of A if every ray originating at point A andfalling on the concave mirror after reflection passes through the point A′.
We now derive the mirror equation or the relation between the objectdistance (u), image distance (v) and the focal length ( f ).
From Fig. 9.5, the two right-angled triangles A′B′F and MPF aresimilar. (For paraxial rays, MP can be considered to be a straight lineperpendicular to CP.) Therefore,
B A B FPM FP
or B A B FBA FP (PM = AB) (9.4)
Since ∠ APB = ∠ A′PB′, the right angled triangles A′B′P and ABP arealso similar. Therefore,
B A B PB A B P
(9.5)
Comparing Eqs. (9.4) and (9.5), we get
B P – FPB F B PFP FP BP
(9.6)
Equation (9.6) is a relation involving magnitude of distances. We nowapply the sign convention. We note that light travels from the object tothe mirror MPN. Hence this is taken as the positive direction. To reach
FIGURE 9.5 Ray diagram for imageformation by a concave mirror.
Physics
314
the object AB, image A′B′ as well as the focus F from the pole P, we haveto travel opposite to the direction of incident light. Hence, all the threewill have negative signs. Thus,
B′ P = –v, FP = –f, BP = –uUsing these in Eq. (9.6), we get
– ––v f v
f u
–
or–v f v
f u
1 1 1v u f
(9.7)
This relation is known as the mirror equation.The size of the image relative to the size of the object is another
important quantity to consider. We define linear magnification (m ) as theratio of the height of the image (h′) to the height of the object (h):
m = h
h
(9.8)
h and h′ will be taken positive or negative in accordance with the acceptedsign convention. In triangles A′B′P and ABP, we have,
B A B PBA BP
With the sign convention, this becomes
– –h v
h u
–so that
m = –h v
h u
(9.9)
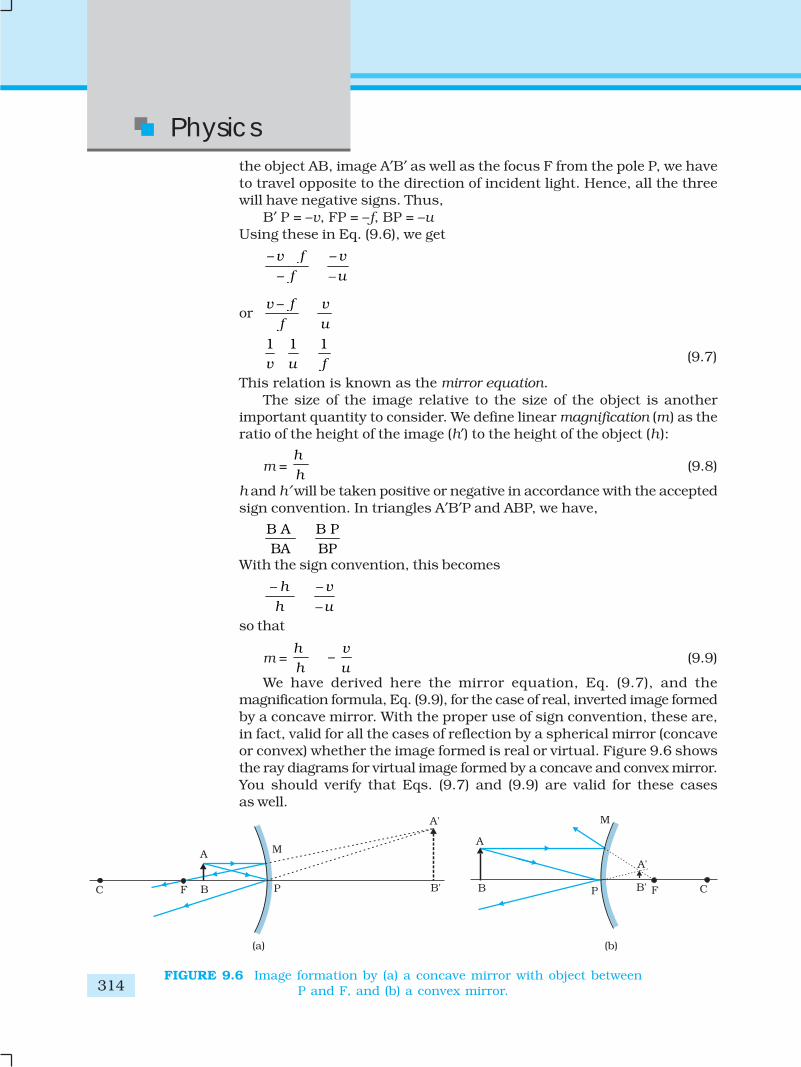
We have derived here the mirror equation, Eq. (9.7), and themagnification formula, Eq. (9.9), for the case of real, inverted image formedby a concave mirror. With the proper use of sign convention, these are,in fact, valid for all the cases of reflection by a spherical mirror (concaveor convex) whether the image formed is real or virtual. Figure 9.6 showsthe ray diagrams for virtual image formed by a concave and convex mirror.You should verify that Eqs. (9.7) and (9.9) are valid for these casesas well.
FIGURE 9.6 Image formation by (a) a concave mirror with object betweenP and F, and (b) a convex mirror.
Ray Optics andOptical Instruments
315
EX
AM
PLE 9
.3 E
XA
MPLE 9
.2 E
XA
MPLE 9
.1
Example 9.1 Suppose that the lower half of the concave mirror’sreflecting surface in Fig. 9.5 is covered with an opaque (non-reflective)material. What effect will this have on the image of an object placedin front of the mirror?
Solution You may think that the image will now show only half of theobject, but taking the laws of reflection to be true for all points of theremaining part of the mirror, the image will be that of the whole object.However, as the area of the reflecting surface has been reduced, theintensity of the image will be low (in this case, half).
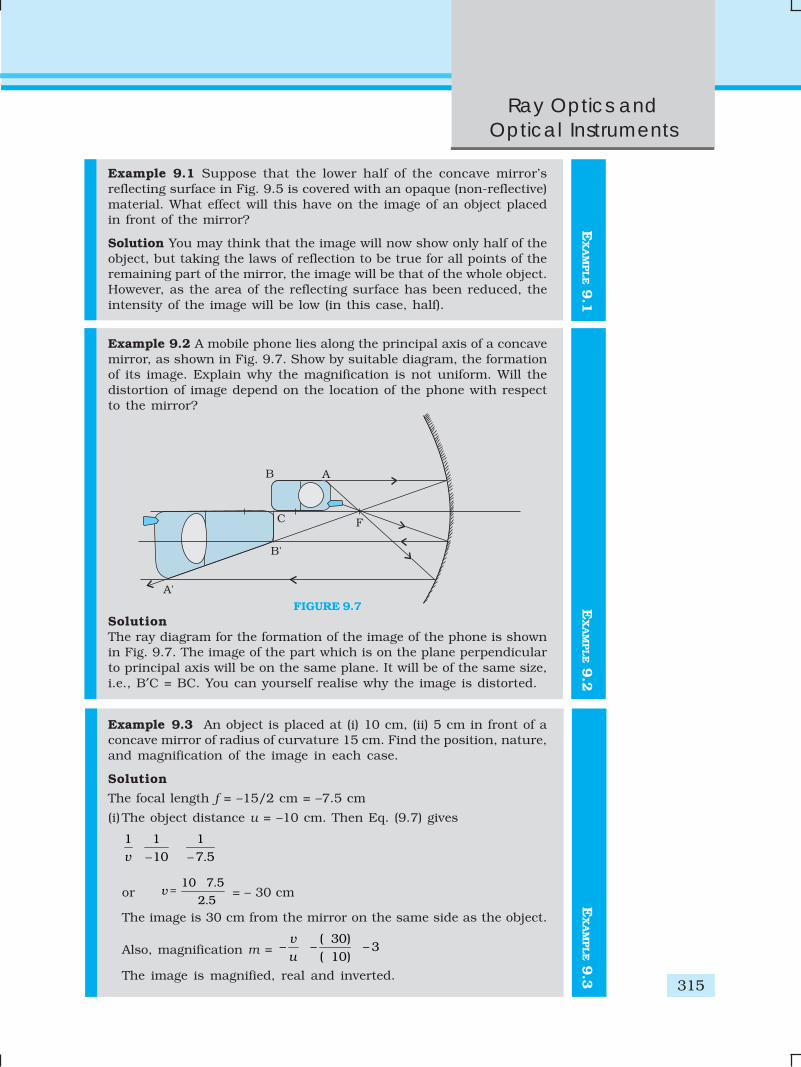
Example 9.2 A mobile phone lies along the principal axis of a concavemirror, as shown in Fig. 9.7. Show by suitable diagram, the formationof its image. Explain why the magnification is not uniform. Will thedistortion of image depend on the location of the phone with respectto the mirror?
FIGURE 9.7SolutionThe ray diagram for the formation of the image of the phone is shownin Fig. 9.7. The image of the part which is on the plane perpendicularto principal axis will be on the same plane. It will be of the same size,i.e., B′C = BC. You can yourself realise why the image is distorted.
Example 9.3 An object is placed at (i) 10 cm, (ii) 5 cm in front of aconcave mirror of radius of curvature 15 cm. Find the position, nature,and magnification of the image in each case.
Solution
The focal length f = –15/2 cm = –7.5 cm
(i) The object distance u = –10 cm. Then Eq. (9.7) gives
– – .1 1 1
10 7 5v
or.
.10 7 5
2 5v
= = – 30 cm
The image is 30 cm from the mirror on the same side as the object.
Also, magnification m = ( 30)
– – – 3( 10)
v
u
The image is magnified, real and inverted.
Physics
316
EX
AM
PLE 9
.4 E
XA
MPLE 9
.3
(ii) The object distance u = –5 cm. Then from Eq. (9.7),
1 1 15 7.5v
or .
. –5 7 5
15 cm7 5 5
v
=
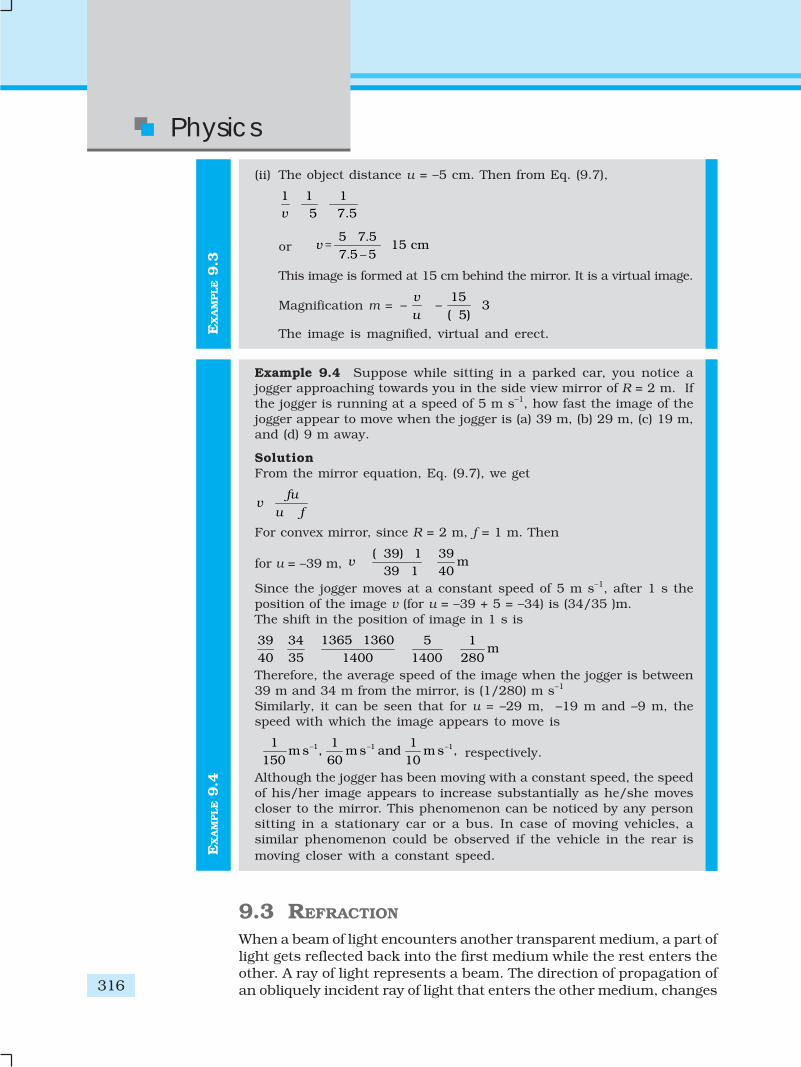
This image is formed at 15 cm behind the mirror. It is a virtual image.
Magnification m = 15
– – 3( 5)
v
u
The image is magnified, virtual and erect.
Example 9.4 Suppose while sitting in a parked car, you notice ajogger approaching towards you in the side view mirror of R = 2 m. Ifthe jogger is running at a speed of 5 m s–1, how fast the image of thejogger appear to move when the jogger is (a) 39 m, (b) 29 m, (c) 19 m,and (d) 9 m away.
SolutionFrom the mirror equation, Eq. (9.7), we get
fuv
u f
For convex mirror, since R = 2 m, f = 1 m. Then
for u = –39 m, ( 39) 1 39
m39 1 40
v
Since the jogger moves at a constant speed of 5 m s–1, after 1 s theposition of the image v (for u = –39 + 5 = –34) is (34/35 )m.The shift in the position of image in 1 s is
1365 136039 34 5 1m
40 35 1400 1400 280
Therefore, the average speed of the image when the jogger is between39 m and 34 m from the mirror, is (1/280) m s–1
Similarly, it can be seen that for u = –29 m, –19 m and –9 m, thespeed with which the image appears to move is
–1 –1 –11 1 1
m s , m s and m s ,150 60 10
respectively.
Although the jogger has been moving with a constant speed, the speedof his/her image appears to increase substantially as he/she movescloser to the mirror. This phenomenon can be noticed by any personsitting in a stationary car or a bus. In case of moving vehicles, asimilar phenomenon could be observed if the vehicle in the rear ismoving closer with a constant speed.
9.3 REFRACTION
When a beam of light encounters another transparent medium, a part oflight gets reflected back into the first medium while the rest enters theother. A ray of light represents a beam. The direction of propagation ofan obliquely incident ray of light that enters the other medium, changes
Ray Optics andOptical Instruments
317
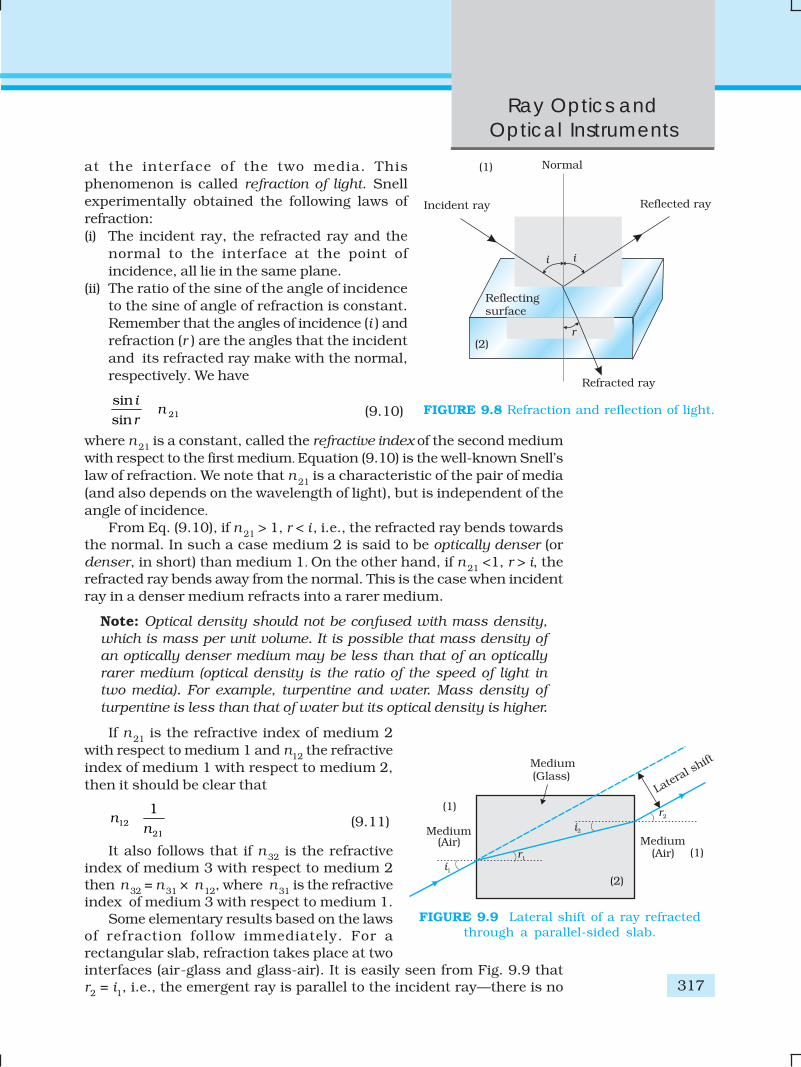
at the interface of the two media. Thisphenomenon is called refraction of light. Snellexperimentally obtained the following laws ofrefraction:(i) The incident ray, the refracted ray and the
normal to the interface at the point ofincidence, all lie in the same plane.
(ii) The ratio of the sine of the angle of incidenceto the sine of angle of refraction is constant.Remember that the angles of incidence (i ) andrefraction (r ) are the angles that the incidentand its refracted ray make with the normal,respectively. We have
21
sinsin
in
r (9.10)
where n 21 is a constant, called the refractive index of the second mediumwith respect to the first medium. Equation (9.10) is the well-known Snell’slaw of refraction. We note that n 21 is a characteristic of the pair of media(and also depends on the wavelength of light), but is independent of theangle of incidence.
From Eq. (9.10), if n 21 > 1, r < i , i.e., the refracted ray bends towardsthe normal. In such a case medium 2 is said to be optically denser (ordenser, in short) than medium 1. On the other hand, if n 21 <1, r > i, therefracted ray bends away from the normal. This is the case when incidentray in a denser medium refracts into a rarer medium.
Note: Optical density should not be confused with mass density,which is mass per unit volume. It is possible that mass density ofan optically denser medium may be less than that of an opticallyrarer medium (optical density is the ratio of the speed of light intwo media). For example, turpentine and water. Mass density ofturpentine is less than that of water but its optical density is higher.
If n 21 is the refractive index of medium 2with respect to medium 1 and n12 the refractiveindex of medium 1 with respect to medium 2,then it should be clear that
1221
1n
n (9.11)
It also follows that if n 32 is the refractiveindex of medium 3 with respect to medium 2then n32 = n31 × n12, where n31 is the refractiveindex of medium 3 with respect to medium 1.
Some elementary results based on the lawsof refraction follow immediately. For arectangular slab, refraction takes place at twointerfaces (air-glass and glass-air). It is easily seen from Fig. 9.9 thatr2 = i1, i.e., the emergent ray is parallel to the incident ray—there is no
FIGURE 9.8 Refraction and reflection of light.
FIGURE 9.9 Lateral shift of a ray refractedthrough a parallel-sided slab.
Physics
318 EX
AM
PLE 9
.5
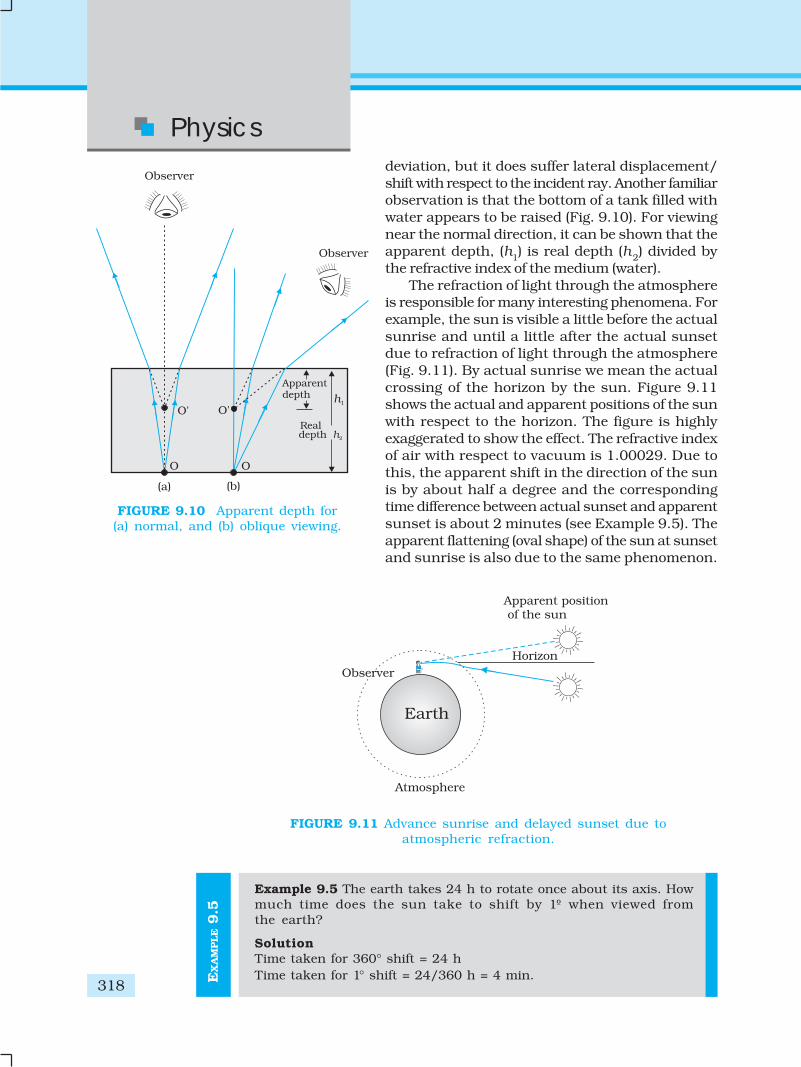
deviation, but it does suffer lateral displacement/shift with respect to the incident ray. Another familiarobservation is that the bottom of a tank filled withwater appears to be raised (Fig. 9.10). For viewingnear the normal direction, it can be shown that theapparent depth, (h1) is real depth (h2) divided bythe refractive index of the medium (water).
The refraction of light through the atmosphereis responsible for many interesting phenomena. Forexample, the sun is visible a little before the actualsunrise and until a little after the actual sunsetdue to refraction of light through the atmosphere(Fig. 9.11). By actual sunrise we mean the actualcrossing of the horizon by the sun. Figure 9.11shows the actual and apparent positions of the sunwith respect to the horizon. The figure is highlyexaggerated to show the effect. The refractive indexof air with respect to vacuum is 1.00029. Due tothis, the apparent shift in the direction of the sunis by about half a degree and the correspondingtime difference between actual sunset and apparentsunset is about 2 minutes (see Example 9.5). Theapparent flattening (oval shape) of the sun at sunsetand sunrise is also due to the same phenomenon.
FIGURE 9.10 Apparent depth for(a) normal, and (b) oblique viewing.
FIGURE 9.11 Advance sunrise and delayed sunset due toatmospheric refraction.
Example 9.5 The earth takes 24 h to rotate once about its axis. Howmuch time does the sun take to shift by 1º when viewed fromthe earth?
SolutionTime taken for 360° shift = 24 hTime taken for 1° shift = 24/360 h = 4 min.
Ray Optics andOptical Instruments
319
9.4 TOTAL INTERNAL REFLECTION
When light travels from an optically denser medium to a rarer mediumat the interface, it is partly reflected back into the same medium andpartly refracted to the second medium. This reflection is called the internalreflection.
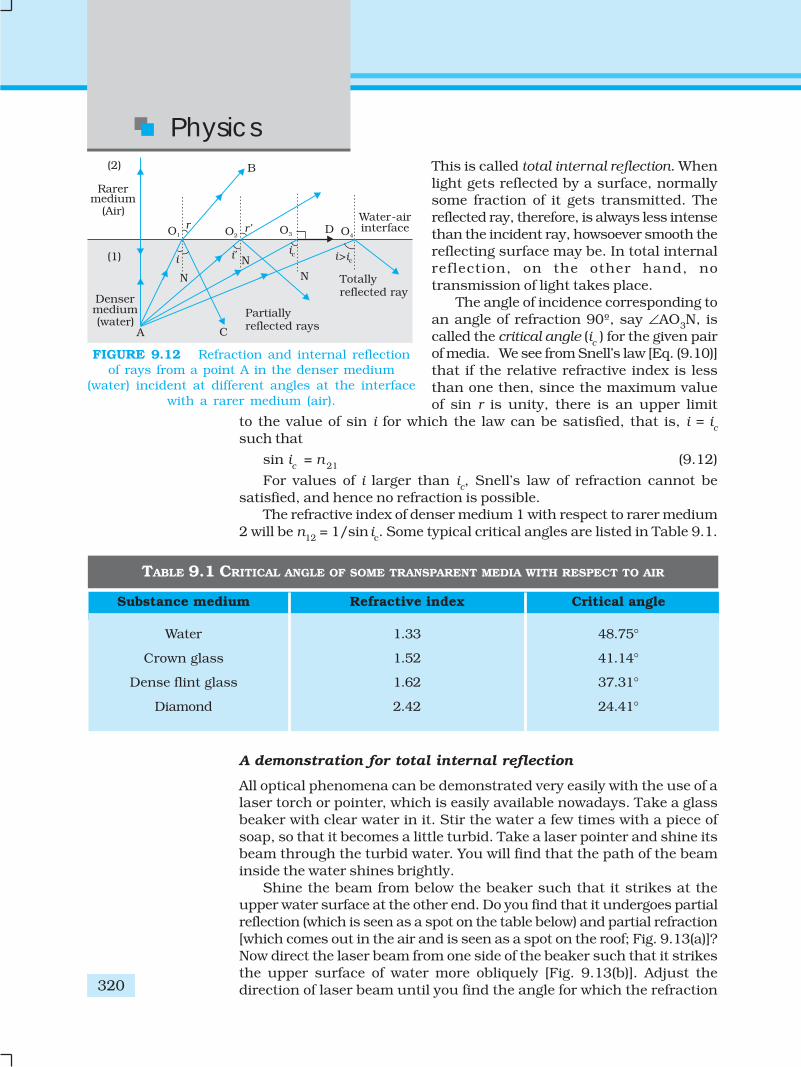
When a ray of light enters from a denser medium to a rarer medium,it bends away from the normal, for example, the ray AO1 B in Fig. 9.12.The incident ray AO1 is partially reflected (O1C) and partially transmitted(O1B) or refracted, the angle of refraction (r ) being larger than the angle ofincidence (i ). As the angle of incidence increases, so does the angle ofrefraction, till for the ray AO3, the angle of refraction is π/2. The refractedray is bent so much away from the normal that it grazes the surface atthe interface between the two media. This is shown by the ray AO3 D inFig. 9.12. If the angle of incidence is increased still further (e.g., the rayAO4), refraction is not possible, and the incident ray is totally reflected.
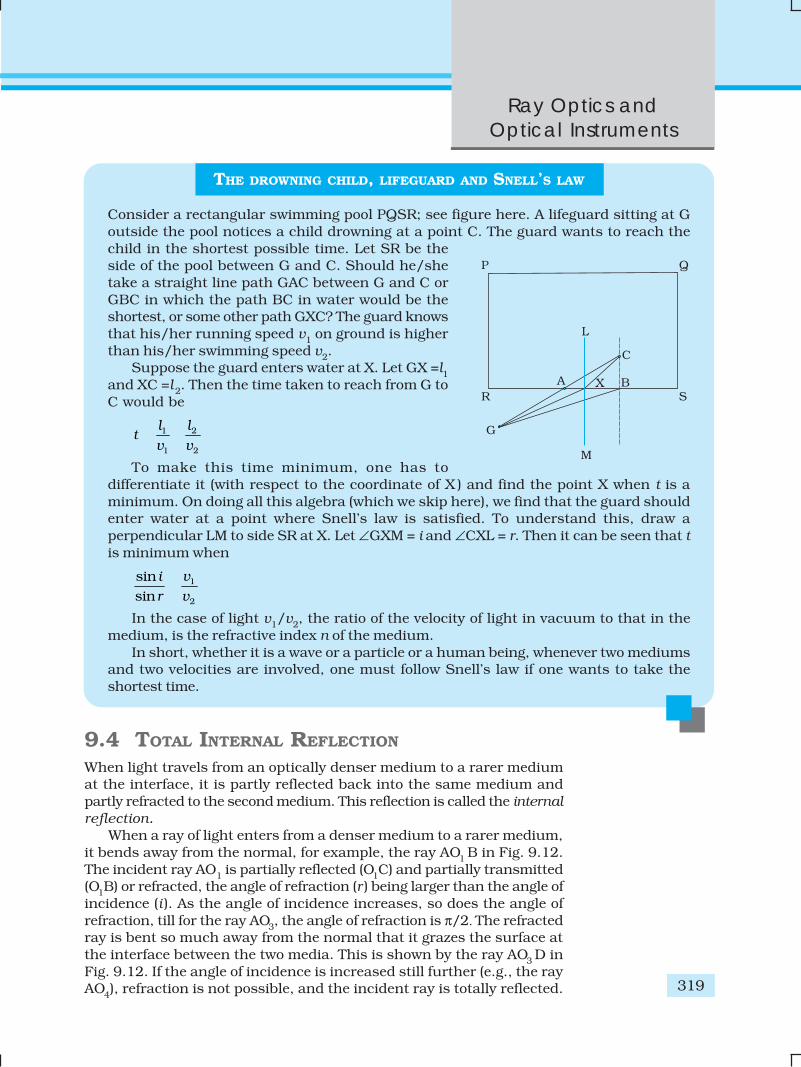
THE DROWNING CHILD, LIFEGUARD AND SNELL’S LAW
Consider a rectangular swimming pool PQSR; see figure here. A lifeguard sitting at Goutside the pool notices a child drowning at a point C. The guard wants to reach thechild in the shortest possible time. Let SR be theside of the pool between G and C. Should he/shetake a straight line path GAC between G and C orGBC in which the path BC in water would be theshortest, or some other path GXC? The guard knowsthat his/her running speed v1 on ground is higherthan his/her swimming speed v2.
Suppose the guard enters water at X. Let GX =l1and XC =l2. Then the time taken to reach from G toC would be
1 2
1 2
l lt
v v
To make this time minimum, one has todifferentiate it (with respect to the coordinate of X ) and find the point X when t is aminimum. On doing all this algebra (which we skip here), we find that the guard shouldenter water at a point where Snell’s law is satisfied. To understand this, draw aperpendicular LM to side SR at X. Let ∠GXM = i and ∠CXL = r. Then it can be seen that tis minimum when
1
2
sinsin
vi
r v
In the case of light v1/v2, the ratio of the velocity of light in vacuum to that in themedium, is the refractive index n of the medium.
In short, whether it is a wave or a particle or a human being, whenever two mediumsand two velocities are involved, one must follow Snell’s law if one wants to take theshortest time.
Physics
320
This is called total internal reflection. Whenlight gets reflected by a surface, normallysome fraction of it gets transmitted. Thereflected ray, therefore, is always less intensethan the incident ray, howsoever smooth thereflecting surface may be. In total internalreflection, on the other hand, notransmission of light takes place.
The angle of incidence corresponding toan angle of refraction 90º, say ∠AO3N, iscalled the critical angle (ic ) for the given pairof media. We see from Snell’s law [Eq. (9.10)]that if the relative refractive index is lessthan one then, since the maximum valueof sin r is unity, there is an upper limit
to the value of sin i for which the law can be satisfied, that is, i = icsuch that
sin ic = n 21 (9.12)
For values of i larger than ic, Snell’s law of refraction cannot besatisfied, and hence no refraction is possible.
The refractive index of denser medium 1 with respect to rarer medium2 will be n12 = 1/sin ic. Some typical critical angles are listed in Table 9.1.
FIGURE 9.12 Refraction and internal reflectionof rays from a point A in the denser medium
(water) incident at different angles at the interfacewith a rarer medium (air).
A demonstration for total internal reflection
All optical phenomena can be demonstrated very easily with the use of alaser torch or pointer, which is easily available nowadays. Take a glassbeaker with clear water in it. Stir the water a few times with a piece ofsoap, so that it becomes a little turbid. Take a laser pointer and shine itsbeam through the turbid water. You will find that the path of the beaminside the water shines brightly.
Shine the beam from below the beaker such that it strikes at theupper water surface at the other end. Do you find that it undergoes partialreflection (which is seen as a spot on the table below) and partial refraction[which comes out in the air and is seen as a spot on the roof; Fig. 9.13(a)]?Now direct the laser beam from one side of the beaker such that it strikesthe upper surface of water more obliquely [Fig. 9.13(b)]. Adjust thedirection of laser beam until you find the angle for which the refraction
TABLE 9.1 CRITICAL ANGLE OF SOME TRANSPARENT MEDIA WITH RESPECT TO AIR
Substance medium Refractive index Critical angle
Water 1.33 48.75°
Crown glass 1.52 41.14°
Dense flint glass 1.62 37.31°
Diamond 2.42 24.41°
Ray Optics andOptical Instruments
321
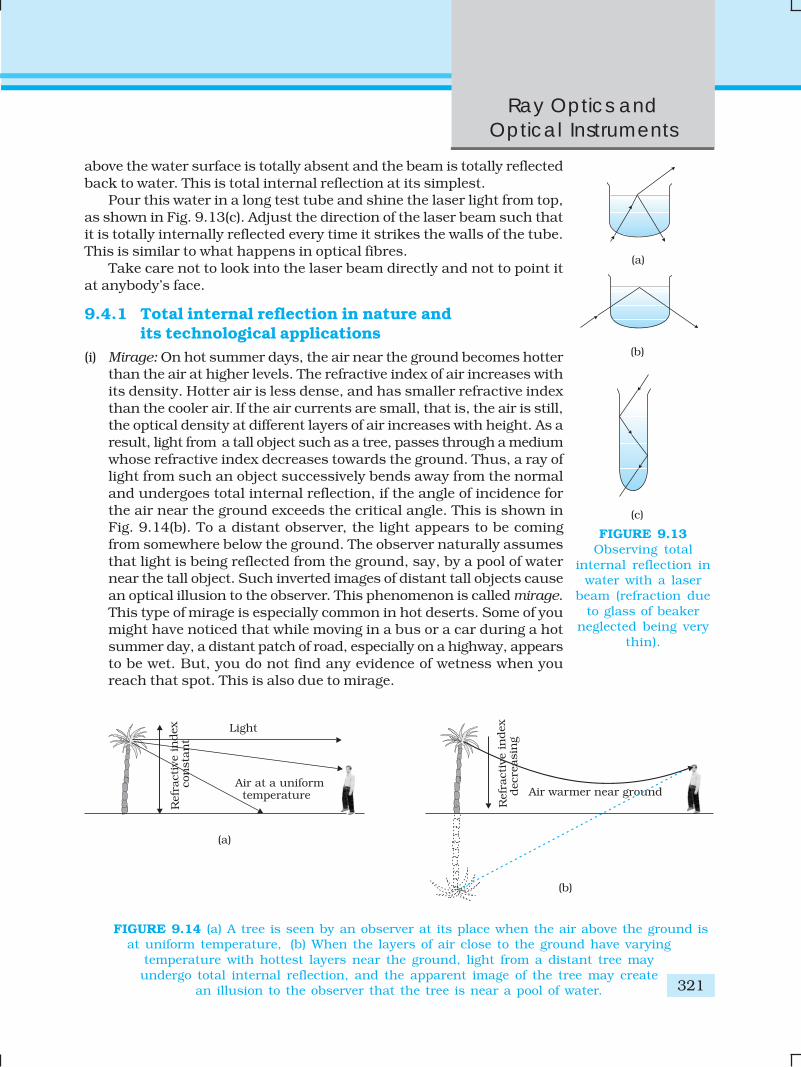
above the water surface is totally absent and the beam is totally reflectedback to water. This is total internal reflection at its simplest.
Pour this water in a long test tube and shine the laser light from top,as shown in Fig. 9.13(c). Adjust the direction of the laser beam such thatit is totally internally reflected every time it strikes the walls of the tube.This is similar to what happens in optical fibres.
Take care not to look into the laser beam directly and not to point itat anybody’s face.
9.4.1 Total internal reflection in nature andits technological applications
(i) Mirage: On hot summer days, the air near the ground becomes hotterthan the air at higher levels. The refractive index of air increases withits density. Hotter air is less dense, and has smaller refractive indexthan the cooler air. If the air currents are small, that is, the air is still,the optical density at different layers of air increases with height. As aresult, light from a tall object such as a tree, passes through a mediumwhose refractive index decreases towards the ground. Thus, a ray oflight from such an object successively bends away from the normaland undergoes total internal reflection, if the angle of incidence forthe air near the ground exceeds the critical angle. This is shown inFig. 9.14(b). To a distant observer, the light appears to be comingfrom somewhere below the ground. The observer naturally assumesthat light is being reflected from the ground, say, by a pool of waternear the tall object. Such inverted images of distant tall objects causean optical illusion to the observer. This phenomenon is called mirage.This type of mirage is especially common in hot deserts. Some of youmight have noticed that while moving in a bus or a car during a hotsummer day, a distant patch of road, especially on a highway, appearsto be wet. But, you do not find any evidence of wetness when youreach that spot. This is also due to mirage.
FIGURE 9.13Observing total
internal reflection inwater with a laser
beam (refraction dueto glass of beaker
neglected being verythin).
FIGURE 9.14 (a) A tree is seen by an observer at its place when the air above the ground isat uniform temperature, (b) When the layers of air close to the ground have varying
temperature with hottest layers near the ground, light from a distant tree mayundergo total internal reflection, and the apparent image of the tree may create
an illusion to the observer that the tree is near a pool of water.
Physics
322
(ii) Diamond : Diamonds are known for theirspectacular brilliance. Their brillianceis mainly due to the total internalreflection of light inside them. The criticalangle for diamond-air interface (≅ 24.4°)is very small, therefore once light entersa diamond, it is very likely to undergototal internal reflection inside it.Diamonds found in nature rarely exhibitthe brilliance for which they are known.It is the technical skill of a diamondcutter which makes diamonds tosparkle so brilliantly. By cutting thediamond suitably, multiple totalinternal reflections can be madeto occur.
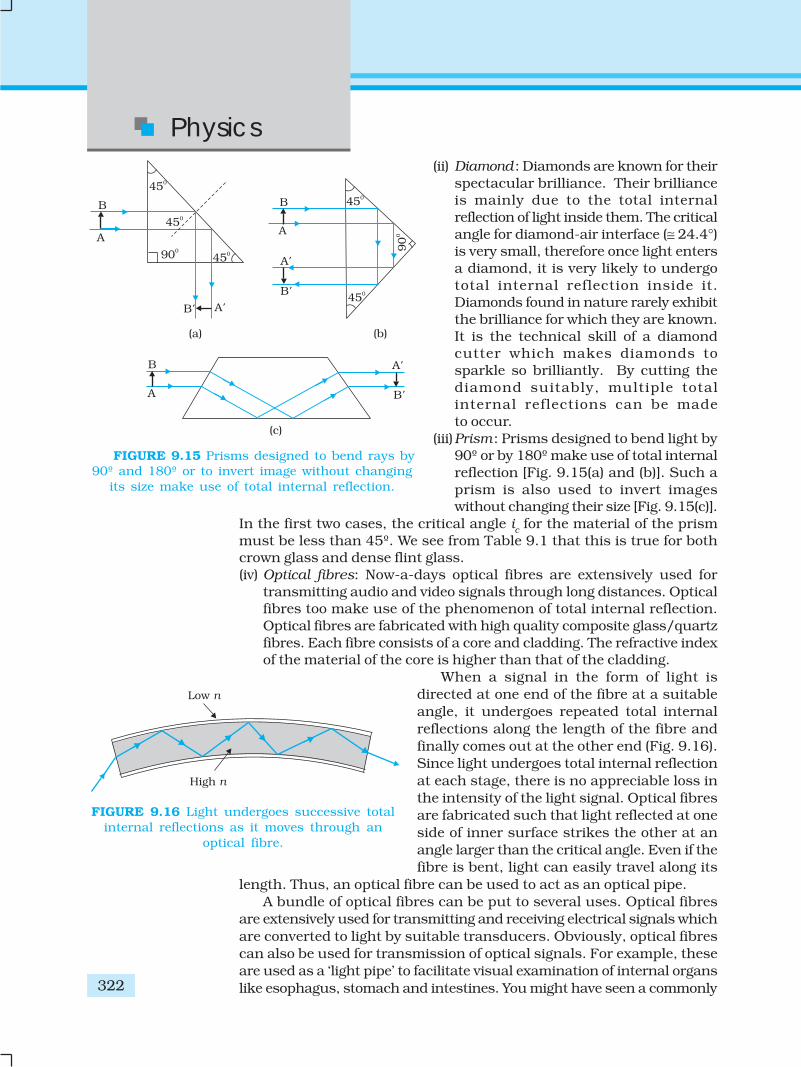
(iii)Prism : Prisms designed to bend light by90º or by 180º make use of total internalreflection [Fig. 9.15(a) and (b)]. Such aprism is also used to invert imageswithout changing their size [Fig. 9.15(c)].
In the first two cases, the critical angle ic for the material of the prismmust be less than 45º. We see from Table 9.1 that this is true for bothcrown glass and dense flint glass.(iv) Optical fibres: Now-a-days optical fibres are extensively used for
transmitting audio and video signals through long distances. Opticalfibres too make use of the phenomenon of total internal reflection.Optical fibres are fabricated with high quality composite glass/quartzfibres. Each fibre consists of a core and cladding. The refractive indexof the material of the core is higher than that of the cladding.
When a signal in the form of light isdirected at one end of the fibre at a suitableangle, it undergoes repeated total internalreflections along the length of the fibre andfinally comes out at the other end (Fig. 9.16).Since light undergoes total internal reflectionat each stage, there is no appreciable loss inthe intensity of the light signal. Optical fibresare fabricated such that light reflected at oneside of inner surface strikes the other at anangle larger than the critical angle. Even if thefibre is bent, light can easily travel along its
length. Thus, an optical fibre can be used to act as an optical pipe.A bundle of optical fibres can be put to several uses. Optical fibres
are extensively used for transmitting and receiving electrical signals whichare converted to light by suitable transducers. Obviously, optical fibrescan also be used for transmission of optical signals. For example, theseare used as a ‘light pipe’ to facilitate visual examination of internal organslike esophagus, stomach and intestines. You might have seen a commonly
FIGURE 9.15 Prisms designed to bend rays by90º and 180º or to invert image without changing
its size make use of total internal reflection.
FIGURE 9.16 Light undergoes successive totalinternal reflections as it moves through an
optical fibre.
Ray Optics andOptical Instruments
323
available decorative lamp with fine plastic fibres with their free endsforming a fountain like structure. The other end of the fibres is fixed overan electric lamp. When the lamp is switched on, the light travels from thebottom of each fibre and appears at the tip of its free end as a dot of light.The fibres in such decorative lamps are optical fibres.
The main requirement in fabricating optical fibres is that there shouldbe very little absorption of light as it travels for long distances insidethem. This has been achieved by purification and special preparation ofmaterials such as quartz. In silica glass fibres, it is possible to transmitmore than 95% of the light over a fibre length of 1 km. (Compare withwhat you expect for a block of ordinary window glass 1 km thick.)
9.5 REFRACTION AT SPHERICAL SURFACES
AND BY LENSES
We have so far considered refraction at a plane interface. We shall nowconsider refraction at a spherical interface between two transparent media.An infinitesimal part of a spherical surface can be regarded as planarand the same laws of refraction can be applied at every point on thesurface. Just as for reflection by a spherical mirror, the normal at thepoint of incidence is perpendicular to the tangent plane to the sphericalsurface at that point and, therefore, passes through its centre of curvature.We first consider refraction by a single spherical surface and follow it bythin lenses. A thin lens is a transparent optical medium bounded by twosurfaces; at least one of which should be spherical. Applying the formulafor image formation by a single spherical surface successively at the twosurfaces of a lens, we shall obtain the lens maker’s formula and then thelens formula.
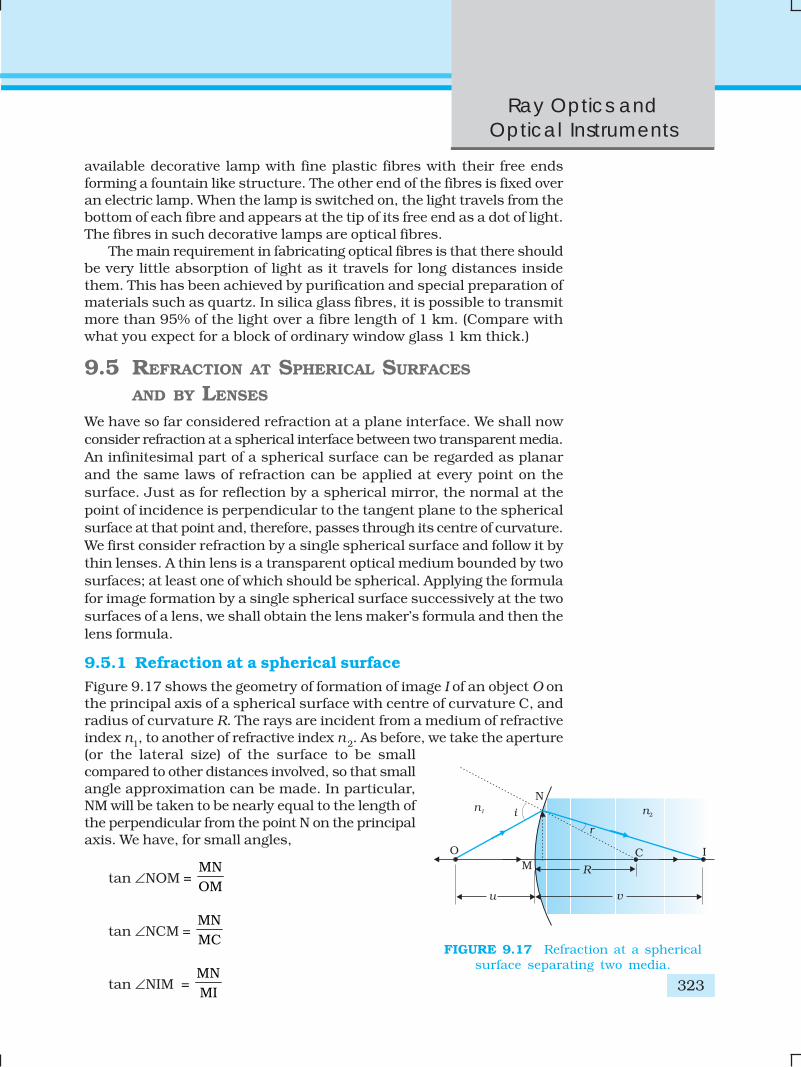
9.5.1 Refraction at a spherical surfaceFigure 9.17 shows the geometry of formation of image I of an object O onthe principal axis of a spherical surface with centre of curvature C, andradius of curvature R. The rays are incident from a medium of refractiveindex n1, to another of refractive index n2. As before, we take the aperture(or the lateral size) of the surface to be smallcompared to other distances involved, so that smallangle approximation can be made. In particular,NM will be taken to be nearly equal to the length ofthe perpendicular from the point N on the principalaxis. We have, for small angles,
tan ∠NOM = MNOM
tan ∠NCM = MNMC
tan ∠NIM = MNMI
FIGURE 9.17 Refraction at a sphericalsurface separating two media.

Physics
324
Now, for ΔNOC, i is the exterior angle. Therefore, i = ∠NOM + ∠NCM
i = MN MNOM MC
(9.13)
Similarly,
r = ∠NCM – ∠NIM
i.e., r = MN MNMC MI
(9.14)
Now, by Snell’s law
n1 sin i = n 2 sin r
or for small angles
n1i = n 2r
LIGHT SOURCES AND PHOTOMETRY
It is known that a body above absolute zero temperature emits electromagnetic radiation.The wavelength region in which the body emits the radiation depends on its absolutetemperature. Radiation emitted by a hot body, for example, a tungsten filament lamphaving temperature 2850 K are partly invisible and mostly in infrared (or heat) region.As the temperature of the body increases radiation emitted by it is in visible region. Thesun with temperature of about 5500 K emits radiation whose energy versus wavelengthgraph peaks approximately at 550 nm corresponding to green light and is almost in themiddle of the visible region. The energy versus wavelength distribution graph for a givenbody peaks at some wavelength, which is inversely proportional to the absolutetemperature of that body.
The measurement of light as perceived by human eye is called photometry. Photometryis measurement of a physiological phenomenon, being the stimulus of light as receivedby the human eye, transmitted by the optic nerves and analysed by the brain. The mainphysical quantities in photometry are (i) the luminous intensity of the source,(ii) the luminous flux or flow of light from the source, and (iii) illuminance of the surface.The SI unit of luminous intensity (I ) is candela (cd). The candela is the luminous intensity,in a given direction, of a source that emits monochromatic radiation of frequency540 × 1012 Hz and that has a radiant intensity in that direction of 1/683 watt per steradian.If a light source emits one candela of luminous intensity into a solid angle of one steradian,the total luminous flux emitted into that solid angle is one lumen (lm). A standard100 watt incadescent light bulb emits approximately 1700 lumens.
In photometry, the only parameter, which can be measured directly is illuminance. Itis defined as luminous flux incident per unit area on a surface (lm/m2 or lux ). Most lightmeters measure this quantity. The illuminance E, produced by a source of luminousintensity I, is given by E = I/r2, where r is the normal distance of the surface from thesource. A quantity named luminance (L), is used to characterise the brightness of emittingor reflecting flat surfaces. Its unit is cd/m2 (sometimes called ‘nit’ in industry) . A goodLCD computer monitor has a brightness of about 250 nits.
Ray Optics andOptical Instruments
325
EX
AM
PLE 9
.6
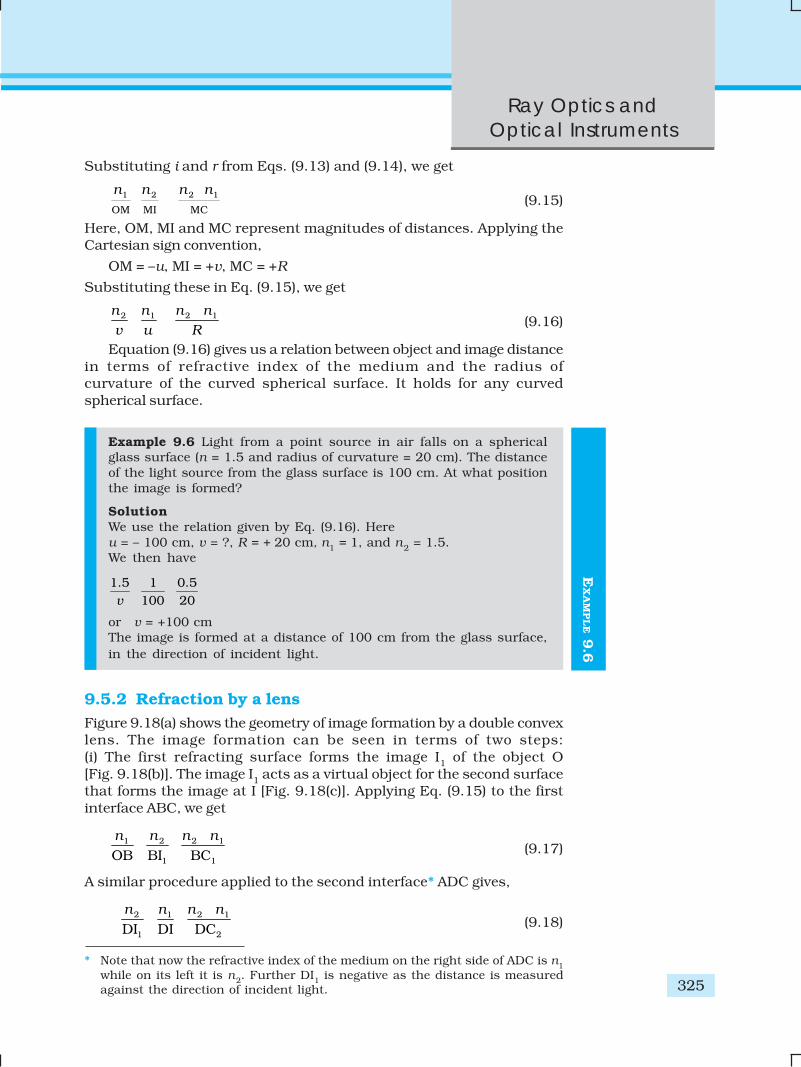
Substituting i and r from Eqs. (9.13) and (9.14), we get
1 2 2 1
OM MI MC
n n n n (9.15)
Here, OM, MI and MC represent magnitudes of distances. Applying theCartesian sign convention,
OM = –u, MI = +v, MC = +R
Substituting these in Eq. (9.15), we get
2 1 2 1n n n n
v u R
(9.16)
Equation (9.16) gives us a relation between object and image distancein terms of refractive index of the medium and the radius ofcurvature of the curved spherical surface. It holds for any curvedspherical surface.
Example 9.6 Light from a point source in air falls on a sphericalglass surface (n = 1.5 and radius of curvature = 20 cm). The distanceof the light source from the glass surface is 100 cm. At what positionthe image is formed?
SolutionWe use the relation given by Eq. (9.16). Hereu = – 100 cm, v = ?, R = + 20 cm, n1 = 1, and n2 = 1.5.We then have
1.5 1 0.5100 20v
or v = +100 cmThe image is formed at a distance of 100 cm from the glass surface,in the direction of incident light.
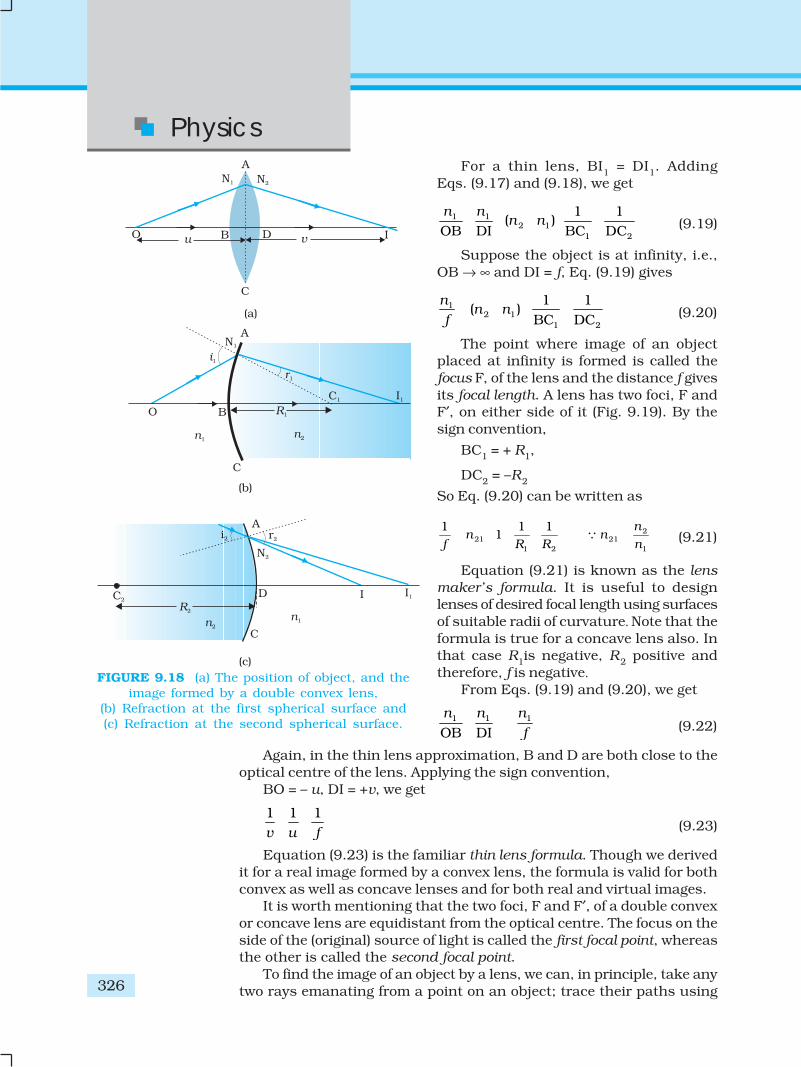
9.5.2 Refraction by a lensFigure 9.18(a) shows the geometry of image formation by a double convexlens. The image formation can be seen in terms of two steps:(i) The first refracting surface forms the image I1 of the object O[Fig. 9.18(b)]. The image I1 acts as a virtual object for the second surfacethat forms the image at I [Fig. 9.18(c)]. Applying Eq. (9.15) to the firstinterface ABC, we get
1 2 2 1
1 1OB BI BCn n n n
(9.17)
A similar procedure applied to the second interface* ADC gives,
2 1 2 1
1 2DI DI DCn n n n
(9.18)
* Note that now the refractive index of the medium on the right side of ADC is n1while on its left it is n2. Further DI1 is negative as the distance is measuredagainst the direction of incident light.
Physics
326
For a thin lens, BI1 = DI1. AddingEqs. (9.17) and (9.18), we get
1 12 1
1 2
1 1( )
OB DI BC DCn n
n n
(9.19)
Suppose the object is at infinity, i.e.,OB → ∞ and DI = f, Eq. (9.19) gives
12 1
1 2
1 1( )
BC DCn
n nf
(9.20)
The point where image of an objectplaced at infinity is formed is called thefocus F, of the lens and the distance f givesits focal length. A lens has two foci, F andF′, on either side of it (Fig. 9.19). By thesign convention,
BC1 = + R1,
DC2 = –R2
So Eq. (9.20) can be written as
221 21
1 2 1
1 1 11
nn n
f R R n
(9.21)
Equation (9.21) is known as the lensmaker’s formula. It is useful to designlenses of desired focal length using surfacesof suitable radii of curvature. Note that theformula is true for a concave lens also. Inthat case R1is negative, R2 positive andtherefore, f is negative.
From Eqs. (9.19) and (9.20), we get
1 1 1
OB DIn n n
f (9.22)
Again, in the thin lens approximation, B and D are both close to theoptical centre of the lens. Applying the sign convention,
BO = – u, DI = +v, we get
1 1 1v u f
(9.23)
Equation (9.23) is the familiar thin lens formula. Though we derivedit for a real image formed by a convex lens, the formula is valid for bothconvex as well as concave lenses and for both real and virtual images.
It is worth mentioning that the two foci, F and F′, of a double convexor concave lens are equidistant from the optical centre. The focus on theside of the (original) source of light is called the first focal point, whereasthe other is called the second focal point.
To find the image of an object by a lens, we can, in principle, take anytwo rays emanating from a point on an object; trace their paths using
FIGURE 9.18 (a) The position of object, and theimage formed by a double convex lens,
(b) Refraction at the first spherical surface and(c) Refraction at the second spherical surface.
Ray Optics andOptical Instruments
327
EX
AM
PLE 9
.7
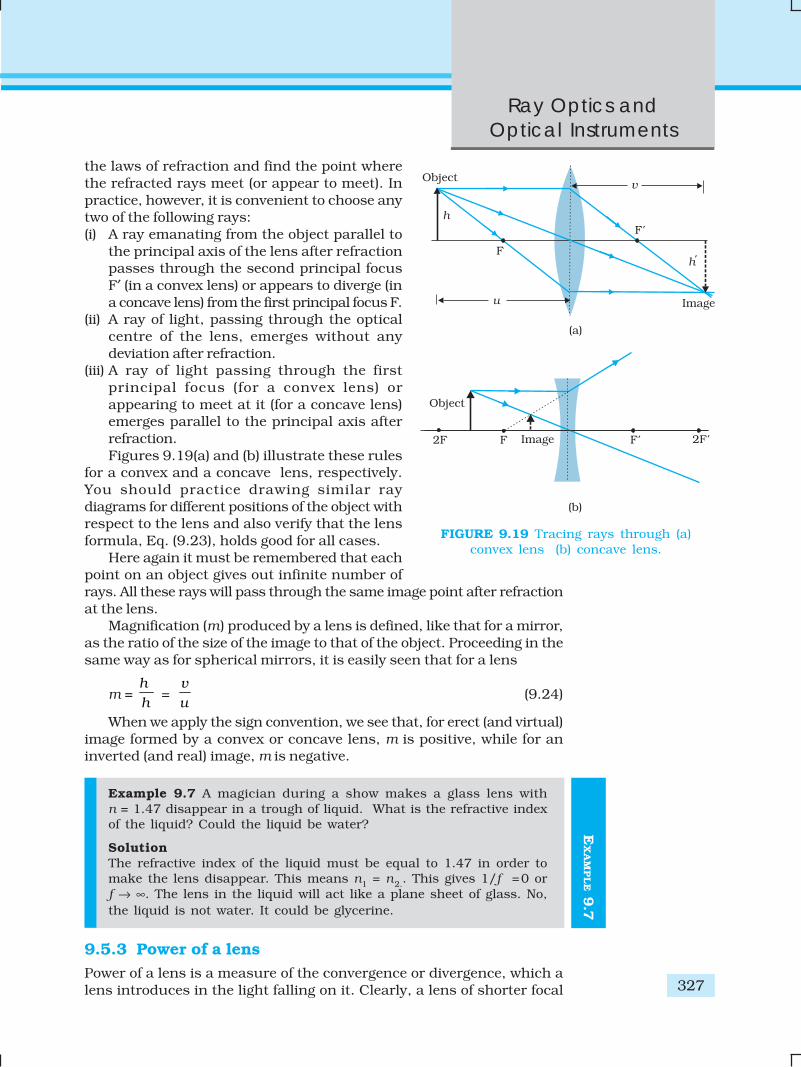
the laws of refraction and find the point wherethe refracted rays meet (or appear to meet). Inpractice, however, it is convenient to choose anytwo of the following rays:(i) A ray emanating from the object parallel to
the principal axis of the lens after refractionpasses through the second principal focusF′ (in a convex lens) or appears to diverge (ina concave lens) from the first principal focus F.
(ii) A ray of light, passing through the opticalcentre of the lens, emerges without anydeviation after refraction.
(iii) A ray of light passing through the firstprincipal focus (for a convex lens) orappearing to meet at it (for a concave lens)emerges parallel to the principal axis afterrefraction.Figures 9.19(a) and (b) illustrate these rules
for a convex and a concave lens, respectively.You should practice drawing similar raydiagrams for different positions of the object withrespect to the lens and also verify that the lensformula, Eq. (9.23), holds good for all cases.
Here again it must be remembered that eachpoint on an object gives out infinite number ofrays. All these rays will pass through the same image point after refractionat the lens.
Magnification (m) produced by a lens is defined, like that for a mirror,as the ratio of the size of the image to that of the object. Proceeding in thesame way as for spherical mirrors, it is easily seen that for a lens
m = h
h
=
v
u(9.24)
When we apply the sign convention, we see that, for erect (and virtual)image formed by a convex or concave lens, m is positive, while for aninverted (and real) image, m is negative.
Example 9.7 A magician during a show makes a glass lens withn = 1.47 disappear in a trough of liquid. What is the refractive indexof the liquid? Could the liquid be water?
SolutionThe refractive index of the liquid must be equal to 1.47 in order tomake the lens disappear. This means n1 = n2.. This gives 1/f =0 orf → ∞. The lens in the liquid will act like a plane sheet of glass. No,the liquid is not water. It could be glycerine.
9.5.3 Power of a lensPower of a lens is a measure of the convergence or divergence, which alens introduces in the light falling on it. Clearly, a lens of shorter focal
FIGURE 9.19 Tracing rays through (a)convex lens (b) concave lens.
Physics
328
EX
AM
PLE 9
.8
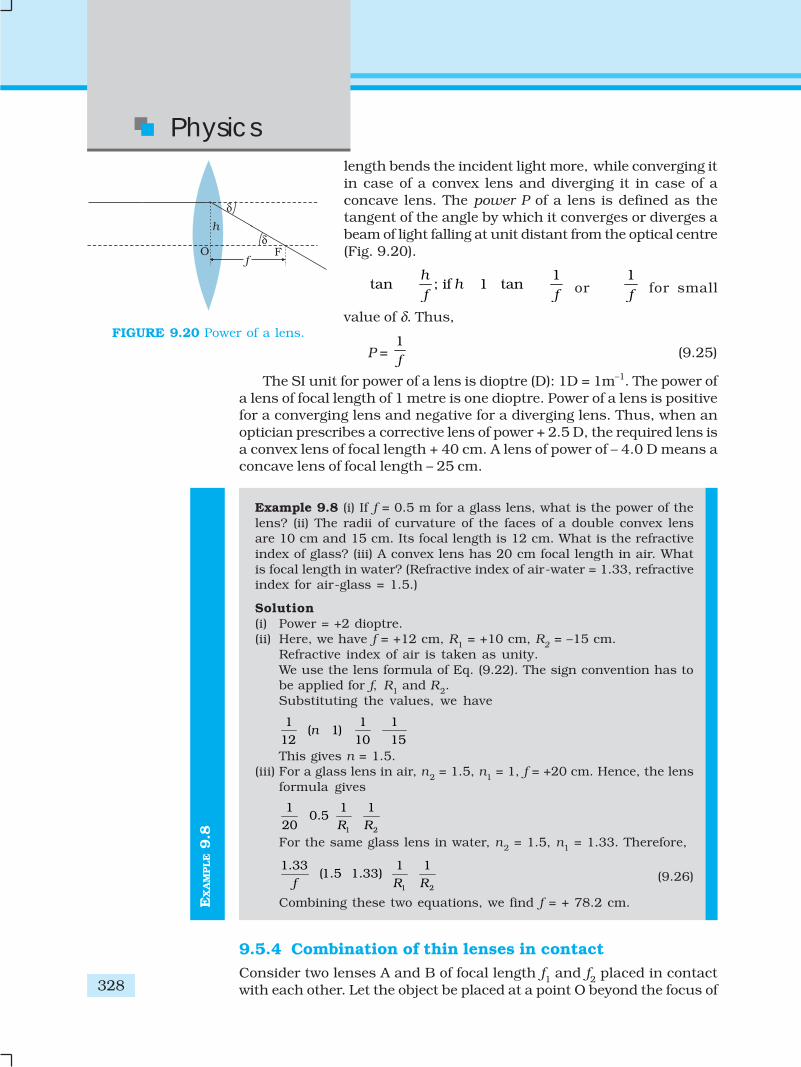
length bends the incident light more, while converging itin case of a convex lens and diverging it in case of aconcave lens. The power P of a lens is defined as thetangent of the angle by which it converges or diverges abeam of light falling at unit distant from the optical centre(Fig. 9.20).
1tan ; if 1 tan
hh
f f or
1f
for small
value of δ. Thus,
P = 1f (9.25)
The SI unit for power of a lens is dioptre (D): 1D = 1m–1. The power ofa lens of focal length of 1 metre is one dioptre. Power of a lens is positivefor a converging lens and negative for a diverging lens. Thus, when anoptician prescribes a corrective lens of power + 2.5 D, the required lens isa convex lens of focal length + 40 cm. A lens of power of – 4.0 D means aconcave lens of focal length – 25 cm.
Example 9.8 (i) If f = 0.5 m for a glass lens, what is the power of thelens? (ii) The radii of curvature of the faces of a double convex lensare 10 cm and 15 cm. Its focal length is 12 cm. What is the refractiveindex of glass? (iii) A convex lens has 20 cm focal length in air. Whatis focal length in water? (Refractive index of air-water = 1.33, refractiveindex for air-glass = 1.5.)
Solution(i) Power = +2 dioptre.(ii) Here, we have f = +12 cm, R1 = +10 cm, R2 = –15 cm.
Refractive index of air is taken as unity.We use the lens formula of Eq. (9.22). The sign convention has tobe applied for f, R1 and R2.Substituting the values, we have
1 1 1( 1)
12 10 15n
This gives n = 1.5.(iii) For a glass lens in air, n2 = 1.5, n1 = 1, f = +20 cm. Hence, the lens
formula gives
1 2
1 1 10.5
20 R R
For the same glass lens in water, n2 = 1.5, n1 = 1.33. Therefore,
1 2
1.33 1 1(1.5 1.33)
f R R
(9.26)
Combining these two equations, we find f = + 78.2 cm.
9.5.4 Combination of thin lenses in contactConsider two lenses A and B of focal length f1 and f2 placed in contactwith each other. Let the object be placed at a point O beyond the focus of
FIGURE 9.20 Power of a lens.
Ray Optics andOptical Instruments
329
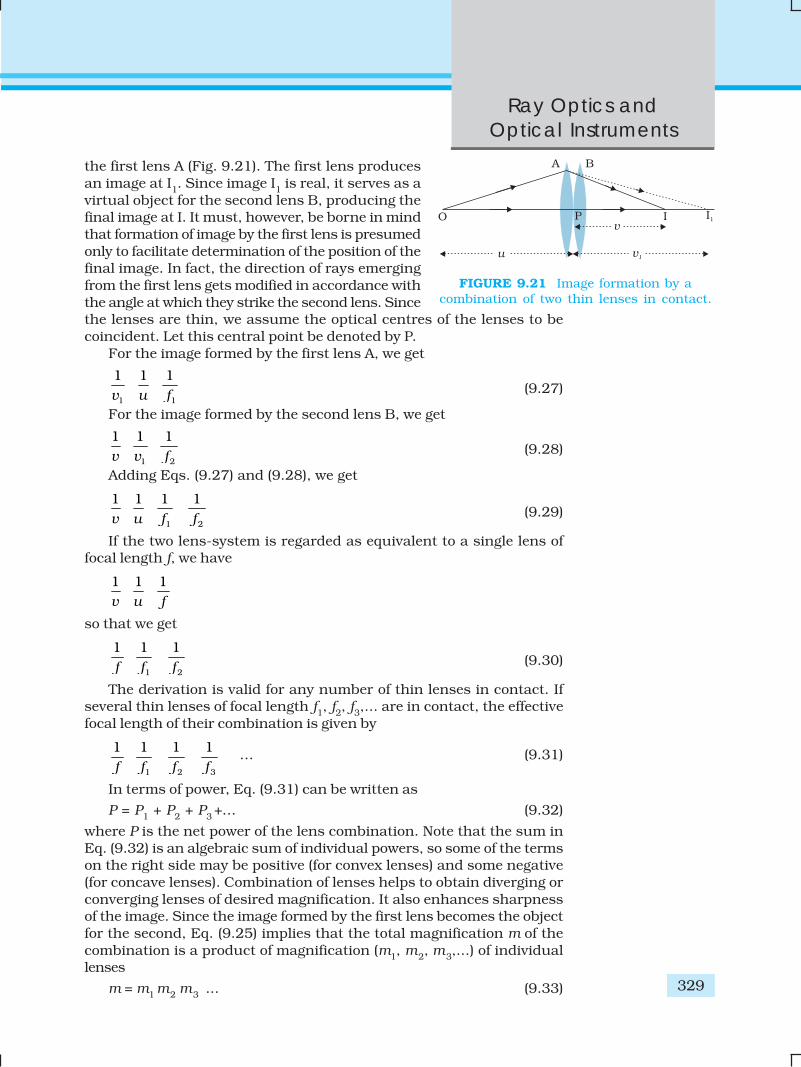
the first lens A (Fig. 9.21). The first lens producesan image at I1. Since image I1 is real, it serves as avirtual object for the second lens B, producing thefinal image at I. It must, however, be borne in mindthat formation of image by the first lens is presumedonly to facilitate determination of the position of thefinal image. In fact, the direction of rays emergingfrom the first lens gets modified in accordance withthe angle at which they strike the second lens. Sincethe lenses are thin, we assume the optical centres of the lenses to becoincident. Let this central point be denoted by P.
For the image formed by the first lens A, we get
1 1
1 1 1v u f
(9.27)
For the image formed by the second lens B, we get
1 2
1 1 1v v f
(9.28)
Adding Eqs. (9.27) and (9.28), we get
1 2
1 1 1 1v u f f
(9.29)
If the two lens-system is regarded as equivalent to a single lens offocal length f, we have
1 1 1v u f
so that we get
1 2
1 1 1f f f
(9.30)
The derivation is valid for any number of thin lenses in contact. Ifseveral thin lenses of focal length f1, f2, f3,... are in contact, the effectivefocal length of their combination is given by
1 2 3
1 1 1 1f f f f
… (9.31)
In terms of power, Eq. (9.31) can be written as
P = P1 + P2 + P3 + … (9.32)
where P is the net power of the lens combination. Note that the sum inEq. (9.32) is an algebraic sum of individual powers, so some of the termson the right side may be positive (for convex lenses) and some negative(for concave lenses). Combination of lenses helps to obtain diverging orconverging lenses of desired magnification. It also enhances sharpnessof the image. Since the image formed by the first lens becomes the objectfor the second, Eq. (9.25) implies that the total magnification m of thecombination is a product of magnification (m1, m2, m3,...) of individuallenses
m = m1 m2 m3 ... (9.33)
FIGURE 9.21 Image formation by acombination of two thin lenses in contact.
Physics
330
EX
AM
PLE 9
.9
Such a system of combination of lenses is commonly used in designinglenses for cameras, microscopes, telescopes and other optical instruments.
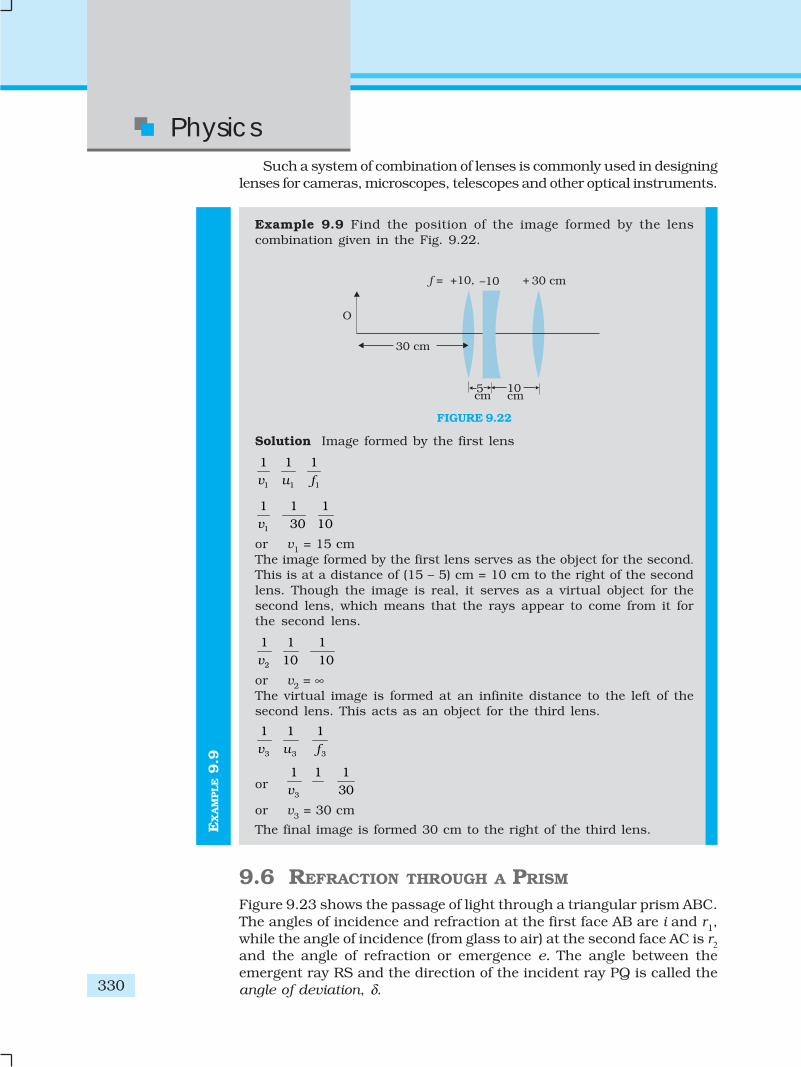
Example 9.9 Find the position of the image formed by the lenscombination given in the Fig. 9.22.
FIGURE 9.22
Solution Image formed by the first lens
1 1 1
1 1 1v u f
1
1 1 130 10v
or v1 = 15 cmThe image formed by the first lens serves as the object for the second.This is at a distance of (15 – 5) cm = 10 cm to the right of the secondlens. Though the image is real, it serves as a virtual object for thesecond lens, which means that the rays appear to come from it forthe second lens.
2
1 1 110 10v
or v2 = ∞The virtual image is formed at an infinite distance to the left of thesecond lens. This acts as an object for the third lens.
3 3 3
1 1 1v u f
or 3
1 1 130v
or v3 = 30 cm
The final image is formed 30 cm to the right of the third lens.
9.6 REFRACTION THROUGH A PRISM
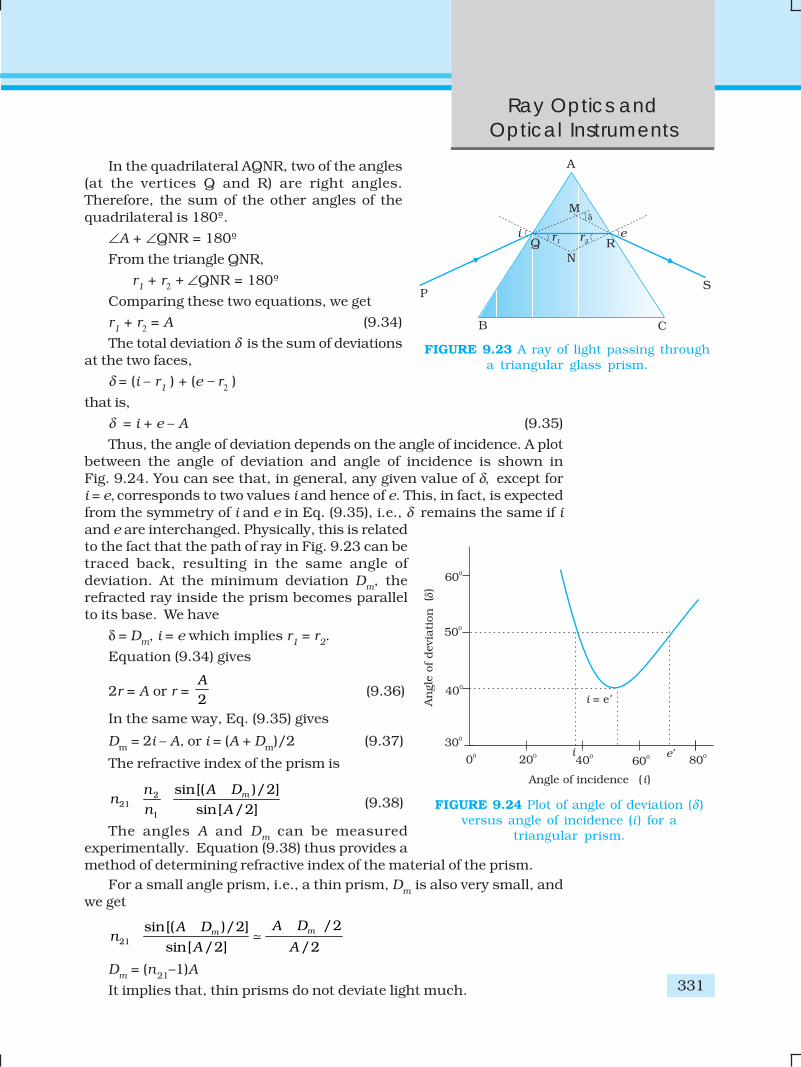
Figure 9.23 shows the passage of light through a triangular prism ABC.The angles of incidence and refraction at the first face AB are i and r1,while the angle of incidence (from glass to air) at the second face AC is r2and the angle of refraction or emergence e. The angle between theemergent ray RS and the direction of the incident ray PQ is called theangle of deviation, δ.
Ray Optics andOptical Instruments
331
In the quadrilateral AQNR, two of the angles(at the vertices Q and R) are right angles.Therefore, the sum of the other angles of thequadrilateral is 180º.
∠A + ∠QNR = 180º
From the triangle QNR,
r1 + r2 + ∠QNR = 180º
Comparing these two equations, we get
r1 + r2 = A (9.34)
The total deviation δ is the sum of deviationsat the two faces,
δ = (i – r1 ) + (e – r2 )
that is,
δ = i + e – A (9.35)
Thus, the angle of deviation depends on the angle of incidence. A plotbetween the angle of deviation and angle of incidence is shown inFig. 9.24. You can see that, in general, any given value of δ, except fori = e, corresponds to two values i and hence of e. This, in fact, is expectedfrom the symmetry of i and e in Eq. (9.35), i.e., δ remains the same if iand e are interchanged. Physically, this is relatedto the fact that the path of ray in Fig. 9.23 can betraced back, resulting in the same angle ofdeviation. At the minimum deviation Dm, therefracted ray inside the prism becomes parallelto its base. We have
δ = Dm, i = e which implies r1 = r2.
Equation (9.34) gives
2r = A or r = 2A
(9.36)
In the same way, Eq. (9.35) gives
Dm = 2i – A, or i = (A + Dm)/2 (9.37)
The refractive index of the prism is
221
1
sin[( )/2]sin[ /2]
mA Dnn
n A
(9.38)
The angles A and Dm can be measuredexperimentally. Equation (9.38) thus provides amethod of determining refractive index of the material of the prism.
For a small angle prism, i.e., a thin prism, Dm is also very small, andwe get
21
/2sin[( )/2]sin[ /2] /2
mm A DA Dn
A A
Dm = (n21–1)A
It implies that, thin prisms do not deviate light much.
FIGURE 9.23 A ray of light passing througha triangular glass prism.
FIGURE 9.24 Plot of angle of deviation (δ )versus angle of incidence (i ) for a
triangular prism.
Physics
332
9.7 DISPERSION BY A PRISM
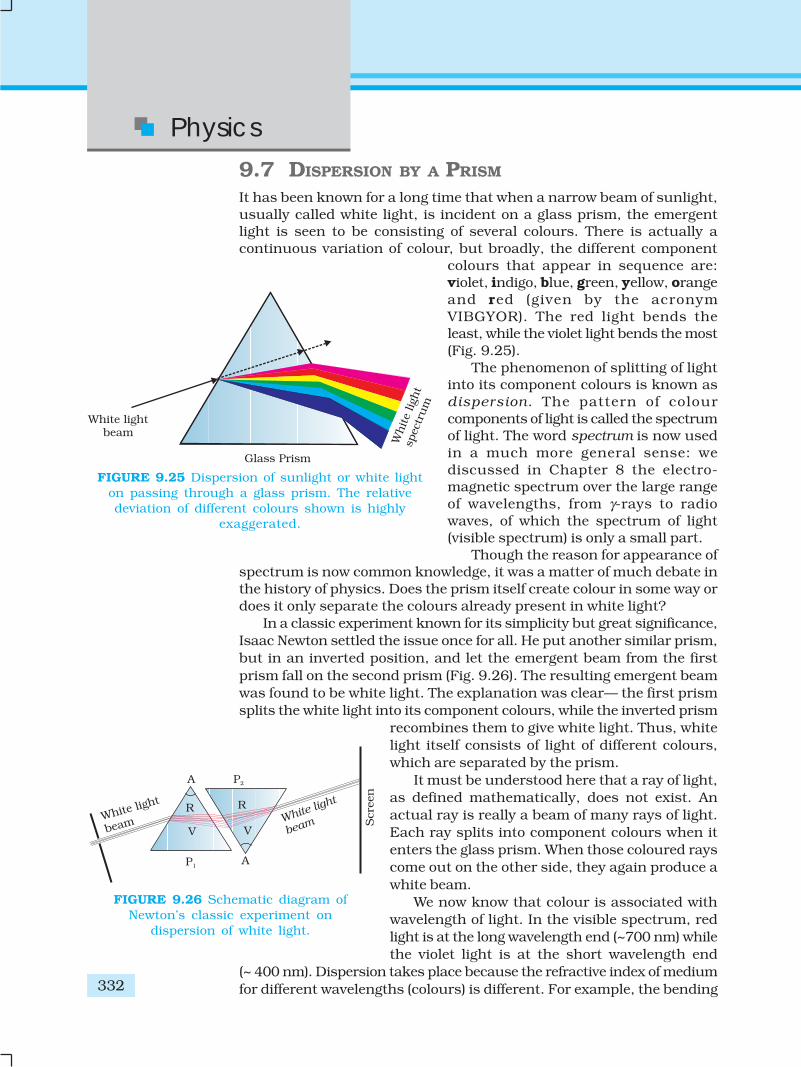
It has been known for a long time that when a narrow beam of sunlight,usually called white light, is incident on a glass prism, the emergentlight is seen to be consisting of several colours. There is actually acontinuous variation of colour, but broadly, the different component
colours that appear in sequence are:violet, indigo, blue, green, yellow, orangeand red (given by the acronymVIBGYOR). The red light bends theleast, while the violet light bends the most(Fig. 9.25).
The phenomenon of splitting of lightinto its component colours is known asdispersion. The pattern of colourcomponents of light is called the spectrumof light. The word spectrum is now usedin a much more general sense: wediscussed in Chapter 8 the electro-magnetic spectrum over the large rangeof wavelengths, from γ-rays to radiowaves, of which the spectrum of light(visible spectrum) is only a small part.
Though the reason for appearance ofspectrum is now common knowledge, it was a matter of much debate inthe history of physics. Does the prism itself create colour in some way ordoes it only separate the colours already present in white light?
In a classic experiment known for its simplicity but great significance,Isaac Newton settled the issue once for all. He put another similar prism,but in an inverted position, and let the emergent beam from the firstprism fall on the second prism (Fig. 9.26). The resulting emergent beamwas found to be white light. The explanation was clear— the first prismsplits the white light into its component colours, while the inverted prism
recombines them to give white light. Thus, whitelight itself consists of light of different colours,which are separated by the prism.
It must be understood here that a ray of light,as defined mathematically, does not exist. Anactual ray is really a beam of many rays of light.Each ray splits into component colours when itenters the glass prism. When those coloured rayscome out on the other side, they again produce awhite beam.
We now know that colour is associated withwavelength of light. In the visible spectrum, redlight is at the long wavelength end (~700 nm) whilethe violet light is at the short wavelength end
(~ 400 nm). Dispersion takes place because the refractive index of mediumfor different wavelengths (colours) is different. For example, the bending
FIGURE 9.25 Dispersion of sunlight or white lighton passing through a glass prism. The relativedeviation of different colours shown is highly
exaggerated.
FIGURE 9.26 Schematic diagram ofNewton’s classic experiment on
dispersion of white light.
Ray Optics andOptical Instruments
333
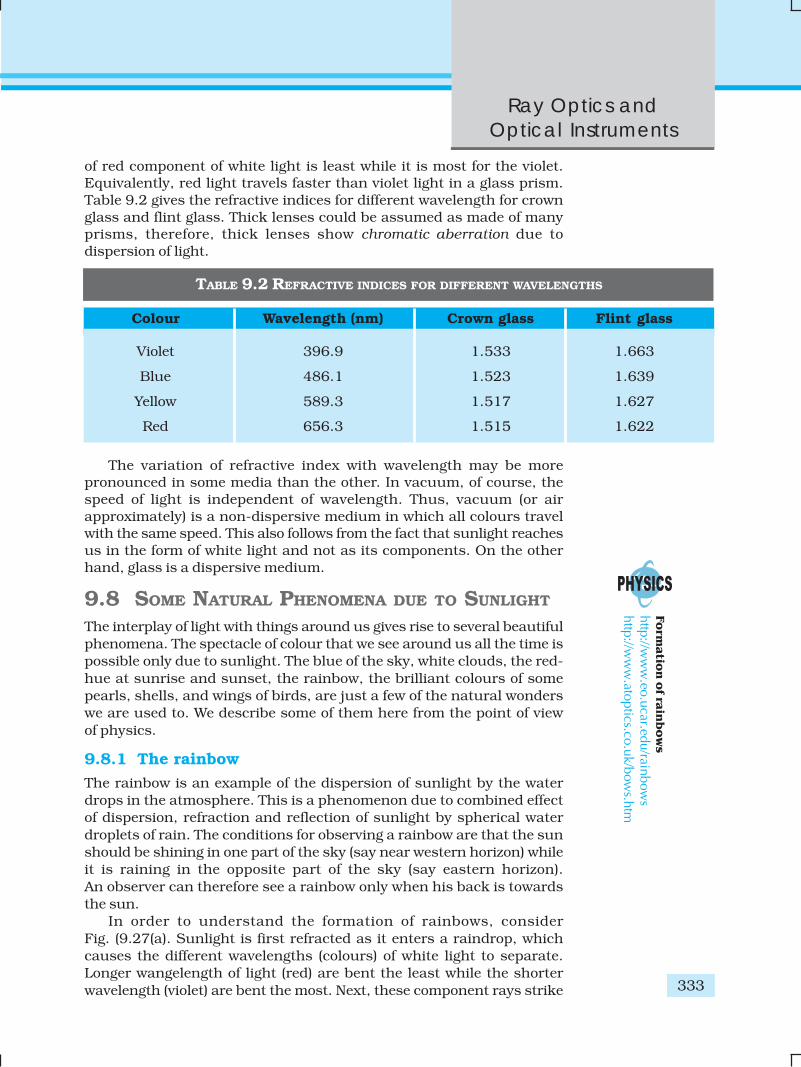
of red component of white light is least while it is most for the violet.Equivalently, red light travels faster than violet light in a glass prism.Table 9.2 gives the refractive indices for different wavelength for crownglass and flint glass. Thick lenses could be assumed as made of manyprisms, therefore, thick lenses show chromatic aberration due todispersion of light.
TABLE 9.2 REFRACTIVE INDICES FOR DIFFERENT WAVELENGTHS
Colour Wavelength (nm) Crown glass Flint glass
Violet 396.9 1.533 1.663
Blue 486.1 1.523 1.639
Yellow 589.3 1.517 1.627
Red 656.3 1.515 1.622
The variation of refractive index with wavelength may be morepronounced in some media than the other. In vacuum, of course, thespeed of light is independent of wavelength. Thus, vacuum (or airapproximately) is a non-dispersive medium in which all colours travelwith the same speed. This also follows from the fact that sunlight reachesus in the form of white light and not as its components. On the otherhand, glass is a dispersive medium.
9.8 SOME NATURAL PHENOMENA DUE TO SUNLIGHT
The interplay of light with things around us gives rise to several beautifulphenomena. The spectacle of colour that we see around us all the time ispossible only due to sunlight. The blue of the sky, white clouds, the red-hue at sunrise and sunset, the rainbow, the brilliant colours of somepearls, shells, and wings of birds, are just a few of the natural wonderswe are used to. We describe some of them here from the point of viewof physics.
9.8.1 The rainbowThe rainbow is an example of the dispersion of sunlight by the waterdrops in the atmosphere. This is a phenomenon due to combined effectof dispersion, refraction and reflection of sunlight by spherical waterdroplets of rain. The conditions for observing a rainbow are that the sunshould be shining in one part of the sky (say near western horizon) whileit is raining in the opposite part of the sky (say eastern horizon).An observer can therefore see a rainbow only when his back is towardsthe sun.
In order to understand the formation of rainbows, considerFig. (9.27(a). Sunlight is first refracted as it enters a raindrop, whichcauses the different wavelengths (colours) of white light to separate.Longer wangelength of light (red) are bent the least while the shorterwavelength (violet) are bent the most. Next, these component rays strike
Form
ation
of rain
bow
shttp://w
ww.eo.ucar.edu/rainbow
shttp://w
ww.atoptics.co.uk/bow
s.htm

Physics
334
the inner surface of the water drop and get internally reflected if the anglebetween the refracted ray and normal to the drop surface is greater thenthe critical angle (48º, in this case). The reflected light is refracted againas it comes out of the drop as shown in the figure. It is found that theviolet light emerges at an angle of 40º related to the incoming sunlightand red light emerges at an angle of 42º. For other colours, angles lie inbetween these two values.
FIGURE 9.27 Rainbow: (a) The sun rays incident on a water drop get refracted twiceand reflected internally by a drop; (b) Enlarge view of internal reflection and
refraction of a ray of light inside a drop form primary rainbow; and(c) secondary rainbow is formed by rays
undergoing internal reflection twiceinside the drop.
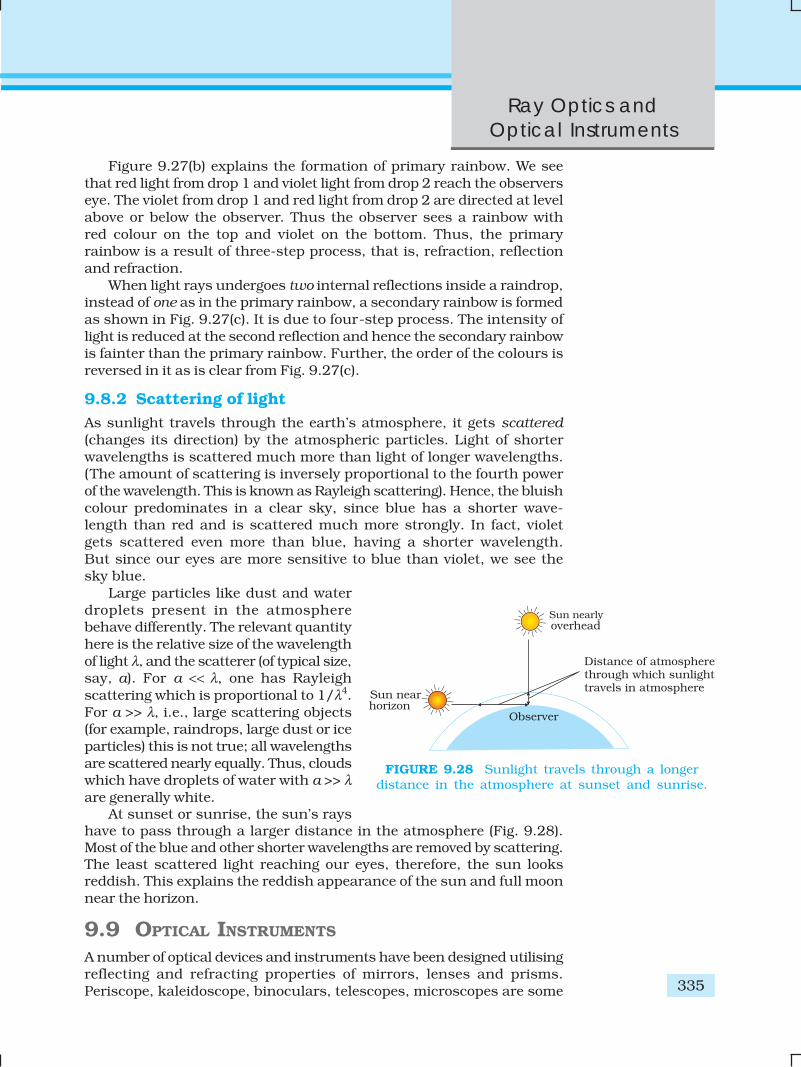
Ray Optics andOptical Instruments
335
Figure 9.27(b) explains the formation of primary rainbow. We seethat red light from drop 1 and violet light from drop 2 reach the observerseye. The violet from drop 1 and red light from drop 2 are directed at levelabove or below the observer. Thus the observer sees a rainbow withred colour on the top and violet on the bottom. Thus, the primaryrainbow is a result of three-step process, that is, refraction, reflectionand refraction.
When light rays undergoes two internal reflections inside a raindrop,instead of one as in the primary rainbow, a secondary rainbow is formedas shown in Fig. 9.27(c). It is due to four-step process. The intensity oflight is reduced at the second reflection and hence the secondary rainbowis fainter than the primary rainbow. Further, the order of the colours isreversed in it as is clear from Fig. 9.27(c).
9.8.2 Scattering of lightAs sunlight travels through the earth’s atmosphere, it gets scattered(changes its direction) by the atmospheric particles. Light of shorterwavelengths is scattered much more than light of longer wavelengths.(The amount of scattering is inversely proportional to the fourth powerof the wavelength. This is known as Rayleigh scattering). Hence, the bluishcolour predominates in a clear sky, since blue has a shorter wave-length than red and is scattered much more strongly. In fact, violetgets scattered even more than blue, having a shorter wavelength.But since our eyes are more sensitive to blue than violet, we see thesky blue.
Large particles like dust and waterdroplets present in the atmospherebehave differently. The relevant quantityhere is the relative size of the wavelengthof light λ, and the scatterer (of typical size,say, a). For a << λ, one has Rayleighscattering which is proportional to 1/λ4.For a >> λ, i.e., large scattering objects(for example, raindrops, large dust or iceparticles) this is not true; all wavelengthsare scattered nearly equally. Thus, cloudswhich have droplets of water with a >> λare generally white.
At sunset or sunrise, the sun’s rayshave to pass through a larger distance in the atmosphere (Fig. 9.28).Most of the blue and other shorter wavelengths are removed by scattering.The least scattered light reaching our eyes, therefore, the sun looksreddish. This explains the reddish appearance of the sun and full moonnear the horizon.
9.9 OPTICAL INSTRUMENTS
A number of optical devices and instruments have been designed utilisingreflecting and refracting properties of mirrors, lenses and prisms.Periscope, kaleidoscope, binoculars, telescopes, microscopes are some
FIGURE 9.28 Sunlight travels through a longerdistance in the atmosphere at sunset and sunrise.
Physics
336
examples of optical devices and instruments that are in common use.Our eye is, of course, one of the most important optical device the naturehas endowed us with. Starting with the eye, we then go on to describethe principles of working of the microscope and the telescope.
9.9.1 The eyeFigure 9.29 (a) shows the eye. Light enters the eye through a curvedfront surface, the cornea. It passes through the pupil which is the centralhole in the iris. The size of the pupil can change under control of muscles.The light is further focussed by the eye lens on the retina. The retina is afilm of nerve fibres covering the curved back surface of the eye. The retinacontains rods and cones which sense light intensity and colour,respectively, and transmit electrical signals via the optic nerve to the brainwhich finally processes this information. The shape (curvature) andtherefore the focal length of the lens can be modified somewhat by theciliary muscles. For example, when the muscle is relaxed, the focal lengthis about 2.5 cm and objects at infinity are in sharp focus on the retina.When the object is brought closer to the eye, in order to maintain thesame image-lens distance (≅ 2.5 cm), the focal length of the eye lensbecomes shorter by the action of the ciliary muscles. This property of theeye is called accommodation. If the object is too close to the eye, the lenscannot curve enough to focus the image on to the retina, and the imageis blurred. The closest distance for which the lens can focus light on theretina is called the least distance of distinct vision, or the near point.The standard value for normal vision is taken as 25 cm. (Often the nearpoint is given the symbol D.) This distance increases with age, becauseof the decreasing effectiveness of the ciliary muscle and the loss offlexibility of the lens. The near point may be as close as about 7 to 8 cmin a child ten years of age, and may increase to as much as 200 cm at 60years of age. Thus, if an elderly person tries to read a book at about 25 cmfrom the eye, the image appears blurred. This condition (defect of the eye)is called presbyopia. It is corrected by using a converging lens for reading.
Thus, our eyes are marvellous organs that have the capability tointerpret incoming electromagnetic waves as images through a complexprocess. These are our greatest assets and we must take proper care toprotect them. Imagine the world without a pair of functional eyes. Yetmany amongst us bravely face this challenge by effectively overcomingtheir limitations to lead a normal life. They deserve our appreciation fortheir courage and conviction.
In spite of all precautions and proactive action, our eyes may developsome defects due to various reasons. We shall restrict our discussion tosome common optical defects of the eye. For example, the light from adistant object arriving at the eye-lens may get converged at a point infront of the retina. This type of defect is called nearsightedness or myopia .This means that the eye is producing too much convergence in the incidentbeam. To compensate this, we interpose a concave lens between the eyeand the object, with the diverging effect desired to get the image focussedon the retina [Fig. 9.29(b)].
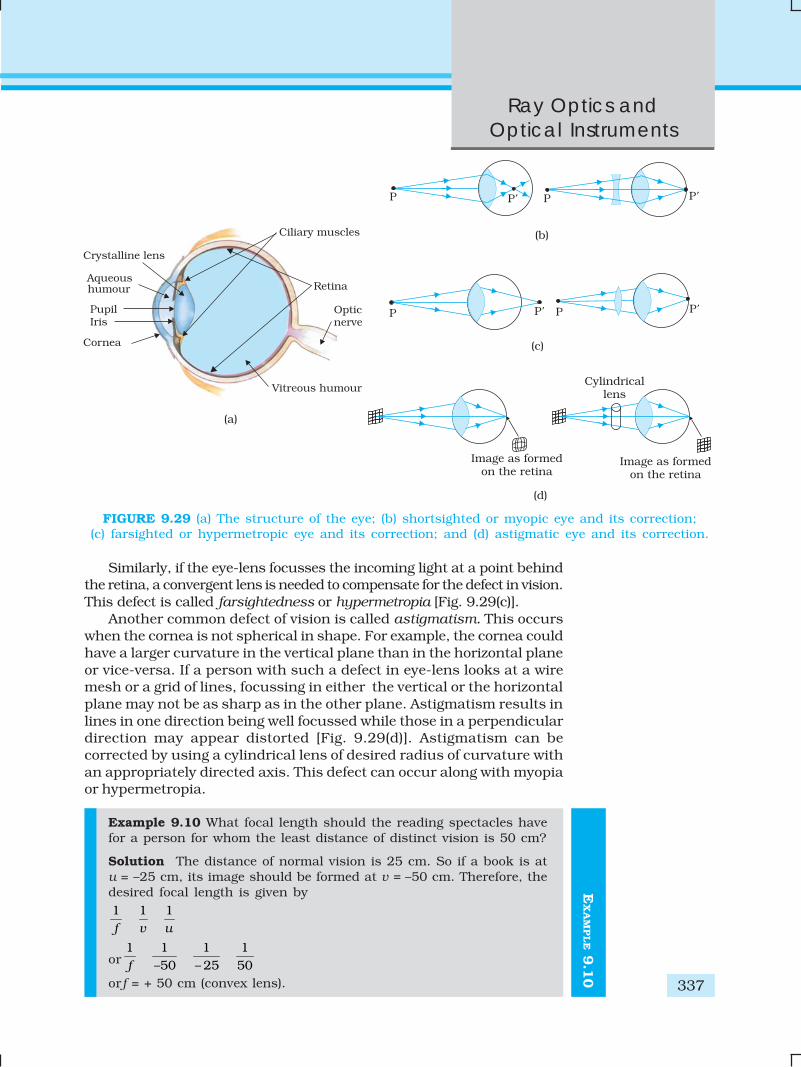
Ray Optics andOptical Instruments
337
EX
AM
PLE 9
.10
Similarly, if the eye-lens focusses the incoming light at a point behindthe retina, a convergent lens is needed to compensate for the defect in vision.This defect is called farsightedness or hypermetropia [Fig. 9.29(c)].
Another common defect of vision is called astigmatism. This occurswhen the cornea is not spherical in shape. For example, the cornea couldhave a larger curvature in the vertical plane than in the horizontal planeor vice-versa. If a person with such a defect in eye-lens looks at a wiremesh or a grid of lines, focussing in either the vertical or the horizontalplane may not be as sharp as in the other plane. Astigmatism results inlines in one direction being well focussed while those in a perpendiculardirection may appear distorted [Fig. 9.29(d)]. Astigmatism can becorrected by using a cylindrical lens of desired radius of curvature withan appropriately directed axis. This defect can occur along with myopiaor hypermetropia.
Example 9.10 What focal length should the reading spectacles havefor a person for whom the least distance of distinct vision is 50 cm?
Solution The distance of normal vision is 25 cm. So if a book is atu = –25 cm, its image should be formed at v = –50 cm. Therefore, thedesired focal length is given by1 1 1f v u
or1 1 1 1
–50 – 25 50f
orf = + 50 cm (convex lens).
FIGURE 9.29 (a) The structure of the eye; (b) shortsighted or myopic eye and its correction;(c) farsighted or hypermetropic eye and its correction; and (d) astigmatic eye and its correction.
Physics
338 EX
AM
PLE 9
.12
EX
AM
PLE 9
.11
Example 9.11(a) The far point of a myopic person is 80 cm in front of the eye. What
is the power of the lens required to enable him to see very distantobjects clearly?
(b) In what way does the corrective lens help the above person? Doesthe lens magnify very distant objects? Explain carefully.
(c) The above person prefers to remove his spectacles while readinga book. Explain why?
Solution(a) Solving as in the previous example, we find that the person should
use a concave lens of focal length = – 80 cm, i.e., of power = – 1.25dioptres.
(b) No. The concave lens, in fact, reduces the size of the object, butthe angle subtended by the distant object at the eye is the sameas the angle subtended by the image (at the far point) at the eye.The eye is able to see distant objects not because the correctivelens magnifies the object, but because it brings the object (i.e., itproduces virtual image of the object) at the far point of the eyewhich then can be focussed by the eye-lens on the retina.
(c) The myopic person may have a normal near point, i.e., about25 cm (or even less). In order to read a book with the spectacles,such a person must keep the book at a distance greater than25 cm so that the image of the book by the concave lens is producednot closer than 25 cm. The angular size of the book (or its image)at the greater distance is evidently less than the angular sizewhen the book is placed at 25 cm and no spectacles are needed.Hence, the person prefers to remove the spectacles while reading.
Example 9.12 (a) The near point of a hypermetropic person is 75 cmfrom the eye. What is the power of the lens required to enable theperson to read clearly a book held at 25 cm from the eye? (b) In whatway does the corrective lens help the above person? Does the lensmagnify objects held near the eye? (c) The above person prefers toremove the spectacles while looking at the sky. Explain why?
Solution(a) u = – 25 cm, v = – 75 cm
1/f = 1/25 – 1/75, i.e., f = 37.5 cm.The corrective lens needs to have a converging power of +2.67dioptres.
(b) The corrective lens produces a virtual image (at 75 cm) of an objectat 25 cm. The angular size of this image is the same as that of theobject. In this sense the lens does not magnify the object but merelybrings the object to the near point of the hypermetric eye, whichthen gets focussed on the retina. However, the angular size isgreater than that of the same object at the near point (75 cm)viewed without the spectacles.
(c) A hypermetropic eye may have normal far point i.e., it may haveenough converging power to focus parallel rays from infinity onthe retina of the shortened eyeball. Wearing spectacles of converginglenses (used for near vision) will amount to more converging powerthan needed for parallel rays. Hence the person prefers not to usethe spectacles for far objects.
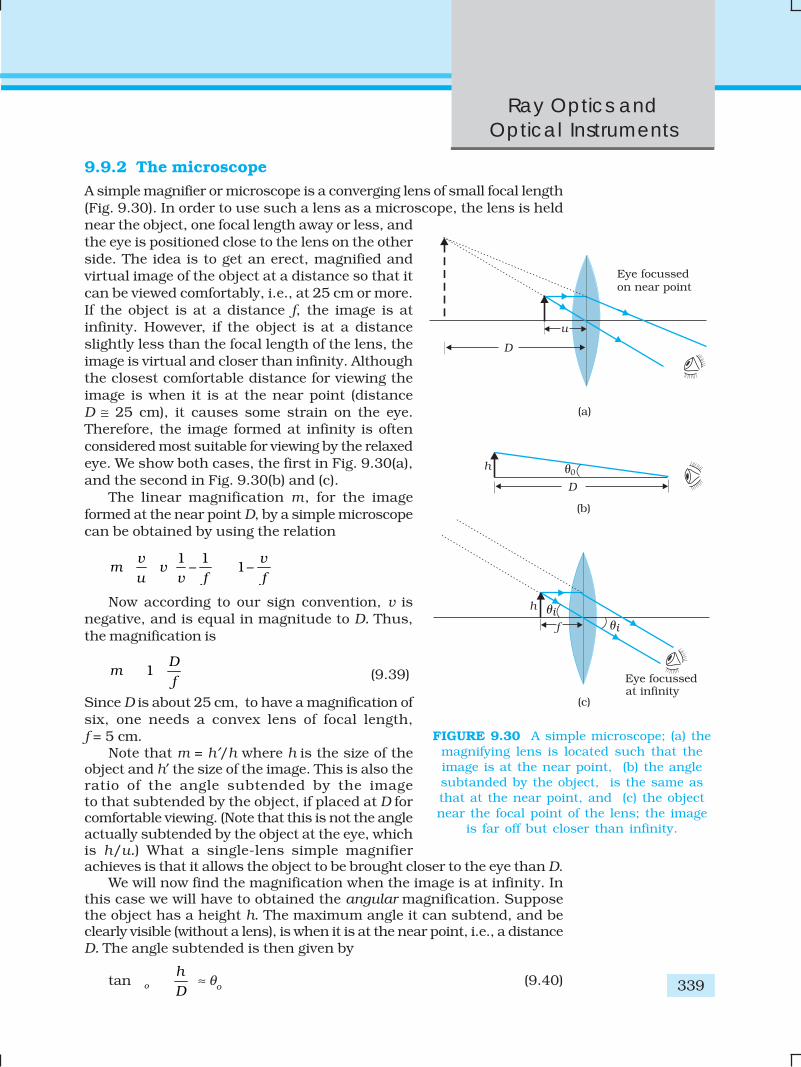
Ray Optics andOptical Instruments
339
9.9.2 The microscopeA simple magnifier or microscope is a converging lens of small focal length(Fig. 9.30). In order to use such a lens as a microscope, the lens is heldnear the object, one focal length away or less, andthe eye is positioned close to the lens on the otherside. The idea is to get an erect, magnified andvirtual image of the object at a distance so that itcan be viewed comfortably, i.e., at 25 cm or more.If the object is at a distance f, the image is atinfinity. However, if the object is at a distanceslightly less than the focal length of the lens, theimage is virtual and closer than infinity. Althoughthe closest comfortable distance for viewing theimage is when it is at the near point (distanceD ≅ 25 cm), it causes some strain on the eye.Therefore, the image formed at infinity is oftenconsidered most suitable for viewing by the relaxedeye. We show both cases, the first in Fig. 9.30(a),and the second in Fig. 9.30(b) and (c).
The linear magnification m , for the imageformed at the near point D, by a simple microscopecan be obtained by using the relation
1 1– 1–
v vm v
u v f f
Now according to our sign convention, v isnegative, and is equal in magnitude to D. Thus,the magnification is
1D
mf
(9.39)
Since D is about 25 cm, to have a magnification ofsix, one needs a convex lens of focal length,f = 5 cm.
Note that m = h′/h where h is the size of theobject and h′ the size of the image. This is also theratio of the angle subtended by the imageto that subtended by the object, if placed at D forcomfortable viewing. (Note that this is not the angleactually subtended by the object at the eye, whichis h/u.) What a single-lens simple magnifierachieves is that it allows the object to be brought closer to the eye than D.
We will now find the magnification when the image is at infinity. Inthis case we will have to obtained the angular magnification. Supposethe object has a height h. The maximum angle it can subtend, and beclearly visible (without a lens), is when it is at the near point, i.e., a distanceD. The angle subtended is then given by
tan o
h
D
≈ θo (9.40)
FIGURE 9.30 A simple microscope; (a) themagnifying lens is located such that theimage is at the near point, (b) the anglesubtanded by the object, is the same asthat at the near point, and (c) the objectnear the focal point of the lens; the image
is far off but closer than infinity.
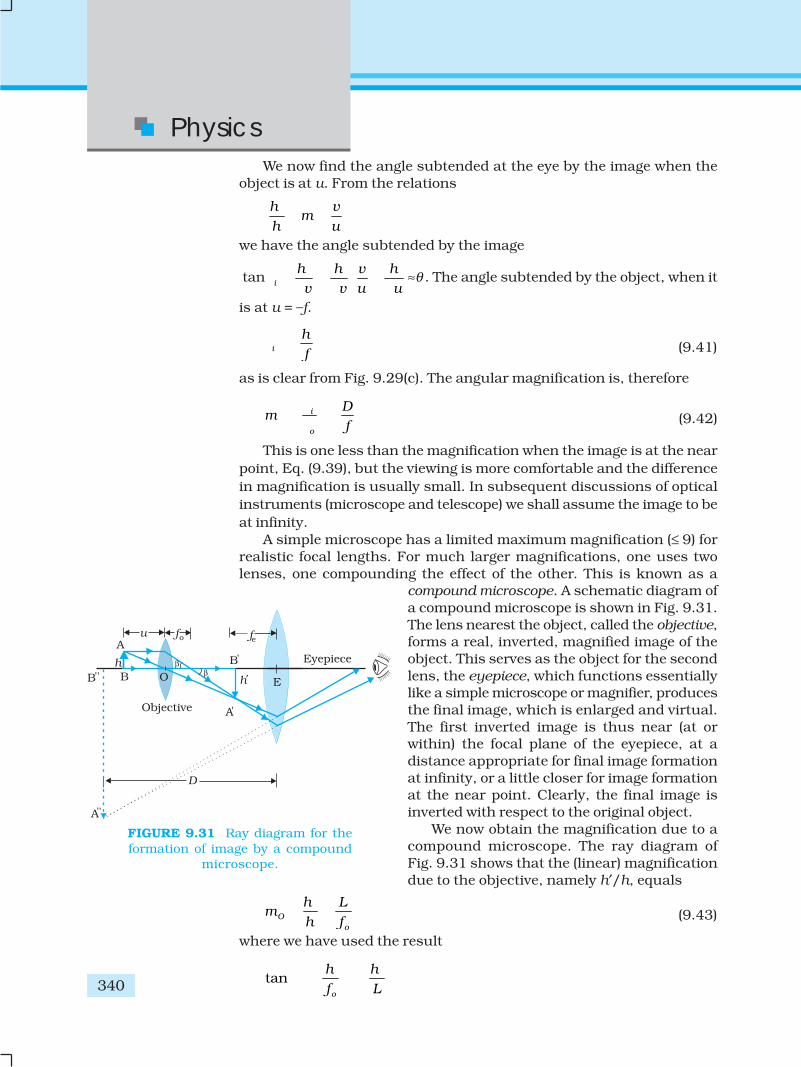
Physics
340
We now find the angle subtended at the eye by the image when theobject is at u. From the relations
h v
mh u
we have the angle subtended by the image
tan i
h h v h
v v u u
≈θ . The angle subtended by the object, when it
is at u = –f.
i
h
f
(9.41)
as is clear from Fig. 9.29(c). The angular magnification is, therefore
i
o
Dm
f
(9.42)
This is one less than the magnification when the image is at the nearpoint, Eq. (9.39), but the viewing is more comfortable and the differencein magnification is usually small. In subsequent discussions of opticalinstruments (microscope and telescope) we shall assume the image to beat infinity.
A simple microscope has a limited maximum magnification (≤ 9) forrealistic focal lengths. For much larger magnifications, one uses twolenses, one compounding the effect of the other. This is known as a
compound microscope. A schematic diagram ofa compound microscope is shown in Fig. 9.31.The lens nearest the object, called the objective,forms a real, inverted, magnified image of theobject. This serves as the object for the secondlens, the eyepiece, which functions essentiallylike a simple microscope or magnifier, producesthe final image, which is enlarged and virtual.The first inverted image is thus near (at orwithin) the focal plane of the eyepiece, at adistance appropriate for final image formationat infinity, or a little closer for image formationat the near point. Clearly, the final image isinverted with respect to the original object.
We now obtain the magnification due to acompound microscope. The ray diagram ofFig. 9.31 shows that the (linear) magnificationdue to the objective, namely h′/h, equals
Oo
h Lm
h f
(9.43)
where we have used the result
tano
h h
f L
FIGURE 9.31 Ray diagram for theformation of image by a compound
microscope.
Ray Optics andOptical Instruments
341
Here h′ is the size of the first image, the object size being h and fobeing the focal length of the objective. The first image is formed near thefocal point of the eyepiece. The distance L, i.e., the distance between thesecond focal point of the objective and the first focal point of the eyepiece(focal length fe ) is called the tube length of the compound microscope.
As the first inverted image is near the focal point of the eyepiece, weuse the result from the discussion above for the simple microscope toobtain the (angular) magnification me due to it [Eq. (9.39)], when thefinal image is formed at the near point, is
1ee
Dm
f
[9.44(a)]
When the final image is formed at infinity, the angular magnificationdue to the eyepiece [Eq. (9.42)] is
me = (D/fe ) [9.44(b)]
Thus, the total magnification [(according to Eq. (9.33)], when theimage is formed at infinity, is
o eo e
L Dm m m
f f
(9.45)
Clearly, to achieve a large magnification of a small object (hence thename microscope), the objective and eyepiece should have small focallengths. In practice, it is difficult to make the focal length much smallerthan 1 cm. Also large lenses are required to make L large.
For example, with an objective with fo = 1.0 cm, and an eyepiece withfocal length fe = 2.0 cm, and a tube length of 20 cm, the magnification is
o eo e
L Dm m m
f f
20 25
2501 2
Various other factors such as illumination of the object, contribute tothe quality and visibility of the image. In modern microscopes, multi-component lenses are used for both the objective and the eyepiece toimprove image quality by minimising various optical aberrations (defects)in lenses.
9.9.3 TelescopeThe telescope is used to provide angular magnification of distant objects(Fig. 9.32). It also has an objective and an eyepiece. But here, the objectivehas a large focal length and a much larger aperture than the eyepiece.Light from a distant object enters the objective and a real image is formedin the tube at its second focal point. The eyepiece magnifies this imageproducing a final inverted image. The magnifying power m is the ratio ofthe angle β subtended at the eye by the final image to the angle α whichthe object subtends at the lens or the eye. Hence
. o o
e e
f fhm
f h f
(9.46)
In this case, the length of the telescope tube is fo + fe.
Th
e w
orld
’s largest o
ptical te
lesco
pes
http://astro.nineplanets.org/bigeyes.html
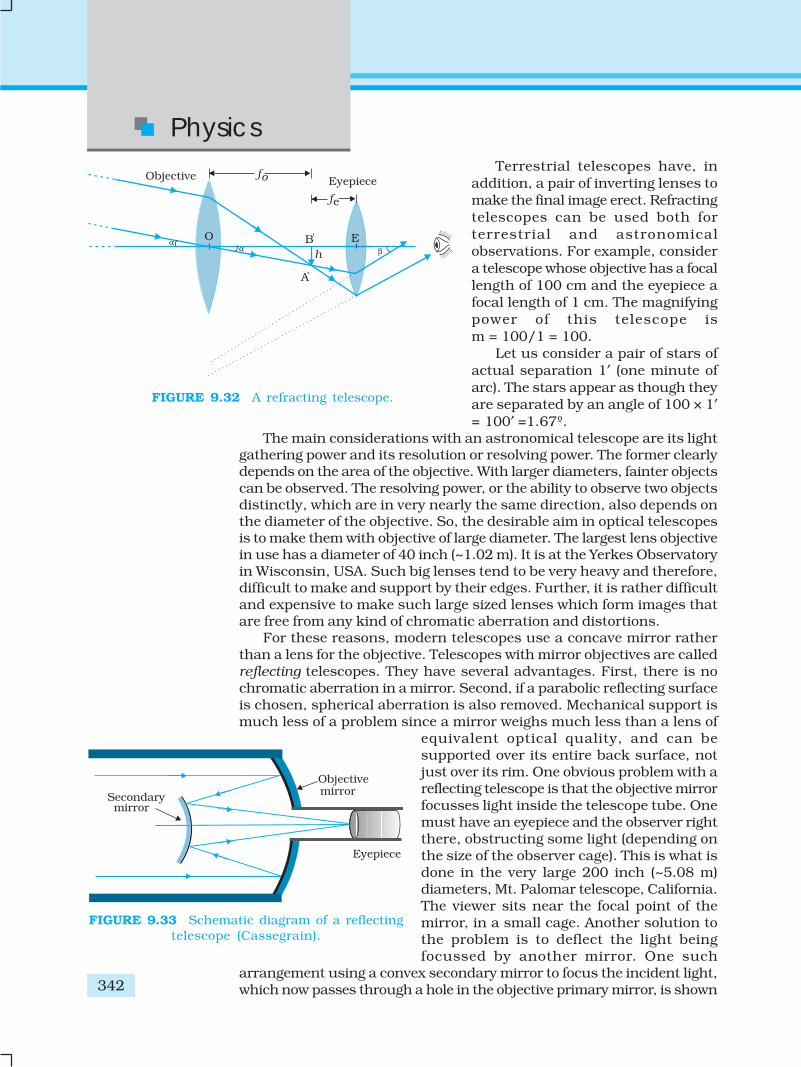
Physics
342
Terrestrial telescopes have, inaddition, a pair of inverting lenses tomake the final image erect. Refractingtelescopes can be used both forterrestrial and astronomicalobservations. For example, considera telescope whose objective has a focallength of 100 cm and the eyepiece afocal length of 1 cm. The magnifyingpower of this telescope ism = 100/1 = 100.
Let us consider a pair of stars ofactual separation 1′ (one minute ofarc). The stars appear as though theyare separated by an angle of 100 × 1′= 100′ =1.67º.
The main considerations with an astronomical telescope are its lightgathering power and its resolution or resolving power. The former clearlydepends on the area of the objective. With larger diameters, fainter objectscan be observed. The resolving power, or the ability to observe two objectsdistinctly, which are in very nearly the same direction, also depends onthe diameter of the objective. So, the desirable aim in optical telescopesis to make them with objective of large diameter. The largest lens objectivein use has a diameter of 40 inch (~1.02 m). It is at the Yerkes Observatoryin Wisconsin, USA. Such big lenses tend to be very heavy and therefore,difficult to make and support by their edges. Further, it is rather difficultand expensive to make such large sized lenses which form images thatare free from any kind of chromatic aberration and distortions.
For these reasons, modern telescopes use a concave mirror ratherthan a lens for the objective. Telescopes with mirror objectives are calledreflecting telescopes. They have several advantages. First, there is nochromatic aberration in a mirror. Second, if a parabolic reflecting surfaceis chosen, spherical aberration is also removed. Mechanical support ismuch less of a problem since a mirror weighs much less than a lens of
equivalent optical quality, and can besupported over its entire back surface, notjust over its rim. One obvious problem with areflecting telescope is that the objective mirrorfocusses light inside the telescope tube. Onemust have an eyepiece and the observer rightthere, obstructing some light (depending onthe size of the observer cage). This is what isdone in the very large 200 inch (~5.08 m)diameters, Mt. Palomar telescope, California.The viewer sits near the focal point of themirror, in a small cage. Another solution tothe problem is to deflect the light beingfocussed by another mirror. One such
arrangement using a convex secondary mirror to focus the incident light,which now passes through a hole in the objective primary mirror, is shown
FIGURE 9.32 A refracting telescope.
FIGURE 9.33 Schematic diagram of a reflectingtelescope (Cassegrain).
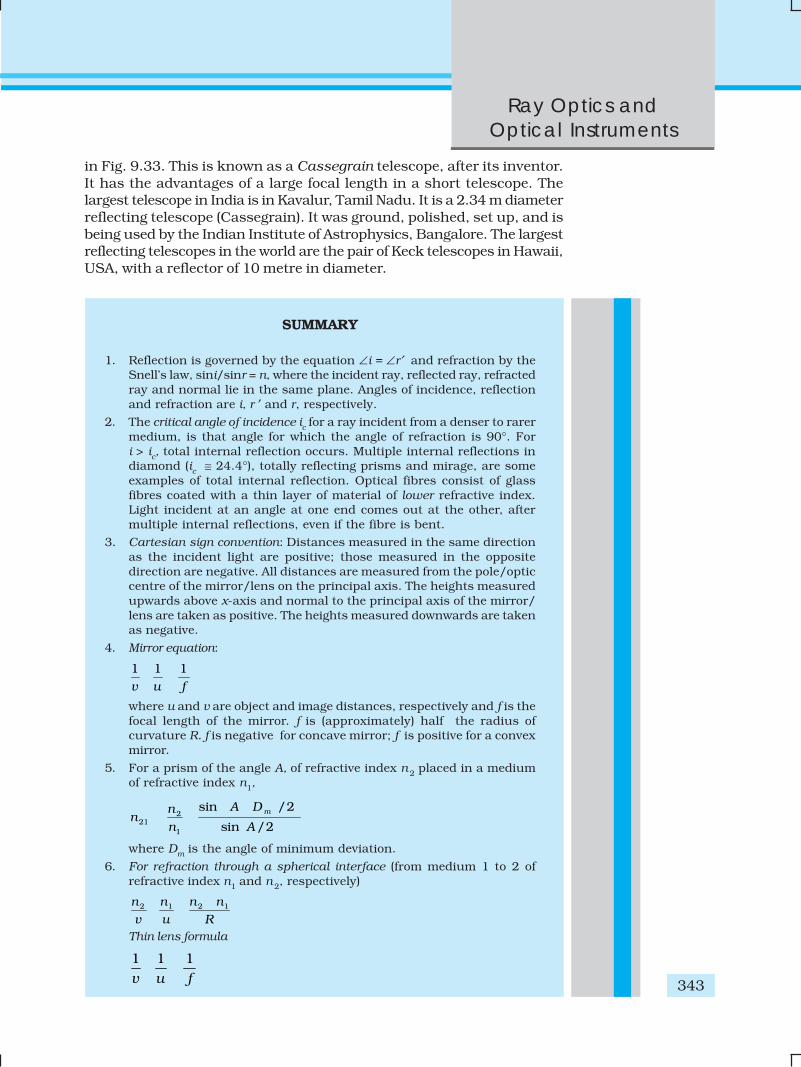
Ray Optics andOptical Instruments
343
SUMMARY
1. Reflection is governed by the equation ∠i = ∠r′ and refraction by theSnell’s law, sini/sinr = n, where the incident ray, reflected ray, refractedray and normal lie in the same plane. Angles of incidence, reflectionand refraction are i, r ′ and r, respectively.
2. The critical angle of incidence ic for a ray incident from a denser to rarermedium, is that angle for which the angle of refraction is 90°. Fori > ic, total internal reflection occurs. Multiple internal reflections indiamond (ic ≅ 24.4°), totally reflecting prisms and mirage, are someexamples of total internal reflection. Optical fibres consist of glassfibres coated with a thin layer of material of lower refractive index.Light incident at an angle at one end comes out at the other, aftermultiple internal reflections, even if the fibre is bent.
3. Cartesian sign convention: Distances measured in the same directionas the incident light are positive; those measured in the oppositedirection are negative. All distances are measured from the pole/opticcentre of the mirror/lens on the principal axis. The heights measuredupwards above x-axis and normal to the principal axis of the mirror/lens are taken as positive. The heights measured downwards are takenas negative.
4. Mirror equation:
1 1 1v u f
where u and v are object and image distances, respectively and f is thefocal length of the mirror. f is (approximately) half the radius ofcurvature R. f is negative for concave mirror; f is positive for a convexmirror.
5. For a prism of the angle A, of refractive index n 2 placed in a mediumof refractive index n1,
221
1
sin /2
sin /2mA Dn
nn A
where Dm is the angle of minimum deviation.
6. For refraction through a spherical interface (from medium 1 to 2 ofrefractive index n1 and n 2, respectively)
2 1 2 1n n n n
v u R
Thin lens formula
1 1 1v u f
in Fig. 9.33. This is known as a Cassegrain telescope, after its inventor.It has the advantages of a large focal length in a short telescope. Thelargest telescope in India is in Kavalur, Tamil Nadu. It is a 2.34 m diameterreflecting telescope (Cassegrain). It was ground, polished, set up, and isbeing used by the Indian Institute of Astrophysics, Bangalore. The largestreflecting telescopes in the world are the pair of Keck telescopes in Hawaii,USA, with a reflector of 10 metre in diameter.
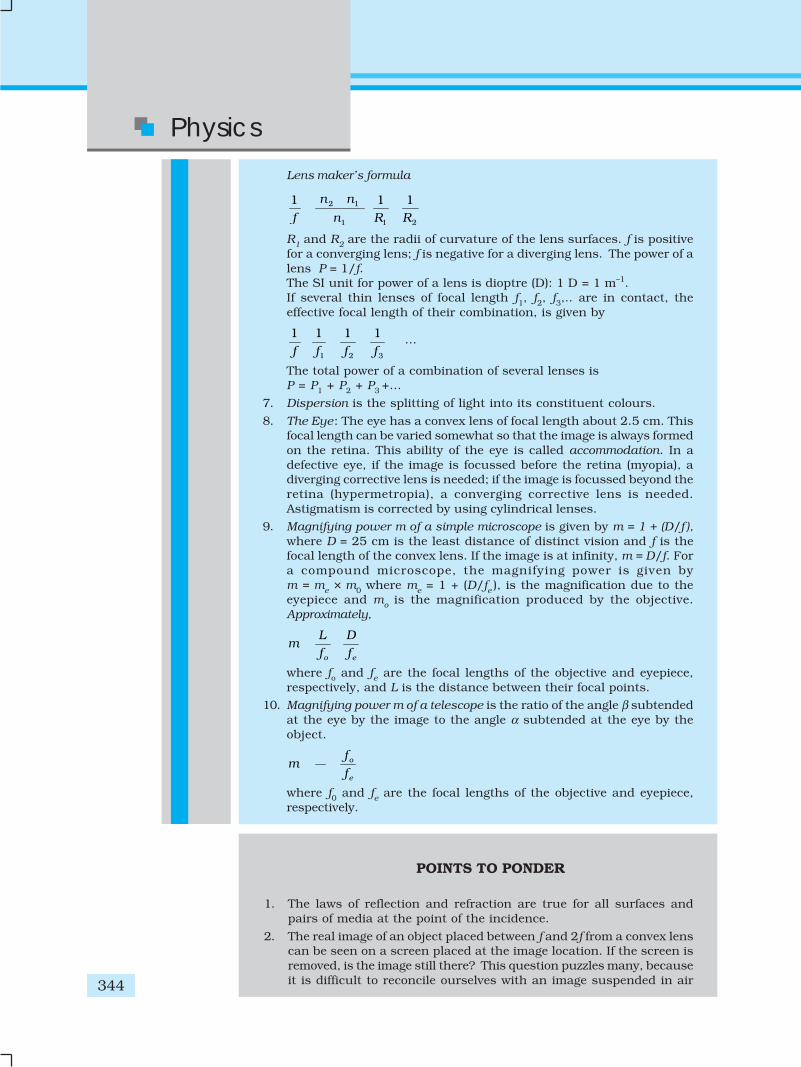
Physics
344
Lens maker’s formula
2 1
1 1 2
1 1 1n n
f n R R
R1 and R2 are the radii of curvature of the lens surfaces. f is positivefor a converging lens; f is negative for a diverging lens. The power of alens P = 1/f.The SI unit for power of a lens is dioptre (D): 1 D = 1 m–1.If several thin lenses of focal length f1, f2, f3,.. are in contact, theeffective focal length of their combination, is given by
1 2 3
1 1 1 1f f f f
…
The total power of a combination of several lenses isP = P1 + P2 + P3 + …
7. Dispersion is the splitting of light into its constituent colours.
8. The Eye: The eye has a convex lens of focal length about 2.5 cm. Thisfocal length can be varied somewhat so that the image is always formedon the retina. This ability of the eye is called accommodation. In adefective eye, if the image is focussed before the retina (myopia), adiverging corrective lens is needed; if the image is focussed beyond theretina (hypermetropia), a converging corrective lens is needed.Astigmatism is corrected by using cylindrical lenses.
9. Magnifying power m of a simple microscope is given by m = 1 + (D/f ),where D = 25 cm is the least distance of distinct vision and f is thefocal length of the convex lens. If the image is at infinity, m = D/f. Fora compound microscope, the magnifying power is given bym = me × m0 where me = 1 + (D/fe ), is the magnification due to theeyepiece and mo is the magnification produced by the objective.Approximately,
o e
L Dm
f f
where fo and fe are the focal lengths of the objective and eyepiece,respectively, and L is the distance between their focal points.
10. Magnifying power m of a telescope is the ratio of the angle β subtendedat the eye by the image to the angle α subtended at the eye by theobject.
o
e
fm
f
where f0 and fe are the focal lengths of the objective and eyepiece,respectively.
POINTS TO PONDER
1. The laws of reflection and refraction are true for all surfaces andpairs of media at the point of the incidence.
2. The real image of an object placed between f and 2f from a convex lenscan be seen on a screen placed at the image location. If the screen isremoved, is the image still there? This question puzzles many, becauseit is difficult to reconcile ourselves with an image suspended in air
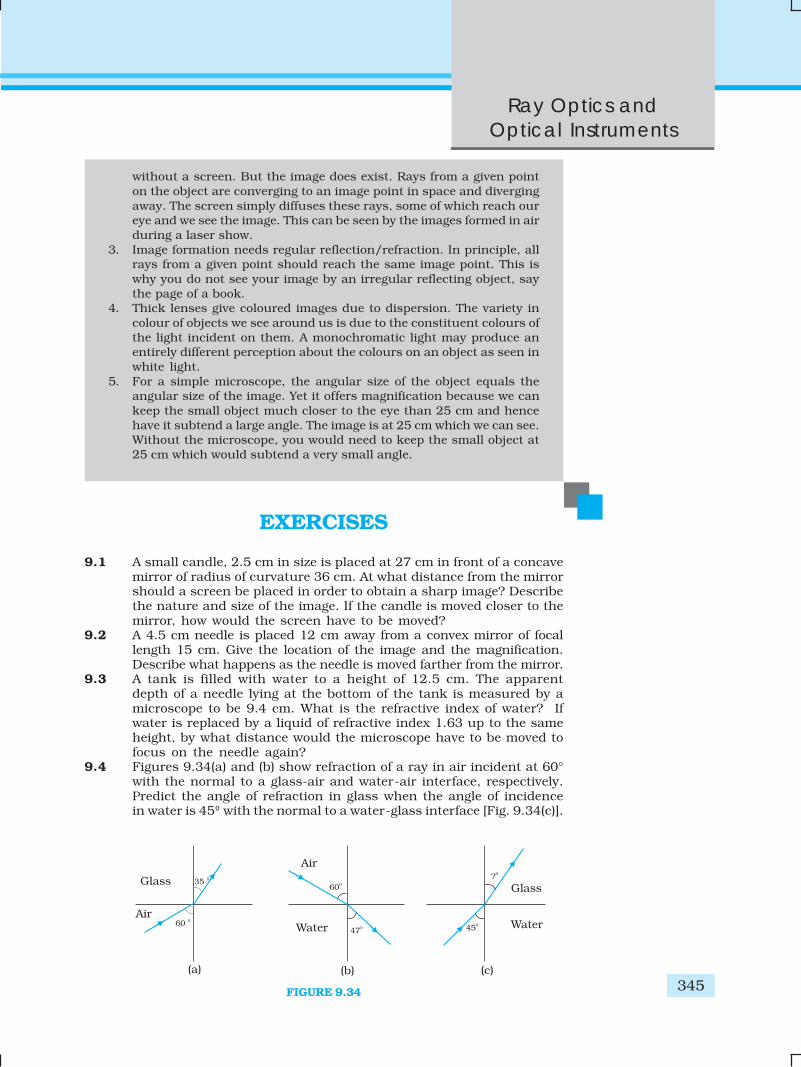
Ray Optics andOptical Instruments
345
EXERCISES
9.1 A small candle, 2.5 cm in size is placed at 27 cm in front of a concavemirror of radius of curvature 36 cm. At what distance from the mirrorshould a screen be placed in order to obtain a sharp image? Describethe nature and size of the image. If the candle is moved closer to themirror, how would the screen have to be moved?
9.2 A 4.5 cm needle is placed 12 cm away from a convex mirror of focallength 15 cm. Give the location of the image and the magnification.Describe what happens as the needle is moved farther from the mirror.
9.3 A tank is filled with water to a height of 12.5 cm. The apparentdepth of a needle lying at the bottom of the tank is measured by amicroscope to be 9.4 cm. What is the refractive index of water? Ifwater is replaced by a liquid of refractive index 1.63 up to the sameheight, by what distance would the microscope have to be moved tofocus on the needle again?
9.4 Figures 9.34(a) and (b) show refraction of a ray in air incident at 60°with the normal to a glass-air and water-air interface, respectively.Predict the angle of refraction in glass when the angle of incidencein water is 45º with the normal to a water-glass interface [Fig. 9.34(c)].
without a screen. But the image does exist. Rays from a given pointon the object are converging to an image point in space and divergingaway. The screen simply diffuses these rays, some of which reach oureye and we see the image. This can be seen by the images formed in airduring a laser show.
3. Image formation needs regular reflection/refraction. In principle, allrays from a given point should reach the same image point. This iswhy you do not see your image by an irregular reflecting object, saythe page of a book.
4. Thick lenses give coloured images due to dispersion. The variety incolour of objects we see around us is due to the constituent colours ofthe light incident on them. A monochromatic light may produce anentirely different perception about the colours on an object as seen inwhite light.
5. For a simple microscope, the angular size of the object equals theangular size of the image. Yet it offers magnification because we cankeep the small object much closer to the eye than 25 cm and hencehave it subtend a large angle. The image is at 25 cm which we can see.Without the microscope, you would need to keep the small object at25 cm which would subtend a very small angle.
FIGURE 9.34
Physics
346
9.5 A small bulb is placed at the bottom of a tank containing water to adepth of 80cm. What is the area of the surface of water throughwhich light from the bulb can emerge out? Refractive index of wateris 1.33. (Consider the bulb to be a point source.)
9.6 A prism is made of glass of unknown refractive index. A parallelbeam of light is incident on a face of the prism. The angle of minimumdeviation is measured to be 40°. What is the refractive index of thematerial of the prism? The refracting angle of the prism is 60°. Ifthe prism is placed in water (refractive index 1.33), predict the newangle of minimum deviation of a parallel beam of light.
9.7 Double-convex lenses are to be manufactured from a glass ofrefractive index 1.55, with both faces of the same radius ofcurvature. What is the radius of curvature required if the focal lengthis to be 20cm?
9.8 A beam of light converges at a point P. Now a lens is placed in thepath of the convergent beam 12cm from P. At what point does thebeam converge if the lens is (a) a convex lens of focal length 20cm,and (b) a concave lens of focal length 16cm?
9.9 An object of size 3.0cm is placed 14cm in front of a concave lens offocal length 21cm. Describe the image produced by the lens. Whathappens if the object is moved further away from the lens?
9.10 What is the focal length of a convex lens of focal length 30cm incontact with a concave lens of focal length 20cm? Is the system aconverging or a diverging lens? Ignore thickness of the lenses.
9.11 A compound microscope consists of an objective lens of focal length2.0 cm and an eyepiece of focal length 6.25 cm separated by adistance of 15cm. How far from the objective should an object beplaced in order to obtain the final image at (a) the least distance ofdistinct vision (25cm), and (b) at infinity? What is the magnifyingpower of the microscope in each case?
9.12 A person with a normal near point (25 cm) using a compoundmicroscope with objective of focal length 8.0 mm and an eyepiece offocal length 2.5cm can bring an object placed at 9.0mm from theobjective in sharp focus. What is the separation between the twolenses? Calculate the magnifying power of the microscope,
9.13 A small telescope has an objective lens of focal length 144cm andan eyepiece of focal length 6.0cm. What is the magnifying power ofthe telescope? What is the separation between the objective andthe eyepiece?
9.14 (a) A giant refracting telescope at an observatory has an objectivelens of focal length 15m. If an eyepiece of focal length 1.0cm isused, what is the angular magnification of the telescope?
(b) If this telescope is used to view the moon, what is the diameterof the image of the moon formed by the objective lens? Thediameter of the moon is 3.48 × 10⁶m, and the radius of lunarorbit is 3.8 × 10⁸m.
9.15 Use the mirror equation to deduce that:(a) an object placed between f and 2 f of a concave mirror produces
a real image beyond 2 f.(b) a convex mirror always produces a virtual image independent
of the location of the object.(c) the virtual image produced by a convex mirror is always
diminished in size and is located between the focus andthe pole.
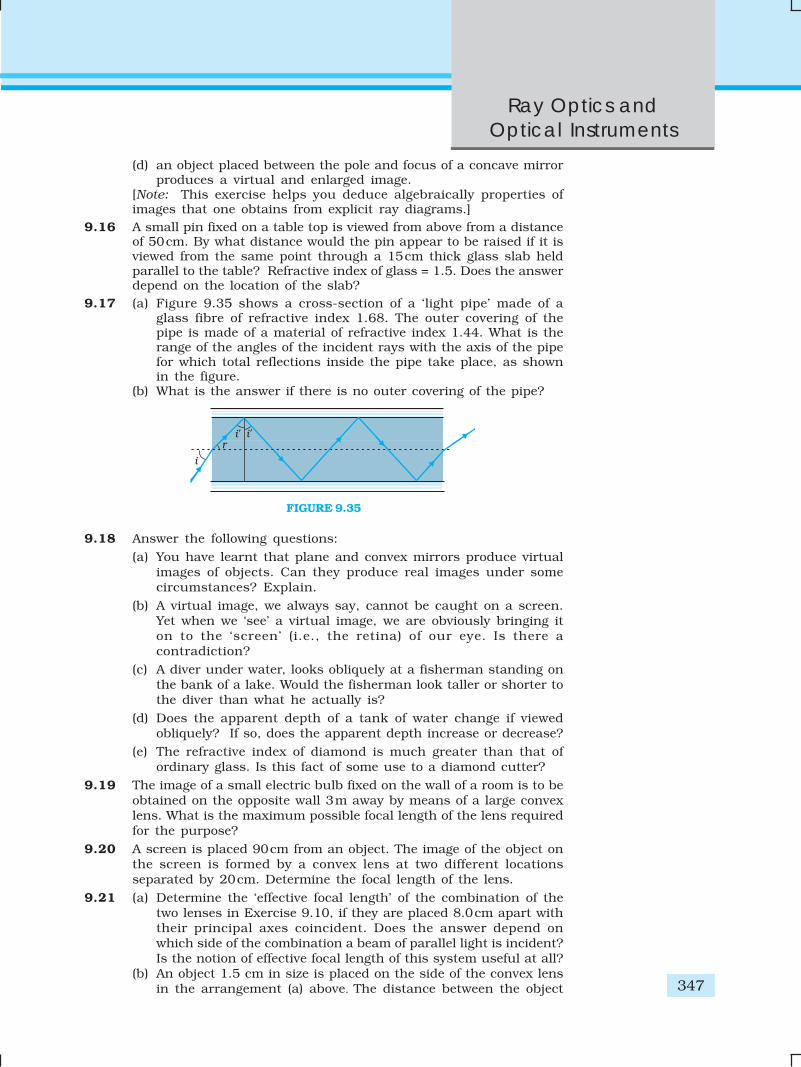
Ray Optics andOptical Instruments
347
(d) an object placed between the pole and focus of a concave mirrorproduces a virtual and enlarged image.
[Note: This exercise helps you deduce algebraically properties ofimages that one obtains from explicit ray diagrams.]
9.16 A small pin fixed on a table top is viewed from above from a distanceof 50cm. By what distance would the pin appear to be raised if it isviewed from the same point through a 15cm thick glass slab heldparallel to the table? Refractive index of glass = 1.5. Does the answerdepend on the location of the slab?
9.17 (a) Figure 9.35 shows a cross-section of a ‘light pipe’ made of aglass fibre of refractive index 1.68. The outer covering of thepipe is made of a material of refractive index 1.44. What is therange of the angles of the incident rays with the axis of the pipefor which total reflections inside the pipe take place, as shownin the figure.
(b) What is the answer if there is no outer covering of the pipe?
FIGURE 9.35
9.18 Answer the following questions:
(a) You have learnt that plane and convex mirrors produce virtualimages of objects. Can they produce real images under somecircumstances? Explain.
(b) A virtual image, we always say, cannot be caught on a screen.Yet when we ‘see’ a virtual image, we are obviously bringing iton to the ‘screen’ (i.e., the retina) of our eye. Is there acontradiction?
(c) A diver under water, looks obliquely at a fisherman standing onthe bank of a lake. Would the fisherman look taller or shorter tothe diver than what he actually is?
(d) Does the apparent depth of a tank of water change if viewedobliquely? If so, does the apparent depth increase or decrease?
(e) The refractive index of diamond is much greater than that ofordinary glass. Is this fact of some use to a diamond cutter?
9.19 The image of a small electric bulb fixed on the wall of a room is to beobtained on the opposite wall 3m away by means of a large convexlens. What is the maximum possible focal length of the lens requiredfor the purpose?
9.20 A screen is placed 90cm from an object. The image of the object onthe screen is formed by a convex lens at two different locationsseparated by 20cm. Determine the focal length of the lens.
9.21 (a) Determine the ‘effective focal length’ of the combination of thetwo lenses in Exercise 9.10, if they are placed 8.0cm apart withtheir principal axes coincident. Does the answer depend onwhich side of the combination a beam of parallel light is incident?Is the notion of effective focal length of this system useful at all?
(b) An object 1.5 cm in size is placed on the side of the convex lensin the arrangement (a) above. The distance between the object
Physics
348
and the convex lens is 40 cm. Determine the magnificationproduced by the two-lens system, and the size of the image.
9.22 At what angle should a ray of light be incident on the face of a prismof refracting angle 60° so that it just suffers total internal reflectionat the other face? The refractive index of the material of the prism is1.524.
9.23 You are given prisms made of crown glass and flint glass with awide variety of angles. Suggest a combination of prisms which will(a) deviate a pencil of white light without much dispersion,(b) disperse (and displace) a pencil of white light without much
deviation.9.24 For a normal eye, the far point is at infinity and the near point of
distinct vision is about 25cm in front of the eye. The cornea of theeye provides a converging power of about 40 dioptres, and the leastconverging power of the eye-lens behind the cornea is about 20dioptres. From this rough data estimate the range of accommodation(i.e., the range of converging power of the eye-lens) of a normal eye.
9.25 Does short-sightedness (myopia) or long-sightedness (hyper-metropia) imply necessarily that the eye has partially lost its abilityof accommodation? If not, what might cause these defects of vision?
9.26 A myopic person has been using spectacles of power –1.0 dioptrefor distant vision. During old age he also needs to use separatereading glass of power + 2.0 dioptres. Explain what may havehappened.
9.27 A person looking at a person wearing a shirt with a patterncomprising vertical and horizontal lines is able to see the verticallines more distinctly than the horizontal ones. What is this defectdue to? How is such a defect of vision corrected?
9.28 A man with normal near point (25 cm) reads a book with small printusing a magnifying glass: a thin convex lens of focal length 5 cm.(a) What is the closest and the farthest distance at which he should
keep the lens from the page so that he can read the book whenviewing through the magnifying glass?
(b) What is the maximum and the minimum angular magnification(magnifying power) possible using the above simple microscope?
9.29 A card sheet divided into squares each of size 1 mm2 is being viewedat a distance of 9 cm through a magnifying glass (a converging lensof focal length 9 cm) held close to the eye.(a) What is the magnification produced by the lens? How much is
the area of each square in the virtual image?(b) What is the angular magnification (magnifying power) of the
lens?(c) Is the magnification in (a) equal to the magnifying power in (b)?
Explain.9.30 (a) At what distance should the lens be held from the figure in
Exercise 9.29 in order to view the squares distinctly with themaximum possible magnifying power?
(b) What is the magnification in this case?(c) Is the magnification equal to the magnifying power in this case?
Explain.9.31 What should be the distance between the object in Exercise 9.30
and the magnifying glass if the virtual image of each square in thefigure is to have an area of 6.25 mm2. Would you be able to see thesquares distinctly with your eyes very close to the magnifier?
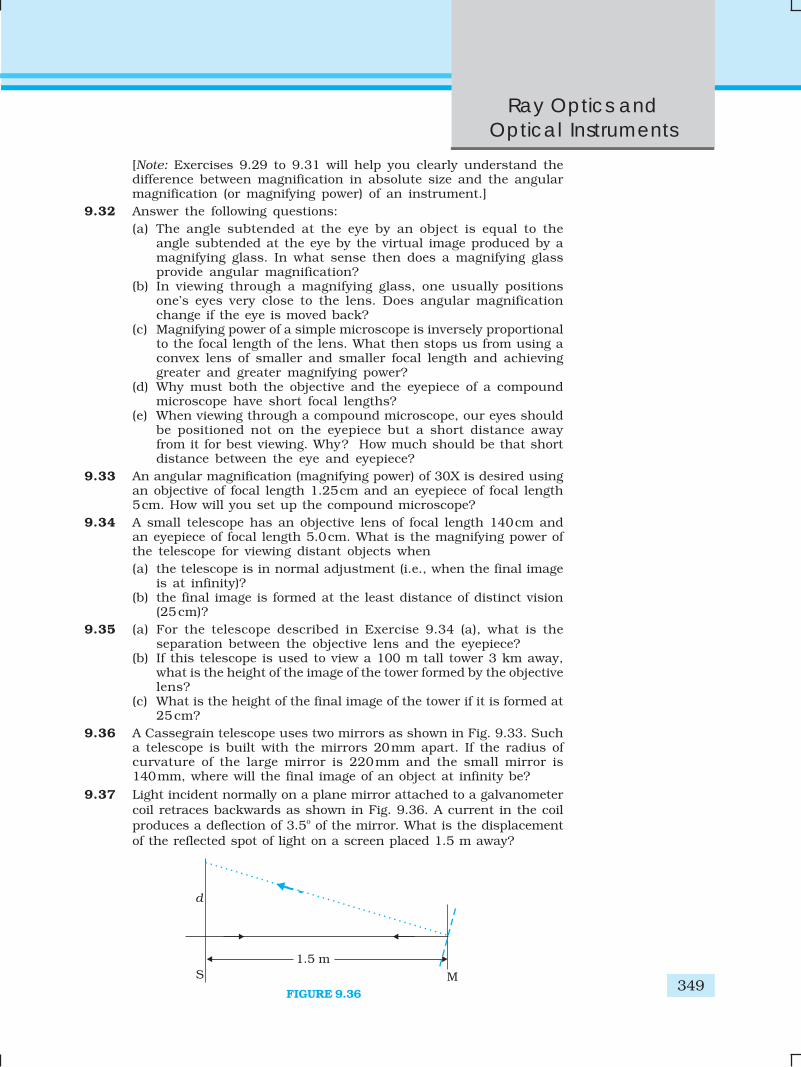
Ray Optics andOptical Instruments
349
[Note: Exercises 9.29 to 9.31 will help you clearly understand thedifference between magnification in absolute size and the angularmagnification (or magnifying power) of an instrument.]
9.32 Answer the following questions:(a) The angle subtended at the eye by an object is equal to the
angle subtended at the eye by the virtual image produced by amagnifying glass. In what sense then does a magnifying glassprovide angular magnification?
(b) In viewing through a magnifying glass, one usually positionsone’s eyes very close to the lens. Does angular magnificationchange if the eye is moved back?
(c) Magnifying power of a simple microscope is inversely proportionalto the focal length of the lens. What then stops us from using aconvex lens of smaller and smaller focal length and achievinggreater and greater magnifying power?
(d) Why must both the objective and the eyepiece of a compoundmicroscope have short focal lengths?
(e) When viewing through a compound microscope, our eyes shouldbe positioned not on the eyepiece but a short distance awayfrom it for best viewing. Why? How much should be that shortdistance between the eye and eyepiece?
9.33 An angular magnification (magnifying power) of 30X is desired usingan objective of focal length 1.25cm and an eyepiece of focal length5cm. How will you set up the compound microscope?
9.34 A small telescope has an objective lens of focal length 140cm andan eyepiece of focal length 5.0cm. What is the magnifying power ofthe telescope for viewing distant objects when(a) the telescope is in normal adjustment (i.e., when the final image
is at infinity)?(b) the final image is formed at the least distance of distinct vision
(25cm)?9.35 (a) For the telescope described in Exercise 9.34 (a), what is the
separation between the objective lens and the eyepiece?(b) If this telescope is used to view a 100 m tall tower 3 km away,
what is the height of the image of the tower formed by the objectivelens?
(c) What is the height of the final image of the tower if it is formed at25cm?
9.36 A Cassegrain telescope uses two mirrors as shown in Fig. 9.33. Sucha telescope is built with the mirrors 20mm apart. If the radius ofcurvature of the large mirror is 220mm and the small mirror is140mm, where will the final image of an object at infinity be?
9.37 Light incident normally on a plane mirror attached to a galvanometercoil retraces backwards as shown in Fig. 9.36. A current in the coilproduces a deflection of 3.5o of the mirror. What is the displacementof the reflected spot of light on a screen placed 1.5 m away?
FIGURE 9.36
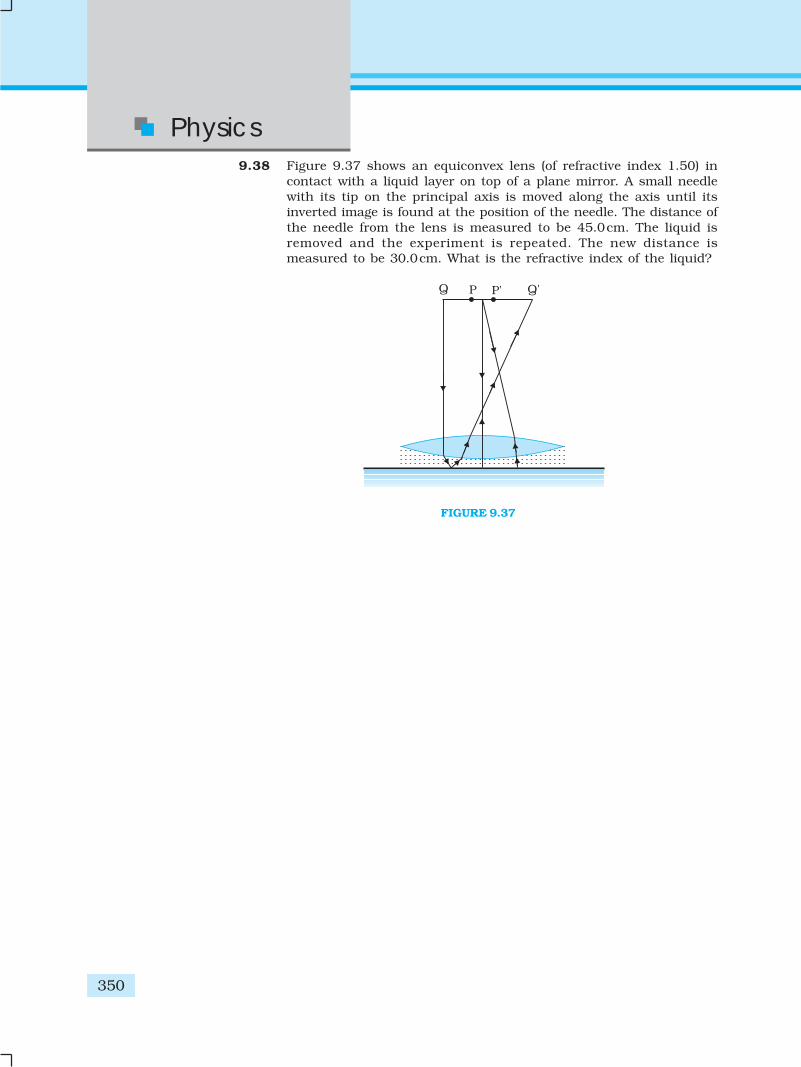
Physics
350
9.38 Figure 9.37 shows an equiconvex lens (of refractive index 1.50) incontact with a liquid layer on top of a plane mirror. A small needlewith its tip on the principal axis is moved along the axis until itsinverted image is found at the position of the needle. The distance ofthe needle from the lens is measured to be 45.0cm. The liquid isremoved and the experiment is repeated. The new distance ismeasured to be 30.0cm. What is the refractive index of the liquid?
FIGURE 9.37
351
Wave Optics
Chapter Ten
WAVE OPTICS
10.1 INTRODUCTION
In 1637 Descartes gave the corpuscular model of light and derived Snell’s
law. It explained the laws of reflection and refraction of light at an interface.
The corpuscular model predicted that if the ray of light (on refraction)
bends towards the normal then the speed of light would be greater in the
second medium. This corpuscular model of light was further developed
by Isaac Newton in his famous book entitled OPTICKS and because of
the tremendous popularity of this book, the corpuscular model is very
often attributed to Newton.
In 1678, the Dutch physicist Christiaan Huygens put forward the
wave theory of light – it is this wave model of light that we will discuss in
this chapter. As we will see, the wave model could satisfactorily explain
the phenomena of reflection and refraction; however, it predicted that on
refraction if the wave bends towards the normal then the speed of light
would be less in the second medium. This is in contradiction to the
prediction made by using the corpuscular model of light. It was much
later confirmed by experiments where it was shown that the speed of
light in water is less than the speed in air confirming the prediction of the
wave model; Foucault carried out this experiment in 1850.
The wave theory was not readily accepted primarily because of
Newton’s authority and also because light could travel through vacuum
Physics
352
and it was felt that a wave would always require a medium to propagate
from one point to the other. However, when Thomas Young performed
his famous interference experiment in 1801, it was firmly established
that light is indeed a wave phenomenon. The wavelength of visible
light was measured and found to be extremely small; for example, the
wavelength of yellow light is about 0.5 µm. Because of the smallness
of the wavelength of visible light (in comparison to the dimensions of
typical mirrors and lenses), light can be assumed to approximately
travel in straight lines. This is the field of geometrical optics, which we
had discussed in the previous chapter. Indeed, the branch of optics in
which one completely neglects the finiteness of the wavelength is called
geometrical optics and a ray is defined as the path of energy
propagation in the limit of wavelength tending to zero.
After the interference experiment of Young in 1801, for the next 40
years or so, many experiments were carried out involving the
interference and diffraction of lightwaves; these experiments could only
be satisfactorily explained by assuming a wave model of light. Thus,
around the middle of the nineteenth century, the wave theory seemed
to be very well established. The only major difficulty was that since it
was thought that a wave required a medium for its propagation, how
could light waves propagate through vacuum. This was explained
when Maxwell put forward his famous electromagnetic theory of light.
Maxwell had developed a set of equations describing the laws of
electricity and magnetism and using these equations he derived what
is known as the wave equation from which he predicted the existence
of electromagnetic waves*. From the wave equation, Maxwell could
calculate the speed of electromagnetic waves in free space and he found
that the theoretical value was very close to the measured value of speed
of l ight. From this, he propounded that l ight must be an
electromagnetic wave. Thus, according to Maxwell, light waves are
associated with changing electric and magnetic fields; changing electric
field produces a time and space varying magnetic field and a changing
magnetic field produces a time and space varying electric field. The
changing electric and magnetic fields result in the propagation of
electromagnetic waves (or light waves) even in vacuum.
In this chapter we will first discuss the original formulation of the
Huygens principle and derive the laws of reflection and refraction. In
Sections 10.4 and 10.5, we will discuss the phenomenon of interference
which is based on the principle of superposition. In Section 10.6 we
will discuss the phenomenon of diffraction which is based on Huygens-
Fresnel principle. Finally in Section 10.7 we will discuss the
phenomenon of polarisation which is based on the fact that the light
waves are transverse electromagnetic waves.
* Maxwell had predicted the existence of electromagnetic waves around 1855; it
was much later (around 1890) that Heinrich Hertz produced radiowaves in the
laboratory. J.C. Bose and G. Marconi made practical applications of the Hertzian
waves
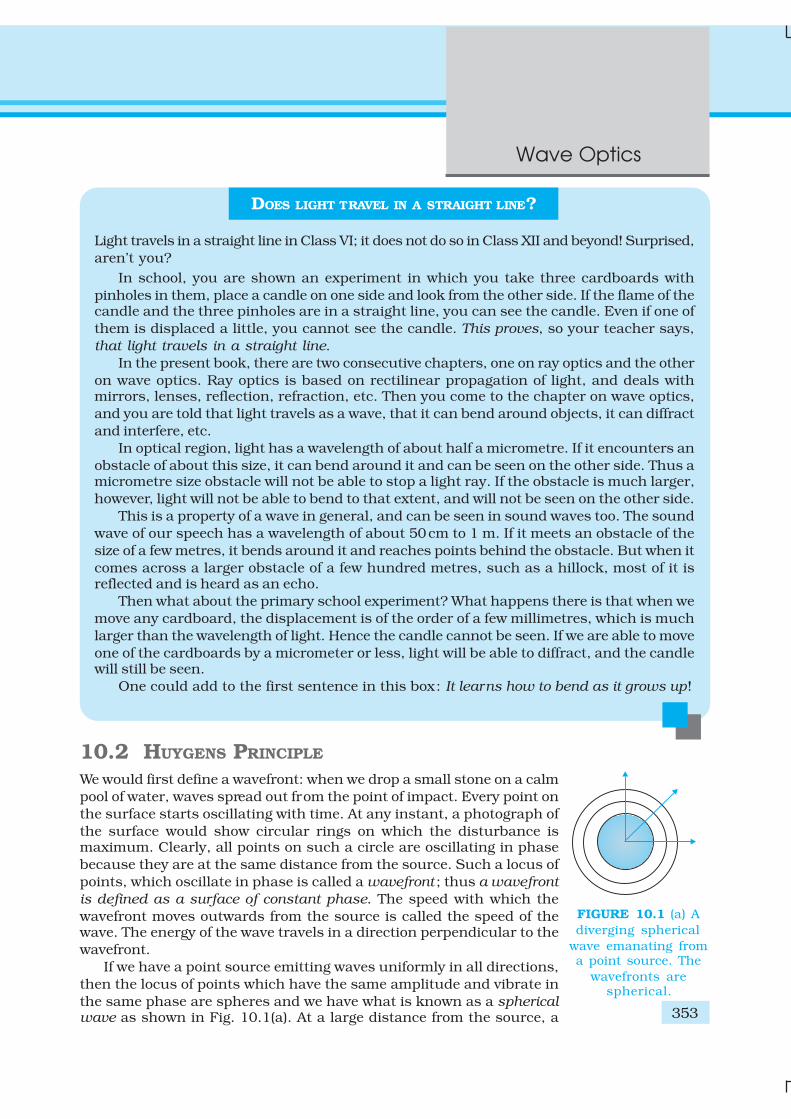
353
Wave Optics
10.2 HUYGENS PRINCIPLE
We would first define a wavefront: when we drop a small stone on a calm
pool of water, waves spread out from the point of impact. Every point on
the surface starts oscillating with time. At any instant, a photograph of
the surface would show circular rings on which the disturbance ismaximum. Clearly, all points on such a circle are oscillating in phase
because they are at the same distance from the source. Such a locus of
points, which oscillate in phase is called a wavefront ; thus a wavefront
is defined as a surface of constant phase. The speed with which the
wavefront moves outwards from the source is called the speed of thewave. The energy of the wave travels in a direction perpendicular to the
wavefront.
If we have a point source emitting waves uniformly in all directions,
then the locus of points which have the same amplitude and vibrate in
the same phase are spheres and we have what is known as a sphericalwave as shown in Fig. 10.1(a). At a large distance from the source, a
DOES LIGHT TRAVEL IN A STRAIGHT LINE?
Light travels in a straight line in Class VI; it does not do so in Class XII and beyond! Surprised,
aren’t you?
In school, you are shown an experiment in which you take three cardboards with
pinholes in them, place a candle on one side and look from the other side. If the flame of thecandle and the three pinholes are in a straight line, you can see the candle. Even if one of
them is displaced a little, you cannot see the candle. This proves, so your teacher says,
that light travels in a straight line.
In the present book, there are two consecutive chapters, one on ray optics and the other
on wave optics. Ray optics is based on rectilinear propagation of light, and deals withmirrors, lenses, reflection, refraction, etc. Then you come to the chapter on wave optics,
and you are told that light travels as a wave, that it can bend around objects, it can diffract
and interfere, etc.
In optical region, light has a wavelength of about half a micrometre. If it encounters an
obstacle of about this size, it can bend around it and can be seen on the other side. Thus amicrometre size obstacle will not be able to stop a light ray. If the obstacle is much larger,
however, light will not be able to bend to that extent, and will not be seen on the other side.
This is a property of a wave in general, and can be seen in sound waves too. The sound
wave of our speech has a wavelength of about 50cm to 1 m. If it meets an obstacle of the
size of a few metres, it bends around it and reaches points behind the obstacle. But when it
comes across a larger obstacle of a few hundred metres, such as a hillock, most of it isreflected and is heard as an echo.
Then what about the primary school experiment? What happens there is that when we
move any cardboard, the displacement is of the order of a few millimetres, which is much
larger than the wavelength of light. Hence the candle cannot be seen. If we are able to move
one of the cardboards by a micrometer or less, light will be able to diffract, and the candlewill still be seen.
One could add to the first sentence in this box: It learns how to bend as it grows up!
FIGURE 10.1 (a) A
diverging spherical
wave emanating froma point source. The
wavefronts arespherical.
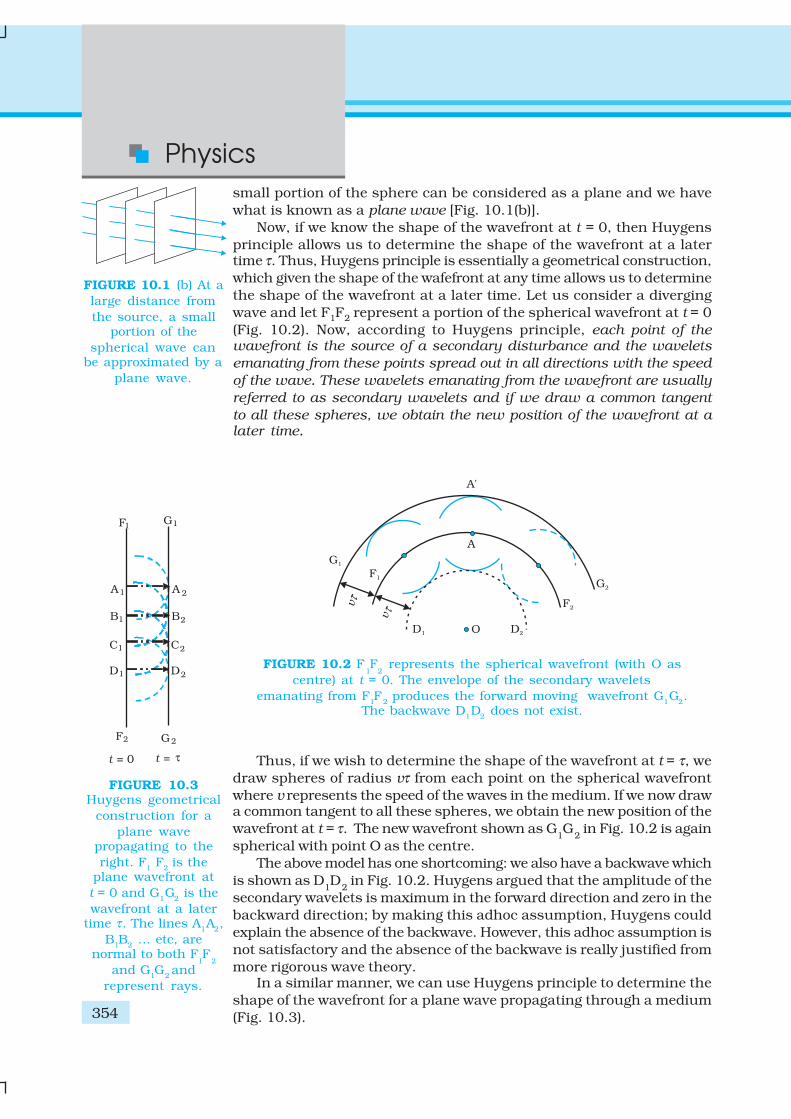
Physics
354
small portion of the sphere can be considered as a plane and we have
what is known as a plane wave [Fig. 10.1(b)].
Now, if we know the shape of the wavefront at t = 0, then Huygens
principle allows us to determine the shape of the wavefront at a latertime τ. Thus, Huygens principle is essentially a geometrical construction,
which given the shape of the wafefront at any time allows us to determine
the shape of the wavefront at a later time. Let us consider a diverging
wave and let F1F2 represent a portion of the spherical wavefront at t = 0
(Fig. 10.2). Now, according to Huygens principle, each point of thewavefront is the source of a secondary disturbance and the wavelets
emanating from these points spread out in all directions with the speed
of the wave. These wavelets emanating from the wavefront are usually
referred to as secondary wavelets and if we draw a common tangent
to all these spheres, we obtain the new position of the wavefront at alater time.
FIGURE 10.1 (b) At a
large distance from
the source, a smallportion of the
spherical wave canbe approximated by a
plane wave.
FIGURE 10.2 F1F
2 represents the spherical wavefront (with O as
centre) at t = 0. The envelope of the secondary wavelets
emanating from F1F
2 produces the forward moving wavefront G
1G
2.
The backwave D1D
2 does not exist.
Thus, if we wish to determine the shape of the wavefront at t = τ, we
draw spheres of radius vτ from each point on the spherical wavefront
where v represents the speed of the waves in the medium. If we now drawa common tangent to all these spheres, we obtain the new position of the
wavefront at t = τ. The new wavefront shown as G1G
2 in Fig. 10.2 is again
spherical with point O as the centre.
The above model has one shortcoming: we also have a backwave which
is shown as D1D
2 in Fig. 10.2. Huygens argued that the amplitude of the
secondary wavelets is maximum in the forward direction and zero in the
backward direction; by making this adhoc assumption, Huygens could
explain the absence of the backwave. However, this adhoc assumption is
not satisfactory and the absence of the backwave is really justified from
more rigorous wave theory.In a similar manner, we can use Huygens principle to determine the
shape of the wavefront for a plane wave propagating through a medium
(Fig. 10.3).
FIGURE 10.3Huygens geometrical
construction for a
plane wavepropagating to the
right. F1 F
2 is the
plane wavefront at
t = 0 and G1G
2 is the
wavefront at a latertime τ. The lines A
1A
2,
B1B
2 … etc, are
normal to both F1F
2
and G1G
2 and
represent rays.
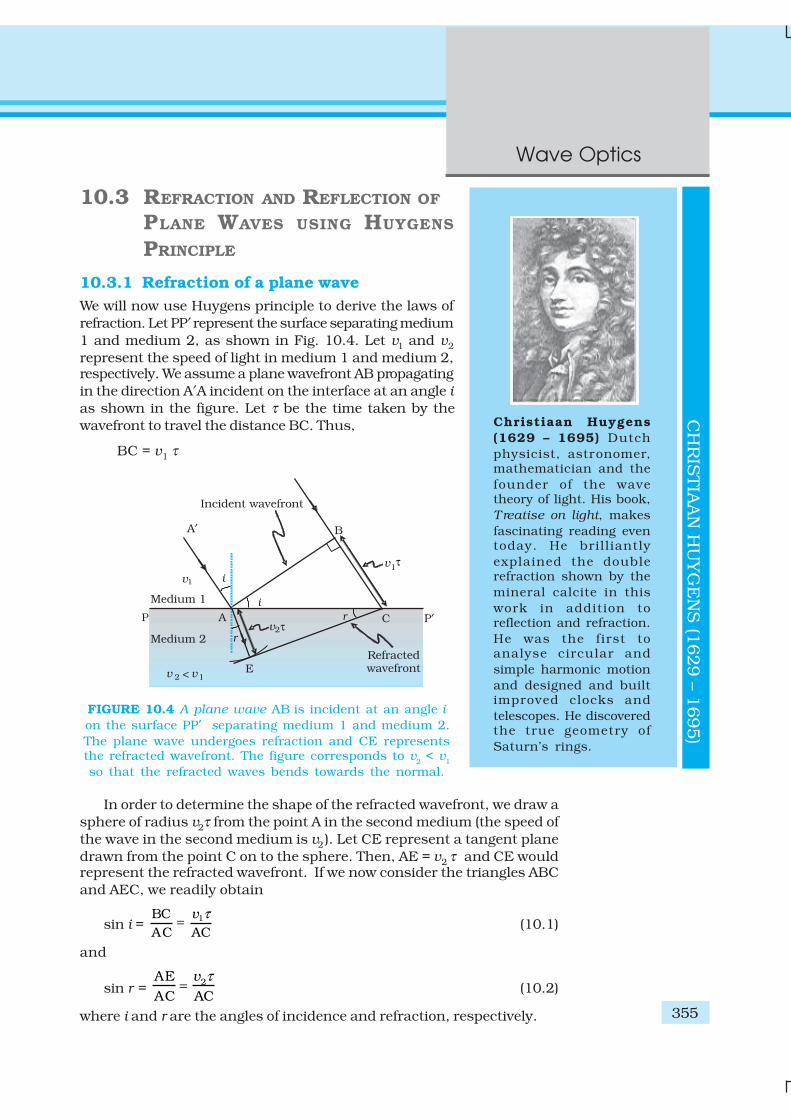
355
Wave Optics
10.3 REFRACTION AND REFLECTION OF
PLANE WAVES USING HUYGENS
PRINCIPLE
10.3.1 Refraction of a plane wave
We will now use Huygens principle to derive the laws of
refraction. Let PP′ represent the surface separating medium
1 and medium 2, as shown in Fig. 10.4. Let v1 and v2
represent the speed of light in medium 1 and medium 2,respectively. We assume a plane wavefront AB propagating
in the direction A′A incident on the interface at an angle i
as shown in the figure. Let τ be the time taken by the
wavefront to travel the distance BC. Thus,
BC = v1 τ
In order to determine the shape of the refracted wavefront, we draw a
sphere of radius v2τ from the point A in the second medium (the speed of
the wave in the second medium is v2). Let CE represent a tangent plane
drawn from the point C on to the sphere. Then, AE = v2 τ and CE wouldrepresent the refracted wavefront. If we now consider the triangles ABC
and AEC, we readily obtain
sin i = 1BC
AC AC
v τ= (10.1)
and
sin r = 2AE
AC AC
v τ= (10.2)
where i and r are the angles of incidence and refraction, respectively.
FIGURE 10.4 A plane wave AB is incident at an angle i
on the surface PP′ separating medium 1 and medium 2.
The plane wave undergoes refraction and CE representsthe refracted wavefront. The figure corresponds to v
2 < v
1
so that the refracted waves bends towards the normal.
CH
RIS
TIA
AN
HU
YG
EN
S (1
629 –
1695)
Christiaan Huygens
(1629 – 1695) Dutch
physicist, astronomer,mathematician and the
founder of the wavetheory of light. His book,
Treatise on light, makes
fascinating reading eventoday. He brilliantly
explained the doublerefraction shown by the
mineral calcite in this
work in addition toreflection and refraction.
He was the first toanalyse circular and
simple harmonic motion
and designed and builtimproved clocks and
telescopes. He discoveredthe true geometry of
Saturn’s rings.
Physics
356
Thus we obtain
1
2
sin
sin
i v
r v= (10.3)
From the above equation, we get the important result that if r < i (i.e.,
if the ray bends toward the normal), the speed of the light wave in thesecond medium (v
2) will be less then the speed of the light wave in the
first medium (v1). This prediction is opposite to the prediction from the
corpuscular model of light and as later experiments showed, the prediction
of the wave theory is correct. Now, if c represents the speed of light in
vacuum, then,
1
1
cn
v= (10.4)
and
n2 = 2
c
v(10.5)
are known as the refractive indices of medium 1 and medium 2,
respectively. In terms of the refractive indices, Eq. (10.3) can be
written as
n1 sin i = n2 sin r (10.6)
This is the Snell’s law of refraction. Further, if λ1 and λ 2 denote thewavelengths of light in medium 1 and medium 2, respectively and if the
distance BC is equal to λ 1 then the distance AE will be equal to λ
2 (because
if the crest from B has reached C in time τ, then the crest from A should
have also reached E in time τ ); thus,
1 1
2 2
BC
AE
v
v
λ
λ= =
or
1 2
1 2
v v
λ λ= (10.7)
The above equation implies that when a wave gets refracted into a
denser medium (v1 > v2) the wavelength and the speed of propagation
decrease but the frequency ν (= v/λ) remains the same.
10.3.2 Refraction at a rarer medium
We now consider refraction of a plane wave at a rarer medium, i.e.,
v2 > v
1. Proceeding in an exactly similar manner we can construct a
refracted wavefront as shown in Fig. 10.5. The angle of refraction
will now be greater than angle of incidence; however, we will still have
n1 sin i = n2 sin r . We define an angle ic by the following equation
2
1
sin c
ni
n= (10.8)
Thus, if i = ic then sin r = 1 and r = 90°. Obviously, for i > ic, there cannot be any refracted wave. The angle i
c is known as the critical angle and
for all angles of incidence greater than the critical angle, we will not have
Dem
on
str
ati
on
o
f in
terf
ere
nce,
dif
fracti
on
, re
fracti
on
, re
so
nan
ce an
d D
op
ple
r eff
ect
http://w
ww
.fal
stad
.com
/rip
ple
/

357
Wave Optics
any refracted wave and the wave will undergo what is known as total
internal reflection. The phenomenon of total internal reflection and its
applications was discussed in Section 9.4.
FIGURE 10.5 Refraction of a plane wave incident on a rarer medium forwhich v
2 > v
1. The plane wave bends away from the normal.
10.3.3 Reflection of a plane wave by a plane surface
We next consider a plane wave AB incident at an angle i on a reflecting
surface MN. If v represents the speed of the wave in the medium and if τ
represents the time taken by the wavefront to advance from the point Bto C then the distance
BC = vτ
In order the construct the reflected wavefront we draw a sphere of
radius vτ from the point A as shown in Fig. 10.6. Let CE represent the
tangent plane drawn from the point C to this sphere. Obviously
AE = BC = vτ
FIGURE 10.6 Reflection of a plane wave AB by the reflecting surface MN.AB and CE represent incident and reflected wavefronts.
If we now consider the triangles EAC and BAC we will find that they
are congruent and therefore, the angles i and r (as shown in Fig. 10.6)
would be equal. This is the law of reflection.Once we have the laws of reflection and refraction, the behaviour of
prisms, lenses, and mirrors can be understood. These phenomena were
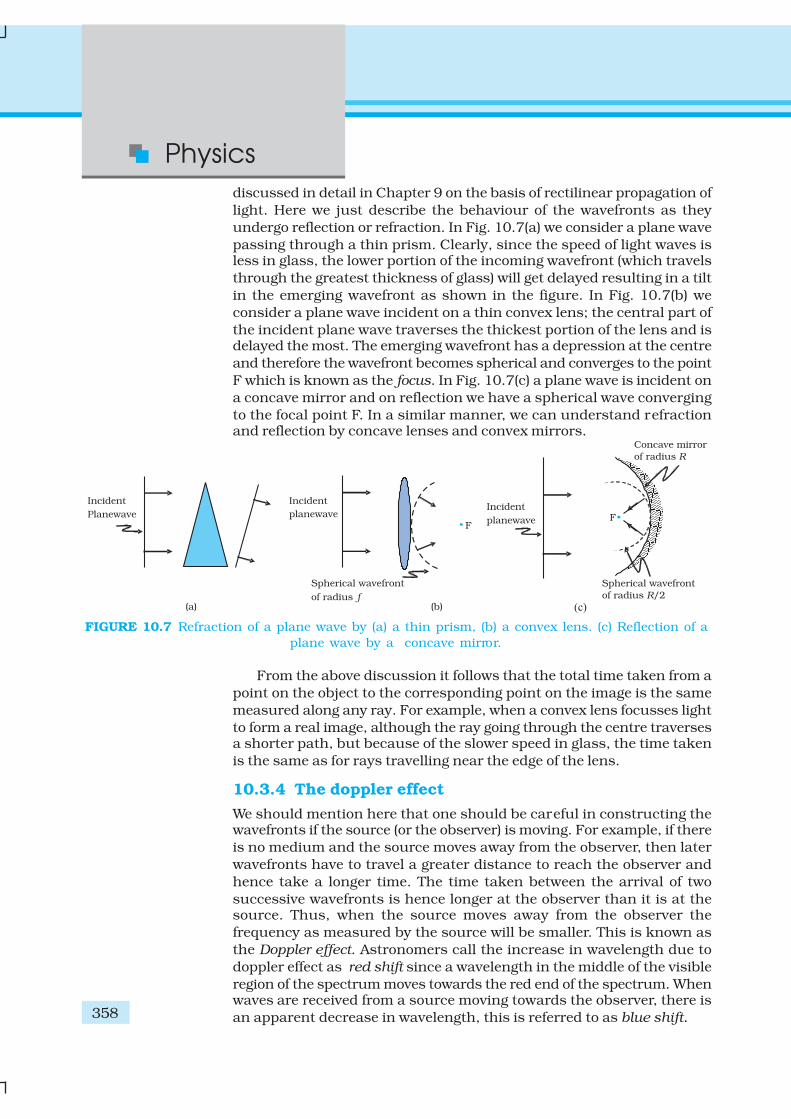
Physics
358
discussed in detail in Chapter 9 on the basis of rectilinear propagation of
light. Here we just describe the behaviour of the wavefronts as they
undergo reflection or refraction. In Fig. 10.7(a) we consider a plane wave
passing through a thin prism. Clearly, since the speed of light waves isless in glass, the lower portion of the incoming wavefront (which travels
through the greatest thickness of glass) will get delayed resulting in a tilt
in the emerging wavefront as shown in the figure. In Fig. 10.7(b) we
consider a plane wave incident on a thin convex lens; the central part of
the incident plane wave traverses the thickest portion of the lens and isdelayed the most. The emerging wavefront has a depression at the centre
and therefore the wavefront becomes spherical and converges to the point
F which is known as the focus. In Fig. 10.7(c) a plane wave is incident on
a concave mirror and on reflection we have a spherical wave converging
to the focal point F. In a similar manner, we can understand refractionand reflection by concave lenses and convex mirrors.
FIGURE 10.7 Refraction of a plane wave by (a) a thin prism, (b) a convex lens. (c) Reflection of a
plane wave by a concave mirror.
From the above discussion it follows that the total time taken from a
point on the object to the corresponding point on the image is the same
measured along any ray. For example, when a convex lens focusses light
to form a real image, although the ray going through the centre traversesa shorter path, but because of the slower speed in glass, the time taken
is the same as for rays travelling near the edge of the lens.
10.3.4 The doppler effect
We should mention here that one should be careful in constructing thewavefronts if the source (or the observer) is moving. For example, if there
is no medium and the source moves away from the observer, then later
wavefronts have to travel a greater distance to reach the observer and
hence take a longer time. The time taken between the arrival of two
successive wavefronts is hence longer at the observer than it is at thesource. Thus, when the source moves away from the observer the
frequency as measured by the source will be smaller. This is known as
the Doppler effect. Astronomers call the increase in wavelength due to
doppler effect as red shift since a wavelength in the middle of the visible
region of the spectrum moves towards the red end of the spectrum. Whenwaves are received from a source moving towards the observer, there is
an apparent decrease in wavelength, this is referred to as blue shift.
359
Wave Optics
EX
AM
PLE 1
0.1
You have already encountered Doppler effect for sound waves in
Chapter 15 of Class XI textbook. For velocities small compared to the
speed of light, we can use the same formulae which we use for sound
waves. The fractional change in frequency ∆ν/ν is given by –vradial/c, wherev
radial is the component of the source velocity along the line joining the
observer to the source relative to the observer; vradial
is considered positive
when the source moves away from the observer. Thus, the Doppler shift
can be expressed as:
– radialv
c
ν
ν
∆= (10.9)
The formula given above is valid only when the speed of the source is
small compared to that of light. A more accurate formula for the Doppler
effect which is valid even when the speeds are close to that of light, requires
the use of Einstein’s special theory of relativity. The Doppler effect for
light is very important in astronomy. It is the basis for the measurementsof the radial velocities of distant galaxies.
Example 10.1 What speed should a galaxy move with respect
to us so that the sodium line at 589.0 nm is observed
at 589.6 nm?
Solution Since νλ = c, –ν λ
ν λ
∆ ∆= (for small changes in ν and λ). For
∆λ = 589.6 – 589.0 = + 0.6 nm
we get [using Eq. (10.9)]
– – radialv
c
ν λ
ν λ
∆ ∆= =
or, vradial
5 –10.6
3.06 10 ms589.0
c ≅ + = + ×
= 306 km/s
Therefore, the galaxy is moving away from us.
Example 10.2
(a) When monochromatic light is incident on a surface separating
two media, the reflected and refracted light both have the samefrequency as the incident frequency. Explain why?
(b) When light travels from a rarer to a denser medium, the speed
decreases. Does the reduction in speed imply a reduction in theenergy carried by the light wave?
(c) In the wave picture of light, intensity of light is determined by the
square of the amplitude of the wave. What determines the intensity
of light in the photon picture of light.
Solution(a) Reflection and refraction arise through interaction of incident light
with the atomic constituents of matter. Atoms may be viewed as
EX
AM
PLE 1
0.2
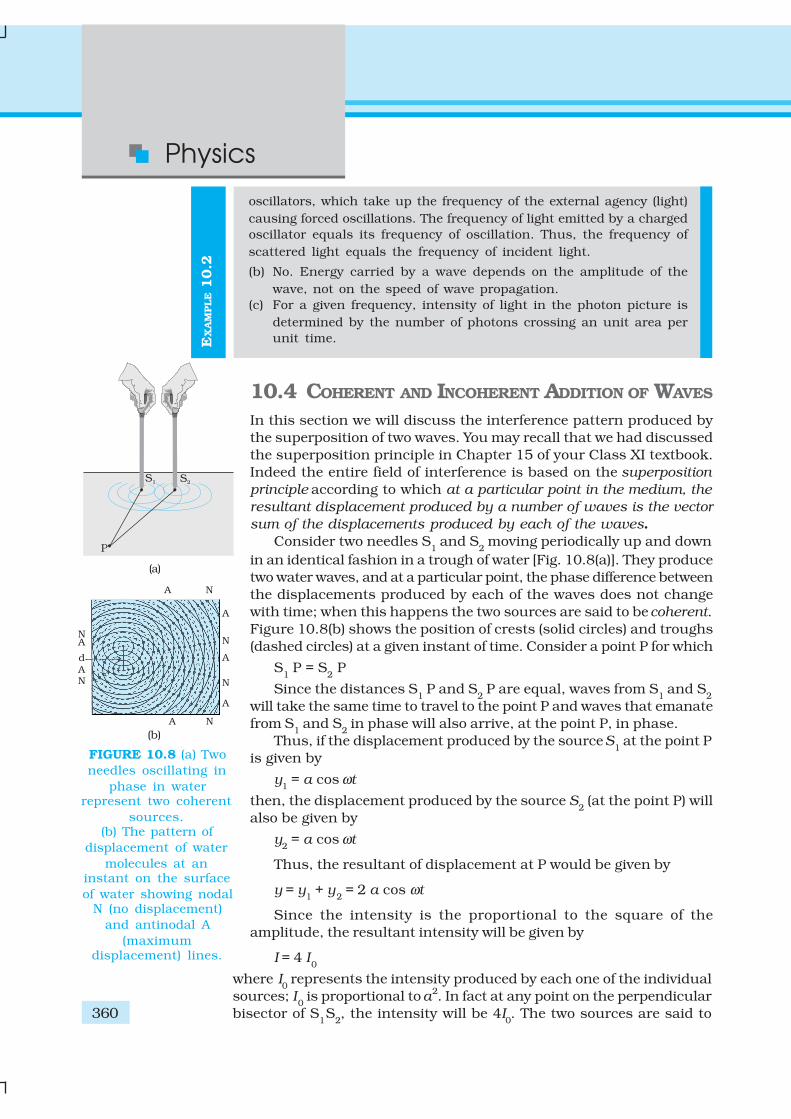
Physics
360
EX
AM
PLE 1
0.2
oscillators, which take up the frequency of the external agency (light)
causing forced oscillations. The frequency of light emitted by a charged
oscillator equals its frequency of oscillation. Thus, the frequency of
scattered light equals the frequency of incident light.
(b) No. Energy carried by a wave depends on the amplitude of the
wave, not on the speed of wave propagation.
(c) For a given frequency, intensity of light in the photon picture is
determined by the number of photons crossing an unit area per
unit time.
10.4 COHERENT AND INCOHERENT ADDITION OF WAVES
In this section we will discuss the interference pattern produced by
the superposition of two waves. You may recall that we had discussed
the superposition principle in Chapter 15 of your Class XI textbook.
Indeed the entire field of interference is based on the superposition
principle according to which at a particular point in the medium, the
resultant displacement produced by a number of waves is the vector
sum of the displacements produced by each of the waves.
Consider two needles S1 and S
2 moving periodically up and down
in an identical fashion in a trough of water [Fig. 10.8(a)]. They produce
two water waves, and at a particular point, the phase difference between
the displacements produced by each of the waves does not change
with time; when this happens the two sources are said to be coherent.
Figure 10.8(b) shows the position of crests (solid circles) and troughs
(dashed circles) at a given instant of time. Consider a point P for which
S1 P = S
2 P
Since the distances S1 P and S
2 P are equal, waves from S
1 and S
2
will take the same time to travel to the point P and waves that emanate
from S1 and S
2 in phase will also arrive, at the point P, in phase.
Thus, if the displacement produced by the source S1 at the point P
is given by
y1 = a cos ωt
then, the displacement produced by the source S2 (at the point P) will
also be given by
y2 = a cos ωt
Thus, the resultant of displacement at P would be given by
y = y1 + y
2 = 2 a cos ωt
Since the intensity is the proportional to the square of the
amplitude, the resultant intensity will be given by
I = 4 I0
where I0 represents the intensity produced by each one of the individual
sources; I0 is proportional to a2. In fact at any point on the perpendicular
bisector of S1S
2, the intensity will be 4I
0. The two sources are said to
(a)
(b)
FIGURE 10.8 (a) Two
needles oscillating in
phase in waterrepresent two coherent
sources.(b) The pattern of
displacement of water
molecules at aninstant on the surface
of water showing nodalN (no displacement)
and antinodal A
(maximumdisplacement) lines.
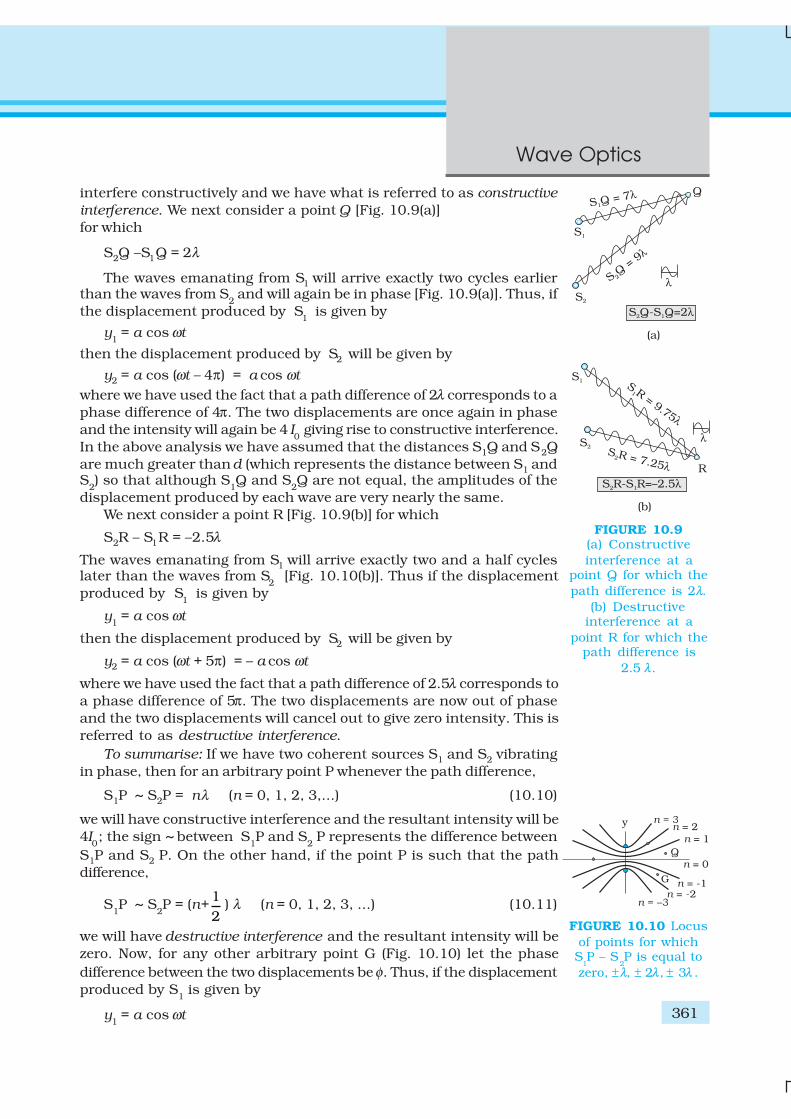
361
Wave Optics
interfere constructively and we have what is referred to as constructive
interference. We next consider a point Q [Fig. 10.9(a)]
for which
S2Q –S1Q = 2λ
The waves emanating from S1 will arrive exactly two cycles earlierthan the waves from S
2 and will again be in phase [Fig. 10.9(a)]. Thus, if
the displacement produced by S1
is given by
y1 = a cos ωt
then the displacement produced by S2 will be given by
y2 = a cos (ωt – 4π) = a cos ωt
where we have used the fact that a path difference of 2λ corresponds to a
phase difference of 4π. The two displacements are once again in phase
and the intensity will again be 4 I0 giving rise to constructive interference.
In the above analysis we have assumed that the distances S1Q and S2Q
are much greater than d (which represents the distance between S1 andS
2) so that although S
1Q and S
2Q are not equal, the amplitudes of the
displacement produced by each wave are very nearly the same.
We next consider a point R [Fig. 10.9(b)] for which
S2R – S1R = –2.5λ
The waves emanating from S1 will arrive exactly two and a half cycleslater than the waves from S
2 [Fig. 10.10(b)]. Thus if the displacement
produced by S1
is given by
y1 = a cos ωt
then the displacement produced by S2 will be given by
y2 = a cos (ωt + 5π) = – a cos ωt
where we have used the fact that a path difference of 2.5λ corresponds to
a phase difference of 5π. The two displacements are now out of phase
and the two displacements will cancel out to give zero intensity. This is
referred to as destructive interference.
To summarise: If we have two coherent sources S1 and S2 vibrating
in phase, then for an arbitrary point P whenever the path difference,
S1P ~ S2P = nλ (n = 0, 1, 2, 3,...) (10.10)
we will have constructive interference and the resultant intensity will be
4I0; the sign ~ between S
1P and S
2 P represents the difference between
S1P and S2 P. On the other hand, if the point P is such that the path
difference,
S1P ~ S
2P = (n+
1
2) λ (n = 0, 1, 2, 3, ...) (10.11)
we will have destructive interference and the resultant intensity will be
zero. Now, for any other arbitrary point G (Fig. 10.10) let the phase
difference between the two displacements be φ. Thus, if the displacement
produced by S1 is given by
y1 = a cos ωt
FIGURE 10.9(a) Constructive
interference at apoint Q for which the
path difference is 2λ.
(b) Destructiveinterference at a
point R for which thepath difference is
2.5 λ.
FIGURE 10.10 Locus
of points for whichS
1P – S
2P is equal to
zero, ±λ, ± 2λ, ± 3λ .
Physics
362
then, the displacement produced by S2 would be
y2 = a cos (ωt + φ )
and the resultant displacement will be given by
y = y1 + y2
= a [cos ωt + cos (ωt +φ)]
= 2 a cos (φ/2) cos (ωt + φ/2)
The amplitude of the resultant displacement is 2a cos (φ/2) and
therefore the intensity at that point will be
I = 4 I0 cos2 (φ/2) (10.12)
If φ = 0, ± 2 π, ± 4 π,… which corresponds to the condition given by
Eq. (10.10) we will have constructive interference leading to maximum
intensity. On the other hand, if φ = ± π, ± 3π, ± 5π … [which corresponds to
the condition given by Eq. (10.11)] we will have destructive interference
leading to zero intensity.Now if the two sources are coherent (i.e., if the two needles are going
up and down regularly) then the phase difference φ at any point will not
change with time and we will have a stable interference pattern; i.e., the
positions of maxima and minima will not change with time. However, if
the two needles do not maintain a constant phase difference, then theinterference pattern will also change with time and, if the phase difference
changes very rapidly with time, the positions of maxima and minima will
also vary rapidly with time and we will see a “time-averaged” intensity
distribution. When this happens, we will observe an average intensity
that will be given by
( )2
04 cos /2I I φ< >= < > (10.13)
where angular brackets represent time averaging. Indeed it is shown in
Section 7.2 that if φ(t ) varies randomly with time, the time-averaged
quantity < cos2 (φ/2) > will be 1/2. This is also intuitively obvious because
the function cos2 (φ/2) will randomly vary between 0 and 1 and the
average value will be 1/2. The resultant intensity will be given by
I = 2 I0
(10.14)
at all points.
When the phase difference between the two vibrating sources changes
rapidly with time, we say that the two sources are incoherent and whenthis happens the intensities just add up. This is indeed what happens
when two separate light sources illuminate a wall.
10.5 INTERFERENCE OF LIGHT WAVES AND YOUNG’S
EXPERIMENT
We will now discuss interference using light waves. If we use two sodium
lamps illuminating two pinholes (Fig. 10.11) we will not observe anyinterference fringes. This is because of the fact that the light wave emitted
from an ordinary source (like a sodium lamp) undergoes abrupt phase
Rip
ple
Tan
k exp
eri
men
ts o
n w
ave in
terf
ere
nce
http://w
ww
.colo
rado.e
du/p
hys
ics/
2000/a
pple
ts/fourier
.htm
l
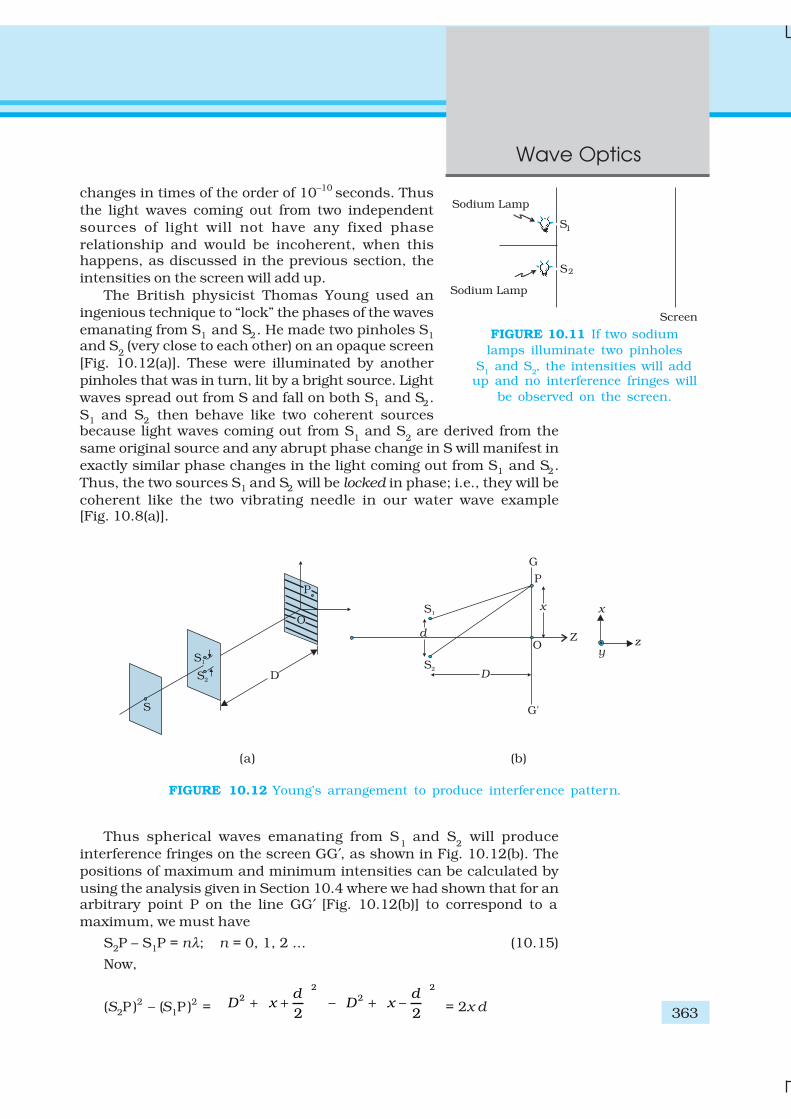
363
Wave Optics
changes in times of the order of 10–10 seconds. Thus
the light waves coming out from two independent
sources of light will not have any fixed phase
relationship and would be incoherent, when thishappens, as discussed in the previous section, the
intensities on the screen will add up.
The British physicist Thomas Young used an
ingenious technique to “lock” the phases of the waves
emanating from S1 and S2. He made two pinholes S1
and S2 (very close to each other) on an opaque screen
[Fig. 10.12(a)]. These were illuminated by another
pinholes that was in turn, lit by a bright source. Light
waves spread out from S and fall on both S1 and S2.
S1 and S2 then behave like two coherent sourcesbecause light waves coming out from S
1 and S
2 are derived from the
same original source and any abrupt phase change in S will manifest in
exactly similar phase changes in the light coming out from S1 and S2.
Thus, the two sources S1 and S2 will be locked in phase; i.e., they will be
coherent like the two vibrating needle in our water wave example[Fig. 10.8(a)].
FIGURE 10.11 If two sodium
lamps illuminate two pinholes
S1 and S
2, the intensities will add
up and no interference fringes will
be observed on the screen.
Thus spherical waves emanating from S1 and S
2 will produce
interference fringes on the screen GG′, as shown in Fig. 10.12(b). The
positions of maximum and minimum intensities can be calculated by
using the analysis given in Section 10.4 where we had shown that for anarbitrary point P on the line GG′ [Fig. 10.12(b)] to correspond to a
maximum, we must have
S2P – S1P = nλ; n = 0, 1, 2 ... (10.15)
Now,
(S2P )2 – (S1P )2 =
2
2 –2
dD x
+ +
2
2 –2
dD x
+ = 2x d
(a) (b)
FIGURE 10.12 Young’s arrangement to produce interference pattern.
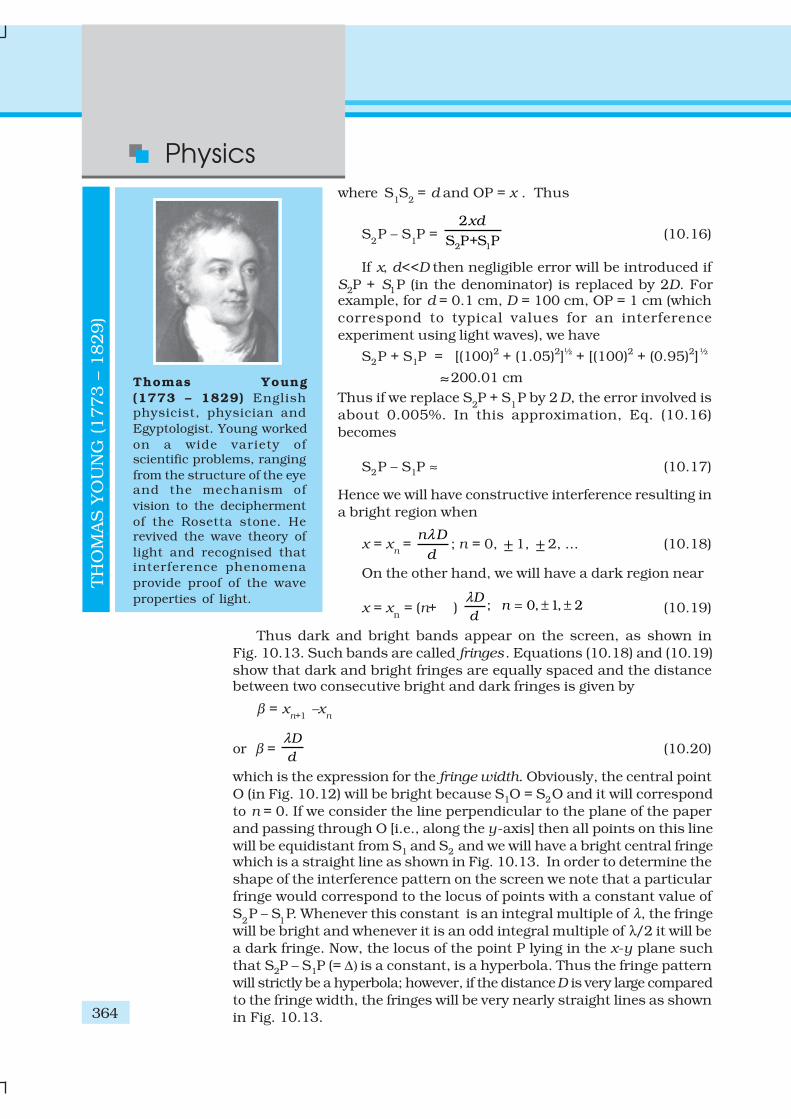
Physics
364
where S1S
2 = d and OP = x . Thus
S2P – S
1P =
2 1
2
S P+S P
xd(10.16)
If x, d<<D then negligible error will be introduced if
S2P + S1P (in the denominator) is replaced by 2D. Forexample, for d = 0.1 cm, D = 100 cm, OP = 1 cm (which
correspond to typical values for an interference
experiment using light waves), we have
S2P + S1P = [(100)2 + (1.05)2]½ + [(100)2 + (0.95)2]½
≈200.01 cm
Thus if we replace S2P + S
1P by 2 D, the error involved is
about 0.005%. In this approximation, Eq. (10.16)
becomes
S2P – S1P ≈ (10.17)
Hence we will have constructive interference resulting in
a bright region when
x = xn =
n D
d
λ; n = 0, ± 1, ± 2, ... (10.18)
On the other hand, we will have a dark region near
x = xn = (n+ ) ; 0, 1, 2
Dn
d
λ= ± ± (10.19)
Thus dark and bright bands appear on the screen, as shown in
Fig. 10.13. Such bands are called fringes. Equations (10.18) and (10.19)
show that dark and bright fringes are equally spaced and the distancebetween two consecutive bright and dark fringes is given by
β = xn+1
–xn
or β = D
d
λ(10.20)
which is the expression for the fringe width. Obviously, the central point
O (in Fig. 10.12) will be bright because S1O = S2O and it will correspond
to n = 0. If we consider the line perpendicular to the plane of the paper
and passing through O [i.e., along the y-axis] then all points on this line
will be equidistant from S1 and S2 and we will have a bright central fringewhich is a straight line as shown in Fig. 10.13. In order to determine the
shape of the interference pattern on the screen we note that a particular
fringe would correspond to the locus of points with a constant value of
S2P – S
1P. Whenever this constant is an integral multiple of λ, the fringe
will be bright and whenever it is an odd integral multiple of λ/2 it will be
a dark fringe. Now, the locus of the point P lying in the x-y plane such
that S2P – S1P (= ∆) is a constant, is a hyperbola. Thus the fringe pattern
will strictly be a hyperbola; however, if the distance D is very large compared
to the fringe width, the fringes will be very nearly straight lines as shown
in Fig. 10.13.
Thomas Young
(1773 – 1829) Englishphysicist, physician and
Egyptologist. Young worked
on a wide variety ofscientific problems, ranging
from the structure of the eyeand the mechanism of
vision to the decipherment
of the Rosetta stone. Herevived the wave theory of
light and recognised thatinterference phenomena
provide proof of the wave
properties of light.
TH
OM
AS
YO
UN
G (1773 –
1829)
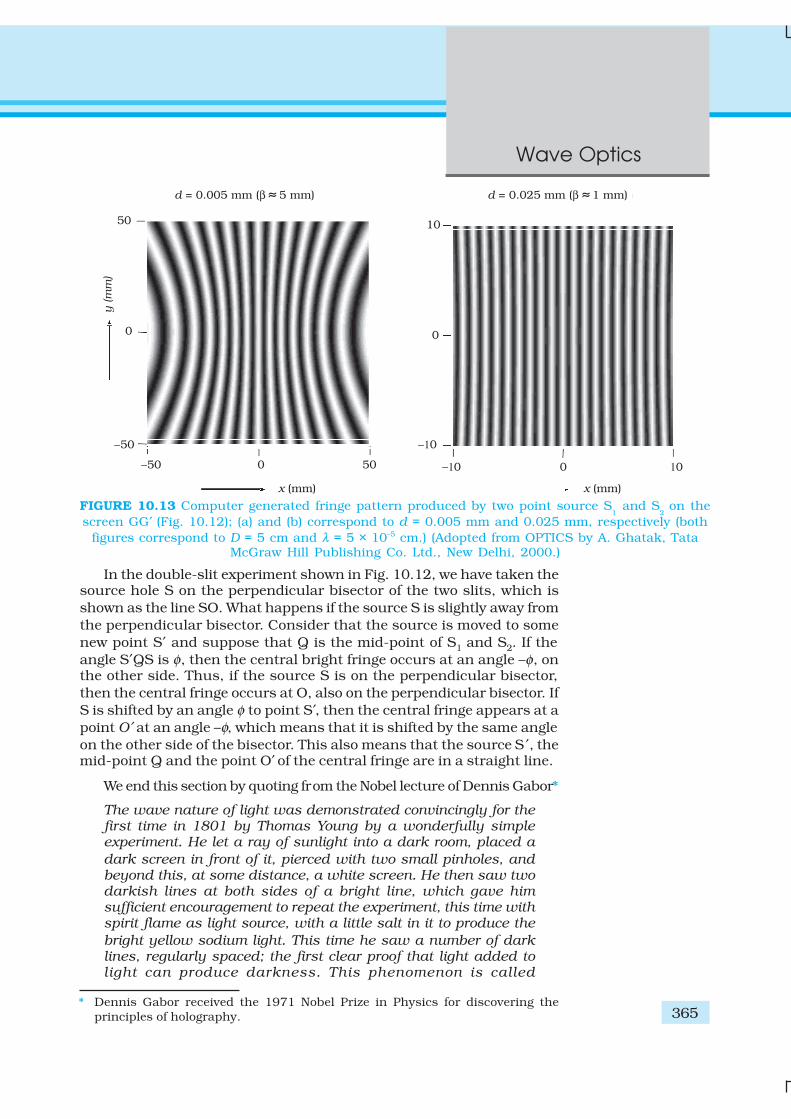
365
Wave Optics
In the double-slit experiment shown in Fig. 10.12, we have taken thesource hole S on the perpendicular bisector of the two slits, which is
shown as the line SO. What happens if the source S is slightly away from
the perpendicular bisector. Consider that the source is moved to some
new point S′ and suppose that Q is the mid-point of S1 and S2. If the
angle S′QS is φ, then the central bright fringe occurs at an angle –φ, onthe other side. Thus, if the source S is on the perpendicular bisector,
then the central fringe occurs at O, also on the perpendicular bisector. If
S is shifted by an angle φ to point S′, then the central fringe appears at a
point O′ at an angle –φ, which means that it is shifted by the same angle
on the other side of the bisector. This also means that the source S ′, themid-point Q and the point O′ of the central fringe are in a straight line.
We end this section by quoting from the Nobel lecture of Dennis Gabor*
The wave nature of light was demonstrated convincingly for thefirst time in 1801 by Thomas Young by a wonderfully simpleexperiment. He let a ray of sunlight into a dark room, placed a
dark screen in front of it, pierced with two small pinholes, andbeyond this, at some distance, a white screen. He then saw twodarkish lines at both sides of a bright line, which gave himsufficient encouragement to repeat the experiment, this time withspirit flame as light source, with a little salt in it to produce the
bright yellow sodium light. This time he saw a number of darklines, regularly spaced; the first clear proof that light added tolight can produce darkness. This phenomenon is called
FIGURE 10.13 Computer generated fringe pattern produced by two point source S1 and S
2 on the
screen GG′ (Fig. 10.12); (a) and (b) correspond to d = 0.005 mm and 0.025 mm, respectively (both
figures correspond to D = 5 cm and λ = 5 × 10⁻⁵ cm.) (Adopted from OPTICS by A. Ghatak, TataMcGraw Hill Publishing Co. Ltd., New Delhi, 2000.)
* Dennis Gabor received the 1971 Nobel Prize in Physics for discovering the
principles of holography.
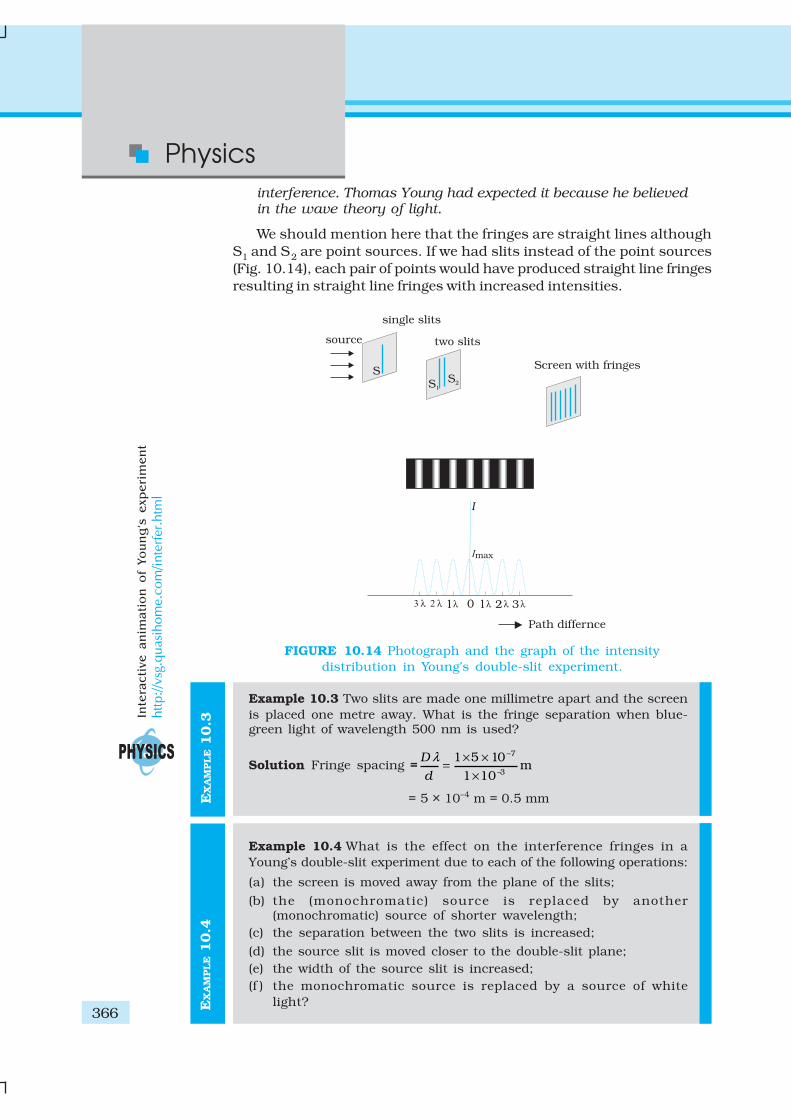
Physics
366
EX
AM
PLE 1
0.3
interference. Thomas Young had expected it because he believedin the wave theory of light.
We should mention here that the fringes are straight lines although
S1 and S2 are point sources. If we had slits instead of the point sources
(Fig. 10.14), each pair of points would have produced straight line fringes
resulting in straight line fringes with increased intensities.
Example 10.3 Two slits are made one millimetre apart and the screen
is placed one metre away. What is the fringe separation when blue-green light of wavelength 500 nm is used?
Solution Fringe spacing =–7
–3
1 5 10m
1 10
D
d
λ × ×=
×
= 5 × 10⁻⁴ m = 0.5 mm
Example 10.4 What is the effect on the interference fringes in a
Young’s double-slit experiment due to each of the following operations:
(a) the screen is moved away from the plane of the slits;
(b) the (monochromatic) source is replaced by another(monochromatic) source of shorter wavelength;
(c) the separation between the two slits is increased;
(d) the source slit is moved closer to the double-slit plane;
(e) the width of the source slit is increased;
(f ) the monochromatic source is replaced by a source of white
light?
FIGURE 10.14 Photograph and the graph of the intensity
distribution in Young’s double-slit experiment.
EX
AM
PLE 1
0.4
Inte
racti
ve an
imati
on
o
f Yo
un
g’s
exp
eri
men
t
http://v
sg.q
uas
ihom
e.co
m/inte
rfer
.htm
l
367
Wave Optics
EX
AM
PLE 1
0.4
( In each operation, take all parameters, other than the one specified,
to remain unchanged.)
Solution
(a) Angular separation of the fringes remains constant
(= λ/d ). The actual separation of the fringes increases in
proportion to the distance of the screen from the plane of the
two slits.
(b) The separation of the fringes (and also angular separation)
decreases. See, however, the condition mentioned in (d) below.
(c) The separation of the fringes (and also angular separation)
decreases. See, however, the condition mentioned in (d) below.
(d) Let s be the size of the source and S its distance from the plane of
the two slits. For interference fringes to be seen, the condition
s/S < λ/d should be satisfied; otherwise, interference patterns
produced by different parts of the source overlap and no fringes
are seen. Thus, as S decreases (i.e., the source slit is brought
closer), the interference pattern gets less and less sharp, and
when the source is brought too close for this condition to be valid,
the fringes disappear. Till this happens, the fringe separation
remains fixed.
(e) Same as in (d). As the source slit width increases, fringe pattern
gets less and less sharp. When the source slit is so wide that the
condition s/S ≤ λ/d is not satisfied, the interference pattern
disappears.
(f ) The interference patterns due to different component colours of
white light overlap (incoherently). The central bright fringes for
different colours are at the same position. Therefore, the central
fringe is white. For a point P for which S2P –S
1P = λ
b/2, where λ
b
(≈ 4000 Å) represents the wavelength for the blue colour, the blue
component will be absent and the fringe will appear red in colour.
Slightly farther away where S2Q–S1Q = λb = λ
r/2 where λ
r (≈ 8000 Å)
is the wavelength for the red colour, the fringe will be predominantly
blue.
Thus, the fringe closest on either side of the central white fringe
is red and the farthest will appear blue. After a few fringes, no
clear fringe pattern is seen.
10.6 DIFFRACTION
If we look clearly at the shadow cast by an opaque object, close to the
region of geometrical shadow, there are alternate dark and bright regions
just like in interference. This happens due to the phenomenon of
diffraction. Diffraction is a general characteristic exhibited by all types of
waves, be it sound waves, light waves, water waves or matter waves. Since
the wavelength of light is much smaller than the dimensions of most
obstacles; we do not encounter diffraction effects of light in everyday
observations. However, the finite resolution of our eye or of optical
Physics
368
instruments such as telescopes or microscopes is limited due to the
phenomenon of diffraction. Indeed the colours that you see when a CD is
viewed is due to diffraction effects. We will now discuss the phenomenon
of diffraction.
10.6.1 The single slit
In the discussion of Young’s experiment, we stated that a single narrow
slit acts as a new source from which light spreads out. Even before Young,
early experimenters – including Newton – had noticed that light spreads
out from narrow holes and slits. It seems to turn around corners and
enter regions where we would expect a shadow. These effects, known as
diffraction, can only be properly understood using wave ideas. After all,
you are hardly surprised to hear sound waves from someone talking
around a corner !
When the double slit in Young’s experiment is replaced by a single
narrow slit (illuminated by a monochromatic source), a broad pattern
with a central bright region is seen. On both sides, there are alternate
dark and bright regions, the intensity becoming weaker away from the
centre (Fig. 10.16). To understand this, go to Fig. 10.15, which shows a
parallel beam of light falling normally on a single slit LN of width a. The
diffracted light goes on to meet a screen. The midpoint of the slit is M.
A straight line through M perpendicular to the slit plane meets the
screen at C. We want the intensity at any point P on the screen. As before,
straight lines joining P to the different points L,M,N, etc., can be treated as
parallel, making an angle θ with the normal MC.
The basic idea is to divide the slit into much smaller parts, and add
their contributions at P with the proper phase differences. We are treating
different parts of the wavefront at the slit as secondary sources. Because
the incoming wavefront is parallel to the plane of the slit, these sources
are in phase.
The path difference NP – LP between the two edges of the slit can be
calculated exactly as for Young’s experiment. From Fig. 10.15,
NP – LP = NQ
= a sin θ
≈ aθ (10.21)
Similarly, if two points M1 and M2 in the slit plane are separated by y, the
path difference M2P – M1P ≈ yθ. We now have to sum up equal, coherent
contributions from a large number of sources, each with a different phase.
This calculation was made by Fresnel using integral calculus, so we omit
it here. The main features of the diffraction pattern can be understood by
simple arguments.
At the central point C on the screen, the angle θ is zero. All path
differences are zero and hence all the parts of the slit contribute in phase.
This gives maximum intensity at C. Experimental observation shown in
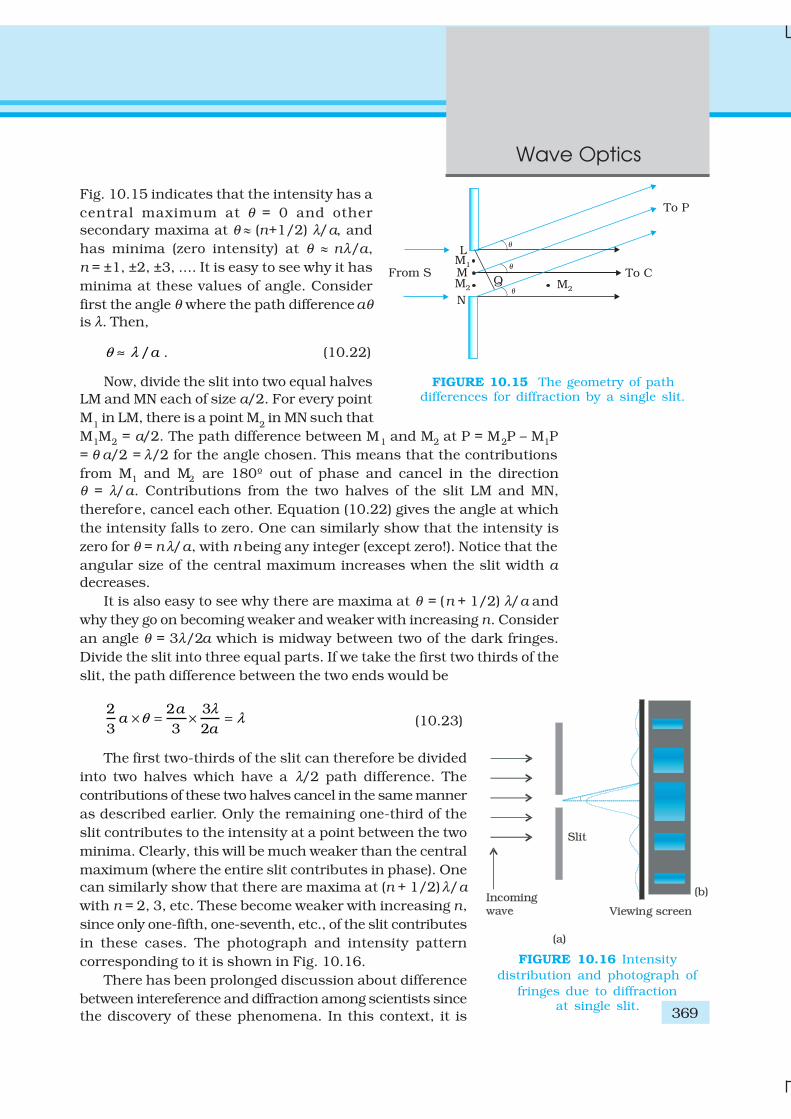
369
Wave Optics
Fig. 10.15 indicates that the intensity has a
central maximum at θ = 0 and other
secondary maxima at θ l (n+1/2) λ/a, and
has minima (zero intensity) at θ l nλ/a,
n = ±1, ±2, ±3, .... It is easy to see why it has
minima at these values of angle. Consider
first the angle θ where the path difference aθ
is λ. Then,
/aθ λ≈ . (10.22)
Now, divide the slit into two equal halves
LM and MN each of size a/2. For every point
M1 in LM, there is a point M
2 in MN such that
M1M2 = a/2. The path difference between M1 and M2 at P = M2P – M1P
= θ a/2 = λ/2 for the angle chosen. This means that the contributions
from M1 and M2 are 180º out of phase and cancel in the direction
θ = λ/a. Contributions from the two halves of the slit LM and MN,
therefore, cancel each other. Equation (10.22) gives the angle at which
the intensity falls to zero. One can similarly show that the intensity is
zero for θ = n λ/a, with n being any integer (except zero!). Notice that the
angular size of the central maximum increases when the slit width a
decreases.
It is also easy to see why there are maxima at θ = (n + 1/2) λ/a and
why they go on becoming weaker and weaker with increasing n. Consider
an angle θ = 3λ/2a which is midway between two of the dark fringes.
Divide the slit into three equal parts. If we take the first two thirds of the
slit, the path difference between the two ends would be
2 2 3
3 3 2
aa
a
λθ λ× = × = (10.23)
The first two-thirds of the slit can therefore be divided
into two halves which have a λ/2 path difference. The
contributions of these two halves cancel in the same manner
as described earlier. Only the remaining one-third of the
slit contributes to the intensity at a point between the two
minima. Clearly, this will be much weaker than the central
maximum (where the entire slit contributes in phase). One
can similarly show that there are maxima at (n + 1/2) λ/a
with n = 2, 3, etc. These become weaker with increasing n,
since only one-fifth, one-seventh, etc., of the slit contributes
in these cases. The photograph and intensity pattern
corresponding to it is shown in Fig. 10.16.
There has been prolonged discussion about difference
between intereference and diffraction among scientists since
the discovery of these phenomena. In this context, it is
FIGURE 10.16 Intensity
distribution and photograph of
fringes due to diffractionat single slit.
FIGURE 10.15 The geometry of pathdifferences for diffraction by a single slit.
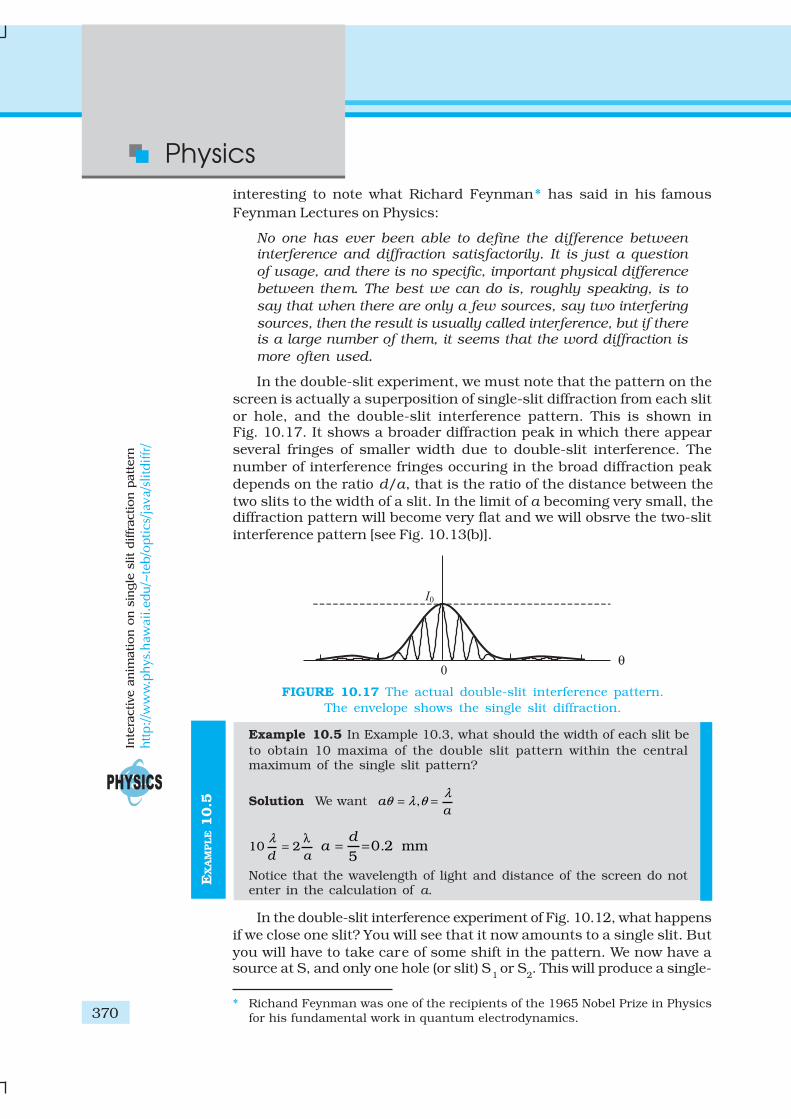
Physics
370
EX
AM
PLE 1
0.5
interesting to note what Richard Feynman* has said in his famous
Feynman Lectures on Physics:
No one has ever been able to define the difference betweeninterference and diffraction satisfactorily. It is just a question
of usage, and there is no specific, important physical difference
between them. The best we can do is, roughly speaking, is to
say that when there are only a few sources, say two interfering
sources, then the result is usually called interference, but if thereis a large number of them, it seems that the word diffraction is
more often used.
In the double-slit experiment, we must note that the pattern on the
screen is actually a superposition of single-slit diffraction from each slit
or hole, and the double-slit interference pattern. This is shown inFig. 10.17. It shows a broader diffraction peak in which there appear
several fringes of smaller width due to double-slit interference. The
number of interference fringes occuring in the broad diffraction peak
depends on the ratio d/a, that is the ratio of the distance between the
two slits to the width of a slit. In the limit of a becoming very small, thediffraction pattern will become very flat and we will obsrve the two-slit
interference pattern [see Fig. 10.13(b)].
* Richand Feynman was one of the recipients of the 1965 Nobel Prize in Physics
for his fundamental work in quantum electrodynamics.
Example 10.5 In Example 10.3, what should the width of each slit be
to obtain 10 maxima of the double slit pattern within the centralmaximum of the single slit pattern?
Solution We want ,aa
λθ λ θ= =
10 2d a
λ λ= 0 2 mm
5
da = = .
Notice that the wavelength of light and distance of the screen do notenter in the calculation of a.
In the double-slit interference experiment of Fig. 10.12, what happens
if we close one slit? You will see that it now amounts to a single slit. But
you will have to take care of some shift in the pattern. We now have asource at S, and only one hole (or slit) S
1 or S
2. This will produce a single-
FIGURE 10.17 The actual double-slit interference pattern.
The envelope shows the single slit diffraction.
Inte
ractive a
nim
atio
n o
n s
ing
le s
lit
diffr
actio
n p
att
ern
http://w
ww
.phys
.haw
aii.ed
u/~
teb/o
ptics
/jav
a/sl
itdiffr/
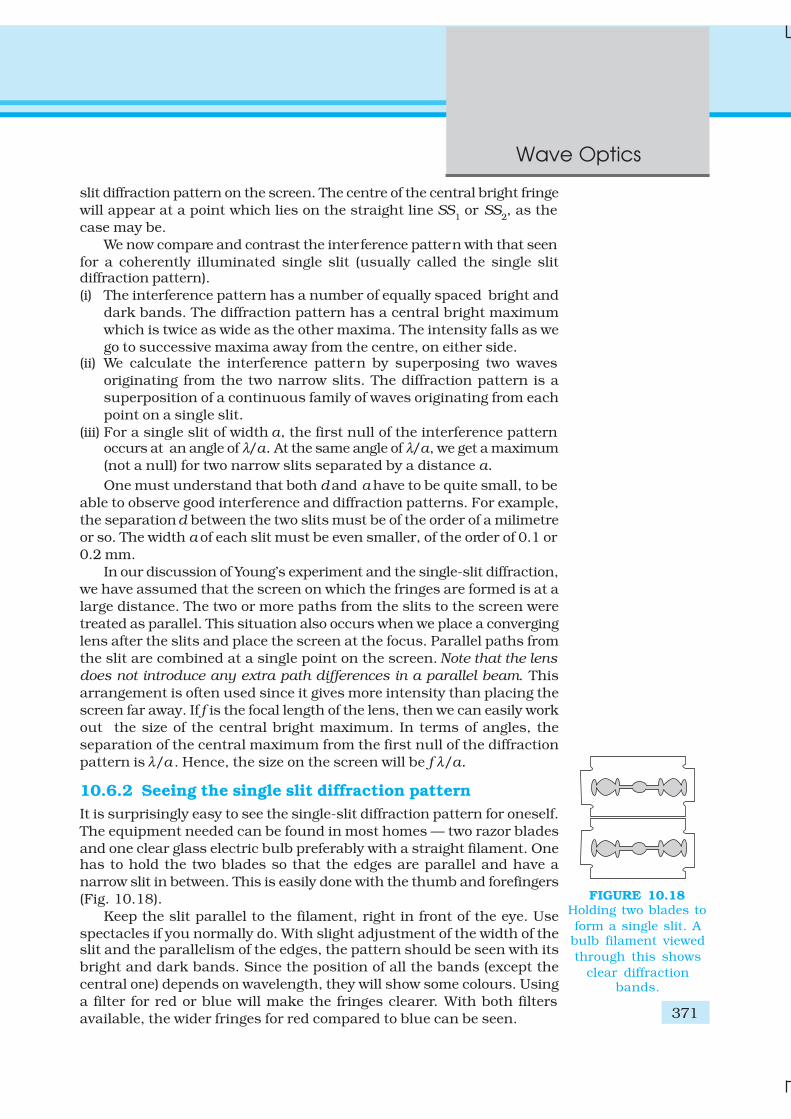
371
Wave Optics
slit diffraction pattern on the screen. The centre of the central bright fringe
will appear at a point which lies on the straight line SS1 or SS
2, as the
case may be.
We now compare and contrast the interference pattern with that seen
for a coherently illuminated single slit (usually called the single slitdiffraction pattern).
(i) The interference pattern has a number of equally spaced bright and
dark bands. The diffraction pattern has a central bright maximum
which is twice as wide as the other maxima. The intensity falls as we
go to successive maxima away from the centre, on either side.(ii) We calculate the interference pattern by superposing two waves
originating from the two narrow slits. The diffraction pattern is a
superposition of a continuous family of waves originating from each
point on a single slit.
(iii) For a single slit of width a, the first null of the interference patternoccurs at an angle of λ/a. At the same angle of λ/a, we get a maximum
(not a null) for two narrow slits separated by a distance a.
One must understand that both d and a have to be quite small, to be
able to observe good interference and diffraction patterns. For example,
the separation d between the two slits must be of the order of a milimetre
or so. The width a of each slit must be even smaller, of the order of 0.1 or
0.2 mm.
In our discussion of Young’s experiment and the single-slit diffraction,
we have assumed that the screen on which the fringes are formed is at a
large distance. The two or more paths from the slits to the screen were
treated as parallel. This situation also occurs when we place a converging
lens after the slits and place the screen at the focus. Parallel paths from
the slit are combined at a single point on the screen. Note that the lens
does not introduce any extra path differences in a parallel beam. This
arrangement is often used since it gives more intensity than placing the
screen far away. If f is the focal length of the lens, then we can easily work
out the size of the central bright maximum. In terms of angles, the
separation of the central maximum from the first null of the diffraction
pattern is λ/a . Hence, the size on the screen will be f λ/a.
10.6.2 Seeing the single slit diffraction pattern
It is surprisingly easy to see the single-slit diffraction pattern for oneself.
The equipment needed can be found in most homes –– two razor blades
and one clear glass electric bulb preferably with a straight filament. Onehas to hold the two blades so that the edges are parallel and have a
narrow slit in between. This is easily done with the thumb and forefingers
(Fig. 10.18).
Keep the slit parallel to the filament, right in front of the eye. Use
spectacles if you normally do. With slight adjustment of the width of theslit and the parallelism of the edges, the pattern should be seen with its
bright and dark bands. Since the position of all the bands (except the
central one) depends on wavelength, they will show some colours. Using
a filter for red or blue will make the fringes clearer. With both filters
available, the wider fringes for red compared to blue can be seen.
FIGURE 10.18Holding two blades to
form a single slit. Abulb filament viewed
through this shows
clear diffractionbands.
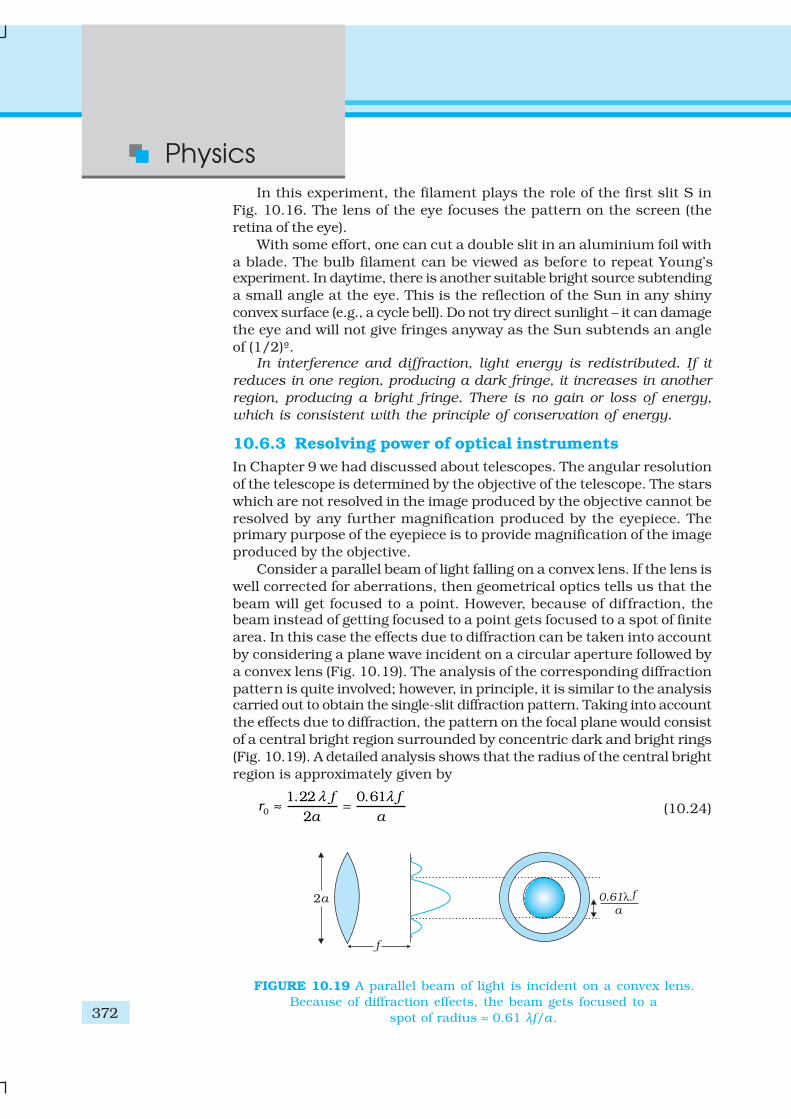
Physics
372
In this experiment, the filament plays the role of the first slit S in
Fig. 10.16. The lens of the eye focuses the pattern on the screen (the
retina of the eye).
With some effort, one can cut a double slit in an aluminium foil with
a blade. The bulb filament can be viewed as before to repeat Young’sexperiment. In daytime, there is another suitable bright source subtending
a small angle at the eye. This is the reflection of the Sun in any shiny
convex surface (e.g., a cycle bell). Do not try direct sunlight – it can damage
the eye and will not give fringes anyway as the Sun subtends an angle
of (1/2)º.In interference and diffraction, light energy is redistributed. If it
reduces in one region, producing a dark fringe, it increases in another
region, producing a bright fringe. There is no gain or loss of energy,
which is consistent with the principle of conservation of energy.
10.6.3 Resolving power of optical instruments
In Chapter 9 we had discussed about telescopes. The angular resolution
of the telescope is determined by the objective of the telescope. The stars
which are not resolved in the image produced by the objective cannot be
resolved by any further magnification produced by the eyepiece. Theprimary purpose of the eyepiece is to provide magnification of the image
produced by the objective.
Consider a parallel beam of light falling on a convex lens. If the lens is
well corrected for aberrations, then geometrical optics tells us that the
beam will get focused to a point. However, because of diffraction, thebeam instead of getting focused to a point gets focused to a spot of finite
area. In this case the effects due to diffraction can be taken into account
by considering a plane wave incident on a circular aperture followed by
a convex lens (Fig. 10.19). The analysis of the corresponding diffraction
pattern is quite involved; however, in principle, it is similar to the analysiscarried out to obtain the single-slit diffraction pattern. Taking into account
the effects due to diffraction, the pattern on the focal plane would consist
of a central bright region surrounded by concentric dark and bright rings
(Fig. 10.19). A detailed analysis shows that the radius of the central bright
region is approximately given by
0
1.22 0.61
2
f fr
a a
λ λ≈ = (10.24)
FIGURE 10.19 A parallel beam of light is incident on a convex lens.
Because of diffraction effects, the beam gets focused to a
spot of radius ≈ 0.61 λf/a .

373
Wave Optics
where f is the focal length of the lens and 2a is the diameter of the circular
aperture or the diameter of the lens, whichever is smaller. Typically if
λ ≈ 0.5 µm, f ≈ 20 cm and a ≈ 5 cm
we have
r0 ≈ 1.2 µm
Although the size of the spot is very small, it plays an important role
in determining the limit of resolution of optical instruments like a telescope
or a microscope. For the two stars to be just resolved
0
0.61 ff r
a
λθ∆ ≈ ≈
implying
0.61
a
λθ∆ ≈ (10.25)
Thus ∆θ will be small if the diameter of the objective is large. This
implies that the telescope will have better resolving power if a is large. It
is for this reason that for better resolution, a telescope must have a large
diameter objective.
Example 10.6 Assume that light of wavelength 6000Å is coming froma star. What is the limit of resolution of a telescope whose objective
has a diameter of 100 inch?
Solution A 100 inch telescope implies that 2a = 100 inch
= 254 cm. Thus if,
λ ≈ 6000Å = 6×10⁻⁵
cmthen
–5–70.61 6 10
2.9 10127
θ× ×
∆ ≈ ≈ × radians
We can apply a similar argument to the objective lens of a microscope.In this case, the object is placed slightly beyond f, so that a real image is
formed at a distance v [Fig. 10.20]. The magnification – ratio of
image size to object size – is given by m l v/f. It can be seen from
Fig. 10.20 that
D/f l 2 tan β (10.26)
where 2β is the angle subtended by the diameter of the objective lens at
the focus of the microscope.
EX
AM
PLE 1
0.6
FIGURE 10.20 Real image formed by the objective lens of the microscope.
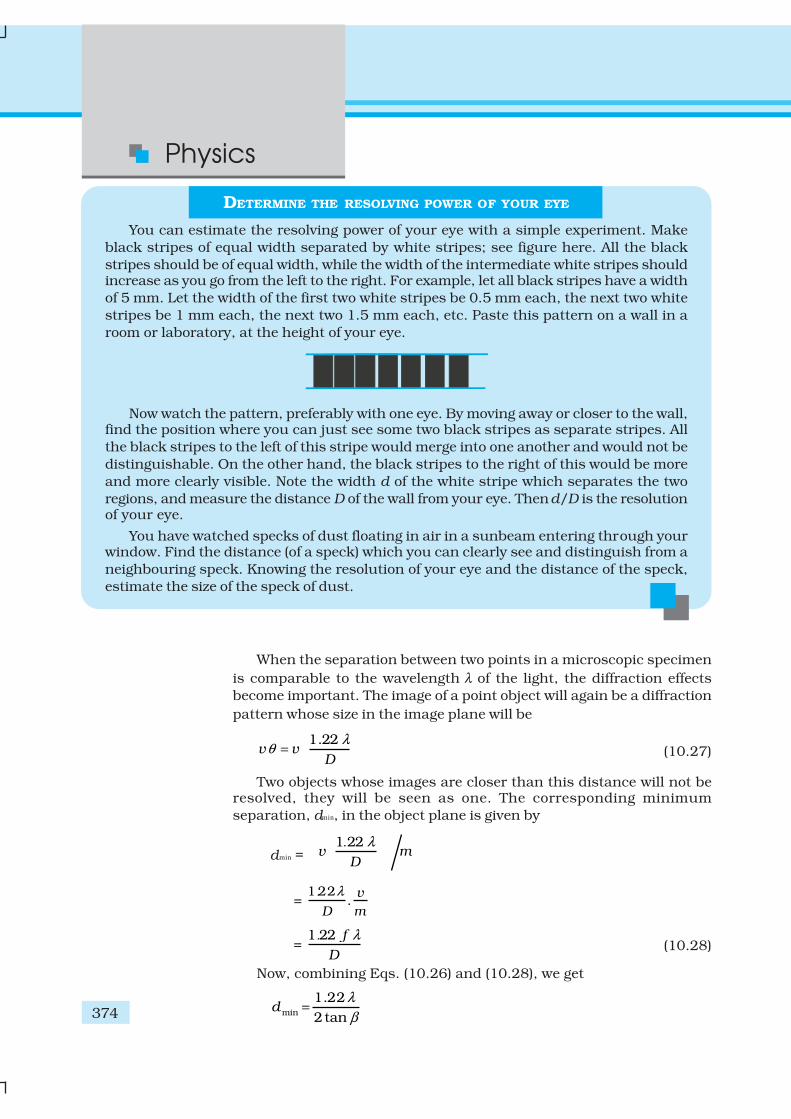
Physics
374
When the separation between two points in a microscopic specimen
is comparable to the wavelength λ of the light, the diffraction effects
become important. The image of a point object will again be a diffraction
pattern whose size in the image plane will be
1.22v v
D
λθ
= (10.27)
Two objects whose images are closer than this distance will not beresolved, they will be seen as one. The corresponding minimum
separation, dmin, in the object plane is given by
dmin = 1 22
v mD
λ.
= 1 22
.v
D m
. λ
= 1 22 f
D
. λ(10.28)
Now, combining Eqs. (10.26) and (10.28), we get
min
1.22
2tand
λ
β=
DETERMINE THE RESOLVING POWER OF YOUR EYE
You can estimate the resolving power of your eye with a simple experiment. Make
black stripes of equal width separated by white stripes; see figure here. All the black
stripes should be of equal width, while the width of the intermediate white stripes shouldincrease as you go from the left to the right. For example, let all black stripes have a width
of 5 mm. Let the width of the first two white stripes be 0.5 mm each, the next two white
stripes be 1 mm each, the next two 1.5 mm each, etc. Paste this pattern on a wall in a
room or laboratory, at the height of your eye.
Now watch the pattern, preferably with one eye. By moving away or closer to the wall,find the position where you can just see some two black stripes as separate stripes. All
the black stripes to the left of this stripe would merge into one another and would not be
distinguishable. On the other hand, the black stripes to the right of this would be more
and more clearly visible. Note the width d of the white stripe which separates the two
regions, and measure the distance D of the wall from your eye. Then d/D is the resolutionof your eye.
You have watched specks of dust floating in air in a sunbeam entering through yourwindow. Find the distance (of a speck) which you can clearly see and distinguish from a
neighbouring speck. Knowing the resolution of your eye and the distance of the speck,
estimate the size of the speck of dust.
375
Wave Optics
1.22
2sin
λ
β (10.29)
If the medium between the object and the objective lens is not air but
a medium of refractive index n, Eq. (10.29) gets modified to
min
1.22
2 sind
n
λ
β= (10.30)
The product n sinβ is called the numerical aperture and is sometimes
marked on the objective.
The resolving power of the microscope is given by the reciprocal of
the minimum separation of two points seen as distinct. It can be seen
from Eq. (10.30) that the resolving power can be increased by choosing a
medium of higher refractive index. Usually an oil having a refractive index
close to that of the objective glass is used. Such an arrangement is called
an ‘oil immersion objective’. Notice that it is not possible to make sinβ
larger than unity. Thus, we see that the resolving power of a microscope
is basically determined by the wavelength of the light used.
There is a likelihood of confusion between resolution and
magnification, and similarly between the role of a telescope and a
microscope to deal with these parameters. A telescope produces images
of far objects nearer to our eye. Therefore objects which are not resolved
at far distance, can be resolved by looking at them through a telescope.
A microscope, on the other hand, magnifies objects (which are near to
us) and produces their larger image. We may be looking at two stars or
two satellites of a far-away planet, or we may be looking at different
regions of a living cell. In this context, it is good to remember that a
telescope resolves whereas a microscope magnifies.
10.6.4 The validity of ray optics
An aperture (i.e., slit or hole) of size a illuminated by a parallel beam
sends diffracted light into an angle of approximately ≈ λ/a . This is the
angular size of the bright central maximum. In travelling a distance z,
the diffracted beam therefore acquires a width zλ/a due to diffraction. It
is interesting to ask at what value of z the spreading due to diffraction
becomes comparable to the size a of the aperture. We thus approximately
equate zλ/a with a. This gives the distance beyond which divergence of
the beam of width a becomes significant. Therefore,
2az
λ (10.31)
We define a quantity zF
called the Fresnel distance by the following
equation
2 /Fz a λ
Equation (10.31) shows that for distances much smaller than zF
, the
spreading due to diffraction is smaller compared to the size of the beam.
It becomes comparable when the distance is approximately zF . For
distances much greater than zF, the spreading due to diffraction

Physics
376
EX
AM
PLE 1
0.7
dominates over that due to ray optics (i.e., the size a of the aperture).
Equation (10.31) also shows that ray optics is valid in the limit of
wavelength tending to zero.
Example 10.7 For what distance is ray optics a good approximationwhen the aperture is 3 mm wide and the wavelength is 500 nm?
Solution ( )
2–32
–7
3 1018 m
5 10F
az
λ
×= = =
×
This example shows that even with a small aperture, diffractionspreading can be neglected for rays many metres in length. Thus, ray
optics is valid in many common situations.
10.7 POLARISATION
Consider holding a long string that is held horizontally, the other end ofwhich is assumed to be fixed. If we move the end of the string up anddown in a periodic manner, we will generate a wave propagating in the+x direction (Fig. 10.21). Such a wave could be described by the following
equation
FIGURE 10.21 (a) The curves represent the displacement of a string at
t = 0 and at t = ∆t, respectively when a sinusoidal wave is propagatingin the +x-direction. (b) The curve represents the time variation
of the displacement at x = 0 when a sinusoidal wave is propagating
in the +x-direction. At x = ∆x, the time variation of thedisplacement will be slightly displaced to the right.
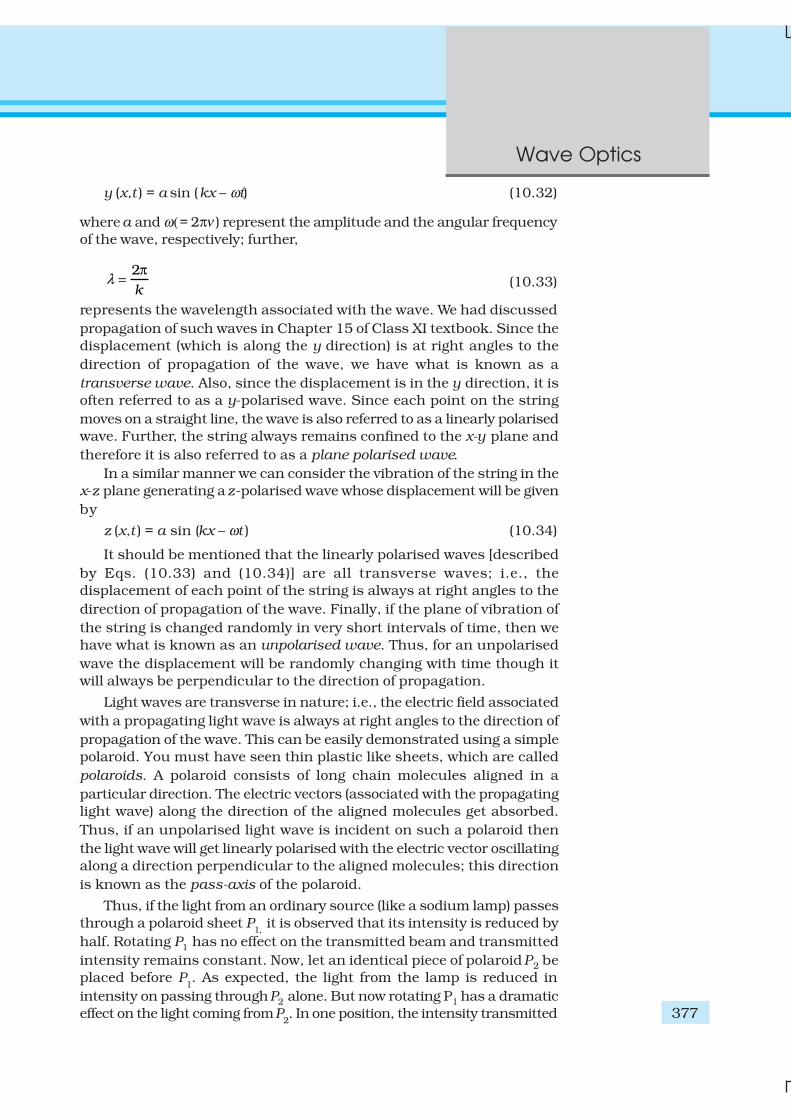
377
Wave Optics
y (x,t ) = a sin (kx – ωt) (10.32)
where a and ω (= 2πν ) represent the amplitude and the angular frequency
of the wave, respectively; further,
2
kλ
π= (10.33)
represents the wavelength associated with the wave. We had discussed
propagation of such waves in Chapter 15 of Class XI textbook. Since the
displacement (which is along the y direction) is at right angles to the
direction of propagation of the wave, we have what is known as a
transverse wave. Also, since the displacement is in the y direction, it is
often referred to as a y-polarised wave. Since each point on the string
moves on a straight line, the wave is also referred to as a linearly polarised
wave. Further, the string always remains confined to the x-y plane and
therefore it is also referred to as a plane polarised wave.
In a similar manner we can consider the vibration of the string in the
x-z plane generating a z-polarised wave whose displacement will be given
by
z (x,t ) = a sin (kx – ωt ) (10.34)
It should be mentioned that the linearly polarised waves [described
by Eqs. (10.33) and (10.34)] are all transverse waves; i.e., the
displacement of each point of the string is always at right angles to the
direction of propagation of the wave. Finally, if the plane of vibration of
the string is changed randomly in very short intervals of time, then we
have what is known as an unpolarised wave. Thus, for an unpolarised
wave the displacement will be randomly changing with time though it
will always be perpendicular to the direction of propagation.
Light waves are transverse in nature; i.e., the electric field associated
with a propagating light wave is always at right angles to the direction of
propagation of the wave. This can be easily demonstrated using a simple
polaroid. You must have seen thin plastic like sheets, which are called
polaroids. A polaroid consists of long chain molecules aligned in a
particular direction. The electric vectors (associated with the propagating
light wave) along the direction of the aligned molecules get absorbed.
Thus, if an unpolarised light wave is incident on such a polaroid then
the light wave will get linearly polarised with the electric vector oscillating
along a direction perpendicular to the aligned molecules; this direction
is known as the pass-axis of the polaroid.
Thus, if the light from an ordinary source (like a sodium lamp) passes
through a polaroid sheet P1,
it is observed that its intensity is reduced by
half. Rotating P1 has no effect on the transmitted beam and transmitted
intensity remains constant. Now, let an identical piece of polaroid P2 be
placed before P1. As expected, the light from the lamp is reduced in
intensity on passing through P2 alone. But now rotating P1 has a dramatic
effect on the light coming from P2. In one position, the intensity transmitted
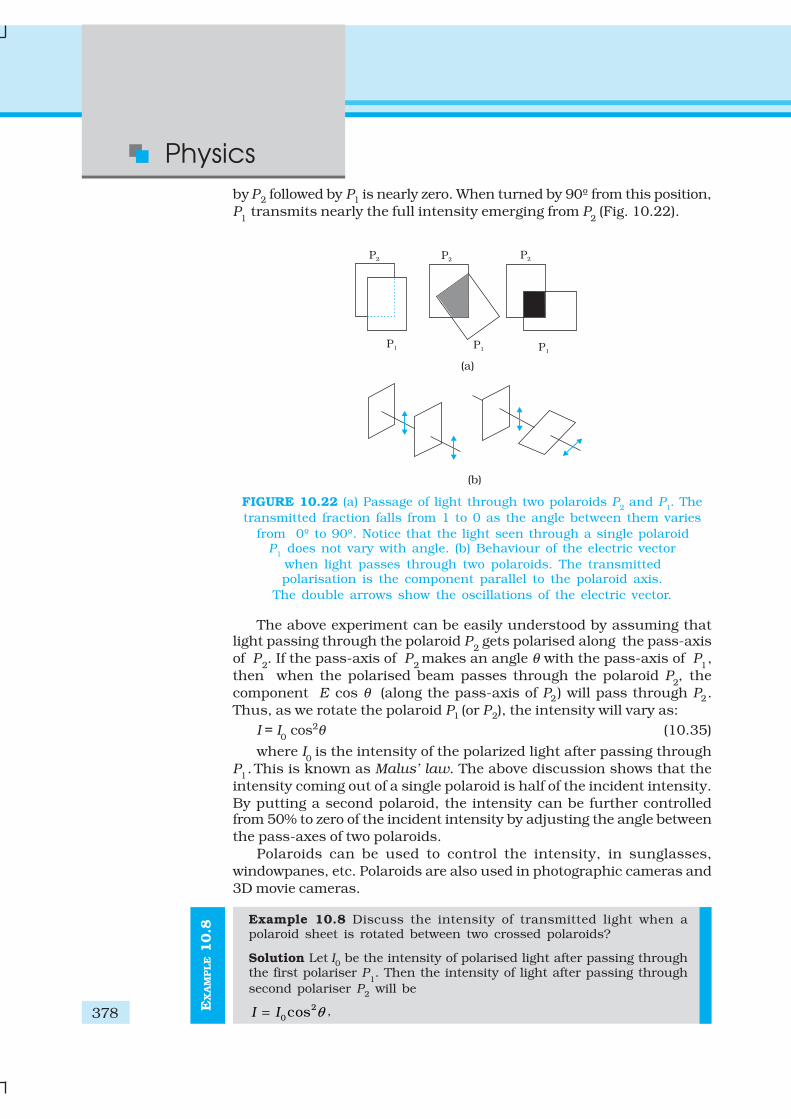
Physics
378 EX
AM
PLE 1
0.8
by P2 followed by P1 is nearly zero. When turned by 90º from this position,
P1 transmits nearly the full intensity emerging from P
2 (Fig. 10.22).
The above experiment can be easily understood by assuming thatlight passing through the polaroid P
2 gets polarised along the pass-axis
of P2. If the pass-axis of P
2 makes an angle θ with the pass-axis of P
1,
then when the polarised beam passes through the polaroid P2, the
component E cos θ (along the pass-axis of P2) will pass through P2.
Thus, as we rotate the polaroid P1 (or P2), the intensity will vary as:
I = I0 cos2θ (10.35)
where I0 is the intensity of the polarized light after passing through
P1. This is known as Malus’ law. The above discussion shows that the
intensity coming out of a single polaroid is half of the incident intensity.
By putting a second polaroid, the intensity can be further controlledfrom 50% to zero of the incident intensity by adjusting the angle between
the pass-axes of two polaroids.
Polaroids can be used to control the intensity, in sunglasses,
windowpanes, etc. Polaroids are also used in photographic cameras and
3D movie cameras.
Example 10.8 Discuss the intensity of transmitted light when apolaroid sheet is rotated between two crossed polaroids?
Solution Let I0 be the intensity of polarised light after passing throughthe first polariser P
1. Then the intensity of light after passing through
second polariser P2 will be
2
0cosI I θ= ,
FIGURE 10.22 (a) Passage of light through two polaroids P2 and P
1. The
transmitted fraction falls from 1 to 0 as the angle between them varies
from 0º to 90º. Notice that the light seen through a single polaroidP
1 does not vary with angle. (b) Behaviour of the electric vector
when light passes through two polaroids. The transmittedpolarisation is the component parallel to the polaroid axis.
The double arrows show the oscillations of the electric vector.
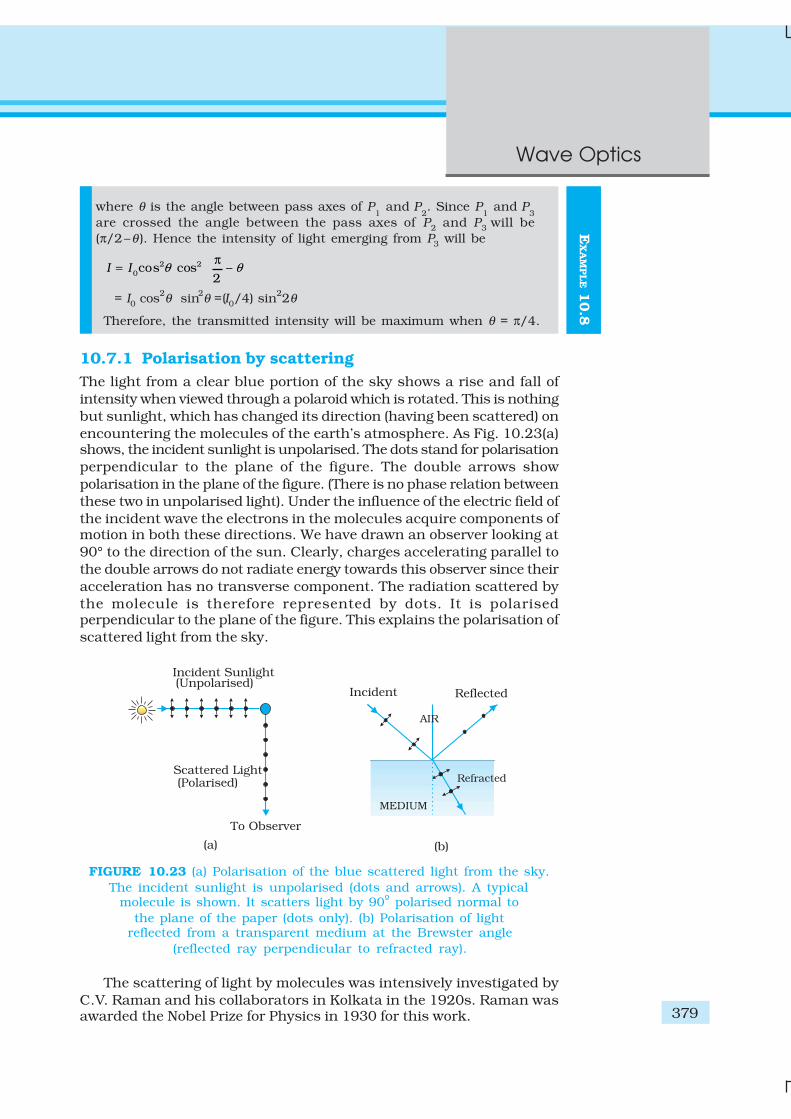
379
Wave Optics
where θ is the angle between pass axes of P1 and P
2. Since P
1 and P
3
are crossed the angle between the pass axes of P2 and P3 will be
(π/2–θ ). Hence the intensity of light emerging from P3 will be
2 2
0cos cos –
2I I θ θ
π =
= I0 cos2θ sin
2θ =(I0/4) sin
22θ
Therefore, the transmitted intensity will be maximum when θ = π/4.
10.7.1 Polarisation by scattering
The light from a clear blue portion of the sky shows a rise and fall of
intensity when viewed through a polaroid which is rotated. This is nothing
but sunlight, which has changed its direction (having been scattered) on
encountering the molecules of the earth’s atmosphere. As Fig. 10.23(a)shows, the incident sunlight is unpolarised. The dots stand for polarisation
perpendicular to the plane of the figure. The double arrows show
polarisation in the plane of the figure. (There is no phase relation between
these two in unpolarised light). Under the influence of the electric field of
the incident wave the electrons in the molecules acquire components ofmotion in both these directions. We have drawn an observer looking at
90° to the direction of the sun. Clearly, charges accelerating parallel to
the double arrows do not radiate energy towards this observer since their
acceleration has no transverse component. The radiation scattered by
the molecule is therefore represented by dots. It is polarisedperpendicular to the plane of the figure. This explains the polarisation of
scattered light from the sky.
FIGURE 10.23 (a) Polarisation of the blue scattered light from the sky.
The incident sunlight is unpolarised (dots and arrows). A typicalmolecule is shown. It scatters light by 90º polarised normal to
the plane of the paper (dots only). (b) Polarisation of lightreflected from a transparent medium at the Brewster angle
(reflected ray perpendicular to refracted ray).
The scattering of light by molecules was intensively investigated by
C.V. Raman and his collaborators in Kolkata in the 1920s. Raman wasawarded the Nobel Prize for Physics in 1930 for this work.
EX
AM
PLE 1
0.8
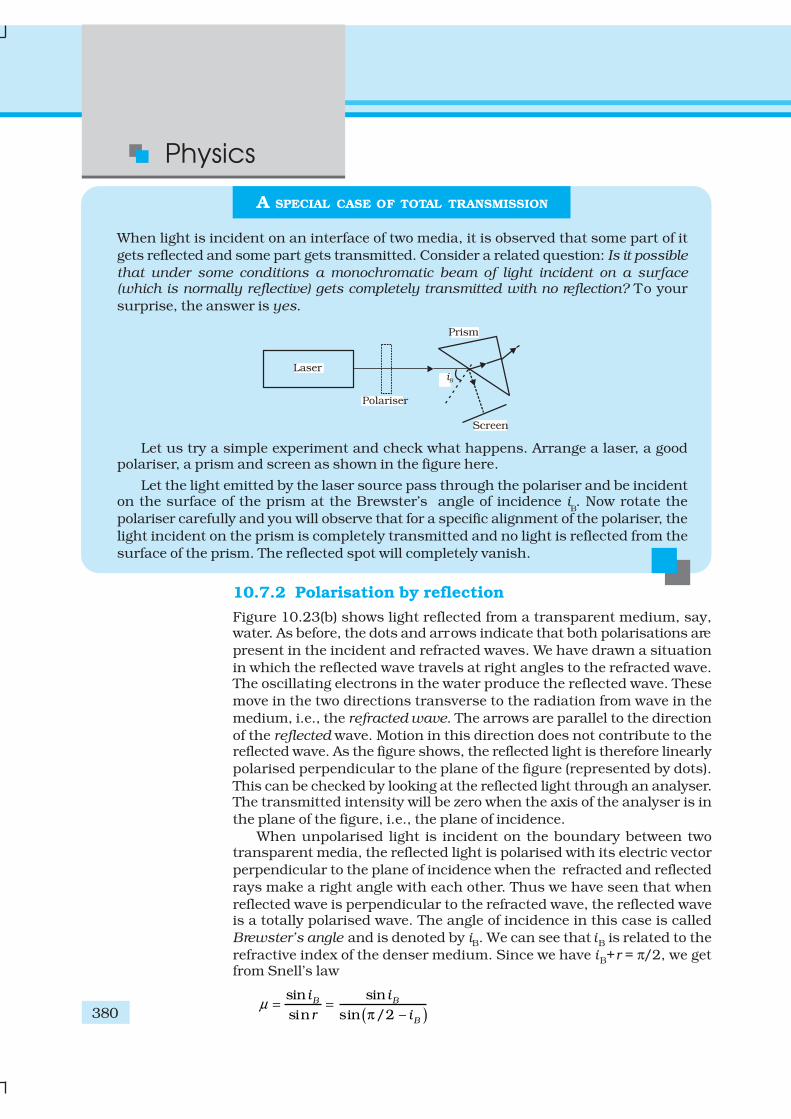
Physics
380
A SPECIAL CASE OF TOTAL TRANSMISSION
When light is incident on an interface of two media, it is observed that some part of it
gets reflected and some part gets transmitted. Consider a related question: Is it possible
that under some conditions a monochromatic beam of light incident on a surface(which is normally reflective) gets completely transmitted with no reflection? To your
surprise, the answer is yes.
Let us try a simple experiment and check what happens. Arrange a laser, a goodpolariser, a prism and screen as shown in the figure here.
Let the light emitted by the laser source pass through the polariser and be incidenton the surface of the prism at the Brewster’s angle of incidence i
B. Now rotate the
polariser carefully and you will observe that for a specific alignment of the polariser, the
light incident on the prism is completely transmitted and no light is reflected from the
surface of the prism. The reflected spot will completely vanish.
10.7.2 Polarisation by reflection
Figure 10.23(b) shows light reflected from a transparent medium, say,water. As before, the dots and arrows indicate that both polarisations are
present in the incident and refracted waves. We have drawn a situation
in which the reflected wave travels at right angles to the refracted wave.The oscillating electrons in the water produce the reflected wave. These
move in the two directions transverse to the radiation from wave in the
medium, i.e., the refracted wave. The arrows are parallel to the direction
of the reflected wave. Motion in this direction does not contribute to thereflected wave. As the figure shows, the reflected light is therefore linearly
polarised perpendicular to the plane of the figure (represented by dots).
This can be checked by looking at the reflected light through an analyser.The transmitted intensity will be zero when the axis of the analyser is in
the plane of the figure, i.e., the plane of incidence.
When unpolarised light is incident on the boundary between twotransparent media, the reflected light is polarised with its electric vector
perpendicular to the plane of incidence when the refracted and reflected
rays make a right angle with each other. Thus we have seen that when
reflected wave is perpendicular to the refracted wave, the reflected waveis a totally polarised wave. The angle of incidence in this case is called
Brewster’s angle and is denoted by iB. We can see that iB is related to the
refractive index of the denser medium. Since we have iB+r = π/2, we getfrom Snell’s law
( )sin sin
sin sin /2 –B B
B
i i
r iµ = =
π

381
Wave Optics
EX
AM
PLE 1
0.9
sintan
cosB
B
B
ii
i= = (10.36)
This is known as Brewster’s law.
Example 10.9 Unpolarised light is incident on a plane glass surface.What should be the angle of incidence so that the reflected and
refracted rays are perpendicular to each other?
Solution For i + r to be equal to π/2, we should have tan iB = µ = 1.5.
This gives iB = 57°. This is the Brewster’s angle for air to glass
interface.
For simplicity, we have discussed scattering of light by 90º, and
reflection at the Brewster angle. In this special situation, one of the twoperpendicular components of the electric field is zero. At other angles,
both components are present but one is stronger than the other. There is
no stable phase relationship between the two perpendicular components
since these are derived from two perpendicular components of an
unpolarised beam. When such light is viewed through a rotating analyser,one sees a maximum and a minimum of intensity but not complete
darkness. This kind of light is called partially polarised.
Let us try to understand the situation. When an unpolarised beam of
light is incident at the Brewster’s angle on an interface of two media, only
part of light with electric field vector perpendicular to the plane ofincidence will be reflected. Now by using a good polariser, if we completely
remove all the light with its electric vector perpendicular to the plane of
incidence and let this light be incident on the surface of the prism at
Brewster’s angle, you will then observe no reflection and there will be
total transmission of light.We began this chapter by pointing out that there are some phenomena
which can be explained only by the wave theory. In order to develop a
proper understanding, we first described how some phenomena like
reflection and refraction, which were studied on this basis of Ray Optics
in Chapter 9, can also be understood on the basis of Wave Optics. Thenwe described Young’s double slit experiment which was a turning point
in the study of optics. Finally, we described some associated points such
as diffraction, resolution, polarisation, and validity of ray optics. In the
next chapter, you will see how new experiments led to new theories at
the turn of the century around 1900 A.D.
SUMMARY
1. Huygens’ principle tells us that each point on a wavefront is a source
of secondary waves, which add up to give the wavefront at a later time.
2. Huygens’ construction tells us that the new wavefront is the forward
envelope of the secondary waves. When the speed of light is
independent of direction, the secondary waves are spherical. The rays
are then perpendicular to both the wavefronts and the time of travel

Physics
382
is the same measured along any ray. This principle leads to the well
known laws of reflection and refraction.
3. The principle of superposition of waves applies whenever two or moresources of light illuminate the same point. When we consider the
intensity of light due to these sources at the given point, there is aninterference term in addition to the sum of the individual intensities.
But this term is important only if it has a non-zero average, whichoccurs only if the sources have the same frequency and a stable
phase difference.
4. Young’s double slit of separation d gives equally spaced fringes of
angular separation λ/d. The source, mid-point of the slits, and centralbright fringe lie in a straight line. An extended source will destroy
the fringes if it subtends angle more than λ/d at the slits.
5. A single slit of width a gives a diffraction pattern with a central
maximum. The intensity falls to zero at angles of 2
, ,a a
λ λ± ± etc.,
with successively weaker secondary maxima in between. Diffractionlimits the angular resolution of a telescope to λ/D where D is the
diameter. Two stars closer than this give strongly overlapping images.Similarly, a microscope objective subtending angle 2β at the focus,
in a medium of refractive index n, will just separate two objects spacedat a distance λ/(2n sin β), which is the resolution limit of a
microscope. Diffraction determines the limitations of the concept oflight rays. A beam of width a travels a distance a2/λ, called the Fresnel
distance, before it starts to spread out due to diffraction.
6. Natural light, e.g., from the sun is unpolarised. This means the electric
vector takes all possible directions in the transverse plane, rapidlyand randomly, during a measurement. A polaroid transmits only one
component (parallel to a special axis). The resulting light is calledlinearly polarised or plane polarised. When this kind of light is viewed
through a second polaroid whose axis turns through 2π, two maximaand minima of intensity are seen. Polarised light can also be produced
by reflection at a special angle (called the Brewster angle) and byscattering through π/2 in the earth’s atmosphere.
POINTS TO PONDER
1. Waves from a point source spread out in all directions, while light was
seen to travel along narrow rays. It required the insight and experiment
of Huygens, Young and Fresnel to understand how a wave theory could
explain all aspects of the behaviour of light.
2. The crucial new feature of waves is interference of amplitudes from different
sources which can be both constructive and destructive, as shown in
Young’s experiment.
3. Even a wave falling on single slit should be regarded as a large number of
sources which interefere constructively in the forward direction (θ = 0),
and destructively in other directions.
4. Diffraction phenomena define the limits of ray optics. The limit of the
ability of microscopes and telescopes to distinguish very close objects is
set by the wavelength of light.
5. Most interference and diffraction effects exist even for longitudinal waves
like sound in air. But polarisation phenomena are special to transverse
waves like light waves.
383
Wave Optics
EXERCISES
10.1 Monochromatic light of wavelength 589 nm is incident from air on a
water surface. What are the wavelength, frequency and speed of
(a) reflected, and (b) refracted light? Refractive index of water is
1.33.
10.2 What is the shape of the wavefront in each of the following cases:
(a) Light diverging from a point source.
(b) Light emerging out of a convex lens when a point source is placed
at its focus.
(c) The portion of the wavefront of light from a distant star intercepted
by the Earth.
10.3 (a) The refractive index of glass is 1.5. What is the speed of light in
glass? (Speed of light in vacuum is 3.0 × 10⁸ m s–1)
(b) Is the speed of light in glass independent of the colour of light? If
not, which of the two colours red and violet travels slower in a
glass prism?
10.4 In a Young’s double-slit experiment, the slits are separated by
0.28 mm and the screen is placed 1.4 m away. The distance between
the central bright fringe and the fourth bright fringe is measured
to be 1.2 cm. Determine the wavelength of light used in the
experiment.
10.5 In Young’s double-slit experiment using monochromatic light of
wavelength λ, the intensity of light at a point on the screen where
path difference is λ, is K units. What is the intensity of light at a
point where path difference is λ/3?
10.6 A beam of light consisting of two wavelengths, 650 nm and 520 nm,
is used to obtain interference fringes in a Young’s double-slit
experiment.
(a) Find the distance of the third bright fringe on the screen from
the central maximum for wavelength 650 nm.
(b) What is the least distance from the central maximum where the
bright fringes due to both the wavelengths coincide?
10.7 In a double-slit experiment the angular width of a fringe is found to
be 0.2° on a screen placed 1 m away. The wavelength of light used is
600 nm. What will be the angular width of the fringe if the entire
experimental apparatus is immersed in water? Take refractive index
of water to be 4/3.
10.8 What is the Brewster angle for air to glass transition? (Refractive
index of glass = 1.5.)
10.9 Light of wavelength 5000 Å falls on a plane reflecting surface. What
are the wavelength and frequency of the reflected light? For what
angle of incidence is the reflected ray normal to the incident ray?
10.10 Estimate the distance for which ray optics is good approximation
for an aperture of 4 mm and wavelength 400 nm.
Physics
384
ADDITIONAL EXERCISES
10.11 The 6563 Å Hα line emitted by hydrogen in a star is found to be red-
shifted by 15 Å. Estimate the speed with which the star is receding
from the Earth.
10.12 Explain how Corpuscular theory predicts the speed of light in a
medium, say, water, to be greater than the speed of light in vacuum.
Is the prediction confirmed by experimental determination of the
speed of light in water? If not, which alternative picture of light is
consistent with experiment?
10.13 You have learnt in the text how Huygens’ principle leads to the laws
of reflection and refraction. Use the same principle to deduce directly
that a point object placed in front of a plane mirror produces a
virtual image whose distance from the mirror is equal to the object
distance from the mirror.
10.14 Let us list some of the factors, which could possibly influence the
speed of wave propagation:
(i) nature of the source.
(ii) direction of propagation.
(iii) motion of the source and/or observer.
(iv) wavelength.
(v) intensity of the wave.
On which of these factors, if any, does
(a) the speed of light in vacuum,
(b) the speed of light in a medium (say, glass or water),
depend?
10.15 For sound waves, the Doppler formula for frequency shift differs
slightly between the two situations: (i) source at rest; observer
moving, and (ii) source moving; observer at rest. The exact Doppler
formulas for the case of light waves in vacuum are, however, strictly
identical for these situations. Explain why this should be so. Would
you expect the formulas to be strictly identical for the two situations
in case of light travelling in a medium?
10.16 In double-slit experiment using light of wavelength 600 nm, the
angular width of a fringe formed on a distant screen is 0.1º. What is
the spacing between the two slits?
10.17 Answer the following questions:
(a) In a single slit diffraction experiment, the width of the slit is
made double the original width. How does this affect the size
and intensity of the central diffraction band?
(b) In what way is diffraction from each slit related to the
interference pattern in a double-slit experiment?
(c) When a tiny circular obstacle is placed in the path of light from
a distant source, a bright spot is seen at the centre of the shadow
of the obstacle. Explain why?
(d) Two students are separated by a 7 m partition wall in a room
10 m high. If both light and sound waves can bend around
385
Wave Optics
obstacles, how is it that the students are unable to see each
other even though they can converse easily.
(e) Ray optics is based on the assumption that light travels in a
straight line. Diffraction effects (observed when light propagatesthrough small apertures/slits or around small obstacles)
disprove this assumption. Yet the ray optics assumption is socommonly used in understanding location and several other
properties of images in optical instruments. What is the
justification?
10.18 Two towers on top of two hills are 40 km apart. The line joiningthem passes 50 m above a hill halfway between the towers. What is
the longest wavelength of radio waves, which can be sent betweenthe towers without appreciable diffraction effects?
10.19 A parallel beam of light of wavelength 500 nm falls on a narrow slit
and the resulting diffraction pattern is observed on a screen 1 m
away. It is observed that the first minimum is at a distance of 2.5mm from the centre of the screen. Find the width of the slit.
10.20 Answer the following questions:
(a) When a low flying aircraft passes overhead, we sometimes notice
a slight shaking of the picture on our TV screen. Suggest apossible explanation.
(b) As you have learnt in the text, the principle of linear
superposition of wave displacement is basic to understanding
intensity distributions in diffraction and interference patterns.What is the justification of this principle?
10.21 In deriving the single slit diffraction pattern, it was stated that the
intensity is zero at angles of nλ/a. Justify this by suitably dividingthe slit to bring out the cancellation.
Physics
386
11.1 INTRODUCTION
The Maxwell’s equations of electromagnetism and Hertz experiments on
the generation and detection of electromagnetic waves in 1887 stronglyestablished the wave nature of light. Towards the same period at the end
of 19th century, experimental investigations on conduction of electricity
(electric discharge) through gases at low pressure in a discharge tube led
to many historic discoveries. The discovery of X-rays by Roentgen in 1895,
and of electron by J. J. Thomson in 1897, were important milestones inthe understanding of atomic structure. It was found that at sufficiently
low pressure of about 0.001 mm of mercury column, a discharge took
place between the two electrodes on applying the electric field to the gas
in the discharge tube. A fluorescent glow appeared on the glass opposite
to cathode. The colour of glow of the glass depended on the type of glass,it being yellowish-green for soda glass. The cause of this fluorescence
was attributed to the radiation which appeared to be coming from the
cathode. These cathode rays were discovered, in 1870, by William
Crookes who later, in 1879, suggested that these rays consisted of streams
of fast moving negatively charged particles. The British physicistJ. J. Thomson (1856-1940) confirmed this hypothesis. By applying
mutually perpendicular electric and magnetic fields across the discharge
tube, J. J. Thomson was the first to determine experimentally the speed
and the specific charge [charge to mass ratio (e/m )] of the cathode ray
Chapter Eleven
DUAL NATURE OF
RADIATION AND
MATTER
387
Dual Nature of Radiation
and Matter
particles. They were found to travel with speeds ranging from about 0.1
to 0.2 times the speed of light (3 ×10⁸ m/s). The presently accepted valueof e/m is 1.76 × 10¹¹ C/kg. Further, the value of e/m was found to be
independent of the nature of the material/metal used as the cathode
(emitter), or the gas introduced in the discharge tube. This observationsuggested the universality of the cathode ray particles.
Around the same time, in 1887, it was found that certain metals, whenirradiated by ultraviolet light, emitted negatively charged particles having
small speeds. Also, certain metals when heated to a high temperature were
found to emit negatively charged particles. The value of e/m of these particleswas found to be the same as that for cathode ray particles. These
observations thus established that all these particles, although producedunder different conditions, were identical in nature. J. J. Thomson, in 1897,
named these particles as electrons, and suggested that they were
fundamental, universal constituents of matter. For his epoch-makingdiscovery of electron, through his theoretical and experimental
investigations on conduction of electricity by gasses, he was awarded theNobel Prize in Physics in 1906. In 1913, the American physicist R. A.
Millikan (1868-1953) performed the pioneering oil-drop experiment for
the precise measurement of the charge on an electron. He found that thecharge on an oil-droplet was always an integral multiple of an elementary
charge, 1.602 × 10 –19 C. Millikan’s experiment established that electric
charge is quantised. From the values of charge (e ) and specific charge(e/m ), the mass (m) of the electron could be determined.
11.2 ELECTRON EMISSION
We know that metals have free electrons (negatively charged particles) thatare responsible for their conductivity. However, the free electrons cannot
normally escape out of the metal surface. If an electron attempts to comeout of the metal, the metal surface acquires a positive charge and pulls the
electron back to the metal. The free electron is thus held inside the metalsurface by the attractive forces of the ions. Consequently, the electron cancome out of the metal surface only if it has got sufficient energy to overcome
the attractive pull. A certain minimum amount of energy is required to begiven to an electron to pull it out from the surface of the metal. This
minimum energy required by an electron to escape from the metal surfaceis called the work function of the metal. It is generally denoted by φ0 andmeasured in eV (electron volt). One electron volt is the energy gained by an
electron when it has been accelerated by a potential difference of 1 volt, sothat 1 eV = 1.602 ×10 –19 J.
This unit of energy is commonly used in atomic and nuclear physics.The work function (φ0) depends on the properties of the metal and thenature of its surface. The values of work function of some metals are
given in Table 11.1. These values are approximate as they are verysensitive to surface impurities.
Note from Table 11.1 that the work function of platinum is the highest(φ0 = 5.65 eV ) while it is the lowest (φ0 = 2.14 eV) for caesium.
The minimum energy required for the electron emission from the metal
surface can be supplied to the free electrons by any one of the followingphysical processes:
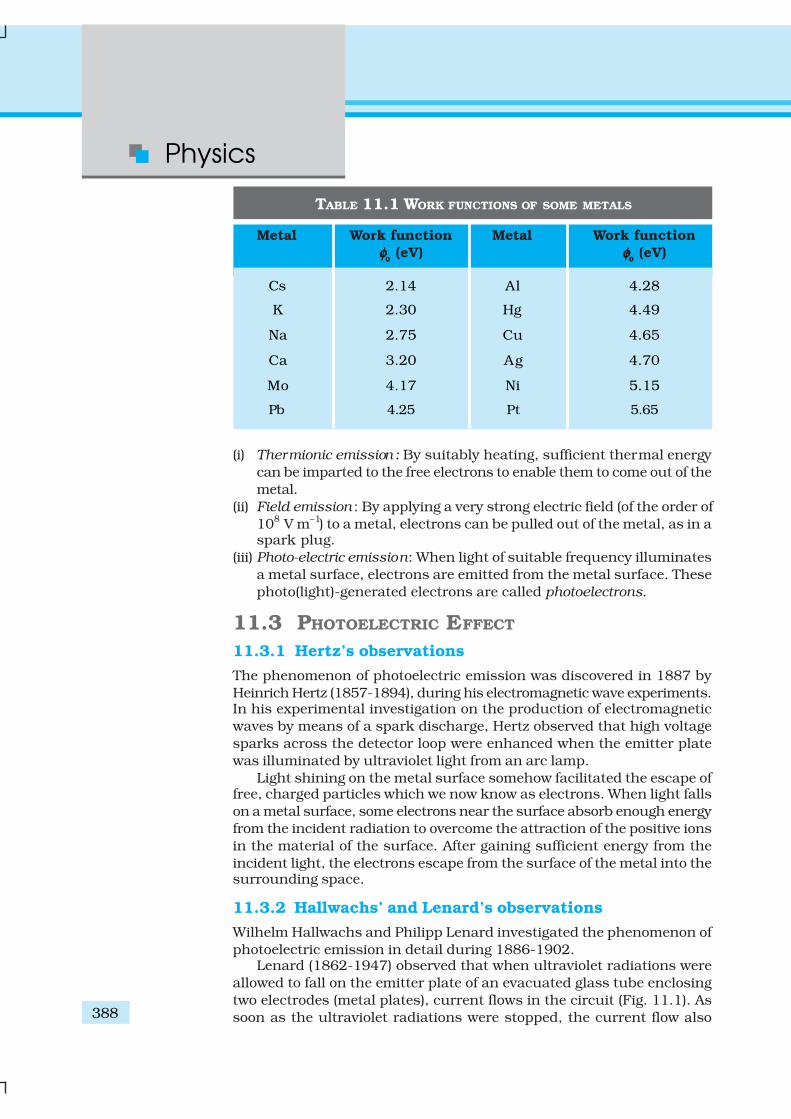
Physics
388
(i) Thermionic emission : By suitably heating, sufficient thermal energy
can be imparted to the free electrons to enable them to come out of the
metal.
(ii) Field emission : By applying a very strong electric field (of the order of
108 V m–1) to a metal, electrons can be pulled out of the metal, as in aspark plug.
(iii) Photo-electric emission: When light of suitable frequency illuminates
a metal surface, electrons are emitted from the metal surface. These
photo(light)-generated electrons are called photoelectrons.
11.3 PHOTOELECTRIC EFFECT
11.3.1 Hertz’s observations
The phenomenon of photoelectric emission was discovered in 1887 by
Heinrich Hertz (1857-1894), during his electromagnetic wave experiments.In his experimental investigation on the production of electromagnetic
waves by means of a spark discharge, Hertz observed that high voltage
sparks across the detector loop were enhanced when the emitter plate
was illuminated by ultraviolet light from an arc lamp.
Light shining on the metal surface somehow facilitated the escape offree, charged particles which we now know as electrons. When light falls
on a metal surface, some electrons near the surface absorb enough energy
from the incident radiation to overcome the attraction of the positive ions
in the material of the surface. After gaining sufficient energy from the
incident light, the electrons escape from the surface of the metal into thesurrounding space.
11.3.2 Hallwachs’ and Lenard’s observations
Wilhelm Hallwachs and Philipp Lenard investigated the phenomenon of
photoelectric emission in detail during 1886-1902.Lenard (1862-1947) observed that when ultraviolet radiations were
allowed to fall on the emitter plate of an evacuated glass tube enclosing
two electrodes (metal plates), current flows in the circuit (Fig. 11.1). As
soon as the ultraviolet radiations were stopped, the current flow also
TABLE 11.1 WORK FUNCTIONS OF SOME METALS
Metal Work function Metal Work function
φφφφφοοοοο (eV) φφφφφοοοοο
(eV)
Cs 2.14 Al 4.28
K 2.30 Hg 4.49
Na 2.75 Cu 4.65
Ca 3.20 Ag 4.70
Mo 4.17 Ni 5.15
Pb 4.25 Pt 5.65
389
Dual Nature of Radiation
and Matter
stopped. These observations indicate that when ultraviolet radiations fall
on the emitter plate C, electrons are ejected from it which are attractedtowards the positive, collector plate A by the electric field. The electrons
flow through the evacuated glass tube, resulting in the current flow. Thus,
light falling on the surface of the emitter causes current in the externalcircuit. Hallwachs and Lenard studied how this photo current varied with
collector plate potential, and with frequency and intensity of incident light.Hallwachs, in 1888, undertook the study further and connected a
negatively charged zinc plate to an electroscope. He observed that the
zinc plate lost its charge when it was illuminated by ultraviolet light.Further, the uncharged zinc plate became positively charged when it was
irradiated by ultraviolet light. Positive charge on a positively chargedzinc plate was found to be further enhanced when it was illuminated by
ultraviolet light. From these observations he concluded that negatively
charged particles were emitted from the zinc plate under the action ofultraviolet light.
After the discovery of the electron in 1897, it became evident that the
incident light causes electrons to be emitted from the emitter plate. Dueto negative charge, the emitted electrons are pushed towards the collector
plate by the electric field. Hallwachs and Lenard also observed that when
ultraviolet light fell on the emitter plate, no electrons were emitted at allwhen the frequency of the incident light was smaller than a certain
minimum value, called the threshold frequency. This minimum frequency
depends on the nature of the material of the emitter plate.
It was found that certain metals like zinc, cadmium, magnesium, etc.,responded only to ultraviolet light, having short wavelength, to cause
electron emission from the surface. However, some alkali metals such as
lithium, sodium, potassium, caesium and rubidium were sensitiveeven to visible light. All these photosensitive substances emit electrons
when they are illuminated by light. After the discovery of electrons, these
electrons were termed as photoelectrons. The phenomenon is calledphotoelectric effect.
11.4 EXPERIMENTAL STUDY OF PHOTOELECTRIC
EFFECT
Figure 11.1 depicts a schematic view of the arrangement used for the
experimental study of the photoelectric effect. It consists of an evacuatedglass/quartz tube having a photosensitive plate C and another metal
plate A. Monochromatic light from the source S of sufficiently short
wavelength passes through the window W and falls on the photosensitiveplate C (emitter). A transparent quartz window is sealed on to the glass
tube, which permits ultraviolet radiation to pass through it and irradiate
the photosensitive plate C. The electrons are emitted by the plate C andare collected by the plate A (collector), by the electric field created by the
battery. The battery maintains the potential difference between the platesC and A, that can be varied. The polarity of the plates C and A can be
reversed by a commutator. Thus, the plate A can be maintained at a desired
positive or negative potential with respect to emitter C. When the collectorplate A is positive with respect to the emitter plate C, the electrons are
Sim
ula
te e
xp
erim
en
ts o
n p
ho
toele
ctric
effe
ct
http
://ww
w.kcvs.ca/site/p
rojects/p
hysics.h
tml
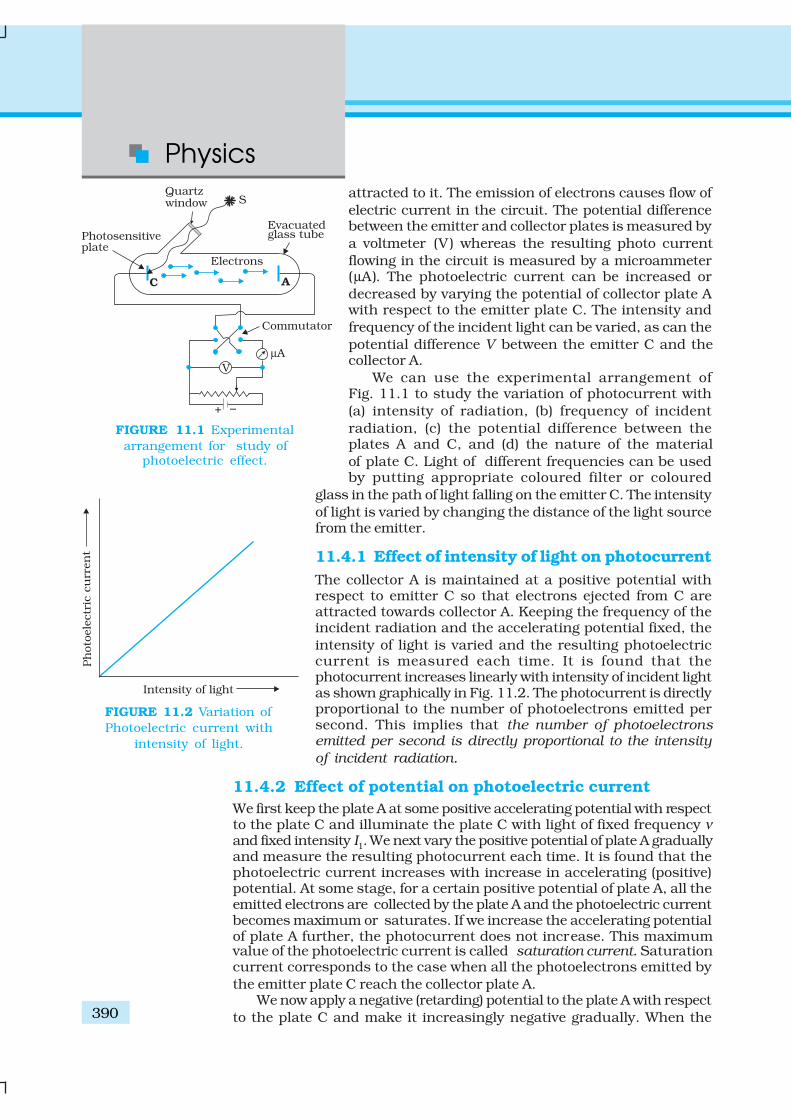
Physics
390
attracted to it. The emission of electrons causes flow of
electric current in the circuit. The potential differencebetween the emitter and collector plates is measured by
a voltmeter (V) whereas the resulting photo current
flowing in the circuit is measured by a microammeter(µA). The photoelectric current can be increased or
decreased by varying the potential of collector plate Awith respect to the emitter plate C. The intensity and
frequency of the incident light can be varied, as can the
potential difference V between the emitter C and thecollector A.
We can use the experimental arrangement ofFig. 11.1 to study the variation of photocurrent with
(a) intensity of radiation, (b) frequency of incident
radiation, (c) the potential difference between theplates A and C, and (d) the nature of the material
of plate C. Light of different frequencies can be usedby putting appropriate coloured filter or coloured
glass in the path of light falling on the emitter C. The intensity
of light is varied by changing the distance of the light sourcefrom the emitter.
11.4.1 Effect of intensity of light on photocurrent
The collector A is maintained at a positive potential withrespect to emitter C so that electrons ejected from C areattracted towards collector A. Keeping the frequency of theincident radiation and the accelerating potential fixed, the
intensity of light is varied and the resulting photoelectriccurrent is measured each time. It is found that thephotocurrent increases linearly with intensity of incident lightas shown graphically in Fig. 11.2. The photocurrent is directlyproportional to the number of photoelectrons emitted persecond. This implies that the number of photoelectronsemitted per second is directly proportional to the intensity
of incident radiation.
11.4.2 Effect of potential on photoelectric current
We first keep the plate A at some positive accelerating potential with respectto the plate C and illuminate the plate C with light of fixed frequency νand fixed intensity I1. We next vary the positive potential of plate A graduallyand measure the resulting photocurrent each time. It is found that thephotoelectric current increases with increase in accelerating (positive)potential. At some stage, for a certain positive potential of plate A, all theemitted electrons are collected by the plate A and the photoelectric currentbecomes maximum or saturates. If we increase the accelerating potentialof plate A further, the photocurrent does not increase. This maximumvalue of the photoelectric current is called saturation current. Saturationcurrent corresponds to the case when all the photoelectrons emitted by
the emitter plate C reach the collector plate A.We now apply a negative (retarding) potential to the plate A with respect
to the plate C and make it increasingly negative gradually. When the
FIGURE 11.1 Experimental
arrangement for study ofphotoelectric effect.
FIGURE 11.2 Variation of
Photoelectric current with
intensity of light.
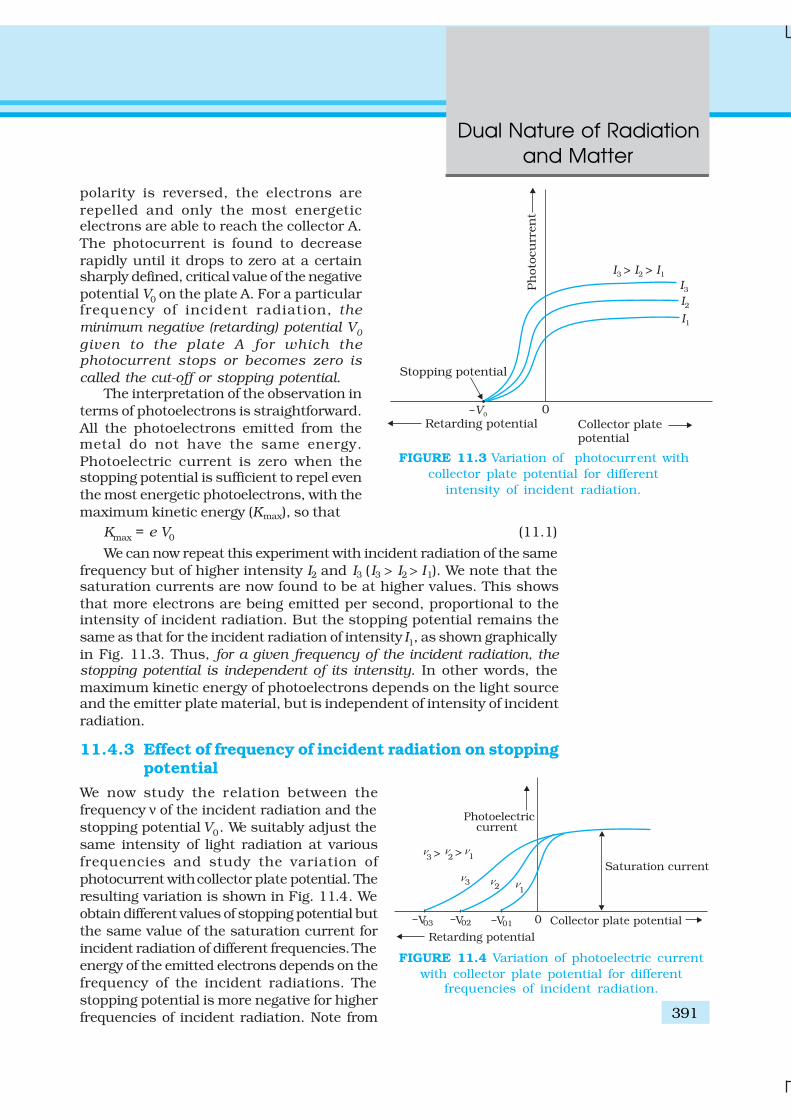
391
Dual Nature of Radiation
and Matter
polarity is reversed, the electrons are
repelled and only the most energeticelectrons are able to reach the collector A.
The photocurrent is found to decrease
rapidly until it drops to zero at a certainsharply defined, critical value of the negative
potential V0 on the plate A. For a particularfrequency of incident radiation, the
minimum negative (retarding) potential V0
given to the plate A for which thephotocurrent stops or becomes zero is
called the cut-off or stopping potential.The interpretation of the observation in
terms of photoelectrons is straightforward.
All the photoelectrons emitted from themetal do not have the same energy.
Photoelectric current is zero when thestopping potential is sufficient to repel even
the most energetic photoelectrons, with the
maximum kinetic energy (Kmax), so that
Kmax = e V0 (11.1)
We can now repeat this experiment with incident radiation of the same
frequency but of higher intensity I2 and I3 (I3 > I2 > I1). We note that thesaturation currents are now found to be at higher values. This shows
that more electrons are being emitted per second, proportional to theintensity of incident radiation. But the stopping potential remains the
same as that for the incident radiation of intensity I1, as shown graphically
in Fig. 11.3. Thus, for a given frequency of the incident radiation, thestopping potential is independent of its intensity. In other words, the
maximum kinetic energy of photoelectrons depends on the light sourceand the emitter plate material, but is independent of intensity of incident
radiation.
11.4.3 Effect of frequency of incident radiation on stoppingpotential
We now study the relation between the
frequency ν of the incident radiation and the
stopping potential V0. We suitably adjust the
same intensity of light radiation at various
frequencies and study the variation of
photocurrent with collector plate potential. The
resulting variation is shown in Fig. 11.4. We
obtain different values of stopping potential but
the same value of the saturation current for
incident radiation of different frequencies. The
energy of the emitted electrons depends on the
frequency of the incident radiations. The
stopping potential is more negative for higher
frequencies of incident radiation. Note from
FIGURE 11.3 Variation of photocurrent with
collector plate potential for different
intensity of incident radiation.
FIGURE 11.4 Variation of photoelectric current
with collector plate potential for differentfrequencies of incident radiation.

Physics
392
Fig. 11.4 that the stopping potentials are in the
order V03 > V02 > V01 if the frequencies are in theorder ν3 > ν2 > ν1 . This implies that greater the
frequency of incident light, greater is themaximum kinetic energy of the photoelectrons.
Consequently, we need greater retarding
potential to stop them completely. If we plot agraph between the frequency of incident radiation
and the corresponding stopping potential fordifferent metals we get a straight line, as shown
in Fig. 11.5.
The graph shows that(i) the stopping potential V0 varies linearly with
the frequency of incident radiation for a givenphotosensitive material.
(ii) there exists a certain minimum cut-off frequency ν0 for which the
stopping potential is zero.
These observations have two implications:
(i) The maximum kinetic energy of the photoelectrons varies linearlywith the frequency of incident radiation, but is independent of its
intensity.
(ii) For a frequency ν of incident radiation, lower than the cut-offfrequency ν0, no photoelectric emission is possible even if the
intensity is large.This minimum, cut-off frequency ν0, is called the threshold frequency.
It is different for different metals.
Different photosensitive materials respond differently to light. Seleniumis more sensitive than zinc or copper. The same photosensitive substance
gives different response to light of different wavelengths. For example,ultraviolet light gives rise to photoelectric effect in copper while green or
red light does not.Note that in all the above experiments, it is found that, if frequency of
the incident radiation exceeds the threshold frequency, the photoelectricemission starts instantaneously without any apparent time lag, even ifthe incident radiation is very dim. It is now known that emission starts in
a time of the order of 10 –9 s or less.We now summarise the experimental features and observations
described in this section.
(i) For a given photosensitive material and frequency of incident radiation(above the threshold frequency), the photoelectric current is directlyproportional to the intensity of incident light (Fig. 11.2).
(ii) For a given photosensitive material and frequency of incident radiation,
saturation current is found to be proportional to the intensity ofincident radiation whereas the stopping potential is independent ofits intensity (Fig. 11.3).
(iii) For a given photosensitive material, there exists a certain minimumcut-off frequency of the incident radiation, called the thresholdfrequency, below which no emission of photoelectrons takes place,
no matter how intense the incident light is. Above the thresholdfrequency, the stopping potential or equivalently the maximum kinetic
FIGURE 11.5 Variation of stopping potential V0
with frequency ν of incident radiation for a
given photosensitive material.
393
Dual Nature of Radiation
and Matter
energy of the emitted photoelectrons increases linearly with the
frequency of the incident radiation, but is independent of its intensity(Fig. 11.5).
(iv) The photoelectric emission is an instantaneous process without anyapparent time lag (∼10 – 9s or less), even when the incident radiation is
made exceedingly dim.
11.5 PHOTOELECTRIC EFFECT AND WAVE THEORY
OF LIGHT
The wave nature of light was well established by the end of the nineteenthcentury. The phenomena of interference, diffraction and polarisation were
explained in a natural and satisfactory way by the wave picture of light.According to this picture, light is an electromagnetic wave consisting of
electric and magnetic fields with continuous distribution of energy over
the region of space over which the wave is extended. Let us now see if thiswave picture of light can explain the observations on photoelectric
emission given in the previous section.According to the wave picture of light, the free electrons at the surface
of the metal (over which the beam of radiation falls) absorb the radiant
energy continuously. The greater the intensity of radiation, the greater arethe amplitude of electric and magnetic fields. Consequently, the greater
the intensity, the greater should be the energy absorbed by each electron.In this picture, the maximum kinetic energy of the photoelectrons on the
surface is then expected to increase with increase in intensity. Also, no
matter what the frequency of radiation is, a sufficiently intense beam ofradiation (over sufficient time) should be able to impart enough energy to
the electrons, so that they exceed the minimum energy needed to escapefrom the metal surface . A threshold frequency, therefore, should not exist.
These expectations of the wave theory directly contradict observations (i),
(ii) and (iii) given at the end of sub-section 11.4.3.Further, we should note that in the wave picture, the absorption of
energy by electron takes place continuously over the entirewavefront of the radiation. Since a large number of electrons absorb energy,
the energy absorbed per electron per unit time turns out to be small.
Explicit calculations estimate that it can take hours or more for a singleelectron to pick up sufficient energy to overcome the work function and
come out of the metal. This conclusion is again in striking contrast toobservation (iv) that the photoelectric emission is instantaneous. In short,
the wave picture is unable to explain the most basic features of
photoelectric emission.
11.6 EINSTEIN’S PHOTOELECTRIC EQUATION: ENERGY
QUANTUM OF RADIATION
In 1905, Albert Einstein (1879-1955) proposed a radically new picture
of electromagnetic radiation to explain photoelectric effect. In this picture,photoelectric emission does not take place by continuous absorption of
energy from radiation. Radiation energy is built up of discrete units – the
so called quanta of energy of radiation. Each quantum of radiant energy
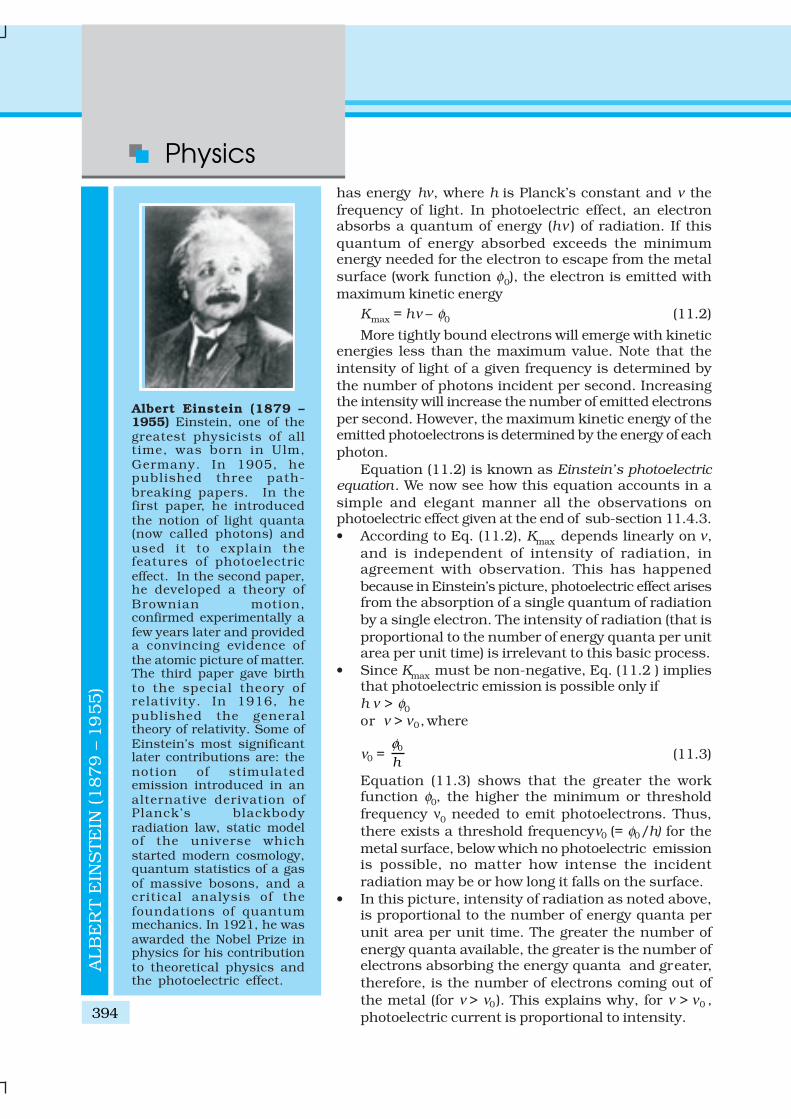
Physics
394
has energy hν, where h is Planck’s constant and ν the
frequency of light. In photoelectric effect, an electronabsorbs a quantum of energy (hν ) of radiation. If this
quantum of energy absorbed exceeds the minimumenergy needed for the electron to escape from the metal
surface (work function φ0), the electron is emitted with
maximum kinetic energy
Kmax = hν – φ0 (11.2)
More tightly bound electrons will emerge with kineticenergies less than the maximum value. Note that the
intensity of light of a given frequency is determined by
the number of photons incident per second. Increasingthe intensity will increase the number of emitted electrons
per second. However, the maximum kinetic energy of theemitted photoelectrons is determined by the energy of each
photon.
Equation (11.2) is known as Einstein’s photoelectricequation. We now see how this equation accounts in a
simple and elegant manner all the observations onphotoelectric effect given at the end of sub-section 11.4.3.
• According to Eq. (11.2), Kmax depends linearly on ν,
and is independent of intensity of radiation, inagreement with observation. This has happened
because in Einstein’s picture, photoelectric effect arisesfrom the absorption of a single quantum of radiation
by a single electron. The intensity of radiation (that is
proportional to the number of energy quanta per unitarea per unit time) is irrelevant to this basic process.
• Since Kmax must be non-negative, Eq. (11.2 ) impliesthat photoelectric emission is possible only if
h ν > φ0
or ν > ν0, where
ν0 = 0
h
φ(11.3)
Equation (11.3) shows that the greater the workfunction φ0, the higher the minimum or threshold
frequency ν0 needed to emit photoelectrons. Thus,
there exists a threshold frequencyν0 (= φ0/h) for the
metal surface, below which no photoelectric emissionis possible, no matter how intense the incident
radiation may be or how long it falls on the surface.
• In this picture, intensity of radiation as noted above,is proportional to the number of energy quanta per
unit area per unit time. The greater the number of
energy quanta available, the greater is the number ofelectrons absorbing the energy quanta and greater,
therefore, is the number of electrons coming out of
the metal (for ν > ν0). This explains why, for ν > ν0 ,
photoelectric current is proportional to intensity.
ALB
ER
T E
INS
TE
IN (
1879 –
19
55)
Albert Einstein (1879 –1955) Einstein, one of thegreatest physicists of alltime, was born in Ulm,Germany. In 1905, hepublished three path-breaking papers. In thefirst paper, he introducedthe notion of light quanta(now called photons) andused it to explain thefeatures of photoelectriceffect. In the second paper,he developed a theory ofBrownian motion,confirmed experimentally afew years later and provideda convincing evidence ofthe atomic picture of matter.The third paper gave birthto the special theory ofrelativity. In 1916, hepublished the generaltheory of relativity. Some ofEinstein’s most significantlater contributions are: thenotion of stimulatedemission introduced in analternative derivation ofPlanck’s blackbodyradiation law, static modelof the universe whichstarted modern cosmology,quantum statistics of a gasof massive bosons, and acritical analysis of thefoundations of quantummechanics. In 1921, he wasawarded the Nobel Prize inphysics for his contributionto theoretical physics andthe photoelectric effect.
395
Dual Nature of Radiation
and Matter
• In Einstein’s picture, the basic elementary process involved in
photoelectric effect is the absorption of a light quantum by an electron.This process is instantaneous. Thus, whatever may be the intensity
i.e., the number of quanta of radiation per unit area per unit time,photoelectric emission is instantaneous. Low intensity does not mean
delay in emission, since the basic elementary process is the same.
Intensity only determines how many electrons are able to participatein the elementary process (absorption of a light quantum by a single
electron) and, therefore, the photoelectric current.Using Eq. (11.1), the photoelectric equation, Eq. (11.2), can be
written as
e V0 = h ν – φ 0; for 0ν ν≥
or V0 = 0h
e e
φν
− (11.4)
This is an important result. It predicts that the V0 versus ν curve is a
straight line with slope = (h/e), independent of the nature of the material.
During 1906-1916, Millikan performed a series of experiments onphotoelectric effect, aimed at disproving Einstein’s photoelectric equation.
He measured the slope of the straight line obtained for sodium, similar to
that shown in Fig. 11.5. Using the known value of e, he determined the
value of Planck’s constant h . This value was close to the value of Planck’s
contant (= 6.626 × 10⁻³⁴J s) determined in an entirely different context.In this way, in 1916, Millikan proved the validity of Einstein’s photoelectric
equation, instead of disproving it.
The successful explanation of photoelectric effect using the hypothesis
of light quanta and the experimental determination of values of h and φ0,
in agreement with values obtained from other experiments, led to theacceptance of Einstein’s picture of photoelectric effect. Millikan verified
photoelectric equation with great precision, for a number of alkali metals
over a wide range of radiation frequencies.
11.7 PARTICLE NATURE OF LIGHT: THE PHOTON
Photoelectric effect thus gave evidence to the strange fact that light in
interaction with matter behaved as if it was made of quanta or packets of
energy, each of energy h ν.
Is the light quantum of energy to be associated with a particle? Einstein
arrived at the important result, that the light quantum can also be
associated with momentum (h ν/c ). A definite value of energy as well as
momentum is a strong sign that the light quantum can be associated
with a particle. This particle was later named photon. The particle-like
behaviour of light was further confirmed, in 1924, by the experiment ofA.H. Compton (1892-1962) on scattering of X-rays from electrons. In
1921, Einstein was awarded the Nobel Prize in Physics for his contribution
to theoretical physics and the photoelectric effect. In 1923, Millikan was
awarded the Nobel Prize in physics for his work on the elementary
charge of electricity and on the photoelectric effect.
We can summarise the photon picture of electromagnetic radiation
as follows:
Physics
396
EX
AM
PLE 1
1.1
EX
AM
PLE 1
1.2
(i) In interaction of radiation with matter, radiation behaves as if it is
made up of particles called photons.(ii) Each photon has energy E (=hν) and momentum p (= h ν/c), and
speed c, the speed of light.
(iii) All photons of light of a particular frequency ν, or wavelength λ, havethe same energy E (=hν = hc/λ) and momentum p (= hν/c = h/λ),
whatever the intensity of radiation may be. By increasing the intensityof light of given wavelength, there is only an increase in the number of
photons per second crossing a given area, with each photon having
the same energy. Thus, photon energy is independent of intensity ofradiation.
(iv) Photons are electrically neutral and are not deflected by electric andmagnetic fields.
(v) In a photon-particle collision (such as photon-electron collision), the
total energy and total momentum are conserved. However, the numberof photons may not be conserved in a collision. The photon may be
absorbed or a new photon may be created.
Example 11.1 Monochromatic light of frequency 6.0 ×10¹⁴ Hz is
produced by a laser. The power emitted is 2.0 ×10⁻³
W. (a) What is theenergy of a photon in the light beam? (b) How many photons per second,on an average, are emitted by the source?
Solution(a) Each photon has an energy
E = h ν = ( 6.63 ×10⁻³⁴
J s) (6.0 ×10¹⁴
Hz) = 3.98 × 10⁻¹⁹ J
(b) If N is the number of photons emitted by the source per second,the power P transmitted in the beam equals N times the energyper photon E, so that P = N E. Then
N = 3
19
2.0 10 W
3.98 10 J
P
E
−
−
×=
×
= 5.0 ×10¹⁵
photons per second.
Example 11.2 The work function of caesium is 2.14 eV. Find (a) thethreshold frequency for caesium, and (b) the wavelength of the incidentlight if the photocurrent is brought to zero by a stopping potential of
0.60 V.
Solution(a) For the cut-off or threshold frequency, the energy h ν0 of the incident
radiation must be equal to work function φ0, so that
ν0 = 0
34
2.14eV
6.63 10 J sh
φ−
=×
19
14
34
2.14 1.6 10 J5.16 10 Hz
6.63 10 J s
−
−
× ×= = ×
×
Thus, for frequencies less than this threshold frequency, nophotoelectrons are ejected.
(b) Photocurrent reduces to zero, when maximum kinetic energy ofthe emitted photoelectrons equals the potential energy e V0 by theretarding potential V0. Einstein’s Photoelectric equation is
397
Dual Nature of Radiation
and Matter
EX
AM
PLE 1
1.2
eV0 = hν – φ0 = hc
λ – φ0
or, λ = hc/(eV0 + φ0 )
34 8(6.63 10 Js) (3 10 m/s)
(0.60eV 2.14eV)
−× × ×=
+
2619.89 10 Jm
(2.74eV)
−×=
26
19
19.89 10 J m454 nm
2.74 1.6 10 Jλ
−
−
×= =
× ×
Example 11.3 The wavelength of light in the visible region is about390 nm for violet colour, about 550 nm (average wavelength) for yellow-
green colour and about 760 nm for red colour.(a) What are the energies of photons in (eV) at the (i) violet end, (ii)
average wavelength, yellow-green colour, and (iii) red end of thevisible spectrum? (Take h = 6.63×10 –34 J s and 1 eV = 1.6×10 –19J.)
(b) From which of the photosensitive materials with work functions
listed in Table 11.1 and using the results of (i), (ii) and (iii) of (a),can you build a photoelectric device that operates with visible
light?
Solution
(a) Energy of the incident photon, E = hν = hc/λE = (6.63×10⁻³⁴J s) (3×10⁸ m/s)/λ
–251.989 10 Jm
λ
×=
(i) For violet light, λ1 = 390 nm (lower wavelength end)
Incident photon energy, E1 =
–25
–9
1.989 10 Jm
390×10 m
×
= 5.10 × 10⁻¹⁹
J
–19
–19
5.10 10 J
1.6×10 J/eV
×=
= 3.19 eV
(ii) For yellow-green light, λ2 = 550 nm (average wavelength)
Incident photon energy, E2 =
–25
–9
1.989 10 Jm
550×10 m
×
= 3.62×10⁻¹⁹ J = 2.26 eV(iii) For red light, λ3 = 760 nm (higher wavelength end)
Incident photon energy, E3 =
–25
–9
1.989 10 Jm
760×10 m
×
= 2.62×10⁻¹⁹
J = 1.64 eV(b) For a photoelectric device to operate, we require incident light energy
E to be equal to or greater than the work function φ0 of the material.Thus, the photoelectric device will operate with violet light (withE = 3.19 eV) photosensitive material Na (with φ0 = 2.75 eV), K (with
φ0 = 2.30 eV) and Cs (with φ0 = 2.14 eV). It will also operate withyellow-green light (with E = 2.26 eV) for Cs (with φ0 = 2.14 eV ) only.
However, it will not operate with red light (with E = 1.64 eV) for anyof these photosensitive materials.
EX
AM
PLE 1
1.3
Physics
398
11.8 WAVE NATURE OF MATTER
The dual (wave-particle) nature of light (electromagnetic radiation, ingeneral) comes out clearly from what we have learnt in this and the
preceding chapters. The wave nature of light shows up in the phenomena
of interference, diffraction and polarisation. On the other hand, inphotoelectric effect and Compton effect which involve energy and
momentum transfer, radiation behaves as if it is made up of a bunch ofparticles – the photons. Whether a particle or wave description is best
suited for understanding an experiment depends on the nature of the
experiment. For example, in the familiar phenomenon of seeing an objectby our eye, both descriptions are important. The gathering and focussing
mechanism of light by the eye-lens is well described in the wave picture.But its absorption by the rods and cones (of the retina) requires the photon
picture of light.
A natural question arises: If radiation has a dual (wave-particle) nature,might not the particles of nature (the electrons, protons, etc.) also exhibit
wave-like character? In 1924, the French physicist Louis Victor de Broglie(pronounced as de Broy) (1892-1987) put forward the bold hypothesis
that moving particles of matter should display wave-like properties under
suitable conditions. He reasoned that nature was symmetrical and thatthe two basic physical entities – matter and energy, must have symmetrical
character. If radiation shows dual aspects, so should matter. De Broglieproposed that the wave length λ associated with a particle of momentum
p is given as
λ = h h
p m v= (11.5)
where m is the mass of the particle and v its speed. Equation (11.5) isknown as the de Broglie relation and the wavelength λ of the matter
wave is called de Broglie wavelength. The dual aspect of matter is evidentin the de Broglie relation. On the left hand side of Eq. (11.5), λ is the
attribute of a wave while on the right hand side the momentum p is a
typical attribute of a particle. Planck’s constant h relates the twoattributes.
Equation (11.5) for a material particle is basically a hypothesis whosevalidity can be tested only by experiment. However, it is interesting to see
that it is satisfied also by a photon. For a photon, as we have seen,
p = hν /c (11.6)
Therefore,
h c
pλ
ν= = (11.7)
That is, the de Broglie wavelength of a photon given by Eq. (11.5) equalsthe wavelength of electromagnetic radiation of which the photon is a
quantum of energy and momentum.Clearly, from Eq. (11.5 ), λ is smaller for a heavier particle ( large m ) or
more energetic particle (large v). For example, the de Broglie wavelengthof a ball of mass 0.12 kg moving with a speed of 20 m s–1 is easily
calculated:
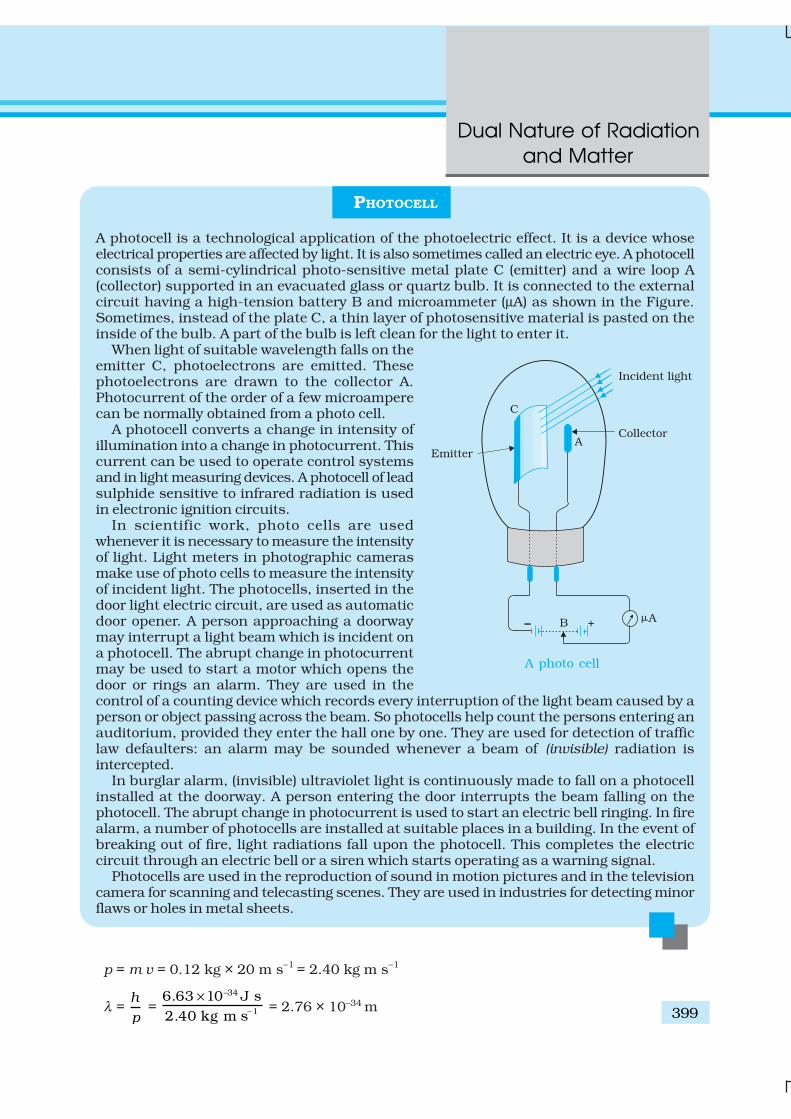
399
Dual Nature of Radiation
and Matter
p = m v = 0.12 kg × 20 m s–1 = 2.40 kg m s–1
λ = h
p =
34
1
6.63 10 J s
2.40 kg m s
−
−
× = 2.76 × 10⁻³⁴ m
PHOTOCELL
A photocell is a technological application of the photoelectric effect. It is a device whoseelectrical properties are affected by light. It is also sometimes called an electric eye. A photocellconsists of a semi-cylindrical photo-sensitive metal plate C (emitter) and a wire loop A(collector) supported in an evacuated glass or quartz bulb. It is connected to the externalcircuit having a high-tension battery B and microammeter (µA) as shown in the Figure.Sometimes, instead of the plate C, a thin layer of photosensitive material is pasted on theinside of the bulb. A part of the bulb is left clean for the light to enter it.
When light of suitable wavelength falls on theemitter C, photoelectrons are emitted. Thesephotoelectrons are drawn to the collector A.Photocurrent of the order of a few microamperecan be normally obtained from a photo cell.
A photocell converts a change in intensity ofillumination into a change in photocurrent. Thiscurrent can be used to operate control systemsand in light measuring devices. A photocell of leadsulphide sensitive to infrared radiation is usedin electronic ignition circuits.
In scientific work, photo cells are usedwhenever it is necessary to measure the intensityof light. Light meters in photographic camerasmake use of photo cells to measure the intensityof incident light. The photocells, inserted in thedoor light electric circuit, are used as automaticdoor opener. A person approaching a doorwaymay interrupt a light beam which is incident ona photocell. The abrupt change in photocurrentmay be used to start a motor which opens thedoor or rings an alarm. They are used in thecontrol of a counting device which records every interruption of the light beam caused by aperson or object passing across the beam. So photocells help count the persons entering anauditorium, provided they enter the hall one by one. They are used for detection of trafficlaw defaulters: an alarm may be sounded whenever a beam of (invisible) radiation isintercepted.
In burglar alarm, (invisible) ultraviolet light is continuously made to fall on a photocellinstalled at the doorway. A person entering the door interrupts the beam falling on thephotocell. The abrupt change in photocurrent is used to start an electric bell ringing. In firealarm, a number of photocells are installed at suitable places in a building. In the event ofbreaking out of fire, light radiations fall upon the photocell. This completes the electriccircuit through an electric bell or a siren which starts operating as a warning signal.
Photocells are used in the reproduction of sound in motion pictures and in the televisioncamera for scanning and telecasting scenes. They are used in industries for detecting minorflaws or holes in metal sheets.
A photo cell
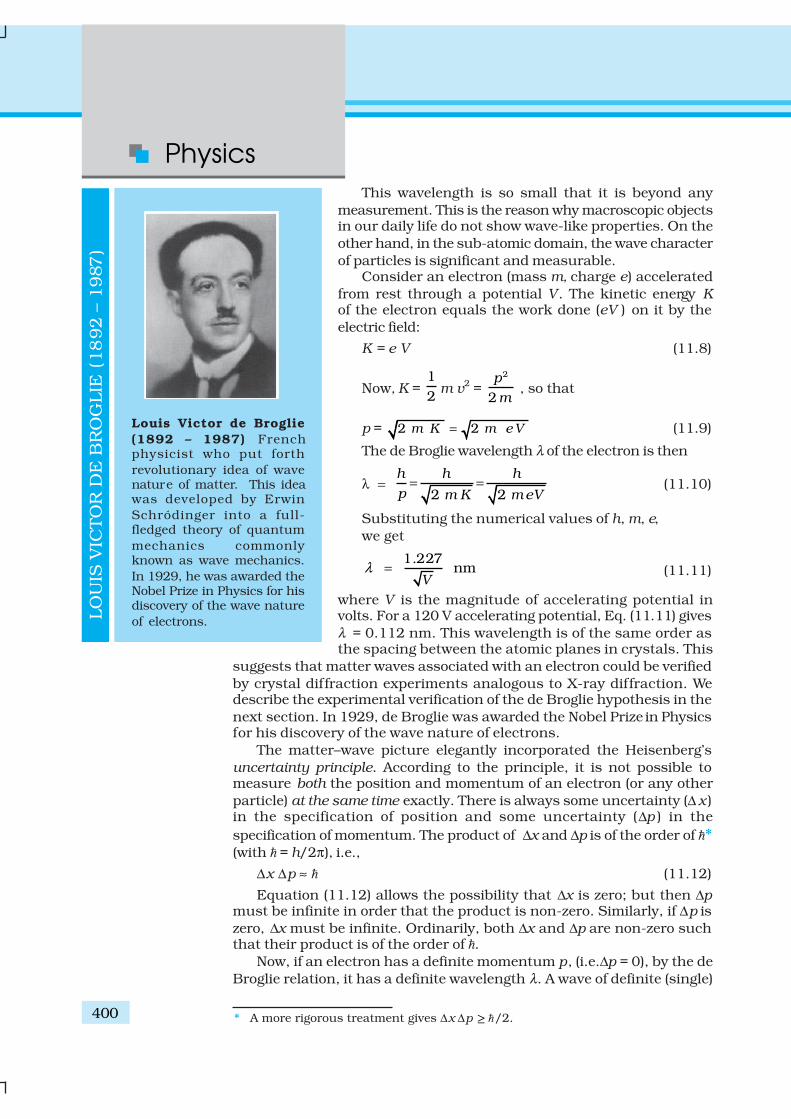
Physics
400
This wavelength is so small that it is beyond any
measurement. This is the reason why macroscopic objectsin our daily life do not show wave-like properties. On the
other hand, in the sub-atomic domain, the wave character
of particles is significant and measurable.Consider an electron (mass m, charge e) accelerated
from rest through a potential V. The kinetic energy Kof the electron equals the work done (eV ) on it by the
electric field:
K = e V (11.8)
Now, K = 1
2m v
2 = 2
2
p
m , so that
p = 2 2 m K m e V= (11.9)
The de Broglie wavelength λ of the electron is then
λ = 2 2
h h h
p m K m eV= = (11.10)
Substituting the numerical values of h, m, e,
we get
1.227 nm
Vλ = (11.11)
where V is the magnitude of accelerating potential involts. For a 120 V accelerating potential, Eq. (11.11) gives
λ = 0.112 nm. This wavelength is of the same order asthe spacing between the atomic planes in crystals. This
suggests that matter waves associated with an electron could be verified
by crystal diffraction experiments analogous to X-ray diffraction. Wedescribe the experimental verification of the de Broglie hypothesis in the
next section. In 1929, de Broglie was awarded the Nobel Prize in Physicsfor his discovery of the wave nature of electrons.
The matter–wave picture elegantly incorporated the Heisenberg’s
uncertainty principle. According to the principle, it is not possible tomeasure both the position and momentum of an electron (or any other
particle) at the same time exactly. There is always some uncertainty (∆ x )in the specification of position and some uncertainty (∆p ) in the
specification of momentum. The product of ∆x and ∆p is of the order of ħ*(with ħ = h/2π), i.e.,
∆x ∆p ≈ ħ (11.12)
Equation (11.12) allows the possibility that ∆x is zero; but then ∆pmust be infinite in order that the product is non-zero. Similarly, if ∆p is
zero, ∆x must be infinite. Ordinarily, both ∆x and ∆p are non-zero suchthat their product is of the order of ħ.
Now, if an electron has a definite momentum p, (i.e.∆p = 0), by the de
Broglie relation, it has a definite wavelength λ. A wave of definite (single)
LO
UIS
VIC
TO
R D
E B
RO
GLIE
(18
92 –
1987
)
Louis Victor de Broglie
(1892 – 1987) Frenchphysicist who put forth
revolutionary idea of wavenature of matter. This ideawas developed by Erwin
Schródinger into a full-fledged theory of quantum
mechanics commonlyknown as wave mechanics.
In 1929, he was awarded theNobel Prize in Physics for hisdiscovery of the wave nature
of electrons.
* A more rigorous treatment gives ∆x ∆p ≥ ħ/2.
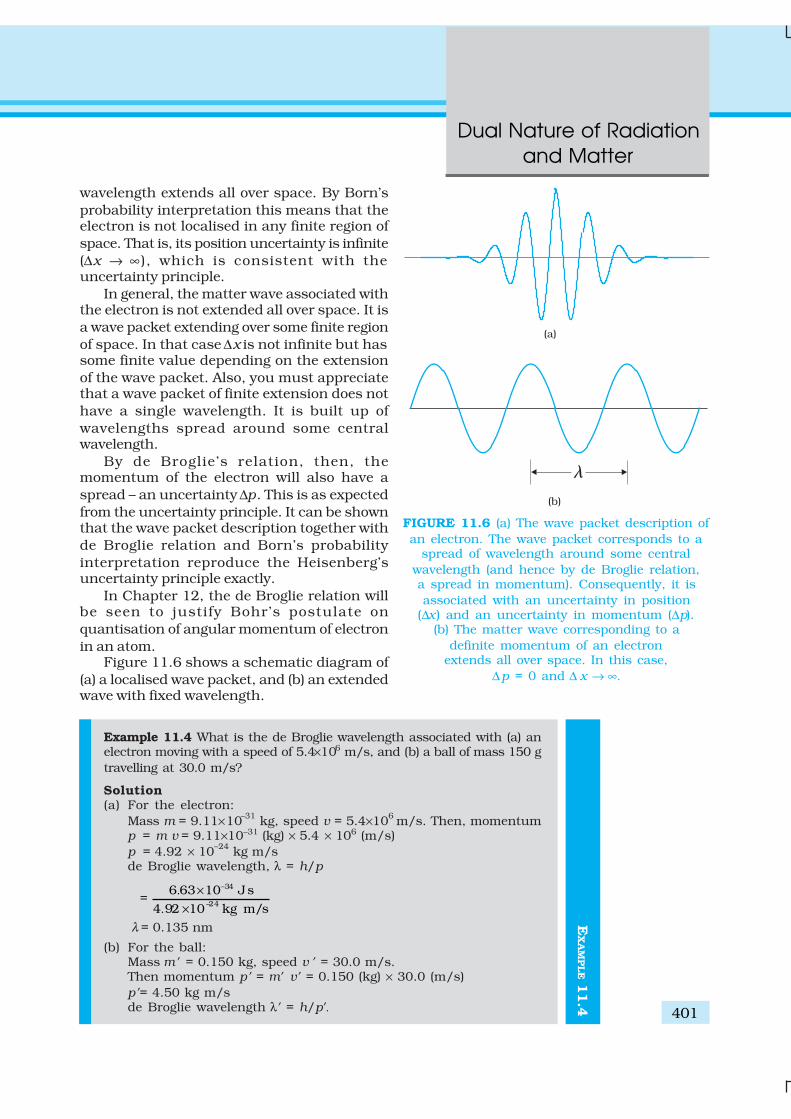
401
Dual Nature of Radiation
and Matter
wavelength extends all over space. By Born’s
probability interpretation this means that theelectron is not localised in any finite region of
space. That is, its position uncertainty is infinite
(∆x → ∞ ), which is consistent with theuncertainty principle.
In general, the matter wave associated withthe electron is not extended all over space. It is
a wave packet extending over some finite region
of space. In that case ∆x is not infinite but hassome finite value depending on the extension
of the wave packet. Also, you must appreciatethat a wave packet of finite extension does not
have a single wavelength. It is built up of
wavelengths spread around some centralwavelength.
By de Broglie’s relation, then, themomentum of the electron will also have a
spread – an uncertainty ∆p. This is as expected
from the uncertainty principle. It can be shownthat the wave packet description together with
de Broglie relation and Born’s probability
interpretation reproduce the Heisenberg’suncertainty principle exactly.
In Chapter 12, the de Broglie relation willbe seen to justify Bohr’s postulate on
quantisation of angular momentum of electron
in an atom.Figure 11.6 shows a schematic diagram of
(a) a localised wave packet, and (b) an extendedwave with fixed wavelength.
Example 11.4 What is the de Broglie wavelength associated with (a) anelectron moving with a speed of 5.4×10⁶ m/s, and (b) a ball of mass 150 g
travelling at 30.0 m/s?
Solution(a) For the electron:
Mass m = 9.11×10⁻³¹
kg, speed v = 5.4×10⁶ m/s. Then, momentum
p = m v = 9.11×10⁻³¹ (kg) × 5.4 × 10⁶ (m/s)
p = 4.92 × 10⁻²⁴
kg m/sde Broglie wavelength, λ = h/p
= .
.
–34
–24
6 63 10 Js
4 92 10 kg m/s
×
×
λ = 0.135 nm
(b) For the ball:Mass m ’ = 0.150 kg, speed v ’ = 30.0 m/s.Then momentum p ’ = m’ v ’ = 0.150 (kg) × 30.0 (m/s)
p ’= 4.50 kg m/sde Broglie wavelength λ’ = h/p’.
FIGURE 11.6 (a) The wave packet description of
an electron. The wave packet corresponds to aspread of wavelength around some central
wavelength (and hence by de Broglie relation,a spread in momentum). Consequently, it is
associated with an uncertainty in position(∆x ) and an uncertainty in momentum (∆p).
(b) The matter wave corresponding to a
definite momentum of an electronextends all over space. In this case,
∆p = 0 and ∆ x → ∞.
EX
AM
PLE 1
1.4
Physics
402 EX
AM
PLE 1
1.6
EX
AM
PLE 1
1.4
±.
.
346 63 10 Js
4 50 kg m/s
×=
×
λ ’= 1.47 ×10⁻³⁴
mThe de Broglie wavelength of electron is comparable with X-ray
wavelengths. However, for the ball it is about 10–19
times the size ofthe proton, quite beyond experimental measurement.
Example 11.5 An electron, an α-particle, and a proton have the samekinetic energy. Which of these particles has the shortest de Broglie
wavelength?
SolutionFor a particle, de Broglie wavelength, λ = h/p
Kinetic energy, K = p2/2m
Then, / 2h mKλ =
For the same kinetic energy K, the de Broglie wavelength associated
with the particle is inversely proportional to the square root of their
masses. A proton ( )1
1H is 1836 times massive than an electron and
an α-particle ( )4
2 He four times that of a proton.
Hence, α – particle has the shortest de Broglie wavelength. EX
AM
PLE 1
1.5
PROBABILITY INTERPRETATION TO MATTER WAVES
It is worth pausing here to reflect on just what a matter wave associated with a particle,say, an electron, means. Actually, a truly satisfactory physical understanding of the
dual nature of matter and radiation has not emerged so far. The great founders of
quantum mechanics (Niels Bohr, Albert Einstein, and many others) struggled with thisand related concepts for long. Still the deep physical interpretation of quantum
mechanics continues to be an area of active research. Despite this, the concept ofmatter wave has been mathematically introduced in modern quantum mechanics with
great success. An important milestone in this connection was when Max Born (1882-
1970) suggested a probability interpretation to the matter wave amplitude. Accordingto this, the intensity (square of the amplitude) of the matter wave at a point determines
the probability density of the particle at that point. Probability density means probabilityper unit volume. Thus, if A is the amplitude of the wave at a point, |A|2 ∆V is the
probability of the particle being found in a small volume ∆V around that point. Thus,
if the intensity of matter wave is large in a certain region, there is a greater probabilityof the particle being found there than where the intensity is small.
Example 11.6 A particle is moving three times as fast as an electron.
The ratio of the de Broglie wavelength of the particle to that of theelectron is 1.813 × 10⁻⁴. Calculate the particle’s mass and identify theparticle.
Solutionde Broglie wavelength of a moving particle, having mass m and
velocity v:
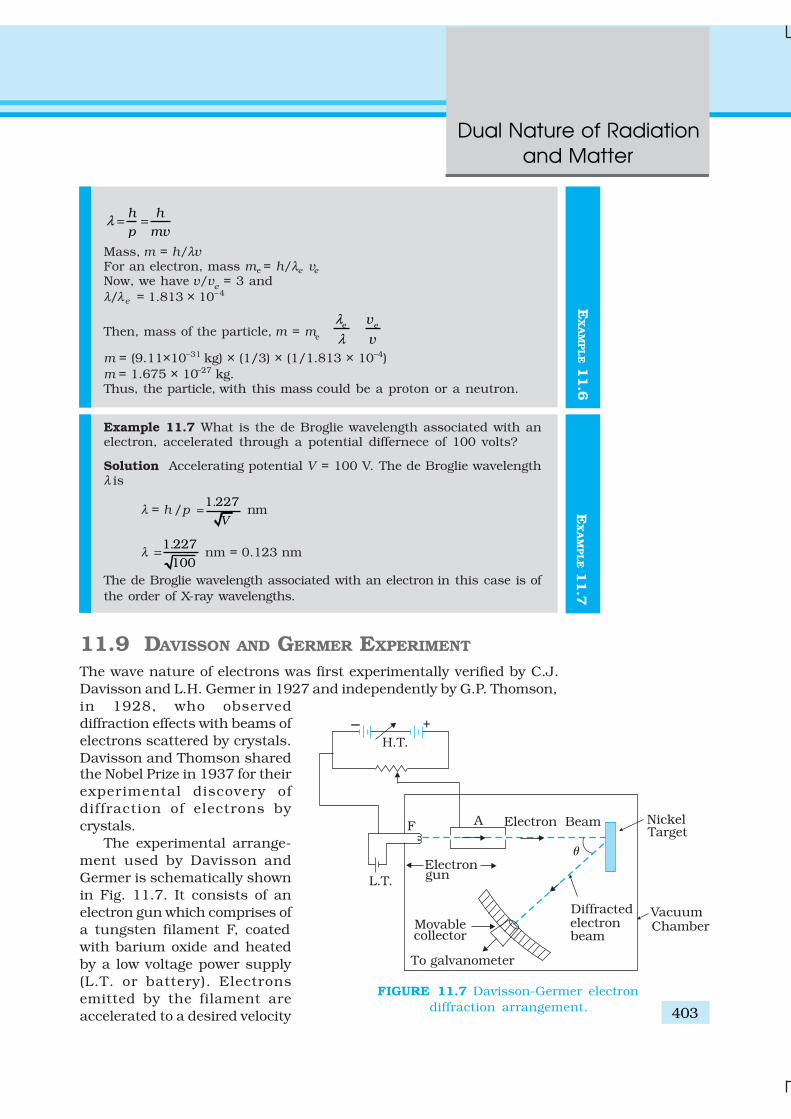
403
Dual Nature of Radiation
and Matter
h h
p mvλ = =
Mass, m = h/λvFor an electron, mass me = h/λe ve
Now, we have v/ve = 3 and
λ/λe = 1.813 × 10⁻⁴
Then, mass of the particle, m = me e e
v
v
λ
λ
m = (9.11×10⁻³¹ kg) × (1/3) × (1/1.813 × 10–4)
m = 1.675 × 10⁻²⁷ kg.Thus, the particle, with this mass could be a proton or a neutron.
Example 11.7 What is the de Broglie wavelength associated with anelectron, accelerated through a potential differnece of 100 volts?
Solution Accelerating potential V = 100 V. The de Broglie wavelengthλ is
λ = h /p .1 227
V= nm
λ .1 227
100= nm = 0.123 nm
The de Broglie wavelength associated with an electron in this case is of
the order of X-ray wavelengths.
11.9 DAVISSON AND GERMER EXPERIMENT
The wave nature of electrons was first experimentally verified by C.J.
Davisson and L.H. Germer in 1927 and independently by G.P. Thomson,
in 1928, who observed
diffraction effects with beams of
electrons scattered by crystals.
Davisson and Thomson sharedthe Nobel Prize in 1937 for their
experimental discovery of
diffraction of electrons by
crystals.
The experimental arrange-
ment used by Davisson and
Germer is schematically shown
in Fig. 11.7. It consists of an
electron gun which comprises of
a tungsten filament F, coated
with barium oxide and heated
by a low voltage power supply
(L.T. or battery). Electrons
emitted by the filament are
accelerated to a desired velocity
FIGURE 11.7 Davisson-Germer electron
diffraction arrangement.
EX
AM
PLE 1
1.6
EX
AM
PLE 1
1.7
Physics
404
by applying suitable potential/voltage from a high voltage power supply
(H.T. or battery). They are made to pass through a cylinder with fine
holes along its axis, producing a fine collimated beam. The beam is made
to fall on the surface of a nickel crystal. The electrons are scattered in all
directions by the atoms of the crystal. The intensity of the electron beam,
scattered in a given direction, is measured by the electron detector
(collector). The detector can be moved on a circular scale and is connected
to a sensitive galvanometer, which records the current. The deflection of
the galvanometer is proportional to the intensity of the electron beam
entering the collector. The apparatus is enclosed in an evacuated chamber.
By moving the detector on the circular scale at different positions, the
intensity of the scattered electron beam is measured for different values
of angle of scattering θ which is the angle between the incident and the
scattered electron beams. The variation of the intensity (I ) of the scattered
electrons with the angle of scattering θ is obtained for different accelerating
voltages.
The experiment was performed by varying the accelarating voltage
from 44 V to 68 V. It was noticed that a strong peak appeared in the
intensity (I ) of the scattered electron for an accelarating voltage of 54V at
a scattering angle θ = 50º
The appearance of the peak in a particular direction is due to the
constructive interference of electrons scattered from different layers of the
regularly spaced atoms of the crystals. From the electron diffraction
measurements, the wavelength of matter waves was found to be
0.165 nm.
The de Broglie wavelength λ associated with electrons, using
Eq. (11.11), for V = 54 V is given by
λ = h /p 1 227
V=
. nm
λ 1 227
54=
. nm = 0.167 nm
Thus, there is an excellent agreement between the theoretical value
and the experimentally obtained value of de Broglie wavelength. Davisson-
Germer experiment thus strikingly confirms the wave nature of electrons
and the de Broglie relation. More recently, in 1989, the wave nature of a
beam of electrons was experimentally demonstrated in a double-slit
experiment, similar to that used for the wave nature of light. Also, in an
experiment in 1994, interference fringes were obtained with the beams of
iodine molecules, which are about a million times more massive than
electrons.
The de Broglie hypothesis has been basic to the development of modern
quantum mechanics. It has also led to the field of electron optics. The
wave properties of electrons have been utilised in the design of electron
microscope which is a great improvement, with higher resolution, over
the optical microscope.
Develo
pm
en
t o
f ele
ctr
on
m
icro
sco
pe
http://w
ww
.nobel
prize
.org
/nobel
_prize
s/phys
ics/
laure
ates
/1986/p
rese
nta
tion-s
pee
ch.h
tml
405
Dual Nature of Radiation
and Matter
SUMMARY
1. The minimum energy needed by an electron to come out from a metal
surface is called the work function of the metal. Energy (greater than
the work function (φο) required for electron emission from the metal
surface can be supplied by suitably heating or applying strong electric
field or irradiating it by light of suitable frequency.
2. Photoelectric effect is the phenomenon of emission of electrons by metals
when illuminated by light of suitable frequency. Certain metals respond
to ultraviolet light while others are sensitive even to the visible light.
Photoelectric effect involves conversion of light energy into electrical
energy. It follows the law of conservation of energy. The photoelectric
emission is an instantaneous process and possesses certain special
features.
3. Photoelectric current depends on (i) the intensity of incident light, (ii)
the potential difference applied between the two electrodes, and (iii)
the nature of the emitter material.
4. The stopping potential (Vo) depends on (i) the frequency of incident
light, and (ii) the nature of the emitter material. For a given frequency
of incident light, it is independent of its intensity. The stopping potential
is directly related to the maximum kinetic energy of electrons emitted:
e V0 = (1/2) m v2
max = K
max.
5. Below a certain frequency (threshold frequency) ν0, characteristic of
the metal, no photoelectric emission takes place, no matter how large
the intensity may be.
6. The classical wave theory could not explain the main features of
photoelectric effect. Its picture of continuous absorption of energy from
radiation could not explain the independence of Kmax
on intensity, the
existence of νo and the instantaneous nature of the process. Einstein
explained these features on the basis of photon picture of light.
According to this, light is composed of discrete packets of energy called
quanta or photons. Each photon carries an energy E (= h ν) and
momentum p (= h/λ), which depend on the frequency (ν ) of incident
light and not on its intensity. Photoelectric emission from the metal
surface occurs due to absorption of a photon by an electron.
7. Einstein’s photoelectric equation is in accordance with the energy
conservation law as applied to the photon absorption by an electron in
the metal. The maximum kinetic energy (1/2)m v2max
is equal to
the photon energy (hν ) minus the work function φ0
(= hν0) of the
target metal:
1
2m v2
max = V
0 e = hν – φ
0 = h (ν – ν
0)
This photoelectric equation explains all the features of the photoelectric
effect. Millikan’s first precise measurements confirmed the Einstein’s
photoelectric equation and obtained an accurate value of Planck’s
constant h . This led to the acceptance of particle or photon description
(nature) of electromagnetic radiation, introduced by Einstein.
8. Radiation has dual nature: wave and particle. The nature of experiment
determines whether a wave or particle description is best suited for
understanding the experimental result. Reasoning that radiation and
matter should be symmetrical in nature, Louis Victor de Broglie
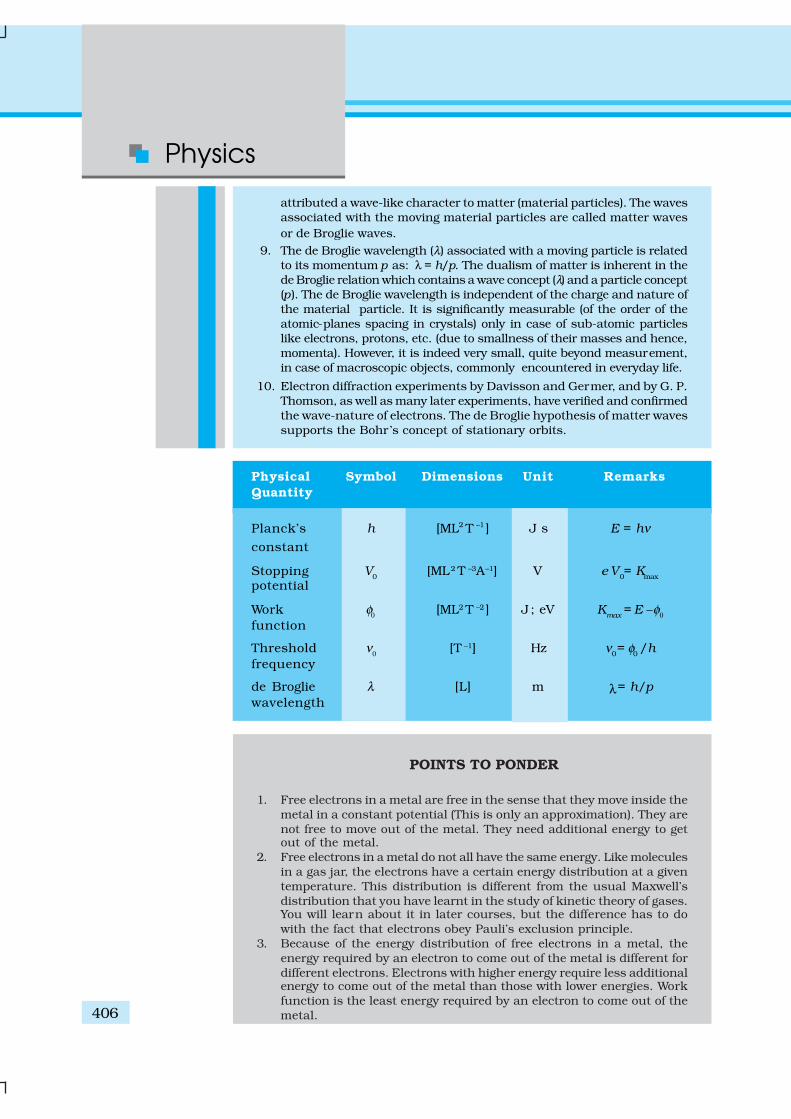
Physics
406
attributed a wave-like character to matter (material particles). The waves
associated with the moving material particles are called matter waves
or de Broglie waves.
9. The de Broglie wavelength (λ) associated with a moving particle is related
to its momentum p as: λ = h/p. The dualism of matter is inherent in the
de Broglie relation which contains a wave concept (λ) and a particle concept
(p). The de Broglie wavelength is independent of the charge and nature of
the material particle. It is significantly measurable (of the order of the
atomic-planes spacing in crystals) only in case of sub-atomic particles
like electrons, protons, etc. (due to smallness of their masses and hence,
momenta). However, it is indeed very small, quite beyond measurement,
in case of macroscopic objects, commonly encountered in everyday life.
10. Electron diffraction experiments by Davisson and Germer, and by G. P.
Thomson, as well as many later experiments, have verified and confirmed
the wave-nature of electrons. The de Broglie hypothesis of matter waves
supports the Bohr ’s concept of stationary orbits.
Physical Symbol Dimensions Unit Remarks
Quantity
Planck’s h [ML2 T –1 ] J s E = hν
constant
Stopping V0
[ML2 T –3A–1] V e V0= K
max
potential
Work φ0
[ML2 T –2 ] J ; eV Kmax
= E –φ0
function
Threshold ν0
[T –1] Hz ν0 = φ
0/h
frequency
de Broglie λ [L] m λ= h/p
wavelength
POINTS TO PONDER
1. Free electrons in a metal are free in the sense that they move inside the
metal in a constant potential (This is only an approximation). They are
not free to move out of the metal. They need additional energy to getout of the metal.
2. Free electrons in a metal do not all have the same energy. Like molecules
in a gas jar, the electrons have a certain energy distribution at a given
temperature. This distribution is different from the usual Maxwell’s
distribution that you have learnt in the study of kinetic theory of gases.You will learn about it in later courses, but the difference has to do
with the fact that electrons obey Pauli’s exclusion principle.
3. Because of the energy distribution of free electrons in a metal, the
energy required by an electron to come out of the metal is different for
different electrons. Electrons with higher energy require less additionalenergy to come out of the metal than those with lower energies. Work
function is the least energy required by an electron to come out of the
metal.
407
Dual Nature of Radiation
and Matter
4. Observations on photoelectric ef fect imply that in the event of matter-
light interaction, absorption of energy takes place in discrete units of hν.This is not quite the same as saying that light consists of particles,
each of energy hν.
5. Observations on the stopping potential (its independence of intensity
and dependence on frequency) are the crucial discriminator between
the wave-picture and photon-picture of photoelectric effect.
6. The wavelength of a matter wave given by h
pλ = has physical
significance; its phase velocity vp has no physical significance. However,
the group velocity of the matter wave is physically meaningful andequals the velocity of the particle.
EXERCISES
11.1 Find the
(a) maximum frequency, and
(b) minimum wavelength of X-rays produced by 30 kV electrons.
11.2 The work function of caesium metal is 2.14 eV. When light of
frequency 6 ×10¹⁴Hz is incident on the metal surface, photoemission
of electrons occurs. What is the
(a) maximum kinetic energy of the emitted electrons,
(b) Stopping potential, and
(c) maximum speed of the emitted photoelectrons?
11.3 The photoelectric cut-off voltage in a certain experiment is 1.5 V.What is the maximum kinetic energy of photoelectrons emitted?
11.4 Monochromatic light of wavelength 632.8 nm is produced by ahelium-neon laser. The power emitted is 9.42 mW.
(a) Find the energy and momentum of each photon in the light beam,
(b) How many photons per second, on the average, arrive at a target
irradiated by this beam? (Assume the beam to have uniformcross-section which is less than the target area ), and
(c) How fast does a hydrogen atom have to travel in order to havethe same momentum as that of the photon?
11.5 The energy flux of sunlight reaching the surface of the earth is
1.388 × 10³ W/m
2. How many photons (nearly) per square metre are
incident on the Earth per second? Assume that the photons in thesunlight have an average wavelength of 550 nm.
11.6 In an experiment on photoelectric effect, the slope of the cut-off
voltage versus frequency of incident light is found to be 4.12 × 10⁻¹⁵
V s.
Calculate the value of Planck’s constant.
11.7 A 100W sodium lamp radiates energy uniformly in all directions.
The lamp is located at the centre of a large sphere that absorbs all
the sodium light which is incident on it. The wavelength of the
sodium light is 589 nm. (a) What is the energy per photon associated
Physics
408
with the sodium light? (b) At what rate are the photons delivered to
the sphere?
11.8 The threshold frequency for a certain metal is 3.3 × 10¹⁴ Hz. If light
of frequency 8.2 × 10¹⁴ Hz is incident on the metal, predict the cut-
off voltage for the photoelectric emission.
11.9 The work function for a certain metal is 4.2 eV. Will this metal give
photoelectric emission for incident radiation of wavelength 330 nm?
11.10 Light of frequency 7.21 × 10¹⁴ Hz is incident on a metal surface.
Electrons with a maximum speed of 6.0 × 10⁵ m/s are ejected from
the surface. What is the threshold frequency for photoemission of
electrons?
11.11 Light of wavelength 488 nm is produced by an argon laser which is
used in the photoelectric effect. When light from this spectral line is
incident on the emitter, the stopping (cut-off) potential of
photoelectrons is 0.38 V. Find the work function of the material
from which the emitter is made.
11.12 Calculate the
(a) momentum, and
(b) de Broglie wavelength of the electrons accelerated through a
potential dif ference of 56 V.
11.13 What is the
(a) momentum,
(b) speed, and
(c) de Broglie wavelength of an electron with kinetic energy of
120 eV.
11.14 The wavelength of light from the spectral emission line of sodium is
589 nm. Find the kinetic energy at which
(a) an electron, and
(b) a neutron, would have the same de Broglie wavelength.
11.15 What is the de Broglie wavelength of
(a) a bullet of mass 0.040 kg travelling at the speed of 1.0 km/s,
(b) a ball of mass 0.060 kg moving at a speed of 1.0 m/s, and
(c) a dust particle of mass 1.0 × 10 –9 kg drifting with a speed of
2.2 m/s?
11.16 An electron and a photon each have a wavelength of 1.00 nm. Find
(a) their momenta,
(b) the energy of the photon, and
(c) the kinetic energy of electron.
11.17 (a) For what kinetic energy of a neutron will the associated de Broglie
wavelength be 1.40 × 10 –10m?
(b) Also find the de Broglie wavelength of a neutron, in thermal
equilibrium with matter, having an average kinetic energy of
(3/2) k T at 300 K.
11.18 Show that the wavelength of electromagnetic radiation is equal to
the de Broglie wavelength of its quantum (photon).
11.19 What is the de Broglie wavelength of a nitrogen molecule in air at
300 K? Assume that the molecule is moving with the root-mean-
square speed of molecules at this temperature. (Atomic mass of
nitrogen = 14.0076 u)
409
Dual Nature of Radiation
and Matter
ADDITIONAL EXERCISES
11.20 (a) Estimate the speed with which electrons emitted from a heated
emitter of an evacuated tube impinge on the collector maintained
at a potential difference of 500 V with respect to the emitter.Ignore the small initial speeds of the electrons. The
specific charge of the electron, i.e., its e/m is given to be
1.76 × 10¹¹
C kg–1
.
(b) Use the same formula you employ in (a) to obtain electron speedfor an collector potential of 10 MV. Do you see what is wrong ? In
what way is the formula to be modified?
11.21 (a) A monoenergetic electron beam with electron speed of
5.20 × 10⁶ m s–1 is subject to a magnetic field of 1.30 × 10⁻⁴ T
normal to the beam velocity. What is the radius of the circle tracedby the beam, given e/m for electron equals 1.76 × 10¹¹C kg–1.
(b) Is the formula you employ in (a) valid for calculating radius of
the path of a 20 MeV electron beam? If not, in what way is it
modified?
[Note: Exercises 11.20(b) and 11.21(b) take you to relativistic
mechanics which is beyond the scope of this book. They have beeninserted here simply to emphasise the point that the formulas you
use in part (a) of the exercises are not valid at very high speeds or
energies. See answers at the end to know what ‘very high speed or
energy’ means.]
11.22 An electron gun with its collector at a potential of 100 V fires outelectrons in a spherical bulb containing hydrogen gas at low
pressure (∼10–2 mm of Hg). A magnetic field of 2.83 × 10⁻⁴ T curves
the path of the electrons in a circular orbit of radius 12.0 cm. (Thepath can be viewed because the gas ions in the path focus the beam
by attracting electrons, and emitting light by electron capture; this
method is known as the ‘fine beam tube’ method.) Determine
e/m from the data.
11.23 (a) An X-ray tube produces a continuous spectrum of radiation withits short wavelength end at 0.45 Å. What is the maximum energy
of a photon in the radiation?
(b) From your answer to (a), guess what order of accelerating voltage
(for electrons) is required in such a tube?
11.24 In an accelerator experiment on high-energy collisions of electrons
with positrons, a certain event is interpreted as annihilation of anelectron-positron pair of total energy 10.2 BeV into two γ-rays of
equal energy. What is the wavelength associated with each γ-ray?
(1BeV = 109 eV)
11.25 Estimating the following two numbers should be interesting. The
first number will tell you why radio engineers do not need to worrymuch about photons! The second number tells you why our eye can
never ‘count photons’, even in barely detectable light.
(a) The number of photons emitted per second by a Medium wave
transmitter of 10 kW power, emitting radiowaves of wavelength500 m.
(b) The number of photons entering the pupil of our eye per secondcorresponding to the minimum intensity of white light that we
Physics
410
humans can perceive (∼10–10 W m –2). Take the area of the pupil
to be about 0.4 cm2, and the average frequency of white light to
be about 6 × 10¹⁴ Hz.
11.26 Ultraviolet light of wavelength 2271 Å from a 100 W mercury source
irradiates a photo-cell made of molybdenum metal. If the stopping
potential is –1.3 V, estimate the work function of the metal. How
would the photo-cell respond to a high intensity (∼105 W m–2) red
light of wavelength 6328 Å produced by a He-Ne laser?
11.27 Monochromatic radiation of wavelength 640.2 nm (1nm = 10–9
m)
from a neon lamp irradiates photosensitive material made of caesium
on tungsten. The stopping voltage is measured to be 0.54 V. The
source is replaced by an iron source and its 427.2 nm line irradiates
the same photo-cell. Predict the new stopping voltage.
11.28 A mercury lamp is a convenient source for studying frequency
dependence of photoelectric emission, since it gives a number of
spectral lines ranging from the UV to the red end of the visible
spectrum. In our experiment with rubidium photo-cell, the following
lines from a mercury source were used:
λ1 = 3650 Å, λ2= 4047 Å, λ3= 4358 Å, λ4= 5461 Å, λ5= 6907 Å,
The stopping voltages, respectively, were measured to be:
V01 = 1.28 V, V02 = 0.95 V, V03 = 0.74 V, V04 = 0.16 V, V05 = 0 V
Determine the value of Planck’s constant h, the threshold frequency
and work function for the material.
[Note: You will notice that to get h from the data, you will need to
know e (which you can take to be 1.6 × 10⁻¹⁹ C). Experiments of this
kind on Na, Li, K, etc. were performed by Millikan, who, using his
own value of e (from the oil-drop experiment) confirmed Einstein’s
photoelectric equation and at the same time gave an independent
estimate of the value of h.]
11.29 The work function for the following metals is given:
Na: 2.75 eV; K: 2.30 eV; Mo: 4.17 eV; Ni: 5.15 eV. Which of these
metals will not give photoelectric emission for a radiation of
wavelength 3300 Å from a He-Cd laser placed 1 m away from the
photocell? What happens if the laser is brought nearer and placed
50 cm away ?
11.30 Light of intensity 10–5 W m–2 falls on a sodium photo-cell of surface
area 2 cm2. Assuming that the top 5 layers of sodium absorb the
incident energy, estimate time required for photoelectric emission
in the wave-picture of radiation. The work function for the metal is
given to be about 2 eV. What is the implication of your answer?
11.31 Crystal diffraction experiments can be performed using X-rays, or
electrons accelerated through appropriate voltage. Which probe has
greater energy? (For quantitative comparison, take the wavelength
of the probe equal to 1 Å, which is of the order of inter-atomic spacing
in the lattice) (me=9.11 × 10
–31 kg).
11.32 (a) Obtain the de Broglie wavelength of a neutron of kinetic energy
150 eV. As you have seen in Exercise 11.31, an electron beam of
this energy is suitable for crystal diffraction experiments. Would
a neutron beam of the same energy be equally suitable? Explain.
(mn = 1.675 × 10
–27 kg)
411
Dual Nature of Radiation
and Matter
(b) Obtain the de Broglie wavelength associated with thermalneutrons at room temperature (27 ºC). Hence explain why a fast
neutron beam needs to be thermalised with the environment
before it can be used for neutron diffraction experiments.
11.33 An electron microscope uses electrons accelerated by a voltage of
50 kV. Determine the de Broglie wavelength associated with theelectrons. If other factors (such as numerical aperture, etc.) are
taken to be roughly the same, how does the resolving power of an
electron microscope compare with that of an optical microscopewhich uses yellow light?
11.34 The wavelength of a probe is roughly a measure of the size of a
structure that it can probe in some detail. The quark structure
of protons and neutrons appears at the minute length-scale of
10–15
m or less. This structure was first probed in early 1970’s usinghigh energy electron beams produced by a linear accelerator at
Stanford, USA. Guess what might have been the order of energy of
these electron beams. (Rest mass energy of electron = 0.511 MeV.)
11.35 Find the typical de Broglie wavelength associated with a He atom inhelium gas at room temperature (27 ºC) and 1 atm pressure; and
compare it with the mean separation between two atoms under these
conditions.
11.36 Compute the typical de Broglie wavelength of an electron in a metal
at 27 ºC and compare it with the mean separation between twoelectrons in a metal which is given to be about 2 × 10⁻¹⁰ m.
[Note: Exercises 11.35 and 11.36 reveal that while the wave-packetsassociated with gaseous molecules under ordinary conditions are
non-overlapping, the electron wave-packets in a metal strongly
overlap with one another. This suggests that whereas molecules inan ordinary gas can be distinguished apart, electrons in a metal
cannot be distintguished apart from one another. This
indistinguishibility has many fundamental implications which youwill explore in more advanced Physics courses.]
11.37 Answer the following questions:
(a) Quarks inside protons and neutrons are thought to carryfractional charges [(+2/3)e ; (–1/3)e ]. Why do they not show up
in Millikan’s oil-drop experiment?(b) What is so special about the combination e/m? Why do we not
simply talk of e and m separately?(c) Why should gases be insulators at ordinary pressures and start
conducting at very low pressures?(d) Every metal has a definite work function. Why do all
photoelectrons not come out with the same energy if incidentradiation is monochromatic? Why is there an energy distribution
of photoelectrons?(e) The energy and momentum of an electron are related to the
frequency and wavelength of the associated matter wave by the
relations:
E = h ν, p = λ
h
But while the value of λ is physically significant, the value of ν
(and therefore, the value of the phase speed ν λ) has no physical
significance. Why?
Physics
412
APPENDIX
11.1 The history of wave-particle flip-flop
What is light? This question has haunted mankind for a long time. But systematic experiments were done by
scientists since the dawn of the scientific and industrial era, about four centuries ago. Around the same time,
theoretical models about what light is made of were developed. While building a model in any branch of
science, it is essential to see that it is able to explain all the experimental observations existing at that time.
It is therefore appropriate to summarize some observations about light that were known in the seventeenth
century.
The properties of light known at that time included (a) rectilinear propagation of light, (b) reflection from
plane and curved surfaces, (c) refraction at the boundary of two media, (d) dispersion into various colours, (e)
high speed. Appropriate laws were formulated for the first four phenomena. For example, Snell formulated his
laws of refraction in 1621. Several scientists right from the days of Galileo had tried to measure the speed of
light. But they had not been able to do so. They had only concluded that it was higher than the limit of their
measurement.
Two models of light were also proposed in the seventeenth century. Descartes, in early decades of seventeenth
century, proposed that light consists of particles, while Huygens, around 1650-60, proposed that light consists
of waves. Descartes′ proposal was merely a philosophical model, devoid of any experiments or scientific
arguments. Newton soon after, around 1660-70, extended Descartes′ particle model, known as corpuscular
theory , built it up as a scientific theory, and explained various known properties with it. These models, light
as waves and as particles, in a sense, are quite opposite of each other. But both models could explain all the
known properties of light. There was nothing to choose between them.
The history of the development of these models over the next few centuries is interesting. Bartholinus, in
1669, discovered double refraction of light in some crystals, and Huygens, in 1678, was quick to explain it on
the basis of his wave theory of light. In spite of this, for over one hundred years, Newton’s particle model was
firmly believed and preferred over the wave model. This was partly because of its simplicity and partly because
of Newton’s influence on contemporary physics.
Then in 1801, Young performed his double-slit experiment and observed interference fringes. This
phenomenon could be explained only by wave theory. It was realized that diffraction was also another
phenomenon which could be explained only by wave theory. In fact, it was a natural consequence of Huygens
idea of secondary wavelets emanating from every point in the path of light. These experiments could not be
explained by assuming that light consists of particles. Another phenomenon of polarisation was discovered
around 1810, and this too could be naturally explained by the wave theory. Thus wave theory of Huygens
came to the forefront and Newton’s particle theory went into the background. This situation again continued
for almost a century.
Better experiments were performed in the nineteenth century to determine the speed of light. With more
accurate experiments, a value of 3×10⁸ m/s for speed of light in vacuum was arrived at. Around 1860, Maxwell
proposed his equations of electromagnetism and it was realized that all electromagnetic phenomena known at
that time could be explained by Maxwell’s four equations. Soon Maxwell showed that electric and magnetic
fields could propagate through empty space (vacuum) in the form of electromagnetic waves. He calculated the
speed of these waves and arrived at a theoretical value of 2.998×10⁸ m/s. The close agreement of this value
with the experimental value suggested that light consists of electromagnetic waves. In 1887 Hertz demonstrated
the generation and detection of such waves. This established the wave theory of light on a firm footing. We
might say that while eighteenth century belonged to the particle model, the nineteenth century belonged to
the wave model of light.
Vast amounts of experiments were done during the period 1850-1900 on heat and related phenomena, an
altogether different area of physics. Theories and models like kinetic theory and thermodynamics were developed
which quite successfully explained the various phenomena, except one.
413
Dual Nature of Radiation
and Matter
Every body at any temperature emits radiation of all wavelengths. It also absorbs radiation falling on it.
A body which absorbs all the radiation falling on it is called a black body. It is an ideal concept in physics, like
concepts of a point mass or uniform motion. A graph of the intensity of radiation emitted by a body versus
wavelength is called the black body spectrum. No theory in those days could explain the complete black body
spectrum!
In 1900, Planck hit upon a novel idea. If we assume, he said, that radiation is emitted in packets of energy
instead of continuously as in a wave, then we can explain the black body spectrum. Planck himself regarded
these quanta, or packets, as a property of emission and absorption, rather than that of light. He derived a
formula which agreed with the entire spectrum. This was a confusing mixture of wave and particle pictures –
radiation is emitted as a particle, it travels as a wave, and is again absorbed as a particle! Moreover, this put
physicists in a dilemma. Should we again accept the particle picture of light just to explain one phenomenon?
Then what happens to the phenomena of interference and diffraction which cannot be explained by the
particle model?
But soon in 1905, Einstein explained the photoelectric effect by assuming the particle picture of light.
In 1907, Debye explained the low temperature specific heats of solids by using the particle picture for lattice
vibrations in a crystalline solid. Both these phenomena belonging to widely diverse areas of physics could be
explained only by the particle model and not by the wave model. In 1923, Compton’s x-ray scattering experiments
from atoms also went in favour of the particle picture. This increased the dilemma further.
Thus by 1923, physicists faced with the following situation. (a) There were some phenomena like rectilinear
propagation, reflection, refraction, which could be explained by either particle model or by wave model. (b)
There were some phenomena such as diffraction and interference which could be explained only by the wave
model but not by the particle model. (c) There were some phenomena such as black body radiation, photoelectric
effect, and Compton scattering which could be explained only by the particle model but not by the wave model.
Somebody in those days aptly remarked that light behaves as a particle on Mondays, Wednesdays and Fridays,
and as a wave on Tuesdays, Thursdays and Saturdays, and we don’t talk of light on Sundays!
In 1924, de Broglie proposed his theory of wave-particle duality in which he said that not only photons
of light but also ‘particles’ of matter such as electrons and atoms possess a dual character, sometimes
behaving like a particle and sometimes as a wave. He gave a formula connecting their mass, velocity, momentum
(particle characteristics), with their wavelength and frequency (wave characteristics)! In 1927 Thomson, and
Davisson and Germer, in separate experiments, showed that electrons did behave like waves with a wavelength
which agreed with that given by de Broglie’s formula. Their experiment was on diffraction of electrons through
crystalline solids, in which the regular arrangement of atoms acted like a grating. Very soon, diffraction
experiments with other ‘particles’ such as neutrons and protons were performed and these too confirmed with
de Broglie’s formula. This confirmed wave-particle duality as an established principle of physics. Here was a
principle, physicists thought, which explained all the phenomena mentioned above not only for light but also
for the so-called particles.
But there was no basic theoretical foundation for wave-particle duality. De Broglie’s proposal was
merely a qualitative argument based on symmetry of nature. Wave-particle duality was at best a principle, not
an outcome of a sound fundamental theory. It is true that all experiments whatever agreed with de Broglie
formula. But physics does not work that way. On the one hand, it needs experimental confirmation, while on
the other hand, it also needs sound theoretical basis for the models proposed. This was developed over the
next two decades. Dirac developed his theory of radiation in about 1928, and Heisenberg and Pauli gave it a
firm footing by 1930. Tomonaga, Schwinger, and Feynman, in late 1940s, produced further refinements and
cleared the theory of inconsistencies which were noticed. All these theories mainly put wave-particle duality
on a theoretical footing.
Although the story continues, it grows more and more complex and beyond the scope of this note. But
we have here the essential structure of what happened, and let us be satisfied with it at the moment. Now it
is regarded as a natural consequence of present theories of physics that electromagnetic radiation as well as
particles of matter exhibit both wave and particle properties in different experiments, and sometimes even in
the different parts of the same experiment.
Physics
414
12.1 INTRODUCTION
By the nineteenth century, enough evidence had accumulated in favour ofatomic hypothesis of matter. In 1897, the experiments on electric dischargethrough gases carried out by the English physicist J. J. Thomson (1856 –1940) revealed that atoms of different elements contain negatively chargedconstituents (electrons) that are identical for all atoms. However, atoms on awhole are electrically neutral. Therefore, an atom must also contain somepositive charge to neutralise the negative charge of the electrons. But whatis the arrangement of the positive charge and the electrons inside the atom?In other words, what is the structure of an atom?
The first model of atom was proposed by J. J. Thomson in 1898.According to this model, the positive charge of the atom is uniformlydistributed throughout the volume of the atom and the negatively chargedelectrons are embedded in it like seeds in a watermelon. This model waspicturesquely called plum pudding model of the atom. Howeversubsequent studies on atoms, as described in this chapter, showed thatthe distribution of the electrons and positive charges are very differentfrom that proposed in this model.
We know that condensed matter (solids and liquids) and dense gases atall temperatures emit electromagnetic radiation in which a continuousdistribution of several wavelengths is present, though with differentintensities. This radiation is considered to be due to oscillations of atoms
Chapter Twelve
ATOMS
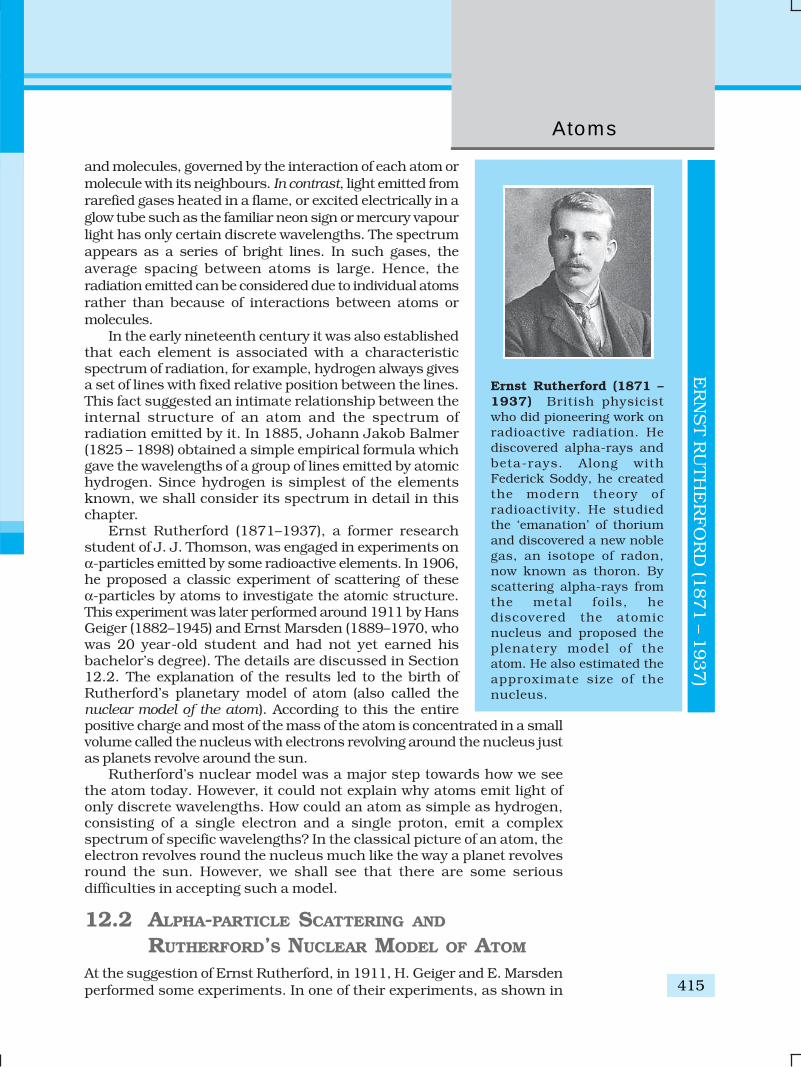
415
Atoms
and molecules, governed by the interaction of each atom ormolecule with its neighbours. In contrast, light emitted fromrarefied gases heated in a flame, or excited electrically in aglow tube such as the familiar neon sign or mercury vapourlight has only certain discrete wavelengths. The spectrumappears as a series of bright lines. In such gases, theaverage spacing between atoms is large. Hence, theradiation emitted can be considered due to individual atomsrather than because of interactions between atoms ormolecules.
In the early nineteenth century it was also establishedthat each element is associated with a characteristicspectrum of radiation, for example, hydrogen always givesa set of lines with fixed relative position between the lines.This fact suggested an intimate relationship between theinternal structure of an atom and the spectrum ofradiation emitted by it. In 1885, Johann Jakob Balmer(1825 – 1898) obtained a simple empirical formula whichgave the wavelengths of a group of lines emitted by atomichydrogen. Since hydrogen is simplest of the elementsknown, we shall consider its spectrum in detail in thischapter.
Ernst Rutherford (1871–1937), a former researchstudent of J. J. Thomson, was engaged in experiments onα-particles emitted by some radioactive elements. In 1906,he proposed a classic experiment of scattering of theseα-particles by atoms to investigate the atomic structure.This experiment was later performed around 1911 by HansGeiger (1882–1945) and Ernst Marsden (1889–1970, whowas 20 year-old student and had not yet earned hisbachelor’s degree). The details are discussed in Section12.2. The explanation of the results led to the birth ofRutherford’s planetary model of atom (also called thenuclear model of the atom). According to this the entirepositive charge and most of the mass of the atom is concentrated in a smallvolume called the nucleus with electrons revolving around the nucleus justas planets revolve around the sun.
Rutherford’s nuclear model was a major step towards how we seethe atom today. However, it could not explain why atoms emit light ofonly discrete wavelengths. How could an atom as simple as hydrogen,consisting of a single electron and a single proton, emit a complexspectrum of specific wavelengths? In the classical picture of an atom, theelectron revolves round the nucleus much like the way a planet revolvesround the sun. However, we shall see that there are some seriousdifficulties in accepting such a model.
12.2 ALPHA-PARTICLE SCATTERING AND
RUTHERFORD’S NUCLEAR MODEL OF ATOM
At the suggestion of Ernst Rutherford, in 1911, H. Geiger and E. Marsdenperformed some experiments. In one of their experiments, as shown in
Ernst Rutherford (1871 –1937) British physicistwho did pioneering work onradioactive radiation. Hediscovered alpha-rays andbeta-rays. Along withFederick Soddy, he createdthe modern theory ofradioactivity. He studiedthe ‘emanation’ of thoriumand discovered a new noblegas, an isotope of radon,now known as thoron. Byscattering alpha-rays fromthe metal foils, hediscovered the atomicnucleus and proposed theplenatery model of theatom. He also estimated theapproximate size of thenucleus.
ER
NS
T R
UTH
ER
FO
RD
(1871 – 1
937)
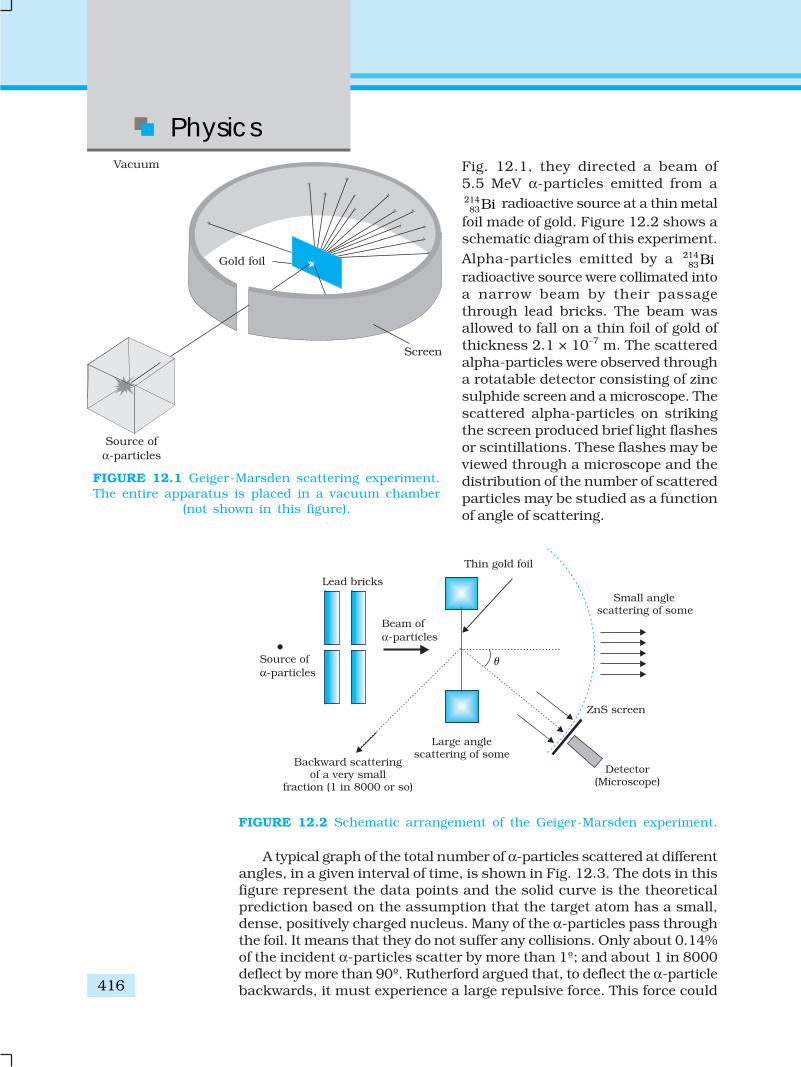
Physics
416
Fig. 12.1, they directed a beam of5.5 MeV α-particles emitted from a21483Bi radioactive source at a thin metal
foil made of gold. Figure 12.2 shows aschematic diagram of this experiment.Alpha-particles emitted by a 214
83Biradioactive source were collimated intoa narrow beam by their passagethrough lead bricks. The beam wasallowed to fall on a thin foil of gold ofthickness 2.1 × 10⁻⁷ m. The scatteredalpha-particles were observed througha rotatable detector consisting of zincsulphide screen and a microscope. Thescattered alpha-particles on strikingthe screen produced brief light flashesor scintillations. These flashes may beviewed through a microscope and thedistribution of the number of scatteredparticles may be studied as a functionof angle of scattering.
FIGURE 12.2 Schematic arrangement of the Geiger-Marsden experiment.
A typical graph of the total number of α-particles scattered at differentangles, in a given interval of time, is shown in Fig. 12.3. The dots in thisfigure represent the data points and the solid curve is the theoreticalprediction based on the assumption that the target atom has a small,dense, positively charged nucleus. Many of the α-particles pass throughthe foil. It means that they do not suffer any collisions. Only about 0.14%of the incident α-particles scatter by more than 1º; and about 1 in 8000deflect by more than 90º. Rutherford argued that, to deflect the α-particlebackwards, it must experience a large repulsive force. This force could
FIGURE 12.1 Geiger-Marsden scattering experiment.The entire apparatus is placed in a vacuum chamber
(not shown in this figure).
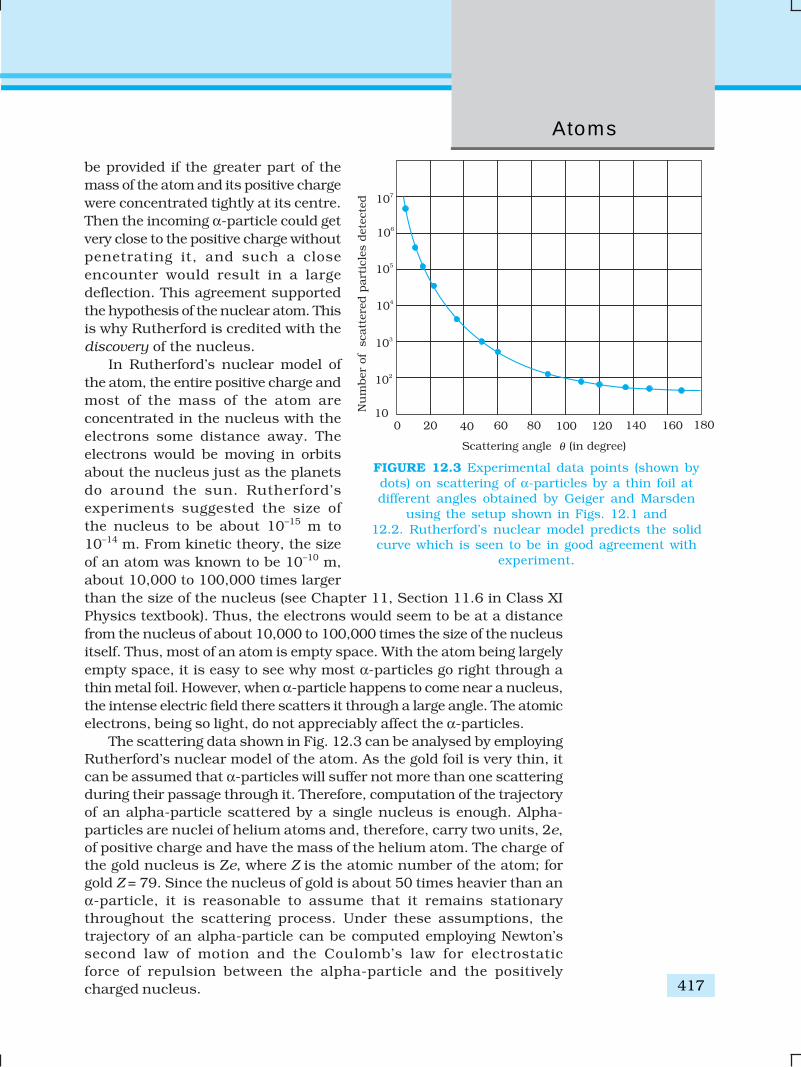
417
Atoms
be provided if the greater part of themass of the atom and its positive chargewere concentrated tightly at its centre.Then the incoming α-particle could getvery close to the positive charge withoutpenetrating it, and such a closeencounter would result in a largedeflection. This agreement supportedthe hypothesis of the nuclear atom. Thisis why Rutherford is credited with thediscovery of the nucleus.
In Rutherford’s nuclear model ofthe atom, the entire positive charge andmost of the mass of the atom areconcentrated in the nucleus with theelectrons some distance away. Theelectrons would be moving in orbitsabout the nucleus just as the planetsdo around the sun. Rutherford’sexperiments suggested the size ofthe nucleus to be about 10–15 m to10–14 m. From kinetic theory, the sizeof an atom was known to be 10–10 m,about 10,000 to 100,000 times largerthan the size of the nucleus (see Chapter 11, Section 11.6 in Class XIPhysics textbook). Thus, the electrons would seem to be at a distancefrom the nucleus of about 10,000 to 100,000 times the size of the nucleusitself. Thus, most of an atom is empty space. With the atom being largelyempty space, it is easy to see why most α-particles go right through athin metal foil. However, when α-particle happens to come near a nucleus,the intense electric field there scatters it through a large angle. The atomicelectrons, being so light, do not appreciably affect the α-particles.
The scattering data shown in Fig. 12.3 can be analysed by employingRutherford’s nuclear model of the atom. As the gold foil is very thin, itcan be assumed that α-particles will suffer not more than one scatteringduring their passage through it. Therefore, computation of the trajectoryof an alpha-particle scattered by a single nucleus is enough. Alpha-particles are nuclei of helium atoms and, therefore, carry two units, 2e,of positive charge and have the mass of the helium atom. The charge ofthe gold nucleus is Ze, where Z is the atomic number of the atom; forgold Z = 79. Since the nucleus of gold is about 50 times heavier than anα-particle, it is reasonable to assume that it remains stationarythroughout the scattering process. Under these assumptions, thetrajectory of an alpha-particle can be computed employing Newton’ssecond law of motion and the Coulomb’s law for electrostaticforce of repulsion between the alpha-particle and the positivelycharged nucleus.
FIGURE 12.3 Experimental data points (shown bydots) on scattering of α-particles by a thin foil atdifferent angles obtained by Geiger and Marsden
using the setup shown in Figs. 12.1 and12.2. Rutherford’s nuclear model predicts the solidcurve which is seen to be in good agreement with
experiment.

Physics
418 EX
AM
PLE 1
2.1
The magnitude of this force is
20
(2 )( )14
e ZeF
r
(12.1)
where r is the distance between the α-particle and the nucleus. The forceis directed along the line joining the α-particle and the nucleus. Themagnitude and direction of the force on an α-particle continuouslychanges as it approaches the nucleus and recedes away from it.
12.2.1 Alpha-particle trajectoryThe trajectory traced by an α-particle depends on the impact parameter,b of collision. The impact parameter is the perpendicular distance of theinitial velocity vector of the α-particle from the centre of the nucleus (Fig.
12.4). A given beam of α-particles has adistribution of impact parameters b, so thatthe beam is scattered in various directionswith different probabilities (Fig. 12.4). (Ina beam, all particles have nearly samekinetic energy.) It is seen that an α-particleclose to the nucleus (small impactparameter) suffers large scattering. In caseof head-on collision, the impact parameteris minimum and the α-particle reboundsback (θ ≅ π). For a large impact parameter,the α-particle goes nearly undeviated andhas a small deflection (θ ≅ 0).
The fact that only a small fraction of thenumber of incident particles rebound backindicates that the number of α-particlesundergoing head on collision is small. This,
in turn, implies that the mass of the atom is concentrated in a smallvolume. Rutherford scattering therefore, is a powerful way to determinean upper limit to the size of the nucleus.
Example 12.1 In the Rutherford’s nuclear model of the atom, thenucleus (radius about 10–15 m) is analogous to the sun about whichthe electron move in orbit (radius ≈ 10–10 m) like the earth orbitsaround the sun. If the dimensions of the solar system had the sameproportions as those of the atom, would the earth be closer to orfarther away from the sun than actually it is? The radius of earth’sorbit is about 1.5 × 10¹¹ m. The radius of sun is taken as 7 × 10⁸ m.
Solution The ratio of the radius of electron’s orbit to the radius ofnucleus is (10–10 m)/(10–15 m) = 105, that is, the radius of the electron’sorbit is 105 times larger than the radius of nucleus. If the radius ofthe earth’s orbit around the sun were 105 times larger than the radiusof the sun, the radius of the earth’s orbit would be 105 × 7 × 108 m =7 × 10¹³ m. This is more than 100 times greater than the actual orbitalradius of earth. Thus, the earth would be much farther away fromthe sun.It implies that an atom contains a much greater fraction of emptyspace than our solar system does.
FIGURE 12.4 Trajectory of α-particles in thecoulomb field of a target nucleus. The impact
parameter, b and scattering angle θare also depicted.
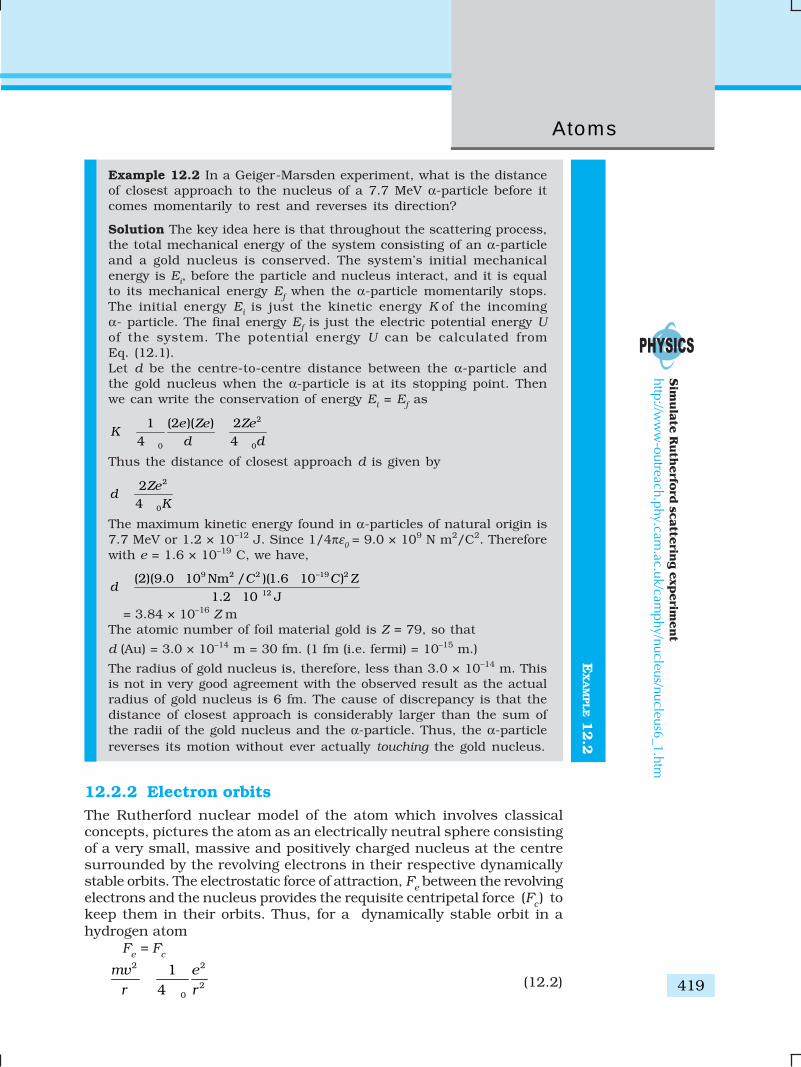
419
Atoms
EX
AM
PLE 1
2.2
Example 12.2 In a Geiger-Marsden experiment, what is the distanceof closest approach to the nucleus of a 7.7 MeV α-particle before itcomes momentarily to rest and reverses its direction?
Solution The key idea here is that throughout the scattering process,the total mechanical energy of the system consisting of an α-particleand a gold nucleus is conserved. The system’s initial mechanicalenergy is Ei, before the particle and nucleus interact, and it is equalto its mechanical energy Ef when the α-particle momentarily stops.The initial energy Ei is just the kinetic energy K of the incomingα- particle. The final energy Ef is just the electric potential energy Uof the system. The potential energy U can be calculated fromEq. (12.1).Let d be the centre-to-centre distance between the α-particle andthe gold nucleus when the α-particle is at its stopping point. Thenwe can write the conservation of energy Ei = Ef as
2
0 0
1 (2 )( ) 24 4
e Ze ZeK
dd
Thus the distance of closest approach d is given by
2
0
24
Zed
K
The maximum kinetic energy found in α-particles of natural origin is7.7 MeV or 1.2 × 10⁻¹² J. Since 1/4πε0 = 9.0 × 10⁹ N m2/C2. Thereforewith e = 1.6 × 10⁻¹⁹ C, we have,
9 2 2 –19 2
12
(2)(9.0 10 Nm / )(1.6 10 ) Z
1.2 10 J
C Cd
= 3.84 × 10⁻¹⁶ Z mThe atomic number of foil material gold is Z = 79, so that
d (Au) = 3.0 × 10⁻¹⁴ m = 30 fm. (1 fm (i.e. fermi) = 10–15 m.)
The radius of gold nucleus is, therefore, less than 3.0 × 10⁻¹⁴ m. Thisis not in very good agreement with the observed result as the actualradius of gold nucleus is 6 fm. The cause of discrepancy is that thedistance of closest approach is considerably larger than the sum ofthe radii of the gold nucleus and the α-particle. Thus, the α-particlereverses its motion without ever actually touching the gold nucleus.
12.2.2 Electron orbitsThe Rutherford nuclear model of the atom which involves classicalconcepts, pictures the atom as an electrically neutral sphere consistingof a very small, massive and positively charged nucleus at the centresurrounded by the revolving electrons in their respective dynamicallystable orbits. The electrostatic force of attraction, Fe between the revolvingelectrons and the nucleus provides the requisite centripetal force (Fc) tokeep them in their orbits. Thus, for a dynamically stable orbit in ahydrogen atom
Fe = Fc2 2
20
14
mv e
r r
(12.2)
Sim
ulate R
uth
erford
scattering exp
erimen
thttp://w
ww-outreach.phy.cam
.ac.uk/camphy/nucleus/nucleus6_1.htm
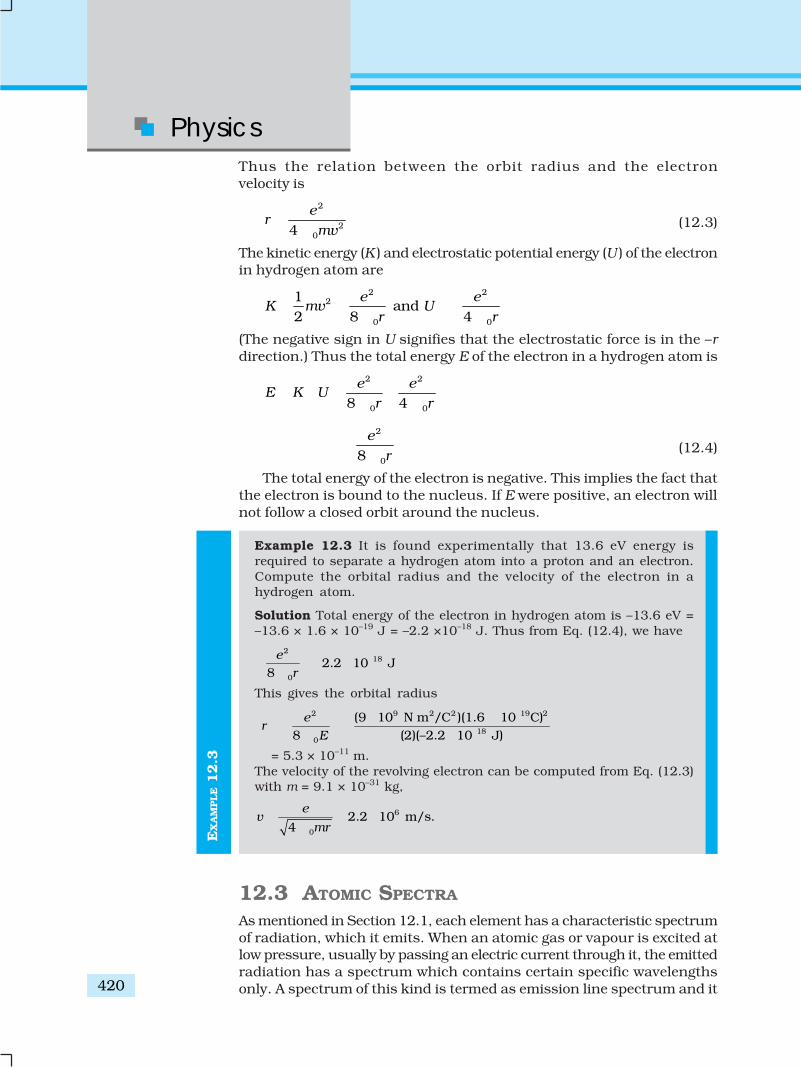
Physics
420
EX
AM
PLE 1
2.3
Thus the relation between the orbit radius and the electronvelocity is
2
204e
rmv
(12.3)
The kinetic energy (K ) and electrostatic potential energy (U ) of the electronin hydrogen atom are
2 22
0 0
1 and
2 8 4e e
K mv Ur r
(The negative sign in U signifies that the electrostatic force is in the –rdirection.) Thus the total energy E of the electron in a hydrogen atom is
2 2
0 08 4e e
E K Ur r
2
08e
r
(12.4)
The total energy of the electron is negative. This implies the fact thatthe electron is bound to the nucleus. If E were positive, an electron willnot follow a closed orbit around the nucleus.
Example 12.3 It is found experimentally that 13.6 eV energy isrequired to separate a hydrogen atom into a proton and an electron.Compute the orbital radius and the velocity of the electron in ahydrogen atom.
Solution Total energy of the electron in hydrogen atom is –13.6 eV =–13.6 × 1.6 × 10–19 J = –2.2 ×10⁻¹⁸ J. Thus from Eq. (12.4), we have
218
0
2.2 10 J8
e
r
This gives the orbital radius
2 9 2 2 19 2
180
(9 10 N m /C )(1.6 10 C)
8 (2)(–2.2 10 J)e
rE
= 5.3 × 10⁻¹¹ m.The velocity of the revolving electron can be computed from Eq. (12.3)with m = 9.1 × 10⁻³¹ kg,
6
0
2.2 10 m/s.4
ev
mr
12.3 ATOMIC SPECTRA
As mentioned in Section 12.1, each element has a characteristic spectrumof radiation, which it emits. When an atomic gas or vapour is excited atlow pressure, usually by passing an electric current through it, the emittedradiation has a spectrum which contains certain specific wavelengthsonly. A spectrum of this kind is termed as emission line spectrum and it
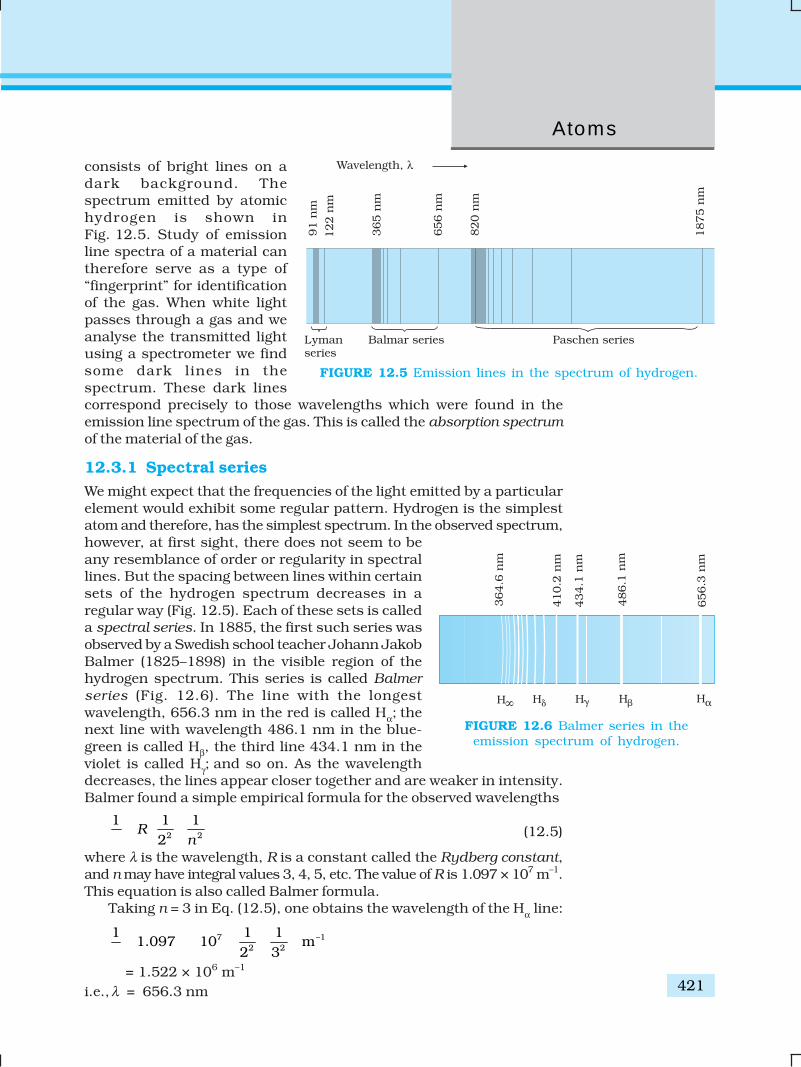
421
Atoms
consists of bright lines on adark background. Thespectrum emitted by atomichydrogen is shown inFig. 12.5. Study of emissionline spectra of a material cantherefore serve as a type of“fingerprint” for identificationof the gas. When white lightpasses through a gas and weanalyse the transmitted lightusing a spectrometer we findsome dark lines in thespectrum. These dark linescorrespond precisely to those wavelengths which were found in theemission line spectrum of the gas. This is called the absorption spectrumof the material of the gas.
12.3.1 Spectral seriesWe might expect that the frequencies of the light emitted by a particularelement would exhibit some regular pattern. Hydrogen is the simplestatom and therefore, has the simplest spectrum. In the observed spectrum,however, at first sight, there does not seem to beany resemblance of order or regularity in spectrallines. But the spacing between lines within certainsets of the hydrogen spectrum decreases in aregular way (Fig. 12.5). Each of these sets is calleda spectral series. In 1885, the first such series wasobserved by a Swedish school teacher Johann JakobBalmer (1825–1898) in the visible region of thehydrogen spectrum. This series is called Balmerseries (Fig. 12.6). The line with the longestwavelength, 656.3 nm in the red is called Hα; thenext line with wavelength 486.1 nm in the blue-green is called Hβ, the third line 434.1 nm in theviolet is called Hγ; and so on. As the wavelengthdecreases, the lines appear closer together and are weaker in intensity.Balmer found a simple empirical formula for the observed wavelengths
2 2
1 1 12
Rn
(12.5)
where λ is the wavelength, R is a constant called the Rydberg constant,and n may have integral values 3, 4, 5, etc. The value of R is 1.097 × 10⁷ m–1.This equation is also called Balmer formula.
Taking n = 3 in Eq. (12.5), one obtains the wavelength of the Hα line:
7 –12 2
1 1 11.097 10 m
2 3
= 1.522 × 10⁶ m–1
i.e.,λ = 656.3 nm
FIGURE 12.5 Emission lines in the spectrum of hydrogen.
FIGURE 12.6 Balmer series in theemission spectrum of hydrogen.
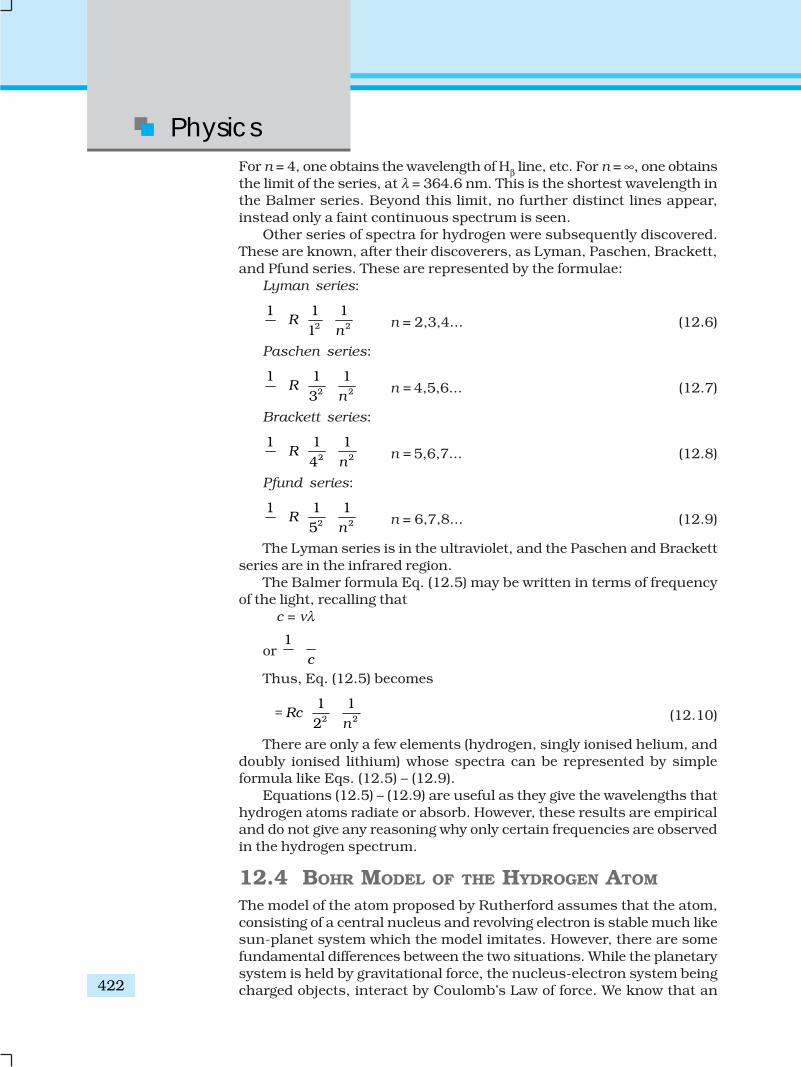
Physics
422
For n = 4, one obtains the wavelength of Hβ line, etc. For n = ∞, one obtainsthe limit of the series, at λ = 364.6 nm. This is the shortest wavelength inthe Balmer series. Beyond this limit, no further distinct lines appear,instead only a faint continuous spectrum is seen.
Other series of spectra for hydrogen were subsequently discovered.These are known, after their discoverers, as Lyman, Paschen, Brackett,and Pfund series. These are represented by the formulae:
Lyman series:
2 2
1 1 11
Rn
n = 2,3,4... (12.6)
Paschen series:
2 2
1 1 13
Rn
n = 4,5,6... (12.7)
Brackett series:
2 2
1 1 14
Rn
n = 5,6,7... (12.8)
Pfund series:
2 2
1 1 15
Rn
n = 6,7,8... (12.9)
The Lyman series is in the ultraviolet, and the Paschen and Brackettseries are in the infrared region.
The Balmer formula Eq. (12.5) may be written in terms of frequencyof the light, recalling that
c = νλ
or 1
c
Thus, Eq. (12.5) becomes
2 2
1 12
Rcn
= (12.10)
There are only a few elements (hydrogen, singly ionised helium, anddoubly ionised lithium) whose spectra can be represented by simpleformula like Eqs. (12.5) – (12.9).
Equations (12.5) – (12.9) are useful as they give the wavelengths thathydrogen atoms radiate or absorb. However, these results are empiricaland do not give any reasoning why only certain frequencies are observedin the hydrogen spectrum.
12.4 BOHR MODEL OF THE HYDROGEN ATOM
The model of the atom proposed by Rutherford assumes that the atom,consisting of a central nucleus and revolving electron is stable much likesun-planet system which the model imitates. However, there are somefundamental differences between the two situations. While the planetarysystem is held by gravitational force, the nucleus-electron system beingcharged objects, interact by Coulomb’s Law of force. We know that an
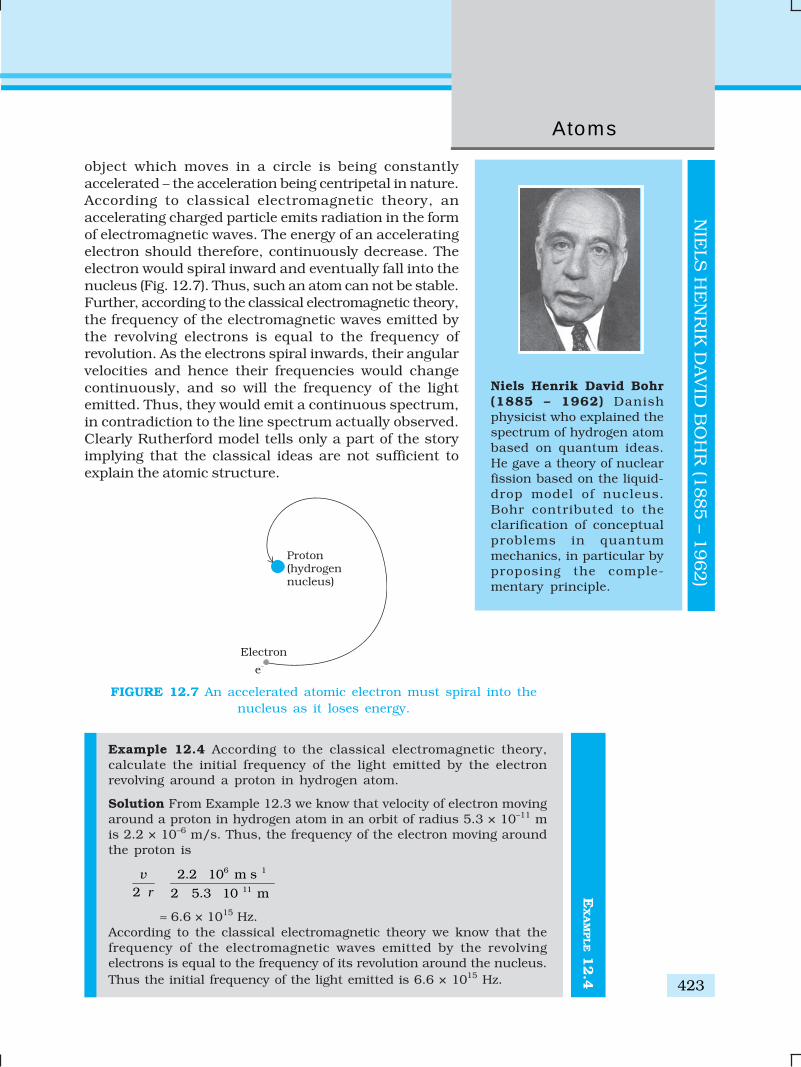
423
Atoms
EX
AM
PLE 1
2.4
object which moves in a circle is being constantlyaccelerated – the acceleration being centripetal in nature.According to classical electromagnetic theory, anaccelerating charged particle emits radiation in the formof electromagnetic waves. The energy of an acceleratingelectron should therefore, continuously decrease. Theelectron would spiral inward and eventually fall into thenucleus (Fig. 12.7). Thus, such an atom can not be stable.Further, according to the classical electromagnetic theory,the frequency of the electromagnetic waves emitted bythe revolving electrons is equal to the frequency ofrevolution. As the electrons spiral inwards, their angularvelocities and hence their frequencies would changecontinuously, and so will the frequency of the lightemitted. Thus, they would emit a continuous spectrum,in contradiction to the line spectrum actually observed.Clearly Rutherford model tells only a part of the storyimplying that the classical ideas are not sufficient toexplain the atomic structure.
FIGURE 12.7 An accelerated atomic electron must spiral into thenucleus as it loses energy.
Example 12.4 According to the classical electromagnetic theory,calculate the initial frequency of the light emitted by the electronrevolving around a proton in hydrogen atom.
Solution From Example 12.3 we know that velocity of electron movingaround a proton in hydrogen atom in an orbit of radius 5.3 × 10⁻¹¹ mis 2.2 × 10⁻⁶ m/s. Thus, the frequency of the electron moving aroundthe proton is
6 1
11
2.2 10 m s2 2 5.3 10 m
vr
≈ 6.6 × 10¹⁵ Hz.According to the classical electromagnetic theory we know that thefrequency of the electromagnetic waves emitted by the revolvingelectrons is equal to the frequency of its revolution around the nucleus.Thus the initial frequency of the light emitted is 6.6 × 10¹⁵ Hz.
Niels Henrik David Bohr(1885 – 1962) Danishphysicist who explained thespectrum of hydrogen atombased on quantum ideas.He gave a theory of nuclearfission based on the liquid-drop model of nucleus.Bohr contributed to theclarification of conceptualproblems in quantummechanics, in particular byproposing the comple-mentary principle.
NIE
LS
HE
NR
IK D
AV
ID B
OH
R (1
885 – 1
962)
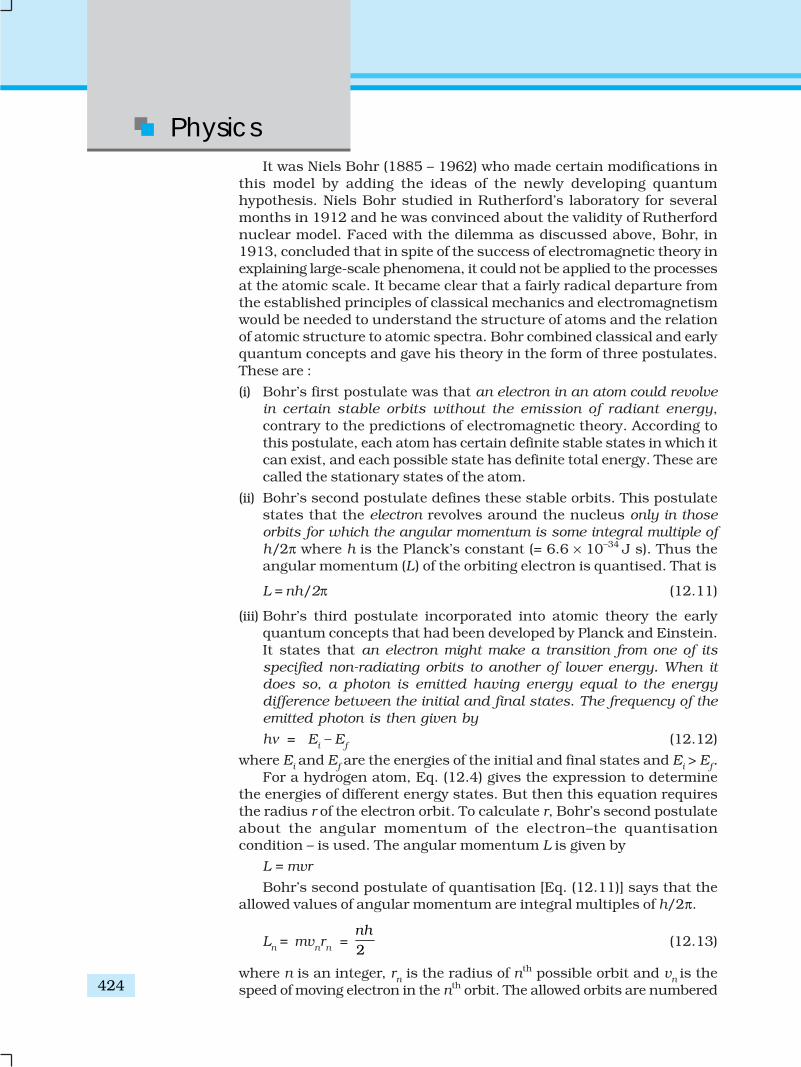
Physics
424
It was Niels Bohr (1885 – 1962) who made certain modifications inthis model by adding the ideas of the newly developing quantumhypothesis. Niels Bohr studied in Rutherford’s laboratory for severalmonths in 1912 and he was convinced about the validity of Rutherfordnuclear model. Faced with the dilemma as discussed above, Bohr, in1913, concluded that in spite of the success of electromagnetic theory inexplaining large-scale phenomena, it could not be applied to the processesat the atomic scale. It became clear that a fairly radical departure fromthe established principles of classical mechanics and electromagnetismwould be needed to understand the structure of atoms and the relationof atomic structure to atomic spectra. Bohr combined classical and earlyquantum concepts and gave his theory in the form of three postulates.These are :
(i) Bohr’s first postulate was that an electron in an atom could revolvein certain stable orbits without the emission of radiant energy,contrary to the predictions of electromagnetic theory. According tothis postulate, each atom has certain definite stable states in which itcan exist, and each possible state has definite total energy. These arecalled the stationary states of the atom.
(ii) Bohr’s second postulate defines these stable orbits. This postulatestates that the electron revolves around the nucleus only in thoseorbits for which the angular momentum is some integral multiple ofh/2π where h is the Planck’s constant (= 6.6 × 10⁻³⁴ J s). Thus theangular momentum (L) of the orbiting electron is quantised. That is
L = nh/2π (12.11)
(iii) Bohr’s third postulate incorporated into atomic theory the earlyquantum concepts that had been developed by Planck and Einstein.It states that an electron might make a transition from one of itsspecified non-radiating orbits to another of lower energy. When itdoes so, a photon is emitted having energy equal to the energydifference between the initial and final states. The frequency of theemitted photon is then given by
hν = Ei – Ef (12.12)
where Ei and Ef are the energies of the initial and final states and Ei > Ef.For a hydrogen atom, Eq. (12.4) gives the expression to determine
the energies of different energy states. But then this equation requiresthe radius r of the electron orbit. To calculate r, Bohr’s second postulateabout the angular momentum of the electron–the quantisationcondition – is used. The angular momentum L is given by
L = mvr
Bohr’s second postulate of quantisation [Eq. (12.11)] says that theallowed values of angular momentum are integral multiples of h/2π.
Ln = mvnrn = 2nh
(12.13)
where n is an integer, rn is the radius of nth possible orbit and vn is thespeed of moving electron in the nth orbit. The allowed orbits are numbered
425
Atoms
1, 2, 3 ..., according to the values of n, which is called the principalquantum number of the orbit.
From Eq. (12.3), the relation between vn and rn is
04n
n
ev
mr
Combining it with Eq. (12.13), we get the following expressions for vnand rn,
2
0
1 14 2n
ev
n h
(12.14)
and22
02
42n
n hr
m e
(12.15)
Eq. (12.14) depicts that the orbital speed in the nth orbit falls by a factorof n. Using Eq. (12.15), the size of the innermost orbit (n = 1) can beobtained as
20
1 2
hr
me
This is called the Bohr radius, represented by the symbol a0. Thus,
20
0 2
ha
me
(12.16)
Substitution of values of h, m, ε0 and e gives a0 = 5.29 × 10⁻¹¹ m. FromEq. (12.15), it can also be seen that the radii of the orbits increase as n2.
The total energy of the electron in the stationary states of the hydrogenatom can be obtained by substituting the value of orbital radius in Eq.(12.4) as
22 2
20 0
28 4n
e m eE
hn
or 4
2 2 208n
meE
n h (12.17)
Substituting values, Eq. (12.17) yields
18
2
2.18 10JnE
n
(12.18)
Atomic energies are often expressed in electron volts (eV) rather thanjoules. Since 1 eV = 1.6 × 10⁻¹⁹ J, Eq. (12.18) can be rewritten as
2
13.6 eVnE
n (12.19)
The negative sign of the total energy of an electron moving in an orbitmeans that the electron is bound with the nucleus. Energy will thus berequired to remove the electron from the hydrogen atom to a distanceinfinitely far away from its nucleus (or proton in hydrogen atom).
Physics
426 EX
AM
PLE 1
2.5
The derivation of Eqs. (12.17) – (12.19) involves the assumption thatthe electronic orbits are circular, though orbits under inverse squareforce are, in general elliptical. (Planets move in elliptical orbits under theinverse square gravitational force of the sun.) However, it was shown bythe German physicist Arnold Sommerfeld (1868 – 1951) that, when therestriction of circular orbit is relaxed, these equations continue to holdeven for elliptic orbits.
ORBIT VS STATE (ORBITAL PICTURE) OF ELECTRON IN ATOM
We are introduced to the Bohr Model of atom one time or the other in the course ofphysics. This model has its place in the history of quantum mechanics and particularlyin explaining the structure of an atom. It has become a milestone since Bohr introducedthe revolutionary idea of definite energy orbits for the electrons, contrary to the classicalpicture requiring an accelerating particle to radiate. Bohr also introduced the idea ofquantisation of angular momentum of electrons moving in definite orbits. Thus it was asemi-classical picture of the structure of atom.
Now with the development of quantum mechanics, we have a better understandingof the structure of atom. Solutions of the Schrödinger wave equation assign a wave-likedescription to the electrons bound in an atom due to attractive forces of the protons.
An orbit of the electron in the Bohr model is the circular path of motion of an electronaround the nucleus. But according to quantum mechanics, we cannot associate a definitepath with the motion of the electrons in an atom. We can only talk about the probabilityof finding an electron in a certain region of space around the nucleus. This probabilitycan be inferred from the one-electron wave function called the orbital. This functiondepends only on the coordinates of the electron.
It is therefore essential that we understand the subtle differences that exist in the twomodels: Bohr model is valid for only one-electron atoms/ions; an energy value, assigned to
each orbit, depends on the principal quantum number n in this model. We knowthat energy associated with a stationary state of an electron depends on n only, forone-electron atoms/ions. For a multi-electron atom/ion, this is not true.
The solution of the Schrödinger wave equation, obtained for hydrogen-like atoms/ions, called the wave function, gives information about the probability of finding anelectron in various regions around the nucleus. This orbital has no resemblancewhatsoever with the orbit defined for an electron in the Bohr model.
Example 12.5 A 10 kg satellite circles earth once every 2 h in anorbit having a radius of 8000 km. Assuming that Bohr’s angularmomentum postulate applies to satellites just as it does to an electronin the hydrogen atom, find the quantum number of the orbit of thesatellite.
SolutionFrom Eq. (12.13), we havem vn rn = nh/2π
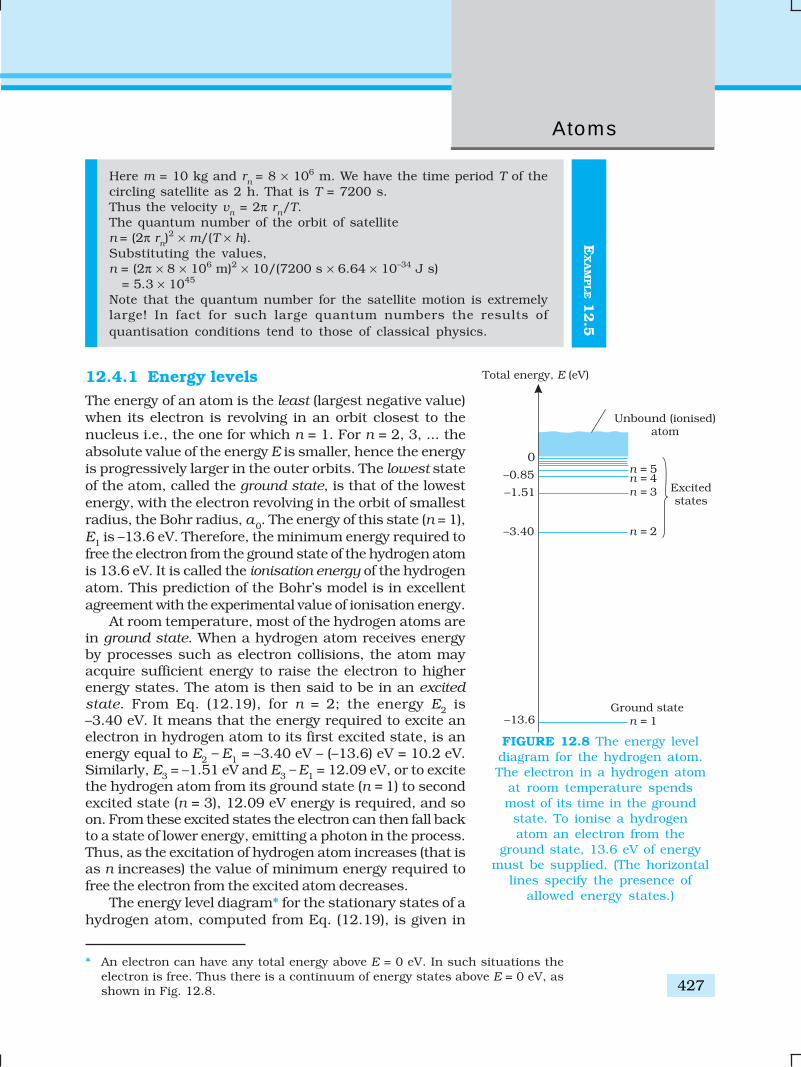
427
Atoms
EX
AM
PLE 1
2.5
Here m = 10 kg and rn = 8 × 10⁶ m. We have the time period T of thecircling satellite as 2 h. That is T = 7200 s.Thus the velocity vn = 2π rn/T.The quantum number of the orbit of satelliten = (2π rn)
2 × m/(T × h).Substituting the values,n = (2π × 8 × 106 m)2 × 10/(7200 s × 6.64 × 10–34 J s) = 5.3 × 1045
Note that the quantum number for the satellite motion is extremelylarge! In fact for such large quantum numbers the results ofquantisation conditions tend to those of classical physics.
12.4.1 Energy levelsThe energy of an atom is the least (largest negative value)when its electron is revolving in an orbit closest to thenucleus i.e., the one for which n = 1. For n = 2, 3, ... theabsolute value of the energy E is smaller, hence the energyis progressively larger in the outer orbits. The lowest stateof the atom, called the ground state, is that of the lowestenergy, with the electron revolving in the orbit of smallestradius, the Bohr radius, a0. The energy of this state (n = 1),E1 is –13.6 eV. Therefore, the minimum energy required tofree the electron from the ground state of the hydrogen atomis 13.6 eV. It is called the ionisation energy of the hydrogenatom. This prediction of the Bohr’s model is in excellentagreement with the experimental value of ionisation energy.
At room temperature, most of the hydrogen atoms arein ground state. When a hydrogen atom receives energyby processes such as electron collisions, the atom mayacquire sufficient energy to raise the electron to higherenergy states. The atom is then said to be in an excitedstate. From Eq. (12.19), for n = 2; the energy E2 is–3.40 eV. It means that the energy required to excite anelectron in hydrogen atom to its first excited state, is anenergy equal to E2 – E1 = –3.40 eV – (–13.6) eV = 10.2 eV.Similarly, E3 = –1.51 eV and E3 – E1 = 12.09 eV, or to excitethe hydrogen atom from its ground state (n = 1) to secondexcited state (n = 3), 12.09 eV energy is required, and soon. From these excited states the electron can then fall backto a state of lower energy, emitting a photon in the process.Thus, as the excitation of hydrogen atom increases (that isas n increases) the value of minimum energy required tofree the electron from the excited atom decreases.
The energy level diagram* for the stationary states of ahydrogen atom, computed from Eq. (12.19), is given in
* An electron can have any total energy above E = 0 eV. In such situations theelectron is free. Thus there is a continuum of energy states above E = 0 eV, asshown in Fig. 12.8.
FIGURE 12.8 The energy leveldiagram for the hydrogen atom.The electron in a hydrogen atom
at room temperature spendsmost of its time in the ground
state. To ionise a hydrogenatom an electron from the
ground state, 13.6 eV of energymust be supplied. (The horizontal
lines specify the presence ofallowed energy states.)
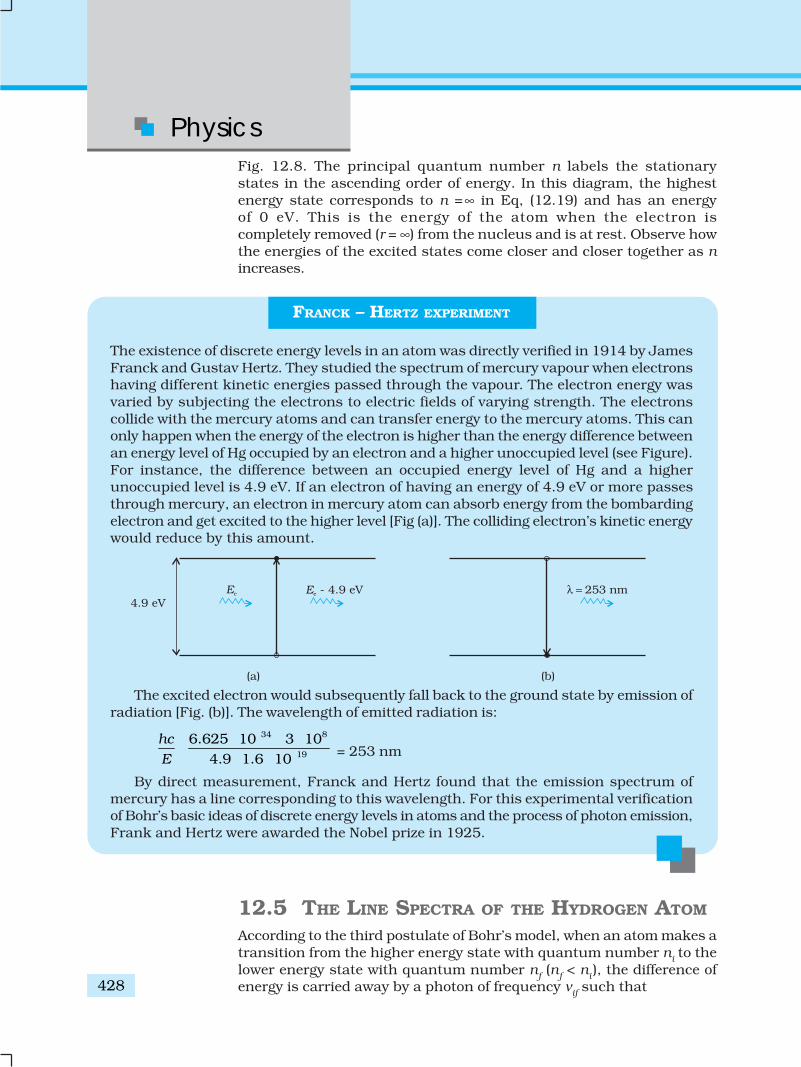
Physics
428
Fig. 12.8. The principal quantum number n labels the stationarystates in the ascending order of energy. In this diagram, the highestenergy state corresponds to n =∞ in Eq, (12.19) and has an energyof 0 eV. This is the energy of the atom when the electron iscompletely removed (r = ∞) from the nucleus and is at rest. Observe howthe energies of the excited states come closer and closer together as nincreases.
12.5 THE LINE SPECTRA OF THE HYDROGEN ATOM
According to the third postulate of Bohr’s model, when an atom makes atransition from the higher energy state with quantum number ni to thelower energy state with quantum number nf (nf < ni ), the difference ofenergy is carried away by a photon of frequency νif such that
FRANCK – HERTZ EXPERIMENT
The existence of discrete energy levels in an atom was directly verified in 1914 by JamesFranck and Gustav Hertz. They studied the spectrum of mercury vapour when electronshaving different kinetic energies passed through the vapour. The electron energy wasvaried by subjecting the electrons to electric fields of varying strength. The electronscollide with the mercury atoms and can transfer energy to the mercury atoms. This canonly happen when the energy of the electron is higher than the energy difference betweenan energy level of Hg occupied by an electron and a higher unoccupied level (see Figure).For instance, the difference between an occupied energy level of Hg and a higherunoccupied level is 4.9 eV. If an electron of having an energy of 4.9 eV or more passesthrough mercury, an electron in mercury atom can absorb energy from the bombardingelectron and get excited to the higher level [Fig (a)]. The colliding electron’s kinetic energywould reduce by this amount.
The excited electron would subsequently fall back to the ground state by emission ofradiation [Fig. (b)]. The wavelength of emitted radiation is:
34 8
19
6.625 10 3 104.9 1.6 10
hc
E
= 253 nm
By direct measurement, Franck and Hertz found that the emission spectrum ofmercury has a line corresponding to this wavelength. For this experimental verificationof Bohr’s basic ideas of discrete energy levels in atoms and the process of photon emission,Frank and Hertz were awarded the Nobel prize in 1925.
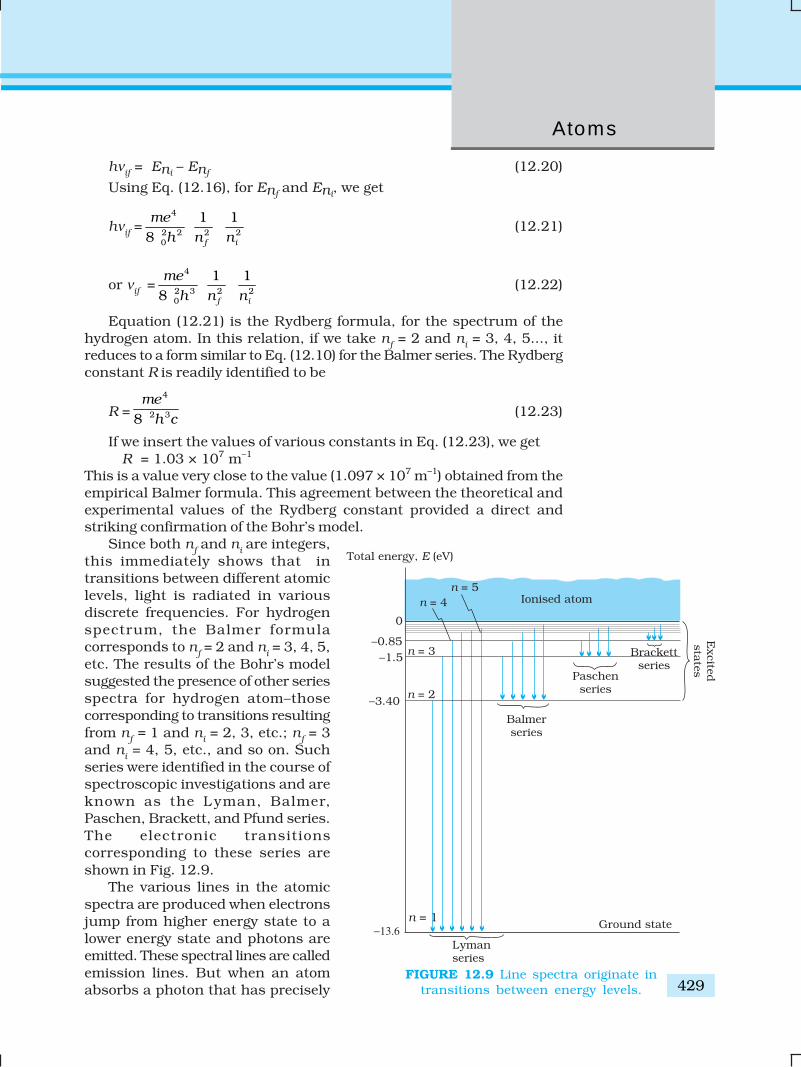
429
Atoms
hνif = Eni – Enf (12.20)
Using Eq. (12.16), for Enf and Eni, we get
hνif =4
2 2 2 20
1 18 f i
me
h n n
(12.21)
or νif =4
2 3 2 20
1 18 f i
me
h n n
(12.22)
Equation (12.21) is the Rydberg formula, for the spectrum of thehydrogen atom. In this relation, if we take nf = 2 and ni = 3, 4, 5..., itreduces to a form similar to Eq. (12.10) for the Balmer series. The Rydbergconstant R is readily identified to be
R =4
2 38me
h c (12.23)
If we insert the values of various constants in Eq. (12.23), we getR = 1.03 × 10⁷ m–1
This is a value very close to the value (1.097 × 10⁷ m–1) obtained from theempirical Balmer formula. This agreement between the theoretical andexperimental values of the Rydberg constant provided a direct andstriking confirmation of the Bohr’s model.
Since both nf and ni are integers,this immediately shows that intransitions between different atomiclevels, light is radiated in variousdiscrete frequencies. For hydrogenspectrum, the Balmer formulacorresponds to nf = 2 and ni = 3, 4, 5,etc. The results of the Bohr’s modelsuggested the presence of other seriesspectra for hydrogen atom–thosecorresponding to transitions resultingfrom nf = 1 and ni = 2, 3, etc.; nf = 3and ni = 4, 5, etc., and so on. Suchseries were identified in the course ofspectroscopic investigations and areknown as the L yman, Balmer,Paschen, Brackett, and Pfund series.The electronic transitionscorresponding to these series areshown in Fig. 12.9.
The various lines in the atomicspectra are produced when electronsjump from higher energy state to alower energy state and photons areemitted. These spectral lines are calledemission lines. But when an atomabsorbs a photon that has precisely
FIGURE 12.9 Line spectra originate intransitions between energy levels.

Physics
430
EX
AM
PLE 1
2.6
the same energy needed by the electron in a lower energy state to maketransitions to a higher energy state, the process is called absorption.Thus if photons with a continuous range of frequencies pass through ararefied gas and then are analysed with a spectrometer, a series of darkspectral absorption lines appear in the continuous spectrum. The darklines indicate the frequencies that have been absorbed by the atoms ofthe gas.
The explanation of the hydrogen atom spectrum provided by Bohr’smodel was a brilliant achievement, which greatly stimulated progresstowards the modern quantum theory. In 1922, Bohr was awarded NobelPrize in Physics.
Example 12.6 Using the Rydberg formula, calculate the wavelengthsof the first four spectral lines in the Lyman series of the hydrogenspectrum.
Solution The Rydberg formula is
hc/λif = 4
2 2 2 2
1 18 f i
me
h n n
The wavelengths of the first four lines in the Lyman series correspondto transitions from ni = 2,3,4,5 to nf = 1. We know that
4
2 28me
h = 13.6 eV = 21.76 ×10⁻¹⁹ J
Therefore,
119
2
m1 1
21.76 101
i
i
hc
n
= . 34 8 2
19 2
6 625 10 3 10m
21.76 10 ( 1)i
i
n
n
=
27
2
0.9134 10 m
( 1)i
i
n
n
= 913.4 ni2/(ni
2 –1) ÅSubstituting ni = 2,3,4,5, we get λ21 = 1218 Å, λ31 = 1028 Å, λ41 = 974.3 Å,and λ51 = 951.4 Å.
12.6 DE BROGLIE’S EXPLANATION OF BOHR’SSECOND POSTULATE OF QUANTISATION
Of all the postulates, Bohr made in his model of the atom, perhaps themost puzzling is his second postulate. It states that the angularmomentum of the electron orbiting around the nucleus is quantised (thatis, Ln = nh/2π; n = 1, 2, 3 …). Why should the angular momentum haveonly those values that are integral multiples of h/2π? The French physicistLouis de Broglie explained this puzzle in 1923, ten years after Bohrproposed his model.
We studied, in Chapter 11, about the de Broglie’s hypothesis thatmaterial particles, such as electrons, also have a wave nature. C. J. Davissonand L. H. Germer later experimentally verified the wave nature of electrons
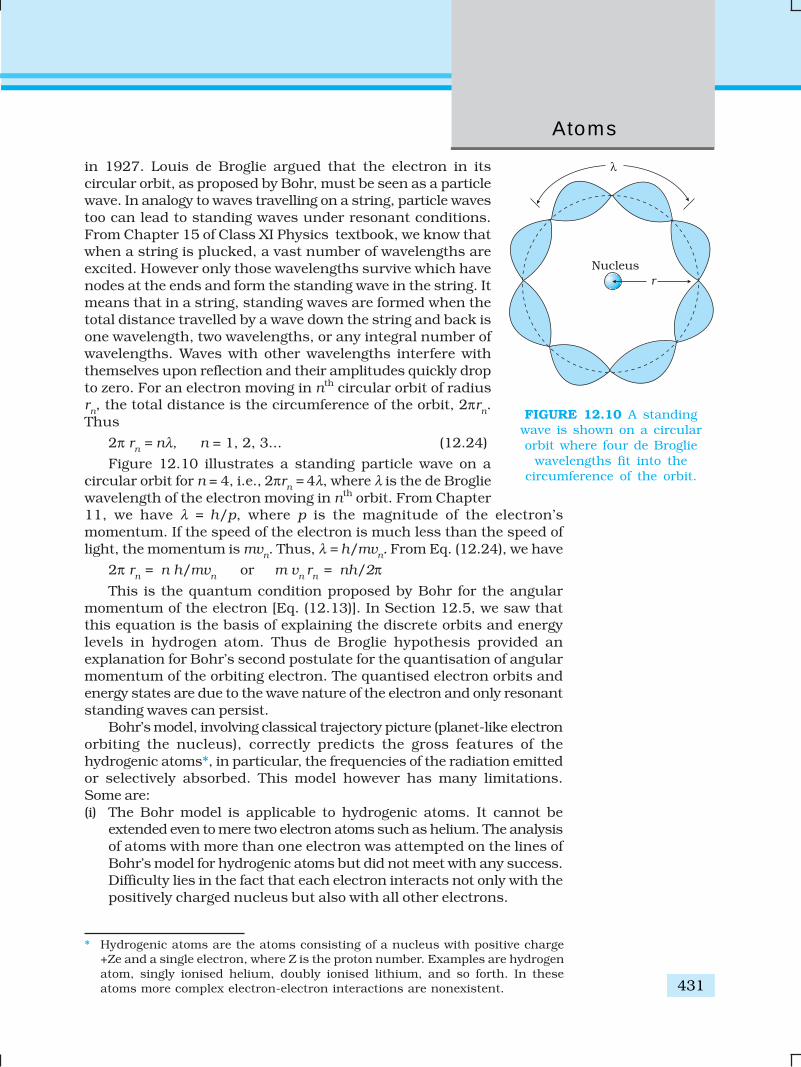
431
Atoms
in 1927. Louis de Broglie argued that the electron in itscircular orbit, as proposed by Bohr, must be seen as a particlewave. In analogy to waves travelling on a string, particle wavestoo can lead to standing waves under resonant conditions.From Chapter 15 of Class XI Physics textbook, we know thatwhen a string is plucked, a vast number of wavelengths areexcited. However only those wavelengths survive which havenodes at the ends and form the standing wave in the string. Itmeans that in a string, standing waves are formed when thetotal distance travelled by a wave down the string and back isone wavelength, two wavelengths, or any integral number ofwavelengths. Waves with other wavelengths interfere withthemselves upon reflection and their amplitudes quickly dropto zero. For an electron moving in nth circular orbit of radiusrn, the total distance is the circumference of the orbit, 2πrn.Thus
2π rn = nλ, n = 1, 2, 3... (12.24)
Figure 12.10 illustrates a standing particle wave on acircular orbit for n = 4, i.e., 2πrn = 4λ, where λ is the de Brogliewavelength of the electron moving in nth orbit. From Chapter11, we have λ = h/p, where p is the magnitude of the electron’smomentum. If the speed of the electron is much less than the speed oflight, the momentum is mvn. Thus, λ = h/mvn. From Eq. (12.24), we have
2π rn = n h/mvn or m vn rn = nh/2πThis is the quantum condition proposed by Bohr for the angular
momentum of the electron [Eq. (12.13)]. In Section 12.5, we saw thatthis equation is the basis of explaining the discrete orbits and energylevels in hydrogen atom. Thus de Broglie hypothesis provided anexplanation for Bohr’s second postulate for the quantisation of angularmomentum of the orbiting electron. The quantised electron orbits andenergy states are due to the wave nature of the electron and only resonantstanding waves can persist.
Bohr’s model, involving classical trajectory picture (planet-like electronorbiting the nucleus), correctly predicts the gross features of thehydrogenic atoms*, in particular, the frequencies of the radiation emittedor selectively absorbed. This model however has many limitations.Some are:(i) The Bohr model is applicable to hydrogenic atoms. It cannot be
extended even to mere two electron atoms such as helium. The analysisof atoms with more than one electron was attempted on the lines ofBohr’s model for hydrogenic atoms but did not meet with any success.Difficulty lies in the fact that each electron interacts not only with thepositively charged nucleus but also with all other electrons.
FIGURE 12.10 A standingwave is shown on a circularorbit where four de Broglie
wavelengths fit into thecircumference of the orbit.
* Hydrogenic atoms are the atoms consisting of a nucleus with positive charge+Ze and a single electron, where Z is the proton number. Examples are hydrogenatom, singly ionised helium, doubly ionised lithium, and so forth. In theseatoms more complex electron-electron interactions are nonexistent.
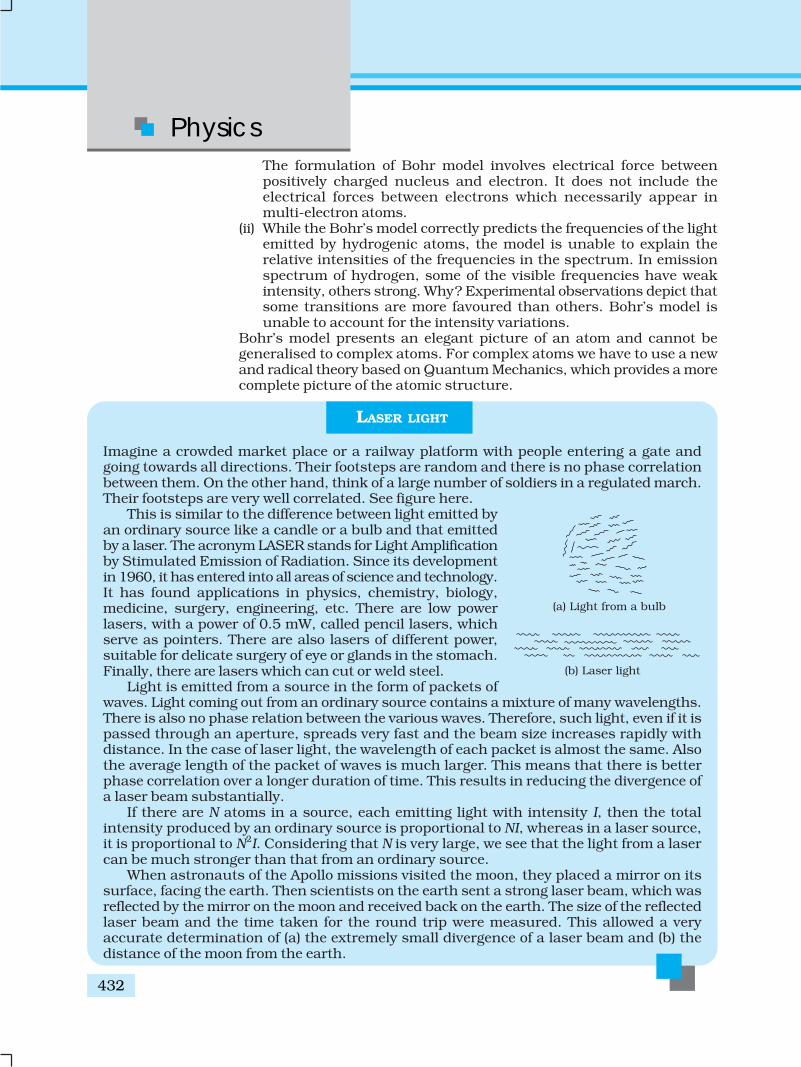
Physics
432
The formulation of Bohr model involves electrical force betweenpositively charged nucleus and electron. It does not include theelectrical forces between electrons which necessarily appear inmulti-electron atoms.
(ii) While the Bohr’s model correctly predicts the frequencies of the lightemitted by hydrogenic atoms, the model is unable to explain therelative intensities of the frequencies in the spectrum. In emissionspectrum of hydrogen, some of the visible frequencies have weakintensity, others strong. Why? Experimental observations depict thatsome transitions are more favoured than others. Bohr’s model isunable to account for the intensity variations.
Bohr’s model presents an elegant picture of an atom and cannot begeneralised to complex atoms. For complex atoms we have to use a newand radical theory based on Quantum Mechanics, which provides a morecomplete picture of the atomic structure.
LASER LIGHT
Imagine a crowded market place or a railway platform with people entering a gate andgoing towards all directions. Their footsteps are random and there is no phase correlationbetween them. On the other hand, think of a large number of soldiers in a regulated march.Their footsteps are very well correlated. See figure here.
This is similar to the difference between light emitted byan ordinary source like a candle or a bulb and that emittedby a laser. The acronym LASER stands for Light Amplificationby Stimulated Emission of Radiation. Since its developmentin 1960, it has entered into all areas of science and technology.It has found applications in physics, chemistry, biology,medicine, surgery, engineering, etc. There are low powerlasers, with a power of 0.5 mW, called pencil lasers, whichserve as pointers. There are also lasers of different power,suitable for delicate surgery of eye or glands in the stomach.Finally, there are lasers which can cut or weld steel.
Light is emitted from a source in the form of packets ofwaves. Light coming out from an ordinary source contains a mixture of many wavelengths.There is also no phase relation between the various waves. Therefore, such light, even if it ispassed through an aperture, spreads very fast and the beam size increases rapidly withdistance. In the case of laser light, the wavelength of each packet is almost the same. Alsothe average length of the packet of waves is much larger. This means that there is betterphase correlation over a longer duration of time. This results in reducing the divergence ofa laser beam substantially.
If there are N atoms in a source, each emitting light with intensity I, then the totalintensity produced by an ordinary source is proportional to NI, whereas in a laser source,it is proportional to N2I. Considering that N is very large, we see that the light from a lasercan be much stronger than that from an ordinary source.
When astronauts of the Apollo missions visited the moon, they placed a mirror on itssurface, facing the earth. Then scientists on the earth sent a strong laser beam, which wasreflected by the mirror on the moon and received back on the earth. The size of the reflectedlaser beam and the time taken for the round trip were measured. This allowed a veryaccurate determination of (a) the extremely small divergence of a laser beam and (b) thedistance of the moon from the earth.
433
Atoms
SUMMARY
1. Atom, as a whole, is electrically neutral and therefore contains equalamount of positive and negative charges.
2. In Thomson’s model, an atom is a spherical cloud of positive chargeswith electrons embedded in it.
3. In Rutherford’s model, most of the mass of the atom and all its positivecharge are concentrated in a tiny nucleus (typically one by ten thousandthe size of an atom), and the electrons revolve around it.
4. Rutherford nuclear model has two main difficulties in explaining thestructure of atom: (a) It predicts that atoms are unstable because theaccelerated electrons revolving around the nucleus must spiral intothe nucleus. This contradicts the stability of matter. (b) It cannotexplain the characteristic line spectra of atoms of different elements.
5. Atoms of each element are stable and emit characteristic spectrum.The spectrum consists of a set of isolated parallel lines termed as linespectrum. It provides useful information about the atomic structure.
6. The atomic hydrogen emits a line spectrum consisting of various series.The frequency of any line in a series can be expressed as a differenceof two terms;
Lyman series: 2 2
1 1
1Rc
n
; n = 2, 3, 4,...
Balmer series: 2 2
1 1
2Rc
n
; n = 3, 4, 5,...
Paschen series: 2 2
1 1
3Rc
n
; n = 4, 5, 6,...
Brackett series: 2 2
1 1
4Rc
n
; n = 5, 6, 7,...
Pfund series:2 2
1 1
5Rc
n
; n = 6, 7, 8,...
7. To explain the line spectra emitted by atoms, as well as the stabilityof atoms, Niel’s Bohr proposed a model for hydrogenic (single elctron)atoms. He introduced three postulates and laid the foundations ofquantum mechanics:
(a) In a hydrogen atom, an electron revolves in certain stable orbits(called stationary orbits) without the emission of radiant energy.
(b) The stationary orbits are those for which the angular momentumis some integral multiple of h/2π. (Bohr’s quantisation condition.)That is L = nh/2π, where n is an integer called a quantum number.
(c) The third postulate states that an electron might make a transitionfrom one of its specified non-radiating orbits to another of lowerenergy. When it does so, a photon is emitted having energy equalto the energy difference between the initial and final states. Thefrequency (ν) of the emitted photon is then given by
hν = Ei – Ef
An atom absorbs radiation of the same frequency the atom emits,in which case the electron is transferred to an orbit with a highervalue of n.
Ei + hν = Ef
Physics
434
8. As a result of the quantisation condition of angular momentum, theelectron orbits the nucleus at only specific radii. For a hydrogen atomit is given by
220
2
42n
n hr
m e
The total energy is also quantised:
4
2 2 208n
meE
n h
= –13.6 eV/n2
The n = 1 state is called ground state. In hydrogen atom the groundstate energy is –13.6 eV. Higher values of n correspond to excitedstates (n > 1). Atoms are excited to these higher states by collisionswith other atoms or electrons or by absorption of a photon of rightfrequency.
9. de Broglie’s hypothesis that electrons have a wavelength λ = h/mv gavean explanation for Bohr’s quantised orbits by bringing in the wave-particle duality. The orbits correspond to circular standing waves inwhich the circumference of the orbit equals a whole number ofwavelengths.
10. Bohr’s model is applicable only to hydrogenic (single electron) atoms.It cannot be extended to even two electron atoms such as helium.This model is also unable to explain for the relative intensities of thefrequencies emitted even by hydrogenic atoms.
POINTS TO PONDER
1. Both the Thomson’s as well as the Rutherford’s models constitute anunstable system. Thomson’s model is unstable electrostatically, whileRutherford’s model is unstable because of electromagnetic radiationof orbiting electrons.
2. What made Bohr quantise angular momentum (second postulate) andnot some other quantity? Note, h has dimensions of angularmomentum, and for circular orbits, angular momentum is a veryrelevant quantity. The second postulate is then so natural!
3. The orbital picture in Bohr’s model of the hydrogen atom wasinconsistent with the uncertainty principle. It was replaced by modernquantum mechanics in which Bohr’s orbits are regions where theelectron may be found with large probability.
4. Unlike the situation in the solar system, where planet-planetgravitational forces are very small as compared to the gravitationalforce of the sun on each planet (because the mass of the sun is somuch greater than the mass of any of the planets), the electron-electronelectric force interaction is comparable in magnitude to the electron-nucleus electrical force, because the charges and distances are of thesame order of magnitude. This is the reason why the Bohr’s modelwith its planet-like electron is not applicable to many electron atoms.
5. Bohr laid the foundation of the quantum theory by postulating specificorbits in which electrons do not radiate. Bohr’s model include only

435
Atoms
one quantum number n. The new theory called quantum mechanicssupportes Bohr’s postulate. However in quantum mechanics (moregenerally accepted), a given energy level may not correspond to justone quantum state. For example, a state is characterised by fourquantum numbers (n, l, m, and s), but for a pure Coulomb potential(as in hydrogen atom) the energy depends only on n.
6. In Bohr model, contrary to ordinary classical expectation, thefrequency of revolution of an electron in its orbit is not connected tothe frequency of spectral line. The later is the difference between twoorbital energies divided by h. For transitions between large quantumnumbers (n to n – 1, n very large), however, the two coincide as expected.
7. Bohr’s semiclassical model based on some aspects of classical physicsand some aspects of modern physics also does not provide a truepicture of the simplest hydrogenic atoms. The true picture is quantummechanical affair which differs from Bohr model in a number offundamental ways. But then if the Bohr model is not strictly correct,why do we bother about it? The reasons which make Bohr’s modelstill useful are:
(i) The model is based on just three postulates but accounts for almostall the general features of the hydrogen spectrum.
(ii) The model incorporates many of the concepts we have learnt inclassical physics.
(iii) The model demonstrates how a theoretical physicist occasionallymust quite literally ignore certain problems of approach in hopesof being able to make some predictions. If the predictions of thetheory or model agree with experiment, a theoretician then mustsomehow hope to explain away or rationalise the problems thatwere ignored along the way.
EXERCISES
12.1 Choose the correct alternative from the clues given at the end ofthe each statement:
(a) The size of the atom in Thomson’s model is .......... the atomicsize in Rutherford’s model. (much greater than/no differentfrom/much less than.)
(b) In the ground state of .......... electrons are in stable equilibrium,while in .......... electrons always experience a net force.(Thomson’s model/ Rutherford’s model.)
(c) A classical atom based on .......... is doomed to collapse.(Thomson’s model/ Rutherford’s model.)
(d) An atom has a nearly continuous mass distribution in a ..........but has a highly non-uniform mass distribution in ..........(Thomson’s model/ Rutherford’s model.)
(e) The positively charged part of the atom possesses most of themass in .......... (Rutherford’s model/both the models.)
12.2 Suppose you are given a chance to repeat the alpha-particlescattering experiment using a thin sheet of solid hydrogen in placeof the gold foil. (Hydrogen is a solid at temperatures below 14 K.)What results do you expect?
Physics
436
12.3 What is the shortest wavelength present in the Paschen series ofspectral lines?
12.4 A difference of 2.3 eV separates two energy levels in an atom. Whatis the frequency of radiation emitted when the atom make atransition from the upper level to the lower level?
12.5 The ground state energy of hydrogen atom is –13.6 eV. What are thekinetic and potential energies of the electron in this state?
12.6 A hydrogen atom initially in the ground level absorbs a photon,which excites it to the n = 4 level. Determine the wavelength andfrequency of photon.
12.7 (a) Using the Bohr’s model calculate the speed of the electron in ahydrogen atom in the n = 1, 2, and 3 levels. (b) Calculate the orbitalperiod in each of these levels.
12.8 The radius of the innermost electron orbit of a hydrogen atom is5.3×10–11 m. What are the radii of the n = 2 and n =3 orbits?
12.9 A 12.5 eV electron beam is used to bombard gaseous hydrogen atroom temperature. What series of wavelengths will be emitted?
12.10 In accordance with the Bohr’s model, find the quantum numberthat characterises the earth’s revolution around the sun in an orbitof radius 1.5 × 10¹¹ m with orbital speed 3 × 10⁴ m/s. (Mass of earth= 6.0 × 1024 kg.)
ADDITIONAL EXERCISES12.11 Answer the following questions, which help you understand the
difference between Thomson’s model and Rutherford’s model better.
(a) Is the average angle of deflection of α-particles by a thin gold foilpredicted by Thomson’s model much less, about the same, ormuch greater than that predicted by Rutherford’s model?
(b) Is the probability of backward scattering (i.e., scattering ofα-particles at angles greater than 90°) predicted by Thomson’smodel much less, about the same, or much greater than thatpredicted by Rutherford’s model?
(c) Keeping other factors fixed, it is found experimentally that forsmall thickness t, the number of α-particles scattered atmoderate angles is proportional to t. What clue does this lineardependence on t provide?
(d) In which model is it completely wrong to ignore multiplescattering for the calculation of average angle of scattering ofα-particles by a thin foil?
12.12 The gravitational attraction between electron and proton in ahydrogen atom is weaker than the coulomb attraction by a factor ofabout 10–40. An alternative way of looking at this fact is to estimatethe radius of the first Bohr orbit of a hydrogen atom if the electronand proton were bound by gravitational attraction. You will find theanswer interesting.
12.13 Obtain an expression for the frequency of radiation emitted when ahydrogen atom de-excites from level n to level (n–1). For large n,show that this frequency equals the classical frequency of revolutionof the electron in the orbit.
437
Atoms
12.14 Classically, an electron can be in any orbit around the nucleus ofan atom. Then what determines the typical atomic size? Why is anatom not, say, thousand times bigger than its typical size? Thequestion had greatly puzzled Bohr before he arrived at his famousmodel of the atom that you have learnt in the text. To simulate whathe might well have done before his discovery, let us play as followswith the basic constants of nature and see if we can get a quantitywith the dimensions of length that is roughly equal to the knownsize of an atom (~ 10–10m).
(a) Construct a quantity with the dimensions of length from thefundamental constants e, me, and c. Determine its numericalvalue.
(b) You will find that the length obtained in (a) is many orders ofmagnitude smaller than the atomic dimensions. Further, itinvolves c. But energies of atoms are mostly in non-relativisticdomain where c is not expected to play any role. This is whatmay have suggested Bohr to discard c and look for ‘somethingelse’ to get the right atomic size. Now, the Planck’s constant hhad already made its appearance elsewhere. Bohr’s great insightlay in recognising that h, me, and e will yield the right atomicsize. Construct a quantity with the dimension of length from h,me, and e and confirm that its numerical value has indeed thecorrect order of magnitude.
12.15 The total energy of an electron in the first excited state of thehydrogen atom is about –3.4 eV.
(a) What is the kinetic energy of the electron in this state?
(b) What is the potential energy of the electron in this state?
(c) Which of the answers above would change if the choice of thezero of potential energy is changed?
12.16 If Bohr’s quantisation postulate (angular momentum = nh/2π) is abasic law of nature, it should be equally valid for the case of planetarymotion also. Why then do we never speak of quantisation of orbitsof planets around the sun?
12.17 Obtain the first Bohr’s radius and the ground state energy of amuonic hydrogen atom [i.e., an atom in which a negatively chargedmuon (μ–) of mass about 207me orbits around a proton].

Physics
438
13.1 INTRODUCTION
In the previous chapter, we have learnt that in every atom, the positive
charge and mass are densely concentrated at the centre of the atom
forming its nucleus. The overall dimensions of a nucleus are much smaller
than those of an atom. Experiments on scattering of α-particles
demonstrated that the radius of a nucleus was smaller than the radius
of an atom by a factor of about 104. This means the volume of a nucleus
is about 10–12 times the volume of the atom. In other words, an atom is
almost empty. If an atom is enlarged to the size of a classroom, the nucleus
would be of the size of pinhead. Nevertheless, the nucleus contains most
(more than 99.9%) of the mass of an atom.
Does the nucleus have a structure, just as the atom does? If so, what
are the constituents of the nucleus? How are these held together? In this
chapter, we shall look for answers to such questions. We shall discuss
various properties of nuclei such as their size, mass and stability, and
also associated nuclear phenomena such as radioactivity, fission and fusion.
13.2 ATOMIC MASSES AND COMPOSITION OF NUCLEUS
The mass of an atom is very small, compared to a kilogram; for example,
the mass of a carbon atom, 12C, is 1.992647 × 10⁻²⁶ kg. Kilogram is not
a very convenient unit to measure such small quantities. Therefore, a
Chapter Thirteen
NUCLEI
439
Nuclei
different mass unit is used for expressing atomic masses. This unit is the
atomic mass unit (u), defined as 1/12th of the mass of the carbon (12C)
atom. According to this definition
12 mass of one C atom1u =
12
261.992647 10 kg
12
−×=
271.660539 10 kg−= × (13.1)
The atomic masses of various elements expressed in atomic mass
unit (u) are close to being integral multiples of the mass of a hydrogenatom. There are, however, many striking exceptions to this rule. For
example, the atomic mass of chlorine atom is 35.46 u.
Accurate measurement of atomic masses is carried out with a mass
spectrometer, The measurement of atomic masses reveals the existence
of different types of atoms of the same element, which exhibit the samechemical properties, but differ in mass. Such atomic species of the same
element differing in mass are called isotopes. (In Greek, isotope means
the same place, i.e. they occur in the same place in the periodic table of
elements.) It was found that practically every element consists of a mixture
of several isotopes. The relative abundance of different isotopes differs
from element to element. Chlorine, for example, has two isotopes havingmasses 34.98 u and 36.98 u, which are nearly integral multiples of the
mass of a hydrogen atom. The relative abundances of these isotopes are
75.4 and 24.6 per cent, respectively. Thus, the average mass of a chlorine
atom is obtained by the weighted average of the masses of the two
isotopes, which works out to be
= 75.4 34.98 24.6 36.98
100
× + ×
= 35.47 u
which agrees with the atomic mass of chlorine.
Even the lightest element, hydrogen has three isotopes having masses
1.0078 u, 2.0141 u, and 3.0160 u. The nucleus of the lightest atom of
hydrogen, which has a relative abundance of 99.985%, is called theproton. The mass of a proton is
271.00727u 1.67262 10 kgp
m−= = × (13.2)
This is equal to the mass of the hydrogen atom (= 1.00783u), minus
the mass of a single electron (me = 0.00055 u). The other two isotopes of
hydrogen are called deuterium and tritium. Tritium nuclei, being
unstable, do not occur naturally and are produced artificially inlaboratories.
The positive charge in the nucleus is that of the protons. A proton
carries one unit of fundamental charge and is stable. It was earlier thought
that the nucleus may contain electrons, but this was ruled out later using
arguments based on quantum theory. All the electrons of an atom areoutside the nucleus. We know that the number of these electrons outside
the nucleus of the atom is Z, the atomic number. The total charge of the
Physics
440
atomic electrons is thus (–Ze), and since the atom is neutral, the charge
of the nucleus is (+Ze). The number of protons in the nucleus of the atom
is, therefore, exactly Z, the atomic number.
Discovery of Neutron
Since the nuclei of deuterium and tritium are isotopes of hydrogen, they
must contain only one proton each. But the masses of the nuclei of
hydrogen, deuterium and tritium are in the ratio of 1:2:3. Therefore, the
nuclei of deuterium and tritium must contain, in addition to a proton,
some neutral matter. The amount of neutral matter present in the nucleiof these isotopes, expressed in units of mass of a proton, is approximately
equal to one and two, respectively. This fact indicates that the nuclei of
atoms contain, in addition to protons, neutral matter in multiples of a
basic unit. This hypothesis was verified in 1932 by James Chadwick
who observed emission of neutral radiation when beryllium nuclei were
bombarded with alpha-particles. (α-particles are helium nuclei, to be
discussed in a later section). It was found that this neutral radiation
could knock out protons from light nuclei such as those of helium, carbon
and nitrogen. The only neutral radiation known at that time was photons(electromagnetic radiation). Application of the principles of conservation
of energy and momentum showed that if the neutral radiation consisted
of photons, the energy of photons would have to be much higher than is
available from the bombardment of beryllium nuclei with α-particles.
The clue to this puzzle, which Chadwick satisfactorily solved, was to
assume that the neutral radiation consists of a new type of neutral
particles called neutrons. From conservation of energy and momentum,
he was able to determine the mass of new particle ‘as very nearly the
same as mass of proton’.The mass of a neutron is now known to a high degree of accuracy. It is
mn = 1.00866 u = 1.6749×10⁻²⁷ kg (13.3)
Chadwick was awarded the 1935 Nobel Prize in Physics for his
discovery of the neutron.
A free neutron, unlike a free proton, is unstable. It decays into aproton, an electron and a antineutrino (another elementary particle), and
has a mean life of about 1000s. It is, however, stable inside the nucleus.
The composition of a nucleus can now be described using the following
terms and symbols:
Z - atomic number = number of protons [13.4(a)]
N - neutron number = number of neutrons [13.4(b)]
A - mass number = Z + N
= total number of protons and neutrons [13.4(c)]
One also uses the term nucleon for a proton or a neutron. Thus the
number of nucleons in an atom is its mass number A.
Nuclear species or nuclides are shown by the notation XA
Z where X is
the chemical symbol of the species. For example, the nucleus of gold is
denoted by 197
79 Au. It contains 197 nucleons, of which 79 are protons
and the rest118 are neutrons.
441
Nuclei
The composition of isotopes of an element can now be readily
explained. The nuclei of isotopes of a given element contain the same
number of protons, but differ from each other in their number of neutrons.
Deuterium, 2
1 H, which is an isotope of hydrogen, contains one proton
and one neutron. Its other isotope tritium, 3
1 H, contains one proton and
two neutrons. The element gold has 32 isotopes, ranging from A =173 toA = 204. We have already mentioned that chemical properties of elements
depend on their electronic structure. As the atoms of isotopes have
identical electronic structure they have identical chemical behaviour and
are placed in the same location in the periodic table.
All nuclides with same mass number A are called isobars. For
example, the nuclides 3
1 H and 3
2He are isobars. Nuclides with same
neutron number N but different atomic number Z, for example 198
80 Hg
and 197
79 Au , are called isotones.
13.3 SIZE OF THE NUCLEUS
As we have seen in Chapter 12, Rutherford was the pioneer who
postulated and established the existence of the atomic nucleus. At
Rutherford’s suggestion, Geiger and Marsden performed their classic
experiment: on the scattering of α-particles from thin gold foils. Their
experiments revealed that the distance of closest approach to a gold
nucleus of an α-particle of kinetic energy 5.5 MeV is about 4.0 × 10⁻¹⁴ m.
The scattering of α-particle by the gold sheet could be understood by
Rutherford by assuming that the coulomb repulsive force was solely
responsible for scattering. Since the positive charge is confined to the
nucleus, the actual size of the nucleus has to be less than 4.0 × 10⁻¹⁴ m.
If we use α-particles of higher energies than 5.5 MeV, the distance of
closest approach to the gold nucleus will be smaller and at some point
the scattering will begin to be affected by the short range nuclear forces,
and differ from Rutherford’s calculations. Rutherford’s calculations are
based on pure coulomb repulsion between the positive charges of the α-
particle and the gold nucleus. From the distance at which deviations set
in, nuclear sizes can be inferred.
By performing scattering experiments in which fast electrons, instead
of α-particles, are projectiles that bombard targets made up of variouselements, the sizes of nuclei of various elements have been accurately
measured.
It has been found that a nucleus of mass number A has a radius
R = R0 A1/3 (13.5)
where R0 = 1.2 × 10⁻¹⁵ m. This means the volume of the nucleus, which
is proportional to R 3 is proportional to A. Thus the density of nucleus is
a constant, independent of A, for all nuclei. Different nuclei are likes
drop of liquid of constant density. The density of nuclear matter is
approximately 2.3 × 10¹⁷ kg m–3. This density is very large compared to
ordinary matter, say water, which is 103 kg m–3. This is understandable,
as we have already seen that most of the atom is empty. Ordinary matter
consisting of atoms has a large amount of empty space.
Physics
442
EX
AM
PLE 1
3.2
Example 13.1 Given the mass of iron nucleus as 55.85u and A=56,find the nuclear density?
Solution
mFe = 55.85, u = 9.27 × 10⁻²⁶
kg
Nuclear density = mass
volume =
26
15 3
9.27 10 1
56(4 /3)(1.2 10 )
−
−
××
π × = 2.29 × 10¹⁷ kg m–3
The density of matter in neutron stars (an astrophysical object) iscomparable to this density. This shows that matter in these objects
has been compressed to such an extent that they resemble a big nucleus.
13.4 MASS-ENERGY AND NUCLEAR BINDING ENERGY
13.4.1 Mass – Energy
Einstein showed from his theory of special relativity that it is necessaryto treat mass as another form of energy. Before the advent of this theory
of special relativity it was presumed that mass and energy were conserved
separately in a reaction. However, Einstein showed that mass is another
form of energy and one can convert mass-energy into other forms of
energy, say kinetic energy and vice-versa.
Einstein gave the famous mass-energy equivalence relation
E = mc2 (13.6)
Here the energy equivalent of mass m is related by the above equation
and c is the velocity of light in vacuum and is approximately equal to
3×10⁸ m s–1.
Example 13.2 Calculate the energy equivalent of 1 g of substance.
Solution
Energy, E = 10–3
× ( 3 × 10⁸)2 J
E = 10–3 × 9 × 1016 = 9 × 10¹³ J
Thus, if one gram of matter is converted to energy, there is a release
of enormous amount of energy.
Experimental verification of the Einstein’s mass-energy relation has
been achieved in the study of nuclear reactions amongst nucleons, nuclei,
electrons and other more recently discovered particles. In a reaction the
conservation law of energy states that the initial energy and the final
energy are equal provided the energy associated with mass is also
included. This concept is important in understanding nuclear masses
and the interaction of nuclei with one another. They form the subject
matter of the next few sections.
13.4.2 Nuclear binding energy
In Section 13.2 we have seen that the nucleus is made up of neutrons
and protons. Therefore it may be expected that the mass of the nucleus
is equal to the total mass of its individual protons and neutrons. However,
EX
AM
PLE 1
3.1
443
Nuclei
EX
AM
PLE 1
3.3
the nuclear mass M is found to be always less than this . For example, let
us consider 168 O ; a nucleus which has 8 neutrons and 8 protons. We
have
Mass of 8 neutrons = 8 × 1.00866 u
Mass of 8 protons = 8 × 1.00727 u
Mass of 8 electrons = 8 × 0.00055 u
Therefore the expected mass of 168 O nucleus
= 8 × 2.01593 u = 16.12744 u.
The atomic mass of 168 O found from mass spectroscopy experiments
is seen to be 15.99493 u. Substracting the mass of 8 electrons (8 × 0.00055 u)
from this, we get the experimental mass of 16
8 O nucleus to be 15.99053 u.
Thus, we find that the mass of the 16
8 O nucleus is less than the total
mass of its constituents by 0.13691u. The difference in mass of a nucleus
and its constituents, ∆M, is called the mass defect, and is given by
[ ( ) ]p n
M Zm A Z m M∆ = + − − (13.7)
What is the meaning of the mass defect? It is here that Einstein’s
equivalence of mass and energy plays a role. Since the mass of the oxygen
nucleus is less that the sum of the masses of its constituents (8 protons
and 8 neutrons, in the unbound state), the equivalent energy of the oxygen
nucleus is less than that of the sum of the equivalent energies of its
constituents. If one wants to break the oxygen nucleus into 8 protons
and 8 neutrons, this extra energy ∆M c2, has to supplied. This energy
required Eb is related to the mass defect by
Eb = ∆ M c2 (13.8)
Example 13.3 Find the energy equivalent of one atomic mass unit,
first in Joules and then in MeV. Using this, express the mass defect
of 168O in MeV/c
2.
Solution1u = 1.6605 × 10⁻²⁷ kg
To convert it into energy units, we multiply it by c2
and find thatenergy equivalent = 1.6605 × 10–27 × (2.9979 × 108)2 kg m2/s2
= 1.4924 × 10 –10 J
=
10
19
1.4924 10eV
1.602 10
−
−
×
×
= 0.9315 × 10⁹ eV
= 931.5 MeVor, 1u = 931.5 MeV/c2
For 16
8 O , ∆M = 0.13691 u = 0.13691×931.5 MeV/c 2
= 127.5 MeV/c2
The energy needed to separate 168O into its constituents is thus
127.5 MeV/c2.
If a certain number of neutrons and protons are brought together to
form a nucleus of a certain charge and mass, an energy Eb will be released
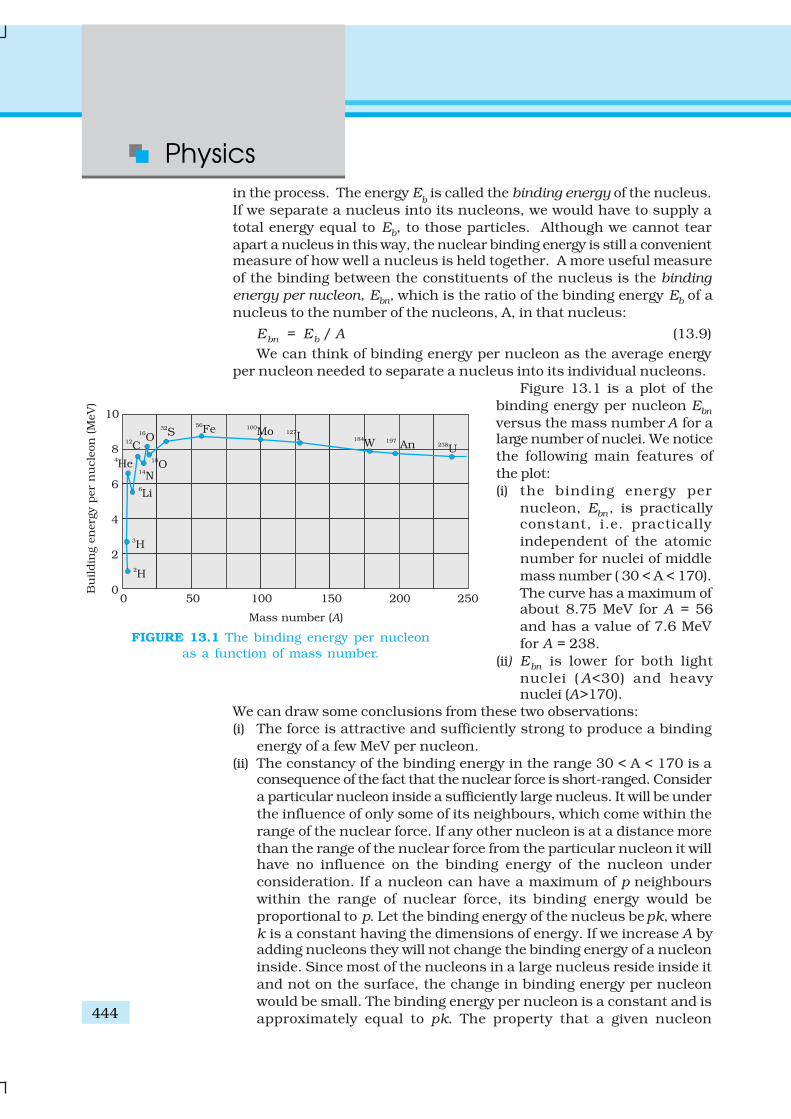
Physics
444
in the process. The energy Eb is called the binding energy of the nucleus.
If we separate a nucleus into its nucleons, we would have to supply a
total energy equal to Eb, to those particles. Although we cannot tear
apart a nucleus in this way, the nuclear binding energy is still a convenientmeasure of how well a nucleus is held together. A more useful measure
of the binding between the constituents of the nucleus is the binding
energy per nucleon, Ebn, which is the ratio of the binding energy Eb of a
nucleus to the number of the nucleons, A, in that nucleus:
Ebn = Eb / A (13.9)
We can think of binding energy per nucleon as the average energy
per nucleon needed to separate a nucleus into its individual nucleons.
Figure 13.1 is a plot of the
binding energy per nucleon Ebn
versus the mass number A for alarge number of nuclei. We notice
the following main features of
the plot:
(i) the binding energy per
nucleon, Ebn, is practicallyconstant, i.e. practically
independent of the atomic
number for nuclei of middle
mass number ( 30 < A < 170).
The curve has a maximum ofabout 8.75 MeV for A = 56
and has a value of 7.6 MeV
for A = 238.
(ii) Ebn is lower for both light
nuclei ( A<30) and heavynuclei (A>170).
We can draw some conclusions from these two observations:
(i) The force is attractive and sufficiently strong to produce a binding
energy of a few MeV per nucleon.
(ii) The constancy of the binding energy in the range 30 < A < 170 is aconsequence of the fact that the nuclear force is short-ranged. Consider
a particular nucleon inside a sufficiently large nucleus. It will be under
the influence of only some of its neighbours, which come within the
range of the nuclear force. If any other nucleon is at a distance more
than the range of the nuclear force from the particular nucleon it willhave no influence on the binding energy of the nucleon under
consideration. If a nucleon can have a maximum of p neighbours
within the range of nuclear force, its binding energy would be
proportional to p. Let the binding energy of the nucleus be pk, where
k is a constant having the dimensions of energy. If we increase A byadding nucleons they will not change the binding energy of a nucleon
inside. Since most of the nucleons in a large nucleus reside inside it
and not on the surface, the change in binding energy per nucleon
would be small. The binding energy per nucleon is a constant and is
approximately equal to pk. The property that a given nucleon
FIGURE 13.1 The binding energy per nucleon
as a function of mass number.

445
Nuclei
influences only nucleons close to it is also referred to as saturation
property of the nuclear force.
(iii) A very heavy nucleus, say A = 240, has lower binding energy per
nucleon compared to that of a nucleus with A = 120. Thus if a
nucleus A = 240 breaks into two A = 120 nuclei, nucleons get moretightly bound. This implies energy would be released in the process.
It has very important implications for energy production through
fission, to be discussed later in Section 13.7.1.
(iv) Consider two very light nuclei (A ≤10) joining to form a heavier
nucleus. The binding energy per nucleon of the fused heavier nucleiis more than the binding energy per nucleon of the lighter nuclei.
This means that the final system is more tightly bound than the initial
system. Again energy would be released in such a process of
fusion. This is the energy source of sun, to be discussed later in
Section 13.7.3.
13.5 NUCLEAR FORCE
The force that determines the motion of atomic electrons is the familiar
Coulomb force. In Section 13.4, we have seen that for average mass
nuclei the binding energy per nucleon is approximately 8 MeV, which is
much larger than the binding energy in atoms. Therefore, to bind a
nucleus together there must be a strong attractive force of a totally
different kind. It must be strong enough to overcome the repulsion
between the (positively charged) protons and to bind both protons and
neutrons into the tiny nuclear volume. We have already seen
that the constancy of binding energy per nucleon can be
understood in terms of its short-range. Many features of the
nuclear binding force are summarised below. These are
obtained from a variety of experiments carried out during 1930
to 1950.
(i) The nuclear force is much stronger than the Coulomb force
acting between charges or the gravitational forces between
masses. The nuclear binding force has to dominate over
the Coulomb repulsive force between protons inside the
nucleus. This happens only because the nuclear force is
much stronger than the coulomb force. The gravitational
force is much weaker than even Coulomb force.
(ii) The nuclear force between two nucleons falls rapidly to
zero as their distance is more than a few femtometres. This
leads to saturation of forces in a medium or a large-sized
nucleus, which is the reason for the constancy of the
binding energy per nucleon.
A rough plot of the potential energy between two nucleons
as a function of distance is shown in the Fig. 13.2. The
potential energy is a minimum at a distance r0 of about
0.8 fm. This means that the force is attractive for distances larger
than 0.8 fm and repulsive if they are separated by distances less
than 0.8 fm.
FIGURE 13.2 Potential energy
of a pair of nucleons as afunction of their separation.
For a separation greaterthan r
0, the force is attractive
and for separations less
than r0, the force isstrongly repulsive.
Physics
446
(iii) The nuclear force between neutron-neutron, proton-neutron and
proton-proton is approximately the same. The nuclear force does not
depend on the electric charge.
Unlike Coulomb’s law or the Newton’s law of gravitation there is no
simple mathematical form of the nuclear force.
13.6 RADIOACTIVITY
A. H. Becquerel discovered radioactivity in 1896 purely by accident. While
studying the fluorescence and phosphorescence of compounds irradiated
with visible light, Becquerel observed an interesting phenomenon. Afterilluminating some pieces of uranium-potassium sulphate with visible
light, he wrapped them in black paper and separated the package from a
photographic plate by a piece of silver. When, after several hours of
exposure, the photographic plate was developed, it showed blackening
due to something that must have been emitted by the compound andwas able to penetrate both black paper and the silver.
Experiments performed subsequently showed that radioactivity was
a nuclear phenomenon in which an unstable nucleus undergoes a decay.
This is referred to as radioactive decay. Three types of radioactive decay
occur in nature :
(i) α-decay in which a helium nucleus 4
2He is emitted;
(ii) β-decay in which electrons or positrons (particles with the same mass
as electrons, but with a charge exactly opposite to that of electron)
are emitted;
(iii) γ-decay in which high energy (hundreds of keV or more) photons are
emitted.
Each of these decay will be considered in subsequent sub-sections.
13.6.1 Law of radioactive decay
In any radioactive sample, which undergoes α, β or γ-decay, it is found
that the number of nuclei undergoing the decay per unit time is
proportional to the total number of nuclei in the sample. If N is the
number of nuclei in the sample and ∆N undergo decay in time ∆t then
NN
t
∆∝
∆
or, ∆N/∆t = λN, (13.10)
where λ is called the radioactive decay constant or disintegration constant.
The change in the number of nuclei in the sample* is dN = – ∆N in
time ∆t. Thus the rate of change of N is (in the limit ∆t → 0)
d–
d
NN
tλ=
* ∆N is the number of nuclei that decay, and hence is always positive. dN is thechange in N, which may have either sign. Here it is negative, because out of
original N nuclei, ∆N have decayed, leaving (N–∆N) nuclei.
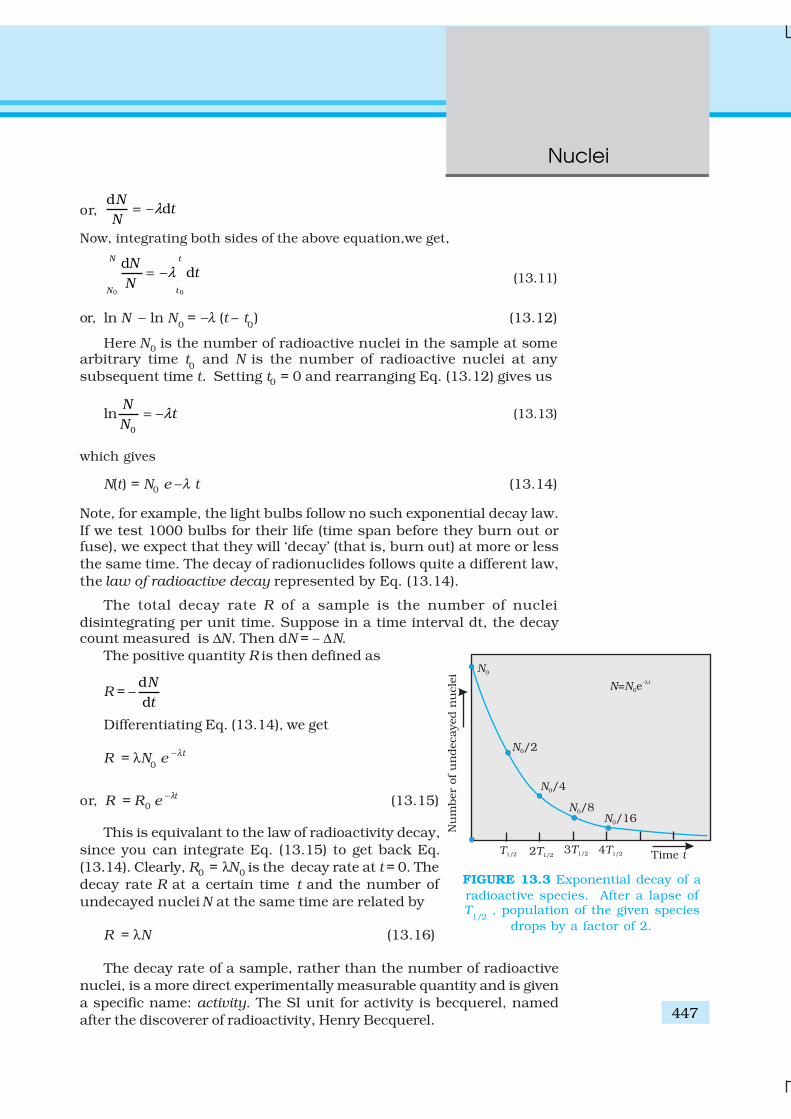
447
Nuclei
or, d
– dN
tN
λ=
Now, integrating both sides of the above equation,we get,
0 0
dd
N t
N t
Nt
Nλ= − (13.11)
or, ln N − ln N0 = −λ (t – t
0) (13.12)
Here N0 is the number of radioactive nuclei in the sample at somearbitrary time t
0 and N is the number of radioactive nuclei at any
subsequent time t. Setting t0 = 0 and rearranging Eq. (13.12) gives us
ln0
Nt
Nλ= − (13.13)
which gives
N(t) = N0 e −λ t (13.14)
Note, for example, the light bulbs follow no such exponential decay law.
If we test 1000 bulbs for their life (time span before they burn out orfuse), we expect that they will ‘decay’ (that is, burn out) at more or less
the same time. The decay of radionuclides follows quite a different law,
the law of radioactive decay represented by Eq. (13.14).
The total decay rate R of a sample is the number of nuclei
disintegrating per unit time. Suppose in a time interval dt, the decaycount measured is ∆N. Then dN = – ∆N.
The positive quantity R is then defined as
R = –d
d
N
t
Differentiating Eq. (13.14), we get
R = λN0 e
−λt
or, R = R0 e –λt (13.15)
This is equivalant to the law of radioactivity decay,
since you can integrate Eq. (13.15) to get back Eq.
(13.14). Clearly, R0 = λN0 is the decay rate at t = 0. The
decay rate R at a certain time t and the number of
undecayed nuclei N at the same time are related by
R = λN (13.16)
The decay rate of a sample, rather than the number of radioactive
nuclei, is a more direct experimentally measurable quantity and is given
a specific name: activity. The SI unit for activity is becquerel, named
after the discoverer of radioactivity, Henry Becquerel.
FIGURE 13.3 Exponential decay of a
radioactive species. After a lapse ofT
1/2 , population of the given species
drops by a factor of 2.
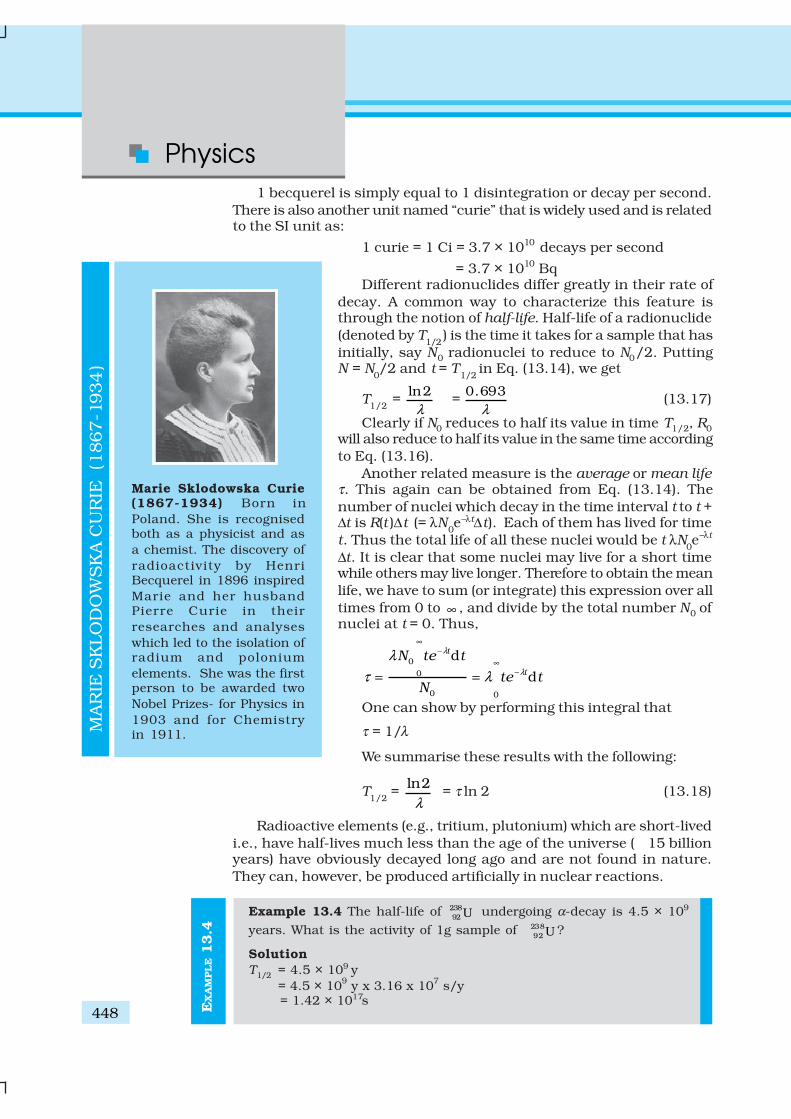
Physics
448 EX
AM
PLE 1
3.4
1 becquerel is simply equal to 1 disintegration or decay per second.
There is also another unit named “curie” that is widely used and is relatedto the SI unit as:
1 curie = 1 Ci = 3.7 × 10¹⁰ decays per second
= 3.7 × 10¹⁰ BqDifferent radionuclides differ greatly in their rate of
decay. A common way to characterize this feature isthrough the notion of half-life. Half-life of a radionuclide
(denoted by T1/2
) is the time it takes for a sample that has
initially, say N0 radionuclei to reduce to N0/2. PuttingN = N
0/2 and t = T
1/2 in Eq. (13.14), we get
T1/2
= ln2
λ =
0.693
λ(13.17)
Clearly if N0 reduces to half its value in time T1/2, R0
will also reduce to half its value in the same time according
to Eq. (13.16).
Another related measure is the average or mean lifeτ. This again can be obtained from Eq. (13.14). The
number of nuclei which decay in the time interval t to t +∆t is R(t )∆t (= λN
0e–λt∆t). Each of them has lived for time
t. Thus the total life of all these nuclei would be t λN0e–λt
∆t. It is clear that some nuclei may live for a short timewhile others may live longer. Therefore to obtain the mean
life, we have to sum (or integrate) this expression over all
times from 0 to ∞ , and divide by the total number N0 ofnuclei at t = 0. Thus,
–
0
–0
0 0
d
d
t
t
N te t
te tN
λ
λ
λ
τ λ
∞
∞
= =
One can show by performing this integral that
τ = 1/λ
We summarise these results with the following:
T1/2
= ln2
λ = τ ln 2 (13.18)
Radioactive elements (e.g., tritium, plutonium) which are short-lived
i.e., have half-lives much less than the age of the universe ( 15 billionyears) have obviously decayed long ago and are not found in nature.
They can, however, be produced artificially in nuclear reactions.
Example 13.4 The half-life of 238
92 U undergoing α-decay is 4.5 × 10⁹
years. What is the activity of 1g sample of 238
92 U ?
Solution
T1/2 = 4.5 × 10⁹ y
= 4.5 × 109 y x 3.16 x 10
7 s/y
= 1.42 × 10¹⁷s
MA
RIE
SK
LO
DO
WS
KA
CU
RIE
(1
867-1
934
)
Marie Sklodowska Curie(1867-1934) Born in
Poland. She is recognisedboth as a physicist and as
a chemist. The discovery of
radioactivity by HenriBecquerel in 1896 inspired
Marie and her husbandPierre Curie in their
researches and analyses
which led to the isolation ofradium and polonium
elements. She was the firstperson to be awarded two
Nobel Prizes- for Physics in
1903 and for Chemistryin 1911.
449
Nuclei
EX
AM
PLE 1
3.5
EX
AM
PLE 1
3.4
One k mol of any isotope contains Avogadro’s number of atoms, and
so 1g of 23892 U contains
–3
1kmol
238 10× × 6.025 × 1026 atoms/kmol
= 25.3 × 10²⁰
atoms.The decay rate R is
R = λN
= 1/ 2
0.693N
T =
201
17
0.693 25.3 10
1.42 10s−
× ×
×
= 1.23 × 10⁴ s–1
= 1.23 × 10⁴ Bq
Example 13.5 Tritium has a half-life of 12.5 y undergoing beta decay.
What fraction of a sample of pure tritium will remain undecayedafter 25 y.
SolutionBy definition of half-life, half of the initial sample will remain
undecayed after 12.5 y. In the next 12.5 y, one-half of these nuclei
would have decayed. Hence, one fourth of the sample of the initial
pure tritium will remain undecayed.
13.6.2 Alpha decay
A well-known example of alpha decay is the decay of uranium 23892 U to
thorium 23490 Th with the emission of a helium nucleus 4
2He
23892U→ 234
90Th + 42He (α-decay) (13.19)
In α-decay, the mass number of the product nucleus (daughter
nucleus) is four less than that of the decaying nucleus (parent nucleus),
while the atomic number decreases by two. In general, α-decay of a parent
nucleus A
Z X results in a daughter nucleus A 4
Z 2Y−
−
A
Z X → A 4
Z 2Y−
− + 4
2He (13.20)
From Einstein’s mass-energy equivalance relation [Eq. (13.6)] andenergy conservation, it is clear that this spontaneous decay is possible
only when the total mass of the decay products is less than the mass of
the initial nucleus. This difference in mass appears as kinetic energy of
the products. By referring to a table of nuclear masses, one can check
that the total mass of 234
90Th and 4
2He is indeed less than that of 238
92U .
The disintegration energy or the Q-value of a nuclear reaction is the
difference between the initial mass energy and the total mass energy of
the decay products. For α-decay
Q = (mX – mY – mHe) c2 (13.21)
Q is also the net kinetic energy gained in the process or, if the initial
nucleus X is at rest, the kinetic energy of the products. Clearly, Q> 0 for
exothermic processes such as α-decay.
Physics
450
EX
AM
PLE 1
3.6
Example 13.6 We are given the following atomic masses:238
92 U = 238.05079 u 4
2 He = 4.00260 u234
90 Th = 234.04363 u 1
1H = 1.00783 u
23791
Pa = 237.05121 u
Here the symbol Pa is for the element protactinium (Z = 91).
(a) Calculate the energy released during the alpha decay of 23892
U .
(b) Show that 23892
U can not spontaneously emit a proton.
Solution
(a) The alpha decay of 238
92 U is given by Eq. (13.20). The energy released
in this process is given byQ = (MU – MTh – MHe) c
2
Substituting the atomic masses as given in the data, we findQ = (238.05079 – 234.04363 – 4.00260)u × c 2
= (0.00456 u) c 2
= (0.00456 u) (931.5 MeV/u) = 4.25 MeV.
(b) If 23892
U spontaneously emits a proton, the decay process would be
238
92 U → 237
91Pa + 1
1H
The Q for this process to happen is= (MU – MPa – MH ) c 2
= (238.05079 – 237.05121 – 1.00783) u × c 2
= (– 0.00825 u) c2
= – (0.00825 u)(931.5 MeV/u)
= – 7.68 MeVThus, the Q of the process is negative and therefore it cannot proceed
spontaneously. We will have to supply an energy of 7.68 MeV to a238
92 U nucleus to make it emit a proton.
13.6.3 Beta decay
In beta decay, a nucleus spontaneously emits an electron (β −−−−− decay) or a
positron (β+ decay). A common example of β −−−−− decay is
32 32
15 16P S e ν−→ + + (13.22)
and that of β+ decay is
22 22
11 10Na Ne e ν+→ + + (13.23)
The decays are governed by the Eqs. (13.14) and (13.15), so that one
can never predict which nucleus will undergo decay, but one can
characterize the decay by a half-life T1/2 . For example, T1/2 for the decaysabove is respectively 14.3 d and 2.6y. The emission of electron in β −−−−− decay
is accompanied by the emission of an antineutrino (ν ); in β+ decay, instead,
a neutrino (ν) is generated. Neutrinos are neutral particles with very small
(possiblly, even zero) mass compared to electrons. They have only weak
interaction with other particles. They are, therefore, very difficult to detect,
since they can penetrate large quantity of matter (even earth) without anyinteraction.
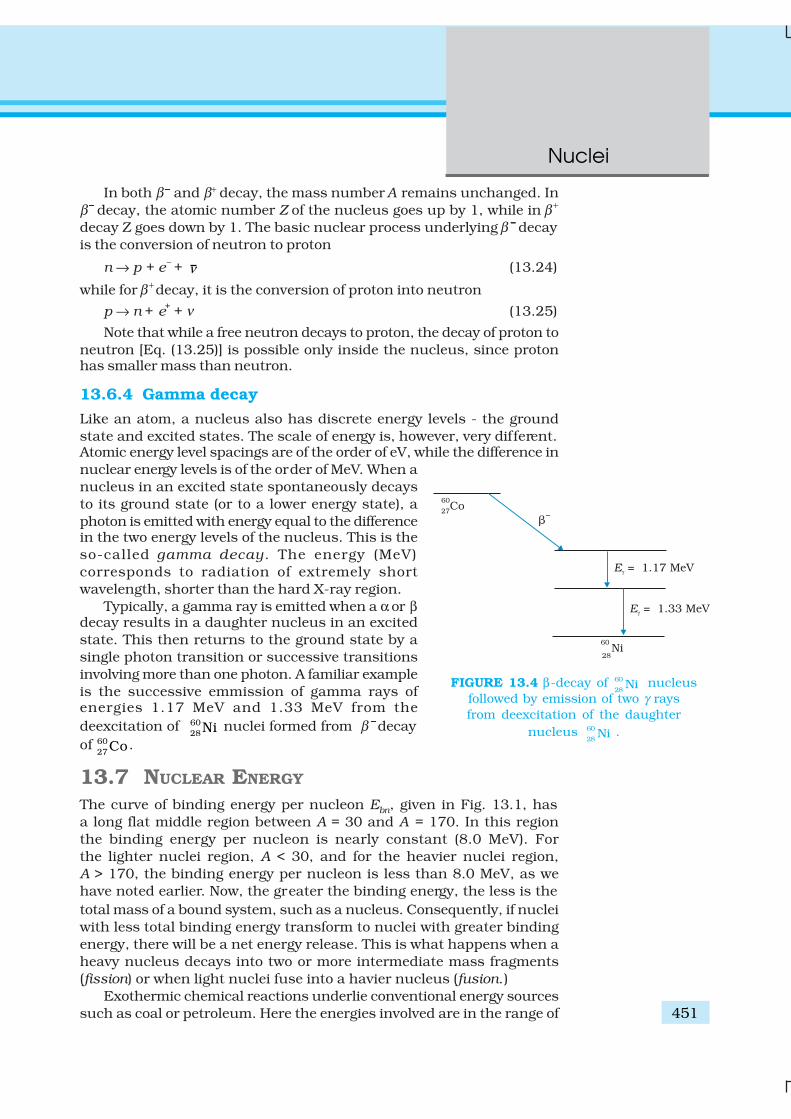
451
Nuclei
In both β −−−−− and β+ decay, the mass number A remains unchanged. In
β −−−−− decay, the atomic number Z of the nucleus goes up by 1, while in β +
decay Z goes down by 1. The basic nuclear process underlying β −−−−− decay
is the conversion of neutron to proton
n → p + e– + ν (13.24)
while for β + decay, it is the conversion of proton into neutron
p → n + e+ + ν (13.25)
Note that while a free neutron decays to proton, the decay of proton to
neutron [Eq. (13.25)] is possible only inside the nucleus, since protonhas smaller mass than neutron.
13.6.4 Gamma decay
Like an atom, a nucleus also has discrete energy levels - the ground
state and excited states. The scale of energy is, however, very different.Atomic energy level spacings are of the order of eV, while the difference in
nuclear energy levels is of the order of MeV. When a
nucleus in an excited state spontaneously decays
to its ground state (or to a lower energy state), a
photon is emitted with energy equal to the differencein the two energy levels of the nucleus. This is the
so-called gamma decay. The energy (MeV)
corresponds to radiation of extremely short
wavelength, shorter than the hard X-ray region.
Typically, a gamma ray is emitted when a α or βdecay results in a daughter nucleus in an excited
state. This then returns to the ground state by a
single photon transition or successive transitions
involving more than one photon. A familiar example
is the successive emmission of gamma rays ofenergies 1.17 MeV and 1.33 MeV from the
deexcitation of 60
28Ni nuclei formed from β −−−−− decay
of 60
27Co.
13.7 NUCLEAR ENERGY
The curve of binding energy per nucleon Ebn, given in Fig. 13.1, has
a long flat middle region between A = 30 and A = 170. In this region
the binding energy per nucleon is nearly constant (8.0 MeV). For
the lighter nuclei region, A < 30, and for the heavier nuclei region,
A > 170, the binding energy per nucleon is less than 8.0 MeV, as we
have noted earlier. Now, the greater the binding energy, the less is the
total mass of a bound system, such as a nucleus. Consequently, if nuclei
with less total binding energy transform to nuclei with greater binding
energy, there will be a net energy release. This is what happens when a
heavy nucleus decays into two or more intermediate mass fragments
(fission) or when light nuclei fuse into a havier nucleus (fusion.)
Exothermic chemical reactions underlie conventional energy sources
such as coal or petroleum. Here the energies involved are in the range of
FIGURE 13.4 β-decay of 28
60Ni nucleus
followed by emission of two γ rays
from deexcitation of the daughter
nucleus 28
60Ni .
Physics
452
electron volts. On the other hand, in a nuclear reaction, the energy release
is of the order of MeV. Thus for the same quantity of matter, nuclear
sources produce a million times more energy than a chemical source.
Fission of 1 kg of uranium, for example, generates 1014 J of energy;
compare it with burning of 1 kg of coal that gives 107 J.
13.7.1 Fission
New possibilities emerge when we go beyond natural radioactive decaysand study nuclear reactions by bombarding nuclei with other nuclear
particles such as proton, neutron, α-particle, etc.
A most important neutron-induced nuclear reaction is fission. An
example of fission is when a uranium isotope 235
92U bombarded with a
neutron breaks into two intermediate mass nuclear fragments
1 235 236 144 89 1
0 92 92 56 36 0n U U Ba Kr 3 n+ → → + + (13.26)
The same reaction can produce other pairs of intermediate mass
fragments
1 235 236 133 99 1
0 92 92 51 41 0n U U Sb Nb 4 n+ → → + + (13.27)
Or, as another example,
1 235 140 94 1
0 92 54 38 0n U Xe Sr 2 n+ → + + (13.28)
The fragment products are radioactive nuclei; they emit β particles in
succession to achieve stable end products.
The energy released (the Q value ) in the fission reaction of nuclei like
uranium is of the order of 200 MeV per fissioning nucleus. This isestimated as follows:
Let us take a nucleus with A = 240 breaking into two fragments each
of A = 120. Then
Ebn for A = 240 nucleus is about 7.6 MeV,
Ebn for the two A = 120 fragment nuclei is about 8.5 MeV.
∴ Gain in binding energy for nucleon is about 0.9 MeV.
Hence the total gain in binding energy is 240×0.9 or 216 MeV.
The disintegration energy in fission events first appears as the kinetic
energy of the fragments and neutrons. Eventually it is transferred to the
surrounding matter appearing as heat. The source of energy in nuclear
reactors, which produce electricity, is nuclear fission. The enormous
energy released in an atom bomb comes from uncontrolled nuclear fission.
We discuss some details in the next section how a nuclear reactor
functions.
13.7.2 Nuclear reactor
Notice one fact of great importance in the fission reactions given in Eqs.(13.26) to (13.28). There is a release of extra neutron (s) in the fission
process. Averagely, 2½ neutrons are released per fission of uranium
nucleus. It is a fraction since in some fission events 2 neutrons are
453
Nuclei
produced, in some 3, etc. The extra neutrons in turn can initiate fission
processes, producing still more neutrons, and so on. This leads to the
possibility of a chain reaction, as was first suggested by Enrico Fermi. If
the chain reaction is controlled suitably, we can get a steady energy
INDIA’S ATOMIC ENERGY PROGRAMME
The atomic energy programme in India was launched around the time of independenceunder the leadership of Homi J. Bhabha (1909-1966). An early historic achievement
was the design and construction of the first nuclear reactor in India (named Apsara)
which went critical on August 4, 1956. It used enriched uranium as fuel and water as
moderator. Following this was another notable landmark: the construction of CIRUS
(Canada India Research U.S.) reactor in 1960. This 40 MW reactor used natural uraniumas fuel and heavy water as moderator. Apsara and CIRUS spurred research in a wide
range of areas of basic and applied nuclear science. An important milestone in the first
two decades of the programme was the indigenous design and construction of the
plutonium plant at Trombay, which ushered in the technology of fuel reprocessing
(separating useful fissile and fertile nuclear materials from the spent fuel of a reactor) inIndia. Research reactors that have been subsequently commissioned include ZERLINA,
PURNIMA (I, II and III), DHRUVA and KAMINI. KAMINI is the country’s first large research
reactor that uses U-233 as fuel. As the name suggests, the primary objective of a research
reactor is not generation of power but to provide a facility for research on different aspects
of nuclear science and technology. Research reactors are also an excellent source forproduction of a variety of radioactive isotopes that find application in diverse fields:
industry, medicine and agriculture.
The main objectives of the Indian Atomic Energy programme are to provide safe and
reliable electric power for the country’s social and economic progress and to be self-
reliant in all aspects of nuclear technology. Exploration of atomic minerals in Indiaundertaken since the early fifties has indicated that India has limited reserves of uranium,
but fairly abundant reserves of thorium. Accordingly, our country has adopted a three-
stage strategy of nuclear power generation. The first stage involves the use of natural
uranium as a fuel, with heavy water as moderator. The Plutonium-239 obtained from
reprocessing of the discharged fuel from the reactors then serves as a fuel for the secondstage — the fast breeder reactors. They are so called because they use fast neutrons for
sustaining the chain reaction (hence no moderator is needed) and, besides generating
power, also breed more fissile species (plutonium) than they consume. The third stage,
most significant in the long term, involves using fast breeder reactors to produce fissile
Uranium-233 from Thorium-232 and to build power reactors based on them.India is currently well into the second stage of the programme and considerable
work has also been done on the third — the thorium utilisation — stage. The country
has mastered the complex technologies of mineral exploration and mining, fuel
fabrication, heavy water production, reactor design, construction and operation, fuel
reprocessing, etc. Pressurised Heavy Water Reactors (PHWRs) built at different sites inthe country mark the accomplishment of the first stage of the programme. India is now
more than self-sufficient in heavy water production. Elaborate safety measures both in
the design and operation of reactors, as also adhering to stringent standards of
radiological protection are the hallmark of the Indian Atomic Energy Programme.
Physics
454
output. This is what happens in a nuclear reactor. If the chain reaction is
uncontrolled, it leads to explosive energy output, as in a nuclear bomb.
There is, however, a hurdle in sustaining a chain reaction, as described
here. It is known experimentally that slow neutrons (thermal neutrons)
are much more likely to cause fission in 235
92 U than fast neutrons. Also
fast neutrons liberated in fission would escape instead of causing another
fission reaction.
The average energy of a neutron produced in fission of 235
92 U is 2 MeV.
These neutrons unless slowed down will escape from the reactor without
interacting with the uranium nuclei, unless a very large amount offissionable material is used for sustaining the chain reaction. What one
needs to do is to slow down the fast neutrons by elastic scattering with
light nuclei. In fact, Chadwick’s experiments showed that in an elastic
collision with hydrogen the neutron almost comes to rest and proton
carries away the energy. This is the same situation as when a marble hitshead-on an identical marble at rest. Therefore, in reactors, light nuclei
called moderators are provided along with the fissionable nuclei for slowing
down fast neutrons. The moderators commonly used are water, heavy
water (D2O) and graphite. The Apsara reactor at the Bhabha Atomic
Research Centre (BARC), Mumbai, uses water as moderator. The otherIndian reactors, which are used for power production, use heavy water
as moderator.
Because of the use of moderator, it is possible that the ratio, K, of
number of fission produced by a given generation of neutrons to the
number of fission of the preceeding generation may be greater than one.This ratio is called the multiplication factor; it is the measure of the growthrate of the neutrons in the reactor. For K = 1, the operation of the reactoris said to be critical, which is what we wish it to be for steady poweroperation. If K becomes greater than one, the reaction rate and the reactorpower increases exponentially. Unless the factor K is brought down veryclose to unity, the reactor will become supercritical and can even explode.The explosion of the Chernobyl reactor in Ukraine in 1986 is a sadreminder that accidents in a nuclear reactor can be catastrophic.
The reaction rate is controlled through control-rods made out ofneutron-absorbing material such as cadmium. In addition to control rods,reactors are provided with safety rods which, when required, can beinserted into the reactor and K can be reduced rapidly to less than unity.
The more abundant isotope 23892 U in naturally occurring uranium is
non-fissionable. When it captures a neutron, it produces the highlyradioactive plutonium through these reactions
238 239 239 –
92 92 93U + n U Np+e ν→ → +
239 239 –
93 94Np Pu+ e ν→ + (13.29)
Plutonium undergoes fission with slow neutrons.
Figure 13.5 shows the schematic diagram of a nuclear reactor basedon thermal neutron fission. The core of the reactor is the site of nuclear
Nu
cle
ar
po
wer
pla
nts
in
In
dia
http://w
ww
.npci
l.nic
.in/m
ain/A
llPro
ject
Oper
atio
nD
ispla
y.as
px
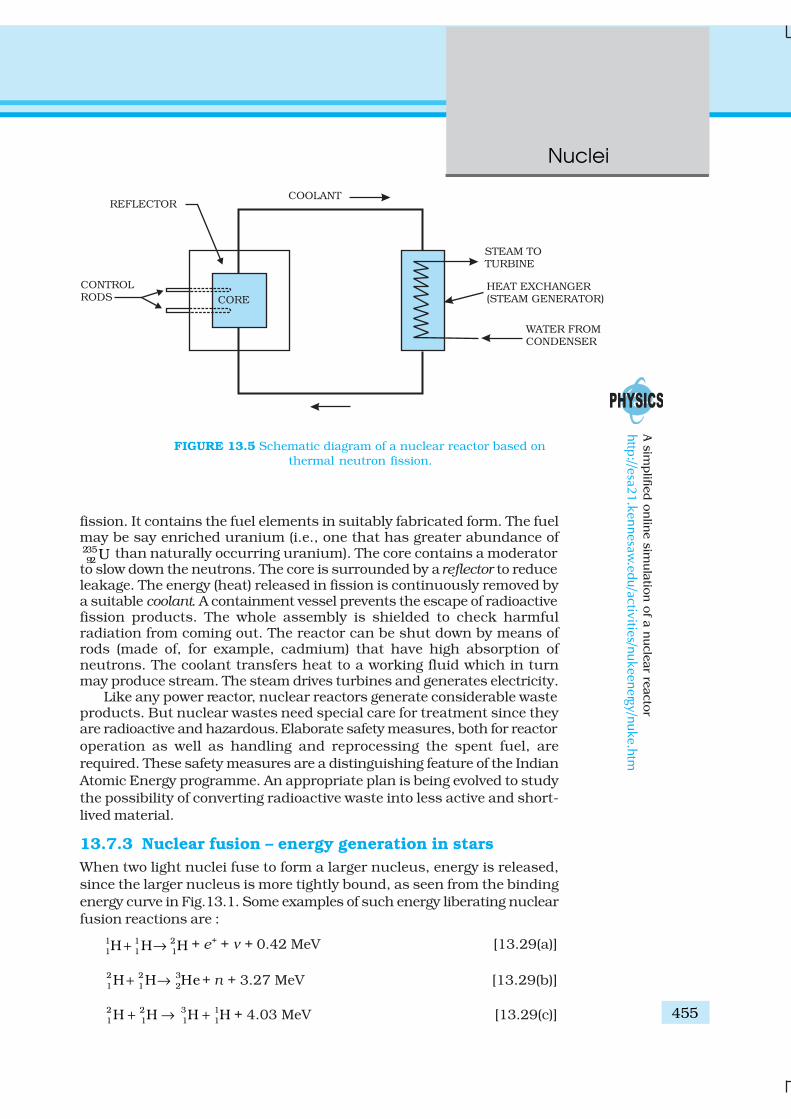
455
Nuclei
fission. It contains the fuel elements in suitably fabricated form. The fuelmay be say enriched uranium (i.e., one that has greater abundance of23592 U than naturally occurring uranium). The core contains a moderator
to slow down the neutrons. The core is surrounded by a reflector to reduceleakage. The energy (heat) released in fission is continuously removed bya suitable coolant. A containment vessel prevents the escape of radioactivefission products. The whole assembly is shielded to check harmfulradiation from coming out. The reactor can be shut down by means ofrods (made of, for example, cadmium) that have high absorption ofneutrons. The coolant transfers heat to a working fluid which in turnmay produce stream. The steam drives turbines and generates electricity.
Like any power reactor, nuclear reactors generate considerable wasteproducts. But nuclear wastes need special care for treatment since theyare radioactive and hazardous. Elaborate safety measures, both for reactor
operation as well as handling and reprocessing the spent fuel, are
required. These safety measures are a distinguishing feature of the Indian
Atomic Energy programme. An appropriate plan is being evolved to study
the possibility of converting radioactive waste into less active and short-
lived material.
13.7.3 Nuclear fusion – energy generation in stars
When two light nuclei fuse to form a larger nucleus, energy is released,
since the larger nucleus is more tightly bound, as seen from the binding
energy curve in Fig.13.1. Some examples of such energy liberating nuclear
fusion reactions are :
1 1 2
1 1 1H H H+ → + e+ + ν + 0.42 MeV [13.29(a)]
2 2 3
1 1 2H H He+ → + n + 3.27 MeV [13.29(b)]
2 2 3 1
1 1 1 1H H H H+ → + + 4.03 MeV [13.29(c)]
A s
imp
lified
on
line s
imu
latio
n o
f a n
ucle
ar re
acto
r
http
://esa21.ken
nesaw
.edu/activities/n
ukeen
ergy/nuke.h
tm
FIGURE 13.5 Schematic diagram of a nuclear reactor based on
thermal neutron fission.
Physics
456
In the first reaction, two protons combine to form a deuteron anda positron with a release of 0.42 MeV energy. In reaction [13.29(b)], twodeuterons combine to form the light isotope of helium. In reaction(13.29c), two deuterons combine to form a triton and a proton. Forfusion to take place, the two nuclei must come close enough so thatattractive short-range nuclear force is able to affect them. However,since they are both positively charged particles, they experience coulombrepulsion. They, therefore, must have enough energy to overcome thiscoulomb barrier. The height of the barrier depends on the charges andradii of the two interacting nuclei. It can be shown, for example, thatthe barrier height for two protons is ~ 400 keV, and is higher for nucleiwith higher charges. We can estimate the temperature at which twoprotons in a proton gas would (averagely) have enough energy toovercome the coulomb barrier:
(3/2)k T = K 400 keV, which gives T ~ 3 × 10⁹ K.When fusion is achieved by raising the temperature of the system so
that particles have enough kinetic energy to overcome the coulombrepulsive behaviour, it is called thermonuclear fusion.
Thermonuclear fusion is the source of energy output in the interiorof stars. The interior of the sun has a temperature of 1.5×10⁷ K, whichis considerably less than the estimated temperature required for fusionof particles of average energy. Clearly, fusion in the sun involves protonswhose energies are much above the average energy.
The fusion reaction in the sun is a multi-step process in which thehydrogen is burned into helium. Thus, the fuel in the sun is the hydrogenin its core. The proton-proton (p, p) cycle by which this occurs is
represented by the following sets of reactions:
1 1 21 1 1H H H+ → + e+ + ν + 0.42 MeV (i)
e+ + e – → γ + γ + 1.02 MeV (ii)
2 1 31 1 2H H He+ → + γ + 5.49 MeV (iii)
+ → + +3 3 4 1 12 2 2 1 1He He He H H+ 12.86 MeV (iv) (13.30)
For the fourth reaction to occur, the first three reactions must occur
twice, in which case two light helium nuclei unite to form ordinary helium
nucleus. If we consider the combination 2(i) + 2(ii) + 2(iii) +(iv), the net
effect is
1 4
1 24 H 2 He 2 6 26.7MeVe ν γ−+ → + + +
or 1 4
1 2(4 H 4 ) ( He 2 ) 2 6 26.7MeVe e ν γ− −+ → + + + + (13.31)
Thus, four hydrogen atoms combine to form an 4
2He atom with a
release of 26.7 MeV of energy.
Helium is not the only element that can be synthesized in the interior
of a star. As the hydrogen in the core gets depleted and becomes helium,
the core starts to cool. The star begins to collapse under its own gravity
457
Nuclei
which increases the temperature of the core. If this temperature increases
to about 108 K, fusion takes place again, this time of helium nuclei into
carbon. This kind of process can generate through fusion higher and
higher mass number elements. But elements more massive than those
near the peak of the binding energy curve in Fig. 13.1 cannot be soproduced.
The age of the sun is about 5×10⁹ y and it is estimated that there is
enough hydrogen in the sun to keep it going for another 5 billion years.
After that, the hydrogen burning will stop and the sun will begin to cool
and will start to collapse under gravity, which will raise the coretemperature. The outer envelope of the sun will expand, turning it into
the so called red giant.
NUCLEAR HOLOCAUST
In a single uranium fission about 0.9×235 MeV (≈200 MeV) of energy is liberated. If
each nucleus of about 50 kg of 235U undergoes fission the amount of energy involved is
about 4 × 10¹⁵J. This energy is equivalent to about 20,000 tons of TNT, enough for asuperexplosion. Uncontrolled release of large nuclear energy is called an atomic explosion.
On August 6, 1945 an atomic device was used in warfare for the first time. The US
dropped an atom bomb on Hiroshima, Japan. The explosion was equivalent to 20,000
tons of TNT. Instantly the radioactive products devastated 10 sq km of the city which
had 3,43,000 inhabitants. Of this number 66,000 were killed and 69,000 were injured;
more than 67% of the city’s structures were destroyed.High temperature conditions for fusion reactions can be created by exploding a fission
bomb. Super-explosions equivalent to 10 megatons of explosive power of TNT were tested
in 1954. Such bombs which involve fusion of isotopes of hydrogen, deuterium and tritium
are called hydrogen bombs. It is estimated that a nuclear arsenal sufficient to destroy
every form of life on this planet several times over is in position to be triggered by thepress of a button. Such a nuclear holocaust will not only destroy the life that exists now
but its radioactive fallout will make this planet unfit for life for all times. Scenarios based
on theoretical calculations predict a long nuclear winter, as the radioactive waste will
hang like a cloud in the earth’s atmosphere and will absorb the sun’s radiation.
13.7.4 Controlled thermonuclear fusion
The natural thermonuclear fusion process in a star is replicated in a
thermonuclear fusion device. In controlled fusion reactors, the aim is to
generate steady power by heating the nuclear fuel to a temperature in therange of 108 K. At these temperatures, the fuel is a mixture of positive
ions and electrons (plasma). The challenge is to confine this plasma, since
no container can stand such a high temperature. Several countries
around the world including India are developing techniques in this
connection. If successful, fusion reactors will hopefully supply almostunlimited power to humanity.
Physics
458 EX
AM
PLE 1
3.7
Example 13.7 Answer the following questions:
(a) Are the equations of nuclear reactions (such as those given in
Section 13.7) ‘balanced’ in the sense a chemical equation (e.g.,2H
2 + O
2→ 2 H
2O) is? If not, in what sense are they balanced on
both sides?
(b) If both the number of protons and the number of neutrons areconserved in each nuclear reaction, in what way is mass converted
into energy (or vice-versa) in a nuclear reaction?
(c) A general impression exists that mass-energy interconversion
takes place only in nuclear reaction and never in chemical
reaction. This is strictly speaking, incorrect. Explain.
Solution
(a) A chemical equation is balanced in the sense that the number of
atoms of each element is the same on both sides of the equation.
A chemical reaction merely alters the original combinations ofatoms. In a nuclear reaction, elements may be transmuted. Thus,
the number of atoms of each element is not necessarily conserved
in a nuclear reaction. However, the number of protons and the
number of neutrons are both separately conserved in a nuclear
reaction. [Actually, even this is not strictly true in the realm ofvery high energies – what is strictly conserved is the total charge
and total ‘baryon number’. We need not pursue this matter here.]
In nuclear reactions (e.g., Eq. 13.26), the number of protons and
the number of neutrons are the same on the two sides of the equation.
(b) We know that the binding energy of a nucleus gives a negativecontribution to the mass of the nucleus (mass defect). Now, since
proton number and neutron number are conserved in a nuclear
reaction, the total rest mass of neutrons and protons is the same
on either side of a reaction. But the total binding energy of nuclei
on the left side need not be the same as that on the right handside. The difference in these binding energies appears as energy
released or absorbed in a nuclear reaction. Since binding energy
contributes to mass, we say that the difference in the total mass
of nuclei on the two sides get converted into energy or vice-versa.
It is in these sense that a nuclear reaction is an example of mass-energy interconversion.
(c) From the point of view of mass-energy interconversion, a chemical
reaction is similar to a nuclear reaction in principle. The energy
released or absorbed in a chemical reaction can be traced to the
difference in chemical (not nuclear) binding energies of atoms andmolecules on the two sides of a reaction. Since, strictly speaking,
chemical binding energy also gives a negative contribution (mass
defect) to the total mass of an atom or molecule, we can equally
well say that the difference in the total mass of atoms or molecules,
on the two sides of the chemical reaction gets converted into energyor vice-versa. However, the mass defects involved in a chemical
reaction are almost a million times smaller than those in a nuclear
reaction.This is the reason for the general impression, (which is
incorrect) that mass-energy interconversion does not take place
in a chemical reaction.

459
Nuclei
SUMMARY
1. An atom has a nucleus. The nucleus is positively charged. The radius
of the nucleus is smaller than the radius of an atom by a factor of
104. More than 99.9% mass of the atom is concentrated in the nucleus.
2. On the atomic scale, mass is measured in atomic mass units (u). By
definition, 1 atomic mass unit (1u) is 1/12th mass of one atom of 12C;
1u = 1.660563 × 10⁻²⁷ kg.
3. A nucleus contains a neutral particle called neutron. Its mass is almost
the same as that of proton
4. The atomic number Z is the number of protons in the atomic nucleus
of an element. The mass number A is the total number of protons and
neutrons in the atomic nucleus; A = Z+N; Here N denotes the number
of neutrons in the nucleus.
A nuclear species or a nuclide is represented as XAZ , where X is the
chemical symbol of the species.
Nuclides with the same atomic number Z, but different neutron number
N are called isotopes. Nuclides with the same A are isobars and those
with the same N are isotones.
Most elements are mixtures of two or more isotopes. The atomic mass
of an element is a weighted average of the masses of its isotopes. The
masses are the relative abundances of the isotopes.
5. A nucleus can be considered to be spherical in shape and assigned a
radius. Electron scattering experiments allow determination of the
nuclear radius; it is found that radii of nuclei fit the formula
R = R0 A1/3,
where R0 = a constant = 1.2 fm. This implies that the nuclear density
is independent of A. It is of the order of 1017 kg/m3.
6. Neutrons and protons are bound in a nucleus by the short-range strong
nuclear force. The nuclear force does not distinguish between neutron
and proton.
7. The nuclear mass M is always less than the total mass, Σm, of its
constituents. The difference in mass of a nucleus and its constituents
is called the mass defect,
∆M = (Z mp + (A – Z )m
n) – M
Using Einstein’s mass energy relation, we express this mass difference
in terms of energy as
∆Eb = ∆M c2
The energy ∆Eb represents the binding energy of the nucleus. In the
mass number range A = 30 to 170, the binding energy per nucleon is
nearly constant, about 8 MeV/nucleon.
8. Energies associated with nuclear processes are about a million times
larger than chemical process.
9. The Q-value of a nuclear process is
Q = final kinetic energy – initial kinetic energy.
Due to conservation of mass-energy, this is also,
Q = (sum of initial masses – sum of final masses)c2
10. Radioactivity is the phenomenon in which nuclei of a given species
transform by giving out α or β or γ rays; α-rays are helium nuclei;
Physics
460
β-rays are electrons. γ-rays are electromagnetic radiation of wavelengths
shorter than X-rays;
11. Law of radioactive decay : N (t) = N(0) e–λt
where λ is the decay constant or disintegration constant.
The half-life T1/2
of a radionuclide is the time in which N has been
reduced to one-half of its initial value. The mean life τ is the time at
which N has been reduced to e–1 of its initial value
1/2
ln2ln 2T τ
λ= =
12. Energy is released when less tightly bound nuclei are transmuted into
more tightly bound nuclei. In fission, a heavy nucleus like 23592 U breaks
into two smaller fragments, e.g., 235 1 133 99 1
92 0 51 41 0U+ n Sb Nb + 4 n→ +
13. The fact that more neutrons are produced in fission than are consumed
gives the possibility of a chain reaction with each neutron that is
produced triggering another fission. The chain reaction is uncontrolled
and rapid in a nuclear bomb explosion. It is controlled and steady in
a nuclear reactor. In a reactor, the value of the neutron multiplication
factor k is maintained at 1.
14. In fusion, lighter nuclei combine to form a larger nucleus. Fusion of
hydrogen nuclei into helium nuclei is the source of energy of all stars
including our sun.
Physical Quantity Symbol Dimensions Units Remarks
Atomic mass unit [M] u Unit of mass for
expressing atomic or
nuclear masses. Oneatomic mass unit equals
1/12th of the mass of
12C
atom.
Disintegration or λ [T –1 ] s–1
decay constant
Half-life T1/2
[T ] s Time taken for the decay
of one-half of the initialnumber of nuclei present
in a radioactive sample.
Mean life τ [T ] s Time at which number ofnuclei has been reduced to
e–1 of its initial value
Activity of a radio- R [T–1] Bq Measure of the activity
active sample of a radioactive source.
POINTS TO PONDER
1. The density of nuclear matter is independent of the size of the nucleus.
The mass density of the atom does not follow this rule.
2. The radius of a nucleus determined by electron scattering is found to
be slightly different from that determined by alpha-particle scattering.
461
Nuclei
This is because electron scattering senses the charge distribution of
the nucleus, whereas alpha and similar particles sense the nuclear
matter.
3. After Einstein showed the equivalence of mass and energy, E = mc 2,
we cannot any longer speak of separate laws of conservation of mass
and conservation of energy, but we have to speak of a unified law of
conservation of mass and energy. The most convincing evidence that
this principle operates in nature comes from nuclear physics. It is
central to our understanding of nuclear energy and harnessing it as a
source of power. Using the principle, Q of a nuclear process (decay or
reaction) can be expressed also in terms of initial and final masses.
4. The nature of the binding energy (per nucleon) curve shows that
exothermic nuclear reactions are possible, when two light nuclei fuse
or when a heavy nucleus undergoes fission into nuclei with intermediate
mass.
5. For fusion, the light nuclei must have sufficient initial energy to
overcome the coulomb potential barrier. That is why fusion requires
very high temperatures.
6. Although the binding energy (per nucleon) curve is smooth and slowly
varying, it shows peaks at nuclides like 4He, 16O etc. This is considered
as evidence of atom-like shell structure in nuclei.
7. Electrons and positron are a particle-antiparticle pair. They are
identical in mass; their charges are equal in magnitude and opposite.
(It is found that when an electron and a positron come together, they
annihilate each other giving energy in the form of gamma-ray photons.)
8. In â--decay (electron emission), the particle emitted along with electron
is anti-neutrino (ν ). On the other hand, the particle emitted in β+-
decay (positron emission) is neutrino (ν). Neutrino and anti-neutrino
are a particle-antiparticle pair. There are anti particles associated
with every particle. What should be antiproton which is the anti
particle of the proton?
9. A free neutron is unstable ( –n p e ν→ + + ). But a similar free proton
decay is not possible, since a proton is (slightly) lighter than a neutron.
10. Gamma emission usually follows alpha or beta emission. A nucleus
in an excited (higher) state goes to a lower state by emitting a gamma
photon. A nucleus may be left in an excited state after alpha or beta
emission. Successive emission of gamma rays from the same nucleus
(as in case of 60Ni, Fig. 13.4) is a clear proof that nuclei also have
discrete energy levels as do the atoms.
11. Radioactivity is an indication of the instability of nuclei. Stability
requires the ratio of neutron to proton to be around 1:1 for light
nuclei. This ratio increases to about 3:2 for heavy nuclei. (More
neutrons are required to overcome the effect of repulsion among the
protons.) Nuclei which are away from the stability ratio, i.e., nuclei
which have an excess of neutrons or protons are unstable. In fact,
only about 10% of knon isotopes (of all elements), are stable. Others
have been either artificially produced in the laboratory by bombarding
α, p, d, n or other particles on targets of stable nuclear species or
identified in astronomical observations of matter in the universe.
Physics
462
EXERCISES
You may find the following data useful in solving the exercises:
e = 1.6×10⁻¹⁹C N = 6.023×10²³ per mole
1/(4πε0) = 9 × 10⁹ N m
2/C
2k = 1.381×10
–23J
0K
–1
1 MeV = 1.6×10⁻¹³J 1 u = 931.5 MeV/c2
1 year = 3.154×10⁷ s
mH = 1.007825 u mn = 1.008665 u
m( 42He ) = 4.002603 u me = 0.000548 u
13.1 (a) Two stable isotopes of lithium 6
3Li and 7
3Li have respective
abundances of 7.5% and 92.5%. These isotopes have masses6.01512 u and 7.01600 u, respectively. Find the atomic mass
of lithium.
(b) Boron has two stable isotopes, 105B and 11
5B. Their respective
masses are 10.01294 u and 11.00931 u, and the atomic mass of
boron is 10.811 u. Find the abundances of 105B and 11
5B .
13.2 The three stable isotopes of neon: 20 21 22
10 10 10Ne, Ne and Ne have
respective abundances of 90.51%, 0.27% and 9.22%. The atomic
masses of the three isotopes are 19.99 u, 20.99 u and 21.99 u,
respectively. Obtain the average atomic mass of neon.
13.3 Obtain the binding energy (in MeV) of a nitrogen nucleus ( )14
7 N ,
given m ( )14
7 N =14.00307 u
13.4 Obtain the binding energy of the nuclei 5626
Fe and 20983
Bi in units of
MeV from the following data:
m ( 5626
Fe ) = 55.934939 u m ( 20983
Bi ) = 208.980388 u
13.5 A given coin has a mass of 3.0 g. Calculate the nuclear energy that
would be required to separate all the neutrons and protons from
each other. For simplicity assume that the coin is entirely made of63
29 Cu atoms (of mass 62.92960 u).
13.6 Write nuclear reaction equations for
(i) α-decay of 226
88 Ra (ii) α-decay of 242
94 Pu
(iii) β–-decay of 32
15P (iv) β
–-decay of 210
83Bi
(v) β+-decay of 11
6 C (vi) β+-decay of 97
43 Tc
(vii) Electron capture of 12054
Xe
13.7 A radioactive isotope has a half-life of T years. How long will it take
the activity to reduce to a) 3.125%, b) 1% of its original value?
13.8 The normal activity of living carbon-containing matter is found tobe about 15 decays per minute for every gram of carbon. This activity
arises from the small proportion of radioactive 146C present with the
stable carbon isotope 126C . When the organism is dead, its interaction
with the atmosphere (which maintains the above equilibrium activity)
ceases and its activity begins to drop. From the known half-life (5730
years) of 14
6 C , and the measured activity, the age of the specimen
can be approximately estimated. This is the principle of 14
6 C dating
463
Nuclei
used in archaeology. Suppose a specimen from Mohenjodaro givesan activity of 9 decays per minute per gram of carbon. Estimate the
approximate age of the Indus-Valley civilisation.
13.9 Obtain the amount of 6027
Co necessary to provide a radioactive source
of 8.0 mCi strength. The half-life of 6027
Co is 5.3 years.
13.10 The half-life of 9038
Sr is 28 years. What is the disintegration rate of
15 mg of this isotope?
13.11 Obtain approximately the ratio of the nuclear radii of the gold isotope19779
Au and the silver isotope 10747
Ag .
13.12 Find the Q-value and the kinetic energy of the emitted α-particle in
the α-decay of (a) 22688
Ra and (b) 220
86 Rn .
Given m ( 22688
Ra ) = 226.02540 u, m ( 22286
Rn ) = 222.01750 u,
m ( 222
86 Rn ) = 220.01137 u, m ( 216
84 Po ) = 216.00189 u.
13.13 The radionuclide 11C decays according to
11 11 +6 5 1/2C B + + : =20.3 mine Tν→
The maximum energy of the emitted positron is 0.960 MeV.
Given the mass values:
m ( 116C) = 11.011434 u and m ( 11
6B ) = 11.009305 u,
calculate Q and compare it with the maximum energy of the positronemitted.
13.14 The nucleus 23
10 Ne decays by β– emission. Write down the β-decay
equation and determine the maximum kinetic energy of the
electrons emitted. Given that:
m ( 2310
Ne ) = 22.994466 u
m ( 23
11 Na ) = 22.089770 u.
13.15 The Q value of a nuclear reaction A + b → C + d is defined by
Q = [ mA + m
b – m
C – m
d]c
2
where the masses refer to the respective nuclei. Determine from thegiven data the Q-value of the following reactions and state whether
the reactions are exothermic or endothermic.
(i) 1 3 2 2
1 1 1 1H+ H H+ H→
(ii) 12 12 20 46 6 10 2C+ C Ne+ He→
Atomic masses are given to be
m ( 2
1 H ) = 2.014102 u
m ( 3
1 H ) = 3.016049 u
m ( 12
6 C ) = 12.000000 u
m ( 20
10 Ne ) = 19.992439 u
13.16 Suppose, we think of fission of a 5626
Fe nucleus into two equal
fragments, 2813
Al . Is the fission energetically possible? Argue by
working out Q of the process. Given m (5626
Fe ) = 55.93494 u and
m ( 2813
Al ) = 27.98191 u.
13.17 The fission properties of 239
94 Pu are very similar to those of 235
92 U . The
average energy released per fission is 180 MeV. How much energy,
Physics
464
in MeV, is released if all the atoms in 1 kg of pure 239
94 Pu undergo
fission?
13.18 A 1000 MW fission reactor consumes half of its fuel in 5.00 y. How
much 23592
U did it contain initially? Assume that the reactor operates
80% of the time, that all the energy generated arises from the fission
of 23592
U and that this nuclide is consumed only by the fission process.
13.19 How long can an electric lamp of 100W be kept glowing by fusion of
2.0 kg of deuterium? Take the fusion reaction as
2 2 3
1 1 2H+ H He+n+3.27 MeV→
13.20 Calculate the height of the potential barrier for a head on collision
of two deuterons. (Hint: The height of the potential barrier is givenby the Coulomb repulsion between the two deuterons when they
just touch each other. Assume that they can be taken as hard
spheres of radius 2.0 fm.)
13.21 From the relation R = R0A1/3
, where R0 is a constant and A is themass number of a nucleus, show that the nuclear matter density is
nearly constant (i.e. independent of A).
13.22 For the β+ (positron) emission from a nucleus, there is another
competing process known as electron capture (electron from an inner
orbit, say, the K–shell, is captured by the nucleus and a neutrino is
emitted).
1
A A
Z Ze X Y ν+
−+ → +
Show that if β+ emission is energetically allowed, electron capture
is necessarily allowed but not vice–versa.
ADDITIONAL EXERCISES
13.23 In a periodic table the average atomic mass of magnesium is given
as 24.312 u. The average value is based on their relative natural
abundance on earth. The three isotopes and their masses are 24
12 Mg
(23.98504u), 25
12 Mg (24.98584u) and 26
12 Mg (25.98259u). The natural
abundance of 24
12 Mg is 78.99% by mass. Calculate the abundances
of other two isotopes.
13.24 The neutron separation energy is defined as the energy required to
remove a neutron from the nucleus. Obtain the neutron separation
energies of the nuclei 41
20 Ca and 27
13 Al from the following data:
m ( 4020
Ca ) = 39.962591 u
m ( 41
20 Ca ) = 40.962278 u
m ( 26
13 Al ) = 25.986895 u
m ( 2713
Al ) = 26.981541 u
13.25 A source contains two phosphorous radio nuclides 32
15P (T1/2 = 14.3d)
and 33
15P (T1/2 = 25.3d). Initially, 10% of the decays come from 33
15P .
How long one must wait until 90% do so?
13.26 Under certain circumstances, a nucleus can decay by emitting a
particle more massive than an α-particle. Consider the following
decay processes:
223 209 14
88 82 6Ra Pb C→ +
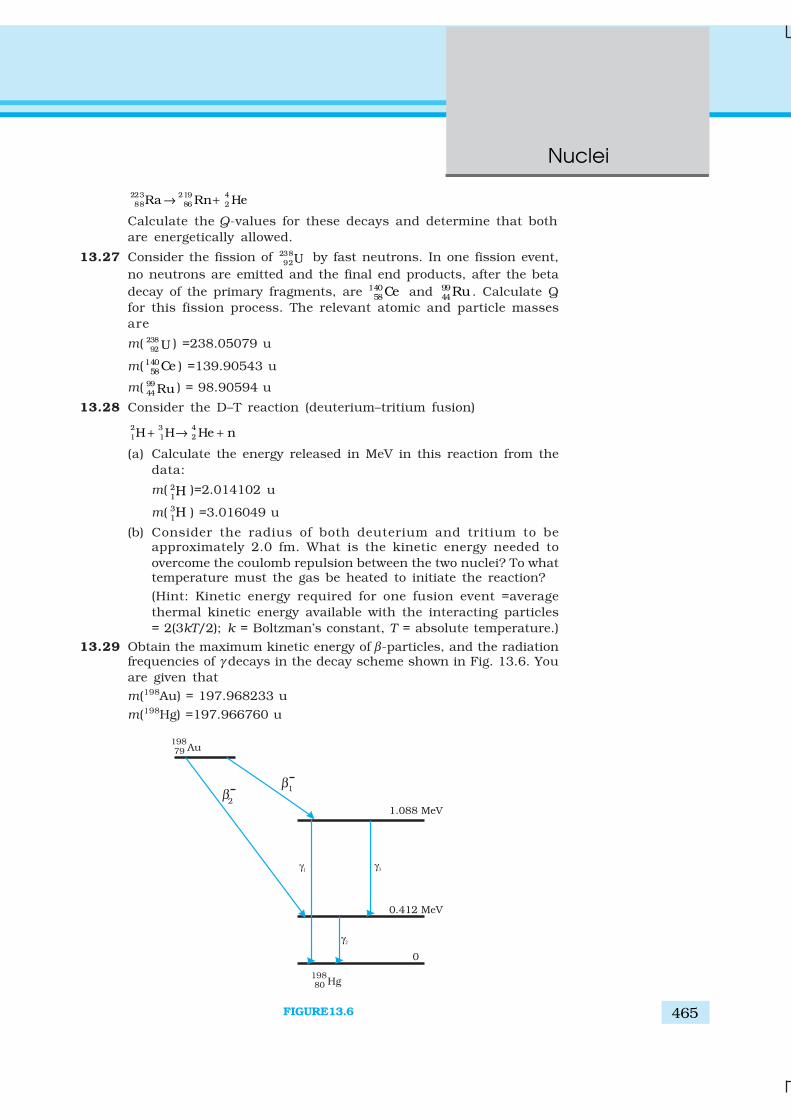
465
Nuclei
223 219 4
88 86 2Ra Rn He→ +
Calculate the Q-values for these decays and determine that both
are energetically allowed.
13.27 Consider the fission of 238
92U by fast neutrons. In one fission event,
no neutrons are emitted and the final end products, after the beta
decay of the primary fragments, are 14058
Ce and 9944
Ru . Calculate Q
for this fission process. The relevant atomic and particle masses
are
m( 238
92 U ) =238.05079 u
m( 14058
Ce ) =139.90543 u
m( 99
44 Ru ) = 98.90594 u
13.28 Consider the D–T reaction (deuterium–tritium fusion)
2 3 4
1 1 2H H He n+ → +
(a) Calculate the energy released in MeV in this reaction from the
data:
m( 21H )=2.014102 u
m( 31H ) =3.016049 u
(b) Consider the radius of both deuterium and tritium to beapproximately 2.0 fm. What is the kinetic energy needed to
overcome the coulomb repulsion between the two nuclei? To whattemperature must the gas be heated to initiate the reaction?
(Hint: Kinetic energy required for one fusion event =average
thermal kinetic energy available with the interacting particles
= 2(3kT/2); k = Boltzman’s constant, T = absolute temperature.)
13.29 Obtain the maximum kinetic energy of β-particles, and the radiationfrequencies of γ decays in the decay scheme shown in Fig. 13.6. You
are given that
m(198Au) = 197.968233 u
m(198Hg) =197.966760 u
FIGURE13.6
Physics
466
13.30 Calculate and compare the energy released by a) fusion of 1.0 kg ofhydrogen deep within Sun and b) the fission of 1.0 kg of 235U in a
fission reactor.
13.31 Suppose India had a target of producing by 2020 AD, 200,000 MWof electric power, ten percent of which was to be obtained from nuclear
power plants. Suppose we are given that, on an average, the efficiency
of utilization (i.e. conversion to electric energy) of thermal energyproduced in a reactor was 25%. How much amount of fissionable
uranium would our country need per year by 2020? Take the heatenergy per fission of 235U to be about 200MeV.
14.1 INTRODUCTION
Devices in which a controlled flow of electrons can be obtained are the
basic building blocks of all the electronic circuits. Before the discovery oftransistor in 1948, such devices were mostly vacuum tubes (also called
valves) like the vacuum diode which has two electrodes, viz., anode (often
called plate) and cathode; triode which has three electrodes – cathode,
plate and grid; tetrode and pentode (respectively with 4 and 5 electrodes).
In a vacuum tube, the electrons are supplied by a heated cathode andthe controlled flow of these electrons in vacuum is obtained by varying
the voltage between its different electrodes. Vacuum is required in the
inter-electrode space; otherwise the moving electrons may lose their
energy on collision with the air molecules in their path. In these devices
the electrons can flow only from the cathode to the anode (i.e., only in onedirection). Therefore, such devices are generally referred to as valves.
These vacuum tube devices are bulky, consume high power, operate
generally at high voltages (~100 V) and have limited life and low reliability.
The seed of the development of modern solid-state semiconductor
electronics goes back to 1930’s when it was realised that some solid-state semiconductors and their junctions offer the possibility of controlling
the number and the direction of flow of charge carriers through them.
Simple excitations like light, heat or small applied voltage can change
the number of mobile charges in a semiconductor. Note that the supply
Chapter Fourteen
SEMICONDUCTORELECTRONICS:MATERIALS, DEVICES
AND SIMPLE CIRCUITS
Physics
468
and flow of charge carriers in the semiconductor devices are within the
solid itself, while in the earlier vacuum tubes/valves, the mobile electrons
were obtained from a heated cathode and they were made to flow in an
evacuated space or vacuum. No external heating or large evacuated space
is required by the semiconductor devices. They are small in size, consumelow power, operate at low voltages and have long life and high reliability.
Even the Cathode Ray Tubes (CRT) used in television and computer
monitors which work on the principle of vacuum tubes are being replaced
by Liquid Crystal Display (LCD) monitors with supporting solid state
electronics. Much before the full implications of the semiconductor deviceswas formally understood, a naturally occurring crystal of galena (Lead
sulphide, PbS) with a metal point contact attached to it was used as
detector of radio waves.
In the following sections, we will introduce the basic concepts of
semiconductor physics and discuss some semiconductor devices likejunction diodes (a 2-electrode device) and bipolar junction transistor (a
3-electrode device). A few circuits illustrating their applications will also
be described.
14.2 CLASSIFICATION OF METALS, CONDUCTORS AND
SEMICONDUCTORS
On the basis of conductivity
On the basis of the relative values of electrical conductivity (σ) or resistivity( ρ = 1/σ ), the solids are broadly classified as:
(i) Metals: They possess very low resistivity (or high conductivity).
ρ ~ 10–2 – 10–8 Ω m
σ ~ 102 – 108 S m–1
(ii) Semiconductors: They have resistivity or conductivity intermediateto metals and insulators.
ρ ~ 10–5 – 106 Ω m
σ ~ 105 – 10–6 S m–1
(iii)Insulators: They have high resistivity (or low conductivity).
ρ ~ 1011 – 1019 Ω mσ ~ 10–11 – 10–19 S m–1
The values of ρ and σ given above are indicative of magnitude and
could well go outside the ranges as well. Relative values of the resistivity
are not the only criteria for distinguishing metals, insulators and
semiconductors from each other. There are some other differences, whichwill become clear as we go along in this chapter.
Our interest in this chapter is in the study of semiconductors which
could be:
(i) Elemental semiconductors: Si and Ge
(ii) Compound semiconductors: Examples are:• Inorganic: CdS, GaAs, CdSe, InP, etc.
• Organic: anthracene, doped pthalocyanines, etc.
• Organic polymers: polypyrrole, polyaniline, polythiophene, etc.
Most of the currently available semiconductor devices are based on
elemental semiconductors Si or Ge and compound inorganic
469
Semiconductor Electronics:
Materials, Devices and
Simple Circuits
semiconductors. However, after 1990, a few semiconductor devices usingorganic semiconductors and semiconducting polymers have beendeveloped signalling the birth of a futuristic technology of polymer-
electronics and molecular-electronics. In this chapter, we will restrictourselves to the study of inorganic semiconductors, particularlyelemental semiconductors Si and Ge. The general concepts introducedhere for discussing the elemental semiconductors, by-and-large, apply
to most of the compound semiconductors as well.
On the basis of energy bands
According to the Bohr atomic model, in an isolated atom the energy ofany of its electrons is decided by the orbit in which it revolves. But when
the atoms come together to form a solid they are close to each other. Sothe outer orbits of electrons from neighbouring atoms would come veryclose or could even overlap. This would make the nature of electron motionin a solid very different from that in an isolated atom.
Inside the crystal each electron has a unique position and no twoelectrons see exactly the same pattern of surrounding charges. Becauseof this, each electron will have a different energy level. These differentenergy levels with continuous energy variation form what are calledenergy bands. The energy band which includes the energy levels of thevalence electrons is called the valence band. The energy band above the
valence band is called the conduction band. With no external energy, allthe valence electrons will reside in the valence band. If the lowest level inthe conduction band happens to be lower than the highest level of thevalence band, the electrons from the valence band can easily move intothe conduction band. Normally the conduction band is empty. But whenit overlaps on the valence band electrons can move freely into it. This isthe case with metallic conductors.
If there is some gap between the conduction band and the valenceband, electrons in the valence band all remain bound and no free electronsare available in the conduction band. This makes the material aninsulator. But some of the electrons from the valence band may gainexternal energy to cross the gap between the conduction band and thevalence band. Then these electrons will move into the conduction band.At the same time they will create vacant energy levels in the valence bandwhere other valence electrons can move. Thus the process creates thepossibility of conduction due to electrons in conduction band as well asdue to vacancies in the valence band.
Let us consider what happens in the case of Si or Ge crystal containingN atoms. For Si, the outermost orbit is the third orbit (n = 3), while for Geit is the fourth orbit (n = 4). The number of electrons in the outermostorbit is 4 (2s and 2p electrons). Hence, the total number of outer electronsin the crystal is 4N. The maximum possible number of electrons in theouter orbit is 8 (2s + 6p electrons). So, for the 4N valence electrons thereare 8N available energy states. These 8N discrete energy levels can eitherform a continuous band or they may be grouped in different bandsdepending upon the distance between the atoms in the crystal (see boxon Band Theory of Solids).
At the distance between the atoms in the crystal lattices of Si and Ge,
the energy band of these 8N states is split apart into two which areseparated by an energy gap E
g (Fig. 14.1). The lower band which is
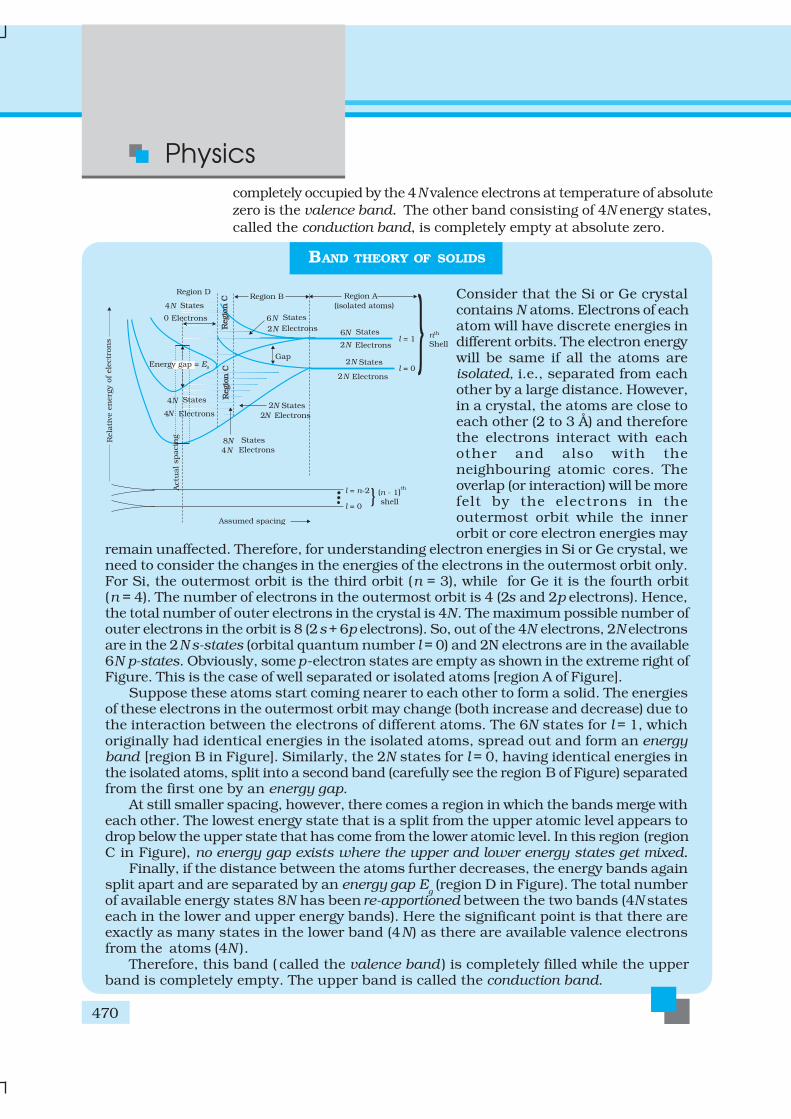
Physics
470
completely occupied by the 4N valence electrons at temperature of absolute
zero is the valence band. The other band consisting of 4N energy states,
called the conduction band, is completely empty at absolute zero.
BAND THEORY OF SOLIDS
Consider that the Si or Ge crystalcontains N atoms. Electrons of eachatom will have discrete energies indifferent orbits. The electron energywill be same if all the atoms areisolated, i.e., separated from eachother by a large distance. However,in a crystal, the atoms are close toeach other (2 to 3 Å) and thereforethe electrons interact with eachother and also with theneighbouring atomic cores. Theoverlap (or interaction) will be morefelt by the electrons in theoutermost orbit while the innerorbit or core electron energies may
remain unaffected. Therefore, for understanding electron energies in Si or Ge crystal, weneed to consider the changes in the energies of the electrons in the outermost orbit only.For Si, the outermost orbit is the third orbit (n = 3), while for Ge it is the fourth orbit(n = 4). The number of electrons in the outermost orbit is 4 (2s and 2p electrons). Hence,the total number of outer electrons in the crystal is 4N. The maximum possible number ofouter electrons in the orbit is 8 (2s + 6p electrons). So, out of the 4N electrons, 2N electronsare in the 2N s-states (orbital quantum number l = 0) and 2N electrons are in the available6N p-states. Obviously, some p-electron states are empty as shown in the extreme right ofFigure. This is the case of well separated or isolated atoms [region A of Figure].
Suppose these atoms start coming nearer to each other to form a solid. The energiesof these electrons in the outermost orbit may change (both increase and decrease) due tothe interaction between the electrons of different atoms. The 6N states for l = 1, whichoriginally had identical energies in the isolated atoms, spread out and form an energyband [region B in Figure]. Similarly, the 2N states for l = 0, having identical energies inthe isolated atoms, split into a second band (carefully see the region B of Figure) separatedfrom the first one by an energy gap.
At still smaller spacing, however, there comes a region in which the bands merge witheach other. The lowest energy state that is a split from the upper atomic level appears todrop below the upper state that has come from the lower atomic level. In this region (regionC in Figure), no energy gap exists where the upper and lower energy states get mixed.
Finally, if the distance between the atoms further decreases, the energy bands againsplit apart and are separated by an energy gap E
g (region D in Figure). The total number
of available energy states 8N has been re-apportioned between the two bands (4N stateseach in the lower and upper energy bands). Here the significant point is that there areexactly as many states in the lower band (4N) as there are available valence electronsfrom the atoms (4N ).
Therefore, this band ( called the valence band ) is completely filled while the upperband is completely empty. The upper band is called the conduction band.
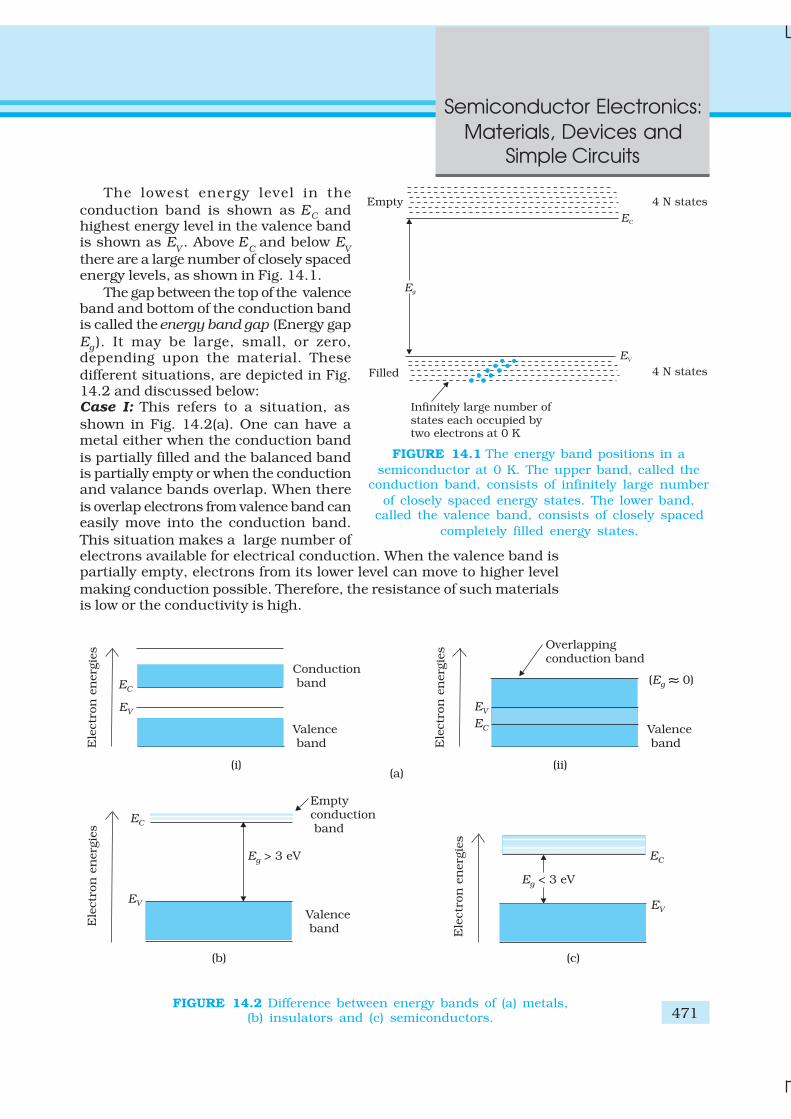
471
Semiconductor Electronics:
Materials, Devices and
Simple Circuits
The lowest energy level in the
conduction band is shown as EC andhighest energy level in the valence bandis shown as E
V. Above E
C and below E
V
there are a large number of closely spacedenergy levels, as shown in Fig. 14.1.
The gap between the top of the valenceband and bottom of the conduction bandis called the energy band gap (Energy gap
Eg ). It may be large, small, or zero,depending upon the material. These
different situations, are depicted in Fig.14.2 and discussed below:Case I: This refers to a situation, as
shown in Fig. 14.2(a). One can have ametal either when the conduction band
is partially filled and the balanced bandis partially empty or when the conductionand valance bands overlap. When there
is overlap electrons from valence band caneasily move into the conduction band.
This situation makes a large number ofelectrons available for electrical conduction. When the valence band ispartially empty, electrons from its lower level can move to higher level
making conduction possible. Therefore, the resistance of such materialsis low or the conductivity is high.
FIGURE 14.2 Difference between energy bands of (a) metals,(b) insulators and (c) semiconductors.
FIGURE 14.1 The energy band positions in a
semiconductor at 0 K. The upper band, called theconduction band, consists of infinitely large number
of closely spaced energy states. The lower band,called the valence band, consists of closely spaced
completely filled energy states.
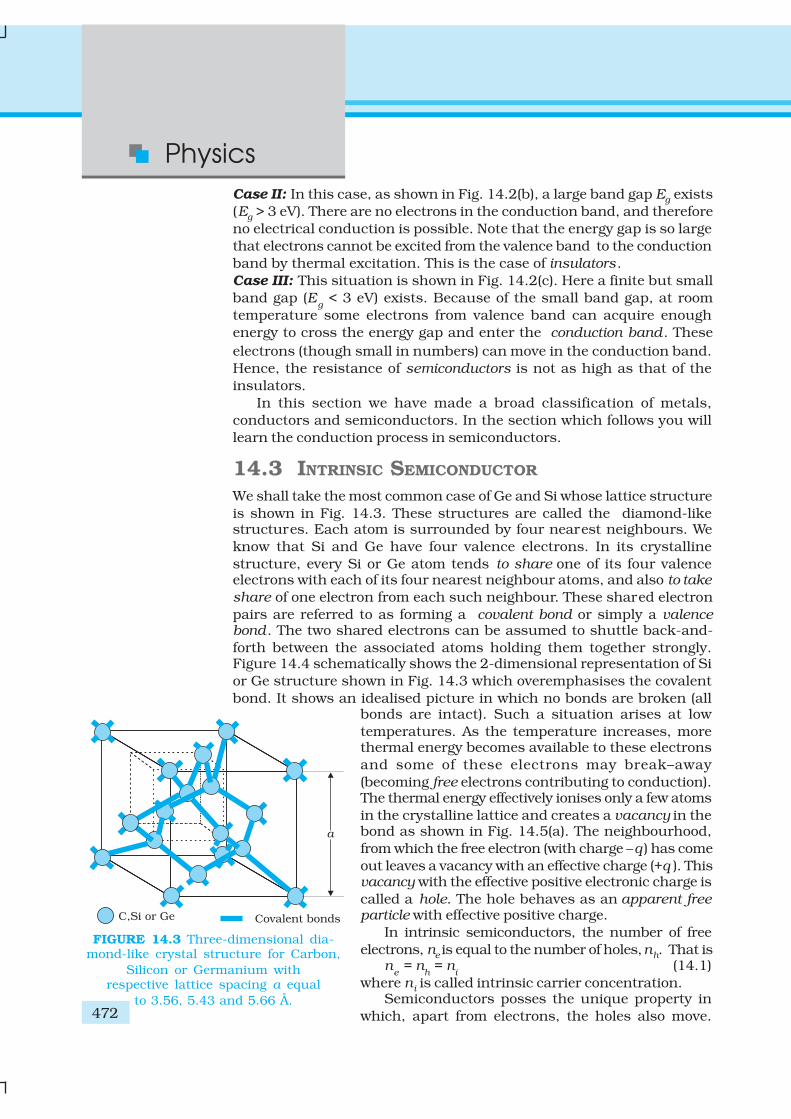
Physics
472
Case II: In this case, as shown in Fig. 14.2(b), a large band gap Eg exists
(Eg > 3 eV). There are no electrons in the conduction band, and therefore
no electrical conduction is possible. Note that the energy gap is so large
that electrons cannot be excited from the valence band to the conduction
band by thermal excitation. This is the case of insulators.
Case III: This situation is shown in Fig. 14.2(c). Here a finite but small
band gap (Eg < 3 eV) exists. Because of the small band gap, at room
temperature some electrons from valence band can acquire enough
energy to cross the energy gap and enter the conduction band. These
electrons (though small in numbers) can move in the conduction band.
Hence, the resistance of semiconductors is not as high as that of the
insulators.
In this section we have made a broad classification of metals,
conductors and semiconductors. In the section which follows you will
learn the conduction process in semiconductors.
14.3 INTRINSIC SEMICONDUCTOR
We shall take the most common case of Ge and Si whose lattice structure
is shown in Fig. 14.3. These structures are called the diamond-likestructures. Each atom is surrounded by four nearest neighbours. We
know that Si and Ge have four valence electrons. In its crystalline
structure, every Si or Ge atom tends to share one of its four valenceelectrons with each of its four nearest neighbour atoms, and also to take
share of one electron from each such neighbour. These shared electron
pairs are referred to as forming a covalent bond or simply a valencebond. The two shared electrons can be assumed to shuttle back-and-
forth between the associated atoms holding them together strongly.Figure 14.4 schematically shows the 2-dimensional representation of Si
or Ge structure shown in Fig. 14.3 which overemphasises the covalent
bond. It shows an idealised picture in which no bonds are broken (allbonds are intact). Such a situation arises at low
temperatures. As the temperature increases, morethermal energy becomes available to these electrons
and some of these electrons may break–away
(becoming free electrons contributing to conduction).The thermal energy effectively ionises only a few atoms
in the crystalline lattice and creates a vacancy in thebond as shown in Fig. 14.5(a). The neighbourhood,
from which the free electron (with charge –q ) has come
out leaves a vacancy with an effective charge (+q ). Thisvacancy with the effective positive electronic charge is
called a hole. The hole behaves as an apparent freeparticle with effective positive charge.
In intrinsic semiconductors, the number of free
electrons, ne is equal to the number of holes, nh. That isn
e = n
h = n
i(14.1)
where ni is called intrinsic carrier concentration.Semiconductors posses the unique property in
which, apart from electrons, the holes also move.
FIGURE 14.3 Three-dimensional dia-mond-like crystal structure for Carbon,
Silicon or Germanium withrespective lattice spacing a equal
to 3.56, 5.43 and 5.66 Å.
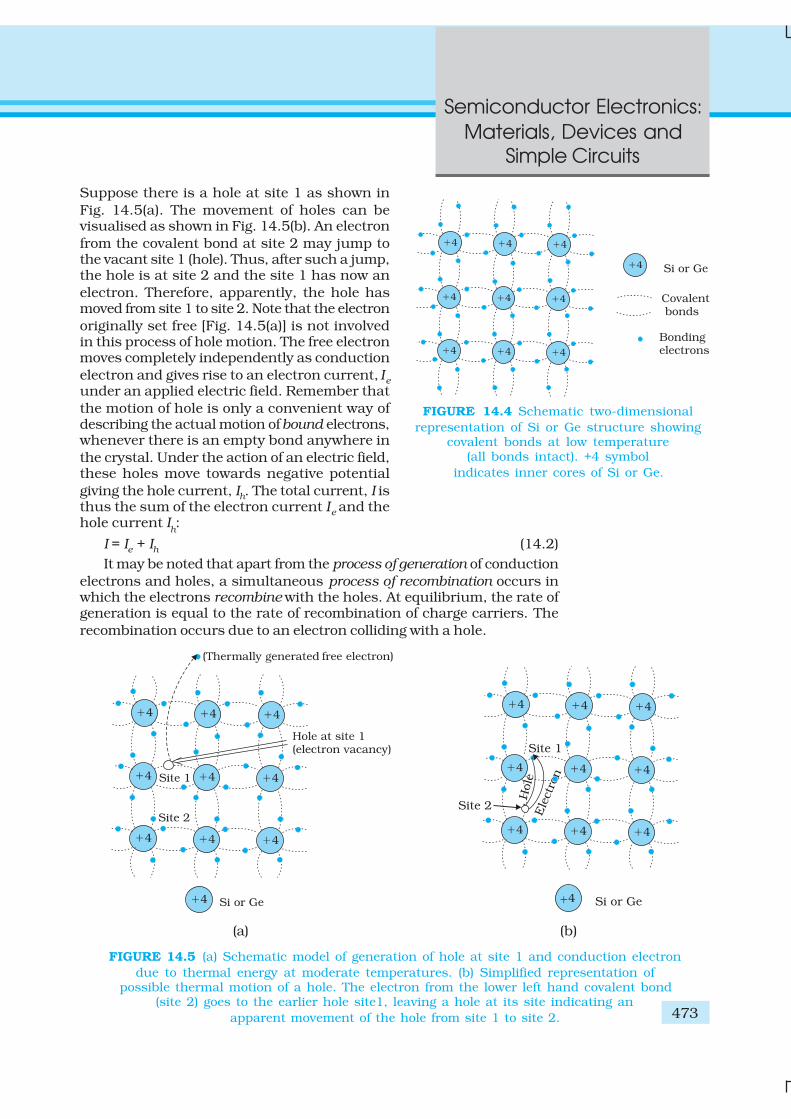
473
Semiconductor Electronics:
Materials, Devices and
Simple Circuits
Suppose there is a hole at site 1 as shown in
Fig. 14.5(a). The movement of holes can bevisualised as shown in Fig. 14.5(b). An electron
from the covalent bond at site 2 may jump tothe vacant site 1 (hole). Thus, after such a jump,the hole is at site 2 and the site 1 has now an
electron. Therefore, apparently, the hole hasmoved from site 1 to site 2. Note that the electron
originally set free [Fig. 14.5(a)] is not involvedin this process of hole motion. The free electronmoves completely independently as conduction
electron and gives rise to an electron current, Ie
under an applied electric field. Remember that
the motion of hole is only a convenient way ofdescribing the actual motion of bound electrons,whenever there is an empty bond anywhere in
the crystal. Under the action of an electric field,these holes move towards negative potential
giving the hole current, Ih. The total current, I isthus the sum of the electron current Ie and thehole current I
h:
I = Ie + Ih (14.2)
It may be noted that apart from the process of generation of conduction
electrons and holes, a simultaneous process of recombination occurs inwhich the electrons recombine with the holes. At equilibrium, the rate ofgeneration is equal to the rate of recombination of charge carriers. The
recombination occurs due to an electron colliding with a hole.
FIGURE 14.4 Schematic two-dimensional
representation of Si or Ge structure showingcovalent bonds at low temperature
(all bonds intact). +4 symbol
indicates inner cores of Si or Ge.
FIGURE 14.5 (a) Schematic model of generation of hole at site 1 and conduction electron
due to thermal energy at moderate temperatures. (b) Simplified representation ofpossible thermal motion of a hole. The electron from the lower left hand covalent bond
(site 2) goes to the earlier hole site1, leaving a hole at its site indicating an
apparent movement of the hole from site 1 to site 2.
(a) (b)
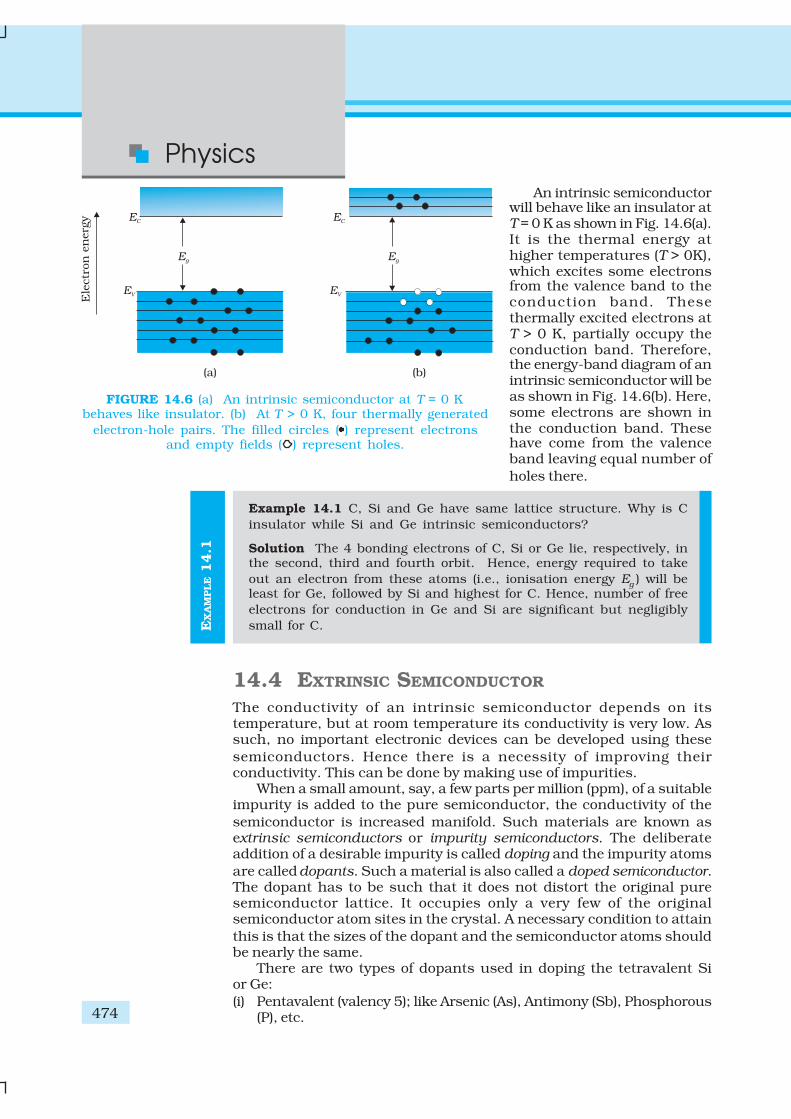
Physics
474
EX
AM
PLE 1
4.1
An intrinsic semiconductorwill behave like an insulator atT = 0 K as shown in Fig. 14.6(a).It is the thermal energy athigher temperatures (T > 0K),which excites some electronsfrom the valence band to theconduction band. Thesethermally excited electrons atT > 0 K, partially occupy theconduction band. Therefore,the energy-band diagram of anintrinsic semiconductor will beas shown in Fig. 14.6(b). Here,some electrons are shown inthe conduction band. Thesehave come from the valenceband leaving equal number of
holes there.
Example 14.1 C, Si and Ge have same lattice structure. Why is C
insulator while Si and Ge intrinsic semiconductors?
Solution The 4 bonding electrons of C, Si or Ge lie, respectively, inthe second, third and fourth orbit. Hence, energy required to take
out an electron from these atoms (i.e., ionisation energy Eg) will be
least for Ge, followed by Si and highest for C. Hence, number of free
electrons for conduction in Ge and Si are significant but negligibly
small for C.
14.4 EXTRINSIC SEMICONDUCTOR
The conductivity of an intrinsic semiconductor depends on itstemperature, but at room temperature its conductivity is very low. Assuch, no important electronic devices can be developed using these
semiconductors. Hence there is a necessity of improving theirconductivity. This can be done by making use of impurities.
When a small amount, say, a few parts per million (ppm), of a suitableimpurity is added to the pure semiconductor, the conductivity of the
semiconductor is increased manifold. Such materials are known asextrinsic semiconductors or impurity semiconductors. The deliberateaddition of a desirable impurity is called doping and the impurity atoms
are called dopants. Such a material is also called a doped semiconductor.The dopant has to be such that it does not distort the original puresemiconductor lattice. It occupies only a very few of the originalsemiconductor atom sites in the crystal. A necessary condition to attain
this is that the sizes of the dopant and the semiconductor atoms shouldbe nearly the same.
There are two types of dopants used in doping the tetravalent Sior Ge:
(i) Pentavalent (valency 5); like Arsenic (As), Antimony (Sb), Phosphorous(P), etc.
FIGURE 14.6 (a) An intrinsic semiconductor at T = 0 Kbehaves like insulator. (b) At T > 0 K, four thermally generated
electron-hole pairs. The filled circles ( ) represent electronsand empty fields ( ) represent holes.
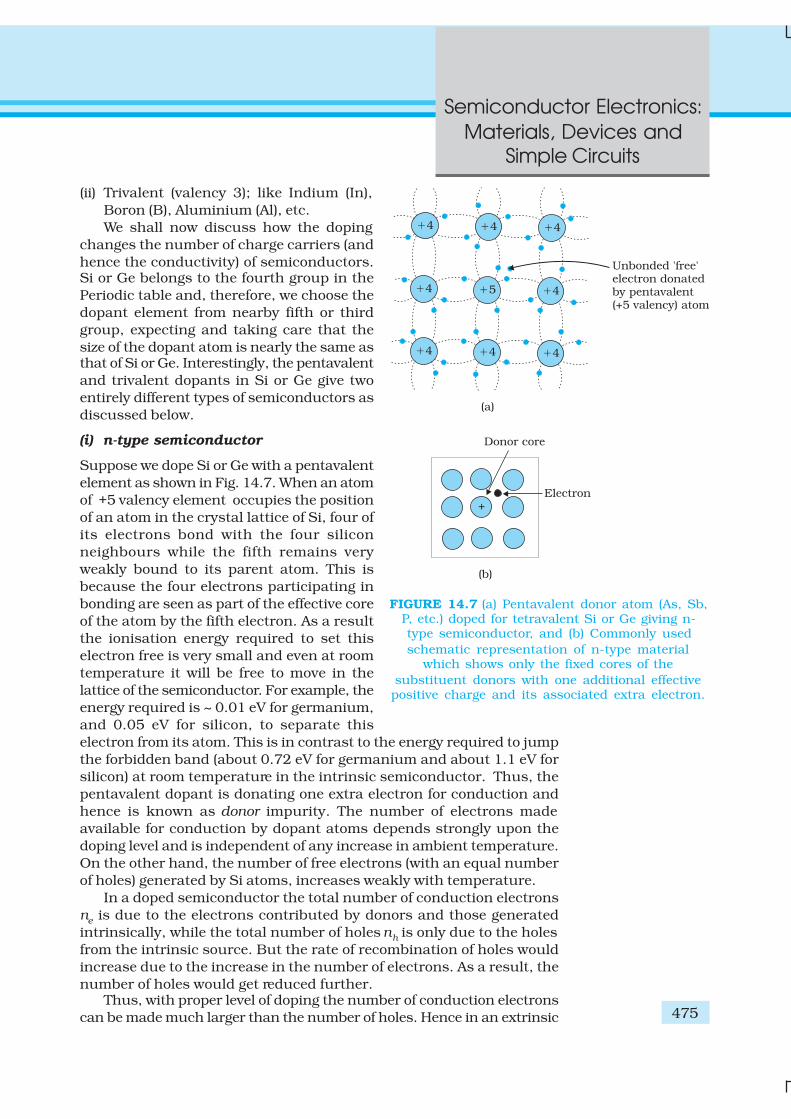
475
Semiconductor Electronics:
Materials, Devices and
Simple Circuits
(ii) Trivalent (valency 3); like Indium (In),
Boron (B), Aluminium (Al), etc.
We shall now discuss how the doping
changes the number of charge carriers (and
hence the conductivity) of semiconductors.Si or Ge belongs to the fourth group in the
Periodic table and, therefore, we choose the
dopant element from nearby fifth or third
group, expecting and taking care that the
size of the dopant atom is nearly the same asthat of Si or Ge. Interestingly, the pentavalent
and trivalent dopants in Si or Ge give two
entirely different types of semiconductors as
discussed below.
(i) n-type semiconductor
Suppose we dope Si or Ge with a pentavalent
element as shown in Fig. 14.7. When an atom
of +5 valency element occupies the position
of an atom in the crystal lattice of Si, four of
its electrons bond with the four silicon
neighbours while the fifth remains very
weakly bound to its parent atom. This is
because the four electrons participating in
bonding are seen as part of the effective core
of the atom by the fifth electron. As a result
the ionisation energy required to set this
electron free is very small and even at room
temperature it will be free to move in the
lattice of the semiconductor. For example, the
energy required is ~ 0.01 eV for germanium,
and 0.05 eV for silicon, to separate this
electron from its atom. This is in contrast to the energy required to jump
the forbidden band (about 0.72 eV for germanium and about 1.1 eV for
silicon) at room temperature in the intrinsic semiconductor. Thus, the
pentavalent dopant is donating one extra electron for conduction and
hence is known as donor impurity. The number of electrons made
available for conduction by dopant atoms depends strongly upon the
doping level and is independent of any increase in ambient temperature.
On the other hand, the number of free electrons (with an equal number
of holes) generated by Si atoms, increases weakly with temperature.
In a doped semiconductor the total number of conduction electrons
ne is due to the electrons contributed by donors and those generated
intrinsically, while the total number of holes nh is only due to the holes
from the intrinsic source. But the rate of recombination of holes would
increase due to the increase in the number of electrons. As a result, the
number of holes would get reduced further.Thus, with proper level of doping the number of conduction electrons
can be made much larger than the number of holes. Hence in an extrinsic
FIGURE 14.7 (a) Pentavalent donor atom (As, Sb,P, etc.) doped for tetravalent Si or Ge giving n-type semiconductor, and (b) Commonly used
schematic representation of n-type materialwhich shows only the fixed cores of the
substituent donors with one additional effectivepositive charge and its associated extra electron.
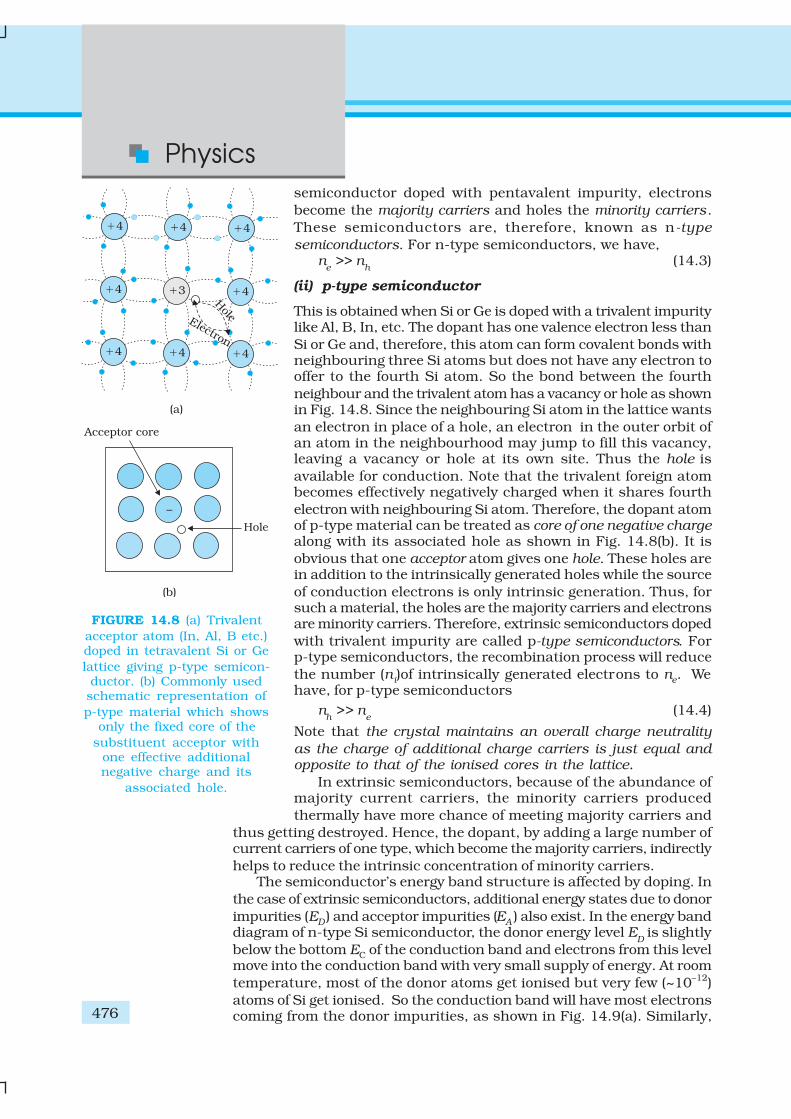
Physics
476
semiconductor doped with pentavalent impurity, electrons
become the majority carriers and holes the minority carriers.
These semiconductors are, therefore, known as n-type
semiconductors. For n-type semiconductors, we have,n
e >> n
h(14.3)
(ii) p-type semiconductor
This is obtained when Si or Ge is doped with a trivalent impuritylike Al, B, In, etc. The dopant has one valence electron less than
Si or Ge and, therefore, this atom can form covalent bonds withneighbouring three Si atoms but does not have any electron tooffer to the fourth Si atom. So the bond between the fourth
neighbour and the trivalent atom has a vacancy or hole as shownin Fig. 14.8. Since the neighbouring Si atom in the lattice wants
an electron in place of a hole, an electron in the outer orbit ofan atom in the neighbourhood may jump to fill this vacancy,leaving a vacancy or hole at its own site. Thus the hole is
available for conduction. Note that the trivalent foreign atombecomes effectively negatively charged when it shares fourth
electron with neighbouring Si atom. Therefore, the dopant atomof p-type material can be treated as core of one negative chargealong with its associated hole as shown in Fig. 14.8(b). It is
obvious that one acceptor atom gives one hole. These holes arein addition to the intrinsically generated holes while the source
of conduction electrons is only intrinsic generation. Thus, forsuch a material, the holes are the majority carriers and electronsare minority carriers. Therefore, extrinsic semiconductors doped
with trivalent impurity are called p-type semiconductors. Forp-type semiconductors, the recombination process will reduce
the number (ni)of intrinsically generated electrons to ne. Wehave, for p-type semiconductors
nh >> n
e(14.4)
Note that the crystal maintains an overall charge neutrality
as the charge of additional charge carriers is just equal andopposite to that of the ionised cores in the lattice.
In extrinsic semiconductors, because of the abundance ofmajority current carriers, the minority carriers produced
thermally have more chance of meeting majority carriers and
thus getting destroyed. Hence, the dopant, by adding a large number ofcurrent carriers of one type, which become the majority carriers, indirectly
helps to reduce the intrinsic concentration of minority carriers.The semiconductor’s energy band structure is affected by doping. In
the case of extrinsic semiconductors, additional energy states due to donor
impurities (ED ) and acceptor impurities (EA ) also exist. In the energy banddiagram of n-type Si semiconductor, the donor energy level E
D is slightly
below the bottom EC of the conduction band and electrons from this levelmove into the conduction band with very small supply of energy. At room
temperature, most of the donor atoms get ionised but very few (~10–12)
atoms of Si get ionised. So the conduction band will have most electronscoming from the donor impurities, as shown in Fig. 14.9(a). Similarly,
FIGURE 14.8 (a) Trivalent
acceptor atom (In, Al, B etc.)doped in tetravalent Si or Ge
lattice giving p-type semicon-ductor. (b) Commonly usedschematic representation of
p-type material which showsonly the fixed core of the
substituent acceptor withone effective additionalnegative charge and its
associated hole.
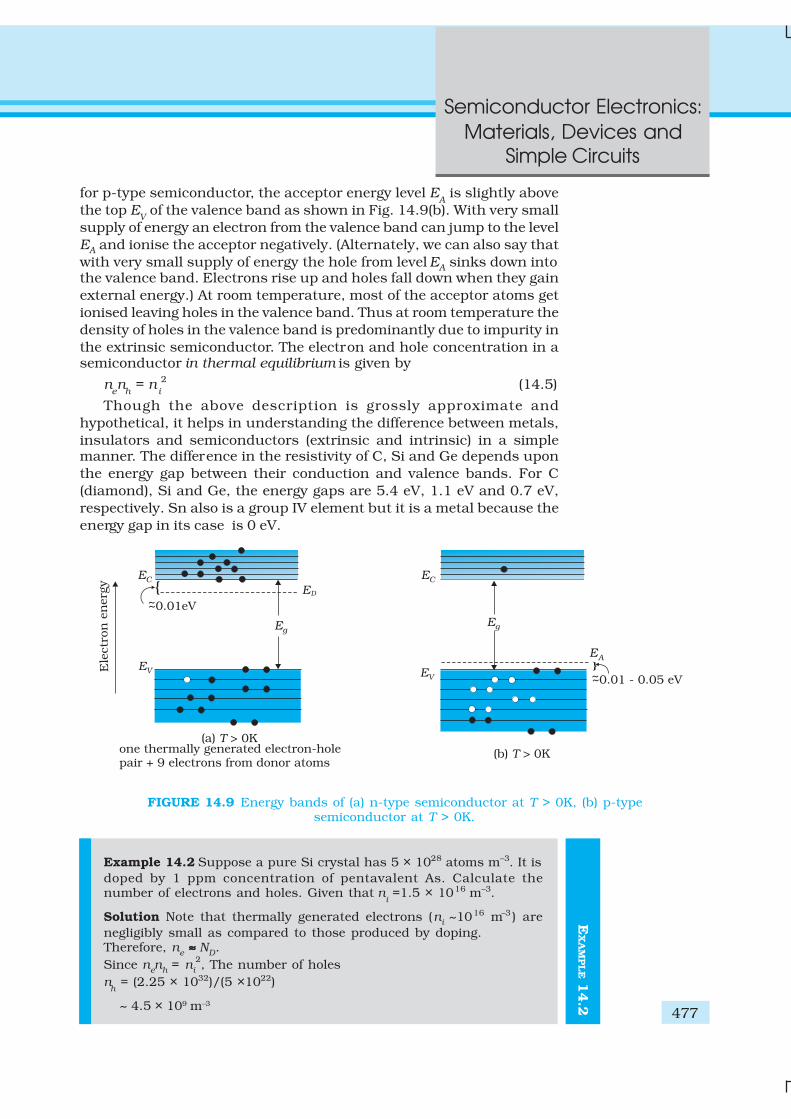
477
Semiconductor Electronics:
Materials, Devices and
Simple Circuits
EX
AM
PLE 1
4.2
for p-type semiconductor, the acceptor energy level EA is slightly above
the top EV of the valence band as shown in Fig. 14.9(b). With very small
supply of energy an electron from the valence band can jump to the level
EA and ionise the acceptor negatively. (Alternately, we can also say that
with very small supply of energy the hole from level EA sinks down intothe valence band. Electrons rise up and holes fall down when they gain
external energy.) At room temperature, most of the acceptor atoms get
ionised leaving holes in the valence band. Thus at room temperature the
density of holes in the valence band is predominantly due to impurity in
the extrinsic semiconductor. The electron and hole concentration in asemiconductor in thermal equilibrium is given by
nen
h = n
i
2 (14.5)
Though the above description is grossly approximate and
hypothetical, it helps in understanding the difference between metals,
insulators and semiconductors (extrinsic and intrinsic) in a simplemanner. The difference in the resistivity of C, Si and Ge depends upon
the energy gap between their conduction and valence bands. For C
(diamond), Si and Ge, the energy gaps are 5.4 eV, 1.1 eV and 0.7 eV,
respectively. Sn also is a group IV element but it is a metal because the
energy gap in its case is 0 eV.
FIGURE 14.9 Energy bands of (a) n-type semiconductor at T > 0K, (b) p-typesemiconductor at T > 0K.
Example 14.2 Suppose a pure Si crystal has 5 × 1028 atoms m–3. It is
doped by 1 ppm concentration of pentavalent As. Calculate thenumber of electrons and holes. Given that n
i =1.5 × 10¹⁶ m–3.
Solution Note that thermally generated electrons (ni ~1016 m–3 ) are
negligibly small as compared to those produced by doping.Therefore, n
e ≈≈≈≈≈ N
D.
Since nen
h = n
i
2, The number of holes
nh = (2.25 × 1032)/(5 ×1022)
~ 4.5 × 10⁹ m–3
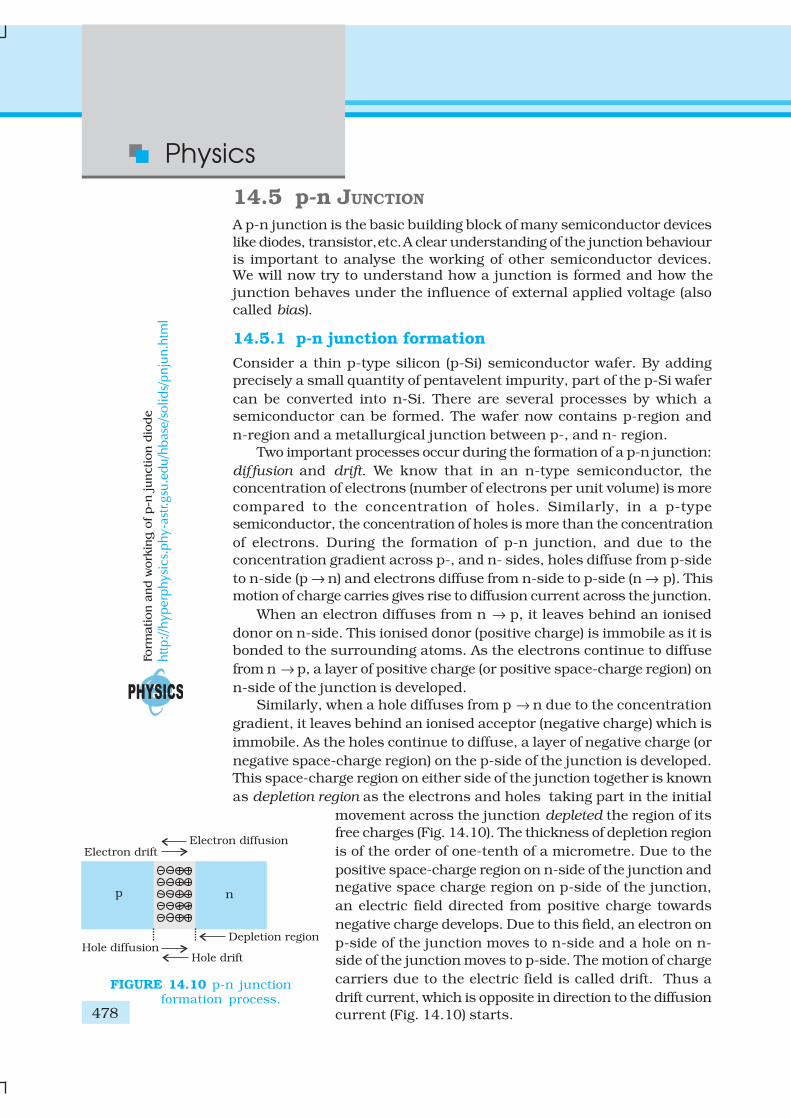
Physics
478
14.5 p-n JUNCTION
A p-n junction is the basic building block of many semiconductor devices
like diodes, transistor, etc. A clear understanding of the junction behaviour
is important to analyse the working of other semiconductor devices.We will now try to understand how a junction is formed and how the
junction behaves under the influence of external applied voltage (also
called bias).
14.5.1 p-n junction formation
Consider a thin p-type silicon (p-Si) semiconductor wafer. By adding
precisely a small quantity of pentavelent impurity, part of the p-Si wafer
can be converted into n-Si. There are several processes by which a
semiconductor can be formed. The wafer now contains p-region and
n-region and a metallurgical junction between p-, and n- region.
Two important processes occur during the formation of a p-n junction:
diffusion and drift. We know that in an n-type semiconductor, the
concentration of electrons (number of electrons per unit volume) is more
compared to the concentration of holes. Similarly, in a p-type
semiconductor, the concentration of holes is more than the concentration
of electrons. During the formation of p-n junction, and due to the
concentration gradient across p-, and n- sides, holes diffuse from p-side
to n-side (p → n) and electrons diffuse from n-side to p-side (n → p). This
motion of charge carries gives rise to diffusion current across the junction.
When an electron diffuses from n → p, it leaves behind an ionised
donor on n-side. This ionised donor (positive charge) is immobile as it is
bonded to the surrounding atoms. As the electrons continue to diffuse
from n → p, a layer of positive charge (or positive space-charge region) on
n-side of the junction is developed.
Similarly, when a hole diffuses from p → n due to the concentration
gradient, it leaves behind an ionised acceptor (negative charge) which is
immobile. As the holes continue to diffuse, a layer of negative charge (or
negative space-charge region) on the p-side of the junction is developed.
This space-charge region on either side of the junction together is known
as depletion region as the electrons and holes taking part in the initial
movement across the junction depleted the region of its
free charges (Fig. 14.10). The thickness of depletion region
is of the order of one-tenth of a micrometre. Due to the
positive space-charge region on n-side of the junction and
negative space charge region on p-side of the junction,
an electric field directed from positive charge towards
negative charge develops. Due to this field, an electron on
p-side of the junction moves to n-side and a hole on n-
side of the junction moves to p-side. The motion of charge
carriers due to the electric field is called drift. Thus a
drift current, which is opposite in direction to the diffusion
current (Fig. 14.10) starts.
FIGURE 14.10 p-n junctionformation process.
Form
ation a
nd w
ork
ing
of
p-n
ju
ncti
on
dio
de
http://h
yper
phys
ics.
phy-
astr.
gsu.e
du/h
bas
e/so
lids/pnju
n.h
tml
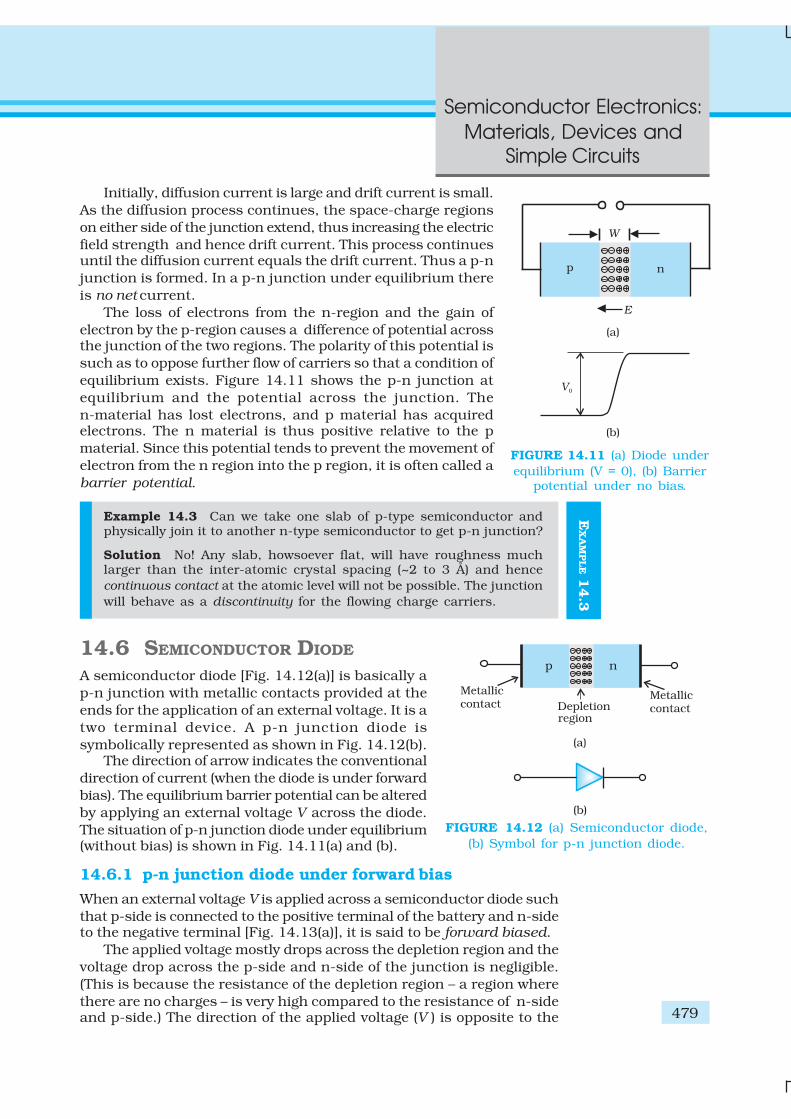
479
Semiconductor Electronics:
Materials, Devices and
Simple Circuits
EX
AM
PLE 1
4.3
Initially, diffusion current is large and drift current is small.
As the diffusion process continues, the space-charge regions
on either side of the junction extend, thus increasing the electric
field strength and hence drift current. This process continuesuntil the diffusion current equals the drift current. Thus a p-n
junction is formed. In a p-n junction under equilibrium there
is no net current.
The loss of electrons from the n-region and the gain of
electron by the p-region causes a difference of potential acrossthe junction of the two regions. The polarity of this potential is
such as to oppose further flow of carriers so that a condition of
equilibrium exists. Figure 14.11 shows the p-n junction at
equilibrium and the potential across the junction. The
n-material has lost electrons, and p material has acquiredelectrons. The n material is thus positive relative to the p
material. Since this potential tends to prevent the movement of
electron from the n region into the p region, it is often called a
barrier potential.
Example 14.3 Can we take one slab of p-type semiconductor andphysically join it to another n-type semiconductor to get p-n junction?
Solution No! Any slab, howsoever flat, will have roughness muchlarger than the inter-atomic crystal spacing (~2 to 3 Å) and hence
continuous contact at the atomic level will not be possible. The junction
will behave as a discontinuity for the flowing charge carriers.
14.6 SEMICONDUCTOR DIODE
A semiconductor diode [Fig. 14.12(a)] is basically a
p-n junction with metallic contacts provided at the
ends for the application of an external voltage. It is a
two terminal device. A p-n junction diode is
symbolically represented as shown in Fig. 14.12(b).The direction of arrow indicates the conventional
direction of current (when the diode is under forward
bias). The equilibrium barrier potential can be altered
by applying an external voltage V across the diode.
The situation of p-n junction diode under equilibrium(without bias) is shown in Fig. 14.11(a) and (b).
14.6.1 p-n junction diode under forward bias
When an external voltage V is applied across a semiconductor diode such
that p-side is connected to the positive terminal of the battery and n-sideto the negative terminal [Fig. 14.13(a)], it is said to be forward biased.
The applied voltage mostly drops across the depletion region and the
voltage drop across the p-side and n-side of the junction is negligible.
(This is because the resistance of the depletion region – a region where
there are no charges – is very high compared to the resistance of n-sideand p-side.) The direction of the applied voltage (V ) is opposite to the
FIGURE 14.11 (a) Diode under
equilibrium (V = 0), (b) Barrierpotential under no bias.
FIGURE 14.12 (a) Semiconductor diode,
(b) Symbol for p-n junction diode.

Physics
480
built-in potential V0. As a result, the depletion layer width
decreases and the barrier height is reduced [Fig. 14.13(b)]. Theeffective barrier height under forward bias is (V0 – V ).
If the applied voltage is small, the barrier potential will bereduced only slightly below the equilibrium value, and only asmall number of carriers in the material—those that happen to
be in the uppermost energy levels—will possess enough energyto cross the junction. So the current will be small. If we increasethe applied voltage significantly, the barrier height will be reducedand more number of carriers will have the required energy. Thusthe current increases.
Due to the applied voltage, electrons from n-side cross thedepletion region and reach p-side (where they are minoritycarries). Similarly, holes from p-side cross the junction and reachthe n-side (where they are minority carries). This process underforward bias is known as minority carrier injection. At the
junction boundary, on each side, the minority carrierconcentration increases significantly compared to the locationsfar from the junction.
Due to this concentration gradient, the injected electrons onp-side diffuse from the junction edge of p-side to the other end
of p-side. Likewise, the injected holes on n-side diffuse from thejunction edge of n-side to the other end of n-side(Fig. 14.14). This motion of charged carriers on either sidegives rise to current. The total diode forward current is sum
of hole diffusion current and conventional current due toelectron diffusion. The magnitude of this current is usuallyin mA.
14.6.2 p-n junction diode under reverse bias
When an external voltage (V ) is applied across the diode such
that n-side is positive and p-side is negative, it is said to bereverse biased [Fig.14.15(a)]. The applied voltage mostly
drops across the depletion region. The direction of applied voltage is sameas the direction of barrier potential. As a result, the barrier height increasesand the depletion region widens due to the change in the electric field.
The effective barrier height under reverse bias is (V0 + V ), [Fig. 14.15(b)].This suppresses the flow of electrons from n → p and holes from p → n.
Thus, diffusion current, decreases enormously compared to the diodeunder forward bias.
The electric field direction of the junction is such that if electrons onp-side or holes on n-side in their random motion come close to the
junction, they will be swept to its majority zone. This drift of carriersgives rise to current. The drift current is of the order of a few µA. This is
quite low because it is due to the motion of carriers from their minority
side to their majority side across the junction. The drift current is alsothere under forward bias but it is negligible (µA) when compared with
current due to injected carriers which is usually in mA.
The diode reverse current is not very much dependent on the applied
voltage. Even a small voltage is sufficient to sweep the minority carriersfrom one side of the junction to the other side of the junction. The current
FIGURE 14.13 (a) p-n
junction diode under forward
bias, (b) Barrier potential(1) without battery, (2) Low
battery voltage, and (3) Highvoltage battery.
FIGURE 14.14 Forward bias
minority carrier injection.
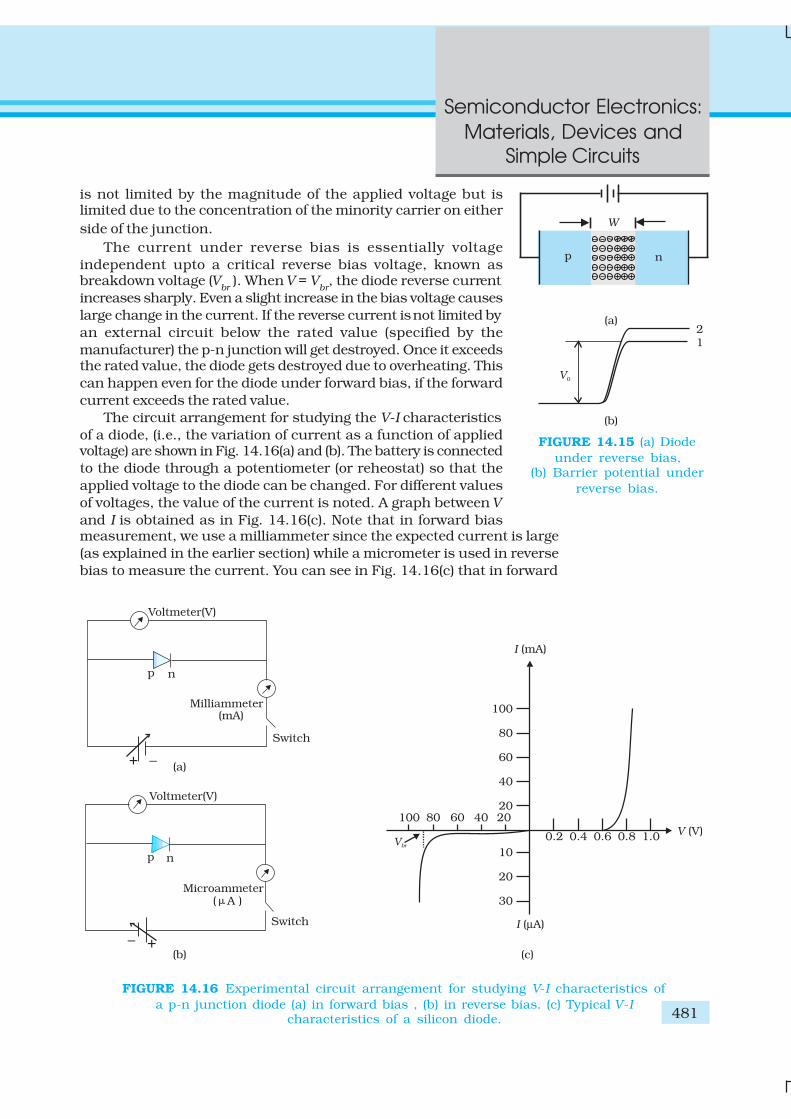
481
Semiconductor Electronics:
Materials, Devices and
Simple Circuits
is not limited by the magnitude of the applied voltage but islimited due to the concentration of the minority carrier on either
side of the junction.
The current under reverse bias is essentially voltage
independent upto a critical reverse bias voltage, known asbreakdown voltage (V
br). When V = V
br, the diode reverse current
increases sharply. Even a slight increase in the bias voltage causes
large change in the current. If the reverse current is not limited by
an external circuit below the rated value (specified by the
manufacturer) the p-n junction will get destroyed. Once it exceedsthe rated value, the diode gets destroyed due to overheating. This
can happen even for the diode under forward bias, if the forward
current exceeds the rated value.
The circuit arrangement for studying the V-I characteristics
of a diode, (i.e., the variation of current as a function of appliedvoltage) are shown in Fig. 14.16(a) and (b). The battery is connected
to the diode through a potentiometer (or reheostat) so that the
applied voltage to the diode can be changed. For different values
of voltages, the value of the current is noted. A graph between V
and I is obtained as in Fig. 14.16(c). Note that in forward biasmeasurement, we use a milliammeter since the expected current is large
(as explained in the earlier section) while a micrometer is used in reverse
bias to measure the current. You can see in Fig. 14.16(c) that in forward
FIGURE 14.15 (a) Diode
under reverse bias,(b) Barrier potential under
reverse bias.
FIGURE 14.16 Experimental circuit arrangement for studying V-I characteristics of
a p-n junction diode (a) in forward bias , (b) in reverse bias. (c) Typical V-Icharacteristics of a silicon diode.
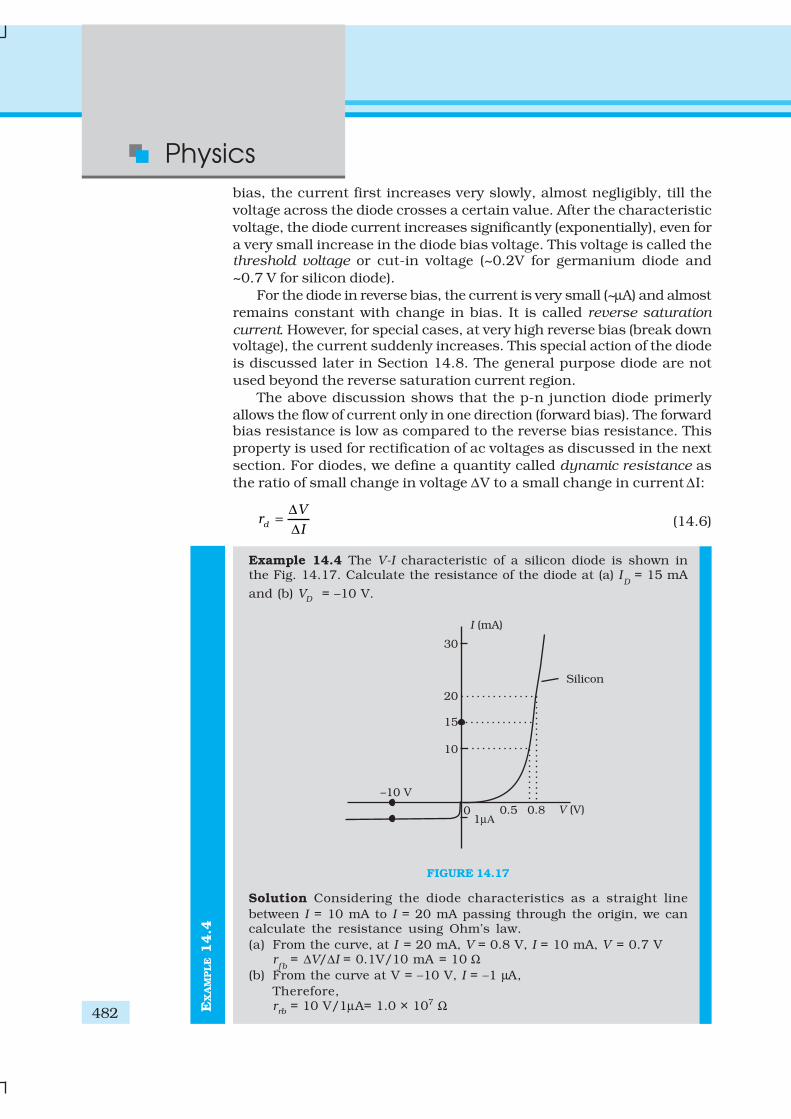
Physics
482 EX
AM
PLE 1
4.4
bias, the current first increases very slowly, almost negligibly, till the
voltage across the diode crosses a certain value. After the characteristic
voltage, the diode current increases significantly (exponentially), even for
a very small increase in the diode bias voltage. This voltage is called thethreshold voltage or cut-in voltage (~0.2V for germanium diode and
~0.7 V for silicon diode).
For the diode in reverse bias, the current is very small (~µA) and almost
remains constant with change in bias. It is called reverse saturation
current. However, for special cases, at very high reverse bias (break downvoltage), the current suddenly increases. This special action of the diode
is discussed later in Section 14.8. The general purpose diode are not
used beyond the reverse saturation current region.
The above discussion shows that the p-n junction diode primerly
allows the flow of current only in one direction (forward bias). The forwardbias resistance is low as compared to the reverse bias resistance. This
property is used for rectification of ac voltages as discussed in the next
section. For diodes, we define a quantity called dynamic resistance as
the ratio of small change in voltage ∆V to a small change in current ∆I:
d
Vr
I
∆=
∆(14.6)
Example 14.4 The V-I characteristic of a silicon diode is shown inthe Fig. 14.17. Calculate the resistance of the diode at (a) I
D = 15 mA
and (b) VD = –10 V.
FIGURE 14.17
Solution Considering the diode characteristics as a straight line
between I = 10 mA to I = 20 mA passing through the origin, we cancalculate the resistance using Ohm’s law.
(a) From the curve, at I = 20 mA, V = 0.8 V, I = 10 mA, V = 0.7 Vr
f b = ∆V/∆I = 0.1V/10 mA = 10 Ω
(b) From the curve at V = –10 V, I = –1 µA,
Therefore,r
rb = 10 V/1µA= 1.0 × 10⁷ Ω
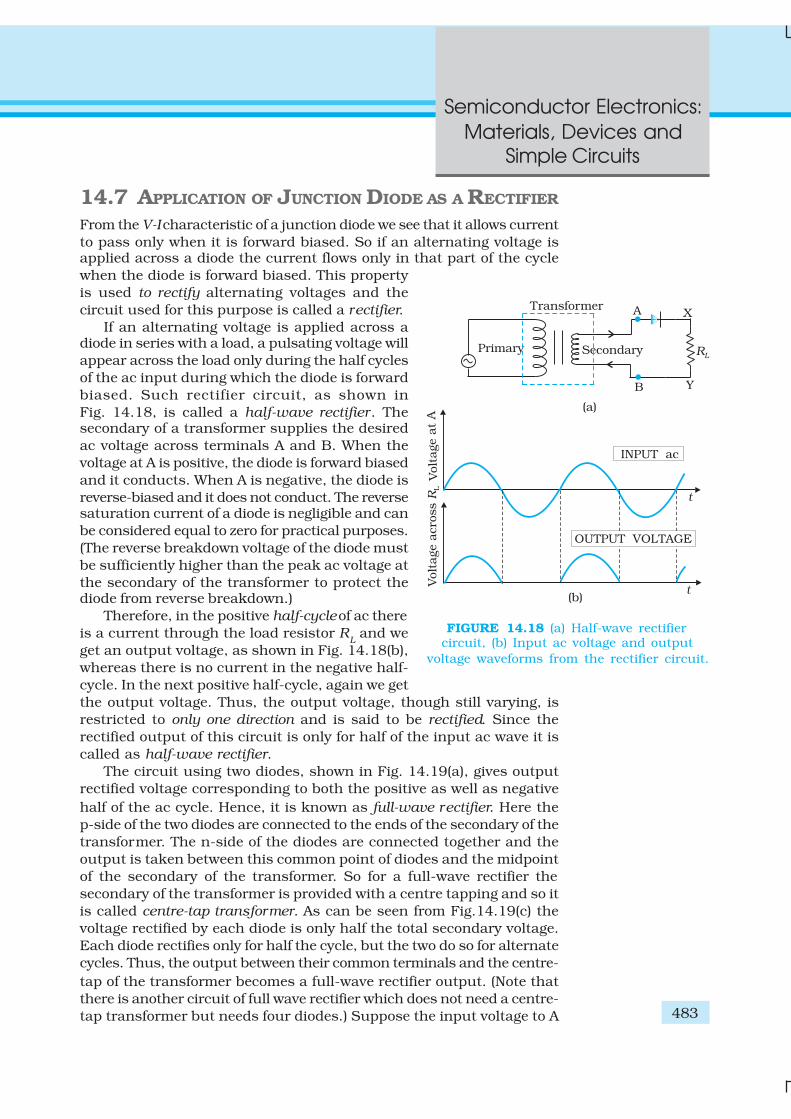
483
Semiconductor Electronics:
Materials, Devices and
Simple Circuits
14.7 APPLICATION OF JUNCTION DIODE AS A RECTIFIER
From the V-I characteristic of a junction diode we see that it allows current
to pass only when it is forward biased. So if an alternating voltage isapplied across a diode the current flows only in that part of the cycle
when the diode is forward biased. This property
is used to rectify alternating voltages and the
circuit used for this purpose is called a rectifier.
If an alternating voltage is applied across adiode in series with a load, a pulsating voltage will
appear across the load only during the half cycles
of the ac input during which the diode is forward
biased. Such rectifier circuit, as shown in
Fig. 14.18, is called a half-wave rectifier. Thesecondary of a transformer supplies the desired
ac voltage across terminals A and B. When the
voltage at A is positive, the diode is forward biased
and it conducts. When A is negative, the diode is
reverse-biased and it does not conduct. The reversesaturation current of a diode is negligible and can
be considered equal to zero for practical purposes.
(The reverse breakdown voltage of the diode must
be sufficiently higher than the peak ac voltage at
the secondary of the transformer to protect thediode from reverse breakdown.)
Therefore, in the positive half-cycle of ac there
is a current through the load resistor RL and we
get an output voltage, as shown in Fig. 14.18(b),
whereas there is no current in the negative half-
cycle. In the next positive half-cycle, again we get
the output voltage. Thus, the output voltage, though still varying, is
restricted to only one direction and is said to be rectified. Since the
rectified output of this circuit is only for half of the input ac wave it is
called as half-wave rectifier.
The circuit using two diodes, shown in Fig. 14.19(a), gives output
rectified voltage corresponding to both the positive as well as negative
half of the ac cycle. Hence, it is known as full-wave rectifier. Here the
p-side of the two diodes are connected to the ends of the secondary of the
transformer. The n-side of the diodes are connected together and the
output is taken between this common point of diodes and the midpoint
of the secondary of the transformer. So for a full-wave rectifier the
secondary of the transformer is provided with a centre tapping and so it
is called centre-tap transformer. As can be seen from Fig.14.19(c) the
voltage rectified by each diode is only half the total secondary voltage.
Each diode rectifies only for half the cycle, but the two do so for alternate
cycles. Thus, the output between their common terminals and the centre-
tap of the transformer becomes a full-wave rectifier output. (Note that
there is another circuit of full wave rectifier which does not need a centre-
tap transformer but needs four diodes.) Suppose the input voltage to A
FIGURE 14.18 (a) Half-wave rectifiercircuit, (b) Input ac voltage and output
voltage waveforms from the rectifier circuit.
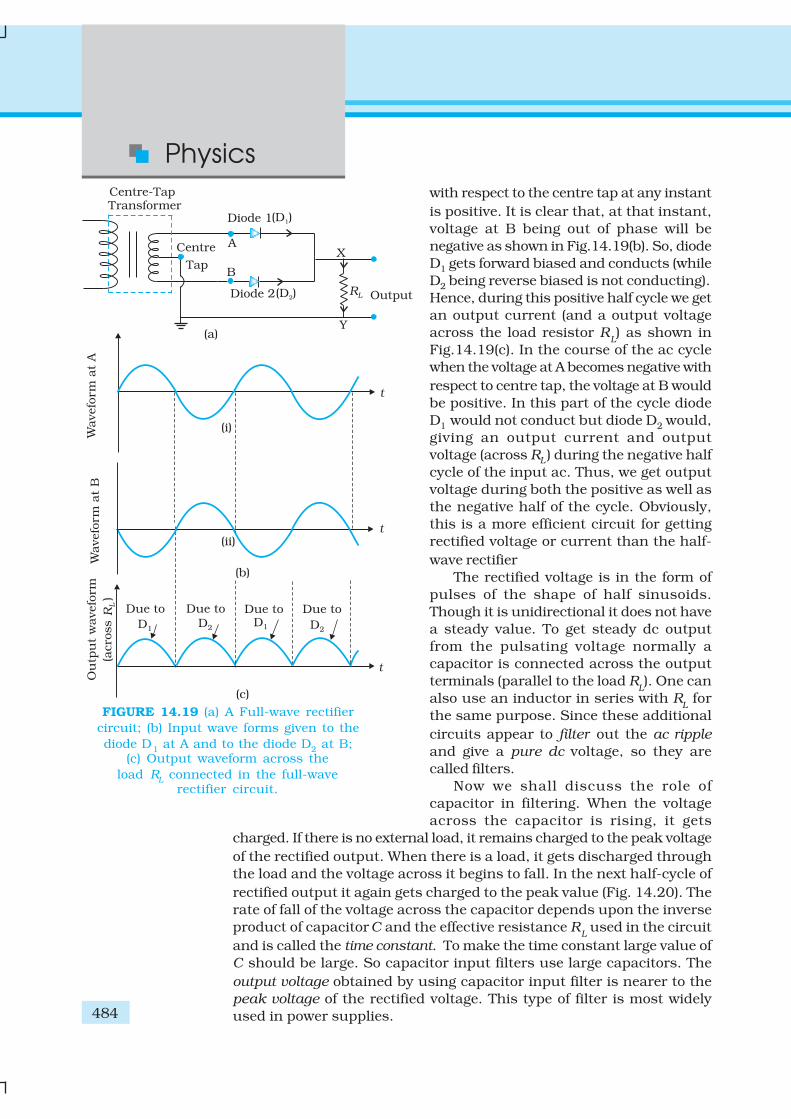
Physics
484
with respect to the centre tap at any instant
is positive. It is clear that, at that instant,
voltage at B being out of phase will be
negative as shown in Fig.14.19(b). So, diode
D1 gets forward biased and conducts (while
D2 being reverse biased is not conducting).
Hence, during this positive half cycle we get
an output current (and a output voltage
across the load resistor RL) as shown in
Fig.14.19(c). In the course of the ac cycle
when the voltage at A becomes negative with
respect to centre tap, the voltage at B would
be positive. In this part of the cycle diode
D1 would not conduct but diode D2 would,
giving an output current and output
voltage (across RL ) during the negative half
cycle of the input ac. Thus, we get output
voltage during both the positive as well as
the negative half of the cycle. Obviously,
this is a more efficient circuit for getting
rectified voltage or current than the half-
wave rectifier
The rectified voltage is in the form of
pulses of the shape of half sinusoids.
Though it is unidirectional it does not have
a steady value. To get steady dc output
from the pulsating voltage normally a
capacitor is connected across the output
terminals (parallel to the load RL). One can
also use an inductor in series with RL for
the same purpose. Since these additional
circuits appear to filter out the ac ripple
and give a pure dc voltage, so they are
called filters.
Now we shall discuss the role of
capacitor in filtering. When the voltage
across the capacitor is rising, it gets
charged. If there is no external load, it remains charged to the peak voltage
of the rectified output. When there is a load, it gets discharged through
the load and the voltage across it begins to fall. In the next half-cycle of
rectified output it again gets charged to the peak value (Fig. 14.20). The
rate of fall of the voltage across the capacitor depends upon the inverse
product of capacitor C and the effective resistance RL used in the circuit
and is called the time constant. To make the time constant large value of
C should be large. So capacitor input filters use large capacitors. The
output voltage obtained by using capacitor input filter is nearer to the
peak voltage of the rectified voltage. This type of filter is most widely
used in power supplies.
FIGURE 14.19 (a) A Full-wave rectifier
circuit; (b) Input wave forms given to the
diode D1 at A and to the diode D2 at B;(c) Output waveform across the
load RL connected in the full-wave
rectifier circuit.
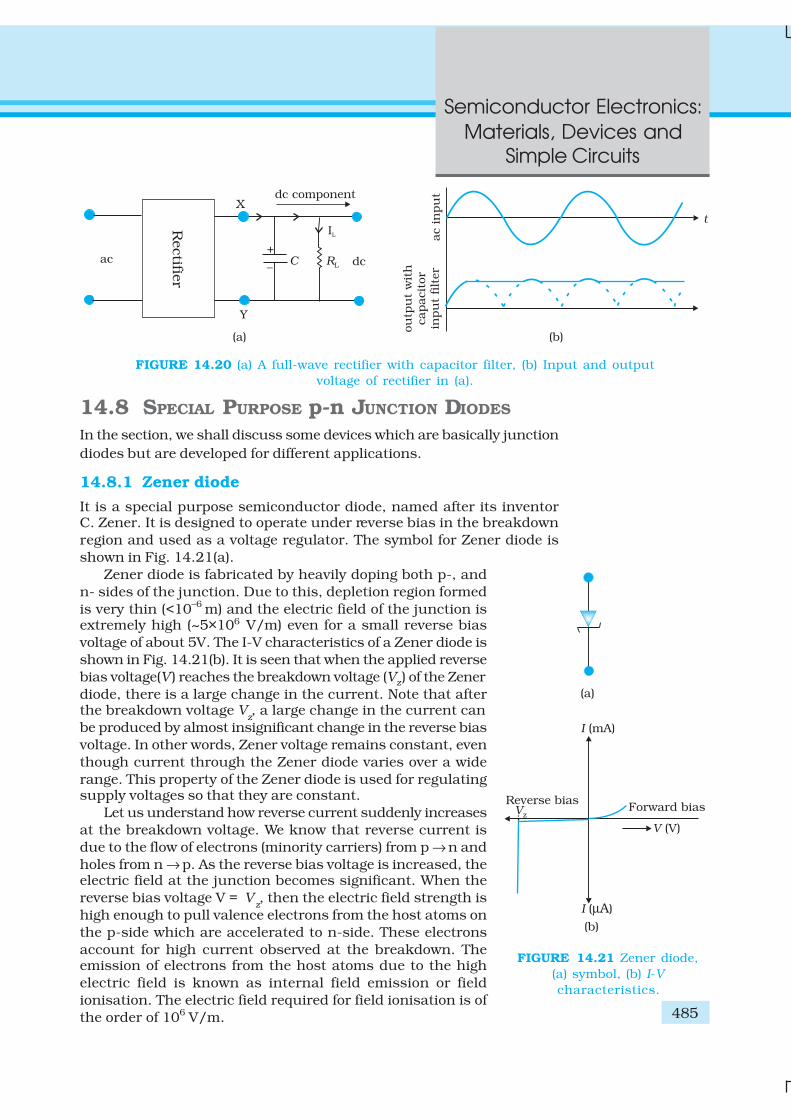
485
Semiconductor Electronics:
Materials, Devices and
Simple Circuits
14.8 SPECIAL PURPOSE p-n JUNCTION DIODES
In the section, we shall discuss some devices which are basically junction
diodes but are developed for different applications.
14.8.1 Zener diode
It is a special purpose semiconductor diode, named after its inventorC. Zener. It is designed to operate under reverse bias in the breakdown
region and used as a voltage regulator. The symbol for Zener diode is
shown in Fig. 14.21(a).
Zener diode is fabricated by heavily doping both p-, and
n- sides of the junction. Due to this, depletion region formed
is very thin (<10–6 m) and the electric field of the junction isextremely high (~5×10⁶ V/m) even for a small reverse bias
voltage of about 5V. The I-V characteristics of a Zener diode is
shown in Fig. 14.21(b). It is seen that when the applied reverse
bias voltage(V) reaches the breakdown voltage (Vz) of the Zener
diode, there is a large change in the current. Note that afterthe breakdown voltage V
z, a large change in the current can
be produced by almost insignificant change in the reverse bias
voltage. In other words, Zener voltage remains constant, even
though current through the Zener diode varies over a wide
range. This property of the Zener diode is used for regulatingsupply voltages so that they are constant.
Let us understand how reverse current suddenly increases
at the breakdown voltage. We know that reverse current is
due to the flow of electrons (minority carriers) from p → n and
holes from n → p. As the reverse bias voltage is increased, theelectric field at the junction becomes significant. When the
reverse bias voltage V = Vz, then the electric field strength is
high enough to pull valence electrons from the host atoms on
the p-side which are accelerated to n-side. These electrons
account for high current observed at the breakdown. Theemission of electrons from the host atoms due to the high
electric field is known as internal field emission or field
ionisation. The electric field required for field ionisation is of
the order of 106 V/m.
FIGURE 14.20 (a) A full-wave rectifier with capacitor filter, (b) Input and output
voltage of rectifier in (a).
FIGURE 14.21 Zener diode,
(a) symbol, (b) I-V
characteristics.
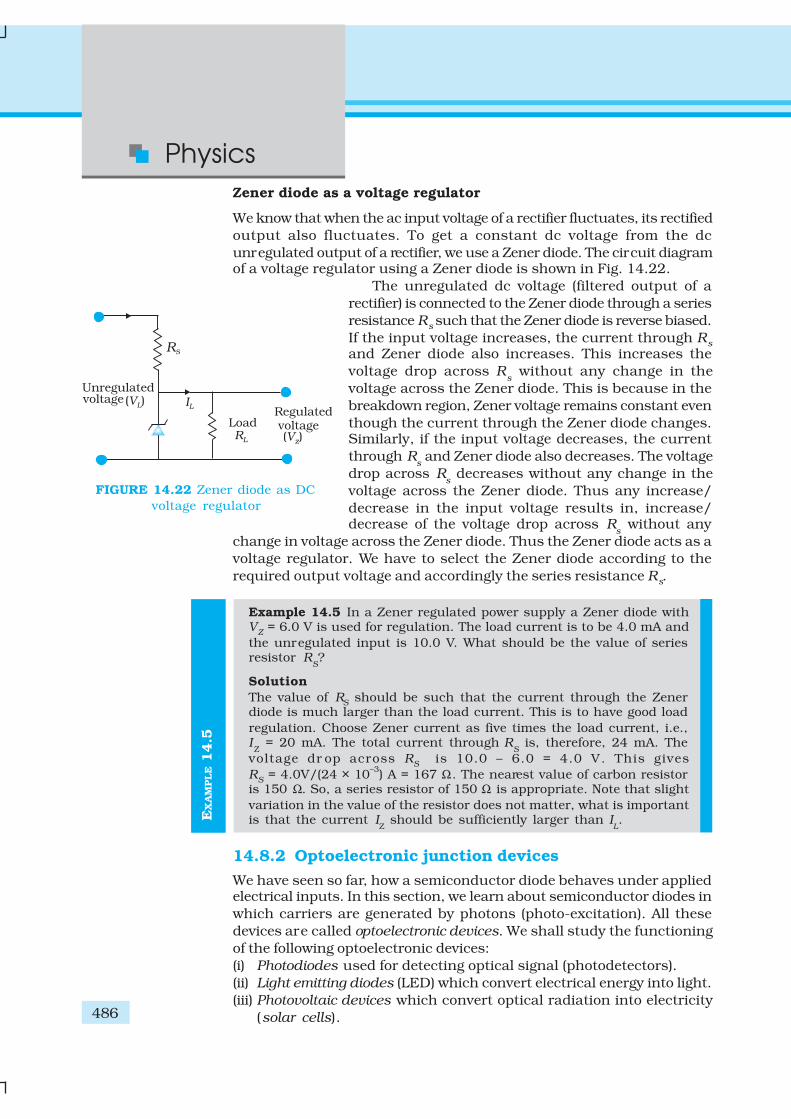
Physics
486
EX
AM
PLE 1
4.5
FIGURE 14.22 Zener diode as DC
voltage regulator
Zener diode as a voltage regulator
We know that when the ac input voltage of a rectifier fluctuates, its rectified
output also fluctuates. To get a constant dc voltage from the dc
unregulated output of a rectifier, we use a Zener diode. The circuit diagramof a voltage regulator using a Zener diode is shown in Fig. 14.22.
The unregulated dc voltage (filtered output of a
rectifier) is connected to the Zener diode through a series
resistance Rs such that the Zener diode is reverse biased.
If the input voltage increases, the current through Rs
and Zener diode also increases. This increases the
voltage drop across Rs without any change in the
voltage across the Zener diode. This is because in the
breakdown region, Zener voltage remains constant even
though the current through the Zener diode changes.Similarly, if the input voltage decreases, the current
through Rs and Zener diode also decreases. The voltage
drop across Rs decreases without any change in the
voltage across the Zener diode. Thus any increase/
decrease in the input voltage results in, increase/decrease of the voltage drop across R
s without any
change in voltage across the Zener diode. Thus the Zener diode acts as a
voltage regulator. We have to select the Zener diode according to the
required output voltage and accordingly the series resistance Rs.
Example 14.5 In a Zener regulated power supply a Zener diode withV
Z = 6.0 V is used for regulation. The load current is to be 4.0 mA and
the unregulated input is 10.0 V. What should be the value of seriesresistor R
S?
Solution
The value of RS should be such that the current through the Zener
diode is much larger than the load current. This is to have good load
regulation. Choose Zener current as five times the load current, i.e.,I
Z = 20 mA. The total current through R
S is, therefore, 24 mA. The
voltage dr op across RS is 10.0 – 6.0 = 4.0 V. This gives
RS = 4.0V/(24 × 10
–3) A = 167 Ω. The nearest value of carbon resistor
is 150 Ω. So, a series resistor of 150 Ω is appropriate. Note that slight
variation in the value of the resistor does not matter, what is importantis that the current I
Z should be sufficiently larger than I
L.
14.8.2 Optoelectronic junction devices
We have seen so far, how a semiconductor diode behaves under appliedelectrical inputs. In this section, we learn about semiconductor diodes in
which carriers are generated by photons (photo-excitation). All these
devices are called optoelectronic devices. We shall study the functioning
of the following optoelectronic devices:
(i) Photodiodes used for detecting optical signal (photodetectors).
(ii) Light emitting diodes (LED) which convert electrical energy into light.
(iii) Photovoltaic devices which convert optical radiation into electricity
(solar cells).
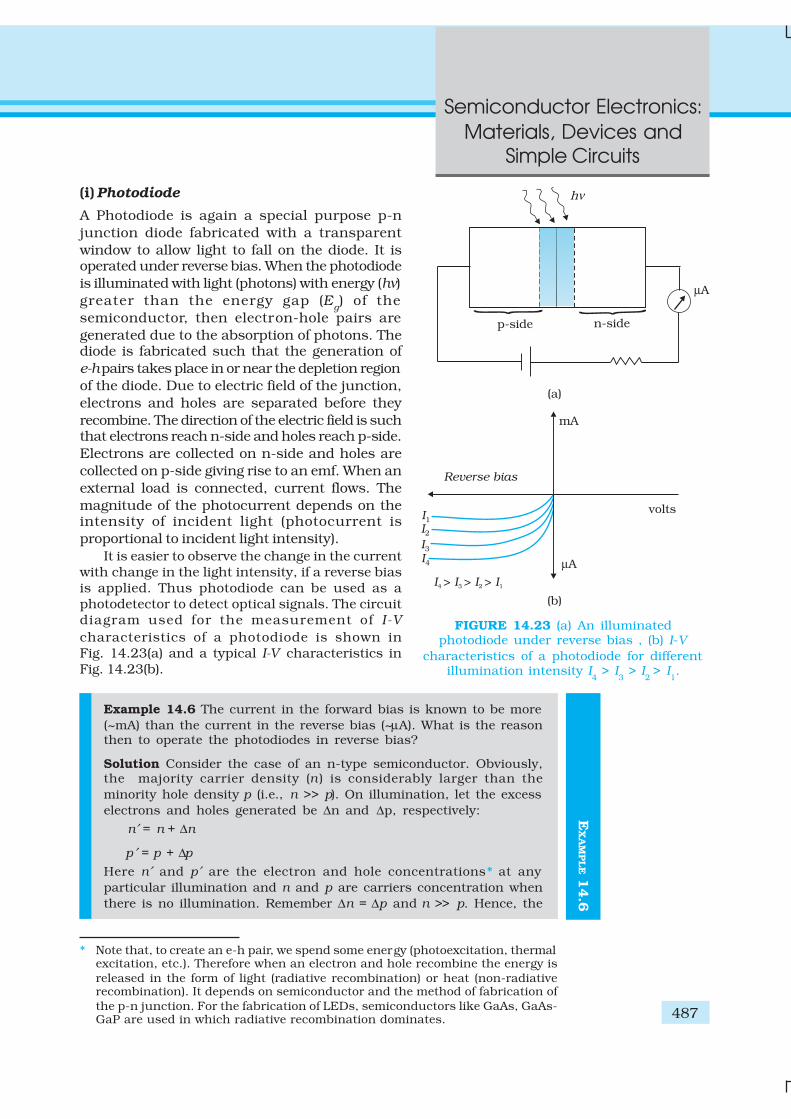
487
Semiconductor Electronics:
Materials, Devices and
Simple Circuits
EX
AM
PLE 1
4.6
(i) Photodiode
A Photodiode is again a special purpose p-n
junction diode fabricated with a transparent
window to allow light to fall on the diode. It isoperated under reverse bias. When the photodiode
is illuminated with light (photons) with energy (hν)
greater than the energy gap (Eg) of the
semiconductor, then electron-hole pairs are
generated due to the absorption of photons. Thediode is fabricated such that the generation of
e-h pairs takes place in or near the depletion region
of the diode. Due to electric field of the junction,
electrons and holes are separated before they
recombine. The direction of the electric field is suchthat electrons reach n-side and holes reach p-side.
Electrons are collected on n-side and holes are
collected on p-side giving rise to an emf. When an
external load is connected, current flows. The
magnitude of the photocurrent depends on theintensity of incident light (photocurrent is
proportional to incident light intensity).
It is easier to observe the change in the currentwith change in the light intensity, if a reverse biasis applied. Thus photodiode can be used as aphotodetector to detect optical signals. The circuitdiagram used for the measurement of I-V
characteristics of a photodiode is shown inFig. 14.23(a) and a typical I-V characteristics inFig. 14.23(b).
Example 14.6 The current in the forward bias is known to be more
(~mA) than the current in the reverse bias (~µA). What is the reasonthen to operate the photodiodes in reverse bias?
Solution Consider the case of an n-type semiconductor. Obviously,the majority carrier density (n ) is considerably larger than the
minority hole density p (i.e., n >> p). On illumination, let the excess
electrons and holes generated be ∆n and ∆p, respectively:
n′ = n + ∆n
p ′ = p + ∆p
Here n′ and p′ are the electron and hole concentrations* at any
particular illumination and n and p are carriers concentration when
there is no illumination. Remember ∆n = ∆p and n >> p. Hence, the
FIGURE 14.23 (a) An illuminatedphotodiode under reverse bias , (b) I-V
characteristics of a photodiode for differentillumination intensity I
4 > I
3 > I
2 > I
1.
* Note that, to create an e-h pair, we spend some energy (photoexcitation, thermalexcitation, etc.). Therefore when an electron and hole recombine the energy is
released in the form of light (radiative recombination) or heat (non-radiativerecombination). It depends on semiconductor and the method of fabrication of
the p-n junction. For the fabrication of LEDs, semiconductors like GaAs, GaAs-GaP are used in which radiative recombination dominates.

Physics
488
EX
AM
PLE 1
4.6
fractional change in the majority carriers (i.e., ∆n/n ) would be muchless than that in the minority carriers (i.e., ∆p/p). In general, we can
state that the fractional change due to the photo-effects on theminority carrier dominated reverse bias current is more easily
measurable than the fractional change in the forward bias current.
Hence, photodiodes are preferably used in the reverse bias condition
for measuring light intensity.
(ii) Light emitting diode
It is a heavily doped p-n junction which under forward bias emits
spontaneous radiation. The diode is encapsulated with a transparent
cover so that emitted light can come out.
When the diode is forward biased, electrons are sent from n → p (where
they are minority carriers) and holes are sent from p → n (where they are
minority carriers). At the junction boundary the concentration of minority
carriers increases compared to the equilibrium concentration (i.e., when
there is no bias). Thus at the junction boundary on either side of thejunction, excess minority carriers are there which recombine with majority
carriers near the junction. On recombination, the energy is released in
the form of photons. Photons with energy equal to or slightly less than
the band gap are emitted. When the forward current of the diode is small,
the intensity of light emitted is small. As the forward current increases,
intensity of light increases and reaches a maximum. Further increase in
the forward current results in decrease of light intensity. LEDs are biased
such that the light emitting efficiency is maximum.
The V-I characteristics of a LED is similar to that of a Si junction
diode. But the threshold voltages are much higher and slightly different
for each colour. The reverse breakdown voltages of LEDs are very low,typically around 5V. So care should be taken that high reverse voltages
do not appear across them.
LEDs that can emit red, yellow, orange, green and blue light are
commercially available. The semiconductor used for fabrication of visible
LEDs must at least have a band gap of 1.8 eV (spectral range of visible
light is from about 0.4 µm to 0.7 µm, i.e., from about 3 eV to 1.8 eV). The
compound semiconductor Gallium Arsenide – Phosphide (GaAs1–xPx) is
used for making LEDs of different colours. GaAs0.6 P0.4 (Eg ~ 1.9 eV) is
used for red LED. GaAs (Eg ~ 1.4 eV) is used for making infrared LED.
These LEDs find extensive use in remote controls, burglar alarm systems,optical communication, etc. Extensive research is being done for
developing white LEDs which can replace incandescent lamps.
LEDs have the following advantages over conventional incandescent
low power lamps:
(i) Low operational voltage and less power.
(ii) Fast action and no warm-up time required.
(iii) The bandwidth of emitted light is 100 Å to 500 Å or in other words it
is nearly (but not exactly) monochromatic.
(iv) Long life and ruggedness.
(v) Fast on-off switching capability.
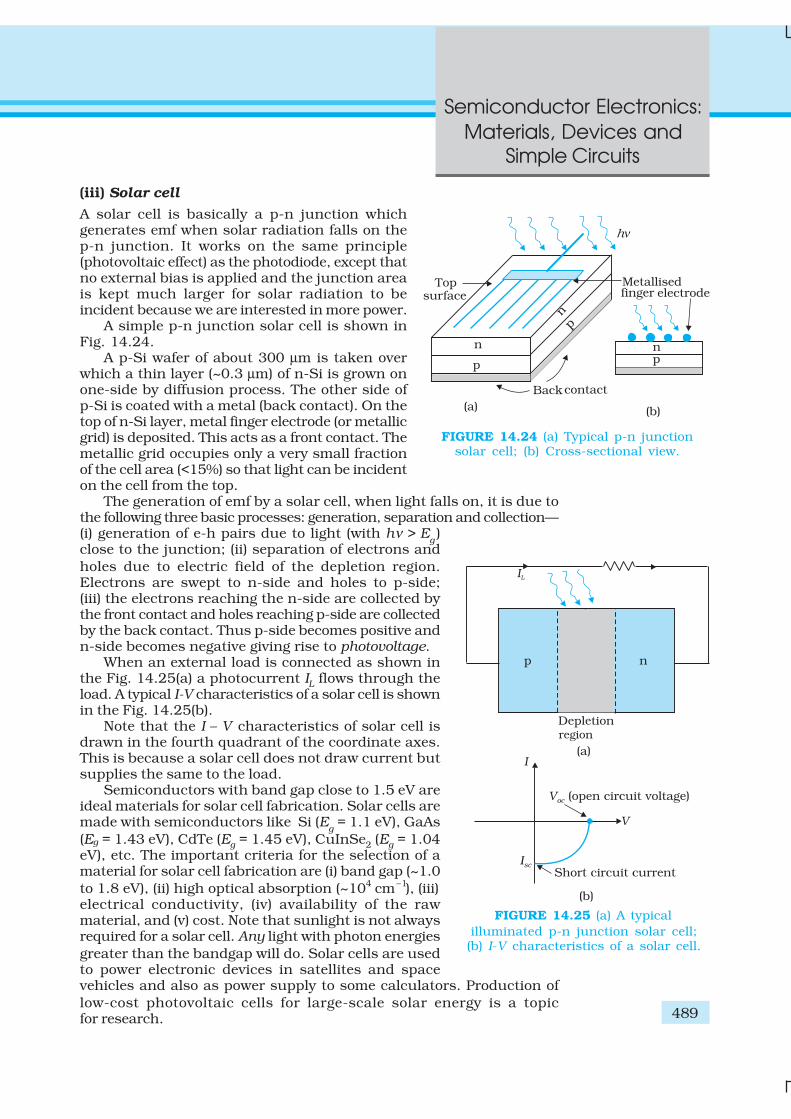
489
Semiconductor Electronics:
Materials, Devices and
Simple Circuits
(iii) Solar cell
A solar cell is basically a p-n junction whichgenerates emf when solar radiation falls on thep-n junction. It works on the same principle(photovoltaic effect) as the photodiode, except thatno external bias is applied and the junction areais kept much larger for solar radiation to beincident because we are interested in more power.
A simple p-n junction solar cell is shown inFig. 14.24.
A p-Si wafer of about 300 µm is taken overwhich a thin layer (~0.3 µm) of n-Si is grown onone-side by diffusion process. The other side ofp-Si is coated with a metal (back contact). On thetop of n-Si layer, metal finger electrode (or metallicgrid) is deposited. This acts as a front contact. Themetallic grid occupies only a very small fractionof the cell area (<15%) so that light can be incidenton the cell from the top.
The generation of emf by a solar cell, when light falls on, it is due tothe following three basic processes: generation, separation and collection—(i) generation of e-h pairs due to light (with hν > E
g)
close to the junction; (ii) separation of electrons and
holes due to electric field of the depletion region.Electrons are swept to n-side and holes to p-side;(iii) the electrons reaching the n-side are collected bythe front contact and holes reaching p-side are collectedby the back contact. Thus p-side becomes positive andn-side becomes negative giving rise to photovoltage.
When an external load is connected as shown inthe Fig. 14.25(a) a photocurrent IL flows through theload. A typical I-V characteristics of a solar cell is shownin the Fig. 14.25(b).
Note that the I – V characteristics of solar cell isdrawn in the fourth quadrant of the coordinate axes.This is because a solar cell does not draw current butsupplies the same to the load.
Semiconductors with band gap close to 1.5 eV areideal materials for solar cell fabrication. Solar cells aremade with semiconductors like Si (E
g = 1.1 eV), GaAs
(Eg = 1.43 eV), CdTe (Eg = 1.45 eV), CuInSe2 (Eg = 1.04eV), etc. The important criteria for the selection of amaterial for solar cell fabrication are (i) band gap (~1.0
to 1.8 eV), (ii) high optical absorption (~104 cm–1), (iii)electrical conductivity, (iv) availability of the rawmaterial, and (v) cost. Note that sunlight is not alwaysrequired for a solar cell. Any light with photon energies
greater than the bandgap will do. Solar cells are usedto power electronic devices in satellites and spacevehicles and also as power supply to some calculators. Production of
low-cost photovoltaic cells for large-scale solar energy is a topicfor research.
FIGURE 14.24 (a) Typical p-n junctionsolar cell; (b) Cross-sectional view.
FIGURE 14.25 (a) A typical
illuminated p-n junction solar cell;(b) I-V characteristics of a solar cell.
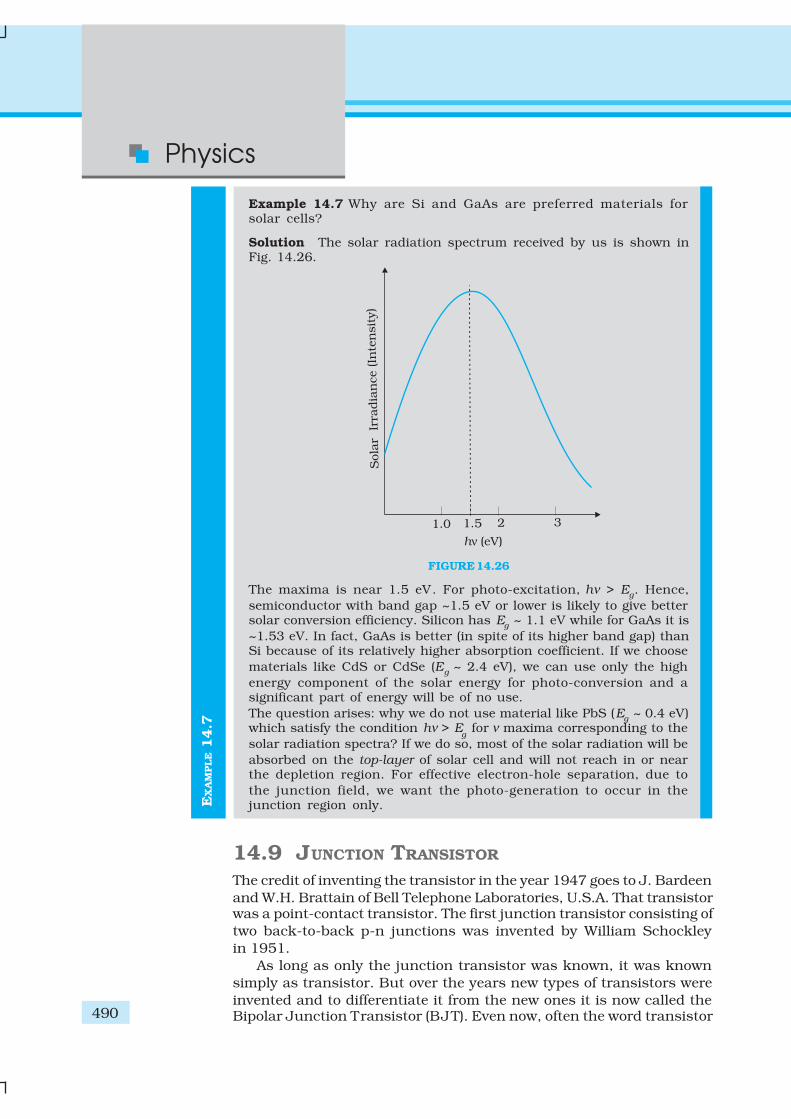
Physics
490
EX
AM
PLE 1
4.7
Example 14.7 Why are Si and GaAs are preferred materials forsolar cells?
Solution The solar radiation spectrum received by us is shown inFig. 14.26.
FIGURE 14.26
The maxima is near 1.5 eV. For photo-excitation, hν > Eg. Hence,
semiconductor with band gap ~1.5 eV or lower is likely to give bettersolar conversion efficiency. Silicon has E
g ~ 1.1 eV while for GaAs it is
~1.53 eV. In fact, GaAs is better (in spite of its higher band gap) thanSi because of its relatively higher absorption coefficient. If we choose
materials like CdS or CdSe (Eg ~ 2.4 eV), we can use only the high
energy component of the solar energy for photo-conversion and asignificant part of energy will be of no use.
The question arises: why we do not use material like PbS (Eg ~ 0.4 eV)
which satisfy the condition hν > Eg for ν maxima corresponding to the
solar radiation spectra? If we do so, most of the solar radiation will be
absorbed on the top-layer of solar cell and will not reach in or nearthe depletion region. For effective electron-hole separation, due to
the junction field, we want the photo-generation to occur in thejunction region only.
14.9 JUNCTION TRANSISTOR
The credit of inventing the transistor in the year 1947 goes to J. Bardeen
and W.H. Brattain of Bell Telephone Laboratories, U.S.A. That transistorwas a point-contact transistor. The first junction transistor consisting of
two back-to-back p-n junctions was invented by William Schockley
in 1951.
As long as only the junction transistor was known, it was known
simply as transistor. But over the years new types of transistors were
invented and to differentiate it from the new ones it is now called theBipolar Junction Transistor (BJT). Even now, often the word transistor
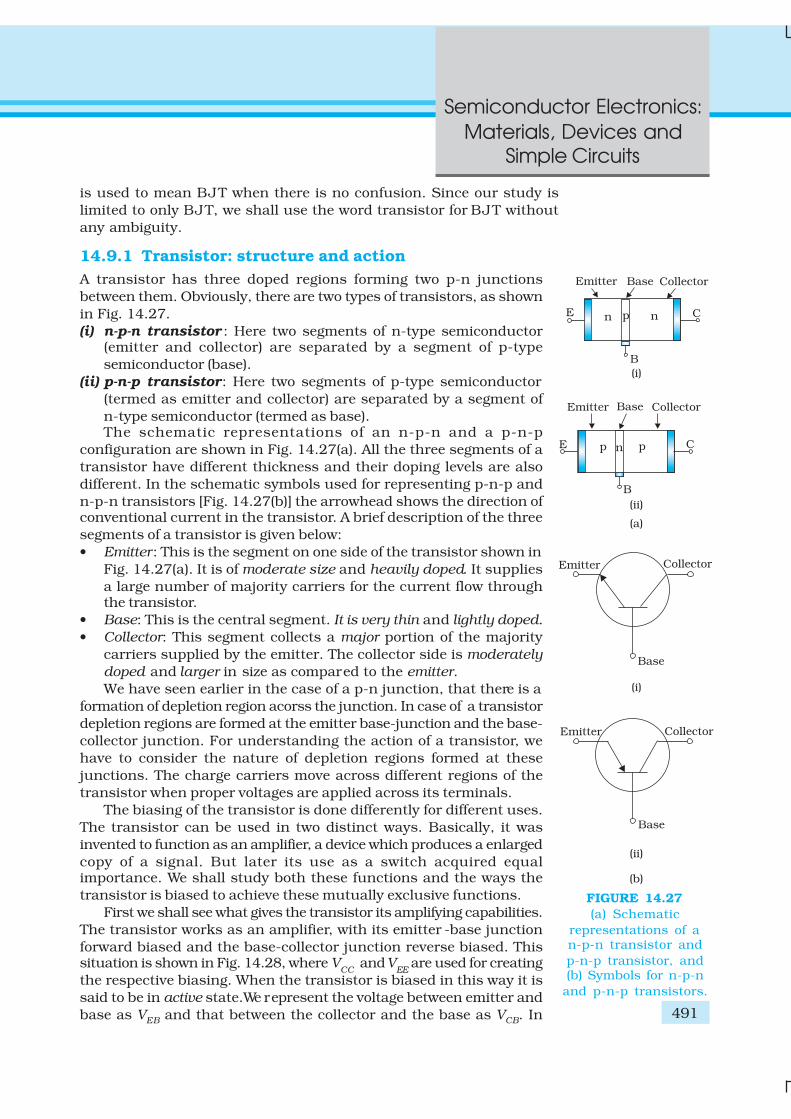
491
Semiconductor Electronics:
Materials, Devices and
Simple Circuits
is used to mean BJT when there is no confusion. Since our study is
limited to only BJT, we shall use the word transistor for BJT without
any ambiguity.
14.9.1 Transistor: structure and action
A transistor has three doped regions forming two p-n junctions
between them. Obviously, there are two types of transistors, as shown
in Fig. 14.27.
(i) n-p-n transistor : Here two segments of n-type semiconductor(emitter and collector) are separated by a segment of p-type
semiconductor (base).
(ii) p-n-p transistor: Here two segments of p-type semiconductor
(termed as emitter and collector) are separated by a segment of
n-type semiconductor (termed as base).The schematic representations of an n-p-n and a p-n-p
configuration are shown in Fig. 14.27(a). All the three segments of a
transistor have different thickness and their doping levels are also
different. In the schematic symbols used for representing p-n-p and
n-p-n transistors [Fig. 14.27(b)] the arrowhead shows the direction ofconventional current in the transistor. A brief description of the three
segments of a transistor is given below:
• Emitter: This is the segment on one side of the transistor shown in
Fig. 14.27(a). It is of moderate size and heavily doped. It supplies
a large number of majority carriers for the current flow throughthe transistor.
• Base: This is the central segment. It is very thin and lightly doped.
• Collector: This segment collects a major portion of the majority
carriers supplied by the emitter. The collector side is moderately
doped and larger in size as compared to the emitter.
We have seen earlier in the case of a p-n junction, that there is a
formation of depletion region acorss the junction. In case of a transistor
depletion regions are formed at the emitter base-junction and the base-
collector junction. For understanding the action of a transistor, we
have to consider the nature of depletion regions formed at these
junctions. The charge carriers move across different regions of the
transistor when proper voltages are applied across its terminals.
The biasing of the transistor is done differently for different uses.
The transistor can be used in two distinct ways. Basically, it was
invented to function as an amplifier, a device which produces a enlarged
copy of a signal. But later its use as a switch acquired equalimportance. We shall study both these functions and the ways the
transistor is biased to achieve these mutually exclusive functions.
First we shall see what gives the transistor its amplifying capabilities.
The transistor works as an amplifier, with its emitter -base junction
forward biased and the base-collector junction reverse biased. Thissituation is shown in Fig. 14.28, where V
CC and V
EE are used for creating
the respective biasing. When the transistor is biased in this way it is
said to be in active state.We represent the voltage between emitter and
base as VEB and that between the collector and the base as VCB. In
FIGURE 14.27
(a) Schematic
representations of an-p-n transistor and
p-n-p transistor, and(b) Symbols for n-p-n
and p-n-p transistors.
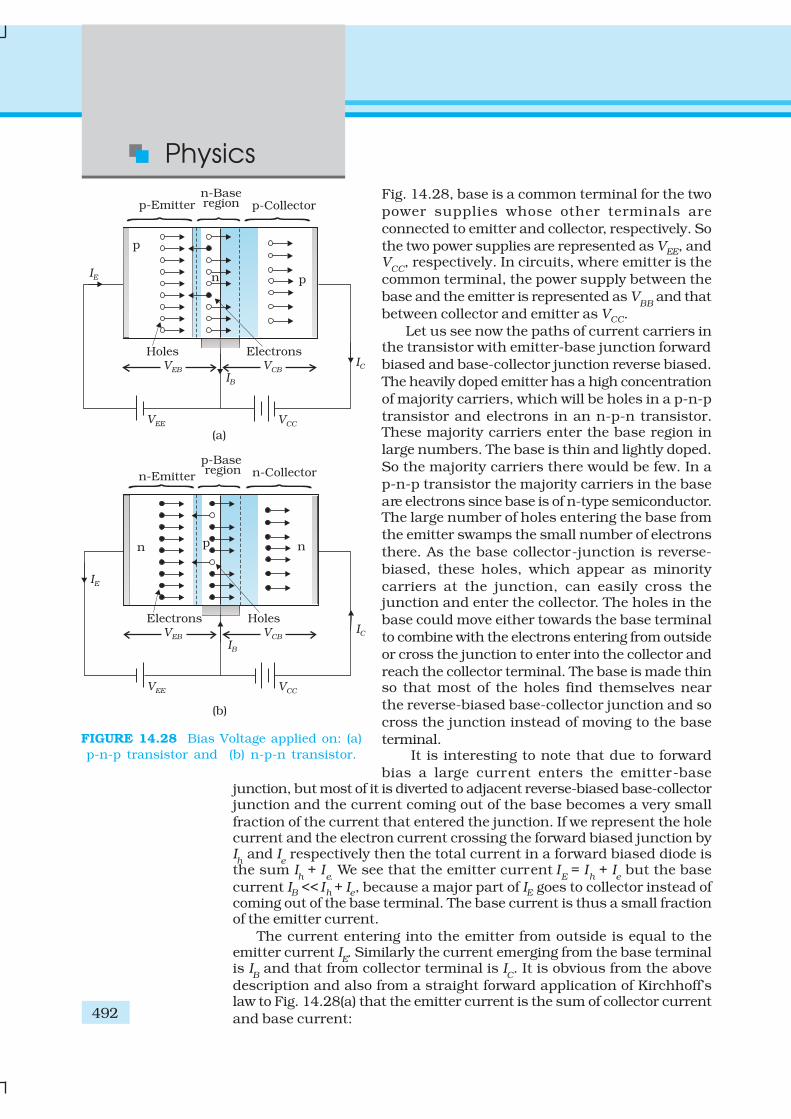
Physics
492
Fig. 14.28, base is a common terminal for the two
power supplies whose other terminals are
connected to emitter and collector, respectively. So
the two power supplies are represented as VEE, andV
CC, respectively. In circuits, where emitter is the
common terminal, the power supply between the
base and the emitter is represented as VBB
and that
between collector and emitter as VCC.
Let us see now the paths of current carriers inthe transistor with emitter-base junction forward
biased and base-collector junction reverse biased.
The heavily doped emitter has a high concentration
of majority carriers, which will be holes in a p-n-p
transistor and electrons in an n-p-n transistor.These majority carriers enter the base region in
large numbers. The base is thin and lightly doped.
So the majority carriers there would be few. In a
p-n-p transistor the majority carriers in the base
are electrons since base is of n-type semiconductor.The large number of holes entering the base from
the emitter swamps the small number of electrons
there. As the base collector-junction is reverse-
biased, these holes, which appear as minority
carriers at the junction, can easily cross thejunction and enter the collector. The holes in the
base could move either towards the base terminal
to combine with the electrons entering from outside
or cross the junction to enter into the collector and
reach the collector terminal. The base is made thinso that most of the holes find themselves near
the reverse-biased base-collector junction and so
cross the junction instead of moving to the base
terminal. It is interesting to note that due to forward
bias a large current enters the emitter-basejunction, but most of it is diverted to adjacent reverse-biased base-collectorjunction and the current coming out of the base becomes a very small
fraction of the current that entered the junction. If we represent the holecurrent and the electron current crossing the forward biased junction byIh and I
e respectively then the total current in a forward biased diode is
the sum Ih + I
e. We see that the emitter current I
E = I
h + I
e but the base
current IB << Ih + Ie, because a major part of IE goes to collector instead ofcoming out of the base terminal. The base current is thus a small fractionof the emitter current.
The current entering into the emitter from outside is equal to theemitter current I
E. Similarly the current emerging from the base terminal
is IB and that from collector terminal is I
C. It is obvious from the above
description and also from a straight forward application of Kirchhoff’slaw to Fig. 14.28(a) that the emitter current is the sum of collector current
and base current:
FIGURE 14.28 Bias Voltage applied on: (a)
p-n-p transistor and (b) n-p-n transistor.
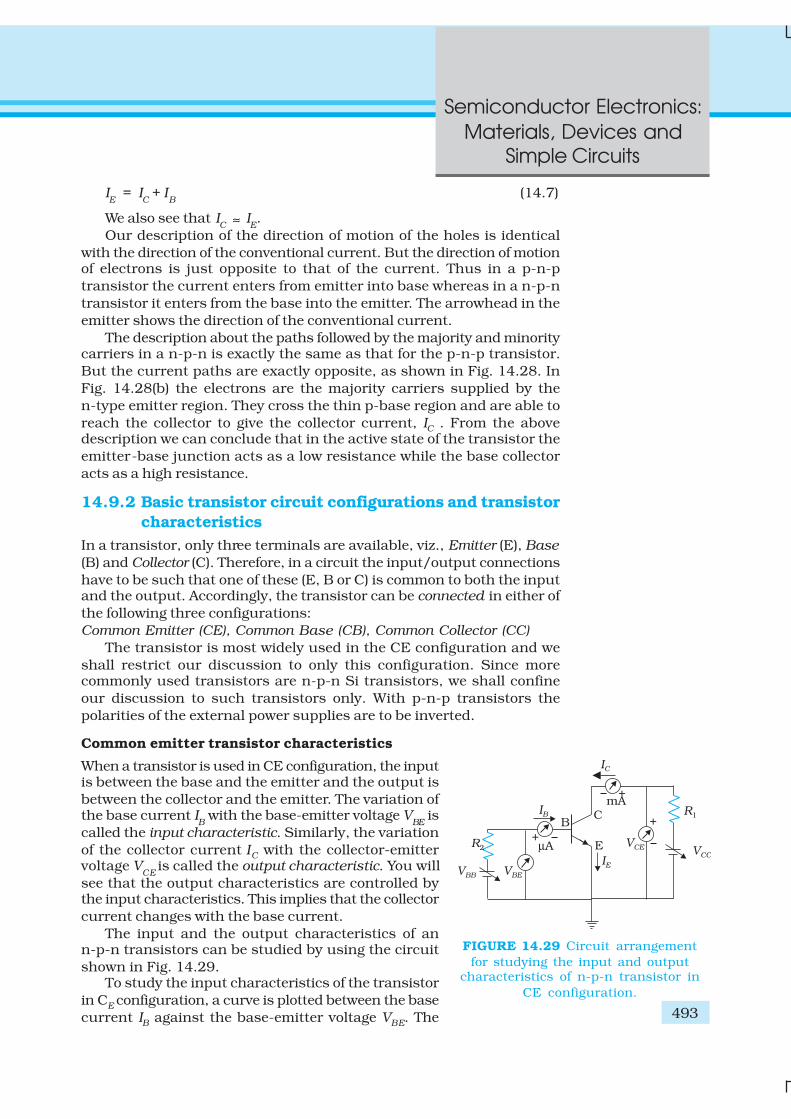
493
Semiconductor Electronics:
Materials, Devices and
Simple Circuits
IE = I
C + I
B(14.7)
We also see that IC ≈ I
E.
Our description of the direction of motion of the holes is identical
with the direction of the conventional current. But the direction of motionof electrons is just opposite to that of the current. Thus in a p-n-p
transistor the current enters from emitter into base whereas in a n-p-n
transistor it enters from the base into the emitter. The arrowhead in the
emitter shows the direction of the conventional current.
The description about the paths followed by the majority and minoritycarriers in a n-p-n is exactly the same as that for the p-n-p transistor.
But the current paths are exactly opposite, as shown in Fig. 14.28. In
Fig. 14.28(b) the electrons are the majority carriers supplied by the
n-type emitter region. They cross the thin p-base region and are able to
reach the collector to give the collector current, IC . From the abovedescription we can conclude that in the active state of the transistor the
emitter-base junction acts as a low resistance while the base collector
acts as a high resistance.
14.9.2 Basic transistor circuit configurations and transistor
characteristics
In a transistor, only three terminals are available, viz., Emitter (E), Base
(B) and Collector (C). Therefore, in a circuit the input/output connections
have to be such that one of these (E, B or C) is common to both the inputand the output. Accordingly, the transistor can be connected in either of
the following three configurations:
Common Emitter (CE), Common Base (CB), Common Collector (CC)
The transistor is most widely used in the CE configuration and we
shall restrict our discussion to only this configuration. Since morecommonly used transistors are n-p-n Si transistors, we shall confine
our discussion to such transistors only. With p-n-p transistors the
polarities of the external power supplies are to be inverted.
Common emitter transistor characteristics
When a transistor is used in CE configuration, the inputis between the base and the emitter and the output is
between the collector and the emitter. The variation ofthe base current I
B with the base-emitter voltage V
BE is
called the input characteristic. Similarly, the variation
of the collector current IC with the collector-emittervoltage V
CE is called the output characteristic. You will
see that the output characteristics are controlled bythe input characteristics. This implies that the collector
current changes with the base current.
The input and the output characteristics of ann-p-n transistors can be studied by using the circuit
shown in Fig. 14.29.To study the input characteristics of the transistor
in CE configuration, a curve is plotted between the base
current IB against the base-emitter voltage VBE. The
FIGURE 14.29 Circuit arrangement
for studying the input and outputcharacteristics of n-p-n transistor in
CE configuration.
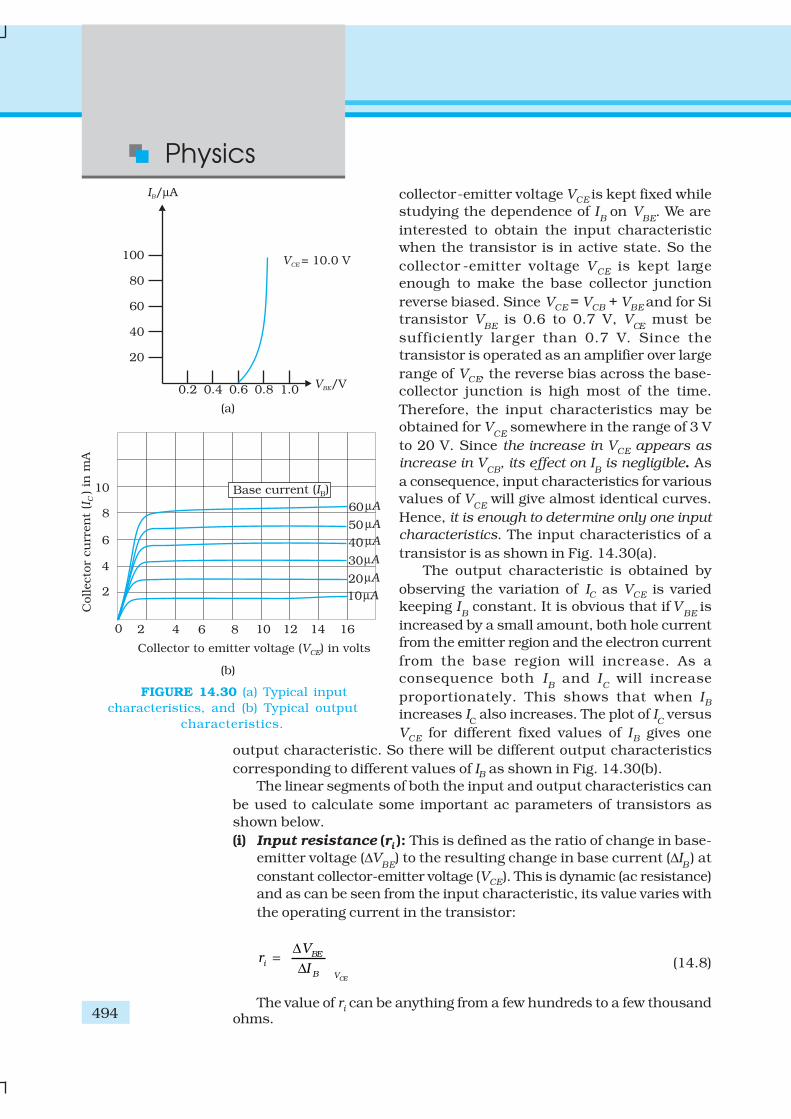
Physics
494
collector-emitter voltage VCE is kept fixed while
studying the dependence of IB on V
BE. We are
interested to obtain the input characteristic
when the transistor is in active state. So the
collector -emitter voltage VCE is kept large
enough to make the base collector junction
reverse biased. Since VCE = VCB + VBE and for Si
transistor VBE
is 0.6 to 0.7 V, VCE
must be
sufficiently larger than 0.7 V. Since the
transistor is operated as an amplifier over large
range of VCE, the reverse bias across the base-
collector junction is high most of the time.
Therefore, the input characteristics may be
obtained for VCE
somewhere in the range of 3 V
to 20 V. Since the increase in VCE appears as
increase in VCB
, its effect on IB is negligible. As
a consequence, input characteristics for various
values of VCE
will give almost identical curves.
Hence, it is enough to determine only one input
characteristics. The input characteristics of a
transistor is as shown in Fig. 14.30(a).
The output characteristic is obtained by
observing the variation of IC as VCE is varied
keeping IB constant. It is obvious that if V
BE is
increased by a small amount, both hole current
from the emitter region and the electron current
from the base region will increase. As a
consequence both IB and I
C will increase
proportionately. This shows that when IB
increases IC also increases. The plot of I
C versus
VCE for different fixed values of IB gives one
output characteristic. So there will be different output characteristics
corresponding to different values of IB as shown in Fig. 14.30(b).
The linear segments of both the input and output characteristics can
be used to calculate some important ac parameters of transistors as
shown below.
(i) Input resistance (ri ): This is defined as the ratio of change in base-
emitter voltage (∆VBE
) to the resulting change in base current (∆IB) at
constant collector-emitter voltage (VCE). This is dynamic (ac resistance)
and as can be seen from the input characteristic, its value varies with
the operating current in the transistor:
CE
BEi
B V
Vr
I
∆= ∆ (14.8)
The value of ri can be anything from a few hundreds to a few thousandohms.
FIGURE 14.30 (a) Typical input
characteristics, and (b) Typical output
characteristics.
495
Semiconductor Electronics:
Materials, Devices and
Simple Circuits
EX
AM
PLE 1
4.8
(ii) Output resistance (ro): This is defined as the ratio of change in
collector-emitter voltage (∆VCE
) to the change in collector current (∆IC)
at a constant base current IB.
B
CEo
C I
Vr
I
∆= ∆ (14.9)
The output characteristics show that initially for very small values ofV
CE, I
C increases almost linearly. This happens because the base-collector
junction is not reverse biased and the transistor is not in active state. In
fact, the transistor is in the saturation state and the current is controlled
by the supply voltage VCC (=VCE) in this part of the characteristic. When
VCE is more than that required to reverse bias the base-collector junction,IC increases very little with V
CE. The reciprocal of the slope of the linear
part of the output characteristic gives the values of ro. The output
resistance of the transistor is mainly controlled by the bias of the base-
collector junction. The high magnitude of the output resistance (of the
order of 100 kΩ) is due to the reverse-biased state of this diode. Thisalso explains why the resistance at the initial part of the characteristic,
when the transistor is in saturation state, is very low.
(iii) Current amplification factor (βββββ ): This is defined as the ratio of
the change in collector current to the change in base current at a
constant collector-emitter voltage (VCE) when the transistor is inactive state.
CE
Cac
B V
I
Iβ
∆= ∆ (14.10)
This is also known as small signal current gain and its value is very
large.
If we simply find the ratio of IC and IB we get what is called dc β of the
transistor. Hence,
Cdc
B
I
Iβ = (14.11)
Since IC increases with I
B almost linearly and I
C = 0 when I
B = 0, the values
of both βdc
and βac
are nearly equal. So, for most calculations βdc
can be
used. Both βac
and βdc
vary with VCE
and IB
(or IC) slightly.
Example 14.8 From the output characteristics shown in Fig. 14.30(b),calculate the values of β
ac and β
dc of the transistor when V
CE is
10 V and IC = 4.0 mA.
Solution
CE
Cac
B V
I
Iβ
∆= ∆ ,
C
dc
B
I
Iβ =
For determining βac
and βdc
at the stated values of VCE
and IC one can
proceed as follows. Consider any two characteristics for two values
of IB which lie above and below the given value of I
C . Here IC = 4.0 mA.
(Choose characteristics for IB= 30 and 20 µA.) At V
CE = 10 V we read
the two values of IC from the graph. Then
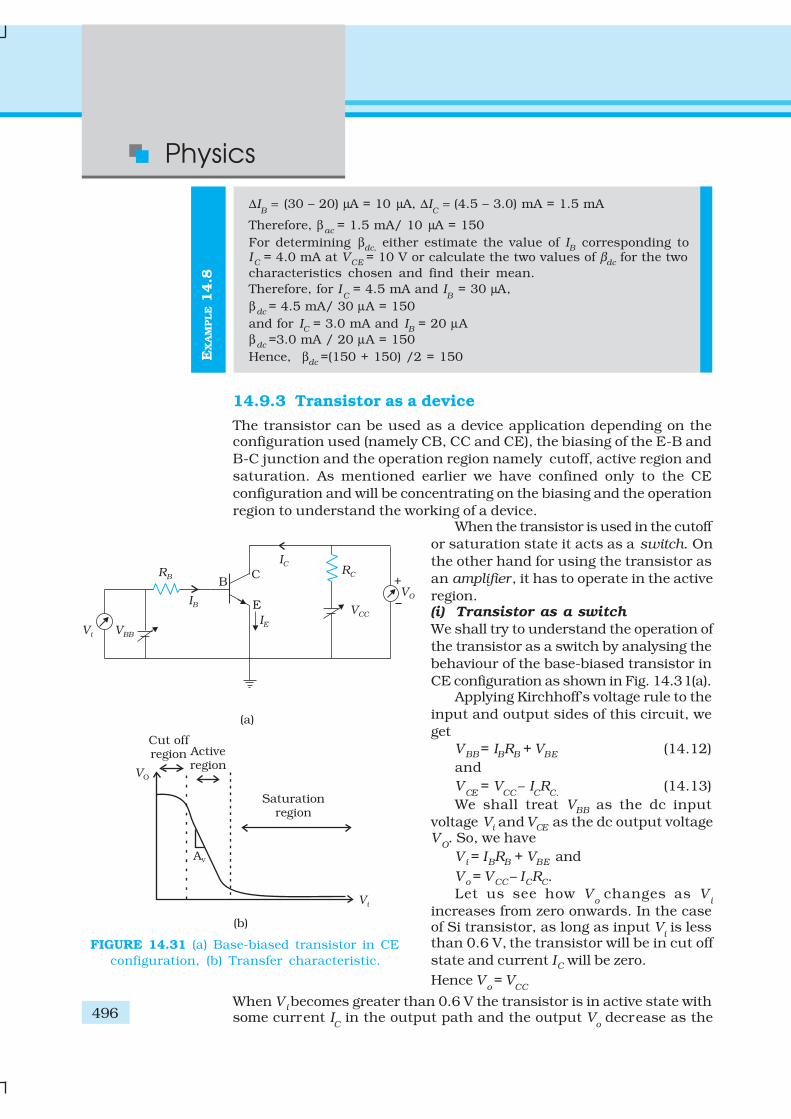
Physics
496
EX
AM
PLE 1
4.8
∆IB = (30 – 20) µA = 10 µA, ∆I
C = (4.5 – 3.0) mA = 1.5 mA
Therefore, βac = 1.5 mA/ 10 µA = 150
For determining βdc, either estimate the value of I
B corresponding to
IC = 4.0 mA at V
CE = 10 V or calculate the two values of β
dc for the two
characteristics chosen and find their mean.
Therefore, for IC = 4.5 mA and I
B = 30 µA,
βdc = 4.5 mA/ 30 µA = 150
and for IC = 3.0 mA and I
B = 20 µA
βdc =3.0 mA / 20 µA = 150
Hence, βdc =(150 + 150) /2 = 150
14.9.3 Transistor as a device
The transistor can be used as a device application depending on theconfiguration used (namely CB, CC and CE), the biasing of the E-B and
B-C junction and the operation region namely cutoff, active region and
saturation. As mentioned earlier we have confined only to the CE
configuration and will be concentrating on the biasing and the operation
region to understand the working of a device.When the transistor is used in the cutoff
or saturation state it acts as a switch. On
the other hand for using the transistor as
an amplifier, it has to operate in the active
region.(i) Transistor as a switch
We shall try to understand the operation of
the transistor as a switch by analysing the
behaviour of the base-biased transistor in
CE configuration as shown in Fig. 14.31(a).Applying Kirchhoff’s voltage rule to the
input and output sides of this circuit, we
get
VBB = IBRB + VBE (14.12)
and
VCE
= VCC
– ICR
C.(14.13)
We shall treat VBB as the dc input
voltage Vi and VCE as the dc output voltageV
O. So, we have
V i = IBRB + VBE and
Vo = VCC – ICRC.
Let us see how Vo
changes as Vi
increases from zero onwards. In the caseof Si transistor, as long as input V
i is less
than 0.6 V, the transistor will be in cut off
state and current IC will be zero.
Hence Vo = V
CC
When V i becomes greater than 0.6 V the transistor is in active state withsome current I
C in the output path and the output V
o decrease as the
FIGURE 14.31 (a) Base-biased transistor in CE
configuration, (b) Transfer characteristic.
497
Semiconductor Electronics:
Materials, Devices and
Simple Circuits
term ICR
C increases. With increase of V
i , I
C increases almost linearly
and so Vo decreases linearly till its value becomes less thanabout 1.0 V.
Beyond this, the change becomes non linear and transistor goes intosaturation state. With further increase in V
i the output voltage is found to
decrease further towards zero though it may never become zero. If we plotthe V
o vs V
i curve, [also called the transfer characteristics of the base-biased
transistor (Fig. 14.31(b)], we see that between cut off state and active stateand also between active state and saturation state there are regions of
non-linearity showing that the transition from cutoff state to active stateand from active state to saturation state are not sharply defined.
Let us see now how the transistor is operated as a switch. As long asV
i is low and unable to forward-bias the transistor, V
o is high (at V
CC ). If
Vi is high enough to drive the transistor into saturation, then Vo is low,very near to zero. When the transistor is not conducting it is said to be
switched off and when it is driven into saturation it is said to be switchedon. This shows that if we define low and high states as below and above
certain voltage levels corresponding to cutoff and saturation of thetransistor, then we can say that a low input switches the transistor off
and a high input switches it on. Alternatively, we can say that a lowinput to the transistor gives a high output and a high input gives a low
output. The switching circuits are designed in such a way that thetransistor does not remain in active state.
(ii) Transistor as an amplifier
For using the transistor as an amplifier we will use the active region ofthe V
o versus V
i curve. The slope of the linear part of the curve represents
the rate of change of the output with the input. It is negative because theoutput is V
CC – I
CR
C and not I
CR
C. That is why as input voltage of the CE
amplifier increases its output voltage decreases and the output is said tobe out of phase with the input. If we consider ∆V
o and ∆V
i as small
changes in the output and input voltages then ∆Vo/∆Vi is called the smallsignal voltage gain A
V of the amplifier.
If the VBB voltage has a fixed value corresponding to the mid point ofthe active region, the circuit will behave as a CE amplifier with voltage
gain ∆Vo/ ∆Vi . We can express the voltage gain AV in terms of the resistorsin the circuit and the current gain of the transistor as follows.
We have, Vo = VCC – ICRC
Therefore, ∆Vo = 0 – R
C ∆ I
C
Similarly, from Vi = IBRB + VBE
∆Vi = R
B ∆I
B + ∆V
BE
But ∆VBE is negligibly small in comparison to ∆IBRB in this circuit.So, the voltage gain of this CE amplifier (Fig. 14.32) is given by
AV = – RC ∆ IC / RB ∆IB = –β
ac(R
C /R
B ) (14.14)
where βac is equal to ∆ IC/∆IB from Eq. (14.10). Thus the linearportion of the active region of the transistor can be exploited for the use
in amplifiers. Transistor as an amplifier (CE configuration) is discussedin detail in the next section.
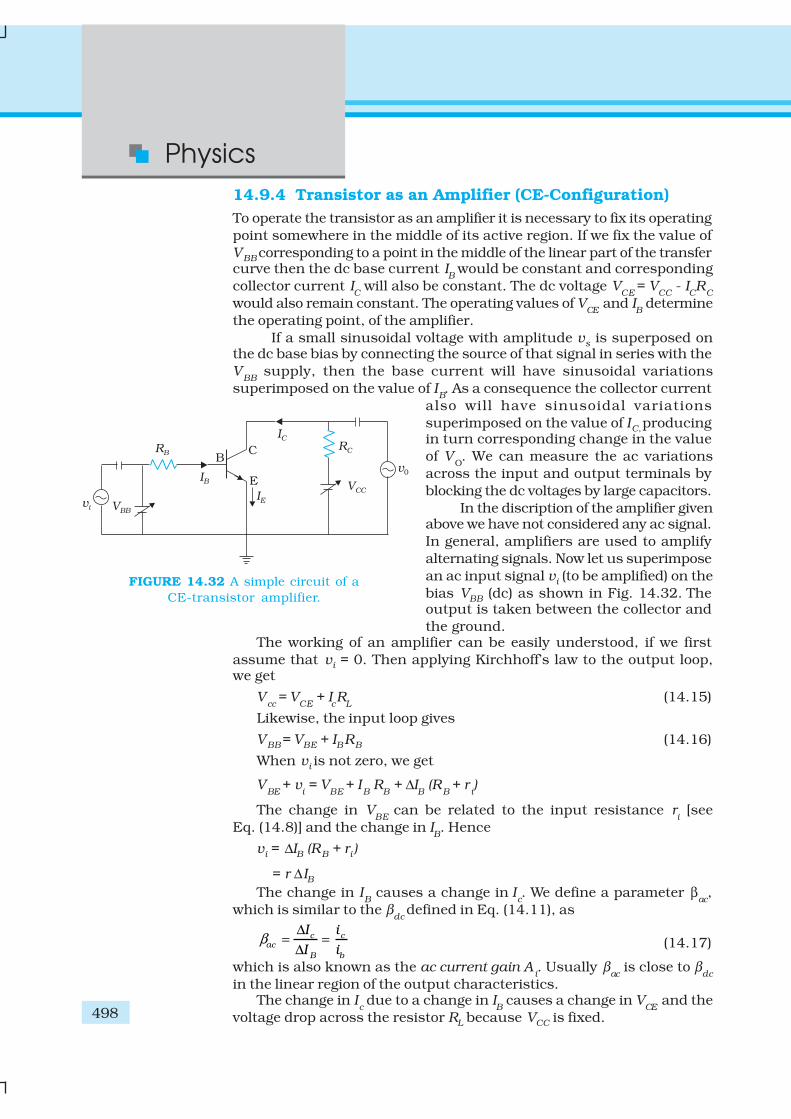
Physics
498
14.9.4 Transistor as an Amplifier (CE-Configuration)
To operate the transistor as an amplifier it is necessary to fix its operating
point somewhere in the middle of its active region. If we fix the value of
VBB corresponding to a point in the middle of the linear part of the transfercurve then the dc base current I
B would be constant and corresponding
collector current IC will also be constant. The dc voltage V
CE = V
CC - I
CR
C
would also remain constant. The operating values of VCE
and IB determine
the operating point, of the amplifier.
If a small sinusoidal voltage with amplitude vs is superposed onthe dc base bias by connecting the source of that signal in series with the
VBB
supply, then the base current will have sinusoidal variations
superimposed on the value of IB. As a consequence the collector current
also will have sinusoidal variations
superimposed on the value of IC, producingin turn corresponding change in the value
of VO. We can measure the ac variations
across the input and output terminals by
blocking the dc voltages by large capacitors.
In the discription of the amplifier givenabove we have not considered any ac signal.
In general, amplifiers are used to amplify
alternating signals. Now let us superimpose
an ac input signal vi (to be amplified) on the
bias VBB (dc) as shown in Fig. 14.32. Theoutput is taken between the collector and
the ground.The working of an amplifier can be easily understood, if we first
assume that vi = 0. Then applying Kirchhoff’s law to the output loop,we get
Vcc
= VCE
+ IcR
L(14.15)
Likewise, the input loop gives
VBB = VBE + IB RB (14.16)
When vi is not zero, we get
VBE
+ vi = V
BE + I
B R
B + ∆I
B (R
B + r
i)
The change in VBE
can be related to the input resistance ri [see
Eq. (14.8)] and the change in IB. Hence
vi = ∆IB (RB + ri )
= r ∆IBThe change in I
B causes a change in I
c. We define a parameter β
ac,
which is similar to the βdc
defined in Eq. (14.11), as
c cac
B b
I i
I iβ
∆= =
∆ (14.17)
which is also known as the ac current gain Ai. Usually β
ac is close to β
dc
in the linear region of the output characteristics.The change in I
c due to a change in I
B causes a change in V
CE and the
voltage drop across the resistor RL because VCC is fixed.
FIGURE 14.32 A simple circuit of a
CE-transistor amplifier.
499
Semiconductor Electronics:
Materials, Devices and
Simple Circuits
EX
AM
PLE 1
4.9
These changes can be given by Eq. (14.15) as
∆VCC
= ∆VCE
+ RL ∆I
C = 0
or ∆VCE
= –RL
∆IC
The change in VCE is the output voltage v0. From Eq. (14.10), we get
v0 = ∆VCE = –βac RL ∆IBThe voltage gain of the amplifier is
0 CEv
i B
v VA
v r I
∆= =
∆
– ac LR
r
β= (14.18)
The negative sign represents that output voltage is opposite with phase
with the input voltage.From the discussion of the transistor characteristics you have seen
that there is a current gain βac
in the CE configuration. Here we have also
seen the voltage gain Av. Therefore the power gain Ap can be expressed
as the product of the current gain and voltage gain. Mathematically
Ap = βac × Av (14.19)
Since βac
and Av are greater than 1, we get ac power gain. However it
should be realised that transistor is not a power generating device. The
energy for the higher ac power at the output is supplied by the battery.
Example 14.9 In Fig. 14.31(a), the VBB
supply can be varied from 0Vto 5.0 V. The Si transistor has β
dc = 250 and R
B = 100 kΩ, R
C = 1 KΩ,
VCC
= 5.0V. Assume that when the transistor is saturated, VCE
= 0V
and VBE
= 0.8V. Calculate (a) the minimum base current, for whichthe transistor will reach saturation. Hence, (b) determine V1 when
the transistor is ‘switched on’. (c) find the ranges of V1 for which thetransistor is ‘switched off’ and ‘switched on’.
Solution
Given at saturation VCE
= 0V, VBE
= 0.8V
VCE
= VCC
– ICR
C
IC = V
CC/R
C = 5.0V/1.0kΩ = 5.0 mA
Therefore IB = I
C/β = 5.0 mA/250 = 20µA
The input voltage at which the transistor will go into saturation is
given by
VIH
= VBB
= IBR
B +V
BE
= 20µA × 100 kΩ + 0.8V = 2.8V
The value of input voltage below which the transistor remains cutoff
is given by
VIL = 0.6V, V
IH = 2.8V
Between 0.0V and 0.6V, the transistor will be in the ‘switched off’
state. Between 2.8V and 5.0V, it will be in ‘switched on’ state.
Note that the transistor is in active state when IB varies from 0.0mA
to 20mA. In this range, IC = βI
B is valid. In the saturation range,
IC ≤ βI
B.
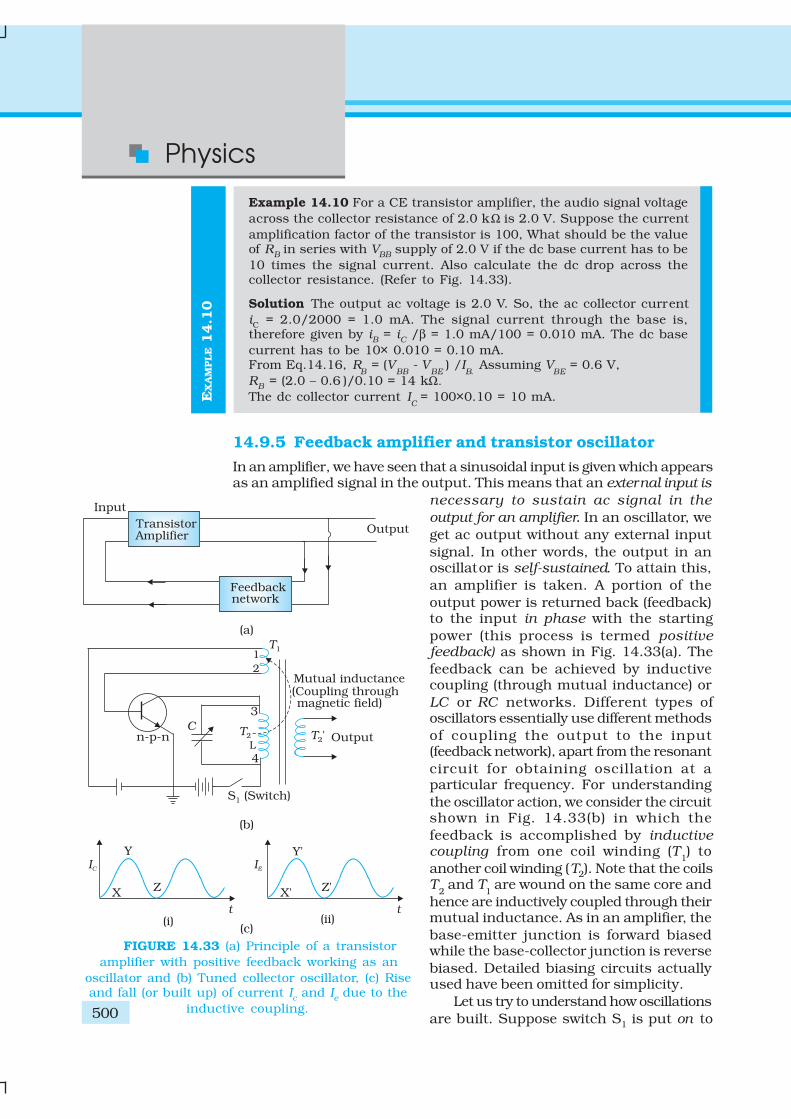
Physics
500
EX
AM
PLE 1
4.1
0Example 14.10 For a CE transistor amplifier, the audio signal voltage
across the collector resistance of 2.0 kΩ is 2.0 V. Suppose the current
amplification factor of the transistor is 100, What should be the valueof R
B in series with V
BB supply of 2.0 V if the dc base current has to be
10 times the signal current. Also calculate the dc drop across thecollector resistance. (Refer to Fig. 14.33).
Solution The output ac voltage is 2.0 V. So, the ac collector current
iC = 2.0/2000 = 1.0 mA. The signal current through the base is,therefore given by i
B = i
C /β = 1.0 mA/100 = 0.010 mA. The dc base
current has to be 10× 0.010 = 0.10 mA.From Eq.14.16, R
B = (V
BB - V
BE ) /I
B. Assuming V
BE = 0.6 V,
RB = (2.0 – 0.6 )/0.10 = 14 kΩ.
The dc collector current IC
= 100×0.10 = 10 mA.
14.9.5 Feedback amplifier and transistor oscillator
In an amplifier, we have seen that a sinusoidal input is given which appearsas an amplified signal in the output. This means that an external input is
necessary to sustain ac signal in the
output for an amplifier. In an oscillator, we
get ac output without any external input
signal. In other words, the output in anoscillator is self-sustained. To attain this,
an amplifier is taken. A portion of the
output power is returned back (feedback)to the input in phase with the starting
power (this process is termed positivefeedback) as shown in Fig. 14.33(a). The
feedback can be achieved by inductivecoupling (through mutual inductance) or
LC or RC networks. Different types ofoscillators essentially use different methods
of coupling the output to the input(feedback network), apart from the resonant
circuit for obtaining oscillation at aparticular frequency. For understanding
the oscillator action, we consider the circuitshown in Fig. 14.33(b) in which the
feedback is accomplished by inductivecoupling from one coil winding (T
1) to
another coil winding (T2). Note that the coilsT
2 and T
1 are wound on the same core and
hence are inductively coupled through theirmutual inductance. As in an amplifier, the
base-emitter junction is forward biasedwhile the base-collector junction is reverse
biased. Detailed biasing circuits actuallyused have been omitted for simplicity.
Let us try to understand how oscillations
are built. Suppose switch S1 is put on to
FIGURE 14.33 (a) Principle of a transistor
amplifier with positive feedback working as an
oscillator and (b) Tuned collector oscillator, (c) Riseand fall (or built up) of current I
c and I
e due to the
inductive coupling.
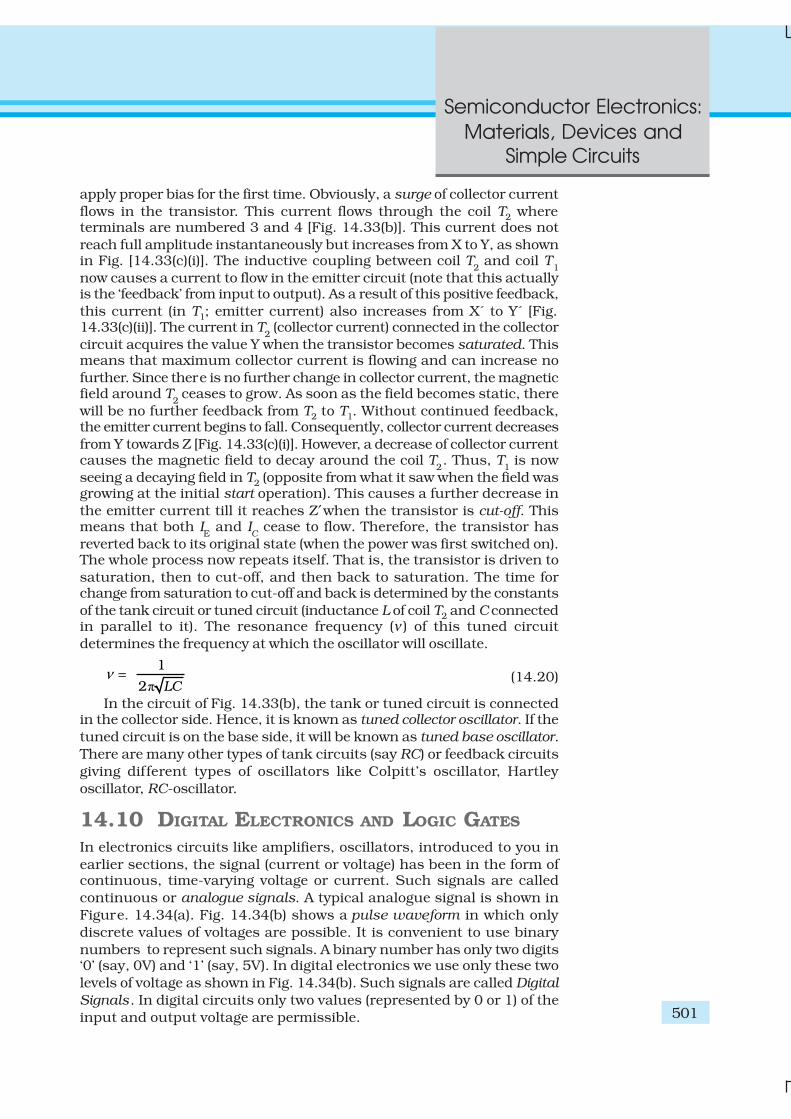
501
Semiconductor Electronics:
Materials, Devices and
Simple Circuits
apply proper bias for the first time. Obviously, a surge of collector current
flows in the transistor. This current flows through the coil T2 whereterminals are numbered 3 and 4 [Fig. 14.33(b)]. This current does not
reach full amplitude instantaneously but increases from X to Y, as shownin Fig. [14.33(c)(i)]. The inductive coupling between coil T
2 and coil T
1
now causes a current to flow in the emitter circuit (note that this actuallyis the ‘feedback’ from input to output). As a result of this positive feedback,
this current (in T1; emitter current) also increases from X´ to Y´ [Fig.14.33(c)(ii)]. The current in T
2 (collector current) connected in the collector
circuit acquires the value Y when the transistor becomes saturated. Thismeans that maximum collector current is flowing and can increase no
further. Since there is no further change in collector current, the magneticfield around T
2 ceases to grow. As soon as the field becomes static, there
will be no further feedback from T2 to T1. Without continued feedback,the emitter current begins to fall. Consequently, collector current decreases
from Y towards Z [Fig. 14.33(c)(i)]. However, a decrease of collector currentcauses the magnetic field to decay around the coil T
2. Thus, T
1 is now
seeing a decaying field in T2 (opposite from what it saw when the field wasgrowing at the initial start operation). This causes a further decrease in
the emitter current till it reaches Z′when the transistor is cut-off. Thismeans that both I
E and I
C cease to flow. Therefore, the transistor has
reverted back to its original state (when the power was first switched on).The whole process now repeats itself. That is, the transistor is driven to
saturation, then to cut-off, and then back to saturation. The time forchange from saturation to cut-off and back is determined by the constants
of the tank circuit or tuned circuit (inductance L of coil T2 and C connectedin parallel to it). The resonance frequency (ν ) of this tuned circuit
determines the frequency at which the oscillator will oscillate.
π
1
2 LCν
= (14.20)
In the circuit of Fig. 14.33(b), the tank or tuned circuit is connectedin the collector side. Hence, it is known as tuned collector oscillator. If the
tuned circuit is on the base side, it will be known as tuned base oscillator.
There are many other types of tank circuits (say RC) or feedback circuits
giving different types of oscillators like Colpitt’s oscillator, Hartley
oscillator, RC-oscillator.
14.10 DIGITAL ELECTRONICS AND LOGIC GATES
In electronics circuits like amplifiers, oscillators, introduced to you in
earlier sections, the signal (current or voltage) has been in the form ofcontinuous, time-varying voltage or current. Such signals are called
continuous or analogue signals. A typical analogue signal is shown in
Figure. 14.34(a). Fig. 14.34(b) shows a pulse waveform in which only
discrete values of voltages are possible. It is convenient to use binary
numbers to represent such signals. A binary number has only two digits‘0’ (say, 0V) and ‘1’ (say, 5V). In digital electronics we use only these two
levels of voltage as shown in Fig. 14.34(b). Such signals are called Digital
Signals. In digital circuits only two values (represented by 0 or 1) of the
input and output voltage are permissible.
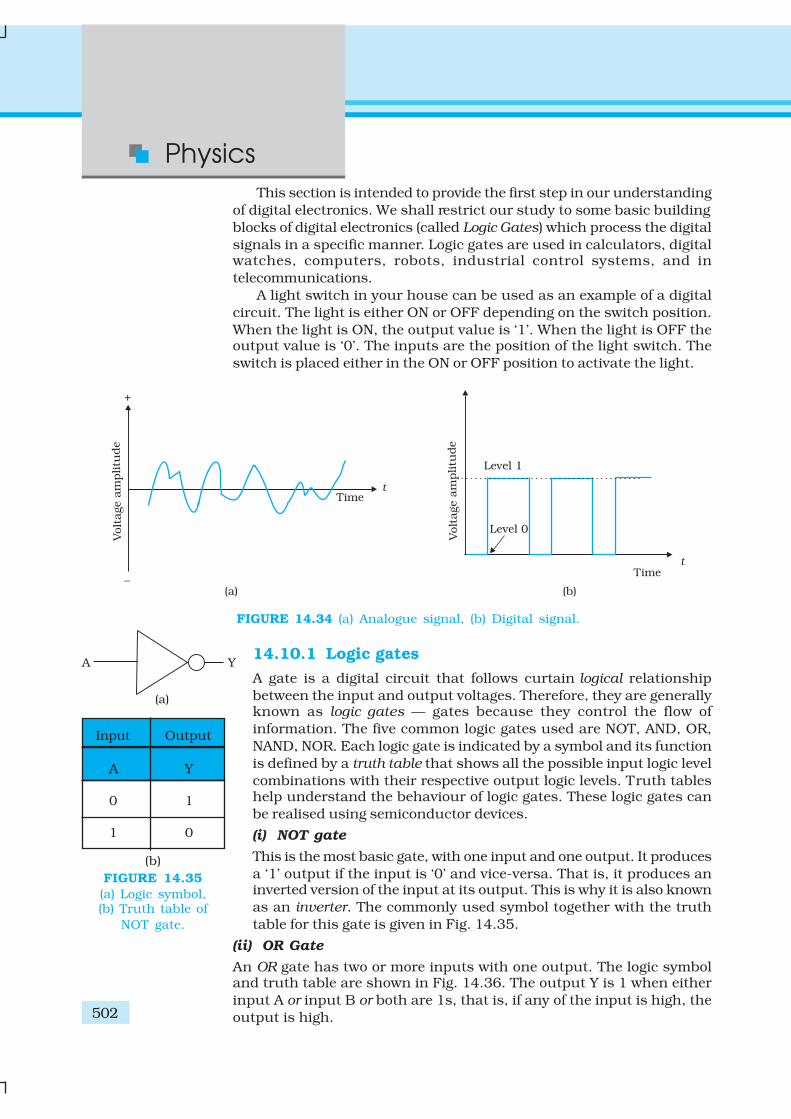
Physics
502
This section is intended to provide the first step in our understanding
of digital electronics. We shall restrict our study to some basic building
blocks of digital electronics (called Logic Gates) which process the digital
signals in a specific manner. Logic gates are used in calculators, digitalwatches, computers, robots, industrial control systems, and in
telecommunications.
A light switch in your house can be used as an example of a digital
circuit. The light is either ON or OFF depending on the switch position.
When the light is ON, the output value is ‘1’. When the light is OFF theoutput value is ‘0’. The inputs are the position of the light switch. The
switch is placed either in the ON or OFF position to activate the light.
FIGURE 14.34 (a) Analogue signal, (b) Digital signal.
14.10.1 Logic gates
A gate is a digital circuit that follows curtain logical relationship
between the input and output voltages. Therefore, they are generallyknown as logic gates — gates because they control the flow of
information. The five common logic gates used are NOT, AND, OR,
NAND, NOR. Each logic gate is indicated by a symbol and its function
is defined by a truth table that shows all the possible input logic level
combinations with their respective output logic levels. Truth tableshelp understand the behaviour of logic gates. These logic gates can
be realised using semiconductor devices.
(i) NOT gate
This is the most basic gate, with one input and one output. It produces
a ‘1’ output if the input is ‘0’ and vice-versa. That is, it produces aninverted version of the input at its output. This is why it is also known
as an inverter. The commonly used symbol together with the truth
table for this gate is given in Fig. 14.35.
(ii) OR Gate
An OR gate has two or more inputs with one output. The logic symboland truth table are shown in Fig. 14.36. The output Y is 1 when either
input A or input B or both are 1s, that is, if any of the input is high, the
output is high.
Input Output
A Y
0 1
1 0
(b)
FIGURE 14.35
(a) Logic symbol,(b) Truth table of
NOT gate.
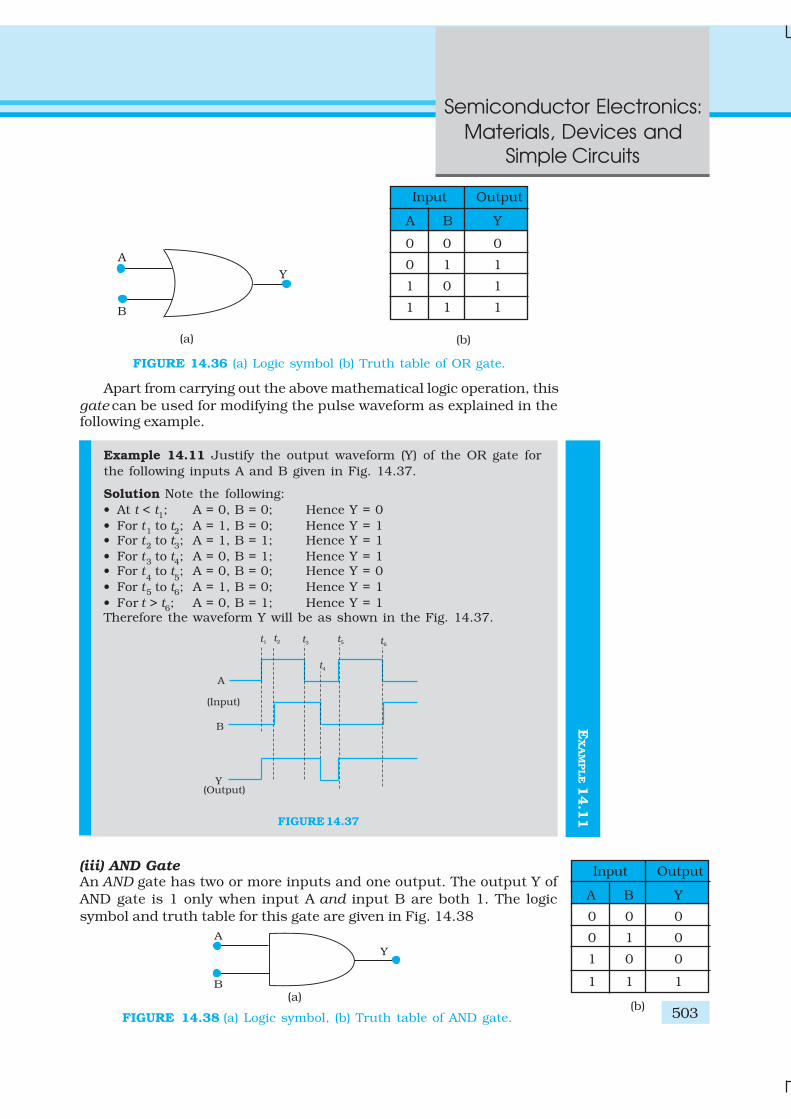
503
Semiconductor Electronics:
Materials, Devices and
Simple Circuits
EX
AM
PLE 1
4.1
1
Apart from carrying out the above mathematical logic operation, this
gate can be used for modifying the pulse waveform as explained in thefollowing example.
Example 14.11 Justify the output waveform (Y) of the OR gate for
the following inputs A and B given in Fig. 14.37.
Solution Note the following:
• At t < t1; A = 0, B = 0; Hence Y = 0
• For t1 to t2; A = 1, B = 0; Hence Y = 1• For t2 to t3; A = 1, B = 1; Hence Y = 1
• For t3 to t4; A = 0, B = 1; Hence Y = 1• For t
4 to t
5; A = 0, B = 0; Hence Y = 0
• For t5 to t6; A = 1, B = 0; Hence Y = 1
• For t > t6; A = 0, B = 1; Hence Y = 1Therefore the waveform Y will be as shown in the Fig. 14.37.
FIGURE 14.37
(iii) AND GateAn AND gate has two or more inputs and one output. The output Y of
AND gate is 1 only when input A and input B are both 1. The logic
symbol and truth table for this gate are given in Fig. 14.38
Input Output
A B Y
0 0 0
0 1 0
1 0 0
1 1 1
(b)
FIGURE 14.36 (a) Logic symbol (b) Truth table of OR gate.
Input Output
A B Y
0 0 0
0 1 1
1 0 1
1 1 1
(b)FIGURE 14.38 (a) Logic symbol, (b) Truth table of AND gate.

Physics
504 EX
AM
PLE 1
4.1
3 E
XA
MPLE 1
4.1
2Example 14.12 Take A and B input waveforms similar to that in
Example 14.11. Sketch the output waveform obtained from AND gate.
Solution• For t ≤ t1; A = 0, B = 0; Hence Y = 0
• For t1 to t2; A = 1, B = 0; Hence Y = 0• For t
2 to t
3; A = 1, B = 1; Hence Y = 1
• For t3 to t4; A = 0, B = 1; Hence Y = 0
• For t4 to t5; A = 0, B = 0; Hence Y = 0• For t5 to t6; A = 1, B = 0; Hence Y = 0
• For t > t6; A = 0, B = 1; Hence Y = 0Based on the above, the output waveform for AND gate can be drawn
as given below.
FIGURE 14.39
(iv) NAND Gate
This is an AND gate followed by a NOT gate. If inputs A and B are both
‘1’, the output Y is not ‘1’. The gate gets its name from this NOT AND
behaviour. Figure 14.40 shows the symbol and truth table of NAND gate.
NAND gates are also called Universal Gates since by using these
gates you can realise other basic gates like OR, AND and NOT (Exercises14.16 and 14.17).
FIGURE 14.40 (a) Logic symbol, (b) Truth table of NAND gate.
Example 14.13 Sketch the output Y from a NAND gate having inputs
A and B given below:
Solution
• For t < t1; A = 1, B = 1; Hence Y = 0• For t
1 to t
2; A = 0, B = 0; Hence Y = 1
• For t2 to t3; A = 0, B = 1; Hence Y = 1
• For t3 to t4; A = 1, B = 0; Hence Y = 1
Input Output
A B Y
0 0 1
0 1 1
1 0 1
1 1 0
(b)
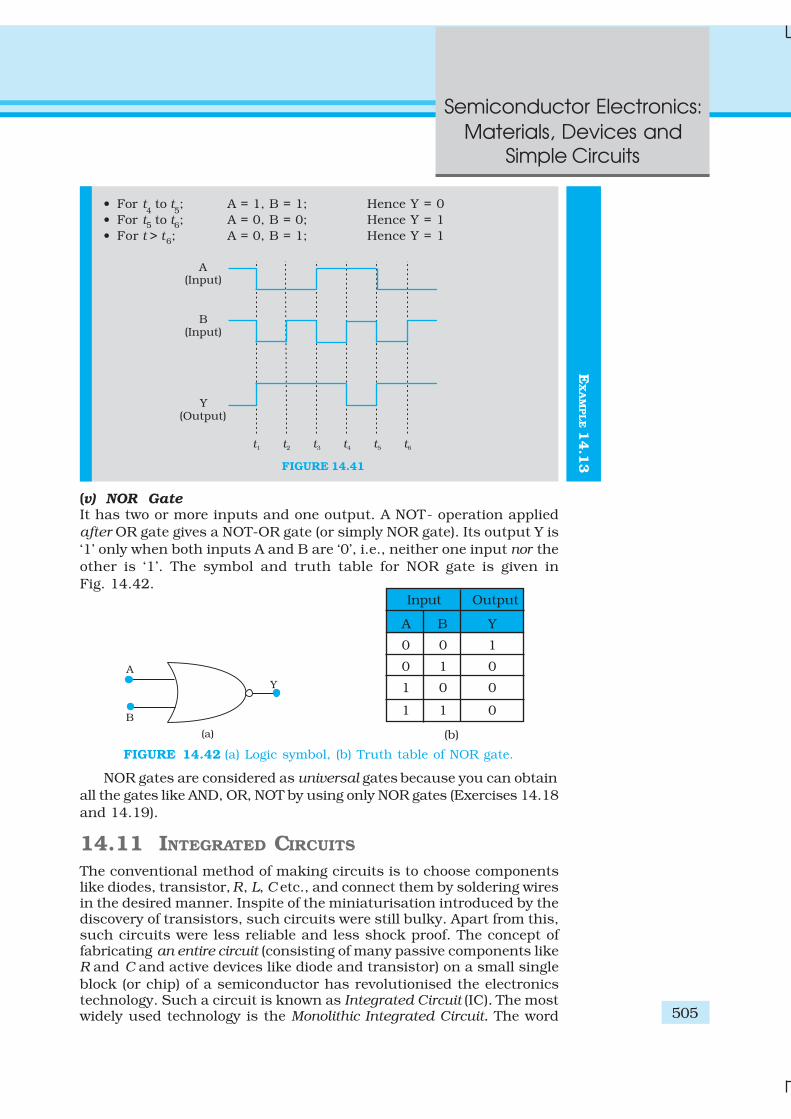
505
Semiconductor Electronics:
Materials, Devices and
Simple Circuits
EX
AM
PLE 1
4.1
3• For t
4 to t
5; A = 1, B = 1; Hence Y = 0
• For t5 to t6; A = 0, B = 0; Hence Y = 1
• For t > t6; A = 0, B = 1; Hence Y = 1
FIGURE 14.41
(v) NOR GateIt has two or more inputs and one output. A NOT- operation applied
after OR gate gives a NOT-OR gate (or simply NOR gate). Its output Y is
‘1’ only when both inputs A and B are ‘0’, i.e., neither one input nor the
other is ‘1’. The symbol and truth table for NOR gate is given in
Fig. 14.42.
FIGURE 14.42 (a) Logic symbol, (b) Truth table of NOR gate.
NOR gates are considered as universal gates because you can obtain
all the gates like AND, OR, NOT by using only NOR gates (Exercises 14.18
and 14.19).
14.11 INTEGRATED CIRCUITS
The conventional method of making circuits is to choose componentslike diodes, transistor, R, L, C etc., and connect them by soldering wiresin the desired manner. Inspite of the miniaturisation introduced by thediscovery of transistors, such circuits were still bulky. Apart from this,such circuits were less reliable and less shock proof. The concept offabricating an entire circuit (consisting of many passive components likeR and C and active devices like diode and transistor) on a small single
block (or chip) of a semiconductor has revolutionised the electronicstechnology. Such a circuit is known as Integrated Circuit (IC). The mostwidely used technology is the Monolithic Integrated Circuit. The word
Input Output
A B Y
0 0 1
0 1 0
1 0 0
1 1 0
(b)
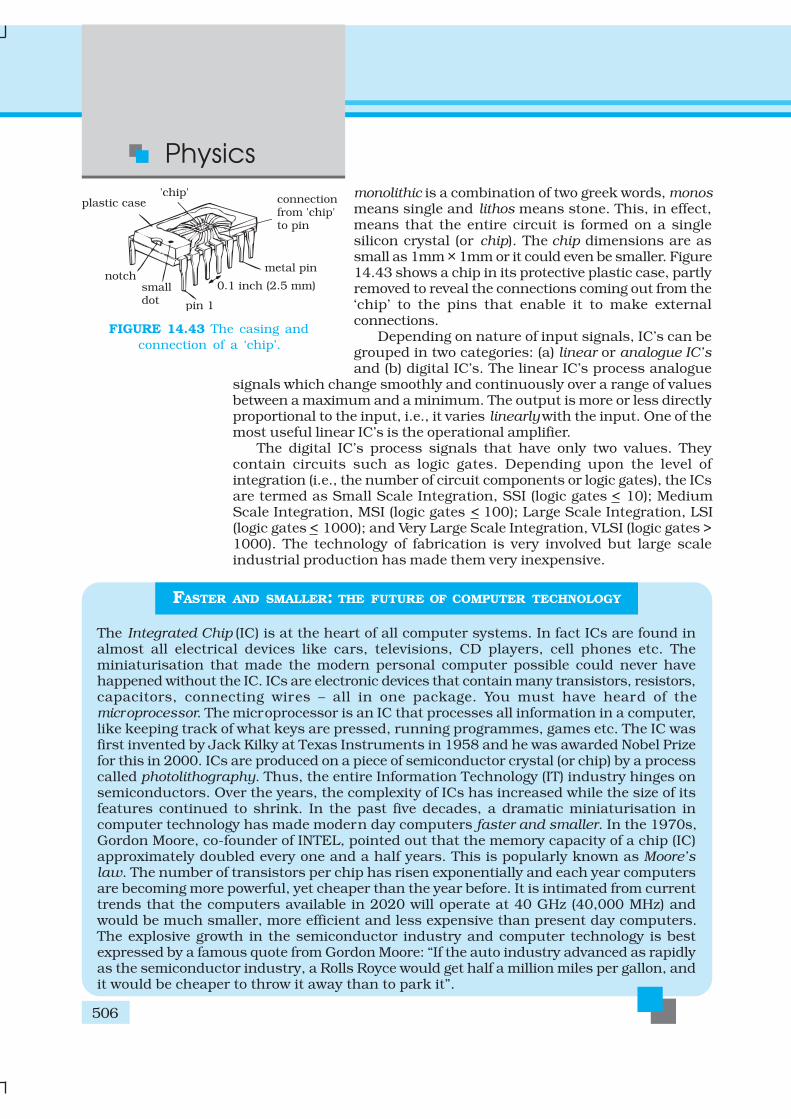
Physics
506
monolithic is a combination of two greek words, monosmeans single and lithos means stone. This, in effect,means that the entire circuit is formed on a singlesilicon crystal (or chip). The chip dimensions are assmall as 1mm × 1mm or it could even be smaller. Figure14.43 shows a chip in its protective plastic case, partlyremoved to reveal the connections coming out from the‘chip’ to the pins that enable it to make externalconnections.
Depending on nature of input signals, IC’s can begrouped in two categories: (a) linear or analogue IC’sand (b) digital IC’s. The linear IC’s process analogue
signals which change smoothly and continuously over a range of valuesbetween a maximum and a minimum. The output is more or less directlyproportional to the input, i.e., it varies linearly with the input. One of themost useful linear IC’s is the operational amplifier.
The digital IC’s process signals that have only two values. Theycontain circuits such as logic gates. Depending upon the level ofintegration (i.e., the number of circuit components or logic gates), the ICsare termed as Small Scale Integration, SSI (logic gates < 10); MediumScale Integration, MSI (logic gates < 100); Large Scale Integration, LSI(logic gates < 1000); and Very Large Scale Integration, VLSI (logic gates >1000). The technology of fabrication is very involved but large scaleindustrial production has made them very inexpensive.
FIGURE 14.43 The casing and
connection of a ‘chip’.
FASTER AND SMALLER: THE FUTURE OF COMPUTER TECHNOLOGY
The Integrated Chip (IC) is at the heart of all computer systems. In fact ICs are found inalmost all electrical devices like cars, televisions, CD players, cell phones etc. Theminiaturisation that made the modern personal computer possible could never havehappened without the IC. ICs are electronic devices that contain many transistors, resistors,capacitors, connecting wires – all in one package. You must have heard of themicroprocessor. The microprocessor is an IC that processes all information in a computer,like keeping track of what keys are pressed, running programmes, games etc. The IC wasfirst invented by Jack Kilky at Texas Instruments in 1958 and he was awarded Nobel Prizefor this in 2000. ICs are produced on a piece of semiconductor crystal (or chip) by a processcalled photolithography. Thus, the entire Information Technology (IT) industry hinges onsemiconductors. Over the years, the complexity of ICs has increased while the size of itsfeatures continued to shrink. In the past five decades, a dramatic miniaturisation incomputer technology has made modern day computers faster and smaller. In the 1970s,Gordon Moore, co-founder of INTEL, pointed out that the memory capacity of a chip (IC)approximately doubled every one and a half years. This is popularly known as Moore’slaw. The number of transistors per chip has risen exponentially and each year computersare becoming more powerful, yet cheaper than the year before. It is intimated from currenttrends that the computers available in 2020 will operate at 40 GHz (40,000 MHz) andwould be much smaller, more efficient and less expensive than present day computers.The explosive growth in the semiconductor industry and computer technology is bestexpressed by a famous quote from Gordon Moore: “If the auto industry advanced as rapidlyas the semiconductor industry, a Rolls Royce would get half a million miles per gallon, andit would be cheaper to throw it away than to park it”.
507
Semiconductor Electronics:
Materials, Devices and
Simple Circuits
SUMMARY
1. Semiconductors are the basic materials used in the present solid stateelectronic devices like diode, transistor, ICs, etc.
2. Lattice structure and the atomic structure of constituent elementsdecide whether a particular material will be insulator, metal or
semiconductor.
3. Metals have low resistivity (10–2 to 10–8 Ωm), insulators have very high
resistivity (>108 Ω m–1), while semiconductors have intermediate valuesof resistivity.
4. Semiconductors are elemental (Si, Ge) as well as compound (GaAs,CdS, etc.).
5. Pure semiconductors are called ‘intrinsic semiconductors’. The presence
of charge carriers (electrons and holes) is an ‘intrinsic’ property of the
material and these are obtained as a result of thermal excitation. Thenumber of electrons (n
e) is equal to the number of holes (n
h ) in intrinsic
conductors. Holes are essentially electron vacancies with an effective
positive charge.
6. The number of charge carriers can be changed by ‘doping’ of a suitable
impurity in pure semiconductors. Such semiconductors are known asextrinsic semiconductors. These are of two types (n-type and p-type).
7. In n-type semiconductors, ne >> n
h while in p-type semiconductors n
h >> n
e.
8. n-type semiconducting Si or Ge is obtained by doping with pentavalentatoms (donors) like As, Sb, P, etc., while p-type Si or Ge can be obtained
by doping with trivalent atom (acceptors) like B, Al, In etc.
9. nen
h = n
i
2 in all cases. Further, the material possesses an overall charge
neutrality.
10. There are two distinct band of energies (called valence band and
conduction band) in which the electrons in a material lie. Valenceband energies are low as compared to conduction band energies. All
energy levels in the valence band are filled while energy levels in the
conduction band may be fully empty or partially filled. The electrons inthe conduction band are free to move in a solid and are responsible for
the conductivity. The extent of conductivity depends upon the energy
gap (Eg) between the top of valence band (E
V) and the bottom of the
conduction band EC. The electrons from valence band can be excited by
heat, light or electrical energy to the conduction band and thus, produce
a change in the current flowing in a semiconductor.
11. For insulators Eg > 3 eV, for semiconductors E
g is 0.2 eV to 3 eV, while
for metals Eg ≈ 0.
12. p-n junction is the ‘key’ to all semiconductor devices. When such ajunction is made, a ‘depletion layer’ is formed consisting of immobile
ion-cores devoid of their electrons or holes. This is responsible for a
junction potential barrier.
13. By changing the external applied voltage, junction barriers can be
changed. In forward bias (n-side is connected to negative terminal of thebattery and p-side is connected to the positive), the barrier is decreased
while the barrier increases in reverse bias. Hence, forward bias current
is more (mA) while it is very small (µA) in a p-n junction diode.
14. Diodes can be used for rectifying an ac voltage (restricting the ac voltage
to one direction). With the help of a capacitor or a suitable filter, a dcvoltage can be obtained.
15. There are some special purpose diodes.
Physics
508
16. Zener diode is one such special purpose diode. In reverse bias, after acertain voltage, the current suddenly increases (breakdown voltage) in
a Zener diode. This property has been used to obtain voltage regulation.
17. p-n junctions have also been used to obtain many photonic or
optoelectronic devices where one of the participating entity is ‘photon’:(a) Photodiodes in which photon excitation results in a change of reverse
saturation current which helps us to measure light intensity; (b) Solarcells which convert photon energy into electricity; (c) Light Emitting
Diode and Diode Laser in which electron excitation by a bias voltage
results in the generation of light.
18. Transistor is an n-p-n or p-n-p junction device. The central block(thin and lightly doped) is called ‘Base’ while the other electrodes are
‘Emitter’ and ‘Collectors’. The emitter-base junction is forward biasedwhile collector-base junction is reverse biased.
19. The transistors can be connected in such a manner that either C or E
or B is common to both the input and output. This gives the three
configurations in which a transistor is used: Common Emitter (CE),Common Collector (CC) and Common Base (CB). The plot between I
C
and VCE
for fixed IB is called output characteristics while the plot between
IB and V
BE with fixed V
CE is called input characteristics. The important
transistor parameters for CE-configuration are:
input resistance,
CE
BE
i
B V
Vr
I
∆= ∆
output resistance,
B
CE
o
C I
Vr
I
∆= ∆
current amplification factor,
CE
C
B V
I
Iβ
∆= ∆
20. T ransistor can be used as an amplifier and oscillator. In fact, an
oscillator can also be considered as a self-sustained amplifier in which
a part of output is fed-back to the input in the same phase (positivefeed back). The voltage gain of a transistor amplifier in common emitter
configuration is: o C
v
i B
v RA
v Rβ
= =
, where RC and R
B are respectively
the resistances in collector and base sides of the circuit.
21. When the transistor is used in the cutoff or saturation state, it acts as
a switch.
22. There are some special circuits which handle the digital data consisting
of 0 and 1 levels. This forms the subject of Digital Electronics.
23. The important digital circuits performing special logic operations are
called logic gates. These are: OR, AND, NOT, NAND, and NOR gates.
24. In modern day circuit, many logical gates or circuits are integrated in
one single ‘Chip’. These are known as Intgrated circuits (IC).
POINTS TO PONDER
1. The energy bands (EC or E
V) in the semiconductors are space delocalised
which means that these are not located in any specific place inside thesolid. The energies are the overall averages. When you see a picture in
which EC or E
V are drawn as straight lines, then they should be
respectively taken simply as the bottom of conduction band energy levels
and top of valence band energy levels.
509
Semiconductor Electronics:
Materials, Devices and
Simple Circuits
2. In elemental semiconductors (Si or Ge), the n-type or p-type
semiconductors are obtained by introducing ‘dopants’ as defects. Incompound semiconductors, the change in relative stoichiometric ratio
can also change the type of semiconductor. For example, in ideal GaAs
the ratio of Ga:As is 1:1 but in Ga-rich or As-rich GaAs it could
respectively be Ga1.1
As0.9
or Ga0.9
As1.1
. In general, the presence of
defects control the properties of semiconductors in many ways.
3. In transistors, the base region is both narrow and lightly doped,
otherwise the electrons or holes coming from the input side (say, emitterin CE-configuration) will not be able to reach the collector.
4. We have described an oscillator as a positive feedback amplifier. Forstable oscillations, the voltage feedback (V
fb) from the output voltage
(Vo) should be such that after amplification (A) it should again become
Vo. If a fraction β′ is feedback, then V
fb = V
o. β′ and after amplification
its value A(vo.β′) should be equal to V
o. This means that the criteria for
stable oscillations to be sustained is A β′ = 1. This is known asBarkhausen's Criteria.
5. In an oscillator, the feedback is in the same phase (positive feedback).If the feedback voltage is in opposite phase (negative feedback), the
gain is less than 1 and it can never work as oscillator. It will be an
amplifier with reduced gain. However, the negative feedback also reduces
noise and distortion in an amplifier which is an advantageous feature.
EXERCISES
14.1 In an n-type silicon, which of the following statement is true:
(a) Electrons are majority carriers and trivalent atoms are thedopants.
(b) Electrons are minority carriers and pentavalent atoms are thedopants.
(c) Holes are minority carriers and pentavalent atoms are the
dopants.
(d) Holes are majority carriers and trivalent atoms are the dopants.
14.2 Which of the statements given in Exercise 14.1 is true for p-type
semiconductos.
14.3 Carbon, silicon and germanium have four valence electrons each.
These are characterised by valence and conduction bands separatedby energy band gap respectively equal to (Eg)C, (Eg)Si and (Eg)Ge. Which
of the following statements is true?
(a) (Eg)Si < (E
g)Ge < (E
g)C
(b) (Eg)C < (E
g)Ge > (E
g)Si
(c) (Eg)C > (E
g)Si > (E
g)Ge
(d) (Eg)C = (E
g)Si = (E
g)Ge
14.4 In an unbiased p-n junction, holes diffuse from the p-region ton-region because
(a) free electrons in the n-region attract them.
(b) they move across the junction by the potential difference.
(c) hole concentration in p-region is more as compared to n-region.
(d) All the above.
Physics
510
14.5 When a forward bias is applied to a p-n junction, it
(a) raises the potential barrier.
(b) reduces the majority carrier current to zero.
(c) lowers the potential barrier.
(d) None of the above.
14.6 For transistor action, which of the following statements are correct:
(a) Base, emitter and collector regions should have similar size anddoping concentrations.
(b) The base region must be very thin and lightly doped.
(c) The emitter junction is forward biased and collector junction isreverse biased.
(d) Both the emitter junction as well as the collector junction areforward biased.
14.7 For a transistor amplifier, the voltage gain
(a) remains constant for all frequencies.
(b) is high at high and low frequencies and constant in the middlefrequency range.
(c) is low at high and low frequencies and constant at midfrequencies.
(d) None of the above.
14.8 In half-wave rectification, what is the output frequency if the inputfrequency is 50 Hz. What is the output frequency of a full-wave rectifier
for the same input frequency.
14.9 For a CE-transistor amplifier, the audio signal voltage across thecollected resistance of 2 kΩ is 2 V. Suppose the current amplificationfactor of the transistor is 100, find the input signal voltage and base
current, if the base resistance is 1 kΩ.
14.10 Two amplifiers are connected one after the other in series (cascaded).The first amplifier has a voltage gain of 10 and the second has avoltage gain of 20. If the input signal is 0.01 volt, calculate the output
ac signal.
14.11 A p-n photodiode is fabricated from a semiconductor with band gapof 2.8 eV. Can it detect a wavelength of 6000 nm?
ADDITIONAL EXERCISES
14.12 The number of silicon atoms per m3 is 5 × 1028. This is doped
simultaneously with 5 × 10²²
atoms per m3 of Arsenic and 5 × 10
20
per m3 atoms of Indium. Calculate the number of electrons and holes.Given that n
i = 1.5 × 10¹⁶ m–3. Is the material n-type or p-type?
14.13 In an intrinsic semiconductor the energy gap Eg is 1.2eV. Its hole
mobility is much smaller than electron mobility and independent oftemperature. What is the ratio between conductivity at 600K andthat at 300K? Assume that the temperature dependence of intrinsic
carrier concentration ni is given by
0 exp –2
g
i
B
En n
k T
=
where n0 is a constant.
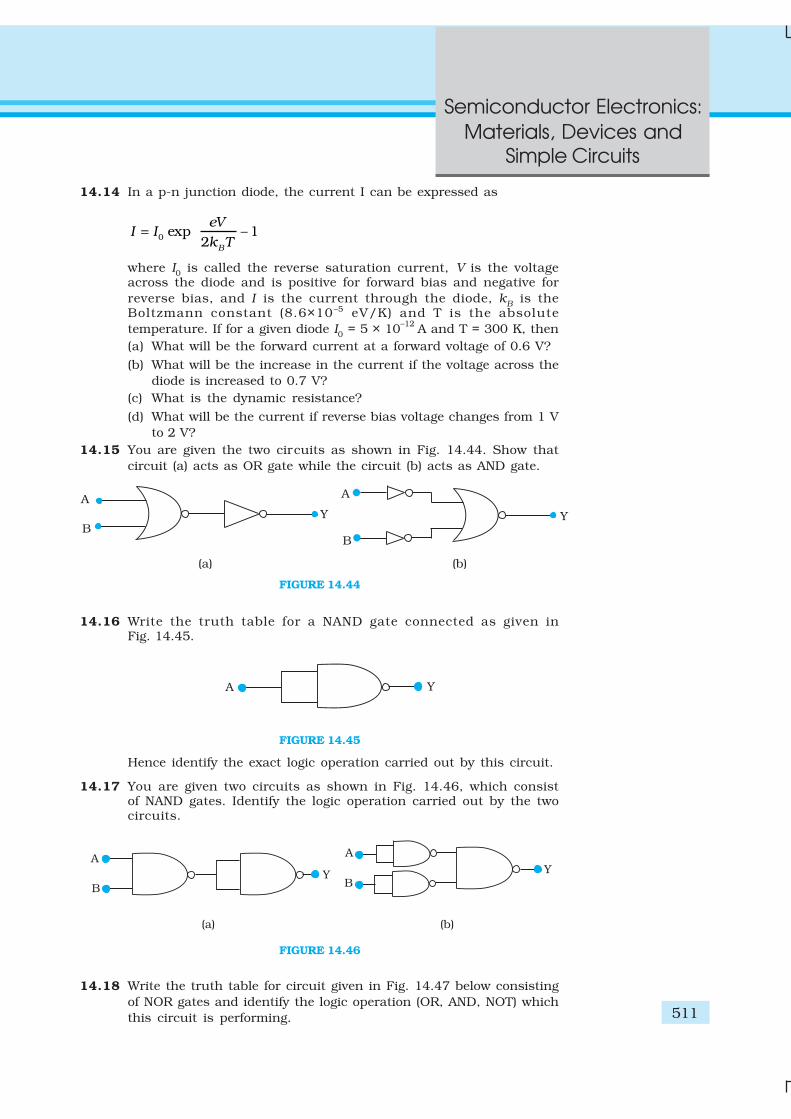
511
Semiconductor Electronics:
Materials, Devices and
Simple Circuits
14.14 In a p-n junction diode, the current I can be expressed as
0 exp – 12
B
eVI I
k T
=
where I0 is called the reverse saturation current, V is the voltageacross the diode and is positive for forward bias and negative for
reverse bias, and I is the current through the diode, kB is the
Boltzmann constant (8.6×10 –5 eV/K) and T is the absolute
temperature. If for a given diode I0 = 5 × 10–12
A and T = 300 K, then
(a) What will be the forward current at a forward voltage of 0.6 V?
(b) What will be the increase in the current if the voltage across the
diode is increased to 0.7 V?
(c) What is the dynamic resistance?
(d) What will be the current if reverse bias voltage changes from 1 V
to 2 V?
14.15 You are given the two circuits as shown in Fig. 14.44. Show that
circuit (a) acts as OR gate while the circuit (b) acts as AND gate.
FIGURE 14.44
14.16 Write the truth table for a NAND gate connected as given inFig. 14.45.
FIGURE 14.45
Hence identify the exact logic operation carried out by this circuit.
14.17 You are given two circuits as shown in Fig. 14.46, which consistof NAND gates. Identify the logic operation carried out by the twocircuits.
FIGURE 14.46
14.18 Write the truth table for circuit given in Fig. 14.47 below consisting
of NOR gates and identify the logic operation (OR, AND, NOT) which
this circuit is performing.

Physics
512
FIGURE 14.47
(Hint: A = 0, B = 1 then A and B inputs of second NOR gate will be 0and hence Y=1. Similarly work out the values of Y for othercombinations of A and B. Compare with the truth table of OR, AND,
NOT gates and find the correct one.)
14.19 Write the truth table for the circuits given in Fig. 14.48 consisting of
NOR gates only. Identify the logic operations (OR, AND, NOT) performedby the two circuits.
FIGURE 14.48
15.1 INTRODUCTION
Communication is the act of transmission of information. Every living
creature in the world experiences the need to impart or receive informationalmost continuously with others in the surrounding world. For
communication to be successful, it is essential that the sender and the
receiver understand a common language. Man has constantly made
endeavors to improve the quality of communication with other human
beings. Languages and methods used in communication have keptevolving from prehistoric to modern times, to meet the growing demands
in terms of speed and complexity of information. It would be worthwhile
to look at the major milestones in events that promoted developments in
communications, as presented in Table 15.1.
Modern communication has its roots in the 19th and 20th century inthe work of scientists like J.C. Bose, F.B. Morse, G. Marconi and Alexander
Graham Bell. The pace of development seems to have increased
dramatically after the first half of the 20th century. We can hope to see
many more accomplishments in the coming decades. The aim of this
chapter is to introduce the concepts of communication, namely the modeof communication, the need for modulation, production and deduction
of amplitude modulation.
15.2 ELEMENTS OF A COMMUNICATION SYSTEM
Communication pervades all stages of life of all living creatures. Irrespective
of its nature, every communication system has three essential elements-
Chapter Fifteen
COMMUNICATION
SYSTEMS
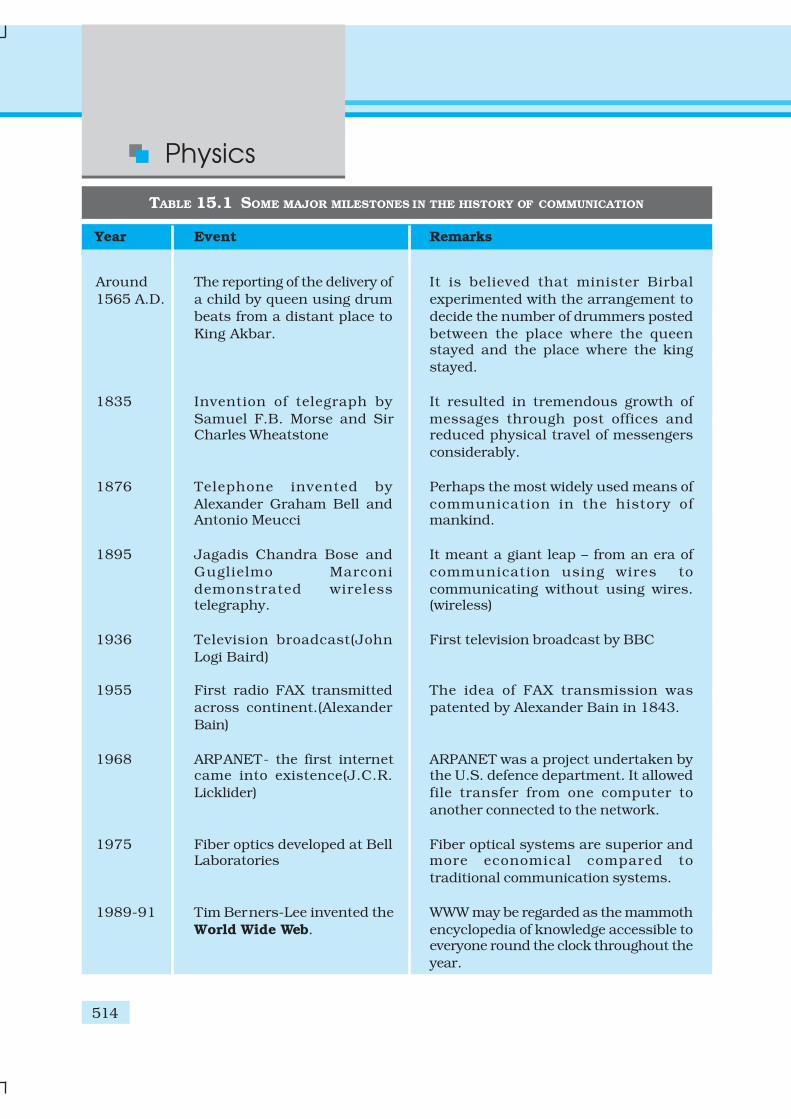
Physics
514
Around
1565 A.D.
1835
1876
1895
1936
1955
1968
1975
1989-91
Year Event Remarks
The reporting of the delivery of
a child by queen using drum
beats from a distant place to
King Akbar.
Invention of telegraph by
Samuel F.B. Morse and SirCharles Wheatstone
Telephone invented by
Alexander Graham Bell andAntonio Meucci
Jagadis Chandra Bose and
Guglielmo Marconi
demonstrated wirelesstelegraphy.
Television broadcast(John
Logi Baird)
First radio FAX transmitted
across continent.(Alexander
Bain)
ARPANET- the first internetcame into existence(J.C.R.
Licklider)
Fiber optics developed at BellLaboratories
Tim Berners-Lee invented the
World Wide Web.
It is believed that minister Birbal
experimented with the arrangement to
decide the number of drummers posted
between the place where the queenstayed and the place where the king
stayed.
It resulted in tremendous growth of
messages through post offices andreduced physical travel of messengers
considerably.
Perhaps the most widely used means of
communication in the history ofmankind.
It meant a giant leap – from an era of
communication using wires to
communicating without using wires.(wireless)
First television broadcast by BBC
The idea of FAX transmission was
patented by Alexander Bain in 1843.
ARPANET was a project undertaken bythe U.S. defence department. It allowed
file transfer from one computer to
another connected to the network.
Fiber optical systems are superior andmore economical compared to
traditional communication systems.
WWW may be regarded as the mammoth
encyclopedia of knowledge accessible toeveryone round the clock throughout the
year.
TABLE 15.1 SOME MAJOR MILESTONES IN THE HISTORY OF COMMUNICATION
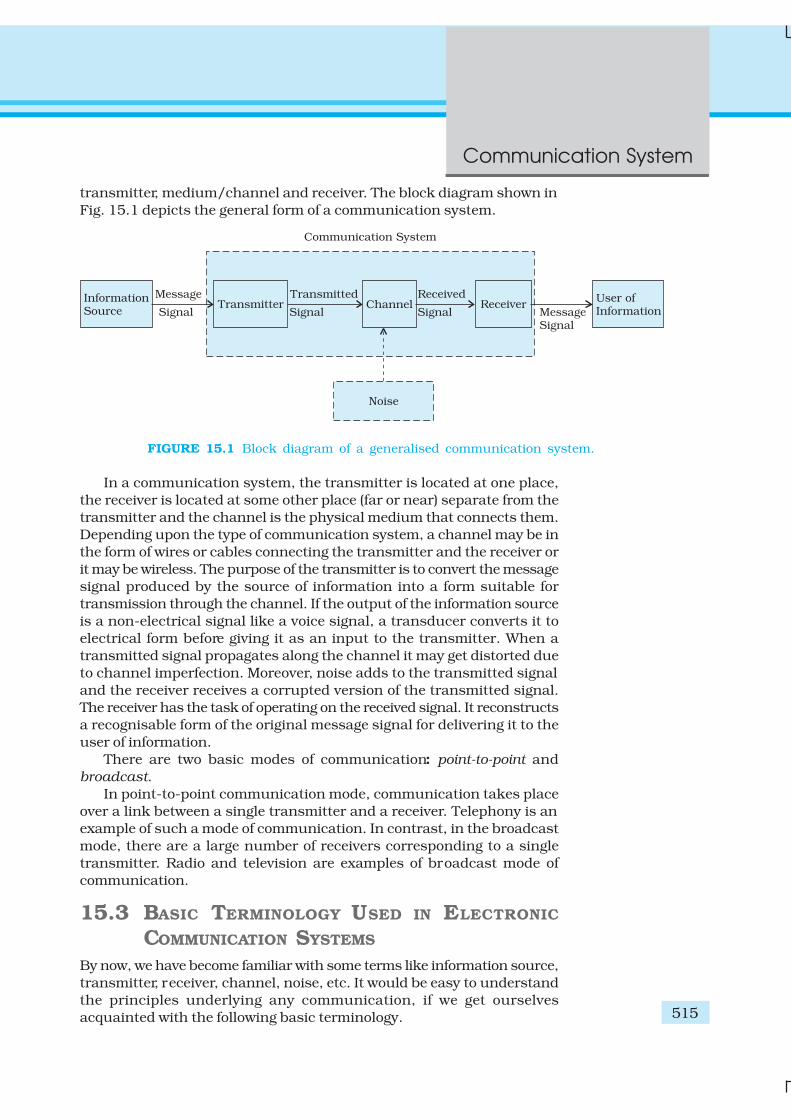
Communication System
515
transmitter, medium/channel and receiver. The block diagram shown in
Fig. 15.1 depicts the general form of a communication system.
FIGURE 15.1 Block diagram of a generalised communication system.
In a communication system, the transmitter is located at one place,
the receiver is located at some other place (far or near) separate from the
transmitter and the channel is the physical medium that connects them.
Depending upon the type of communication system, a channel may be in
the form of wires or cables connecting the transmitter and the receiver or
it may be wireless. The purpose of the transmitter is to convert the message
signal produced by the source of information into a form suitable for
transmission through the channel. If the output of the information source
is a non-electrical signal like a voice signal, a transducer converts it to
electrical form before giving it as an input to the transmitter. When a
transmitted signal propagates along the channel it may get distorted due
to channel imperfection. Moreover, noise adds to the transmitted signal
and the receiver receives a corrupted version of the transmitted signal.
The receiver has the task of operating on the received signal. It reconstructs
a recognisable form of the original message signal for delivering it to the
user of information.
There are two basic modes of communication: point-to-point and
broadcast.
In point-to-point communication mode, communication takes place
over a link between a single transmitter and a receiver. Telephony is an
example of such a mode of communication. In contrast, in the broadcast
mode, there are a large number of receivers corresponding to a single
transmitter. Radio and television are examples of broadcast mode of
communication.
15.3 BASIC TERMINOLOGY USED IN ELECTRONIC
COMMUNICATION SYSTEMS
By now, we have become familiar with some terms like information source,
transmitter, receiver, channel, noise, etc. It would be easy to understand
the principles underlying any communication, if we get ourselves
acquainted with the following basic terminology.
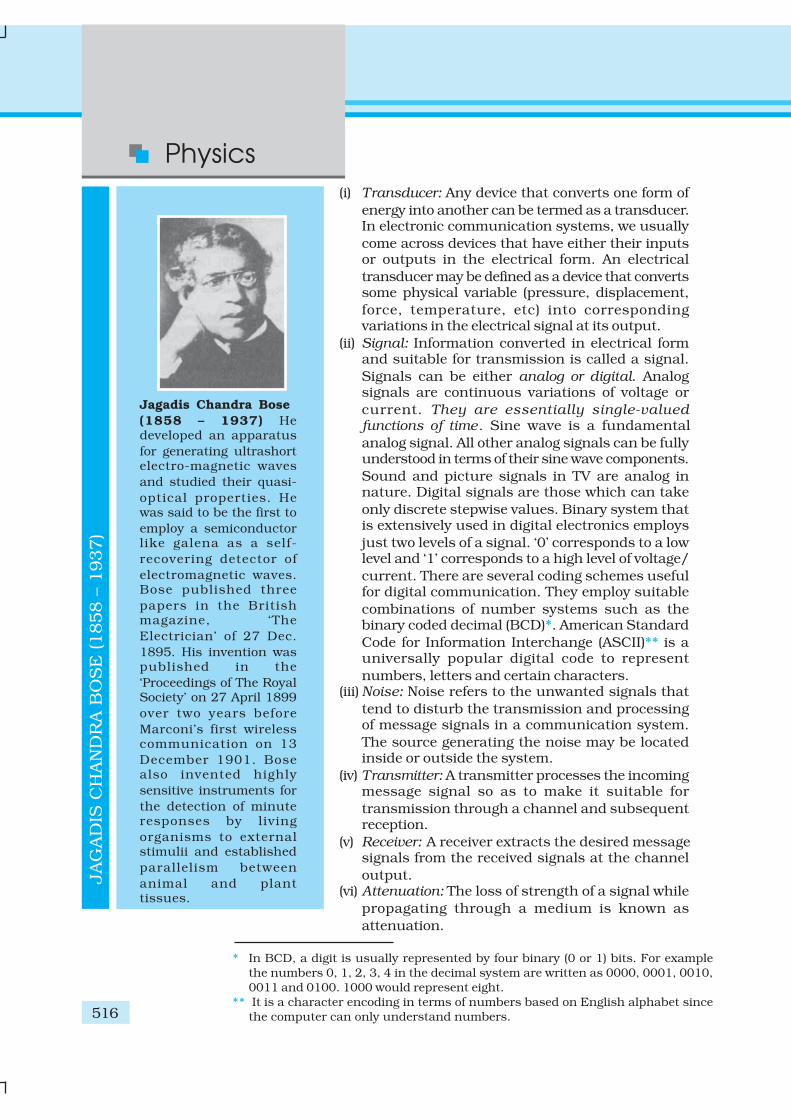
Physics
516
(i) Transducer: Any device that converts one form of
energy into another can be termed as a transducer.In electronic communication systems, we usually
come across devices that have either their inputsor outputs in the electrical form. An electrical
transducer may be defined as a device that convertssome physical variable (pressure, displacement,
force, temperature, etc) into correspondingvariations in the electrical signal at its output.
(ii) Signal: Information converted in electrical formand suitable for transmission is called a signal.
Signals can be either analog or digital. Analogsignals are continuous variations of voltage or
current. They are essentially single-valuedfunctions of time. Sine wave is a fundamental
analog signal. All other analog signals can be fullyunderstood in terms of their sine wave components.
Sound and picture signals in TV are analog innature. Digital signals are those which can take
only discrete stepwise values. Binary system thatis extensively used in digital electronics employs
just two levels of a signal. ‘0’ corresponds to a lowlevel and ‘1’ corresponds to a high level of voltage/
current. There are several coding schemes usefulfor digital communication. They employ suitable
combinations of number systems such as thebinary coded decimal (BCD)*. American Standard
Code for Information Interchange (ASCII)** is auniversally popular digital code to represent
numbers, letters and certain characters.(iii) Noise: Noise refers to the unwanted signals that
tend to disturb the transmission and processingof message signals in a communication system.
The source generating the noise may be locatedinside or outside the system.
(iv) Transmitter: A transmitter processes the incomingmessage signal so as to make it suitable for
transmission through a channel and subsequentreception.
(v) Receiver: A receiver extracts the desired messagesignals from the received signals at the channel
output.(vi) Attenuation: The loss of strength of a signal while
propagating through a medium is known as
attenuation.
* In BCD, a digit is usually represented by four binary (0 or 1) bits. For example
the numbers 0, 1, 2, 3, 4 in the decimal system are written as 0000, 0001, 0010,
0011 and 0100. 1000 would represent eight.
** It is a character encoding in terms of numbers based on English alphabet since
the computer can only understand numbers.
JA
GA
DIS
CH
AN
DR
A B
OS
E (1858 –
1937)
Jagadis Chandra Bose
(1858 – 1937) Hedeveloped an apparatus
for generating ultrashortelectro-magnetic waves
and studied their quasi-
optical properties. Hewas said to be the first to
employ a semiconductorlike galena as a self-
recovering detector of
electromagnetic waves.Bose published three
papers in the Britishmagazine, ‘The
Electrician’ of 27 Dec.
1895. His invention waspublished in the
‘Proceedings of The RoyalSociety’ on 27 April 1899
over two years before
Marconi’s first wirelesscommunication on 13
December 1901. Bosealso invented highly
sensitive instruments for
the detection of minuteresponses by living
organisms to externalstimulii and established
parallelism between
animal and planttissues.
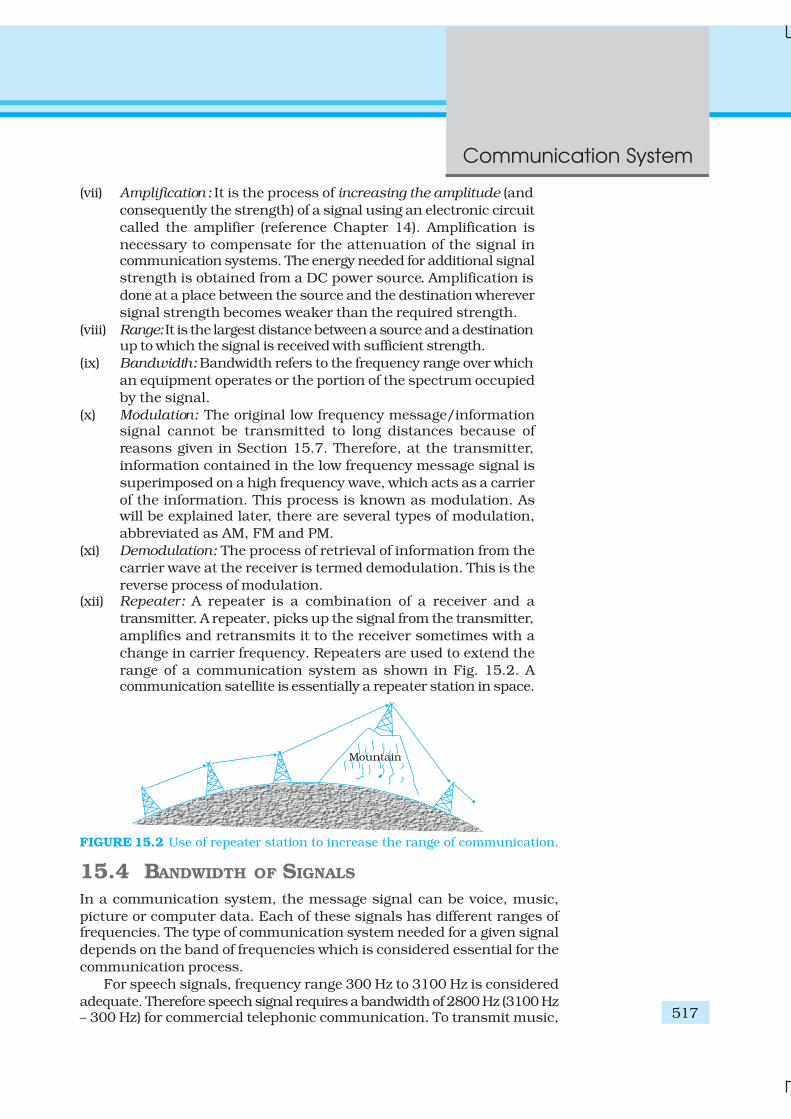
Communication System
517
(vii) Amplification : It is the process of increasing the amplitude (and
consequently the strength) of a signal using an electronic circuit
called the amplifier (reference Chapter 14). Amplification is
necessary to compensate for the attenuation of the signal incommunication systems. The energy needed for additional signal
strength is obtained from a DC power source. Amplification is
done at a place between the source and the destination wherever
signal strength becomes weaker than the required strength.
(viii) Range: It is the largest distance between a source and a destinationup to which the signal is received with sufficient strength.
(ix) Bandwidth: Bandwidth refers to the frequency range over which
an equipment operates or the portion of the spectrum occupied
by the signal.
(x) Modulation: The original low frequency message/informationsignal cannot be transmitted to long distances because of
reasons given in Section 15.7. Therefore, at the transmitter,
information contained in the low frequency message signal is
superimposed on a high frequency wave, which acts as a carrier
of the information. This process is known as modulation. Aswill be explained later, there are several types of modulation,
abbreviated as AM, FM and PM.
(xi) Demodulation: The process of retrieval of information from the
carrier wave at the receiver is termed demodulation. This is the
reverse process of modulation.(xii) Repeater: A repeater is a combination of a receiver and a
transmitter. A repeater, picks up the signal from the transmitter,
amplifies and retransmits it to the receiver sometimes with a
change in carrier frequency. Repeaters are used to extend the
range of a communication system as shown in Fig. 15.2. Acommunication satellite is essentially a repeater station in space.
FIGURE 15.2 Use of repeater station to increase the range of communication.
15.4 BANDWIDTH OF SIGNALS
In a communication system, the message signal can be voice, music,
picture or computer data. Each of these signals has different ranges offrequencies. The type of communication system needed for a given signal
depends on the band of frequencies which is considered essential for the
communication process.
For speech signals, frequency range 300 Hz to 3100 Hz is considered
adequate. Therefore speech signal requires a bandwidth of 2800 Hz (3100 Hz– 300 Hz) for commercial telephonic communication. To transmit music,
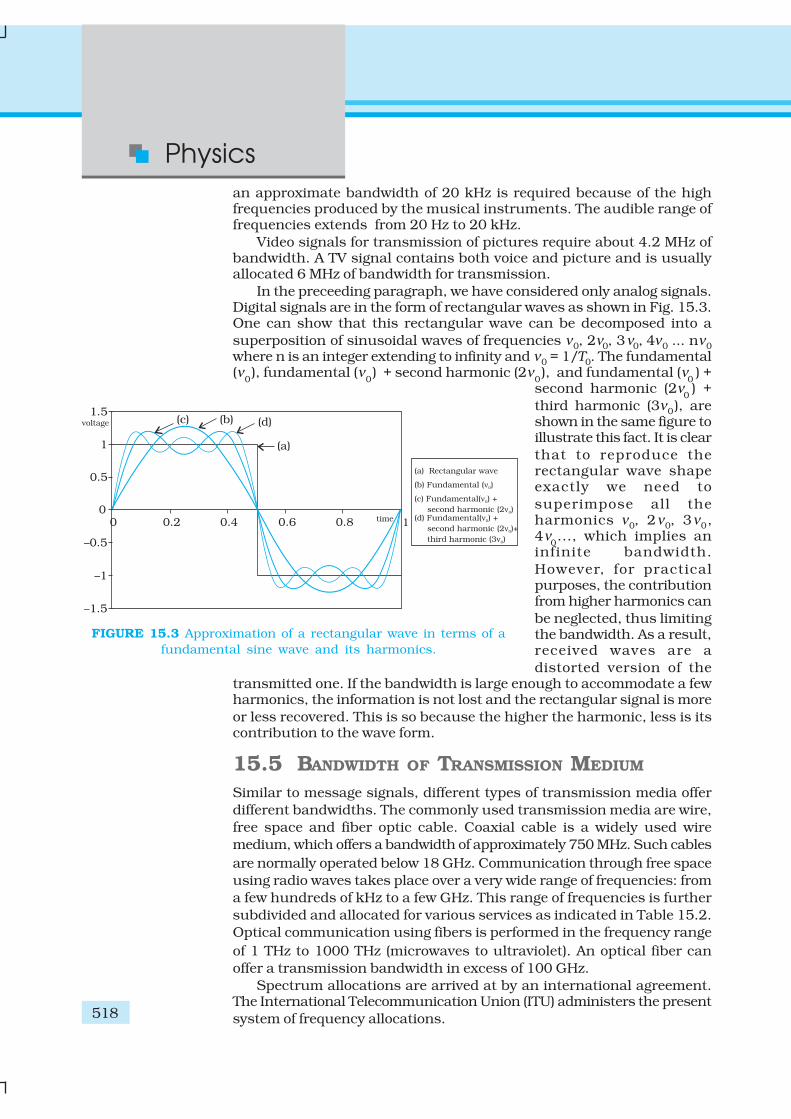
Physics
518
an approximate bandwidth of 20 kHz is required because of the highfrequencies produced by the musical instruments. The audible range offrequencies extends from 20 Hz to 20 kHz.
Video signals for transmission of pictures require about 4.2 MHz ofbandwidth. A TV signal contains both voice and picture and is usuallyallocated 6 MHz of bandwidth for transmission.
In the preceeding paragraph, we have considered only analog signals.Digital signals are in the form of rectangular waves as shown in Fig. 15.3.One can show that this rectangular wave can be decomposed into a
superposition of sinusoidal waves of frequencies ν0, 2ν0, 3ν0, 4ν0 ... nν0
where n is an integer extending to infinity and ν0 = 1/T0. The fundamental(ν
0), fundamental (ν
0) + second harmonic (2ν
0), and fundamental (ν
0) +
second harmonic (2ν0) +
third harmonic (3ν0), areshown in the same figure toillustrate this fact. It is clear
that to reproduce therectangular wave shapeexactly we need to
superimpose all theharmonics ν0, 2ν0, 3ν0,4ν
0..., which implies an
infinite bandwidth.
However, for practicalpurposes, the contributionfrom higher harmonics can
be neglected, thus limitingthe bandwidth. As a result,received waves are a
distorted version of thetransmitted one. If the bandwidth is large enough to accommodate a fewharmonics, the information is not lost and the rectangular signal is more
or less recovered. This is so because the higher the harmonic, less is itscontribution to the wave form.
15.5 BANDWIDTH OF TRANSMISSION MEDIUM
Similar to message signals, different types of transmission media offer
different bandwidths. The commonly used transmission media are wire,
free space and fiber optic cable. Coaxial cable is a widely used wire
medium, which offers a bandwidth of approximately 750 MHz. Such cables
are normally operated below 18 GHz. Communication through free space
using radio waves takes place over a very wide range of frequencies: from
a few hundreds of kHz to a few GHz. This range of frequencies is further
subdivided and allocated for various services as indicated in Table 15.2.
Optical communication using fibers is performed in the frequency range
of 1 THz to 1000 THz (microwaves to ultraviolet). An optical fiber can
offer a transmission bandwidth in excess of 100 GHz.
Spectrum allocations are arrived at by an international agreement.The International Telecommunication Union (ITU) administers the present
system of frequency allocations.
FIGURE 15.3 Approximation of a rectangular wave in terms of a
fundamental sine wave and its harmonics.
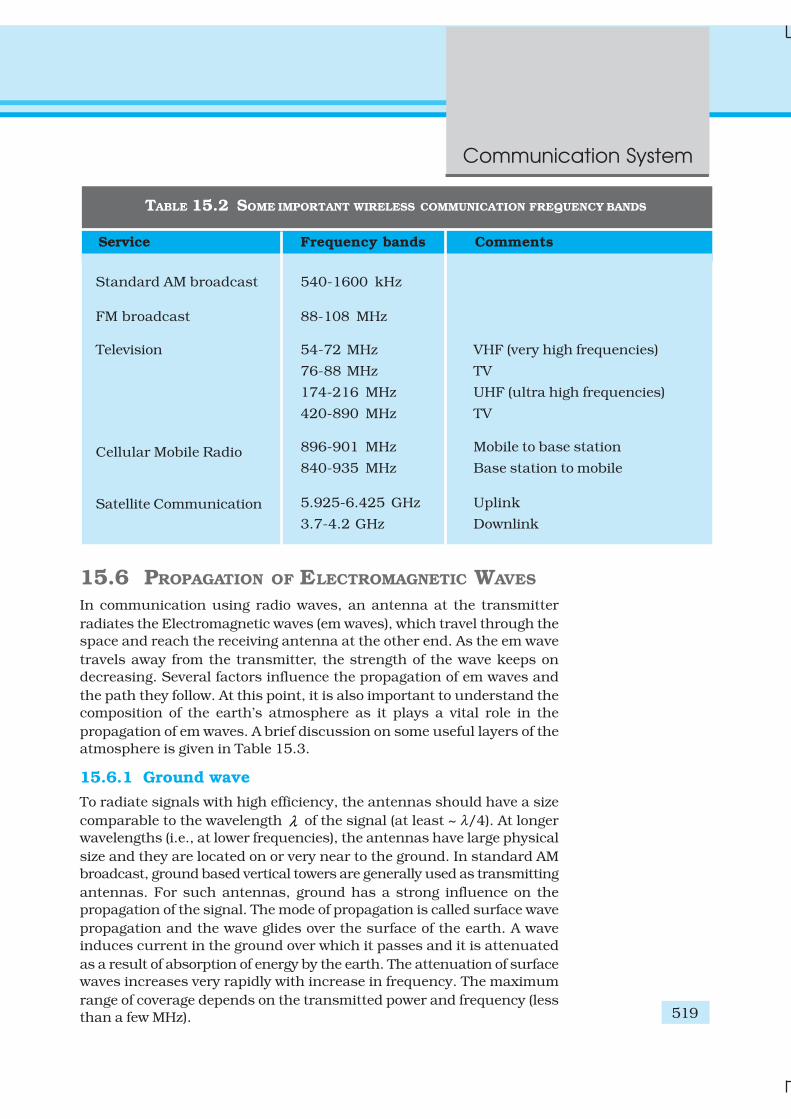
Communication System
519
15.6 PROPAGATION OF ELECTROMAGNETIC WAVES
In communication using radio waves, an antenna at the transmitter
radiates the Electromagnetic waves (em waves), which travel through the
space and reach the receiving antenna at the other end. As the em wave
travels away from the transmitter, the strength of the wave keeps on
decreasing. Several factors influence the propagation of em waves and
the path they follow. At this point, it is also important to understand the
composition of the earth’s atmosphere as it plays a vital role in the
propagation of em waves. A brief discussion on some useful layers of the
atmosphere is given in Table 15.3.
15.6.1 Ground wave
To radiate signals with high efficiency, the antennas should have a size
comparable to the wavelength λ of the signal (at least ~ λ/4). At longer
wavelengths (i.e., at lower frequencies), the antennas have large physical
size and they are located on or very near to the ground. In standard AM
broadcast, ground based vertical towers are generally used as transmitting
antennas. For such antennas, ground has a strong influence on the
propagation of the signal. The mode of propagation is called surface wave
propagation and the wave glides over the surface of the earth. A wave
induces current in the ground over which it passes and it is attenuated
as a result of absorption of energy by the earth. The attenuation of surface
waves increases very rapidly with increase in frequency. The maximum
range of coverage depends on the transmitted power and frequency (less
than a few MHz).
Standard AM broadcast
FM broadcast
Television
Cellular Mobile Radio
Satellite Communication
Service Frequency bands Comments
540-1600 kHz
88-108 MHz
54-72 MHz
76-88 MHz
174-216 MHz
420-890 MHz
896-901 MHz
840-935 MHz
5.925-6.425 GHz
3.7-4.2 GHz
VHF (very high frequencies)
TV
UHF (ultra high frequencies)
TV
Mobile to base station
Base station to mobile
Uplink
Downlink
TABLE 15.2 SOME IMPORTANT WIRELESS COMMUNICATION FREQUENCY BANDS
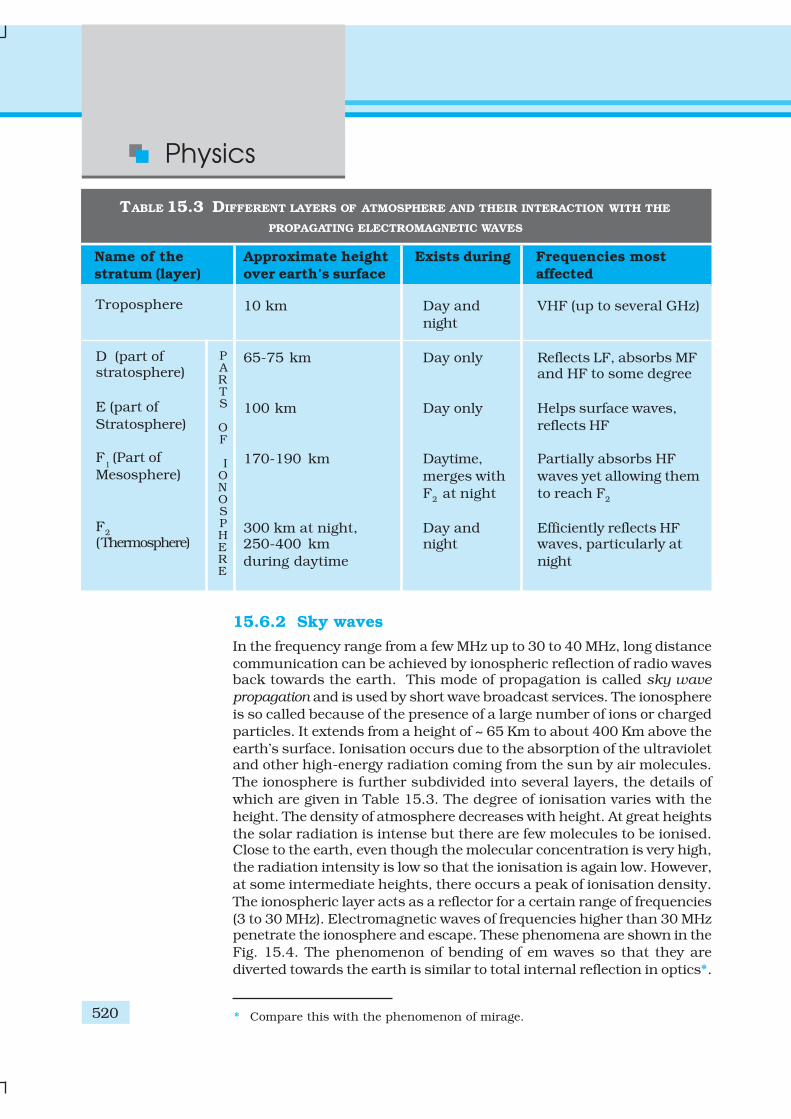
Physics
520
15.6.2 Sky waves
In the frequency range from a few MHz up to 30 to 40 MHz, long distance
communication can be achieved by ionospheric reflection of radio wavesback towards the earth. This mode of propagation is called sky wave
propagation and is used by short wave broadcast services. The ionosphere
is so called because of the presence of a large number of ions or charged
particles. It extends from a height of ~ 65 Km to about 400 Km above the
earth’s surface. Ionisation occurs due to the absorption of the ultravioletand other high-energy radiation coming from the sun by air molecules.
The ionosphere is further subdivided into several layers, the details of
which are given in Table 15.3. The degree of ionisation varies with the
height. The density of atmosphere decreases with height. At great heights
the solar radiation is intense but there are few molecules to be ionised.Close to the earth, even though the molecular concentration is very high,
the radiation intensity is low so that the ionisation is again low. However,
at some intermediate heights, there occurs a peak of ionisation density.
The ionospheric layer acts as a reflector for a certain range of frequencies
(3 to 30 MHz). Electromagnetic waves of frequencies higher than 30 MHzpenetrate the ionosphere and escape. These phenomena are shown in the
Fig. 15.4. The phenomenon of bending of em waves so that they are
diverted towards the earth is similar to total internal reflection in optics*.
Troposphere
D (part ofstratosphere)
E (part of
Stratosphere)
F1 (Part of
Mesosphere)
F2
(Thermosphere)
Name of the
stratum (layer)
Approximate height
over earth’s surface
Exists during
10 km
65-75 km
100 km
170-190 km
300 km at night,250-400 km
during daytime
Day and
night
Day only
Day only
Daytime,
merges with
F2 at night
Day andnight
TABLE 15.3 DIFFERENT LAYERS OF ATMOSPHERE AND THEIR INTERACTION WITH THE
PROPAGATING ELECTROMAGNETIC WAVES
Frequencies most
affected
VHF (up to several GHz)
Reflects LF, absorbs MFand HF to some degree
Helps surface waves,
reflects HF
Partially absorbs HF
waves yet allowing them
to reach F2
Efficiently reflects HFwaves, particularly at
night
PARTS
OF
IONOSPHERE
* Compare this with the phenomenon of mirage.
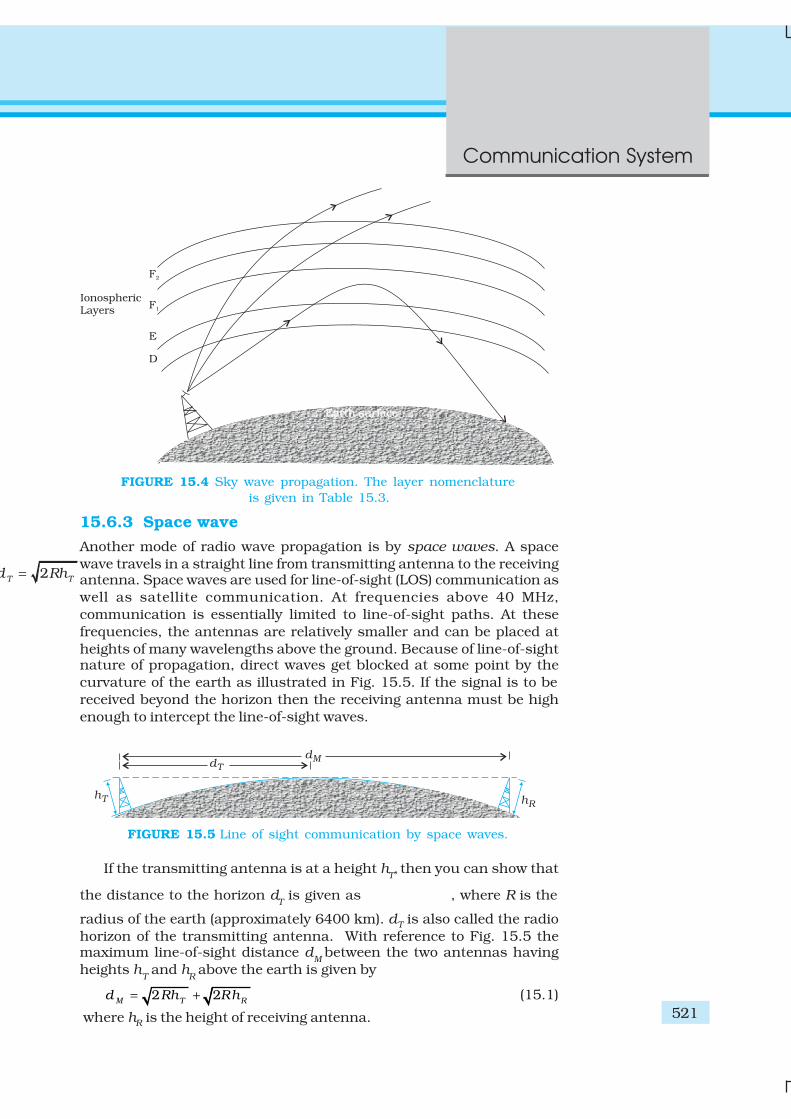
Communication System
521
15.6.3 Space wave
Another mode of radio wave propagation is by space waves. A space
wave travels in a straight line from transmitting antenna to the receivingantenna. Space waves are used for line-of-sight (LOS) communication as
well as satellite communication. At frequencies above 40 MHz,
communication is essentially limited to line-of-sight paths. At these
frequencies, the antennas are relatively smaller and can be placed at
heights of many wavelengths above the ground. Because of line-of-sightnature of propagation, direct waves get blocked at some point by the
curvature of the earth as illustrated in Fig. 15.5. If the signal is to be
received beyond the horizon then the receiving antenna must be high
enough to intercept the line-of-sight waves.
FIGURE 15.4 Sky wave propagation. The layer nomenclature
is given in Table 15.3.
FIGURE 15.5 Line of sight communication by space waves.
If the transmitting antenna is at a height hT, then you can show that
the distance to the horizon dT is given as
2T Td Rh=
, where R is the
radius of the earth (approximately 6400 km). dT is also called the radio
horizon of the transmitting antenna. With reference to Fig. 15.5 themaximum line-of-sight distance d
M between the two antennas having
heights hT and h
R above the earth is given by
2 2M T R
d Rh Rh= + (15.1)
where hR is the height of receiving antenna.
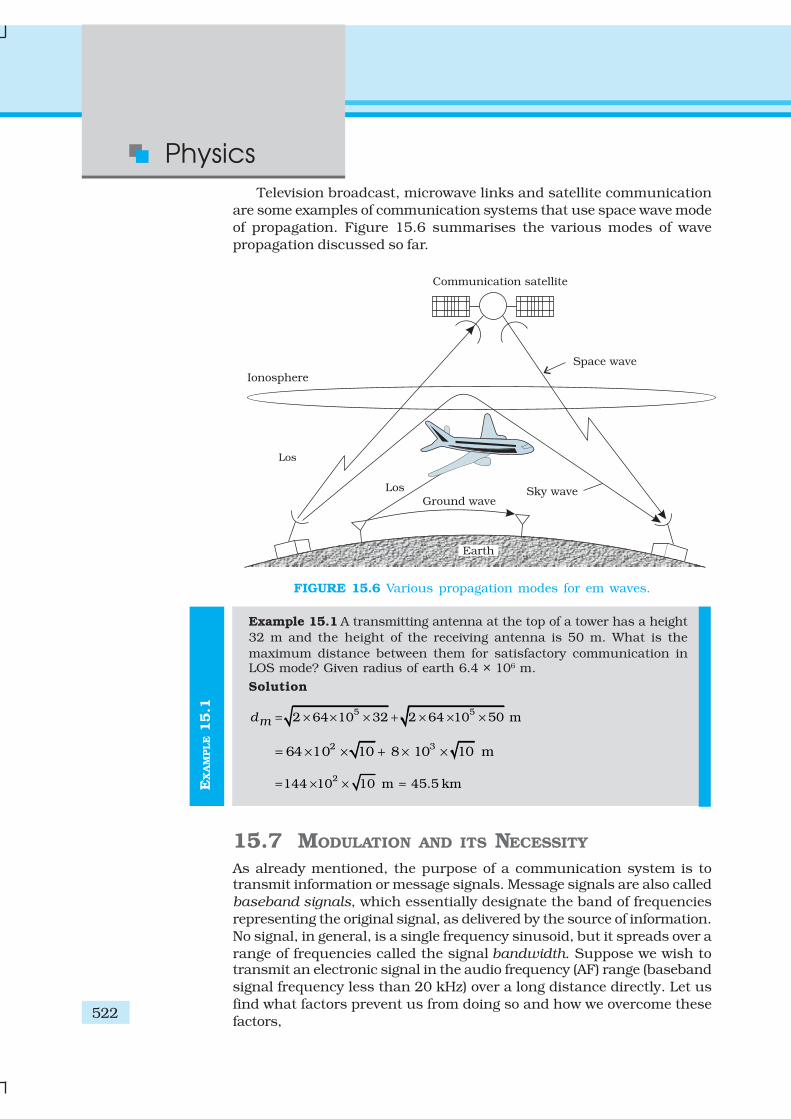
Physics
522
Television broadcast, microwave links and satellite communication
are some examples of communication systems that use space wave mode
of propagation. Figure 15.6 summarises the various modes of wave
propagation discussed so far.
FIGURE 15.6 Various propagation modes for em waves.
EX
AM
PLE 1
5.1
Example 15.1 A transmitting antenna at the top of a tower has a height
32 m and the height of the receiving antenna is 50 m. What is the
maximum distance between them for satisfactory communication inLOS mode? Given radius of earth 6.4 × 10⁶ m.
Solution
5 52 64 10 32 2 64 10 50 mdm = × × × + × × ×
2 364 10 10 8 10 10 m= × × + × ×
2144 10 10 m 45.5 km= × × =
15.7 MODULATION AND ITS NECESSITY
As already mentioned, the purpose of a communication system is totransmit information or message signals. Message signals are also called
baseband signals, which essentially designate the band of frequencies
representing the original signal, as delivered by the source of information.
No signal, in general, is a single frequency sinusoid, but it spreads over a
range of frequencies called the signal bandwidth. Suppose we wish totransmit an electronic signal in the audio frequency (AF) range (baseband
signal frequency less than 20 kHz) over a long distance directly. Let us
find what factors prevent us from doing so and how we overcome these
factors,
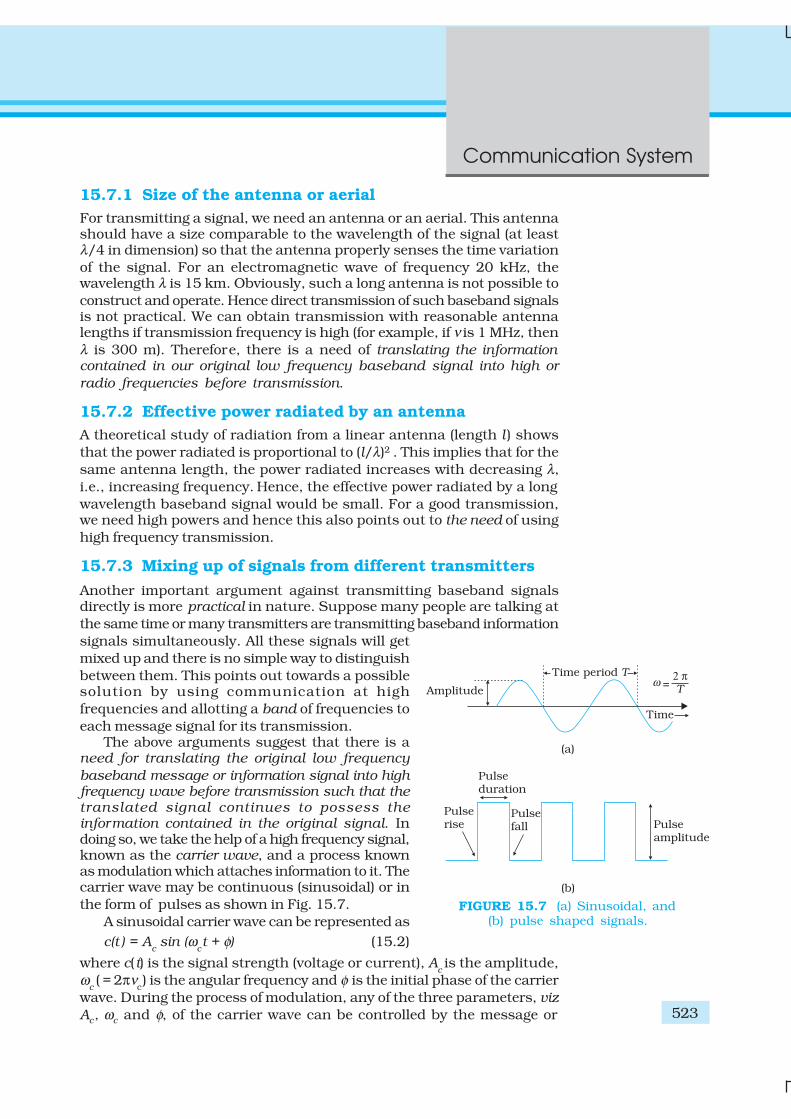
Communication System
523
15.7.1 Size of the antenna or aerial
For transmitting a signal, we need an antenna or an aerial. This antennashould have a size comparable to the wavelength of the signal (at leastλ/4 in dimension) so that the antenna properly senses the time variation
of the signal. For an electromagnetic wave of frequency 20 kHz, thewavelength λ is 15 km. Obviously, such a long antenna is not possible to
construct and operate. Hence direct transmission of such baseband signalsis not practical. We can obtain transmission with reasonable antennalengths if transmission frequency is high (for example, if ν is 1 MHz, then
λ is 300 m). Therefore, there is a need of translating the informationcontained in our original low frequency baseband signal into high or
radio frequencies before transmission.
15.7.2 Effective power radiated by an antenna
A theoretical study of radiation from a linear antenna (length l ) shows
that the power radiated is proportional to (l/λ)2 . This implies that for the
same antenna length, the power radiated increases with decreasing λ,
i.e., increasing frequency. Hence, the effective power radiated by a long
wavelength baseband signal would be small. For a good transmission,we need high powers and hence this also points out to the need of using
high frequency transmission.
15.7.3 Mixing up of signals from different transmitters
Another important argument against transmitting baseband signalsdirectly is more practical in nature. Suppose many people are talking at
the same time or many transmitters are transmitting baseband information
signals simultaneously. All these signals will get
mixed up and there is no simple way to distinguish
between them. This points out towards a possiblesolution by using communication at high
frequencies and allotting a band of frequencies to
each message signal for its transmission.The above arguments suggest that there is a
need for translating the original low frequency
baseband message or information signal into highfrequency wave before transmission such that thetranslated signal continues to possess theinformation contained in the original signal. Indoing so, we take the help of a high frequency signal,known as the carrier wave, and a process knownas modulation which attaches information to it. Thecarrier wave may be continuous (sinusoidal) or in
the form of pulses as shown in Fig. 15.7.
A sinusoidal carrier wave can be represented as
c(t ) = Ac sin (ω
ct + φ) (15.2)
where c(t) is the signal strength (voltage or current), Ac is the amplitude,
ωc ( = 2πν
c) is the angular frequency and φ is the initial phase of the carrier
wave. During the process of modulation, any of the three parameters, viz
Ac, ωc and φ, of the carrier wave can be controlled by the message or
FIGURE 15.7 (a) Sinusoidal, and(b) pulse shaped signals.
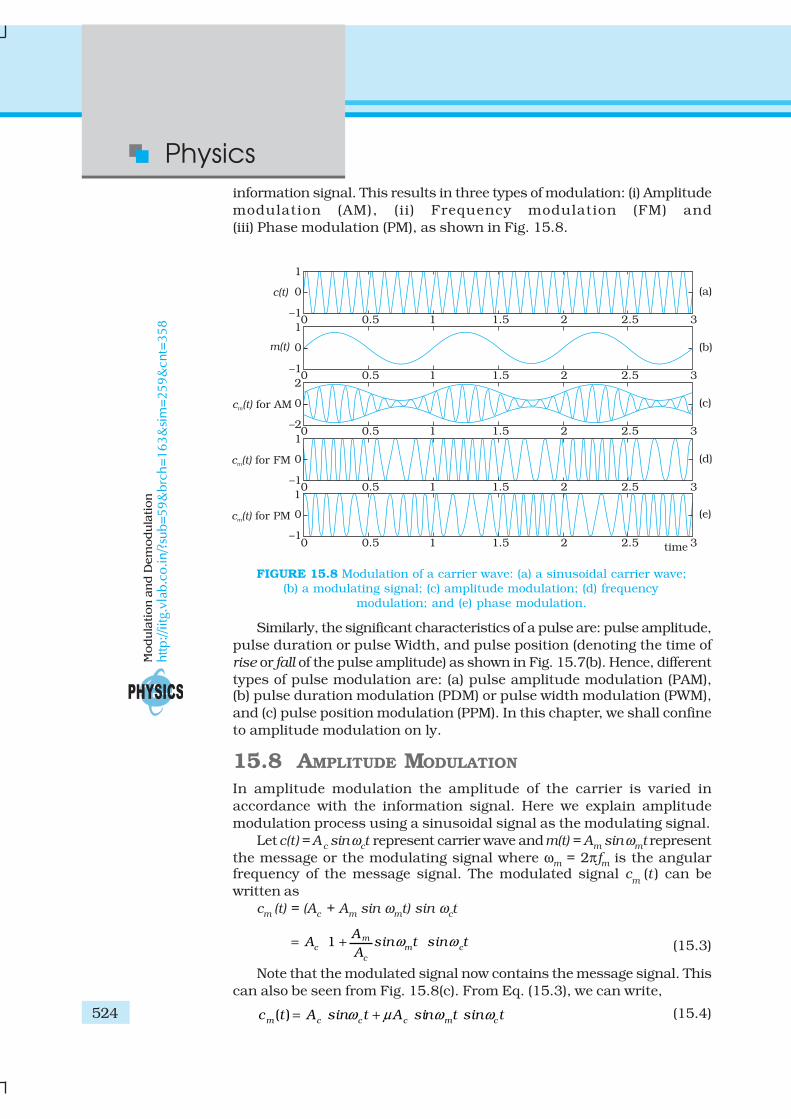
Physics
524
information signal. This results in three types of modulation: (i) Amplitude
modulation (AM), (ii) Frequency modulation (FM) and
(iii) Phase modulation (PM), as shown in Fig. 15.8.
FIGURE 15.8 Modulation of a carrier wave: (a) a sinusoidal carrier wave;
(b) a modulating signal; (c) amplitude modulation; (d) frequency
modulation; and (e) phase modulation.
Similarly, the significant characteristics of a pulse are: pulse amplitude,
pulse duration or pulse Width, and pulse position (denoting the time of
rise or fall of the pulse amplitude) as shown in Fig. 15.7(b). Hence, different
types of pulse modulation are: (a) pulse amplitude modulation (PAM),(b) pulse duration modulation (PDM) or pulse width modulation (PWM),
and (c) pulse position modulation (PPM). In this chapter, we shall confine
to amplitude modulation on ly.
15.8 AMPLITUDE MODULATION
In amplitude modulation the amplitude of the carrier is varied in
accordance with the information signal. Here we explain amplitude
modulation process using a sinusoidal signal as the modulating signal.
Let c(t) = A c sin ωct represent carrier wave and m(t) = Am sin ωmt represent
the message or the modulating signal where ωm = 2πfm is the angularfrequency of the message signal. The modulated signal c
m (t ) can be
written as
cm (t) = (Ac + Am sin ωmt) sin ωct
1 mc m c
c
AA sin t sin t
Aω ω
= +
(15.3)
Note that the modulated signal now contains the message signal. This
can also be seen from Fig. 15.8(c). From Eq. (15.3), we can write,
( )m c c c m cc t A sin t A sin t sin tω µ ω ω= + (15.4)
Mo
du
latio
n a
nd
Dem
od
ula
tio
n
http://iitg.
vlab
.co.in/?su
b=59&
brc
h=163&
sim
=259&
cnt=
358
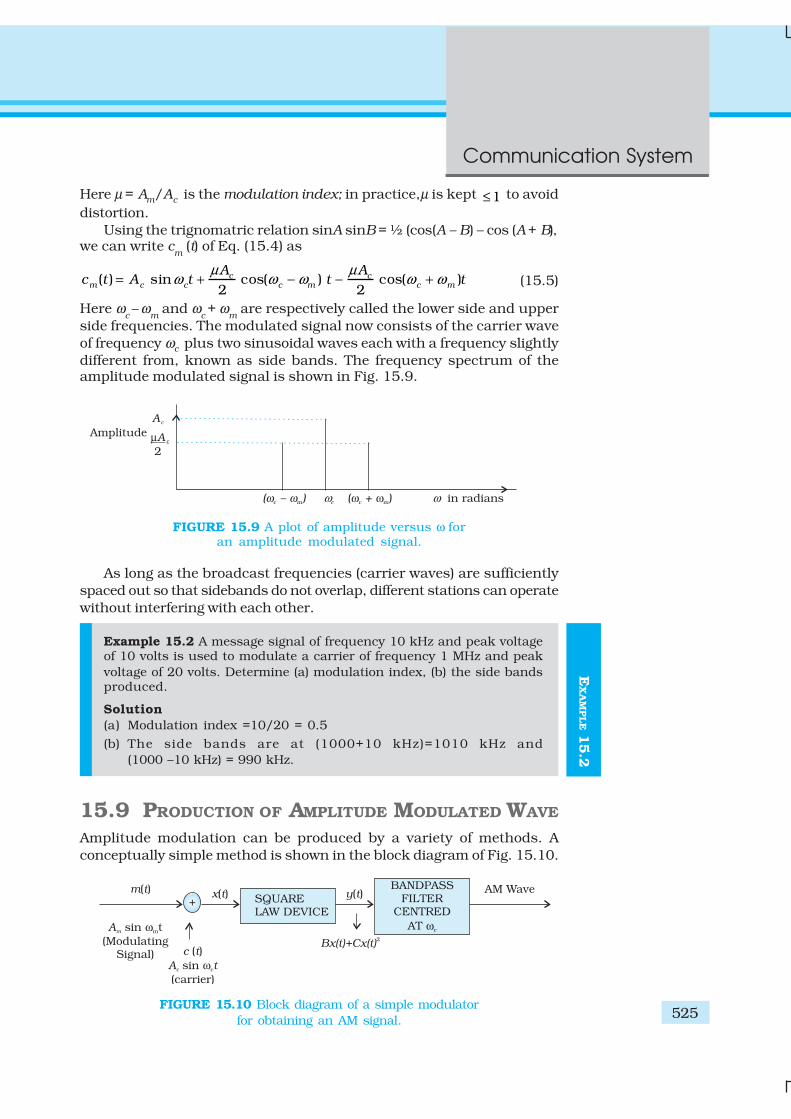
Communication System
525
Here µ = Am/Ac is the modulation index; in practice,µ is kept 1≤ to avoid
distortion.
Using the trignomatric relation sinA sinB = ½ (cos(A – B) – cos (A + B),we can write c
m (t) of Eq. (15.4) as
( ) sin cos( ) cos( )2 2
c cm c c c m c m
A Ac t A t t t
µ µω ω ω ω ω= + − − + (15.5)
Here ωc – ω
m and ω
c + ω
m are respectively called the lower side and upper
side frequencies. The modulated signal now consists of the carrier wave
of frequency ωc plus two sinusoidal waves each with a frequency slightly
different from, known as side bands. The frequency spectrum of theamplitude modulated signal is shown in Fig. 15.9.
FIGURE 15.9 A plot of amplitude versus ω foran amplitude modulated signal.
EX
AM
PLE 1
5.2
As long as the broadcast frequencies (carrier waves) are sufficiently
spaced out so that sidebands do not overlap, different stations can operate
without interfering with each other.
Example 15.2 A message signal of frequency 10 kHz and peak voltageof 10 volts is used to modulate a carrier of frequency 1 MHz and peak
voltage of 20 volts. Determine (a) modulation index, (b) the side bandsproduced.
Solution
(a) Modulation index =10/20 = 0.5
(b) The side bands are at (1000+10 kHz)=1010 kHz and
(1000 –10 kHz) = 990 kHz.
15.9 PRODUCTION OF AMPLITUDE MODULATED WAVE
Amplitude modulation can be produced by a variety of methods. A
conceptually simple method is shown in the block diagram of Fig. 15.10.
FIGURE 15.10 Block diagram of a simple modulator
for obtaining an AM signal.
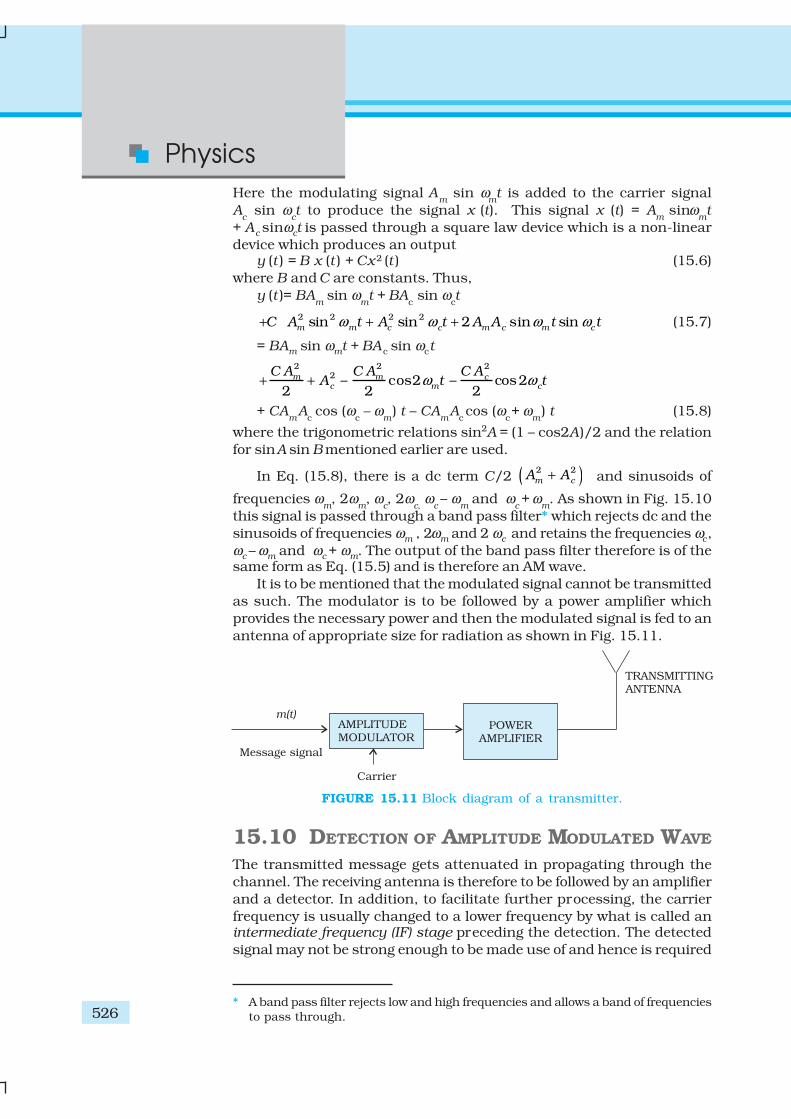
Physics
526
Here the modulating signal Am sin ω
mt is added to the carrier signal
Ac sin ω
ct to produce the signal x (t). This signal x (t) = A
m sinω
mt
+ Ac sinωct is passed through a square law device which is a non-linear
device which produces an outputy (t ) = B x (t ) + Cx 2 (t ) (15.6)
where B and C are constants. Thus,
y (t )= BAm sin ω
mt + BA
c sin ω
ct
2 2 2 2sin sin 2 sin sinm m c c m c m cC A t A t A A t tω ω ω ω + + + (15.7)
= BAm sin ωmt + BAc sin ωct
2 2 22 – cos2 – cos2
2 2 2m m c
c m c
C A C A C AA t tω ω+ +
+ CAm
Ac cos (ω
c – ω
m) t – CA
mA
c cos (ω
c+ ω
m) t (15.8)
where the trigonometric relations sin2A = (1 – cos2A)/2 and the relation
for sinA sin B mentioned earlier are used.
In Eq. (15.8), there is a dc term C/2 ( )2 2
m cA A+ and sinusoids of
frequencies ωm, 2ω
m, ω
c, 2ω
c, ω
c – ω
m and ω
c + ω
m. As shown in Fig. 15.10
this signal is passed through a band pass filter* which rejects dc and the
sinusoids of frequencies ωm , 2ωm and 2 ωc and retains the frequencies ωc,
ωc – ωm and ωc + ωm. The output of the band pass filter therefore is of thesame form as Eq. (15.5) and is therefore an AM wave.
It is to be mentioned that the modulated signal cannot be transmitted
as such. The modulator is to be followed by a power amplifier which
provides the necessary power and then the modulated signal is fed to an
antenna of appropriate size for radiation as shown in Fig. 15.11.
* A band pass filter rejects low and high frequencies and allows a band of frequencies
to pass through.
FIGURE 15.11 Block diagram of a transmitter.
15.10 DETECTION OF AMPLITUDE MODULATED WAVE
The transmitted message gets attenuated in propagating through the
channel. The receiving antenna is therefore to be followed by an amplifier
and a detector. In addition, to facilitate further processing, the carrier
frequency is usually changed to a lower frequency by what is called anintermediate frequency (IF) stage preceding the detection. The detected
signal may not be strong enough to be made use of and hence is required
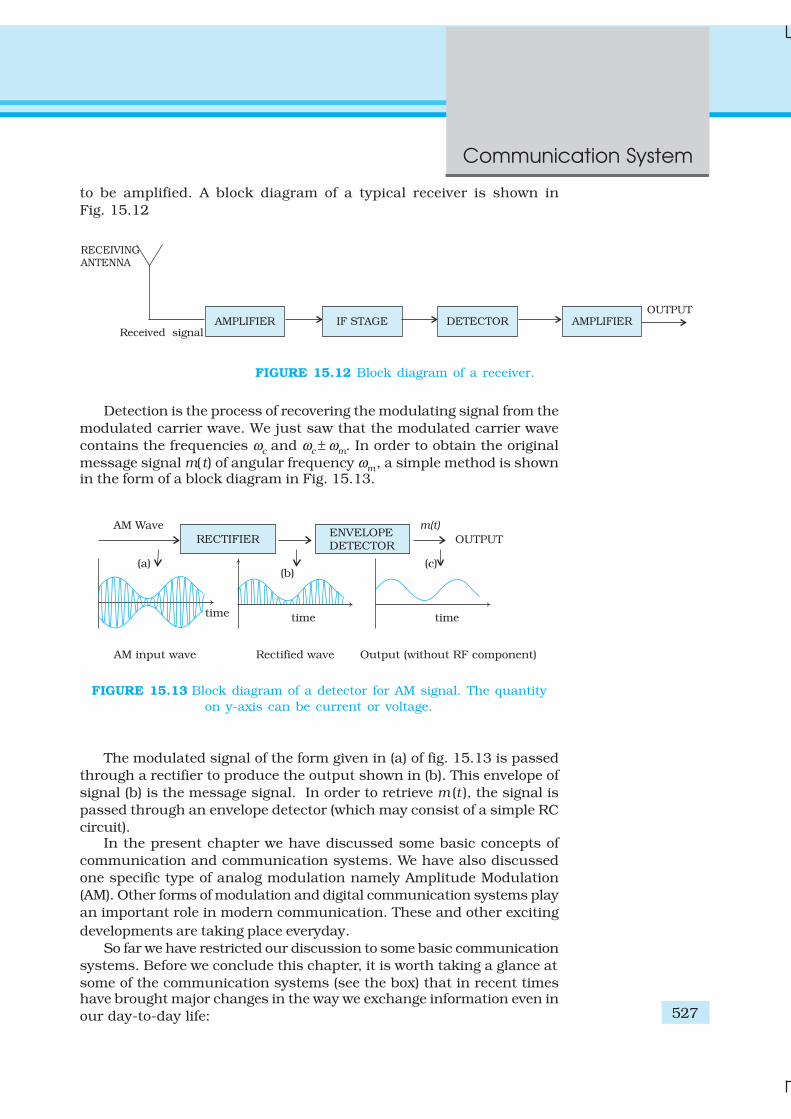
Communication System
527
Detection is the process of recovering the modulating signal from the
modulated carrier wave. We just saw that the modulated carrier wave
contains the frequencies ωc and ωc ± ωm. In order to obtain the original
message signal m(t) of angular frequency ωm , a simple method is shownin the form of a block diagram in Fig. 15.13.
FIGURE 15.12 Block diagram of a receiver.
to be amplified. A block diagram of a typical receiver is shown in
Fig. 15.12
FIGURE 15.13 Block diagram of a detector for AM signal. The quantity
on y-axis can be current or voltage.
The modulated signal of the form given in (a) of fig. 15.13 is passed
through a rectifier to produce the output shown in (b). This envelope of
signal (b) is the message signal. In order to retrieve m (t ), the signal is
passed through an envelope detector (which may consist of a simple RC
circuit).In the present chapter we have discussed some basic concepts of
communication and communication systems. We have also discussed
one specific type of analog modulation namely Amplitude Modulation
(AM). Other forms of modulation and digital communication systems play
an important role in modern communication. These and other exciting
developments are taking place everyday.
So far we have restricted our discussion to some basic communication
systems. Before we conclude this chapter, it is worth taking a glance at
some of the communication systems (see the box) that in recent timeshave brought major changes in the way we exchange information even in
our day-to-day life:
Physics
528
ADDITIONAL INFORMATION
The Internet
It is a system with billions of users worldwide. It permits communication and sharing of alltypes of information between any two or more computers connected through a large and
complex network. It was started in 1960’s and opened for public use in 1990’s. With thepassage of time it has witnessed tremendous growth and it is still expanding its reach. Itsapplications include
(i) E mail – It permits exchange of text/graphic material using email software. We can write aletter and send it to the recipient through ISP’s (Internet Service Providers) who work like
the dispatching and receiving post offices.(ii) File transfer – A FTP (File Transfer Programmes) allows transfer of files/software from one
computer to another connected to the Internet.
(iii) World Wide Web (WWW) – Computers that store specific information for sharing with othersprovide websites either directly or through web service providers. Government
departments, companies, NGO’s (Non-Government Organisations) and individuals can postinformation about their activities for restricted or free use on their websites. This informationbecomes accessible to the users. Several search engines like Google, Yahoo! etc. help us in
finding information by listing the related websites. Hypertext is a powerful feature of theweb that automatically links relevant information from one page on the web to another
using HTML (hypertext markup language).(iv) E-commerce – Use of the Internet to promote business using electronic means such as
using credit cards is called E-commerce. Customers view images and receive all the
information about various products or services of companies through their websites. Theycan do on-line shopping from home/office. Goods are dispatched or services are provided
by the company through mail/courier.(v) Chat – Real time conversation among people with common interests through typed
messages is called chat. Everyone belonging to the chat group gets the message
instantaneously and can respond rapidly.
Facsimile (FAX)
It scans the contents of a document (as an image, not text) to create electronic signals. Thesesignals are then sent to the destination (another FAX machine) in an orderly manner using
telephone lines. At the destination, the signals are reconverted into a replica of the originaldocument. Note that FAX provides image of a static document unlike the image provided by
television of objects that might be dynamic.
Mobile telephonyThe concept of mobile telephony was developed first in 1970’s and it was fully implemented inthe following decade. The central concept of this system is to divide the service area into a
suitable number of cells centred on an office called MTSO (Mobile Telephone Switching Office).Each cell contains a low-power transmitter called a base station and caters to a large number
of mobile receivers (popularly called cell phones). Each cell could have a service area of a fewsquare kilometers or even less depending upon the number of customers. When a mobilereceiver crosses the coverage area of one base station, it is necessary for the mobile user to be
transferred to another base station. This procedure is called handover or handoff. This processis carried out very rapidly, to the extent that the consumer does not even notice it. Mobile
telephones operate typically in the UHF range of frequencies (about 800-950 MHz).

Communication System
529
SUMMARY
1. Electronic communication refers to the faithful transfer of information
or message (available in the form of electrical voltage and current)
from one point to another point.
2. Transmitter, transmission channel and receiver are three basic units
of a communication system.
3. Two important forms of communication system are: Analog and Digital.
The information to be transmitted is generally in continuous waveform
for the former while for the latter it has only discrete or quantised
levels.
4. Every message signal occupies a range of frequencies. The bandwidth
of a message signal refers to the band of frequencies, which are necessary
for satisfactory transmission of the information contained in the signal.
Similarly, any practical communication system permits transmission
of a range of frequencies only, which is referred to as the bandwidth of
the system.
5. Low frequencies cannot be transmitted to long distances. Therefore,
they are superimposed on a high frequency carrier signal by a process
known as modulation.
6. In modulation, some characteristic of the carrier signal like amplitude,
frequency or phase varies in accordance with the modulating or message
signal. Correspondingly, they are called Amplitude Modulated (AM),
Frequency Modulated (FM) or Phase Modulated (PM) waves.
7. Pulse modulation could be classified as: Pulse Amplitude Modulation
(PAM), Pulse Duration Modulation (PDM) or Pulse Width Modulation
(PWM) and Pulse Position Modulation (PPM).
8. For transmission over long distances, signals are radiated into space
using devices called antennas. The radiated signals propagate as
electromagnetic waves and the mode of propagation is influenced by
the presence of the earth and its atmosphere. Near the surface of the
earth, electromagnetic waves propagate as surface waves. Surface wave
propagation is useful up to a few MHz frequencies.
9. Long distance communication between two points on the earth is
achieved through reflection of electromagnetic waves by ionosphere.
Such waves are called sky waves. Sky wave propagation takes place up
to frequency of about 30 MHz. Above this frequency, electromagnetic
waves essentially propagate as space waves. Space waves are used for
line-of-sight communication and satellite communication.
10. If an antenna radiates electromagnetic waves from a height hT, then
the range dT is given by 2 TRh where R is the radius of the earth.
11. Amplitude modulated signal contains frequencies ( – ),ω ωc m
ωc and
( ).c mω ω+
12. Amplitude modulated waves can be produced by application of the
message signal and the carrier wave to a non-linear device, followed by
a band pass filter.
13. AM detection, which is the process of recovering the modulating signal
from an AM waveform, is carried out using a rectifier and an envelope
detector.
Physics
530
POINTS TO PONDER
1. In the process of transmission of message/ information signal, noise gets
added to the signal anywhere between the information source and the
receiving end. Can you think of some sources of noise?
2. In the process of modulation, new frequencies called sidebands are generated
on either side (higher and lower than the carrier frequency) of the carrier by
an amount equal to the highest modulating frequency. Is it possible to
retrieve the message by transmitting (a) only the side bands, (b) only one
side band?
3. In amplitude modulation, modulation index µ ≤ 1 is used. What will happen
if µ > 1?
EXERCISES
15.1 Which of the following frequencies will be suitable for beyond-the-
horizon communication using sky waves?
(a) 10 kHz
(b) 10 MHz
(c) 1 GHz
(d) 1000 GHz
15.2 Frequencies in the UHF range normally propagate by means of:
(a) Ground waves.
(b) Sky waves.
(c) Surface waves.
(d) Space waves.
15.3 Digital signals
(i) do not provide a continuous set of values,
(ii) represent values as discrete steps,
(iii) can utilize binary system, and
(iv) can utilize decimal as well as binary systems.
Which of the above statements are true?
(a) (i) and (ii) only
(b) (ii) and (iii) only
(c) (i), (ii) and (iii) but not (iv)
(d) All of (i), (ii), (iii) and (iv).
15.4 Is it necessary for a transmitting antenna to be at the same height
as that of the receiving antenna for line-of-sight communication? A
TV transmitting antenna is 81m tall. How much service area can it
cover if the receiving antenna is at the ground level?
15.5 A carrier wave of peak voltage 12V is used to transmit a message
signal. What should be the peak voltage of the modulating signal in
order to have a modulation index of 75%?
15.6 A modulating signal is a square wave, as shown in Fig. 15.14.
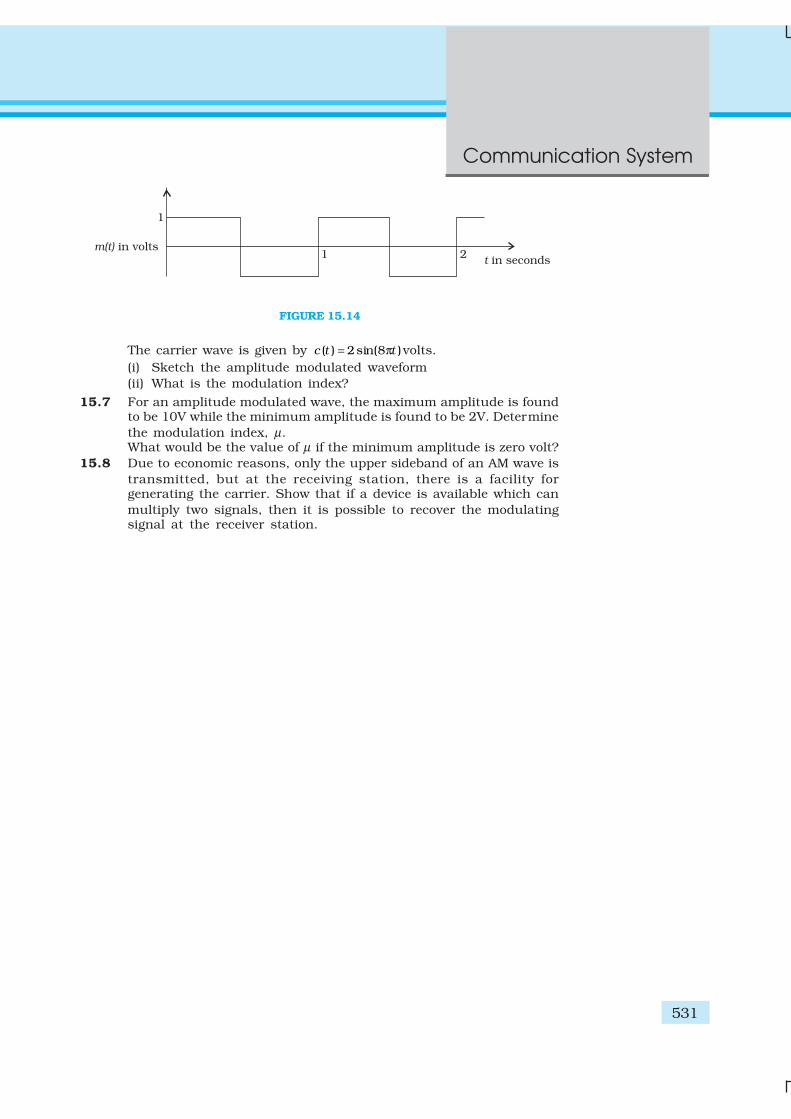
Communication System
531
FIGURE 15.14
The carrier wave is given by ( ) 2 sin(8 )c t t= π volts.
(i) Sketch the amplitude modulated waveform
(ii) What is the modulation index?
15.7 For an amplitude modulated wave, the maximum amplitude is foundto be 10V while the minimum amplitude is found to be 2V. Determine
the modulation index, µ.What would be the value of µ if the minimum amplitude is zero volt?
15.8 Due to economic reasons, only the upper sideband of an AM wave is
transmitted, but at the receiving station, there is a facility forgenerating the carrier. Show that if a device is available which can
multiply two signals, then it is possible to recover the modulatingsignal at the receiver station.

Physics
532
APPENDICES
APPENDIX A 1
THE GREEK ALPHABET
APPENDIX A 2
COMMON SI PREFIXES AND SYMBOLS FOR MULTIPLES AND SUB-MULTIPLES
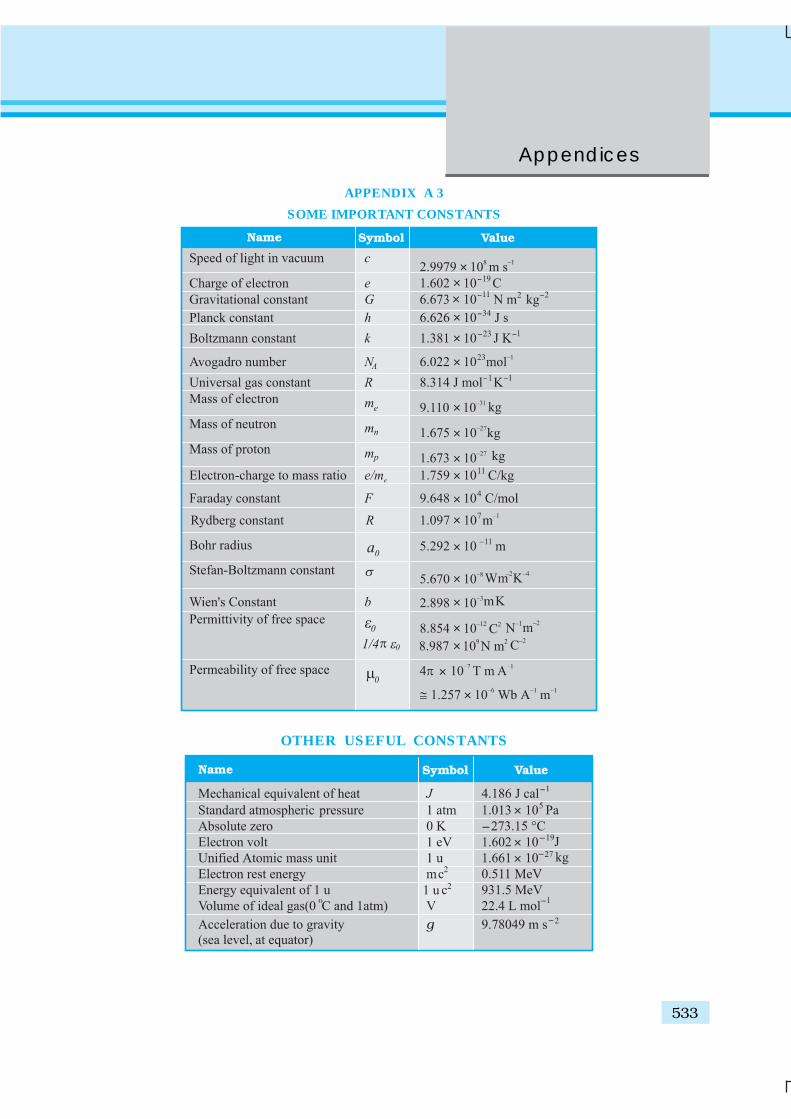
Answers
533
Appendices
APPENDIX A 3
SOME IMPORTANT CONSTANTS
OTHER USEFUL CONSTANTS
Physics
534
ANSWERS
CHAPTER 9
9.1 v = –54 cm. The image is real, inverted and magnified. The size of theimage is 5.0 cm. As u → f, v → ∞; for u < f, image is virtual.
9.2 v = 6.7 cm. Magnification = 5/9, i.e., the size of the image is 2.5 cm. Asu → ∞; v → f (but never beyond) while m → 0.
9.3 1.33; 1.7 cm
9.4 nga = 1.51; nwa
= 1.32; ngw = 1.144; which gives sin r = 0.6181 i.e.,
r ~ 38º.
9.5 r = 0.8 × tan ic and sin 1/1.33 0.75ci = ≅ , where r is the radius (in m)
of the largest circle from which light comes out and ic is the criticalangle for water-air interface, Area = 2.6 m2
9.6 n ≅ 1.53 and Dm for prism in water ≅ 10º
9.7 R = 22 cm
9.8 Here the object is virtual and the image is real. u = +12 cm (object onright; virtual)
(a) f = +20 cm. Image is real and at 7.5 cm from the lens on its rightside.
(b) f = –16 cm. Image is real and at 48 cm from the lens on its rightside.
9.9 v = 8.4 cm, image is erect and virtual. It is diminished to a size1.8 cm. As u → ∞, v → f (but never beyond f while m → 0).
Note that when the object is placed at the focus of the concave lens(21 cm), the image is located at 10.5 cm (not at infinity as one mightwrongly think).
9.10 A diverging lens of focal length 60 cm
9.11 (a) ve = –25 cm and fe = 6.25 cm give ue = –5 cm; vO = (15 – 5) cm =10 cm,fO = uO = – 2.5 cm; Magnifying power = 20
(b) uO = – 2.59 cm.Magnifying power = 13.5.
9.12 Angular magnification of the eye-piece for image at 25 cm
= + =25
2 51 11
.; | | .25
cm 2 27cm11eu = = ; vO = 7.2 cm
Separation = 9.47 cm; Magnifying power = 88
Answers
535
9.13 24; 150 cm
9.14 (a) Angular magnification = 1500
(b) Diameter of the image = 13.7 cm.
9.15 Apply mirror equation and the condition:(a) f < 0 (concave mirror); u < 0 (object on left)
(b) f > 0; u < 0
(c) f > 0 (convex mirror) and u < 0
(d) f < 0 (concave mirror); f < u < 0
to deduce the desired result.9.16 The pin appears raised by 5.0 cm. It can be seen with an explicit ray
diagram that the answer is independent of the location of the slab(for small angles of incidence).
9.17 (a) sin i ′c = 1.44/1.68 which gives i ′c = 59°. Total internal reflectiontakes place when i > 59° or when r < r
max = 31°. Now,
(sin /sin ) .max max
i r =1 68 , which gives imax ~ 60°. Thus, all
incident rays of angles in the range 0 < i < 60° will suffer totalinternal reflections in the pipe. (If the length of the pipe isfinite, which it is in practice, there will be a lower limit on idetermined by the ratio of the diameter to the length of thepipe.)
(b) If there is no outer coating, i ′c = sin–1(1/1.68) = 36.5°. Now,i = 90° will have r = 36.5° and i ′ = 53.5° which is greater thani ′c. Thus, all incident rays (in the range 53.5° < i < 90°) will
suffer total internal reflections.
9.18 (a) Rays converging to a point ‘behind’ a plane or convex mirror arereflected to a point in front of the mirror on a screen. In otherwords, a plane or convex mirror can produce a real image if theobject is virtual. Convince yourself by drawing an appropriateray diagram.
(b) When the reflected or refracted rays are divergent, the image isvirtual. The divergent rays can be converged on to a screen bymeans of an appropriate converging lens. The convex lens of theeye does just that. The virtual image here serves as an object forthe lens to produce a real image. Note, the screen here is notlocated at the position of the virtual image. There is no contra-diction.
(c) Taller
(d) The apparent depth for oblique viewing decreases from its valuefor near-normal viewing. Convince yourself of this fact by draw-ing ray diagrams for different positions of the observer.
(e) Refractive index of a diamond is about 2.42, much larger thanthat of ordinary glass (about 1.5). The critical angle of diamondis about 24°, much less than that of glass. A skilled diamond-cutter exploits the larger range of angles of incidence (in thediamond), 24° to 90°, to ensure that light entering the diamondis totally reflected from many faces before getting out–thusproducing a sparkling effect.
9.19 For fixed distance s between object and screen, the lens equationdoes not give a real solution for u or v if f is greater than s/4.
Therefore, fmax = 0.75 m.
9.20 21.4 cm

Physics
536
9.21 (a) (i) Let a parallel beam be the incident from the left on the convexlens first.f1 = 30 cm and u
1 = – ∞ , give v
1 = + 30 cm. This image becomes
a virtual object for the second lens.
f2 = –20 cm, u2 = + (30 – 8) cm = + 22 cm which gives,v2 = – 220 cm. The parallel incident beam appears to divergefrom a point 216 cm from the centre of the two-lens system .
(ii) Let the parallel beam be incident from the left on the concavelens first: f1 = – 20 cm, u1 = – ∞, give v1 = – 20 cm. This imagebecomes a real object for the second lens: f2 = + 30 cm, u2 =– (20 + 8) cm = – 28 cm which gives, v
2 = – 420 cm. The parallel
incident beam appears to diverge from a point 416 cm on theleft of the centre of the two-lens system.
Clearly, the answer depends on which side of the lens systemthe parallel beam is incident. Further we do not have a simple lensequation true for all u (and v) in terms of a definite constant of thesystem (the constant being determined by f1 and f2, and the separationbetween the lenses). The notion of effective focal length, therefore,does not seem to be meaningful for this system.
(b) u1 = – 40 cm, f1 = 30 cm, gives v1= 120 cm.
Magnitude of magnification due to the first (convex) lens is 3.u 2 = + (120 – 8) cm = +112 cm (object virtual);
f2 = – 20 cm which gives v2
112 2092
= − × cm
Magnitude of magnification due to the second (concave)lens = 20/92.
Net magnitude of magnification = 0.652Size of the image = 0.98 cm
9.22 If the refracted ray in the prism is incident on the second face at thecritical angle ic, the angle of refraction r at the first face is (60°–ic).Now, ic = sin–1 (1/1.524) ~ 41°
Therefore, r = 19°
sin i = 0.4962; i ~ 30°
9.23 Two identical prisms made of the same glass placed with theirbases on opposite sides (of the incident white light) and facestouching (or parallel) will neither deviate nor disperse, but will mearlyproduce a parallel displacement of the beam.
(a) To deviate without dispersion, choose, say, the first prismto be of crown glass, and take for the second prism a flintglass prism of suitably chosen refracting angle (smaller thanthat of crown glass prism because the flint glass prismdisperses more) so that dispersion due to the first is nullifiedby the second.
(b) To disperse without deviation, increase the angle of flintglass prism (i.e., try flint glass prisms of greater and greaterangle) so that deviations due to the two prisms are equaland opposite. (The flint glass prism angle will still be smallerthan that of crown glass because flint glass has higherrefractive index than that of crown glass). Because of theadjustments involved for so many colours, these are notmeant to be precise arrangements for the purpose required.
Answers
537
9.24 To see objects at infinity , the eye uses its least converging power= (40+20) dioptres = 60 dioptres. This gives a rough idea of the distancebetween the retina and cornea-eye lens: (5/3) cm. To focus an objectat the near point (u = –25 cm), on the retina (v = 5/3 cm), the focallength should be
11 3 25cm
25 5 16
−⎡ ⎤+ =⎢ ⎥⎣ ⎦
corresponding to a converging power of 64 dioptres. The power of theeye lens then is (64 – 40) dioptres = 24 dioptres. The range ofaccommodation of the eye-lens is roughly 20 to 24 dioptres.
9.25 No, a person may have normal ability of accommodation of the eye-lens and yet may be myopic or hypermetropic. Myopia arises whenthe eye-ball from front to back gets too elongated; hypermetropiaarises when it gets too shortened. In practice, in addition, the eyelens may also lose some of its ability of accommodation. When theeyeball has the normal length but the eye lens loses partially itsability of accommodation (as happens with increasing age for anynormal eye), the ‘defect’ is called presbyopia and is corrected in thesame manner as hypermetropia.
9.26 The far point of the person is 100 cm, while his near point may havebeen normal (about 25 cm). Objects at infinity produce virtual imageat 100 cm (using spectacles). To view closer objects i.e., those whichare (or whose images using the spectacles are) between 100 cm and25 cm, the person uses the ability of accommodation of his eye-lens.This ability usually gets partially lost in old age (presbyopia). Thenear point of the person recedes to 50 cm. To view objects at 25 cmclearly, the person needs converging lens of power +2 dioptres.
9.27 The defect (called astigmatism) arises because the curvature of thecornea plus eye-lens refracting system is not the same in differentplanes. [The eye-lens is usually spherical i.e., has the samecurvature on different planes but the cornea is not spherical incase of an astigmatic eye.] In the present case, the curvature in thevertical plane is enough, so sharp images of vertical lines can beformed on the retina. But the curvature is insufficient in thehorizontal plane, so horizontal lines appear blurred. The defect canbe corrected by using a cylindrical lens with its axis along the vertical.Clearly , parallel rays in the vertical plane will suffer no extrarefraction, but those in the horizontal plane can get the requiredextra convergence due to refraction by the curved surface of thecylindrical lens if the curvature of the cylindrical surface is chosenappropriately.
9.28 (a) Closest distance = 416
4 2cm cm≈ .
Farthest distance = 5 cm
(b) Maximum angular magnification = [25/(25/6)] = 6. Minimumangular magnification = (25/5) = 5
9.29 (a)1 1
91
10v+ =
i.e., v = – 90 cm,Magnitude of magnification = 90/9 = 10.
Physics
538
Each square in the virtual image has an area 10 × 10 × 1 mm2
= 100 mm2 = 1 cm2
(b) Magnifying power = 25/9 = 2.8
(c) No, magnification of an image by a lens and angular magnification(or magnifying power) of an optical instrument are two separatethings. The latter is the ratio of the angular size of the object(which is equal to the angular size of the image even if the imageis magnified) to the angular size of the object if placed at the nearpoint (25 cm). Thus, magnification magnitude is |(v/u )| andmagnifying power is (25/ |u|). Only when the image is located atthe near point |v| = 25 cm, are the two quantities equal.
9.30 (a) Maximum magnifying power is obtained when the image is atthe near point (25 cm)
u = – 7.14 cm.
(b) Magnitude of magnification = (25/ |u|) = 3.5.
(c) Magnifying power = 3.5Yes, the magnifying power (when the image is produced at 25 cm)is equal to the magnitude of magnification.
9.31 Magnification = ( . / )6 25 1 = 2.5
v = +2.5u
+ − =1
2 5
1 1
10. u u
i.e.,u = – 6 cm|v| = 15 cm
The virtual image is closer than the normal near point (25 cm) andcannot be seen by the eye distinctly.
9.32 (a) Even though the absolute image size is bigger than the objectsize, the angular size of the image is equal to the angular size ofthe object. The magnifier helps in the following way: without itobject would be placed no closer than 25 cm; with it the objectcan be placed much closer. The closer object has larger angularsize than the same object at 25 cm. It is in this sense that angularmagnification is achieved.
(b) Yes, it decreases a little because the angle subtended at the eyeis then slightly less than the angle subtended at the lens. Theeffect is negligible if the image is at a very large distance away.[Note: When the eye is separated from the lens , the anglessubtended at the eye by the first object and its image are notequal.]
(c) First, grinding lens of very small focal length is not easy. Moreimportant, if you decrease focal length, aberrations (both sphericaland chromatic) become more pronounced. So, in practice, youcannot get a magnifying power of more than 3 or so with a simpleconvex lens. However, using an aberration corrected lens system,one can increase this limit by a factor of 10 or so.
(d) Angular magnification of eye-piece is [(25/fe) + 1] ( fe in cm) whichincreases if fe is smaller. Further, magnification of the objective
is given by O
O O O
1
| | (| |/ ) 1
v
u u f=
−
Answers
539
which is large when O| |u is slightly greater than fO. The micro-
scope is used for viewing very close object. So O| |u is small, andso is fO.
(e) The image of the objective in the eye-piece is known as ‘eye-ring’.All the rays from the object refracted by objective go through theeye-ring. Therefore, it is an ideal position for our eyes for viewing.If we place our eyes too close to the eye-piece, we shall not collectmuch of the light and also reduce our field of view. If we positionour eyes on the eye-ring and the area of the pupil of our eye isgreater or equal to the area of the eye-ring, our eyes will collectall the light refracted by the objective. The precise location ofthe eye-ring naturally depends on the separation between theobjective and the eye-piece. When you view through a microscopeby placing your eyes on one end,the ideal distance between theeyes and eye-piece is usually built-in the design of theinstrument.
9.33 Assume microscope in normal use i.e., image at 25 cm. Angularmagnification of the eye-piece
= 25
51 6+ =
Magnification of the objective
= 30
65=
O O
1 1 1
5 1.25u u− =
which gives uO= –1.5 cm; v
0= 7.5 cm. | |ue = (25/6) cm = 4.17 cm. The
separation between the objective and the eye-piece should be (7.5 +4.17) cm = 11.67 cm. Further the object should be placed 1.5 cm fromthe objective to obtain the desired magnification.
9.34 (a) m = ( fO/fe) = 28
(b) m = O O125e
f f
f
⎡ ⎤+⎢ ⎥⎣ ⎦
= 33.6
9.35 (a) fO + fe = 145 cm
(b) Angle subtended by the tower = (100/3000) = (1/30) rad.Angle subtended by the image produced by the objective
= O 140
h h
f=
Equating the two, h = 4.7 cm.
(c) Magnification (magnitude) of the eye-piece = 6. Height of thefinal image (magnitude) = 28 cm.
9.36 The image formed by the larger (concave) mirror acts as virtual objectfor the smaller (convex) mirror. Parallel rays coming from the objectat infinity will focus at a distance of 110 mm from the larger mirror.The distance of virtual object for the smaller mirror = (110 –20) =90 mm. The focal length of smaller mirror is 70 mm. Using the mirrorformula, image is formed at 315 mm from the smaller mirror.
Physics
540
9.37 The reflected rays get deflected by twice the angle of rotation of themirror. Therefore, d/1.5 = tan 7°. Hence d = 18.4 cm.
9.38 n = 1.33
CHAPTER 10
10.1 (a) Reflected light: (wavelength, frequency, speed same as incidentlight)
λ = 589 nm, ν = 5.09 × 10¹⁴ Hz, c = 3.00 × 10⁸ m s–1
(b) Refracted light: (frequency same as the incident frequency)ν = 5.09 × 10¹⁴Hzv = (c/n) = 2.26 × 10⁸ m s–1, λ = (v/ν) = 444 nm
10.2 (a) Spherical(b) Plane(c) Plane (a small area on the surface of a large sphere is nearly
planar).
10.3 (a) 2.0 × 10⁸ m s–1
(b) No. The refractive index, and hence the speed of light in amedium, depends on wavelength. [When no particularwavelength or colour of light is specified, we may take the givenrefractive index to refer to yellow colour.] Now we know violetcolour deviates more than red in a glass prism, i.e. nv > nr.Therefore, the violet component of white light travels slower thanthe red component.
10.4 λ =× × ×
×
1 2 10 0 28 10
4 1 4
. .
.
– 2 – 3
m = 600 nm
10.5 K/4
10.6 (a) 1.17 mm (b) 1.56 mm
10.7 0.15°
10.8 tan–1(1.5) ~ 56.3o
10.9 5000 Å, 6 × 10¹⁴ Hz; 45°
10.10 40 m
10.11 Use the formula λ′ – λ = v
cλ
i.e., v = c
λλ λ( ' − ) =
6563
15103 8 ×× = 6.86 × 10⁵ m s–1
10.12 In corpuscular (particle) picture of refraction, particles of lightincident from a rarer to a denser medium experience a force ofattraction normal to the surface. This results in an increase in thenormal component of the velocity but the component along the surfaceis unchanged. This means
c sin i = v sin r or v
c rn
i= =
sin
sin.
Since n > 1, v > c.
Answers
541
The prediction is opposite to the experimental results (v < c ). Thewave picture of light is consistent with the experiment.
10.13 With the point object at the centre, draw a circle touching the mirror.This is a plane section of the spherical wavefront from the objectthat has just reached the mirror. Next draw the locations of thissame wavefront after a time t in the presence of the mirror, and inthe absence of the mirror. You will get two arcs symmetrically locatedon either side of the mirror. Using simple geometry, the centre of thereflected wavefront (the image of the object) is seen to be at the samedistance from the mirror as the object.
10.14 (a) The speed of light in vacuum is a universal constant independentof all the factors listed and anything else. In particular, note thesurprising fact that it is independent of the relative motionbetween the source and the observer. This fact is a basic axiomof Einstein’s special theory of relativity.
(b) Dependence of the speed of light in a medium:(i) does not depend on the nature of the source (wave speed is
determined by the properties of the medium of propagation.This is also true for other waves, e.g., sound waves, waterwaves, etc.).
(ii) independent of the direction of propagation for isotropicmedia.
(iii) independent of the motion of the source relative to themedium but depends on the motion of the observer relativeto the medium.
(iv) depends on wavelength.(v) independent of intensity. [For high intensity beams,
however, the situation is more complicated and need notconcern us here.]
10.15 Sound waves require a medium for propagation. Thus even thoughthe situations (i) and (ii) may correspond to the same relative motion(between the source and the observer), they are not identicalphysically since the motion of the observer relative to the mediumis different in the two situations. Therefore, we cannot expectDoppler formulas for sound to be identical for (i) and (ii). For lightwaves in vacuum, there is clearly nothing to distinguish between(i) and (ii). Here only the relative motion between the source and theobserver counts and the relativistic Doppler formula is the same for(i) and (ii). For light propagation in a medium, once again like forsound waves, the two situations are not identical and we shouldexpect the Doppler formulas for this case to be different for the twosituations (i) and (ii).
10.16 3.4 × 10⁻⁴ m.10.17 (a) The size reduces by half according to the relation: size ~ λ/d.
Intensity increases four fold.(b) The intensity of interference fringes in a double-slit arrangement
is modulated by the diffraction pattern of each slit.(c) Waves dif fracted from the edge of the circular obstacle interfere
constructively at the centre of the shadow producing a brightspot.
(d) For diffraction or bending of waves by obstacles/apertures by alarge angle, the size of the latter should be comparable towavelength. If the size of the obstacle/aperture is much too largecompared to wavelength, diffraction is by a small angle. Here
Physics
542
the size is of the order of a few metres. The wavelength of light isabout 5 × 10⁻⁷ m, while sound waves of, say, 1 kHz frequencyhave wavelength of about 0.3 m. Thus, sound waves can bendaround the partition while light waves cannot.
(e) Justification based on what is explained in (d). Typical sizes ofapertures involved in ordinary optical instruments are muchlarger than the wavelength of light.
10.18 12.5 cm.
10.19 0.2 nm.
10.20 (a) Interference of the direct signal received by the antenna withthe (weak) signal reflected by the passing aircraft.
(b) Superposition principle follows from the linear character of the(differential) equation governing wave motion. If y1 and y2 aresolutions of the wave equation, so is any linear combination ofy1 and y2. When the amplitudes are large (e.g., high intensity laserbeams) and non-linear effects are important, the situation is farmore complicated and need not concern us here.
10.21 Divide the single slit into n smaller slits of width a ′ = a/n . The angleθ = nλ/a = λ/a ′. Each of the smaller slits sends zero intensity in thedirection θ. The combination gives zero intensity as well.
CHAPTER 11
11.1 (a) 7.24 × 10¹⁸ Hz (b) 0.041 nm
11.2 (a) 0.34 eV = 0.54 × 10⁻¹⁹J (b) 0.34 V (c) 344 km/s11.3 1.5 eV = 2.4 × 10⁻¹⁹ J
11.4 (a) 3.14 × 10⁻¹⁹J, 1.05 × 10⁻²⁷ kg m/s (b) 3 × 10¹⁶ photons/s
(c) 0.63 m/s
11.5 4 × 10²¹ photons/m2 s
11.6 6.59 × 10⁻³⁴ J s11.7 (a) 3.38 × 10⁻¹⁹ J = 2.11 eV (b) 3.0 × 10²⁰ photons/s
11.8 2.0 V
11.9 No, because ν < νo
11.10 4.73 × 10¹⁴ Hz
11.11 2.16 eV = 3.46 × 10⁻¹⁹J
11.12 (a) 4.04 × 10⁻²⁴ kg m s–1 (b) 0.164 nm
11.13 (a) 5.92 × 10⁻²⁴ kg m s–1 (b) 6.50 × 10⁶ m s–1 (c) 0.112 nm
11.14 (a) 6.95 × 10⁻²⁵ J = 4.34 μeV (b) 3.78 × 10⁻²⁸ J = 0.236 neV
11.15 (a) 1.7 × 10⁻³⁵ m (b) 1.1 × 10⁻³² m (c) 3.0 × 10⁻²³ m
11.16 (a) 6.63 × 10⁻²⁵ kg m/s (for both) (b) 1.24 keV (c) 1.51 eV
11.17 (a) 6.686 × 10⁻²¹ J = 4.174 × 10⁻² eV (b) 0.145 nm
11.18 λ = h/p = h/(hν/c) = c/ν11.19 0.028 nm
11.20 (a) Use eV = (m v2/2) i.e., v = [(2eV/m)]1/2 ; v = 1.33 × 10⁷ m s–1.
(b) If we use the same formula with V = 107 V, we get v = 1.88 ×10⁹ m s–1. This is clearly wrong, since nothing can move with aspeed greater than the speed of light (c = 3 × 10⁸ m s–1). Actually,the above formula for kinetic energy (m v2/2) is valid only when
Answers
543
(v/c) << 1. At very high speeds when (v/c ) is comparable to(though always less than) 1, we come to the relativistic domainwhere the following formulae are valid:
Relativistic momentum p = m vTotal energy E = m c 2
Kinetic energy K = m c 2 – m0 c2,
where the relativistic mass m is given by 1/ 22
0 21v
m mc
−⎛ ⎞
= −⎜ ⎟⎝ ⎠
m0 is called the rest mass of the particle. These relations alsoimply:E = (p 2c 2 + m0
2 c4)1/2
Note that in the relativisitc domain when v/c is comparable to 1, Kor energy ≥ m 0c
2 (rest mass energy). The rest mass energy of electronis about 0.51 MeV. Thus a kinetic energy of 10 MeV, being muchgreater than electron’s rest mass energy, implies relativistic domain.Using relativistic formulas, v (for 10 MeV kinetic energy) = 0.999 c.
11.21 (a) 22.7 cm(b) No. As explained above, a 20 MeV electron moves at relativistic
speed. Consequently, the non-relativistic formula R = (m 0v/e B )is not valid. The relativistic formula is
= = / /R p eB mv eB or ( )= 2 20 m / 1 – /R v eB v c
11.22 We have e V = (m v2/2) and R = (m v/e B) which gives (e/m) =(2V/R 2 B 2 ); using the given data (e/m) = 1.73 × 10¹¹ C kg–1.
11.23 (a) 27.6 keV (b) of the order of 30 kV11.24 Use λ = (hc/E) with E = 5.1 × 1.602 × 10–10J to get λ = 2.43 × 10⁻¹⁶ m .
11.25 (a) For λ = 500 m, E = (h c/ λ) = 3.98 × 10⁻²⁸J. Number of photonsemitted per second= 104J s–1/3.98 × 10–28J ∼ 3 × 1031 s–1
We see that the energy of a radiophoton is exceedingly small,and the number of photons emitted per second in a radio beamis enormously large. There is, therefore, negligible error involvedin ignoring the existence of a minimum quantum of energy(photon) and treating the total energy of a radio wave ascontinuous.
(b) For ν = 6 × 10¹⁴ Hz, E ∼ 4 × 10–19J. Photon flux corresponding tominimum intensity
= 10–10 W m–2/4×10–19J = 2.5 × 10⁸ m–2 s–1
Number of photons entering the pupil per second = 2.5 × 108 ×0.4 × 10–4 s–1 = 104 s–1. Though this number is not as large as in(a) above, it is large enough for us never to ‘sense’ or ‘count’individual photons by our eye.
11.26 φ0 = h ν – e V0 = 6.7 × 10⁻¹⁹ J = 4.2 eV; ν0 = φ0
h = 1.0 × 10¹⁵ Hz; λ = 6328Å
corresponds to ν = 4.7 × 10¹⁴ Hz < ν0. The photo-cell will not respondhowsoever high be the intensity of laser light.
11.27 Use e V0 = h ν – φ0 for both sources. From the data on the first source,φ0 = 1.40 eV. Use this value to obtain for the second source V0 = 1.50 V.
Physics
544
11.28 Obtain V0 versus ν plot. The slope of the plot is (h/e) and its intercepton the ν-axis is ν0. The first four points lie nearly on a straight linewhich intercepts the ν-axis at ν0 = 5.0 × 10¹⁴ Hz (threshold frequency).The fifth point corresponds to ν < ν0; there is no photoelectricemission and therefore no stopping voltage is required to stop thecurrent. Slope of the plot is found to be 4.15 × 10⁻¹⁵ V s. Using e = 1.6 ×10⁻¹⁹ C, h = 6.64 × 10⁻³⁴ J s (standard value h = 6.626 × 10⁻³⁴ J s), φ0 =h ν0 = 2.11 V.
11.29 It is found that the given incident frequency ν is greater than ν0
(Na), and ν0 (K); but less than ν0 (Mo), and ν0 (Ni). Therefore, Mo andNi will not give photoelectric emission. If the laser is brought closer,intensity of radiation increases, but this does not affect the resultregarding Mo and Ni. However, photoelectric current from Na and Kwill increase in proportion to intensity.
11.30 Assume one conduction electron per atom. Effective atomic area~10–20 m2
Number of electrons in 5 layers
= 5 2 10
10
4 2
20 2
× × −
−
mm
= 1017
Incident power
= 10–5 W m–2 × 2 × 10–4 m2 = 2 × 10⁻⁹ W
In the wave picture, incident power is uniformly absorbed by all theelectrons continuously. Consequently, energy absorbed per secondper electron
=2 × 10⁻⁹/1017 = 2 × 10–26 WTime required for photoelectric emission
=2 × 1.6 × 10–19J/2 × 10–26 W = 1.6 × 10⁷ s
which is about 0.5 year.
Implication: Experimentally, photoelectric emission is observed nearlyinstantaneously (∼10–9 s): Thus, the wave picture is in grossdisagreement with experiment. In the photon-picture, energy of theradiation is not continuously shared by all the electrons in the toplayers. Rather, energy comes in discontinuous ‘quanta’. andabsorption of energy does not take place gradually. A photon is eithernot absorbed, or absorbed by an electron nearly instantly.
11.31 For λ = 1 Å, electron’s energy = 150 eV; photon’s energy = 12.4 keV.Thus, for the same wavelength, a photon has much greater energythan an electron.
11.32 (a)2
h h
p m Kλ = = Thus, for same K, λ decreases with m as
(1/ m ). Now (mn/me) = 1838.6; therefore for the same energy,
(150 eV) as in Ex. 11.31, wavelength of neutron = ( ).1/ 1838 6 ×
10–10 m = 2.33×10⁻¹² m. The interatomic spacing is about ahundred times greater. A neutron beam of 150 eV energy istherefore not suitable for diffraction experiments.
(b) λ = 1.45 × 10⁻¹⁰ m [Use λ = ( / 3 )h m k T ] which is comparable
to interatomic spacing in a crystal.
Answers
545
Clearly, from (a) and (b) above, thermal neutrons are a suitableprobe for diffraction experiments; so a high energy neutron beamshould be first thermalised before using it for diffraction.
11.33 λ = 5.5 × 10⁻¹² m
λ (yellow light) = 5.9 × 10⁻⁷mResolving Power (RP) is inversely proportional to wavelength. Thus,RP of an electron microscope is about 105 times that of an opticalmicroscope. In practice, differences in other (geometrical) factorscan change this comparison somewhat.
11.34–34
–15
6.63 10 Js
10 mh
pλ
×== = 6.63 × 10⁻¹⁹ kg m s–1
Use the relativistic formula for energy:
E 2 = c2p2 + m02 c4 = 9 × (6.63)2 × 10–22 + (0.511 × 1.6)2 × 10–26
∼ 9 × (6.63)2 × 10–22,
the second term (rest mass energy) being negligible.
Therefore, E = 1.989 × 10⁻¹⁰ J = 1.24 BeV. Thus, electron energiesfrom the accelerator must have been of the order of a few BeV.
11.35 Use 3
h
m k Tλ = ; mHe =
4 106 10
3
23
××
kg
This gives λ = 0.73 × 10⁻¹⁰ m. Mean separationr = (V/N)1/3 = (kT/p)1/3
For T = 300 K, p = 1.01 × 10⁵ Pa, r = 3.4 × 10⁻⁹ m. We find r >> λ .11.36 Using the same formula as in Exercise 11.35, λ = 6.2 × 10⁻⁹ m which
is much greater than the given inter-electron separation.
11.37 (a) Quarks are thought to be confined within a proton or neutronby forces which grow stronger if one tries to pull them apart. It,therefore, seems that though fractional charges may exist innature, observable charges are still integral multiples of e.
(b) Both the basic relations e V = (1/2) m v 2 or e E = m a ande B v =m v2/r, for electric and magnetic fields, respectively, showthat the dynamics of electrons is determined not by e, and mseparately but by the combination e/m .
(c) At low pressures, ions have a chance to reach their respectiveelectrodes and constitute a current. At ordinary pressures, ionshave no chance to do so because of collisions with gas moleculesand recombination.
(d) Work function merely indicates the minimum energy requiredfor the electron in the highest level of the conduction band toget out of the metal. Not all electrons in the metal belong to thislevel. They occupy a continuous band of levels. Consequently,for the same incident radiation, electrons knocked off fromdifferent levels come out with different energies.
(e) The absolute value of energy E (but not momentum p) of anyparticle is arbitrary to within an additive constant. Hence, whileλ is physically significant, absolute value of ν of a matter wave ofan electron has no direct physical meaning. The phase speed νλis likewise not physically significant. The group speed given by
d
d
dE
dp
ν( / )1 λ
= = d
dp
p
m
p
m
2
2
⎛
⎝⎜
⎞
⎠⎟ =
is physically meaningful.
Physics
546
CHAPTER 12
12.1 (a) No different from
(b) Thomson’s model; Rutherford’s model
(c) Rutherford’s model
(d) Thomson’s model; Rutherford’s model
(e) Both the models
12.2 The nucleus of a hydrogen atom is a proton. The mass of it is1.67 × 10–27 kg, whereas the mass of an incident α-particle is6.64 × 10–27 kg. Because the scattering particle is more massive thanthe target nuclei (proton), the α-particle won’t bounce back in evenin a head-on collision. It is similar to a football colliding with a tenisball at rest. Thus, there would be no large-angle scattering.
12.3 820 nm.
12.4 5.6 × 10¹⁴ Hz
12.5 13.6 eV; –27.2 eV
12.6 9.7 × 10– 8 m; 3.1 × 10¹⁵ Hz.
12.7 (a) 2.18 × 10⁶ m/s; 1.09 × 10⁶ m/s; 7.27 × 10⁵ m/s
(b) 1.52 × 10⁻¹⁶ s; 1.22 × 10⁻¹⁵ s; 4.11 × 10⁻¹⁵ s.
12.8 2.12×10⁻¹⁰ m; 4.77 × 10⁻¹⁰ m
12.9 Lyman series: 103 nm and 122 nm; Balmer series: 656 nm.
12.10 2.6 × 1074
12.11 (a) About the same.
(b) Much less.
(c) It suggests that the scattering is predominantly due to a singlecollision, because the chance of a single collision increaseslinearly with the number of target atoms, and hence linearlywith thickness.
(d) In Thomson’s model, a single collision causes very littledeflection. The observed average scattering angle can beexplained only by considering multiple scattering. So it is wrongto ignore multiple scattering in Thomson’s model. InRutherford’s model, most of the scattering comes through asingle collision and multiple scattering effects can be ignoredas a first approximation.
12.12 The first orbit Bohr’s model has a radius a0 given by
a0 = 4 20
2
2
π πε ( / )h
m ee
. If we consider the atom bound by the gravitational
force (Gmpme/r 2), we should replace (e2/4 π ε0) by Gmpm e. That is, the
radius of the first Bohr orbit is given by ah
Gm mG
p e0
2
2
2=
( / )π ≅ 1.2 × 1029 m.
This is much greater than the estimated size of the whole universe!
12.13 ν π π=
−−⎡
⎣⎢⎤
⎦⎥me
h n n
4
302 3 2 24 2
11
1( ) ( / ) ( )ε
=−
−me n
h n n
4
302 3 2 2
2 14 2 1
( )( ) ( / ) ( )π πε
For large n, νπ π
≅me
h n
4
302 3 332 2ε ( / )
Answers
547
Orbital frequency νc = (v/2 π r ). In Bohr model v = n h
m r
( / )2π, and
r =4 20
2
22π πε ( / )h
men . This gives νc =
n h
mr
( / )22 2
ππ
=me
h n
4
302 3 332 2π πε ( / )
which is same as ν for large n.
12.14 (a) The quantity e
mc
2
024πε
⎛
⎝⎜
⎞
⎠⎟ has the dimensions of length. Its value
is 2.82 ×10⁻¹⁵ m – much smaller than the typical atomic size.
(b) The quantity 4 202
2
π πε ( / )h
me has the dimensions of length. Its
value is 0.53 × 10⁻¹⁰ m – of the order of atomic sizes.(Note thatthe dimensional arguments cannot, of course, tell us that weshould use 4π and h/2π in place of h to arrive at the right size.)
12.15 In Bohr’s model, mvr = nh and mv
r
Ze
r
2 2
024
=πε
which give
T = 12 8
22
0
mvZe
r=
π ε; r =
4 02
22πε
Ze mn
These relations have nothing to do with the choice of the zero ofpotential energy. Now, choosing the zero of potential energy at infinitywe have V = – (Z e2/4 π ε0 r) which gives V = –2T and E = T + V = – T
(a) The quoted value of E = – 3.4 eV is based on the customarychoice of zero of potential energy at infinity. Using E = – T, thekinetic energy of the electron in this state is + 3.4 eV.
(b) Using V = – 2T, potential energy of the electron is = – 6.8 eV
(c) If the zero of potential energy is chosen differently, kinetic energydoes not change. Its value is + 3.4 eV independent of the choiceof the zero of potential energy. The potential energy, and thetotal energy of the state, however, would alter if a dif ferent zeroof the potential energy is chosen.
12.16 Angular momenta associated with planetary motion areincomparably large relative to h . For example, angular momentumof the earth in its orbital motion is of the order of 1070h . In terms ofthe Bohr’s quantisation postulate, this corresponds to a very largevalue of n (of the order of 1070). For such large values of n, thedifferences in the successive energies and angular momenta of thequantised levels of the Bohr model are so small compared to theenergies and angular momenta respectively for the levels that onecan, for all practical purposes, consider the levels continuous.
12.17 All that is needed is to replace me by mμ in the formulas of the Bohrmodel. We note that keeping other factors fixed, r ∝ (1/m) and E ∝ m.
Therefore,
rr m
me e
mm
= = ×0 53 10207
13.= 2.56 × 10⁻¹³ m
Eμ=E m
me
e
m = – (13.6 × 207) eV ≅ – 2.8 keV
Physics
548
CHAPTER 13
13.1 (a) 6.941 u (b) 19.9%, 80.1%
13.2 20.18 u
13.3 104.7 MeV
13.4 8.79 MeV, 7.84 MeV
13.5 1.584 × 1025 MeV or 2.535×10¹²J
13.6 i) 226 222 488 86 2Ra Rn+ He→ ii) 242 238 4
94 92 2Pu U+ He→
iii) 32 32 –15 16P S+e +ν→ iv) 210 210 –
83 84B Po+e +ν→
v) 11 11 +6 5C B +e +ν→ vi) 97 97 +
43 42Tc Mo+e +ν→
vii) 120 + 12054 53Xe+e I +ν→
13.7 (a) 5 T years (b) 6.65 T years
13.8 4224 years
13.9 7.126 ×10⁻⁶ g
13.10 7.877 ×10¹⁰ Bq or 2.13 Ci
13.11 1.23
13.12 (a) Q = 4.93 MeV, Eα = 4.85 MeV (b) Q = 6.41 MeV, Eα = 6.29 MeV
13.13 11 11 +6 6C B +e +ν→ + Q
( ) ( )11 11 26 6C – B –N N eQ m m m c⎡ ⎤= ⎣ ⎦ ,
where the masses used are those of nuclei and not of atoms. If weuse atomic masses, we have to add 6me in case of 11C and 5me incase of 11B. Hence
( ) ( )11 11 26 6C – B – 2 eQ m m m c⎡ ⎤= ⎣ ⎦ (Note me has been doubled)
Using given masses, Q = 0.961 MeV.
Q = Ed+ Ee+ Eν
The daughter nucleus is too heavy compared to e+ and ν, so it carriesnegligible energy (Ed ≈0). If the kinetic energy (Eν) carried by theneutrino is minimum (i.e., zero), the positron carries maximumenergy, and this is practically all energy Q; hence maximum E
e ≈ Q).
13.14 23 23 –10 11Ne Na +e + Qν→ + ; ( ) ( )23 23 2
10 11Q = Ne – Na –N N em m m c⎡ ⎤⎣ ⎦ , where the
masses used are masses of nuclei and not of atoms as in Exercise
13.13. Using atomic masses ( ) ( )23 23 210 11Ne – NaQ m m c⎡ ⎤= ⎣ ⎦ . Note m
e has
been cancelled. Using given masses, Q = 4.37 MeV. As in Exercise 13.13,maximum kinetic energy of the electron (max E
e) = Q = 4.37 MeV.
13.15 (i) Q = –4.03 MeV; endothermic
(ii) Q = 4.62 MeV; exothermic
13.16 Q = ( ) ( )56 2826 13Fe – 2 Alm m = 26.90 MeV; not possible.
13.17 4.536 × 1026 MeV
13.18 Energy generated per gram of 23592 U =
23 1316 10 200 1.6 10
Jg235
−−× × × ×
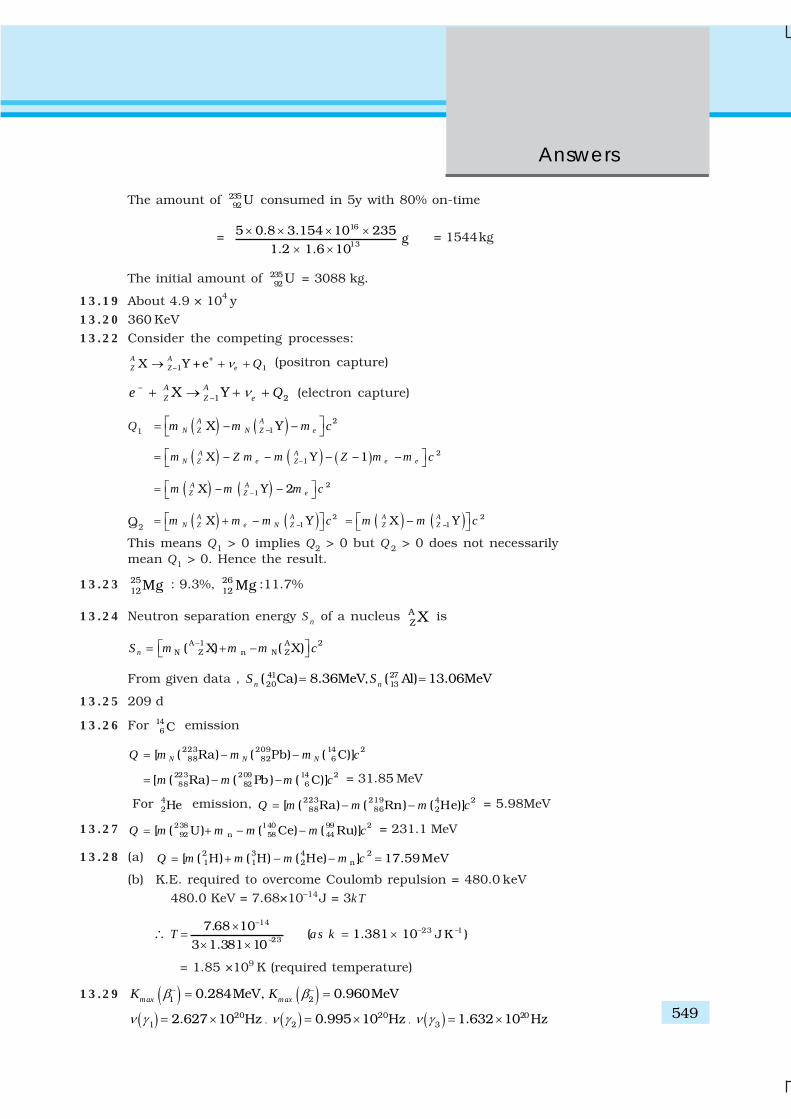
Answers
549
The amount of 23592 U consumed in 5y with 80% on-time
= 16
13
5 0.8 3.154 10 235g
1.2 1.6 10
× × × ×× ×
= 1544 kg
The initial amount of 23592 U = 3088 kg.
13.19 About 4.9 × 10⁴ y
13.20 360 KeV
13.22 Consider the competing processes:
+–1 1X Y +eA A
Z Z e Qν→ + + (positron capture)
––1 2X YA A
Z Z ee Qν+ → + + (electron capture)
Q1 ( ) ( ) 2–1X – Y –A A
N Z N Z em m m c⎡ ⎤= ⎣ ⎦
( ) ( ) ( ) 2–1X – – Y – – 1 –A A
N Z e Z e em Z m m Z m m c⎡ ⎤= ⎣ ⎦
( ) ( ) 2–1X – Y – 2A A
Z Z em m m c⎡ ⎤= ⎣ ⎦
Q2 ( ) ( ) 2–1X – YA A
N Z e N Zm m m c⎡ ⎤= +⎣ ⎦ ( ) ( ) 2–1X – YA A
Z Zm m c⎡ ⎤= ⎣ ⎦This means Q1 > 0 implies Q2 > 0 but Q2 > 0 does not necessarilymean Q1 > 0. Hence the result.
13.23 2512Mg : 9.3%, 26
12 Mg :11.7%
13.24 Neutron separation energy Sn of a nucleus AZ X is
A 1 A 2N Z n N Z( X) ( X)nS m m m c−⎡ ⎤= + −⎣ ⎦
From given data , 41 2720 13( Ca) 8.36MeV, ( Al) 13.06MeVn nS S= =
13.25 209 d
13.26 For 146 C emission
223 209 14 288 82 6[ ( Ra) ( Pb) ( C)]N N NQ m m m c= − −
223 209 14 288 82 6[ ( Ra) ( Pb ) ( C)]m m m c= − − = 31.85 MeV
For 42He emission, 223 219 4 2
88 86 2[ ( Ra) ( Rn) ( He)]Q m m m c= − − = 5.98MeV
13.27 238 140 99 292 n 58 44[ ( U) ( Ce) ( Ru)]Q m m m m c= + − − = 231.1 MeV
13.28 (a) 2 3 4 21 1 2 n[ ( H) ( H) ( He) ] 17.59MeVQ m m m m c= + − − =
(b) K.E. required to overcome Coulomb repulsion = 480.0 keV
480.0 KeV = 7.68×10⁻¹⁴ J = 3kT
–14–23 –1
–23 J K )7.68 10
( 1.381 103 1.381 10
T as k×
= = ×× ×
∴
= 1.85 ×10⁹ K (required temperature)
13.29 ( ) ( )– –1 20.284MeV, 0.960MeVmax maxK Kβ β= =
( ) 201 2.627 10 Hzν γ = × , ( ) 20
2 0.995 10 Hzν γ = × , ( ) 203 1.632 10 Hzν γ = ×
Physics
550
13.30 (a) Note that in the interior of Sun, four 11H nuclei combine to form
one 42He nucleus releasing about 26 MeV of energy per event.
Energy released in fusion of 1kg of hydrogen = 39 ×1026 MeV
(b) Energy released in fission of 1kg of 23592U = 5.1×1026 MeV
The energy released in fusion of 1 kg of hydrogen is about 8times that of the energy released in the fusion of 1 kg of uranium.
13.31 3.076 × 10⁴ kg
CHAPTER 14
14.1 (c)
14.2 (d)
14.3 (c)
14.4 (c)
14.5 (c)
14.6 (b), (c)
14.7 (c)
14.8 50 Hz for half-wave, 100 Hz for full-wave
14.9 vi = 0.01 V ; IB= 10 μA
14.10 2 V
14.11 No (hν has to be greater than Eg ).
14.12 ne ≈ 4.95 × 10²²; nh = 4.75 × 10⁹ ; n-type since ne >> nh
For charge neutrality ND – N
A = n
e – n
h ; n
e.n
h = ni
2
Solving these equations, ne = 12
42 2N N N N nD A D A i−( )+ −( ) +⎡
⎣⎢⎤⎦⎥
14.13 About 1 × 10⁵
14.14 (a) 0.0629 A, (b) 2.97 A, (c) 0.336 Ω(d) For both the voltages, the current I will be almost equal to I0,
showing almost infinite dynamic resistance in the reversebias.
14.16 NOT ; A Y
0 1
1 0
14.17 (a) AND (b) OR
14.18 OR gate
14.19 (a) NOT, (b) AND
CHAPTER 15
15.1 (b) 10 kHz cannot be radiated (antenna size), 1 GHz and 1000 GHzwill penetrate.
15.2 (d) Consult Table 15.2
15.3 (c) Decimal system implies continuous set of values
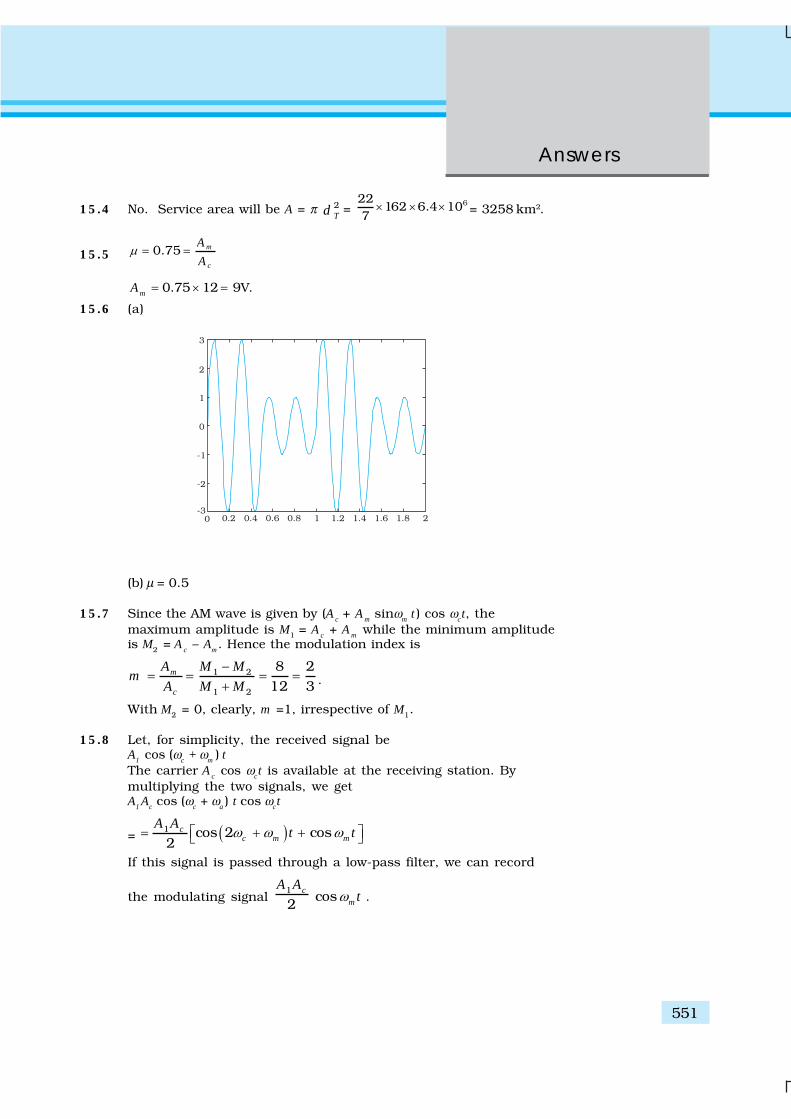
Answers
551
15.4 No. Service area will be A = π 2Td =
622162 6.4 10
7× × × = 3258 km2.
15.5 0.75 m
c
A
Aμ = =
0.75 12 9mA = × = V.
15.6 (a)
(b) μ = 0.5
15.7 Since the AM wave is given by (Ac + Am sinωm t) cos ωct, themaximum amplitude is M1 = Ac + Am while the minimum amplitudeis M2 = Ac – Am. Hence the modulation index is
1 2
1 2
– 8 212 3
m
c
A M Mm
A M M= = = =
+ .
With M2 = 0, clearly, m =1, irrespective of M1.
15.8 Let, for simplicity, the received signal beA1 cos (ωc + ωm ) tThe carrier Ac cos ωct is available at the receiving station. Bymultiplying the two signals, we getA1Ac cos (ωc + ωa) t cos ωct
= ( )1 cos 2 cos2
cc m m
A At tω ω ω⎡ ⎤= + +⎣ ⎦
If this signal is passed through a low-pass filter, we can record
the modulating signal 1
2cA A
cos mtω .
Physics
552
BIBLIOGRAPHY
TEXTBOOKS
For additional reading on the topics covered in this book, you may like to consult one or more of the followingbooks. Some of these books however are more advanced and contain many more topics than this book.
1 Ordinary Level Physics, A.F. Abbott, Arnold-Heinemann (1984).2 Advanced Level Physics , M. Nelkon and P. Parker, 6th Edition, Arnold-Heinemann (1987).
3 Advanced Physics , Tom Duncan, John Murray (2000).
4 Fundamentals of Physics, David Halliday, Robert Resnick and Jearl Walker, 7th EditionJohn Wily (2004).
5 University Physics (Sears and Zemansky’s), H.D. Young and R.A. Freedman, 11th Edition,Addison—Wesley (2004).
6 Problems in Elementary Physics, B. Bukhovtsa, V. Krivchenkov, G. Myakishev andV. Shalnov, MIR Publishers, (1971).
7 Lectures on Physics (3 volumes), R.P. Feynman, Addision – Wesley (1965).8 Berkeley Physics Course (5 volumes) McGraw Hill (1965).
a. Vol. 1 – Mechanics: (Kittel, Knight and Ruderman)
b. Vol. 2 – Electricity and Magnetism (E.M. Purcell)c. Vol. 3 – Waves and Oscillations (Frank S. Crawford)
d. Vol. 4 – Quantum Physics (Wichmann)
e. Vol. 5 – Statistical Physics (F. Reif )9 Fundamental University Physics, M. Alonso and E. J. Finn, Addison – Wesley (1967).
10 College Physics, R.L. Weber, K.V. Manning, M.W. White and G.A. Weygand, Tata McGrawHill (1977).
11 Physics: Foundations and Frontiers, G. Gamow and J.M. Cleveland, Tata McGraw Hill(1978).
12 Physics for the Inquiring Mind, E.M. Rogers, Princeton University Press (1960).13 PSSC Physics Course, DC Heath and Co. (1965) Indian Edition, NCERT (1967).14 Physics Advanced Level, Jim Breithampt, Stanley Thornes Publishers (2000).15 Physics, Patrick Fullick, Heinemann (2000).
16 Conceptual Physics, Paul G. Hewitt, Addision—Wesley (1998).17 College Physics, Raymond A. Serway and Jerry S. Faughn, Harcourt Brace and Co. (1999).18 University Physics, Harris Benson, John Wiley (1996).
19 University Physics, William P. Crummet and Arthur B. Western, Wm.C. Brown (1994).20 General Physics, Morton M. Sternheim and Joseph W. Kane, John Wiley (1988).21 Physics, Hans C. Ohanian, W.W. Norton (1989).

Answers
553
22 Advanced Physics, Keith Gibbs, Cambridge University Press (1996).23 Understanding Basic Mechanics, F. Reif, John Wiley (1995).24 College Physics, Jerry D. Wilson and Anthony J. Buffa, Prentice Hall (1997).25 Senior Physics, Part – I, I.K. Kikoin and A.K. Kikoin, MIR Publishers (1987).26 Senior Physics, Part – II, B. Bekhovtsev, MIR Publishers (1988).27 Understanding Physics, K. Cummings, Patrick J. Cooney, Priscilla W. Laws and Edward F.
Redish, John Wiley (2005).28 Essentials of Physics, John D. Cutnell and Kenneth W. Johnson, John Wiley (2005).
GENERAL BOOKS
For instructive and entertaining general reading on science, you may like to read some of the following books.Remember however, that many of these books are written at a level far beyond the level of the present book.
1 Mr. Tompkins in paperback, G. Gamow, Cambridge University Press (1967).2 The Universe and Dr. Einstein, C. Barnett, Time Inc. New York (1962).3 Thirty years that Shook Physics, G. Gamow, Double Day, New York (1966).4 Surely You’re Joking, Mr. Feynman, R.P. Feynman, Bantam books (1986).5 One, Two, Three… Infinity, G. Gamow, Viking Inc. (1961).6 The Meaning of Relativity, A. Einstein, (Indian Edition) Oxford and IBH Pub. Co. (1965).7 Atomic Theory and the Description of Nature, Niels Bohr, Cambridge (1934).8 The Physical Principles of Quantum Theory, W. Heisenberg, University of Chicago Press
(1930).9 The Physics—Astronomy Frontier, F. Hoyle and J.V. Narlikar, W.H. Freeman (1980).10 The Flying Circus of Physics with Answer, J. Walker, John Wiley and Sons (1977).11 Physics for Everyone (series), L.D. Landau and A.I. Kitaigorodski, MIR Publisher (1978).
Book 1: Physical BodiesBook 2: MoleculesBook 3: ElectronsBook 4: Photons and Nuclei.
12 Physics can be Fun, Y. Perelman, MIR Publishers (1986).13 Power of Ten, Philip Morrison and Eames, W.H. Freeman (1985).14 Physics in your Kitchen Lab., I.K. Kikoin, MIR Publishers (1985).15 How Things Work: The Physics of Everyday Life, Louis A. Bloomfield, John Wiley (2005).16 Physics Matters: An Introduction to Conceptual Physics, James Trefil and Robert M.
Hazen, John Wiley (2004).
Bibliography

Absorption spectra 421AC current 233AC Generator 224AC voltage 233
applied to a capacitor 241applied to a resistor 234applied to an inductor 237applied to a series LCR circuit 244
Accelerators in India 142Accommodation of eye 336Activity of radioactive substances 447Additivity of charges 8Alpha decay 449Alpha particle scattering 415Ammeter 165Ampere 155Amperes circuital law 147Amplification 517Amplitude modulation 524Analog signal 502AND gate 503Andre, Ampere 148Angle
of deviation 330of incidence 355of reflection 355of refraction 355
Angular magnification 341Apparent depth 318Area element vector 26Astigmatism 337Atomic
mass unit 439number 440spectra 420
Attenuation 516Aurora Boriolis 139Band gap 470Bandwidth of signal 517
Bandwidth of transmission medium 518Bar magnet 174
as solenoid 176Barrier potential 479Base 491Becquerel 448Beta decay 450Binding energy per nucleon 444Biot-Savart law 143Bohr magneton 163Bohr radius 425Bohr’s model of atom 422Bohr’s postulates 424Brewster’s angle 380Brewster’s law 381C.A. Volta 53Capacitance 73Capacitive reactance 241Capacitive circuit 252Capacitor
parallel plate 74in parallel 79in series 78
Cartesian sign convention 311Cassegrain telescope 342Cells 110
in parallel 114in series 113
Chain reaction 452Channel 515Charging by induction 6Charles August de Coulomb 11Chromatic aberration 333Ciliary muscles 337Coercivity 195Coherent source 360Collector 491Colour code of resistors 103Combination of lenses 328
Physics
INDEX
554

Combination of resistorsseries 107parallel 108
Composition of nucleus 438Concave mirror 312Conduction band 469Conductivity 97, 468Conductors 5Conservation of charge 8Conservative force 51Continuous charge distribution 32Control rods 454Convex mirror 312Coulomb 11Coulomb’s law 10Critical angle 320Curie temperature 194Curie 448Current 94
amplification factor 495density 97loop as a magnetic dipole 160sensitivity of galvanometer 165
Cut-off voltage/Stopping potential 391Cyclotron 140
frequency 141Davisson & Germer Experiment 403de Broglie
relation 398wavelength 398explanation 430
Decay constant 446Detection of amplitude modulated wave 526Diamagnetism 192Dielectrics 71Dielectric
constant 76strength 74
Diffraction 367single slit 368
Digitalelectronics 501signal 502
Dioptre 328Dipole
moment 28moment vector 28in uniform electric field 31physical significance 29
Dispersion by a prism 332Displacement current 270Doppler effect 358Drift velocity 98Earth’s magnetism 185Earthing 6
Eddy currents 218Einstein’s photoelectric equation 394Electric
charge 1current 93dipole 27displacement 77field 18field, physical significance 20field due to a system of charges 19field lines 23flux 25susceptibility 72
Electrical energy 105Electromagnetic
waves, sources 274waves, nature 275damping 218spectrum 280
Electron emission 387Electrostatic
analog 180potential 53shielding 69
Electrostatics 1of conductors 67
Electromotive force (emf ) 110Emission spectra 421Emitter 491Energy
bands 469generation in stars 455levels 427stored in a capacitor 80
Equipotential surfaces 60Excited state 427Experiments of Faraday & Henry 205Extrinsic semiconductor 474Eye 336Farad 75Faraday’s law of Induction 207Fast breeder reactor 453Ferromagnetism 193Field
due to infinite plane sheet 38due to uniformly charged thin sphericalshell 39
Field emission 388Flemings left hand ruleFlux leakage 261Focal length 311Force between two parallel currents 154Forward bias 479Franck-Hertz experiment 428
Index
555
Fringe width 364Full-wave rectifier 483G.S. Ohm 96Gamma
rays 283decay 451
Gauss’s law 33its applications 37in magnetism 181
Gaussian surface 35Geographic meridian 186Gold leaf electroscope 4Ground
state 427wave 519
H.A. Lorentz 134Half life 448Half-wave rectifier 483Hallwachs’ and Lenard’s observations 388Henry 220Hertz Experiment 274Holes 472Horizontal component of earth’smagnetic field 187Huygen’s Principle 353Hypermetropia 337Impact parameter 418Impedence diagram 246Inductance 219
mutual 220self 222
Induction 6of charge 6
Inductivecircuit 252reactance 238
Input resistance of a transistor 494Insulators 5Integrated circuits (IC) 505Interference
constructive 361destructive 361fringes 363
Internal resistance 110Intrinsic semiconductor 472Ionisation energy 427Iris 337Isobars 441Isotones 441Isotopes 439J.C. Maxwell 270Junction transistor 490K.F. Gauss 182Kirchhoff’s rules 115
Lateral shift 317Law
of radioactive decay 447of reflection 357of refraction 356
LC oscillations 255Least distance of distinct vision 336Lenz’s law 210Lens maker’s formula 326Light emitting diode 488Limitations of Ohm’s law 101Linear
charge density 32magnification/Magnifying power 339
Logic gates 502Lorentz force 134Magnetic
declination 186dipole 177dipole moment of a revolving electron 162field 132field lines 175field on the axis of a circular current loop 145flux 182, 206force on a current carrying conductor 135force 133hysteresis 195inclination 187intensity 190meridian 186moment of a current loop 158moment 178permeability 190potential energy 178susceptibility 190torque 178
Magnetisation 189Majority carriers 476Mass
defect 443number 440energy relation 442
Maxwell’s equations 273Mean life 448Meter bridge 120Michael Faraday 208Microscope 339
compound 340Microwaves 281Minority carriers 476Mirage 321Mirror equation 314Mobility 100Moderator 454
Physics
556

Modulation 517, 522index 525
Motion in a magnetic field 137Motional emf 212Moving coil galvanometer 163Multiplication factor (fission) 454Myopia 336NAND gate 504Near point 336Neutrons 440Noise 516Non-polar molecules 72NOR gate 505North pole 174NOT gate 502n-p-n transistor 491n-type semi conductor 475Nuclear
binding energy 442density 442energy 451fission 452force 445fusion 455holocaust 457reactor 452size 441winter 457
Numerical aperture 375Ohm 95Ohm’s law 95Optical fibers 322OR gate 502Orbital magnetic moment 163Output resistance of a transistor 495Paramagnetism 192Permanent magnets 195Permeability of free space 143Permittivity
of free space 11, 76of medium 76
Phasors 237diagram 237
Photodiode 487Photoelectric effect 388Photocell 399Photoelectric emission 388Photoelectrons 389Photon 395Pith ball 2Plane polarised wave 377p-n Junction 478p-n-p transistor 491Point charge 10Polar molecules 72
Polarisation 71, 376by reflection 380by scattering 379
Polarity of charge 2Polaroid 378Potential 53
due to an electric dipole 55due to a point charge 54due to a system of charges 57energy difference 53energy for a system of charges 61energy of a dipole 66energy of a single charge 64energy of a system of two charges 65energy 52
Potentiometer 122Power (electrical) 106
factor 252in ac circuit 252of lens 327
Pressurised heavy water reactors 453Primary coilPrincipal focus 311Principle of superposition 15Principle quantum number 425Prism formula 331Production of amplitude modulated wave 525Properties of electric charge 8p-type semi conductor 476Q factor/quality factor 250Quanta of energy 393Quantisation of charge 8Radio waves 281Radioactivity 446Rainbow 333Ray optics, validity of 375Rayleigh scattering 335Rectifier 483Red shift 358Reflection of light 310Refraction 318
of a plane wave 355Refractive index 317, 356Relation between field and potential 61Relaxation time 98Rententivity 195Repeater 517Resistance 95Resistivity 96, 468
of some materials 102Resolving power 373
of eye 374Resonance 248
Sharpness 249Resonant frequency 248Reverse bias 480
Index
557

Physics
558
Right hand rule 149Root mean square (rms) or effective
current 235voltage 235
Roget’s spiral 156Rutherford’s model of atom 415Saturation current 390Scattering of light 335Secondary wavelet 354Semiconductors 469
diode 479elemental 468compound 468
Shunt resistance 164Signal 516Sky wave 520Snell’s law 317, 356Solar cell 489Solenoid 151South pole 174Space wave 521Spectral series 421
Brackett 422Fund 422Lyman 422Paschen 422
Spectrum of light 332Spherical mirror 310, 311Spin magnetic moment 163Surface charge density 32Telescope 341Temperature dependence of
resistivity 103Tesla 135Thermionic emission 388Thermonuclear fusion 456Thin lens formula 326Threshold frequency 392
Tokamak 153Toroid 152Torque
on a current loop 157on a dipole 31
Total internal reflection 319Transducer 516Transformer 259
Step-down 261Step-up 261
Transistoras a switch 496as an amplifier 497oscillator 500common emitter configuration 493
Truth table 502Uncertainty Principle 400Unpolarised wave 377Ultraviolet rays 282Valence band 469Van de Graaff Generator 83Velocity selector 140Visible rays 282Voltage Regulator 486Voltage sensitivity of a galvanometer 165Voltmeter 165Volume charge density 32Wattless current 252Wavefront 353
plane 354spherical 354
Wheatstone bridge 118Work function 394X rays 283Young’s experiment 362Zener
diode 485breakdown 485
558
Copyright © 2022 FDOKUMEN