
Theoretical investigation of CO adsorption on Pd(111) and Pd(111) --- Zn systems
Upload
independentCategory
view
3download
0
Journal of Molecular Catalysis A: Chemical 228 (2005) 11–19
Physical and chemical properties of Ce1−xZrxO2 nanoparticles andCe1−xZrxO2(1 1 1) surfaces: synchrotron-based studies
J.A. Rodrigueza,∗, X. Wanga, G. Liua, J.C. Hansona, J. Hrbeka, C.H.F. Pedenb,A. Iglesias-Juezc, M. Fernandez-Garcıac
a Department of Chemistry, Brookhaven National Laboratory, Upton, NY 11973, USAb Environmental Molecular Sciences Laboratory, Pacific Northwest National Laboratory, Richland, WA 99352, USA
c Instituto de Cat´alisis y Petroleoqu´ımica, CSIC, Campus Cantoblanco, 28049 Madrid, Spain
Available online 19 November 2004
Abstract
In this article, we review a series of studies that use synchrotron-based techniques (high-resolution photoemission, time-resolved X-ray diffraction (XRD), and X-ray absorption near-edge spectroscopy) to investigate the physical and chemical properties of Ce1−xZrxO2
n usinga dC reasing Zrc s thatl rert rationo uence ofa SOt no sp©
K
1
teeo[mdp
oringun-
eenede de-
ole inre-ond
ed-the
e-nia
1d
anoparticles and Ce1−xZrxO2(1 1 1) surfaces (x≤ 0.5). CeO2 and Ce1−xZrxO2 particles in sizes between 4 and 7 nm were synthesizednovel microemulsion method. The results of XANES (O K-edge, Ce and Zr LIII -edges) indicate that the Ce1−xZrxO2 nanoparticles ane1−xZrxO2(1 1 1) surfaces have very similar electronic properties. For these systems, the lattice constant decreased with incontent, varying from 5.4A in CeO2 to 5.3A in Ce0.5Zr0.5O2. Within the fluorite structure, the Zr atoms exhibited structural perturbation
ed to different types of Zr–O distances and non-equivalent O atoms in the Ce1−xZrxO2 compounds. The Ce1−xZrxO2 nanoparticles were moeactive towards H2 and SO2 than the Ce1−xZrxO2(1 1 1) surfaces. The Ce1−xZrxO2(1 1 1) surfaces did not reduce in hydrogen at 300◦C. Atemperatures above 250◦C, the Ce1−xZrxO2 nanoparticles reacted with H2 and water evolved into gas phase. XANES showed the genef Ce3+ cations without reduction of Zr4+. There was an expansion in the unit cell of the reduced nanoparticles probably as a conseqpartial Ce4+ → Ce3+ transformation and the sorption of hydrogen into the bulk of the material. S K-edge XANES spectra pointed to4 as
he main product of the adsorption of SO2 on the Ce1−xZrxO2 nanoparticles and Ce1−xZrxO2(1 1 1) surfaces. Full dissociation of SO2 was seen the nanoparticles but not on the Ce1−xZrxO2(1 1 1) surfaces. The metal cations at corner and edge sites of the Ce1−xZrxO2 nanoparticlerobably play a very important role in interactions with the H2 and SO2 molecules.2004 Elsevier B.V. All rights reserved.
eywords:High-resolution photoemission; Time-resolved X-ray diffraction; Nanoparticles
. Introduction
Ceria (CeO2) is an oxide with important applications inhe control of environmental pollution[1,2]. One of the majorfforts of environmental cleanup is focused on controlling themission of toxic pollutants produced during the combustionf fuels in factories, power plants and automotive engines
1–3]. The so-called three-way catalysts (TWC’s) are com-only used to reduce the emissions of CO, NOx and hy-rocarbons from automobile exhaust[3,4]. Due to its redoxroperties, CeO2 is a key component in these catalysts[2,3,5].
∗ Corresponding author. Tel.: +1 516 2822246; fax: +1 516 2825815.E-mail address:[email protected] (J.A. Rodriguez).
Ceria-supported noble-metal catalysts are capable of stoxygen under oxidizing conditions and release oxygender reducing conditions via the facile conversion betwCe4+ and Ce3+ oxidation states[5]. Furthermore, ceria-basmaterials are also utilized in sorbents or catalysts for thstruction of SO2 (DeSOx operations)[6,7]. Oxygen anionvacancies in ceria are considered to play an essential rcatalytic reactions[5–11]. The energetics of O vacancy cation/filling can be altered after doping ceria with a secmetal[11–13].
The CeO2–ZrO2 system is one of the most studied mixmetal oxides in the literature due to its important role inoperation of automotive catalysts[1–5]. To enhance the rdox properties and thermal stability of pure ceria, zirco
381-1169/$ – see front matter © 2004 Elsevier B.V. All rights reserved.oi:10.1016/j.molcata.2004.09.069

12 J.A. Rodriguez et al. / Journal of Molecular Catalysis A: Chemical 228 (2005) 11–19
(ZrO2) is often mixed as an additive to form solid solutionsof the Ce1−xZrxO2 type (x≤ 0.5)[5,12]. Typically, cations arerandomly distributed in a fluorite-type subcell, whereas thetotal symmetry is governed by the anion subcell[5,12]. Forthese materials, tetragonal and cubic structures are possible[5,12,14]. The focus has been on examining possible correla-tions between the CeO2 ↔ ZrO2 interactions and differencesin the behavior of Ce1−xZrxO2 and CeO2. The mechanismsfor the doping effects of Zr remain uncertain and are still amatter of debate. It has been suggested that ceria structuralmodifications mediated by zirconia and zirconia-stabilizeddefects in ceria are responsible for the enhanced oxygen-storage capacity of ceria–zirconia mixed oxides[12,15,16].Contributions from “electronic effects” (i.e. modificationsin the chemical properties of the metal cations as a con-sequence of electronic perturbations) have been frequentlydismissed, although it is clear that they cannot be ruled out[8,13].
Nano structures of oxides can have special chemicalproperties due to size-induced structural distortions and thepresence of O vacancies[18]. This is an issue that needsfurther investigation. Recent studies have shown thatnanoparticles of Ce1−xZrxO2 can be prepared by a novelmicroemulsion method that leads to highly homogeneousmaterials in terms of chemical composition (i.e. Ce, Zrd zes[ efulfaa tron-bt -s es -t ofH s oft ica-t nt ine ta toc d,c[
2
O rtedi d[ itialC tingm nfi edZ ular-b
The time-resolved X-ray diffraction results shown inSection3 were collected on beam line X7B of the NationalSynchrotron Light Source (NSLS) at Brookhaven NationalLaboratory (BNL)[17,25]. Investigations at BNL have estab-lished the feasibility of conducting subminute, time-resolvedXRD experiments when combining the high intensity of syn-chrotron radiation and new parallel data-collection devices[25]. A MAR345 detector was used to record the in situ XRDdata. The typical time required for collecting an individualdiffraction pattern was in the range of 0.5–2 min. The powderrings were integrated using the FIT2D code[26]. Rietveld re-finements were performed with the program GSAS[27,28].In this work, a whole profile refinement with the commercialReflex package provided by Accelrys was employed toobtain the particle sizes, cell dimension, and lattice strain[18,31]. Here lattice strain was determined from the variationof peak width, and is an estimation of the stress, produced byimperfections and defects, in the crystal structure[29–31].
The photoemission studies described in Section3 wereperformed in a ultrahigh-vacuum (UHV) chamber that formspart of the U7A beamline in the NSLS[8,21]. The UHVchamber (with a base pressure of∼ 5× 10⁻¹⁰ Torr) is fittedwith a hemispherical electron energy analyzer with multi-channel detection, optics for low-energy electron diffraction(LEED), a residual gas analyzer (SRS-RGA), and a twin (MgK lu-t
c-t nb g ab ecialr ctor[ ges ricalg en int lierl na eV.
3
3
s hint ns int nt phase,a red ase turalc ion,l ac-t ec-tt
istribution), having a narrow distribution of particle si19,20]. The catalysts prepared in this way are very usor studying the thermal stability of the Ce1−xZrxO2 systemnd aging treatments at high temperature[4,19,20]. In thisrticle, we review a series of studies that use synchroased techniques (high-resolution photoemission[8,21],
ime-resolved X-ray diffraction (XRD)[17] and X-ray aborption near-edge spectroscopy[8,17]) to investigate thtructural and electronic properties of Ce1−xZrxO2 nanoparicles and Ce1−xZrxO2(1 1 1) surfaces. The chemisorption
2 and SO2 are used to examine the chemical propertiehe Ce1−xZrxO2 systems. The study has practical applions as hydrogen is one of the reducing agents presexhaust gases of automotive engines[1–3]. It is known thadsorption of SO2 affects the performance of TWC’s usedontrol emissions of CO and NOx [22] and, on the other haneria-based catalysts are highly active for DeSOx operations6,7].
. Experimental methods
To prepare the Ce1−xZrx O2 nanoparticles and Ce1−xZrx2(1 1 1) surfaces, we followed methods previously repo
n the literature[19,20,23,24]. A microemulsion metho19,20] was used to synthesize nanoparticles with ine:Zr atomic ratios of 9:1, 2:1 and 1:1 in the reacixtures[17]. Ce1−xZrxO2(1 1 1) (x= 0.1, 0.2 or 0.3) thi
lms (500–700A in thickness) were grown on a Y-stabilizrO2(1 1 1) surface by oxygen-plasma assisted moleceam epitaxy[23,24].
� and Al K�) X-ray source. The combined energy resoion in the photoemission spectra was 0.3–0.4 eV[8,21].
The Ce and Zr LIII -edge and S K-edge XANES spera presented in Section3 were collected at the NSLS oeam line X19A in the “fluorescence-yield mode” usinoomerang-type flat crystal monochromator and a speaction cell with a modified Stern–Heald–Lytle dete7,8,17]. Beamline U7A was utilized to record the O K-edpectra. This beamline is equipped with a toroidal-spherating monochromator. The O K-edge spectra were tak
he “electron-yield mode” by using a channeltron multipocated near the sample surface[8,17]. The energy resolutiot the LIII (Ce or Zr) and K (S or O) edges was close to 0.5
. Results
.1. Structural properties of the Ce1−xZrxO2 systems
Fig. 1 shows the structure of an ideal Ce1−xZrxO2(1 1 1)urface (x< 0.4). The top layer consists of O atoms, but withis layer there are holes that expose the Ce or Zr catiohe second layer. The Ce1−xZrxO2(1 1 1) thin films used ihe present study possess a pure and single-crystallinend these surfaces are oxygen-terminated and well ordevidenced by the results of several techniques for strucharacterization (reflection high-energy electron diffractow-energy electron diffraction, X-ray photoelectron diffrion, X-ray diffraction, and Rutherford backscattering sproscopy and channeling)[8,23,24]. In the Ce1−xZrxO2(1 1 1)hin films and the Ce1−xZrxO2 nanoparticles, the Ce↔ Zr ex-

J.A. Rodriguez et al. / Journal of Molecular Catalysis A: Chemical 228 (2005) 11–19 13
Fig. 1. Top and side views of an oxygen-terminated Ce1−xZrxO2(1 1 1) sur-face (x< 0.4). The large spheres represent O atoms, and the small spherescorrespond to Ce or Zr atoms in a solid solution.
change led to a decrease in the lattice constant of the oxide[8,17,23], in agreement with reported XRD results for bulkpowders of these compounds[32].
Fig. 2 shows time-resolved XRD results obtained afterheating a sample of Ce0.9Zr0.1O2 nanoparticles from 25 to1000◦C [17]. When the temperature is raised, the diffractionlines clearly gain intensity and become better defined. Nophase transformation is visible. These changes are a consequence of an increase in the size of the particles (sintering)at temperatures above 500◦C. This process was irreversible.Similar results were found for Ce0.66Zr0.33O2 nanoparticles.
F -c
From the width of the diffraction lines, one can get areasonable estimate of the average size of the CeO2 andCe1−xZrxO2 nanoparticles[29–31]. The top panel inFig. 3displays changes in size as a function of Zr concentration andtemperature. Data for a limited number of temperatures havebeen published in ref.[17], but the corresponding new set inFig. 3is more extensive and the analysis of the XRD patternswas performed utilizing a more sophisticated approach (seeSection2) [31]. Initially, the particles have a size in the rangeof 5–7 nm. The size of the pure CeO2 nanoparticles (∼ 7 nm)is comparable to that obtained recently using a different syn-thetic method[14]. A similar size can be determined fromimages of transmission electron microscopy (TEM), whichalso show that there is no preferential orientation for the sur-face of the nanoparticles[18–20]. Around 600◦C, the size ofthe CeO2 particles starts to increase and by 1000◦C is close to25 nm. For the Ce1−xZrxO2 systems the sintering also startsnear 600◦C, but the magnitude of the size increase seems todiminish when the content of Zr is raised[17]. The “extra”thermal stability could be a consequence of more dense pack-ing of the atoms in the unit cell of the compound[17,31]. Thetrends in the top panel ofFig. 3are important and consistentwith the fact that the addition of zirconia to ceria enhancesthe thermal stability of automotive catalysts[2,4,15,32].
The strain in the Ce1−xZrxOy, nanoparticles as a functiono anel
Fig. 3. Effects of heating on the size (top panel) and strain parameter of aseries of Ce1−xZrxO2 (x= 0, 0.1, 0.33) nanoparticles.
ig. 2. Time-resolved XRD data for the heating of Ce0.9Zr0.1O2 nanopartiles in air. Heating rate = 4.8◦C/min.λ = 0.8941A.
-
f Zr content and temperature is shown in the bottom p

14 J.A. Rodriguez et al. / Journal of Molecular Catalysis A: Chemical 228 (2005) 11–19
of Fig. 3. Under ideal circumstances, the Bragg peaks in apowder diffractogram should appear as narrow well-definedsymmetrical peaks. There are a number of sources of dis-tortion that can result in significant peak broadening andasymmetry. The three main contributions to the line shape in-clude instrumental broadening, crystalline size broadening,and strain broadening. Strain is a measurement of the lat-tice stress existing in the materials because of surface effects(differences in local symmetry and distances with respect tothe bulk) and/or the crystal imperfections (O vacancies, otherpoint defects, line defects and plane defects)[33]. Pure ceriananoparticles exhibit a larger lattice strain when comparedto bulk CeO2. Clearly, the introduction of an alien specieslike Zr leads to extra forces that increase the strain in thelattice of the nanoparticles. There are important defect con-tributions to the strain that can be eliminated by annealing athigh temperature and inducing sintering of the nanoparticles[34].
3.2. Electronic properties of the Ce1−xZrxO2 systems
The results of XANES (O K-edge, Ce and Zr LIII -edges) indicate that the Ce1−xZrxO2 nanoparticles andCe1−xZrxO2(1 1 1) surfaces have very similar electronicproperties[8,17]. The spectra for the Ce LIII -edge of theC e re-p dnc ichs e. noO ataf
C r theC werevpm sta-b ei aino theo icha ,t nglyot ubice akio inC -ce n pureZ
ofC raf e
Fig. 4. Zr LIII -edge XANES spectra for bulk ZrO2 and Ce1−xZrxO2 nanopar-ticles.
and 5d–t2g in pure CeO2 are related to electronic transitionsfrom the O 1s core levels to the empty cerium 4f, 5deg, and5dt2glevels, respectively[7,8]. The O K-edge spectrum ofZrO2 comes mainly from O 1 s→ Zr(4d) electronic transi-tions[18], and the two main peaks reflect the splitting of theZr 4d orbitals into levels with eg and t2gsymmetry[36]. The OK-edge spectra of the Ce1−xZrxO2 nanoparticles significantlychange as a function of Zr doping. They exhibit features thatmatch very well those found for Ce1−xZrxO2(1 1 1) surfaces[8]. The O K-edge spectra of Ce1−xZrxO2 compounds havea distinctive line shape that cannot be attributed to a sum ofCeO2 and ZrO2 peaks. This is consistent with the results ofDF calculations[8,17], which show CeO and Zr O bonddistances in Ce1−xZrxO2 not seen in the isolated oxides (i.e.some O atoms are in a special chemical environment).
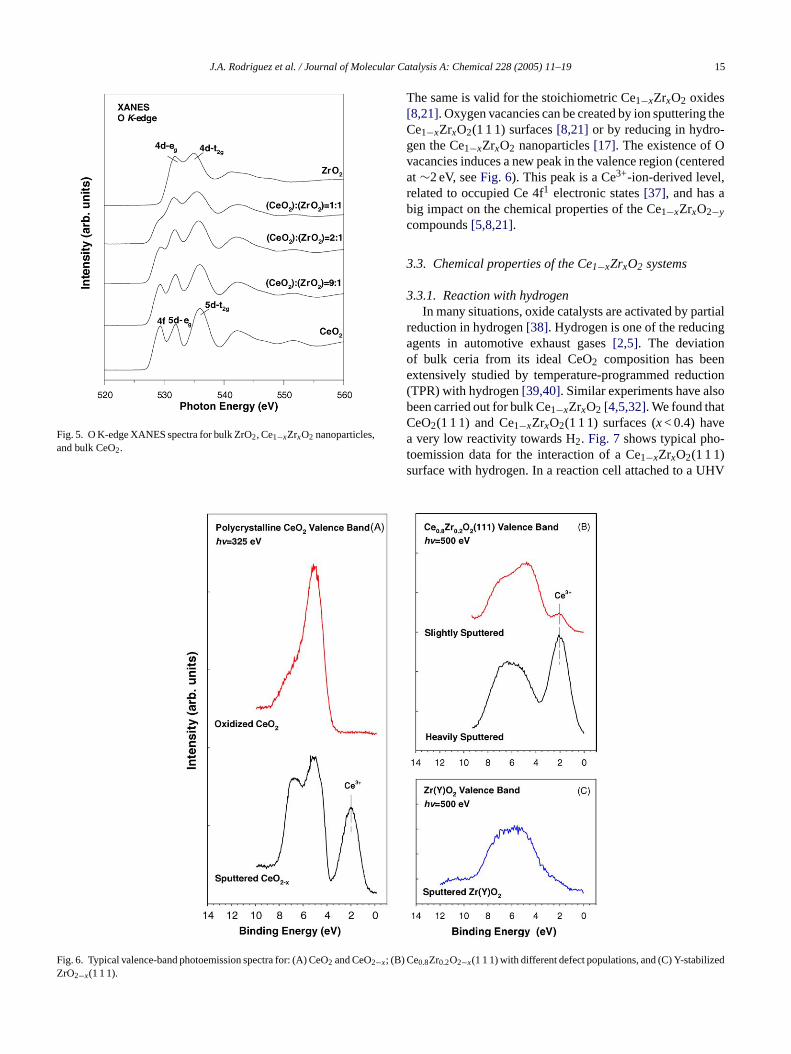
Fig. 6 displays a series of valence band spectra forpolycrystalline CeO2, Ce0.8Zr0.2O2(1 1 1) and Y-stabilizedZrO2(1 1 1)[8]. Fig. 6A shows the typical valence spectrumof pure ceria[37]. For the fully oxidized CeO2, no photoe-mission peaks exist between 0 and 4 eV within the band gap.
e1−xZrxO2 systems showed energies and the line shaported for bulk CeO2 [8,17]. Thus, the doping with Zr diot induce formation of a significant amount of Ce3+. This isonsistent with results of XRD for the nanoparticles, whhow that the oxygen occupancy is essentially 100% (i.vacancies)[17,31], and with XPS and photoemission d
or the Ce1−xZrxO2(1 1 1) surfaces[8].Fig. 4 displays Zr LIII -edge spectra for bulk ZrO2 and
e1−xZrxO2 nanoparticles. The corresponding spectra foe1−xZrxO2(1 1 1) surfaces are not shown, because theyery similar to those of the nanoparticles[8,17]. At the tem-erature in which the spectra were acquired (∼ 25◦C), aonoclinic crystal structure is the thermodynamicallyle phase for ZrO2 [8,35]. The Zr LIII -edge of this oxid
s characterized by four distinctive features. The two mnes (a and b) correspond to electronic transitions fromccupied Zr 2p orbitals to the empty Zr 4d orbitals whre split into orbitals with t and e symmetry[36]. In oxides
he relative intensity of the a and b peaks depends stron the chemical environment around the Zr cations[36]. In
he Ce1−xZrxO2 systems, the Zr atoms are in a pseudo-cnvironment[8,17] and the relative intensity of the b pe
s stronger than observed for monoclinic ZrO2 or for tetrag-nal Zr-doped Y2O3 [36]. The a and b peak separatione0.9Zr0.1O2 is ∼ 0.25 eV larger than in ZrO2. As the conentration of zirconium in Ce1−xZrxO2 increases, the Zr LIII -dge line shape changes and becomes closer to that irO2 (bottom ofFig. 4).
Fig. 5 shows O K-edge XANES spectra for a seriese1−xZrxO2 nanoparticles[17], including reference spect
or bulk ZrO2 and CeO2. The features labeled 4f, 5d–g,
J.A. Rodriguez et al. / Journal of Molecular Catalysis A: Chemical 228 (2005) 11–19 15
Fig. 5. O K-edge XANES spectra for bulk ZrO2, Ce1−xZrxO2 nanoparticles,and bulk CeO2.
The same is valid for the stoichiometric Ce1−xZrxO2 oxides[8,21]. Oxygen vacancies can be created by ion sputtering theCe1−xZrxO2(1 1 1) surfaces[8,21] or by reducing in hydro-gen the Ce1−xZrxO2 nanoparticles[17]. The existence of Ovacancies induces a new peak in the valence region (centeredat ∼2 eV, seeFig. 6). This peak is a Ce3+-ion-derived level,related to occupied Ce 4f1 electronic states[37], and has abig impact on the chemical properties of the Ce1−xZrxO2−ycompounds[5,8,21].
3.3. Chemical properties of the Ce1−xZrxO2 systems
3.3.1. Reaction with hydrogenIn many situations, oxide catalysts are activated by partial
reduction in hydrogen[38]. Hydrogen is one of the reducingagents in automotive exhaust gases[2,5]. The deviationof bulk ceria from its ideal CeO2 composition has beenextensively studied by temperature-programmed reduction(TPR) with hydrogen[39,40]. Similar experiments have alsobeen carried out for bulk Ce1−xZrxO2 [4,5,32]. We found thatCeO2(1 1 1) and Ce1−xZrxO2(1 1 1) surfaces (x< 0.4) havea very low reactivity towards H2. Fig. 7 shows typical pho-toemission data for the interaction of a Ce1−xZrxO2(1 1 1)surface with hydrogen. In a reaction cell attached to a UHV
Fig. 6. Typical valence-band photoemission spectra for: (A) CeO2 and CeO2−x; (B) CZrO2−x(1 1 1).
e0.8Zr0.2O2−x(1 1 1) with different defect populations, and (C) Y-stabilized

16 J.A. Rodriguez et al. / Journal of Molecular Catalysis A: Chemical 228 (2005) 11–19
Fig. 7. O 1s/Ce 3d XPS ratio for a Ce0.8Zr0.2O2(1 1 1) crystal and a roughCe0.8Zr0.2O2 film exposed to hydrogen (5 Torr of H2, 300◦C) for differentperiods of time (see text).
chamber[41], the oxide surfaces were exposed to 5 Torr ofH2 at 300◦C for a given period of time. Then, the cell waspumped down (< 5× 10⁻⁷ Torr) and the samples were trans-ferred into the UHV chamber to measure the relative intensityof the O 1s and Ce 3d core levels. The data showed that at300◦C essentially there was no reduction of the CeO2(1 1 1)and Ce1−xZrxO2(1 1 1) surfaces. On the other hand, Oremoval was detected when similar experiments were donewith rough films of CeO2 or Ce1−xZrxO2 (seeFig. 7) andwith Ce1−xZrxO2 nanoparticles. The presence of defects orimperfections in the surface of an oxide facilitates the reac-tion with hydrogen and the removal of O as gaseous water[41,42].
We investigated the partial reduction of the Ce1−xZrxO2nanoparticles in a flow reactor using in situ time-resolvedXRD and XANES[17]. Fig. 8 displays diffraction patternsobtained after heating Ce0.9Zr0.1O2 nanoparticles from 25 to1000◦C under a 5% H2/95% He stream (20 cm3/min). Asthe temperature increases, there is a narrowing of the diffrac-
F -c
Fig. 9. Variations in cell dimension (A) during annealing in air (top panel)and H2-TPR (bottom panel) for a series of nanoparticles: Ce0.5Zr0.5O2,Ce0.66Zr0.33O2, Ce0.90Zr0.10O2, and CeO2. In the H2-TPR experiments, thesamples were heated under a flow (20 cm3/min) of a 5% H2/95% He mixture.Heating rate = 5.9◦C/min.
tion peaks together with a clear shift in position. The nar-rowing indicates sintering of the nanoparticles (see above)and the shift to the lower angle in 2θ is a consequence ofan expansion in their unit cell as a result of introducing Ovacancies and/or sorbing hydrogen during the reduction pro-cess[17,39,40]. Water evolution was observed with a massspectrometer located at the exit of the reaction cell[17]. Sim-ilar trends were observed in the corresponding XRD data fornanoparticles of CeO2, Ce0.5Zr0.5O2 and Ce0.66Zr0.33O2. Thediffraction results did not show the formation of reduced ox-ides with the crystal structures of CeO1.71 or Ce2O3 [17,31].However, XANES measurements at the Ce LIII -edge gavespectra with the line shape expected for a mixture of Ce4+
and Ce3+ [17,43]. Interestingly, there was no reduction of theZr4+ cations[17].
The bottom panel inFig. 9 shows how the size of theunit cell of Ce1−xZrxO2 nanoparticles changes as a functionof temperature when they are reduced in hydrogen. The cellexpansions are much larger than seen during simple heating(compare to data in top panel of the figure)1 as a consequence
1 The cell dimensions obtained here taking into consideration asymme-try effects[31] are a little bit different (0.01–0.04A) from those obtained
ig. 8. Time-resolved XRD data for the heating of Ce0.9Zr0.1O2 nanopartiles under a flow of 5% H2/95% He. Heating rate = 5.9◦C/min.λ = 0.9034A.

J.A. Rodriguez et al. / Journal of Molecular Catalysis A: Chemical 228 (2005) 11–19 17
of a chemical reaction (Ce3+ formation) and the sorption ofhydrogen[17]. Substantial increases in cell dimension oc-cur from 300 to 500◦C, and from 600 to 900◦C. It is clearthat the CeO2 nanoparticles exhibit the lowest reactivity to-wards H2 in Fig. 9. This agrees with trends found in H2-TPRexperiments for bulk CeO2 and Ce1−xZrxO2 [44], and it isfrequently linked to the improvement in oxygen-storage ca-pacity seen in Zr-doped ceria[45]. During the oxygen releaseprocess, there is stress in the oxide lattice as a consequenceof the difference in atomic size of Ce4+ (0.97A) and Ce3+
(1.14A) [46]. The introduction of relatively small Zr4+ ions(0.84A) into the ceria framework could compensate the vol-ume increment, and ease the valence change (Ce4+ → Ce3+)and reduction process in Ce1−xZrxO2 [45,46].
3.3.2. Adsorption and dissociation of SO2Ceria-based catalysts can be very useful for the destruc-
tion of SO2 [6,7]. On the other hand, the SO2 formed dur-ing the combustion of fuels in automotive engines can affectthe performance of the CeO2 or Ce1−xZrxO2 present in cat-alysts used for reducing CO and NOx emissions[22]. Thespecies responsible for ceria deactivation is mainly attributedto cerium sulfate, which blocks the Ce3+ sites for the redoxcycle in the process of oxygen storage/release[22,47]. Re-action of SO2 with CeO2 powders and polycrystalline ceriafia ationo andh ortp atc ss usive[ theis tiono tr peakpt inorc or-b
tt ies:
S
S
i rderi rimen-t ase ofC and at e cubico
Fig. 10. S K-edge spectra taken after dosing SO2 to CeO2(1 1 1) andCe0.7Zr0.3O2(1 1 1) surfaces, and nanoparticles of CeO2, Ce0.66O0.33O2 andCe0.66Ca0.33O2−y. The samples were exposed to 0.1 Torr of SO2, for 5 minat 25◦C.
There are “holes” in the top layer of CeO2(1 1 1) andCe0.7Zr0.3O2(1 1 1) that expose Ce and Zr cations in thesecond layer, seeFig. 1. These cations have all their O neigh-bors (eight in total) and interact very weakly with an ad-sorbed SO2 molecule[21]. One must introduce O vacanciesin CeO2(1 1 1) and Ce0.7Zr0.3O2(1 1 1) to see the interactionof SO2 with the metal cations and dissociation of the molecule[21,48].
In Fig. 10are also shown S K-edge XANES spectra takenafter exposing nanoparticles of CeO2, Ce0.66Zr0.33O2 andCe0.66Ca0.33O2−y to SO2 at 25◦C. Again one finds that SO4is the main sulfur-containing species present on the oxidesbut, in addition, features are seen at photon energies between2470 and 2472 eV that denote the existence of metal–S bonds[7,49] as a consequence of the full dissociation of SO2. Inprinciple, clusters and nanoparticles of Ce1−xZrxO2 proba-bly have metal cations at corner and edge sites (seeFig. 11andrefs. [10,18]) that can interact well with the SO2 molecule.On some of these special sites that are very reactive SO2decomposes. In addition, there may be O vacancies in thesurface of the Ce0.66Zr0.33O2 and Ce0.66Ca0.33O2−y nanopar-ticles that facilitate S–O bond cleavage[21,48,49]. In Fig. 10,the Ce0.66Ca0.33O2−y system has the largest concentration ofO vacancies[31,34], and the highest reactivity for the disso-ciation of SO2.
lms supported on Pt(1 1 1) at 25◦C shows sulfate (SO4)s the main surface species as evidenced by a combinf XANES, temperature-programmed desorption (TPD),igh-resolution photoemission[7]. Photoemission studies f
he adsorption of SO2 on CeO2(1 1 1) and Ce1−xZrxO2(1 1 1)oint to the formation of a SOx species on the surface thould be either SO3 or SO4 [21,48]. The identification of thipecies on the basis of only photoemission is not concl21]. To address this issue, XANES was used to studynteraction of SO2 with CeO2(1 1 1) and Ce1−xZrxO2(1 1 1)urfaces.Fig. 10shows S K-edge spectra for the adsorpf SO2 on CeO2(1 1 1) and Ce0.7Zr0.3O2(1 1 1) surfaces aoom temperature. A comparison to the correspondingositions for sulfates and sulfites[7,49] indicates that SO4 is
he main species formed on the oxide surfaces with a moncentration of SO3. There is no dissociation of the adsate.
The top layer of CeO2(1 1 1) and Ce0.7Zr0.3O2(1 1 1) con-ains only O atoms, seeFig. 1. The adsorption of SO2 onhese O atoms would yield directly sulfite or sulfate spec
O2, gas+ Olattice → SO3,ads (1)
O3,ads+ Olattice → SO4,ads (2)
gnoring asymmetry[17]. Independently of this, variations of the same on the lattice dimension can be expected depending on the exact expeal procedure used for the preparation of the nanoparticles. In the ce0.5Zr0.5O2 nanoparticles, the coexistence of an almost cubic phase
race of a tetragonal phase could occur. The reported values are for thr pseudo-cubic phase.

18 J.A. Rodriguez et al. / Journal of Molecular Catalysis A: Chemical 228 (2005) 11–19
Fig. 11. Possible structures for nanoclusters of CeO2 or Ce1−xZrxO2. Evenfor stoichiometric systems, corner and edge atoms that have a low coordi-nation number can exist.
Fig. 12. Effect of temperature on the XANES signal for the SO4 formed onthe CeO2 and Ce1−xZrxO2 systems ofFig. 10. The top panel shows the resultsfor the (1 1 1) surfaces, while the bottom panel contains the correspondingresults for the nanoparticles.
Fig. 12 shows the effect of the temperature on the sul-fate (SO4) signal for the CeO2 and Ce1−xZrxO2 systems inFig. 10. As the temperature is raised SO4 decomposes. In thecase of the CeO2(1 1 1) and Ce0.7Zr0.3O2(1 1 1) surfaces, theadsorbed SO4 transforms into SO2 gas. On the other hand,in the case of the nanoparticles, most of the decomposedSO4 yields SO2 gas, but a fraction undergoes complete de-composition depositing S on the oxide substrate. The SO4adsorbed on the nanoparticles is somewhat more stable thanthat present on the (1 1 1) surfaces. For both types of systems,the presence of Zr seems to induce an increase in the thermalstability of the adsorbed sulfate. The Zr cations also enhancethe thermal stability of SO4 species formed on partially re-duced Ce1−xZrxO2−y(1 1 1) surfaces[21].
4. Summary and conclusions
Synchrotron-based techniques (high-resolution photoe-mission, time-resolved X-ray diffraction, and X-ray ab-sorption near-edge spectroscopy) were used to investigatethe physical and chemical properties of Ce1−xZrxO2(1 1 1)surfaces and Ce1−xZrxO2 particles with sizes between 4and 7 nm. The results of XANES (O K-edge, Ce andZr LIII -edges) indicate that the Ce1−xZrxO2 nanoparticlesand Ce1−xZrxO2(1 1 1) surfaces have very similar electronicp easedw5 ra ffer-e s intXC
to-w .T enan spo ello e of ap y-d ctrap Oof lesb nsa sp theH
A
ora-t ced
roperties. For these systems, the lattice constant decrith increasing Zr content, varying from 5.4A in CeO2 to.3A in Ce0.5Zr0.5O2. Within the fluorite structure, the Ztoms exhibited structural perturbations that led to dint types of Zr–O distances and non-equivalent O atom
he Ce1−xZrxO2 compounds. Their Zr LIII - and O K-edgeANES spectra displayed features not seen in pure ZrO2 oreO2.The Ce1−xZrxO2 nanoparticles were more reactive
ards H2 and SO2 than the Ce1−xZrxO2(1 1 1) surfaceshe Ce1−xZrxO2(1 1 1) surfaces did not reduce in hydrogt 300◦C. At temperatures above 250◦C, the Ce1−xZrxO2anoparticles reacted with H2 and water evolved into gahase. XANES showed the generation of Ce3+ cations with-ut reduction of Zr4+. There was an expansion in the unit cf the reduced nanoparticles probably as a consequencartial Ce4+ → Ce3+ transformation and the sorption of hrogen into the bulk of the material. S K-edge XANES speointed to SO4 as the main product of the adsorption of S2n the Ce1−xZrxO2 nanoparticles and Ce1−xZrxO2(1 1 1) sur-
aces. Full dissociation of SO2 was seen on the nanoparticut not on the Ce1−xZrxO2(1 1 1) surfaces. The metal catiot corner and edge sites of the Ce1−xZrxO2 nanoparticlerobably play a very important role in interactions with2 and SO2 molecules.
cknowledgements
The research carried out at Brookhaven National Labory and Pacific Northwest National Laboratory was finan

J.A. Rodriguez et al. / Journal of Molecular Catalysis A: Chemical 228 (2005) 11–19 19
by the US Department of Energy (DOE), Office of Basic En-ergy Sciences, Division of Chemical Sciences. Work at the“Instituto de Catalisis (CSIC)” was done with financial sup-port from CICYT (project MAT2000-1467). The NationalSynchrotron Light Source is supported by the Divisions ofMaterials and Chemical Sciences of DOE. A portion of thework was performed in the Environmental Molecular Sci-ences Laboratory (EMSL), a national scientific user facilitylocated at Pacific Northwest National Laboratory and sup-ported by the DOE Office of Biological and EnvironmentalResearch.
References
[1] J.M. Thomas, W.J. Thomas, Principles and Practice of Heteroge-neous Catalysis, VCH, New York, 1997.
[2] M. Shelef, R.W. McCabe, Catal. Today 62 (2000) 35.[3] K.C. Taylor, Catal. Rev. Sci. Eng. 35 (1993) 457.[4] M. Fernandez-Garcıa, A. Martınez-Arias, A. Iglesias-Juez, A.B.
Hungrıa, J.A. Anderson, J.C. Conesa, J. Soria, Appl. Catal. B: En-viron. 31 (2001) 39.
[5] A. Trovarelli, Catal. Rev. Sci. Eng. 38 (1996) 439.[6] T. Zhu, L. Kundakovic, A. Dreher, M. Flytzani-Stephanopoulos,
Catal. Today 50 (1999) 381.[7] J.A. Rodriguez, T. Jirsak, A. Freitag, J.C. Hanson, J.Z. Larese, S.
Chaturvedi, Catal. Lett. 62 (1999) 113.hys.
[ 128.[ jcik,
hem.
[ m.
[[ nson,
[ R.E.
[ 1.[ , M.
[ o-
[ a-796.
[ -) 2473.
[ hys.
[22] R.M. Ferrizz, R.J. Gorte, J.M. Vohs, Catal. Lett. 82 (2002) 123.[23] Y.J. Kim, S. Thevuthasan, V. Shutthananadan, C.L. Perkins, D.E.
McCready, G.S. Herman, Y. Gao, T.T. Tran, S.A. Chambers, C.H.F.Peden, J. Electron Spectrosc. Relat. Phenom. 126 (2002) 177.
[24] V. Shutthanandan, S. Thevuthasan, Y.J. Kim, C.H.F. Peden, Mater.Res. Soc. Symp. Proc. 654 (2001) AA2.6/1.
[25] P. Norby, J. Hanson, Catal. Today 39 (1998) 301, and referencestherein.
[26] A.P. Hammersely, S.O. Svensson, A. Thompson, Nucl. Instrum.Methods Phys. Res. 346 (1994) 321.
[27] A.C. Larson, R.B. von Dreele, GSAS General Structure AnalysisSystem, Report LAUR 86-748, Los Alamos National Laboratory,Los Alamos, NM, 1995.
[28] P. Norby, F.I. Pashni, A.F. Gualtieri, J.C. Hanson, C.P. Grey, J. Phys.Chem. B 102 (1998) 839.
[29] P. Thompson, D.E. Cox, J.B. Hastings, J. Appl. Cryst. 20 (1987)79.
[30] J. Baldinozzi, J.F. Berar, J. Appl. Cryst. 26 (1993) 128.[31] X. Wang, J.C. Hanson, G. Liu, J.A. Rodriguez, A. Iglesias-Juez, M.
Fernandez-Garcıa, J. Chem. Phys. 121 (2004) 5434.[32] P. Fornasiero, E. Fonda, R. Di Monte, G. Vlaic, J. Kaspar, M.
Graziani, J. Catal. 187 (1999) 177.[33] R. Jenkins, R.L. Snyder, Introduction to X-ray Powder Diffractom-
etry, Wiley, New York, 1996, p. 91.[34] J.A. Rodriguez, X. Wang, J.C. Hanson, G. Liu, A. Iglesias-Juez, M.
Fernandez-Garcıa, J. Chem. Phys. 119 (2003) 5659.[35] A. Christensen, E.A. Carter, Phys. Rev. B 58 (1998) 8050.[36] N. Thromat, C. Noguera, M. Gautier, F. Jollet, J.P. Duraud, Phys.
Rev. B 44 (1991) 7904.[37] D.R. Mullins, S.H. Overbury, D. Huntley, Surf. Sci. 409 (1998)
[ atal-
[ Soc.
[ . 66
[ Am.
[ .
[ ett.
[
[ .D.
[ , T.
[ uret,
[ ys.
[
[8] G. Liu, J.A. Rodriguez, J. Hrbek, J. Dvorak, C.H.F. Peden, J. PChem. B 105 (2001) 7762.
[9] J. Stubenrauch, J.M. Vohs, J. Catal. 159 (1996) 50.10] H. Cordatos, D. Ford, R. Gorte, J. Phys. Chem. 100 (1996) 1811] S. de Carolis, J.L. Pascual, L.G.M. Petterson, M. Baudin, M. Wo
K. Hermansson, A.E.C. Palmqvist, M. Muhammed, J. Phys. CB 103 (1999) 7627.
12] G. Balducci, M. Islam, J. Kaspar, P. Fornasiero, M. Graziani, CheMater. 12 (2000) 677.
13] J.A. Rodriguez, Theor. Chem. Acc. 107 (2002) 117.14] F. Zhang, S.-W. Chan, J.E. Spanier, E. Apak, Q. Jin, R.D. Robi
I.P. Herman, Appl. Phys. Lett. 80 (2002) 127.15] E.S. Putna, T. Bunluesin, X.L. Fan, R.J. Gorte, J.M. Vohs,
Lakis, T. Egami, Catal. Today 50 (1999) 343.16] S. Rossignol, Y. Madier, D. Duprez, Catal. Today 50 (1999) 2617] J.A. Rodriguez, J.C. Hanson, J.-Y. Kim, G. Liu, A. Iglesias-Juez
Fernandez-Garcıa, J. Phys. Chem. B 107 (2003) 3535.18] M. Fernandez-Garcıa, A. Martınez-Arias, J.C. Hanson, J.A. R
driguez, Chem. Rev. 104 (2004) 4063.19] A. Martınez-Arias, M. Fernandez-Garcıa, V. Ballesteros, L.N. Sal
manca, J.C. Conesa, C. Otero, J. Soria, Langmuir 15 (1999) 420] M. Fernandez-Garcıa, A. Martınez-Arias, A.B. Hungrıa, A. Iglesias
Juez, J.C. Conesa, J. Soria, Phys. Chem. Chem. Phys. 4 (200221] G. Liu, J.A. Rodriguez, Z. Chang, J. Hrbek, C.H.F. Peden, J. P
Chem. B 108 (2004) 2931.
307.38] H.H. Kung, Transition Metal Oxides: Surface Chemistry and C
ysis, Elsevier, New York, 1989.39] K. Sohlberg, S.K. Pantelides, S.J. Pennycook, J. Am. Chem.
123 (2001) 6609, and references therein.40] J.L.G. Fierro, J. Soria, J. Sanz, J.M. Rojo, J. Solid State Chem
(1987) 154.41] J.Y. Kim, J.A. Rodriguez, J.C. Hanson, A. Frenkel, P.L. Lee, J.
Chem. Soc. 125 (2003) 10685.42] J.A. Rodriguez, J.C. Hanson, A.I. Frenkel, J.Y. Kim, M. Perez, J
Am. Chem. Soc. 124 (2002) 346.43] S.H. Overbury, D.R. Huntley, D. Mullins, G.N. Cleave, Catal. L
51 (1998) 133, and references therein.44] G. Vlaic, R. Di Monte, P. Fornasiero, E. Fonda, J. Kaspar, M.
Graziani, J. Catal. 182 (1999) 378.45] G. Balducci, J. Kaspar, P. Fornasiero, M. Granziani, M.S. Islam, J
Gale, J. Phys. Chem. B 101 (1997) 1750.46] Y. Nagai, T. Yamamoto, T. Tanaka, S. Yoshida, T. Nonaka
Okamoto, A. Suda, M. Sugiura, Catal. Today 74 (2002) 225.47] W. Waqif, P. Bazin, O. Saur, J.C. Lavalley, G. Balanchard, O. To
Appl. Catal. B 11 (1997) 193.48] S.H. Overbury, D.R. Mullins, D. Huntley, L.J. Kundakovic, J. Ph
Chem. B 103 (1999) 11308.49] J.A. Rodriguez, T. Jirsak, L. Gonzalez, J. Evans, M. Perez, A. Maiti,
J. Chem. Phys. 115 (2001) 10914.
Copyright © 2022 FDOKUMEN