Physical activity and health-related quality of life among adult women in Cali, Colombia: a...
10
1 23 Quality of Life Research An International Journal of Quality of Life Aspects of Treatment, Care and Rehabilitation - Official Journal of the International Society of Quality of Life Research ISSN 0962-9343 Qual Life Res DOI 10.1007/s11136-013-0378-9 Physical activity and health-related quality of life among adult women in Cali, Colombia: a cross-sectional study Luis F. Gómez, José Moreno, Olga L. Gómez, Rocio Carvajal & Diana C. Parra
Transcript of Physical activity and health-related quality of life among adult women in Cali, Colombia: a...

1 23
Quality of Life ResearchAn International Journal of Quality ofLife Aspects of Treatment, Care andRehabilitation - Official Journal of theInternational Society of Quality of LifeResearch ISSN 0962-9343 Qual Life ResDOI 10.1007/s11136-013-0378-9
Physical activity and health-relatedquality of life among adult women in Cali,Colombia: a cross-sectional study
Luis F. Gómez, José Moreno, OlgaL. Gómez, Rocio Carvajal & DianaC. Parra

1 23
Your article is protected by copyright and all
rights are held exclusively by Springer Science
+Business Media Dordrecht. This e-offprint
is for personal use only and shall not be self-
archived in electronic repositories. If you
wish to self-archive your work, please use the
accepted author’s version for posting to your
own website or your institution’s repository.
You may further deposit the accepted author’s
version on a funder’s repository at a funder’s
request, provided it is not made publicly
available until 12 months after publication.

Physical activity and health-related quality of life among adultwomen in Cali, Colombia: a cross-sectional study
Luis F. Gomez • Jose Moreno • Olga L. Gomez •
Rocio Carvajal • Diana C. Parra
Accepted: 19 February 2013
� Springer Science+Business Media Dordrecht 2013
Abstract
Objectives To examine the associations of leisure-time
physical activity (LTPA) and walking for transportation
(WT) with the physical and mental dimensions of health-
related quality of life (HR-QOL) among women.
Methods A cross-sectional study was carried out in 2009
among 1,263 women ages 18–59 years living in neighbor-
hoods with low and middle-low socioeconomic status in the
urban area of Cali. HR-QOL was assessed using the Short
Form 8 (SF-8). LTPA and WT were measured using the long
version of the International Physical Activity Questionnaire
(IPAQ). Associations were assessed using linear regression
models adjusting for potential confounders.
Results Low (10–149 min) and medium–high (at least
150 min) levels of WT were negatively associated with the
mental and physical dimensions of HR-QOL. Low
(10–149 min of moderate intensity PA, or 10–74 min of
vigorous intensity PA) and medium–high (at least 150 or
75 min of moderate or vigorous intensity PA, respectively)
levels of LTPA were positively associated with both
dimensions. Significant interactions were observed between
education level and perceived safety from traffic.
Conclusions This study found that WT and LTPA were
associated with HR-QOL both in the physical and mental
dimensions; however, the direction and magnitude of the
association varied by domain. These results highlight the
need to better understand the links between PA and HR-
QOL in urban contexts from Latin America.
Keywords Physical activity � Health-related quality of
life � Urban environment
Background
The promotion of physical activity (PA) is starting to be
recognized as a cornerstone of public health policies [1]. A
compelling number of studies have consistently found that
those who engage in regular physical activity are less likely
to develop chronic diseases such as type 2 diabetes, cancer
and heart disease [2–4]. In addition, physical activity has
been linked with a lower risk of depression symptoms and
cognitive decline [5, 6].
Health-related quality of life (HR-QOL) is a multidi-
mensional concept which includes overall aspects of life
closely linked with physical and mental well-being [7–10].
Although several studies have shown a consistent positive
association between physical activity and HR-QOL [11–15],
the majority of them have only measured physical activity
during leisure time or overall physical activity [11–15].
Jurakic et al. conducted one of the few studies measuring
L. F. Gomez (&)
Departamento de Medicina Preventiva y Social, Facultad de
Medicina, Pontificia Universidad Javeriana, Bogota, Colombia
e-mail: [email protected]
J. Moreno
Instituto Nacional de Salud Publica de Mexico, INSP,
Cuernavaca, Mexico
J. Moreno
Escuela de Salud Publica de Mexico, Cuernavaca, Mexico
O. L. Gomez
Escuela de Salud Publica, Universidad del Valle, Cali, Colombia
R. Carvajal
Fundacion FES Social, Pontificia Universidad Javeriana, Cali,
Colombia
D. C. Parra
Washington University in St. Louis, Prevention Research Center,
St. Louis (MO), USA
123
Qual Life Res
DOI 10.1007/s11136-013-0378-9
Author's personal copy

several domains of physical activity and their association
with HR-QOL and found that while those who engaged in
LTPA were more likely to have higher HR-QOL, transpor-
tation and domestic PA domains were negatively associated
[16].
There is not a clear understanding about the relation-
ships between different domains of PA and HR-QOL
among women who reside in social contexts with large
gender and social disparities, such as those seen in Latin
America. In consequence, the objective of this study is to
examine the associations of two domains of PA: leisure-
time physical activity (LTPA) and walking for transporta-
tion (WT) with the physical and mental dimensions of HR-
QOL among adult women. The results of this study may
contribute to improve understanding of this relevant issue
for public health in the context of Latin America.
Methods
Study setting
Cali is the third largest city in Colombia with a population
of approximately 2,200,000 inhabitants and is an important
economic and cultural urban center of the southwest region
of the country [17]. Its Gini coefficient was 0.53 in 2010,
being very close to the national average (0.56) [18].
As in other Latin American countries, gender disparities
are very notorious in Colombia where 33 % of Colombian
homes have a female head of household. In addition,
34.6 % of women 15 years and older residing in urban
settings do not have an economic income, compared with
17.2 % among men. In addition, unemployment rates are
significantly higher among women (15.8 %) compared to
men (9.4 %) [19].
According to the National Nutrition Survey from 2010,
19.8 % of adults living in Cali engaged in at least 150 min
of LTPA per week and 28.2 % walked for at least 150 min
per week for transportation purposes [20].
Study and sampling design
This was a cross-sectional study conducted in 2010 which
was part of a broader study aimed at assessing the acces-
sibility conditions to mental health services in the city.
Using a multistage probabilistic sampling design, 221
urban segments from low and middle-low socioeconomic
status neighborhoods were selected as primary sample units
(PSU) considering an unequal probability of selection
proportional to the population size. On average, 10
households were selected in each PSU using a random
systematic selection procedure. Finally, an adult 18 years
and older was selected in each household using Kish tables
for respondent selection. For the present study, data from
1,263 adult women were used. The response rate in this
subpopulation group was 83.1 %.
General measurement procedures
A face-to-face questionnaire was administered by inter-
viewers with experience conducting population surveys
and who received a standardized training of 5 days prior to
data collection. The average duration of the interviews was
25 min. All participants were asked to provide written
informed consent. The study was approved by the Institu-
tional Review Board from FES Foundation.
HR-QOL
The official and licensed Spanish version of the Short Form-
8 (SF-8) was used to assess HR-QOL among selected par-
ticipants. This validated questionnaire allows establishing
separate scorings for mental health and physical health,
which were calculated based on the procedures suggested by
QualiMetrics [21]. These two variables were treated as
continuous scores. The value of Cronbach’s alpha was 0.80
for the participant’s responses obtained in the study.
Physical activity
Two domains of physical activity were assessed in this
study using the selected items of a cultural adapted version
of the Long Form of the International Physical Question-
naire (IPAQ): WT and LTPA. In a previous study con-
ducted in Bogota, this version of IPAQ was validated with
accelerometers obtaining a spearman correlation of 0.42
(p = 0.006) when comparing the accelerometer measures
and the scoring in metabolic equivalents (MET). In addi-
tion, the test–retest reliability was 0.69 (p \ 0.001) [22].
These domains were included in this study based on
their relevance for public health and prior recommenda-
tions for the Latin American region [23].
WT was classified in three categories following the 2008
Physical Activity Guidelines for Americans (PAGA) [24]:
(a) inactive: reporting less than 10 min of WT in the last
7 days, (b) low: reporting between 10 and 149 min of WT
in the last 7 days and (c) medium–high: reporting at least
150 min of WT in the last 7 days. The PAGA considers
separately the categories medium (150–300 min a week)
and high (more than 300 min a week) but these were col-
lapsed in order to increase cell size and improve precision
in the statistical analysis. Participants classified in this
category meet the physical activity recommendations
according with PAGA.
Categories of LTPA patterns were as follows: (a) inac-
tive: reporting less than 10 min of physical activity of
Qual Life Res
123
Author's personal copy

moderate or vigorous intensity in the last 7 days, (b) low:
reporting between 10 and 149 min of physical activity of
moderate intensity, or between 10 and 74 min of physical
activity of vigorous intensity in the last 7 days and
(c) medium or high: reporting at least 150 min of moderate
intensity or at least 75 min of vigorous physical activity in
the last 7 days.
Covariates
Sociodemographic covariates included age groups (18–29,
30–49 and 50–59 years), education levels (less than sec-
ondary education and secondary education completed or
more), marital status (married or living together, separated
or divorced, and single or widow), household domestic
activities defined as the main occupation during the last
30 days (yes or not) and socioeconomic status of the
neighborhoods. This last variable was established using the
criteria of the municipality of Cali which consider the
characteristics of the surrounding urban environments (i.e.
street and sidewalk infrastructure) and physical attributes
of housing (i.e. construction type and materials) [25].
Finally, the perception of safety from traffic was assessed
using the following question: ‘‘How safe from traffic do
you or will you feel crossing the streets of the place where
you reside?’’ and response options were as follows: ‘‘very
unsafe’’, ‘‘unsafe’’, ‘‘neither unsafe nor safe’’, ‘‘safe’’ and
‘‘very safe’’.
Table 1 Descriptive
characteristics of the study
population (n = 1,263)
a Number of observation
Variables na % or mean (SD)
Age in years 1,263 37.5 (11.6)
Education levels
None 322 25.5 %
Primary and incomplete secondary education 768 60.8 %
Secondary education completed or more 173 13.7 %
Marital status
Married or living together 781 61.8 %
Separated or divorced 112 8.9 %
Single 329 26 %
Widow 41 3.3 %
Household activities as their main occupation
Yes 923 73 %
No 340 27 %
Socioeconomic status of neighborhood
Low 773 61 %
Middle-low 490 39 %
How safe from traffic do you or will you feel crossing the streets of
the place where you reside?
Very unsafe 168 13.3 %
Unsafe 488 38.6 %
Neither safe nor unsafe 264 21.0 %
Safe 336 26.6 %
Very safe 6 0.5 %
Levels of walking for transportation in the last 7 days
Inactive: less than 10 min 304 24 %
Low: 10–149 min 765 60.6 %
Medium–high: 150 min or more 194 15.4 %
Levels of leisure-time physical activity in the last 7 days
Inactive: less than 10 min 824 65.2 %
Low: 10–149 min (moderate activities) or 10–74 min (vigorous
activity)
246 19.5 %
Medium–high: 150 min and over (moderate activities) or 75 min
or more (vigorous activity)
193 15.3 %
Mental dimension of health-related quality of life 1,263 50.8 (8.7)
Physical dimension of health-related quality of life 1,263 50.1 (8.0)
Qual Life Res
123
Author's personal copy

Statistical analysis
Two multiple linear regression models were conducted to
examine the associations between the physical activity
patterns of WT and LTPA and HR-QOL: one for the
mental dimension and another one for the physical
dimension.
The following sets of statistical interaction terms were
explored in the models based on a previous study con-
ducted in Colombia exploring the links between urban
environments and physical activity and HR-QOL [26]:
• Education level and walking for transportation interac-
tions (Secondary education completed or more * walk-
ing for transportation 10–149 min; and secondary
education completed or more * walking for transpor-
tation 150 min or more)
• Education level and leisure-time physical activity
interactions (Secondary education completed or mor-
e * leisure-time physical activity 10–149 min of mod-
erate activity or 10–74 min vigorous activity; and
secondary education completed or more * leisure-time
physical activity 150 min or more of moderate activity
or 75 min or more of vigorous activity)
• Perception of safety when crossing streets and walking
for transportation interactions (Safe or very safe *
walking for transportation 10–149 min; and safe or
very safe * walking for transportation 150 min or
more)
Therefore, it was hypothesized that the extent to which
physical activity patterns (inactive, low and medium–high)
of LTPA and WT were associated with HR-QOL may vary
according to education level and perceived safety from
traffic.
Models were adjusted by age groups, education levels,
socioeconomic status of neighborhood, marital status,
household activity and interaction terms. Variance inflation
factors were calculated in the step-by-step variable’s
selection process to examine multicollinearity among
variables included in the models. All the statistical analyses
took into account the unequal probability of selection and
the complexity of sampling design using Stata 12.
Results
Characteristics of the study population
Table 1 shows descriptive characteristics of the 1,263
women surveyed in this study. Mean age of the sample was
37.5 (SD = 11.6). Eighty-six percent had less than sec-
ondary education, 61,8 % reported being married or living
together and 73 % reported household activities as their
main occupation. Sixty-one percent belonged to low
socioeconomic status. Slightly more than 15 % reported a
medium–high pattern of WT or LTPA in the last 7 days.
The SF-8 mean scores for the mental and physical health
dimensions were 50.8 (SD = 8.7) and 50.1 (SD = 8.0),
respectively.
WT and LTPA patterns and its associations with HR-
QOL
Tables 2 and 3 show the associations of WT and LTPA
patterns with the mental and physical health dimensions of
HR-QOL.
Low and medium–high levels of WT were negatively
and significantly associated with the mental dimension of
HR-QOL (b = -0.81 and b = -0.91, p \ 0.001, respec-
tively; p trend \ 0.001). Low and medium–high levels of
LTPA were significantly and positively associated with the
mental dimension of HR-QOL (b = ?0.51 and b =
?0.92, respectively; p trend \ 0.001) (Table 2).
Similarly, low and medium–high levels of WT were
negatively associated with the physical dimension of HR-
QOL (b = -1.15 and b = -1.75, respectively; p trend
\ 0.001). Low and medium–high levels of LTPA were
positively associated with the physical dimension of HR-
QOL (b = ?2.51 and b = ?1.84, respectively; p trend
\ 0.001) (Table 3).
Significant interaction terms were found between the
selected PA domains and education level and perception of
safety when crossing the streets. Achieving low and med-
ium–high levels of LTPA among those with complete
secondary education or more was positively associated
with the mental dimension of HR-QOL. Likewise,
achieving low and medium–high levels of WT among
those with complete secondary education or more was
positively associated with the physical dimension of HR-
QOL. Finally, women who walked above the inactive level
(10–149 min or 150 min or more) and reported being safe
or very safe when crossing the streets tended to report
higher scorings of HR-QOL in the mental and physical
dimensions (Tables 2, 3).
Both models achieved low levels of explained variation
with determination coefficients not exceeding 6 %.
Discussion
This study found that WT and LTPA were associated with
HR-QOL both in the physical and mental dimensions;
however, the direction and magnitude of the associations
varied by domain. LTPA patterns were positively associ-
ated with the mental and physical dimension of HR-QOL,
whereas WT was negatively associated with both
Qual Life Res
123
Author's personal copy
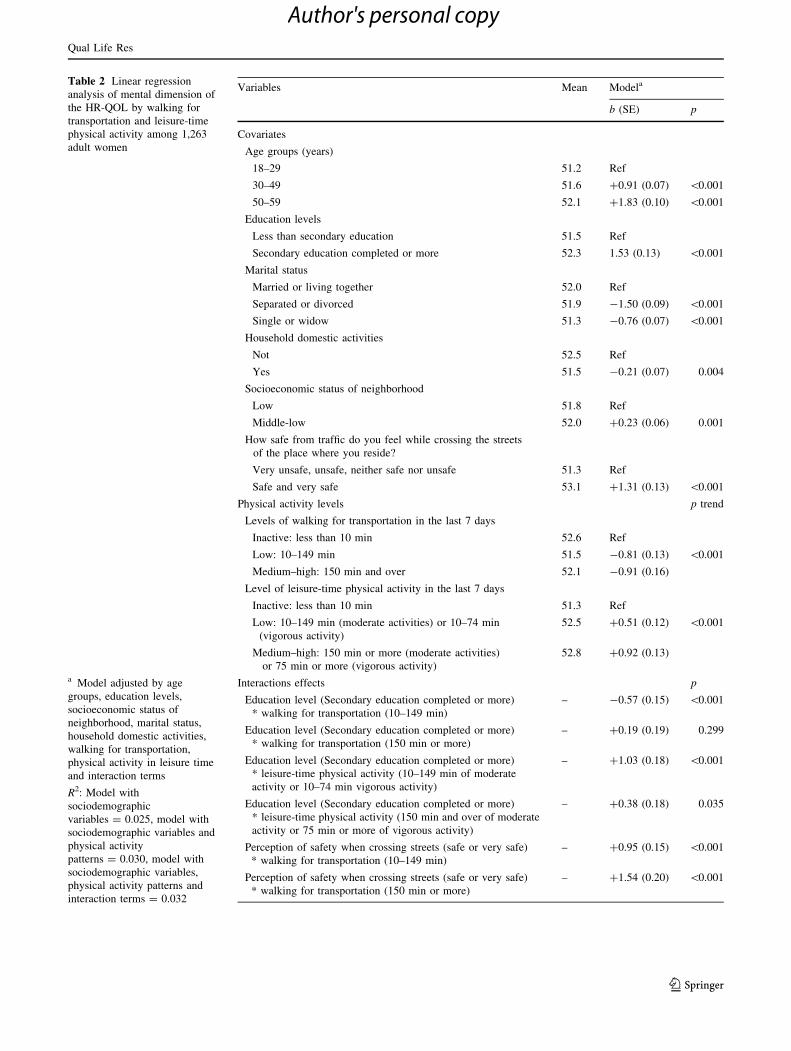
Table 2 Linear regression
analysis of mental dimension of
the HR-QOL by walking for
transportation and leisure-time
physical activity among 1,263
adult women
a Model adjusted by age
groups, education levels,
socioeconomic status of
neighborhood, marital status,
household domestic activities,
walking for transportation,
physical activity in leisure time
and interaction terms
R2: Model with
sociodemographic
variables = 0.025, model with
sociodemographic variables and
physical activity
patterns = 0.030, model with
sociodemographic variables,
physical activity patterns and
interaction terms = 0.032
Variables Mean Modela
b (SE) p
Covariates
Age groups (years)
18–29 51.2 Ref
30–49 51.6 ?0.91 (0.07) \0.001
50–59 52.1 ?1.83 (0.10) \0.001
Education levels
Less than secondary education 51.5 Ref
Secondary education completed or more 52.3 1.53 (0.13) \0.001
Marital status
Married or living together 52.0 Ref
Separated or divorced 51.9 -1.50 (0.09) \0.001
Single or widow 51.3 -0.76 (0.07) \0.001
Household domestic activities
Not 52.5 Ref
Yes 51.5 -0.21 (0.07) 0.004
Socioeconomic status of neighborhood
Low 51.8 Ref
Middle-low 52.0 ?0.23 (0.06) 0.001
How safe from traffic do you feel while crossing the streets
of the place where you reside?
Very unsafe, unsafe, neither safe nor unsafe 51.3 Ref
Safe and very safe 53.1 ?1.31 (0.13) \0.001
Physical activity levels p trend
Levels of walking for transportation in the last 7 days
Inactive: less than 10 min 52.6 Ref
Low: 10–149 min 51.5 -0.81 (0.13) \0.001
Medium–high: 150 min and over 52.1 -0.91 (0.16)
Level of leisure-time physical activity in the last 7 days
Inactive: less than 10 min 51.3 Ref
Low: 10–149 min (moderate activities) or 10–74 min
(vigorous activity)
52.5 ?0.51 (0.12) \0.001
Medium–high: 150 min or more (moderate activities)
or 75 min or more (vigorous activity)
52.8 ?0.92 (0.13)
Interactions effects p
Education level (Secondary education completed or more)
* walking for transportation (10–149 min)
– -0.57 (0.15) \0.001
Education level (Secondary education completed or more)
* walking for transportation (150 min or more)
– ?0.19 (0.19) 0.299
Education level (Secondary education completed or more)
* leisure-time physical activity (10–149 min of moderate
activity or 10–74 min vigorous activity)
– ?1.03 (0.18) \0.001
Education level (Secondary education completed or more)
* leisure-time physical activity (150 min and over of moderate
activity or 75 min or more of vigorous activity)
– ?0.38 (0.18) 0.035
Perception of safety when crossing streets (safe or very safe)
* walking for transportation (10–149 min)
– ?0.95 (0.15) \0.001
Perception of safety when crossing streets (safe or very safe)
* walking for transportation (150 min or more)
– ?1.54 (0.20) \0.001
Qual Life Res
123
Author's personal copy
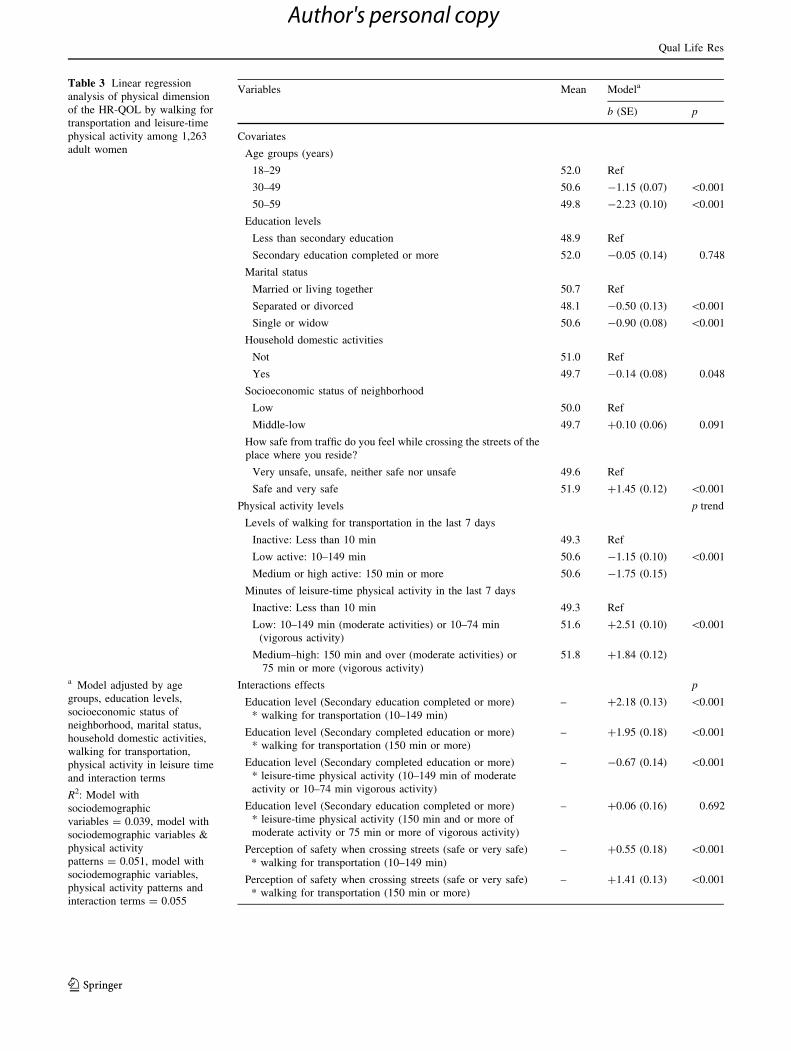
Table 3 Linear regression
analysis of physical dimension
of the HR-QOL by walking for
transportation and leisure-time
physical activity among 1,263
adult women
a Model adjusted by age
groups, education levels,
socioeconomic status of
neighborhood, marital status,
household domestic activities,
walking for transportation,
physical activity in leisure time
and interaction terms
R2: Model with
sociodemographic
variables = 0.039, model with
sociodemographic variables &
physical activity
patterns = 0.051, model with
sociodemographic variables,
physical activity patterns and
interaction terms = 0.055
Variables Mean Modela
b (SE) p
Covariates
Age groups (years)
18–29 52.0 Ref
30–49 50.6 -1.15 (0.07) \0.001
50–59 49.8 -2.23 (0.10) \0.001
Education levels
Less than secondary education 48.9 Ref
Secondary education completed or more 52.0 -0.05 (0.14) 0.748
Marital status
Married or living together 50.7 Ref
Separated or divorced 48.1 -0.50 (0.13) \0.001
Single or widow 50.6 -0.90 (0.08) \0.001
Household domestic activities
Not 51.0 Ref
Yes 49.7 -0.14 (0.08) 0.048
Socioeconomic status of neighborhood
Low 50.0 Ref
Middle-low 49.7 ?0.10 (0.06) 0.091
How safe from traffic do you feel while crossing the streets of the
place where you reside?
Very unsafe, unsafe, neither safe nor unsafe 49.6 Ref
Safe and very safe 51.9 ?1.45 (0.12) \0.001
Physical activity levels p trend
Levels of walking for transportation in the last 7 days
Inactive: Less than 10 min 49.3 Ref
Low active: 10–149 min 50.6 -1.15 (0.10) \0.001
Medium or high active: 150 min or more 50.6 -1.75 (0.15)
Minutes of leisure-time physical activity in the last 7 days
Inactive: Less than 10 min 49.3 Ref
Low: 10–149 min (moderate activities) or 10–74 min
(vigorous activity)
51.6 ?2.51 (0.10) \0.001
Medium–high: 150 min and over (moderate activities) or
75 min or more (vigorous activity)
51.8 ?1.84 (0.12)
Interactions effects p
Education level (Secondary education completed or more)
* walking for transportation (10–149 min)
– ?2.18 (0.13) \0.001
Education level (Secondary completed education or more)
* walking for transportation (150 min or more)
– ?1.95 (0.18) \0.001
Education level (Secondary completed education or more)
* leisure-time physical activity (10–149 min of moderate
activity or 10–74 min vigorous activity)
– -0.67 (0.14) \0.001
Education level (Secondary education completed or more)
* leisure-time physical activity (150 min and or more of
moderate activity or 75 min or more of vigorous activity)
– ?0.06 (0.16) 0.692
Perception of safety when crossing streets (safe or very safe)
* walking for transportation (10–149 min)
– ?0.55 (0.18) \0.001
Perception of safety when crossing streets (safe or very safe)
* walking for transportation (150 min or more)
– ?1.41 (0.13) \0.001
Qual Life Res
123
Author's personal copy

dimensions. In addition, this study found significant vari-
ation of the effects once adjusted by education level and
perception of safety when crossing the streets.
The positive associations between LTPA and HR-QOL
are similar to those found in studies conducted in devel-
oped and developing countries and enhance the relevance
of this PA domain on health and well-being [11–15]. On
the other hand, to our knowledge, the study conducted by
Jurakic et al. in Croatia was the only previous study that
reported a negative association between PA for transpor-
tation and HR-QOL [16].
These findings highlight the need to better understand
the links between active transportation and HR-QOL in
contexts characterized by social, gender and urban
inequalities. In a society with pronounced gender and
social disparities such as Colombia, walking for transpor-
tation may be linked with burdensome utilitarian activities
culturally assigned to women, such as caregiving, and
household chores [12]. In addition, the mobility patterns of
Latin American women are specially conditioned by
security circumstances such as the risk of robbery and
sexual harassment [27]. All of these factors might have
deleterious associations between well-being and functional
health which should be explored in future studies. Fur-
thermore, it is relevant to note that at the moment of
conducting this study, the municipality of Cali was
undertaking several mega public works which may have
affected urban mobility, access to public transportation and
environmental and well-being perceptions of walkers. For
this reason, it is possible that the beneficial effects of
physical activity in HR-QOL, in particular, walking for
transportation, may not be present in such a context.
The interactions between education level and WT and
LTPA were significant but did not have consistent patterns,
which highlight the need for a deeper exploration in further
studies. Results of the interaction term between perception
of safety when crossing the streets are in some way
expected and may show the relevance of improving
pedestrian safety and other urban attributes, not only to
promote active transportation, but also to increase the
perception of quality of life [26].
Several limitations can be identified in this study. First,
the cross-sectional designed does not allow to track over
time the influence of the selected PA domains on HR-QOL.
Second, residual confusion cannot be ruled out due to
several potential cofounders that were not measured, such
as family composition and income. Third, several studies
have shown that IPAQ overestimates PA levels [26, 28–
30]; however, this limitation has been shown to be more
problematic for the short form of IPAQ [31]. Also, results
can be only statistically inferred to the sampling frame of
women who reside in low and middle-low neighborhoods
in Cali. Finally, although SF-8 has shown appropriate
psychometric properties, the self-perception assessment of
HR-QOL may have limitations due to differences in social
experiences among participants [31]. For instance, people
who have lived in adverse and deprived social conditions
may have a tendency to report fair or good perceptions of
HR-QOL as a coping strategy to face their daily lives [32].
Even with these limitations, our study provides useful
information about the relationship between physical
activity and HR-QOL and could guide the development of
public policies to improve the social and urban environ-
ment conditions linked with PA patterns. Future studies
should explore the interactive role of environmental factors
in the association of physical activity and HR-QOL.
Conclusions
This study found that WT and LTPA were associated with
HR-QOL both in the physical and mental dimensions;
however, the direction and magnitude of the association
varied by domain. These results highlight the need to better
understand the links between PA and HR-QOL in urban
contexts from Latin America.
Acknowledgments This research was supported by a grant from the
Departamento Administrativo de Ciencia, Tecnologıa e Innovacion,
COLCIENCIAS, Grant # 620449326152 - Contract # 565-2009.
Many individuals contributed to this research, and their assistance is
acknowledged.
References
1. Sallis, J. F., Cervero, R. B., Ascher, W., Henderson, K. A., Kraft,
M. K., & Kerr, J. (2006). An ecological approach to creating
active living communities. Annual Review of Public Health, 27,
297–322.
2. Sattelmair, J., Pertman, J., Ding, E. L., Kohl, H. W., I. I. I.,
Haskell, W., & Lee, I. M. (2011). Dose response between phys-
ical activity and risk of coronary heart disease: A meta-analysis.
Circulation, 124(7), 789–795.
3. Jeon, C. Y., Lokken, R. P., Hu, F. B., & van Dam, R. M. (2007).
Physical activity of moderate intensity and risk of type 2 diabetes:
A systematic review. Diabetes Care, 30(3), 744–752.
4. Monninkhof, E. M., Elias, S. G., Vlems, F. A., van der Tweel, I.,
Schuit, A. J., Voskuil, D. W., et al. (2007). Physical activity and
breast cancer: A systematic review. Epidemiology, 18(1),
137–157.
5. Teychenne, M., Ball, K., & Salmon, J. (2008). Physical activity
and likelihood of depression in adults: A review. PreventiveMedicine, 46(5), 397–411.
6. Weuve, J., Kang, J. H., Manson, J. E., Breteler, M. M., Ware, J. H.,
& Grodstein, F. (2004). Physical activity, including walking, and
cognitive function in older women. JAMA, 292(12), 1454–1461.
7. Centers for Disease Control and Prevention. (2000). Measuringhealthy days: Population assessment of health-related quality oflife. Georgia: Centers for Disease Control and Prevention.
8. Gandek, B., Sinclair, S. J., Kosinski, M., & Ware, J. E., Jr.
(2004). Psychometric evaluation of the SF-36 health survey in
Qual Life Res
123
Author's personal copy

Medicare managed care. Health Care Financing Review, 25(4),
5–25.
9. McHorney, C. A. (1999). Health status assessment methods for
adults: Past accomplishments and future directions. AnnualReview of Public Health, 20, 309–335.
10. Selim, A. J., Rogers, W., Fleishman, J. A., Qian, S. X., Fincke, B.
G., Rothendler, J. A., et al. (2009). Updated U.S. population
standard for the Veterans RAND 12-item Health Survey (VR-12).
Quality of Life Research, 18(1), 43–52.
11. Wolin, K. Y., Glynn, R. J., Colditz, G. A., Lee, I. M., & Kawachi,
I. (2007). Long-term physical activity patterns and health-related
quality of life in U.S. women. American Journal of PreventiveMedicine, 32(6), 490–499.
12. Tessier, S., Vuillemin, A., Bertrais, S., Boini, S., Le Bihan, E.,
Oppert, J. M., et al. (2007). Association between leisure-time
physical activity and health-related quality of life changes over
time. Preventive Medicine, 44(3), 202–208.
13. Chai, W., Nigg, C. R., Pagano, I. S., Motl, R. W., Horwath, C., &
Dishman, R. K. (2010). Associations of quality of life with
physical activity, fruit and vegetable consumption, and physica-
linactivity in a free living, multiethnic population in Hawaii: a
longitudinal study. The International Journal of BehavioralNutrition and Physical Activity, 7, 83.
14. Parra, D., Gomez, L. F., Sarmiento, O. L., Buchner, D., Brown-
son, R., Schmid, T., et al. (2010). Perceived and objective
neighborhood environment attributes and health related quality of
life among the elderly in Bogota. Social Science and Medicine,70, 1070–1076.
15. Sarmiento, O. L., Schmid, T., Parra, D., Diaz-del-Castillo, A.,
Gomez, L. F., Pratt, M., et al. (2010). Quality of life, physical
activity and built environment characteristics among Colombian
Adults. Journal of Physical Activity and Health., 7, S181–S195.
16. Jurakic, D., Pedisic, Z., & Greblo, Z. (2010). Physical activity in
different domains and health-related quality of life: A population-
based study. Quality of Life Research, 19(9), 1303–1309.
17. DANE. Departamento Administrativo de Planeacion Distrital.
Proyecciones de poblacion. Bogota. 2010. Available in: http://www.
dane.gov.co/index.php?option=com_content&view=article&id=75
&Itemid=72.
18. DANE. Departamento Administrativo de Planeacion Distrital.
Gran Encuesta Integrada de Hogares 2008–2012. Bogota. 2012.
Available in: http://www.dane.gov.co/index.php?option=com_
content&view=article&id=121&Itemid=67.
19. Organizacion Panamericana de la Salud. (2012). CEPAL: Gen-
ero, salud y desarrollo en las Americas—Indicadores basicos
2009. 20. Organizacion Panamericana de la Salud, CEPAL.
Available in: http://www2.paho.org/hq/dmdocuments/2010/
BASICindicators10spanLR.pdf.
20. ICBF. Encuesta Nacional de la Situacion Nutricional en
Colombia ENSIN 2010. Bogota: ICBF. 2011.
21. QualityMetrics. (2008). A manual for users of the SF-8_ health
survey quality. Metrics.
22. Gomez, L. F., Sarmiento, O. L., Parra, D., Schmid, T., Pratt, M.,
Jacoby, E., et al. (2010). Characteristics of the built environmentassociated with leisure-time physical activity among adults in
Bogota, Colombia: A Multilevel Study. Journal of PhysicalActivity and Health, 7, S182–S195.
23. Hallal, P. C., Gomez, L. F., Parra, D. C., Lobelo, F., Mosquera, J.,
Florindo, A., et al. (2010). Lessons learned after 10 years of
IPAQ use in Brazil and Colombia. Journal of Physical Activityand Health, 7, S259–S264.
24. U.S. Department of Health and HumanServices. (2008). PhysicalActivity Guidelines for Americans. Washington DC, 2008.
25. Municipio de Santiago de Cali. Departamento Administrativo de
Planeacion Municipal. La estratificacion socioeconomica. 2011.
26. Gomez, L. F., Parra, D., Buchner, D., Brownson, R., Sarmiento,
O. L., Pinzon, J. D., et al. (2010). Built environment attributes
and walking patterns among the elderly population in Bogota.
American Journal of Preventive Medicine, 30, 592–599.
27. ONU-HABITAT. (2012). State of Latin American and Caribbean
cities. Towards a new urban transition. Nairobi: ONU-HABITAT.
28. Johnson-Kozlow, M., Sallis, J. F., Gilpin, E. A., Rock, C. L., &
Pierce, J. P. (2006). Comparative validation of the IPAQ and the
7-Day PAR among women diagnosed with breast cancer. TheInternational Journal of Behavioral Nutrition and PhysicalActivity, 3, 7.
29. Ainsworth, B. E., Macera, C. A., Jones, D. A., et al. (2006).
Comparison of the 2001 BRFSS and the IPAQ Physical Activity
Questionnaires. Medicine and Science in Sports and Exercise,38(9), 1584–1592.
30. Rzewnicki, R., Vanden Auweele, Y., & den Bourdeaudhuij, I.
(2003). Addressing over-reporting on the International Physical
Activity Questionnaire (IPAQ) telephone survey with a popula-
tion sample. Public Health Nutrition, 6, 299–305.
31. Lee, P. H., Macfarlane, D. J., Lam, T. H., & Stewart, S. M.
(2011). Validity of the International Physical Activity Question-
naire Short Form (IPAQ-SF): A systematic review. The Inter-national Journal of Behavioral Nutrition and Physical Activity, 8,
115.
32. Sen, A. (2002). Health: Perception versus observation. BMJ, 324,
860–861.
Qual Life Res
123
Author's personal copy