Photothermal Single-Particle Microscopy: Detection of a Nanolens
11
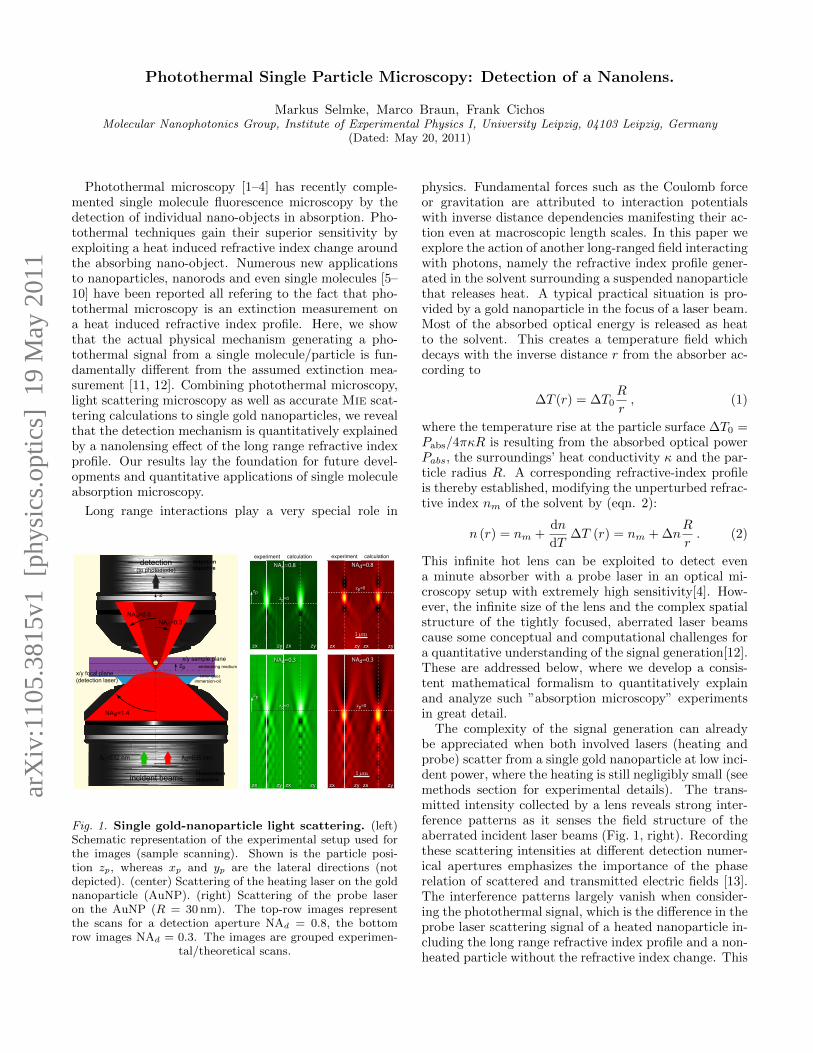
Photothermal Single Particle Microscopy: Detection of a Nanolens. Markus Selmke, Marco Braun, Frank Cichos Molecular Nanophotonics Group, Institute of Experimental Physics I, University Leipzig, 04103 Leipzig, Germany (Dated: May 20, 2011) Photothermal microscopy [1–4] has recently comple- mented single molecule fluorescence microscopy by the detection of individual nano-objects in absorption. Pho- tothermal techniques gain their superior sensitivity by exploiting a heat induced refractive index change around the absorbing nano-object. Numerous new applications to nanoparticles, nanorods and even single molecules [5– 10] have been reported all refering to the fact that pho- tothermal microscopy is an extinction measurement on a heat induced refractive index profile. Here, we show that the actual physical mechanism generating a pho- tothermal signal from a single molecule/particle is fun- damentally different from the assumed extinction mea- surement [11, 12]. Combining photothermal microscopy, light scattering microscopy as well as accurate Mie scat- tering calculations to single gold nanoparticles, we reveal that the detection mechanism is quantitatively explained by a nanolensing effect of the long range refractive index profile. Our results lay the foundation for future devel- opments and quantitative applications of single molecule absorption microscopy. Long range interactions play a very special role in experiment experiment calculation calculation NAd=0.8 NAd=0.8 NAd=0.3 NAd=0.3 x/y sample plane incident beams detection (to photodiode) zp=0 zp=0 zp=0 zp=0 z zx zy zx zy zx zy zx zy zx zy zx zy zx zy zx zy λd=635 nm λh=532 nm cover-glass embedding medium zp immersion-oil NAd=0.8 NAd=0.3 NAill=1.4 detection objective illumination objective x/y focal plane (detection laser) zp zp Fig. 1. Single gold-nanoparticle light scattering. (left) Schematic representation of the experimental setup used for the images (sample scanning). Shown is the particle posi- tion zp, whereas xp and yp are the lateral directions (not depicted). (center) Scattering of the heating laser on the gold nanoparticle (AuNP). (right) Scattering of the probe laser on the AuNP (R = 30 nm). The top-row images represent the scans for a detection aperture NA d =0.8, the bottom row images NA d =0.3. The images are grouped experimen- tal/theoretical scans. physics. Fundamental forces such as the Coulomb force or gravitation are attributed to interaction potentials with inverse distance dependencies manifesting their ac- tion even at macroscopic length scales. In this paper we explore the action of another long-ranged field interacting with photons, namely the refractive index profile gener- ated in the solvent surrounding a suspended nanoparticle that releases heat. A typical practical situation is pro- vided by a gold nanoparticle in the focus of a laser beam. Most of the absorbed optical energy is released as heat to the solvent. This creates a temperature field which decays with the inverse distance r from the absorber ac- cording to ΔT (r)=ΔT 0 R r , (1) where the temperature rise at the particle surface ΔT 0 = P abs /4πκR is resulting from the absorbed optical power P abs , the surroundings’ heat conductivity κ and the par- ticle radius R. A corresponding refractive-index profile is thereby established, modifying the unperturbed refrac- tive index n m of the solvent by (eqn. 2): n (r)= n m + dn dT ΔT (r)= n m +Δn R r . (2) This infinite hot lens can be exploited to detect even a minute absorber with a probe laser in an optical mi- croscopy setup with extremely high sensitivity[4]. How- ever, the infinite size of the lens and the complex spatial structure of the tightly focused, aberrated laser beams cause some conceptual and computational challenges for a quantitative understanding of the signal generation[12]. These are addressed below, where we develop a consis- tent mathematical formalism to quantitatively explain and analyze such ”absorption microscopy” experiments in great detail. The complexity of the signal generation can already be appreciated when both involved lasers (heating and probe) scatter from a single gold nanoparticle at low inci- dent power, where the heating is still negligibly small (see methods section for experimental details). The trans- mitted intensity collected by a lens reveals strong inter- ference patterns as it senses the field structure of the aberrated incident laser beams (Fig. 1, right). Recording these scattering intensities at different detection numer- ical apertures emphasizes the importance of the phase relation of scattered and transmitted electric fields [13]. The interference patterns largely vanish when consider- ing the photothermal signal, which is the difference in the probe laser scattering signal of a heated nanoparticle in- cluding the long range refractive index profile and a non- heated particle without the refractive index change. This arXiv:1105.3815v1 [physics.optics] 19 May 2011
-
Upload
independent -
Category
Documents
-
view
5 -
download
0
Transcript of Photothermal Single-Particle Microscopy: Detection of a Nanolens
Photothermal Single Particle Microscopy: Detection of a Nanolens.
Markus Selmke, Marco Braun, Frank CichosMolecular Nanophotonics Group, Institute of Experimental Physics I, University Leipzig, 04103 Leipzig, Germany
(Dated: May 20, 2011)
Photothermal microscopy [1–4] has recently comple-mented single molecule fluorescence microscopy by thedetection of individual nano-objects in absorption. Pho-tothermal techniques gain their superior sensitivity byexploiting a heat induced refractive index change aroundthe absorbing nano-object. Numerous new applicationsto nanoparticles, nanorods and even single molecules [5–10] have been reported all refering to the fact that pho-tothermal microscopy is an extinction measurement ona heat induced refractive index profile. Here, we showthat the actual physical mechanism generating a pho-tothermal signal from a single molecule/particle is fun-damentally different from the assumed extinction mea-surement [11, 12]. Combining photothermal microscopy,light scattering microscopy as well as accurate Mie scat-tering calculations to single gold nanoparticles, we revealthat the detection mechanism is quantitatively explainedby a nanolensing effect of the long range refractive indexprofile. Our results lay the foundation for future devel-opments and quantitative applications of single moleculeabsorption microscopy.
Long range interactions play a very special role in
experiment experimentcalculation calculationNAd=0.8 NAd=0.8
NAd=0.3 NAd=0.3x/y sample plane
incident beams
detection(to photodiode)
zp=0
zp=0zp=0
zp=0z
zx zy zx zy zx zy zx zy
zx zy zx zy zx zy zx zy
λd=635 nmλh=532 nm
cover-glass
embedding mediumzp
immersion-oil
NAd=0.8NAd=0.3
NAill=1.4
detection objective
illumination objective
x/y focal plane(detection laser)
zp
zp
Fig. 1. Single gold-nanoparticle light scattering. (left)Schematic representation of the experimental setup used forthe images (sample scanning). Shown is the particle posi-tion zp, whereas xp and yp are the lateral directions (notdepicted). (center) Scattering of the heating laser on the goldnanoparticle (AuNP). (right) Scattering of the probe laseron the AuNP (R = 30 nm). The top-row images representthe scans for a detection aperture NAd = 0.8, the bottomrow images NAd = 0.3. The images are grouped experimen-
tal/theoretical scans.
physics. Fundamental forces such as the Coulomb forceor gravitation are attributed to interaction potentialswith inverse distance dependencies manifesting their ac-tion even at macroscopic length scales. In this paper weexplore the action of another long-ranged field interactingwith photons, namely the refractive index profile gener-ated in the solvent surrounding a suspended nanoparticlethat releases heat. A typical practical situation is pro-vided by a gold nanoparticle in the focus of a laser beam.Most of the absorbed optical energy is released as heatto the solvent. This creates a temperature field whichdecays with the inverse distance r from the absorber ac-cording to
∆T (r) = ∆T0R
r, (1)
where the temperature rise at the particle surface ∆T0 =Pabs/4πκR is resulting from the absorbed optical powerPabs, the surroundings’ heat conductivity κ and the par-ticle radius R. A corresponding refractive-index profileis thereby established, modifying the unperturbed refrac-tive index nm of the solvent by (eqn. 2):
n (r) = nm +dn
dT∆T (r) = nm + ∆n
R
r. (2)
This infinite hot lens can be exploited to detect evena minute absorber with a probe laser in an optical mi-croscopy setup with extremely high sensitivity[4]. How-ever, the infinite size of the lens and the complex spatialstructure of the tightly focused, aberrated laser beamscause some conceptual and computational challenges fora quantitative understanding of the signal generation[12].These are addressed below, where we develop a consis-tent mathematical formalism to quantitatively explainand analyze such ”absorption microscopy” experimentsin great detail.
The complexity of the signal generation can alreadybe appreciated when both involved lasers (heating andprobe) scatter from a single gold nanoparticle at low inci-dent power, where the heating is still negligibly small (seemethods section for experimental details). The trans-mitted intensity collected by a lens reveals strong inter-ference patterns as it senses the field structure of theaberrated incident laser beams (Fig. 1, right). Recordingthese scattering intensities at different detection numer-ical apertures emphasizes the importance of the phaserelation of scattered and transmitted electric fields [13].The interference patterns largely vanish when consider-ing the photothermal signal, which is the difference in theprobe laser scattering signal of a heated nanoparticle in-cluding the long range refractive index profile and a non-heated particle without the refractive index change. This
arX
iv:1
105.
3815
v1 [
phys
ics.
optic
s] 1
9 M
ay 2
011
2
6x10⁻³
4
2
0
-2
rel.
PT
sign
al
2.01.00.0-1.0 zp [ m]
2.0x10⁻³
1.0
0.0
-1.0
-2.0
rel.
PT
sign
al
-2.0 -1.0 0.0 1.0 2.0 zp [ m]
zpΔzf
steady statephotothermal signal
dynamic photothermal signal
stea
dy s
tate
dyna
mic
a)
b)
c) e)
d)
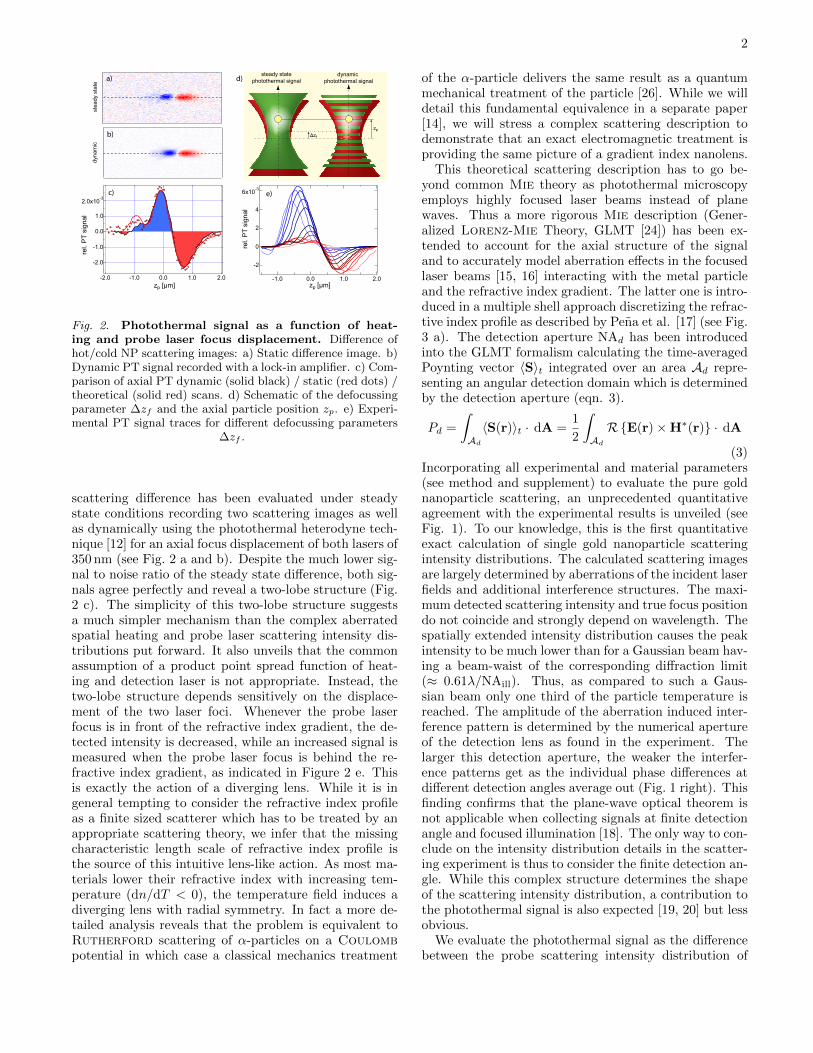
Fig. 2. Photothermal signal as a function of heat-ing and probe laser focus displacement. Difference ofhot/cold NP scattering images: a) Static difference image. b)Dynamic PT signal recorded with a lock-in amplifier. c) Com-parison of axial PT dynamic (solid black) / static (red dots) /theoretical (solid red) scans. d) Schematic of the defocussingparameter ∆zf and the axial particle position zp. e) Experi-mental PT signal traces for different defocussing parameters
∆zf .
scattering difference has been evaluated under steadystate conditions recording two scattering images as wellas dynamically using the photothermal heterodyne tech-nique [12] for an axial focus displacement of both lasers of350 nm (see Fig. 2 a and b). Despite the much lower sig-nal to noise ratio of the steady state difference, both sig-nals agree perfectly and reveal a two-lobe structure (Fig.2 c). The simplicity of this two-lobe structure suggestsa much simpler mechanism than the complex aberratedspatial heating and probe laser scattering intensity dis-tributions put forward. It also unveils that the commonassumption of a product point spread function of heat-ing and detection laser is not appropriate. Instead, thetwo-lobe structure depends sensitively on the displace-ment of the two laser foci. Whenever the probe laserfocus is in front of the refractive index gradient, the de-tected intensity is decreased, while an increased signal ismeasured when the probe laser focus is behind the re-fractive index gradient, as indicated in Figure 2 e. Thisis exactly the action of a diverging lens. While it is ingeneral tempting to consider the refractive index profileas a finite sized scatterer which has to be treated by anappropriate scattering theory, we infer that the missingcharacteristic length scale of refractive index profile isthe source of this intuitive lens-like action. As most ma-terials lower their refractive index with increasing tem-perature (dn/dT < 0), the temperature field induces adiverging lens with radial symmetry. In fact a more de-tailed analysis reveals that the problem is equivalent toRutherford scattering of α-particles on a Coulombpotential in which case a classical mechanics treatment
of the α-particle delivers the same result as a quantummechanical treatment of the particle [26]. While we willdetail this fundamental equivalence in a separate paper[14], we will stress a complex scattering description todemonstrate that an exact electromagnetic treatment isproviding the same picture of a gradient index nanolens.
This theoretical scattering description has to go be-yond common Mie theory as photothermal microscopyemploys highly focused laser beams instead of planewaves. Thus a more rigorous Mie description (Gener-alized Lorenz-Mie Theory, GLMT [24]) has been ex-tended to account for the axial structure of the signaland to accurately model aberration effects in the focusedlaser beams [15, 16] interacting with the metal particleand the refractive index gradient. The latter one is intro-duced in a multiple shell approach discretizing the refrac-tive index profile as described by Pena et al. [17] (see Fig.3 a). The detection aperture NAd has been introducedinto the GLMT formalism calculating the time-averagedPoynting vector 〈S〉t integrated over an area Ad repre-senting an angular detection domain which is determinedby the detection aperture (eqn. 3).
Pd =
∫
Ad
〈S(r)〉t · dA =1
2
∫
Ad
RE(r)×H∗(r) · dA
(3)Incorporating all experimental and material parameters(see method and supplement) to evaluate the pure goldnanoparticle scattering, an unprecedented quantitativeagreement with the experimental results is unveiled (seeFig. 1). To our knowledge, this is the first quantitativeexact calculation of single gold nanoparticle scatteringintensity distributions. The calculated scattering imagesare largely determined by aberrations of the incident laserfields and additional interference structures. The maxi-mum detected scattering intensity and true focus positiondo not coincide and strongly depend on wavelength. Thespatially extended intensity distribution causes the peakintensity to be much lower than for a Gaussian beam hav-ing a beam-waist of the corresponding diffraction limit(≈ 0.61λ/NAill). Thus, as compared to such a Gaus-sian beam only one third of the particle temperature isreached. The amplitude of the aberration induced inter-ference pattern is determined by the numerical apertureof the detection lens as found in the experiment. Thelarger this detection aperture, the weaker the interfer-ence patterns get as the individual phase differences atdifferent detection angles average out (Fig. 1 right). Thisfinding confirms that the plane-wave optical theorem isnot applicable when collecting signals at finite detectionangle and focused illumination [18]. The only way to con-clude on the intensity distribution details in the scatter-ing experiment is thus to consider the finite detection an-gle. While this complex structure determines the shapeof the scattering intensity distribution, a contribution tothe photothermal signal is also expected [19, 20] but lessobvious.
We evaluate the photothermal signal as the differencebetween the probe scattering intensity distribution of
3
3x10⁻³
2
1
0
rel.
Sig
nal
250200150100500 T0 [K]
-6x10⁻⁴
-4
-2
0
2
rel.
Sig
nal
2001000 [K]T0
T0
n0
Δn
T(r) n(r)
r r
ri ni
T0
6x10⁻³
4
2
0
-2
rel.
PT
sign
al
2.01.00.0-1.0 zp [ m]
-6x10⁻³
-4
-2
0
2
4
6
rel.
PT
sign
al
-1.0 -0.5 0 0.5 1.0
zf [µm]
-1000
-500
0
500
1000
ext
rem
a lo
catio
n [n
m]
1.00.50-0.5-1.0
zf [µm]
a) b)
e)
c)
d)
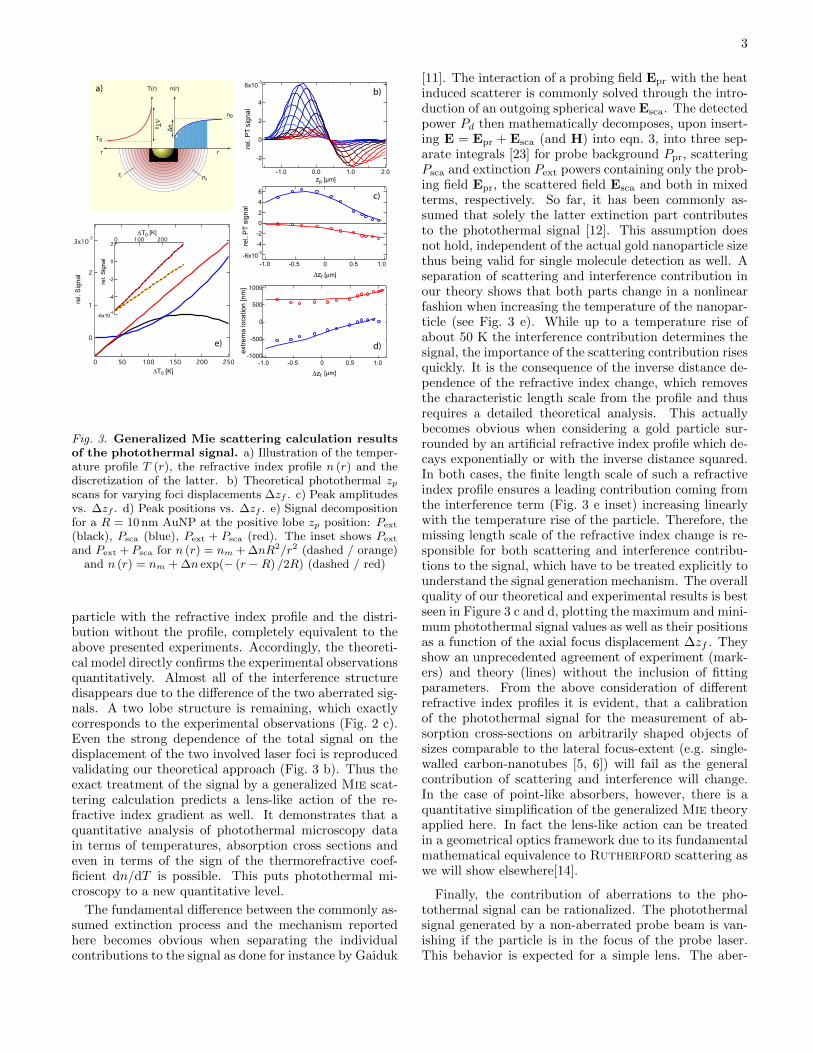
Fig. 3. Generalized Mie scattering calculation resultsof the photothermal signal. a) Illustration of the temper-ature profile T (r), the refractive index profile n (r) and thediscretization of the latter. b) Theoretical photothermal zpscans for varying foci displacements ∆zf . c) Peak amplitudesvs. ∆zf . d) Peak positions vs. ∆zf . e) Signal decompositionfor a R = 10 nm AuNP at the positive lobe zp position: Pext
(black), Psca (blue), Pext + Psca (red). The inset shows Pext
and Pext + Psca for n (r) = nm + ∆nR2/r2 (dashed / orange)and n (r) = nm + ∆n exp(− (r −R) /2R) (dashed / red)
particle with the refractive index profile and the distri-bution without the profile, completely equivalent to theabove presented experiments. Accordingly, the theoreti-cal model directly confirms the experimental observationsquantitatively. Almost all of the interference structuredisappears due to the difference of the two aberrated sig-nals. A two lobe structure is remaining, which exactlycorresponds to the experimental observations (Fig. 2 c).Even the strong dependence of the total signal on thedisplacement of the two involved laser foci is reproducedvalidating our theoretical approach (Fig. 3 b). Thus theexact treatment of the signal by a generalized Mie scat-tering calculation predicts a lens-like action of the re-fractive index gradient as well. It demonstrates that aquantitative analysis of photothermal microscopy datain terms of temperatures, absorption cross sections andeven in terms of the sign of the thermorefractive coef-ficient dn/dT is possible. This puts photothermal mi-croscopy to a new quantitative level.
The fundamental difference between the commonly as-sumed extinction process and the mechanism reportedhere becomes obvious when separating the individualcontributions to the signal as done for instance by Gaiduk
[11]. The interaction of a probing field Epr with the heatinduced scatterer is commonly solved through the intro-duction of an outgoing spherical wave Esca. The detectedpower Pd then mathematically decomposes, upon insert-ing E = Epr + Esca (and H) into eqn. 3, into three sep-arate integrals [23] for probe background Ppr, scatteringPsca and extinction Pext powers containing only the prob-ing field Epr, the scattered field Esca and both in mixedterms, respectively. So far, it has been commonly as-sumed that solely the latter extinction part contributesto the photothermal signal [12]. This assumption doesnot hold, independent of the actual gold nanoparticle sizethus being valid for single molecule detection as well. Aseparation of scattering and interference contribution inour theory shows that both parts change in a nonlinearfashion when increasing the temperature of the nanopar-ticle (see Fig. 3 e). While up to a temperature rise ofabout 50 K the interference contribution determines thesignal, the importance of the scattering contribution risesquickly. It is the consequence of the inverse distance de-pendence of the refractive index change, which removesthe characteristic length scale from the profile and thusrequires a detailed theoretical analysis. This actuallybecomes obvious when considering a gold particle sur-rounded by an artificial refractive index profile which de-cays exponentially or with the inverse distance squared.In both cases, the finite length scale of such a refractiveindex profile ensures a leading contribution coming fromthe interference term (Fig. 3 e inset) increasing linearlywith the temperature rise of the particle. Therefore, themissing length scale of the refractive index change is re-sponsible for both scattering and interference contribu-tions to the signal, which have to be treated explicitly tounderstand the signal generation mechanism. The overallquality of our theoretical and experimental results is bestseen in Figure 3 c and d, plotting the maximum and mini-mum photothermal signal values as well as their positionsas a function of the axial focus displacement ∆zf . Theyshow an unprecedented agreement of experiment (mark-ers) and theory (lines) without the inclusion of fittingparameters. From the above consideration of differentrefractive index profiles it is evident, that a calibrationof the photothermal signal for the measurement of ab-sorption cross-sections on arbitrarily shaped objects ofsizes comparable to the lateral focus-extent (e.g. single-walled carbon-nanotubes [5, 6]) will fail as the generalcontribution of scattering and interference will change.In the case of point-like absorbers, however, there is aquantitative simplification of the generalized Mie theoryapplied here. In fact the lens-like action can be treatedin a geometrical optics framework due to its fundamentalmathematical equivalence to Rutherford scattering aswe will show elsewhere[14].
Finally, the contribution of aberrations to the pho-tothermal signal can be rationalized. The photothermalsignal generated by a non-aberrated probe beam is van-ishing if the particle is in the focus of the probe laser.This behavior is expected for a simple lens. The aber-
4
calc
. abs
orpt
ion
at 6
35 n
m
zx zy
calc
. abs
orpt
ion
at 5
32 n
mzx zy
250200
150
100
50
0
P
[a.
u.]
abs
-1 0 1 2 zp [µm]
2x10⁻³
1
0
-1
-2
rel. PT S
ignal
250200
150
100
50
0
-1 0 1 2 zp [µm]
-3
-2
-1
0
1
rel. PT S
ignal
250200
150
100
50
0
-2 -1 0 1 2 zp [µm]
6x10⁻³
4
2
0
rel. PT S
ignal
x10-3
P
[a.
u.]
abs
P
[a.
u.]
abs
-2
-2
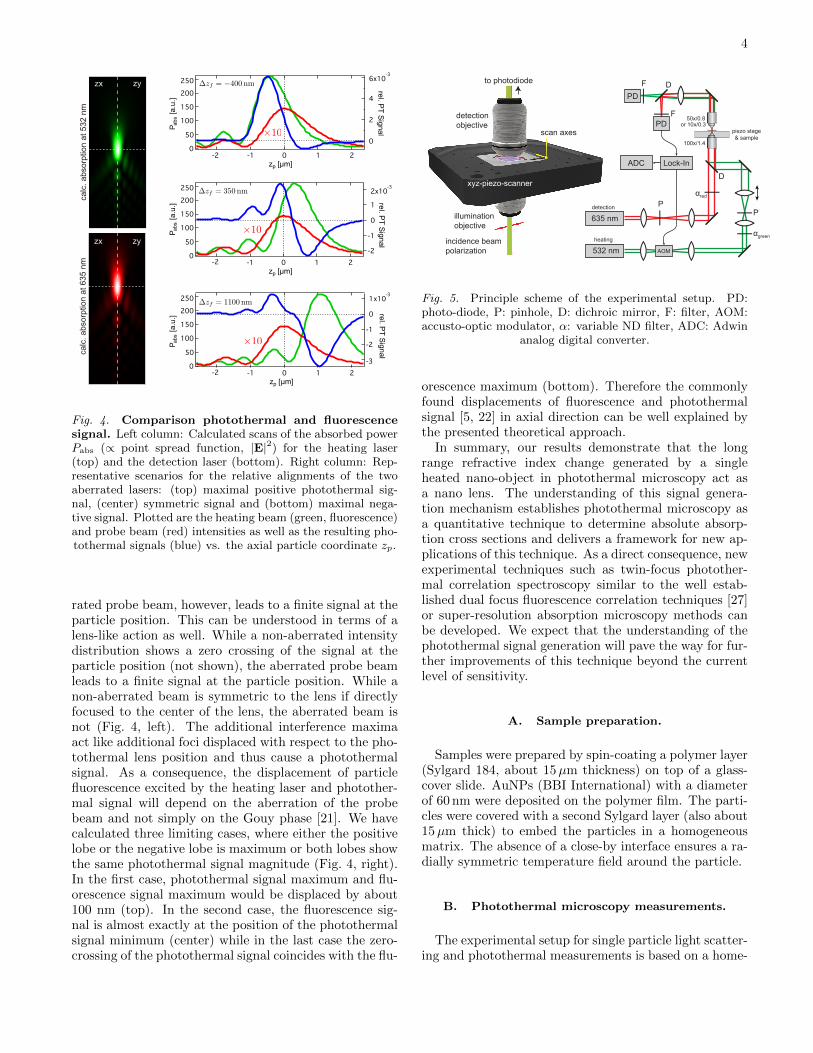
Fig. 4. Comparison photothermal and fluorescencesignal. Left column: Calculated scans of the absorbed powerPabs (∝ point spread function, |E|2) for the heating laser(top) and the detection laser (bottom). Right column: Rep-resentative scenarios for the relative alignments of the twoaberrated lasers: (top) maximal positive photothermal sig-nal, (center) symmetric signal and (bottom) maximal nega-tive signal. Plotted are the heating beam (green, fluorescence)and probe beam (red) intensities as well as the resulting pho-tothermal signals (blue) vs. the axial particle coordinate zp.
rated probe beam, however, leads to a finite signal at theparticle position. This can be understood in terms of alens-like action as well. While a non-aberrated intensitydistribution shows a zero crossing of the signal at theparticle position (not shown), the aberrated probe beamleads to a finite signal at the particle position. While anon-aberrated beam is symmetric to the lens if directlyfocused to the center of the lens, the aberrated beam isnot (Fig. 4, left). The additional interference maximaact like additional foci displaced with respect to the pho-tothermal lens position and thus cause a photothermalsignal. As a consequence, the displacement of particlefluorescence excited by the heating laser and photother-mal signal will depend on the aberration of the probebeam and not simply on the Gouy phase [21]. We havecalculated three limiting cases, where either the positivelobe or the negative lobe is maximum or both lobes showthe same photothermal signal magnitude (Fig. 4, right).In the first case, photothermal signal maximum and flu-orescence signal maximum would be displaced by about100 nm (top). In the second case, the fluorescence sig-nal is almost exactly at the position of the photothermalsignal minimum (center) while in the last case the zero-crossing of the photothermal signal coincides with the flu-
incidence beam polarization
scan axes
xyz-piezo-scanner
to photodiode
detection objective
illuminationobjective
532 nm
PD
PD
AOM
P
F
F
D
D
heating
piezo stage& sample
detection
50x/0.8
100x/1.4
αred
αgreen
635 nm
P
or 10x/0.3
Lock-InADC
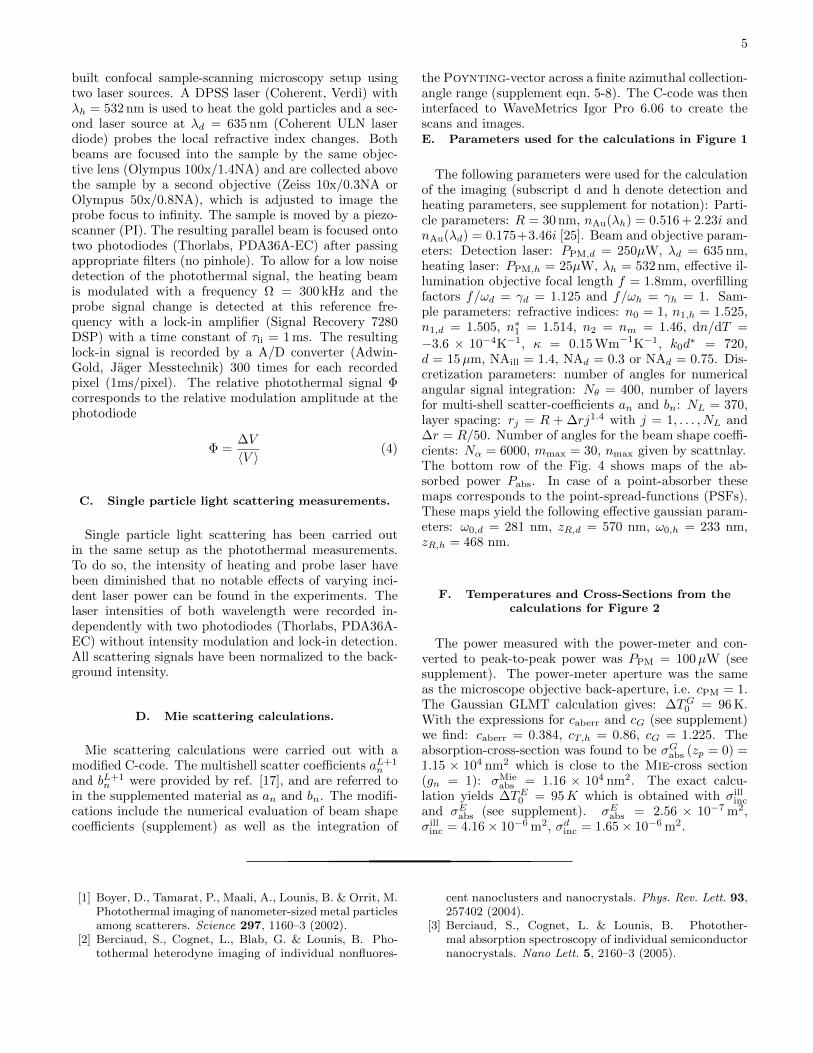
Fig. 5. Principle scheme of the experimental setup. PD:photo-diode, P: pinhole, D: dichroic mirror, F: filter, AOM:accusto-optic modulator, α: variable ND filter, ADC: Adwin
analog digital converter.
orescence maximum (bottom). Therefore the commonlyfound displacements of fluorescence and photothermalsignal [5, 22] in axial direction can be well explained bythe presented theoretical approach.
In summary, our results demonstrate that the longrange refractive index change generated by a singleheated nano-object in photothermal microscopy act asa nano lens. The understanding of this signal genera-tion mechanism establishes photothermal microscopy asa quantitative technique to determine absolute absorp-tion cross sections and delivers a framework for new ap-plications of this technique. As a direct consequence, newexperimental techniques such as twin-focus photother-mal correlation spectroscopy similar to the well estab-lished dual focus fluorescence correlation techniques [27]or super-resolution absorption microscopy methods canbe developed. We expect that the understanding of thephotothermal signal generation will pave the way for fur-ther improvements of this technique beyond the currentlevel of sensitivity.
A. Sample preparation.
Samples were prepared by spin-coating a polymer layer(Sylgard 184, about 15µm thickness) on top of a glass-cover slide. AuNPs (BBI International) with a diameterof 60 nm were deposited on the polymer film. The parti-cles were covered with a second Sylgard layer (also about15µm thick) to embed the particles in a homogeneousmatrix. The absence of a close-by interface ensures a ra-dially symmetric temperature field around the particle.
B. Photothermal microscopy measurements.
The experimental setup for single particle light scatter-ing and photothermal measurements is based on a home-
5
built confocal sample-scanning microscopy setup usingtwo laser sources. A DPSS laser (Coherent, Verdi) withλh = 532 nm is used to heat the gold particles and a sec-ond laser source at λd = 635 nm (Coherent ULN laserdiode) probes the local refractive index changes. Bothbeams are focused into the sample by the same objec-tive lens (Olympus 100x/1.4NA) and are collected abovethe sample by a second objective (Zeiss 10x/0.3NA orOlympus 50x/0.8NA), which is adjusted to image theprobe focus to infinity. The sample is moved by a piezo-scanner (PI). The resulting parallel beam is focused ontotwo photodiodes (Thorlabs, PDA36A-EC) after passingappropriate filters (no pinhole). To allow for a low noisedetection of the photothermal signal, the heating beamis modulated with a frequency Ω = 300 kHz and theprobe signal change is detected at this reference fre-quency with a lock-in amplifier (Signal Recovery 7280DSP) with a time constant of τli = 1 ms. The resultinglock-in signal is recorded by a A/D converter (Adwin-Gold, Jager Messtechnik) 300 times for each recordedpixel (1ms/pixel). The relative photothermal signal Φcorresponds to the relative modulation amplitude at thephotodiode
Φ =∆V
〈V 〉 (4)
C. Single particle light scattering measurements.
Single particle light scattering has been carried outin the same setup as the photothermal measurements.To do so, the intensity of heating and probe laser havebeen diminished that no notable effects of varying inci-dent laser power can be found in the experiments. Thelaser intensities of both wavelength were recorded in-dependently with two photodiodes (Thorlabs, PDA36A-EC) without intensity modulation and lock-in detection.All scattering signals have been normalized to the back-ground intensity.
D. Mie scattering calculations.
Mie scattering calculations were carried out with amodified C-code. The multishell scatter coefficients aL+1
n
and bL+1n were provided by ref. [17], and are referred to
in the supplemented material as an and bn. The modifi-cations include the numerical evaluation of beam shapecoefficients (supplement) as well as the integration of
the Poynting-vector across a finite azimuthal collection-angle range (supplement eqn. 5-8). The C-code was theninterfaced to WaveMetrics Igor Pro 6.06 to create thescans and images.E. Parameters used for the calculations in Figure 1
The following parameters were used for the calculationof the imaging (subscript d and h denote detection andheating parameters, see supplement for notation): Parti-cle parameters: R = 30 nm, nAu(λh) = 0.516 + 2.23i andnAu(λd) = 0.175+3.46i [25]. Beam and objective param-eters: Detection laser: PPM,d = 250µW, λd = 635 nm,heating laser: PPM,h = 25µW, λh = 532 nm, effective il-lumination objective focal length f = 1.8mm, overfillingfactors f/ωd = γd = 1.125 and f/ωh = γh = 1. Sam-ple parameters: refractive indices: n0 = 1, n1,h = 1.525,n1,d = 1.505, n∗1 = 1.514, n2 = nm = 1.46, dn/dT =
−3.6 × 10⁻⁴K−1, κ = 0.15 Wm−1K−1, k0d∗ = 720,
d = 15µm, NAill = 1.4, NAd = 0.3 or NAd = 0.75. Dis-cretization parameters: number of angles for numericalangular signal integration: Nθ = 400, number of layersfor multi-shell scatter-coefficients an and bn: NL = 370,layer spacing: rj = R + ∆rj1.4 with j = 1, . . . , NL and∆r = R/50. Number of angles for the beam shape coeffi-cients: Nα = 6000, mmax = 30, nmax given by scattnlay.The bottom row of the Fig. 4 shows maps of the ab-sorbed power Pabs. In case of a point-absorber thesemaps corresponds to the point-spread-functions (PSFs).These maps yield the following effective gaussian param-eters: ω0,d = 281 nm, zR,d = 570 nm, ω0,h = 233 nm,zR,h = 468 nm.
F. Temperatures and Cross-Sections from thecalculations for Figure 2
The power measured with the power-meter and con-verted to peak-to-peak power was PPM = 100µW (seesupplement). The power-meter aperture was the sameas the microscope objective back-aperture, i.e. cPM = 1.The Gaussian GLMT calculation gives: ∆TG0 = 96 K.With the expressions for caberr and cG (see supplement)we find: caberr = 0.384, cT,h = 0.86, cG = 1.225. Theabsorption-cross-section was found to be σGabs (zp = 0) =1.15 × 10⁴ nm2 which is close to the Mie-cross section(gn = 1): σMie
abs = 1.16 × 10⁴ nm2. The exact calcu-lation yields ∆TE0 = 95K which is obtained with σill
inc
and σEabs (see supplement). σEabs = 2.56 × 10⁻⁷ m2,σillinc = 4.16× 10⁻⁶ m2, σdinc = 1.65× 10⁻⁶ m2.
[1] Boyer, D., Tamarat, P., Maali, A., Lounis, B. & Orrit, M.Photothermal imaging of nanometer-sized metal particlesamong scatterers. Science 297, 1160–3 (2002).
[2] Berciaud, S., Cognet, L., Blab, G. & Lounis, B. Pho-tothermal heterodyne imaging of individual nonfluores-
cent nanoclusters and nanocrystals. Phys. Rev. Lett. 93,257402 (2004).
[3] Berciaud, S., Cognet, L. & Lounis, B. Photother-mal absorption spectroscopy of individual semiconductornanocrystals. Nano Lett. 5, 2160–3 (2005).
6
[4] Gaiduk, A., Yorulmaz, M., Ruijgrok, P. V. & Orrit, M.Room-temperature detection of a single molecule’s ab-sorption by photothermal contrast. Science 330, 353–356(2010).
[5] Giblin, J., Syed, M., Banning, M. T., Kuno, M. & Hart-land, G. Experimental determination of single CdSenanowire absorption cross sections through photothermalimaging. ACS Nano 4, 358–364 (2010).
[6] Berciaud, S., Cognet, L. & Lounis, B. Luminescence de-cay and the absorption cross section of individual single-walled carbon nanotubes. Phys. Rev. Lett. 101, 077402-1–077402-4 (2008).
[7] Rings, D., Schachoff, R., Selmke, M., Cichos, F. & Kroy,K. Hot Brownian motion. Phys. Rev. Lett. 105, 090604-1-090604-4 (2010).
[8] Wahnert, M., Radunz, R. & Cichos, F. Nanoscale dis-tance fluctuations probed by photothermal correlationspectroscopy. Proc. SPIE 7185, 71850V (2009).
[9] Octeau, V., Cognet, L. et al. Photothermal absorptioncorrelation spectroscopy. ACS Nano 3, 345–350 (2009).
[10] Radunz, R., Rings, D., Kroy, K. & Cichos, F. Hot Brown-ian particles and photothermal correlation spectroscopy.J. Phys. Chem. A (2009).
[11] Gaiduk, A., Ruijgrok, P. V., Yorulmaz, M. & Orrit, M.Detection limits in photothermal microscopy. Chem. Sci.1, 343–350 (2010).
[12] Berciaud, S., Lasne, D., Blab, G., Cognet, L. & Lou-nis, B. Photothermal heterodyne imaging of individualmetallic nanoparticles: Theory versus experiment. Phys.Rev. B 73, 045424 (2006).
[13] Selmke, M., Braun, M. & Cichos, F. in preparation N.N.(2011).
[14] Selmke, M., Braun, M. & Cichos, F. Photonic Rutherfordscattering. in preparation (2011).
[15] Neves, A. A. R. et al. Axial optical trapping efficiencythrough a dielectric interface. Phys. Rev. E 76, 061917-1-061917-8 (2007).
[16] Nasse, M. J. & Woehl, J. C. Realistic modeling of the illu-mination point spread function in confocal scanning op-tical microscopy. J. Opt. Soc. Am. A 27, 295–302 (2010).
[17] Pena, O. & Pal, U. Scattering of electromagnetic radia-tion by a multilayered sphere. Comput. Phys. Commun.180, 2348–2354 (2009).
[18] Gouesbet, G., Letellier, C., Grehan, G. & Hodges, J. T.Generalized optical theorem for on-axis Gaussian beams.Opt. Commun. 125, 137–157 (1996).
[19] Jurgensen, F. & Schroer, W. Studies on the diffractionimage of a thermal lens. Appl. Opt. 34, 41–50 (1995).
[20] Bialkowski, S. E. Photothermal Spectroscopy Methods forChemical Analysis (John Wiley and Sons, Inc., 1996).
[21] Hwang, J. & Moerner, W. E. Interferometry of a sin-gle nanoparticle using the Gouy phase of a focused laserbeam. Opt. Commun. 280, 487–491 (2007).
[22] Gaiduk, A., Ruijgrok, P. V., Yorulmaz, M. & Orrit, M.Making gold nanoparticles fluorescent for simultaneousabsorption and fluorescence detection on the single par-ticle level. Phys. Chem. Chem. Phys. (2010).
[23] Berg, M. J., Sorensen, C. M. & Chakrabarti, A. Extinc-tion and the optical theorem. part i. single particles. J.Opt. Soc. Am. A 25, 1504–1513 (2008).
[24] Gouesbet, G., Grehan, G. & Maheu, B. Scattering of aGaussian-beam by a Mie scatter center using a Bromwichformalism. J. Optics-Nouvelle Rev. D Opt. 16, 83–93(1985).
[25] Johnson, P. B. & Christy, R. W. Optical constants of thenoble metals. Phys. Rev. B 6, 4370–4379 (1972).
[26] Baryshevskii, V. G., Feranchuk, I. D. & Kats, P. B. Regu-larization of the coulomb scattering problem. Phys. Rev.A 70, 052701-1–052701-15 (2004).
[27] Dertinger, T. et al. Two-focus fluorescence correlationspectroscopy: A new tool for accurate and absolute dif-fusion measurements. Chem. Phys. Chem. 8, 433–443(2007).
Supplementary Material
Markus Selmke, Marco Braun, Frank Cichos
May 20, 2011
1 Generalized Lorenz Mie Theory
The Generalized LORENZ-MIE Theory (GLMT) [1, 2] providesthe total Electromagnetic fields E t and H t which solve thesituation of the incident electric field (denoted by E i and H i
in the absence of any scatterer) upon a spherically symmet-ric (possibly multilayered) scattering center. The applica-tion of the BROMWHICH-formalism to this situation was in-troduced by G. Gouesbet et al. and is here generalized forthe purpose of finite collection-angle flux-integration. Thefield expressions, POYNTING-vector expressions and far-fieldlimits of the appropriate Bessel-functions involved werechecked and adopted from [2]. For the calculation of thehot-particle scattering including the refractive index profile,the scattering coefficents a n and bn were exchanged for themultilayer coefficients a L+1
n and b L+1n [8].
2 Integrated Fluxes
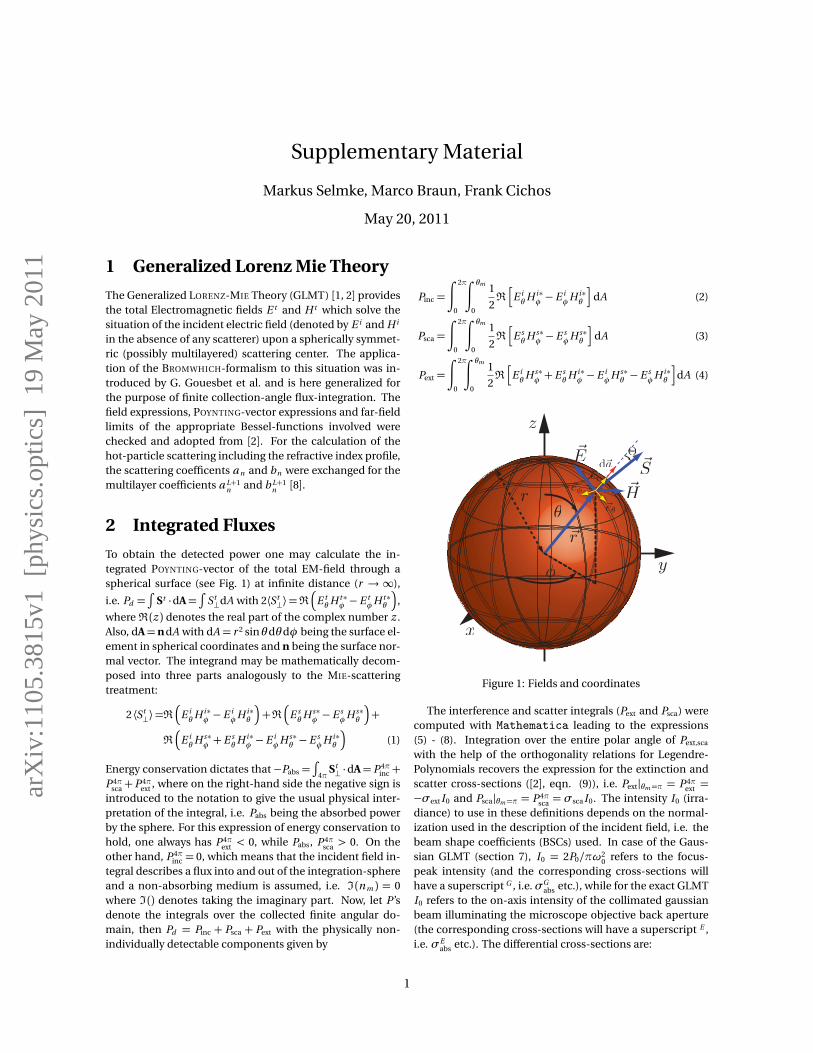
To obtain the detected power one may calculate the in-tegrated POYNTING-vector of the total EM-field through aspherical surface (see Fig. 1) at infinite distance (r → ∞),
i.e. Pd =∫
St ·dA=∫
St⊥dA with 2⟨St
⊥⟩=R
E tθH t ∗
φ −E tφH t ∗
θ
,
where R (z ) denotes the real part of the complex number z .Also, dA=n dA with dA = r 2 sinθdθdφ being the surface el-ement in spherical coordinates and n being the surface nor-mal vector. The integrand may be mathematically decom-posed into three parts analogously to the MIE-scatteringtreatment:
2 ⟨St⊥⟩=R
E iθH i∗
φ −E iφH i∗
θ
+R
E sθH s∗
φ −E sφH s∗
θ
+
R
E iθH s∗
φ +E sθH i∗
φ −E iφH s∗
θ −E sφH i∗
θ
(1)
Energy conservation dictates that −Pabs =∫
4πSt⊥ ·dA= P4π
inc +P4π
sca +P4πext , where on the right-hand side the negative sign is
introduced to the notation to give the usual physical inter-pretation of the integral, i.e. Pabs being the absorbed powerby the sphere. For this expression of energy conservation tohold, one always has P4π
ext < 0, while Pabs, P4πsca > 0. On the
other hand, P4πinc = 0, which means that the incident field in-
tegral describes a flux into and out of the integration-sphereand a non-absorbing medium is assumed, i.e. I (n m ) = 0where I () denotes taking the imaginary part. Now, let P’sdenote the integrals over the collected finite angular do-main, then Pd = Pinc + Psca + Pext with the physically non-individually detectable components given by
Pinc =
∫ 2π
0
∫ θm
0
1
2Rh
E iθH i∗
φ −E iφH i∗
θ
idA (2)
Psca =
∫ 2π
0
∫ θm
0
1
2Rh
E sθH s∗
φ −E sφH s∗
θ
idA (3)
Pext =
∫ 2π
0
∫ θm
0
1
2Rh
E iθH s∗
φ +E sθH i∗
φ −E iφH s∗
θ −E sφH i∗
θ
idA (4)
Figure 1: Fields and coordinates
The interference and scatter integrals (Pext and Psca) werecomputed with Mathematica leading to the expressions(5) - (8). Integration over the entire polar angle of Pext,sca
with the help of the orthogonality relations for Legendre-Polynomials recovers the expression for the extinction andscatter cross-sections ([2], eqn. (9)), i.e. Pext|θm=π = P4π
ext =−σextI0 and Psca|θm=π = P4π
sca = σscaI0. The intensity I0 (irra-diance) to use in these definitions depends on the normal-ization used in the description of the incident field, i.e. thebeam shape coefficients (BSCs) used. In case of the Gaus-sian GLMT (section 7), I0 = 2P0/πω2
0 refers to the focus-peak intensity (and the corresponding cross-sections willhave a superscript G , i.e.σG
abs etc.), while for the exact GLMTI0 refers to the on-axis intensity of the collimated gaussianbeam illuminating the microscope objective back aperture(the corresponding cross-sections will have a superscript E ,i.e. σE
abs etc.). The differential cross-sections are:
1
arX
iv:1
105.
3815
v1 [
phys
ics.
optic
s] 1
9 M
ay 2
011
3 EXACT BEAM SHAPE COEFFICIENTS 2
σsca (θm ) =σsca,1 (θm )+σsca,2 (θm ) (5)
σsca, 12(θm ) =
2π
k 2
∫ θm
0
∞∑n=1
n∑m=−n
X 1
2
m
n
∞∑
n ′=n ′|m |
X ∗1
2
m
n ′sinθdθ
σext (θm ) =−Rσext,1 (θm )+σext,2 (θm )
(6)
σext, 12(θm ) =
2π
k 2
∫ θm
0
∞∑n=1
n∑m=−n
Y 1
2
m
n
∞∑
n ′=n ′|m |
X ∗1
2
m
n ′sinθdθ
with 2π/k 2 = λ2d /
2πn 2m
and n ′|m | =max(1, |m |). These
expressions have been evaluated numerically. The matrixelements
M i ,j
m
nwill be introduced for convenience and
calculated for each angle θ within the sums (and prior totheir evaluation) which helped to speed up the numericalcalculations:
Y 1
2(θ )m
n= Nn
i g m
n ,T E
g mn ,T M
τ|m |n +m g m
n ,T M
i m g mn ,T E
Π|m |n
(7)
=
M 1,12,1(θ )m
n+
M 1,22,2(θ )m
n
X 1
2(θ )m
n= Nn
a n
m g mn ,T MΠ
|m |n
g mn ,T Mτ
|m |n
+bni g m
n ,T Eτ|m |n
i m g mn ,T EΠ|m |n
(8)
= a n
M 1,2
2,1(θ )m
n+bn
M 1,1
2,2(θ )m
n
where i =p−1 and Nn = [2n +1]/ [n (n +1)]. The an-
gular functions Π|m |n and τmn are defined in section 4. The
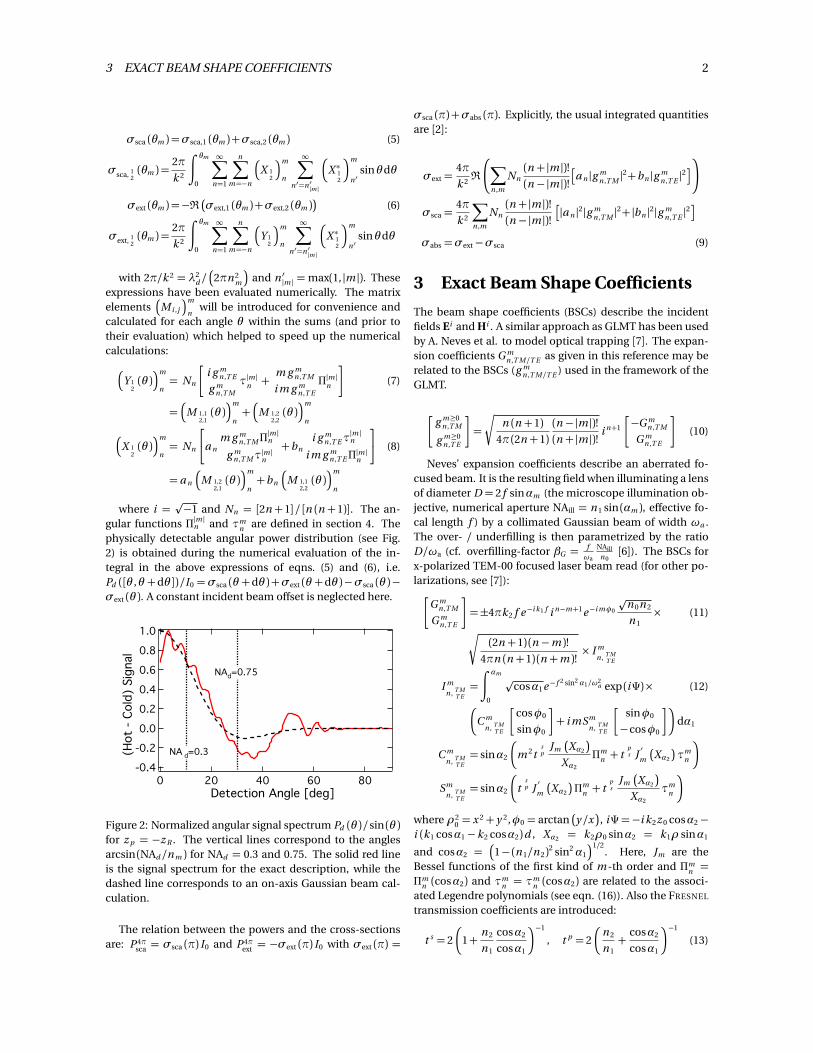
physically detectable angular power distribution (see Fig.2) is obtained during the numerical evaluation of the in-tegral in the above expressions of eqns. (5) and (6), i.e.Pd ([θ ,θ +dθ ])/I0 =σsca (θ +dθ ) +σext (θ +dθ )−σsca (θ )−σext (θ ). A constant incident beam offset is neglected here.
1.0
0.8
0.6
0.4
0.2
0.0
-0.2
-0.4
(Hot
- Cold
) Sig
nal
806040200Detection Angle [deg]
NAd=0.75
NA d=0.3
Figure 2: Normalized angular signal spectrum Pd (θ )/sin (θ )for z p = −z R . The vertical lines correspond to the anglesarcsin (NAd /n m ) for NAd = 0.3 and 0.75. The solid red lineis the signal spectrum for the exact description, while thedashed line corresponds to an on-axis Gaussian beam cal-culation.
The relation between the powers and the cross-sectionsare: P4π
sca = σsca (π) I0 and P4πext = −σext (π) I0 with σext (π) =
σsca (π) +σabs (π). Explicitly, the usual integrated quantitiesare [2]:
σext =4π
k 2R
∑n ,m
Nn(n + |m |)!(n − |m |)!
a n |g m
n ,T M |2+bn |g mn ,T E |2
!
σsca =4π
k 2
∑n ,m
Nn(n + |m |)!(n − |m |)!
|a n |2|g mn ,T M |2+ |bn |2|g m
n ,T E |2
σabs =σext−σsca (9)
3 Exact Beam Shape Coefficients
The beam shape coefficients (BSCs) describe the incidentfields Ei and Hi . A similar approach as GLMT has been usedby A. Neves et al. to model optical trapping [7]. The expan-sion coefficients G m
n ,T M/T E as given in this reference may berelated to the BSCs (g m
n ,T M/T E ) used in the framework of theGLMT.
g m≥0
n ,T M
g m≥0n ,T E
=
rn (n +1)
4π (2n +1)(n − |m |)!(n + |m |)! i n+1
−G mn ,T M
G mn ,T E
(10)
Neves’ expansion coefficients describe an aberrated fo-cused beam. It is the resulting field when illuminating a lensof diameter D = 2 f sinαm (the microscope illumination ob-jective, numerical aperture NAill = n 1 sin (αm ), effective fo-cal length f ) by a collimated Gaussian beam of width ωa .The over- / underfilling is then parametrized by the ratioD/ωa (cf. overfilling-factor βG =
fωa
NAilln0[6]). The BSCs for
x-polarized TEM-00 focused laser beam read (for other po-larizations, see [7]):
G mn ,T M
G mn ,T E
=±4πk2 f e−i k1 f i n−m+1e−i mφ0
pn 0n 2
n 1× (11)
r(2n +1) (n −m )!
4πn (n +1) (n +m )!× I m
n , T MT E
I mn , T M
T E=
∫ αm
0
pcosα1e− f 2 sin2 α1/ω2
a exp (iΨ)× (12)
C m
n , T MT E
cosφ0
sinφ0
+ i mSm
n , T MT E
sinφ0
−cosφ0
dα1
C mn , T M
T E= sinα2
m 2t
sp
Jm
Xα2
Xα2
Πmn + t
ps J
′m
Xα2
τm
n
Smn , T M
T E= sinα2
t
sp J
′m
Xα2
Πm
n + tps
Jm
Xα2
Xα2
τmn
where ρ20 = x 2+ y 2,φ0 = arctan
y /x
, iΨ=−i k2z 0 cosα2−
i (k1 cosα1−k2 cosα2)d , Xα2 = k2ρ0 sinα2 = k1ρ sinα1
and cosα2 =
1− (n 1/n 2)2 sin2α1
1/2. Here, Jm are the
Bessel functions of the first kind of m -th order and Πmn =
Πmn (cosα2) and τm
n = τmn (cosα2) are related to the associ-
ated Legendre polynomials (see eqn. (16)). Also the FRESNEL
transmission coefficients are introduced:
t s = 2
1+
n 2
n 1
cosα2
cosα1
−1
, t p = 2
n 2
n 1+
cosα2
cosα1
−1
(13)
4 SPECIAL FUNCTIONS 3
integrationsphere
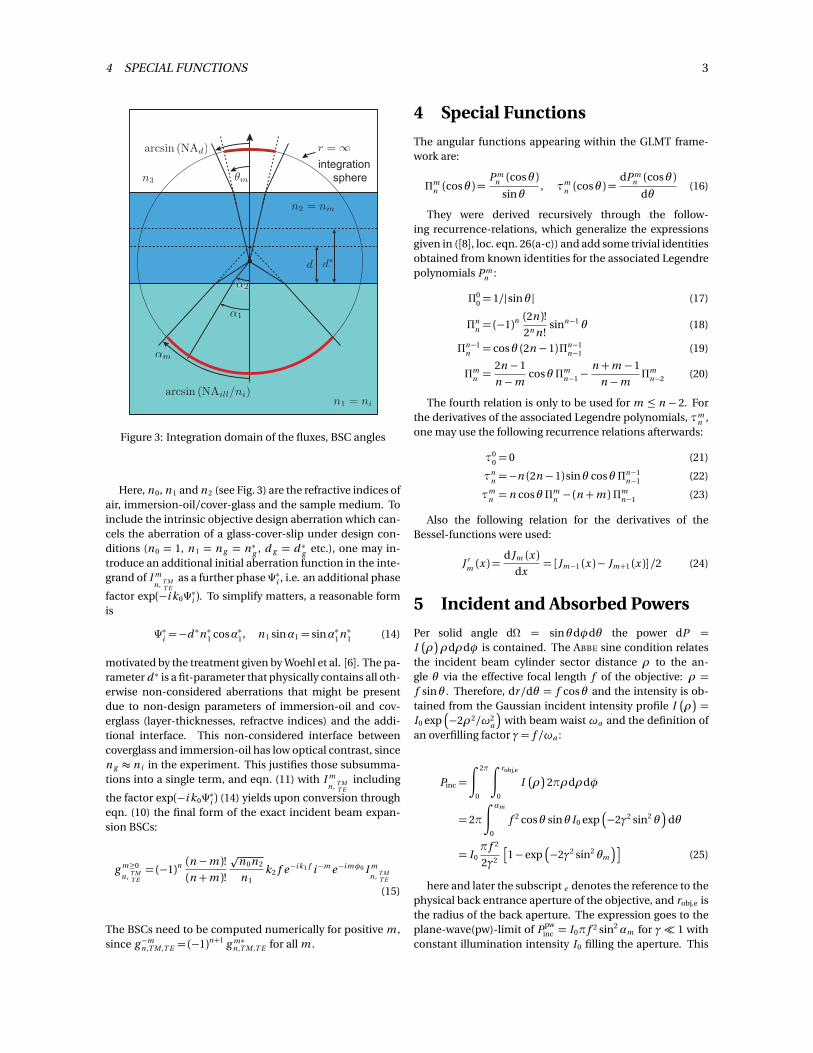
Figure 3: Integration domain of the fluxes, BSC angles
Here, n 0, n 1 and n 2 (see Fig. 3) are the refractive indices ofair, immersion-oil/cover-glass and the sample medium. Toinclude the intrinsic objective design aberration which can-cels the aberration of a glass-cover-slip under design con-ditions (n 0 = 1, n 1 = n g = n ∗g , d g = d ∗g etc.), one may in-troduce an additional initial aberration function in the inte-grand of I m
n , T MT E
as a further phaseΨ∗i , i.e. an additional phase
factor exp(−i k0Ψ∗i ). To simplify matters, a reasonable formis
Ψ∗i =−d ∗n ∗1 cosα∗1, n 1 sinα1 = sinα∗1n ∗1 (14)
motivated by the treatment given by Woehl et al. [6]. The pa-rameter d ∗ is a fit-parameter that physically contains all oth-erwise non-considered aberrations that might be presentdue to non-design parameters of immersion-oil and cov-erglass (layer-thicknesses, refractve indices) and the addi-tional interface. This non-considered interface betweencoverglass and immersion-oil has low optical contrast, sincen g ≈ n i in the experiment. This justifies those subsumma-tions into a single term, and eqn. (11) with I m
n , T MT E
including
the factor exp(−i k0Ψ∗i ) (14) yields upon conversion througheqn. (10) the final form of the exact incident beam expan-sion BSCs:
g m≥0
n , T MT E
= (−1)n(n −m )!(n +m )!
pn 0n 2
n 1k2 f e−i k1 f i−m e−i mφ0 I m
n , T MT E
(15)
The BSCs need to be computed numerically for positive m ,since g −m
n ,T M ,T E = (−1)n+1 g m∗n ,T M ,T E for all m .
4 Special Functions
The angular functions appearing within the GLMT frame-work are:
Πmn (cosθ ) =
Pmn (cosθ )
sinθ, τm
n (cosθ ) =dPm
n (cosθ )
dθ(16)
They were derived recursively through the follow-ing recurrence-relations, which generalize the expressionsgiven in ([8], loc. eqn. 26(a-c)) and add some trivial identitiesobtained from known identities for the associated Legendrepolynomials Pm
n :
Π00 = 1/|sinθ | (17)
Πnn = (−1)n
(2n )!2n n !
sinn−1 θ (18)
Πn−1n = cosθ (2n −1)Πn−1
n−1 (19)
Πmn =
2n −1
n −mcosθ Πm
n−1−n +m −1
n −mΠm
n−2 (20)
The fourth relation is only to be used for m ≤ n − 2. Forthe derivatives of the associated Legendre polynomials, τm
n ,one may use the following recurrence relations afterwards:
τ00 = 0 (21)
τnn =−n (2n −1)sinθ cosθ Πn−1
n−1 (22)
τmn = n cosθ Πm
n − (n +m ) Πmn−1 (23)
Also the following relation for the derivatives of theBessel-functions were used:
J ′m (x ) =dJm (x )
dx= [Jm−1 (x )− Jm+1 (x )]/2 (24)
5 Incident and Absorbed Powers
Per solid angle dΩ = sinθdφdθ the power dP =Iρρdρdφ is contained. The ABBE sine condition relates
the incident beam cylinder sector distance ρ to the an-gle θ via the effective focal length f of the objective: ρ =f sinθ . Therefore, dr /dθ = f cosθ and the intensity is ob-tained from the Gaussian incident intensity profile I
ρ=
I0 exp−2ρ2/ω2
a
with beam waistωa and the definition of
an overfilling factor γ= f /ωa :
Pinc =
∫ 2π
0
∫ robj,e
0
Iρ
2πρdρdφ
= 2π
∫ αm
0
f 2 cosθ sinθ I0 exp−2γ2 sin2 θ
dθ
= I0π f 2
2γ2
1−exp
−2γ2 sin2 θm
(25)
here and later the subscript e denotes the reference to thephysical back entrance aperture of the objective, and robj,e isthe radius of the back aperture. The expression goes to theplane-wave(pw)-limit of Ppw
inc = I0π f 2 sin2αm for γ 1 withconstant illumination intensity I0 filling the aperture. This
6 THE PHOTOTHERMAL SIGNAL 4
limit was considered in [4]. The general expression (25) maybe used to obtain an estimate of the detected power withouta particle, i.e. for normalization (see next section). For heat-ing estimates, the incident power on the particle is needed,and hence αm = arcsin (NAill/n 1) is taken, while for the de-tection background intensity αm = θm = arcsin (NAd /n 2)has to be used (assuming θm < αm ). Analogously to thecross-sections, we may define the following two quantities:
σillinc = P ill
inc/I0, αm = arcsin (NAill/n 1) (26)
σdinc = Pd
inc/I0, αm = arcsin (NAd /n 2) (27)
Also, σabs = Pabs/I0 and thus σabs/σillinc = Pabs/P ill
inc whichmay be used to calculate absorbed powers via
Pabs = P illinc
σabs
σillinc
(28)
In case of a power-meter detection area radius rPM deviat-ing from the objective back-aperture (robj,e), a further factorto be considered is:
cPM =P ill
inc
PPMinc
=
∫ robj,e
0
Iρ
2πρdρ
 ∫ rPM
0
Iρ
2πρdρ
=1−exp
−2r 2
obj,e/ω2a,e
1−exp−2r 2
PM/ω2a,e
(29)
Given an aperture radius robj,e and beam-waistωa ,e of theincident beam we may relate these parameters to the ef-fective lens parameters via robj = f sinθm = f NAill/n 1 androbj,e/ωa,e = robj/ωa, such that γ =
robj,e
ωa,e
n1NAill
. A further factor
of cT,h = 0.86 or cT,d = 0.83 for 532 nm (subscript h) or 635nm (supscript d ) wavelength accounts for the transmissionof the used objective (Olympus, UPlanSApo 100XO). Heatingmay thus be computed via
∆T0 =σλhabs
σillinc
cT,λh cPMPPM
4πκR. (30)
To connect the exact with an approximate Gaussian cal-culation we note the following. The absorbed power Pabs =I0σ
Gabs may be obtained with the help of the gaussian GLMT
absorption cross-section σGabs. The total power P total
inc , whichis to be used in the Gaussian approximation in order to com-pute the peak intensity via I0 = 2P total
inc /πω2
0
, reads
P totalinc = cT,λh cG caberrcPMPPM
inc , (31)
wherein the factors cG , caberr have the following meaning:
cG =P total
inc
Pobjinc
=
∫ ∞
0
Iρ
2πρdρ
 ∫ robj,e
0
Iρ
2πρdρ (32)
=
1−exp
−2r 2obj,e
ω2a ,e
!−1
=
1−exp
−2γ2NA2
n 21
−1
.
For γ = 1 and n 1 = 1.46 and NAill = 1.4 the coefficienttakes the value cG = 1.225. Aberrations may be included byintroducing an intensity scaling factor. This factor may be
obtained by considering in the exact GLMT z p -scan of σEabs
for the aberrated case and for the un-aberrated case andconsidering the peak-ratio. Alternatively, it may be equallywell obtained by a PSF analysis according to [6].
caberr =max
Paberr
abs
max
Punaberrabs
= maxσE,aberr
abs
maxσE,unaberr
abs
(33)
This means, that the following absorbed powers can becompared and used to calculate the temperature rise in-duced via∆T0 = Pabs/ (4πκR):
Gaussian: PGabs = cT,λh cG caberr
2cPMPPM
πω20
σGabs (34)
Exact: P Eabs = cT,λh cPMPPM
σEabs
σillinc
(35)
6 The Photothermal Signal
A normalization is needed in order to define the relativephotothermal signal (eqn. 40). A quantity having the unitsof an area and being proportional to the background powerhas been introduced for that purpose: σd
inc. For the ex-act beam, σd
inc from eqn. (27) and (25) should be used.For a Gaussian beam (on-axis) one may calculate the inte-grated flux of the collected beam directly, i.e.
∫Si · da with
2Si⊥ = R
hE iθH i∗
φ −E iφH i∗
θ
i/2. The result may be written as
a Cauchy-sum σdinc =
π2k 2
∑∞n=1σ
dinc,n with summands σd
inc,n
given by:
σdinc,n =
n∑m=1
Nm g m Nn−m+1 g ∗n−m+1
∫ θm
0
(36)
ΣmΣn−m+1− (−1)n∆m∆n−m+1
sinθdθ
with∆n ≡Πn−τn andΣn ≡Πn+τn . To ensure numericalstability for small angles, a direct recursive determination of∆n ≡Πn −τn was used [5]:
∆0 =0, ∆1 = 1− cosθ , ∆2 = 3+3 cosθ −6 cos2 θ (37)
∆n =2n −1
(n −1)3[1+n (n −1)cosθ ]∆n−1− n 3
(n −1)3∆n−2 (38)
The relative photothermal signal may be calculatedquantitatively and compared to experimental values by con-sidering relative signals, i.e. the ratio of the time-varyingpower, which is the photothermal signal S, and the largeconstant power PPD detected i.e. on a photodiode (voltageVPD):
Φ=∆PPD
PPD=
PPD, hot−PPD, cold
PPD, cold≈ ∆σext+∆σsca
σdinc
(39)
=(σsca+σext) |∆T0(Ph ,Pd )− (σsca+σext) |∆T0(Ph=0,Pd )
σdinc
z p=0
(40)
REFERENCES 5
In a modulated heating laser beam usually the effectiveheating power PPM ,eff = PPM /2 is detected by a power-meter(PPM being the peak-to-peak power used for calculationsand static experiments), and furthermore a lock-in amplifierthat is common to these experiments outputs a photother-mal (rms, root-mean-squared) voltage V rms
PT that is related tothe peak-to-peak voltage via V rms
PT =V ppPT /
2p
2
. Therefore,
Φ=∆PPD
PPD,cold
PPM
= 2p
2V rms
PT
VPD. (41)
7 Gaussian Beam Shape Coeffi-cients
While the implementation of an off-axis beam according to[3] may be used to generate images akin to Fig. 1 of thearticle, the aberration-caused details are naturally absentin these calculations. Considerably easier than the off-axisscattering is the computation of the signal for a particle illu-minated on-axis by a focused Gaussian beam. In that case,the double and triple sums simplify and one may utilize themodified local approximation (MLA, [9]):
g n
s ,γ=Q exp
−Qs 2 (n −1) (n +2)
exp
iγs−1/2
, (42)
where Q =
1+ i sγ−1 with the beam-confinement factor
s defined through s = ω0/ (2z R ) = 1/kω0, i.e. the ratio oflateral to axial extent of the beam focus, and a defocussingparameter γ = 2z p/ω0. z p describes the axial position ofthe beam-focus relative to the center of the scatterer, z p be-ing the displacement of the particle relative to the beam-waist: z p < 0 corresponds to the situation where the focusis between the particle and the collecting objective. TheRAYLEIGH-range of the Gaussian beam is z R = n mπω2
0/λ
and the beam waist is ω0. The wave-vector is given by k =2πn m /λ with n m being the refractive index of the particle-embedding medium far away from it. The results expressedas cross-section in any forward/backward angular domainare:
σsca (θm ) =π
k 2
∫ θm
0
|S1 (θ ) |2+ |S2 (θ ) |2
sinθdθ (43)
σext (θm ) =−πk 2
∫ θm
0
[R (M )R (S1+S2) +
I (M ) I (S1+S2)]sinθdθ (44)
M (θ ) =∞∑
n=1
[Πn (cosθ )+τn (cosθ )] g n Nn (45)
The usual full-π-integrated quantities are
σsca =2π
k 2
∞∑n=1
(2n +1) |g n |2|a n |2+ |bn |2
(46)
σext =2π
k 2
∞∑n=1
(2n +1) |g n |2 R (a n +bn ) (47)
σabs =σext−σsca. (48)
References
[1] G. Gouesbet, G. Grehan, and B. Maheu. Scatteringof a gaussian-beam by a mie scatter center using abromwich formalism. Journal of Optics-Nouvelle RevueD Optique, 16(2):83–93, 1985.
[2] G. Gouesbet, B. Maheu, and G. Grehan. Light-scatteringfrom a sphere arbitrarily located in a gaussian-beam,using a bromwich formulation. J. Opt. Soc. Am. A,5(9):1427–1443, 1988.
[3] G. Gouesbet K.F. Ren, G. Grehan. Localized approxima-tion of generalized lorenz-mie theory - faster algorithmfor computations of beam shape coefficients, g(m)n.Particle & Particle Systems Characterization, 9(2):144–150, 1992.
[4] J. Lerme, G. Bachelier, and P. Billaud et al. Optical re-sponse of a single spherical particle in a tightly focusedlight beam: application to the spatial modulation spec-troscopy technique. J. Opt. Soc. Am. A, 25(2):493–514,2008.
[5] G. H. Meeten. Computation of s1-s2 in mie scattering-theory. J. Phys. D: Appl. Phys., 17(7):L89–L91, 1984.
[6] M. J. Nasse and J. C. Woehl. Realistic modeling of the il-lumination point spread function in confocal scanningoptical microscopy. J. Opt. Soc. Am. A, 27(2):295–302,2010.
[7] A. A. R. Neves, A. Fontes, and C. L. Cesar et al. Axial op-tical trapping efficiency through a dielectric interface.Phys. Rev. E, 76(6):061917-1–061917-8, 2007.
[8] O. Pena and U. Pal. Scattering of electromagnetic radia-tion by a multilayered sphere. Comput. Phys. Commun.,180(11):2348–2354, 2009.
[9] G. Gouesbet, J. A. Lock, and G. Grehan. Partial-wave rep-resentations of laser-beams for use in light-scatteringcalculations. Appl. Opt., 34(12):2133–2143, 1995.