Microstructural defects in nanocrystalline iron probed by x-ray-absorption spectroscopy
Upload
independentCategory
view
0download
0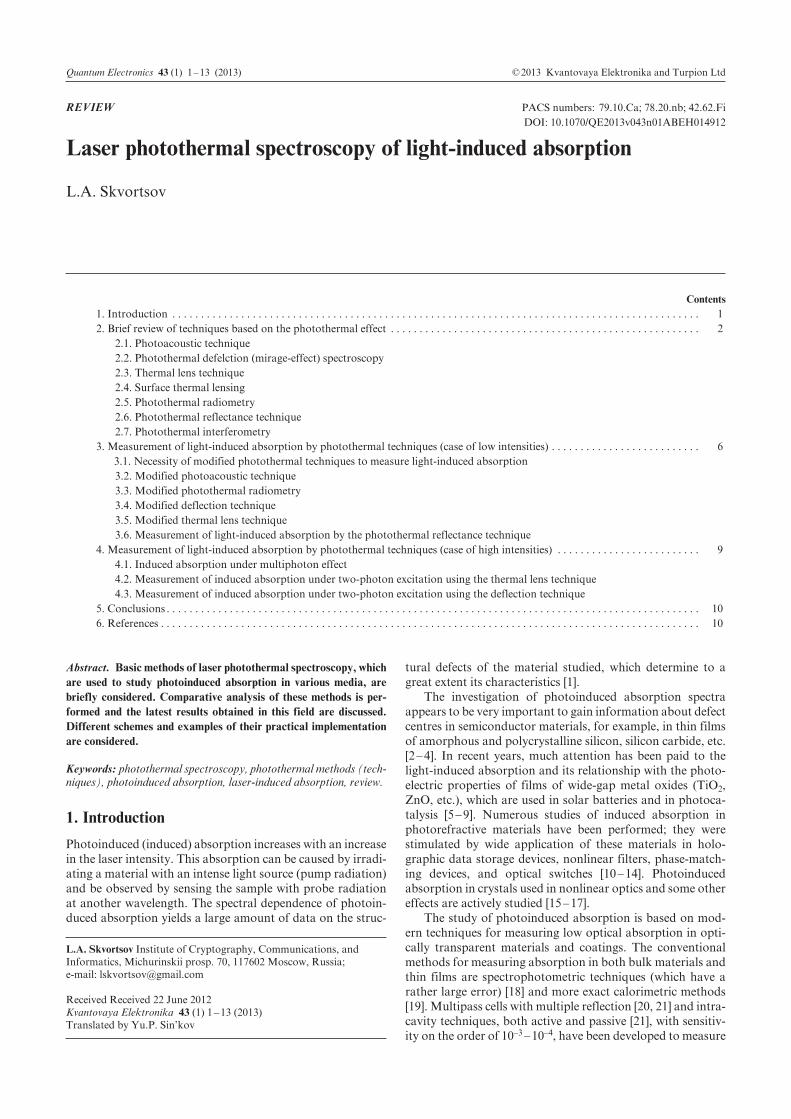
Quantum Electronics 43 (1) 1 – 13 (2013) © 2013 Kvantovaya Elektronika and Turpion Ltd
Abstract. Basic methods of laser photothermal spectroscopy, which are used to study photoinduced absorption in various media, are briefly considered. Comparative analysis of these methods is per-formed and the latest results obtained in this field are discussed. Different schemes and examples of their practical implementation are considered.
Keywords: photothermal spectroscopy, photothermal methods (tech-niques), photoinduced absorption, laser-induced absorption, review.
1. Introduction
Photoinduced (induced) absorption increases with an increase in the laser intensity. This absorption can be caused by irradi-ating a material with an intense light source (pump radiation) and be observed by sensing the sample with probe radiation at another wavelength. The spectral dependence of photoin-duced absorption yields a large amount of data on the struc-
tural defects of the material studied, which determine to a great extent its characteristics [1].
The investigation of photoinduced absorption spectra appears to be very important to gain information about defect centres in semiconductor materials, for example, in thin films of amorphous and polycrystalline silicon, silicon carbide, etc. [2 – 4]. In recent years, much attention has been paid to the light-induced absorption and its relationship with the photo-electric properties of films of wide-gap metal oxides (TiO2, ZnO, etc.), which are used in solar batteries and in photoca-talysis [5 – 9]. Numerous studies of induced absorption in photorefractive materials have been performed; they were stimulated by wide application of these materials in holo-graphic data storage devices, nonlinear filters, phase-match-ing devices, and optical switches [10 – 14]. Photoinduced absorption in crystals used in nonlinear optics and some other effects are actively studied [15 – 17].
The study of photoinduced absorption is based on mod-ern techniques for measuring low optical absorption in opti-cally transparent materials and coatings. The conventional methods for measuring absorption in both bulk materials and thin films are spectrophotometric techniques (which have a rather large error) [18] and more exact calorimetric methods [19]. Multipass cells with multiple reflection [20, 21] and intra-cavity techniques, both active and passive [21], with sensitiv-ity on the order of 10–3 – 10–4, have been developed to measure
Laser photothermal spectroscopy of light-induced absorption
L.A. Skvortsov
L.A. Skvortsov Institute of Cryptography, Communications, and Informatics, Michurinskii prosp. 70, 117602 Moscow, Russia; e-mail: [email protected] Received Received 22 June 2012 Kvantovaya Elektronika 43 (1) 1 – 13 (2013) Translated by Yu.P. Sin’kov
REVIEW PACS numbers: 79.10.Ca; 78.20.nb; 42.62.Fi DOI: 10.1070/QE2013v043n01ABEH014912
Contents 1. Introduction . . . . . . . . . . . . . . . . . . . . . . . . . . . . . . . . . . . . . . . . . . . . . . . . . . . . . . . . . . . . . . . . . . . . . . . . . . . . . . . . . . . . . . . . . . . . 12. Brief review of techniques based on the photothermal effect . . . . . . . . . . . . . . . . . . . . . . . . . . . . . . . . . . . . . . . . . . . . . . . . . . . . . . 2
2.1. Photoacoustic technique2.2. Photothermal defelction (mirage-effect) spectroscopy 2.3. Thermal lens technique 2.4. Surface thermal lensing2.5. Photothermal radiometry 2.6. Photothermal reflectance technique2.7. Photothermal interferometry
3. Measurement of light-induced absorption by photothermal techniques (case of low intensities) . . . . . . . . . . . . . . . . . . . . . . . . . . 6 3.1. Necessity of modified photothermal techniques to measure light-induced absorption3.2. Modified photoacoustic technique 3.3. Modified photothermal radiometry3.4. Modified deflection technique 3.5. Modified thermal lens technique3.6. Measurement of light-induced absorption by the photothermal reflectance technique
4. Measurement of light-induced absorption by photothermal techniques (case of high intensities) . . . . . . . . . . . . . . . . . . . . . . . . . 94.1. Induced absorption under multiphoton effect4.2. Measurement of induced absorption under two-photon excitation using the thermal lens technique4.3. Measurement of induced absorption under two-photon excitation using the deflection technique
5. Conclusions . . . . . . . . . . . . . . . . . . . . . . . . . . . . . . . . . . . . . . . . . . . . . . . . . . . . . . . . . . . . . . . . . . . . . . . . . . . . . . . . . . . . . . . . . . . . . 106. References . . . . . . . . . . . . . . . . . . . . . . . . . . . . . . . . . . . . . . . . . . . . . . . . . . . . . . . . . . . . . . . . . . . . . . . . . . . . . . . . . . . . . . . . . . . . . . 10
L.A. Skvortsov2
low absorption. However, this sensitivity is insufficient to detect photoinduced absorption in thin films or (in the case of low exposures) bulk samples.
Laser photothermal spectroscopy is an alternative to con-ventional absorption spectroscopy techniques. Photothermal methods have the active character; they are nondestructive and, in most cases, contactless. A characteristic sign of all photothermal techniques is that they yield information about the properties and composition of a medium under study based on direct detection of the power absorbed in it from the corresponding changes in the physical and thermodynamic parameters of the material [22 – 26]. A direct consequence of this is the following set of features: (1) zero-referenced mea-surements (the output signal is zero in the absence of absorp-tion), (2) an increase in sensitivity with an increase in the radiation power (up to the absorption saturation mode), and (3) fundamental limitation of the limiting sensitivity by ther-mal fluctuations in the medium under study.
Photothermal techniques can be implemented in two ways. In the first version, a sample is exposed to cw laser radi-ation periodically modulated in amplitude (the so-called pho-tothermal modulation spectroscopy). The second version is the pulsed photothermal spectroscopy, where periodically repeated laser pulses are used. In both cases, absorption of laser radiation by the object under study leads to excitation of thermal waves in it, as a result of which the temperature and recorded signal become modulated. Having analysed the time dependence of the recorded signal and its phase, one can gain information about various physical properties of the object, including the magnitude and dynamics of photoinduced absorption.
As was mentioned above, photothermal spectroscopy is a modulation measurement technique, which implies periodic perturbation of some parameter of the material under study by modulated (pulsed) laser radiation. The basic advantages of photothermal spectroscopy, as compared with conven-tional spectroscopy, are due to the possibility of eliminating the background (structureless) component of signal and mea-suring differential spectra. The reason is that the signal recorded is directly related not to the parameter to be mea-sured but to its change, i.e., to the derivative of this parameter with respect to temperature. Therefore, photothermal spectra have fine features, analysis of which yields data on the prop-erties of material that cannot always be revealed by conven-tional spectroscopy. In addition, lock-in detection of a signal at a modulation frequency improves significantly the signal-to-noise ratio, thus reducing the measurement error.
Depending on the way of detecting modulated signal, the most widespread methods are photoacoustic spectroscopy techniques, photothermal deflection spectroscopy (mirage-effect), thermal lens technique (thermal lens spectroscopy), photothermal radiometry and photothermal interferometry, and thermoreflectance technique. All these methods were described in a number of reviews and monographs [22 – 32].
In this paper we will not go into details of numerous orig-inal studies, as, for example, in [24 – 26], where an extensive bibliography on different photothermal spectroscopy tech-niques can be found. We will restrict ourselves to brief consid-eration of the basic (in our opinion) laser photothermal tech-niques, which are most widespread and promising for practi-cal analysis of photoinduced absorption in various media. We will refer to the original studies that we believe to be of funda-mental importance for the problem under consideration and to a number of new studies that have not been considered in
the aforementioned reviews. Emphasis will be on the specific features of the techniques presented and on the discussion of the latest results obtained generally with the use of new designs.
Because of the limited volume of the paper, the results are described only briefly. Details can be found in the original studies, reviews, and monographs we refer to; they contain extensive data on separate aspects of the problem under con-sideration.
2. Brief review of techniques based on the photothermal effect
2.1. Photoacoustic technique
The essence of the photoacoustic technique is as follows [33, 34]. A sample under study is placed in a special cell and exposed to modulated laser radiation, which is completely or partially absorbed in the sample to heat it. The heat released is transferred to the gas medium located in the acoustic cell, as a result of which the pressure in the cell periodically changes. The thus excited acoustic waves are recorded by a highly sen-sitive microphone, built-in into the cell (Fig. 1). One can also perform contact measurement of the photoacoustic signal when studying, for example, solids with the aid of a piezoelec-tric sensor, positioned directly on the sample surface. Currently open photoacoustic systems with a sensitive ele-ment in the form of a quartz tuning fork have been developed; they are considered to be promising devices for remote detec-tion of chemical compounds on surfaces of solids.
High sensitivity of photoacoustic spectroscopy makes it possible to advance significantly in the study of weakly absorbing media [35, 36]. Highly sensitive photoacoustic mul-ticomponent gas analysers have been developed to solve envi-ronmental protection problems [37 – 40]. The photoacoustic effect was used as a basis for measuring thermodynamic parameters of gaseous, liquid, and condensed media [41 – 44]. Photo acoustic microscopy and flaw detection are widely used in modern materials science, biology, and medicine [45 – 48]. Recently much attention has been paid to the photoacoustic spectroscopy as a tool of remote detection of traces of chemi-cal compound [49 – 51] etc. Many reviews and monographs were devoted to the application of photoacoustic technique for studying matter in different aggregate states [22, 25, 30].
2.2. Photothermal defelction (mirage-effect) spectroscopy
In this technique modulated excitation radiation heats the surface of a sample studied. Heat transfer causes periodic
Laser
Microphone
Gas
DP
Modulator
Photoacoustic cell
Figure 1. Schematic of the photoacoustic technique [34].
3Laser photothermal spectroscopy of light-induced absorption
heating of the surface layer of the medium contacting the sample. The formation of a temperature gradient in the medium near the surface and the related change in its refractive index are revealed by the deviation of the probe beam from the plane parallel to the sample surface (the mirage effect) and recorded by a position-sensitive photodetector (Fig. 2).
To increase the sensitivity of this technique, the sample is generally placed in a cell containing a transparent liquid, the refractive index of which depends strongly on temperature. Using this scheme, one can measure temperature increments on the sample surface at a level of 10–4 K, which correspond to a probe beam deviation angle of ~10–9 rad [52]. This sensi-tivity makes it possible to detect absorption losses in solids at a level of ~10–7 cm–1 [53]. This technique is widely applied to measure optical (absorption coefficient [54, 55]), thermal (thermal conductivity [56 – 58], temperature [59]), and electri-cal [60] properties of materials. Extensive data on this mea-surement technique can be found in a number of reviews and monographs [25, 26].
2.3. Thermal lens technique
In a simplified form, the essence of this technique is as fol-lows. Irradiation of an absorbing medium by a laser beam with a Gaussian intensity distribution in the transverse cross section induces a temperature gradient in it due to nonuni-form heating. In turn, a change in temperature causes local changes in the refractive index of the medium, in correspon-dence with the laser beam intensity distribution. The occur-rence of the refractive index gradient in the medium leads to the formation of an optical element, which acts as a scatter-ing/collecting lens; this element was referred to as a thermal lens. Since the refractive index of most materials in the trans-parency range decreases with an increase in the temperature, the thermal lens is generally scattering; i.e., the transverse laser-beam size increases when the medium is heated.
In the more general case variations in the refractive index of the medium can be caused by changes in both the tempera-ture T and density r of the medium:
¶¶
¶¶n
Tn T n
P TrrD D D= +c cm m .
The thermal lens technique can be implemented using both single- and double-beam measurement schemes. In the single-beam scheme radiation of one laser is simultaneously used for excitation (generation of a thermal lens) and prob-ing. Being absorbed, laser radiation heats the sample, and the
change in its intensity yields information about absorption in the medium. The measurement technique generally implies recording the temporal shape of photothermal signal from a photodetector with a diaphragm, located in the far-field zone.
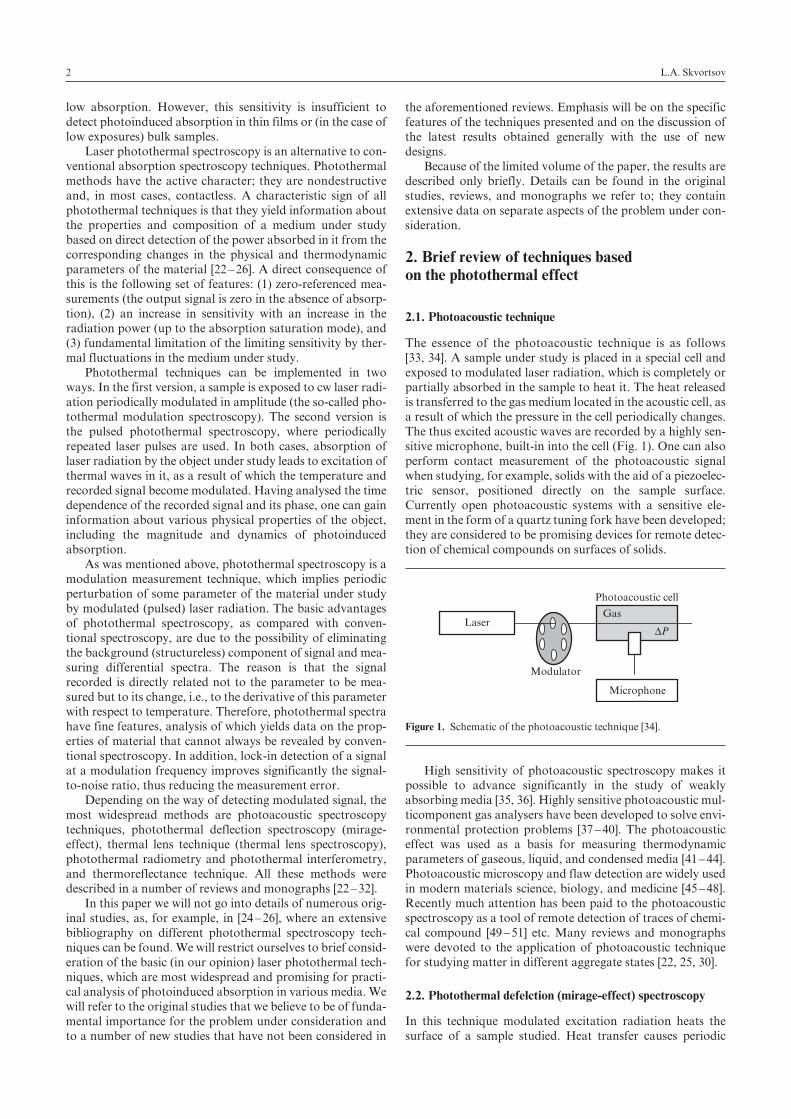
The double-beam scheme is more universal. Here, a ther-mal lens induced by excitation (pump) radiation is recorded by measuring defocusing of an additional probe beam. Its main advantage is that it allows one to study the spectral dependence of the absorption of materials; this cannot be done within the single-beam scheme. One of configurations of the classical double-beam measurement scheme is shown in Fig. 3.
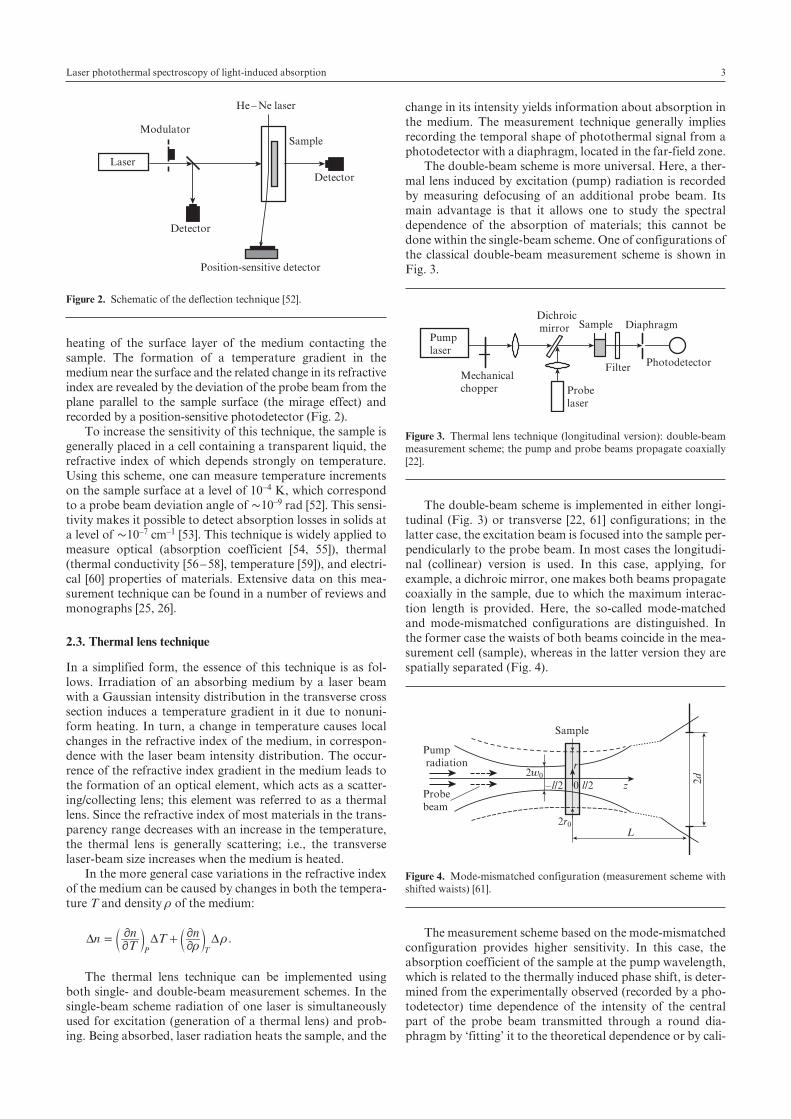
The double-beam scheme is implemented in either longi-tudinal (Fig. 3) or transverse [22, 61] configurations; in the latter case, the excitation beam is focused into the sample per-pendicularly to the probe beam. In most cases the longitudi-nal (collinear) version is used. In this case, applying, for example, a dichroic mirror, one makes both beams propagate coaxially in the sample, due to which the maximum interac-tion length is provided. Here, the so-called mode-matched and mode-mismatched configurations are distinguished. In the former case the waists of both beams coincide in the mea-surement cell (sample), whereas in the latter version they are spatially separated (Fig. 4).
The measurement scheme based on the mode-mismatched configuration provides higher sensitivity. In this case, the absorption coefficient of the sample at the pump wavelength, which is related to the thermally induced phase shift, is deter-mined from the experimentally observed (recorded by a pho-todetector) time dependence of the intensity of the central part of the probe beam transmitted through a round dia-phragm by ‘fitting’ it to the theoretical dependence or by cali-
Laser
Modulator
Detector
Detector
Sample
He – Ne laser
Position-sensitive detector
Figure 2. Schematic of the deflection technique [52].
Pump laser
Probelaser
Filter Photodetector
Sample DiaphragmDichroic mirror
Mechanicalchopper
Figure 3. Thermal lens technique (longitudinal version): double-beam measurement scheme; the pump and probe beams propagate coaxially [22].
Pump radiation
Probebeam
Sample
– l/2 l/2
L
z2v0
r
0
2r0
2d
Figure 4. Mode-mismatched configuration (measurement scheme with shifted waists) [61].
L.A. Skvortsov4
brating with the aid of a standard (reference) sample with known absorption.
The pump laser can operate in both pulsed and cw modes, while the probe radiation intensity is generally chosen to be constant; thus, its change on the diaphragm can only be caused by induced modulation from the pump laser. In prac-tice, the threshold sensitivity of this technique is mainly lim-ited by laser power fluctuations. At a fluctuation level not more than 0.5 % – 1 %, the measured absorption threshold is 10–6 – 10–7 cm–1. This corresponds to the detection threshold of ~10–8 for refractive index variations and a temperature variation threshold in the range of 10–6 – 10–7 K [22]. Later it was shown that one can measure the absorption coefficient at a level of ~10–8 cm–1 using Z scanning (scanning in the longi-tudinal direction), which is a kind of thermal lens technique [62].
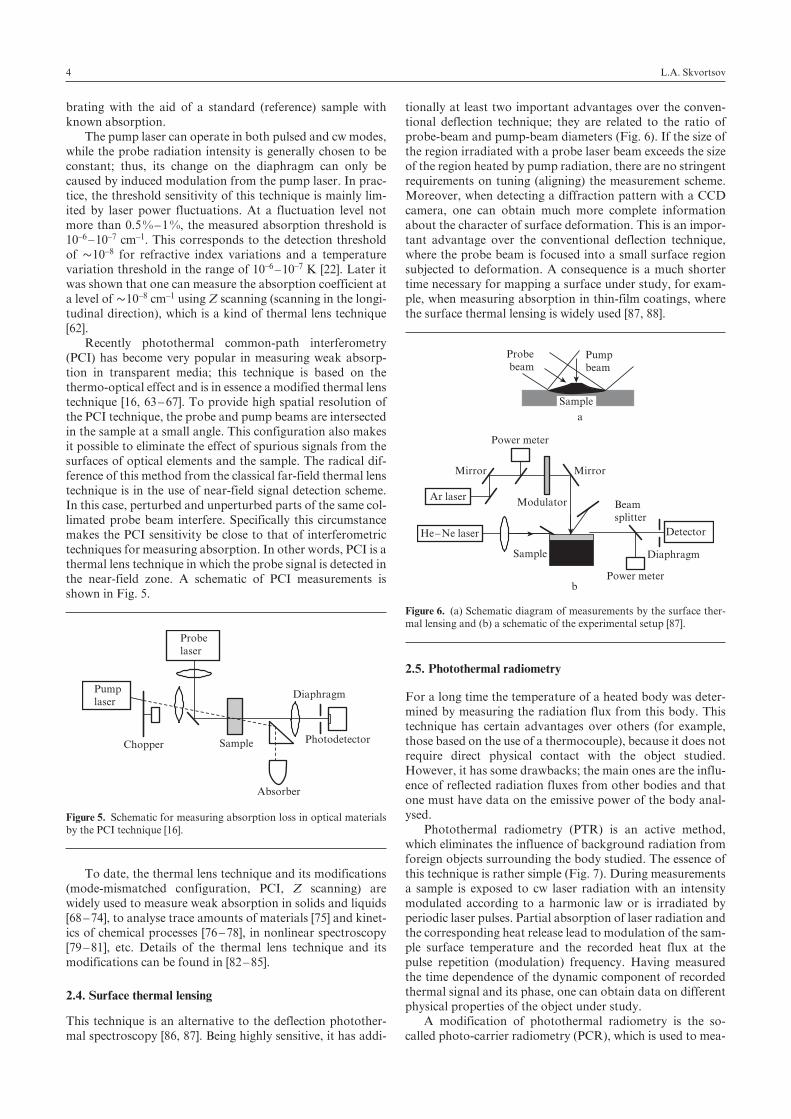
Recently photothermal common-path interferometry (PCI) has become very popular in measuring weak absorp-tion in transparent media; this technique is based on the thermo-optical effect and is in essence a modified thermal lens technique [16, 63 – 67]. To provide high spatial resolution of the PCI technique, the probe and pump beams are intersected in the sample at a small angle. This configuration also makes it possible to eliminate the effect of spurious signals from the surfaces of optical elements and the sample. The radical dif-ference of this method from the classical far-field thermal lens technique is in the use of near-field signal detection scheme. In this case, perturbed and unperturbed parts of the same col-limated probe beam interfere. Specifically this circumstance makes the PCI sensitivity be close to that of interferometric techniques for measuring absorption. In other words, PCI is a thermal lens technique in which the probe signal is detected in the near-field zone. A schematic of PCI measurements is shown in Fig. 5.
To date, the thermal lens technique and its modifications (mode-mismatched configuration, PCI, Z scanning) are widely used to measure weak absorption in solids and liquids [68 – 74], to analyse trace amounts of materials [75] and kinet-ics of chemical processes [76 – 78], in nonlinear spectroscopy [79 – 81], etc. Details of the thermal lens technique and its modifications can be found in [82 – 85].
2.4. Surface thermal lensing
This technique is an alternative to the deflection photother-mal spectroscopy [86, 87]. Being highly sensitive, it has addi-
tionally at least two important advantages over the conven-tional deflection technique; they are related to the ratio of probe-beam and pump-beam diameters (Fig. 6). If the size of the region irradiated with a probe laser beam exceeds the size of the region heated by pump radiation, there are no stringent requirements on tuning (aligning) the measurement scheme. Moreover, when detecting a diffraction pattern with a CCD camera, one can obtain much more complete information about the character of surface deformation. This is an impor-tant advantage over the conventional deflection technique, where the probe beam is focused into a small surface region subjected to deformation. A consequence is a much shorter time necessary for mapping a surface under study, for exam-ple, when measuring absorption in thin-film coatings, where the surface thermal lensing is widely used [87, 88].
2.5. Photothermal radiometry
For a long time the temperature of a heated body was deter-mined by measuring the radiation flux from this body. This technique has certain advantages over others (for example, those based on the use of a thermocouple), because it does not require direct physical contact with the object studied. However, it has some drawbacks; the main ones are the influ-ence of reflected radiation fluxes from other bodies and that one must have data on the emissive power of the body anal-ysed.
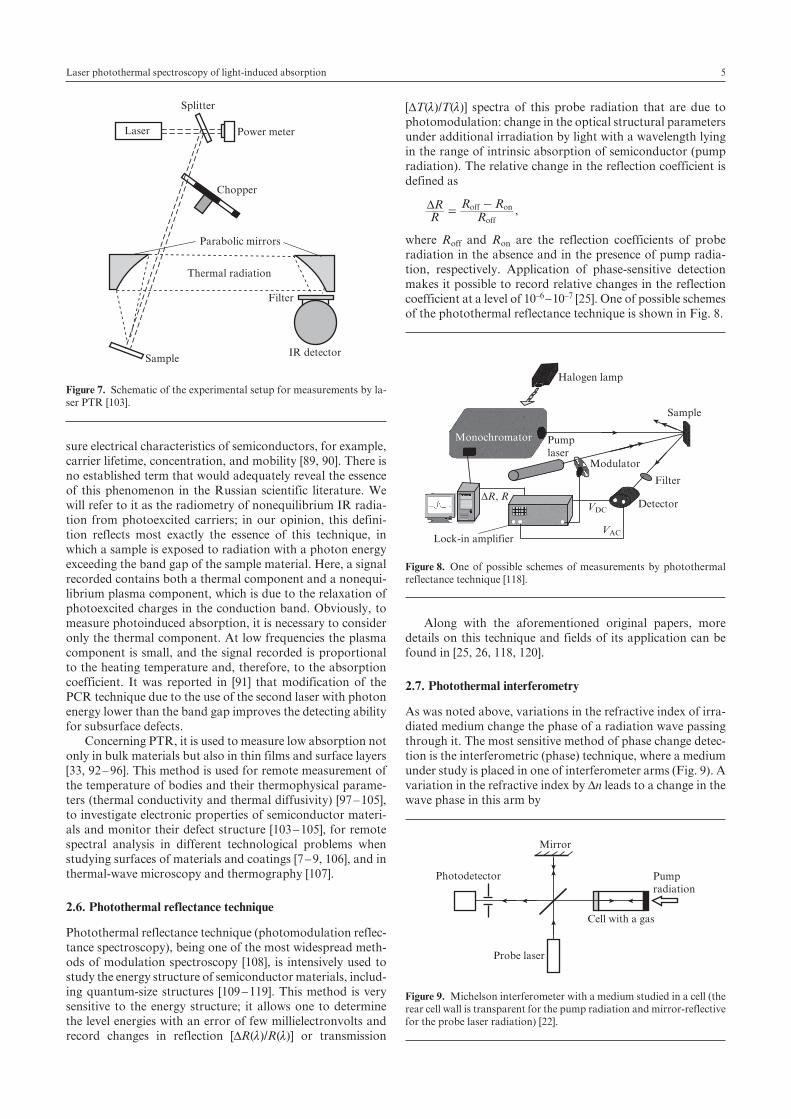
Photothermal radiometry (PTR) is an active method, which eliminates the influence of background radiation from foreign objects surrounding the body studied. The essence of this technique is rather simple (Fig. 7). During measurements a sample is exposed to cw laser radiation with an intensity modulated according to a harmonic law or is irradiated by periodic laser pulses. Partial absorption of laser radiation and the corresponding heat release lead to modulation of the sam-ple surface temperature and the recorded heat flux at the pulse repetition (modulation) frequency. Having measured the time dependence of the dynamic component of recorded thermal signal and its phase, one can obtain data on different physical properties of the object under study.
A modification of photothermal radiometry is the so-called photo-carrier radiometry (PCR), which is used to mea-
Pumplaser
Probelaser
Chopper Sample
Absorber
Diaphragm
Photodetector
Figure 5. Schematic for measuring absorption loss in optical materials by the PCI technique [16].
Ar laser
He–Ne laser Detector
Mirror Mirror
Power meter
Power meter
Modulator
Sample
Beamsplitter
Diaphragm
Sample
Probe beam
Pumpbeam
a
b
Figure 6. (a) Schematic diagram of measurements by the surface ther-mal lensing and (b) a schematic of the experimental setup [87].
5Laser photothermal spectroscopy of light-induced absorption
sure electrical characteristics of semiconductors, for example, carrier lifetime, concentration, and mobility [89, 90]. There is no established term that would adequately reveal the essence of this phenomenon in the Russian scientific literature. We will refer to it as the radiometry of nonequilibrium IR radia-tion from photoexcited carriers; in our opinion, this defini-tion reflects most exactly the essence of this technique, in which a sample is exposed to radiation with a photon energy exceeding the band gap of the sample material. Here, a signal recorded contains both a thermal component and a nonequi-librium plasma component, which is due to the relaxation of photoexcited charges in the conduction band. Obviously, to measure photoinduced absorption, it is necessary to consider only the thermal component. At low frequencies the plasma component is small, and the signal recorded is proportional to the heating temperature and, therefore, to the absorption coefficient. It was reported in [91] that modification of the PCR technique due to the use of the second laser with photon energy lower than the band gap improves the detecting ability for subsurface defects.
Concerning PTR, it is used to measure low absorption not only in bulk materials but also in thin films and surface layers [33, 92 – 96]. This method is used for remote measurement of the temperature of bodies and their thermophysical parame-ters (thermal conductivity and thermal diffusivity) [97 – 105], to investigate electronic properties of semiconductor materi-als and monitor their defect structure [103 – 105], for remote spectral analysis in different technological problems when studying surfaces of materials and coatings [7 – 9, 106], and in thermal-wave microscopy and thermography [107].
2.6. Photothermal reflectance technique
Photothermal reflectance technique (photomodulation reflec-tance spectroscopy), being one of the most widespread meth-ods of modulation spectroscopy [108], is intensively used to study the energy structure of semiconductor materials, includ-ing quantum-size structures [109 – 119]. This method is very sensitive to the energy structure; it allows one to determine the level energies with an error of few millielectronvolts and record changes in reflection [DR(l)/R(l)] or transmission
[DT(l)/T(l)] spectra of this probe radiation that are due to photomodulation: change in the optical structural parameters under additional irradiation by light with a wavelength lying in the range of intrinsic absorption of semiconductor (pump radiation). The relative change in the reflection coefficient is defined as
RR
RR R
off
off onD=
- ,
where Roff and Ron are the reflection coefficients of probe radiation in the absence and in the presence of pump radia-tion, respectively. Application of phase-sensitive detection makes it possible to record relative changes in the reflection coefficient at a level of 10–6 – 10–7 [25]. One of possible schemes of the photothermal reflectance technique is shown in Fig. 8.
Along with the aforementioned original papers, more details on this technique and fields of its application can be found in [25, 26, 118, 120].
2.7. Photothermal interferometry
As was noted above, variations in the refractive index of irra-diated medium change the phase of a radiation wave passing through it. The most sensitive method of phase change detec-tion is the interferometric (phase) technique, where a medium under study is placed in one of interferometer arms (Fig. 9). A variation in the refractive index by Dn leads to a change in the wave phase in this arm by
Laser
SampleIR detector
Filter
Thermal radiation
Parabolic mirrors
Chopper
Power meter
Splitter
Figure 7. Schematic of the experimental setup for measurements by la-ser PTR [103].
Halogen lamp
Monochromator Pumplaser
Modulator
Filter
Detector
Sample
DR, R
VAC
VDC
Lock-in amplifier
Figure 8. One of possible schemes of measurements by photothermal reflectance technique [118].
Mirror
Photodetector
Probe laser
Cell with a gas
Pumpradiation
Figure 9. Michelson interferometer with a medium studied in a cell (the rear cell wall is transparent for the pump radiation and mirror-reflective for the probe laser radiation) [22].
L.A. Skvortsov6
Dj = (2pL/lp)Dn,
where L is the length of the spatial alignment region in the sample for the excitation (pump) radiation and probe wave and lp is the probe wavelength.
A change in the probe wave phase shifts the interference pattern in the detection plane; this shift is detected by measur-ing the change in the radiation power with the aid of a photo-detector with a diaphragm. Depending on the measurement conditions, one can determine variations Dn using many known interferometric schemes with insignificant modifica-tion (for example, Mach – Zehnder, Fabry – Perot, Michelson, and Jamin interferometers) [121, 122]. In comparison with the deflection and thermal lens techniques, the phase method provides higher sensitivity [22, 61]. For example, the sensitiv-ity of the interference measurements in gases was ~10 ppt [123]. Nevertheless, the phase method is relatively complex in both design and operation; in addition, it requires reliable vibroacoustic isolation. Apparently, it has not become very popular for these reasons.
3. Measurement of light-induced absorption by photothermal techniques (case of low intensities)
3.1. Necessity of modified photothermal techniques to measure light-induced absorption
The mechanism of induced absorption is generally related to the occupation of traps by electrons excited by light to the conduction band from deep donor levels or from the valence band. With allowance for this phenomenon, measurement of induced absorption calls for modifying photothermal tech-niques in the following way.
When electrons are excited from the valence band to the conduction band, the sample under study must be exposed simultaneously to at least two light beams. One of them, with a wavelength falling in the range of intrinsic absorption of the material (pump wave), generates electron – hole pairs both in the bulk of the sample and on its surface. A cw laser is gener-ally used as a source of this short-wavelength radiation. The free electrons formed in the conduction band can be captured by traps before recombination. The second radiation flux, with photon energy below the band gap (probe wave), leads to trap depletion, heat release through relaxation electrons in the conduction band, and their further recombination. Thus, having measured (at the long-wavelength pulse repetition fre-quency) the variable (dynamic) component of the signal induced by periodic variation in temperature (or some related parameter, for example, the refractive index of material), one can measure the induced absorption at this wavelength. The spectral dependence of photoinduced absorption is studied using such radiation sources as, for example, xenon lamps (whose light is transmitted through a monochromator) or wavelength-tunable lasers. The latter have a higher spectral brightness and thus provide higher measurement sensitivity. Note that in the case under consideration the modified photo-thermal techniques are designed for studying thin films and surface layers of materials. This is due to the fact that pump radiation is absorbed at a depth la » af
–1, where af » 105 – 106 cm–1 is the absorption coefficient related to funda-mental absorption.
At the same time, depletion of deep donor levels by pump radiation also leads to occupation of electronic traps. In this case, the pump photon energy may be much lower than the band gap; this situation occurs, for example, when studying the photoinduced absorption in the bulk of photorefractive crystals and other optically transparent materials.
Thus, in both cases the above-considered conventional schemes used to measure photoinduced absorption should contain an additional pump channel in order to form excited centres, whose absorption is to be measured. The choice of the pump wavelength is determined to a great extent by not only the nature of materials but also by the specific conditions of their application.
3.2. Modified photoacoustic technique
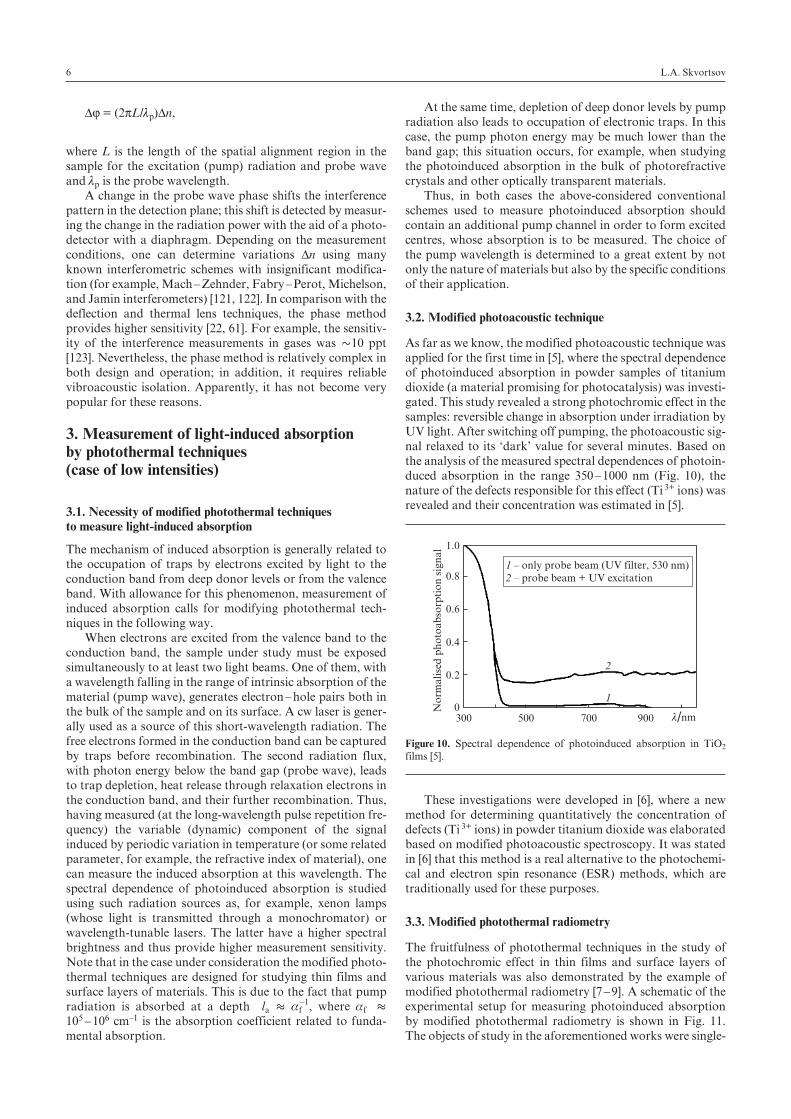
As far as we know, the modified photoacoustic technique was applied for the first time in [5], where the spectral dependence of photoinduced absorption in powder samples of titanium dioxide (a material promising for photocatalysis) was investi-gated. This study revealed a strong photochromic effect in the samples: reversible change in absorption under irradiation by UV light. After switching off pumping, the photoacoustic sig-nal relaxed to its ‘dark’ value for several minutes. Based on the analysis of the measured spectral dependences of photoin-duced absorption in the range 350 – 1000 nm (Fig. 10), the nature of the defects responsible for this effect (Ti 3+ ions) was revealed and their concentration was estimated in [5].
These investigations were developed in [6], where a new method for determining quantitatively the concentration of defects (Ti 3+ ions) in powder titanium dioxide was elaborated based on modified photoacoustic spectroscopy. It was stated in [6] that this method is a real alternative to the photochemi-cal and electron spin resonance (ESR) methods, which are traditionally used for these purposes.
3.3. Modified photothermal radiometry
The fruitfulness of photothermal techniques in the study of the photochromic effect in thin films and surface layers of various materials was also demonstrated by the example of modified photothermal radiometry [7 – 9]. A schematic of the experimental setup for measuring photoinduced absorption by modified photothermal radiometry is shown in Fig. 11. The objects of study in the aforementioned works were single-
0
0.2
0.4
0.6
0.8
1.0
1
2
300 500 700 900 l/nm
1 – only probe beam (UV filter, 530 nm)2 – probe beam + UV excitation
No
rmal
ised
ph
oto
abso
rpti
on
sig
nal
Figure 10. Spectral dependence of photoinduced absorption in TiO2 films [5].
7Laser photothermal spectroscopy of light-induced absorption
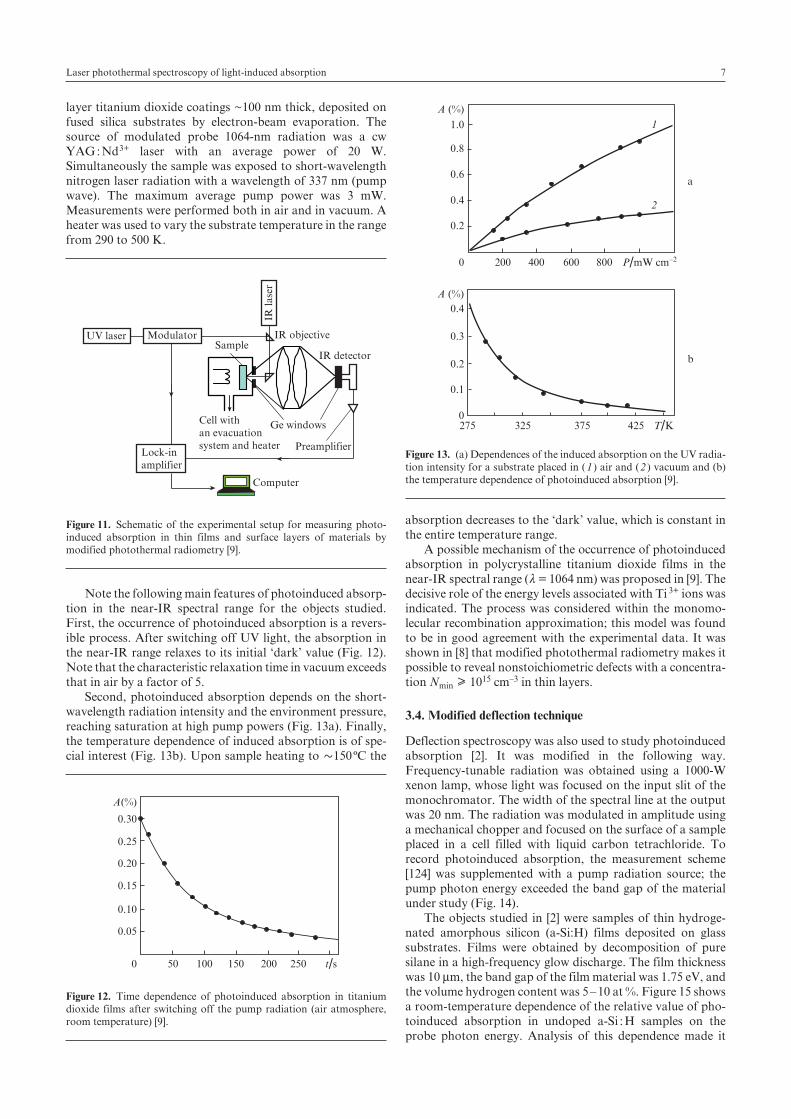
layer titanium dioxide coatings ~100 nm thick, deposited on fused silica substrates by electron-beam evaporation. The source of modulated probe 1064-nm radiation was a cw YAG : Nd3+ laser with an average power of 20 W. Simultaneously the sample was exposed to short-wavelength nitrogen laser radiation with a wavelength of 337 nm (pump wave). The maximum average pump power was 3 mW. Measurements were performed both in air and in vacuum. A heater was used to vary the substrate temperature in the range from 290 to 500 K.
Note the following main features of photoinduced absorp-tion in the near-IR spectral range for the objects studied. First, the occurrence of photoinduced absorption is a revers-ible process. After switching off UV light, the absorption in the near-IR range relaxes to its initial ‘dark’ value (Fig. 12). Note that the characteristic relaxation time in vacuum exceeds that in air by a factor of 5.
Second, photoinduced absorption depends on the short-wavelength radiation intensity and the environment pressure, reaching saturation at high pump powers (Fig. 13a). Finally, the temperature dependence of induced absorption is of spe-cial interest (Fig. 13b). Upon sample heating to ~150 ºC the
absorption decreases to the ‘dark’ value, which is constant in the entire temperature range.
A possible mechanism of the occurrence of photoinduced absorption in polycrystalline titanium dioxide films in the near-IR spectral range ( l = 1064 nm) was proposed in [9]. The decisive role of the energy levels associated with Ti 3+ ions was indicated. The process was considered within the monomo-lecular recombination approximation; this model was found to be in good agreement with the experimental data. It was shown in [8] that modified photothermal radiometry makes it possible to reveal nonstoichiometric defects with a concentra-tion Nmin ³ 1015 cm–3 in thin layers.
3.4. Modified deflection technique
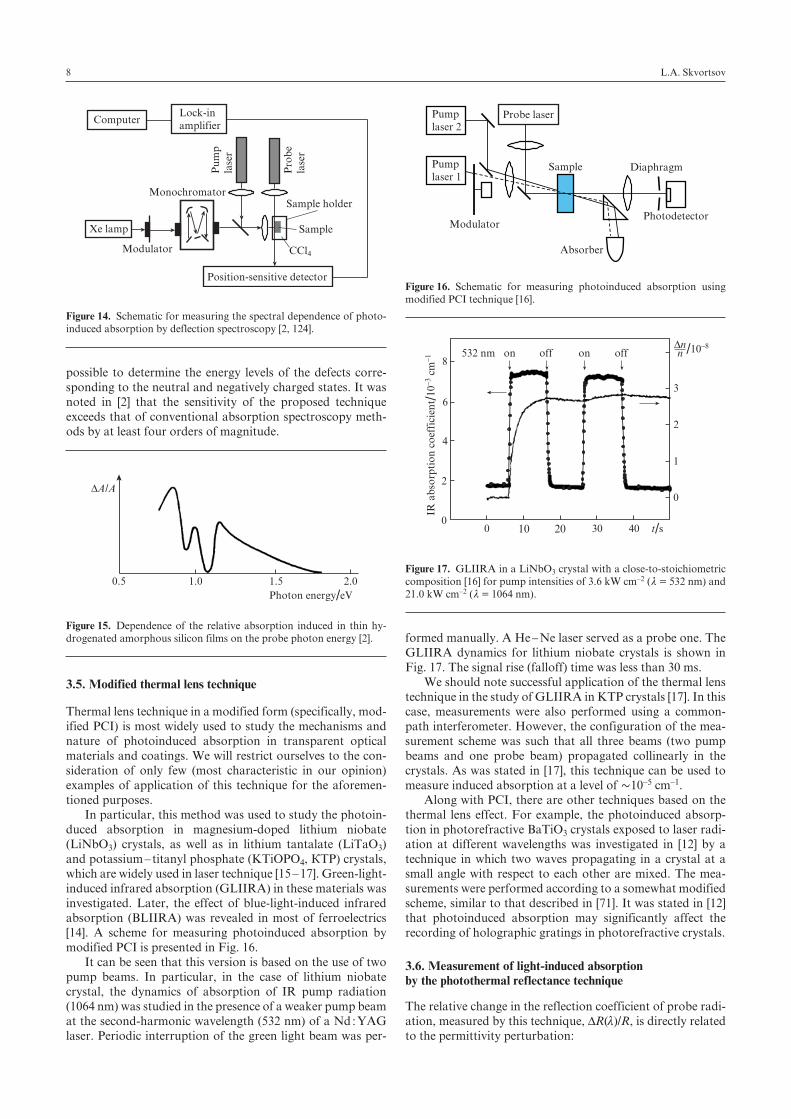
Deflection spectroscopy was also used to study photoinduced absorption [2]. It was modified in the following way. Frequency-tunable radiation was obtained using a 1000-W xenon lamp, whose light was focused on the input slit of the monochromator. The width of the spectral line at the output was 20 nm. The radiation was modulated in amplitude using a mechanical chopper and focused on the surface of a sample placed in a cell filled with liquid carbon tetrachloride. To record photoinduced absorption, the measurement scheme [124] was supplemented with a pump radiation source; the pump photon energy exceeded the band gap of the material under study (Fig. 14).
The objects studied in [2] were samples of thin hydroge-nated amorphous silicon (a-Si:H) films deposited on glass substrates. Films were obtained by decomposition of pure silane in a high-frequency glow discharge. The film thickness was 10 mm, the band gap of the film material was 1.75 eV, and the volume hydrogen content was 5 – 10 at %. Figure 15 shows a room-temperature dependence of the relative value of pho-toinduced absorption in undoped a-Si : H samples on the probe photon energy. Analysis of this dependence made it
Modulator
Lock-inamplifier
IR la
ser
UV laser
Computer
Cell withan evacuationsystem and heater
SampleIR objective
IR detector
Preamplifier
Ge windows
Figure 11. Schematic of the experimental setup for measuring photo-induced absorption in thin films and surface layers of materials by modified photothermal radiometry [9].
0 50 100 150 200 250 t/s
A(%)
0.05
0.10
0.15
0.20
0.30
0.25
Figure 12. Time dependence of photoinduced absorption in titanium dioxide films after switching off the pump radiation (air atmosphere, room temperature) [9].
0
0
200 400 600 800
0.2
0.2
0.1
0.3
0.4
0.4
0.6
0.8
1.0
A (%)
A (%)
P/mW cm–2
275 325 425375 T/K
a
b
1
2
Figure 13. (a) Dependences of the induced absorption on the UV radia-tion intensity for a substrate placed in ( 1 ) air and ( 2 ) vacuum and (b) the temperature dependence of photoinduced absorption [9].
L.A. Skvortsov8
possible to determine the energy levels of the defects corre-sponding to the neutral and negatively charged states. It was noted in [2] that the sensitivity of the proposed technique exceeds that of conventional absorption spectroscopy meth-ods by at least four orders of magnitude.
3.5. Modified thermal lens technique
Thermal lens technique in a modified form (specifically, mod-ified PCI) is most widely used to study the mechanisms and nature of photoinduced absorption in transparent optical materials and coatings. We will restrict ourselves to the con-sideration of only few (most characteristic in our opinion) examples of application of this technique for the aforemen-tioned purposes.
In particular, this method was used to study the photoin-duced absorption in magnesium-doped lithium niobate (LiNbO3) crystals, as well as in lithium tantalate (LiTaO3) and potassium – titanyl phosphate (KTiOPO4, КTP) crystals, which are widely used in laser technique [15 – 17]. Green-light-induced infrared absorption (GLIIRA) in these materials was investigated. Later, the effect of blue-light-induced infrared absorption (BLIIRA) was revealed in most of ferroelectrics [14]. A scheme for measuring photoinduced absorption by modified PCI is presented in Fig. 16.
It can be seen that this version is based on the use of two pump beams. In particular, in the case of lithium niobate crystal, the dynamics of absorption of IR pump radiation (1064 nm) was studied in the presence of a weaker pump beam at the second-harmonic wavelength (532 nm) of a Nd : YAG laser. Periodic interruption of the green light beam was per-
formed manually. A He – Ne laser served as a probe one. The GLIIRA dynamics for lithium niobate crystals is shown in Fig. 17. The signal rise (falloff) time was less than 30 ms.
We should note successful application of the thermal lens technique in the study of GLIIRА in KTP crystals [17]. In this case, measurements were also performed using a common-path interferometer. However, the configuration of the mea-surement scheme was such that all three beams (two pump beams and one probe beam) propagated collinearly in the crystals. As was stated in [17], this technique can be used to measure induced absorption at a level of ~10–5 cm–1.
Along with PCI, there are other techniques based on the thermal lens effect. For example, the photoinduced absorp-tion in photorefractive BaTiO3 crystals exposed to laser radi-ation at different wavelengths was investigated in [12] by a technique in which two waves propagating in a crystal at a small angle with respect to each other are mixed. The mea-surements were performed according to a somewhat modified scheme, similar to that described in [71]. It was stated in [12] that photoinduced absorption may significantly affect the recording of holographic gratings in photorefractive crystals.
3.6. Measurement of light-induced absorption by the photothermal reflectance technique
The relative change in the reflection coefficient of probe radi-ation, measured by this technique, DR(l)/R, is directly related to the permittivity perturbation:
ComputerLock-inamplifier
Xe lamp
Position-sensitive detector
Modulator
Monochromator
Pu
mp
lase
r
Pro
be
lase
r
Sample holder
CCl4
Sample
Figure 14. Schematic for measuring the spectral dependence of photo-induced absorption by deflection spectroscopy [2, 124].
0.5 1.0 1.5 2.0Photon energy/eV
DA/A
Figure 15. Dependence of the relative absorption induced in thin hy-drogenated amorphous silicon films on the probe photon energy [2].
Pumplaser 2
Pumplaser 1
Probe laser
Absorber
Modulator
Sample Diaphragm
Photodetector
Figure 16. Schematic for measuring photoinduced absorption using modified PCI technique [16].
8
6
4
2
2
0
0
0 10 20 30 40 t/s
532 nm on off offon
IR a
bso
rpti
on
co
effi
cien
t /10–3
cm
–1
1
3
Dnn /10–8
Figure 17. GLIIRА in a LiNbO3 crystal with a close-to-stoichiometric composition [16] for pump intensities of 3.6 kW cm–2 ( l = 532 nm) and 21.0 kW cm–2 ( l = 1064 nm).
9Laser photothermal spectroscopy of light-induced absorption
∆R/R = a(e1, e2) ∆e1 + b(e1, e2) ∆e2,
where a and b are the Seraphin coefficients [125], which depend on the permittivity e(l) = e1(l) + ie2 (l); ∆e1 and ∆e2 are, respectively, the changes in the real and imaginary parts of the permittivity, which are linked by the Kramers – Kronig relation.
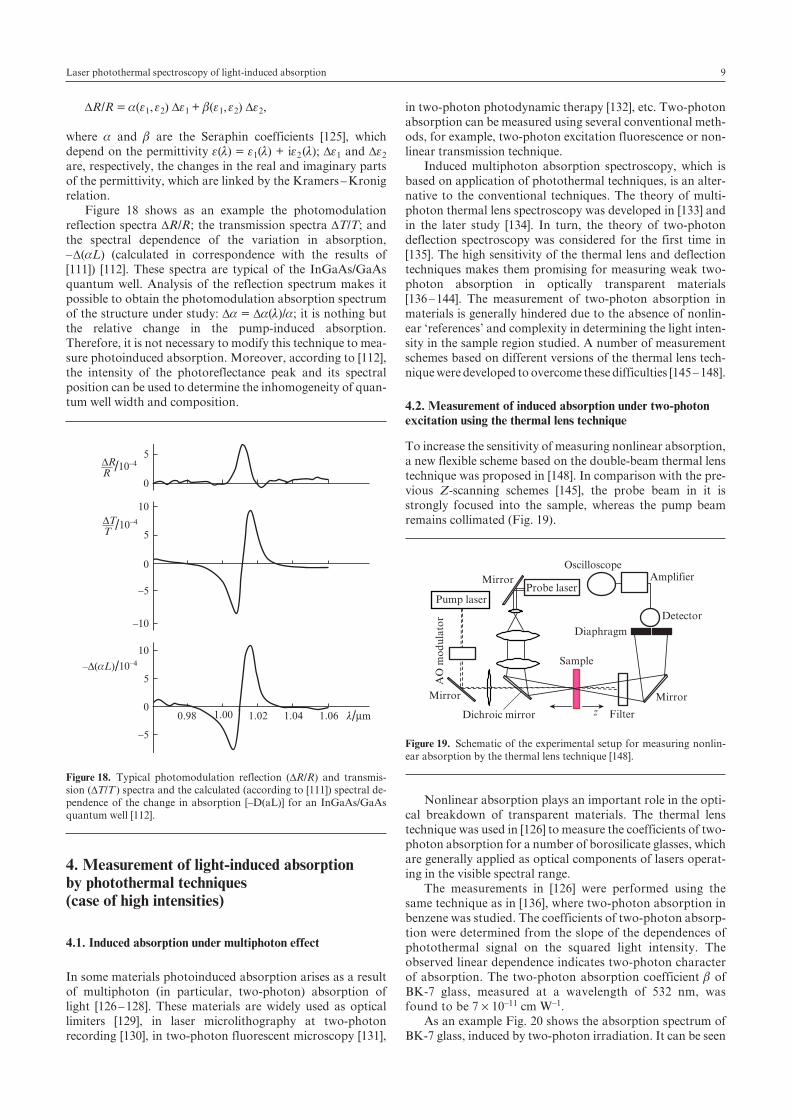
Figure 18 shows as an example the photomodulation reflection spectra ∆R/R; the transmission spectra ∆T/T; and the spectral dependence of the variation in absorption, –∆(aL) (calculated in correspondence with the results of [111]) [112]. These spectra are typical of the InGaAs/GaAs quantum well. Analysis of the reflection spectrum makes it possible to obtain the photomodulation absorption spectrum of the structure under study: ∆a = ∆a(l)/a; it is nothing but the relative change in the pump-induced absorption. Therefore, it is not necessary to modify this technique to mea-sure photoinduced absorption. Moreover, according to [112], the intensity of the photoreflectance peak and its spectral position can be used to determine the inhomogeneity of quan-tum well width and composition.
4. Measurement of light-induced absorption by photothermal techniques (case of high intensities)
4.1. Induced absorption under multiphoton effect
In some materials photoinduced absorption arises as a result of multiphoton (in particular, two-photon) absorption of light [126 – 128]. These materials are widely used as optical limiters [129], in laser microlithography at two-photon recording [130], in two-photon fluorescent microscopy [131],
in two-photon photodynamic therapy [132], etc. Two-photon absorption can be measured using several conventional meth-ods, for example, two-photon excitation fluorescence or non-linear transmission technique.
Induced multiphoton absorption spectroscopy, which is based on application of photothermal techniques, is an alter-native to the conventional techniques. The theory of multi-photon thermal lens spectroscopy was developed in [133] and in the later study [134]. In turn, the theory of two-photon deflection spectroscopy was considered for the first time in [135]. The high sensitivity of the thermal lens and deflection techniques makes them promising for measuring weak two-photon absorption in optically transparent materials [136 – 144]. The measurement of two-photon absorption in materials is generally hindered due to the absence of nonlin-ear ‘references’ and complexity in determining the light inten-sity in the sample region studied. A number of measurement schemes based on different versions of the thermal lens tech-nique were developed to overcome these difficulties [145 – 148].
4.2. Measurement of induced absorption under two-photon excitation using the thermal lens technique
To increase the sensitivity of measuring nonlinear absorption, a new flexible scheme based on the double-beam thermal lens technique was proposed in [148]. In comparison with the pre-vious Z-scanning schemes [145], the probe beam in it is strongly focused into the sample, whereas the pump beam remains collimated (Fig. 19).
Nonlinear absorption plays an important role in the opti-cal breakdown of transparent materials. The thermal lens technique was used in [126] to measure the coefficients of two-photon absorption for a number of borosilicate glasses, which are generally applied as optical components of lasers operat-ing in the visible spectral range.
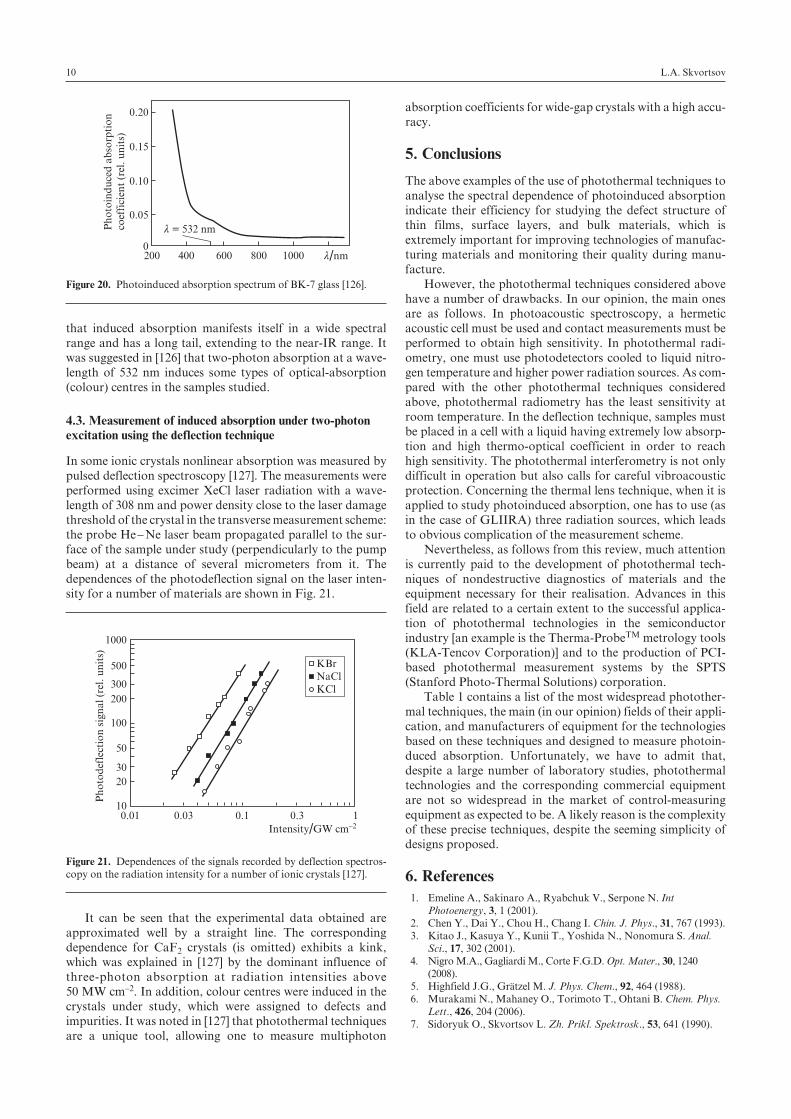
The measurements in [126] were performed using the same technique as in [136], where two-photon absorption in benzene was studied. The coefficients of two-photon absorp-tion were determined from the slope of the dependences of photothermal signal on the squared light intensity. The observed linear dependence indicates two-photon character of absorption. The two-photon absorption coefficient b of BK-7 glass, measured at a wavelength of 532 nm, was found to be 7 ´ 10–11 cm W–1.
As an example Fig. 20 shows the absorption spectrum of BK-7 glass, induced by two-photon irradiation. It can be seen
–5
–10
–5
0
0
0
5
5
5
10
10
0.98 1.00 1.02 1.04 1.06 l/mm
–D(aL)/10–4
DTT /10
–4
DRR /10
–4
Figure 18. Typical photomodulation reflection (DR/R) and transmis-sion (DT/T ) spectra and the calculated (according to [111]) spectral de-pendence of the change in absorption [–D(aL)] for an InGaAs/GaAs quantum well [112].
Pump laserProbe laser
Detector
Filter
MirrorMirror
Mirror
Diaphragm
Sample
AmplifierOscilloscope
zDichroic mirror
AO
mo
du
lato
r
Figure 19. Schematic of the experimental setup for measuring nonlin-ear absorption by the thermal lens technique [148].
L.A. Skvortsov10
that induced absorption manifests itself in a wide spectral range and has a long tail, extending to the near-IR range. It was suggested in [126] that two-photon absorption at a wave-length of 532 nm induces some types of optical-absorption (colour) centres in the samples studied.
4.3. Measurement of induced absorption under two-photon excitation using the deflection technique
In some ionic crystals nonlinear absorption was measured by pulsed deflection spectroscopy [127]. The measurements were performed using excimer XeCl laser radiation with a wave-length of 308 nm and power density close to the laser damage threshold of the crystal in the transverse measurement scheme: the probe He – Ne laser beam propagated parallel to the sur-face of the sample under study (perpendicularly to the pump beam) at a distance of several micrometers from it. The dependences of the photodeflection signal on the laser inten-sity for a number of materials are shown in Fig. 21.
It can be seen that the experimental data obtained are approximated well by a straight line. The corresponding dependence for CaF2 crystals (is omitted) exhibits a kink, which was explained in [127] by the dominant influence of three-photon absorption at radiation intensities above 50 MW cm–2. In addition, colour centres were induced in the crystals under study, which were assigned to defects and impurities. It was noted in [127] that photothermal techniques are a unique tool, allowing one to measure multiphoton
absorption coefficients for wide-gap crystals with a high accu-racy.
5. Conclusions
The above examples of the use of photothermal techniques to analyse the spectral dependence of photoinduced absorption indicate their efficiency for studying the defect structure of thin films, surface layers, and bulk materials, which is extremely important for improving technologies of manufac-turing materials and monitoring their quality during manu-facture.
However, the photothermal techniques considered above have a number of drawbacks. In our opinion, the main ones are as follows. In photoacoustic spectroscopy, a hermetic acoustic cell must be used and contact measurements must be performed to obtain high sensitivity. In photothermal radi-ometry, one must use photodetectors cooled to liquid nitro-gen temperature and higher power radiation sources. As com-pared with the other photothermal techniques considered above, photothermal radiometry has the least sensitivity at room temperature. In the deflection technique, samples must be placed in a cell with a liquid having extremely low absorp-tion and high thermo-optical coefficient in order to reach high sensitivity. The photothermal interferometry is not only difficult in operation but also calls for careful vibroacoustic protection. Concerning the thermal lens technique, when it is applied to study photoinduced absorption, one has to use (as in the case of GLIIRA) three radiation sources, which leads to obvious complication of the measurement scheme.
Nevertheless, as follows from this review, much attention is currently paid to the development of photothermal tech-niques of nondestructive diagnostics of materials and the equipment necessary for their realisation. Advances in this field are related to a certain extent to the successful applica-tion of photothermal technologies in the semiconductor industry [an example is the Therma-ProbeTM metrology tools (KLA-Tencov Corporation)] and to the production of PCI-based photothermal measurement systems by the SPTS (Stanford Photo-Thermal Solutions) corporation.
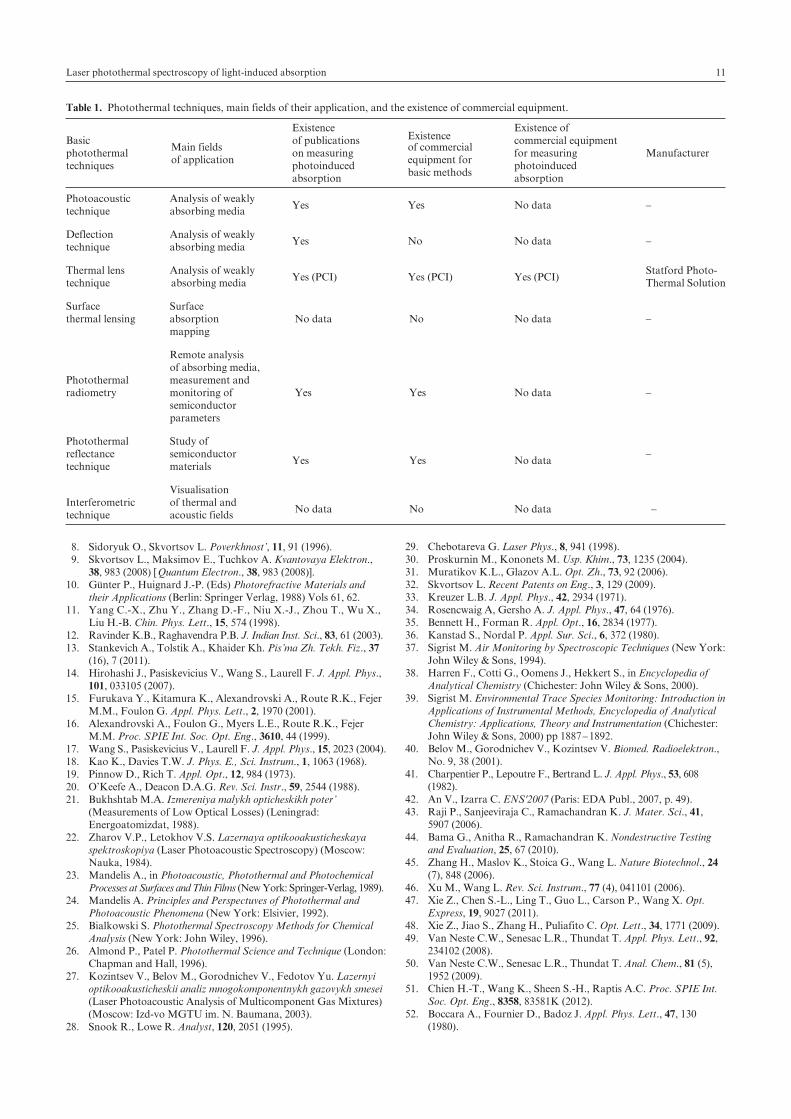
Table 1 contains a list of the most widespread photother-mal techniques, the main (in our opinion) fields of their appli-cation, and manufacturers of equipment for the technologies based on these techniques and designed to measure photoin-duced absorption. Unfortunately, we have to admit that, despite a large number of laboratory studies, photothermal technologies and the corresponding commercial equipment are not so widespread in the market of control-measuring equipment as expected to be. A likely reason is the complexity of these precise techniques, despite the seeming simplicity of designs proposed.
6. References 1. Emeline A., Sakinaro A., Ryabchuk V., Serpone N. Int
Photoenergy, 3, 1 (2001). 2. Chen Y., Dai Y., Chou H., Chang I. Chin. J. Phys., 31, 767 (1993). 3. Kitao J., Kasuya Y., Kunii T., Yoshida N., Nonomura S. Anal.
Sci., 17, 302 (2001). 4. Nigro M.A., Gagliardi M., Corte F.G.D. Opt. Mater., 30, 1240
(2008). 5. Highfield J.G., Grätzel M. J. Phys. Chem., 92, 464 (1988). 6. Murakami N., Mahaney O., Torimoto T., Ohtani B. Chem. Phys.
Lett., 426, 204 (2006). 7. Sidoryuk O., Skvortsov L. Zh. Prikl. Spektrosk., 53, 641 (1990).
l = 532 nm
200 400 600 800 1000 l/nm0
0.05
0.15
0.10
0.20P
ho
toin
du
ced
ab
sorp
tio
nco
effi
cien
t (r
el. u
nit
s)
Figure 20. Photoinduced absorption spectrum of BK-7 glass [126].
KBrNaClKCl
10
1000
2030
50
100
200
300
500
Intensity/GW cm–2
Ph
oto
def
lect
ion
sig
nal
(re
l. u
nit
s)
0.01 0.10.03 0.3 1
Figure 21. Dependences of the signals recorded by deflection spectros-copy on the radiation intensity for a number of ionic crystals [127].
11Laser photothermal spectroscopy of light-induced absorption
8. Sidoryuk O., Skvortsov L. Poverkhnost’, 11, 91 (1996). 9. Skvortsov L., Maksimov E., Tuchkov A. Kvantovaya Elektron.,
38, 983 (2008) [ Quantum Electron., 38, 983 (2008)].10. Günter P., Huignard J.-P. (Eds) Photorefractive Materials and
their Applications (Berlin: Springer Verlag, 1988) Vols 61, 62.11. Yang C.-X., Zhu Y., Zhang D.-F., Niu X.-J., Zhou T., Wu X.,
Liu H.-B. Chin. Phys. Lett., 15, 574 (1998).12. Ravinder K.B., Raghavendra P.B. J. Indian Inst. Sci., 83, 61 (2003).13. Stankevich A., Tolstik A., Khaider Kh. Pis’ma Zh. Tekh. Fiz., 37
(16), 7 (2011).14. Hirohashi J., Pasiskevicius V., Wang S., Laurell F. J. Appl. Phys.,
101, 033105 (2007).15. Furukava Y., Kitamura K., Alexandrovski A., Route R.K., Fejer
M.M., Foulon G. Appl. Phys. Lett., 2, 1970 (2001).16. Alexandrovski A., Foulon G., Myers L.E., Route R.K., Fejer
M.M. Proc. SPIE Int. Soc. Opt. Eng., 3610, 44 (1999).17. Wang S., Pasiskevicius V., Laurell F. J. Appl. Phys., 15, 2023 (2004).18. Kao K., Davies T.W. J. Phys. E., Sci. Instrum., 1, 1063 (1968).19. Pinnow D., Rich T. Appl. Opt., 12, 984 (1973).20. O’Keefe A., Deacon D.A.G. Rev. Sci. Instr., 59, 2544 (1988).21. Bukhshtab M.A. Izmereniya malykh opticheskikh poter’
(Measurements of Low Optical Losses) (Leningrad: Energoatomizdat, 1988).
22. Zharov V.P., Letokhov V.S. Lazernaya optikooakusticheskaya spektroskopiya (Laser Photoacoustic Spectroscopy) (Moscow: Nauka, 1984).
23. Mandelis A., in Photoacoustic, Photothermal and Photochemical Processes at Surfaces and Thin Films (New York: Springer-Verlag, 1989).
24. Mandelis A. Principles and Perspectuves of Photothermal and Photo acoustic Phenomena (New York: Elsivier, 1992).
25. Bialkowski S. Photothermal Spectroscopy Methods for Chemical Analysis (New York: John Wiley, 1996).
26. Almond P., Patel P. Photothermal Science and Technique (London: Chapman and Hall, 1996).
27. Kozintsev V., Belov M., Gorodnichev V., Fedotov Yu. Lazernyi optikooakusticheskii analiz mnogokomponentnykh gazovykh smesei (Laser Photoacoustic Analysis of Multicomponent Gas Mixtures) (Moscow: Izd-vo MGTU im. N. Baumana, 2003).
28. Snook R., Lowe R. Analyst, 120, 2051 (1995).
29. Chebotareva G. Laser Phys., 8, 941 (1998).30. Proskurnin M., Kononets M. Usp. Khim., 73, 1235 (2004).31. Muratikov K.L., Glazov A.L. Opt. Zh., 73, 92 (2006).32. Skvortsov L. Recent Patents on Eng., 3, 129 (2009).33. Kreuzer L.B. J. Appl. Phys., 42, 2934 (1971).34. Rosencwaig A, Gersho A. J. Appl. Phys., 47, 64 (1976).35. Bennett H., Forman R. Appl. Opt., 16, 2834 (1977).36. Kanstad S., Nordal P. Appl. Sur. Sci., 6, 372 (1980).37. Sigrist M. Air Monitoring by Spectroscopic Techniques (New York:
John Wiley & Sons, 1994).38. Harren F., Cotti G., Oomens J., Hekkert S., in Encyclopedia of
Analytical Chemistry (Chichester: John Wiley & Sons, 2000).39. Sigrist M. Environmental Trace Species Monitoring: Introduction in
Applications of Instrumental Methods, Encyclopedia of Analytical Chemistry: Applications, Theory and Instrumentation (Chichester: John Wiley & Sons, 2000) pp 1887 – 1892.
40. Belov M., Gorodnichev V., Kozintsev V. Biomed. Radioelektron., No. 9, 38 (2001).
41. Charpentier P., Lepoutre F., Bertrand L. J. Appl. Phys., 53, 608 (1982).
42. An V., Izarra C. ENS'2007 (Paris: EDA Publ., 2007, p. 49). 43. Raji P., Sanjeeviraja C., Ramachandran K. J. Mater. Sci., 41,
5907 (2006).44. Bama G., Anitha R., Ramachandran K. Nondestructive Testing
and Evaluation, 25, 67 (2010).45. Zhang H., Maslov K., Stoica G., Wang L. Nature Biotechnol., 24
(7), 848 (2006).46. Xu M., Wang L. Rev. Sci. Instrum., 77 (4), 041101 (2006).47. Xie Z., Chen S.-L., Ling T., Guo L., Carson P., Wang X. Opt.
Express, 19, 9027 (2011).48. Xie Z., Jiao S., Zhang H., Puliafito C. Opt. Lett., 34, 1771 (2009). 49. Van Neste C.W., Senesac L.R., Thundat T. Appl. Phys. Lett., 92,
234102 (2008).50. Van Neste C.W., Senesac L.R., Thundat T. Anal. Chem., 81 (5),
1952 (2009).51. Chien H.-T., Wang K., Sheen S.-H., Raptis A.C. Proc. SPIE Int.
Soc. Opt. Eng., 8358, 83581K (2012).52. Boccara A., Fournier D., Badoz J. Appl. Phys. Lett., 47, 130
(1980).
Table 1. Photothermal techniques, main fields of their application, and the existence of commercial equipment.
Existence Existence
Existence of Basic
Main fields of publications
of commercial commercial equipment
photothermal of application
on measuring equipment for
for measuring Manufacturertechniques photoinduced
basic methods photoinduced
absorption absorption
Photoacoustic Analysis of weakly Yes
Yes
No data
–
technique absorbing media
Deflection Analysis of weakly Yes
No
No data
–
technique absorbing media
Thermal lens Analysis of weakly Yes (PCI)
Yes (PCI)
Yes (PCI)
Statford Photo-technique absorbing media Thermal Solution
Surface Surface thermal lensing absorption No data No No data – mapping
Remote analysis of absorbing media, Photothermal measurement and radiometry monitoring of Yes Yes No data – semiconductor parameters
Photothermal Study of reflectance semiconductor
Yes
Yes
No data –
technique materials
Visualisation Interferometric of thermal and
No data
No
No data
–technique acoustic fields
L.A. Skvortsov12
53. Fournier D., Boccara A., Amer N., Gerlach R. Appl. Phys. Lett., 37, 519 (1980).
54. Goris L., Haenen K., Nesládek M., Wagner P., Vanderzande D., Schepper L., D’haen J., Lutsen L., Manca J. J. Mater. Sci., 40, 1413 (2005).
55. Tanaka K., Gotoh T., Yoshida N., Nonomura S. J. Appl. Phys., 91, 125 (2002).
56. Xiao L., Changyoung L., Zhang L., Zhao Y., Jia S., Zhou G. Chinese. J. Lasers, B9, 538 (2000).
57. Salazar A., Sanches-Lavega A. Rev. Sci. Instrum., 70, 98 (1999).58. Bertolotti M., Liakhou G., Li Voti R., Paoloni S., Sibilia C. Appl.
Phys. B, 67, 641 (1998).59. Li Y., Gupta R. Appl. Phys. B.: Lasers and Optics, 75, 103 (2002).60. Mori K., Natsuhara H., Ohashi T., Sakakiyama R., Itoh T.,
Yoshida N., Nonomura S., Fukawa M., Sato K. Rev. Sci. Instrum., 74, 863 (2003).
61. Luk’yanov A., Novikov M. Zh. Tekh. Fiz., 70 (11), 99 (2000).62. Gupte S., Marcano A., Pradhan R., Desai C.F., Melikechi J.
J. Appl. Phys., 89, 4939 (2001).63. Alexandrovski A., Route R., Fejer M. Legal Sub. Com.Meeting
(Hanford, WA, 2001, LIGO-GJ10352-00Z).64. Furukava Y., Kitamura K., Alexandrovski A., Route R.,
Fejer M., Foulon G. Appl. Phys. Lett., 78, 1970 (2001). 65. Alexandrovski A., Fejer M., Markosyan A., Route R. Proc. SPIE
Int. Soc. Opt. Eng., 7193, 71930D (2009).66. Gaume R., He Y., Markosyan A., Bayer R. J. Appl. Phys., 111,
093104 (2012).67. Harry G., Abernathy M., Becerra-Toledo A., Armandula H.,
Black E., Dooley K., Eichenfield M., Nwabugwu C., Villar A., Crooks D., Cagnoli G., Hough J., How C., MacLaren I., Murray P., Reid S., Rowan S., Sneddon P., Fejer M., Route R., Penn S., Ganau P., Mackowski J., Michel C., Pinard L., Remillieux A. Class. Quantum Grav., 24, 405 (2007).
68. Cabrera H., Marcano A., Castellanos Y. Condensed Matter Phys., 9, 385 (2006).
69. Shen J., Lowe R., Snook R. Chem. Phys., 165, 385 (1992).70. Shen J., Baesso M.L., Snook R.D. J. Appl. Phys., 75, 3738 (1994).71. Marcano A., Loper C., Melikechi N. Appl. Phys. Lett., 78, 3415 (2001).72. Marcano A., Loper C., Melikechi N. J. Opt. Soc. Am. B, 19, 119
(2002).73. Jacinto C., Catunda T. J. Phys. IV, 125, 229 (2005).74. Gupte S., Marcano A., Pradhan R., Desai C.F., Melikechi J.
J. Appl. Phys., 89, 4939 (2001).75. Brusnichkin A., Nedosekin D., Galanzha E., Vladimirov Y.,
Shevtsova E., Proskurnin M., Zharov V. J. Biophoton., 3 (12), 791 (2010).
76. Camdron R., Harris J. J. Phys. Chem., 97, 13598 (1993).77. Proskurnin M. Rev. Sci. Instr., 74, 343 (2003).78. Astrath N., Astrath F., Shen J., Zhou J., Michaelian K.,
Fairbridge C., Malacarne L., Pedreira P., Medina A., Baesso M. Opt. Lett., 34, 3460 (2009).
79. Bialkowski S. Appl. Opt., 32, 3177 (1993).80. Chartier A., Bialkowski S. Appl. Spectr., 55, 84 (2001).81. Bialkowski S. Photochem. Photobiol. Sci., 2, 779 (2003).82. Kliger D.S. Ultrasensitive Laser Spectroscopy (New York – North
Holland: Acad. Press, 1983).83. Snook R.D., Lowe R.D. Analyst, 120, 2051 (1995).84. Lima S.M., Sampaio J.A., Catunda T., Bento A.C., Miranda
L.C.M., Baesso M.L. J. Non-Cryst. Sol., 273, 215 (2000).85. Jacinto C., Messias D., Andrade A., Lima S., Baesso M., Catunda
T. J. Non-Cryst. Sol., 352, 3582 (2006).86. Saito H., Irikura M., Haraguchi M., Fukui M. Appl. Opt., 31,
2047 (1992).87. Chow R., Taylor J., Wu Z., Krupka R., Yang T. High Reflector
Absorptance Measurtments by the Surface Thermal Lensing Tech nique (UCRL-JC-125736 Preprint, LLN, 1996).
88. Wu Z., Stolz C.J., Weakley S.C., Hughes J.D., Zhao Q. Appl. Opt., 20, 1897 (2001).
89. Mandelis A., Riopel Y. J. Vac. Sci. Technol. A, 18, 705 (2000).90. Christofidies C., Nestoros M., Othonos A. Proc. SPIE Int. Soc.
Opt. Eng., 4, 4 (2000).91. Shaughnessy D., Mandelis A., Batista J., Tolev J., Li B. Semicond.
Sci. Technol., 21, 320 (2006).
92. Lopatkin V.N., Sidoryuk O.E., Skvortsov L.A. Kvantovaya Elektron., 12, 339 (1985) [ Sov. J. Quantum Electron., 15, 216 (1985)].
93. Kolodnyi G.Ya., Novopashin V.A., Skvortsov L.A. Elektron. Tekh./Lazer. Tekh. Optoelektron. Ser. 11, No. 4, 100 (1988).
94. Sidoryuk O.E., Skvortsov L.A. Zh. Prikl. Spektrosk., 56 (5- 6), 781 (1992).
95. Sidoryuk O.E., Skvortsov L.A. Zh. Prikl. Spektrosk., 64 (1), 82 (1997).
96. Watkins S.E., Heimlich R., Reis R. Proc. SPIE Int. Soc. Opt. Eng., 1624, 246 (1992).
97. Loarer T., Greffet J.J., Heutz-Aubert M. Appl. Opt., 29, 979 (1990).
98. Skvortsov L.A., Kirillov V.M. Kvantovaya Elektron., 33, 1113 (2003) [ Quantum Electron., 33, 1113 (2003)].
99. Kirillov V.M., Skvortsov L.A. Kvantovaya Elektron., 36, 797 (2006) [ Quantum Electron., 36, 797 (2006)].
100. Broussely M., Levick A., Edwards G. Intern. J. Thermophys., 26 (1), 221 (2005).
101. Martinsons C., Levick A., Edwards G. Analyt. Sci., 17, 114 (2001).
102. Fuente R., Apiñaniz E., Mendioroz A., Salazar A. J. Appl. Phys., 110, 033515 (2011).
103. Leung W., Tam A. Appl. Phys. Lett., 51, 2085 (1987).104. Kondyurin A., Sviridov A. Kvantovaya Elektron., 38, 641 (2008)
[ Quantum Electron., 38, 641 (2008)].105. Kondyurin A., Sviridov A., Obrezkova M., Lunin V. Zh. Fiz.
Khim., 83, 1575 (2009).106. Zverev G.M., Skvortsov L.A. Izv. AN SSSR, Ser. Fiz., 45 (3), 644
(1981).107. Skvortsov L.A., Kirillov V.M. Kvantovaya Elektron., 37, 1076
(2007) [ Quantum Electron., 37, 1076 (2007)].108. Cardona M. Modulation Spectroscopy (New York: Academic,
1969; Moscow: Mir, 1972).109. Rosencwaig J., Opsal W., Smith W., Willenborg D. Appl. Phys.
Lett., 46, 1013 (1985).110. Vitkin I., Cristofidies C., Mandelis A. Appl. Phys. Lett., 54, 2392
(1989).111. Sela I., Watkins D., Laurich B., Smith D., Subbana S.,
Kroemer H. Phys. Rev. B, 43, 11884 (1991).112. Avrutskii I., Osaulenko O., Plotnichenko V., Pyrkov Yu. Fiz.
Tekh. Poluprovodn., 26 (11), 1907 (1992).113. Amato G., Boarino L., Benedetto G., Spagnolo R. Thin Sol.
Films, 255, 111 (1995).114. Othonos A., Cristofidies C. Appl. Phys. Lett., 82, 904 (2002).115. Zhao Y., Zhu C., Wang S., Tian J., Yang D., Chen C., Cheng H.,
Hing P. J. Appl. Phys., 98, 4563 (2004).116. Shan W., Walukiewich W., Haller E. J. Appl. Phys., 84, 4952
(1998).117. Talaat H., El-Brolossy T., Negm S. J. Phys.: Conf. Ser., 214,
012100 (2010). 118. Misiewicz J., Sitarek P., Sek G., Kudraviec R. Mater. Sci., 21 (3),
263 (2003).119. Pollak F.H., Shen H. Mat. Sci. Eng., R10, 275 (1993).120. Vorob’ev L.E., Firsov D.A., Shalygin V.A., Panevin V.Yu.,
Safronov A.N., Yakimov A.I., Dvurechenskii A.V., Tonkikh A.A., Werner P. Fiz. Tekh. Poluprovodn., 46, 1566 (2012).
121. Campillo A., Petuchowski S., Davis C., Lin H. Appl. Phys. Lett., 41, 327 (1982).
122. Cournoyer A., Baulaigue P., Lazarides E., Blancher H., Bertrand L., Occelli R. Appl. Opt., 36, 5252 (1997).
123. Pellegrino P., Fell N., Jr., Gillespie J. Proc. SPIE Int. Soc. Opt. Eng., 4205, 4205441 (2001).
124. Nonomura S., Nishiwaki T., Nitta S. Philos. Mag. B, 29, 335 (1994).
125. Seraphin B., Bottka N. Phys. Rev., 145, 628 (1966).126. White W., Henesian M., Weber M. J. Opt. Soc. Am. B, 2, 1402
(1985).127. Petrocelli G., Scudieri F., Martellucci S. Appl. Phys. B, 52, 123
(1991).128. Eva E., Mann K. Appl. Phys. A, 62, 143 (1996).
13Laser photothermal spectroscopy of light-induced absorption
129. Perry J., Mansour K., Lee I., Wu X., Bedworth, P., Chen C., Ng D., Marder S., Miles P., Wada T., Tian M., Sasabe H. Science, 273, 1533 (1996).
130. Kaatz P., Shelton D. J. Opt. Soc. Am. B, 16, 998 (1999).131. Denk W., Strickler J., Webb W. Science, 248, 73 (1990).132. Bhawalkar J., Kumar N., Zhao C., Prasad P. J. Clin. Laser. Med.
Surg., 15, 201 (1997).133. Twarowski A., Kliger D. Chem. Phys., 20, 253 (1977).134. Kamada K., Matsunaga K., Yoshino A., Ohta K. J. Opt. Soc.
Am. B, 20, 529 (2003).135. Alahmed Z., Gupta R. Appl. Phys. B, 79, 741 (2004).136. Twarowski A., Kliger D. Chem. Phys., 20, 259 (1977).137. Fang H., Gustafson T., Swofford R. J. Chem. Phys., 78, 1663
(1983).138. Kurian A., Lee S., Unnikrishnan K., George D., Nampoori V.,
Vallabhan C. J. Nonlinear Opt. Phys. Mater., 12, 75 (2003).139. Halvorson C., Heeger A. Chem. Phys. Lett., 216, 488 (1993).140. Han J., Rosenshein J., Wu Z., Ye W., Thomsen M., Zhao Q. Opt.
Eng., 40, 303 (2001).141. Li B., Martin S., Welsh E. Proc. SPIE Int. Soc. Opt. Eng., 82, 4347
(2001).142. Castillo J., Kozich V., Marcano O. Opt. Lett., 19, 171 (1994).143. Imangholi B., Hasselbesk M., Sheik-Bahae M. Opt. Commun.,
227, 337 (2003).144. Ganeev R., Ryasnyansky A., Tigushev R., Kodirov M.,
Akhmedjanov F., Usmanov T. Opt. Quantum Electron., 36, 807 (2004).
145. Sheik-Bahae M., Said A., Wei T., Hagan D., Van Stryland E. IEEE Quantum Electron., 26, 760 (1990).
146. Silva D., Azeka L., Zillo S., Misoguti L., Mendonca C. Opt. Commun., 251, 423 (2005).
147. Rodrigez L., Echevarria L., Fernandez A. Opt. Commun., 277, 181 (2007).
148. Marcano A., Williams K., Melikechi N. Opt. Commun., 281, 2598 (2008).
Copyright © 2022 FDOKUMEN