
Effect of pruning strategy on 'Syrah' bud necrosis ... - Hal Inrae
Upload
uni-freiburgCategory
view
3download
0
This article appeared in a journal published by Elsevier. The attachedcopy is furnished to the author for internal non-commercial researchand education use, including for instruction at the authors institution
and sharing with colleagues.
Other uses, including reproduction and distribution, or selling orlicensing copies, or posting to personal, institutional or third party
websites are prohibited.
In most cases authors are permitted to post their version of thearticle (e.g. in Word or Tex form) to their personal website orinstitutional repository. Authors requiring further information
regarding Elsevier’s archiving and manuscript policies areencouraged to visit:
http://www.elsevier.com/copyright
Author's personal copy
Photosynthetic response to green crown pruning in young plantation-grownEucalyptus pilularis and E. cloeziana
Philip J. Alcorn a,b,*, Jurgen Bauhus b,c, Dane S. Thomas d, Ryde N. James b, R. Geoff B. Smith d,Adrienne B. Nicotra a
a School of Botany and Zoology, The Australian National University, Canberra, ACT 0200, Australiab Fenner School of Environment and Society, The Australian National University, Canberra, ACT 0200, Australiac Institute of Silviculture, Freiburg University, D-79085 Freiburg, Germanyd Forests NSW, PO Box J19, Coffs Harbour, NSW 2450, Australia
1. Introduction
Pruning is a silvicultural treatment that directly reduces leaf areaavailable for photosynthesis. Intuitively, one expects that pruningtherefore reduces, at least in the short-term, the growth of trees.However, there may be up-regulation of photosynthesis in theremaining foliage leading to compensatory growth. The phenom-enon of enhanced photosynthesis in the remaining foliage followingreductions in the foliage has been shown in a wide-range of species(Heichel and Turner, 1983; von Caemmerer and Farquhar, 1984;Ovaska et al., 1992; Layne and Flore, 1995; Pinkard et al., 1998). Theincreased photosynthetic activity may occur because leaves oftenfunction below their maximum photosynthetic capacity (Wareinget al., 1968; Lovett Doust, 1989; Harbinson, 1994), in particular in
the lower part of tree crowns, which are subject to pruning of livebranches. A number of mechanisms have been identified that wouldallow for enhanced photosynthesis of remaining foliage, includingchanges in intracellular or stomatal carbon dioxide transport or rateof carboxylation in the cell (Hartt et al., 1964; Thorne and Koller,1974; Nafziger and Koller, 1976), increased assimilate demandfollowing loss of foliage (Hartt et al., 1964; Wareing et al., 1968;Thorne and Koller, 1974; Nafziger and Koller, 1976), elevatedhormone concentrations in the remaining foliage (Ovaska et al.,1993) and/or increased foliar nitrogen concentrations (Hoogestegerand Karlsson, 1992). The result of this up-regulation of photosynth-esis is an enhanced capacity to lead to compensatory growth (Senocket al., 1991).
There are many factors that may affect the magnitude andduration of photosynthetic response following defoliation. It hasgenerally been observed that increasing the intensity of defoliationincreases photosynthetic up-regulation (Pinkard et al., 1998), untilthe rate of biochemical reactions reaches a maximum (vonCaemmerer and Farquhar, 1984). The species (Heichel and Turner,1983), frequency of leaf-area removal (Wallace et al., 1984), leaf
Forest Ecology and Management 255 (2008) 3827–3838
A R T I C L E I N F O
Article history:
Received 12 June 2007
Received in revised form 13 March 2008
Accepted 18 March 2008
Keywords:
Eucalyptus pilularis
Eucalyptus cloeziana
Photosynthesis
Pruning
Up-regulation
A B S T R A C T
The loss of foliage through pruning of live branches may reduce tree growth or it may be compensated by
photosynthetic up-regulation of the remaining crown. Here, the changes in light-saturated
photosynthesis following pruning to remove 50% of green crown length were examined in 4-year-old
Eucalyptus pilularis Sm. and Eucalyptus cloeziana F. Muell. trees. The objectives of the study were to: (1)
compare leaf-level physiological (light-saturated photosynthesis (Amax), stomatal conductance (g),
transpiration (T), dark respiration (Rd), quantum yield (F), light compensation point (G), water-use
efficiency (WUE), nitrogen-use efficiency (NUE)) traits in species with contrasting crown dynamics and
structure, (2) examine the effect of crown position on these traits, and (3) examine the effect of pruning
on Amax, g, T, WUE, NUE, leaf N and P concentrations and specific leaf area (SLA). Prior to pruning there
were no differences in Rd, G and F between E. pilularis and E. cloeziana but differences in Amax, T, g, leaf N,
leaf P, WUE, NUE and SLA. Whereas the rate of physiological processes (Amax, T, and g) and leaf N and P
concentrations increased with crown height, Rd, G, F and SLA declined along this vertical gradient, except
in the upper crown of E. cloeziana where Amax, T and g were not different to the lower crown. No up-
regulation of photosynthesis or changes in leaf physiology occurred between 6 and 13 months after
pruning in either species. The results provide an important basis for modelling pruning effects in process-
based tree growth models.
� 2008 Elsevier B.V. All rights reserved.
* Corresponding author at: Nicotra Laboratory, School of Botany and Zoology, The
Australian National University, Canberra, ACT 0200, Australia.
Tel.: +61 2 6125 2671; fax: +61 2 6125 5573.
E-mail address: [email protected] (P.J. Alcorn).
Contents l is ts ava i lab le at ScienceDirec t
Forest Ecology and Management
journal homepage: www.e lsev ier .com/ locate / foreco
0378-1127/$ – see front matter � 2008 Elsevier B.V. All rights reserved.
doi:10.1016/j.foreco.2008.03.030
Author's personal copy
age (Pinkard et al., 1998), plant size and age (Reich et al., 1993) andnitrogen availability (Ovaska et al., 1993) can all influence themagnitude and duration of the photosynthetic response. Sincepruning in plantation-grown trees removes the lower branches,which are generally of lower productivity due to shading fromneighbouring trees and upper crown sections (Pinkard et al., 1998),the photosynthetic responses may be less through the removal ofmore productive upper crown foliage. While the magnitude andduration of the photosynthetic response to foliage removal is well-studied in glass-house seedlings, there have been few studiesconducted on trees (e.g. Pinkard et al., 1998). Even fewer studieshave examined the photosynthetic responses to pruning defolia-tion in Eucalyptus trees (e.g. Pinkard et al., 1998; Ngugi et al., 2004).
This paper describes a study carried out under field conditionsat the Southgate research site, north-eastern New South Wales,Australia, to examine the physiological difference in leaf traitsbetween Eucalyptus pilularis Sm. and Eucalyptus cloeziana F. Muelland response to pruning. The two species possess quite contrastingcrown dynamics in young plantations. In E. pilularis branches areshed much sooner than in E. cloeziana trees of the same age.Consequently, E. cloeziana retains a deeper live crown than E.
pilularis (Smith et al., 2006; Alcorn et al., 2007). This difference incrown dynamics suggests that E. cloeziana is more shade-tolerantthan E. pilularis, since its foliage may endure a greater level of self-shading within crowns. Consequently, foliage in the lower crownof E. cloeziana might be expected to display the characteristics ofgreater tolerance to low light including foliage with lower light-saturated photosynthesis rates, lower dark respiration rates andlower light intensities at which photosynthesis and respiration areequal (light compensation point) (e.g. Larcher, 1995; Florence,1996). In addition, the foliage in the lower crown of E. cloeziana
may use water and nutrients more effectively as comparablefoliage in E. pilularis, so that lower branches can contribute towhole tree assimilation for longer. Two common measures offoliage resource efficiency include the water-use and the nitrogen-use efficiency of photosynthesis (e.g. Larcher, 1995). The efficiencyalso depends largely on the foliage construction costs, which canbe expressed as the ratio of leaf surface area to dry weight (specificleaf area) (e.g. Evans and Poorter, 2001). Therefore, we analysedhow these measures of efficiency of foliage differed between thedifferent crown positions in the two species.
An earlier experiment at the Southgate research site found thatpruning to remove 50% of the green crown length in young E. pilularis
and E. cloeziana did not result in significant reductions in theincrement of height or stem diameter at breast height in trees of bothspecies over a 2-year period (Alcorn et al., 2008). Given that growthrates were not reduced at this site, it is predicted that an up-regulation of leaf photosynthesis occurred to compensate for theloss of leaf area. This experiment therefore tested the hypothesesthat (a) there are large effects of crown position on physiological leaftraits in both species, (b) there are differences in the physiologicalleaf traits between species with contrasting crown dynamics and (c)there would be evidence of up-regulation of photosynthesisfollowing pruning to remove 50% of the live crown in both species.
2. Methods
2.1. Study site and treatment design
The pruning trial was established at Southgate, an experimentalplantation located near Nana Glen in north-eastern New SouthWales (30810S, 153880E) (for full site description see Alcorn et al.,2008).
Trees of E. pilularis and E. cloeziana located in four plotsestablished at 1250 trees ha�1 were selected for this experiment.
Eight trees of each species were selected from the co-dominant ordominant crown classes (Smith et al., 1997), they were straight andsingle stemmed, free of visible health defects and surrounded byeight immediate neighbours in each direction. On 6 October 2004,four selected trees were pruned to remove the lower 50% of thelength of the green crown. Green crown length was visuallydefined as the distance between the tree height and the steminsertion height of the lowest green branch contained within ageometrically regular crown envelope (Soares and Tome, 2001).Branches were pruned perpendicular to the branch axes as close tothe stem as possible using pruning shears. Unpruned trees servedas controls.
2.2. Gas exchange measurements
Light response curves were determined on a single occasion forthree leaves from each of the four trees of each species randomlyselected before pruning in late September 2004. Measurementswere made on the youngest fully expanded leaf on the northern side(sun-exposed side) of the crown from the lower (25% of the greencrown length), middle (60% of the green crown length) and upper(85% of the green crown length) positions. Leaf gas exchange wasmeasured using a LI-6400 (LI-COR, Lincoln, Nebraska) portable gasexchange system with a 6400-02B LED leaf chamber. Leaves wereinitially dark adapted by wrapping the leaf and leaf cuvette in a blackcloth to determine dark respiration (Rd) when the photosyntheticphoton flux density (PPFD) level was 0 mmol m�2 s�1. PPFD wasprogressively increased using the leaf chamber red and blue lightdiodes in 10 steps from 0 to a maximum of 3000 mmol m�2 s�1,allowing for an acclimation period of 3–8 min following adjustmentof light levels and recording measurements when the photosyn-thetic rates were stable. A flow rate of 200 mmol s�1 was used andthe reference CO2 concentration was set at 370 mmol CO2 mol�1 air.Leaf chamber humidity of 60–80% and leaf temperature of 26–28 8Cwas maintained during all measurements. Measurements weremade over 4 days between 08:00 and 13:00 EST.
Apparent quantum yield (F) and Rd were estimated frommeasured data. Values of F, were calculated as the slope ofphotosynthesis (A) by irradiance between 50 and 100 mmol m�2 s�1.Light compensation points (G) were estimated by extrapolatingbetween measured data. Light saturation was defined as thephotosynthetic photon flux density of 2000 mmol m�2 s�1.
Measurements of light-saturated photosynthesis (Amax), tran-spiration (T) and stomatal conductance (g) were made prior topruning (September 2004) and on three occasions followingpruning in March, July and November 2005 on unpruned and 50%pruned treatments. Measurements of Amax were made at1000 mmol m�2 s�1, approximately 90% saturation (determinedfrom light response curves) and the same leaf cuvette conditionsas above. All measurements were made between 08:00 and 13:00EST. Pre-pruning Amax measurements were derived from thelight–response curves taken on leaves from four out of the eighttrees selected for each species. Additional pre-pruning measure-ments of Amax were made on leaves from the four trees selected forthe experiment from each species that were not measured forlight–response curves. Measurements were made over 4 days,with two trees (unpruned and 50% pruned tree) of each speciesbeing randomly selected for measurement on the same day.Measurements were made on three fully expanded leavesselected from the northern side of the crown in the lower (25%of the green crown length), middle (60% of the green crownlength) and upper (85% of the green crown length) crownpositions at the time of pruning. An additional crown zone wasadded at the first post-pruning measurement to account for Amax
on new foliage produced through the height growth after pruning
P.J. Alcorn et al. / Forest Ecology and Management 255 (2008) 3827–38383828
Author's personal copy
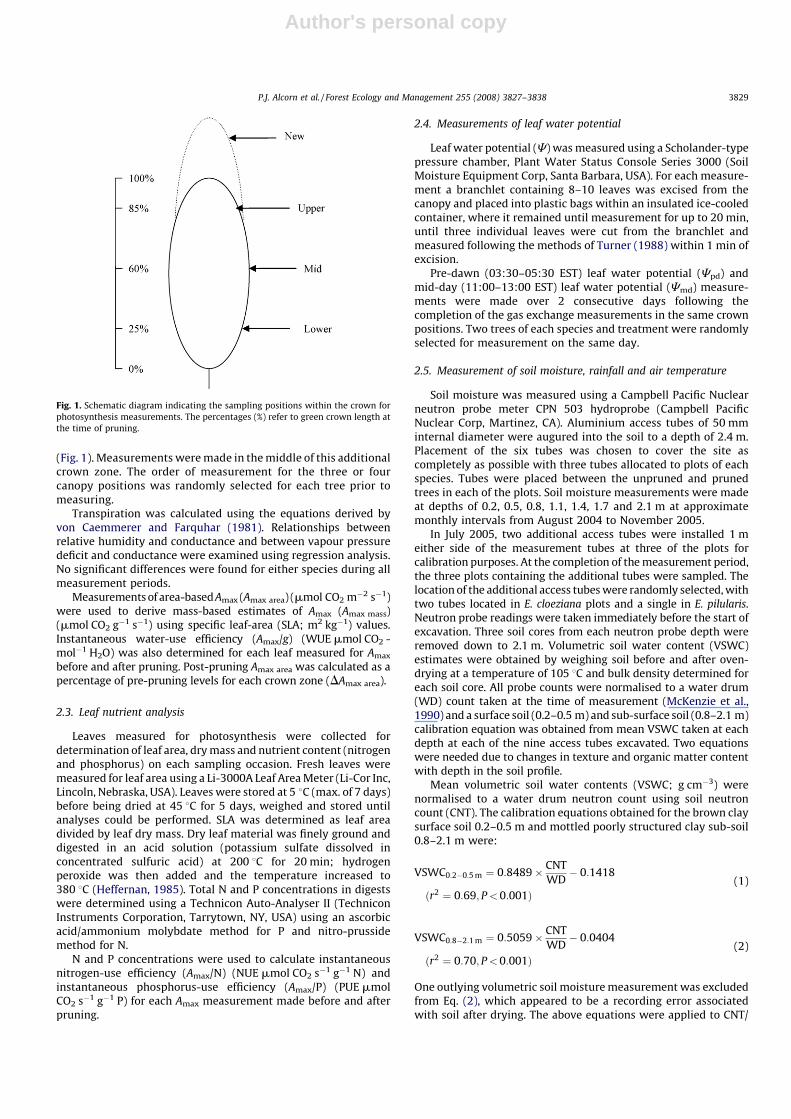
(Fig. 1). Measurements were made in the middle of this additionalcrown zone. The order of measurement for the three or fourcanopy positions was randomly selected for each tree prior tomeasuring.
Transpiration was calculated using the equations derived byvon Caemmerer and Farquhar (1981). Relationships betweenrelative humidity and conductance and between vapour pressuredeficit and conductance were examined using regression analysis.No significant differences were found for either species during allmeasurement periods.
Measurements of area-based Amax (Amax area) (mmol CO2 m�2 s�1)were used to derive mass-based estimates of Amax (Amax mass)(mmol CO2 g�1 s�1) using specific leaf-area (SLA; m2 kg�1) values.Instantaneous water-use efficiency (Amax/g) (WUE mmol CO2 -mol�1 H2O) was also determined for each leaf measured for Amax
before and after pruning. Post-pruning Amax area was calculated as apercentage of pre-pruning levels for each crown zone (DAmax area).
2.3. Leaf nutrient analysis
Leaves measured for photosynthesis were collected fordetermination of leaf area, dry mass and nutrient content (nitrogenand phosphorus) on each sampling occasion. Fresh leaves weremeasured for leaf area using a Li-3000A Leaf Area Meter (Li-Cor Inc,Lincoln, Nebraska, USA). Leaves were stored at 5 8C (max. of 7 days)before being dried at 45 8C for 5 days, weighed and stored untilanalyses could be performed. SLA was determined as leaf areadivided by leaf dry mass. Dry leaf material was finely ground anddigested in an acid solution (potassium sulfate dissolved inconcentrated sulfuric acid) at 200 8C for 20 min; hydrogenperoxide was then added and the temperature increased to380 8C (Heffernan, 1985). Total N and P concentrations in digestswere determined using a Technicon Auto-Analyser II (TechniconInstruments Corporation, Tarrytown, NY, USA) using an ascorbicacid/ammonium molybdate method for P and nitro-prussidemethod for N.
N and P concentrations were used to calculate instantaneousnitrogen-use efficiency (Amax/N) (NUE mmol CO2 s�1 g�1 N) andinstantaneous phosphorus-use efficiency (Amax/P) (PUE mmolCO2 s�1 g�1 P) for each Amax measurement made before and afterpruning.
2.4. Measurements of leaf water potential
Leaf water potential (C) was measured using a Scholander-typepressure chamber, Plant Water Status Console Series 3000 (SoilMoisture Equipment Corp, Santa Barbara, USA). For each measure-ment a branchlet containing 8–10 leaves was excised from thecanopy and placed into plastic bags within an insulated ice-cooledcontainer, where it remained until measurement for up to 20 min,until three individual leaves were cut from the branchlet andmeasured following the methods of Turner (1988) within 1 min ofexcision.
Pre-dawn (03:30–05:30 EST) leaf water potential (Cpd) andmid-day (11:00–13:00 EST) leaf water potential (Cmd) measure-ments were made over 2 consecutive days following thecompletion of the gas exchange measurements in the same crownpositions. Two trees of each species and treatment were randomlyselected for measurement on the same day.
2.5. Measurement of soil moisture, rainfall and air temperature
Soil moisture was measured using a Campbell Pacific Nuclearneutron probe meter CPN 503 hydroprobe (Campbell PacificNuclear Corp, Martinez, CA). Aluminium access tubes of 50 mminternal diameter were augured into the soil to a depth of 2.4 m.Placement of the six tubes was chosen to cover the site ascompletely as possible with three tubes allocated to plots of eachspecies. Tubes were placed between the unpruned and prunedtrees in each of the plots. Soil moisture measurements were madeat depths of 0.2, 0.5, 0.8, 1.1, 1.4, 1.7 and 2.1 m at approximatemonthly intervals from August 2004 to November 2005.
In July 2005, two additional access tubes were installed 1 meither side of the measurement tubes at three of the plots forcalibration purposes. At the completion of the measurement period,the three plots containing the additional tubes were sampled. Thelocation of the additional access tubes were randomly selected, withtwo tubes located in E. cloeziana plots and a single in E. pilularis.Neutron probe readings were taken immediately before the start ofexcavation. Three soil cores from each neutron probe depth wereremoved down to 2.1 m. Volumetric soil water content (VSWC)estimates were obtained by weighing soil before and after oven-drying at a temperature of 105 8C and bulk density determined foreach soil core. All probe counts were normalised to a water drum(WD) count taken at the time of measurement (McKenzie et al.,1990) and a surface soil (0.2–0.5 m) and sub-surface soil (0.8–2.1 m)calibration equation was obtained from mean VSWC taken at eachdepth at each of the nine access tubes excavated. Two equationswere needed due to changes in texture and organic matter contentwith depth in the soil profile.
Mean volumetric soil water contents (VSWC; g cm�3) werenormalised to a water drum neutron count using soil neutroncount (CNT). The calibration equations obtained for the brown claysurface soil 0.2–0.5 m and mottled poorly structured clay sub-soil0.8–2.1 m were:
VSWC0:2�0:5 m ¼ 0:8489� CNT
WD� 0:1418
ðr2 ¼ 0:69; P<0:001Þ(1)
VSWC0:8�2:1 m ¼ 0:5059� CNT
WD� 0:0404
ðr2 ¼ 0:70; P<0:001Þ(2)
One outlying volumetric soil moisture measurement was excludedfrom Eq. (2), which appeared to be a recording error associatedwith soil after drying. The above equations were applied to CNT/
Fig. 1. Schematic diagram indicating the sampling positions within the crown for
photosynthesis measurements. The percentages (%) refer to green crown length at
the time of pruning.
P.J. Alcorn et al. / Forest Ecology and Management 255 (2008) 3827–3838 3829

Author's personal copy
WD data collected over the course of the experiment to calculateVSWC as a percentage of total volume.
Measurements of rainfall were made using a 0.2 mm tipping-bucket rain gauge with a bucket located 200 m from theexperimental site. A Starlog 6003B Portable Data Logger (UnidataPty Ltd., Perth, Western Australia, Australia) was attached andprogrammed to record total rainfall at 15 min intervals. Maximumand minimum temperatures were derived from interpolatedclimate surfaces (Anon., 2007).
2.6. Data analysis
Residual maximum likelihood (REML) variance componentsanalysis was conducted to examine the effect of crown positionand species on fourteen leaf traits collected prior to pruning,including Rd, G, F, Cpd, Amax area, Amax mass, T, g, N, P, WUE, NUE, PUEand SLA.
For each species, the effect of pruning treatment and crownposition on leaf physiology was also examined using REMLvariance components analysis. Mean Amax, DAmax, T, g, N, P,WUE, NUE, PUE, SLA, Cpd and Cmd were analysed separately 6, 10and 13 months after pruning. All analyses were performed usingGenstat (VSN International 2004, Hemel Hempstead, Herts, UK).Regression analysis was used to examine relationships betweenAmax and N.
3. Results
3.1. The effect of crown position on leaf-level photosynthesis
Rd, G, F) and Cpd varied with crown position but not speciesprior to pruning (Table 1). With increasing height in the crown, Rd,G and F increased (Table 2).
Amax area, Amax mass, T, g, N, P, WUE, NUE, PUE and SLA varied withcrown position and species. In both species Amax area, Amax mass, T, g,and N and P foliar concentrations increased with increasing heightabove the ground, except in the upper crown position of E. cloeziana
where Amax area and Amax mass, T and g were not significantly differentfrom the lowest crown position. Amax area, Amax mass, T and g weresignificantly lower in the upper crown position of E. cloeziana than inthe upper crown of E. pilularis. The ranges of leaf N and Pconcentrations measured in the crown were greater in E. cloeziana
than E. pilularis (Table 2). N and P concentrations were lower in thelower crown of E. cloeziana than E. pilularis, while N concentrations inthe mid-crown were higher in E. cloeziana than E. pilularis. WUE wassignificantly lower in the lower crown of E. cloeziana than E. pilularis,while NUE and PUE were significantly lower in the upper crown of E.
cloeziana when compared to E. pilularis. SLA declined with increasingheight in the crown of both species. In the middle and lower crownpositions, SLA was significantly higher in E. cloeziana than in E.
pilularis (Table 2).
Table 1Summary of REML variance components analysis conducted to determine the effect of crown position and species on physiological and morphological leaf traits in E. pilularis
and E. cloeziana trees prior to pruning
Leaf trait No. trees Crown position Species Crown position � species
d.f. Wald statistic Chi P-value d.f. Wald statistic Chi P-value d.f. Wald statistic Chi P-value
Rd (mmol CO2 m�2 s�1) 4 2 71.17 <0.001 1 0.01 0.943 2 1.12 0.570
G (mmol m�2 s�1) 4 2 50.86 <0.001 1 0.55 0.457 2 1.98 0.371
F (mol mol�1) 4 2 21.37 <0.001 1 0.70 0.403 2 2.14 0.343
Cpd (MPa) 4 2 16.02 <0.001 1 0.00 0.974 2 5.40 0.067
Amax area (mmol CO2 m�2 s�1) 8 2 38.02 <0.001 1 1.38 0.239 2 18.63 <0.001
Amax mass (mmol CO2 g�1 s�1) 8 2 6.44 0.040 1 0.06 0.799 2 18.01 <0.001
T (mmol H2O m�2 s�1) 8 2 8.14 0.017 1 0.10 0.751 2 10.77 0.005
g (mol H2O m�2 s�1) 8 2 12.99 0.002 1 0.15 0.699 2 6.30 0.043
N (g m�2) 8 2 119.99 <0.001 1 0.70 0.403 2 11.03 0.004
P (g m�2) 8 2 87.39 <0.001 1 0.47 0.494 2 8.72 0.013
WUE (mmol CO2 mol�1 H2O) 8 2 3.38 0.185 1 0.02 0.899 2 6.69 0.035
NUE (mmol CO2 s�1 g�1 N) 8 2 12.16 0.002 1 2.54 0.111 2 18.77 <0.001
PUE (mmol CO2 s�1 g�1 P) 8 2 8.67 0.013 1 0.06 0.799 2 27.98 <0.001
SLA (m2 kg�1) 8 2 108.55 <0.001 1 56.58 <0.001 2 40.57 <0.001
Table 2Predicted means from REML variance components analysis conducted to determine the effect of crown position (lower, middle, upper) and species on leaf physiology traits in
E. pilularis and E. cloeziana trees prior to pruning
E. pilularis E. cloeziana SEDpos SEDsp
Lower Middle Upper Lower Middle Upper
Rd (mmol CO2 m�2 s�1) �1.03 aA �1.69 aA �2.96 bA �0.81 aA �1.97 bA �2.93 cA 0.36 0.34
G (mmol m�2 s�1) 22.56 aA 26.03 aA 38.66 bA 16.67 aA 27.33 bA 36.80 cA 4.13 3.62
F (mol mol�1) 0.020 aA 0.036 abA 0.045 bA 0.029 aA 0.048 aA 0.044 aA 0.01 0.01
Cpd (MPa) 0.29 aA 0.19 bA 0.31 aA 0.26 aA 0.24 aA 0.28 aA 0.05 0.03
Amax area (mmol CO2 m�2 s�1) 6.07 aA 9.40 bA 12.45 cA 6.06 aA 10.76 bA 7.23 aA 1.43 1.09
Amax mass (mmol g�1 s�1) 57.14 aA 77.32 aA 80.36 aA 80.20 aA 94.77 aA 53.86 bA 11.68 10.53
T (mmol H2O m�2 s�1) 1.15 aA 1.77 abA 2.23 bA 1.56 aA 1.89 aA 1.42 aA 0.38 0.27
g (mol H2O m�2 s�1) 0.07 aA 0.11 abA 0.15 bA 0.09 aA 0.13 aA 0.09 aA 0.03 0.02
N (g m�2) 1.18 aA 1.52 aA 2.22 bA 0.89 aA 2.02 bA 2.44 bA 0.22 0.17
P (g m�2) 0.10 aA 0.12 aA 0.13 aA 0.05 aA 0.15 bA 0.17 bA 0.02 0.02
WUE (mmol CO2 mol�1 H2O) 89.60 aA 86.47 aA 80.90 aA 68.39 aA 94.40 aA 96.55 aA 10.70 10.08
NUE (mmol CO2 s�1 g�1 N) 5.31 aA 6.26 aA 5.86 aA 6.67 aA 5.30 aA 3.04 bA 0.76 0.68
PUE (mmol CO2 s�1 g�1 P) 65.64 aA 84.20 aA 82.86 aA 114.61 aA 75.81 bA 52.10 bA 15.69 10.95
SLA (m2 kg�1) 8.75 aA 7.91 abA 6.94 bA 14.53 aB 9.18 bB 7.90 cA 0.60 0.60
Means sharing the same lower case letters are not significantly different from other positions within a species and means sharing the same upper case letters are not
significantly different from the same position on the alternate species (P < 0.05). Standard errors of difference between position (SEDpos) and species (SEDsp) are provided.
Bold SED values indicate a significant effect (Chi P < 0.05).
P.J. Alcorn et al. / Forest Ecology and Management 255 (2008) 3827–38383830
Author's personal copy
3.2. The effect of pruning on leaf-level photosynthesis
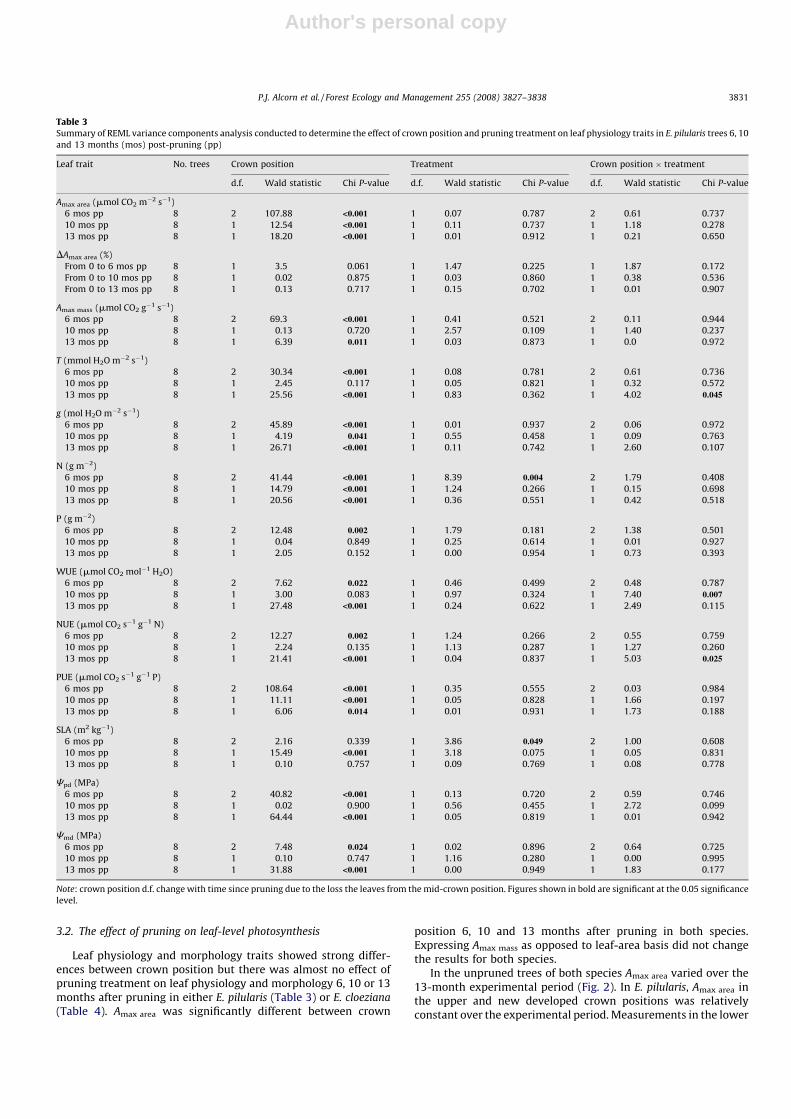
Leaf physiology and morphology traits showed strong differ-ences between crown position but there was almost no effect ofpruning treatment on leaf physiology and morphology 6, 10 or 13months after pruning in either E. pilularis (Table 3) or E. cloeziana
(Table 4). Amax area was significantly different between crown
position 6, 10 and 13 months after pruning in both species.Expressing Amax mass as opposed to leaf-area basis did not changethe results for both species.
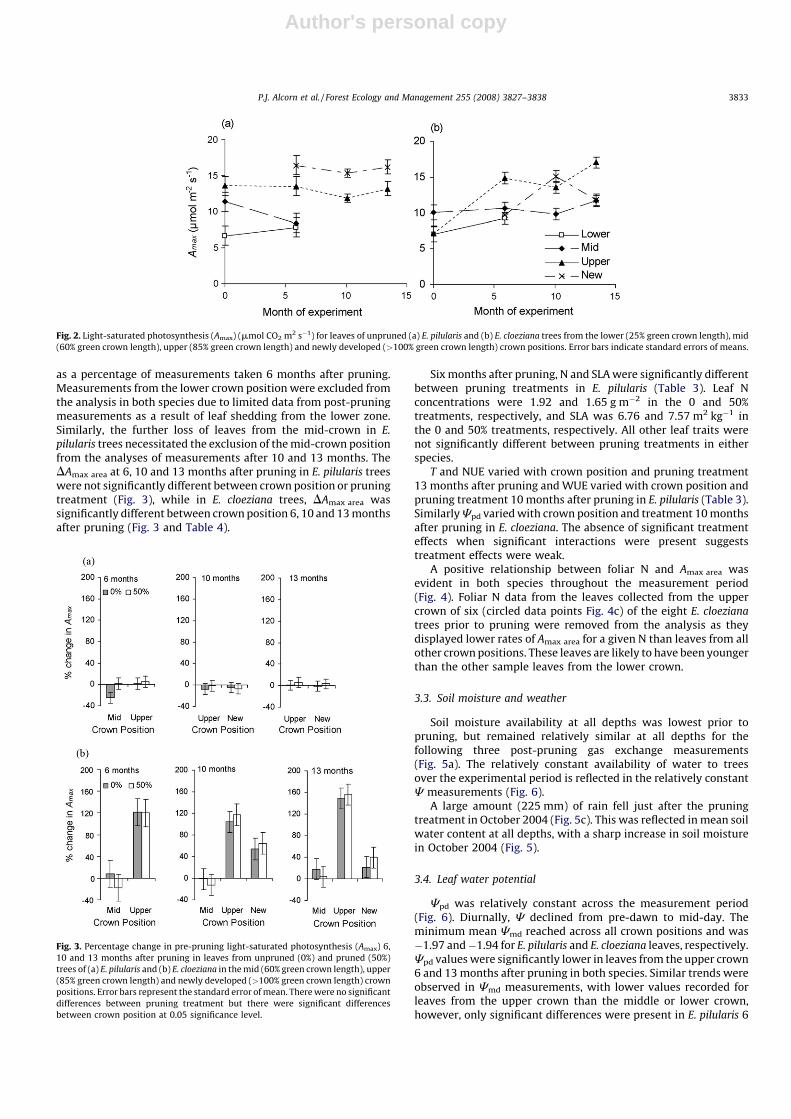
In the unpruned trees of both species Amax area varied over the13-month experimental period (Fig. 2). In E. pilularis, Amax area inthe upper and new developed crown positions was relativelyconstant over the experimental period. Measurements in the lower
Table 3Summary of REML variance components analysis conducted to determine the effect of crown position and pruning treatment on leaf physiology traits in E. pilularis trees 6, 10
and 13 months (mos) post-pruning (pp)
Leaf trait No. trees Crown position Treatment Crown position � treatment
d.f. Wald statistic Chi P-value d.f. Wald statistic Chi P-value d.f. Wald statistic Chi P-value
Amax area (mmol CO2 m�2 s�1)
6 mos pp 8 2 107.88 <0.001 1 0.07 0.787 2 0.61 0.737
10 mos pp 8 1 12.54 <0.001 1 0.11 0.737 1 1.18 0.278
13 mos pp 8 1 18.20 <0.001 1 0.01 0.912 1 0.21 0.650
DAmax area (%)
From 0 to 6 mos pp 8 1 3.5 0.061 1 1.47 0.225 1 1.87 0.172
From 0 to 10 mos pp 8 1 0.02 0.875 1 0.03 0.860 1 0.38 0.536
From 0 to 13 mos pp 8 1 0.13 0.717 1 0.15 0.702 1 0.01 0.907
Amax mass (mmol CO2 g�1 s�1)
6 mos pp 8 2 69.3 <0.001 1 0.41 0.521 2 0.11 0.944
10 mos pp 8 1 0.13 0.720 1 2.57 0.109 1 1.40 0.237
13 mos pp 8 1 6.39 0.011 1 0.03 0.873 1 0.0 0.972
T (mmol H2O m�2 s�1)
6 mos pp 8 2 30.34 <0.001 1 0.08 0.781 2 0.61 0.736
10 mos pp 8 1 2.45 0.117 1 0.05 0.821 1 0.32 0.572
13 mos pp 8 1 25.56 <0.001 1 0.83 0.362 1 4.02 0.045
g (mol H2O m�2 s�1)
6 mos pp 8 2 45.89 <0.001 1 0.01 0.937 2 0.06 0.972
10 mos pp 8 1 4.19 0.041 1 0.55 0.458 1 0.09 0.763
13 mos pp 8 1 26.71 <0.001 1 0.11 0.742 1 2.60 0.107
N (g m�2)
6 mos pp 8 2 41.44 <0.001 1 8.39 0.004 2 1.79 0.408
10 mos pp 8 1 14.79 <0.001 1 1.24 0.266 1 0.15 0.698
13 mos pp 8 1 20.56 <0.001 1 0.36 0.551 1 0.42 0.518
P (g m�2)
6 mos pp 8 2 12.48 0.002 1 1.79 0.181 2 1.38 0.501
10 mos pp 8 1 0.04 0.849 1 0.25 0.614 1 0.01 0.927
13 mos pp 8 1 2.05 0.152 1 0.00 0.954 1 0.73 0.393
WUE (mmol CO2 mol�1 H2O)
6 mos pp 8 2 7.62 0.022 1 0.46 0.499 2 0.48 0.787
10 mos pp 8 1 3.00 0.083 1 0.97 0.324 1 7.40 0.007
13 mos pp 8 1 27.48 <0.001 1 0.24 0.622 1 2.49 0.115
NUE (mmol CO2 s�1 g�1 N)
6 mos pp 8 2 12.27 0.002 1 1.24 0.266 2 0.55 0.759
10 mos pp 8 1 2.24 0.135 1 1.13 0.287 1 1.27 0.260
13 mos pp 8 1 21.41 <0.001 1 0.04 0.837 1 5.03 0.025
PUE (mmol CO2 s�1 g�1 P)
6 mos pp 8 2 108.64 <0.001 1 0.35 0.555 2 0.03 0.984
10 mos pp 8 1 11.11 <0.001 1 0.05 0.828 1 1.66 0.197
13 mos pp 8 1 6.06 0.014 1 0.01 0.931 1 1.73 0.188
SLA (m2 kg�1)
6 mos pp 8 2 2.16 0.339 1 3.86 0.049 2 1.00 0.608
10 mos pp 8 1 15.49 <0.001 1 3.18 0.075 1 0.05 0.831
13 mos pp 8 1 0.10 0.757 1 0.09 0.769 1 0.08 0.778
Cpd (MPa)
6 mos pp 8 2 40.82 <0.001 1 0.13 0.720 2 0.59 0.746
10 mos pp 8 1 0.02 0.900 1 0.56 0.455 1 2.72 0.099
13 mos pp 8 1 64.44 <0.001 1 0.05 0.819 1 0.01 0.942
Cmd (MPa)
6 mos pp 8 2 7.48 0.024 1 0.02 0.896 2 0.64 0.725
10 mos pp 8 1 0.10 0.747 1 1.16 0.280 1 0.00 0.995
13 mos pp 8 1 31.88 <0.001 1 0.00 0.949 1 1.83 0.177
Note: crown position d.f. change with time since pruning due to the loss the leaves from the mid-crown position. Figures shown in bold are significant at the 0.05 significance
level.
P.J. Alcorn et al. / Forest Ecology and Management 255 (2008) 3827–3838 3831
Author's personal copy
and mid-canopy positions of E. pilularis could not be continuedafter the 6-month post-pruning period as leaves within the lowerand mid-crown positions were shed from stems between 6 and 10months after the first measurement. A slight increase in Amax area
was observed in the lower crown of E. pilularis 6 months after thefirst measurement, while decreases were observed in the mid-crown. Very few leaves remained on the lower and mid-crownbranches during this measurement. Amax in E. cloeziana trees were
relatively constant within the mid-crown over the experiment,however large changes were observed in the upper and newdeveloped crown. No leaves were present on the northern side ofthe lower crown 10 months after first measurement.
To further examine the change in Amax over the 13-monthmeasurement period, post-pruning measurements of Amax area
were expressed as a percentage of pre-pruning levels (DAmax area).Data for the newly developed crown zone (>100%) was expressed
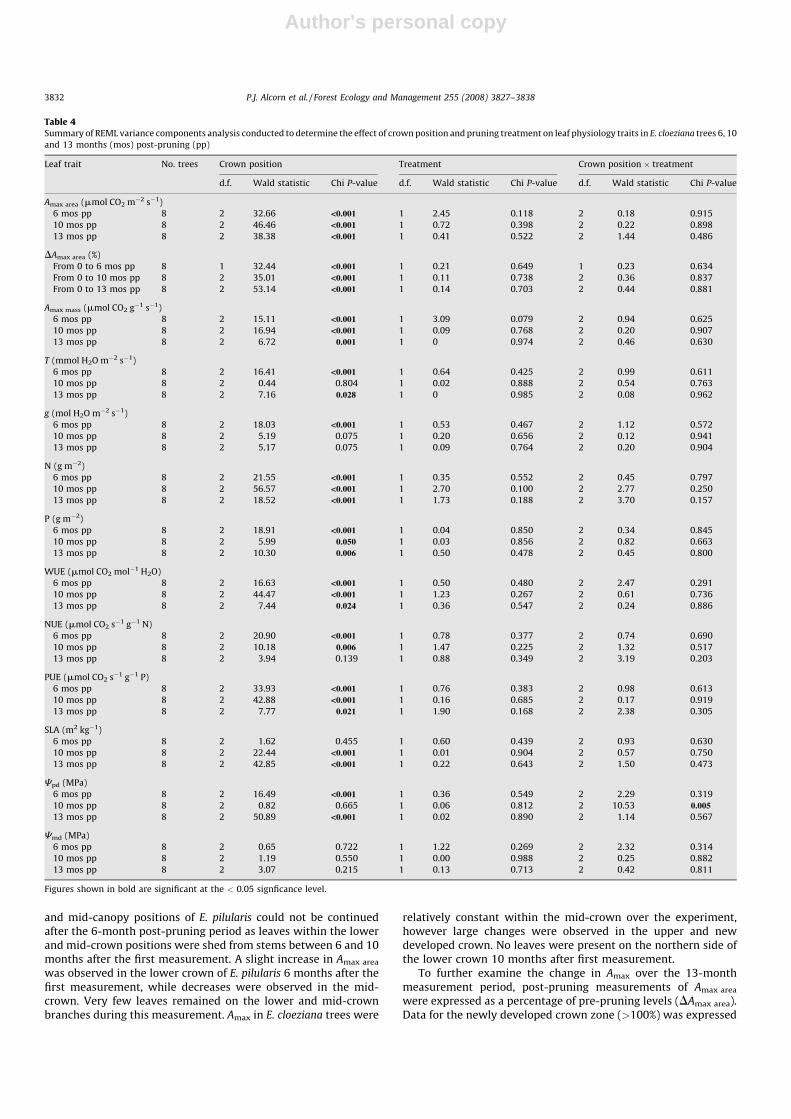
Table 4Summary of REML variance components analysis conducted to determine the effect of crown position and pruning treatment on leaf physiology traits in E. cloeziana trees 6, 10
and 13 months (mos) post-pruning (pp)
Leaf trait No. trees Crown position Treatment Crown position � treatment
d.f. Wald statistic Chi P-value d.f. Wald statistic Chi P-value d.f. Wald statistic Chi P-value
Amax area (mmol CO2 m�2 s�1)
6 mos pp 8 2 32.66 <0.001 1 2.45 0.118 2 0.18 0.915
10 mos pp 8 2 46.46 <0.001 1 0.72 0.398 2 0.22 0.898
13 mos pp 8 2 38.38 <0.001 1 0.41 0.522 2 1.44 0.486
DAmax area (%)
From 0 to 6 mos pp 8 1 32.44 <0.001 1 0.21 0.649 1 0.23 0.634
From 0 to 10 mos pp 8 2 35.01 <0.001 1 0.11 0.738 2 0.36 0.837
From 0 to 13 mos pp 8 2 53.14 <0.001 1 0.14 0.703 2 0.44 0.881
Amax mass (mmol CO2 g�1 s�1)
6 mos pp 8 2 15.11 <0.001 1 3.09 0.079 2 0.94 0.625
10 mos pp 8 2 16.94 <0.001 1 0.09 0.768 2 0.20 0.907
13 mos pp 8 2 6.72 0.001 1 0 0.974 2 0.46 0.630
T (mmol H2O m�2 s�1)
6 mos pp 8 2 16.41 <0.001 1 0.64 0.425 2 0.99 0.611
10 mos pp 8 2 0.44 0.804 1 0.02 0.888 2 0.54 0.763
13 mos pp 8 2 7.16 0.028 1 0 0.985 2 0.08 0.962
g (mol H2O m�2 s�1)
6 mos pp 8 2 18.03 <0.001 1 0.53 0.467 2 1.12 0.572
10 mos pp 8 2 5.19 0.075 1 0.20 0.656 2 0.12 0.941
13 mos pp 8 2 5.17 0.075 1 0.09 0.764 2 0.20 0.904
N (g m�2)
6 mos pp 8 2 21.55 <0.001 1 0.35 0.552 2 0.45 0.797
10 mos pp 8 2 56.57 <0.001 1 2.70 0.100 2 2.77 0.250
13 mos pp 8 2 18.52 <0.001 1 1.73 0.188 2 3.70 0.157
P (g m�2)
6 mos pp 8 2 18.91 <0.001 1 0.04 0.850 2 0.34 0.845
10 mos pp 8 2 5.99 0.050 1 0.03 0.856 2 0.82 0.663
13 mos pp 8 2 10.30 0.006 1 0.50 0.478 2 0.45 0.800
WUE (mmol CO2 mol�1 H2O)
6 mos pp 8 2 16.63 <0.001 1 0.50 0.480 2 2.47 0.291
10 mos pp 8 2 44.47 <0.001 1 1.23 0.267 2 0.61 0.736
13 mos pp 8 2 7.44 0.024 1 0.36 0.547 2 0.24 0.886
NUE (mmol CO2 s�1 g�1 N)
6 mos pp 8 2 20.90 <0.001 1 0.78 0.377 2 0.74 0.690
10 mos pp 8 2 10.18 0.006 1 1.47 0.225 2 1.32 0.517
13 mos pp 8 2 3.94 0.139 1 0.88 0.349 2 3.19 0.203
PUE (mmol CO2 s�1 g�1 P)
6 mos pp 8 2 33.93 <0.001 1 0.76 0.383 2 0.98 0.613
10 mos pp 8 2 42.88 <0.001 1 0.16 0.685 2 0.17 0.919
13 mos pp 8 2 7.77 0.021 1 1.90 0.168 2 2.38 0.305
SLA (m2 kg�1)
6 mos pp 8 2 1.62 0.455 1 0.60 0.439 2 0.93 0.630
10 mos pp 8 2 22.44 <0.001 1 0.01 0.904 2 0.57 0.750
13 mos pp 8 2 42.85 <0.001 1 0.22 0.643 2 1.50 0.473
Cpd (MPa)
6 mos pp 8 2 16.49 <0.001 1 0.36 0.549 2 2.29 0.319
10 mos pp 8 2 0.82 0.665 1 0.06 0.812 2 10.53 0.005
13 mos pp 8 2 50.89 <0.001 1 0.02 0.890 2 1.14 0.567
Cmd (MPa)
6 mos pp 8 2 0.65 0.722 1 1.22 0.269 2 2.32 0.314
10 mos pp 8 2 1.19 0.550 1 0.00 0.988 2 0.25 0.882
13 mos pp 8 2 3.07 0.215 1 0.13 0.713 2 0.42 0.811
Figures shown in bold are significant at the < 0.05 signficance level.
P.J. Alcorn et al. / Forest Ecology and Management 255 (2008) 3827–38383832
Author's personal copy
as a percentage of measurements taken 6 months after pruning.Measurements from the lower crown position were excluded fromthe analysis in both species due to limited data from post-pruningmeasurements as a result of leaf shedding from the lower zone.Similarly, the further loss of leaves from the mid-crown in E.
pilularis trees necessitated the exclusion of the mid-crown positionfrom the analyses of measurements after 10 and 13 months. TheDAmax area at 6, 10 and 13 months after pruning in E. pilularis treeswere not significantly different between crown position or pruningtreatment (Fig. 3), while in E. cloeziana trees, DAmax area wassignificantly different between crown position 6, 10 and 13 monthsafter pruning (Fig. 3 and Table 4).
Six months after pruning, N and SLA were significantly differentbetween pruning treatments in E. pilularis (Table 3). Leaf Nconcentrations were 1.92 and 1.65 g m�2 in the 0 and 50%treatments, respectively, and SLA was 6.76 and 7.57 m2 kg�1 inthe 0 and 50% treatments, respectively. All other leaf traits werenot significantly different between pruning treatments in eitherspecies.
T and NUE varied with crown position and pruning treatment13 months after pruning and WUE varied with crown position andpruning treatment 10 months after pruning in E. pilularis (Table 3).Similarly Cpd varied with crown position and treatment 10 monthsafter pruning in E. cloeziana. The absence of significant treatmenteffects when significant interactions were present suggeststreatment effects were weak.
A positive relationship between foliar N and Amax area wasevident in both species throughout the measurement period(Fig. 4). Foliar N data from the leaves collected from the uppercrown of six (circled data points Fig. 4c) of the eight E. cloeziana
trees prior to pruning were removed from the analysis as theydisplayed lower rates of Amax area for a given N than leaves from allother crown positions. These leaves are likely to have been youngerthan the other sample leaves from the lower crown.
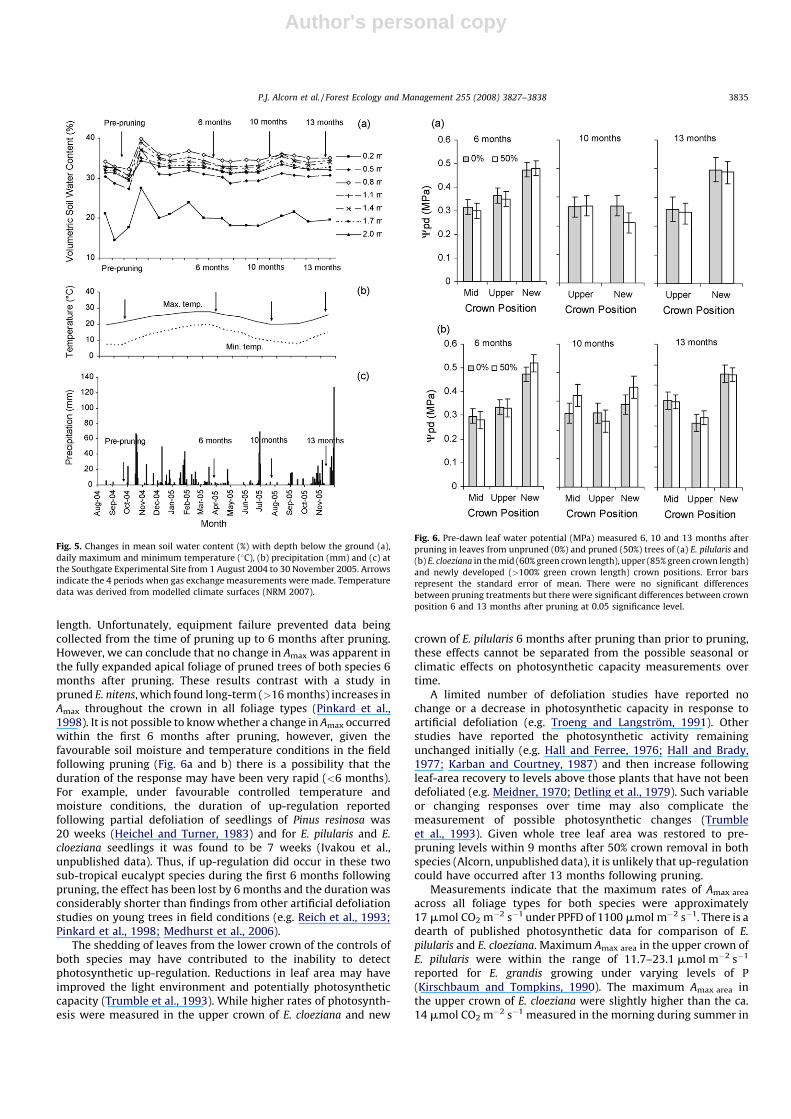
3.3. Soil moisture and weather
Soil moisture availability at all depths was lowest prior topruning, but remained relatively similar at all depths for thefollowing three post-pruning gas exchange measurements(Fig. 5a). The relatively constant availability of water to treesover the experimental period is reflected in the relatively constantC measurements (Fig. 6).
A large amount (225 mm) of rain fell just after the pruningtreatment in October 2004 (Fig. 5c). This was reflected in mean soilwater content at all depths, with a sharp increase in soil moisturein October 2004 (Fig. 5).
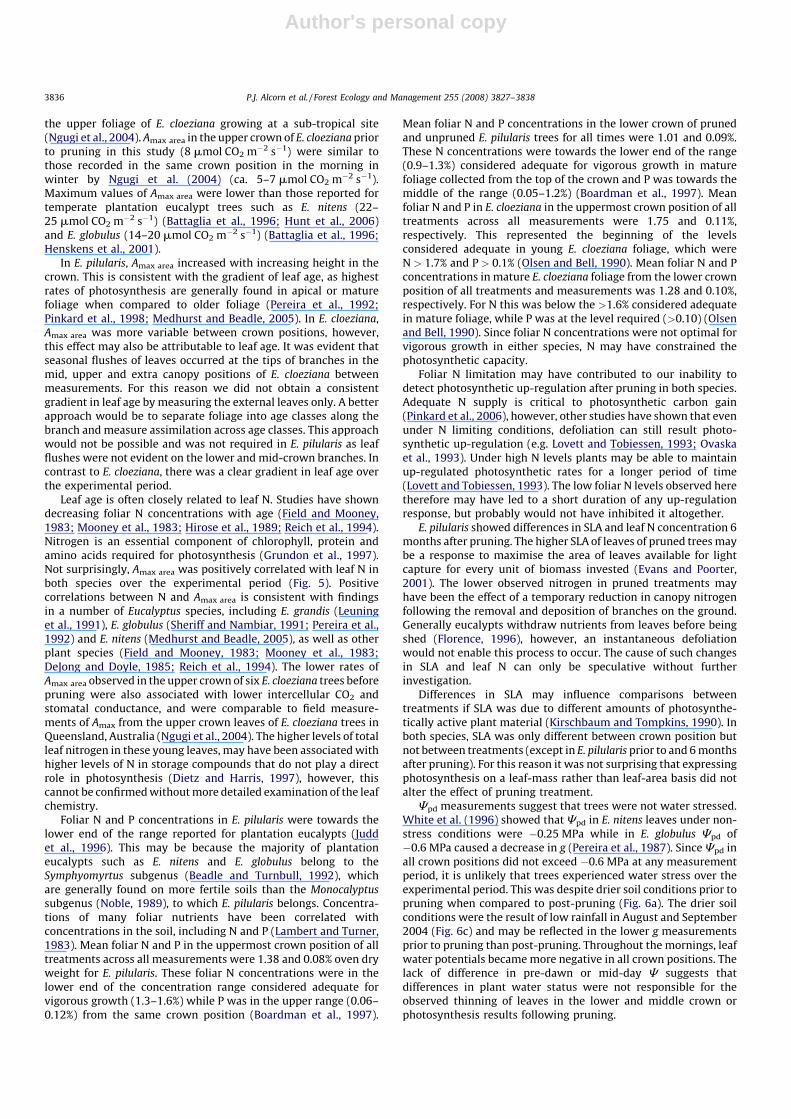
3.4. Leaf water potential
Cpd was relatively constant across the measurement period(Fig. 6). Diurnally, C declined from pre-dawn to mid-day. Theminimum mean Cmd reached across all crown positions and was�1.97 and�1.94 for E. pilularis and E. cloeziana leaves, respectively.Cpd values were significantly lower in leaves from the upper crown6 and 13 months after pruning in both species. Similar trends wereobserved in Cmd measurements, with lower values recorded forleaves from the upper crown than the middle or lower crown,however, only significant differences were present in E. pilularis 6
Fig. 2. Light-saturated photosynthesis (Amax) (mmol CO2 m2 s�1) for leaves of unpruned (a) E. pilularis and (b) E. cloeziana trees from the lower (25% green crown length), mid
(60% green crown length), upper (85% green crown length) and newly developed (>100% green crown length) crown positions. Error bars indicate standard errors of means.
Fig. 3. Percentage change in pre-pruning light-saturated photosynthesis (Amax) 6,
10 and 13 months after pruning in leaves from unpruned (0%) and pruned (50%)
trees of (a) E. pilularis and (b) E. cloeziana in the mid (60% green crown length), upper
(85% green crown length) and newly developed (>100% green crown length) crown
positions. Error bars represent the standard error of mean. There were no significant
differences between pruning treatment but there were significant differences
between crown position at 0.05 significance level.
P.J. Alcorn et al. / Forest Ecology and Management 255 (2008) 3827–3838 3833

Author's personal copy
and 13 months after pruning. The lack of difference in Cpd (Fig. 6aand b) Cmd and between crown positions at 10 months afterpruning in both species is a likely reflection of mild temperaturesin July (Fig. 5b). In contrast, lower C measurements recorded inMarch (6 months) and November (13 months) suggest that thenewly developed crown was more water stressed than the uppercrown, which is likely a reflection of the hotter weather duringthese measurements.
4. Discussion
The results of this study confirm that there are strong positionaleffects in physiological and morphological leaf traits in bothspecies. We found little difference in physiological leaf propertiesbetween the two study species. There was no evidence of up-regulation of photosynthesis 6 months after pruning that removed50% of the live crown.
4.1. The effect of crown position on leaf-level photosynthesis
Leaf position within the crown had a strong influence onphysiological leaf traits in both species. Declining Rd and G withincreasing depth in the canopy are typical responses to a lightgradient. It has been suggested that the prolonged survival ofheavily shaded leaves and branches in the lower crown may relateto lower Rd (Sprugel et al., 1991). Furthermore, lower G in the lowercrown means a lower level of light is required to support a net gainof carbon uptake (Ehleringer and Bjorkman, 1977). Lower Rd and Gmay contribute to the survival of leaves at the base of crowns inboth species.
Higher F means greater ability to fix carbon under low lightconditions. The lower F in the lower crown position compared tothe upper and mid-crown positions was a little surprising as
quantum yield often decreases in leaves grown at high-lightcompared to low light (Bjorkman, 1981; Turnbull, 1991; Sims andPearcy, 1992). Turnbull (1991) reported decreased quantum yieldin five out of six rain forest trees when grown at the lowest lightlevel at which they survived. The longer duration of shading in thelower leaves of both species due to branch shading fromsurrounding trees within the closed-canopy stand may havecontributed to the lower quantum yield when compared to otherparts of the crown, or these species may not develop true shadeleaves (Leverenz and Jarvis, 1980) and do not possess thestructures (e.g. thin epidermis and thick mesophyll) and mechan-isms to facilitate a high quantum yield (Chazdon and Kaufmann,1993).
Amax area rates were similar in the lower and mid-crownpositions of both species, however much lower rates weremeasured in the upper crown of E. cloeziana than E. pilularis priorto pruning. This may be a leaf age effect because leaves measuredin the upper crown of E. cloeziana appeared to be much younger (arecent leaf flush had occurred just prior to sampling) than sampleleaves used during subsequent measurements and younger thanthose sampled in E. pilularis. This observation is supported by thesimilarity in Amax area measured in the upper crown of unpruned E.
cloeziana and E. pilularis 6, 10 and 13 months after the initialmeasurements (Fig. 2). Overall the similarity in leaf physiologicaltraits between E. pilularis and E. cloeziana suggests that there islittle physiological difference in shade tolerance between the twospecies.
4.2. Photosynthetic response to pruning
Contrary to predictions, we did not observe an increase in light-saturated photosynthesis in leaves of E. pilularis and E. cloeziana
trees 6–13 months after the removal of 50% of the green crown
Fig. 4. Strong linear relationships between mean light-saturated photosynthesis rate (Amax, mmol CO2 m2 s�1) and foliar nitrogen concentration (N g m�2) for leaves from
pruned (50% crown length removal) and unpruned (0% crown length removal) E. pilularis and E. cloeziana trees 0 (a and c) and 10 months (b and d) after pruning. Pruning
treatment was not significant (P < 0.05). Circled values in graph (c) are the upper crown measurements excluded from the regression analysis.
P.J. Alcorn et al. / Forest Ecology and Management 255 (2008) 3827–38383834
Author's personal copy
length. Unfortunately, equipment failure prevented data beingcollected from the time of pruning up to 6 months after pruning.However, we can conclude that no change in Amax was apparent inthe fully expanded apical foliage of pruned trees of both species 6months after pruning. These results contrast with a study inpruned E. nitens, which found long-term (>16 months) increases inAmax throughout the crown in all foliage types (Pinkard et al.,1998). It is not possible to know whether a change in Amax occurredwithin the first 6 months after pruning, however, given thefavourable soil moisture and temperature conditions in the fieldfollowing pruning (Fig. 6a and b) there is a possibility that theduration of the response may have been very rapid (<6 months).For example, under favourable controlled temperature andmoisture conditions, the duration of up-regulation reportedfollowing partial defoliation of seedlings of Pinus resinosa was20 weeks (Heichel and Turner, 1983) and for E. pilularis and E.
cloeziana seedlings it was found to be 7 weeks (Ivakou et al.,unpublished data). Thus, if up-regulation did occur in these twosub-tropical eucalypt species during the first 6 months followingpruning, the effect has been lost by 6 months and the duration wasconsiderably shorter than findings from other artificial defoliationstudies on young trees in field conditions (e.g. Reich et al., 1993;Pinkard et al., 1998; Medhurst et al., 2006).
The shedding of leaves from the lower crown of the controls ofboth species may have contributed to the inability to detectphotosynthetic up-regulation. Reductions in leaf area may haveimproved the light environment and potentially photosyntheticcapacity (Trumble et al., 1993). While higher rates of photosynth-esis were measured in the upper crown of E. cloeziana and new
crown of E. pilularis 6 months after pruning than prior to pruning,these effects cannot be separated from the possible seasonal orclimatic effects on photosynthetic capacity measurements overtime.
A limited number of defoliation studies have reported nochange or a decrease in photosynthetic capacity in response toartificial defoliation (e.g. Troeng and Langstrom, 1991). Otherstudies have reported the photosynthetic activity remainingunchanged initially (e.g. Hall and Ferree, 1976; Hall and Brady,1977; Karban and Courtney, 1987) and then increase followingleaf-area recovery to levels above those plants that have not beendefoliated (e.g. Meidner, 1970; Detling et al., 1979). Such variableor changing responses over time may also complicate themeasurement of possible photosynthetic changes (Trumbleet al., 1993). Given whole tree leaf area was restored to pre-pruning levels within 9 months after 50% crown removal in bothspecies (Alcorn, unpublished data), it is unlikely that up-regulationcould have occurred after 13 months following pruning.
Measurements indicate that the maximum rates of Amax area
across all foliage types for both species were approximately17 mmol CO2 m�2 s�1 under PPFD of 1100 mmol m�2 s�1. There is adearth of published photosynthetic data for comparison of E.
pilularis and E. cloeziana. Maximum Amax area in the upper crown ofE. pilularis were within the range of 11.7–23.1 mmol m�2 s�1
reported for E. grandis growing under varying levels of P(Kirschbaum and Tompkins, 1990). The maximum Amax area inthe upper crown of E. cloeziana were slightly higher than the ca.14 mmol CO2 m�2 s�1 measured in the morning during summer in
Fig. 5. Changes in mean soil water content (%) with depth below the ground (a),
daily maximum and minimum temperature (8C), (b) precipitation (mm) and (c) at
the Southgate Experimental Site from 1 August 2004 to 30 November 2005. Arrows
indicate the 4 periods when gas exchange measurements were made. Temperature
data was derived from modelled climate surfaces (NRM 2007).
Fig. 6. Pre-dawn leaf water potential (MPa) measured 6, 10 and 13 months after
pruning in leaves from unpruned (0%) and pruned (50%) trees of (a) E. pilularis and
(b) E. cloeziana in the mid (60% green crown length), upper (85% green crown length)
and newly developed (>100% green crown length) crown positions. Error bars
represent the standard error of mean. There were no significant differences
between pruning treatments but there were significant differences between crown
position 6 and 13 months after pruning at 0.05 significance level.
P.J. Alcorn et al. / Forest Ecology and Management 255 (2008) 3827–3838 3835
Author's personal copy
the upper foliage of E. cloeziana growing at a sub-tropical site(Ngugi et al., 2004). Amax area in the upper crown of E. cloeziana priorto pruning in this study (8 mmol CO2 m�2 s�1) were similar tothose recorded in the same crown position in the morning inwinter by Ngugi et al. (2004) (ca. 5–7 mmol CO2 m�2 s�1).Maximum values of Amax area were lower than those reported fortemperate plantation eucalypt trees such as E. nitens (22–25 mmol CO2 m�2 s�1) (Battaglia et al., 1996; Hunt et al., 2006)and E. globulus (14–20 mmol CO2 m�2 s�1) (Battaglia et al., 1996;Henskens et al., 2001).
In E. pilularis, Amax area increased with increasing height in thecrown. This is consistent with the gradient of leaf age, as highestrates of photosynthesis are generally found in apical or maturefoliage when compared to older foliage (Pereira et al., 1992;Pinkard et al., 1998; Medhurst and Beadle, 2005). In E. cloeziana,Amax area was more variable between crown positions, however,this effect may also be attributable to leaf age. It was evident thatseasonal flushes of leaves occurred at the tips of branches in themid, upper and extra canopy positions of E. cloeziana betweenmeasurements. For this reason we did not obtain a consistentgradient in leaf age by measuring the external leaves only. A betterapproach would be to separate foliage into age classes along thebranch and measure assimilation across age classes. This approachwould not be possible and was not required in E. pilularis as leafflushes were not evident on the lower and mid-crown branches. Incontrast to E. cloeziana, there was a clear gradient in leaf age overthe experimental period.
Leaf age is often closely related to leaf N. Studies have showndecreasing foliar N concentrations with age (Field and Mooney,1983; Mooney et al., 1983; Hirose et al., 1989; Reich et al., 1994).Nitrogen is an essential component of chlorophyll, protein andamino acids required for photosynthesis (Grundon et al., 1997).Not surprisingly, Amax area was positively correlated with leaf N inboth species over the experimental period (Fig. 5). Positivecorrelations between N and Amax area is consistent with findingsin a number of Eucalyptus species, including E. grandis (Leuninget al., 1991), E. globulus (Sheriff and Nambiar, 1991; Pereira et al.,1992) and E. nitens (Medhurst and Beadle, 2005), as well as otherplant species (Field and Mooney, 1983; Mooney et al., 1983;DeJong and Doyle, 1985; Reich et al., 1994). The lower rates ofAmax area observed in the upper crown of six E. cloeziana trees beforepruning were also associated with lower intercellular CO2 andstomatal conductance, and were comparable to field measure-ments of Amax from the upper crown leaves of E. cloeziana trees inQueensland, Australia (Ngugi et al., 2004). The higher levels of totalleaf nitrogen in these young leaves, may have been associated withhigher levels of N in storage compounds that do not play a directrole in photosynthesis (Dietz and Harris, 1997), however, thiscannot be confirmed without more detailed examination of the leafchemistry.
Foliar N and P concentrations in E. pilularis were towards thelower end of the range reported for plantation eucalypts (Juddet al., 1996). This may be because the majority of plantationeucalypts such as E. nitens and E. globulus belong to theSymphyomyrtus subgenus (Beadle and Turnbull, 1992), whichare generally found on more fertile soils than the Monocalyptus
subgenus (Noble, 1989), to which E. pilularis belongs. Concentra-tions of many foliar nutrients have been correlated withconcentrations in the soil, including N and P (Lambert and Turner,1983). Mean foliar N and P in the uppermost crown position of alltreatments across all measurements were 1.38 and 0.08% oven dryweight for E. pilularis. These foliar N concentrations were in thelower end of the concentration range considered adequate forvigorous growth (1.3–1.6%) while P was in the upper range (0.06–0.12%) from the same crown position (Boardman et al., 1997).
Mean foliar N and P concentrations in the lower crown of prunedand unpruned E. pilularis trees for all times were 1.01 and 0.09%.These N concentrations were towards the lower end of the range(0.9–1.3%) considered adequate for vigorous growth in maturefoliage collected from the top of the crown and P was towards themiddle of the range (0.05–1.2%) (Boardman et al., 1997). Meanfoliar N and P in E. cloeziana in the uppermost crown position of alltreatments across all measurements were 1.75 and 0.11%,respectively. This represented the beginning of the levelsconsidered adequate in young E. cloeziana foliage, which wereN > 1.7% and P > 0.1% (Olsen and Bell, 1990). Mean foliar N and Pconcentrations in mature E. cloeziana foliage from the lower crownposition of all treatments and measurements was 1.28 and 0.10%,respectively. For N this was below the >1.6% considered adequatein mature foliage, while P was at the level required (>0.10) (Olsenand Bell, 1990). Since foliar N concentrations were not optimal forvigorous growth in either species, N may have constrained thephotosynthetic capacity.
Foliar N limitation may have contributed to our inability todetect photosynthetic up-regulation after pruning in both species.Adequate N supply is critical to photosynthetic carbon gain(Pinkard et al., 2006), however, other studies have shown that evenunder N limiting conditions, defoliation can still result photo-synthetic up-regulation (e.g. Lovett and Tobiessen, 1993; Ovaskaet al., 1993). Under high N levels plants may be able to maintainup-regulated photosynthetic rates for a longer period of time(Lovett and Tobiessen, 1993). The low foliar N levels observed heretherefore may have led to a short duration of any up-regulationresponse, but probably would not have inhibited it altogether.
E. pilularis showed differences in SLA and leaf N concentration 6months after pruning. The higher SLA of leaves of pruned trees maybe a response to maximise the area of leaves available for lightcapture for every unit of biomass invested (Evans and Poorter,2001). The lower observed nitrogen in pruned treatments mayhave been the effect of a temporary reduction in canopy nitrogenfollowing the removal and deposition of branches on the ground.Generally eucalypts withdraw nutrients from leaves before beingshed (Florence, 1996), however, an instantaneous defoliationwould not enable this process to occur. The cause of such changesin SLA and leaf N can only be speculative without furtherinvestigation.
Differences in SLA may influence comparisons betweentreatments if SLA was due to different amounts of photosynthe-tically active plant material (Kirschbaum and Tompkins, 1990). Inboth species, SLA was only different between crown position butnot between treatments (except in E. pilularis prior to and 6 monthsafter pruning). For this reason it was not surprising that expressingphotosynthesis on a leaf-mass rather than leaf-area basis did notalter the effect of pruning treatment.
Cpd measurements suggest that trees were not water stressed.White et al. (1996) showed that Cpd in E. nitens leaves under non-stress conditions were �0.25 MPa while in E. globulus Cpd of�0.6 MPa caused a decrease in g (Pereira et al., 1987). Since Cpd inall crown positions did not exceed �0.6 MPa at any measurementperiod, it is unlikely that trees experienced water stress over theexperimental period. This was despite drier soil conditions prior topruning when compared to post-pruning (Fig. 6a). The drier soilconditions were the result of low rainfall in August and September2004 (Fig. 6c) and may be reflected in the lower g measurementsprior to pruning than post-pruning. Throughout the mornings, leafwater potentials became more negative in all crown positions. Thelack of difference in pre-dawn or mid-day C suggests thatdifferences in plant water status were not responsible for theobserved thinning of leaves in the lower and middle crown orphotosynthesis results following pruning.
P.J. Alcorn et al. / Forest Ecology and Management 255 (2008) 3827–38383836

Author's personal copy
In this study, C was not consistently different between verticalcrown positions. C has generally been found to decrease withincreasing height in the crown in very tall trees (Koch et al., 2004),however, C is also influenced by how much T has occurred (Myers,1997), leaf age, branch type (e.g. lateral vs. main) and environ-mental conditions such as irradiance, vapour pressure deficit andwind speed (Hellkvist et al., 1974). Other studies have observedlimited vertical differences in C in other young plantation-growneucalypts (e.g. Hunt et al., 2006).
There was no indication that pruning influenced g, T, WUE orNUE. Differences observed at other measurement times were notconsistent to indicate pruning altered these parameters.
4.3. Application and conclusions
There was little prior information about the physiologicalcharacteristics of E. pilularis and E. cloeziana. A comparison ofphysiological characteristics showed limited difference betweenleaves of the species, suggesting no difference in shade tolerance.However, morphological differences in leaves may explainobserved differences in crown structure (Smith et al., 2006). Thisstudy showed that there are strong positional effects on leafphysiology in both E. pilularis and E. cloeziana and therefore futureexperiments should account for large vertical gradients in leafphysiology.
While we did not find an up-regulation of photosynthesis 6months after pruning, detailed and useful photosynthesis,transpiration and conductance data have been presented for bothE. pilularis and E. cloeziana. These new data provide an importantbasis required for modelling pruning effects in process-based treegrowth models.
Acknowledgements
The authors would like to thank Forests NSW for the use of theexperimental site and financial assistance with this research. Wewould also like to thank John Alcorn, Daryl Johnston, Geoff Hagneyand Piers Harper for assistance in the field. Philip Alcorn wassupported by an Australian Postgraduate Award Industry scholar-ship (ARC Grant LP0348999) and Cooperative Research CentreForestry scholarship. The manuscript benefited from constructivecomments provided by two anonymous reviewers.
References
Alcorn, P.J., Bauhus, J., Smith, R.G.B., Thomas, D., James, R., Nicotra, A., 2008. Growthresponse following green crown pruning in plantation-grown Eucalyptus pilu-laris and E. cloeziana. Can. J. For. Res. 38, 770–781.
Alcorn, P.J., Pyttel, P., Bauhus, J., Smith, R.G.B., Thomas, D., James, R., Nicotra, A.,2007. Effects of initial planting density on branch development in four-year oldplantation grown Eucalyptus pilularis and E. cloeziana trees. For. Ecol. Manage.252, 41–51.
Anon., 2007. Natural Resource Management. Data available online at http://www.nrm.qld.gov.au/silo/datadrill. Accessed 1/01/2008.
Battaglia, M., Beadle, C., Loughhead, S., 1996. Photosynthetic temperature responsesof Eucalyptus globulus and Eucalyptus nitens. Tree Physiol. 16, 81–89.
Beadle, C.L., Turnbull, C.R.A., 1992. Comparative growth rates of Eucalyptus innative forest and in plantation monoculture. In: Calder, I.R., Hall, R.L., Adlard,P.G. (Eds.), Growth and Water Use of Forest Plantations. John Wiley and Sons,Chichester, pp. 318–331.
Bjorkman, O., 1981. Responses to different quantum flux densities. In: Lange, O.L.,Nobel, P.S., Osmond, C.B., Ziegler, H. (Eds.), Physiological Plant Ecology: I.Responses to the Physical Environment. Springer-Verlag, Berlin, pp. 57–107.
Boardman, R., Cromer, R.N., Lambert, M.J., Webb, M.J., 1997. Forest plantations. In:Reuter, D.J., Robinson, J.B. (Eds.), Plant Analysis: An Interpretation Manual.CSIRO, Melbourne, pp. 505–566.
Chazdon, R.L., Kaufmann, S., 1993. Plasticity of leaf anatomy of two rain forestshrubs in relation to photosynthetic light acclimation. Funct. Ecol. 7, 385–394.
DeJong, T.M., Doyle, J.F., 1985. Seasonal relationships between leaf nitrogen content(photosynthetic capacity) and leaf canopy light exposure in peach (Prunuspersica). Plant, Cell Environ. 8, 701–706.
Detling, J.K., Dyer, M.I., Winn, D.T., 1979. Net photosynthesis, root respiration, andregrowth of Bouteloua gracilis following simulated grazing. Oecologia 41, 127–134.
Dietz, K.-J., Harris, G.C., 1997. Photosynthesis under nutrient deficiency. In: Pessar-akli, M. (Ed.), Handbook of Photosynthesis. Marcel Dekker, New York, pp. 951–975.
Ehleringer, J., Bjorkman, O., 1977. Quantum yields for CO2 uptake in C3 and C4
plants: dependence on temperature, CO2, and O2 concentration. Plant Physiol.59, 86–90.
Evans, J.R., Poorter, H., 2001. Photosynthetic acclimation of plants to growthirradiance: the relative importance of specific leaf area and nitrogen partition-ing in maximizing carbon gain. Plant Cell Environ. 24, 755–767.
Field, C., Mooney, H.A., 1983. Leaf age and seasonal effects on light, water andnitrogen use efficiency in a California shrub. Oecologica 56, 348–355.
Florence, R.G., 1996. Ecology and Silviculture of Eucalypt Forests. CSIRO, Colling-wood, p. 413.
Grundon, N.J., Robson, A.D., Lambert, M.J., Snowball, K., 1997. Nutrient deficiencyand toxicity symptoms. In: Reuter, D.J., Robinson, J.B. (Eds.), Plant Analysis: AnInterpretation Manual. CSIRO, Melbourne, pp. 37–51.
Hall, A.J., Brady, C.J., 1977. Assimilate source-sink relationships in Capsicum annuumL. II. Effects of fruiting and defloration on the photosynthetic capacity andsenescence of the leaves. Aust. J. Plant Physiol. 4, 771–783.
Hall, F.R., Ferree, D.C., 1976. Effect of insect injury simulation on photosynthesis ofApple leaves. J. Econ. Entomol. 69, 245–248.
Harbinson, J., 1994. The responses of thylakoid electron transport and light utiliza-tion efficiency to sink limitation of photosynthesis. In: Baker, N.R., Bower, J.R.(Eds.), Photoinhibition of Photosynthesis: From Molecular Mechanisms to theField. BIOS Scientific, Oxford, pp. 273–295.
Hartt, C.E., Kortschak, H.P., Burr, G.O., 1964. Effects of defoliation, deradication anddarkening the blade upon translocation of C14 in sugarcane. Plant Physiol. 39,15–22.
Heffernan, B.J., 1985. A Handbook of Methods of Inorganic Chemical Analysis forForest Soils, Foliage and Water. CSIRO Division of Forest Research, Canberra, p.281.
Heichel, G.H., Turner, N.C., 1983. CO2 assimilation of primary and regrowth foliageof red maple (Acer rubrum L.) and red oak (Quercus rubra L.): response todefoliation. Oecologia 57, 14–19.
Hellkvist, J., Richards, G.P., Jarvis, P.G., 1974. Vertical gradients of water potentialand tissue water relations in Sitka spruce trees measured with the pressurechamber. J. Appl. Ecol. 11, 637–667.
Henskens, F.L., Battaglia, M., Cherry, M.L., Beadle, C.L., 2001. Physiological basis ofspacing effects on tree growth and form in Eucalyptus globulus. Trees 15, 365–377.
Hirose, T., Werger, M.J.A., van Rheenen, J.W.A., 1989. Canopy development and leafnitrogen distribution in a stand of Carex acutiformis. Ecology 70, 1610–1618.
Hoogesteger, J., Karlsson, P.S., 1992. Effects of defoliation on radial stem growth andphotosynthesis in the mountain birch (Betula pubescens ssp. tortuosa). Funct.Ecol. 6, 317–323.
Hunt, M.A., Battaglia, M., Davidson, N.J., Unwin, G.L., 2006. Competition betweenplantation Eucalyptus nitens and Acacia dealbata weeds in northeastern Tasma-nia. For. Ecol. Manage. 233, 260–274.
Judd, T.S., Attiwill, P.M., Adams, M.A., 1996. Nutrient concentrations in Eucalyptus:a synthesis in relation to differences between taxa, sites and components. In:Attiwill, P.M., Adams, M.A. (Eds.), Nutrition of Eucalypts. CSIRO, Melbourne, pp.123–153.
Karban, R., Courtney, S., 1987. Intraspecific host plant choice: lack of consequencesfor Streptanthus tortuosus (Cruciferae) and Euchloe hyantis (Lepidoptera: Pier-idae). Oikos 48, 243–248.
Kirschbaum, M.U.F., Tompkins, D., 1990. Photosynthetic responses to phosphorusnutrition in Eucalyptus grandis seedlings. Aust. J. Plant Physiol. 17, 527–535.
Koch, G.W., Sillett, S.C., Jennings, G.M., Davis, S.D., 2004. The limits to tree height.Nature 428, 851–854.
Lambert, M.J., Turner, J., 1983. Soil nutrient-vegetation relationships in the Edenarea N.S.W. III Foliar nutrient relationships with particular reference to Euca-lyptus subgenera. Aust. For. 46, 200–209.
Larcher, W., 1995. Physiological Plant Ecology: Ecophysiology and Stress Physiologyof Functional Groups. Springer-Verlag, Berlin, p. 506.
Layne, D.R., Flore, J.A., 1995. End-product inhibition of photosynthesis in Prunuscerasus L. in response to whole-plant source-sink manipulation. J. Am. Soc. Hort.Sci. 120, 583–599.
Leuning, R., Cromer, R.N., Rance, S., 1991. Spatial distributions of foliar nitrogen andphosphorus in crowns of Eucalyptus grandis. Oecologia 88, 504–510.
Leverenz, J.W., Jarvis, P.G., 1980. Photosynthesis in Sitka Spruce (Picea sitchensis(Bong.) Carr.) X. Acclimation to quantum flux density within and between trees.J. Appl. Ecol. 17, 697–708.
Lovett Doust, J., 1989. Plant reproductive strategies and resource allocation. TrendsEcol. Evol. 4, 230–234.
Lovett, G.M., Tobiessen, 1993. Carbon and nitrogen assimilation in red oaks (Quercusruba L.) subject to defoliation and nitrogen stress. Tree Physiol. 12, 259–269.
McKenzie, D.C., Hucker, K.W., Morthorpe, L.J., Baker, P.J., 1990. Field calibration of aneutron-gamma probe in three agriculturally important soils of the LowerMacquarie Valley. Aust. J. Exp. Agric. 30, 115–122.
Medhurst, J.L., Beadle, C.L., 2005. Photosynthetic capacity and foliar nitrogendistribution in Eucalyptus nitens is altered by high-intensity thinning. TreePhysiol. 25, 981–991.
P.J. Alcorn et al. / Forest Ecology and Management 255 (2008) 3827–3838 3837
Author's personal copy
Medhurst, J.L., Pinkard, E.A., Beadle, C.L., Worledge, D., 2006. Photosynthetic capa-city increases in Acacia melanoxylon following form pruning in a two-speciesplantation. For. Ecol. Manage. 233, 250–259.
Meidner, H., 1970. Effects of photoperiodic induction and debudding in Xanthiumpennsylvanicum and of partial defoliation in Phaseolus vulgaris on rates of netphotosynthesis and stomatal conductances. J. Exp. Bot. 21, 164–169.
Mooney, H.A., Field, C., Gulmon, S.L., Rundel, P., Kruger, F.J., 1983. Photosyntheticcharacteristics of South African sclerophylls. Oecologia 58, 398–401.
Myers, B.J., 1997. Seasonal variation in water relations of trees of differing leafphenology in a wet–dry tropical savanna near Darwin, Northern Australia. Aust.J. Bot. 45, 225–240.
Nafziger, E.D., Koller, H.R., 1976. Influence of leaf starch concentration on CO2
assimilation. Plant Physiol. 57, 560–563.Ngugi, M.R., Hunt, M.A., Doley, D., Ryan, P., Dart, P., 2004. Selection of species and
provenances for low-rainfall areas: physiological responses of Eucalyptus cloezi-ana and Eucalyptus argophloia to seasonal conditions in subtropical Queensland.For. Ecol. Manage. 193, 141–156.
Noble, I.R., 1989. Ecological traits of the Eucalyptus L’Herit. subgenera Monocalyptusand Symphyomyrtus. Aust. J. Bot. 37, 207–224.
Olsen, J.K., Bell, L.C., 1990. A glasshouse evaluation of ‘critical’ N and P concentra-tions and N:P ratios in various plant parts of six eucalypt species. Aust. J. Bot. 38,281–298.
Ovaska, J., Ruuska, S., Rintomaki, E., Vapaavuori, E., 1993. Combined effects of partialdefoliation and nutrient availability on cloned Betula pendula saplings. II.Changes in net photosynthesis and related biochemical properties. J. Exp.Bot. 44, 1395–1402.
Ovaska, J., Walls, M., Mutikainen, P., 1992. Changes in leaf gas exchange proper-ties of cloned Betula pendula saplings after partial defoliation. II. Changes innet photosynthesis and related biochemcial properties. J. Exp. Bot. 43, 1301–1307.
Pereira, J.S., Chaves, M.M., Fonseca, F., Araujo, M.C., Torres, F., 1992. Photosyntheticcapacity of leaves of Eucalyptus globulus (Labill.) growing in the field withdifferent nutrient and water supplies. Tree Physiol. 11, 381–389.
Pereira, J.S., Tenhunen, J.D., Lange, O.L., 1987. Stomatal control of photosynthesis ofEucalyptus globulus Labill. trees under field conditions in Portugal. J. Exp. Bot. 38,1678–1688.
Pinkard, E.A., Baillie, C.C., Patel, V., Paterson, S., Battaglia, M., Smethurst, P.J.,Mohammed, C.L., Wardlaw, T., Stone, C., 2006. Growth responses of Eucalyptusglobulus Labill. to nitrogen application and severity, pattern and frequency ofartifical defoliation. For. Ecol. Manage. 229, 378–387.
Pinkard, E.A., Beadle, C.L., Davidson, N.J., Battaglia, M., 1998. Photosyntheticresponses of Eucalyptus nitens (Deane and Maiden) Maiden to green pruning.Trees 12, 119–129.
Reich, P.B., Walters, M.B., Ellsworth, D.S., Uhl, C., 1994. Photosynthesis-nitrogenrelations in Amazonian tree species I. Patterns among species and communities.Oecologia 97, 62–72.
Reich, P.B., Walters, M.B., Krause, S.C., Vanderklein, D.W., Raffa, K.F., Tabone, T.,1993. Growth, nutrition and gas exchange of Pinus resinosa following artificialdefoliation. Trees 7, 67–77.
Senock, R.S., Sisson, W.B., Donart, G.B., 1991. Compensatory photosynthesis ofSporobolus flexuosus (Thurb.) Rydb. following simulated herbivory in the North-ern Chihuahuan Desert. Bot. Gaz. 152, 275–281.
Sheriff, D.W., Nambiar, E.K.S., 1991. Nitrogen nutrition, growth and gas exchange inEucalyptus globulus Labill. seedlings. Aust. J. Plant Physiol. 18, 37–52.
Sims, D.A., Pearcy, R.W., 1992. Response of leaf anatomy and photosyntheticcapacity in Alocasia macrorrhiza (Araceae) to a transfer from low to high light.Am. J. Bot. 79, 449–455.
Smith, D.M., Larson, B.C., Kelty, M.J., Ashton, P.M.S., 1997. The Practice of Silvicul-ture: Applied Forest Ecology. John Wiley and Sons Inc., New York, p. 537.
Smith, R.G.B., Dingle, J., Kearney, D., Montagu, K., 2006. Branch occlusion afterpruning in four contrasting sub-tropical eucalypt species. J. Trop. For. Sci. 18,117–123.
Soares, P., Tome, M., 2001. A tree crown ratio prediction equation for eucalyptplantations. Ann. For. Sci. 58, 193–202.
Sprugel, D.G., Hinckley, T.M., Schaap, W., 1991. The theory and practice of branchautonomy. Ann. Rev. Ecol. Syst. 22, 309–334.
Thorne, J.H., Koller, H.R., 1974. Influence of assimilate demand on photosynthesis,diffusive resistances, translocation, and carbohydrate levels of soybean leaves.Plant Physiol. 54, 201–207.
Troeng, E., Langstrom, B., 1991. Gas exchange in young Scots pine following pruningof current shoots. Ann. For. Sci. 48, 336–359.
Trumble, J.T., Kolodny-Hirsch, D.M., Ting, I.P., 1993. Plant compensation for arthro-pod herbivory. Ann. Rev. Entomol. 38 (3), 93–119.
Turnbull, M.H., 1991. The effect of light quantity and quality during development ofthe photosynthetic characteristics of six Australian rainforest tree species.Oecologia 87, 110–117.
Turner, N.C., 1988. Measurement of plant water status by the pressure chambertechnique. Irrig. Sci. 9, 289–308.
von Caemmerer, S., Farquhar, G.D., 1981. Some relationships between the biochem-istry of photosynthesis and the gas exchange of leaves. Planta 153, 376–387.
von Caemmerer, S., Farquhar, G.D., 1984. Effects of partial defoliation, changes ofirradiance during growth, short-term water stress and growth at enhancedp(CO2) on the photosynthetic capacity of leaves of Phaseolus vulgaris L. Planta160, 320–329.
Wallace, L.L., McNaughton, S.J., Coughenour, M.B., 1984. Compensatory photosyn-thetic responses of three African graminoids to different fertilization, wateringand clipping regimes. Bot. Gaz. 145, 151–156.
Wareing, P.F., Khalifa, M.M., Treharne, K.J., 1968. Rate-limiting processes in photo-synthesis at saturating light intensities. Nature 220, 453–457.
White, D.A., Beadle, C.L., Worledge, D., 1996. Leaf water relations of Eucalyptusglobulus ssp. globulus and E. nitens: seasonal, drought and species effects. TreePhysiol. 16, 469–476.
P.J. Alcorn et al. / Forest Ecology and Management 255 (2008) 3827–38383838
Copyright © 2022 FDOKUMEN