photolytic labeling to probe peptide-matrix interactions in ...
143
PHOTOLYTIC LABELING TO PROBE PEPTIDE-MATRIX INTERACTIONS IN LYOPHILIZED SOLIDS by Yuan Chen Dissertation Submitted to the Faculty of Purdue University In Partial Fulfillment of the Requirements for the degree of Doctor of Philosophy Department of Industrial and Physical Pharmacy, College of Pharmacy West Lafayette, Indiana May 2019
-
Upload
khangminh22 -
Category
Documents
-
view
4 -
download
0
Transcript of photolytic labeling to probe peptide-matrix interactions in ...

PHOTOLYTIC LABELING TO PROBE PEPTIDE-MATRIX
INTERACTIONS IN LYOPHILIZED SOLIDS
by
Yuan Chen
Dissertation
Submitted to the Faculty of Purdue University
In Partial Fulfillment of the Requirements for the degree of
Doctor of Philosophy
Department of Industrial and Physical Pharmacy, College of Pharmacy
West Lafayette, Indiana
May 2019

2
THE PURDUE UNIVERSITY GRADUATE SCHOOL
STATEMENT OF COMMITTEE APPROVAL
Dr. Elizabeth M. Topp, Chair
Department of Industrial and Physical Pharmacy
Dr. Rodolfo Pinal
Department of Industrial and Physical Pharmacy
Dr. Lynne S. Taylor
Department of Industrial and Physical Pharmacy
Dr. Yoon Yeo
Department of Industrial and Physical Pharmacy
Approved by:
Dr. Eric Munson
Head of the Graduate Program

3
For Science

4
ACKNOWLEDGMENTS
The process of finishing my Ph.D. is like a journey. Dr. Topp has been a wonderful mentor to
guide me through it. There are multiple times that I thought I have reached the dead-end of the
road. She is always able to point the right direction for me. At the same time, I appreciate her effort
to encourage students to think freely. I benefit a lot from her wisdom and enthusiasm for science.
At the same time, she has made a great role as a female scientist and leader. The experience I had
in her group has not only taught me how to be an independent researcher, but also enlightened me
on how to be a great person.
I would like to thank my committee members Dr. Rodolfo Pinal, Dr. Lynne Taylor and Dr. Yoon
Yeo. They have provided valuable advices for my thesis. I appreciate their efforts to encourage
students to have a deeper understanding on their research projects. I am grateful to Dr. Shenbaga
Moorthy Balakrishnan and Dr. Ehab Moussa for interesting discussion on scientific projects when
I started my work. Many thanks to lab members Dr. Mohamed AbouGhaly, Dr. Karthik
Balakrishna-Chandrababu, Eunbi Cho, Rajashekar Kammari, Harshil Renawala, Lia Bersin,
Rishabh Tukra, Nathan Wilson and Tarun Mutukuri for being my lab mates. I would also like to
express my gratitude to Mary Ellen Hurt and Nancy Cramer for administrative services.
I am grateful that I could have the chance to be part of the Department of Industrial and Physical
Pharmacy at Purdue. At the end of this journey, I would say it sincerely and proudly – I have had
a great time working towards my PhD.

5
TABLE OF CONTENTS
LIST OF TABLES .......................................................................................................................... 8
LIST OF FIGURES ........................................................................................................................ 9
LIST OF ABBREVIATIONS ....................................................................................................... 12
ABSTRACT .................................................................................................................................. 13
CHAPTER 1. INTRODUCTION .............................................................................................. 17
1.1 Introduction of Photolytic Labeling .................................................................................. 17
1.2 Reaction Mechanism and Applications of Photo-Reactive Reagents ............................... 18
1.2.1 Phenyl Azide .............................................................................................................. 18
1.2.2 Carbene ...................................................................................................................... 19
1.2.3 Benzophenone ............................................................................................................ 21
1.2.4 Applications ............................................................................................................... 22
1.3 Photolytic Labeling In Lyophilized Solids ....................................................................... 27
1.4 The Significance of This Study ......................................................................................... 29
1.5 Hypothesis and Specific Aims .......................................................................................... 30
1.6 Overall Approach .............................................................................................................. 32
CHAPTER 2. QUANTITATIVE ANALYSIS OF PEPTIDE-MATRIX INTERACTIONS IN
LYOPHILIZED SOLIDS USING PHOTOLYTIC LABELING ................................................. 35
2.1 Abstract ............................................................................................................................. 35
2.2 Introduction ....................................................................................................................... 36
2.3 Materials and Methods ...................................................................................................... 39
2.3.1 Materials .................................................................................................................... 39
2.3.2 Analysis of the Unlabeled Peptide ............................................................................. 40
2.3.3 Peptide Labeling and Analysis of the Labeled Peptide ............................................. 41
2.3.4 Formulation Preparation ............................................................................................ 41
2.3.5 Photolytic Cross-Linking and Product Quantitation .................................................. 42
2.3.6 Characterization of Lyophilized Solids ..................................................................... 43
2.4 Results ............................................................................................................................... 44
2.4.1 KLQ and KLQ-SDA Peptide Analysis ...................................................................... 44
2.4.2 Photolytic Labeling in Different Formulations .......................................................... 45

6
2.4.3 Quantitation of Photolytic Labeling Products ........................................................... 51
2.4.4 Comparison of Photolytic Labeling Products Among Formulations ........................ 54
2.4.5 Lyophilized Solid Characterization ........................................................................... 56
2.5 Discussion ......................................................................................................................... 58
2.6 Conclusion ........................................................................................................................ 62
CHAPTER 3. PHOTOLYTIC LABELING TO QUANTIFY PEPTIDE-WATER
INTERACTIONS IN LYOPHILIZED SOLIDS .......................................................................... 63
3.1 Abstract ............................................................................................................................. 63
3.2 Introduction ....................................................................................................................... 64
3.3 Materials and Methods ...................................................................................................... 68
3.3.1 Materials .................................................................................................................... 68
3.3.2 Peptide Preparation and Quantitation ........................................................................ 68
3.3.3 Lyophilized Sample Preparation................................................................................ 69
3.3.4 Moisture Content Study ............................................................................................. 70
3.3.5 Photolytic Labeling Reaction and Product Quantitation ........................................... 71
3.3.6 Tg Measurement ......................................................................................................... 72
3.4 Results ............................................................................................................................... 73
3.4.1 Identification of Water-Related Products .................................................................. 73
3.4.2 Effects of Moisture on Physical Properties of Lyophilized Solids ............................ 76
3.4.3 Effect of Moisture Content on Photolytic Labeling Products in Lyophilized Solids 78
3.4.4 Effects of Moisture Content on Conversion to KLQ-H2O and KLQ-Excipient Adducts
in Lyophilized Solids ............................................................................................................. 82
3.4.5 Formation of KLQ-PO4 in Lyophilized Solids .......................................................... 84
3.5 Discussion ......................................................................................................................... 86
3.6 Conclusion ........................................................................................................................ 90
CHAPTER 4. A NOVEL PHOTO-REACTIVE EXCIPIENT TO PROBE PEPTIDE-MATRIX
INTERACTIONS IN LYOPHILIZED SOLIDS .......................................................................... 91
4.1 Abstract ............................................................................................................................. 91
4.2 Introduction ....................................................................................................................... 92
4.3 Materials and Methods ...................................................................................................... 96
4.3.1 Materials .................................................................................................................... 96

7
4.3.2 Synthesis of pGlcN .................................................................................................... 97
4.3.3 Preparation of Lyophilized Formulations .................................................................. 98
4.3.4 Photolytic Labeling and Product Analysis ................................................................ 99
4.4 Results ............................................................................................................................. 101
4.4.1 Determination of Reaction Time for Photo-reactive Excipients ............................. 101
4.4.2 Photolytic Labeling of sCT with pLeu .................................................................... 102
4.4.3 Photo-reaction of pLeu in Solution .......................................................................... 104
4.4.4 Peptide Fragment Analysis of pLeu-Labeled sCT................................................... 105
4.4.5 Photolytic Labeling of sCT with pGlcN .................................................................. 108
4.4.6 Peptide Fragment Analysis of pGlcN-Labeled sCT ................................................ 110
4.4.7 Photo-reaction of pGlcN in Solution ....................................................................... 111
4.5 Discussion ....................................................................................................................... 112
CHAPTER 5. CONCLUSIONS ............................................................................................... 117
5.1 Current Development ...................................................................................................... 117
5.2 Future Challenges ........................................................................................................... 119
APPENDIX ................................................................................................................................. 121
REFERENCES ........................................................................................................................... 128
VITA ........................................................................................................................................... 141
8
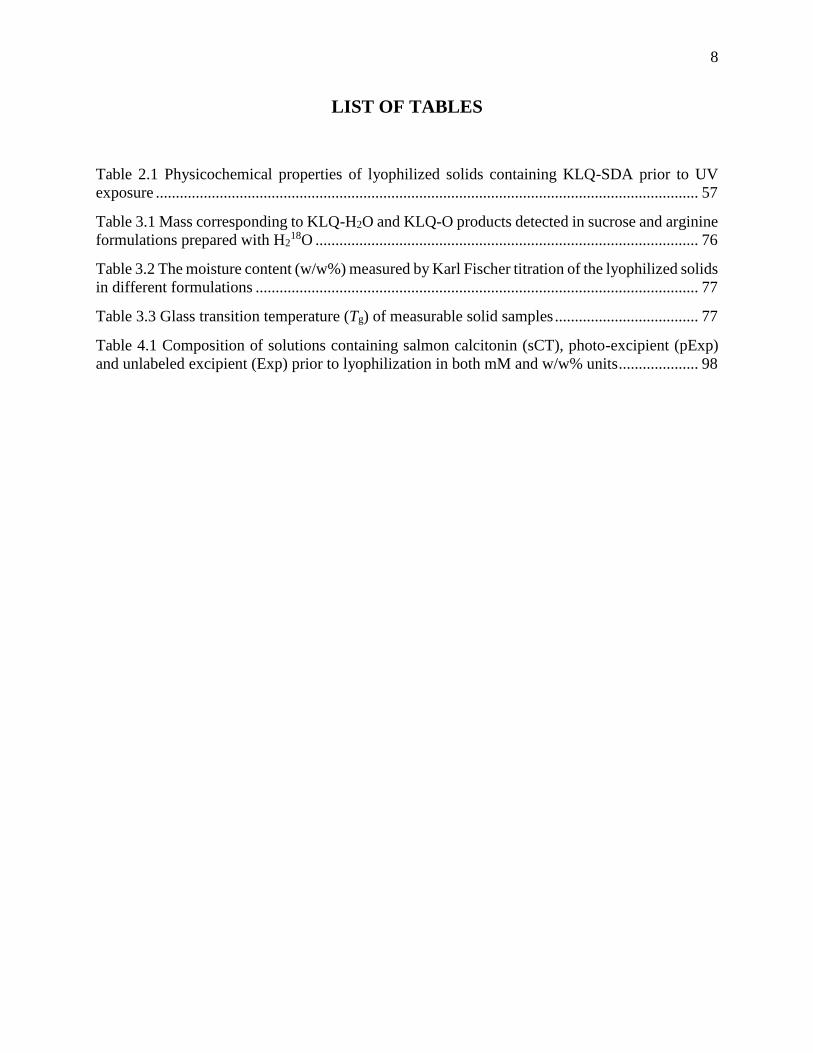
LIST OF TABLES
Table 2.1 Physicochemical properties of lyophilized solids containing KLQ-SDA prior to UV
exposure ........................................................................................................................................ 57
Table 3.1 Mass corresponding to KLQ-H2O and KLQ-O products detected in sucrose and arginine
formulations prepared with H218O ................................................................................................ 76
Table 3.2 The moisture content (w/w%) measured by Karl Fischer titration of the lyophilized solids
in different formulations ............................................................................................................... 77
Table 3.3 Glass transition temperature (Tg) of measurable solid samples .................................... 77
Table 4.1 Composition of solutions containing salmon calcitonin (sCT), photo-excipient (pExp)
and unlabeled excipient (Exp) prior to lyophilization in both mM and w/w% units .................... 98

9
LIST OF FIGURES
Figure 1.1 Reaction pathway of phenyl azide reagents. Adapted from [15] and [18]. ................. 19
Figure 1.2 Reaction pathway of diazirine with trifluoromethylphenyldiazirine as an example (A)
and diazo ketone showing Wolff rearrangement (B). Adapted from [21] and [24]. .................... 21
Figure 1.3 Reaction pathway of benzophenone. Adapted from [33]. ........................................... 22
Figure 1.4 Structures of photo-reactive amino acids site specifically incorporated into proteins in
vivo. Adapted from [7,31,40–42,44]. ............................................................................................ 24
Figure 2.1 The reaction pathways for peptide labeling with SDA and photolytic labeling of SDA-
labeled peptide. SDA reacts with primary amine on the lysine residue and SDA-labeled peptide
forms with elimination of N-hydroxysuccinimide. With UV exposure at 365 nm, the following
products could form: photolytic labeling adducts with molecules such as excipients, water and salt
from buffer in vicinity and dead-end products from unproductive intramolecular reaction. ....... 39
Figure 2.2 Quantitation of KLQ and KLQ-SDA peptides by rp-HPLC. Representative rp-HPLC
chromatogram for the KLQ peptide (Ac-QELHKLQ-NHCH3) (A) and corresponding calibration
curve relating peak area (AUC) to concentration (B). Representative rp-HPLC chromatogram for
the diazirine-labeled KLQ peptide (KLQ-SDA) (C) and corresponding calibration curve relating
peak area (AUC) to concentration (D). See text for chromatographic conditions........................ 45
Figure 2.3 Representative rp-HPLC chromatograms of solutions and reconstituted lyophilized
powders containing the photolytically labeled KLQ-SDA peptide following UV exposure, in
formulations containing: (A) sucrose, (B) trehalose, (C) mannitol, (D) histidine, (E) arginine, (F)
urea or (G) NaCl. See text for formulation composition. Peak assignments and masses by LC-MS
were: 1. KLQ (949.5 Da); 2. KLQ-PO4 (1129.6 Da); 3. KLQ-H2O Form I (1049.6 Da); 4. dead-
end product (1031.6 Da); 5. unreacted KLQ-SDA (1059.6 Da); 6. KLQ-H2O Form II (1047.6Da);
7. unknown product (1146.6Da). KLQ and KLQ-excipient co-eluted at 11 min (peak 1) in sucrose
(lyo), trehalose (lyo), mannitol (lyo), histidine (solution and lyo) and arginine (lyo) formulations.
KLQ-urea (lyo) co-eluted with KLQ-H2O (Form I). KLQ-excipient was not detected in the NaCl
formulation. ................................................................................................................................... 49
Figure 2.4 Fractional conversion (in percentage) of KLQ-SDA to cross-linked products following
UV exposure in solution (top) and lyophilized solids (bottom) containing: (A) sucrose, (B)
trehalose, (C) mannitol, (D) histidine, (E) arginine, (F) urea or (G) NaCl. See text for formulation
composition. Products are indicated by colors: orange = KLQ-excipient adduct; green = KLQ;
black = KLQ-PO4 adduct; dark blue = KLQ-water adduct (Form I); light blue = KLQ-water adduct
(Form II); yellow = dead-end product; purple = unreacted KLQ-SDA; grey = unidentified products;
white = unrecovered KLQ-SDA compared to the stock before photolytic reaction. The total sums
to 100%. ........................................................................................................................................ 54
Figure 2.5 Comparison of photolytic labeling products from KLQ-SDA on exposure to UV light
across various formulations in solution and lyophilized solids. Quantities of (A) KLQ-excipient,
(B) KLQ-H2O, (C) dead-end products and (D) unreacted KLQ-SDA are shown as the fractional

10
conversion from KLQ-SDA, reported as a percentage. KLQ-H2O adducts in lyophilized solids
include both Form I and Form II; see text for details. .................................................................. 56
Figure 2.6 Comparison of KLQ-H2O water adducts following photolytic labeling of the KLQ-SDA
peptide in lyophilized samples (as % of KLQ-SDA) with bulk moisture content of the solid
measured by Karl Fischer titration. KLQ-H2O adducts in lyophilized solids include both Form I
and Form II. Error bars not shown when less than symbol height. .............................................. 58
Figure 3.1 Proposed structures of products assigned to peptide-water adducts in the previous
study27: A. hydroxyl form; B. ketone form. .................................................................................. 73
Figure 3.2 Distribution of photolytic labeling products in lyophilized solids of the arginine
formulation with air or N2 in the vial headspace, or sealed under vacuum. The areas of the segments
reflect the fractional conversion of KLQ-SDA to specific products: green = regenerated parent
peptide (KLQ); orange = adduct with arginine (KLQ-arginine); black = adduct with phosphate
(KLQ-PO4); dark blue = adduct with water, hydroxyl form (KLQ-H2O); light blue = product
previously assigned to the ketone form of peptide-water adducts (KLQ-O); yellow = dead-end
products; purple = unreacted KLQ-SDA; white = unrecovered. See text for additional details. . 74
Figure 3.3 Fractional conversion to various photolytic labeling products in lyophilized
formulations containing different excipients (sucrose, trehalose, mannitol, histidine, arginine) with
varied RH exposure (8%, 13%, 33%, 45% and 78% RH). Lyophilized samples without RH
exposure and solution samples are included as controls. The area of each colored sector represents
the fractional conversion (%) of KLQ-SDA to a specific product after photo-reaction: green =
regenerated KLQ; orange = KLQ-excipient; black = KLQ-PO4; blue (dark) = KLQ-H2O; blue
(light) = KLQ-O; yellow = dead-end products; purple = unreacted KLQ-SDA; grey (dark) = an
unknown product (1146.6 Da); grey (light) = unidentified products (unknown identities,
concentration difference resulted from rp-HPLC result and EIC result); white = unrecovered. Any
fractional conversion < 1% was neglected.................................................................................... 79
Figure 3.4 Fractional conversion (%) of KLQ-SDA to KLQ-H2O adduct (open triangles) and KLQ-
excipient adducts (closed circles) as a function of moisture content (w/w%) in lyophilized solids
containing (A) sucrose, (B) trehalose, (C) mannitol, (D) histidine, or (E) arginine. See text for
formulation composition. n=3 ±SD for both moisture content measurement and photolytic labeling
product quantitation; SD not shown when smaller than the symbol. ........................................... 83
Figure 3.5 The fractional conversion of KLQ-SDA to KLQ-PO4 in the lyophilized solids with
exposure to different RH conditions across formulations............................................................. 86
Figure 4.1 A. Structures of photo-excipients used in this study. L-photo-leucine (pLeu) is
commercially available; glucosamine diazirine (photo glucosamine, pGlcN) was chemically
synthesized (see Materials and Methods). B. Proposed reaction of photo-excipients with peptides
in the solid state on exposure to UV light, showing initial production of the reactive carbene
followed by formation of a covalent adduct with the peptide; R = photo-excipient (pLeu or pGlcN),
Peptide = salmon calcitonin (sCT). ............................................................................................... 96
Figure 4.2 Synthesis of photo glucosamine (pGlcN). ................................................................... 97
Figure 4.3 Labeling reaction in sucrose formulations with either pLeu or pGlcN at pre-
lyophilization solution pH 6 and 9.9 with different UV exposure time. The composition of
11
photolytic labeling products is shown as a percentage (%) at three time points of UV exposure: 30,
40 and 60 min. n = 3 +/- SD. ...................................................................................................... 102
Figure 4.4 The composition of photolytic labeling products in pLeu formulations at various pre-
lyophilization pH conditions: (A) pH 6, (B) pH 7.2, (C) pH 8.4 and (D) pH 9.9. The products were
quantified as the fractional area of all final products (%) by EIC on LC-MS; see text. n = 3 +/- SD.
..................................................................................................................................................... 103
Figure 4.5 Comparison of photolytic labeling products formed in pLeu formulations. n = 3 +/- SD.
..................................................................................................................................................... 104
Figure 4.6 Comparison of labeled sCT in solution and lyophilized solids of pLeu formulation
containing sucrose. n = 3 +/- SD. ................................................................................................ 105
Figure 4.7 Digest map of sCT after photo-reaction showing pLeu-labeled peptide fragments.
Trypsin digestion of unlabeled sCT yielded four peptide fragments with amino acids from 1-11,
12-18, 19-24 and 25-32. Digestion of pLeu-labeled sCT generated unlabeled (not shown) and
labeled peptide fragments. The pLeu-labeled fragments were: native fragments (i.e., fragments
found for unlabeled sCT) with one pLeu label (white bar), mis-cleaved peptide fragments with one
pLeu label (grey bar) or mis-cleaved peptide fragments with two pLeu labels (black bar). ...... 107
Figure 4.9 The composition of photolytic labeling products in pGlcN formulations at two pre-
lyophilization solution pH conditions: (A) pH 6 and (B) pH 9.9. The products were quantified as
the fractional area of all final products (%) by EIC on LC-MS; see text. n = 3 +/- SD. ............ 109
Figure 4.10 Comparison of photolytic labeling products formed in pGlcN formulations. n = 3 +/-
SD. .............................................................................................................................................. 110
Figure 4.11 Digest map of sCT after photo-reaction showing pGlcN-labeled peptide fragments.
The digestion of pGlcN labeled sCT generated unlabeled (not shown) and labeled peptide
fragments. The pGlcN-labeled fragments were: native fragments (i.e., fragments found for
unlabeled sCT) with one pGlcN label (white bar) and mis-cleaved peptide fragments with one
pGlcN label (grey bar). ............................................................................................................... 111
Figure 4.12 Comparison of labeled sCT in solution and lyophilized solids of pGlcN formulations
containing sucrose. n = 3 +/- SD. ................................................................................................ 112
Appendix Figure
Figure A1 Photolytic reaction of SDA-labeled peptide with species present in solution and solid
formulations, showing proposed product structures ................................................................... 121
Figure A2 Comparison of KLQ-H2O water adducts (Form I only) following photolytic
crosslinking of the KLQ-SDA peptide in lyophilized samples (as % of KLQ-SDA) with bulk
moisture content of the solid measured by Karl Fischer titration ............................................... 122
Figure A3 Change in moisture content (w/w%) with time in lyophilized samples exposed to
relative humidity (RH) at 8% and 78% as measured by Karl Fischer titration .......................... 127

12
LIST OF ABBREVIATIONS
SDA (NHS-Diazirine), succinimidyl 4,4’-azipentanoate
KLQ, model peptide with the sequence Ac-QELHKLQ-NHCH3
KLQ-SDA, SDA labeled KLQ peptide
rp-HPLC, reversed-phase High Performance Liquid Chromatography
LC-MS, Liquid Chromatography-Mass Spectrometry
EIC, Extracted Ion Chromatogram
AUC, Area under the Curve
Tg, Glass Transition Temperature
pLeu, L-2-amino-4,4'-azi-pentanoic acid
pGlcN, photo-glucosamine/ glucosamine-diazirine
sCT, Salmon Calcitonin

13
ABSTRACT
Author: Chen, Yuan. PhD
Institution: Purdue University
Degree Received: December 2018
Title: Photolytic Labeling to Probe Peptide-Matrix Interactions in Lyophilized Solids
Committee Chair: Elizabeth M. Topp
Therapeutic proteins are often lyophilized with excipients such as sucrose or trehalose to protect
them during manufacturing and achieve a longer shelf-life. Formulation design for therapeutic
proteins has been a trial-and-error process, and the mechanisms responsible for the stabilizing
effects of excipients are not fully understood. Two proposed theories have been widely accepted:
the water replacement theory and the vitrification theory.1,2 The water replacement theory suggests
that excipients stabilize protein molecules in the solid state by forming hydrogen bonds that
“replace” the hydrogen bonds to water that stabilize the protein in solution, while the vitrification
theory asserts that proteins are stabilized by a glassy solid matrix of low mobility and does not
require direct interactions between excipient and protein. A better understanding of the interactions
between proteins and other components of the lyophilized matrix can facilitate rational formulation
design and shorten the time in development. However, most of the analytical methods available
can only provide information on the bulk properties of the lyophilized matrix such as moisture
content and glass transition temperature (Tg); it has been difficult to measure the interactions
between protein and excipient directly, if they exist. In order to characterize the interactions
between protein and excipients in a lyophilized matrix with high resolution, a photolytic labeling
method was developed in this dissertation, building on previous work in our research group.
Photolytic labeling has long been used to identify protein-protein interactions in vivo.3,4 Common
types of photo-reaction reagents and their applications are summarized in Chapter 1. The research

14
described in this dissertation utilizes the diazirine functional group, which is activated after UV
exposure and undergoes a free radical reaction to form covalent bonds with nearby molecules. The
reaction can be used to identify the interactions between excipients and protein or peptide in a
solid formulation. Previous studies in our lab have shown that photo-reaction can be applied to
lyophilized solids to study protein-matrix properties and interactions in the solid.5,6 This
dissertation seeks to further identify photo-reaction products and analyze them in a more
quantitative way.
Chapter 2 describes a quantitative analysis of photo-reaction products in solution and lyophilized
solids using a model peptide, KLQ (Ac-QELHKLQ-NHCH3). The purpose of the work in this
chapter is to establish a quantitative analytical method for photo-reaction products, enabling
studies of peptide-excipient interactions in lyophilized solids. KLQ was derivatized with a
bifunctional probe NHS-diazirine (succinimidyl 4,4’-azipentanoate; SDA) at Lys5 to be photo-
reactive. The SDA derivatized KLQ (KLQ-SDA) was used to study the photo-reaction products
and examine excipient interactions. Identification and quantitation of photo-reaction products of
KLQ-SDA was achieved with liquid chromatography mass spectrometry (LC-MS) and reversed
phase HPLC (rp-HPLC). Important reaction products such as peptide-excipient adducts and
peptide water adducts varied in different formulations. Unexpected reaction products such as
unproductive “dead-end” products and peptide-phosphate adducts from buffer salt were also
detected and quantified. Together, the photo-reaction products reflected the local environment near
Lys5 of the peptide in the solid state. This study has provided a better understanding of photo-
reaction with diazirine in the lyophilized solids together with a quantitative description of the local
environment near Lys5.

15
In Chapter 3, the photo-reaction products in lyophilized solids exposed to increasing moisture were
analyzed, and the effect of increasing moisture on the local environment near the peptide was
examined. Using the analytical method developed in Chapter 2, these studies explored whether
peptide-water interactions, as measured by the formation of water adducts formed by photolytic
labeling, are linearly correlated with an increase in solid bulk moisture content. Formulations
containing the KLQ-SDA peptide were exposed to various relative humidity conditions and
photolytic labeling was induced. Solids containing disaccharide excipients behaved differently
from those containing amino acids when exposed to the same relative humidity condition, showing
different levels of peptide-excipient and peptide-water adducts. With increasing moisture content
in the solids, the formation of photo-reaction products did not mimic the pattern of solutions with
same composition, indicating differences in the local environment.
An alternative approach to studying lyophilized formulations using photolytic labeling is to
incorporate photo-reactive excipients into the solid matrix. In Chapter 4, a new diazirine-labeled
photo-excipient, photo-glucosamine (pGlcN), was chemically synthesized and incorporated into
formulations of the therapeutic peptide salmon calcitonin (sCT) and compared with the
commercially available diazirine-labeled amino acid, photo-leucine (pLeu). The studies in Chapter
4 further compared peptide-excipient interactions at the molecular level with two different photo-
excipients, ionizable pLeu and unionizable pGlcN. Changing solution pH prior to lyophilization
was expected to change ionic interactions between sCT and pLeu in the solid samples, resulting in
different distributions of photo-reactions products; pH-dependent differences were not expected
for pGlcN. The results demonstrated that the distribution of photo-reaction products varied with
the composition of the formulation and the pH of the solution prior to lyophilization. The photo-

16
reaction products in the pGlcN-containing formulation differed from those pLeu, showing a
difference in the interactions of unionizable (pGlcN) and ionizable (pLeu) excipients with sCT in
solid samples.
The work in this dissertation has developed photolytic labeling as a tool to study lyophilized
peptide formulations, and has provided a more quantitative understanding of the photo-reaction
products that are produced from diazirine-labeled peptides or excipients in the solid state. A new
photo-reactive excipient has also been presented (pGlcN), which showed different photo-reaction
products than a commercially available photo-excipient (pLeu) and is promising for future study.
Photolytic labeling for formulation development is still in its early stages, and additional research
regarding reaction mechanism and complementary stability studies is needed. Nevertheless, the
results presented in this dissertation support continued development of photolytic labeling as a
practical method for formulation design and development.
17
CHAPTER 1. INTRODUCTION
*Part of the content in this chapter was published in Journal of Pharmaceutical Sciences.
DOI: 10.1016/j.xphs.2018.10.017
1.1 Introduction of Photolytic Labeling
Photolytic labeling, also known as photoaffinity labeling and photo-crosslinking, is a series of
chemical reactions that are activated upon exposure to light at a certain wavelength. With covalent
bond formation after UV activation, transient protein-protein or protein-ligand interactions can be
captured.7,8 The use of photo-reactive reagents can be dated back to 1969 when the 4-azido-2-
nitrophenyl group was first used to label bovine -globulin and human serum albumin to study
antibodies in vivo.9 Today, the application of photolytic labeling has been expanded to other areas
such as identification of membrane protein targets and the elucidation of protein structure in
solution.10,11 Photo-reactive reagents typically are stable before UV activation and become reactive
under specific activation conditions. Moreover, photolytic labeling generates covalently modified
products that are stable enough to be analyzed with common analytical methods. These properties
have allowed photolytic labeling to be increasingly used to study protein interactions both in vitro
and in vivo.
Recently, photolytic labeling has also been used in the study of lyophilized formulation of proteins.
Traditional photo-reactive reagents, which were commonly used in protein-protein interaction
studies in vivo, were either incorporated in the protein structure or in the lyophilized matrix to
study the protein-excipient interactions.5,6 Quantitation of the productions of these photo-reaction
has been limited, however, together with a lack of information regarding the mechanisms of
18
photolytic labeling in solid state. In the following sections, the known mechanisms of common
photo-reactive reagents are summarized. Their applications are also described.
1.2 Reaction Mechanism and Applications of Photo-Reactive Reagents
1.2.1 Phenyl Azide
Phenyl azide labels have been incorporated in the protein structure to study protein-protein
interactions, often using modified amino acids such as p-azido-L-phenylalanine.12 The absorption
maximum for the phenyl azide group is ~260 nm when the phenyl ring is unsubstituted.13 In studies
involving proteins, the short wavelength required to activate phenyl azides may cause damage to
protein structures.14 The reaction mechanism has been studied in a rigid glassy system consisting
of diethyl ether, isopentane and ethanol at 77K.15 After UV activation, singlet and triplet
phenylnitrene were proposed as transient intermediates. Phenylnitrene can insert into C-H, N-H or
O-H bonds and form covalently labeled products. Phenylnitrene can also undergo ring expansion
to form addition products with nucleophiles such as primary or secondary amines. Trace amounts
of azobenzene were detected as side products of the reaction.15 The oxidation of phenylnitrene
with formation of nitrobenzene has also been reported.16 The reaction products can be affected by
system temperature and by substituent groups on the aromatic ring.17 With many possible reaction
pathways (Fig. 1.1), the labeling yields are often low after irradiation.18 Nitrenes have shown
different reactivities towards naturally occurring amino acids, with a preference for cysteine and
aromatic amino acids, suggesting that labeling may favor interactions involving these amino
acids.19

19
Figure 1.1 Reaction pathway of phenyl azide reagents. Adapted from [15] and [18].
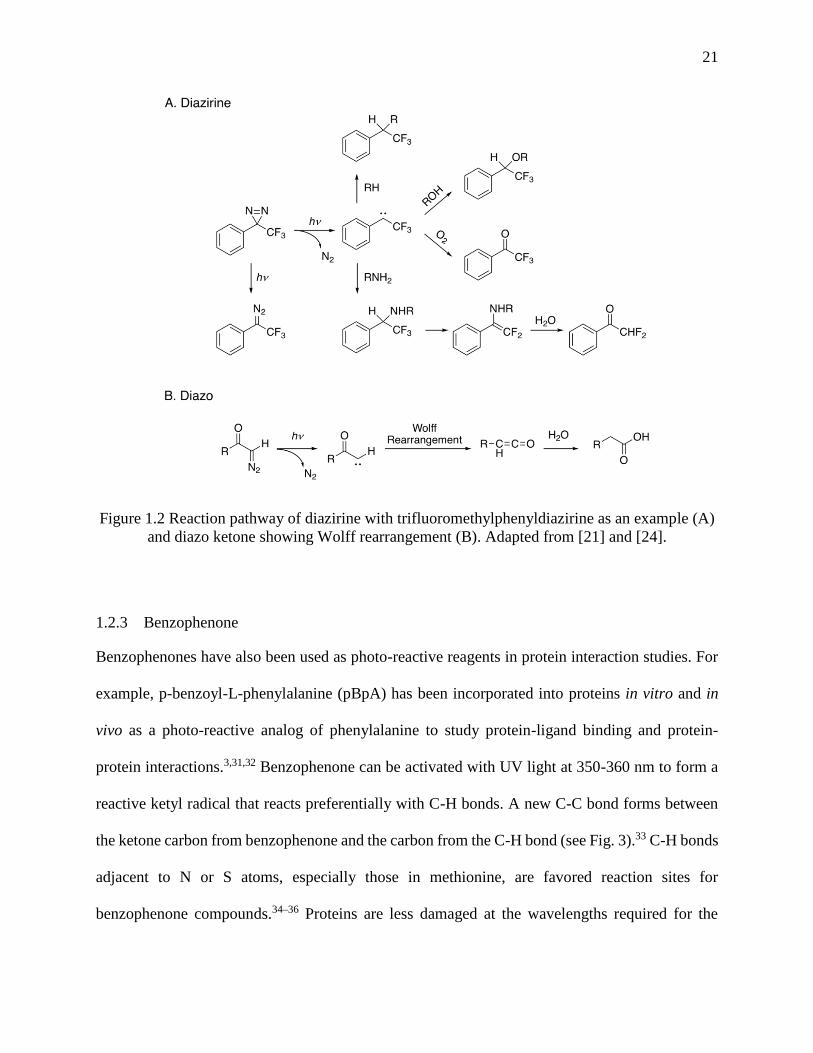
1.2.2 Carbene
Carbenes can form covalent bonds with molecules in their vicinity by inserting into C-C bonds,
X-H (X=C, O, N, S) bonds or adding onto C=C bonds.20–22 Photolytic labeling with carbenes is a
fast, relatively non-specific radical reaction. Carbenes can be generated from diazirine or diazo
groups after UV activation at a certain wavelength.23 Stable diazo compounds such as diazo
ketones have been reported to undergo the Wolf rearrangement (see Fig. 1.2 B), which leads to the
formation of ketene products.24 Ketenes can be further hydrolyzed by water to form carboxylic
acids,25 or can react with other nucleophiles. The inherent instability and low labeling yield of
diazo compounds has limited their application in photolytic labeling studies.13
Unlike diazo compounds, diazirines tend to be relatively stable, allowing their broad application
in protein interaction studies.26 In the absence of activating light, diazirines are stable at room
temperature. Activation requires absorption of light at relatively long wavelengths (330-370 nm),
causing less damage to protein structure than with phenyl azides. It has been shown that the

20
diazirine radical reaction also occurs in amorphous solid powders.6 In addition to the expected
photolytic labeling products, diazirine adducts with water and phosphate from buffer salt were
detected in solution and solid-state reactions in these studies.27 “Dead-end” products, resulting
from deactivation of the carbene without intermolecular reaction, accounted for a large fraction of
the photolytic labeling products in these samples.27 The structures of these dead-end products
remain unknown. Ketones can form at the carbene carbon after oxidation by O2 or hydrolysis of
N-H insertion products.21 Photolysis of the diazirine can induce conversion to diazo compounds,
which have low reactivity and can lead to undesired side products.28 A trifluoromethyl group can
be introduced into the diazirine carbon to stabilize the carbene and prevent rearrangement.29 The
reaction pathways of diazirines are shown in Fig. 1.2, using trifluoromethylphenyldiazirine
(TFMD) as an example.
The selectivity of the carbene towards different amino acid side chains has been studied in
fiberglass coupled with 3-(trifluoromethyl)-3-(m-isothiocyanophenyl) diazirine.30 In this study,
carbene preferentially interacted with cysteine and aromatic amino acids while relatively low
affinity was observed for amino acids with aliphatic side chains. Although carbene reactions are
thought to be relatively non-specific in solution, it remains unclear whether the preferential
reactivity observed in the fiberglass system also occurs in amorphous powders containing proteins.
21
Figure 1.2 Reaction pathway of diazirine with trifluoromethylphenyldiazirine as an example (A)
and diazo ketone showing Wolff rearrangement (B). Adapted from [21] and [24].
1.2.3 Benzophenone
Benzophenones have also been used as photo-reactive reagents in protein interaction studies. For
example, p-benzoyl-L-phenylalanine (pBpA) has been incorporated into proteins in vitro and in
vivo as a photo-reactive analog of phenylalanine to study protein-ligand binding and protein-
protein interactions.3,31,32 Benzophenone can be activated with UV light at 350-360 nm to form a
reactive ketyl radical that reacts preferentially with C-H bonds. A new C-C bond forms between
the ketone carbon from benzophenone and the carbon from the C-H bond (see Fig. 3).33 C-H bonds
adjacent to N or S atoms, especially those in methionine, are favored reaction sites for
benzophenone compounds.34–36 Proteins are less damaged at the wavelengths required for the

22
activation of benzophenone than with the shorter wavelengths needed for phenyl azides, although
benzophenone occasionally requires a relatively long irradiation period.37 The structure of
benzophenone makes it stable in many solvents. However, one of the disadvantages of using
benzophenone is that its structure does not mimic those of natural amino acids without aromatic
rings. As a result, protein structure may be disrupted with the incorporation of pBpA or other
benzophenones.
Figure 1.3 Reaction pathway of benzophenone. Adapted from [33].
1.2.4 Applications
1.2.4.1 Protein-protein Interactions
Photo reactive reagents have been used to study protein-protein interactions in vivo. These reagents
tend to have structures similar to those of natural amino acids and can be site-specifically
incorporated into the protein. UV irradiation in situ induces the formation of covalent protein-
protein adducts, allowing transient protein-protein interactions to be captured.
L-photo-leucine and L-photo-methionine are two diazirine compounds that can be chemically
synthesized (see Fig. 1.4 A) and are available commercially. Their structures are similar to the
corresponding natural amino acids. Photo-leucine and photo-methionine have been successfully
incorporated into membrane proteins through unmodified mammalian translation machinery of
COS7 (monkey kidney) cells.7 These two unnatural amino acids were nontoxic to these cells.

23
Different protein-protein complexes linked with covalent bonds were detected by western blotting.
Photolytic labeling enabled a new protein-protein interaction between membrane protein
PGRMC1 and Insig-1 to be identified, which is involved in the regulation of cellular lipid
homeostasis. In a study of Alzheimer’s disease, photo-leucine and photo-methionine were used to
confirm the preferential binding of soluble oligomeric assemblies of amyloid peptides (ADDLs)
with a subunit of AMPA receptors in neurons.38 A similar method utilizing these two photo-
reactive reagents was used to detect a direct interaction between subunits of RNA polymerase II
and a mediator protein complex in eukaryotic cells.39
Several diazirine compounds with structures similar to lysine have been used to study protein-
protein interactions. 3’-azibutyl-N-carbamoyl-lysine (AbK) has the diazirine functional group
attached at the end of the lysine side chain. An approach using a combination of AbK photolytic
labeling and stable isotope labeling of amino acids in cell culture (SILAC) allowed protein
interactions with histone subunits to be identified in HEK293T cells.40 A second photolytically
labeled lysine that retains the primary amine on the side chain was site-specifically incorporated
into histone and used to identify histone and chromatin binding proteins during post-translational
modifications in HeLa cells.41 In order to expand the spatial range in which interactions could be
detected, N-[((4-(3-(trifluoromethyl)-3H-diazirin-3-yl)- benzyl)oxy)carbonyl]-L-lysine
(TmdZLys) was prepared to detect possible protein interactions, with a spacer arm of 15 Å.42
Structures of AbK, photo lysine and TmdZlys are shown in Fig. 1.4 B.
The benzophenone compound p-benzoyl-L-phenylalanine (pBpA) has been used for protein-
protein interaction studies in vitro and in vivo following procedures similar to those described

24
above.31 pBpA has also been used to study protein-DNA binding.43 Another diazirine derivative
of phenylalanine, 4’-[3-(trifluoromethyl)-3H-diazin-3-yl]-L-phenylalanine (TmfdPhe), has been
genetically encoded in Escherichia coli and could be used in photolytic labeling in vivo44, though
results have not been reported. Structures of pBpA and TmfdPhe are shown in Fig. 1.4 C.
Figure 1.4 Structures of photo-reactive amino acids site specifically incorporated into proteins in
vivo. Adapted from [7,31,40–42,44].
1.2.4.2 Protein-ligand Binding
Photolytic labeling can be used to identify the interactions involved in ligand binding. For ligands
that interact with proteins non-covalently, it is often difficult to detect their target in situ. Ligands
with photo-reactive functional groups can be activated after UV exposure to form covalent bonds
with the target protein. The ligand-protein complex can then be analyzed with methods such as
SDS-PAGE and liquid chromatography mass spectrometry (LC-MS). Known ligands with photo-
reactive functional groups can also be used to discover off-target interactions, and to study
selectivity in ligand-protein binding.

25
In early development, many drugs are designed to be ligands that are selective for specific targets.
Off-target interactions are generally undesirable, as they can lead to unexpected side effects.45
However, the study of off-target interactions may expand the understanding and effective usage of
existing drugs, and may enable the discovery of new drugs or facilitate screening of drug
candidates for a range of targets early in development.46 Dasatinib is a chemotherapeutic agent
that targets the Src/Abl family of tyrosine kinases, and is used for the treatment of imatinib-
resistant chronic myelogenous leukemia (CML).47 DA-2, a dasatinib analog with its core structure
maintained, was used to establish a proteome profiling method to identify off-target interactions
of dasatinib in vivo.48 DA-2 differs from dasatinib in that a diazirine and an alkyne were introduced
through chemical synthesis. DA-2 was internalized by both K562 and HepG2 cancer cells and
bound to various intracellular targets. Following UV exposure, covalent bonds formed between
DA-2 and the target proteins through the diazirine moiety. Two click reporters, rhodamine and
biotin, each modified to contain an azide group, were then reacted with the DA-2 alkyne through
click chemistry, allowing the ligand-complexes to be purified and analyzed. Several
serine/threonine kinases were identified with this method, and their activities were validated by
pull-down/immunoblotting experiments and kinase inhibition assays. In this study, the photolytic
labeling method was able to identify more putative targets than an immobilized dasatinib affinity
matrix. Similar diazirine and alkyne modifications have been made to the inhibitor MLN8237,
which targets the ATP-binding site of kinases. The off-target interactions of MLN8237 were
identified.49
Angiotensin II (AngII) is an octapeptide hormone that activates AT1 and AT2 receptors and
functions in the regulation of the cardiovascular system.50 Some truncated analogs of AngII have

26
been found to be biological active, but their receptors are difficult to distinguish from one another.
Two photo-reactive analogs of the hexapeptide AngIV, [N3-Phe6]AngIV and [Bpa6]AngIV, were
developed with the photo-reactive functional group at the phenylalanine residue.51 [N3-
Phe6]AngIV underwent the phenyl azide photo-reaction (Fig. 1.1) and [Bpa6]AngIV underwent
the benzophenone photo-reaction (Fig. 1.3). [N3-Phe6]AngIV and [Bpa6]AngIV showed high
affinity for the AT4 receptor from bovine endothelial membrane. Subsequent analysis of AT4
showed that this receptor is a 186 kDa integral membrane glycoprotein.
1.2.4.3 Structure of Proteins and Their Oligomers
Photolytic labeling can be used to form covalent bonds between nearby residues within proteins
themselves. Following UV exposure, analysis of the digested peptides provides information on
protein structure. Three hetero-bifunctional probes that are both isotopically-labeled and photo-
reactive have been developed to study protein structure.11 All have an NHS ester in their structure
that reacts preferentially with primary amines, allowing derivatization of lysine groups in the
protein. The photo-reactive functional groups on the probes were phenyl azide (ABAS-12C6/13C6),
diazirine (SDA-12C5/13C5) and benzophenone (CBS-12C6/
13C6). Proteins were first incubated with
the probe in the dark to allow reaction with the NHS ester, followed by UV exposure to induce
covalent bond formation within ~ 5 or 7 Å of the lysine nitrogen atom. ABAS and CBS were able
to detect crosslinks in a well-established system of RNase S. The probe ABAS was also used to
study the structure of a disordered protein, -synuclein, which is implicated in neurodegenerative
disease. Multiple interactions within the protein were identified.

27
Transient protein-interactions, such as oligomerization dependent on post-translational
modifications, can be difficult to capture. To address this problem, photo methionine was site-
specifically incorporated into the MH2 domain of the Smad2 signaling protein, which forms homo-
trimers in response to the phosphorylation of serine residues.52 This method was compatible with
both solid-phase peptide synthesis and expressed protein ligation. The transient MH2-MH2
interaction was captured with photolytic labeling. In a study of A16-22, its photo-reactive analogs
were generated and incubated to form aggregates.53 Photolytic labeling of the diazirine analog
within the aggregates was successfully used to characterize the inter-peptide interactions. The
insertion sites were identified with LC-MS analysis.
1.3 Photolytic Labeling In Lyophilized Solids
Lyophilization, also known as freeze-drying, is widely used to create dried powders of therapeutic
proteins with the goal of preserving the protein and extending the shelf-life of the product.54
Excipients such as disaccharides are usually included in the formulation, and are thought to
contribute to stabilization by interacting with the protein in the solid matrix.55 Understanding the
interactions between the lyophilized matrix and the protein could contribute to rational formulation
design and reduce the time-to-market for new protein drugs. At present, however, there is a lack
of methods able to detect non-covalent protein-matrix interactions in the solid state. Photolytic
labeling has been used as a new tool to address this problem. Among the photo-reactive reagents
summarized in the previous section, diazirine functional group has been utilized for its relatively
small size and high labeling efficiency. Photolytic labeling with diazirine has been applied in the
lyophilized solid by two different approaches: 1) incorporating the photo-reactive functional group
in protein structure; 2) incorporating photo-reactive reagents in formulation matrix as regular

28
excipients. The former approach would detect the local environment near the residue where the
photo-reactive functional group is attached, while the latter one focuses on the excipient behavior.
As an example of the first approach, the photo-reactive reagent can be site-specifically
incorporated into the protein to study its interaction with surrounding environment in the
lyophilized solids. Succinimidyl 4,4’-azipentanoate (SDA) was used to react with lysine residues
in order to introduce a diazirine functional group into myoglobin.6 The addition of the diazirine
label did not disturb the overall structure of myoglobin. Diazirine-labeled myoglobin was then
lyophilized with either raffinose or Gdn HCl to detect protein-excipient interactions in the solid
state. After proteolytic digestion of the labeled products, peptide-peptide, peptide-water and
peptide-excipient adducts were identified by LC-MS. In this study, SDA has been found to label
residues other than lysine and the number of SDA labels on myoglobin cannot be controlled.
Myoblobin was heterogeneously labeled, which made the photo-reaction products complicated.
The quantitation of photo-reaction products on concentration basis were not feasible with the
photo-reaction products to be poorly identified.
In the alternative approach, photo leucine has been included in lyophilized apomyoglobin
formulations at molar ratios of apomyoglobin to photo leucine from 1:20 to 1:100.5 Sucrose was
also included in the matrix. After lyophilization, the solid samples were exposed to UV at 365 nm
to induce photo-reaction. The photolytic labeling products formed from apomyoglobin and photo
leucine were analyzed at both intact and digested protein levels, and the sites of labeling were
localized to specific peptide fragments. The distribution of the photo leucine label on
apomyoglobin depended on the ratio of photo leucine to apomyglobin in the sample, and gave an

29
indication of the local interactions between apomyoglobin and photo leucine in the lyophilized
matrix. This method has been limited by the availability of photo-reactive reagents that mimic the
structure of regular excipients.
Previous study has successfully proved that photolytic labeling can be applied to lyophilized solids
to study protein formulations. This can be developed to be more quantitative and practical for
analysis purpose.
1.4 The Significance of This Study
Currently available methods for analyzing lyophilized protein formulations are limited in their
ability to detect direct protein-matrix interactions. Proteins in lyophilized solids are often
characterized in terms of aggregation propensity, charge heterogeneity and chemical modifications
using methods such as size exclusion chromatography (SEC), cation exchange chromatography or
MS with reconstituted samples.56 Other methods such as Karl Fischer titration and differential
scanning calorimetry (DSC) are used to evaluation of bulk properties of the lyophilized matrix.
However, although it is widely accepted that protein-excipient interactions are critical in
stabilizing proteins in solid formulations,54,57,58 there is a lack of detection methods with that can
detect these interactions with high resolution.
Our lab has developed solid state hydrogen-deuterium exchange with mass spectrometry (ssHDX-
MS) to characterize protein-matrix interactions that involve hydrogen bonding, the results of which
have been well correlated with long-term stability of a monoclonal antibody.59 Since the
photoreaction of diazirine groups is a free radical reaction, the products can show the interactions
between the protein or peptide with molecules in their vicinity regardless of the type of interaction.

30
Molecules interacting with protein or peptide through hydrogen bonding, ionic interactions or
other intermolecular forces can all be represented with photolytic labeling products. Developing
photolytic labeling methods thus would expand our understanding of the mechanisms of excipient
stabilizing effects and make progress towards the practical utilization of the method.
In previous studies in our group, photolytic labeling has been applied to lyophilized solids and
used to evaluate process and excipient effects on myoglobin formulations.5,6,60 In these studies, the
photo-reaction products were difficult to quantify and the results were complicated to interpret.
The work presented here enables a better and more quantitative understanding of the products of
diazirine photo-reactions in the solid state. A diazirine-labeled short peptide was first used to
quantify the photo-reaction products in the lyophilized solids. The effects of increasing solid
moisture content on the local environment near the peptide were further probed using this system.
In a separate study, a new photo-reactive reagent was chemically synthesized and incorporated
into the lyophilized matrix. Its results were compared to those of photo-leucine, a commercially
available photo-amino acid, to examine the effects of unionizable and ionizable excipients on
interactions in lyophilized formulations.
1.5 Hypothesis and Specific Aims
Vitrification theory and water replacement theory have long been used to explain the stabilizing
effects of excipients. Techniques such as DSC have been used to measure the bulk properties of
solids, providing a direct measurement of properties relevant to vitrification theory. However,
there is a lack of detection methods that can quantitatively evaluate the interactions between a
protein or peptide and excipients in the solid state at a molecular level. The overall objective of the
work is to develop photolytic labeling as a high-resolution method to detect peptide-matrix

31
interactions in the solid state. Photolytic labeling products will be identified and quantified on a
concentration basis using analytical methods such as rp-HPLC and LC-MS, and used to evaluate
the effects of solid composition on the identity and quantity of these photolytic labeling products.
The central hypothesis of this dissertation is that the interactions between model peptides and solid
matrix at the molecular level are affected by the choice of excipients, an increase in solid moisture
content and the changes in solution pH prior to lyophilization, as reflected by the formation of
photolytic labeling products. A diazirine labeled short peptide KLQ (Ac-QELHKLQ-NHCH3) is
used to study photolytic labeling products quantitatively. In an alternative approach, the diazirine
labeled excipient is incorporated in the solid matrix. To advance this approach, a new photo-
reactive excipient, photo glucosamine (pGlcN), was synthesized and incorporated in a lyophilized
matrix of salmon calcitonin (sCT) to study the effect of excipients on formulations. Thus, the
Specific Aims of this dissertation research are:
Specific Aim 1: To identify and quantify peptide-matrix interactions for a diazirine-labeled
model peptide in lyophilized solids. A seven-amino acid peptide KLQ (Ac-QELHKLQ-NHCH3)
will serve as the model peptide and be labeled with a diazirine group at lysine residue. The diazirine
labeled KLQ peptide will be lyophilized with several excipients separately to probe the local
environment near the lysine residue and the photolytic labeling products in different formulations
will be quantitatively analyzed. The purpose of Specific Aim 1 is to establish an analytical method
that can be used to identify and quantify photo-reaction products to study the interactions between
peptide and excipient in the solids at a molecular level.
Specific Aim 2: To evaluate the effect of increasing bulk moisture on the local environment
near the KLQ peptide in lyophilized solids. Using the quantitative analytical methods

32
established for KLQ peptide in Aim 1, the local environment of the peptide will be studied when
the solids are exposed to various levels of environmental humidity in solids containing different
excipients. Both excipient and environmental humidity effects will be examined. The interactions
between peptide and solid matrix are expected to be affected by changes in the bulk properties of
solids such as moisture content. An increase in the peptide-water interactions at the molecular level,
as reflected by higher fractional conversion to peptide-water adducts, is likely to be linearly
correlated with an increase in bulk solid moisture.
Specific Aim 3: To develop and evaluate a new photo-reactive diazirine excipient,
glucosamine diazirine, and to compare its peptide-matrix interactions in lyophilized solids
with those of photo-leucine. A new photo-reactive excipient, a diazirine labeled analog of
glucosamine (photo-glucosamine, pGlcN), will be developed and incorporated into lyophilized
solids containing a therapeutic peptide, salmon calcitonin (sCT). The labeling of sCT with pGlcN
in various lyophilized formulations will be evaluated and quantified, and compared with results
for the commercially available photo amino acid, photo-leucine (pLeu). Changing solution pH
prior to lyophilization is expected to change ionic interactions between sCT and pLeu in the solid
samples, resulting in different distributions of photo-reactions products; pH-dependent differences
are not expected for pGlcN.
1.6 Overall Approach
A short peptide KLQ (Ac-QELHKLQ-NHCH3) will be used to further investigate the photo-
reaction products of a diazirine-labeled peptide in lyophilized solids. The KLQ sequence
corresponds to the 14th to 20th amino acids of salmon calcitonin (sCT). KLQ will be made photo-

33
reactive after labeling reaction with SDA, as previously described.6 The KLQ peptide contains
only one lysine residue, making it easier to control the site and extent of diazirine-labeling and
limiting the heterogeneity of the photo-reaction products. The characterization of photolytic
labeling products will be achieved with rp-HPLC and LC-MS. The fractions of each product from
rp-HPLC chromatogram will be collected and analyzed with LC-MS to determine their molecular
weight and assign a likely structure. The concentrations of the products will be determined using
the peak area from rp-HPLC chromatogram based on the calibration curves for the diazirine-
labeled peptide. As a control, the photo-reaction will also be conducted in solution formulations.
To explore the effects of solid moisture content on peptide-matrix interactions, lyophilized solids
containing the KLQ peptide will be exposed to different levels of environment moisture. With
different excipients, the moisture content in the solids will vary. Photolytic labeling products in
these samples will be analyzed with rp-HPLC and LC-MS, using methods developed in the
previous study, to quantitatively show how the local environment near the peptide changes. The
main focus will be on peptide-water and peptide-excipient adducts.
To explore protein-matrix interactions using photolytically labeled excipients, photo-reactive
reagent, photo glucosamine (pGlcN) will be chemically synthesized and used to study solid
formulations of salmon calcitonin (sCT). pGlcN is a diazirine derivative of glucosamine and is not
ionizable in solution. In this study, pGlcN adducts with sCT are quantified and compared to those
of photo leucine (pLeu), which is ionizable in solution. Together with photo-reactive reagent, an
unlabeled excipient such as sucrose or histidine will also be included in the formulation, and the
pH of the solution prior to lyophilization will be varied. Peptide-excipient adducts are expected to
34
form and will be quantified with LC-MS based on the area of each product on the extracted ion
chromatogram (EIC). The photo-reaction products in different combination of excipients at
various pH level will be examined.

35
CHAPTER 2. QUANTITATIVE ANALYSIS OF PEPTIDE-MATRIX
INTERACTIONS IN LYOPHILIZED SOLIDS USING PHOTOLYTIC
LABELING
*This chapter has been published in Molecular Pharmaceutics.
DOI: 10.1021/acs.molpharmaceut.8b00283
2.1 Abstract
Peptide-matrix interactions in lyophilized solids were explored using photolytic labeling with
reversed phase high performance liquid chromatography (rp-HPLC) and mass spectrometric (MS)
analysis. A model peptide (Ac-QELHKLQ-NHCH3) derived from salmon calcitonin was first
labeled with a heterobifunctional cross-linker NHS-diazirine (succinimidyl 4,4’-azipentanoate;
SDA) at Lys5 in solution, with ~ 100% conversion. The SDA labeled peptide was then formulated
with the following excipients at a 1:400 molar ratio and lyophilized: sucrose, trehalose, mannitol,
histidine, arginine, urea and NaCl. The lyophilized samples and corresponding solution controls
were exposed to UV at 365 nm to induce photolytic labeling and the products were identified by
MS and quantified with rp-HPLC or MS. Peptide-excipient adducts were detected in the
lyophilized solids except the NaCl formulation. With the exception of the histidine formulation,
peptide-excipient adducts were not detected in solution and the fractional conversion to peptide-
water adducts in solution was significantly greater than in lyophilized solids, as expected. In
lyophilized solids, the fractional conversion to peptide-water adducts was poorly correlated with
bulk moisture content, suggesting that the local water content near the labeled lysine residue differs
from the measured bulk average. In lyophilized solids, the fractional conversion to peptide-
excipient adducts was assessed using MS extracted ion chromatograms (EIC); subject to the
assumption of equal ionization efficiencies, the fractional conversion to excipient adducts varied

36
with excipient type. The results demonstrate that the local environment near the lysine residue of
the peptide in the lyophilized solids can be quantitatively probed with a photolytic labeling method.
2.2 Introduction
Therapeutic proteins are often marketed in lyophilized form in an effort to maintain their native
structure and extend shelf-life. Excipients such as sucrose and trehalose are usually incorporated
in the formulation to protect and stabilize the protein during lyophilization and storage.
Considerable effort has been expended in selecting appropriate excipients to maximize stability
for a given protein.61–63 Two theories have been proposed to explain the mechanisms of
stabilization by excipients: (1) the water replacement theory and (2) the vitrification theory. The
water replacement theory suggests that hydrogen bonds formed between the excipient and protein
in the solid state can stabilize protein structure, “replacing” hydrogen bonds to water that
contribute to structure in solution.1 The vitrification theory suggests that protein degradation is
impeded by a glassy matrix of sugar excipients, in which limited molecular mobility limits
degradation reactions.2 Each theory has its supporting experimental evidence and the dominant
mechanism may be system dependent.64,65 Currently, however, neither theory provides a definitive
guide to excipient selection, and the development of lyophilized protein formulations is largely a
matter of trial-and-error informed by previous experience.
One of the difficulties in understanding the mechanism of excipient stabilizing effect is the lack of
analytical methods to characterize protein-excipient interactions at the molecular level in the solid
state. Common methods used to characterize lyophilized therapeutic proteins do not directly detect
interactions between protein and excipient, but instead monitor the properties of protein itself or
those of the lyophilized matrix. For example, the properties of proteins in lyophilized solids are

37
often evaluated based on changes in size, charge heterogeneity and chemical modifications using
methods such as size-exclusion chromatography (SEC), cation exchanged chromatography and
reversed phase high-performance liquid chromatography (rp-HPLC)56 in reconstituted samples.
Important properties of the matrix include residual moisture content and glass transition
temperature (Tg). High moisture content has been associated with protein aggregation in some
cases;66,67 low moisture content is generally favored for lyophilized products. Tg indicates the
thermally induced transition of the amorphous solid from a glassy state of low mobility to a rubbery
state of higher mobility, and is usually measured by differential scanning calorimetry (DSC). These
methods have served as important quality standards for lyophilized products. However, direct
information about protein-excipient interactions cannot be achieved from these well-established
methods. If such interactions could be understood and measured, they may help us to understand
molecular properties responsible for long-term stability and assist in rational formulation design
in the future.
Recently, our group has adopted photolytic labeling methods, long used to study protein-protein
interactions in cells,3,4 to interrogate the local environment of proteins in lyophilized solids. For
example, a heterobifunctional cross-linker NHS-diazirine (succinimidyl 4,4’-azipentanoate;
SDA) was used to study protein-matrix interactions in lyophilized powders containing
myoglobin.6 NHS-SDA contains two reactive functional groups: (i) an NHS ester (N-
hydroxysuccinimidyl ester), which reacts with primary amines and (ii) a diazirine, which is
activated with UV light to form a carbene. The succinimidyl ester reacts with primary amines in
solution; in these studies, myoglobin was labeled with SDA on lysine side chains. The labeled
myoglobin (Mb-SDA) was then lyophilized with raffinose or guanidine hydrochloride. After

38
exposure of the lyophilized solids to UV light at 365 nm, the photo reactive diazirine lost N2(g)
to form a reactive carbene. Carbenes can insert into any X-H (C, O, N, S) bond or C=C bond,
allowing molecules near the lysine residue (~3.9 Å,spacer arm of SDA) to form cross-linked
products with myoglobin. Using MS analysis, peptide-peptide, peptide-water and peptide-
excipient adducts were detected. The distribution of these products and the sites at which they
were detected on myoglobin differed among formulations.
This study showed the potential of utilizing SDA to detect protein interactions in lyophilized
powders. However, since myoglobin has multiple lysine residues, a heterogeneous mixture of
labeled protein with different numbers of SDA tags was generated in the labeling step.
Additionally, the composition of the matrix near these labeling sites was also heterogeneous, the
cross-linked products produced after UV exposure were even more heterogeneous and quantitation
was difficult due to the large number of possible products. To improve our understanding of protein
interactions in the solid state, a more quantitative analysis of these interactions is desirable.
In the studies reported here, photolytic labeling in lyophilized solids was studied in a more
quantitative way. To reduce the complexity of the cross-linked products, a model peptide of seven
amino acids was chosen. This peptide (Ac-QELHKLQ-NHCH3) was derived from salmon
calcitonin, a 32 amino acid therapeutic peptide used to treat osteoporosis and bone fracture in
postmenopausal women.68 Since the N-terminus of the model peptide was acetylated, the SDA-
labeling site for the model peptide was at the sole lysine residue (K5). A homogenous, singly SDA-
labeled peptide helped to control the number of potential cross-linked products. Moreover,
concentration determination of the SDA labeled peptide and its cross-linked products was possible

39
using HPLC and MS. Cross-linked products including peptide-water, peptide-excipient and
peptide-salt adducts were detected and quantified in the form of fractional conversion from the
labeled model peptide. The reaction pathway was shown in Figure 2.1. Peptide interactions with
different excipients and other components of the solid matrices were assessed quantitatively by
comparing the distribution of cross-linked products.
Figure 2.1 The reaction pathways for peptide labeling with SDA and photolytic labeling of SDA-
labeled peptide. SDA reacts with primary amine on the lysine residue and SDA-labeled peptide
forms with elimination of N-hydroxysuccinimide. With UV exposure at 365 nm, the following
products could form: photolytic labeling adducts with molecules such as excipients, water and
salt from buffer in vicinity and dead-end products from unproductive intramolecular reaction.
2.3 Materials and Methods
2.3.1 Materials
The model “KLQ” peptide (Ac-QELHKLQ-NHCH3) was custom synthesized by GenScript
(Piscataway, NJ). The peptide content of the product received was ~70% of total weight. The
labeling reagent succinimidyl 4,4’-azipentanoate (SDA) and formic acid were purchased from
Thermo Scientific (Rockford, IL). Anhydrous methanol (99.8%), sucrose, D-mannitol, L-arginine,
urea, tris base, potassium phosphate monobasic and potassium phosphate dibasic were obtained
from Sigma-Aldrich (St. Louis, MO). D-(+)-trehalose, L-histidine, sodium chloride and

40
phosphoric acid (85%, certified ACS), HPLC-grade acetonitrile, HPLC-grade trifluoroacetic acid
(TFA), MS-grade water and MS-grade acetonitrile were obtained from Fisher Scientific (Fair
Lawn, NJ). Anhydrous dimethyl sulfoxide (DMSO) was purchased from ACROS Organics
(Morris Plains, NJ).
2.3.2 Analysis of the Unlabeled Peptide
To confirm the identity and purity of the synthetic KLQ peptide, 20 mg was dissolved in 1 mL of
deionized water and dialyzed against the same solvent for 24 hours to remove residual salts from
the synthesis process. The peptide solution after dialysis was filtered using a syringe driven filter
unit (0.22 µM, EMD Millipore Corporation, Billerica, MA) before lyophilization (VirTis
Lyophilizer, SP Scientific, Stone Ridge, NY). The lyophilized solid of the purified peptide was
weighed and dissolved in potassium phosphate buffer (2.5 mM, pH 7.4) into 1 mL solution (final
peptide concentration 10.5 mM). The remaining solid was stored at -20 °C prior to use.
The peptide sample was diluted with MS grade water (containing 0.1% formic acid) to 20 µM for
LC-MS analysis (1260 Infinity Series HPLC; 6230 TOF LC/MS; ZORBRX 300SB-C18 column,
1.0×50 mm, particle size 3.5 µm; Agilent Technologies, Santa Clara, CA). The solvents and the
gradient method were: MS-grade water with 0.1% formic acid (solvent A), MS-grade acetonitrile
with 0.1% formic acid (solvent B); a constant 10% solvent B flow from 0 to 2 minutes, followed
by a gradient flow from 10% B to 31% B in 14 minutes.
Solutions with various KLQ peptide concentrations (50-420 µM) were prepared in potassium
phosphate buffer (2.5 mM, pH 7.4) to construct a calibration curve. All samples used for
quantitation were prepared in triplicate unless specified. The above samples were analyzed using

41
rp-HPLC (1200 Series HPLC; ZORBRX Eclipse Plus C18 column, 4.6×250 mm, particle size 5
µm; Agilent Technologies). The injection volume for each sample was 30 µL and the detection
wavelength was 215 nm. The solvents and the gradient method were: filtered DDI water with 0.1%
TFA (solvent A), HPLC-grade acetonitrile with 0.1% TFA (solvent B); a gradient flow from 15%
solvent B to 69% solvent B in 18 minutes. The peptide concentrations and their corresponding
chromatographic peak areas were recorded.
2.3.3 Peptide Labeling and Analysis of the Labeled Peptide
The labeling reagent SDA was dissolved in DMSO to a concentration of 300 mM. The unlabeled
KLQ peptide solution was mixed with the SDA solution to achieve a peptide/SDA ratio of 1:7.5
on a molar basis (final peptide concentration = 2 mM). The content of DMSO was kept at 5% by
volume in the final reaction mixture. The labeling reaction was held at room temperature for 30
min before quenching with Tris·HCl buffer (1 M, pH 8.0; final concentration 90 mM). The reaction
mixture was dialyzed for at least 36 hours with a dialysis kit (MWCO 100-500D, Spectrum Labs,
Rancho Dominguez, CA) to remove extra salts and any residual SDA reagent. The purified SDA-
labeled KLQ peptide (referred to as KLQ-SDA hereinafter) was analyzed using the LC-MS
method described above. To construct an rp-HPLC assay with a calibration curve, solutions with
various concentrations of KLQ-SDA (8.6 to 536 µM) were prepared and analyzed using the
gradient method described above. The remaining KLQ-SDA was stored at 4 °C prior to use.
2.3.4 Formulation Preparation
To probe the local environment of the peptide in lyophilized solids, KLQ-SDA was lyophilized
with each of the following excipients individually: sucrose, D-(+)-trehalose, D-mannitol, L-
histidine, L-arginine, urea and NaCl. Potassium phosphate buffer (2.5 mM, pH 7.4) was used in

42
the procedure and the stock solutions of each formulation were prepared with a final molar ratio
of peptide: excipient of 1:400. The final pH of each formulation was adjusted to 7 using diluted
85% phosphoric acid. The target concentration of KLQ-SDA in each formulation was 200 µM.
The final concentration of the stock solution in each formulation was measured by rp-HPLC.
The stock solution of each formulation was distributed into clear glass vials (2 mL vial, Wheaton,
Millville, NJ). The volume in each vial was 250 µL. Samples were lyophilized according to a fixed
lyophilization cycle, in which: (i) the starting shelf temperature was set at 20 °C and kept for 5
min, followed by (ii) freezing over 4 steps with a temperature ramp rate of 1°C/min (hold at -5 °C
for 15 min, -40 °C for 60 min, -20 °C for 150 min, -40 °C for 120 min), (iii) primary drying under
70 mTorr at -35 °C for 1440 min, (iv) increased to 25 °C at 1 °C/min and (v) secondary drying
under 70 mTorr at 25 °C for 720 min. The lyophilized samples were crimped with aluminum seals
(13 mm, Wheaton, Millville, NJ) and stored at -20 °C prior to use.
2.3.5 Photolytic Cross-Linking and Product Quantitation
To initiate the photolytic cross-linking reaction, samples were placed in a UV Stratalinker 2400
(Stratagene Corp., La Jolla, CA) with five 365 nm UV lamps installed inside. For each formulation,
six samples were prepared. Three were exposed to UV light in the solid state, while the remaining
three were reconstituted with filtered deionized water to 250 µL prior to UV exposure, to serve as
solution controls. The lamps were allowed to warm up for 5 minutes before use, and samples were
then placed in the UV Stratalinker for 30 minutes. The vials remained capped during UV exposure,
and were arranged with approximately equal distances between them inside the UV chamber. After
UV exposure, solid samples were reconstituted to 250 µL with filtered DDI water and analyzed
together with the solution controls as described below.

43
For rp-HPLC analysis, each sample was diluted 3-fold to minimize the effects of excipient
viscosity. The injection volume was increased to 90 µL to maintain the same amount of the peptide
injected on the column. MS analysis was used to identify the mass of each rp-HPLC peak, allowing
the likely structure to be inferred. For MS analysis, each sample was diluted 10 times with MS-
grade water containing 0.1% formic acid. The method used for rp-HPLC and LC-MS were the
same as those described above for the analysis of KLQ and KLQ-SDA. The concentration of each
cross-linked product was determined by the rp-HPLC assay by assuming that the UV absorbance
of the cross-linked products at 215 nm was identical to that of the KLQ-SDA peptide, and thus
could be quantified using the calibration curve for KLQ-SDA. This assumption is reasonable
because the number of amide bonds in the cross-linked products is identical to that in KLQ-SDA.
In some cases, peptide-excipient adducts and the regenerated KLQ peptide co-eluted on rp-HPLC
analysis and could not be resolved. In this case, extracted ion chromatograms (EIC) in LC-MS
were used to resolve and quantify these two products; see APPENDIX for details.
2.3.6 Characterization of Lyophilized Solids
Moisture Content of Lyophilized Solids. An 831 KF Coulometer (Metrohm, Riverview, FL) was
used to measure the moisture content of the lyophilized samples in each formulation. Anhydrous
methanol was used to reconstitute the lyophilized samples. The moisture content (in ppm) of the
anhydrous methanol and the reconstituted samples were recorded. The moisture content was
calculated accordingly and reported as a weight percentage (w/w%).
Tg Measurement. Glass transition temperatures of the lyophilized solids in different formulations
were analyzed by modulated differential scanning calorimetry (MDSC) (DSC 25, TA Instruments,

44
New Castle, DE). The lyophilized powder (2-5 mg) was transferred to a Tzero Pan and sealed with
a Tzero hermetic lid (TA Instruments, New Castle, DE). Sample preparation was finished in a
glove box with nitrogen flow, maintaining the atmospheric moisture content at ~10%. Samples
were heated from -5 °C to 180 °C at 2 °C/min with a modulation period of 60 s and a modulation
amplitude of ± 1 °C. Duplicate samples were analyzed for each formulation.
X-Ray Powder Diffraction (XRPD). X-ray powder diffraction (Rigaku SmartLab XRD 6000
diffractometer, The Woodlands, TX) was used to detect the crystallinity of the lyophilized samples
in each formulation. Data were collected at room temperature from 5° to 40° 2 with 0.02
increments.
2.4 Results
2.4.1 KLQ and KLQ-SDA Peptide Analysis
The mass of the model peptide KLQ was 949.5 Da as determined by LC/MS analysis. KLQ in the
stock solution appeared as a single peak on the rp-HPLC chromatogram with a retention time of
~11 min (Fig. 2.2 A). A calibration curve was established relating the KLQ concentration [C] to
the corresponding chromatographic peak area (Fig. 2.2 B). After labeling with SDA, the original
KLQ peak disappeared and a new peak corresponding to KLQ-SDA appeared at ~14 min (Fig. 2.2
C); LC/MS analysis confirmed that the mass of the new peak was consistent with the production
of KLQ-SDA. The mass of KLQ-SDA was 1059.6 Da, indicating a singly labeled product. No
additional chromatographic peaks were observed after the labeling reaction and LC/MS analysis
showed that no additional products were formed. KLQ was not detected after the labeling reaction

45
and the conversion of KLQ to KLQ-SDA was effectively complete. A calibration curve relating
KLQ-SDA concentration to rp-HPLC peak area was also established (Fig. 2.2 D).
Figure 2.2 Quantitation of KLQ and KLQ-SDA peptides by rp-HPLC. Representative rp-HPLC
chromatogram for the KLQ peptide (Ac-QELHKLQ-NHCH3) (A) and corresponding calibration
curve relating peak area (AUC) to concentration (B). Representative rp-HPLC chromatogram for
the diazirine-labeled KLQ peptide (KLQ-SDA) (C) and corresponding calibration curve relating
peak area (AUC) to concentration (D). See text for chromatographic conditions.
2.4.2 Photolytic Labeling in Different Formulations
KLQ-SDA was co-lyophilized with various excipients and the resulting lyophilized solids were
then exposed to UV light to induce photolytic labeling. The corresponding solution samples were
also exposed to UV light to serve as controls. The peaks detected on rp-HPLC were assigned to
the product anticipated for the reaction according to their mass. In general, the following products
were detected in the lyophilized and solution samples after UV exposure: unlabeled KLQ, which
was regenerated on exposure to UV light; KLQ-excipient adducts; KLQ-H2O adducts; KLQ-PO4

46
adducts resulting from reaction with buffer salt; and several “dead-end products” resulting from
unproductive intramolecular reactions. The masses of the peaks assigned to “dead-end” products
are consistent with the loss of a molecule of N2 from KLQ-SDA without the formation of any
adducts with adjacent molecules. Chromatographic peaks and corresponding masses suggested
that two different forms of KLQ-H2O adduct were present. One was attributed to a hydroxyl form
(Form I) and the other to a ketone form (Form II) (see Fig. A1 for proposed structures).
Representative rp-HPLC chromatograms for each formulation in solution and in lyophilized solids
are shown in Figure 2.3, together with peak assignments. The subsections below describe the
products identified for each formulation in greater detail.
Sucrose (Fig. 2.3 A). In solution, the following products were detected after UV exposure:
unlabeled KLQ (949.5 Da), KLQ-PO4 (1129.6 Da), KLQ-H2O Form I (1049.6 Da), dead-end
product (1031.6 Da) and unreacted KLQ-SDA (1059.6 Da). The retention times for these products
were 11 min, 11.5 min, 12 min, 13.5 min and 14 min, respectively. The KLQ-sucrose adduct was
not detected in solution. In lyophilized solids, unlabeled KLQ (949.5 Da), KLQ-sucrose (1373.7
Da), KLQ-H2O (1049.6 Da, Form I), dead-end product (1031.6 Da) and unreacted KLQ-SDA
(1059.6 Da) were detected after UV exposure. The peak corresponding to KLQ-sucrose co-eluted
with KLQ at ~11 min. The peak area of KLQ-H2O Form I in lyophilized solids was ~16% of that
in solution (Fig. 2.3 A, Peak 3). The splitting of the peak for the dead-end product in both solution
and lyophilized solids (Fig. 2.3 A, Peak 4) suggests that more than one species is present with the
same mass. The different structures of the dead-end product could not be distinguished by LC/MS.
Trehalose (Fig. 2.3 B). The chromatographic peaks for the trehalose formulation in solution and
lyophilized solids following UV exposure were similar to those for the sucrose formulation. The

47
KLQ-trehalose adduct was not detected in solution. In lyophilized solids, KLQ-trehalose (1373.7
Da) co-eluted with unlabeled KLQ at ~11 min.
Mannitol (Fig. 2.3 C). The pattern of chromatographic peaks for the mannitol formulation in
solution after UV exposure was similar to that for the sucrose formulation. In lyophilized solids,
an additional peak was observed at ~ 12.5 min, immediately following elution of KLQ-H2O Form
I. LC/MS analysis for this peak gave a mass of 1047.6 Da, which was assigned to a peptide-water
adduct in ketone form (Form II) (Fig. 2.3 C Lyo, Peak 6). As with the sucrose and trehalose
formulations, KLQ-mannitol (1213.7 Da) was not detected in solution but co-eluted with unlabeled
KLQ for lyophilized samples.
Histidine (Fig. 2.3 D). Chromatographic peaks for the histidine formulation in solution and
lyophilized solids following UV exposure showed a pattern similar to those for the mannitol
formulation. Interestingly, however, KLQ-histidine (1186.7 Da) was detected in both solution and
lyophilized solids, co-eluting with unlabeled KLQ at ~11 min. In addition, KLQ-H2O Form II was
detected in lyophilized solids (Fig. 2.3 D Lyo, Peak 6). A new product (1146.6) appeared at ~13
min (Fig. 2.3 D Lyo, Peak 7); its structure and identity were not determined.
Arginine (Fig. 2.3 E). A KLQ-arginine adduct (1205.7 Da) was detected only in lyophilized solids;
unlike the histidine formulation, an excipient adduct was not detected in solution. KLQ-H2O Form
II was detected in lyophilized solids (Fig. 2.3 E Lyo, Peak 6), and with a peak area ~159% greater
than that of KLQ-H2O Form I (Fig. 2.3 E Lyo, Peak 3), suggesting that Form II is favored for this
excipient.

48
Urea (Fig. 2.3 F). A KLQ-urea adduct (1091.6 Da) was detected only in lyophilized solids. Unlike
the other KLQ-excipient adducts, KLQ-urea co-eluted with KLQ-H2O Form I at ~12 min (Fig. 2.3
F Lyo, Peak 3).
NaCl (Fig. 2.3 G). KLQ-excipient adducts were not detected for the NaCl formulation in either
solution or lyophilized solids. The peak area of KLQ-H2O Form I was ~29% of that of KLQ-H2O
Form II.

49
Figure 2.3 Representative rp-HPLC chromatograms of solutions and reconstituted lyophilized
powders containing the photolytically labeled KLQ-SDA peptide following UV exposure, in
formulations containing: (A) sucrose, (B) trehalose, (C) mannitol, (D) histidine, (E) arginine, (F)
urea or (G) NaCl. See text for formulation composition. Peak assignments and masses by LC-
MS were: 1. KLQ (949.5 Da); 2. KLQ-PO4 (1129.6 Da); 3. KLQ-H2O Form I (1049.6 Da); 4.
dead-end product (1031.6 Da); 5. unreacted KLQ-SDA (1059.6 Da); 6. KLQ-H2O Form II
(1047.6Da); 7. unknown product (1146.6Da). KLQ and KLQ-excipient co-eluted at 11 min (peak
1) in sucrose (lyo), trehalose (lyo), mannitol (lyo), histidine (solution and lyo) and arginine (lyo)
formulations. KLQ-urea (lyo) co-eluted with KLQ-H2O (Form I). KLQ-excipient was not
detected in the NaCl formulation.

50
Figure 2.3 Continued

51
2.4.3 Quantitation of Photolytic Labeling Products
With the exception of the KLQ-excipient adducts that co-eluted with unlabeled KLQ or KLQ-H2O,
the concentrations of the cross-linked products were calculated using the calibration curve
established for KLQ-SDA. This calculation assumes that the UV absorbance of these peptides at
215 nm are identical, which is reasonable given that all of these species have similar structures and
an equal number of amide bonds. The parent KLQ peptide was regenerated after UV exposure as
a reaction product. When KLQ did not co-elute with the KLQ-excipient products and was resolved
as a single peak, its concentration was calculated using the calibration curve established for KLQ.
In cases when KLQ and KLQ-excipient co-eluted, the concentrations could not be determined
based on the chromatographic peak area alone. In these cases, the ratio of peak areas from extracted
ion chromatogram (EIC) of KLQ or KLQ-excipient to KLQ-H2O (Form I) was used to determine
the concentration.
To compare the results and mitigate the effect of initial KLQ-SDA concentration variation among
different formulations, the amount of each cross-linked product was normalized to the conversion
of KLQ-SDA parent peptide as a percentage (See SI for quantitation details). The fractional
conversion of the parent peptide to each of the cross-linked products following UV exposure is
reported in Figure 2.4. Several trends are evident in the data. As expected, the fractional conversion
to the water adduct was greater in solution than in lyophilized solids for all formulations studied
(Fig. 2.4; dark blue and light blue). This observation is consistent with a high degree of interaction
between the peptide and water in aqueous solution, which is reduced in lyophilized solids in which
water content is more limited. KLQ-H2O Form II adducts were not detected in solution or in the
lyophilized solids for sucrose and trehalose formulations. In contrast, Form II was detected in all
other lyophilized formulations, with the lyophilized NaCl formulation showing the greatest

52
fractional conversion to Form II. This suggests that reaction conditions in some solids favor the
formation of the ketone form (Form II) of the water adduct, though the chemical definition of those
conditions is not clear. The ketone form (Form II) is expected to be more reactive than the
hydroxyl form (Form I); the extent to which Form II that is initially formed on light exposure is
then converted to other species is not known.
KLQ-excipient adducts were detected in all lyophilized formulations except that containing NaCl.
Together with the water adduct results discussed above, this result is generally consistent with the
water-replacement hypothesis, which asserts that hydrogen bonds of peptides/proteins to water in
solution are replaced with hydrogen bonds to stabilizing excipients in the amorphous solid state.58
Interestingly, the conversion to KLQ-excipient adducts differed among the lyophilized
formulations, with the greatest fractional conversion detected in the trehalose, sucrose and
histidine formulations, which are often considered good stabilizers of lyophilized protein
formulations. The trehalose formulation showed the greatest fractional conversion to excipient
adducts of all the formulations. Unexpectedly, a KLQ-histidine adduct was also detected in
solution (Fig. 2.4 D, Solution), suggesting that a specific ionic interaction may occur. Though
arginine is also a basic amino acid frequently used to stabilize protein formulations, a KLQ-
arginine adduct was not detected in solution. These inferences regarding the conversion from the
KLQ-SDA peptide to excipient adducts are based on EIC analysis to resolve co-eluting species, as
described above. Comparison among different excipients requires the additional assumption of
equal MS ionization efficiencies for the different KLQ-excipient adducts; the comparisons are thus
contingent on the validity of this assumption.
53
KLQ-PO4 adducts were detected in all solution formulations and, to a lesser extent, in lyophilized
formulations. This result suggests that the buffer salt interacts with the peptide in solution, perhaps
via ionic interactions between the phosphate monobasic anion and the positively charged side
chain of His4, which is immediately N-terminal to the SDA-labeled Lys5. This interaction is also
observed in some of the lyophilized formulations particularly those in which lower levels of
excipient adducts were detected (Fig. 2.4 C, E, F).
The regenerated KLQ peptide, dead-end and unidentified products are essentially reaction by-
products, providing little direct information on the peptide-excipient or peptide-water interactions
that are of greatest interest. For all formulations and in both solution and lyophilized solids, the
greatest fraction of KLQ-SDA parent peptide was converted to dead-end products (Fig. 2.4,
yellow). The fraction designated “unidentified products” (Fig. 2.4, grey) represents the difference
between the fractional conversion to the products eluting at ~11 minutes on rp-HPLC and the sum
of the equivalent KLQ and KLQ-excipient adducts determined by EIC. The fraction of unidentified
products was generally greater in lyophilized formulations than in solution, notably in the
lyophilized sucrose formulation (Fig. 2.4 A, grey). Ideally, the fractional conversion of all the
photolytic labeling products from KLQ-SDA parent peptide should sum to 100%. Loss may occur
during sample analysis and quantitation; the “unrecovered” fraction was introduced to represent
these mass losses. With the exception of the sucrose and trehalose formulations, the unrecovered
fraction was greater in lyophilized solids than in solution (Fig. 2.4, white).

54
Figure 2.4 Fractional conversion (in percentage) of KLQ-SDA to cross-linked products
following UV exposure in solution (top) and lyophilized solids (bottom) containing: (A) sucrose,
(B) trehalose, (C) mannitol, (D) histidine, (E) arginine, (F) urea or (G) NaCl. See text for
formulation composition. Products are indicated by colors: orange = KLQ-excipient adduct;
green = KLQ; black = KLQ-PO4 adduct; dark blue = KLQ-water adduct (Form I); light blue =
KLQ-water adduct (Form II); yellow = dead-end product; purple = unreacted KLQ-SDA; grey =
unidentified products; white = unrecovered KLQ-SDA compared to the stock before photolytic
reaction. The total sums to 100%.
2.4.4 Comparison of Photolytic Labeling Products Among Formulations
The amount of KLQ-excipient adducts, KLQ-H2O adducts (i.e., the sum of Form I and Form II),
dead-end products and unreacted KLQ-SDA were compared among the various formulations (Fig.
2.5). As discussed above, the quantitation of KLQ-excipient adducts relied in part on EIC LC/MS.
A comparison of the excipient adducts may therefore be affected by differences in the ionization
efficiencies of various excipient adducts. For the purposes of this comparison, it is assumed that
differences in ionization efficiency among the excipient adducts are negligible. The other products
(KLQ-H2O, dead-end, KLQ-SDA) were quantified using rp-HPLC and are chemically identical
across the formulations. Thus, comparisons of these species among the formulations are not subject
to the assumption of equal ionization efficiency.

55
The fractional conversion of KLQ-SDA to KLQ-trehalose was 19.2%, the greatest conversion to
excipient adducts among all the formulations tested. With the same molecular weight and a similar
structure, the sucrose formulation showed a fractional conversion to KLQ-sucrose of 7.6% (Fig.
2.5 A), suggesting more extensive interactions between KLQ-SDA and trehalose than sucrose in
the solid state. Compared to lyophilized solids, the fractional conversion to KLQ-H2O adducts was
greater in solution, as expected (Fig. 2.5 B), ranging from 28.3% to 34.9% and relatively
independent of excipient type. The greatest fractional conversion to KLQ-H2O adducts in the
lyophilized solids was observed in the NaCl formulation, which was ~4.8 fold greater than that in
the sucrose formulation. The fractional conversion to dead-end products in solution was less than
that in the lyophilized solids (Fig. 2.5 C). The unreacted KLQ-SDA fraction remained relatively
constant in solution among the different excipients, but varied in lyophilized solids (Fig. 2.5 D).
With the exception of the arginine formulation, the unreacted KLQ-SDA fraction was greater in
solution than in lyophilized solids.

56
Figure 2.5 Comparison of photolytic labeling products from KLQ-SDA on exposure to UV light
across various formulations in solution and lyophilized solids. Quantities of (A) KLQ-excipient,
(B) KLQ-H2O, (C) dead-end products and (D) unreacted KLQ-SDA are shown as the fractional
conversion from KLQ-SDA, reported as a percentage. KLQ-H2O adducts in lyophilized solids
include both Form I and Form II; see text for details.
2.4.5 Lyophilized Solid Characterization
The moisture content, glass transition temperature (Tg) and crystallinity of the lyophilized solids
were characterized for all formulations (Table 1). The relationship between bulk moisture content
and the fractional conversion to KLQ-H2O adducts in lyophilized solids was shown in Figure 2.6.
The fractional conversion to KLQ-H2O adducts represents local water in the immediate vicinity of
the SDA-derivatized Lys residue in the KLQ peptide, while the bulk moisture content measured
by Karl Fischer titration is a spatial average. Among the different formulations, bulk moisture
content and local moisture content, as measured by fractional conversion of KLQ-SDA, are poorly

57
correlated (R2= 0.12) (Fig. 2.6). Correlation coefficients are greater (R2= 0.89) when the sucrose
and urea formulations are omitted, however, suggesting that differences in local vs. global
distribution of moisture in the two groups of solids.
Tg values for lyophilized sucrose, trehalose and arginine formulations (Table 2.1) were within the
expected range.69,70 Tg is poorly correlated with the level of KLQ-excipient (R2= 0.06) or KLQ-
H2O (R2= 0.71) in these lyophilized formulations. Tg of trehalose and arginine formulations are
comparable, while their KLQ-excipient or KLQ-H2O are significantly different from the other
formulation (Fig. 2.5 A, B). Lyophilized solids containing mannitol, histidine, urea or NaCl
showed crystalline character by PXRD. The KLQ-excipient adducts formed in the mannitol, urea
and NaCl formulations were relatively low (Fig. 2.4), consistent with fewer peptide-excipient
interactions.
Table 2.1 Physicochemical properties of lyophilized solids containing KLQ-SDA prior to UV
exposure.
Formulationa
Composition
of Excipient
(w/w%)
Moisture
Content
(w/w%)b
Tg (°C)c Crystalline?e
Sucrose 99.2 1.8±0.2 63.3 N
Trehalose 99.2 0.9±0.2 89.1 N
Mannitol 98.6 1.7±0.3 NAd Y
Histidine 98.3 1.3±0.3 NA Y
Arginine 98.5 1.6±0.2 89.8 N
Urea 95.8 5.2±0.5 NA Y
NaCl 95.7 4.0±0.7 NA Y aFormulations mainly contained solids of KLQ and excipient at a molar ratio of 1:400.
2.5 mM potassium phosphate buffer were used during sample preparation. bMoisture content determined by Karl Fischer titration. cGlass transition temperature (Tg) determined by modulated DSC. dNA=not applicable; Tg not detected. ePresence (Y) or absence(N) of crystalline character by PXRD.

58
Figure 2.6 Comparison of KLQ-H2O water adducts following photolytic labeling of the KLQ-
SDA peptide in lyophilized samples (as % of KLQ-SDA) with bulk moisture content of the solid
measured by Karl Fischer titration. KLQ-H2O adducts in lyophilized solids include both Form I
and Form II. Error bars not shown when less than symbol height.
2.5 Discussion
In the studies reported here, the photoreaction products of a diazirine-labeled model peptide (KLQ-
SDA) were quantified in solution and solid samples, with the goal of characterizing the local
chemical environment near the diazirine group at Lys5, particularly in the solid state. The reaction
products reflect the local environment within a radius of ~3.9 Å, which is the length of the spacer
arm of the SDA tag used here. SDA tag altered the properties of the lysine residue, so the
interactions detected here reflects a local environment created with the rest of the sequence near
Lys5 in the KLQ peptide, which may not be directly related to lysine. Seven excipients were
chosen to study the peptide-excipient interactions. Sucrose and trehalose are generally believed to
stabilize proteins during lyophilization and storage, while mannitol is often used as bulking
agent.61 His and Arg are also used as stabilizers,71,72 though the mechanisms responsible for their
stabilizing effects are not clear. Urea and NaCl were not often selected as stabilizers and included

59
as controls in this study. A combination of rp-HPLC and ESI-MS allowed the photoreaction
products to be identified and quantified.
From our previous work, we expected that excipient adducts of the KLQ peptide would be
observed after UV exposure.5,6 Excipient adducts were in fact detected in all lyophilized solids
except that containing NaCl (Fig. 2.4). Since inorganic NaCl is not expected to react with the
carbene, the absence of a NaCl adduct is not surprising and not necessarily indicative of the
absence of interactions. Interestingly, an adduct with histidine was detected in both solution and
solid samples (Fig. 2.4), suggesting a specific interaction between histidine and the peptide. The
presence of the histidine adduct in solution is counter to the idea that stabilizing excipients are
preferentially excluded from the immediate vicinity of proteins in solution. Similarly, adducts with
salts from buffer were detected in both solution and solid samples, probably the result of reaction
of the carbene with phosphate oxygen, and indicating proximity of buffer salt to the peptide in
both media. Since the molar ratio of excipient to phosphate buffer is more than 30 in this study, a
fractional conversion to phosphate adducts that exceeds the fractional conversion to excipient
adducts is a strong indication that phosphate interactions are favored (e.g., Fig. 2.4 C, Lyo; Fig.
2.4 D Solution). To minimize peptide-peptide interactions, low peptide: excipient ratios were used
in all formulations. As a result, the peptide-peptide adducts that were detected and mapped in our
previous work were not detected here, and were not expected.5,6
Adducts of the KLQ peptide with water were also expected and were observed in all solution and
lyophilized formulations. While we have attributed the ketone product (KLQ-H2O Form II, Fig.
2.3, Peak 6) to reaction of the carbene with water, it is possible that it may instead be due to reaction

60
of the carbene with oxygen (O2(g)). The latter explanation is consistent with the fact that Form II
is detected only in solid samples, in which the surface of the lyophilized particles may be exposed
to air, and not in solution samples, in which dissolved oxygen concentrations are orders of
magnitude less than the concentration of water (Fig. 2.4). The reaction of biphenylcarbene with
oxygen in solid matrices to produce a ketone (i.e., benzophenone) has been reported
previously.73,74 If Form II is the product of reaction with oxygen, the results suggest that the various
lyophilized formulations protect KLQ-SDA from oxygen to different extents. For example, the
fact that the lyophilized sucrose and trehalose formulations show no Form II may suggest that
KLQ-SDA is fully protected from oxygen in these solids, while higher levels of Form II in the
NaCl formulation may indicate greater oxygen exposure. The correlation of KLQ-H2O adducts
with the moisture content of the solid (Fig. 2.6) remains poor if the Form II adducts are omitted
(Fig. S2). The reason for the Form II product detected only in lyophilized solid is unknown and
this product may bias the quantitative analysis.
Dead-end products, unreacted KLQ-SDA and regenerated KLQ were detected in all samples,
together accounting for more than 50% of the products in most cases (Fig. 2.4). These products
are uninformative for the purposes of this study, providing no direct information on the local
chemical environment. The dead-end products have masses consistent with the loss of nitrogen,
suggesting the unproductive formation of a truncated chain at Lys5 or intramolecular interaction
of the activated carbene with other functional groups in the KLQ peptide. KLQ is derived from
salmon calcitonin (i.e., Q14-Q20), an α-helical, 32-amino acid peptide hormone.75 It is unlikely
that the dead-end products are the result of partial folding or secondary structure in KLQ, since
the diazirine-functionalized Lys side chain is expected to be solvent-facing (or solid matrix facing)

61
if any helical structure is retained. It is more likely that the dead-end products reflect the absence
of sufficiently reactive neighbors within the ~3.9 Å radius of the lysine residue. Additional studies
using SDA reagents with a longer spacer arm (e.g., LC-SDA, succinimidyl 6-(4,4’-azipentanamido)
hexanoate, 12.5 Å spacer arm) are warranted. On the other hand, the size of the labeling reagent
should be carefully controlled to maintain the integrity of the structure of protein or peptide.
The goal of quantitative analysis of the photoreaction products was achieved in part. Residual
KLQ-SDA remaining after the reaction was resolved from the reaction products on rp-HPLC, and
could be quantified absolutely against a calibration curve prepared using a known standard of
KLQ-SDA (Fig. 2.3). Most of the other products (i.e., KLQ-H2O Form I, KLQ-H2O Form II, KLQ-
PO4, dead-end products) were also well-resolved on rp-HPLC (Fig. 2.3), and relative quantitation
was achieved against the KLQ-SDA standard, subject to the assumption of identical UV
absorbance of these species at 215 nm, as discussed above. The KLQ and KLQ-excipient products
co-eluted on rp-HPLC for several formulations; relative quantitation of these species was achieved
using EIC from LC/MS, subject to the additional assumption of equal ionization efficiencies. Thus,
quantitative comparison of photoreaction products is likely to be most robust for those products
having identical structures in all formulations (i.e., KLQ-SDA, KLQ-H2O Form I, KLQ-H2O Form
II, KLQ-PO4). Quantitative comparison of excipient adducts for solution and solid forms having
the same excipient is also likely to be reliable, while quantitative comparison among formulations
having different excipients rests on several assumptions and is probably weaker. The unrecovered
fraction represents the lack of closure of the mass balance, and was greatest in solid samples (Fig.
2). This comparison may be biased from the reaction products disproportionately contained in the
unrecovered fraction, this may also bias quantitative comparisons.

62
Several limitations of this method should be noted. The diazirine functional group is supposed to
insert into any X-H (C, O, N, S) bond or C=C bond without any preference. Notably, adducts with
water and buffer salt were also detected. The reactivity of diazirine towards different molecules
were not investigated here, which prevents a valid comparison of KLQ-excipient adducts across
the formulations. Also, better resolution of excipient adducts may be achieved with improved LC
method if that is the only product of interest. In this project, the fill volume of the formulation was
designed to be small to ensure adequate UV exposure. Thus, the light penetration efficiency should
be considered when this method is utilized on samples with large volume fill. Compared to the
previous work,6 this study has greatly expanded our understanding of photolytic labeling in terms
of the detected reaction products, which is not possible when heterogeneous SDA labeling protein
was used.
2.6 Conclusion
In summary, a diazirine-labeled model peptide (KLQ-SDA) has been used to study peptide-
formulation interactions in both solution and lyophilized solids containing various excipients. On
exposure to UV light, adducts of the peptide with excipients, water and buffer salts were detected
and quantified using rp-HPLC and ESI-MS, together with unreacted KLQ-SDA, regenerated
unlabeled peptide (KLQ) and dead-end products showing loss of nitrogen. The fractional
conversion to various photoreaction products provides a measure of the local environment of the
labeled Lys in the KLQ peptide; fractional conversion values were poorly correlated to bulk
properties of the solids, such as Tg and water content. In ongoing studies, this approach is being
used to study changes in the local environment in lyophilized solids in response to changes in
relative humidity.

63
CHAPTER 3. PHOTOLYTIC LABELING TO QUANTIFY PEPTIDE-
WATER INTERACTIONS IN LYOPHILIZED SOLIDS
*This chapter has been published in Molecular Pharmaceutics.
DOI: 10.1021/acs.molpharmaceut.8b01031
3.1 Abstract
Interactions of a lyophilized peptide with water and excipients in the solid matrix were explored
using photolytic labeling. A model peptide “KLQ” (Ac-QELHKLQ-NHCH3) was covalently
labeled with NHS-diazirine (succinimidyl 4,4'-azipentanoate) and the labeled peptide (KLQ-SDA)
was formulated and exposed to UV light in both solution and lyophilized solids. Solid samples
contained the following excipients at a molar ratio of 1:400: sucrose, trehalose, mannitol, histidine
or arginine. Prior to UV exposure, the lyophilized solids were exposed to various relative humidity
(RH) environments (8%, 13%, 33%, 45% and 78%) and the resulting solid moisture content (Karl
Fischer titration) and glass transition temperature (Tg; differential scanning calorimetry, DSC)
were measured. To initiate photolytic labeling, solution and solid samples were exposed to UV
light at 365 nm for 30 min. Photolytic labeling products were quantified using reversed phase high
performance liquid chromatography (rp-HPLC) and mass spectrometry (MS). In lyophilized solids,
studies excluding oxygen and using H218O confirmed that the source of oxygen in KLQ adducts
with a mass increase of 18 amu are attributable to reaction with water, while those with a mass
increase of 16 amu are not attributable to reaction with either water or molecular oxygen. In solids
containing sucrose or trehalose peptide-excipient adducts decreased with increasing solid moisture
content, while peptide-water adduct increased only at lower RH exposure, then plateaued, in partial
agreement with the water replacement hypothesis.

64
3.2 Introduction
Lyophilization, also known as freeze-drying, removes water from solutions of proteins or other
biomolecules to create dry solid powders, usually in an effort to enhance stability and extend shelf-
life.76,77 A typical lyophilization cycle includes two drying stages: primary drying and secondary
drying. Primary drying removes so-called “free water” having little or no interaction with the
protein, while secondary drying further reduces water content by removing water molecules that
interact with the protein more tightly.78 Water cannot be completely removed by lyophilization;
the water that remains exists as residual moisture in the lyophilized powder. The level of residual
moisture is usually used as an indication of the end point of the lyophilization process, and
generally should not exceed 2-5% for a protein product.79,80
Although lyophilization is intended to improve stability, residual water can adversely affect
therapeutic protein stability in a number of ways. For example, water can be directly involved in
chemical degradation reactions by serving as a reactant (e.g., hydrolysis), or can affect reactions
indirectly by changing the dynamics or conformational stability of the protein.54,81 At high
moisture content, proteins also tend to be more susceptible to various physical degradation
processes such as denaturation and aggregation.54,82 Excipients in lyophilized solids can also be
adversely affected by residual moisture. For example, sucrose can undergo recrystallization83 or
hydrolysis if the matrix is sufficiently acidic.84 In general, low residual moisture is favored for
lyophilized protein products.85 On the other hand, it has been reported that over-drying may result
in increased insoluble aggregate content and decreased protein activity in some protein
formulations.86 In a study of a humanized monoclonal antibody formulation, increased moisture
within a certain range resulted in improved physical stability at high temperature without

65
introducing significant destabilizing effects on chemical stability.87 The optimal moisture content
is often case-dependent.
High moisture content in lyophilized solids can plasticize the solid and lead to decreased glass
transition temperature (Tg), as measured by differential scanning calorimetry (DSC).88 Tg has been
regarded as an important parameter to optimize both formulation and the lyophilization process.89
While Tg is a measure of global mobility in the lyophilized matrix, it does not provide direct
information regarding the local environment in which both physical and chemical degradation
processes occur. Efforts have been made to study the local environment of proteins in lyophilized
solids. Gravimetric sorption analysis (GSA) has been used to calculate the water monolayer (M0)
for a lyophilized protein-sugar matrix. Protein lyophilized with sucrose or trehalose had lower M0
values than predicted by values for pure protein and sugar, which suggests that water-protein
interactions are reduced in these solids.90 -relaxation, which reflects local mobility and can be
measured by dielectric spectroscopy, has been shown to be better correlated with protein stability
in glassy sugar-based matrices than -relaxation.91 Deuterium incorporation in solid-state
hydrogen-deuterium exchange with mass spectrometric analysis (ssHDX-MS) differed for
myoglobin lyophilized with sucrose or mannitol, even though the two solids had similar bulk
moisture content.92 Other common methods such as solid-state nuclear magnetic resonance
spectroscopy (ssNMR) and solid-state Fourier transform infrared spectroscopy (ssFTIR), have
been used to study changes in protein structure in lyophilized solids but do not provide direct
information on local interactions between specific domains of the protein and the matrix.93,94

66
Solid-state photolytic labeling (ssPLL) is being developed in our lab to study the local environment
of proteins in lyophilized solids, an approach inspired by the use of photolytic labeling to study
protein-protein interactions in vivo.7 In one embodiment of the method, ssPLL utilizes diazirine-
labeled excipients that are co-lyophilized with the protein and other excipients of interest. On
exposure of the lyophilized powder to UV light of the appropriate wavelength (~350 nm), the
diazirine group is activated with loss of N2(g) to produce a carbene, which then reacts covalently
with molecules in its vicinity in the solid powder. The carbene rapidly inserts into nearby C-C
bond or X-H (X = C, O, N, S) bonds, or adds onto C=C bonds.20,21 Following reconstitution, the
photolytically labeled products can be analyzed with methods such as reversed-phase HPLC (rp-
HPLC) and liquid chromatography-mass spectrometry (LC-MS). An alternative approach
introduces the diazirine label into the protein itself, e.g., by using a diazirine-functionalized reagent
to label side chains or by site-specifically incorporating photo-amino acid into the sequence.
In a previous study, a commercially available photo-amino acid, photo-leucine (pLeu; L-2-amino-
4,4'-azi-pentanoic acid) was co-lyophilized with sucrose and apomyoglobin (apoMb). ApoMb
exhibited extents and patterns of photolytic labeling that depended on the concentration of pLeu.5
In another study, the diazirine label was introduced into myoglobin (Mb) using the bifunctional
reagent succinimidyl 4,4’-azipentanoate (SDA), which reacted with Mb primarily at lysine
residues. The distribution of photolytic labeling products again depended on the excipients.6
These results have demonstrated that diazirine activation and photolytic labeling occur in the solid
state. However, quantitative analysis of photolytic labeling products in these samples has been
difficult, particularly for SDA-labeled protein. Since the number and sites of SDA label

67
incorporation cannot be controlled, the population of labeled protein is heterogeneous even before
photolytic labeling is induced. Upon photolytic labeling, the heterogeneity of the local
environment near each diazirine group further increases the number of distinct chemical species
formed, complicating quantitative analysis. In a more recent study, in order to better quantify
photolytic labeling in the solid state, peptide-matrix interactions were probed using a model
peptide KLQ (Ac-QELHKLQ-NHCH3).27 Singly SDA labeled KLQ (KLQ-SDA) was lyophilized
with several excipients separately, and a quantitation method based on rp-HPLC and LC-MS was
used to study the product distribution. The local environment near the lysine residue of KLQ in
the different solids was analyzed quantitatively as the fractional conversion (%) of KLQ-SDA to
the various species produced, including covalent adducts with water, excipient and buffer (i.e.,
phosphate).
In the studies reported here, ssPLL and the KLQ-SDA peptide were used to study local interactions
between the peptide and residual water in the solid samples in greater detail. Lyophilized solids
containing KLQ-SDA and different excipients (sucrose, trehalose, mannitol, histidine and arginine)
were incubated under several relative humidity (RH) conditions: 8%, 13%, 33%, 45% and 78%.
All samples were then exposed to UV light at 365 nm to initiate the photo-reaction, and the
photolytically labeled products were analyzed quantitatively using rp-HPLC and LC-MS as in our
previous study.27 In all the formulations tested, the peptide-water adducts did not increase in
proportion with increasing bulk moisture in the lyophilized solid, suggesting that local hydration
near the diazirine group is not well-represented by bulk moisture content. In contrast, peptide-
excipient adducts decreased significantly with increasing solid moisture in sucrose and trehalose

68
formulations, suggesting that peptide-excipient interactions decrease with increasing moisture
content.
3.3 Materials and Methods
3.3.1 Materials
The model peptide “KLQ” (Ac-QELHKLQ-NHCH3, MW 949.5 Da) was custom synthesized by
GenScript (Piscataway, NJ). NHS-diazirine (succinimidyl 4,4'-azipentanoate) and formic acid
(99+%) were obtained from Thermo Scientific (Rockford, IL). Sucrose, D-mannitol, L-arginine,
magnesium chloride, anhydrous methanol (99.8%), tris base, potassium phosphate monobasic,
potassium phosphate dibasic and water-18O (97 atom % 18O) were purchased from Sigma-Aldrich
(St. Louis, MO). D-(+)-trehalose, L-histidine, sodium chloride, lithium chloride, HPLC grade
acetonitrile and trifluoroacetic acid (TFA), MS grade water and acetonitrile, and phosphoric acid
(85%, certified ACS) were obtained from Fischer Scientific (Fair Lawn, NJ). Anhydrous dimethyl
sulfoxide (DMSO) was obtained from ACROS Organics (Morris Plains, NJ). Lithium bromide
anhydrous (99%) was purchased from Alfa Aesar (Ward Hill, MA). Potassium carbonate
anhydrous (ACS) was obtained from VWR AMRESCO (Solon, OH).
3.3.2 Peptide Preparation and Quantitation
KLQ peptide and SDA labeled KLQ peptide (KLQ-SDA) were prepared and quantified as
described previously.27 Briefly, the custom-synthesized KLQ as received was further purified by
dialysis with a dialysis device (MWCO 100-500D, Spectrum Labs, Rancho Dominguez, CA) prior
to use. After dialysis and lyophilization, the net weight of purified KLQ solid was measured. The
KLQ solid was reconstituted with potassium phosphate buffer (2.5 mM, pH 7.4) to prepare a stock
solution with desired concentrations. A linear calibration curve of KLQ was established using rp-

69
HPLC (1200 Series HPLC, ZORBRX Eclipse Plus C18 column, 4.6×250 mm, particle size 5 µm;
Agilent Technologies) covering the range 50-420 µM.
To produce diazirine labeled KLQ peptide (“KLQ-SDA”), SDA was first dissolved in DMSO to
prepare a stock solution at 300 mM. The DMSO content in the reaction mixture was kept at 5%
by volume. Stock solutions of SDA and KLQ were then mixed to reach a molar ratio of KLQ to
SDA of 1 to 7.5. After 30 minutes at room temperature, the reaction was quenched using Tris HCl
buffer (1M, pH 8.0). The reaction mixture was then dialyzed for at least 36 hours to remove the
extra salt. The analysis of KLQ-SDA was identical to that of KLQ as described above. A linear
calibration curve for KLQ-SDA was established over a concentration range from 8.6-536 µM.
The anticipated molecular masses of both KLQ and KLQ-SDA were confirmed by LC-MS
analysis (1260 Infinity Series HPLC; 6230 TOF LC/MS; ZORBRX 300SB-C18 column, 1.0×50
mm, particle size 3.5 µm; Agilent Technologies, Santa Clara, CA).
3.3.3 Lyophilized Sample Preparation
Lyophilized powders were prepared containing KLQ-SDA and one of the following excipients:
sucrose, D-(+)-trehalose, D-mannitol, L-histidine, L-arginine. The concentration of KLQ-SDA in
the solution prior to lyophilization was 500 µM; the molar ratio of KLQ-SDA to excipient was
1:400 and the final pH was adjusted to 7. Solutions were pipetted into clear glass vials (2mL vial,
Wheaton, Millville, NJ; 250 µL/vial). Lyophilization was conducted using an established cycle
with a process development freeze dryer (LyoStar 3, SP Scientific, Warminster, PA). The
temperature ramp rate between steps was set to be 1 °C/min. Shelves were precooled at -5 °C,
followed by freezing over three steps: -40 °C for 60 min, -20 °C for 150 min, -40 °C for 120 min.

70
Primary drying was then conducted at 70 mTorr and -35 °C for 1440 min, followed by secondary
drying under the same pressure at 25 °C for 720 min. Chamber pressure was maintained using
nitrogen, and samples were backfilled with nitrogen at 400 Torr before stoppering.
The sucrose and arginine formulations of KLQ-SDA were used to further understand the formation
of the ketone product of KLQ-SDA (KLQ-H2O Form II), observed previously.27 The ketone
product was not observed in lyophilized powders containing sucrose, while fractional conversion
to the ketone product in the arginine formulation was relatively high compared to other
excipients.27 We hypothesized that the ketone product may result from KLQ-SDA reacting with
water (H2O) or oxygen (O2) in the surrounding matrix. To test these alternatives, lyophilized
arginine formulations were stoppered with and without nitrogen backfill while under vacuum. A
second set of arginine-containing samples without nitrogen backfill was opened to allow air into
the head space before the photo-reaction. Solution and lyophilized samples of the sucrose and
arginine formulations were also prepared with H218O (97 atom % 18O). Solution samples were
prepared by reconstituting lyophilized solids in H218O. Lyophilized samples of both formulations
were reconstituted with H218O and then subjected to the lyophilization procedure described above.
Samples were stoppered after the cycle finished before releasing the vacuum. Samples were
prepared in triplicate for each condition studied.
3.3.4 Moisture Content Study
Lyophilized samples were exposed to water vapor at various relative humidities using saturated
salt solutions of LiBr, LiCl, MgCl2, K2CO3 and NaCl. All the salt solutions were equilibrated at
room temperature to provide relative humidity (RH) conditions of 6%, 11%, 33%, 43% and 75%,
respectively.95 The actual humidity inside the desiccators was measured using a hygrometer

71
(Traceable Alarm RH/Temperature Monitor, Fisher Scientific, Hampton, NH). The measured RH
values were 8%, 13%, 33%, 45% and 78%. Lyophilized samples in open vials were placed in the
desiccators to absorb moisture from the surrounding environment and re-stoppered upon removal
from the desiccator. The kinetics of moisture absorption of the lyophilized samples were studied
at 8% and 78% RH at exposure times of 0, 2, 4, 16, 24 and 48 hrs. The moisture content of these
samples was measured by an 831 KF Coulometer (Metrohm, Riverview, FL). Samples were
reconstituted with anhydrous methanol for the measurement. The final moisture content was
calculated accordingly and reported as weight percentage (w/w%). All the measurements were in
triplicate.
3.3.5 Photolytic Labeling Reaction and Product Quantitation
A UV Stratalinker 2400 (Stratagene Corp., La Jolla, CA) with five UV lamps at 365 nm was used
to initiate the photo-reaction. All solution and lyophilized samples were exposed to UV light for
30 min as triplicate samples. Sample vials remained capped with stoppers during UV exposure.
For samples with prior humidity exposure, the reaction was induced immediately after samples
were removed from the desiccators. After the reaction, solid samples were reconstituted with DDI
water for rp-HPLC and LC-MS analysis. Peaks detected on rp-HPLC were collected as they eluted
from the column to confirm the photo-reaction product by LC-MS. As reported previously, most
of the photolytic labeling products were quantified using rp-HPLC against calibration curves
prepared using known standards.27 KLQ-excipient adducts were the exception to this procedure;
due to co-elution with regenerated unlabeled KLQ, these products were quantified using LC-MS
extracted ion chromatograms (EIC) in conjunction with rp-HPLC calibration curve. The details of
quantitation method are described in our previous work.27 Briefly, the photo-reaction products
were quantified as the fractional conversion of KLQ-SDA to a specific adduct. The concentration

72
of each product was determined using a calibration curve established for KLQ-SDA. For KLQ-
excipient adducts, the AUC of EIC was used to calculate their concentrations. The fractional
conversion of each product was calculated as:
[𝑃ℎ𝑜𝑡𝑜 − 𝑅𝑒𝑎𝑐𝑡𝑖𝑜𝑛 𝑃𝑟𝑜𝑑𝑢𝑐𝑡]% =[𝑃ℎ𝑜𝑡𝑜 − 𝑅𝑒𝑎𝑐𝑡𝑖𝑜𝑛 𝑃𝑟𝑜𝑑𝑢𝑐𝑡]𝐻𝑃𝐿𝐶 𝑜𝑟 𝐸𝐼𝐶
[𝐾𝐿𝑄 − 𝑆𝐷𝐴]𝑏𝑒𝑓𝑜𝑟𝑒 𝑟𝑒𝑎𝑐𝑡𝑖𝑜𝑛× 100%
where [𝑃ℎ𝑜𝑡𝑜 − 𝑅𝑒𝑎𝑐𝑡𝑖𝑜𝑛 𝑃𝑟𝑜𝑑𝑢𝑐𝑡]𝐻𝑃𝐿𝐶 𝑜𝑟 𝐸𝐼𝐶 is the concentration of each product after photo-
reaction determined from the calibration curve in units of µM; and [𝐾𝐿𝑄 − 𝑆𝐷𝐴]𝑏𝑒𝑓𝑜𝑟𝑒 𝑟𝑒𝑎𝑐𝑡𝑖𝑜𝑛 is
the concentration of KLQ-SDA in each formulation before photo-reaction determined from the
calibration curve in units of µM. For example, if [𝐾𝐿𝑄 − 𝐻2𝑂]% is 10%, this means that 10% of
the KLQ-SDA, on a molar basis, was converted to the adduct with water in the photo-reaction.
3.3.6 Tg Measurement
Modulated differential scanning calorimetry (MDSC) (DSC 25, TA Instruments, New Castle, DE)
was used to measure the Tg values for the lyophilized solids. Tg could be measured for solids
containing sucrose, trehalose and arginine. Some of the lyophilized samples did not exist in solid
form after moisture exposure, so their Tg values were not measured. To measure Tg, 2-5 mg of the
solid was transferred to a Tzero Pan and sealed with a Tzero hermetic lid (TA Instruments, New
Castle, DE). The heating range was from -5 °C to 180 °C at 2 °C/min with a modulation period of
60 s and a modulation amplitude of ± 1 °C. Tg is reported as the midpoint between the onset and
endpoint temperatures. Duplicate measurements were performed for each formulation.

73
3.4 Results
3.4.1 Identification of Water-Related Products
The identification of photolytic labeling reaction products with water was based on the mass
increase of the reactive form of KLQ-SDA peptide after photo-reaction. The product with a mass
increase of 18 Da was assigned to the KLQ-H2O adduct (hydroxyl form, Form I, proposed structure
shown in Fig. 3.1 A). This is reasonable since the fractional conversion of KLQ-SDA to this
product was significantly greater for the reaction in solution than in lyophilized solids. Another
product that was detected only in lyophilized solids, and showed a mass increase of 16 Da, was
also initially assigned as a KLQ-H2O adduct (ketone form, Form II, proposed structure shown in
Fig. 3.1 B).27 The reaction of diazirines with molecular oxygen (O2(g)) or water to form ketone
products has been reported previously.21 For the purposes of this study, it is important to determine
which of these two reactants is responsible for the proposed ketone product. Hereinafter, “KLQ-
H2O” and “KLQ-O” will be used to denote the hydroxyl and ketone products, respectively.
Figure 3.1 Proposed structures of products assigned to peptide-water adducts in the previous
study27: A. hydroxyl form; B. ketone form.
The fractional conversion of KLQ-SDA to the ketone product was highest in the arginine
formulation.27 Lyophilized arginine formulations were therefore used to assess whether the KLQ-

74
O form is the result of reaction with O2(g). To exclude oxygen from the headspace, lyophilized
samples were backfilled with N2(g) or stoppered directly at the end of the lyophilization cycle,
while still under vacuum. Samples with air in the head space were used as a control. After photo-
reaction, the distribution of products did not differ among the samples produced under the three
conditions (Fig. 3.2). The fractional conversion to KLQ-H2O was 9.20.5%, 8.50.1% and
10.20.3% in air, N2(g) backfill and vacuum samples, respectively. The fractional conversion to
KLQ-O was 9.40.2%, 9.80.3% and 8.40.4% in air, N2(g) backfill and vacuum samples,
respectively. Importantly, the formation of KLQ-O did not decrease significantly when the amount
of O2(g) in the system was reduced by sealing the samples under vacuum or under nitrogen,
suggesting that KLQ-O is not a product of the reaction of the peptide with O2(g).
Figure 3.2 Distribution of photolytic labeling products in lyophilized solids of the arginine
formulation with air or N2 in the vial headspace, or sealed under vacuum. The areas of the
segments reflect the fractional conversion of KLQ-SDA to specific products: green = regenerated
parent peptide (KLQ); orange = adduct with arginine (KLQ-arginine); black = adduct with
phosphate (KLQ-PO4); dark blue = adduct with water, hydroxyl form (KLQ-H2O); light blue =
product previously assigned to the ketone form of peptide-water adducts (KLQ-O); yellow =
dead-end products; purple = unreacted KLQ-SDA; white = unrecovered. See text for additional
details.
To obtain additional information regarding the source of oxygen in the water adducts, solution and
lyophilized samples of the sucrose and arginine formulations were prepared using H218O and used

75
to study the formation of KLQ-H2O and KLQ-O products. In solution, only the KLQ-H2O product
was detected. The KLQ-O product was not detected in lyophilized solids containing sucrose, while
both KLQ-H2O and KLQ-O products were detected in lyophilized solids containing arginine. The
masses of the KLQ-H2O and KLQ-O products detected in sucrose and arginine formulations
prepared with H218O are shown in Table 3.1. In the solutions of sucrose and arginine formulations,
and in lyophilized solids of the sucrose formulation, a product with a mass of 1051.6 Da was
detected, while a product with a mass of 1049.6 Da was not. The 1049.6 Da product was previously
assigned to the KLQ-H2O product; accordingly, the product with mass 1051.6 is assigned to KLQ-
H218O. This result further confirms that KLQ-H2O is the product of a reaction of KLQ-SDA with
water. In lyophilized solids containing arginine, products with masses of 1047.6 Da and 1051.6
Da were detected, which were assigned to KLQ-O and KLQ-H218O, respectively (Table 3.1). The
mass of 1047.6 would not have been observed if the ketone product was formed due to reaction
with water, since KLQ-18O (1049.6) would have been observed rather than KLQ-O (1047.6). The
results of studies with H218O therefore suggest that the ketone product (KLQ-O) is not the direct
result of a reaction of KLQ-SDA with H2O, nor can it be attributed to reaction with molecular
oxygen, as discussed above (Fig. 3.2). Since water is not a direct source of oxygen for the KLQ-O
product, only the KLQ-H2O product is used to evaluate the local interactions with water in the
results reported below. Possible sources of oxygen in the KLQ-O product are addressed in the
Discussion section.

76
Table 3.1 Mass corresponding to KLQ-H2O and KLQ-O products detected in sucrose and
arginine formulations prepared with H218O
Mass Detected?a Sucrose
(solution)b
Sucrose
(lyo)c
Arginine
(solution)b
Arginine
(lyo)c
KLQ-H2O
(1049.6 Da)
KLQ-H218Od
(1051.6 Da) ✓ ✓ ✓ ✓
KLQ-O
(1047.6 Da) ✓
KLQ-18Oe
(1049.6 Da)
a“” denotes “not detected”; “✓” denotes “detected”. Trace amount of H2O product was neglected considering
possible contamination of H218O.
bLyophilized samples were reconstituted with H218O.
cLyophilized samples were reconstituted with H218O and lyophilized again.
dKLQ-H2O adduct formed with oxygen isotope 18O. eKLQ-O adduct formed with oxygen isotope 18O.
3.4.2 Effects of Moisture on Physical Properties of Lyophilized Solids
The kinetics of moisture uptake in the lyophilized solids were studied using samples exposed to
8% and 78% RH for each formulation. The kinetics of moisture sorption were monitored from 0
to 48 h. With the exception of mannitol, all the lyophilized formulations reached saturation of
moisture content after 16 hours at either 8% or 78% RH (Figure A3). The moisture content of the
mannitol formulation did not show a significant change within the time range of moisture exposure
at each RH value. An exposure time of 16 h was selected for the remaining RH conditions to ensure
saturation in moisture uptake for the lyophilized solids.
The moisture content of lyophilized solids after 16 h of exposure to various RH environments is
shown in Table 3.2. In general, higher RH values are associated with greater moisture content of
the lyophilized solids, as expected. At 78% RH, the moisture content was > 30% w/w for the

77
lyophilized sucrose and trehalose formulations. The mannitol formulation did now show
significant changes in moisture content at different RH levels, and remained at around 3% w/w.
The moisture contents of the histidine and arginine formulations after exposure to 78% RH were
significantly less than those of the sucrose or trehalose formulations.
Table 3.2 The moisture content (w/w%) measured by Karl Fischer titration of the lyophilized
solids in different formulations. All the lyophilized samples were exposed to the RH value for 16
hours; n = 3 ± SD
Moisture content (w/w%)
Formulation No RH 8% 13% 33% 45% 78%
Sucrose 0.5±0.1 1.4±0.0 3.5±0.2 8.1±0.4 11.5±0.4 34.1±0.3
Trehalose 1.0±0.4 3.1±0.1 4.2±0.4 8.6±0.2 12.0±0.5 33.7±1.4
Mannitol 3.8±1.2 3.1±0.2 3.2±0.2 2.9±0.2 3.1±0.3 3.5±0.2
Histidine 1.3±0.1 2.3±0.1 2.7±0.4 3.4±0.2 3.3±0.5 7.2±0.3
Arginine 1.6±0.2 4.5±0.2 6.7±0.6 12.8±0.8 13.1±1.0 14.3±1.2
Tg values were also measured to characterize the lyophilized solids (Table 3.3). Values were
measurable for lyophilized sucrose, trehalose and arginine samples at several moisture contents.
The Tg values for the solids not exposed to relative humidity were within reasonable ranges.69,96
With exposure to increasing RH values and increased solid moisture content, Tg values decreased
due to plasticization of the solids with water, as expected.81 Tg values could not be measured for
lyophilized solids containing mannitol or histidine at any RH exposure, and Tg values could not be
measured for the sucrose, trehalose or arginine formulations after exposure to RH values of 78%.
Table 3.3 Glass transition temperature (Tg) of measurable solid samples
Tg/°C No RH 8% 13% 33% 45%
Sucrose 65.1 50.5 45.2 NAa NA
Trehalose 97.3 75.2 68.3 43.5 NA
Arginine 103.5 79.0 70.9 41.6 32.7
aNot applicable.

78
3.4.3 Effect of Moisture Content on Photolytic Labeling Products in Lyophilized Solids
As reported previously,27 the following photolytic labeling products were detected in lyophilized
solids: regenerated KLQ (949.5 Da, peptide without the SDA label); KLQ-excipient adducts
(1373.7 Da in sucrose and trehalose formulation, 1213.7 Da in mannitol formulation, 1186.7 Da
in histidine formulation and 1205.7 Da in arginine formulation); KLQ-PO4 adducts (1129.6 Da,
adduct with buffer salt); KLQ-H2O (1049.6 Da); KLQ-O (1047.6 Da); dead-end products (1031.6
Da, non-productive product of KLQ-SDA); and unreacted KLQ-SDA (1059.6 Da) (Fig. 3.3).
There was considerable fractional conversion to an unknown product (1146.6 Da) in the mannitol
formulation. In our previous study, this product was detected but its fractional conversion was
negligible.27 The fractional conversion to KLQ-H2O was significantly greater in solution than in
the corresponding lyophilized solids, as expected. In all solution and lyophilized samples, the
greatest fraction of KLQ-SDA was converted to dead-end products. With the exception of the
histidine formulation, KLQ-excipient adducts were detected only in lyophilized solids. The KLQ-
O adduct was detected in lyophilized mannitol, histidine and arginine samples at all RH conditions,
but in lyophilized sucrose and trehalose samples only at the highest RH studied. KLQ-O was not
detected in any of the solution controls (Fig. 3.3).

79
Figure 3.3 Fractional conversion to various photolytic labeling products in lyophilized
formulations containing different excipients (sucrose, trehalose, mannitol, histidine, arginine)
with varied RH exposure (8%, 13%, 33%, 45% and 78% RH). Lyophilized samples without RH
exposure and solution samples are included as controls. The area of each colored sector
represents the fractional conversion (%) of KLQ-SDA to a specific product after photo-reaction:
green = regenerated KLQ; orange = KLQ-excipient; black = KLQ-PO4; blue (dark) = KLQ-H2O;
blue (light) = KLQ-O; yellow = dead-end products; purple = unreacted KLQ-SDA; grey (dark) =
an unknown product (1146.6 Da); grey (light) = unidentified products (unknown identities,
concentration difference resulted from rp-HPLC result and EIC result); white = unrecovered.
Any fractional conversion < 1% was neglected.

80

81
Sucrose and Trehalose Formulations. Sucrose and trehalose are both disaccharides and have the
same molecular weight. In solution and in lyophilized solids exposed to 78% RH, the distribution
of photolytic labeling products was nearly identical for the two disaccharides (Fig. 3.3). In
lyophilized solids exposed to RH < 78%, the fractional conversion to KLQ-excipient adducts was
significantly greater for the sucrose and trehalose formulations than for the other formulations at
each RH value. This suggests that, compared to other excipients, more sucrose and trehalose are
in close proximity to the diazirine functional group and react with the carbene following photolytic
activation. The fractional conversion to excipient adducts is somewhat greater for KLQ-trehalose
than for KLQ-sucrose in lyophilized solids that were not exposed to RH-controlled atmosphere
(“Lyo”, Fig. 3) and from 8 to 45% RH exposure (i.e., 8%, 13%, 33% and 45%; Fig. 3.3). In contrast,
the fractional conversion to KLQ-H2O was only slightly greater (~ 1-2%) in the trehalose
formulation than in the sucrose formulation from 8 to 45% RH exposure. At 78% RH exposure,
the KLQ-O product was detected in both sucrose and trehalose samples, with fractional conversion
less than 5%.
Mannitol Formulation. The distributions of photolytic labeling products in lyophilized solids with
and without RH exposure were similar (Fig. 3.3). The fractional conversion to the KLQ-mannitol
adduct was relatively low compared to other formulations, and decreased slightly with increasing
RH, from 2.0% in solids without RH exposure to 1.3% in solids with 45% RH exposure (Fig. 3.3).
KLQ-mannitol adducts were not detected at 78% RH. This suggests that, relative to sucrose and
trehalose formulations, there are fewer mannitol-peptide interactions in the lyophilized solids. The
fractional conversion to KLQ-H2O did not change significantly with moisture exposure, while the

82
KLQ-O fraction increased somewhat at 78% RH. The fractional conversion to regenerated KLQ
decreased and KLQ-PO4 was not detected at 78% RH (Fig. 3.3).
Histidine and Arginine Formulations. The fractional conversion to KLQ-excipient adducts was
slightly greater in histidine formulations without RH exposure and from 8% to 13% RH exposure
compared to the corresponding arginine sample at the same RH exposure level (Fig. 3.3). KLQ-
excipient adducts were not detected at 78% RH exposure for arginine or histidine formulations.
The fractional conversion to KLQ-H2O adducts decreased slightly in histidine solids from 8% to
45% RH exposure, while it was relatively independent of RH exposure in arginine samples. The
fractional conversion to KLQ-O was highest in histidine formulations exposed to 78% RH, while
it gradually decreased in arginine formulation with increasing moisture exposure. Less regenerated
KLQ peptide was detected in arginine formulation than that in the histidine formulation at each
RH condition. The solution sample of the arginine formulation showed the largest fractional
conversion to KLQ-PO4 among all the samples.
3.4.4 Effects of Moisture Content on Conversion to KLQ-H2O and KLQ-Excipient Adducts in
Lyophilized Solids
Among the photolytic labeling products, the KLQ-H2O and KLQ-excipient adducts are of the
greatest interest in formulation design, since they show the direct interactions of the peptide with
water and excipients in the solid matrix. The fractional conversion to KLQ-H2O and KLQ-
excipient adducts as a function of moisture content in the lyophilized solids are shown in Figure
3.4.

83
Figure 3.4 Fractional conversion (%) of KLQ-SDA to KLQ-H2O adduct (open triangles) and
KLQ-excipient adducts (closed circles) as a function of moisture content (w/w%) in lyophilized
solids containing (A) sucrose, (B) trehalose, (C) mannitol, (D) histidine, or (E) arginine. See text
for formulation composition. n=3 ±SD for both moisture content measurement and photolytic
labeling product quantitation; SD not shown when smaller than the symbol.
Changes in the fractional conversion to KLQ-H2O and KLQ-excipient adducts with increasing
moisture content were similar in the sucrose and trehalose formulations. The fractional conversion
to KLQ-H2O increased initially and reached a plateau at a bulk moisture content of 3.5% (w/w) in
the sucrose formulation and 4.2% (w/w) in the trehalose formulation (Fig. 3.4 A, B), values that
correspond roughly to the optimal residual moisture content for protein stability.79 In contrast, the
fractional conversion to KLQ-excipient adducts decreased sharply with increasing solid moisture
content in these two formulations, particularly at low moisture content, suggesting that a loss of
stabilizing interactions with excipients may contribute to the 2-5% optimal residual moisture
content commonly observed in lyophilized protein formulations. At ~34% (w/w) moisture content
in both sucrose and trehalose formulations, the fractional conversion to KLQ-excipient adducts

84
was ~1.5%, significantly less than the conversion to KLQ-H2O at this moisture content in these
formulations (Fig. 3.4 A, B). In the mannitol formulation, the fractional conversion to KLQ-H2O
and KLQ-mannitol, as well as the moisture content of the mannitol solids, showed little variation
with changes in RH exposure (Fig. 3.4 C), which may reflect phase separation or recrystallization
of mannitol as observed previously for this formulation.27 KLQ-mannitol was not detected at 78%
RH, which was comparable to the low fractional conversion to peptide-excipient adducts in
sucrose and trehalose formulations. The fractional conversions to KLQ-H2O and KLQ-mannitol
were 11%~13% and 1.3~2.0%, respectively, while the solid moisture content was ~3% (w/w). The
histidine and arginine formulations showed greater fractional conversion to KLQ-H2O adducts
than to KLQ-excipient adducts throughout the moisture content range tested (Fig. 3.4 D, E), which
again may reflect phase separation or recrystallization. The changes in the fractional conversion
to KLQ-H2O adducts with changes in moisture content were minor. The fractional conversion to
the KLQ-histidine adduct decreased from 6.1% to 1.4% and that of the KLQ-arginine adduct
decreased from 4.5% to 2.6% over the moisture content range tested. For the histidine and arginine
formulations, KLQ-excipient adducts were not detected at the highest RH exposure. The histidine
and arginine formulations showed comparable trends in KLQ-H2O and KLQ-excipient adducts
with changing moisture content (Fig. 3.4 D, E), although the moisture content of the arginine solids
at each RH level (1.6-14.3% w/w; Table 3.2) was significantly greater than that of the histidine
solids (1.3-7.2% w/w; Table 3.2).
3.4.5 Formation of KLQ-PO4 in Lyophilized Solids
The KLQ-PO4 adduct reflects interactions between the KLQ-SDA peptide and phosphate from the
formulation buffer; there is no other source of phosphate in the samples. The fractional conversion
of KLQ-SDA to KLQ-PO4 adduct in the various formulations under different RH conditions is

85
shown in Figure 3.5. The sucrose and trehalose formulations showed the greatest fractional
conversion to phosphate adduct in solids with 45% RH exposure, and was greater than in solution
samples containing these excipients (Fig. 3.5). This suggests that interactions with phosphate are
at a maximum at moderate hydration in these solids, and may be reduced by competing interactions
with sugars at lower moisture content and by dilution at higher moisture content. In the mannitol
formulation, there were no significant differences in the fractional conversion to KLQ-PO4 adduct
in solution and solid samples, which was less than 2% in all cases. Phase separation and/or
recrystallization of mannitol may prevent KLQ-mannitol interactions at all moisture contents, so
that there is no competition between the sugars and phosphate for interaction with the peptide, and
KLQ-PO4 levels are unaffected by moisture content. For lyophilized mannitol solids exposed to
78% RH, the KLQ-PO4 adduct was not detected, the reason for which remains unknown. Histidine
and arginine solution samples showed the highest fractional conversion to the KLQ-PO4 adduct,
suggesting specific interactions with lower values detected in the lyophilized solids at all RH
conditions. In lyophilized histidine formulations, the fractional conversion to the KLQ-PO4 adduct
increased significantly in solids with RH exposure at 33% and 45% compared to that at 13% (Fig.
3.5), while the solid moisture content also increased from 6.7% (13% RH) to ~13% (33% and 45%
RH) (Table 3.2).

86
Figure 3.5 The fractional conversion of KLQ-SDA to KLQ-PO4 in the lyophilized solids with
exposure to different RH conditions across formulations.
3.5 Discussion
In solution, the chemical and structural stability of a protein or peptide is maintained by a variety
of forces, which include hydrophobic interactions, hydrogen bonding and electrostatic interactions.
Dehydration of the solution to produce a dry powder can disturb these interactions and have
negative effects on stability.97 Several different mechanisms have been proposed for the stabilizing
effects of carbohydrate excipients in the solids. For example, the water replacement theory
suggests that hydrogen bonds to water are ”replaced” with hydrogen bonds to stabilizing
carbohydrates in amorphous solids as drying occurs.98 The water entrapment hypothesis asserts
that, rather than binding directly to the protein, stabilizing carbohydrates trap water molecules in
an intermediate layer between the matrix and the protein surface, so that the movement of water is
slowed.99–101 The vitrification theory proposes that stabilization is the result of the formulation of
a glassy solid of low molecular mobility.2 On the other hand, residual water that is not removed
during drying may also adversely affect protein stability since it can act as a plasticizer and

87
participate in chemical degradation reactions.102,103 Significant efforts have been made to study the
role of water in lyophilized solids. Water can affect hydrogen bond formation between protein and
excipient. The water replacement theory suggests that hydrogen bonds to water are ”replaced” with
hydrogen bonds to stabilizing carbohydrates in amorphous solids as drying occurs.98 In the unified
model of protein dynamics, fluctuation of bulk solvent controls large scale protein motions while
that of the hydration shell controls the internal protein motions. The former are absent in solids
and the latter are absent in dehydrated proteins.104,105 Molecular simulation of water dynamics near
the protein surface at moderate to high hydration levels has been conducted in several systems
including native protein and powder environments. The results showed that the exchange of
protein-water hydrogen bonds by translational displacement of water is required for protein
structural relaxation while rotational motion itself is not sufficient.106 It has been suggested that
the distribution of water on the protein during the sorption process is not uniform.107 Water may
interact with charged groups on the protein first, followed by interactions with less readily ionized
areas such as the peptide backbone. Multiple layers of water are thought to form on the protein
surface, with weakly binding water last and most distant from the protein.108
In the current study, peptide-water interactions in lyophilized solids were studied using a diazirine-
derivatized model peptide (KLQ-SDA). On exposure to UV light, photolytic-labeling products
formed between the peptide and adjacent molecules in the lyophilized matrix and were quantified
as a measure of the various interactions. Interactions detected with this model peptide were within
a range of ~3.9 Å of the Lys5 sidechain, since this is the approximate length of the spacer arm of
the NHS-diazirine reagent. With the charged amine group masked by diazirine functionalization,
ionic interactions that directly involve Lys5 are not detected using this approach.

88
Increased RH exposure to lyophilized solids was associated with changes in the photolytic labeling
products across all the formulations studied. In sucrose and trehalose formulations, KLQ-excipient
adducts decreased with increasing solid moisture content (Fig. 3.4 A, B). Water replacement theory
would suggest that KLQ-H2O adduct should have formed to “replace” the decrease in interactions
with carbohydrates. However, in both formulations, the level of KLQ-H2O adduct increased as
solid moisture increased from low values to ~4% (w/w), but then reached a plateau, and a simple
correspondence between decreasing peptide-excipient adducts and increasing peptide-water
adduct was not observed. In the mannitol formulation, an increase in solid moisture was not
observed with the exposure to increasing RH (Table 3.2). However, KLQ-mannitol adducts were
not detected in 78% RH solid sample (Fig. 3.3 Mannitol). KLQ-excipient adducts were also absent
in in histidine and arginine formulations at 78% RH (Fig. 3.3 His, Arg). Instead of showing a
dependence on RH, as in the sucrose and trehalose formulations, the level of KLQ-H2O adducts in
mannitol, histidine and arginine formulations fluctuated around a relatively constant value over
the range of RH conditions studied (Fig. 3.4 C, D, E). Across the formulations used in this study,
then, changes in the levels of KLQ-excipient adducts were not compensated by counterbalancing
changes in KLQ-H2O adducts. This suggests that the water replacement hypothesis is not strictly
applicable at the molecular scale and that water entrapment and/or vitrification may be important
in the stabilization typically observed in sucrose and trehalose formulations of proteins. However,
this inference rests on the assumption that the carbene reacts non-specifically with water and the
various excipients, an assumption that will be discussed below.
In our previous report on photolytic labeling in this system, we tentatively identified the KLQ-O
adduct (+16 amu) as one of two products of the reaction of the activated peptide with water. Efforts

89
were made in this study to more thoroughly identify the source of the KLQ-O adduct. Interestingly,
the results demonstrate that KLQ-O is not a product of the activated peptide with either water or
O2(g) (Fig. 3.2 and Table 3.1). KLQ-O was detected in solid samples of mannitol, histidine and
arginine formulations and in solid samples containing sucrose and trehalose at the highest RH
(78%) (Fig. 3.3). The source of oxygen in the KLQ-O adduct remains unknown and the sites at
which the peptide has been modified in these +16 amu products have not been identified.
Nevertheless, the presence of the KLQ-O adduct suggests that, in addition to the carbene,
photolytic activation may also generate reactive oxygen species (ROS) that react with the peptide,
and that the oxygen source in the ROS may include matrix excipients or the peptide itself.
At a broader level, the unknown source of oxygen in the KLQ-O product reflects the fact that the
mechanisms of the carbene reaction are not fully understood, particularly in the solid state. In
solution, carbenes are thought to insert non-specifically into C-C, X-H (X = C, O, N, S) or C=C
bonds,20,21 making them attractive for studies of protein-protein interactions. Here, by adopting a
photolytic labeling strategy to study solid formulations of peptides, we hoped to identify and
quantify peptide-excipient and peptide-water interactions in a similar way. A broader variety of
reaction products was detected than initially anticipated, however, indicating that the carbene also
reacts inter-molecularly with phosphate (KLQ-PO4) and with oxygen (KLQ-O), as well as intra-
molecularly to produce “dead-end” products. Whether all these reactions of the carbene are truly
non-specific, occurring at similar rates and to similar degrees of conversion, is not known.
Differences in reactivity (i.e., rate or specificity) may bias the distribution of products; if so, the
observed differences in fractional conversion (Fig. 3.3) may reflect differences in reactivity rather

90
than differences in the local environment. Additional studies of the carbene reaction in solid
samples and the factors controlling reactivity would help address these questions.
3.6 Conclusion
In summary, a diazirine-labeled model peptide (KLQ-SDA) has been used to quantify the effects
of changing solid moisture content on the local environment of the peptide in lyophilized solids,
as reflected by the fractional conversion of KLQ-SDA to various photolytic labeling products.
With increasing solid moisture content, the fractional conversion to adducts between the peptide
and sucrose or trehalose decreased, while that to adducts with water increased initially and then
plateaued. In solids containing mannitol, histidine or arginine, the solid moisture content and the
fractional conversion to excipient adducts and water adducts all showed relatively less variation
with changing RH exposure. The results are in partial agreement with the water replacement
hypothesis, which suggests that interactions with stabilizing excipients “replace” hydrogen bonds
to water in lyophilized solids, yet call into question the extent to which replacement occurs as an
even exchange (i.e., one excipient for one water) at the molecular scale. In addition, an adduct of
the peptide with oxygen (KLQ-O) was further identified in solid samples. The source of oxygen
in KLQ-O was shown to be neither water nor molecular oxygen, implicating reactive oxygen
species generated from other components of the solid.

91
CHAPTER 4. A NOVEL PHOTO-REACTIVE EXCIPIENT TO PROBE
PEPTIDE-MATRIX INTERACTIONS IN LYOPHILIZED SOLIDS
*This chapter has been submitted to Journal of Pharmaceutical Sciences.
4.1 Abstract
Excipients used in lyophilized protein drug products are often selected by trial-and-error, in part
because the analytical methods used to detect protein-excipient interactions in lyophilized solids
are limited. In this study, photolytic labeling was used to probe interactions between salmon
calcitonin (sCT) and excipients in lyophilized solids. Two diazirine-derived photo-excipients,
photo leucine (pLeu) and photo glucosamine (pGlcN), were incorporated into lyophilized solids
containing sCT, together with an unlabeled excipient (sucrose or histidine) at pre-lyophilization
pH values from 6 to 9.9. Commercially available pLeu was selected as an ionizable photo-
excipient and amino acid analog, while pGlcN was synthesized as an analog of sugar-based
excipients. Photolytic labeling was induced by exposing the solids to UV light (365 nm, 30-60
min) and the resulting products identified and quantified with liquid-chromatography mass
spectrometry (LC-MS). The distribution of photo-reaction products was affected by the photo-
reactive reagent used, the type of unlabeled excipient and the solution pH prior to lyophilization.
When other components of the solid were identical, the extent and sites of labeling on sCT were
different for pGlcN and pLeu. The results suggest that ionizable and non-ionizable excipients
interact differently with sCT in lyophilized solids, and that photo-excipients can be used to map
these interactions.

92
4.2 Introduction
Interactions between a lyophilized protein drug and pharmacologically inactive components of the
solid matrix (“excipients”) help to stabilize the protein during lyophilization and subsequent
storage in the dry state.55,109 Several types of interactions can occur, including ionic interactions,
hydrogen bonding, cation-π interactions and dispersive interactions.110 In solution, protein-
excipient interactions have been studied using methods such as circular dichroism (CD), Raman
spectroscopy and confocal microscopy.111–113 Though more limited, several methods are also
available to study these interactions in solid samples. For example, amide I band Raman
spectroscopy has been used to characterize the secondary structure of a therapeutic monoclonal
antibody formulated with different excipients in solution, lyophilized solids and spray-dried solids.
The observed structural changes were correlated with the rate of aggregation in long-term stability
studies.114 Fourier-Transform Infrared Spectrometry (FTIR) has been used to study the interactions
between carbohydrates and lysozyme in lyophilized solids using the amide band region.98 Non-
covalent interactions were detected between a humanized monoclonal antibody and arginine as an
excipient by the chemical shifts on the 13C and 15N solid-state nuclear magnetic resonance (ssNMR)
spectra.72 Hydrogen deuterium exchange (HDX), a method traditionally used for proteins in
solution, has been applied to solids to detect differences among several formulations of a
monoclonal antibody, and deuterium uptake in freshly lyophilized samples was strongly correlated
with aggregation and chemical degradation during long-term storage.59 Though all of these
approaches provide information on proteins in the solid matrix, none of them can identify the local
composition in the immediate vicinity of the protein. Such information would be useful in
identifying the types of interactions that contribute to stability, enabling the rational design of solid
protein formulations.

93
Photolytic labeling is being developed as a new approach to probe the interactions between a
lyophilized peptide and the excipients in a solid matrix. Here, the term “photolytic labeling” is
used to describe a reaction activated by exposure to light of certain wavelength and resulting in
the formation of a covalent bond. Photo-reactive reagents in common use include compounds with
phenyl azide, benzophenone or diazirine functional groups.21,115,116 Some of these reagents mimic
the structure of natural amino acids, and have been site-specifically incorporated into proteins to
study protein-protein and protein-ligand interactions in vivo and in vitro.7,12,117 Among the
available photo-reactive reagents, diazirine compounds have often been favored due to their
relatively small size and limited perturbation of structure before and after labeling.26 Diazirines
are activated by UV light at ~360 nm, a wavelength that itself causes low damage to protein
structure.14 Upon UV exposure, the diazirine group loses a molecule of N2 to form a reactive
carbene, which can insert into C-C bonds, X-H (X=C, O, N, S) bonds or add onto C=C bonds.20,118
Photo-reactions with diazirine are generally fast and non-specific, enabling them to efficiently
capture transient protein interactions.119
In our group, proteins and other reagents with diazirine functional groups are being developed to
study the interactions between a protein or peptide and the surrounding matrix in lyophilized solids.
The diazirine reagents have been used in two general ways, by: (i) site-specifically incorporating
the diazirine into the sequence of the protein or peptide, or (ii) incorporating a diazirine-containing
small molecule into the lyophilized matrix as an excipient. As an example of the first approach,
myoglobin was covalently labeled with succinimidyl 4,4’-azipentanoate (SDA) which introduced
the diazirine functional group primarily at lysine side chains.6 The diazirine-labeled myoglobin
was then used to study the interactions of the protein with raffinose and guanidine hydrochloride

94
(Gdn HCl) in lyophilized solids.6 After exposure to UV light to induce the photo-reaction, digested
myoglobin was analyzed using LC-MS to detect peptide-peptide, peptide-water and peptide-
excipient interactions. The distribution of photolytic products differed with the excipient type.6
Recently, a more quantitative analysis of peptide-matrix interactions was performed using a seven-
amino acid peptide (KLQ) derived from salmon calcitonin, which was labeled with SDA at its
single lysine residue.27 In studies with a series of excipients, peptide-excipient adducts were
detected in lyophilized solids and not in solution controls.27 The histidine formulation was an
exception to this observation, in that a histidine-peptide adduct was also detected in solution.27 As
an example of the second approach, photo leucine (pLeu) was used as an excipient in lyophilized
formulations of apomyoglobin (apoMb) to study protein-matrix interactions. The formation of
pLeu-labeled apoMb was related to the concentration of pLeu and the structure of apoMb.5 In
another study of lyophilized myoglobin, pLeu was incorporated in the matrix to explore the
changes induced by lyophilization process differences such as controlled ice nucleation.60
Both of the approaches described above have limitations. Introducing the diazirine functional
group into the protein through post-translational modification of a side chain (e.g., with SDA
diazirine, as above) produces a protein that is heterogeneously labeled with the regard to both the
number and sites of labeling. While it is possible to achieve site-specific protein labeling by
engineering and expressing proteins with photo-amino acids at particular locations, this approach
is time consuming and not amenable to routine formulation development. The use of diazirine-
labeled excipients is constrained by their availability. As representative reagents, only photo-
leucine and photo-methionine have reasonable solubility in solution and are available
commercially at modest cost. While useful, these photo-amino acids do not represent the array of

95
excipients and protein-excipient interactions important for the development of lyophilized protein
formulations.
In the studies reported here, a diazirine-labeled sugar (photo-glucosamine, pGlcN) was synthesized
and compared with photo leucine (pLeu) with regard to the extent and sites of labeling of salmon
calcitonin (sCT) in lyophilized solids under various conditions. Salmon calcitonin (sCT), a 32-
amino acid therapeutic peptide, is used to treat osteoporosis and was selected as the model
peptide.120 The two photo-reactive reagents, pLeu and pGlcN, were incorporated into the
lyophilized matrix to study the difference between ionizable (pLeu) and non-ionizable (pGlcN)
photo-excipients. The structures of the two reagents are shown in Figure 4.1 A. Both contain the
diazirine functional group and are therefore expected to undergo the carbene radical reaction after
UV exposure (Figure 4.1 B). These reagents label sCT when it is in their immediate vicinity (~3.9
Å or less).5 pLeu carries the diazirine label on the side chain, and so is ionizable at both the amine
and carboxylic acid groups. Lyophilized formulations containing pLeu were prepared from
solutions at different pH to explore any changes in pLeu-sCT interactions in lyophilized solids. In
contrast, pGlcN has no ionizable functional groups. Instead, like many sugars used in lyophilized
protein formulations, it has a number of hydroxyl groups capable of forming hydrogen bonds with
the protein. pGlcN was chemically synthesized by introducing the diazirine functional group at the
amine group on glucosamine through the N-hydroxysuccinimide (NHS) ester reaction.121
Unlabeled excipients such as sucrose and histidine were also included in the formulations and their
effects on the photolytic labeling of sCT were analyzed quantitatively using liquid-
chromatography mass spectrometry (LC-MS). The results demonstrate that photolytic labeling in
pLeu formulations was more sensitive to the solution pH prior to lyophilization than pGlcN
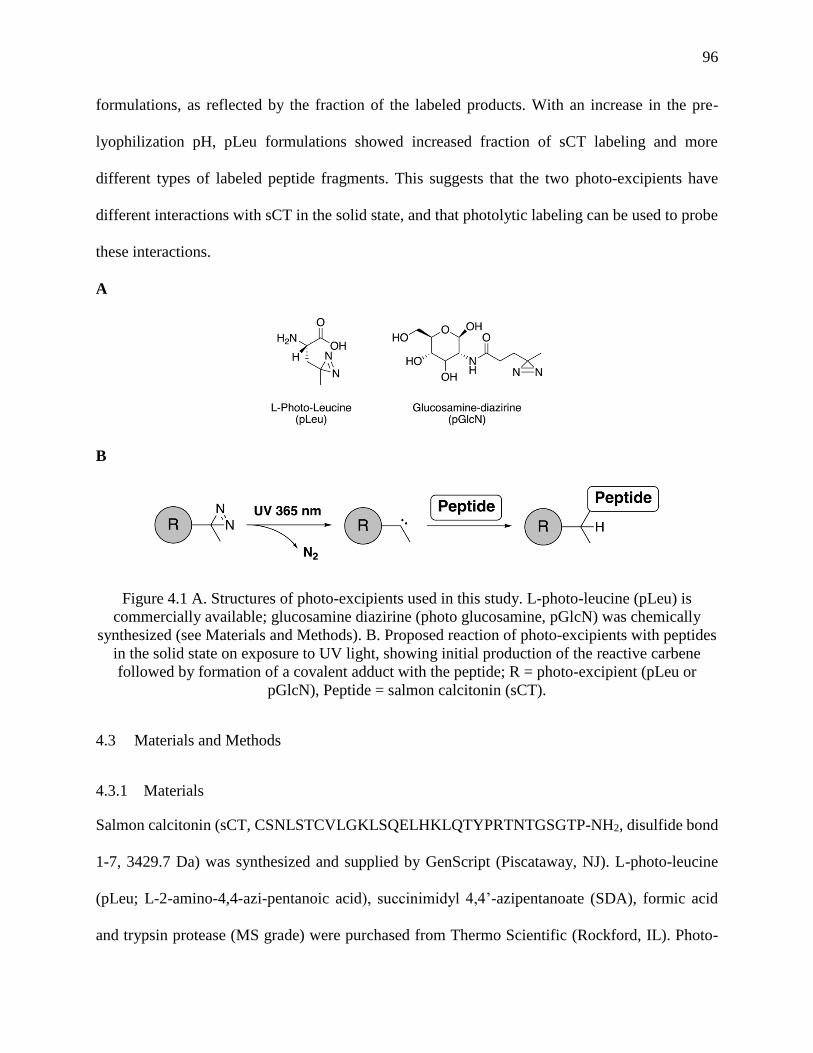
96
formulations, as reflected by the fraction of the labeled products. With an increase in the pre-
lyophilization pH, pLeu formulations showed increased fraction of sCT labeling and more
different types of labeled peptide fragments. This suggests that the two photo-excipients have
different interactions with sCT in the solid state, and that photolytic labeling can be used to probe
these interactions.
A
B
Figure 4.1 A. Structures of photo-excipients used in this study. L-photo-leucine (pLeu) is
commercially available; glucosamine diazirine (photo glucosamine, pGlcN) was chemically
synthesized (see Materials and Methods). B. Proposed reaction of photo-excipients with peptides
in the solid state on exposure to UV light, showing initial production of the reactive carbene
followed by formation of a covalent adduct with the peptide; R = photo-excipient (pLeu or
pGlcN), Peptide = salmon calcitonin (sCT).
4.3 Materials and Methods
4.3.1 Materials
Salmon calcitonin (sCT, CSNLSTCVLGKLSQELHKLQTYPRTNTGSGTP-NH2, disulfide bond
1-7, 3429.7 Da) was synthesized and supplied by GenScript (Piscataway, NJ). L-photo-leucine
(pLeu; L-2-amino-4,4-azi-pentanoic acid), succinimidyl 4,4’-azipentanoate (SDA), formic acid
and trypsin protease (MS grade) were purchased from Thermo Scientific (Rockford, IL). Photo-

97
glucosamine (pGlcN) was chemically synthesized as described below. Sucrose, L-arginine,
potassium phosphate monobasic, potassium phosphate dibasic, and ammonium bicarbonate were
purchased from Sigma-Aldrich (St. Louis, MO). D-(+)-Trehalose, L-histidine, sodium chloride,
MS-grade water, MS-grade acetonitrile, hydrochloric acid solution (1 N) and phosphoric acid
(85%, certified ACS) were obtained from Fisher Scientific (Fair Lawn, NJ). Potassium hydroxide
(1.0 N in aqueous solution) was purchased from VWR Chemicals (Radnor, PA).
4.3.2 Synthesis of pGlcN
pGlcN was synthesized by labeling glucosamine with SDA, as summarized in Figure 4.2. To a
solution of SDA (50 mg in 5 mL DMSO) was added glucosamine (40 mg) and N, N-
diisopropylethylamine (DIPEA). The resulting reaction mixture was stirred at room temperature
overnight. After evaporating the solvent in vacuo, the residue was rinsed with ethyl acetate and
CH2Cl2 to afford pGlcN (50 mg, 57.8% yield, mixture of anomers) as a white solid. NMR chemical
shifts of the product agreed with published values.122 The synthesis of pGlcN was performed by
Dr. Sakkarapalayam M. Mahalingam in the Department of Chemistry at Purdue University.
Figure 4.2 Synthesis of photo glucosamine (pGlcN).

98
4.3.3 Preparation of Lyophilized Formulations
The lyophilized samples contained sCT, a photo-excipient (either pLeu or pGlcN) and an
additional unlabeled excipient such as sucrose. In the solution prior to lyophilization, the photo-
excipient was included at a molar ratio of excipient to sCT of 100:1 and unlabeled excipients were
included at a weight ratio of excipient to sCT of 2:1. For pLeu, pre-lyophilization solution
formulations of each excipient combination were prepared at pH 6, 7.2, 8.4 and 9.9. For pGlcN,
pre-lyophilization solution formulations of each excipient combination were prepared only at pH
6 and 9.9 due to limited availability of pGlcN. Details of the formulation compositions are
summarized in Table 4.1.
Table 4.1 Composition of solutions containing salmon calcitonin (sCT), photo-excipient (pExp)
and unlabeled excipient (Exp) prior to lyophilization in both mM and w/w% units.
pExp Exp mM w/w% Pre-Lyo
Solution pH sCT pExp Exp Buffera sCT pExp Exp Buffera
pLeu
Sucrose
0.1 10
2.0
2.5 11.8 49.4 23.7 15
6.0
7.2
8.4
9.9
Trehalose 2.0
Arg 3.9
His 4.4
NaCl 11.7
pGlu
Sucrose
0.1 10
2.0
2.5 7.9 66.4 15.7 10 6.0
9.9 His 4.4
NaCl 11.7
aThe amount of buffer content is estimated. Extra salts added to adjust pH have been neglected.
To prepare the stock solution formulation, 2.5 mg of sCT were dissolved in 1 mL of phosphate
buffer (2.5 mM, pH 6 ~ 9.9). The solution was filtered with a syringe driven filter unit (0.22 µm,
EMD Millipore Corporation, Billerica, MA) and dialyzed with the same solvent in a dialysis
device (MWCO 100-500D, Spectrum Laboratories, Rancho Dominguez, CA) for 24 h. The
concentration of the stock solution was measured using UV-Vis spectroscopy (= 1615 M-1 cm-

99
1). The photo-excipient (100 mM) and unlabeled excipient (6.9 mg/mL) were dissolved in the same
buffer separately and filtered before use. The stock solutions were mixed and diluted with extra
buffer to reach the target concentration (Table 4.1) and pH-adjusted prior to lyophilization.
Samples (100 µL/vial) were lyophilized following a fixed cycle with a ramp rate of 1 °C/min: (i)
freezing step (-5 °C for 15 min, -40 °C for 60 min, -20 °C for 150 min and -40 °C for 120 min);
(ii) primary drying (-35 °C for 1440 min at 70 mTorr); (iii) secondary drying (25 °C for 720 min
at 70 mTorr). Lyophilized samples were stored at -20 °C before use.
4.3.4 Photolytic Labeling and Product Analysis
The lyophilized samples were exposed to UV light at 365 nm in a UV Stratalinker 2400 (Stratagene
Corp., La Jolla, CA) to activate the photolytic labeling reaction. Samples containing sCT and
sucrose with either pLeu or pGlcN at pH 6 and 9.9 were exposed to UV light for 30, 40 and 60
min. For all other formulations, samples were exposed to UV light for 40 min. As controls,
lyophilized samples of the sucrose formulation with either pLeu or pGlcN at pH 6 and pH 9.9 were
reconstituted with 100 µL water. These samples were exposed to UV immediately upon
reconstitution. Triplicates were prepared and analyzed in each case.
After photo-reaction, the lyophilized samples were reconstituted with MS-grade water containing
0.1% formic acid and subjected to LC-MS analysis (1260 Infinity Series HPLC; 6230 TOF LC/MS;
ZORBRX 300SB-C18 column, 1.0×50 mm, particle size 3.5 µm; Agilent Technologies, Santa
Clara, CA). Reconstituted samples after photo-reaction were diluted with MS-grade water
containing 0.1% formic acid for LC-MS analysis. The injected peptide concentration and the
analysis procedure were the same for lyophilized samples and solution controls. The gradient

100
solvents were MS-grade water with 0.1% formic acid (solvent A) and MS-grade acetonitrile with
0.1% formic acid (solvent B). Gradient elution was accomplished using the following profile:
constant 10% solvent B from 0 to 2 min, followed by an increase from 10% to 60% solvent B over
10 min.
The fraction of sCT converted to each of the photolytically labeled products was quantified using
the respective peak areas on the extracted ion chromatogram (EIC) obtained on LC-MS, according
to the following equation: 𝐹𝑖 =(𝐴𝑈𝐶 𝑜𝑓 𝐸𝐼𝐶)𝑖
∑ (𝐴𝑈𝐶 𝑜𝑓 𝐸𝐼𝐶)𝑖𝑖=0𝑚𝑎𝑥
where 𝐹𝑖 is the fraction of sCT with 𝑖 photo-excipient labels; the numerator is the EIC peak area
of sCT with 𝑖 photo-excipient labels; the denominator is the sum of the peak areas corresponding
to unlabeled sCT over all the photo excipient labeled sCT detected (𝑖 = 0, unlabeled sCT; max =
maximum number of photo-excipient label detected on sCT).
The photolytically labeled sCT was also digested with trypsin to analyze the labeled fragments
and identify sites of labeling. Trypsin protease was dissolved in HCl solution (1 mM) and stored
at -20 °C prior to use. The solid samples of sCT formulations after UV exposure were reconstituted
with 90 µL ammonium bicarbonate solution (100 mM, pH 8) for use in digestion. The stock
solution of trypsin protease was thawed before use and added to each peptide sample to reach a
ratio of protease to peptide of 1:30 (w/w). The mixture was incubated at 37 °C for 24 h (Eppendorf
Thermomixer, Hauppauge, NY). The digested sample was then diluted with MS-grade water
containing 0.1% formic acid for LC-MS analysis. Unlabeled sCT was also digested with trypsin
protease and served as a control. Duplicates were prepared and analyzed for each formulation.

101
4.4 Results
4.4.1 Determination of Reaction Time for Photo-reactive Excipients
The duration of UV exposure affects the formation of photo-reaction products. The reaction time
should be long enough to ensure the completeness of the diazirine reaction while minimizing
sample heating. In previous studies of the pLeu labeling reaction in solids, the reaction was
complete within 30 min.5 The kinetics of the photolytic reaction of sCT with pLeu and pGlcN in
solids were studied in formulations containing sucrose at pre-lyophilization solution pH 6 and 9.9
with UV exposure time of 30, 40 and 60 min (Fig. 4.3). In the pLeu formulation at pH 6, a product
consisting of sCT with one pLeu label (3544.8 Da) was detected, which accounted for 4.7% of the
species detected at 40 min (Fig. 4.3 A). At pH 6, the difference in the composition of labeled sCT
in the samples at the three time points were within 1% of one another. At pH 9.9, the total fractional
formation of pLeu-labeled sCT increased slightly with time, from 21.7% at 30 min to 23.4% at 60
min (Fig. 4.3 B); small amounts of sCT with two pLeu labels (3659.9 Da) were also detected (Fig.
4.3 B). The distributions of sCT products with zero, one and two pLeu labels at the three time
points were comparable. Like the pLeu formulations, there were no significant changes in the
product composition of pGlcN formulations with different UV exposure time (Fig. 4.3 C, D). In
the pGlcN formulations at pH 6 and pH 9.9, sCT was labeled with up to two pGlcN labels (Fig.
4.3 C, D). At pH 6, sCT with one (3690.9 Da) and two pGlcN (3952.1 Da) labels were ~12.4%
and ~1.3% respectively of the total sCT present. At pH 9.9, sCT with one pGlcN label increased
~1.5% when the exposure time increased from 30 min to 40 min. Based on these results, a UV
exposure time of 40 min was chosen for other solid samples.

102
Figure 4.3 Labeling reaction in sucrose formulations with either pLeu or pGlcN at pre-
lyophilization solution pH 6 and 9.9 with different UV exposure time. The composition of
photolytic labeling products is shown as a percentage (%) at three time points of UV exposure:
30, 40 and 60 min. n = 3 +/- SD.
4.4.2 Photolytic Labeling of sCT with pLeu
Samples containing sCT and pLeu were prepared with sucrose, trehalose, arginine, histidine or
NaCl to study the effects of matrix composition on the labeling reaction. For each excipient
combination, the pH of the solution prior to lyophilization was adjusted to 6, 7.2, 8.4 or 9.9. pLeu
is expected to remain ionized within this pH range. As the pH increased from 6 to 9.9, the unlabeled
sCT remaining in the solids decreased in all formulations studied (Fig. 4.4). At pH 6, the unlabeled
sCT was 92%~96% and was lowest in the arginine formulation (Fig. 4.4 A). At pH 7.2, the sucrose
and trehalose formulations showed similar unlabeled sCT (~95%) with the remaining formulations
showing similar and somewhat lower values (Fig. 4.4 B). At pH 8.4, the unlabeled sCT was 71%

103
in NaCl formulations, significantly less than in the other formulations. A similar trend was
observed at pH 9.9, in which the unlabeled sCT was 60% in the NaCl formulation.
Figure 4.4 The composition of photolytic labeling products in pLeu formulations at various pre-
lyophilization pH conditions: (A) pH 6, (B) pH 7.2, (C) pH 8.4 and (D) pH 9.9. The products
were quantified as the fractional area of all final products (%) by EIC on LC-MS; see text. n = 3
+/- SD.
A more detailed comparison of the photolytic labeling products is shown in Figure 4.5. At pH 6,
sCT with only one label was detected in all formulations. At pH 7.2, sCT with two labels was
detected only in the arginine and histidine formulations, with the other formulations showing only
one label. The total fractions of labeled sCT (i.e., with one and two labels) were comparable at pH
6 and pH 7.2 in sucrose, trehalose and arginine formulations while the fraction was greater at pH
7.2 in histidine and NaCl formulations (Fig. 4.5). At pH 8.4 and 9.9, sCT with up to three labels

104
was detected in NaCl formulations; the total fraction of labeled sCT was also greatest in the NaCl
formulation at these pH values. Across the different excipients, the fraction of labeled sCT was
greater at pH 8.4 and 9.9 than at lower pH values. The greatest change in the total fraction of
labeled sCT occurred between pre-lyophilization solution pH values of 7.2 (< 10%) and 8.4 (>15%)
in all formulations (Fig. 4.5). The increase in labeling fraction of sCT from pH 7.2 to 8.4 may
indicate a change in the ionization state of either pLeu or sCT, or both.
Figure 4.5 Comparison of photolytic labeling products formed in pLeu formulations. n = 3 +/-
SD.
4.4.3 Photo-reaction of pLeu in Solution
As a control, solution samples of pLeu-sucrose formulations at pH 6 and 9.9 were subjected to
photo-reaction at the conditions described above. The composition of the labeled products is
shown in Figure 4.6 and compared with the corresponding lyophilized samples. pLeu-labeled sCT
was not detected in solution at pH 6. At pH 9.9, only sCT with one pLeu label was detected in

105
solution. The total fraction of labeled product was significantly lower in solution (8%) than in the
lyophilized solids (22%) at pH 9.9.
Figure 4.6 Comparison of labeled sCT in solution and lyophilized solids of pLeu formulation
containing sucrose. n = 3 +/- SD.
4.4.4 Peptide Fragment Analysis of pLeu-Labeled sCT
To identify the regions of the peptide involved in photolytic labeling, sCT in solid samples after
photo-reaction was subjected to tryptic digestion and MS analysis. Tryptic fragments that showed
a mass increase (relative to unlabeled control) consistent with reaction with one molecule of photo-
excipient were considered singly labeled. Similarly, those tryptic fragments with mass increases
consistent with reaction with two or three photo-excipient molecules were considered doubly or
triply labeled, respectively. Photolytic labeling near the sites of trypsin cleavage (i.e., near Lys or
Arg) can inhibit tryptic digestion at that site, creating a “missed” cleavage (or “mis-cleaved” site

106
or fragment). Detection of these longer mis-cleaved fragments suggests that photolytic labeling
occurred near the normal site of trypsin cleavage or interfered with digestion in some way.
Digestion of unlabeled sCT yielded four peptide fragments without any missed cleavage: C1-K11
(fragment 1-11), L12-K18 (fragment 12-18), L19-R24 (fragment 19-24) and T25-P32 (fragment
25-32) (Fig. 4.7). In pLeu labeled sCT samples, the four unlabeled peptide fragments without pLeu
label were all detected. Mis-cleaved peptide fragments (i.e., longer fragments resulting from
“missed” enzymatic digestion at the sites above) without pLeu label were not detected and
sequence coverage was 100%. The pLeu-labeled fragments detected in each formulation are shown
in Figure 4.7. With increasing pre-lyophilization pH, more fragments with pLeu label were
detected. At lower pH, labeled fragments were primarily in the N-terminal half of the sCT
sequence, suggesting that interactions occur primarily in this region. At higher pre-lyophilization
pH, labeled fragments were also detected in the C-terminal half of the sequence.

107
Figure 4.7 Digest map of sCT after photo-reaction showing pLeu-labeled peptide fragments.
Trypsin digestion of unlabeled sCT yielded four peptide fragments with amino acids from 1-11,
12-18, 19-24 and 25-32. Digestion of pLeu-labeled sCT generated unlabeled (not shown) and
labeled peptide fragments. The pLeu-labeled fragments were: native fragments (i.e., fragments
found for unlabeled sCT) with one pLeu label (white bar), mis-cleaved peptide fragments with
one pLeu label (grey bar) or mis-cleaved peptide fragments with two pLeu labels (black bar).

108
At pH 6, peptide fragments with one pLeu label were detected in all formulations and there were
no mis-cleaved peptide fragments (Fig. 4.7). pLeu-labeled fragment 12-18 was detected in all
formulations, while the arginine and NaCl formulations also contained labeled fragment 1-11. At
pH 7.2, mis-cleaved peptide fragments were detected in arginine, histidine and NaCl formulations
(Fig. 4.7). The fraction of total labeled products was also greater in these formulations than in the
sucrose and trehalose formulations (Fig. 4.4 B). Fragments 1-18 and 12-24 with one pLeu label
were detected in the arginine and histidine formulations. At pH 8.4, the sucrose and histidine
formulations showed the same labeled fragments: fragment 1-11, 12-18 and 19-24 with one pLeu
label and mis-cleaved fragments 1-18 and 12-24 with one pLeu label (Fig. 4.7). A mis-cleaved
fragment 12-24 with two pLeu labels was detected in trehalose, arginine and NaCl formulations.
In the NaCl formulation, an additional fragment 25-32 with one pLeu was also detected, and the
total fraction of labeled sCT in this sample was > 25% (Fig. 4.4 C). At pH 9.9, a mis-cleaved
peptide fragment 1-18 with two pLeu labels was detected in arginine and NaCl formulations (Fig.
4.7). The distributions of labeled peptide fragments in these two formulations were the same. All
the formulations except the histidine formulation showed more labeled fragments at pH 9.9 than
at pH 8.4.
4.4.5 Photolytic Labeling of sCT with pGlcN
Due to limited availability of pGlcN, samples containing pGlcN were prepared with sucrose,
histidine or NaCl as unlabeled excipients at pre-lyophilization pH values of 6 and 9.9. pGlcN is
not ionizable and so is expected to be uncharged at both pH values. The composition of photolytic
labeling products is shown in Figure 4.8. At pH 6, the fraction of unlabeled sCT was ~85% in the
three formulations and increased to ~89% at pH 9.9. Differences in the product distribution among
the three formulations were less than in the pLeu formulations (Fig. 4.4). sCT with up to two

109
pGlcN labels was detected in each formulation. A more detailed comparison of the photolytic
labeling products is shown in Figure 4.9. The total fraction of labeled products decreased from pH
6 to pH 9.9 in all the formulations. The changes were greater in the histidine and NaCl formulations
(~4%) than in the sucrose formulation (~2%).
Figure 4.8 The composition of photolytic labeling products in pGlcN formulations at two pre-
lyophilization solution pH conditions: (A) pH 6 and (B) pH 9.9. The products were quantified as
the fractional area of all final products (%) by EIC on LC-MS; see text. n = 3 +/- SD.

110
Figure 4.9 Comparison of photolytic labeling products formed in pGlcN formulations. n = 3 +/-
SD.
4.4.6 Peptide Fragment Analysis of pGlcN-Labeled sCT
The digestion map of pGlcN-labeled sCT is shown in Figure 4.10. Unlabeled mis-cleaved peptide
fragments were not detected. At pH 6, peptide fragments 1-11, 12-18 and 19-24 with one pGlcN
label were detected in all formulations. Mis-cleaved peptide fragment 12-24 with one pGlcN label
was detected in the histidine and NaCl formulations. At pH 9.9, mis-cleaved peptide fragment 1-
18 with one pGlcN label was detected in the sucrose and histidine formulations. The distribution
of labeled peptide fragments was the same in NaCl formulations at pH 6 and 9.9. Labeled fragment
25-32 was not detected in any of the pGlcN formulations. The slight decrease in the total fraction
of labeled sCT with increasing pH (Fig. 4.9) was not associated with a decrease in the types of
pGlcN-labeled peptide fragments (Fig. 4.10).

111
Figure 4.10 Digest map of sCT after photo-reaction showing pGlcN-labeled peptide fragments.
The digestion of pGlcN labeled sCT generated unlabeled (not shown) and labeled peptide
fragments. The pGlcN-labeled fragments were: native fragments (i.e., fragments found for
unlabeled sCT) with one pGlcN label (white bar) and mis-cleaved peptide fragments with one
pGlcN label (grey bar).
4.4.7 Photo-reaction of pGlcN in Solution
Solution samples of pGlcN formulations containing sucrose at pH 6 and 9.9 were subjected to
photo-reaction. The composition of the photo-reaction products is shown in Figure 4.11. pGlcN-
labeled sCT was not detected in solution at pH 6, while a low level (1%) of sCT with one pGlcN
label was detected at pH 9.9. The total fraction of labeled products in the solution controls was
significantly less than in the corresponding lyophilized samples (Fig. 4.11). At pH 9.9, the fraction
of labeling was significantly less than that in pLeu formulations (1%, Fig. 4.11, vs. 8%, Fig. 4.6),
which suggests different interactions of pLeu and pGlcN with sCT in solution.

112
Figure 4.11 Comparison of labeled sCT in solution and lyophilized solids of pGlcN formulations
containing sucrose. n = 3 +/- SD.
4.5 Discussion
pGlcN was chemically synthesized using the commercially available reagents glucosamine and
NHS-SDA, which introduced the diazirine onto the glucosamine primary amine through the NHS
ester reaction. This reaction has been used in other studies to introduce functional groups or cross-
link proteins.123–126 The reaction is simple to perform and can be used to label other amine-
containing excipients such as amino acids with diazirine. pGlcN was then incorporated into the
lyophilized matrix of sCT together with other unlabeled excipients. The photolytically labeled
products for formulations containing pGlcN differed from those containing pLeu when the pH of
the pre-lyophilization solution changed.

113
With an increase in pre-lyophilization solution pH, the total fraction of photolytically labeled
products increased in sCT formulations containing pLeu and a higher number of pLeu labels was
detected (Fig. 4.4). The largest change occurred when the solution pH increased from 7.2 to 8.4
(Fig. 4.5). Such a pH-dependent increase in labeling was not observed in pGlcN formulations (Fig.
4.9). In solution within this pH range, sCT is expected to have a net positive charge that is
unaffected by pH (pI ~10) and pLeu is expected to be zwitterionic (pKa1 ~ 2.4, pKa2 ~ 9.6).127–129
This difference in pLeu labeling with pH then is not easily explained by differences in the
ionization state of either sCT or pLeu in solution. This suggests that the ionization state of one or
both species may be shifted in the solid state, affecting their interactions. Previous studies have
shown that the pKa values of amino acid side chains shift in microenvironments less polar than
water, such as the interior of a folded protein.130,131 These shifts can be five pH units or more and
tend to favor the neutral state, so that pKa values for acidic groups are greater and those of basic
groups less than in an aqueous environment.130,131 Similar shifts in the pKa values for sCT in the
solid state could produce changes in ionization state in the pre-lyophilization pH range studied
here. The lack of a pH-dependence in pGlcN labeling is consistent with the fact that pGlcN is not
ionizable, so that changing charge states do not affect its interactions with sCT. It is possible that
the pH-dependent changes in labeling in pLeu-containing solids are instead due to pH-dependent
changes in sCT conformation. The absence of pH-dependent changes in labeling for the pGlcN
formulation makes this unlikely, however. pH-dependent changes in the phase behavior of the
pLeu-containing solids (e.g., crystallization or micro phase separation) are also possible; exploring
the pH-dependent phase behavior of the pLeu and pGlcN solids is beyond the scope of these studies.

114
As trypsin digestion of pLeu-labeled sCT suggests (Fig. 5), a higher total fraction of labeling is
accompanied by more different types of labeled fragments detected. Most of the labeled fragments
are located in the first twenty-four amino acids of the sCT sequence (i.e., C1-R24). All five of the
amino acids with ionizable side chains are located in this region (i.e., K11, E15, H17, K18, R24),
suggesting that charge-based interactions are involved in labeling. Labeling of fragment 25-32 was
detected only at pH > 7.2 in a few formulations, suggesting weak interactions with pLeu in this
region. Since mis-cleaved peptide fragments were not detected in unlabeled sCT controls, the
presence of labeled mis-cleaved peptide fragments suggests that labeling interferes with tryptic
cleavage, and that the interaction with pLeu occurs near charged amino acids such as K11, K18
and R24. In pGlcN formulations, the labeled peptide fragments are located in similar sequences as
in pLeu formulations (Fig. 4.10). However, it is possible that pGlcN interacts with sCT mainly
through hydrogen bonding. Fragment 25-32 has poor potential to form hydrogen bonds, which
may explain the absence of labeling. Compared to the pLeu formulation, there was no clear trend
in the site of sCT labeling in pGlcN formulations with increasing pre-lyophilization solution pH.
The unlabeled excipients also have an effect on photolytic labeling. For pLeu, the total fraction of
labeled sCT was highest in formulations containing NaCl at pre-lyophilization solution pH values
of 8.4 and 9.9 (Fig. 4.5). Increased labeling in NaCl formulations may be the result of its
destabilizing effect on protein structure compared to the other unlabeled excipients. The fraction
of labeled products was comparable in pGlcN formulations containing histidine and NaCl,
however, which suggests that any destabilizing effects of NaCl do not affect pGlcN interactions
with sCT appreciably (Fig. 4.9). The absence of effects of NaCl in pGlcN containing formulations
argues against a simple effect of NaCl on sCT conformation.

115
Labeled sCT was not detected at pH 6 in solutions containing sucrose in either pLeu or pGlcN
formulations, but was detected in the same formulations at pH 9.9 (Fig. 4.6 and Fig. 4.11). Limited
interactions between sCT and the labeling reagents in solution are expected, since the peptide is
likely to be preferentially hydrated in sucrose-containing solutions.132,133 However, there are
interactions between pLeu and sCT in solution at pH 9.9 (Fig. 4.6) and detectable interactions with
pGlcN at this pH (Fig. 4.11). The pLeu labeling in solution may result from interactions of the
overall negatively-charged pLeu with positively-charged sCT side chains on amino acids such as
K11, K18 and R24 in solution at pH 9.9 (Fig. 4.6). Reasons for the low level of interaction with
pGlcN at pH 9.9 are unknown (Fig. 4.11).
The results presented here demonstrate that interactions between a peptide and photo-excipient in
solid formulations depend on both the properties of the photo-excipient and the formulation
composition. This suggests that photo-reactive excipients may be useful as probes of the
interactions between peptide (or protein) and the excipient matrix in the solid state. Understanding
these interactions and their relationship to storage stability may facilitate the rational development
of solid formulations and shorten the time needed for formulation development. For example, a
comparison of pLeu photolytic labeling and the storage stability of formulations containing leucine
as an excipient could reveal the extent to which interactions detected by photolytic labeling
contribute to long-term stability. Photo-excipients are not intended to be included in the final
formulation, but would instead serve as development tools to identify peptide-excipient
interactions.

116
For this idea to be evaluated fully, a broader range of photo-reactive excipients that mimic the
structures of commonly used excipients is needed. Ideally, these should be either commercially
available or easy to synthesize. The NHS-SDA labeling method used in this study can only modify
reagents that contain primary amines. There is a need for photo-reactive reagents that more closely
mimic the structures of commonly used excipients to be photo-reactive, including sugars, polyols
and surfactants, which do not necessarily contain primary amines. The introduction of a
photolytically activatable group should not change critical chemical and physical properties of the
excipient (e.g., solubility) greatly and should preserve functional groups that contribute to
interactions with peptides and proteins (e.g., hydrogen bond donors/acceptors, ionizable groups).
Improved understanding of photolytic reactions in solution and solid states is also needed. Previous
studies have shown that a diazirine-labeled peptide can generate an array of products in lyophilized
solid samples, in addition to peptide-excipient adducts.27 The side products in the reactions of
photo-excipients with molecules other than peptide have not been addressed in the studies reported
here, and may affect the yield of labeled sCT. Here, these side reactions are assumed to occur to
the same degree for the conditions and photo-excipients used. Finally, stability studies of
formulations containing the corresponding unreactive excipients, leucine and glucosamine in this
case, would reveal the relation between photolytic labeling products and the long-term stability of
formulations. Such studies would facilitate the application of photolytic labeling in other
peptide/protein formulations for excipient selection at early stage of formulation development.
117
CHAPTER 5. CONCLUSIONS
5.1 Current Development
It has been nearly 50 years since photolytic labeling was first introduced to study protein-protein
interactions in vivo.9 Since that time, photo-reactive reagents have been mostly used in solution
environments to study protein-related interactions. Successful application of this method to study
protein-matrix interactions in solid samples has been reported only recently by our lab.5 In our
group’s initial studies, the photo-reactive diazirine functional group was introduced into the protein
structure though the NHS ester reaction, which is easy to perform. The study of SDA-labeled
myoglobin in lyophilized formulations showed that photo-reaction with diazirine occurs in
lyophilized solid and that the products depend on the composition of lyophilized matrix.6 To our
knowledge, these results were the first to reveal the possibility of using photolytic labeling to probe
protein-matrix interactions in solid samples.
The work presented in this dissertation was motivated by a need to address the quantitation of
photo-reaction products from NHS-SDA labeled proteins. There are usually multiple lysine
residues in a protein sequence. With NHS-SDA labeling, the distribution of SDA labels in terms
of number and location on each protein cannot be controlled, and the protein tends to be
heterogeneously labeled after SDA reaction. Since the local environment near each lysine residue
is also heterogeneous, the resulting photo-reaction products are complicated and quantitative
analysis is difficult. To gain a better understanding of the products of diazirine photo-reactions in
solid, a model peptide with a single lysine in its sequence (KLQ) was used in Chapter 1 to achieve
a singly SDA-labeled peptide (KLQ-SDA). Complete conversion from KLQ to KLQ-SDA was

118
achieved and the resulting photo-reaction products were used to map the local environment near
the SDA-labeled lysine residue. Photo-reaction products such as peptide-water and peptide-
excipient adducts were detected with LC-MS and quantified with rp-HPLC and LC-MS. This study
provided insights into the photo-reaction products from diazirine reaction in the lyophilized solids.
In addition to the expected adducts of the peptide with water or excipient, other products such as
peptide-salt adducts and unproductive dead-end products were generated, detected and quantified.
Formulations prepared with stabilizing excipients showed different distributions of photo-reaction
products than those with destabilizing excipients, indicating that photolytic labeling shows
promise in excipient selection and formulation development.
The work described in Chapter 2 uses the quantitation method established in Chapter 1 to study
increased solid moisture effect on the local environment near the peptide. Lyophilized solids
containing different excipients were exposed to various relative humidity conditions until
saturation. The distribution of photo-reaction products changed with excipient type and with
changes in solid moisture. The source of peptide-water adducts was also further investigated and
confirmed. As solid moisture increases, a higher conversion to peptide-water adducts would be
expected, and was in fact observed in formulations containing disaccharide excipients at low
moisture level. However, the results suggested that increases in bulk moisture content do not lead
to greater interactions between peptide and water at molecular level. These changes are generally
not detected with analytical methods commonly used in protein formulation, such as DSC and
FTIR.

119
In Chapter 3, two different diazirine-labeled photo-excipients were incorporated in lyophilized
formulations of a therapeutic peptide, sCT. Quantitative analysis of photo-excipient labeled
peptide is more feasible than that of the photo-reaction products of a labeled peptide. The synthesis
of photo glucosamine (pGlcN) was achieved using NHS-SDA labeling of glucosamine. pGlcN
was designed to mimic the structure of disaccharide excipients, which are not ionizable. pLeu was
selected as an ionizable excipient and photo-reaction products of the two photo-excipients were
compared in various formulations. pGlcN and pLeu behaved differently when pre-lyophilization
solution pH increased, with pLeu showing a pH-dependent labeling of sCT that was not observed
for pGlcN. This pH dependence is consistent with a role for electrostatic interactions in the
interactions of pLeu with sCT in the solid state.
5.2 Future Challenges
Though progress toward the application and quantitation of photolytic labeling reactions in
lyophilized solids has been made this dissertation research, a number of challenges still remain.
First, the mechanism of the diazirine photo-reaction in the solid state remains unclear. Diazirine
forms a reactive carbene after UV activation, which is expected to react non-specifically with the
molecules in its immediate environment. However, a study in fiberglass coupled with diazirine
reagents showed that the activated carbene preferentially interacts with cysteine and aromatic
amino acids.30 This preferential reactivity could bias quantitation, so that the product profiles
reflect reactivity towards different molecules rather than peptide-matrix interactions. A better
understanding of the reaction mechanism would help to address this issue.

120
Second, new photo-reactive reagents are needed. NHS-SDA has been shown to be a high efficiency
labeling tool, but cannot be used to site-specifically label proteins. While proteins can be expressed
with photo-amino acids in specific positions, this approach is time-consuming and not well-suited
to routine formulation development. There is a need for new chemical labeling approaches that
can be applied post-translationally to produce uniformly and site-specifically labeled protein. At
the same time, new photo-reactive excipients could also be developed, which should not be limited
to diazirine reagents. Ideally, these photo-excipients should be similar to the original excipient in
structure, and any modifications should not mask important functional groups involved in key
interactions such as hydrogen bonding and electrostatic interaction. Novel photo-excipients should
also require activation wavelengths that are not damaging to proteins, and should have high
reaction efficiency without specificity towards certain molecules or functional groups. For
formulation studies, photo-excipients mimicking the diversity of excipient structures used in
protein formulation are desired.
Finally, to develop photolytic labeling as a practical tool for formulation selection, the correlation
between the formation of photo-reaction products and long-term stability of protein formulation
needs to be further explored. Photo-reactions are complete in 30 to 40 min in the conditions used
in this dissertation, while long-term stability studies for protein formulations can take up to a few
years. Solid state hydrogen deuterium exchange mass spectrometry (ssHDX-MS), a method used
to probe hydrogen bonding between the protein and the solid matrix, has shown promise in
predicting the long-term stability of protein formulations in a relatively short time.59,134 The
relationship between long-term stability and short-term photolytic labeling results should also be
explored.

121
APPENDIX
Figure A1 Photolytic reaction of SDA-labeled peptide with species present in solution and solid
formulations, showing proposed product structures: (a) reactive intermediate resulting from UV
exposure, (b) peptide-water adduct, hydroxyl form (Form I), (c) peptide-water adduct, ketone
form (Form II), (d) peptide-excipient adduct and (e) peptide-phosphate adduct. Dead-end
products are formed from unproductive intramolecular reaction and have the same mass as the
carbene intermediate.

122
Figure A2 Comparison of KLQ-H2O water adducts (Form I only) following photolytic
crosslinking of the KLQ-SDA peptide in lyophilized samples (as % of KLQ-SDA) with bulk
moisture content of the solid measured by Karl Fischer titration. Error bars not shown when less
than symbol height.

123
Quantitation Method for Photolytic Labeling Products
The concentrations of KLQ-excipient adducts were calculated from the LC-MS extracted ion
chromatograms (EIC) using the following equation:
[𝐾𝐿𝑄 − 𝑒𝑥𝑐𝑖𝑝𝑖𝑒𝑛𝑡] =[𝐴𝑈𝐶𝐾𝐿𝑄−𝑒𝑥𝑐𝑖𝑝𝑖𝑒𝑛𝑡]𝐸𝐼𝐶
[𝐴𝑈𝐶𝐾𝐿𝑄−𝐻2𝑂]𝐸𝐼𝐶× [𝐾𝐿𝑄 − 𝐻2𝑂𝑇𝑜𝑡𝑎𝑙]𝐻𝑃𝐿𝐶 (1)
where [𝐴𝑈𝐶𝐾𝐿𝑄−𝑒𝑥𝑐𝑖𝑝𝑖𝑒𝑛𝑡]𝐸𝐼𝐶 is the peak area for the KLQ-excipient adduct measured by EIC, in
arbitrary units; [𝐴𝑈𝐶𝐾𝐿𝑄−𝐻2𝑂]𝐸𝐼𝐶 is the peak area for the KLQ-H2O adduct measured by EIC, in
arbitrary units; and [𝐾𝐿𝑄 − 𝐻2𝑂𝑇𝑜𝑡𝑎𝑙]𝐻𝑃𝐿𝐶 is the total concentration of KLQ-H2O adducts
measured by HPLC, in units of µM.
The concentration of KLQ-H2O was based on the corresponding chromatographic peak area and
the calibration curve for the KLQ-SDA peptide, as described in the text. [𝐴𝑈𝐶𝐾𝐿𝑄−𝐻2𝑂]𝐸𝐼𝐶 and
[𝐾𝐿𝑄 − 𝐻2𝑂𝑇𝑜𝑡𝑎𝑙]𝐻𝑃𝐿𝐶 in the above equation included both Form I and Form II because they
cannot be distinguished from one another on EIC, although the two forms are well resolved on rp-
HPLC (Fig. 1).
The concentration of regenerated KLQ was calculated similarly when it co-eluted with other
products:
[𝐾𝐿𝑄] =[𝐴𝑈𝐶𝐾𝐿𝑄]𝐸𝐼𝐶
[𝐴𝑈𝐶𝐾𝐿𝑄−𝐻2𝑂]𝐸𝐼𝐶× [𝐾𝐿𝑄 − 𝐻2𝑂𝑇𝑜𝑡𝑎𝑙]𝐻𝑃𝐿𝐶 (2)
where [𝐴𝑈𝐶𝐾𝐿𝑄]𝐸𝐼𝐶 is the peak area for the regenerated KLQ peptide measured by EIC, in
arbitrary units; [𝐴𝑈𝐶𝐾𝐿𝑄−𝐻2𝑂]𝐸𝐼𝐶 is the peak area for the KLQ-H2O adduct measured by EIC, in
arbitrary units; and [𝐾𝐿𝑄 − 𝐻2𝑂𝑇𝑜𝑡𝑎𝑙]𝐻𝑃𝐿𝐶 is the total concentration of KLQ-H2O adducts
measured by HPLC, in units of µM.

124
When the sum of the concentrations of regenerated KLQ and KLQ-excipient adduct did not equal
that of the chromatographic peak at 11 min, the unidentified product concentration was defined as:
[𝑈𝑛𝑖𝑑𝑒𝑛𝑡𝑖𝑓𝑖𝑒𝑑] = [11 min 𝑝𝑒𝑎𝑘]𝐻𝑃𝐿𝐶 − [𝐾𝐿𝑄 − 𝑒𝑥𝑐𝑖𝑝𝑖𝑒𝑛𝑡] − [𝐾𝐿𝑄] (3)
where [11 min 𝑝𝑒𝑎𝑘]𝐻𝑃𝐿𝐶 is the product concentration at 11 min peak measured by HPLC; and
[𝐾𝐿𝑄 − 𝑒𝑥𝑐𝑖𝑝𝑖𝑒𝑛𝑡] and [𝐾𝐿𝑄] are defined by (1) and (2), respectively, in units of µM.
KLQ-urea co-eluted with KLQ-H2O Form I. The regenerated KLQ and KLQ-H2O Form II
remained as single peaks on rp-HPLC, so they were quantified by rp-HPLC. The total KLQ-H2O
was calculated using the following equation:
[𝐾𝐿𝑄 − 𝐻2𝑂𝑇𝑜𝑡𝑎𝑙] =[𝐴𝑈𝐶𝐾𝐿𝑄−𝐻2𝑂]𝐸𝐼𝐶
[𝐴𝑈𝐶𝐾𝐿𝑄]𝐸𝐼𝐶× [𝐾𝐿𝑄]𝐻𝑃𝐿𝐶 (𝑢𝑟𝑒𝑎 𝑓𝑜𝑟𝑚𝑢𝑙𝑎𝑡𝑖𝑜𝑛 𝑠𝑜𝑙𝑖𝑑) (4)
where [𝐴𝑈𝐶𝐾𝐿𝑄−𝐻2𝑂]𝐸𝐼𝐶 is the peak area for the KLQ-H2O adduct measured by EIC, in arbitrary
units; [𝐴𝑈𝐶𝐾𝐿𝑄]𝐸𝐼𝐶 is the peak area for the regenerated KLQ peptide measured by EIC, in arbitrary
units; and [𝐾𝐿𝑄]𝐻𝑃𝐿𝐶 is the total concentration of the regenerated KLQ measured by HPLC, in
units of µM.
The concentration of KLQ-H2O Form I was calculated by deducting KLQ-H2O Form II from the
total KLQ-H2O concentration:
[𝐾𝐿𝑄 − 𝐻2𝑂 𝐹𝑜𝑟𝑚 𝐼] = [𝐾𝐿𝑄 − 𝐻2𝑂𝑇𝑜𝑡𝑎𝑙] − [𝐾𝐿𝑄 − 𝐻2𝑂 𝐹𝑜𝑟𝑚 𝐼𝐼]𝐻𝑃𝐿𝐶 (5)
where [𝐾𝐿𝑄 − 𝐻2𝑂𝑇𝑜𝑡𝑎𝑙] was defined by (4) in units of µM; [𝐾𝐿𝑄 − 𝐻2𝑂 𝐹𝑜𝑟𝑚 𝐼𝐼]𝐻𝑃𝐿𝐶 was
measured by HPLC in units of µM. [𝐾𝐿𝑄 − 𝑢𝑟𝑒𝑎] was calculated by (1).

125
To compare results among different formulations and mitigate the effect of KLQ-SDA
concentration variation among batches, the amount of each cross-linked product was normalized
in the form of the fractional conversion of KLQ-SDA in the stock solution after photolytic reaction:
[𝐶𝑟𝑜𝑠𝑠 − 𝐿𝑖𝑛𝑘𝑒𝑑 𝑃𝑟𝑜𝑑𝑢𝑐𝑡]% =[𝐶𝑟𝑜𝑠𝑠−𝐿𝑖𝑛𝑘𝑒𝑑 𝑃𝑟𝑜𝑑𝑢𝑐𝑡]𝐻𝑃𝐿𝐶 𝑜𝑟 𝐸𝐼𝐶
[𝐾𝐿𝑄−𝑆𝐷𝐴]𝑏𝑒𝑓𝑜𝑟𝑒 𝑟𝑒𝑎𝑐𝑡𝑖𝑜𝑛× 100% (6)
where [𝐶𝑟𝑜𝑠𝑠 − 𝐿𝑖𝑛𝑘𝑒𝑑 𝑃𝑟𝑜𝑑𝑢𝑐𝑡]𝐻𝑃𝐿𝐶 𝑜𝑟 𝐸𝐼𝐶 was the concentration of each cross-linked product
after photolytic reaction defined by (1) – (5) or measured by rp-HPLC in units of µM; and
[𝐾𝐿𝑄 − 𝑆𝐷𝐴]𝑏𝑒𝑓𝑜𝑟𝑒 𝑟𝑒𝑎𝑐𝑡𝑖𝑜𝑛 was the concentration of KLQ-SDA in each formulation before
photolytic reaction measured by rp-HPLC in units of µM. For example, if [𝐷𝑒𝑎𝑑 −
𝑒𝑛𝑑 𝑝𝑟𝑜𝑑𝑢𝑐𝑡]% is 50%, this means 50% of the KLQ-SDA, on a molar basis, was converted to
dead-end product after the photolytic reaction.
Ideally, the total concentration of all the cross-linked products sum to that of the KLQ-SDA before
the photolytic reaction. However, it was not the case observed from the experiments. So an
unrecovered part was defined as:
[𝑈𝑛𝑟𝑒𝑐𝑜𝑣𝑒𝑟𝑒𝑑]% = 100% − [𝐶𝑟𝑜𝑠𝑠 − 𝐿𝑖𝑛𝑘𝑒𝑑 𝑃𝑟𝑜𝑑𝑢𝑐𝑡𝑠]𝑇𝑜𝑡𝑎𝑙% (7)
where [𝐶𝑟𝑜𝑠𝑠 − 𝐿𝑖𝑛𝑘𝑒𝑑 𝑃𝑟𝑜𝑑𝑢𝑐𝑡𝑠]𝑇𝑜𝑡𝑎𝑙% is the sum of all the cross-linked products defined by
(6).
The standard deviation of the resulting percentage was calculated according to the error
propagation equation.135 If the concentration of a specific cross-linked product was less than 1 µM,
its amount was neglected in reporting the results.

126
0 20 40 600
1
2
3
4
5
Time(hrs)
w/w
(%)
Sucrose RH 8%
0 20 40 600
10
20
30
40
Sucrose RH 78%
Time(hrs)
w/w
(%)
0 20 40 600
1
2
3
4
Trehalose RH 8%
Time(hrs)
w/w
(%)
0 20 40 600
10
20
30
40Trehalose RH 78%
Time(hrs)
w/w
(%)
0 20 40 600
2
4
6
Time(hrs)
w/w
(%)
Mannitol RH 8%
0 20 40 600
2
4
6
Time(hrs)
w/w
(%)
Mannitol RH 78%
0 20 40 600
1
2
3
Histidine RH 8%
Time(hrs)
w/w
(%)
0 20 40 600
2
4
6
8Histidine RH 78%
Time(hrs)
w/w
(%)

127
Figure A3 Change in moisture content (w/w%) with time in lyophilized samples exposed to
relative humidity (RH) at 8% and 78% as measured by Karl Fischer titration. The time points
were 0, 2, 4, 16, 24 and 48 hrs. n=3 ± SD.
0 20 40 600
2
4
6
8
Time(hrs)
w/w
(%)
Arginine RH 8%
0 20 40 600
10
20
30
40
Time(hrs)
w/w
(%)
Arginine RH 78%

128
REFERENCES
(1) Allison, S. D.; Chang, B.; Randolph, T. W.; Carpenter, J. F. Hydrogen Bonding between
Sugar and Protein Is Responsible for Inhibition of Dehydration-Induced Protein Unfolding.
Arch. Biochem. Biophys. 1999, 365 (2), 289–298.
(2) Crowe, J. H.; Carpenter, J. F.; Crowe, L. M. The Role of Vitrification in Anhydrobiosis.
Annu. Rev. Physiol. 1998, 60, 73–103.
(3) Chin, J. W.; Martin, A. B.; King, D. S.; Wang, L.; Schultz, P. G. Addition of a
Photocrosslinking Amino Acid to the Genetic Code of Escherichiacoli. Proc. Natl. Acad.
Sci. U. S. A. 2002, 99 (17), 11020–11024.
(4) Hino, N.; Okazaki, Y.; Kobayashi, T.; Hayashi, A.; Sakamoto, K.; Yokoyama, S. Protein
Photo-Cross-Linking in Mammalian Cells by Site-Specific Incorporation of a
Photoreactive Amino Acid. Nat. Methods 2005, 2 (3), 201–206.
(5) Iyer, L. K.; Moorthy, B. S.; Topp, E. M. Photolytic Labeling to Probe Molecular Interactions
in Lyophilized Powders. Mol. Pharm. 2013, 10 (12), 4629–4639.
(6) Iyer, L. K.; Moorthy, B. S.; Topp, E. M. Photolytic Crosslinking to Probe Protein-Protein
and Protein-Matrix Interactions In Lyophilized Powders. Mol. Pharm. 2015, 12 (9), 3237–
3249.
(7) Suchanek, M.; Radzikowska, A.; Thiele, C. Photo-Leucine and Photo-Methionine Allow
Identification of Protein-Protein Interactions in Living Cells. Nat. Methods 2005, 2 (4),
261–267.
(8) Rao, S.; Horwitz, S. B.; Ringel, I. Direct Photoaffinity Labeling of Tubulin With Taxol.
JNCI J. Natl. Cancer Inst. 1992, 84 (10), 785–788.
(9) FLEET, G. W. J.; PORTER, R. R.; KNOWLES, J. R. Affinity Labelling of Antibodies with
Aryl Nitrene as Reactive Group. Nature 1969, 224, 511.
(10) Johnson, G. L.; MacAndrew, V. I.; Pilch, P. F. Identification of the Glucagon Receptor in
Rat Liver Membranes by Photoaffinity Crosslinking. Proc. Natl. Acad. Sci. 1981, 78 (2),
875 LP-878.
(11) Brodie, N. I.; Makepeace, K. A. T.; Petrotchenko, E. V; Borchers, C. H. Isotopically-Coded
Short-Range Hetero-Bifunctional Photo-Reactive Crosslinkers for Studying Protein
Structure. J. Proteomics 2015, 118 (Supplement C), 12–20.

129
(12) Chin, J. W.; Santoro, S. W.; Martin, A. B.; King, D. S.; Wang, L.; Schultz, P. G. Addition
of P-Azido-L-Phenylalanine to the Genetic Code of Escherichia Coli. J. Am. Chem. Soc.
2002, 124 (31), 9026–9027.
(13) Neberle, A.; de Graan, P. N. E. B. T.-M. in E. [11] General Principles for Photoaffinity
Labeling of Peptide Hormone Receptors. In Hormone Action Part I: Peptide Hormones;
Academic Press, 1985; Vol. 109, pp 129–156.
(14) Davies, M. J. Singlet Oxygen-Mediated Damage to Proteins and Its Consequences. Biochem.
Biophys. Res. Commun. 2003, 305 (3), 761–770.
(15) Leyva, E.; Platz, M. S.; Persy, G.; Wirz, J. Photochemistry of Phenyl Azide: The Role of
Singlet and Triplet Phenylnitrene as Transient Intermediates. J. Am. Chem. Soc. 1986, 108
(13), 3783–3790.
(16) Bergeron, R. J.; Dionis, J. B.; Ingeno, M. J. Synthesis of a Parabactin Photoaffinity Label.
J. Org. Chem. 1987, 52 (1), 144–149.
(17) L’abbe, G. Decomposition and Addition Reactions of Organic Azides. Chem. Rev. 1969, 69
(3), 345–363.
(18) Geurink, P. P.; Prely, L. M.; van der Marel, G. A.; Bischoff, R.; Overkleeft, H. S.
Photoaffinity Labeling in Activity-Based Protein Profiling BT - Activity-Based Protein
Profiling; Sieber, S. A., Ed.; Springer Berlin Heidelberg: Berlin, Heidelberg, 2012; pp 85–
113.
(19) Schwartz, M. A. Studying the Cytoskeleton by Label Transfer Crosslinking: Uses and
Limitations BT - Photochemical Probes in Biochemistry; Nielsen, P. E., Ed.; Springer
Netherlands: Dordrecht, 1989; pp 157–168.
(20) Buehler, C. A. Carbenes in Insertion and Addition Reactions. J. Chem. Educ. 1972, 49 (4),
239.
(21) Smith, E.; Collins, I. Photoaffinity Labeling in Target- and Binding-Site Identification.
Future Med. Chem. 2015, 7 (2), 159–183.
(22) Brunner, J.; Senn, H.; Richards, F. M. 3-Trifluoromethyl-3-Phenyldiazirine. A New
Carbene Generating Group for Photolabeling Reagents. J. Biol. Chem. 1980, 255 (8), 3313–
3318.
(23) Cowell, G. W.; Ledwith, A. Developments in the Chemistry of Diazo-Alkanes. Q. Rev.
Chem. Soc. 1970, 24 (1), 119–167.

130
(24) Kirmse, W. 100 Years of the Wolff Rearrangement. European J. Org. Chem. 2002, 2002
(14), 2193–2256.
(25) Louie, M. K.; Francisco, J. S.; Verdicchio, M.; Klippenstein, S. J.; Sinha, A. Hydrolysis of
Ketene Catalyzed by Formic Acid: Modification of Reaction Mechanism, Energetics, and
Kinetics with Organic Acid Catalysis. J. Phys. Chem. A 2015, 119 (19), 4347–4357.
(26) Dubinsky, L.; Krom, B. P.; Meijler, M. M. Diazirine Based Photoaffinity Labeling. Bioorg.
Med. Chem. 2012, 20 (2), 554–570.
(27) Chen, Y.; Topp, E. M. Quantitative Analysis of Peptide-Matrix Interactions in Lyophilized
Solids Using Photolytic Labeling. Mol. Pharm. 2018.
(28) Liu, M. T. H. The Thermolysis and Photolysis of Diazirines. Chem. Soc. Rev. 1982, 11 (2),
127–140.
(29) Das, J. Aliphatic Diazirines as Photoaffinity Probes for Proteins: Recent Developments.
Chem. Rev. 2011, 111 (8), 4405–4417.
(30) Sigrist, H.; Mühlemann, M.; Dolder, M. Philicity of Amino Acid Side-Chains for
Photogenerated Carbenes. J. Photochem. Photobiol. B Biol. 1990, 7 (2), 277–287.
(31) Farrell, I. S.; Toroney, R.; Hazen, J. L.; Mehl, R. A.; Chin, J. W. Photo-Cross-Linking
Interacting Proteins with a Genetically Encoded Benzophenone. Nat. Methods 2005, 2 (5),
377–384.
(32) Pettelkau, J.; Ihling, C. H.; Frohberg, P.; van Werven, L.; Jahn, O.; Sinz, A. Reliable
Identification of Cross-Linked Products in Protein Interaction Studies by 13C-Labeled p-
Benzoylphenylalanine. J. Am. Soc. Mass Spectrom. 2014, 25 (9), 1628–1641.
(33) Dorman, G.; Prestwich, G. D. Benzophenone Photophores in Biochemistry. Biochemistry
1994, 33 (19), 5661–5673.
(34) Jahn, O.; Eckart, K.; Brauns, O.; Tezval, H.; Spiess, J. The Binding Protein of Corticotropin-
Releasing Factor: Ligand-Binding Site and Subunit Structure. Proc. Natl. Acad. Sci. 2002,
99 (19), 12055 LP-12060.
(35) Kage, R.; Leeman, S. E.; Krause, J. E.; Costello, C. E.; Boyd, N. D. Identification of
Methionine as the Site of Covalent Attachment of a P-Benzoyl-Phenylalanine-Containing
Analogue of Substance P on the Substance P (NK-1) Receptor. J. Biol. Chem. 1996, 271
(42), 25797–25800.

131
(36) Angela, W.; E., T. B.; F., M. D.; Michael, R. Methionine Acts as a “Magnet” in
Photoaffinity Crosslinking Experiments. FEBS Lett. 2006, 580 (7), 1872–1876.
(37) D., P. G.; György, D.; T., E. J.; M., M. D.; Anu, C. Benzophenone Photoprobes for
Phosphoinositides, Peptides and Drugs. Photochem. Photobiol. 2008, 65 (2), 222–234.
(38) Zhao, W.-Q.; Santini, F.; Breese, R.; Ross, D.; Zhang, X. D.; Stone, D. J.; Ferrer, M.;
Townsend, M.; Wolfe, A. L.; Seager, M. A.; et al. Inhibition of Calcineurin-Mediated
Endocytosis and α-Amino-3-Hydroxy-5-Methyl-4-Isoxazolepropionic Acid (AMPA)
Receptors Prevents Amyloid β Oligomer-Induced Synaptic Disruption. J. Biol. Chem. 2010,
285 (10), 7619–7632.
(39) Soutourina, J.; Wydau, S.; Ambroise, Y.; Boschiero, C.; Werner, M. Direct Interaction of
RNA Polymerase II and Mediator Required for Transcription in Vivo. Science (80-. ). 2011,
331 (6023), 1451 LP-1454.
(40) Kleiner, R. E.; Hang, L. E.; Molloy, K. R.; Chait, B. T.; Kapoor, T. M. A Chemical
Proteomics Approach to Reveal Direct Protein-Protein Interactions in Living Cells. Cell
Chem. Biol. 2018, 25 (1), 110–120.e3.
(41) Yang, T.; Li, X.-M.; Bao, X.; Fung, Y. M. E.; Li, X. D. Photo-Lysine Captures Proteins
That Bind Lysine Post-Translational Modifications. Nat. Chem. Biol. 2016, 12 (2), 70–72.
(42) Yanagisawa, T.; Hino, N.; Iraha, F.; Mukai, T.; Sakamoto, K.; Yokoyama, S. Wide-Range
Protein Photo-Crosslinking Achieved by a Genetically Encoded N?-
(Benzyloxycarbonyl)Lysine Derivative with a Diazirinyl Moiety. Mol. Biosyst. 2012, 8 (4),
1131–1135.
(43) Lee, H. S.; Dimla, R. D.; Schultz, P. G. Protein-DNA Photo-Crosslinking with a Genetically
Encoded Benzophenone-Containing Amino Acid. Bioorg. Med. Chem. Lett. 2009, 19 (17),
5222–5224.
(44) M., T. E.; Wenshe, L.; Daniel, S.; V., M. A.; G., S. P. A Genetically Encoded Diazirine
Photocrosslinker in Escherichia Coli. ChemBioChem 2007, 8 (18), 2210–2214.
(45) Hopkins, A. L. Network Pharmacology: The next Paradigm in Drug Discovery. Nat. Chem.
Biol. 2008, 4 (11), 682–690.
(46) Keiser, M. J.; Setola, V.; Irwin, J. J.; Laggner, C.; Abbas, A. I.; Hufeisen, S. J.; Jensen, N.
H.; Kuijer, M. B.; Matos, R. C.; Tran, T. B.; et al. Predicting New Molecular Targets for
Known Drugs. Nature 2009, 462, 175.

132
(47) Kantarjian, H.; Shah, N. P.; Hochhaus, A.; Cortes, J.; Shah, S.; Ayala, M.; Moiraghi, B.;
Shen, Z.; Mayer, J.; Pasquini, R.; et al. Dasatinib versus Imatinib in Newly Diagnosed
Chronic-Phase Chronic Myeloid Leukemia. N. Engl. J. Med. 2010, 362 (24), 2260–2270.
(48) Shi, H.; Zhang, C.-J.; Chen, G. Y. J.; Yao, S. Q. Cell-Based Proteome Profiling of Potential
Dasatinib Targets by Use of Affinity-Based Probes. J. Am. Chem. Soc. 2012, 134 (6), 3001–
3014.
(49) Su, Y.; Pan, S.; Li, Z.; Li, L.; Wu, X.; Hao, P.; Sze, S. K.; Yao, S. Q. Multiplex Imaging
and Cellular Target Identification of Kinase Inhibitors via an Affinity-Based Proteome
Profiling Approach. Sci. Rep. 2015, 5, 7724.
(50) de Gasparo, M.; Catt, K. J.; Inagami, T.; Wright, J. W.; Unger, T. International Union of
Pharmacology. XXIII. The Angiotensin II Receptors. Pharmacol. Rev. 2000, 52 (3), 415
LP-472.
(51) Bernier, S. G.; Bellemare, J. M. L.; Escher, E.; Guillemette, G. Characterization of AT4
Receptor from Bovine Aortic Endothelium with Photosensitive Analogues of Angiotensin
IV. Biochemistry 1998, 37 (12), 4280–4287.
(52) Vila-Perelló, M.; Pratt, M. R.; Tulin, F.; Muir, T. W. Covalent Capture of Phospho-
Dependent Protein Oligomerization by Site-Specific Incorporation of a Diazirine Photo-
Cross-Linker. J. Am. Chem. Soc. 2007, 129 (26), 8068–8069.
(53) Preston, G. W.; Radford, S. E.; Ashcroft, A. E.; Wilson, A. J. Analysis of Amyloid
Nanostructures Using Photo-Cross-Linking: In Situ Comparison of Three Widely Used
Photo-Cross-Linkers. ACS Chem. Biol. 2014, 9 (3), 761–768.
(54) Wang, W. Lyophilization and Development of Solid Protein Pharmaceuticals. Int. J. Pharm.
2000, 203 (1), 1–60.
(55) Carpenter, J. F.; Pikal, M. J.; Chang, B. S.; Randolph, T. W. Rational Design of Stable
Lyophilized Protein Formulations: Some Practical Advice. Pharm. Res. 1997, 14 (8), 969–
975.
(56) Harris, R.; Shire, S.; Winter, C. Commercial Manufacturing Scale Formulation and
Analytical Characterization of Therapeutic Recombinant Antibodies; 2004; Vol. 61.
(57) Akers, M. J. Excipient–Drug Interactions in Parenteral Formulations. J. Pharm. Sci. 2002,
91 (11), 2283–2300.

133
(58) Ohtake, S.; Kita, Y.; Arakawa, T. Interactions of Formulation Excipients with Proteins in
Solution and in the Dried State. Adv. Drug Deliv. Rev. 2011, 63 (13), 1053–1073.
(59) Moorthy, B. S.; Zarraga, I. E.; Kumar, L.; Walters, B. T.; Goldbach, P.; Topp, E. M.;
Allmendinger, A. Solid-State Hydrogen–Deuterium Exchange Mass Spectrometry:
Correlation of Deuterium Uptake and Long-Term Stability of Lyophilized Monoclonal
Antibody Formulations. Mol. Pharm. 2018, 15 (1), 1–11.
(60) Iyer, L. K.; Sacha, G. A.; Moorthy, B. S.; Nail, S. L.; Topp, E. M. Process and Formulation
Effects on Protein Structure in Lyophilized Solids Using Mass Spectrometric Methods. J.
Pharm. Sci. 2016, 105 (5), 1684–1692.
(61) Costantino, H. R.; Carrasquillo, K. G.; Cordero, R. A.; Mumenthaler, M.; Hsu, C. C.;
Griebenow, K. Effect of Excipients on the Stability and Structure of Lyophilized
Recombinant Human Growth Hormone. J. Pharm. Sci. 1998, 87 (11), 1412–1420.
(62) Hawe, A.; Friess, W. Formulation Development for Hydrophobic Therapeutic Proteins.
Pharm. Dev. Technol. 2007, 12 (3), 223–237.
(63) Cleland, J. L.; Lam, X.; Kendrick, B.; Yang, J.; Yang, T. H.; Overcashier, D.; Brooks, D.;
Hsu, C.; Carpenter, J. F. A Specific Molar Ratio of Stabilizer to Protein Is Required for
Storage Stability of a Lyophilized Monoclonal Antibody. J. Pharm. Sci. 2001, 90 (3), 310–
321.
(64) Chang, L. L.; Shepherd, D.; Sun, J.; Ouellette, D.; Grant, K. L.; Tang, X. C.; Pikal, M. J.
Mechanism of Protein Stabilization by Sugars during Freeze-Drying and Storage: Native
Structure Preservation, Specific Interaction, and/or Immobilization in a Glassy Matrix? J.
Pharm. Sci. 2005, 94 (7), 1427–1444.
(65) Grasmeijer, N.; Stankovic, M.; de Waard, H.; Frijlink, H. W.; Hinrichs, W. L. J. Unraveling
Protein Stabilization Mechanisms: Vitrification and Water Replacement in a Glass
Transition Temperature Controlled System. Biochim. Biophys. Acta 2013, 1834 (4), 763–
769.
(66) Costantino, H. R.; Langer, R.; Klibanov, A. M. Moisture-Induced Aggregation of
Lyophilized Insulin. Pharm. Res. 1994, 11 (1), 21–29.
(67) Costantino, H. R.; Langer, R.; Klibanov, A. M. Aggregation of a Lyophilized
Pharmaceutical Protein, Recombinant Human Albumin: Effect of Moisture and
Stabilization by Excipients. Biotechnology. (N. Y). 1995, 13 (5), 493–496.

134
(68) Chesnut, C. H.; Silverman, S.; Andriano, K.; Genant, H.; Gimona, A.; Harris, S.; Kiel, D.;
LeBoff, M.; Maricic, M.; Miller, P.; et al. A Randomized Trial of Nasal Spray Salmon
Calcitonin in Postmenopausal Women with Established Osteoporosis: The Prevent
Recurrence of Osteoporotic Fractures Study. Am. J. Med. 2000, 109 (4), 267–276.
(69) Simperler, A.; Kornherr, A.; Chopra, R.; Bonnet, P. A.; Jones, W.; Motherwell, W. D. S.;
Zifferer, G. Glass Transition Temperature of Glucose, Sucrose, and Trehalose: An
Experimental and in Silico Study. J. Phys. Chem. B 2006, 110 (39), 19678–19684.
(70) Izutsu, K.; Kadoya, S.; Yomota, C.; Kawanishi, T.; Yonemochi, E.; Terada, K. Freeze-
Drying of Proteins in Glass Solids Formed by Basic Amino Acids and Dicarboxylic Acids.
Chem. Pharm. Bull. (Tokyo). 2009, 57 (1), 43–48.
(71) Chen, B.; Bautista, R.; Yu, K.; Zapata, G. A.; Mulkerrin, M. G.; Chamow, S. M. Influence
of Histidine on the Stability and Physical Properties of a Fully Human Antibody in Aqueous
and Solid Forms. Pharm. Res. 2003, 20 (12), 1952–1960.
(72) Tian, F.; Middaugh, C. R.; Offerdahl, T.; Munson, E.; Sane, S.; Rytting, J. H. Spectroscopic
Evaluation of the Stabilization of Humanized Monoclonal Antibodies in Amino Acid
Formulations. Int. J. Pharm. 2007, 335 (1), 20–31.
(73) Werstiuk, N. H.; Casal, H. L.; Scaiano, J. C. Reaction of Diphenylcarbene with Oxygen: A
Laser Flash Photolysis Study. Can. J. Chem. 1984, 62 (11), 2391–2392.
(74) Tomioka, H. Reactions of Carbenes in Solidified Organic Molecules at Low Temperature.
Res. Chem. Intermed. 1994, 20 (6), 605–634.
(75) Andreotti, G.; Mendez, B. L.; Amodeo, P.; Morelli, M. A. C.; Nakamuta, H.; Motta, A.
Structural Determinants of Salmon Calcitonin Bioactivity: The Role of the Leu-Based
Amphipathic Alpha-Helix. J. Biol. Chem. 2006, 281 (34), 24193–24203.
(76) J., S. S.; Zahra, S.; Jun, L. Challenges in the Development of High Protein Concentration
Formulations. J. Pharm. Sci. 2004, 93 (6), 1390–1402.
(77) Frokjaer, S.; Otzen, D. E. Protein Drug Stability: A Formulation Challenge. Nat. Rev. Drug
Discov. 2005, 4 (4), 298–306.
(78) Jennings, T. A. Lyophilization: Introduction and Basic Principles; CrC Press, 1999.

135
(79) Chang, L. (Lucy); Shepherd, D.; Sun, J.; Tang, X. (Charlie); Pikal, M. J. Effect of Sorbitol
and Residual Moisture on the Stability of Lyophilized Antibodies: Implications for the
Mechanism of Protein Stabilization in the Solid State. J. Pharm. Sci. 2005, 94 (7), 1445–
1455.
(80) Daukas, L. A.; Trappler, E. H. Assessing the Quality of Lyophilized Parenterals. Pharm.
Cosmet. Qual. 1998, 2, 21–25.
(81) Ahlneck, C.; Zografi, G. The Molecular Basis of Moisture Effects on the Physical and
Chemical Stability of Drugs in the Solid State. Int. J. Pharm. 1990, 62 (2), 87–95.
(82) Costantino, H. R.; Langer, R.; Klibanov, A. M. Solid‐ phase Aggregation of Proteins under
Pharmaceutically Relevant Conditions. J. Pharm. Sci. 1994, 83 (12), 1662–1669.
(83) Luner, P. E.; Seyer, J. J. Assessment of Crystallinity in Processed Sucrose by Near-Infrared
Spectroscopy and Application to Lyophiles. J. Pharm. Sci. 2014, 103 (9), 2884–2895.
(84) Singh, S. K. Sucrose and Trehalose in Therapeutic Protein Formulations BT - Challenges
in Protein Product Development; Warne, N. W., Mahler, H.-C., Eds.; Springer International
Publishing: Cham, 2018; pp 63–95.
(85) Carpenter, J. F.; Chang, B. S.; Garzon-Rodriguez, W.; Randolph, T. W. Rational Design of
Stable Lyophilized Protein Formulations: Theory and Practice. In Rational design of stable
protein formulations; Springer, 2002; pp 109–133.
(86) Wang, D. Q. Formulation Characterization. In Freeze-Drying/Lyophilization of
Pharmaceutical and Biological Products, Third Edition; CRC Press, 2016; pp 245–265.
(87) Breen, E. D.; Curley, J. G.; Overcashier, D. E.; Hsu, C. C.; Shire, S. J. Effect of Moisture
on the Stability of a Lyophilized Humanized Monoclonal Antibody Formulation. Pharm.
Res. 2001, 18 (9), 1345–1353.
(88) Hancock, B. C.; Zografi, G. The Relationship Between the Glass Transition Temperature
and the Water Content of Amorphous Pharmaceutical Solids. Pharm. Res. 1994, 11 (4),
471–477.
(89) Pikal, M. J. Freeze-Drying of Proteins. In Formulation and Delivery of Proteins and
Peptides; ACS Symposium Series; American Chemical Society, 1994; Vol. 567, pp 120-
133 SE – 8.

136
(90) Costantino, H. R.; Curley, J. G.; Wu, S.; Hsu, C. C. Water Sorption Behavior of Lyophilized
Protein–Sugar Systems and Implications for Solid-State Interactions. Int. J. Pharm. 1998,
166 (2), 211–221.
(91) Cicerone, M. T.; Douglas, J. F. [Small Beta]-Relaxation Governs Protein Stability in Sugar-
Glass Matrices. Soft Matter 2012, 8 (10), 2983–2991.
(92) Sophocleous, A. M.; Zhang, J.; Topp, E. M. Localized Hydration in Lyophilized Myoglobin
by Hydrogen–Deuterium Exchange Mass Spectrometry. 1. Exchange Mapping. Mol. Pharm.
2012, 9 (4), 718–726.
(93) Zhou, D. H.; Shah, G.; Mullen, C.; Sandoz, D.; Rienstra, C. M. Proton‐ Detected Solid‐
State NMR Spectroscopy of Natural‐ Abundance Peptide and Protein Pharmaceuticals.
Angew. Chemie Int. Ed. 2009, 48 (7), 1253–1256.
(94) Pikal, M. J.; Rigsbee, D.; Roy, M. L. Solid State Stability of Proteins III: Calorimetric (DSC)
and Spectroscopic (FTIR) Characterization of Thermal Denaturation in Freeze Dried
Human Growth Hormone (HGH). J. Pharm. Sci. 2008, 97 (12), 5122–5131.
(95) Greenspan, L. Humidity Fixed Points of Binary Saturated Aqueous Solutions; 1977; Vol.
81A.
(96) Izutsu, K.-I.; Fujimaki, Y.; Kuwabara, A.; Aoyagi, N. Effect of Counterions on the Physical
Properties of L-Arginine in Frozen Solutions and Freeze-Dried Solids. Int. J. Pharm. 2005,
301 (1), 161–169.
(97) Hill, J. J.; Shalaev, E. Y.; Zografi, G. Thermodynamic and Dynamic Factors Involved in the
Stability of Native Protein Structure in Amorphous Solids in Relation to Levels of
Hydration. J. Pharm. Sci. 2005, 94 (8), 1636–1667.
(98) Carpenter, J. F.; Crowe, J. H. An Infrared Spectroscopic Study of the Interactions of
Carbohydrates with Dried Proteins. Biochemistry 1989, 28 (9), 3916–3922.
(99) Arsiccio, A.; Pisano, R. Water Entrapment and Structure Ordering as Protection
Mechanisms for Protein Structural Preservation. J. Chem. Phys. 2018, 148 (5), 55102.
(100) Fedorov, M. V; Goodman, J. M.; Nerukh, D.; Schumm, S. Self-Assembly of Trehalose
Molecules on a Lysozyme Surface: The Broken Glass Hypothesis. Phys. Chem. Chem. Phys.
2011, 13 (6), 2294–2299.
137
(101) Giuffrida, L. C. and G. C. and S. Role of Residual Water Hydrogen Bonding in
Sugar/Water/Biomolecule Systems: A Possible Explanation for Trehalose Peculiarity. J.
Phys. Condens. Matter 2007, 19 (20), 205110.
(102) Oksanen, C. A.; Zografi, G. The Relationship Between the Glass Transition Temperature
and Water Vapor Absorption by Poly(Vinylpyrrolidone). Pharm. Res. 1990, 7 (6), 654–657.
(103) Shalaev, E. Y.; Zografi, G. How Does Residual Water Affect the Solid‐ state Degradation
of Drugs in the Amorphous State? J. Pharm. Sci. 1996, 85 (11), 1137–1141.
(104) Frauenfelder, H.; Chen, G.; Berendzen, J.; Fenimore, P. W.; Jansson, H.; McMahon, B. H.;
Stroe, I. R.; Swenson, J.; Young, R. D. A Unified Model of Protein Dynamics. Proc. Natl.
Acad. Sci. 2009, 106 (13), 5129 LP-5134.
(105) Fenimore, P. W.; Frauenfelder, H.; McMahon, B. H.; Young, R. D. Bulk-Solvent and
Hydration-Shell Fluctuations, Similar to α- and β-Fluctuations in Glasses, Control Protein
Motions and Functions. Proc. Natl. Acad. Sci. U. S. A. 2004, 101 (40), 14408 LP-14413.
(106) Tarek, M.; Tobias, D. J. The Dynamics of Protein Hydration Water: A Quantitative
Comparison of Molecular Dynamics Simulations and Neutron-Scattering Experiments.
Biophys. J. 2000, 79 (6), 3244–3257.
(107) Towns, J. K. Moisture Content in Proteins: Its Effects and Measurement. J. Chromatogr. A
1995, 705 (1), 115–127.
(108) Ahern, T. J. Chemical and Physical Pathways of Protein Degradation; Plenum, 1992.
(109) Chang, L. (Lucy); Pikal, M. J. Mechanisms of Protein Stabilization in the Solid State. J.
Pharm. Sci. 2009, 98 (9), 2886–2908.
(110) Kamerzell, T. J.; Esfandiary, R.; Joshi, S. B.; Middaugh, C. R.; Volkin, D. B. Protein-
Excipient Interactions: Mechanisms and Biophysical Characterization Applied to Protein
Formulation Development. Adv. Drug Deliv. Rev. 2011, 63 (13), 1118–1159.
(111) Andya, J. D.; Hsu, C. C.; Shire, S. J. Mechanisms of Aggregate Formation and Carbohydrate
Excipient Stabilization of Lyophilized Humanized Monoclonal Antibody Formulations.
AAPS PharmSci 2015, 5 (2), 21.
(112) Wen, Z. Raman Spectroscopy of Protein Pharmaceuticals. J. Pharm. Sci. 2007, 96 (11),
2861–2878.

138
(113) Stradner, A.; Sedgwick, H.; Cardinaux, F.; Poon, W. C. K.; Egelhaaf, S. U.; Schurtenberger,
P. Equilibrium Cluster Formation in Concentrated Protein Solutions and Colloids. Nature
2004, 432, 492.
(114) U., S. S.; Rita, W.; C., H. C. Raman Spectroscopic Characterization of Drying-Induced
Structural Changes in a Therapeutic Antibody: Correlating Structural Changes with Long-
Term Stability. J. Pharm. Sci. 2004, 93 (4), 1005–1018.
(115) Sinz, A. Chemical Cross‐ linking and Mass Spectrometry to Map Three‐ dimensional
Protein Structures and Protein–Protein Interactions. Mass Spectrom. Rev. 2006, 25 (4), 663–
682.
(116) Chen, Y.; Topp, E. M. Photolytic Labeling and Its Applications in Protein Drug Discovery
and Development. J. Pharm. Sci. 2018.
(117) Salisbury, C. M.; Cravatt, B. F. Activity-Based Probes for Proteomic Profiling of Histone
Deacetylase Complexes. Proc. Natl. Acad. Sci. 2007, 104 (4), 1171 LP-1176.
(118) Dormán, G.; Prestwich, G. D. Using Photolabile Ligands in Drug Discovery and
Development. Trends Biotechnol. 2000, 18 (2), 64–77.
(119) Tanaka, Y.; Bond, M. R.; Kohler, J. J. Photocrosslinkers Illuminate Interactions in Living
Cells. Mol. Biosyst. 2008, 4 (6), 473–480.
(120) Chesnut, C. H.; Azria, M.; Silverman, S.; Engelhardt, M.; Olson, M.; Mindeholm, L.
Salmon Calcitonin: A Review of Current and Future Therapeutic Indications. Osteoporos.
Int. 2008, 19 (4), 479–491.
(121) Cline, G. W.; Hanna, S. B. Kinetics and Mechanisms of the Aminolysis of N-
Hydroxysuccinimide Esters in Aqueous Buffers. J. Org. Chem. 1988, 53 (15), 3583–3586.
(122) Tanaka, Y.; Kohler, J. J. Photoactivatable Crosslinking Sugars for Capturing Glycoprotein
Interactions. J. Am. Chem. Soc. 2008, 130 (11), 3278–3279.
(123) Altman, R. B.; Terry, D. S.; Zhou, Z.; Zheng, Q.; Geggier, P.; Kolster, R. A.; Zhao, Y.;
Javitch, J. A.; Warren, J. D.; Blanchard, S. C. Cyanine Fluorophore Derivatives with
Enhanced Photostability. Nat. Methods 2011, 9, 68.
(124) Dai, Q.; Walkey, C.; Chan, W. C. W. Polyethylene Glycol Backfilling Mitigates the
Negative Impact of the Protein Corona on Nanoparticle Cell Targeting. Angew. Chemie Int.
Ed. 2014, 53 (20), 5093–5096.

139
(125) Erba, E. B.; Klein, P. A.; Signor, L. Combining a NHS Ester and Glutaraldehyde Improves
Crosslinking Prior to MALDI MS Analysis of Intact Protein Complexes. J. Mass Spectrom.
2015, 50 (10), 1114–1119.
(126) Lee, J. H.; Hoover, T. R. Protein Crosslinking Studies Suggest That Rhizobium Meliloti
C4-Dicarboxylic Acid Transport Protein D, a Sigma 54-Dependent Transcriptional
Activator, Interacts with Sigma 54 and the Beta Subunit of RNA Polymerase. Proc. Natl.
Acad. Sci. 1995, 92 (21), 9702 LP-9706.
(127) Chan, H.; Clark, A. R.; Feeley, J. C.; Kuo, M.; Lehrman, S. R.; Pikal‐ Cleland, K.; Miller,
D. P.; Vehring, R.; Lechuga‐ Ballesteros, D. Physical Stability of Salmon Calcitonin
Spray‐ dried Powders for Inhalation. J. Pharm. Sci. 2004, 93 (3), 792–804.
(128) Yang, M.; Velaga, S.; Yamamoto, H.; Takeuchi, H.; Kawashima, Y.; Hovgaard, L.; van de
Weert, M.; Frokjaer, S. Characterisation of Salmon Calcitonin in Spray-Dried Powder for
Inhalation: Effect of Chitosan. Int. J. Pharm. 2007, 331 (2), 176–181.
(129) Henchoz, Y.; Schappler, J.; Geiser, L.; Prat, J.; Carrupt, P.-A.; Veuthey, J.-L. Rapid
Determination of PKa Values of 20 Amino Acids by CZE with UV and Capacitively
Coupled Contactless Conductivity Detections. Anal. Bioanal. Chem. 2007, 389 (6), 1869–
1878.
(130) Isom, D. G.; Castaneda, C. A.; Cannon, B. R.; Garcia-Moreno, B. Large Shifts in PKa
Values of Lysine Residues Buried inside a Protein. Proc. Natl. Acad. Sci. U. S. A. 2011, 108
(13), 5260–5265.
(131) Grimsley, G. R.; Scholtz, J. M.; Pace, C. N. A Summary of the Measured PK Values of the
Ionizable Groups in Folded Proteins. Protein Sci. 2009, 18 (1), 247–251.
(132) Gekko, K.; Timasheff, S. N. Mechanism of Protein Stabilization by Glycerol: Preferential
Hydration in Glycerol-Water Mixtures. Biochemistry 1981, 20 (16), 4667–4676.
(133) Wang, W. Instability, Stabilization, and Formulation of Liquid Protein Pharmaceuticals. Int.
J. Pharm. 1999, 185 (2), 129–188.
(134) Moorthy, B. S.; Schultz, S. G.; Kim, S. G.; Topp, E. M. Predicting Protein Aggregation
during Storage in Lyophilized Solids Using Solid State Amide Hydrogen/Deuterium
Exchange with Mass Spectrometric Analysis (SsHDX-MS). Mol. Pharm. 2014, 11 (6),
1869–1879.

140
(135) Farrance, I.; Frenkel, R. Uncertainty of Measurement: A Review of the Rules for
Calculating Uncertainty Components through Functional Relationships. Clin. Biochem. Rev.
2012, 33 (2), 49–75.

141
VITA
Yuan Chen
Education
08/2014 – 03/2019 Ph.D. in Pharmaceutical Sciences
Department of Industrial and Physical Pharmacy, Purdue University
West Lafayette, IN
Advisor: Prof. Elizabeth Topp
05/2014 M.S. in Chemistry
Department of Chemistry, SUNY Stony Brook University
Stony Brook, NY
Advisor: Prof. Daniel Raleigh
06/2012 B.S. in Pharmaceutical Sciences
Sun Yat-sen University, Guangdong, China
Research Experience
07/2015 – 03/2019 Research Assistant, Purdue University
Thesis: Photolytic Labeling to Probe Peptide-matrix Interactions in Lyophilized Solids
Project 1 Identify and quantify peptide-matrix interactions in lyophilized solids of peptide
formulations
- Designed and chemically modified a model peptide for formulation study
- Prepared solution and lyophilized peptide formulations for photo-reaction
- Characterized reaction products from peptides with LC-MS and rp-HPLC
Project 2 Evaluate the effect of increasing bulk moisture on the local environment near the
peptide in lyophilized solids
- Designed and prepared lyophilized formulations for the moisture study
- Quantitatively analyzed reaction products to examine the effects of moisture change on the local
environment near the peptide in the lyophilized formulations
Project 3 Use photo-reactive excipients to study peptide-matrix interactions
- Designed photo-reactive excipients and prepared lyophilized formulations
- Identified and quantified the photo-reaction products to analyze the excipient effects on peptide-
matrix interactions
10/2014 – 07/2015 Research Assistant, Purdue University
Explore new methods for protein aggregate quantitation
- Defined the detection range of nanoparticle tracking analysis (NTA) by analyzing size and
concentration of NIST standard particles and protein aggregates
- Received training of analytical ultracentrifuge (AUC) to characterize proteins

142
01/2013 – 05/2014 Research Assistant, SUNY Stony Brook University
Evaluate the effect of small molecules on the fibrillation of Islet Amyloid Polypeptide (IAPP)
- Prepared IAPP and its peptide analogues with solid-phase peptide synthesis
- Studied the fibrillation mechanism of IAPP with fluorescence chromatography
- Explored the mechanism of the interactions between IAPP fibril and small molecules with
computation modeling
07/2010 – 05/2012 Undergraduate Research Assistant, Sun Yat-sen University
Synthesis of small molecules and their bio-activity evaluation
- Designed, synthesized and evaluate antibacterial activity of indole derivatives
- Designed, synthesized and evaluate the activity of curcumin analogues against Alzheimer’s
Disease
Internship Experience
06/2017 – 08/2017 Intern, Formulation and Drug Product Sciences, Seattle Genetics Inc
- Assisted in the development of solution and lyophilized formulations of ADC products
- Conducted stability studies of ADC formulations and analyzed the degradation products with
various biophysical analysis methods
Other Related Experience Course Work
Principles of Pharmacokinetics; Advanced Biopharmaceutics; Physical Chemistry Principles;
Pharmaceutical Manufacturing; Statistical Methods; Chemical Aspects of Mass Spectrometry.
TA Experience
09/2014 – 12/2014 Teaching Assistant, Purdue University
- Organized and graded exams for the course “Biotech and Advanced Parenterals”
Publication and Selected Poster Presentation - Chen, Y.; Topp, E. M. Quantitative Analysis of Peptide-Matrix Interactions in Lyophilized Solids
Using Photolytic Labeling. Mol. Pharm. 2018. 15 (7), 2797–2806.
- Chen, Y.; Topp, E. M. Photolytic Labeling and Its Applications in Protein Drug Discovery and
Development. J Pharm Sci. 2019. 108 (2):791-797.
- Chen, Y.; Topp, E. M. Photolytic Labeling to Quantify Peptide-Water Interactions in Lyophilized
solids. Mol. Pharm. 2019. 6 (3), 1053–1064.
- Chen, Y.; Topp, E. M. A Novel Photo-Reactive Excipient to Probe Peptide-Matrix Interactions
in Lyophilized Solids. (Submitted to J. Pharm. Sci. in Jan. 2019)
- Book Chapter: High Resolution Mass Spectrometric Methods for Proteins in Lyophilized Solids
(Published)
- Chen, S.-Y.; Chen, Y.; Li, Y.-P.; Chen, S.-H.; Tan, J.-H.; Ou, T.-M.; Gu, L.-Q.; Huang, Z.-S.
Design, Synthesis, and Biological Evaluation of Curcumin Analogues as Multifunctional Agents
for the Treatment of Alzheimer’s Disease. Bioorg. Med. Chem. 2011, 19 (18), 5596–5604.

143
- “Quantitative Analysis of Peptide-Matrix Interactions in Lyophilized Solids Using Photolytic
Labeling”
Conference of International Society of Lyophilization – Freeze Drying, Inc. (ISL-FD) (April 2018
in Chicago)
- “Use Photolytic Cross-Linking to Explore the Effect of Humidity on Lyophilized Solid at
Molecular Level”
AAPS Annual Meeting and Exposition (November 2017 in San Diego)
- “Use Photolytic Cross-Linking to Probe Peptide-Excipient Interactions in Solution and
Lyophilized Solid”
AAPS National Biotechnology Conference (May 2017 in San Diego)
- “Use Photolytic Cross-Linking to Probe Peptide Interactions in Solution and Lyophilized
Formulations”
AAPS Annual Meeting and Exposition (November 2016 in Denver)
- “Use Photolytic Cross-Linking to Probe Peptide Interactions in Solution and Lyophilized
Formulations”
Jenkins-Knevel Graduate Student Research Symposium (November 2016 at Purdue University)
- “Application of NTA in Characterization of Subvisible Particles in Protein Drug Products”
Pharmaceutics Graduate Student Research Meeting (2015 at University of Kentucky)
Experimental Skills - Protein/peptide analysis with HPLC, UPLC, LC-MS, iCIEF, SEC, AUC, UV and nanoparticle
tracking analysis (NTA); basic operation of freeze dryer (Millrock REVO, LyoStar 3); DSC; Karl
Fischer titration; solid-phase peptide synthesis; data analysis with Origin, Prism, SAS; basic
computer skills with Microsoft Office.
Award - 2017 AAPS Travelship (November 2017 in San Diego)
- 2017 AAPS Analysis and Pharmaceutical Quality (APQ) Section Travelship (May 2017 in San
Diego)
Professional Membership 09/2014 – present AAPS Member