Photoinduced work function changes by isomerization of a densely packed azobenzene-based SAM on Au:...
9
14302 Phys. Chem. Chem. Phys., 2011, 13, 14302–14310 This journal is c the Owner Societies 2011 Cite this: Phys. Chem. Chem. Phys., 2011, 13, 14302–14310 Photoinduced work function changes by isomerization of a densely packed azobenzene-based SAM on Au: a joint experimental and theoretical study N. Crivillers, a A. Liscio, b F. Di Stasio, c C. Van Dyck, d S. Osella, d D. Cornil, d S. Mian, c G. M. Lazzerini, c O. Fenwick, c E. Orgiu, a F. Reinders, e S. Braun, f M. Fahlman, f M. Mayor,* eg J. Cornil,* d V. Palermo,* b F. Cacialli* c and P. Samorı`* a Received 21st March 2011, Accepted 13th May 2011 DOI: 10.1039/c1cp20851a Responsive monolayers are key building blocks for future applications in organic and molecular electronics in particular because they hold potential for tuning the physico-chemical properties of interfaces, including their energetics. Here we study a photochromic SAM based on a conjugated azobenzene derivative and its influence on the gold work function (F Au ) when chemisorbed on its surface. In particular we show that the F Au can be modulated with external stimuli by controlling the azobenzene trans/cis isomerization process. This phenomenon is characterized experimentally by four different techniques, kelvin probe, kelvin probe force microscopy, electroabsorption spectroscopy and ultraviolet photoelectron spectroscopy. The use of different techniques implies exposing the SAM to different measurement conditions and different preparation methods, which, remarkably, do not alter the observed work function change (F trans –F cis ). Theoretical calculations provided a complementary insight crucial to attain a deeper knowledge on the origin of the work function photo-modulation. 1. Introduction Self-assembled monolayers (SAMs) are highly ordered supra- molecular arrays of functional molecules that can be easily processed on specific surfaces via chemisorption. 1 SAMs are technologically important as they can be incorporated in devices for a wide range of applications such as sensors, 2 memory devices 3 and organic thin-film transistors. 4 From a fundamental viewpoint, SAMs offer a unique and tunable combination of physical properties that render them prototypical systems for various studies in the realm of interfacial chemistry and more generally self-organization. 5 An appropriate design of the molecules that will self-organize on a substrate is crucial to confer a specific functionality to the resulting modified surface. Among various tunable functions of a SAM, the electronic work function (F) of metallic contacts is very important for optimizing charge injection and extraction in electronic devices and hence their performance. 6 In general, the presence of an interfacial dipole associated with the molecular monolayer at the metal/semiconductor interfaces has been identified as the main contribution to the work function tuning of metallic contacts. 7 Since the surface of an electrode can be decorated with arrays of responsive molecules, the design of switchable SAMs, i.e. monolayers able to undergo significant changes in their physical or chemical properties as a result of external stimuli, is of particular interest for the fabrication of smart surfaces and interfaces. 8 Among photochromic systems, azobenzenes are known to undergo a well-defined isomerization from the trans to the cis conformation around the N Q N double bond, in response to an external stimulus such as UV light and vice versa if exposed to visible light or heating. 9 These two forms feature different physico-chemical properties 10 that when self-assembled into monolayers emerge as different wettability, 11 conductance 12 or dipole moment. 13 Accordingly, azobenzenes have been used a ISIS—CNRS 7006, Universite´ de Strasbourg, 8 alle ´e Gaspard Monge, 67000 Strasbourg, France. E-mail: [email protected] b ISOF-CNR, via Gobetti 101, 40129 Bologna, Italy. E-mail: [email protected] c Department of Physics and Astronomy and London Centre for Nanotechnology, University College London, Gower Street, London WC1E 6BT, England. E-mail: [email protected] d Laboratory for Chemistry of Novel Materials, University of Mons, 20 Place du Parc, B-7000 Mons, Belgium. E-mail: [email protected] e Department of Chemistry, University of Basel, St. Johannsring 19, 4056 Basel, Switzerland. E-mail: [email protected] f Department of Physics, Chemistry and Biology, Linko ¨ping University, 581 83 Linko ¨ping, Sweden g Karlsruhe Institute of Technology KIT, Institute for Nanotechnology, P.O. Box 3640, 76021 Karlsruhe, Germany PCCP Dynamic Article Links www.rsc.org/pccp PAPER Published on 22 June 2011. Downloaded by University College London on 14/12/2013 12:16:45. View Article Online / Journal Homepage / Table of Contents for this issue
-
Upload
independent -
Category
Documents
-
view
0 -
download
0
Transcript of Photoinduced work function changes by isomerization of a densely packed azobenzene-based SAM on Au:...

14302 Phys. Chem. Chem. Phys., 2011, 13, 14302–14310 This journal is c the Owner Societies 2011
Cite this: Phys. Chem. Chem. Phys., 2011, 13, 14302–14310
Photoinduced work function changes by isomerization of a densely
packed azobenzene-based SAM on Au: a joint experimental and
theoretical study
N. Crivillers,a A. Liscio,b F. Di Stasio,c C. Van Dyck,d S. Osella,d D. Cornil,d
S. Mian,cG. M. Lazzerini,
cO. Fenwick,
cE. Orgiu,
aF. Reinders,
eS. Braun,
f
M. Fahlman,fM. Mayor,*
egJ. Cornil,*
dV. Palermo,*
bF. Cacialli*
cand
P. Samorı*a
Received 21st March 2011, Accepted 13th May 2011
DOI: 10.1039/c1cp20851a
Responsive monolayers are key building blocks for future applications in organic and molecular
electronics in particular because they hold potential for tuning the physico-chemical properties of
interfaces, including their energetics. Here we study a photochromic SAM based on a conjugated
azobenzene derivative and its influence on the gold work function (FAu) when chemisorbed on its
surface. In particular we show that the FAu can be modulated with external stimuli by controlling
the azobenzene trans/cis isomerization process. This phenomenon is characterized experimentally
by four different techniques, kelvin probe, kelvin probe force microscopy, electroabsorption
spectroscopy and ultraviolet photoelectron spectroscopy. The use of different techniques implies
exposing the SAM to different measurement conditions and different preparation methods, which,
remarkably, do not alter the observed work function change (Ftrans–Fcis). Theoretical calculations
provided a complementary insight crucial to attain a deeper knowledge on the origin of the work
function photo-modulation.
1. Introduction
Self-assembled monolayers (SAMs) are highly ordered supra-
molecular arrays of functional molecules that can be easily
processed on specific surfaces via chemisorption.1 SAMs are
technologically important as they can be incorporated in devices
for a wide range of applications such as sensors,2 memory
devices3 and organic thin-film transistors.4 From a fundamental
viewpoint, SAMs offer a unique and tunable combination of
physical properties that render them prototypical systems for
various studies in the realm of interfacial chemistry and
more generally self-organization.5 An appropriate design of
the molecules that will self-organize on a substrate is crucial to
confer a specific functionality to the resulting modified surface.
Among various tunable functions of a SAM, the electronic
work function (F) of metallic contacts is very important for
optimizing charge injection and extraction in electronic devices
and hence their performance.6 In general, the presence of an
interfacial dipole associated with the molecular monolayer
at the metal/semiconductor interfaces has been identified as
the main contribution to the work function tuning of metallic
contacts.7
Since the surface of an electrode can be decorated with arrays
of responsive molecules, the design of switchable SAMs, i.e.
monolayers able to undergo significant changes in their physical
or chemical properties as a result of external stimuli, is of
particular interest for the fabrication of smart surfaces and
interfaces.8 Among photochromic systems, azobenzenes are
known to undergo a well-defined isomerization from the trans
to the cis conformation around the NQN double bond, in
response to an external stimulus such as UV light and vice versa
if exposed to visible light or heating.9 These two forms feature
different physico-chemical properties10 that when self-assembled
into monolayers emerge as different wettability,11 conductance12
or dipole moment.13 Accordingly, azobenzenes have been used
a ISIS—CNRS 7006, Universite de Strasbourg,8 allee Gaspard Monge, 67000 Strasbourg, France.E-mail: [email protected]
b ISOF-CNR, via Gobetti 101, 40129 Bologna, Italy.E-mail: [email protected]
c Department of Physics and Astronomy and London Centre forNanotechnology, University College London, Gower Street,London WC1E 6BT, England. E-mail: [email protected]
d Laboratory for Chemistry of Novel Materials, University of Mons,20 Place du Parc, B-7000 Mons, Belgium.E-mail: [email protected]
eDepartment of Chemistry, University of Basel, St. Johannsring 19,4056 Basel, Switzerland. E-mail: [email protected]
f Department of Physics, Chemistry and Biology,Linkoping University, 581 83 Linkoping, Sweden
gKarlsruhe Institute of Technology KIT, Institute for Nanotechnology,P.O. Box 3640, 76021 Karlsruhe, Germany
PCCP Dynamic Article Links
www.rsc.org/pccp PAPER
Publ
ishe
d on
22
June
201
1. D
ownl
oade
d by
Uni
vers
ity C
olle
ge L
ondo
n on
14/
12/2
013
12:1
6:45
. View Article Online / Journal Homepage / Table of Contents for this issue

This journal is c the Owner Societies 2011 Phys. Chem. Chem. Phys., 2011, 13, 14302–14310 14303
for a large variety of applications14 including modulation of the
interactions between azo-protected nanoparticles, photo-
mechanical responsive systems, liquid-crystal alignment for
displays, optical switching and data storage devices.15 In
particular, azobenzene derivatives hold potential to be incorpo-
rated in electronic switchable devices. Azobenzene-based
SAMs on gold have been exploited to tune reversibly the
work function by photoisomerization.13,16 In contrast to the
conjugated azobenzene used in the present work, many previous
studies were addressed to asymmetric azobenzene dithiols
exhibiting an alkyl chain on the second sulfur binding group.
Such alkyl group led to a 50% surface coverage of azobenzene
units within the SAM, thereby providing the necessary free
volume for the photoisomerization process to occur.17 Never-
theless, in our specific case, we previously demonstrated by
means of scanning tunneling microscopy (STM) that the
terminally thiol functionalized azo-biphenyl (AZO) used for
this study forms highly ordered and tightly packed SAMs
on Au (111) which undergoes photoisomerization in large
domains at surfaces, with an unexpected isomerization yield
exceeding 96%.18 By exploiting such a high yield, bistable
electrical nano-junctions,19 cargo lifter20 as well as optically
modulable field-effect transistors21 could be fabricated.
Here, we report on the change in the Au work function (F)and its modulation caused by the trans- to cis-azobenzene
photoisomerization of AZO-SAMs chemisorbed on Au
(Scheme 1). To this end, we have measured the change in work
function using four complementary experimental techniques:
macroscopic Kelvin Probe (KP), Kelvin Probe Force Micro-
scopy (KPFM), electroabsorption (EA) spectroscopy and
ultraviolet photoelectron spectroscopy (UPS). Theoretical
calculations on the photoisomerization in AZO-SAMs have
been also carried out to complement and explain the experi-
mental results. KP and KPFM have been employed to investi-
gate the surface potential and work function modification due
to the presence of the AZO-SAM chemisorbed Au in a similar
air environment, measurement done under the effect of an
electric field. While KP maps a macroscopic area, the KPFM
features tens of nm spatial resolution. In the case of the EA, an
electric field is also used to modulate the measurable absorp-
tion, the experiments are performed under rough vacuum
(10�2 mbar). This latest technique offers the possibility to
study the effect of the AZO-SAM under similar operational
conditions but when it is embedded in a real device. On the
contrary, it is interesting to observe if when the AZO-SAM is
exposed to completely different measurement condition the
result is altered, such in the case of the UPS.
2. Experimental details
AZO-SAMs were prepared by immersing the gold substrates
in a 0.1 mM solution of the azobenzene derivative in chloroform
for 48 h. The samples were vigorously rinsed with chloroform
and dried under nitrogen. To obtain comparable results
between different techniques, polycrystalline evaporated gold
on SiOx or indium tin oxide (ITO) were used, thus providing
comparable surface roughness, i.e., homogeneous Au grain
size. Au (111) substrates were prepared by evaporating 60 nm
of gold onto freshly cleaved mica after preheating the mica at
450 1C overnight. Thermal deposition was performed at a rate
of 0.01 nm s�1 and a pressure of 1–1.5 � 10�6 mbar keeping
the temperature at 450 1C during the evaporation. Commercial
micro-electrodes were purchased from IPMS Fraunhofer and
consisted of SiO2 substrates exposing pre-patterned gold
electrodes (30 nm Au with 10 nm ITO as adhesion layer).
AFM images on the gold showed similar roughness as the
above mentioned polycrystalline Au evaporated gold on SiOx.
Macroscopic Au surfaces evaporated on mica and SiOx
expose hundreds of nanometer sized atomically flat terraces
having a root mean square roughness (Rrms) of 0.3 nm. In the
case of commercial Au micro-electrodes similar roughness
values are obtained on images recorded on a surface area of
ca. 200 mm2. Similarly, the KPFM images of all the three Au
surfaces show a similar Rrms close to 10 mV.
In the KP and KPFM experiments the same UV-light
source (365 nm) and same sample-light distance were used.
Kelvin probe techniques
Macroscopic kelvin probe measurements were performed under
ambient conditions using 2 mm diameter gold tip amplifier
(Ambient Kelvin Probe Package from KP Technology Ltd.)
KPFM measurements were performed by employing a
commercial microscope Multimode (Veeco) with Extender
Electronics module. In order to obtain a sufficiently large and
detectable mechanical deflection, we used (k= 2.8 Nm�1) Pt/Ir
coated Si ultra levers (SCM, Veeco) with oscillating frequencies
in the range 60 o o o 90 KHz. AFM and KPFM images are
acquired in the same measurement; a topographic line scan is
first obtained by AFM operating in Tapping Mode and then
that same line is rescanned in Lift Mode with the tip raised to a
lift height of 10 nm.
Both techniques provide a voltage resolution of about 5 mV,
while the lateral resolution lies between a few millimeters and a
few tens of nanometers for KP and KPFM, respectively.
Calibration of the probe was performed against a freshly
cleaved High Oriented Pyrolytic Graphite (HOPG) surface
for both techniques.22 A comprehensive description of the two
techniques can be found in23 and references therein.
Ultraviolet photoelectron spectroscopy (UPS)
Ultraviolet photoelectron spectroscopy (UPS) measurements
of as-received (trans state) and UV-illuminated (60 min in air)
(cis state) AZO-SAM samples were carried out at a base
pressure lower than 1 � 10�9 mbar. The work function was
estimated using the secondary electron cut-off method24 with
an experimental error below 0.05 eV, and with the absoluteScheme 1 Schematic representation of the AZO-SAM.
Publ
ishe
d on
22
June
201
1. D
ownl
oade
d by
Uni
vers
ity C
olle
ge L
ondo
n on
14/
12/2
013
12:1
6:45
.
View Article Online

14304 Phys. Chem. Chem. Phys., 2011, 13, 14302–14310 This journal is c the Owner Societies 2011
work function values calibrated against sputter-cleaned
polycrystalline gold of F = 5.2 eV.
Electroabsorption spectroscopy
The linear dependence of the electroabsorption (EA) signal on
the applied bias was used to determine the nulling voltage (Vnull)
across the light-emitting diodes (LEDs), a detailed description of
the setup and technique can be found in reference.25
The LEDs used for this study were prepared using O2
plasma treated ITO substrates,26 with a thin Au layer (5 nm)
and the AZO-SAM deposited on top. Active layers were made
of poly(9,90-dioctylfluorene-alt-benzothiadiazole), F8BT, and
a 50 nm thick Al cathode was deposited on top via thermal
evaporation (inset Fig. 5) using a shadow mask to obtain eight
pixels for each ITO substrate. AZO-SAMs are exposed to air
prior to spin-coating of the polymer and cathodes evaporation.
Quantum-chemical calculations
Before estimating the work function, the geometrical para-
meters for the corresponding cis- and trans-SAMs on gold
were optimized. In one of our previous studies, it was experi-
mentally established by STM measurements that the trans
isomer exhibits a herringbone packing on the Au (111)
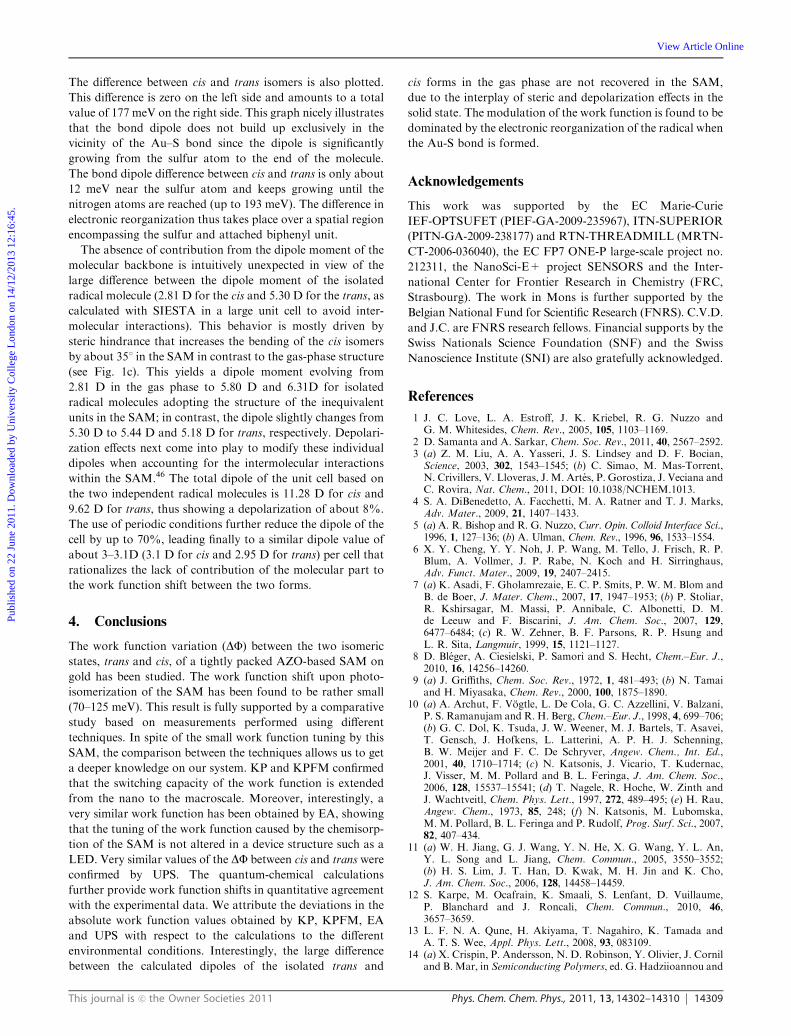
surface18,27 (cell parameters: a = 6.5 � 0.5 A; b = 8.9 � 0.5 A;
a = 841 � 51, Fig. 1a). The unit cell contains two independent
molecules, leading to an area per molecule of 28.8 � 4.1 A2.
The experimental data also indicates that the position of the
anchoring group is not modified during the isomerization.18
Accordingly, we have built a two-dimensional periodic slab
made of five layers of gold with a lattice parameter of 4.1 A
(Au–Au distance of 2.9 A);28 the slabs are separated in the
third direction by a vacuum region of 40 A. We have then
added on top a layer of chemisorbed AZO molecules in
the two forms mimicking the pattern observed in the STM
measurements (in particular, an inversion in the orientation of
the cis form between adjacent layers, see Fig. 1a); we also
chose the same initial position for the sulfur atoms on the gold
surface for the two isomers. Considering the limited size of the
unit cell that we can treat and the gold surface periodicity
constraints, the best matching unit cell that we have adopted
has the parameters: a = 8.7 A; b = 7.7 A, and a = 791; this
represents an area per molecule of 32.9 A2 entering into the
experimental error bars. The geometry of the cells has been
optimized at the density functional theory (DFT) level using
the SIESTA3 package,29 with a full relaxation of the molecule
and top two gold layers. The local density approximation has
been used in conjunction with the Ceperley–Alder exchange–
correlation functional.30 The valence electrons are described
within the LCAO approximation using a DZP basis set29
whereas Trouillier–Martin pseudopotentials are used for the
description of the core electrons. We use a mesh cut-off of
Fig. 1 (a) STM image showing the packing of the cis (left) and trans (right) isomers on the gold surface; Reprinted with permission from ref. 18;
Copyright 2007 by the National Academy of Sciences, USA (b) optimized geometries of the unit cell for the cis (left) and trans (right) isomers.
The arrows depict the opening direction of the cis form to compare with the STM image; (c) optimized geometry of the cis form in the gas phase
(left) and of the two independent molecules in the unit cell on the gold surface (right).
Publ
ishe
d on
22
June
201
1. D
ownl
oade
d by
Uni
vers
ity C
olle
ge L
ondo
n on
14/
12/2
013
12:1
6:45
.
View Article Online

This journal is c the Owner Societies 2011 Phys. Chem. Chem. Phys., 2011, 13, 14302–14310 14305
250 Ry and a k-sampling of (5,5,1) in the Monkhorst–Pack
scheme.31 The parameters of the DZP basis have been adapted
in the same way for all atoms so that the work function of the
clean Au (111) surface matches the experimental value of
5.26 eV.28 This theoretical approach has been validated in
the case of model systems such as alkanethiol derivatives by
showing a good quantitative agreement for the vacuum
level shift and its components when compared to another
theoretical approach often used in literature (based on DFT
calculations using plane waves within the VASP code) and
corresponding experimental data.32
Fig. 1b shows the optimized structure of the cell for the two
isomeric forms. The trans isomers pack into a herringbone
structure with an average tilt angle of 7.21 between the surface
normal and the vector connecting the sulfur atom and the top
hydrogen atom. This small angle is consistent with experi-
mental estimates around 201.27 The cis isomer exhibits a
significant opening of the structure (1171) which is larger than
for the molecule in the gas phase (821) due to steric effects in
the SAM. It also appears in our simulations that the phenyl
ring next to the surface is more tilted in average for the
cis isomer (16.11 and 7.11 for the two independent molecules)
than for the trans (13.11 and 6.81). The anchoring position of
the sulfur atoms on the surface is conserved upon isomeri-
zation, in agreement with the experimental observations. The
average SAM thickness is about 18.4 A for the cis isomer and
22.2 A for the trans isomer; the difference of about 3.8 A is a
little bit smaller than experimental studies of azobenzene
SAMs which give typical values around 5–7 A.19,20,33 We
attribute this difference to the larger thickness of the cis form
in our simulations compared to the experimental thickness
of about 16 A;19 on the other hand, the value obtained for
the trans form agrees with corresponding experimental data
(20.4 A in27 and 23.6 � 1.5 A in19).
The electronic density associated to the equilibrium geometry
can then be exploited to plot the plane-averaged electrostatic
potential along the axis normal to the interface; this provides a
direct estimate of the work function shift by comparing the
converged potential on the bare side of the surface and on the
SAM-covered side of the surface. The total dipole moment
perpendicular to the surface at the origin of the work function
shift34 can be obtained by integrating the electronic density.
The total work function shift (DF) may also be casted down
into a molecular contribution (DVSAM) arising from the dipole
supported by the molecular backbone and a bond dipole (BD)
contribution describing the interfacial electronic reorganization
upon formation of the Au–S bond35:
DF = DVSAM + BD (1)
The magnitude of these two contributions depends whether we
are considering that radicals approach the gold surface to
make a covalent Au–S bond or that chemisorption occurs by
replacing in the neutral molecule the hydrogen atom of the
thiol group by a gold atom.36 DVSAM has been estimated here
in the radical scenario by computing at the LDA level with
spin polarization (LSDA) the electrostatic potential profile
across a sheet of radicals obtained by removing the gold atoms
from the entire system while keeping the same geometry for
the molecular part. The value of BD is then obtained by
subtracting DVSAM from DF.
3. Results and discussion
The work function (F) measured by means of KP is an average
of long acquisition time measurements (15 to 60 min) with a
standard deviation lower than 0.02 eV. The work function for
the bare polycrystalline gold on SiO2 substrate was found
to amount to 5.12 eV. Fig. 2 shows the graph of the absolute
F (FAZO�SAM) vs. time while monitoring the trans-cis photo-
isomerization cycles. The UV illumination was carried out
ex-situ, recording F before (trans) and after irradiation (cis).
The thermal recovery in dark could be monitored in situ over
time. The largest DFcis�trans is observed for the first trans to cis
conversion, with an increase of 70 meV (Ftrans = 5.15 eV and
Fcis = 5.22 eV), and an exponential decay during the back
reaction reaching almost saturation, thus indicating that most
of the cis molecules have been converted to the trans form.
Unfortunately, a switch fatigue is appreciable in the last cycle.
For this reason we consider that the first isomerization quantifies
the WF change.
The work function shift induced by the photoisomerization
of the SAM, and the following reversible switching when
keeping the sample in dark, was also monitored by KPFM
as shown in Fig. 3a. The measured work function for the trans
initial state of the SAM on Au (111) was 5.17� 0.03 eV, which
is really close to the value obtained by macroscopic KP. The
trans AZO-SAM was irradiated until a very small variation of
the SP was measured in time, i.e. very close to the steady state.
KPFM yields a slightly higher increase for the cis-SAM
(DFcis�trans = 116 � 16 meV) compared to the one acquired
with KP. As a control experiment, a bare gold surface was
irradiated with the same UV lamp and at the same distance
than the functionalized gold, and the surface potential did not
reveal any variation (as shown in the bottom side of Fig. 3a).
Similar value of the work function difference between cis and
trans configurations (DFcis�trans = 125 � 15 meV) was
Fig. 2 Plot of the F AZO�SAM on gold over time monitored by Kelvin
Probe (KP) experiments. UV irradiation was performed ex situ,
measuring the F before (trans) and after irradiation (cis). The thermal
back reaction (cis to trans) was monitored in situ in dark.
Publ
ishe
d on
22
June
201
1. D
ownl
oade
d by
Uni
vers
ity C
olle
ge L
ondo
n on
14/
12/2
013
12:1
6:45
.
View Article Online

14306 Phys. Chem. Chem. Phys., 2011, 13, 14302–14310 This journal is c the Owner Societies 2011
measured on samples of AZO-SAM chemisorbed on commercial
gold micro-electrodes (polycrystalline gold on ITO). The DFdeviation observed for the two different types of gold surfaces
made it possible to get a better insight into the switching
mechanism. To this end, we fitted a stretched exponential
function (SEF) to the experimental data.37
F tð Þ ¼ Ftrans þ DFcis�trans � exp � t� t0
t
� �b� �: cis! trans
ð2aÞ
F tð Þ ¼ Fcis � DFcis�trans � exp � t� t0
t
� �b� �: trans! cis
ð2bÞ
where t is the characteristic time and b o 1 represents the
stretch parameter of the two transitions. When b = 1, the
expression (2a,b) become a simple asymptotic exponential and
b is called decay constant. In the case of exponential decay, the
observable quantity decreases at a rate proportional to b.Thus, kinetics described as an exponential law indicate that
they governed by only one mechanism or when all the sites of
the sample are activated at same time. Differently, when more
mechanisms compete or are activated in different times, the
time constant is no longer constant but shows a time-dependence.
Thus, a kinetics well described by a stretched exponential
function remarks that the variation of the observable (SP in
our case) often shows multiple time constants (implying a
‘‘serial activation’’ of the decay process of different sites of the
sample). In general, the ‘‘stretched behaviours’’ are observed
in amorphous systems as glasses, percolations, excitation
transfer from donor to static defects (see37 and references
therein).
The dynamics of trans - cis conversion measured when the
AZO-SAM is chemisorbed on Au evaporated on mica and on
micro-patterned Au electrodes are reported in Fig. 3b. All
t and b values obtained by fitting the measured time-evolution
work function with the expressions (2a,b) are summarized in
Table 1.
A strong asymmetry in the time-evolution trend is observed
for both substrates, both in shape and characteristic time. The
trans - cis conversion is faster than the inverse one and
presents a work function variation roughly described by a
simple exponential trend (b E 1). By STM, it was observed
that cis isomer formed herringbone domains stabilized by
p–p intermolecular interactions. This stability of the cis
AZO-SAM was corroborated by the slow thermal back isomeri-
zation observed by UV–vis absorption measurements.18 The
fact that the trans to cis is a photoexcited process and the
stability of the cis state in the SAM form, support the larger
t found for the back reaction compared to the t of the trans tocis isomerisation. In addition, the difference in the two values
observed when the SAM is supported on Au with different
degree of crystallinity can be explained by the direct influence
of the nature of the Au on the molecule-molecule interactions
and thus, affecting the packing and order of the molecules
forming the SAM. This will lead to more disordered and
smaller domains for polycrystalline gold. This different ordering
will directly influence the directionality and yield of the
isomerisation, i.e. time scale of the process.
The smaller b values achieved for cis - trans conver-
sions can be expressed in terms of a hierarchical model
introduced by Palmer38 for strongly interacting glassy materials.
Fig. 3 (a) Work function variation (J) corresponding to trans and cis SAMs due to the UV illumination recorded in situ by KPFM on
evaporated gold films on mica substrate. Acquired in the same conditions, the work function variation (’) of the bare Au substrate is reported in
the bottom side of the image. (b) Work function variations after UV illumination (sample in dark) acquired for different gold substrates (red J)
evaporated gold on mica (Au (111)) and (&) polycrystalline gold (commercial micro-electrodes). DSP ¼ SPUV � SPdark ! Fcis�Ftrans
�e
Table 1 t and b extracted from fitting a stretched exponential law (eqn (2a)–(b)) to the experimental data (Fig. 3b)
t/min b
cis - trans trans - cis cis - trans trans - cis
Au (111) on mica 40 � 15 20 � 5 0.5 � 0.1 0.8 � 0.1Polycrystalline Au (commercial micro-electrodes) 35 � 10 15 � 5 0.7 � 0.1 0.9 � 0.1
Publ
ishe
d on
22
June
201
1. D
ownl
oade
d by
Uni
vers
ity C
olle
ge L
ondo
n on
14/
12/2
013
12:1
6:45
.
View Article Online

This journal is c the Owner Societies 2011 Phys. Chem. Chem. Phys., 2011, 13, 14302–14310 14307
Using such model, we suggest that the molecular relaxation
occurs in stages, and the constraint imposes by a fast relaxa-
tion process must relax before a subsequent slower relaxation
process sets in. This implies that the time scale of relaxation of
one molecule (or molecular cluster) is subordinated to the
relaxation of the close ones. KPFM images do not show
anisotropies on the surface, this experimental evidence implies
that the cluster’s lateral dimension is smaller than the lateral
resolution of the technique, amounting to 100 nm.
UPS measurements reveal a work function shift upon
isomerisation amounting to 80 � 50 meV (Ftrans = 4.32 eV
and Fcis = 4.40 eV) when the functionalized AZOtrans-Au was
irradiated with UV-light (365 nm) under ambient conditions
for 60 min (Fig. 4). The work function of the bare polycrystalline
gold on SiO2 was measured to be 4.50 eV without being
sputter cleaned prior to measurement. The difference with
the polycrystalline gold surface prepared in UHV through
sputtering (WF = B5.2 eV) used for the calibration is due to
the hydrocarbon absorption at the surface which reduces the
work function down to B4.5 eV for a Bmonolayer coverage
through the well known ‘‘pillow’’ effect.24,39 The function-
alized gold gave as expected for UPS measurements, lower
work function values (few hundreds of meV) than KP, which
is attributed to the fact that the KP method measures an
average of all work function values found in potentially
different (and/or non-homogenous) domains existing under
the probe head. Instead, UPS is most sensitive to the lowest
work function in the probed area, as the secondary electrons
with the lowest kinetic energy are used for the determination.40
The observed FSAM-Au shift caused by the isomerization of the
photoresponse SAM upon irradiation is in agreement with
that observed by KP method. Importantly, in the KP and
KPFM also the water thin film contribution is measured,
which highly contributes to the difference in absolute value
respect to UPS performed in UHV. Indeed, while the absolute
values are different, the relative change in WF (cis-trans
difference) is consistent, and are in good agreement for the
three experimental techniques, suggesting uniform films and
that although in air, when the difference between the two
states is made, the water contribution can be removed.
As a further proof of the work function measured by the
above described techniques when the SAM is embedded in a
device, we performed EA measurements on LEDs incorporating
the transAZO-SAM, with the following structure: ITO/Au(5 nm)/
AZO-SAM/F8BT(100 nm)/Al(50 nm). All measurements were
carried out at room temperature at the EA signal peak, by
irradiating with a monochromated beam (from a Xe-lamp) at
l = 505 nm, while applying a sinusoidal voltage VAC = 0.5 V
at a frequency f = 2 kHz, and with the optical probe entering
the LED through the semitransparent ITO/Au electrode. The
wavelength at which the beam operates will not induce
the trans to cis isomerisation since it only takes place when
the sample is irradiated with UV light. The zero-crossing
voltages were obtained from an average of 10 measurements
over 2 pixels. Fig. 5 shows the EA signal as a function of the
applied DC bias. In the ideal condition of negligible charge
being present within the semiconductor (F8BT in our case) the
EA signal is null when the applied DC voltage compensates
the built-in voltage VBI, which is generated by the equalisation
of the Fermi energy throughout the whole device and, thus, is
equal to the work function difference between the electrodes.41
For the trans AZO-SAM the zero crossing voltage (Vnull) was
determined to be 1.39 � 0.03 V.
Estimation of the work function of the AZO-SAM function-
alized electrode on the basis of this Vnull requires knowledge of
the work function of the Al cathode and of the lowest
unoccupied molecular orbital (LUMO) energy of F8BT, in
case of cathodic pinning of the Fermi energy to the LUMO.
We consider the possibility of pinning unlikely since the
LUMO of F8BT is accepted to lie in the range 3.2–3.5 eV
and the Al work function only decreases below 3.5 eV upon
exposure to significant amount of oxygen during or after
Fig. 4 Ultraviolet Photoelectron Spectroscopy (UPS) secondary electron
cut-off spectra for the AZO-SAM before irradiation (trans) and after UV
irradiation (cis).
Fig. 5 Electroabsorption signal at l = 505 nm and VAC = 0.5 V as
a function of applied DC voltage for the light emitting diode: ITO/Au/
AZO-SAM/F8BT/Al. The zero crossing voltage is 1.39 V.
Publ
ishe
d on
22
June
201
1. D
ownl
oade
d by
Uni
vers
ity C
olle
ge L
ondo
n on
14/
12/2
013
12:1
6:45
.
View Article Online

14308 Phys. Chem. Chem. Phys., 2011, 13, 14302–14310 This journal is c the Owner Societies 2011
evaporation (B300 L or more; the work function of Al in
UHV is B4.1–4.2 eV).42 Previous KP measurements of our
evaporated Al electrodes gave an average Al work function in
our diodes of 3.70–3.80 eV. On that basis, we can calculate the
work function of the trans AZO-SAM functionalized anode
using eqn (3):
Vnull = (Fanode–Fcathode)/e (3)
Where Fanode and Fcathode are the work function of the anode
(AZO-SAM) and the cathode (Al) respectively and e is the
electronic charge. Using this equation, we extracted a value for
the SAM-functionalized anode of 5.06–5.22 eV, in agreement
with the other determinations.43
The above experimental results prompted us to perform
theoretical calculations to help in elucidating the origin of the
small F shift encountered between the two isomeric configu-
rations. Fig. 6 displays the plane averaged potential profiles
associated to the optimized structures of the unit cell for the
cis and trans isomers. The work function of gold modified with
the cis and trans isomers are 4.14 eV and 4.04 eV, respectively,
which represents a decrease by �1.12 eV and �1.22 eV with
respect to the clean metal surface. The higher work function
observed for the cis form and the difference between the two
forms (100 meV) are entirely consistent with the experimental
data. The large work function shifts are comparable to other
theoretical values reported in the literature35,44 as well as with
experimental UPS data in UHV conditions.45 However, these
shifts are much higher than those measured in the present
study. The comparison is most likely hampered by the actual
nature of the gold sample and by the presence of contaminants
in the KP, KPFM, and EA measurements. In order to
investigate the bond dipole versus molecular contributions to
this shift, we have also computed the potential profile of the
free SAM in Fig. 6. For the cis form, the molecular contri-
bution is �1.79 eV; leading to a bond dipole of +0.67eV. A
very similar value of �1.72 eV is obtained for the trans form,
which translates into a bond dipole about +0.50 eV. According
to our calculations, the shift of the work function is dominated
by the electronic reorganization upon formation of the Au–S
bond between the gold surface and the radical rather than by
the difference of dipole moment between the two isomeric
forms. In order to further shed light on the difference between
the bond dipole of the two forms, we have plotted in Fig. 7 the
evolution of the generated bond dipole when moving from
the left side to right side of the interface for both isomers.
Fig. 6 Plane averaged potentials of the cis (a) and trans (b) SAMs on gold surface. The zero energy is set at the Fermi level so that the work
function is directly readable. We display curves for the bare Au (111) gold surface, the gold surface covered by the SAM, and the free SAM system.
In the left part, we can identify the five gold layers and the SAM contribution moving away from the surface. The two arrows on the right side
points to the work function shift of the entire system (light grey) and of the contribution arising from the free SAM (black). The difference between
these shifts corresponds to the bond dipole.
Fig. 7 Graph illustrating the build up of the bond dipoles as an
electron crosses the metal/SAM interface from the left to the right side.
The dashed lines correspond to the cis and trans isomers. Reference
vertical lines corresponding to the gold surface and different positions
along the molecular backbone have been added. These positions are
shown in the superimposed trans geometry. The bond dipole first
decreases in the vicinity of the Au-S bond. This is attributed to the
repulsion of the gold electronic cloud at the surface by the atoms of the
deposited molecule (i.e., pillow effect). Then, a delocalized polariza-
tion of the electronic density extending from the sulfur to the attached
biphenyl unit induces a growing barrier leading to the final bond
dipole. The continuous line corresponds to the difference between the
bond dipoles of the cis and trans forms. This shows that the origin of
the bond dipole difference is not only concentrated around the Au–S
bond but also takes place over a spatial region encompassing the sulfur
and attached biphenyl unit.
Publ
ishe
d on
22
June
201
1. D
ownl
oade
d by
Uni
vers
ity C
olle
ge L
ondo
n on
14/
12/2
013
12:1
6:45
.
View Article Online
This journal is c the Owner Societies 2011 Phys. Chem. Chem. Phys., 2011, 13, 14302–14310 14309
The difference between cis and trans isomers is also plotted.
This difference is zero on the left side and amounts to a total
value of 177 meV on the right side. This graph nicely illustrates
that the bond dipole does not build up exclusively in the
vicinity of the Au–S bond since the dipole is significantly
growing from the sulfur atom to the end of the molecule.
The bond dipole difference between cis and trans is only about
12 meV near the sulfur atom and keeps growing until the
nitrogen atoms are reached (up to 193 meV). The difference in
electronic reorganization thus takes place over a spatial region
encompassing the sulfur and attached biphenyl unit.
The absence of contribution from the dipole moment of the
molecular backbone is intuitively unexpected in view of the
large difference between the dipole moment of the isolated
radical molecule (2.81 D for the cis and 5.30 D for the trans, as
calculated with SIESTA in a large unit cell to avoid inter-
molecular interactions). This behavior is mostly driven by
steric hindrance that increases the bending of the cis isomers
by about 351 in the SAM in contrast to the gas-phase structure
(see Fig. 1c). This yields a dipole moment evolving from
2.81 D in the gas phase to 5.80 D and 6.31D for isolated
radical molecules adopting the structure of the inequivalent
units in the SAM; in contrast, the dipole slightly changes from
5.30 D to 5.44 D and 5.18 D for trans, respectively. Depolari-
zation effects next come into play to modify these individual
dipoles when accounting for the intermolecular interactions
within the SAM.46 The total dipole of the unit cell based on
the two independent radical molecules is 11.28 D for cis and
9.62 D for trans, thus showing a depolarization of about 8%.
The use of periodic conditions further reduce the dipole of the
cell by up to 70%, leading finally to a similar dipole value of
about 3–3.1D (3.1 D for cis and 2.95 D for trans) per cell that
rationalizes the lack of contribution of the molecular part to
the work function shift between the two forms.
4. Conclusions
The work function variation (DF) between the two isomeric
states, trans and cis, of a tightly packed AZO-based SAM on
gold has been studied. The work function shift upon photo-
isomerization of the SAM has been found to be rather small
(70–125 meV). This result is fully supported by a comparative
study based on measurements performed using different
techniques. In spite of the small work function tuning by this
SAM, the comparison between the techniques allows us to get
a deeper knowledge on our system. KP and KPFM confirmed
that the switching capacity of the work function is extended
from the nano to the macroscale. Moreover, interestingly, a
very similar work function has been obtained by EA, showing
that the tuning of the work function caused by the chemisorp-
tion of the SAM is not altered in a device structure such as a
LED. Very similar values of the DF between cis and trans were
confirmed by UPS. The quantum-chemical calculations
further provide work function shifts in quantitative agreement
with the experimental data. We attribute the deviations in the
absolute work function values obtained by KP, KPFM, EA
and UPS with respect to the calculations to the different
environmental conditions. Interestingly, the large difference
between the calculated dipoles of the isolated trans and
cis forms in the gas phase are not recovered in the SAM,
due to the interplay of steric and depolarization effects in the
solid state. The modulation of the work function is found to be
dominated by the electronic reorganization of the radical when
the Au-S bond is formed.
Acknowledgements
This work was supported by the EC Marie-Curie
IEF-OPTSUFET (PIEF-GA-2009-235967), ITN-SUPERIOR
(PITN-GA-2009-238177) and RTN-THREADMILL (MRTN-
CT-2006-036040), the EC FP7 ONE-P large-scale project no.
212311, the NanoSci-E+ project SENSORS and the Inter-
national Center for Frontier Research in Chemistry (FRC,
Strasbourg). The work in Mons is further supported by the
Belgian National Fund for Scientific Research (FNRS). C.V.D.
and J.C. are FNRS research fellows. Financial supports by the
Swiss Nationals Science Foundation (SNF) and the Swiss
Nanoscience Institute (SNI) are also gratefully acknowledged.
References
1 J. C. Love, L. A. Estroff, J. K. Kriebel, R. G. Nuzzo andG. M. Whitesides, Chem. Rev., 2005, 105, 1103–1169.
2 D. Samanta and A. Sarkar, Chem. Soc. Rev., 2011, 40, 2567–2592.3 (a) Z. M. Liu, A. A. Yasseri, J. S. Lindsey and D. F. Bocian,Science, 2003, 302, 1543–1545; (b) C. Simao, M. Mas-Torrent,N. Crivillers, V. Lloveras, J. M. Artes, P. Gorostiza, J. Veciana andC. Rovira, Nat. Chem., 2011, DOI: 10.1038/NCHEM.1013.
4 S. A. DiBenedetto, A. Facchetti, M. A. Ratner and T. J. Marks,Adv. Mater., 2009, 21, 1407–1433.
5 (a) A. R. Bishop and R. G. Nuzzo, Curr. Opin. Colloid Interface Sci.,1996, 1, 127–136; (b) A. Ulman, Chem. Rev., 1996, 96, 1533–1554.
6 X. Y. Cheng, Y. Y. Noh, J. P. Wang, M. Tello, J. Frisch, R. P.Blum, A. Vollmer, J. P. Rabe, N. Koch and H. Sirringhaus,Adv. Funct. Mater., 2009, 19, 2407–2415.
7 (a) K. Asadi, F. Gholamrezaie, E. C. P. Smits, P. W. M. Blom andB. de Boer, J. Mater. Chem., 2007, 17, 1947–1953; (b) P. Stoliar,R. Kshirsagar, M. Massi, P. Annibale, C. Albonetti, D. M.de Leeuw and F. Biscarini, J. Am. Chem. Soc., 2007, 129,6477–6484; (c) R. W. Zehner, B. F. Parsons, R. P. Hsung andL. R. Sita, Langmuir, 1999, 15, 1121–1127.
8 D. Bleger, A. Ciesielski, P. Samorı and S. Hecht, Chem.–Eur. J.,2010, 16, 14256–14260.
9 (a) J. Griffiths, Chem. Soc. Rev., 1972, 1, 481–493; (b) N. Tamaiand H. Miyasaka, Chem. Rev., 2000, 100, 1875–1890.
10 (a) A. Archut, F. Vogtle, L. De Cola, G. C. Azzellini, V. Balzani,P. S. Ramanujam and R. H. Berg, Chem.–Eur. J., 1998, 4, 699–706;(b) G. C. Dol, K. Tsuda, J. W. Weener, M. J. Bartels, T. Asavei,T. Gensch, J. Hofkens, L. Latterini, A. P. H. J. Schenning,B. W. Meijer and F. C. De Schryver, Angew. Chem., Int. Ed.,2001, 40, 1710–1714; (c) N. Katsonis, J. Vicario, T. Kudernac,J. Visser, M. M. Pollard and B. L. Feringa, J. Am. Chem. Soc.,2006, 128, 15537–15541; (d) T. Nagele, R. Hoche, W. Zinth andJ. Wachtveitl, Chem. Phys. Lett., 1997, 272, 489–495; (e) H. Rau,Angew. Chem., 1973, 85, 248; (f) N. Katsonis, M. Lubomska,M. M. Pollard, B. L. Feringa and P. Rudolf, Prog. Surf. Sci., 2007,82, 407–434.
11 (a) W. H. Jiang, G. J. Wang, Y. N. He, X. G. Wang, Y. L. An,Y. L. Song and L. Jiang, Chem. Commun., 2005, 3550–3552;(b) H. S. Lim, J. T. Han, D. Kwak, M. H. Jin and K. Cho,J. Am. Chem. Soc., 2006, 128, 14458–14459.
12 S. Karpe, M. Ocafrain, K. Smaali, S. Lenfant, D. Vuillaume,P. Blanchard and J. Roncali, Chem. Commun., 2010, 46,3657–3659.
13 L. F. N. A. Qune, H. Akiyama, T. Nagahiro, K. Tamada andA. T. S. Wee, Appl. Phys. Lett., 2008, 93, 083109.
14 (a) X. Crispin, P. Andersson, N. D. Robinson, Y. Olivier, J. Corniland B. Mar, in Semiconducting Polymers, ed. G. Hadziioannou and
Publ
ishe
d on
22
June
201
1. D
ownl
oade
d by
Uni
vers
ity C
olle
ge L
ondo
n on
14/
12/2
013
12:1
6:45
.
View Article Online

14310 Phys. Chem. Chem. Phys., 2011, 13, 14302–14310 This journal is c the Owner Societies 2011
G. G. Malliaras, VCH, Weinheim, 2007, pp. 579–612;(b) M. M. Russew and S. Hecht, Adv. Mater., 2010, 22, 3348–3360.
15 (a) R. Advincula, M. K. Park, A. Baba and F. Kaneko, Langmuir,2003, 19, 654–665; (b) T. Hugel, N. B. Holland, A. Cattani,L. Moroder, M. Seitz and H. E. Gaub, Science, 2002, 296,1103–1106; (c) T. Ikeda and O. Tsutsumi, Science, 1995, 268,1873–1875; (d) M. Kondo, Y. L. Yu and T. Ikeda, Angew. Chem.,Int. Ed., 2006, 45, 1378–1382; (e) Z. F. Liu, K. Hashimoto andA. Fujishima, Nature, 1990, 347, 658–660; (f) C. Raimondo,F. Reinders, U. Soydaner, M. Mayor and P. Samorı, Chem.Commun., 2010, 46, 1147–1149; (g) L. V. Schafer, E. M. Muller,H. E. Gaub and H. Grubmuller, Angew. Chem., Int. Ed., 2007, 46,2232–2237; (h) Y. L. Yu, M. Nakano and T. Ikeda, Nature, 2003,425, 145–145.
16 T. Nagahiro, H. Akiyama, M. Hara and K. Tamada, J. ElectronSpectrosc. Relat. Phenom., 2009, 172, 128–133.
17 K. Tamada, H. Akiyama and T. X. Wei, Langmuir, 2002, 18,5239–5246.
18 G. Pace, V. Ferri, C. Grave, M. Elbing, C. von Hanisch,M. Zharnikov, M. Mayor, M. A. Rampi and P. Samorı, Proc.Natl. Acad. Sci. U. S. A., 2007, 104, 9937–9942.
19 J. M. Mativetsky, G. Pace, M. Elbing, M. A. Rampi, M. Mayorand P. Samorı, J. Am. Chem. Soc., 2008, 130, 9192–9193.
20 V. Ferri, M. Elbing, G. Pace, M. D. Dickey, M. Zharnikov,P. Samorı, M. Mayor and M. A. Rampi, Angew. Chem., Int. Ed.,2008, 47, 3407–3409.
21 N. Crivillers, E. Orgiu, F. Reinders, M.Mayor and P. Samorı, Adv.Mater., 2011, 23, 1447–1452.
22 W. N. Hansen and G. J. Hansen, Surf. Sci., 2001, 481, 172–184.23 (a) I. D. Baikie, S. Mackenzie, P. J. Z. Estrup and J. A. Meyer,Rev.
Sci. Instrum., 1991, 62, 1326–1332; (b) I. D. Baikie,E. Venderbosch, J. A. Meyer and P. J. Z. Estrup, Rev. Sci.Instrum., 1991, 62, 725–735; (c) A. Liscio, V. Palermo andP. Samorı, Acc. Chem. Res., 2010, 43, 541–550; (d) V. Palermo,M. Palma and P. Samorı, Adv. Mater., 2006, 18, 145–164.
24 S. Braun, W. R. Salaneck and M. Fahlman, Adv. Mater., 2009, 21,1450–1472.
25 (a) T. M. Brown and F. Cacialli, J. Polym. Sci., Part B: Polym.Phys., 2003, 41, 2649–2664; (b) T. M. Brown, R. H. Friend,I. S. Millard, D. J. Lacey, T. Butler, J. H. Burroughes andF. Cacialli, J. Appl. Phys., 2003, 93, 6159–6172.
26 (a) J. S. Kim, F. Cacialli and R. Friend, Thin Solid Films, 2003,445, 358–366; (b) G. Winroth, S. Brovelli, R. Daik, W. J. Feast andF. Cacialli, Org. Electron., 2010, 11, 1445–1448; (c) G. Winroth,G. Latini, D. Credgington, L. Y. Wong, L. L. Chua, P. K. H. Hoand F. Cacialli, Appl. Phys. Lett., 2008, 92, 103308.
27 M. Elbing, A. Blaszczyk, C. von Haenisch, M. Mayor, V. Ferri,C. Grave, M. A. Rampi, G. Pace, P. Samorı, A. Shaporenko andM. Zharnikov, Adv. Funct. Mater., 2008, 18, 2972–2983.
28 D. R. Lide, Handbook of chemistry and physics; CRC Press, 1995.29 (a) E. Artacho, E. Anglada, O. Dieguez, J. D. Gale, A. Garcia,
J. Junquera, R. M. Martin, P. Ordejon, J. M. Pruneda,D. Sanchez-Portal and J. M. Soler, J. Phys.: Condens. Matter,2008, 20, 064208; (b) D. Sanchez-Portal, P. Ordejon, E. Artachoand J. M. Soler, Int. J. Quantum Chem., 1997, 65, 453–461.
30 (a) D. Ceperley, Phys. Rev. B, 1978, 18, 3126–3138;(b) D. M. Ceperley and B. J. Alder, Phys. Rev. Lett., 1980, 45,566–569; (c) J. P. Perdew and A. Zunger, Phys. Rev. B, 1981, 23,5048–5079; (d) P. A. M. Dirac, Math. Proc. Cambridge Philos.Soc., 2008, 26, 376–385.
31 H. J. Monkhorst and J. D. Pack, Phys. Rev. B: Solid State, 1976,13, 5188–5192.
32 D. Cornil, H. Li, C. Wood, G. Pourtois, J. L. Bredas and J. Cornil,to be submitted, 2011.
33 K. Smaali, S. Lenfant, S. Karpe, M. Ocafrain, P. Blanchard,D. Deresmes, S. Godey, A. Rochefort, J. Roncali andD. Vuillaume, ACS Nano, 2010, 4, 2411–2421.
34 (a) S. D. Evans and A. Ulman, Chem. Phys. Lett., 1990, 170,462–466; (b) S. D. Evans, E. Urankar, A. Ulman and N. Ferris,J. Am. Chem. Soc., 1991, 113, 4121–4131; (c) R. W. Zehner,B. F. Parsons, R. P. Hsung and L. R. Sita, Langmuir, 1999, 15,1121–1127.
35 G. Heimel, L. Romaner, J. L. Bredas and E. Zojer, Phys. Rev.Lett., 2006, 96, 196806.
36 L. J. Wang, G. M. Rangger, Z. Ma, Q. Li, Z. Shuai, E. Zojer andG. Heimel, Phys. Chem. Chem. Phys., 2010, 12, 4287–4290.
37 J. Klafter and M. F. Shlesinger, Proc. Natl. Acad. Sci. U. S. A.,1986, 83, 848–851.
38 R. G. Palmer, D. L. Stein, E. Abrahams and P. W. Anderson,Phys. Rev. Lett., 1984, 53, 958–961.
39 W. Osikowicz, M. P. de Jong, S. Braun, C. Tengstedt, M. Fahlmanand W. R. Salaneck, Appl. Phys. Lett., 2006, 88, -.
40 (a) J. S. Kim, B. Lagel, E. Moons, N. Johansson, I. D. Baikie,W. R. Salaneck, R. H. Friend and F. Cacialli, Synth. Met., 2000,111, 311–314; (b) N. D. Orf, I. D. Baikie, O. Shapira and Y. Fink,Appl. Phys. Lett., 2009, 94, 113504.
41 I. H. Campbell, T. W. Hagler, D. L. Smith and J. P. Ferraris, Phys.Rev. Lett., 1996, 76, 1900–1903.
42 (a) R. I. R. Blyth, S. A. Sardar, F. P. Netzer and M. G. Ramsey,Appl. Phys. Lett., 2000, 77, 1212–1214; (b) G. Winroth,O. Fenwick, M. A. Scott, D. Yip, S. Howorka and F. Cacialli,Appl. Phys. Lett., 2010, 97, 043304.
43 (a) T. M. Brown, G. M. Lazzerini, L. J. Parrott, V. Bodrozic,L. Burgi and C. F., Org. Electron., 2011, 12, 623–633; (b) J. S. Kim,M. Granstrom, R. H. Friend, N. Johansson, W. R. Salaneck,R. Daik, W. J. Feast and F. Cacialli, J. Appl. Phys., 1998, 84,6859–6870; (c) G. Latini, M. Wykes, R. Schlapak, S. Howorka andF. Cacialli, Appl. Phys. Lett., 2008, 92, 013511.
44 (a) P. C. Rusu and G. Brocks, J. Phys. Chem. B, 2006, 110,22628–22634; (b) P. C. Rusu and G. Brocks, Phys. Rev. B:Condens. Matter Mater. Phys., 2006, 74, -.
45 (a) D. M. Alloway, A. L. Graham, X. Yang, A. Mudalige,R. Colorado, V. H. Wysocki, J. E. Pemberton, T. R. Lee,R. J. Wysocki and N. R. Armstrong, J. Phys. Chem. C, 2009,113, 20328–20334; (b) D. M. Alloway, M. Hofmann, D. L. Smith,N. E. Gruhn, A. L. Graham, R. Colorado, V. H. Wysocki,T. R. Lee, P. A. Lee and N. R. Armstrong, J. Phys. Chem. B,2003, 107, 11690–11699.
46 D. Cornil, Y. Olivier, V. Geskin and J. Cornil, Adv. Funct. Mater.,2007, 17, 1143–1148.
Publ
ishe
d on
22
June
201
1. D
ownl
oade
d by
Uni
vers
ity C
olle
ge L
ondo
n on
14/
12/2
013
12:1
6:45
.
View Article Online