
Photic evoked activity in the visual cortex of monocularly deprived cats
15
EXPERIMENTAL NEUROLOGY 55, 211-225 (1977) Photic Evoked Activity in the Visual Cortex of Monocularly Deprived Cats Departrrrent of Phtrrrrrocolog~, Untiwsity of Pittsburgh School of Mdicim, Pittsbwglz, Pcnrfsylew~ia 151761 Received Ocfohcr 22, 19i6 Monocular eyelid closure during the first 2 months of life has previously been shown to cause a dramatic reduction in the number of neurons that can be activated by photic stimulation of the deprived eye. Those studies recorded single neuron responses to stimulation with discrete forms. In contrast, the author has previously shown that the initial components of the slow-wave response from one region of the cortex evoked by diffuse stimulation of the deprived eye are actually similar to these components when evoked from the nondeprived eye. The disparity in these findings may be due to the fact that the slow-wave data bvcre recorded from only one region of the visual cortex and in response to diffuse photic stimulation. To resolve these differ- ences the slow-wave response from areas 17, 18, and 19 and single-unit activity in response to diffuse photic stimulation were studied. The response evoked from the deprived eye was found to be reduced in area 17 but was sometimes actually larger in areas 18 and 19 than the response evoked from the good eye. Of 45 single units tested, 36 could be driven by stimulation of either eye. Evidently, photic stimulation of the deprived eye is capable of evoking neuronal discharge lvithin the visual cortex. Indeed, the ability of neuronal transmission from the deprived eye to activate neurons within the visual cortex is in keeping with the evidence on behavioral recovery from monocular eyelid closure. INTRODUCTIOX The effects of monocular eyelid closure on developlent of the stimulus specificity of new-oils within the visual cortex have been repeatedly de- scribed. Those reports have consistently demonstrated that monocular eyelid closure during the first two nlonths of life leads to an irreversible change in the response characteristics of single units (5, 12, 39, 40). AS 1 The author wishes to thank Dr. Robert W. Doty for his valuable suggestions in the preparation of this manuscript. 211 Copyright 0 1977 by Academic Press, Inc. All rights of reproduction in any form reservrd. ISSiX 0014-4886
Transcript of Photic evoked activity in the visual cortex of monocularly deprived cats

EXPERIMENTAL NEUROLOGY 55, 211-225 (1977)
Photic Evoked Activity in the Visual Cortex of Monocularly Deprived Cats
Departrrrent of Phtrrrrrocolog~, Untiwsity of Pittsburgh School of Mdicim,
Pittsbwglz, Pcnrfsylew~ia 151761
Received Ocfohcr 22, 19i6
Monocular eyelid closure during the first 2 months of life has previously been shown to cause a dramatic reduction in the number of neurons that can be activated by photic stimulation of the deprived eye. Those studies recorded single neuron responses to stimulation with discrete forms. In contrast, the author has previously shown that the initial components of the slow-wave response from one region of the cortex evoked by diffuse stimulation of the deprived eye are actually similar to these components when evoked from the nondeprived eye. The disparity in these findings may be due to the fact that the slow-wave data bvcre recorded from only one region of the visual cortex and in response to diffuse photic stimulation. To resolve these differ- ences the slow-wave response from areas 17, 18, and 19 and single-unit activity in response to diffuse photic stimulation were studied. The response evoked from the deprived eye was found to be reduced in area 17 but was sometimes actually larger in areas 18 and 19 than the response evoked from the good eye. Of 45 single units tested, 36 could be driven by stimulation of either eye. Evidently, photic stimulation of the deprived eye is capable of evoking neuronal discharge lvithin the visual cortex. Indeed, the ability of neuronal transmission from the deprived eye to activate neurons within the visual cortex is in keeping with the evidence on behavioral recovery from monocular eyelid closure.
INTRODUCTIOX
The effects of monocular eyelid closure on developlent of the stimulus specificity of new-oils within the visual cortex have been repeatedly de- scribed. Those reports have consistently demonstrated that monocular eyelid closure during the first two nlonths of life leads to an irreversible
change in the response characteristics of single units (5, 12, 39, 40). AS
1 The author wishes to thank Dr. Robert W. Doty for his valuable suggestions in the preparation of this manuscript.
211
Copyright 0 1977 by Academic Press, Inc. All rights of reproduction in any form reservrd. ISSiX 0014-4886

212 JAY D. GLASS
a result of the deprivation, a stimulus which will activate a cortical neuron when presented to the nondeprived eye no longer will activate the same neuron when presented to the deprived eye, even after 5 years of closure reversal (31).
Not only does the deprivation affect the response properties of visual cortex neurons, but also results in marked impairment of the cat’s ability to use the deprived eye for the control of its behavior (5, 8, 11). How- ever, in spite of the irreversible electrophysiologic changes within the visual cortex, during the next several months postdeprivation, the cat does develop some capacity to behaviorally utilize visual cues viewed with the deprived eye ( 11, 13). The lack of response of cortical neurons to stimulation of the deprived eye stands in contrast to the cat’s ability to perform behavioral tasks based on visual stimuli seen with the deprived eye.
The author (15, 16) has previously found the amplitude of the initial components of the slow-wave, visually evoked response from the deprived eye to be comparable to the response evoked from the cat’s good eye. Although this finding is in keeping with the visuobehavioral capacity of the cat, it is surprising that the comparatively normal visually evoked response is present in spite of the previously reported inability of stimu- lation of the deprived eye to drive cortical neurons.
Two explanations for the disparity between the slow-wave and single- unit findings seem most plausible. First, the slow-wave study recorded the visually evoked response from only one region of the cortex; perhaps a severe slow-wave deficit would manifest itself in other areas of the visual cortex. Second, the single-unit studies used very specific types of stimuli, either small spots of light or discrete forms, whereas the slow wave was evoked by diffuse photic stimulation. To resolve this issue, in monocularly deprived cats the slow-wave response from many regions of visual cortex and single-unit activity were recorded in response to diffuse photic stimulation. I now have found that the previously reported slow- wave data do generalize to several regions of the visual cortex, and, most important, dieuse stimulation of the deprived eye in fact will activate single units within binocular regions of the visual cortex.
METHOD
In kittens, just prior to the time of normal eyelid separation, under halo- thane anesthesia the eyelid edges were trimmed, juxtaposed, and sutured closed over one eye.
Chronic Stzcdies. Adult cats (N = 5) of various ages (Table 1) were anesthetized with freshly recrystallized a-chloralose (7) dissolved in pro- pylene glycol and administered intraperitoneally at 65 mg/kg. The cat’s

VISYAI, DEPKI\‘ATION 213
temperature was maintained at 38.5 * 0.5”C by a therniostatically cou- trolled heating pad.
Under aseptic conditions, tungsten wire, 0.25 mm in diameter, insulated with Epoxylite, except for a conical-shape tip of 0.5~mm length, was implanted into areas 17, lS, and 19 (176) of the visual cortex (Fig. 1 j . Sufficient bone was removed to allow clear visual identification of areas 17, 18, and 19. The electrode was driven into the cortex such that only the 0.5-nm conical tip penetrated the cortical surface. l’hotic stimulatiou was used to verify the recording functions of the electrodes. The elec- trodes were cemented to the skull and crinlped into the pins of an auiphe- no1 plug. The plug was attached to the skull with dental acrylic and additionally anchored by four inverted stainless-steel screws, with the head of each screw between the dura and skull and each nut finger-tight on the external surface of the skull. The screws were placed bilaterally in the lambdoidal ridge and in the bone overlying the frontal sinus. A stainless-steel wire connected the four screws, and it was crimped to a pin of the plug, which served as the reference for the monopolar record- ing. Berkeley et al. (2,) have shown the similarity of the visually evoked response recorded either bipolarly or n1onopolarly from the visual cortex. The four screws and the two fixation tubes were all embedded within the acrylic skull cap.
For 2 to 3 weeks prior to implantation, to habituate the cat to the re- straint device, the animal spent approximately 1 h,‘day in the laboratory held in a Lexan restraint box (31 1. On the second, third, and fourth days after implantation, the cat was placed in the restraint box, its head was held rigid with the Kopf chronic fixation system, and its pupils were dilated with 10% phenylephrine hydrochloride (Neosyuephrine HCI, Winthrop) Photic stiniulation was delivered to each eye independently from a Grass I’S_)_3 stimulator, intensity setting 1 (Grass rating, 93,750 cp), with the globe placed 65 cn~ in front of the cat. Approximately 30 stimuli were presented to only the deprived eye whose lids had been sepa- rated during the implantation, and approximately 30 stimuli were pre- sented to only the good eye. The nonstinn~latetl eye was covered with a patch that sufficed to eliminate light leakage as demonstrated by the lack of a visually evoked response when both eyes were covered simultaneously. This procedure also confirmed that the click of the lanq) discharge was not respousible for evoking the response.
The pilot lights from the recording apparatus created sufficiently dim illumination so that, after a period of dark adaptation, it was possible for the experimenter to view the cat’s face during the recordings. Stimuli
were triggered by a hand-operated button, apin-oxinlately oiie stimulus every 5 to 10 s. By watching the cat, it was possible to deliver stimuli

214 JAY D. GLASS
while the cat was resting quietly, with the appropriate eye fully open. The reliability of the visually evoked response from either eye over the 3-day test period following the implantation attests to the validity of the stimulation procedures.
Neural activity could be recorded from four electrodes simultane- ously. Four FM 122 Tektronix preamplifiers were used (low-frequency cutoff, 0.8 Hz ; high-frequency cutoff, 1 kHz). The data were observed on an oscilloscope and stored on magnetic tape. Prior to averaging the -visually evoked response with a TMC CAT 400 C, the single-response data were previewed and any trial showing movement artifact was elimi- nated from analysis. The sum of 25 visually evoked responses was com- puted with the CAT and written out on a Mosely strip chart recorder (Fig. 1). The individual visually evoked responses composing the CAT sums shown in Fig. 1 were individually photographed from the oscillo- scope. The peak-to-peak amplitudes for the initial positive-negative com- ponent and the latency to first peak were measured for each response. The means and standard errors for amplitudes and latencies of the 25 responses in each test condition are presented in Table 2.
The results from all cats with implanted electrodes are given in Table 1. The amplitude measures presented were generated by measuring in milli- meters the distance from the initial positive peak to the initial negative peak of the visually evoked response. The ratio of good eye versus de- prived eye amplitude (the amplitude of the response evoked from the deprived eye to the amplitude of the response evoked from the good eye) expresses the alteration in response amplitude as a result of the deprivation. The latency measures in Table 1 were derived by subtracting the latency to the initial positive peak of the response evoked from the deprived eye from the latency to the initial positive peak of the response evoked from the good eye.
Acztte Stltdies. The adult cats (N = 3) were anesthetized with freshly recrystallized a-chloralose (7) dissolved in propylene glycol (50 mg/ml) and injected intravenously at 65 mg/kg. The femoral vein and artery and the trachea were cannulated. The arterial cannula was connected to a Hg manometer; blood pressure was above 100 mm Hg throughout the experi- ment. A thermostatically controlled heating pad was used to maintain the cat’s temperature at 38 +- 0.5”C. A total of 10 ml 0.9% saline was in- jected intravenously for 1 h during the experiment. Two drops of 10% phenylephrine hydrochloride (Neosynephrine HCI, Winthrop) in each eye maintained dilated pupils during the recording session.
The cat was placed in a Kopf stereotaxic frame designed to allow for unobstructed forward vision. The dorsal surface of the skull was exposed and the bone removed bilaterally overlying the marginal gyri to allow

VISUAL DEPRIVATION 215
introduction of the microelectrode into the fovea1 region of the cortex (3, 35). A dam of dental acrylic was built up around the skull opening. Fixation tubes were cemented to the skull and secured to the head frame so that eye and mouth bars could be removed. Just prior to introduction of the microelectrode (etched tungsten with varnish insulation) the dura overlying the cortex was removed. Under microscopic viewing the micro- electrode was placed on the surface of the cortex and. to control pulsa- tions, the acrylic well was filled with 4% agar at 42°C.
With only background illumination from the pilot lights of the record- ing apparatus, the niicroelectrode was advanced into the cortex with a Kopf hydraulic microdrive while a flashlight beam was moved around the wall of the laboratory facing the cat. When a stable cell was en- countered, the recording conm~enced. The deprived eye was covered with a black rubber patch, thoroughly secured over the eye. A series of 10 stimuli at 0.2 Hz was then delivered. Immediately afterward, the patch was transferred to the good eye, and the same series of stimulations was presented to the deprived eye. On some occasions the stimulation was also performed at 2 Hz. The lids and nictitating membrane of the stimu- lated eye were held retracted during stimulation. Frequent manipulation of the patch was sufficient to keep the cornea moist.
Photic stitnulation was delivered by a Grass PS Z? stimulator, intensity setting 1 (Grass rating, 93,750 cpj, with the flash globe 65 cm from the cat’s nose. The inside of the globe was padded with foam rubber to dampen the click emitted by the discharge of the lamp. Covering both eyes and flashing the light produced no response so one can assume that the background noise of the laboratory machinery was sufficient to mask the discharge of the lamp. In addition. this provided a test for the efficacy of the patching procedure.
The unit activity, recorded 11iot1opolarly iii reference to the stereotaxic frame, was fed through an impedance matching probe with a gain of 5 and then into a Tektronix FM 122 preamplifier specially modified with a low-frequency cutoff of 600 Hz and set at high frequency of 10 kHz. During certain recordings the activity from the microelectrode was passed through a second FM 122 preamplifier with a low frequency of 0.S Hz and high frequency of 1 kHz. The data were observed during the experi- ment on an oscilloscope and stored on magnetic tape for subsequent photography.
After the final penetration for each cat, the electrode was positio;led 2 tntn below the cortical surface, dc current of 5 mA for 5 s was passed, the electrode was then withdrawn 1 mm, and current again passed. The appropriate section of the marginal gyms was removed, fixed in formalin,
e1nbetlded in celloitli1i, sectioned at 30 pm, stained with crcsyl violet, and

216 JAY D. GLASS
mounted on glass slides. From the lesion markings and the depth as indicated on the Kopf microdrive, the position of each recording could be identified. Although only the last penetration of any one cat was so marked, the previous penetrations had been made in a similar fashion, perpendicular to the crown of the marginal gyrus.
RESULTS
The following description of the amplitude and latencies of the visually evoked responses recorded from areas 17, 18, and 19 of the implanted cats is based on the measures of response amplitude as expressed in Table 1. For area 17, the response evoked from the deprived eye was at best equal (H,, 17A contralateral) to that from the good eye. The largest effect of the deprivation was a 44% (Hz, 17P ipsilateral) reduction in the re- sponse evoked from the deprived eye compared to the good eye. Except for E4, the response ipsilateral to the deprived eye was always reduced to a greater extent than the response contralateral to the deprived eye.
The effect of the deprivation on the visually evoked responses recorded from area 18 shows a much greater variation than those recorded from
TABLE 1
Visually Evoked Response Amplitudes and Latencies from
Areas 17, 18, and 19 of Deprived Cats
Cat
(age in months)
Electrode Amplitude” Latency a position”
Contralatrral Ipsilateral Contralateral Ipsilateral
Ha (9) 17A 1 .oo 0.75 +3 $2 17P 0.86 0.81 0 $2 18 1.18 1.15 +2 0
19 0.81 1.25 -4 $3
& (14) 17A 0.87 0.71 0 0 18 1.70 1.33 0 0 19 0.92 1 .oo +1 0
E4 (12) 17A 0.53 0.66 -2 -2
18 0.99 0.93 0 +2 Da (14) 17A 0.67 0.51 -2 0
19 1.15 0.65 -6 +4
Hz (18) 17A 0.94 0.83 0 0
17P 0.64 0.44 -2 $3
a Electrode positions as shown in Fig. 1. A = anterior, P = posterior. b Amplitude from initial positive peak to initial negative peak is expressed as ratio cf
deprived: good, and latency to initial positive peak is expressed in milliseconds as good - deprived.

VISUAL DEPRIVATION 217
FIG. 1. Cat HS, 9 months of age, with closure of the right eye. Shoxn is the CAT
sum of 25 responses evoked from good (G) and deprived (D) eyes and recorded from areas 17, 18, and 19 of the visual cortex in alert animal. Stimulus occurs at dot;
positivity, downward; calibration, 100 ms and 0.5 mV.
area 17. In cat E+ the responses evoked from the good and deprived eyes are approximately equal (contralateral, 0.99 ; ipsilateral, 0.93). Those re- corded from area 18 in cats ES and H5 demonstrate the reverse of the
effects found in area 17. In both cats, the visually evoked response from area 18 was larger when evoked from the deprived eye than from
the good eye. The results from area 19 show a sinlilar mixture of effects. Ia some
cases the visually evoked response from the deprived eye was larger than that from the good eye (H,, ipsilateral; D3, contralateral) whereas in
other cases the reverse was found ( H5, contralateral ; DB, ipsilateral) . In cat ES, a minimal difference between good-eye and deprived-eye responses was found (0.92, contralateral ; 1.0, ipsilateral) .

218 JAY D. GLASS
TABLE 2
Mean Latencies and Amplitudes for 25 Individual yisually Evoked
Responses from Cat Hja
Good
Latency b
17A
17P 17
19
Amplituded
17A 17P
18
19
Right Left
22.6 (0.12)c 18.4 (0.13) 21.4 (0.08) 20.6 (0.08)
27.6 (0.08) 25.8 (0.01) 24.8 (0.12) 30.6 (0.09)
0.35 (0.08)” 0.26 (0.06)
0.24 (0.05) 0.18 (0.01) 0.38 (0.02) 0.37 (0.03) 0.28 (0.05) 0.25 (0.03)
Deprived
Right Left
22.2 (0.07) 17.0 (0.08) 11.8 (0.08) 22.2 (0.07)
25.8 (0.07) 23.6 (0.07) 24.0 (0.06) 32.8 (0.11)
0.20 (0.07) 0.34 (0.04) 0.16 (0.01) 0.17 (0.02) 0.40 (0.03) 0.40 (0.04)
0.29 (0.02) 0.21 (0.02)
@ See Fig. 1.
b Measured in milliseconds to initial positive peak of visually evoked response. c Standard error.
d Measured in millivolts peak-to-peak for initial positive-negative component of visually evoked response.
No consistent effects of the deprivation on the latencies of the visually evoked responses (Table 1) were found in area 17, 18, or 19. For ex- ample, in cat ES the latencies to the responses from these areas, both ipsilateral and contralateral, were similar whether evoked from the good or the deprived eye. However, in cat H;, area 17A, the ipsilateral and contralateral responses evoked from the deprived eye occurred 2 and 3 ms sooner, respectively, than did the ipsilateral or contralateral response evoked from the good eye, whereas from 17P this result was found only for the comparison of ipsilateral visually evoked responses. For area 19 of Hg, the latency to the ipsilateral response was 3 ms shorter when evoked from the deprived eye compared to the latency when evoked from the good eye. A similar mixture of effects was found in the other three cats.
The CAT sums of the 25 visually evoked responses recorded from cat H5 are presented in Fig. 1, and mean amplitudes and latencies taken from the individual responses are given in Table 2. One effect of the deprivation on the visually evoked response that has been found con- sistently is not reflected in the amplitude measurements presented in Tables 1 and 2. This effect is a general “detuning” of certain components of the visually evoked response. The sharp, distinct components evoked from the good eye are not nearly as well defined when evoked from the de-

VISI-AL DEI’RI\‘r\TION 219
prived eye. An example of this effect is presented most clearly in the record- ings from area 18 (Fig. 1). After the negative peak of the visually evoked response, the return to baseline occurs much more slowly for the re- sponse evoked from the deprived eye than for that from the good eye. This effect, the lack of definition of later components following the initial positive-negative waves, is extremely consistent whether the visually evoked response is recorded under chloralose or from the awake animal. This finding was presented in Figs. 1 through 4 of a previous publication showing the effect of the deprivation on visually evoked responses in the visual cortex of the chloralose-anesthetized cat (16).
In three chloralose-anesthetized cats, single cells were tested for re- sponsiveness to stimulation of good and deprived eyes. Of 45 isolated units, 36 were found to be escitetl by stimulation of either eye, and the response properties of the cell did not depend on the hemisphere in which the cells were located. Nor did the length of deprivation for the three cats (9, 11, and 17 ~~~ol~thsj correlate with the degree of photic activation from the deprived eye. Most of the cells were found between 1.1 and 1.8 mm below the surface of the cortex as determined b\- a reconstruction of the electrode tract from histologic material.
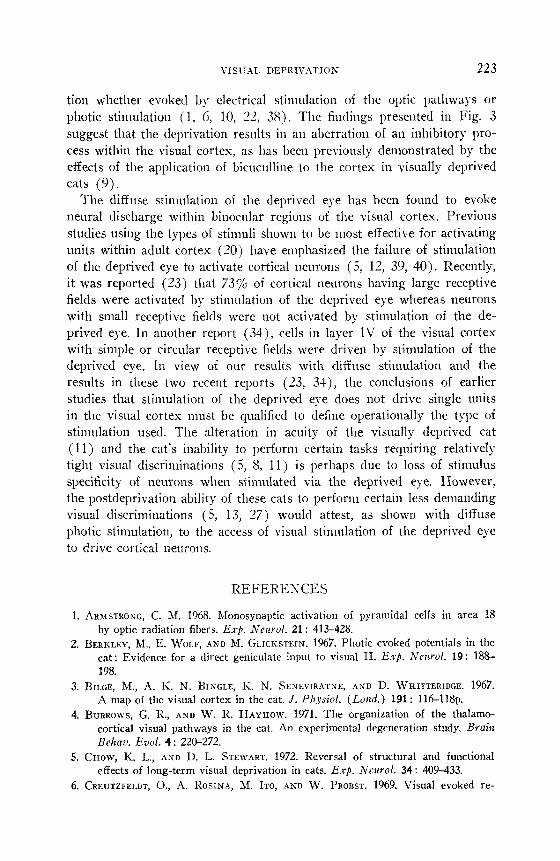
Figure 21 presents five units and their responses to stimulation of the
DEP
A
“i(rci- *
-44-i
El
E
+
+
DEP
2Hz
FIG. 2. A-Unit activity in response to light flash to good and deprived (DEP)
eyes recorded from fovea1 projection of left hemisphere. Units A and B from cat with closure of right eye for 9 months, C and D from cat with closure of right eye for 11 months, and E from cat with closure of right eye for 17 months. Calibration,
100 ms; stimulus occurs at dot. B-Unit activity in response to photic stimulation of deprived right eye at 2 Hz (dots). Recorded from fovea1 representation in left hemi-
sphere of cat deprived for 11 months. Calibration, 1 s.
220 JAY D. GLASS
GOOD DEP
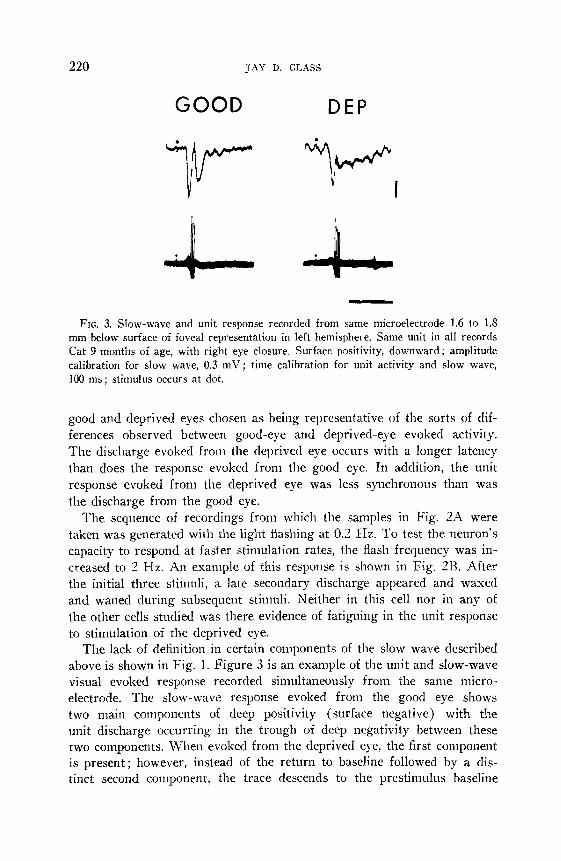
FIG. 3. Slow-wave and unit response recorded from same microelectrode 1.6 to l.S mm below surface of fovea1 representation in left hemisphere. Same unit in all records Cat 9 months of age, with right eye closure. Surface positivity, downward; amplitude calibration for slow wave, 0.3 mV; time calibration for unit activity and slow wave, 100 ms: stimulus occurs at dot.
good and deprived eyes chosen as being representative of the sorts of dif- ferences observed between good-eye and deprived-eye evoked activity.
The discharge evoked from the deprived eye occurs with a longer latency than does the response evoked from the good eye. In addition, the unit response evoked from the deprived eye was less synchronous than was
the discharge from the good eye.
The sequence of recordings from which the samples in Fig. 2A were taken was generated with the light flashing at 0.2 Hz. To test the neuron’s capacity to respond at faster stimulation rates, the flash frequency was in-
creased to 2 Hz. An example of this response is shown in Fig. 213. After the initial three stimuli, a late secondary discharge appeared and waxed
and waned during subsequent stimuli. Neither in this cell nor in any of
the other cells studied was there evidence of fatiguing in the unit response
to stimulation of the deprived eye. The lack of definition in certain components of the slow wave described
above is shown in Fig. 1. Figure 3 is an example of the unit and slow-wave visual evoked response recorded simultaneously from the same micro- electrode. The slow-wave response evoked from the good eye shows two main components of deep positivity (surface negative) with the unit discharge occurring in the trough of deep negativity between these
two components. When evoked from the deprived eye, the first component is present; however, instead of the return to baseline followed by a dis- tinct second component, the trace descends to the prestimulus baseline

\‘JSVAL I~EI’l<I\‘.~‘rIoN 221
level during a relati\:el\- Ion g tilue course. The unit discharge begins in the trough but extends in time into the lleriod when the discrete second
coinponent should have occurred.
DISCUSSIC)X
The findings from the chronic animals demonstrate that diffuse stimu-
lation of the deprived eye can evoke neural potentials over widespread regions of the visual cortex. The reliability of this finding is attested 1)~
the consistency of the visually evoked responses during the 3-day post- implant test period. In area 17, the initial components of the response
evoked from the deprived eye tend to be smaller than those same coni- ponents when evoked from the good eye. However, the response recorded
from areas 18 and 19 may actually be larger when evoked from the de-
prived eye in comparison to that evoked from the good eye. The thalamic projections to area 17 originate principally from cells in the laminated portion of the lateral geniculate nucleus (14, 35, 3X). The thalamic pro-
jections to area 1S include not only the laminated portion of the lateral geniculate (17. 28) but also the nietlial intralaminar nucleus (4, 1-F. 23,
25, 138. 29, 41 ) and the lmlvinar (Z-4, -75 ) The cited anatomic evidence . for the lateral geniculate projection to area 1S is sulq)ortetl electropliysio-
logically (2, 33. 36, 37 ). Area 19 also receives input from the medial intralaniinar nucleus ( 14, 21, -Z, 7> 41) and additionally from the posterior nucleus and pulvinar (4, 23, I ‘S) . Although the effects of visual deprivation on these specific divisions of the tlialantocortical projections have not
been studied electropliysiologically, one may speculate that the cor- ticopetal projections to areas 18 and 19 from the medial intralaininar
nucleus, plvinar, and posterior nucleus may not be as susceptible to the deprivation as are the projections to area 17 from the principal laminae
of the lateral geiiiculate. Within areas 17, lS, and 19 the visually evoked response iron1 the
hemisphere ipsilateral to the deprived eye was altered to a greater extent
than was the response from the hemisphere contralateral to the deprived
eye. The relatively greater reduction in the atqlitude for the ipsilateral response may be explained in terms of the cortical competition hypothesis.
Various effects of visual deprivation from the lateral geniculate nucleus to the visual cortex have been explained based on a model that has axon terminals from geniculate cells competing for synaptic sites on binocularly activated cortical neurons (lS, 30, 40). The axon terminals of geniculate
cells receiving a “normal” quantity of activation from the good eye are
thought to dominate the axon terminals coming from the geniculate cells receiving a “subnormal” input from the deprived eye. With the cat having a larger projection from each eye to the coiitralaterai hemisphere than to

222 JAY D. GLASS
the ipsilateral hemisphere [about GO:40 (20) 1, in the case of the contra- lateral hemisphere it is the 60$ from the deprived eye competing against the 4070 from the good eye. In contrast, for the hemisphere ipsilateral to the deprived eye, the 60% from the good eye overwhelms the 4OrJG front the deprived eye. Therefore, the contralateral projections from the de- prived eye have a better chance than do the ipsilateral projections for survival in the struggle for functional synapses upon cortical neurons.
Of 45 single units studied in three cats, 36 could be driven by good and deprived eyes. The other nine were influenced only by stimulation of the good eye. The unit discharge from the deprived eye occurred with a longer latency than did the discharge evoked from the good eye. A possible explanation for this effect lies in the grouping of retino-geniculo-cortical axons into the X-Y classification (19, 32, 33). As a result of monocular diffuse-light rearing, a loss of Y cells in the binocular segments of the lateral geniculate nucleus has been reported (30). The Y system is com- posed of axons that conduct more rapidly than do the axons of the X system. The longer latency of response found in this report, recorded from a binocular region of the cortex, may be due to selective elimination of Y fibers. Both X and Y systems play a role in generating the response to stimulation of the good eye ; however, for stimulation of the deprived eye, only the X system is involved in driving the cortical neurons and, thus, results in a longer latency to discharge.
A distinct difference between good-eye and deprived-eye evoked re- sponses was found in a certain aspect of the waveform. After the peak of the initial negative wave, the response evoked from the good eye would have several distinct later components. When evoked from the deprived eye, these components were not nearly as sharply defined. Figure 3 shows that when the response is evoked from good and deprived eyes, the cell begins its response after the peak of the initial surface-negative wave and continues firing during the subsequent trough of relative surface posi- tivity. In the case of the response evoked from the good eye, the unit discharge ceases with the appearance of the discrete secondary surface- negative wave. In the slow-wave record evoked from the deprived eye, the discrete secondary surface-negative wave is missing, as previously described for Fig. 1, and the response from the deprived eye maintains its discharge into this time period. As described in Results, this finding was true for the alert animal (Fig. 1) and the chloralose-anesthetized animal [Fig. 3 and (15, 16)]. The longer-duration unit response when evoked from the deprived eye compared to the response from the good
eye is also present in Fig. 2A, D, E. The relationship between slow-wave components and unit activity has been the subject of conflicting claims,
both positive and negative waves having been associated with unit inhibi-
\‘ISPAL DEPRIVATIOX 223
tion whether evoked by electrical stimulation of the optic 1)atliways or photic stimulation (1, 6, 10, --, ?) 3s). The fintlings presented in Fig. 3
suggest that the deprivation results in an aberration of an inhibitory pro- cess within the visual cortex, as has been previously demonstrated by the effects of the application of bicuculline to the cortex in visually deprived cats (9).
The diffuse stimulation of the deprived eye has been found to evoke neural discharge within binocular regions of the visual cortex. Previous studies using the types of stimuli shown to be most effective for activating units within adult cortex (30) have emphasized the failure of stimulation of the deprived eye to activate cortical neurons (5, 12, 39, 40). Recently, it was reported (23) that 73% of cortical neurons having large receptive fields were activated by stimulation of the deprived eye whereas neurons with small receptive fields were not activated by stimulation of the de- prived eye. In another report (31)) cells in layer IV of the visual cortex with simple or circular receptive fields were driven by stimulation of the deprived eye. In view of our results with diffuse stimulation and the results in these two recent reports (23, 3-l), the conclusions of earlier studies that stimulation of the deprived eye does not drive single units in the visual cortex must be qualified to define operationally the type of stimulation used. The alteration in acuity of the visually deprived cat (11) and the cat’s inability to perform certain tasks requiring relatively tight visual discriminations (5, 8, 11) is perhaps due to loss of stimulus specificity of neurons when stimulated via the deprived eye. However, the postdeprivation ability of these cats to perform certain less demanding visual discriminations (5, 13, 27) would attest, as shown with diffuse photic stimulation, to the access of visual stimulation of the deprived eye to drive cortical neurons.
REFERESCES
1. ARMSTRONG, C. RI. 1968. Monosynaptic activation of pyramidal cells in area 18
by optic radiation fibers. Exp. Nenvol. 21: 413-428.
2. BERKLEY, M., E. WOLF, AND M, GLICKSTEIN. 1967. Photic evoked potentials in the
cat: Evidence for a direct geniculate input to visual II. Exp. Nczcrol. 19: 18%
198.
3. BILGE, M., A. K. IV. BINGLE, K. T\i. SENEVIRATNE, AND D. WHITTERIDGE. 1967.
A map of the visual cortex in the cat. J. Ph~jsiol. (Lond.) 191 : 116-118~.
4. BURROWS, G. R., AND W. R. HAYHOW. 1971. The organization of the thalamo- cortical visual pathways in the cat. An experimental degeneration study. Bruin
Bchav. Evol. 4: 220-272. 5. CHOW, K. L., AND D. L. STEWART. 1972. Reversal of structural and functional
effects of long-term visual deprivation in cats. Exp. Ncurol. 34: 409-433. 6. CREUTZFELDT, O., A. ROSINA, M. ITO, AND W. PROBST. 1969. Visual evoked re-

224 JAY D. GLASS
sponse of single cells and of the EEG in primary visual area of the cat. J. Ncrm~hysiol. 32 : 127-139.
7. DENAVIT, M. 1963. Action diffGrentielle du quelques anesthesiques sur les reponses
de structures aliment&es par lcs voics specifiques ou associatives. Anestk .41arrlg. (Pwis) 20 : 747-809.
8. DEWS, P. B., AND T. N. WIESEI., 1970. Consequences of monocular deprivation
on visual behavior in kittens. J. Ph~siol. (Load.) 206: 437-455.
9. DUFFY, F. H., S. R. SNODGKASS, J. L. BURCHIFIEL, AND J. L. CONWAY. 1976.
Bicuculline reversal of deprivation amblyopia in the cat. Nature (Londolz) 260 : 256-257.
10. FROMM, G. H., AND H. W. BOND. 1967. The relationship between neuron activity
and cortical steady potentials. Elrctroemcphalogr. Clba. Neurophysiol. 22 :
159-166. 11. GANZ, L., AND M. FITCH. 1968. The effect of visual deprivation on perceptual
behavior. Exp. Nrtlvol. 22: 638-660. 12. GANZ, L., M. FITCH, AND J. A. SATTERBERG. 1968. The selective effect of visual
deprivation on receptive field shape determined electrophysiologically. Exp.
Ncurol. 22: 614637. 13. GANZ, L., H. V. B. HIRSCH, AND S. B. TIEMAN. 1972. The nature of perceptual
deficits in visually deprived cats. Brain Rcs. 44 : 547-568. 14. GAREY, L. J., AND T. P. S. POWELL. 1967. The projection of the lateral geniculate
nucleus upon the cortex in the cat. Proc. R. Sot. Lo& (Biol.) 169: 107-126. 15. GLASS, J. D. 1971. Photically evoked potentials in cat neocortex altered by visual
pattern deprivation. Braix Rcs. 30: 207-210.
16. GLASS, J. D. 1973. Photically evoked potentials from cat neocortex before and
after recovery from visual deprivation. Exp. Ne~trol. 39: 123-139.
17. GLICKSTEIN, M., R. A. KING, J. MILLER, A~TD M. BERKLEY. 1967. Cortical pro-
jections from dorsal lateral geniculate nucleus of cats. J. Conzp. Newel. 130:
55-76.
18. GUILLERY, R. W., AND D. J. STELZNER. 1970. The differential effects of unilateral
lid closure upon the monocular and binocular segments of the dorsal lateral geniculate nucleus in the cat. J. Cokrrp. Nrlrrol. 139: 413422.
19. HOFFIMAN, K. P., J. STONE, AND S. M. SHERMAN. 1972. Relay of receptive-field
properties in dorsal lateral geniculate nucleus of the cat. J. Nezrroph.wioZ. 35:
518-531. 20. HUBEL, D. H., AND T. N. WIESEL. 1962. Receptive fields, binocular interaction
and functional architecture in the cat’s visual cortex. J. PIzysiol. (LoIz~.) 160:
106154.
21. HUBEL, D. H., AND T. N. WIESEL. 1970. The period of susceptibility to the physi- ological effects of unilateral eye closure in kittens. /. Physiol. (Lad.) 206:
419-436.
22. KONDRATJEVA, I. N., AND V. B. POLYANSKY. 1968. Inhibition in the neuronal
systems of the visual cortex. Act. New. Super. (Phraka) 10: I-11.
23. LEVENTHAL, A. G., AND H. V. B. HIRSCH. 1976. Response characteristics of mo-
nocular and of binocular neurons in the visual cortex of pattern deprived cats. Neurosci. Abst. 2 : 1124.
24. MACIEWICZ, R. J. 1975. Thalamic afferents to areas 17, 18, and 19 of cat cortex
traced with horseradish peroxidase. Brain Res. 84: 388-412.
25. NIIMI, K., AND J. M. SPRAGUE. 1970. Thalamo-cortical organization of the visual system in the cat. J. Corrrp. Neural. 138: 219-238.

VISUAL DEPRIVATION 22.5
26. OTSUKA, I<., 12x1) R. H.\SSI,I.X 1962. i’bcr Aulbau and Gliedcrundg dcr corticalen SeIlspIliire hei (ICI- Katzc. .-lr<.i/. Z’.c~,c.hilf. A’c~~;vII~:~. 203 : 212-233.
27. RIZZ(~I.IZTTI, G., AND V. ‘L~IIAKII~. 1071. L’attcrn discrimination in monocularly
reared cats. E‘I~. 1\:srfr-0/. 33: 181-194.
28. ROSENQLVST, -4. C., AK;D S. B. Eutv~wus. 1973. Projections of the lateral geniculate nucleus in the cat as demonstrntrd by autoradiography. .itrrc~t. Rrc. 175 : 428-429.
29. ROSIGKOL, S., AXU >I. COILISIER. 1971. X light microscope study of degeneration patterns in cat cortex after lesions (It the lateral geniculate nucleus. L’ision RCS.
Sup/d. No 3: 329-338.
30. SIIEKMAN, S. M., R. W. GUILLEKY, J. H. Krws, AND R. J. SZNDERSON. 1974. Behavioral, electropll~siological and morphological studies of binocular corn-
petition in the development of tile geniculocurtical path\vays of cat. J. CojJrp. Nc~wol. 158 : l-18.
31. SIEGEL, J., i\~n C. I.INE~IXKY. 1971. :Z method for recording single unit activity
from unanesthetized chronic cats. I’/>.~sh)i. ficlw~. Q : 607-608.
32. STONE, J., ANI) K. P. HOFFMAN. 1971. Conduction velocity as a parameter in the organization of the afferent relay in the cat’s lateral geniculate nucleus. Brain
Rcs. 32: 454-459.
33. STONE, J., AND B. DIwfER. 1973. Projection of S and T cells of the cat’s lateral
geniculate nucleus to areas 17 and 18 of visual cortex. J. Ncnrophysiol. 36: 551-567.
34. STRYKER, hl. I’., AKD C. J. SIIATZ. 1976. Ocular dominance in layer IV of the
normal and deprived cat’s visual cortex. Nclrr-cwi. .gbsf. 2 : 1137.
35. TALBOT, S. A., AND W. II. MARSIIAIL. 1941. Physiological studies on neural mechanisms of visual localization and discrimination. ,f U~ZY. J. Opiztixrln~ol. 24:
1255-1263.
36. TOYOMA, Ii., AND K. MATSLJXA~II. 1968. Synaptic action of specific visual im-
pulses upon cat’s parastriate cortex. ijvuirl Ices. 10: 473-476. 37. TRETTER, I;., hf. CYXAMX, AND W. SIKGER. 1975. Cat parastriate cortex; a pri-
mary or secondary visual area. J. Xcurophysiol. 38 : 1099-1113. 38. WmB,v, L., ASD C. AJMOKE-MARSAN. 1960. Unitary analysis of the response
elicited in the visual cortex of cat. .-i~cl~. Ifd. Bio(. 98: 248-274.
39. WIESEL, T. N., AKD D. H. Hcnxr.. 1963. Single ccl1 responses in striate cortex of
kittens deprived of vision in one eye. J. N~~~ruoQlr.vsio/, 2’6 : 1003-1017.
40. WIESET., T. N., AXD I). H. H<~BEI,. 1965. Comparison of the effects of unilateral
and bilateral eye cl(lsure on cortical unit responses in kittens. J. X’rwopl~ysiol.
28 : 1028-1040.
41. WILSON-, I& E., AND B. G. CRACG. 1967. Projections from the lateral geniculate nucleus in the cat and monkey J. .-lrrc~l. 101 : 677-692.