Phosphorus-31 Knigh shifts in amorphous nickel-phosphorus and ...
After online publication, subscribers (personal/institutional) to this journal will haveaccess to the complete article via the DOI using the URL:
If you would like to know when your article has been published online, take advantageof our free alert service. For registration and further information, go to:
.
Due to the electronic nature of the procedure, the manuscript and the original figureswill only be returned to you on special request. When you return your corrections,please inform us, if you would like to have these documents returned.
Dear Author
Here are the proofs of your article.
• You can submit your corrections online, via e-mail or by fax.
• For online submission please insert your corrections in the online correction form.
Always indicate the line number to which the correction refers.
• You can also insert your corrections in the proof PDF and email the annotated PDF.
• For fax submission, please ensure that your corrections are clearly legible. Use a fine
black pen and write the correction in the margin, not too close to the edge of the page.
• Remember to note the journal title, article number, and your name when sending your
response via e-mail or fax.
• Check the metadata sheet to make sure that the header information, especially author
names and the corresponding affiliations are correctly shown.
• Check the questions that may have arisen during copy editing and insert your
answers/corrections.
• Check that the text is complete and that all figures, tables and their legends are included.
Also check the accuracy of special characters, equations, and electronic supplementary
material if applicable. If necessary refer to the Edited manuscript.
• The publication of inaccurate data such as dosages and units can have serious
consequences. Please take particular care that all such details are correct.
• Please do not make changes that involve only matters of style. We have generally
introduced forms that follow the journal’s style.
• Substantial changes in content, e.g., new results, corrected values, title and authorship are
not allowed without the approval of the responsible editor. In such a case, please contact
the Editorial Office and return his/her consent together with the proof.
• If we do not receive your corrections within 48 hours, we will send you a reminder.
• Your article will be published Online First approximately one week after receipt of your
corrected proofs. This is the official first publication citable with the DOI. Further
changes are, therefore, not possible.
• The printed version will follow in a forthcoming issue.
Please note
http://www.link.springer.com
http://dx.doi.org/10.1007/s10661-014-3836-0

AUTHOR'S PROOF
Metadata of the article that will be visualized in OnlineFirst
1 Article Title Phosphorus speciation in the marine sediment of Kalpakkam
coast, southeast coast of India
2 Article Sub- Title
3 Article Copyright -Year
Springer International Publishing Switzerland 2014(This will be the copyright line in the final PDF)
4 Journal Name Environmental Monitoring and Assessment
5
Corresponding
Author
Family Name Satpathy
6 Particle
7 Given Name K. K.
8 Suffix
9 Organization Indira Gandhi Centre for Atomic Research
10 Division Environment and Safety Division
11 Address Kalpakkam, Tamil Nadu, India
12 e-mail [email protected]
13
Author
Family Name Bramha
14 Particle
15 Given Name S. N.
16 Suffix
17 Organization Indira Gandhi Centre for Atomic Research
18 Division Environment and Safety Division
19 Address Kalpakkam, Tamil Nadu, India
20 e-mail
21
Author
Family Name Mohanty
22 Particle
23 Given Name A. K.
24 Suffix
25 Organization Indira Gandhi Centre for Atomic Research
26 Division Environment and Safety Division
27 Address Kalpakkam, Tamil Nadu, India
28 e-mail
29Author
Family Name Padhi
30 Particle
AUTHOR'S PROOF
31 Given Name R. K.
32 Suffix
33 Organization Indira Gandhi Centre for Atomic Research
34 Division Environment and Safety Division
35 Address Kalpakkam, Tamil Nadu, India
36 e-mail
37
Author
Family Name Panigrahi
38 Particle
39 Given Name S. N.
40 Suffix
41 Organization Indira Gandhi Centre for Atomic Research
42 Division Environment and Safety Division
43 Address Kalpakkam, Tamil Nadu, India
44 e-mail
45
Schedule
Received 14 January 2014
46 Revised
47 Accepted 14 May 2014
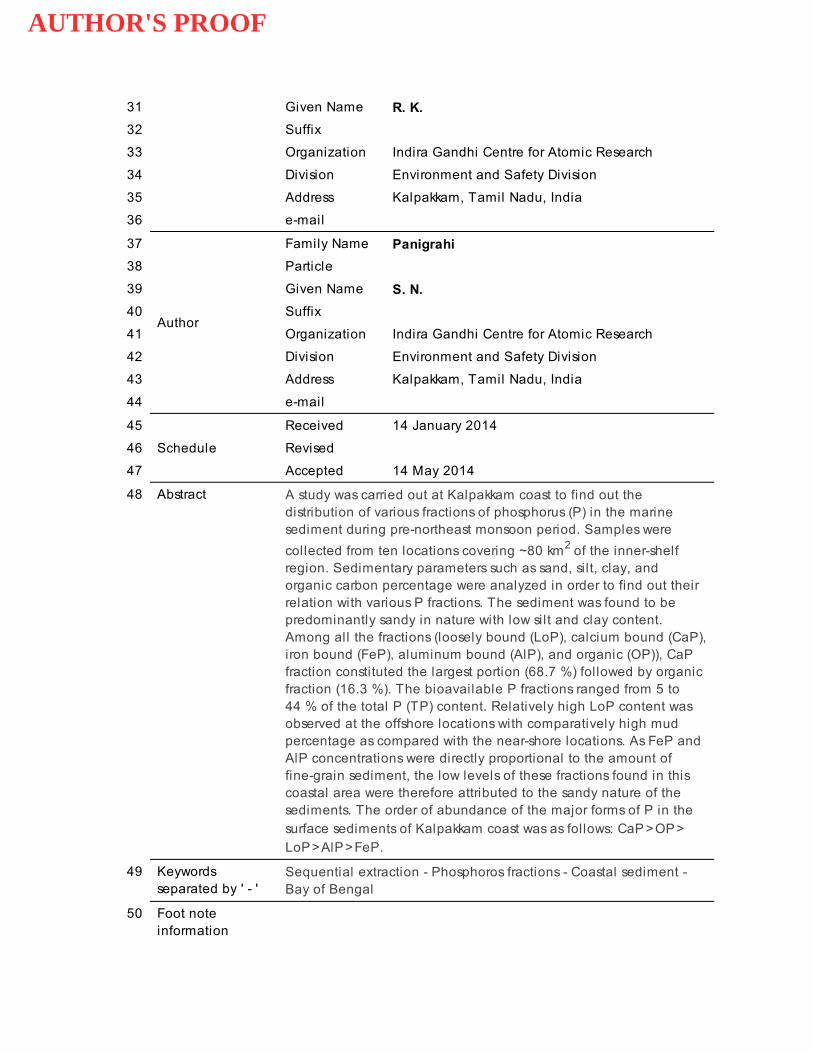
48 Abstract A study was carried out at Kalpakkam coast to find out thedistribution of various fractions of phosphorus (P) in the marinesediment during pre-northeast monsoon period. Samples were
collected from ten locations covering ~80 km2 of the inner-shelfregion. Sedimentary parameters such as sand, silt, clay, andorganic carbon percentage were analyzed in order to find out theirrelation with various P fractions. The sediment was found to bepredominantly sandy in nature with low silt and clay content.Among all the fractions (loosely bound (LoP), calcium bound (CaP),iron bound (FeP), aluminum bound (AlP), and organic (OP)), CaPfraction constituted the largest portion (68.7 %) followed by organicfraction (16.3 %). The bioavailable P fractions ranged from 5 to44 % of the total P (TP) content. Relatively high LoP content wasobserved at the offshore locations with comparatively high mudpercentage as compared with the near-shore locations. As FeP andAlP concentrations were directly proportional to the amount offine-grain sediment, the low levels of these fractions found in thiscoastal area were therefore attributed to the sandy nature of thesediments. The order of abundance of the major forms of P in the
surface sediments of Kalpakkam coast was as follows: CaP > OP > LoP > AlP > FeP.
49 Keywordsseparated by ' - '
Sequential extraction - Phosphoros fractions - Coastal sediment -Bay of Bengal
50 Foot noteinformation

AUTHOR'S PROOF
UNCORRECTEDPROOF
1
23
4 Phosphorus speciation in the marine sediment of Kalpakkam5 coast, southeast coast of India
7Q1 S. N. Bramha & A. K. Mohanty & R. K. Padhi &8 S. N. Panigrahi &Q2 K. K. Satpathy9
10
11 Received: 14 January 2014 /Accepted: 14 May 201412 # Springer International Publishing Switzerland 2014
13
14 Abstract A study was carried out at Kalpakkam coast15 to find out the distribution of various fractions of phos-16 phorus (P) in the marine sediment during pre-northeast17 monsoon period. Samples were collected from ten loca-18 tions covering ~80 km2 of the inner-shelf region.19 Sedimentary parameters such as sand, silt, clay, and20 organic carbon percentage were analyzed in order to21 find out their relation with various P fractions. The22 sediment was found to be predominantly sandy in nature23 with low silt and clay content. Among all the fractions24 (loosely bound (LoP), calcium bound (CaP), iron bound25 (FeP), aluminum bound (AlP), and organic (OP)), CaP26 fraction constituted the largest portion (68.7 %) follow-27 ed by organic fraction (16.3 %). The bioavailable P28 fractions ranged from 5 to 44 % of the total P (TP)29 content. Relatively high LoP content was observed at30 the offshore locations with comparatively high mud31 percentage as compared with the near-shore locations.32 As FeP and AlP concentrations were directly propor-33 tional to the amount of fine-grain sediment, the low34 levels of these fractions found in this coastal area were35 therefore attributed to the sandy nature of the sediments.36 The order of abundance of the major forms of P in the37 surface sediments of Kalpakkam coast was as follows:38 CaP>OP>LoP>AlP>FeP.
39Keywords Sequential extraction . Phosphoros40fractions . Coastal sediment . Bay of Bengal
41Introduction Q4
42Sediment plays an important role in the overall nutrient43dynamics of the coastal marine ecosystem. It has been44observed that the sediment of the coastal system can act45as an internal source of nutrients for the overlying water46column. Among other nutrients, phosphorus (P) has47been recognized as the most essential and critical nutri-48ent in the terrestrial and coastal aquatic environments49(Harrison et al. 1990; Bauerfeind et al. 1990) and is50thought to control marine primary productivity over a51geological time scales (Ruttenberg 2004). It is an essen-52tial constituent of tissues and cells and required for the53formation of nucleic acids and energy-carrying mole-54cules such as adenosine triphosphate (ATP). The bio-55geochemical cycle of the P in the marine sediment is56mainly the quantity of inorganic and organic P and the P57dynamics are controlled by a combination of physical,58chemical, and biological properties and processes59( Q5Frossard et al. 2000; Reddy et al. 2005). By contrast,60the other important micronutrients, nitrogen and sulfur,61are predominately present in organic forms in sedi-62ments, and their turnover is therefore primarily con-63trolled by biological and biochemical processes64(Golterman 2004; Schimel and Bennett 2004;65Bünemann and Condron 2007).66Phosphates, the most abundant form of the P in the67environment, are readily available in detergents,
Environ Monit AssessDOI 10.1007/s10661-014-3836-0
S. N. Bramha :A. K. Mohanty : R. K. Padhi :S. N. Panigrahi :K. K. Satpathy (*)
Q3 Environment and Safety Division, Indira Gandhi Centre forAtomic Research,Kalpakkam, Tamil Nadu, Indiae-mail: [email protected]
JrnlID 10661_ArtID 3836_Proof# 1 - 20/05/2014
AUTHOR'S PROOF
UNCORRECTEDPROOF
68 fertilizers, and pesticides. Consequently, monitoring of69 P content in the water and sediment is essential to70 control and avoid eutrophication of the coastal aquatic71 environment. Its current abundance in the earth crust is72 approximately 0.12 %; however, almost all P on the73 earth crust found in the form of minerals including74 apatite (chloro and floro), vivianite, wavellite, and phos-75 phorite. Apatite {Ca (PO4)3[F, OH, or Cl]}, the largest76 reservoir of phosphate on Earth, is relatively insoluble in77 water. Most of the P in the current natural environment78 is present in particulate form and is not biologically79 available, thereby limiting primary production. The80 sorption of phosphate on sediments has major influ-81 ences on transport, degradation, and ultimate fate of P82 in marine ecosystems. P is found in the nature in various83 forms which includes: (1) mineral forms; (2) organic84 forms such as phospholipids, nucleic acids, proteins,85 polysaccarides, nucleotides cofactors, and phosphonates;86 (3) dissolved in organic forms such as pentavalent, triva-87 lent, or univalent dissolve species; (4) gaseous form in the88 III oxidation state; and (5) particulate or colloidal forms89 (Aydin et al. 2009;Q6 Frankowski et al. 2002).90 P in marine sediments primarily consists of inorganic91 forms such as: loosely bounded P (LoP), aluminum92 (Al)-bounded P (AlP), iron (Fe)-bounded P (FeP), cal-93 cium (Ca)-bounded P (CaP), and organic P (OP). These94 fractions of P shows a wide range of variations, which95 are controlled by a number of factors such as rate of96 sedimentation, sediment type, amount and type of or-97 ganic matter, intensity of mineralization of organic mat-98 ters in the sediment and water column, redox conditions99 in the sediments and water depth. Al, Fe, and Ca con-100 tents in the sediments are also known to influence the P101 fractions (Sundareshwar andMorris 1999; Jennifer et al.102 2004,). Different form of P in the sediments can provide103 valuable information on the origin of the P, the degree of104 pollution from anthropogenic activities, the bioavail-105 ability, and also the burial and digenesis of P in sedi-106 ments (Andrieux and Aminot 1997;Q7 Jensen et al. 1988;107 Schenau and De Lange 2001). A considerable amount108 of work on physicochemical characteristics of109 Kalpakkam coastal waters have been carried out110 (Satpathy et al. 2010, 2011). However, observations on111 sediment nutrients and other physicochemical charac-112 teristics are lacking. Moreover, information about con-113 centration and variability of different P fractions in114 coastal sediments, particularly from this region is not115 available. Thus, the present study was designed with the116 following objectives: (1) to investigate the distribution
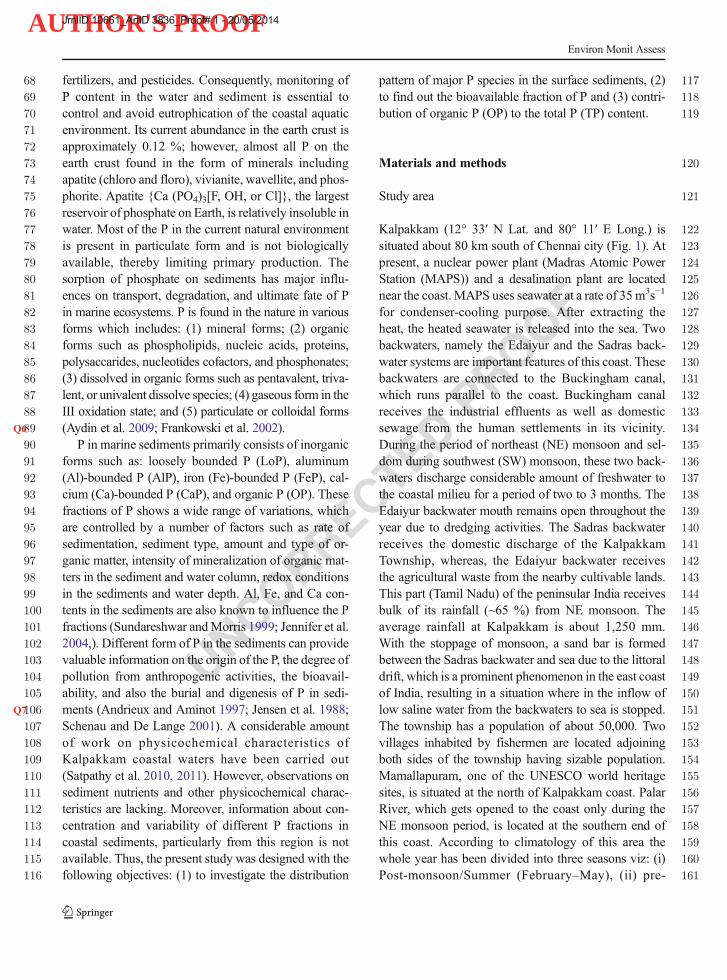
117pattern of major P species in the surface sediments, (2)118to find out the bioavailable fraction of P and (3) contri-119bution of organic P (OP) to the total P (TP) content.
120Materials and methods
121Study area
122Kalpakkam (12° 33′ N Lat. and 80° 11′ E Long.) is123situated about 80 km south of Chennai city (Fig. 1). At124present, a nuclear power plant (Madras Atomic Power125Station (MAPS)) and a desalination plant are located126near the coast. MAPS uses seawater at a rate of 35m3s−1
127for condenser-cooling purpose. After extracting the128heat, the heated seawater is released into the sea. Two129backwaters, namely the Edaiyur and the Sadras back-130water systems are important features of this coast. These131backwaters are connected to the Buckingham canal,132which runs parallel to the coast. Buckingham canal133receives the industrial effluents as well as domestic134sewage from the human settlements in its vicinity.135During the period of northeast (NE) monsoon and sel-136dom during southwest (SW) monsoon, these two back-137waters discharge considerable amount of freshwater to138the coastal milieu for a period of two to 3 months. The139Edaiyur backwater mouth remains open throughout the140year due to dredging activities. The Sadras backwater141receives the domestic discharge of the Kalpakkam142Township, whereas, the Edaiyur backwater receives143the agricultural waste from the nearby cultivable lands.144This part (Tamil Nadu) of the peninsular India receives145bulk of its rainfall (~65 %) from NE monsoon. The146average rainfall at Kalpakkam is about 1,250 mm.147With the stoppage of monsoon, a sand bar is formed148between the Sadras backwater and sea due to the littoral149drift, which is a prominent phenomenon in the east coast150of India, resulting in a situation where in the inflow of151low saline water from the backwaters to sea is stopped.152The township has a population of about 50,000. Two153villages inhabited by fishermen are located adjoining154both sides of the township having sizable population.155Mamallapuram, one of the UNESCO world heritage156sites, is situated at the north of Kalpakkam coast. Palar157River, which gets opened to the coast only during the158NE monsoon period, is located at the southern end of159this coast. According to climatology of this area the160whole year has been divided into three seasons viz: (i)161Post-monsoon/Summer (February–May), (ii) pre-
Environ Monit Assess
JrnlID 10661_ArtID 3836_Proof# 1 - 20/05/2014
AUTHOR'S PROOF
UNCORRECTEDPROOF
162 monsoon or SW monsoon (June–September), and (iii)163 Monsoon or NE monsoon (October–January) (Nair and164 Ganapathy 1983; Satapathy 1996).
165 Methodology
166 Surface sediment samples (0–5 cm) were collected at ten167 locations from five transects perpendicular to Palar168 River (P1 and P2), Sadras backwater (S1 and S2),169 MAPS Jetty (J1 and J2), Edaiyur (E1 and E2) backwa-170 ter, and Mamallapuram (M1 and M2) (Fig. 1). The two171 sampling stations at each transect were located at a172 distance of 0.5 and 5 km from the shore. Sediment173 samples were collected during September 2012 by using174 a Vaan Veen grab sampler. Samples were preserved at175 4 °C in sealed plastic bags prior to processing for further176 analysis. For the determination of sand, silt, and clay,177 20 g of sediment samples were washed with 30 % H2O2
178 and 1 N HCl to remove organic matter and carbonate,179 respectively (Van Andel and Postma 1954). Then the180 samples were washed in a 230 ASTM sieve (mesh size,181 63μm) repeatedly till all the silt and clay were removed.182 The washings were collected in a 1,000-ml measuring183 cylinder, which were further categorized as silt and clay184 by pipette analysis method (Carver 1971; Krumbain and185 Petti John 1938). The material retained in the sieve was186 dried and weighed for sand fraction.187 For analysis of P, samples were freeze dried and188 powdered by a mixture mill (Retsch make). Trace189 metal- or analytical-grade chemicals (Fisher Scientific)190 were used for preparation of reagents. Milli-Q191 (Millipore) water was used for all the analytical proce-192 dures. Working standard solutions were prepared from193 NIST standard solution (1,000 mg/l) of phosphate194 (Merck-Certipur). Certified reference material (CRM)195 sediment, CRM 7001 from the CZECH Metrology196 Institute, Czech Republic, was used to find out the197 analytical and instrument accuracy of the methods.198 The recovery was found to be 95 % of the certified199 value. P fractions in the sediments have been character-200 ized by their differential solubility in various chemical201 extractants. The sequential P extraction method used in202 the present study determined P distribution in five dif-203 ferent phases of sedimentary P (Aydin et al. 2009;204 Frankowski et al. 2002). Extraction of the sediment205 samples was carried out sequentially with 1.0 M206 NH4Cl, 1.0 M NH4F, 0.1 M NaOH, and 1.0 M H2SO4
207 for LoP, AlP, FeP, and CaP, respectively. TP in the208 sediment was determined by igniting the sediment at
209550±10 °C in a muffle furnace followed by extraction210of P with 1 N H2SO4 for 16 h (Wildung and Shmidt2111973). The total inorganic P (IP) is the sum of all212inorganic-bound P. Organic P was calculated as the213difference between TP and IP (Sanyal and De Dutta2141991). The phosphate in the extracts was estimated with215the phosphmolybadate blue method (Grasshoff et al.2161999). Organic carbon was analyzed by using Simatzu217TOC analyzer (model, TOC VCP-H-SSM-500).218Correla t ion analys is was carr ied out using219STATISTICA (ver. 7) from Statsoft. In order to find220out the distribution pattern of P, contour maps were221plotted using Surfer (ver. 8.02) from Golden software.
222Results
223Sedimentary parameters
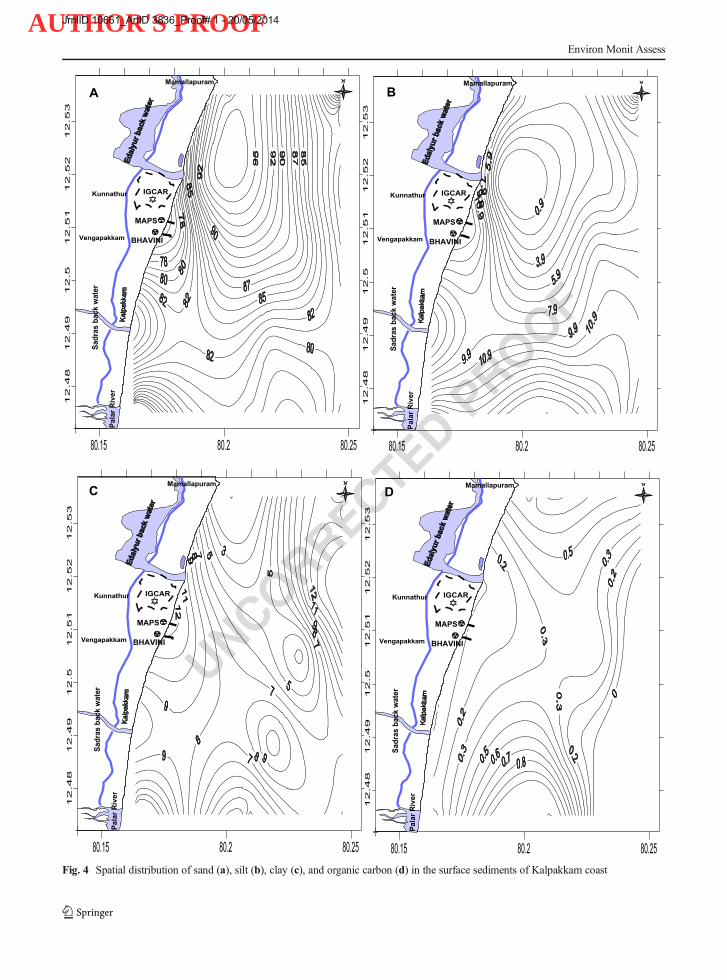
224Results (range, average±standard deviation) showed225that sand, silt, and clay content varied from 74.4 to22693.3 % (average, 83.2±6.4), 0.9 to 17.7 % (average,2278.9±4.9), and 2.6 to 12.9 % (average, 8.2±3.7), respec-228tively (Fig. 2). The spatial distribution of sand silt and229clay showed that sand percentage gradually increased230from station P1 toM1 (Figs. 3 and 4); whereas, it did not231show any decreasing or increasing trend from P2 to M2.232Similarly, a reverse trend as that of sand was observed233for silt and clay which gradually decreased from P1 to234M1 (Fig. 3). Relatively high mud (silt+clay) percentage235was observed at Palar transect. The sand percentage was236found to be higher at near-shore stations (0.5 km) than237that of the offshore stations (5 km). The organic carbon238content in the surface sediment ranged from 0.1 to 0.9 %239with an average of 0.3±0.3 %. Though it did not show240any particular spatial trend, relatively high values were241observed at Palar and Mamallapuram transects (Fig. 5).242OC content showed a weak positive correlation with243clay content (Table 1) indicating the role of fine grained244sediment in regulating OC fraction of sediment.
245Spatial distribution of different form of P
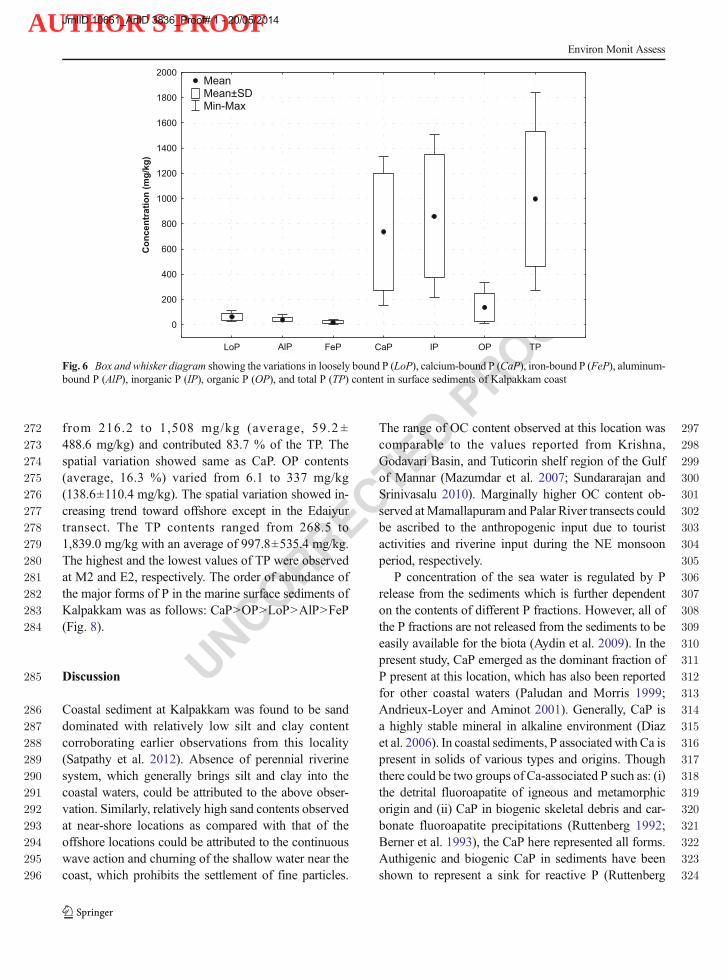
246The concentrations of different forms of P and their247spatial distribution in the surface sediments of248Kalpakkam coast are depicted in Figs. 6 and 7, respec-249tively. The highest and the lowest value of LoP were250recorded at M2 (108.7 mg/kg) and E2 (27.5 mg/kg),251respectively. Its average contribution to TP was 7.5 % at
Environ Monit Assess
JrnlID 10661_ArtID 3836_Proof# 1 - 20/05/2014

AUTHOR'S PROOF
UNCORRECTEDPROOF
80.15 80.16 80.17 80.18 80.19 80.2 80.21 80.22 80.23 80.24 80.25
12
.48
12
.49
12
.512. 5
112
. 52
12.5
3
M1M2
E1
E2
J2
J1
S1
S2
P1P2
IGCAR
MAPS
BHAVINI
Kunnathur
Vengapakkam
Mamallapuram
Palar
Rive
r
Sadr a
sbac
k wate
r
70 75 80 85 90 95 100
10
15
20
25
30
35
INDIA
76 76.5 77 77.5
8.59
9.510
10.5
Tamil Nadu
Chennai
Pondicherry
Madurai
Kalpakkam
Q8 Fig. 1 Study area showing the sampling locations
Environ Monit Assess
JrnlID 10661_ArtID 3836_Proof# 1 - 20/05/2014

AUTHOR'S PROOF
UNCORRECTEDPROOF
252 63.6±27.2 mg/kg. Except Edaiyur transect, the LoP253 values increased towards off shore region. AlP ranged254 from 21.9 to 84.8 mg/kg with an average of 39.6±255 17.5 mg/kg during the study. It contributed 5.3 % of256 TP content. The highest and the lowest values of AlP257 were observed at P2 and S1, respectively. FeP contents258 varied between 40.5 and 306 mg/kg with an average of
25918.7±11.7 mg/kg. The spatial variation of FeP increased260toward offshore except at Sadras and MAPS Jetty,261which showed reverse trends. FeP constituted 2.1 % of262the TP content. CaP was found to be the dominant form263of fraction of P in this region, with most of the value264exceeding 70 % (average, 68.7 %) of TP. CaP varied265between 154.6 and 1,331.8 mg/kg with an average of
Sand Silt Clay OC
0
20
40
60
80
100
Perc
enta
ge (
%)
Mean Mean±SD Min-Max
Fig. 2 Box and whisker diagram showing the percentage contribution of sand, silt, clay, and organic carbon (OC) content of surfacesediments of Kalpakkam coast
0%
20%
40%
60%
80%
100%
P1 S1 J1 E1 M1 P2 S2 J2 E2 M2
Clay
Silt
Sand
Fig. 3 Percentage contribution of sand, silt and clay at different sampling locations (P Palar, S Sadras, J MAPS Jetty, E Edaiyur, MMamallapuram)
Environ Monit Assess
JrnlID 10661_ArtID 3836_Proof# 1 - 20/05/2014
AUTHOR'S PROOF
UNCORRECTEDPROOF
80.15 80.2 80.25
12.4
812.4
912.5
12. 5
112.5
21
2.5
3
IGCAR
MAPS
BHAVINI
Kunnathur
Vengapakkam
Mamallapuram
Pala
rRiv
er
Sadr
a sba
ckw
ater
80.15 80.2 80.25
12.4
812.4
912.5
12.5
112.5
21
2.5
3
IGCAR
MAPS
BHAVINI
Kunnathur
Vengapakkam
Mamallapuram
Pala
rRiv
er
Sadr
asba
ckw
ater
80.15 80.2 80.25
12.4
812
.49
12.5
12.5
112
.52
12.5
3
IGCAR
MAPS
BHAVINI
Kunnathur
Vengapakkam
Mamallapuram
Pala
rRiv
er
Sadr
asba
ckw
ate r
80.15 80.2 80.25
12.4
812
.49
12.5
12.5
112.5
212. 5
3
IGCAR
MAPS
BHAVINI
Kunnathur
Vengapakkam
Mamallapuram
Pala
rRiv
er
Sadr
asba
ckw
ater
A B
C D
Fig. 4 Spatial distribution of sand (a), silt (b), clay (c), and organic carbon (d) in the surface sediments of Kalpakkam coast
Environ Monit Assess
JrnlID 10661_ArtID 3836_Proof# 1 - 20/05/2014

AUTHOR'S PROOF
UNCORRECTEDPROOF
266 737.3±463.1 mg/kg. The highest and the lowest values267 were observed at M2 and E2, respectively. The spatial268 distribution of CaP fraction showed decreasing trend
269towards offshore except in the Mamallapuram transect.270The IP content was found to be the dominant portion as271compared with the OP content at this location. It varied
0.00
0.10
0.20
0.30
0.40
0.50
0.60
0.70
0.80
0.90
1.00
P S J E M
Organic carbon (%)
0.5 km
5 km
Fig. 5 Variation in organic carbon content (%) at different sampling transects (P Palar, S Sadras, J MAPS Jetty, E Edaiyur, MMamallapuram)
t1:1 Table 1Q9 Correlation matrix exhibiting associations between different fractions of phosphorus and other sedimentary parameters in coastalsediments off Kalpakkam
t1:2 Variables LoP AlP FeP CaP IP OP TP Sand Silt Clay OC
t1:3 LoP 1.000
t1:4 0.599*
t1:5 ALP ** 1.000
t1:6 0.615*
t1:7 FeP 0.433 ** 1.000
t1:8 0.586*
t1:9 CaP ** 0.092 0.528 1.000
t1:10 0.643* 0.570* 0.996
t1:11 IP * 0.171 ** * 1.000
t1:12 OP 0.773* 0.802* 0.391 0.264 0.331 1.000
t1:13 0.746* 0.601* 0.964 0.981
t1:14 TP * 0.322 ** * * 0.508 1.000
t1:15 −0.815 −0.36 −0.38 −0.13 −0.38t1:16 Sand −0.265 −0.304 * 2 8 7 2 1.000
t1:17 0.647* −0.827 1.0
t1:18 Silt 0.458 * 0.923* 0.361 0.413 0.383 0.456 * 00
t1:19 −0.26 −0.680 0.1
t1:20 Clay −0.149 −0.286 0.238 0.145 0.124 3 0.059 ** 52 1.000
t1:21 −0.03 0.724 0.5 0.572* 1.0
t1:22 OC 0.457 0.890* 0.412 0 0.038 * 0.184 −0.058 23 ** 00
*Values are with a significance level of 0.01; **values are with a significance level of 0.05; ***values are with a significance level of 0.1
Environ Monit Assess
JrnlID 10661_ArtID 3836_Proof# 1 - 20/05/2014
AUTHOR'S PROOF
UNCORRECTEDPROOF
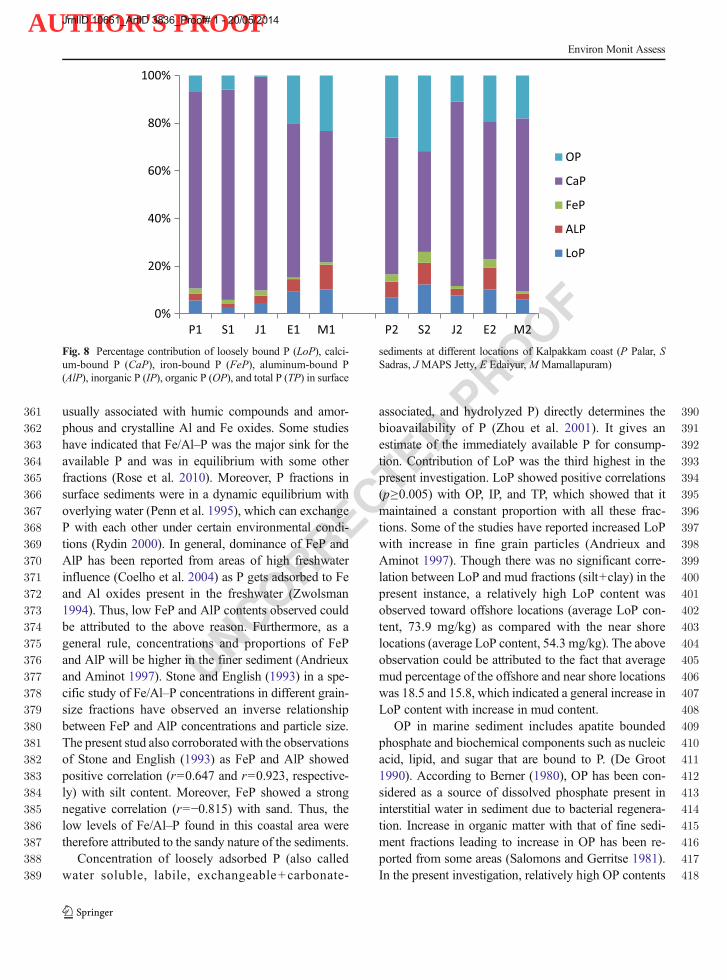
272 from 216.2 to 1,508 mg/kg (average, 59.2 ±273 488.6 mg/kg) and contributed 83.7 % of the TP. The274 spatial variation showed same as CaP. OP contents275 (average, 16.3 %) varied from 6.1 to 337 mg/kg276 (138.6±110.4 mg/kg). The spatial variation showed in-277 creasing trend toward offshore except in the Edaiyur278 transect. The TP contents ranged from 268.5 to279 1,839.0 mg/kg with an average of 997.8±535.4 mg/kg.280 The highest and the lowest values of TP were observed281 at M2 and E2, respectively. The order of abundance of282 the major forms of P in the marine surface sediments of283 Kalpakkam was as follows: CaP>OP>LoP>AlP>FeP284 (Fig. 8).
285 Discussion
286 Coastal sediment at Kalpakkam was found to be sand287 dominated with relatively low silt and clay content288 corroborating earlier observations from this locality289 (Satpathy et al. 2012). Absence of perennial riverine290 system, which generally brings silt and clay into the291 coastal waters, could be attributed to the above obser-292 vation. Similarly, relatively high sand contents observed293 at near-shore locations as compared with that of the294 offshore locations could be attributed to the continuous295 wave action and churning of the shallow water near the296 coast, which prohibits the settlement of fine particles.
297The range of OC content observed at this location was298comparable to the values reported from Krishna,299Godavari Basin, and Tuticorin shelf region of the Gulf300of Mannar (Mazumdar et al. 2007; Sundararajan and301Srinivasalu 2010). Marginally higher OC content ob-302served atMamallapuram and Palar River transects could303be ascribed to the anthropogenic input due to tourist304activities and riverine input during the NE monsoon305period, respectively.306P concentration of the sea water is regulated by P307release from the sediments which is further dependent308on the contents of different P fractions. However, all of309the P fractions are not released from the sediments to be310easily available for the biota (Aydin et al. 2009). In the311present study, CaP emerged as the dominant fraction of312P present at this location, which has also been reported313for other coastal waters (Paludan and Morris 1999;314Andrieux-Loyer and Aminot 2001). Generally, CaP is315a highly stable mineral in alkaline environment (Diaz316et al. 2006). In coastal sediments, P associatedwith Ca is317present in solids of various types and origins. Though318there could be two groups of Ca-associated P such as: (i)319the detrital fluoroapatite of igneous and metamorphic320origin and (ii) CaP in biogenic skeletal debris and car-321bonate fluoroapatite precipitations (Ruttenberg 1992;322Berner et al. 1993), the CaP here represented all forms.323Authigenic and biogenic CaP in sediments have been324shown to represent a sink for reactive P (Ruttenberg
LoP FeP CaP IP OP TP
0
200
400
600
800
1000
1200
1400
1600
1800
2000
Con
cent
ratio
n (m
g/kg
)
Mean Mean±SD Min-Max
AlP
Fig. 6 Box and whisker diagram showing the variations in loosely bound P (LoP), calcium-bound P (CaP), iron-bound P (FeP), aluminum-bound P (AlP), inorganic P (IP), organic P (OP), and total P (TP) content in surface sediments of Kalpakkam coast
Environ Monit Assess
JrnlID 10661_ArtID 3836_Proof# 1 - 20/05/2014
AUTHOR'S PROOF
UNCORRECTEDPROOF
325 1992; Berner et al. 1993). Those forms like detrital are326 almost insoluble under the physicochemical conditions327 of marine waters and remains stable under both oxidiz-328 ing and reducing conditions and cannot be released329 again from the sediment to the overlying water330 (Williams et al. 1980; Gonsiorczyk et al. 1998). Thus,331 P concentration in this extraction step will not be bio-332 available so easily, being considered permanent burial333 (Jin et al. 2006). Therefore, knowledge of the level of334 CaP concentration is useful to evaluate the proportion of335 bioavailable P in coastal areas. It is well known that336 calcite is produced at high salinities through precipita-337 tion reactions and biological activity, both in estuarine338 and marine environments, which forms an adsorption339 substrate for dissolved phosphate (Coelho et al. 2004).340 This could be a plausible reason behind the observed341 dominance of CaP in the study area, as the coastal water342 at this location is sparsely influenced by freshwater
343input throughout the year. Moreover, several authors344have reported that the dominance of CaP could also be345due to the transformation of OP into authigenic346fluorapatite during microbial decomposition347(Anshumali and Ramanathan 2007; Katsaounos et al.3482007; Hou et al. 2009). Similarly, sedimentary organic349matter decomposed in situ may combine with CaCO3
350from calcareous phytoplankton to form CaP351(Frankowski et al. 2002), which could also contribute352to its dominance in coastal areas.353P bound to Fe and Al through chemisorption (Guo354et al. 2000) acts as indicator of algal available P and can355be used for the estimation of available P in the sediments356(Kaiserli et al. 2002; Wang et al. 2006). These P frac-357tions could be released for the growth of phytoplankton358when anoxic conditions prevail at sediment–water inter-359face (Zhou et al. 2001). However, according to Hedley360et al. (1982), this fraction is less plant available and
80.15 80.2 80.25
12.4
812.4
91
2.5
12
.51
12
.52
12
. 53
IGCAR
MAPS
BHAVINI
Kunnathur
Vengapakkam
Mamallapuram
Pala
rRiv
er
Sadr
asba
ckw
ater
80.15 80.2 80.25
12
.48
12
.49
12
.51
2.5
112
.52
12
.53
IGCAR
MAPS
BHAVINI
Kunnathur
Vengapakkam
Mamallapuram
Pala
rRiv
er
Sadr
asba
ckw
ate r
80.15 80.2 80.25
12
.48
12
.49
12
.512
.51
12
.52
12
.53
IGCAR
MAPS
BHAVINI
Kunnathur
Vengapakkam
Mamallapuram
Pala
rRiv
er
Sadr
a sba
c kw
ate r
80.15 80.2 80.25
12.4
812.4
912.5
12.5
112.5
212.5
3
IGCAR
MAPS
BHAVINI
Kunnathur
Vengapakkam
Mamallapuram
Pala
rRiv
er
Sadr
asba
ckw
ater
80.15 80.2 80.25
12
.48
12
.49
12
.51
2.5
11
2.5
21
2.5
3
IGCAR
MAPS
BHAVINI
Kunnathur
Vengapakkam
Mamallapuram
Pala
rRiv
er
Sadr
asba
ckw
ater
80.15 80.2 80.25
12.4
812.4
91
2.5
12.5
112. 5
212.5
3
IGCAR
MAPS
BHAVINI
Kunnathur
Vengapakkam
Mamallapuram
Pala
rRiv
er
Sadr
a sba
ckw
a ter
80.15 80.2 80.25
12
.48
12
.49
12
.51
2.5
11
2.5
21
2.5
3
IGCAR
MAPS
BHAVINI
Kunnathur
Vengapakkam
Mamallapuram
Pala
rRiv
er
Sadr
asba
ckw
ater
A B C D
E F G
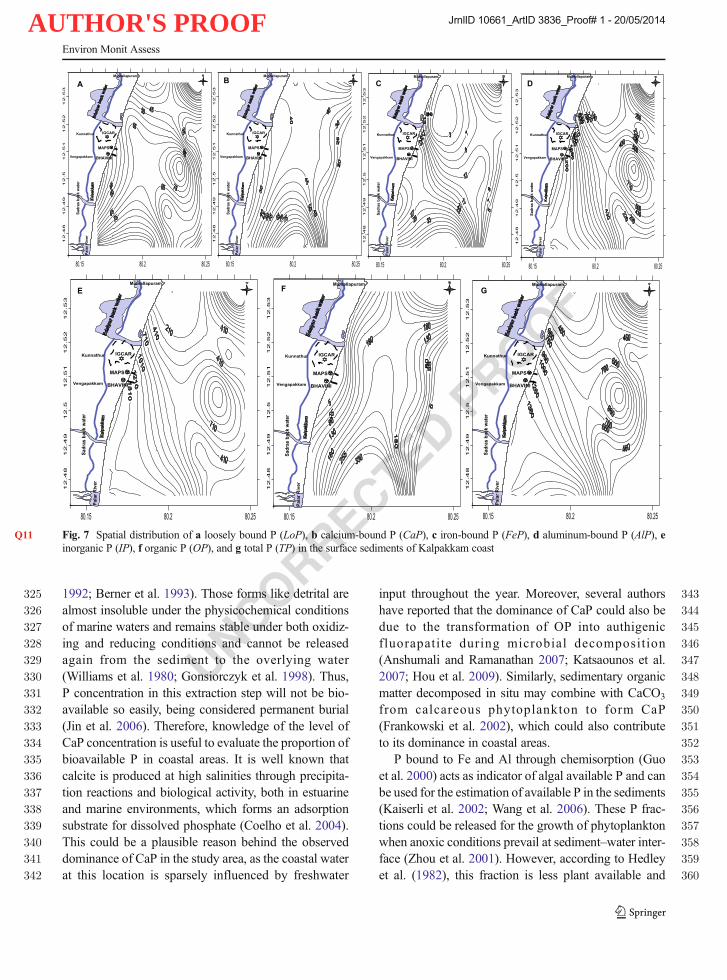
Fig. 7Q11 Spatial distribution of a loosely bound P (LoP), b calcium-bound P (CaP), c iron-bound P (FeP), d aluminum-bound P (AlP), einorganic P (IP), f organic P (OP), and g total P (TP) in the surface sediments of Kalpakkam coast
Environ Monit Assess
JrnlID 10661_ArtID 3836_Proof# 1 - 20/05/2014
AUTHOR'S PROOF
UNCORRECTEDPROOF
361 usually associated with humic compounds and amor-362 phous and crystalline Al and Fe oxides. Some studies363 have indicated that Fe/Al–P was the major sink for the364 available P and was in equilibrium with some other365 fractions (Rose et al. 2010). Moreover, P fractions in366 surface sediments were in a dynamic equilibrium with367 overlying water (Penn et al. 1995), which can exchange368 P with each other under certain environmental condi-369 tions (Rydin 2000). In general, dominance of FeP and370 AlP has been reported from areas of high freshwater371 influence (Coelho et al. 2004) as P gets adsorbed to Fe372 and Al oxides present in the freshwater (Zwolsman373 1994). Thus, low FeP and AlP contents observed could374 be attributed to the above reason. Furthermore, as a375 general rule, concentrations and proportions of FeP376 and AlP will be higher in the finer sediment (Andrieux377 and Aminot 1997). Stone and English (1993) in a spe-378 cific study of Fe/Al–P concentrations in different grain-379 size fractions have observed an inverse relationship380 between FeP and AlP concentrations and particle size.381 The present stud also corroborated with the observations382 of Stone and English (1993) as FeP and AlP showed383 positive correlation (r=0.647 and r=0.923, respective-384 ly) with silt content. Moreover, FeP showed a strong385 negative correlation (r=−0.815) with sand. Thus, the386 low levels of Fe/Al–P found in this coastal area were387 therefore attributed to the sandy nature of the sediments.388 Concentration of loosely adsorbed P (also called389 water soluble, labile, exchangeable+carbonate-
390associated, and hydrolyzed P) directly determines the391bioavailability of P (Zhou et al. 2001). It gives an392estimate of the immediately available P for consump-393tion. Contribution of LoP was the third highest in the394present investigation. LoP showed positive correlations395(p≥0.005) with OP, IP, and TP, which showed that it396maintained a constant proportion with all these frac-397tions. Some of the studies have reported increased LoP398with increase in fine grain particles (Andrieux and399Aminot 1997). Though there was no significant corre-400lation between LoP and mud fractions (silt+clay) in the401present instance, a relatively high LoP content was402observed toward offshore locations (average LoP con-403tent, 73.9 mg/kg) as compared with the near shore404locations (average LoP content, 54.3 mg/kg). The above405observation could be attributed to the fact that average406mud percentage of the offshore and near shore locations407was 18.5 and 15.8, which indicated a general increase in408LoP content with increase in mud content.409OP in marine sediment includes apatite bounded410phosphate and biochemical components such as nucleic411acid, lipid, and sugar that are bound to P. (De Groot4121990). According to Berner (1980), OP has been con-413sidered as a source of dissolved phosphate present in414interstitial water in sediment due to bacterial regenera-415tion. Increase in organic matter with that of fine sedi-416ment fractions leading to increase in OP has been re-417ported from some areas (Salomons and Gerritse 1981).418In the present investigation, relatively high OP contents
0%
20%
40%
60%
80%
100%
P1 S1 J1 E1 M1 P2 S2 J2 E2 M2
OP
CaP
FeP
ALP
LoP
Fig. 8 Percentage contribution of loosely bound P (LoP), calci-um-bound P (CaP), iron-bound P (FeP), aluminum-bound P(AlP), inorganic P (IP), organic P (OP), and total P (TP) in surface
sediments at different locations of Kalpakkam coast (P Palar, SSadras, J MAPS Jetty, E Edaiyur, M Mamallapuram)
Environ Monit Assess
JrnlID 10661_ArtID 3836_Proof# 1 - 20/05/2014
AUTHOR'S PROOF
UNCORRECTEDPROOF
419 observed at offshore locations could be attributed420 to the comparatively high mud fraction and OC421 content found at those locations. A strong positive422 correlation (r=0.724; p≥0.001) found between OP423 and OC further supported the above observations.424 Contribution of OP to TP was the second highest425 in the present study, which suggested that miner-426 alization of the phosphate-containing organic mat-427 ter at the sediment surface (Lee et al. 1977) is the428 predominant process at this location. Similar phe-429 nomenon has also been reported from the coastal430 waters of South India (Nair et al. 1993).431 Even though, TP is not representative of the432 reactive fraction of P in sediments, it is usually433 the only component that can be compared with434 existing data based on lesser defined geochemical435 determinations. TP showed positive correlation436 with almost all the inorganic fractions (LoP, r=437 0.964; FeP, r=0.601; CaP, r=0.964; and IP, r=438 0.981), whereas it did not yield any significant439 correlation with the organic fraction. TP as well440 as the OP content observed in the present study441 were comparable to that of the other marine envi-442 ronments of India and elsewhere (Q10 Renjith et al.443 2011; Aydin et al. 2009).444 Considering the important role of P in marine pro-445 ductivity and its existence in various fractions (soluble446 and nonsoluble), the notion of bioavailability must be447 taken into account. Bioavailable P in sediments corre-448 sponds to the amount that can be released easily, for449 algal growth (Sonzogni et al. 1982). Though bioavail-450 ability can be assessed by bioassays (De Jonge et al.451 1993), knowledge of the various forms of P is useful in452 determining the upper limit of the potentially bioavail-453 able P. CaP, which remains insoluble in marine condi-454 tions and FeP and AlP, which cannot be released unless455 anoxic environment prevails, practically do not contrib-456 ute to the bioavailable fraction. The present study area457 being an open shallow coastal environment that sup-458 ports turbulence and mixing, the CaP and FeP and AlP459 fractions cannot be bioavailable under normal circum-460 stances. However, LoP can progressively be released461 when the phosphate concentration in the water column462 is lower than that in the pore water. Similarly, OP can be463 progressively bioavailable due to remineralization.464 Therefore, initially only LoP and OP should be consid-465 ered as potentially bioavailable fractions (Andrieux and466 Aminot 1997), which contributed from 5 to 44 % (av-467 erage, 23.8 %) of the TP during the present study.
468Conclusions
469This paper presents baseline report on P speciation in the470coastal sediments of Kalpakkam. The coastal sediment471at Kalpakkam was found to be sand dominated. The472CaP fraction comprised the largest percent (68.7 %) to473the total sedimentary P followed by the organic fraction474(16.3 %). Bioavailable P fractions ranged from 5 to47544 % of the TP content. Relatively high LoP content476was observed at the offshore locations with compara-477tively high mud percentage as compared with the near-478shore locations. As FeP and AlP concentrations are479directly proportional to the amount of fine-grain sedi-480ment, the low levels of Fe/Al–P found in this coastal481area were therefore attributed to the sandy nature of the482sediments. The order of abundance of the major forms483of P in the marine surface sediments of Kalpakkam was484as follows: CaP>OP>LoP>ALP>FeP. The present ob-485servation encourages future intensive research focusing486to elucidate the role of different seasons in speciation of487P in Kalpakkam coastal sediment.
488References 489
490Andrieux, F., & Aminot, A. (1997). A two-year survey of phos-491phorus speciation in the sediments of the Bay of Seine492(France). Continental Shelf Research, 17, 1229–1245.493Andrieux-Loyer, F., & Aminot, A. (2001). Phosphorus Forms494Related to Sediment Grain Size and Geochemical495Characteristics in French Coastal Areas. Estuarine and496Coastal Shelf Science, 52(5), 617–629.497Anshumali, & Ramanathan, A. L. (2007). Phosphorus fractions in498surficial sediments of Pandoh Lake, Lesser Himalaya,499Himachal Pradesh, India. Applied Geochemistry, 22, 1860–5001871.501Aydin, F., Aydin, A., Saydut, C. J., & Hamamci. (2009). A502sequential extraction to determine the distribution of phos-503phorus in the seawater and marine surface sediment. Journal504of Hazardous Materials, 168, 664–669.505Bauerfeind, E., Hickel, W., Niermann, U., & Westernhagen, H. V.506(1990). Phytoplankton biomass and potential nutrient limita-507tion of phytoplancton development in the southeastern, North508Sea in spring 1985 and 1986. Netherlands Journal of Sea509Research, 25(1–2), 131–142.510Berner, R. A. (1980). Early Diagenesis. A Theoretical Approach,511Princeton Univ. Press, pp. 168–174.512Berner, R. A., Ruttenberg, K. C., & Rao, JiL. (1993). The nature of513phosphorus burial in modern marine sediments. In:514Interactions of C,N,P and S Biogeochemical Cycles and515Global Changes, R. Wollast, F.T. Mackenzie, L. Chou, edi-516tors, Spriger-Verlag, NATO ASI Series I: Global517Environmental Change, vol. 4.
Environ Monit Assess
JrnlID 10661_ArtID 3836_Proof# 1 - 20/05/2014
AUTHOR'S PROOF
UNCORRECTEDPROOF
518 Bünemann, E. K., & Condron, L. M. (2007). Phosphorus and519 sulphur cycling in terrestrial systems. In: Nutrient cycling.520 Eds. P Marschner and Z Rengel. Springer, pp. 65–92.521 Carver, R. (1971). Procedures in Sedimentary Petrology (pp. 79–522 88). New York: Wiley-Interscience.523 Coelho, J. P., Flindt, M. R., Jensen, H. S., Lillebø, A. I., & Pardal,524 M. A. (2004). Phosphorus speciation and availability in525 intertidal sediments of a temperate estuary: relation to eutro-526 phication and annual P-fluxes. Estuarine and Coastal Shelf527 Science, 61(4), 583–590.528 De Groot, C. J. (1990). Some remarks on the presence of organic529 phosphates in the sediments. Hydrobiologia, 207, 303–309.530 De Jonge, V. N., Engelkes, M. M., & Bakker, J. F. (1993). Bio-531 availability of phosphorus in sediments of the western Dutch532 Wadden Sea. Hydrobiologia, 253, 151–163.533 Diaz, O. A., Daroub, S. H., Stuck, J. D., Clark,M.W., Lang, T. A.,534 & Reddy, K. R. (2006). Sediment inventory and phosphorus535 fractions for water conservation area canals in the536 Everglades. Soil Science Society American Journal, 70,537 863–871.538 Frankowski, L., Bolałek, J., & Szostek, A. (2002). Phosphorus in539 bottom sediments of Pomerania Bay (Southern Baltic–540 Poland) Estuar. Estuarine and Coastal Shelf Science, 54,541 1027–1038.542 Frossard, E., Condron, L. M., Oberson, A., Sinaj, S., & Fardeau, J.543 C. (2000). Processes governing phosphorus availability in544 temperate soils. Journal of Environmental Quality, 29, 15–545 23.546 Golterman, H. L. (2004). The Chemistry of Phosphate and547 Nitrogen Compounds in Sediments. Dordrecht: Kluwer548 Academic Publishers.549 Gonsiorczyk, T., Casper, P., & Koschel, R. H. (1998).550 Phosphorus-binding forms in the sediment of an oligo-551 trophic and an eutrophic hardwater lake of the Baltic552 Lake Dist r ic t (Germany) . Water Science and553 Technology, 37, 51–58.554 Grasshoff, K., Ehrdardt, M., Kremling, K., & Anderson, L. G.555 (1999). Methods of seawater analysis. Wiley.556 Guo, L. D., Wen, L. S., Tang, D. G., & Santschi, P. H. (2000).557 Reexamination of cross-flow ultrafiltration for sampling558 aquatic colloids: evidence from molecular probes. Marine559 Chemistry, 69, 75–90.560 Harrison, P. J., Hu, M. J., Yang, Y. P., & Lu, X. (1990). Phosphate561 limitation in estuarine and coastal water of China. Journal of562 Experimental Marine Biology Ecology, 40, 79–87.563 Hedley, M. J., Stewart, J. W. B., & Chauhan, B. S. (1982).564 Changes in inorganic and organic soil phosphorus fractions565 induced by cultivation practices and by laboratory incuba-566 tions. Soil Science Society American Journal, 46, 970–976.567 Hou, L. J., Liu, M., Yang, Y., Ou, D. N., Lin, X., Chen, H., et al.568 (2009). Phosphorus speciation and availability in intertidal569 sediments of Yangtze river estuary, China. Applied570 Geochemistry, 24, 120–128.571 Jennifer, L. M., Megonigal, J. P., & Walbridge, M. R. (2004).572 Sediment nutrient accumulation and nutrient availability in573 two tidal freshwater marshes along the Mattaponi River,574 Virginia. USA Biogeochemistry, 69, 175–206.575 Jensen, H. S., McGlathery, K. J., Marino, R., & Howarth, R. W.576 (1988). Forms and availability of sediments phosphorus in577 carbonate sand of Bermuda seagrass beds. Limnology578 Oceanography, 43, 799–810.
579Jin, X., Wang, S., Pang, Y., & Chang, W. F. (2006). Phosphorus580fractions and the effect of pH on the phosphorus release of the581sediments from different trophic areas in Taihu Lake. China582Environmental Pollution, 139(2), 288–295.583Kaiserli, A., Voutsa, D., & Samara, C. (2002). Phosphorus frac-584tionation in lake sediments—Lakes Volvi and Koronia, N.585Greece. Chemosphere, 46(8), 1147–1155.586Katsaounos, C. Z., Giokas, D. L., Leonardos, J. D., & Karayanis,587M. I. (2007). Speciation of phosphorus fraction in river588sediments by explanatory data analysis. Water Research,58941, 406–418.590Krumbain, W. C., & Petti John, F. J. (1938). Manual of sedimen-591tary petrography. New York: Appleton Century crofts.592Lee, G. F., Sonzogni,W. C., & Spear, R. D. (1977). Significance of593oxic versus anoxic conditions for Lake Mendota sediment594phosphorus release. In Interactions between Sediments and595Fresh Water (Edited by Golterman HL) Proceedings of the596International Symposium. Amsterdam, The Netherlands.597Junk & Purdoc. The Hague, pp. 294–306.598Mazumdar, A., Paropkari, A. L., Borole, D. V., Rao, B. R.,599Khadge, N. H., Karisiddaiah, S. M., Kocherla, M., & Joao,600H. M. (2007). Pore-water suphate concentration profiles of601sediment cores from Krishna-Godavari and Goa basins,602India. Geochemical Journal, 41, 259–269.603Nair, K. V. K., & Ganapathy, S. (1983). Baseline ecology of604Edayur–Sadras estuarine system at Kalpakkam. I: General605hydrographic and chemical feature. Mahasagar, 16, 143–606151.607Nair, S. M., Balchand, A. N., & Nambisan, P. N. K. (1993).608Phosphate fractionation in mud bank sediments from the609Southwest coast of India. Hydrobiologia, 252(1), 61–69.610Paludan, C., & Morris, J. T. (1999). Distribution and speciation of611phosphorus along a salinity gradient in intertidal marsh sed-612iments. Biogeochemistry, 45, 197–221.613Penn, M. R., Auer, M. T., Van Orman, E. L., & Korienek, J. J.614(1995). Phosphorus digenesis in lake sediments: investiga-615tions using fractionation techniques. Marine Freshwater616Research, 46, 89–99.617Reddy, K. R., Wetzel, R. G., & Kadlec, R. H. (2005).618Biogeochemistry of phosphorus in wetlands. In: Sims JT619and Sharpley editors, Phosphorus: Agriculture and the envi-620ronment. Agronomy Monograph, ASA, CSSA, and SSSA,621Madison WI, 46, 263–316.622Rose, T. J., Hardiputra, B., & Rengel, Z. (2010). Wheat, canola623and grain legume access to soil phosphorus fractions differs624in soils with contrasting phosphorus dynamics. Plant and625Soil, 326, 159–170.626Ruttenberg, K. C. (1992). Development of a sequential extraction627method for different forms of phosphorus in marine sedi-628ments. Limnology and Oceanography, 37(7), 1460–1482.629Ruttenberg, K. C. (2004). The Global Phosphorus Cycle. In:630Treatise on Geochemistry, (HD Holland and KK Turekian,631eds.) Vol. 8 (Biogeochemistry: W. H. Schlesinger, volume632editor), Chapter 14, Elsevier Science, pp. 585–643.633Rydin, E. (2000). Potentially mobile phosphorus in Lake Erken634sediment. Water Research, 34, 2037–2042.635Salomons,W., & Gerritse, R. G. (1981). Some observations on the636occurrence of phosphorus in recent sediments from Western637Europe. Science of the Total Environment, 17, 37–49.638Sanyal, S. K., & De Dutta, S. K. (1991). Chemistry of P transfor-639mation in soil. Advance Soil Science, 16, 1–120.
Environ Monit Assess
JrnlID 10661_ArtID 3836_Proof# 1 - 20/05/2014

AUTHOR'S PROOF
UNCORRECTEDPROOF
640 Satapathy, K. K. (1996). Seasonal distribution of nutrients in the641 coastal waters of Kalpakkam, East Coast of India. Indian642 Journal of Marine Sciences, 25, 221–224.643 Satpathy, K. K., Mohanty, A. K., Natesan, U., Prasad, M. V. R., &644 Sarkar, S. K. (2010). Seasonal variation in physicochemical645 properties of coastal waters of Kalpakkam, east coast of India646 with special emphasis on nutrients. Environmental647 Monitoring and Assessment, 164, 153–171.648 Satpathy, K. K., Mohanty, A. K., Sahu, G., Sarguru, S., Sarkar, S.649 K., & Natesan, U. (2011). Spatio-temporal variation in650 physico-chemical properties of coastal waters off651 Kalpakkam, southeast coast of India, during summer, pre-652 monsoon and post-monsoon period. Environmental653 Monitoring and Assessment, 180, 41–62.654 Satpathy, K. K., Mohanty, A. K., Prasad, M. V. R.,655 Natesan, U., & Sarkar, S. K. (2012). Studies on the656 variations of heavy metals in the marine sediments off657 Kalpakkam, east coast of India. Environmental Earth658 Sciences, 65(1), 89–101.659 Schenau, S. J., & De Lange, G. J. (2001). Phosphorus regeneration660 vs. burial in sediments of the Arabian Sea.Marine Chemistry,661 75, 201–217.662 Schimel, J. P., & Bennett, J. (2004). Nitrogen mineralization:663 challenges of a changing paradigm. Ecology, 85(3), 591–602.664 Sonzogni, W. C., Chapra, S. C., Armstrong, D. E., & Logan, T. J.665 (1982). Bioavailability of phosphate inputs to lakes. Journal666 of Environmental Quality, 11, 555–562.667 Stone, M., & English, M. C. (1993). Geochemical composition,668 phosphorus speciation and mass transport characteristics of
669fine-grained sediment in two Lake Erie tributaries.670Hydrobiologia, 253, 17–29.671Sundararajan, M., & Srinivasalu, S. (2010). Geochemistry of Core672Sediments from Gulf of Mannar, India. International of673Environmental Research, 4, 861–876.674Sundareshwar, P. V., & Morris, J. T. (1999). Phosphorus sorption675characteristics of intertidal marsh sediments along an estua-676rine salinity gradient. Limnology and Oceanography, 44(7),6771693–1701.678Van Andel, J. H., & Postma, H. (1954). Recent sediments of Gulf679of Paria, reports of Orinco shelf expedition (p. 245).680Amsterdam: North Holland Publishing Co.681Wang, X. J., Xia, S. Q., Chen, L., Zhao, J. F., Renault, N. J., &682Chovelon, J. M. (2006). Nutrients removal from municipal683wastewater by chemical precipitation in a moving bed bio-684film reactor. Process Biochemistry, 41, 824–828.685Wildung, R. E., & Shmidt, R. L. (1973). Phosphorus relies from686lake sediment. EPA-R3-73-024. US Environmental687Protection Agency.688Williams, J. O. H., Shear, H., & Thomas, R. L. (1980). A689vailability to Scenedesmus quadricauda of different forms690of phosphorus in sedimentary materials from the Great691Lakes. Limnology and Oceanography, 25, 1–11.692Zhou, Q., Gibson, C. E., & Zhu, Y. (2001). Evaluation of phos-693phorus bioavailability in sediments of three contrasting lakes694in China and the UK. Chemosphere, 42(2), 221–225.695Zwolsman, J. J. G. (1994). Seasonal variability and biogeochem-696istry of phosphorus in the Scheldt estuary, SW Netherlands.697Estuarine and Coastal Shelf Science, 39, 227–248.
698
Environ Monit Assess
JrnlID 10661_ArtID 3836_Proof# 1 - 20/05/2014
AUTHOR'S PROOF
UNCORRECTEDPROOF
AUTHOR QUERIES
AUTHOR PLEASE ANSWER ALL QUERIES.
Q1. Kindly check if the names of authors are correctly captured and presented.Q2. Please check corresponding author’s telecommunications data if correctly captured.Q3. Please check if data on authors’ affiliations are correctly presented.Q4. Please check section heads if assigned to appropriate levels.Q5. The citation “Frossard et al. 2001” (original) has been changed to “Frossard et al. 2000”.
Please check if appropriate.Q6. The citation “Frankowski et al. 2001” (original) has been changed to “Frankowski et al.
2002”. Please check if appropriate.Q7. The citation “Jensen et al. 1998” (original) has been changed to “Jensen et al. 1988”. Please
check if appropriate.Q8. Please check figure captions if correctly captured.Q9. Kindly check if the table entries, notes, and other relevant details are correctly captured and
presented.Q10. “Renjith et al. 2011” is cited in text but not given in the reference list. Please provide details
in the list or delete the citation from the text.Q11. Figure 7 contains poor quality of resolution(small text below standard size) Please provide
replacement/s. Otherwise, please advise if it's okay to proceed with the figures as is.
Copyright © 2022 FDOKUMEN