SULFATE SORPTION BY TWO OXISOLS AND AN ALFISOL OF THE TROPICS

NOTICE: this is the author’s version of a work that was accepted for publication in
Geochimica et Cosmochimica Acta. A definitive version was subsequently published in
Geochimica et Cosmochimica Acta 120, 140-157, 2013.
http://dx.doi.org/10.1016/j.gca.2013.06.012
Phosphate effects on copper(II) and lead(II) sorption to ferrihydrite
Charlotta Tiberga*
, Carin Sjöstedtb, Ingmar Persson
c, Jon Petter Gustafsson
b
aDepartment of Soil and Environment, Swedish University of Agricultural Sciences (SLU),
Box 7014, SE-750 07 Uppsala, Sweden. [email protected], Tel: +46-18-67 12 24
bDepartment of Land and Water Resources Engineering, Royal Institute of Technology
(KTH), Teknikringen 76, SE-100 44 Stockholm, Sweden. C. Sjöstedt: [email protected], J. P.
Gustafsson: [email protected] cDepartment of Chemistry, Swedish University of Agricultural Sciences (SLU), SE-750 07
Uppsala, Sweden, [email protected]
*corresponding author

2
Abstract
Transport of lead(II) and copper(II) ions in soil is affected by the soil phosphorus status. Part
of the explanation may be that phosphate increases the adsorption of copper(II) and lead(II) to
iron (hydr)oxides in soil, but the details of these interactions are poorly known. Knowledge
about such mechanisms is important, for example, in risk assessments of contaminated sites
and development of remediation methods. We used a combination of batch experiments,
extended X-ray absorption fine structure (EXAFS) spectroscopy and surface complexation
modeling with the three-plane CD-MUSIC model to study the effect of phosphate on sorption
of copper(II) and lead(II) to ferrihydrite. The aim was to identify the surface complexes
formed and to derive constants for the surface complexation reactions. In the batch
experiments phosphate greatly enhanced the adsorption of copper(II) and lead(II) to
ferrihydrite at pH < 6. The largest effects were seen for lead(II).
Based on interpretation of the EXAFS spectra edge-sharing bidentate copper(II) or
lead(II) complexes predominated in the single-sorbate systems with ferrihydrite. Lead(II)
EXAFS spectra suggested a distinct change of coordination in the presence of phosphate, i.e.
the signal from edge-sharing complexes diminished and a longer Pb…
Fe distance appeared at
about 4 Å. A similar, but less pronounced, pattern was observed for copper(II). Based on the
results from interpretation of EXAFS spectra and surface complexation modeling with the
CD-MUSIC model the enhanced sorption in presence of phosphate was most satisfactorily
explained by the appearance of ternary metal-phosphate complexes in which the metal
interacts directly with the surface.
In conclusion, geochemical models used for simulating trace element behavior in acidic
environments seem to require ternary metal-phosphate surface complexes to properly describe
partitioning of metals between solution and the solid phase.

3
1. INTRODUCTION
Elevated concentrations of phosphate can retard transport of copper(II) and lead(II) in soil.
The magnitude and durability of this effect is of special interest in for example risk
assessments of contaminated soils and development of soil remediation methods where
phosphate is used as a stabilizing agent. The possibility to use phosphate amendments to
immobilize lead(II) in remediation of contaminated soils has been tested in pilot projects (Ma
el al., 2008; Cao et al., 2002).
The promoting effect of phosphate on lead(II) immobilization has mainly been attributed to
the formation of lead(II) phosphate minerals. It is well known that minerals such as
pyromorphite (Pb5(PO4)3Cl) are formed at high concentrations of lead(II) and phosphate in
combination with high pH. Several authors employing EXAFS (extended X-ray absorption
fine structure) spectroscopy or X-ray diffraction techniques have reported formation of
pyromorphite-type mineral phases on iron (hydr)oxides (Weesner and Bleam, 1998; Scheckel
and Ryan, 2003; Hashimoto et al., 2009). It has been debated, though, to what extent the
immobilisation of lead(II) in soil is really due to formation of pyromorphite. In general the
conditions in these studies were such (pH > 6 and/or high dissolved lead(II) concentrations)
that the formation of pyromorphite-type mineral phases may have been favourable. According
to recent studies, it has been suggested that pyromorphite-type minerals may be responsible
for as little as 30 % of the immobilisation if the formation is inhibited by complexation with
Fe/Al oxides and/or organic matter (Hashimoto et al., 2009, 2011).
It has been known for a long time that copper(II) and lead(II) are bound strongly to iron
(hydr)oxides such as ferrihydrite (e.g., Benjamin and Leckie, 1981). Batch experiments in
combination with surface complexation models show that lead(II), and maybe also copper(II),
are adsorbed more strongly to a minor part of the sorption sites on ferrihydrite (Swedlund and
Webster, 2001; Swedlund et al., 2003; Gustafsson et al., 2011). Site heterogeneity has also

4
been found in the presence of an oxyanion, sulfate, (Swedlund and Webster, 2001; Swedlund
et al., 2003).
X-ray absorption spectroscopy (XAS) has frequently been used to study surface complexes
with lead(II) and copper(II). Lead(II) forms inner-sphere edge-sharing bidentate complexes on
several iron (hydr)oxides, for example on goethite (Bargar et al., 1997b; Ostergren et al.,
2000a), hematite (Bargar et al., 1997b), and ferrihydrite (Scheinost et al., 2001; Trivedi et al.,
2003) with an average Pb…
Fe distance of about 3.3 Å. Under some circumstances though,
there have been indications also of other complexes. An inner-sphere monodentate complex
with a Pb…
Fe distance of 3.89 Å was suggested at low pH (< 4.5) for lead(II) adsorption to
ferrihydrite (Trivedi et al., 2003). Ostergren et al (2000a), investigating lead sorption to
goethite, interpreted a Pb…
Fe distance of 3.9 Å as a bidentate cornersharing complex.
Copper(II) forms inner-sphere edge-sharing bidentate complexes on ferrihydrite (Scheinost
et al., 2001; Moon and Peacock, 2012), with an average Cu…
Fe distance of about 3.0 Å. In
contrast, for goethite, hematite and lepidocrocite, EXAFS evidence for corner-sharing
bidentate complexes has been obtained, in which the Cu…
Fe distance is longer, i.e. between
3.2 and 3.4 Å (Peacock and Sherman, 2004). Parkman et al (1999) suggested that a longer
Cu…
Fe distance of 3.67 Å on lepidocrocite could also be interpreted as a corner-sharing
complex.
Xie and Giammar (2007) showed that the addition of phosphate increased lead(II) sorption
to goethite. In contrast, Weesner and Bleam (1998) did not observe any significant effect on
lead(II) sorption to goethite upon the addition of phosphate. The reasons for the different
observations in these two studies are not clear but might be related to differences in
experimental setup. Weesner and Bleam (1998) performed batch experiments with 2 µM
lead(II) and 2 µM phosphate/m2 goethite while Xie and Giammar used recirculating
microcolumns containing goethite coated sand, 0.8 µM Pb/m 2 goethite and a wide range of

5
phosphate concentrations. Interestingly, in spite of the absence of increased sorption in the
systems with phosphate, Weesner and Bleam (1998) draw the conclusion that lead(II) adsorbs
as an inner-sphere complex and interacts with phosphate at the oxide-solution interface. Xie
and Giammar (2007), on the other hand, used a surface complexation model according to
which the enhanced lead(II) adsorption in presence of phosphate could be explained mainly
by electrostatic interaction. Ternary lead(II)-goethite complexes have been reported to form
on goethite with anions such as sulphate, carbonate and chloride (ie. Elzinga et al., 2001;
Ostergren et al., 2000a; 2000b; Bargar et al., 1998). These authors found spectroscopic
evidence for the formation of monodentate or bidentate corner-sharing lead-ferrihydrite
complexes further stabilized by the anion.
Phosphate effects on copper(II) interaction with iron oxy(hydro)xides have been less
studied but Nelson (2012) showed that arsenate, a closely related anion, enhanced copper
sorption to goethite. Based on surface complexation modeling this was attributed to the
formation of two ternary surface complexes. One (dominating) with the components arranged
in the order surface-ligand-metal (a type B complex) and one with the components arranged
in the order surface-metal-ligand (a type A complex). Few spectroscopic data on the addition
of phosphate to Cu(II) iron (hydr)oxide system exist. A related system studied by Sheals et al.
(2003), showed that copper(II) forms ternary complexes with goethite in the presence of
phosphomethylglycine (PMG). At low pH a type B complex was suggested (components
arranged as: surface-PMG-Cu(II)) but at high pH there were indications of a type A complex
(components arranged as: surface-Cu(II)-PMG).
In this study we investigate the effect of phosphate on sorption of copper(II) and lead(II) to
ferrihydrite, at low equilibrium copper(II) and lead(II) concentrations typical for mildly
contaminated soils (soils containing a few hundred mg/kg dw of copper or lead, based on
Swedish classification of contaminated soils (Swedish EPA, 2002)). Ferrihydrite is a poorly

6
crystalline iron (hydr)oxide common in nature. Due to its extremely large surface area and
reactivity, ferrihydrite is important for metal retention in the environment (Jambor and
Dutrizac, 1998). The aim was to identify the surface complexes formed and to derive
constants for the surface complexation reactions. To do this a combination of batch
experiments, EXAFS spectroscopy and surface complexation modeling with the three-plane
CD-MUSIC model was applied.
2. MATERIALS AND METHODS
2.1 Ferrihydrite preparation
2-line ferrihydrite was prepared using the method of Swedlund and Webster (1999) and
Schwertmann and Cornell (2000). A solution containing 36 mM Fe(NO3)3 and 12 mM NaNO3
was brought to pH 8.0 through drop-wise addition of 4 M NaOH (prepared just before it was
used). The resulting suspension was aged for about 16 h at 20 oC. Iron (hydr)oxide particles
from such a suspension have earlier been examined by Fe K-edge EXAFS spectroscopy
(spectrum shown by Gustafsson et al., 2007) and found to be 2-line ferrihydrite. After
synthesis the ferrihydrite suspension was back-titrated with 0.1 M HNO3 to pH 4.6 and stirred
for about 30 min just before starting the batch experiments to avoid the presence of excessive
CO2 in the suspensions.
2.2 Batch experiments
Batch experiments producing data for copper(II) and lead(II) adsorption to ferrihydrite as well
as copper(II) and lead(II) adsorption to ferrihydrite in presence of phosphate were all prepared
and analyzed as described below. The data for lead(II) adsorption to ferrihydrite in absence of
phosphate that are discussed has been published in Gustafsson et al. (2011).

7
To prepare suspensions for batch experiments an amount of ferrihydrite suspension was
first mixed with water and stock solution of NaNO3 to produce a background electrolyte
concentration of 0.01 M. Then various amounts of acid (HNO3) or base (NaOH, prepared the
same day) were added to produce a range of pH values to cover the adsorption edges. Then an
aqueous solution of NaH2PO4 was added directly followed by addition of aqueous solutions of
Pb(NO3)2 or Cu(NO3)2.
The samples were equilibrated in tightly sealed 40 mL polypropylene centrifuge tubes
placed on an end-over-end shaker and shaken gently for 24 h at room temperature (21oC).
They were then centrifuged for 20 min at about 3000g and filtered using 0.2-m single-use
filters (Acrodisc PF, Pall Corporation, Ann Arbor, MI). The pH was measured on the
unfiltered supernatant using a Radiometer combination electrode. Part of the filtered
suspension was acidified (1 % HNO3) and analyzed for Cu and Pb with inductively coupled
plasma mass spectroscopy (ICP-MS) using a Perkin-Elmer ELAN 6100 instrument (Perkin-
Elmer Inc., Waltham, MA, USA). Dissolved phosphate concentrations were analyzed on
filtered samples with the acid molybdate method using flow injection analysis (Aquatec-
Tecator Autoanalyzer, Foss Analytical, Copenhagen).
Gustafsson et al. (2011) examined possible artifacts because of iron dissolution at low pH
and lead(II) adsorption to container walls and to the filters; these effects were found to be
very small although a slight contribution was possible at the highest Pb/Fe ratio. The
adsorption of copper(II) to container walls and filters was investigated within this study and
the conclusions were similar. Results from equilibrating 3 mM copper(II) solutions without
ferrihydrite show 0.6, 1.6 and 8 % copper(II) adsorption at pH 3.9, 4.5 and 5.3, respectively.
Therefore no strong contribution from container wall or filter sorption is expected except
perhaps at the highest pH level of the system with the highest Cu/Fe ratio (results were not
corrected for this effect). The interference of carbonate is also likely to be small. Dissolved
8
inorganic carbon was measured in separate batch experiments conducted at pH 4 to 10 with
no metals added. Below pH 6.3 inorganic carbon concentration was less than 13 µM and at
pH 7.3 less than 41 µM. All suspensions were undersaturated with respect to known lead(II)
and copper(II)-carbonate phases (the least soluble being cerrusite, PbCO3(s), log Ks = -13.2 at
25oC). By use of a surface complexation model based on the carbonate adsorption data of
Zachara et al. (1987), we concluded that carbonate might have a very small influence on
surface complexation of lead(II) and copper(II) in the highest pH range of this study, but
should not at all affect the results below pH 6.3, the main condition in this study. These
results are in accordance with the observations of Villalobos et al. (2001), who concluded that
the presence of up to 1 % CO2 did not affect Pb2+
sorption to goethite below pH 6.5. For the
X-ray spectroscopic measurements ferrihydrite was sampled directly from batch experiments
conducted immediately before measurements.
2.3 X-ray absorption spectroscopy
X-ray spectroscopic measurements of ferrihydrite samples from the batch experiments were
performed at the Cu K and Pb L3 edges. The measurements were conducted at the wiggler
beam line 4-1 at Stanford Synchrotron Radiation Lightsource (SSRL), Stanford, USA, in
February 2011. The beam line operated at 3.0 GeV and with a ring current of 197-200 mA
(top-up mode). The station was equipped with a Si[220] double crystal monochromator. The
measurements were performed in fluorescence mode using a 13 element Ge array
fluorescence detector. For Cu, a combination of Ni and Al filters were used, together with
Soller slits, to reduce Fe fluorescence and scattering contributions. For Pb, Al and Ge filters
were used, with otherwise the same setup as for Cu. The Si[220] monochromator was detuned
50 % (Cu) or 60 % (Pb) of maximum intensity to reduce higher-order harmonics. Internal
energy calibration was made with a foil of metallic copper or lead assigned to 8.979 and

9
13.035 keV, respectively (Thompson et al., 2009). Between 10 and 20 scans were collected
per sample. All EXAFS spectra were then treated in the Athena software (version 0.8.061)
(Ravel and Newville, 2005). Sample scans were individually studied to identify and discard
poor scans. Energy calibration, averaging and background removal were carried out using the
procedures described by Kelly et al. (2008). The background was removed using the
AUTOBAK algorithm incorporated in Athena, with a k-weight of 2 or 3 and with the Rbkg
parameter set to 1 for copper(II) and to 1.1 for lead(II). A model of the first shell was used to
improve the background for copper(II) spectra, as described by Kelly et al. (2008).
To decide if a certain peak in the Fourier transform originates from a heavy or a light back-
scatterer, wavelet transform (WT) analyses of the EXAFS spectra can be performed (Funke et
al., 2005), and has been implemented in several recent studies (e.g. Karlsson et al, 2008;
Loring et al, 2009). In simplified terms, the wavelet transform is a 3-D image that combines
the EXAFS-spectra in k-space and r-space (FT transform) where the back-scattering of the
elements appear with high intensity. Depending on the weight of the back-scatterer the
maximum intensity appears at different k-values. The Morlet wavelet transform incorporated
in the Igor Pro script was used (Wavelet2.ipf; Chukalina, 2010). EXAFS spectra (k3-
weighted) were imported to the script, and a wavelet parameter combination of κ = 7 (copper)
or κ = 6 (lead) and σ = 1 was used, with a range of R + ΔR from 2 to 4 Å (corresponding to
interatomic distances of about 2.5 to 4.5 Å). The k-range used was from 2.7 to 9-10.5 Å-1
for
the copper(II) spectra, and from 2.25 to 8-9 Å-1
for the lead(II) spectra (the same k-ranges as
used in the EXAFS fitting procedure described below).
The Artemis program (Ravel and Newville, 2005) was used for final data treatment of the
EXAFS spectra. Theoretical scattering paths were calculated using FEFF (Ankudinov et al.,
1998). For copper(II), they were based on the structure of copper(II) hydroxide, Cu(OH)2,
(Oswald et al, 1990), cornetite, Cu3PO4(OH)3, (Eby and Hawthorne, 1989) and libethenite,

10
Cu2PO4OH, (Heritsch, 1940) with partial Fe-for-Cu substitution, except for the Cu-O multiple
scattering paths that were calculated directly in FEFF. For lead(II), the scattering paths were
based on the structure of red tetragonal lead(II) oxide, PbO, (Leciejewicz, 1961), pattersonite,
PbFe3(PO4)2(OH)4[(H2O)0.5(OH)0.5]2, (Kolitsch et al., 2008) with partial Fe-for-P substitution,
and lead tetrapolyphosphate (Averbuch-Pouchot and Durif, 1987) with partial Fe-for-Pb
substitution. The fitting procedure was performed on the Fourier transform real part between
1 and 4 Å for copper(II), and between 1.1 and 4 Å for lead(II) using a Hanning window (dk
value = 1) and optimizing over k-weights of 1, 2 and 3. Refined models were evaluated not
only by means of goodness-of-fit (as evidenced by the R factor in Artemis), but also by
qualitative comparison of WT plots of the model spectra with WT plots of the EXAFS
spectra.
During the fitting procedure the amplitude reduction factor (S02) was set to 0.8 for
copper(II) spectra and to 1.0 for lead(II) spectra based on fitting of this parameter for the first
coordination shell. For copper(II) samples without phosphate, one Cu_O path corresponding
to four axial oxygens, three multiple scattering paths (Cu_O
_O paths at 180º), and one Cu
…Fe
path (Cu…
Fe1) were used. Several other combinations of scattering paths were tested in the
fitting procedure before deciding to use these paths, including contributions from two Cu…
Fe
distances and multiple scattering from Cu-O-O paths at 90º and Cu-O-Fe paths. For lead(II)
samples without phosphate, two Pb_O paths were used with Pb
_O1 representing oxygens
attached to the ferrihydrite surface and Pb_O2 representing neighboring water (or nitrate)
molecules. One Pb…
Fe1 path was added. Other combinations of contributions from heavy
back-scatterers and multiple scattering were also tested, including several Pb…
Fe distances
and multiple scattering from Pb-O-Fe paths and Pb-O-O paths. The coordination numbers
(CN) of samples without phosphate were set during fitting based on previous findings for
adsorption of copper(II) and lead(II) to ferrihydrite (Scheinost et al., 2001; Moon and

11
Peacock, 2012; Trivedi et al., 2003). These show that the first coordination shell of the
lead(II) complex is dominated by back-scattering from two oxygens, the first coordination
shell of the copper(II) complex is dominated by back-scattering from four axial oxygens and
that both copper(II) and lead(II) form edge-sharing bidentate complexes to ferrihydrite. CN of
the second oxygen path of Pb was set to a number that gave Debye-Waller factors (σ2) larger
than the first Pb-O paths since they have a higher degree of disorder being more loosely
bound. The path lengths (R) and Debye-Waller factors were fitted.
To model the corresponding samples with phosphate (i.e. samples with the same metal and
ferrihydrite concentrations but with phosphate added) we used a step-wise approach. After
initial investigation of the spectra with different combinations of Cu∙∙∙Fe/Cu∙∙∙P and
Pb∙∙∙Fe/Pb∙∙∙P paths we concluded that there was most likely a contribution from the same
edge-sharing bidentate complex as in the samples without phosphate. Therefore, to investigate
the magnitude of the contribution from this edge-sharing complex and to reduce the number
of fitting variables, we used some of the parameters obtained for edge-sharing complexes
from fitting the samples without phosphate and fixed them when fitting the samples with
phosphate. The Debye Waller factors from the Cu∙∙∙Fe1/Pb∙∙∙Fe1 paths and the path-lengths
and Debye Waller factors of the multiple scattering paths (Cu_O
_O) were therefore fixed and
instead the coordination numbers of the Cu∙∙∙Fe1/Pb∙∙∙Fe1 paths were fitted. We then tried
adding a Cu∙∙∙P/Pb∙∙∙P path and a second, longer, Cu∙∙∙Fe/Pb∙∙∙Fe path (Cu∙∙∙Fe2/Pb∙∙∙Fe2) in
the phosphate-containing samples. The coordination numbers of the Cu∙∙∙Fe2/Pb∙∙∙Fe2 paths
was defined as 1-Cu∙∙∙Fe1 and 1-Pb∙∙∙Fe1.
2.4 Surface complexation modeling
The three plane CD-MUSIC model was used with new surface charging parameters for
ferrihydrite (Table 1). In agreement with recent structural analyses of ferrihydrite (Hiemstra

12
and van Riemsdijk, 2009; Hiemstra, 2013), we assumed that triply coordinated ≡Fe3O groups
accounted for 20 % of the proton charging whereas singly coordinated ≡FeOH groups
accounted for the remaining 80 %. In line with the simplifications of Hiemstra et al. (2009),
the role of doubly coordinated ≡Fe2OH groups was not explicitly considered, and the pKa of
the ≡FeOH and of the ≡Fe3O groups was set to the same value (8.1), see Table 2. To be
consistent with Hiemstra and van Riemsdijk (2009), the inner-layer and outer-layer
capacitances were set to higher values (1.15 and 0.9 C m-2
, respectively) than for goethite, to
reflect the spherical morphology of ferrihydrite. The total density of the ≡FeOH and ≡Fe3O
groups was set to 7.8 sites nm-2
using a molecular weight of ferrihydrite of 89 g/mol and a
specific surface area of 650 m2 g
-1. This is a slightly larger site density than in the work of
Hiemstra and van Riemsdijk (2009; 7.2 sites nm-2
), but consistent with the larger densities
suggested by Hiemstra (2013). The surface charging parameters were found to provide an
excellent description to the acid-base titration results of Hsi and Langmuir (1985; c.f. Fig. S1,
Electronic Annex), which have been used in the past to calibrate surface charging models for
ferrihydrite (Gustafsson et al., 2009; Hiemstra and van Riemsdijk, 2009). The surface
complex-forming ions in this work (Pb2+
, Cu2+
, PO43-
) were assumed to react exclusively with
the ≡FeOH groups, as these are generally considered to be the most reactive ones (Hiemstra et
al., 2009).
For PO43-
adsorption, we used a model description assuming bidentate complexes to be
dominant, with CD values calculated by Hiemstra and van Riemsdijk (2006) using DFT
(density functional theory). As in previous modeling attempts (Sjöstedt et al., 2009), we also
included a doubly protonated monodentate species at low pH. Table 2 lists all surface
complexation reactions considered.
The surface complexation reactions for copper(II) and lead(II) were constrained from
spectroscopic evidence of this study (c.f. Results section). Therefore in the modeled reaction,

13
one Cu2+
or Pb2+
ion was reacted with two ≡FeOH groups in systems without phosphate
(Table 2). The surface complexation constants and CD (charge distribution) values that
describe the change in o-plane and b-plane charge were fitted. The implementation of the CD-
MUSIC model for Pb2+
adsorption to ferrihydrite considered surface site heterogeneity by
dividing the sites into three groups with different affinities for Pb2+
adsorption. A small part of
the sites (1 % of the total number of sites) were assigned higher affinities. The high-affinity
sites were divided into two groups corresponding to 0.9 and 0.1 % of the total number of sites
and the latter group was assigned the highest affinity (Gustafsson et al., 2011). This was not
necessary to apply in the case of Cu2+
adsorption, which was described well using an equal
affinity for all sites (c.f. Results section).
In the model optimization process, surface complexation constants for single-sorbate
systems were optimized with FITEQL ver. 4.0 (Herbelin and Westall, 1999), as modified by
Gustafsson (2003) to include the CD-MUSIC model and the description of bidentate
complexation reactions using mole fractions (this add-in is available from
http://www2.lwr.kth.se/forskningsprojekt/mow/fiteql.htm). FITEQL uses the overall variance
VY as a goodness-of-fit parameter, which is defined as the weighted sum-of-squares divided
by the number of degrees of freedom. When CD values were fitted, the procedure was
repeated until an optimal set of CD values (that led to the lowest VY values) was found. For
optimization of surface complexation constants for lead(II) and copper(II) adsorption several
datasets were considered; the data sets of Benjamin and Leckie (1981; 1982; for Pb2+
and
Cu2+
) Swedlund and Webster (2001; for Cu2+
), Swedlund et al. (2003; for Pb2+
), Gustafsson et
al. (2011; for Pb2+
) and data for Cu2+
adsorption of this study (Table S2, Electronic Annex).
Together these data sets represent a wide variation of metal:Fe ratios and ferrihydrite
suspension concentrations. For phosphate adsorption we considered six data sets of which five
were collected during the course of this study (Table S3, Electronic Annex). Weighted

14
average log K’s and 95 % confidence intervals (95 CI) were calculated according to Dzombak
and Morel (1990). The latter are heavily dependent on the assumed uncertainty of the data
input to FITEQL – a relative error Srel = 0.05 for [H+], [Pb
2+], [Cu
2+] and [PO4
3-] was applied,
and an absolute error Sabs = 1 % of the total concentration of the sorbing ion (see, e.g.,
Dzombak and Morel, 1990).
For ternary systems, i.e. for ferrihydrite suspensions that contained both metal (Pb2+
or
Cu2+
) and phosphate, initially model predictions were made with Visual MINTEQ
(Gustafsson, 2012), assuming that any ternary interactions could be explained with
electrostatic interactions only (model 1). To assess if this model possibly could explain our
results, uncertainties in the model predictions were calculated from the estimated 95 CI for the
individual log K’s by use of a Monte-Carlo method in which 2 000 randomly generated values
of each log K were processed in Visual MINTEQ. For the generated output, the 95 CI for the
dissolved concentration of ions in each data point were calculated assuming that the dissolved
concentrations were log-normally distributed. We then made a model (model 2) that
considered ternary complexes that included two ≡FeOH groups, one copper(II) or lead(II) ion
and one phosphate ion (consistent with our EXAFS interpretations, c.f. Results section). The
surface complexation constants and CD values that describe the change in o-plane and b-plane
charge were fitted. Ternary surface complex formation constants (i.e. for Pb-PO4 or Cu-PO4
onto ferrihydrite) could not be optimized in a consistent manner by FITEQL because of poor
convergence characteristics. Instead the constants and CD values for these reactions were
optimized with a trial-and-error procedure by use of Brent’s method to minimize the rmse
(root-mean square error) in the adsorbed fraction. As a consequence, the uncertainty of these
log K’s was not calculated.
Finally, we tested a model (model 3) that did not include any ternary complexes but
monodentate ferrihydrite-metal complexes (Fig. 9B and 9F) that were important in phosphate-

15
containing systems but not in systems without phosphate were included. Such monodentate
complexes would be in accordance with EXAFS results. The model is discussed in detail in
the Electronic Annex.
In their model approach, Hiemstra et al. (2009) divided the ≡FeOH groups into two
subgroups, one that may form edge-sharing bidentate complexes, and another that can form
corner-sharing bidentate complexes. While this makes sense from a structural point of view,
we decided (after having tested such an approach) to adopt a simplified approach considering
only one type of ≡FeOH group. The reason was that the results were almost identical, the
main difference being that the surface complexation constants were numerically different. The
only notable difference in the model fit was observed at the highest surface coverage in one of
the lead(II) data sets. Because of the small differences we used the simpler approach, which
results in a substantially smaller number of surface species; this makes the model easier to set
up and to treat with optimization software such as FITEQL.
3. RESULTS
3.1 Copper(II), lead(II) and phosphate adsorption to ferrihydrite
Results from the batch experiments of the copper(II)-ferrihydrite and lead(II)-ferrihydrite
systems (Fig. 1) indicate that the adsorption affinity of copper(II) on ferrihydrite is
independent of the total copper(II) concentration as long as the sorbed copper(II) is far from
saturating the ferrihydrite sorption sites. Copper(II)-ferrihydrite systems with Cu/Fe-ratios of
0.0001, 0.001 and 0.01 follow essentially the same adsorption edge with about 50 % of the
copper adsorbed at pH 5.0. However, at a Cu/Fe ratio of 0.1 the adsorption edge moves to
higher pH and only 10 % of the copper is adsorbed at pH 5.0.
By contrast, the adsorption of lead(II) to ferrihydrite has been shown earlier to be highly
dependent on the lead(II) concentration (Gustafsson et al, 2011; results reproduced in Fig. 1).

16
When a higher Pb/Fe ratio is used, a higher pH is required to adsorb all lead(II). The shape of
the sorption edge also changes slightly to a somewhat flatter shape at higher Pb/Fe ratio.
Results from sorption of phosphate to ferrihydrite are plotted in Fig 2. Phosphate
adsorption ranges from 90-100 % at pH 3 to 40-60 % at pH 7 in the five series performed
within this study.
With phosphate added in the batches, the sorption of copper(II) and lead(II) was enhanced
in all experimental series (Fig. 3 and Fig. 4). The effect was larger for lead(II) for which the
sorption edge was displaced one pH unit or more at low pH when phosphate was added. The
enhancement was also distinct, but smaller, for copper(II) except at the highest Cu/Fe ratio
(0.1), where it was very small. As in the single-sorbate systems the sorption of copper(II) was
essentially independent of the copper(II) concentration, whereas the sorption of lead(II)
increased at lower Pb/Fe ratios. In most experimental series the phosphate concentrations
were much higher than the metal concentrations and therefore it was not possible to
distinguish any effect of copper(II) or lead(II) on phosphate sorption to ferrihydrite. In one
series though, with the highest addition of lead(II) compared to phosphate, there was a clear
enhancement of phosphate sorption compared to the corresponding system without lead(II)
(Fig. 2).
Visual MINTEQ was used to check for possible precipitation of copper(II) and lead(II)
phosphate minerals. However, under the conditions used in this study, all systems were found
to be magnitudes under-saturated with respect to known copper(II) and lead(II) phosphates
(Table S1, Electronic Annex). The highest saturation indexes recorded were -3.38 for
Cu3(PO4)2×3H2O(s), -1.39 for PbHPO4(s), and -2.14 for Pb5(PO4)3OH(s). Copper(II) and
lead(II) (hydr)oxide minerals were also consistently undersaturated according to Visual
MINTEQ.

17
3.2 Structure of copper(II) and lead(II) surface complexes
Eight samples of ferrihydrite from the batch experiments, four with copper(II) and four with
lead(II), were analysed with EXAFS spectroscopy to obtain details about the structure on
molecular level. The composition of the samples and their pH values are listed in Table 3.
3.2.1 Copper(II) surface complexes
Wavelet transform (WT) analysis was used to qualitatively assess the second-shell
contributions from heavy back-scatterers such as iron as compared to lighter elements such as
oxygen, nitrogen and phosphorus. A heavy element would appear with a maximum in the
envelope of k3-weighted EXAFS function at k=8-10 Å
-1 in the WT analysis of copper(II)
spectra, whereas lighter elements have maxima at lower energies. The WT analysis of the
EXAFS functions revealed an area of back-scattering from a heavier element at k = 8-10 Å-1
at about R + ΔR = 2.5-3.0 Å (Fig 5) in all copper samples. The intensity of back-scattering at
this distance was lower in the WT plot of the corresponding samples with phosphate. The area
of back-scattering was also stretched out to about R + ΔR = 3.5 Å which suggests another
heavy back-scatterer at a longer distance from the copper(II) atoms. The first heavy back-
scatterer, present in all samples, could be fit with an iron atom located at R = 3.00-3.05 Å
(Table 3). This is in agreement with the edge-sharing bidentate complex identified on
ferrihydrite also by Scheinost et al (2001) and Moon and Peacock (2012). For the samples
with phosphate, the intensity of the signal from the first heavy back-scatterer was lower also
in the EXAFS Fourier transform fitting; the coordination number decreased from 1 to 0.53 for
both samples with σ2
fixed at the value obtained when fitting the samples without phosphate.
Inclusion of a second heavy back-scatterer did not significantly improve the model fits,
although it could be included at about 3.6 Å for the samples with phosphate. On the other
hand the WT plots of this model with two different Cu…
Fe distances (not shown) resembled
18
the WT plots for the original spectra much more closely compared to a model with only one
short Cu…
Fe distance. Possibly, the contribution of a second Cu…
Fe distance to the EXAFS
spectra is too small to be clearly visible in the model spectra. There were also areas of
enhanced intensity in all samples at lower energies (k = 3-4 Å-1
) and at R + ΔR = 2.5-3.2 Å,
which was interpreted as multiple scattering effects (Fig. 5). These could be reproduced fairly
well in the WT plots of the model (data not shown).
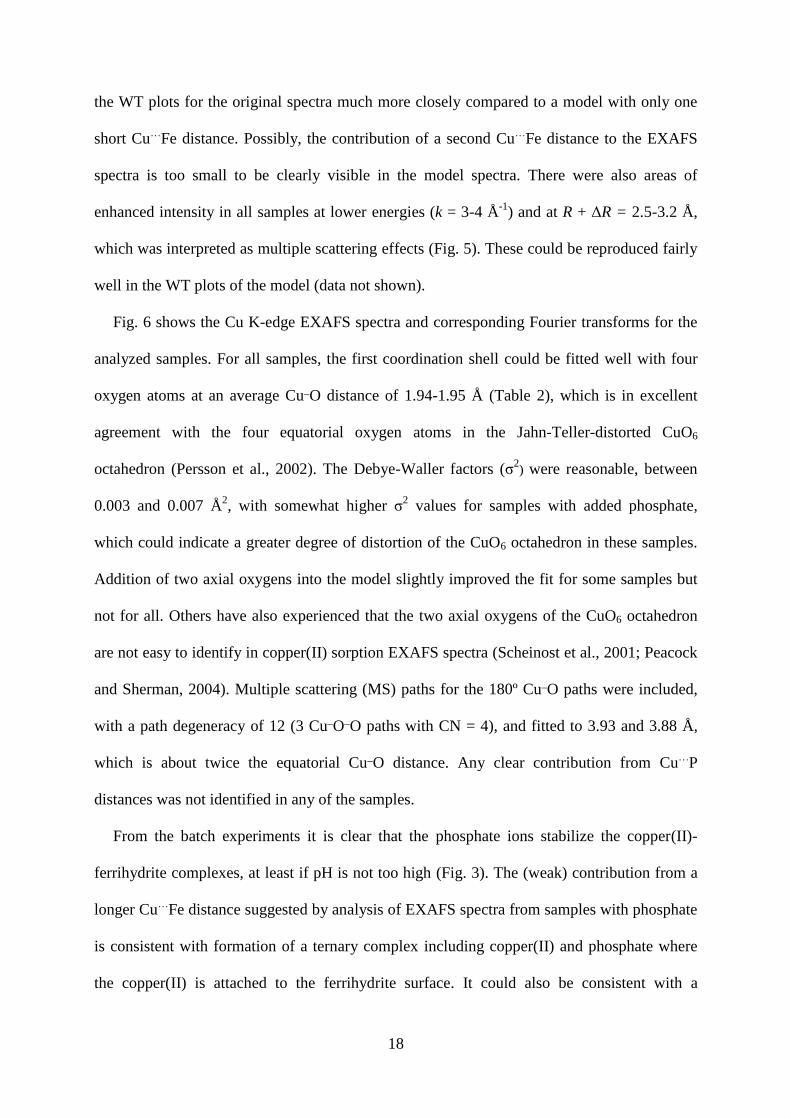
Fig. 6 shows the Cu K-edge EXAFS spectra and corresponding Fourier transforms for the
analyzed samples. For all samples, the first coordination shell could be fitted well with four
oxygen atoms at an average Cu_O distance of 1.94-1.95 Å (Table 2), which is in excellent
agreement with the four equatorial oxygen atoms in the Jahn-Teller-distorted CuO6
octahedron (Persson et al., 2002). The Debye-Waller factors (σ2) were reasonable, between
0.003 and 0.007 Å2, with somewhat higher σ
2 values for samples with added phosphate,
which could indicate a greater degree of distortion of the CuO6 octahedron in these samples.
Addition of two axial oxygens into the model slightly improved the fit for some samples but
not for all. Others have also experienced that the two axial oxygens of the CuO6 octahedron
are not easy to identify in copper(II) sorption EXAFS spectra (Scheinost et al., 2001; Peacock
and Sherman, 2004). Multiple scattering (MS) paths for the 180º Cu_O paths were included,
with a path degeneracy of 12 (3 Cu_O
_O paths with CN = 4), and fitted to 3.93 and 3.88 Å,
which is about twice the equatorial Cu_O distance. Any clear contribution from Cu
…P
distances was not identified in any of the samples.
From the batch experiments it is clear that the phosphate ions stabilize the copper(II)-
ferrihydrite complexes, at least if pH is not too high (Fig. 3). The (weak) contribution from a
longer Cu…
Fe distance suggested by analysis of EXAFS spectra from samples with phosphate
is consistent with formation of a ternary complex including copper(II) and phosphate where
the copper(II) is attached to the ferrihydrite surface. It could also be consistent with a

19
monodentate copper(II)-ferrihydrite complex. Both these alternatives have been evaluated
with the CD-MUSIC model (c.f. 3.3 Surface complexation modeling).
A ternary complex would require part of the copper(II) to be bound to phosphate, with a
Cu…
P distance of max 3.5 Å. Such a Cu…
P distance could not be identified by EXAFS
spectroscopy. This can be explained by P being a light element and not easily identifiable in
the second shell at such a distance. Another possibility is that the interaction between
copper(II) and phosphate is of an outer-sphere nature, in which case the Cu…
P distance would
be even longer with a wider distance distribution.
3.2.2 Lead(II) surface complexes
Wavelet transform analysis (WT) of the EXAFS functions revealed differences between
lead(II) samples with and without phosphate (Fig 7). Areas of back-scattering from a heavier
element centered at about k = 5-7 Å-1
were pronounced at about R + ΔR = 2.5-3.0 Å in
samples without phosphate. In samples with phosphate the back-scattering was comparatively
lower at this distance but the intensity was somewhat enhanced also at longer distances, out to
about R + ΔR = 3.5 Å which suggests that a heavy back-scatterer is present also at a longer
distance in these samples. A Pb…
Fe distance of between 3.36 to 3.43 Å was included for all
samples but with a lower CN for the samples with phosphate, in accordance with the lower
amplitude of the peaks for the Fourier transforms for these samples (Fig. 8). In samples with
phosphate a second Pb…
Fe at about 4 Å improved the fit significantly. A Pb…
Fe distance of
about 3.35 Å indicates a bidentate edge-sharing complex and is consistent with earlier results
for lead(II) sorption on ferrihydrite (Trivedi et al., 2003; Scheinost., et al 2001; Xu et al.,
2006). The longer Pb…
Fe distance that appeared in samples with phosphate is similar to
Pb…
Fe distances of 3.9 Å earlier identified for lead(II) adsorption to goethite in presence of
sulfate (Ostergren et al. 2000a; Elzinga et al. 2001) carbonate (Ostergren et al., 2000b) or
chloride (Bargar et al., 1998) and attributed to the formation of ternary surface complexes. A

20
similar distance of Pb…
Fe 3.89 Å was also suggested for a binary lead(II)-ferrihydrite system
at low pH by Trivedi et al. (2003) and attributed to a monodentate lead(II) complex. (We did
not find this longer Pb…
Fe distance in samples without phosphate, though.)
The first coordination shell could be modeled with two oxygens at R = 2.33-2.38 Å in all
samples. The Debye Waller factors were rather high, σ2
= 0.009 and 0.013, which is typical
for lead (Bargar et al., 1997a). A second set of four oxygens (Pb_O2) with a path length
between R = 2.56 and 2.62 Å and σ2
at about 0.03 Å2 improved the fits. These parameters are
in agreement with water molecules (and possibly nitrate), bound to the lead(II) ion (Persson et
al. 2011). Due to the wide Pb-O bond distance distribution, normally in low symmetry
configuration giving large Debye-Waller coefficients (Persson et al. 2011), multiple scattering
paths were too weak to be distinguished.
The appearance of a longer Pb…
Fe distance could be explained by formation of a ternary
complex with the lead attached to the ferrihydrite surface or by a monodentate complex. Both
these possibilities were tested in surface complexation modeling (c.f. below). A ternary
complex would require part of the lead(II) to be bound to phosphate with a Pb…
P distance of
max 3.9 Å. However, this distance could not be identified by EXAFS spectroscopy. As for
copper(II), this can be explained by P being a light element and not easily identifiable in the
second shell at such a distance and/or that the interaction is of an outer-sphere nature, with an
even longer Pb…
P distance.
3.3 Surface complexation modeling
3.3.1 Surface complexation modeling in single sorbate systems
Based on the EXAFS results the required copper(II) adsorption reaction in the CD-MUSIC
model was defined as a bidentate complex. The best results were obtained when it was
assumed that the bound copper(II) was hydrolyzed, i.e. that one of the solution-oriented

21
oxygens in the copper(II) coordination sphere had undergone hydrolysis. In the resulting
complex, ≡(FeOH)2CuOH, the CD values were fitted to the experimental data and were found
to be 0.5 for both the o-plane and the b-plane, which means that the fraction (f) of the Cu2+
charge attributed to the surface was 0.25, which is considered a realistic result.
As the results from the copper(II) batch experiments did not indicate any surface site
heterogeneity, only one type of site (i.e. one surface complexation constant) was used. With
this model, a satisfactory fit was obtained for all considered data sets, using the surface
complexation constant given in Table 2 (model fits are shown in Fig. 1 and in Fig. S2,
Electronic Annex). Much of the remaining discrepancy is probably caused by uncertainties in
the experimental data and can be attributed mainly to the difficulty to obtain precise pH
values in the poorly buffered extracts studied. All equations and constants used are listed in
Table 2, and further details are given in Table S5 in the Electronic Annex.
For the lead(II) surface complex, the bidentate complex, ≡(FeOH)2Pb+, the model provided
an excellent description to the data of Gustafsson et al. (2011) and Swedlund et al. (2003),
when surface site heterogeneity was considered (Fig. 1 and Fig. S3, Electronic Annex). This
was addressed in the model by dividing the sites into three different classes with different
affinity corresponding to 99 %, 0.9 % and 0.1 % of the surface sites. In this complex, lead(II)
is not hydrolyzed and displays an unusually large asymmetry (f = 0.6), which would create a
slight oversaturation of the surface oxygen ligands. Possibly this situation arises due to weak
interaction with a third surface group, which at present is not explicitly included in the model
(Gustafsson et al., 2011). Our EXAFS results, showing that lead(II) forms an edge-sharing
bidentate complex, is in general accordance with this model description. However, EXAFS
results are not available for Pb/Fe ratios lower than 0.01 due to the large Debye-Waller factors
(large bond distance distribution) of low symmetric lead(II) complexes. Therefore, our
22
spectroscopic results could not be used to understand the reasons for the considerable surface
site heterogeneity as observed for lead(II).
Consideration of site heterogeneity was important also for the description of the data of
Benjamin and Leckie (1981; 1982 Table S5, Electronic Annex). However, for the latter data
set the lead(II) binding was systematically weaker than for the two other data sets. The reason
for this difference is not known; one possibility could be differences in equilibration time.
Whatever the reason, we decided not to consider this data set for the calculation of weighted
average log K’s, as the main objective with this exercise was to provide a solid basis for
modeling the ternary lead(II) phosphate systems of this study. To provide input for the
modeling in the ternary systems, the sorption of phosphate to ferrihydrite was also
investigated. The results are summarized in, Fig. 2 and in Table S6, Electronic Annex. These
results are consistent with previous ones (Gustafsson, 2003). It should be noted that it could
not be entirely excluded that the precipitation of an iron(III) phosphate such as strengite,
FePO4×2H2O(s), could influence the results at low pH. The solubility constant of crystalline
strengite, as reported by Iuliano et al. (2007), implies that the phosphate-containing systems
are supersaturated with respect to strengite at pH < 5 (for systems containing 60 µM P) and at
pH < 6.5 (for systems containing 600 µM P). However, results obtained with infrared
spectroscopy and X-ray absorption near-edge structure (XANES) spectroscopy for similar
systems did not show any evidence for iron(III) phosphate formation on ferrihydrite (Willett
et al., 1988; Khare et al., 2005), and we consider it unlikely that significant amounts of a
crystalline iron(III) phosphate mineral could have precipitated during the short-term (24 h)
experiments of this study.
3.3.2 Surface complexation modeling in ternary systems with phosphate
In a model with only bidentate metal-ferrihydrite complexes (model 1) the enhanced
copper(II) and lead(II) sorption in systems with phosphate could not be described

23
satisfactorily by electrostatic interactions only, the exception being the system with the lowest
Cu/Fe ratio (with Cu = 30 µM, Fe = 0.3 mM, for which phosphate addition did not have a
large effect on copper(II) sorption). Examples of model predictions, with 95 % CI, are shown
in Fig. 3 and Fig. 4 (as dashed lines). Hence in all but one system, the interactions were
stronger than those predicted by electrostatic interactions, indicating the presence of
additional interactions. In addition, a significant enhancement of phosphate sorption was also
observed in the system with the highest Pb/Fe ratio (Fig. 2). For this reason ternary complexes
were included, resulting in model 2. Good model fits were obtained by including complexes
≡(FeO)2HCuPO3H0 and ≡(FeO)2HPbPO3H
0 (depicted in Figs. 9C and 9G). Copper(II) and
lead(II) are here monodentately coordinated to the ferrihydrite surface, which is in agreement
with interpretation of EXAFS data. The phosphate is protonated, coordinated to the
copper(II)/lead(II) ion and at the same time interacting with the surface. The CD values were
fit to 0.7 for the o-plane and to 0.3 for the b-plane for both complexes. This means that the
surface oxygens remain slightly undersaturated. This model was also able to describe the
effect of lead(II) on sorption of phosphate in the system with the highest Pb/Fe and PO4 ratio
(Fig. 2).
Similar to the case for single-sorbate systems only one type of surface site was used for the
ternary copper(II) complex. For the ternary lead(II) complex however, two sites with two
different affinities were required. A higher affinity was used for a small number (1 %) of the
surface sites. This resulted in the fits depicted in Fig. 3 and Fig. 4 with rmse = 5.1 % for
copper(II) and rmse = 2.0 % for lead(II).
It should be noted that corner-sharing complexes with the metal bidentately attached to the
ferrihydrite surface and the phosphate attached only to the metal (≡(FeOH)2CuPO4H20 and
≡(FeOH)2PbPO4H20, shown in Fig. 9D and 9H) would also be consistent with the EXAFS
results and yield the same result in the CD-MUSIC model.

24
It is also possible to describe the results with a model in which a monodentate metal-
ferrihydrite complex (Figs. 9B and 9F) becomes important in phosphate-containing systems
(Model 3, Electronic Annex). However, this model was not able to predict phosphate sorption
well in the system with the highest Pb/Fe ratio.
4. DISCUSSION
The EXAFS results of this study show that the coordination chemistry of copper(II) and
lead(II) changes in a similar way when phosphate is added to batches with ferrihydrite and
copper(II) or lead(II). The amount of Cu…
Fe/Pb…
Fe distances indicating edge-sharing
complexes diminishes and is partly replaced by a longer distance that suggests a monodentate,
or possibly, corner-sharing metal-ferrihydrite complex. These EXAFS results are, on the
whole, consistent with earlier studies on binary systems with copper(II) or lead(II) sorption to
ferrihydrite (i.e. Scheinost et al., 2001) and with EXAFS studies of ternary Pb(II)-SO4
systems with goethite (Ostergren et al., 2000b; Elzinga et al., 2001) indicating Pb…
Fe
distances about 3.9 Å in the presence of sulfate. Chloride and carbonate seem to have the
same effect on lead(II) coordination to goethite (Bargar et al., 1998; Ostergren et al., 2000a).
Our parameterization of the CD-MUSIC model for sorption in the single sorbate systems
with lead(II) and copper(II) coordinating bidentately to ferrihydrite perform very well for our
data (Fig 3 and 4) as well as other datasets (Fig S2, S3, Electronic annex). The use of the CD-
MUSIC model for lead(II) and copper(II) adsorption on ferrihydrite in single-sorbate systems
has also been evaluated by Ponthieu et al. (2006) using datasets of Benjamin and Leckie
(1981; 1982). However, their model approach was different from ours and the results are
therefore difficult to compare. In agreement with the EXAFS results, we only used bidentate
complexes in the model, whereas Ponthieu et al. (2006) also used tridentate complexes.
Moreover the latter authors assumed all major types of surface groups (≡FeOH, ≡Fe2OH and

25
≡Fe3O) to adsorb metals. As a result Ponthieu et al. (2006) used six complexes each for
copper(II) and lead(II) in their model, whereas we only used one for copper(II) and three for
lead(II), but with model fits that are comparable in quality.
For both ternary systems with copper(II) and with lead(II) the best modeling results were
obtained by introducing a ternary complex involving the metal ion, the phosphate ion and the
ferrihydrite surface (model 2). Such a model was able to describe the mutual enhancement of
metal and phosphate sorption in the ternary systems. The EXAFS and surface complexation
modeling results are consistent with two types of ternary complexes; (i) a ternary surface
complex where both metal and phosphate interact monodentately with the ferrihydrite surface
(composition ≡(FeO)2HMePO3H0, structure in Fig 9C and 9G), and (ii) a corner-sharing
ferrihydrite-metal complex in which the phosphate ion is bound to the metal but not to the
surface resulting in a type A complex with the composition ≡(FeOH)2-Me-H2PO4 (Fig 9B and
9H).
If the metal-ferrihydrite distances of 4.0 Å for lead(II) and 3.6 Å for copper(II) are
interpreted as evidence for monodentate coordination of copper(II) and lead(II) to the surface
(in agreement with option (i) above), EXAFS results would also be consistent with a ternary
type A complex with the composition ≡(FeOH)MePO4. However, this complex, including
only one surface group, was considered less likely as such a model yields a poorer fit (not
shown) and too large CD values for the o-plane.
Concerning option (ii), previous authors have attributed a 3.9 Å Pb…
Fe distance also to the
formation of corner-sharing complexes. In particular Ostergren et al. (2000b) interpreted
EXAFS results for a ternary goethite-lead(II)-sulfate system as corner-sharing ≡(FeOH)2-
Pb(II)-SO4 complexes where the sulfate ion interacts only with lead(II) and not with the
surface. We do not rule out this interpretation on the basis of our EXAFS results, as the

26
Pb…
Fe distance at 4.0 Å may be interpreted as a corner-sharing complex. Although we have
used CN = 1 for the Pb…
Fe distance in the EXAFS model in agreement with option (i) (Table
3), very similar fits can be obtained also with CN = 2, which is expected for a ternary corner-
sharing complex. The same is true for a Cu…
Fe distance of 3.6 Å. To our knowledge there are
no EXAFS studies on systems with copper(II), iron (hydr)oxide and inorganic ligands, but a
Cu…
Fe distance of 3.67 Å for copper(II) sorption to lepidocrocite was interpreted as a corner-
sharing complex by Parkman et al. (1999). To find out the surface structure more precisely
additional EXAFS studies and/or ATR-FTIR (Attentuated Total Reflectance Fourier
Transform Infrared Spectroscopy) studies are needed. EXAFS analyses could be made for
ternary systems in which a heavier analogue to P (preferably As) is used. Thus the changes in
the coordination of the ligand could also be investigated.
As the 4.0 Å Pb…
Fe and the 3.6 Å Cu…
Fe distances may indicate monodentate
coordination with the ferrihydrite surface and we do not distinguish any Pb…
P or Cu…
P
distances, the EXAFS results are also consistent with the formation of monodentate
FeOHCu+1.5
or FeOHPb+1.5
complexes (Fig 9B and 9F). Model 3, in which these complexes
were included, but not any ternary complexes, was able to explain the enhanced sorption of
copper(II) and lead(II) quite well (for details, see Electronic Annex). Although this possibility
cannot be discounted, we consider this alternative less likely, mostly because of the relatively
poor prediction of phosphate in the ternary system at the highest Pb/Fe ratio. Moreover,
because the equilibrium constant of the monodentate complex could not be determined in
single-sorbate systems, and since no presence of a monodentate complex could be detected
with EXAFS spectroscopy in single-sorbate systems, there is no experimental support neither
for the existence of such a complex nor for the value of its equilibrium constant.
In all our sorption experiments the pH value is a crucial parameter. Whereas the sorption of
copper(II) and lead(II) increases at higher pH, the sorption of phosphate is higher at low pH.

27
In Fig. 10, a model simulation of the effect of phosphate on the partitioning between the
proposed surface complexes is shown. The simulation was made in Visual MINTEQ using the
surface complexation constants of Table 2 and by fixing the total dissolved phosphate
concentrations. According to the simulation, the ternary surface complexes are important
under acidic conditions, below about pH 6, and they are more important for lead(II) than for
copper(II). For copper(II), very high dissolved phosphate concentrations are needed for any
significant amounts of ternary complexes to be formed at pH above 6. This reflects the much
larger effect on lead(II) sorption upon addition of phosphate. Similarly, the small difference in
copper(II) sorption in systems with and without phosphate at the highest Cu/Fe ratio (Fig. 3)
can partly be attributed to the high pH at the adsorption edge.
The results from this study show that phosphate may greatly enhance the adsorption of
lead(II) and copper(II) at low pH and that this is best explained by the formation of ternary
surface complexes. Geochemical models used for simulating trace element behavior in acidic
environments need to account for this type of reaction to properly describe partitioning of
metals between solution and the solid phase.
Acknowledgements: This research was funded by the Geological Survey of Sweden (SGU).
Portions of this research were carried out at the Stanford Synchrotron Radiation Lightsource,
a Directorate of SLAC National Accelerator Laboratory and an Office of Science User
Facility operated for the U.S. Department of Energy Office of Science by Stanford University.
The SSRL Structural Molecular Biology Program is supported by the DOE Office of
Biological and Environmental Research, and by the National Institutes of Health, National
Center for Research Resources, Biomedical Technology Program (P41RR001209). Abubaker
Edkymish, Maja Larsson and Lena Ek are thanked for parts of the laboratory work.

28
RERERENCES
Ankudinov, A.L., Ravel, B., Rehr, J.J. and Conradson, S.D. (1998) Real-space multiple-
scattering calculation and interpretation of X-ray absorption near-edge structure. Phys. Rev.
B 58, 7565-7576.
Averbuch-Pouchot, M. and Durif, A. (1987) Structure of lead tetrapolyphosphate. Acta Cryst.
C 43, 631-632.
Bargar J. R., Brown G. E., Jr. and Parks G. A. (1997a) Surface complexation of Pb(II) at
oxide-water interfaces: I. XAFS and bond-valence determination of mononuclear and
polynuclear Pb(II) sorption products on aluminum oxides. Geochim. Cosmochim. Acta 61,
2617–2638.
Bargar, J.R., Brown, G.E. and Parks, G.A. (1997b) Surface complexation of Pb(II) at oxide-
water interfaces: II. XAFS and bond-valence determination of mononuclear Pb(II) sorption
products and surface functional groups on iron oxides. Geochim. Cosmochim. Acta 61,
2639-2652.
Bargar, J.R., Brown, G.E. and Parks, G.A. (1998) Surface complexation of Pb(II) at oxide-
water interfaces: III. XAFS determination of Pb(II) and Pb(II)-chloro adsorption complexes
on goethite and alumina. Geochim. Cosmochim. Acta 62, 193-207.
Benjamin, M.M. and Leckie, J.O. (1981) Mutliple-site adsorption of Cd, Cu, Zn and Pb on
amorphous iron oxyhydroxide. J. Colloid Interface Sci. 79, 209-221.
Benjamin, M.M. and Leckie, J.O. (1982) Effects of complexation by Cl, SO4, and S2O3 on
adsorption behavior of Cd on oxide surfaces. Environ. Sci. Technol. 16, 162-170.
Cao, X., Ma, L.Q., Chen, M., Singh, S.P. and Harris, W.G. (2002) Impacts of phosphate
amendments on lead biogeochemistry at a contaminated site. Environ. Sci. Technol. 36,
5296-5304
29
Chukalina, M. (2010) Wavelet2.ipf, a procedure for calculating the Wavelet transform in
IGOR Pro. Downloaded from website in November 2011:
http://www.esrf.eu/UsersAndScience/Experiments/CRG/BM20/Software/Wavelets/IGOR
Eby, R. K. and Hawthorne, F. C. (1989) Cornetite: modulated densely-packed Cu2+ oxysalt.
Mineralogy and Petrology 40, 127-136
Elzinga, E.J., Peak, D. and Sparks, D.L. (2001) Spectroscopic studies of Pb(II)-sulfate
interactions at the goethite-water interface. Geochim. Cosmochim. Acta 65, 2219-2230.
Funke, H., Scheinost, A.C. and Chukalina, M. (2005) Wavelet analysis of extended X-ray
absorption fine structure data. Phys. Rev. B 71, 094110.
Gustafsson, J.P. (2003) Modelling molybdate and tungstate adsorption to ferrihydrite. Chem.
Geol. 200, 105-115.
Gustafsson J.P. (2012) Visual MINTEQ 3.0. Available at
http://www2.lwr.kth.se/english/OurSoftWare/Vminteq/index.html.
Gustafsson, J.P., Persson, I., Kleja, D.B. and van Schaik, J.W.J. (2007) Binding of iron(III) to
organic soils: EXAFS spectroscopy and chemical equilibrium modeling. Environ. Sci.
Technol. 41, 1232-1237.
Gustafsson, J.P., Dässman, E. and Bäckström, M. (2009) Towards a consistent geochemical
model for prediction of uranium(VI) removal from groundwater by ferrihydrite. Appl.
Geochem. 24, 454-462.
Gustafsson, J.P., Tiberg, C., Edkymish, A. and Kleja, D.B. (2011) Modelling lead(II) sorption
to ferrihydrite and soil organic matter. Environ. Chem. 8, 485-492.
Hashimoto, Y., Takaoka, M., Oshita, K. and Tanida, H. (2009) Incomplete transformations of
Pb to pyromorphite by phosphate-induced immobilization investigated by X-ray absorption
fine structure (XAFS) spectroscopy. Chemosphere 76, 616-622.
30
Hashimoto, Y., Takaoka, M.and Shiota, K. (2011) Enhanced transformation of lead speciation
in rhizosphere soils using phosphate amendments and phytostabilization: an X-ray
absorption fine structure investigation. J. Environ. Qual. 40, 696-703.
Herbelin, A.L. and Westall, J.C. (1999) FITEQL 4.0: A Computer Program for Determination
of Chemical Equilibrium Constants from Experimental Data. Report 99-0a. Department of
Chemistry, Oregon State University, Corvallis.
Heritsch, H. (1940) Die Struktur des Libethenites Cu2(OH)[PO4]. Z. Kristallogr. 102, 1–12.
Hiemstra, T. (2013) Surface and mineral structure of ferrihydrite. Geochim. Cosmochim. Acta
105, 316-325.
Hiemstra, T. and van Riemsdijk, W.H. (1996) A surface structural approach to ion adsorption:
The charge distribution (CD) model. J. Colloid Interface Sci. 179, 488-508.
Hiemstra, T. and van Riemsdijk, W.H. (2006) On the relationship between charge
distribution, surface hydration, and the structure of the interface of metal hydroxides. J.
Colloid Interface Sci. 301, 1-18.
Hiemstra, T. and van Riemsdijk, W.H. (2009) A surface structural model for ferrihydrite I:
Sites related to primary charge, molar mass, and mass density. Geochim. Cosmochim. Acta
73, 4423-4436.
Hiemstra, T., van Riemsdijk, W.H., Rossberg, A. and Ulrich, K.U. (2009) A surface structural
model for ferrihydrite II: Adsorption of uranyl and carbonate. Geochim. Cosmochim. Acta
73, 4437-4451.
Hsi, C.D. and Langmuir, D. (1985) Adsorption of uranyl onto ferric oxyhydroxides:
application of the surface complexation site-binding model. Geochim. Cosmochim. Acta 49,
1931-1941.
Iuliano, M., Ciavatta, L. and De Tommaso, G. (2007) On the solubility constant of strengite.
Soil Sci. Soc. Am. J. 71, 1137-1140.

31
Jambor, J.L. and Dutrizac, J.E. (1998) Occurrence and consitution of natural and synthetic
ferrihydrite, a widespread iron oxyhydroxide. Chem. Rev. 98, 2549-2585.
Kelly, S., Hesterberg, D. and Ravel, B. (2008) Analysis of soils and minerals using X-ray
absorption spectroscopy. In: Methods of soil analysis. Part 5. Mineralogical methods. (eds.
A.L. Ulery and L.R. Drees). SSSA Book Series Ser. 5, SSSA, Madison, WI.
Khare, N., Hesterberg, D. and Martin, J.D. (2005) XANES investigation of phosphate
sorption in single and binary systems of iron and aluminium oxide minerals. Environ. Sci.
Technol. 39, 2152-2160.
Kolitsch, U., Bernhardt H-J, Krause, W. and Blass, G. (2008) Pattersonite, a new supergene
phosphate mineral: description and crystal structure. Eur. J. Mineral. 20, 281-288.
Leciejewicz, J. (1961) On the crystal structure of tetragonal (red) PbO. Acta Crystallogr. 14,
1304.
Ma, L. Q., Santos, J., Cao, X., Saha, U. and Harris, W. (2008) Field application of phosphate
rock for remediation of metal-contaminated soils, Publication No. 01-148-226, (Editor
Karen J. Stewart), Florida state institute of phosphate research, Florida, USA.
Moon, E.M., Peacock, C.L. (2012). Adsorption of Cu(II) to ferrihydrite-bacteria composites:
Importance of the carboxyl group for Cu mobility in natural environments, Geochim.
Cosmochim. Acta, 2012, DOI:10.1016/j.gca.2012.06.012
Nelson, H. (2012) Modelling precipitation and surface complexation reactions in systems with
goethite, Cu(II) and oxyanions containing As(V) or P(V). PhD thesis, Department of
Chemistry, Umeå University, Umeå, Sweden. Available at: http://www.diva-
portal.org/smash/record.jsf?searchId=1&pid=diva2:508296&rvn=4
Ostergren, J.D., Trainor, T.P., Bargar, J.R., Brown, G.E. and Parks, G.A. (2000a) Inorganic
ligand effects on Pb(II) sorption to goethite (-FeOOH) - I. Carbonate. J. Colloid Interface
Sci. 225, 466-482.
32
Ostergren, J.D., Brown, G.E., Parks, G.A. and Persson, P. (2000b) Inorganic ligand effects
on Pb(II) sorption to goethite (-FeOOH) - II. Sulfate. J. Colloid Interface Sci. 225, 483–
493.
Oswald, H. R., Reller, A., Schmalle, H. W., Dubler, E., (1990) Structure of copper(II)
hydroxide, Cu(OH)2, Acta Cryst. C46, 2279-2284.
Parkman, R.H., Charnock, J.M., Bryan, N.D., Livens, F.R. and Vaughan, D.J. (1999)
Reactions of copper and cadmium ions in aqueous solution with goethite, lepidocrocite,
mackinawite and pyrite. Am. Mineral. 84, 407-419.
Peacock, C.L. and Sherman, D.M. (2004) Copper(II) sorption on goethite, hematite and
lepidocrocite: a surface complexation model based on ab initio molecular geometries and
EXAFS spectroscopy. Geochim. Cosmochim. Acta 68, 2623-2637.
Persson, I., Persson, P., Sandström, M. and Ullström, A.S. (2002) Structure of Jahn-Teller
distorted solvated copper(II) ions in solution, and in solids with apparently regular
octahedral coordination geometry. J. Chem. Soc. Dalton Trans. 2002, 1256-1265.
Persson, I., Lyczko, K., Lundberg, D., Eriksson, L., Placzek, A. (2011) Coordination
chemistry study of hydrated and solvated lead (II) ions in solution and solid state. Inorg.
Chem. 50 1058-1072.
Ponthieu, M., Juillot, F., Hiemstra, T., van Riemsdijk, W.H. and Benedetti, M.F. (2006) Metal
ion binding to iron oxides. Geochim. Cosmochim. Acta 70, 2679-2708.
Ravel, B. and Newville, M. (2005). Athena Artemis Haephestus: Data analysis for X-ray
absorption spectroscopy using IFEFFIT. J. Synchrotron Rad. 12, 537-541.
Scheckel, K.G. and Ryan, J.A. (2003) In vitro formation of pyromorphite via reaction of Pb
sources with soft-drink phosphoric acid. Sci. Total Environ. 302, 253-265.
Scheinost, A.C., Abend, S., Pandya, K.I. and Sparks, D.L. (2001) Kinetic controls on Cu and
Pb sorption by ferrihydrite. Environ. Sci. Technol. 35, 1090-1096.

33
Schwertmann, U. and Cornell, R.M. (2000) Iron oxides in the laboratory: preparation and
characterization. Wiley, Weinheim.
Sheals, J., Granström, M., Sjöberg, S. and Persson, P. (2003) Coadsorption of Cu(II) and
glyphosate at the water-goethite (-FeOOH) interface: molecular structures from FTIR and
EXAFS measurements. J. Colloid Interface Sci. 262, 38-47.
Sjöstedt, C., Wällstedt, T., Gustafsson, J.P. and Borg, H. (2009) Speciation of aluminium,
arsenic and molybdenum in excessively limed lakes. Sci. Total Environ. 407, 5119-5127.
Swedlund, P.J. and Webster, J.G. (1999) Adsorption and polymerisation of silicic acid on
ferrihydrite, and its effect on arsenic adsorption. Water Res. 33, 3413-3422.
Swedlund, P.J. and Webster, J.G. (2001) Cu and Zn ternary surface complex formation with
SO4 on ferrihydrite and schwertmannite. Appl Geochem. 16, 503-511
Swedlund, P.J. and Webster, J.G and Miskelly, G.M.(2003) The effect of SO4 on the
ferrihydrite adsorption of Co, Pb and Cd: ternary complexes and site heterogeneity
Appl. Geochem. 18, 1671-1689.
Swedish environmental protection agency (2002), Metodes for inventories of contaminated
sites, Report 5053, 1st edition, Fätht and Hässler, Värnamo. Available at:
http://www.naturvardsverket.se/Documents/publikationer/620-5053-2.pdf
Thompson, A., Attwood, D., Gullikson, E., Howells, M., Kim, K.-J., Kirz, J., Kortright, J.,
Lindau, I., Pianetta, P., Robinson, A., Scofield, J., Underwood, J., Williams, G. and Winck,
H. (2009) X-ray Data Booklet. Lawrence Berkeley National Laboratory, University of
California, Berkeley, California.
Trivedi, P., Dyer, J.A. and Sparks, D.L. (2003) Lead sorption onto ferrihydrite. 1. A
macroscopic and spectroscopic assessment. Environ. Sci. Technol. 37, 908-914.

34
Weesner, F.J. and Bleam, W.F. (1998) Binding characteristics of Pb2+
on anion-modified and
pristine hydrous oxide surfaces studied by electrophoretic mobility and X-ray absorption
spectroscopy. J. Colloid Interface Sci. 205, 380-389.
Villalobos, M., Trotz, N.A. and Leckie, J.O. (2001) Surface complexation modeling of
carbonate effects on the adsorption of Cr(VI), Pb(II), and U(VI) on goethite. Environ. Sci.
Technol. 35, 3849-3856.
Willett, I.R., Chartres, C.J. and Nguyen, T.T. (1988) Migration of phosphate into aggregated
particles of ferrihydrite. J. Soil Sci. 39, 275-282.
Xie, L. and Giammar, D.E. (2007) Influence of phosphate on adsorption and surface
precipitation of lead on iron oxide surfaces. In Adsorption of Metals by Geomedia II:
Variables, mechanisms, and model applications (eds. M.O. Barnett and D.O. Kent), pp.
349-373. Elsevier, Amsterdam, Netherlands.
Xu, Y., Boonfueng, T., Axe, L., Maeng, S. and Tyson, T. (2006) Surface complexation of
Pb(II) on amorphous iron oxide and manganese oxide: Spectroscopic and time studies. J.
Colloid Interface Sci. 299, 28-40.
Zachara, J.M., Girvin, D.C., Schmidt, R.L. and Resch, C.T. (1987) Chromate adsorption onto
amorphous iron oxyhydroxide in the presence of major groundwater ions. Environ, Sci.
Technol. 21, 589-594.

35
Table 1
Model parameters for surface charging of ferrihydrite
Gustafsson et al. 2009 Hiemstra et al. 2009a This study
A / m2 g
-1 750 650 650
Ns, all / sites nm-2
6.3 7.2 7.8
Ns, FeOH / sites nm-2
6.3 6.0 6.25
Ns, Fe3O / sites nm-2
0 1.2 1.55
C1 / F m-2
1 1.15 1.15
C2 / F m-2
0.74 0.9 0.9
A is the specific surface area; Ns is the site density; C1 and C2 are the inner-layer and outer-
layer capacitances, respectively.

36
Table 2
Surface complexation reactions and constants used in the CD-MUSIC model for ferrihydrite.
Reaction (z0, z1, z2)a log K
b Data source(s)
FeOH½- + H+ ↔ FeOH2½+ (1,0,0) 8.1 Dzombak & Morel (1990)
Fe3O½- + H+ ↔ Fe3OH½+ (1,0,0) 8.1 Assumed the same as above
FeOH½- + Na+ ↔ FeOHNa½+ (0,1,0) -0.6 Hiemstra & van Riemsdijk
(2006)
Fe3O½- + Na+ ↔ Fe3ONa½+ (0,1,0) -0.6 ”
FeOH½- + H+ + NO3-↔ FeOH2NO3
½- (1,-1,0) 7.42 ”
Fe3O½- + H+ + NO3
-↔ Fe3OHNO3½- (1,-1,0) 7.42 ”
2FeOH½- + 2H+ + PO43-↔ Fe2O2PO2
2- + 2H2O (0.46,-1.46,0) 27.59 This studyc
2FeOH½- + 3H+ + PO43-↔ Fe2O2POOH- + 2H2O (0.63,-0.63,0) 32.89 ”
FeOH½- + 3H+ + PO43-↔ FeOPO3H2
½- + H2O (0.5,-0.5,0) 30.23 ”
2FeOH½- + Pb2+ ↔ (FeOH)2Pb+ (1.2,0.8,0) 9.58 (99 %)
12.25 (0.9 %)
14.24 (0.1 %)
”
”
”
2FeOH½- + Cu2+ + H2O ↔ (FeOH)2CuOH + H+ (0.5,0.5,0) 0.97 ”
2FeOH½- + 2H+ + Pb2+ + PO43-↔ (FeO)2HPbPO3H
0 + H2O (0.7,0.3,0) 33.64 (99 %)
37.20 (1 %)
”
”
2FeOH½- + 2H+ + Cu2+ + PO43-↔ (FeO)2HCuPO3H
0 + H2O (0.7,0.3,0) 31.71 ”
a The change of charge in the o-, b- and d-planes respectively. b Two or three numbers indicate binding to sites with different affinity, the percentages of which are within brackets (c.f.
text). cSee the text and the Electronic Annex for details
37
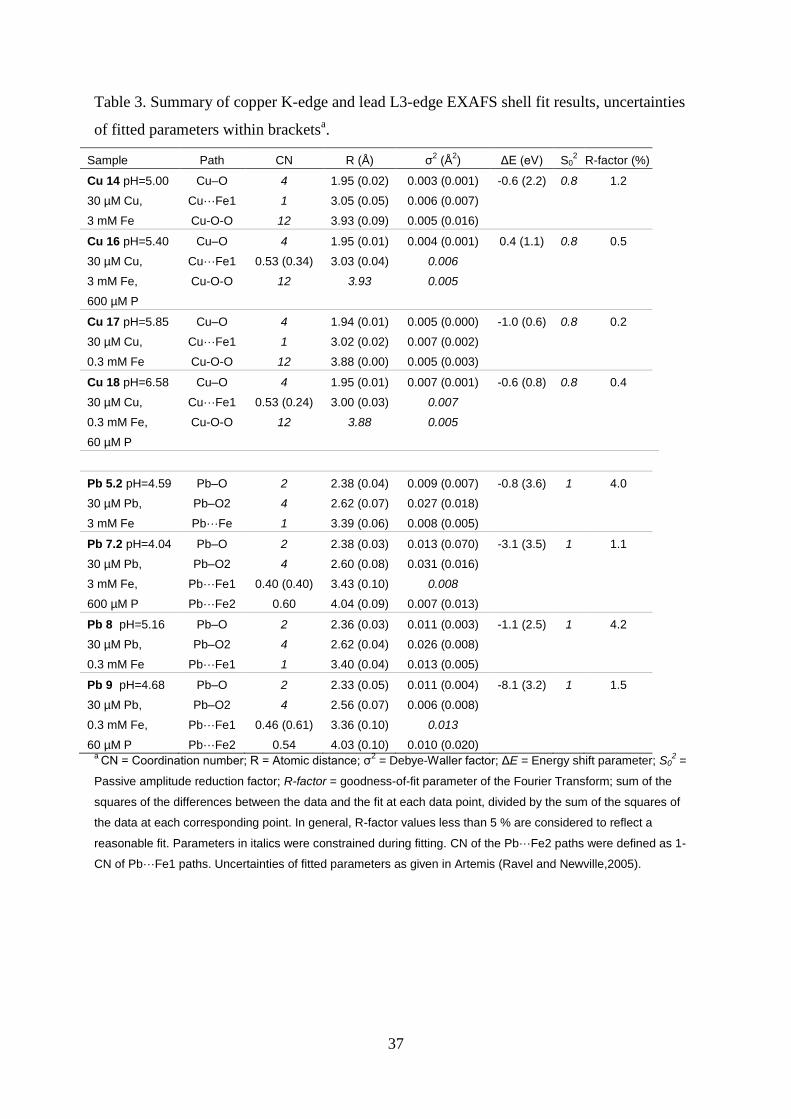
Table 3. Summary of copper K-edge and lead L3-edge EXAFS shell fit results, uncertainties
of fitted parameters within bracketsa.
Sample Path CN R (Å) σ2 (Å
2) ΔE (eV) S0
2 R-factor (%)
Cu 14 pH=5.00 Cu–O 4 1.95 (0.02) 0.003 (0.001) -0.6 (2.2) 0.8 1.2
30 µM Cu, Cu···Fe1 1 3.05 (0.05) 0.006 (0.007)
3 mM Fe Cu-O-O 12 3.93 (0.09) 0.005 (0.016)
Cu 16 pH=5.40 Cu–O 4 1.95 (0.01) 0.004 (0.001) 0.4 (1.1) 0.8 0.5
30 µM Cu, Cu···Fe1 0.53 (0.34) 3.03 (0.04) 0.006
3 mM Fe,
600 µM P
Cu-O-O 12 3.93 0.005
Cu 17 pH=5.85 Cu–O 4 1.94 (0.01) 0.005 (0.000) -1.0 (0.6) 0.8 0.2
30 µM Cu, Cu···Fe1 1 3.02 (0.02) 0.007 (0.002)
0.3 mM Fe Cu-O-O 12 3.88 (0.00) 0.005 (0.003)
Cu 18 pH=6.58 Cu–O 4 1.95 (0.01) 0.007 (0.001) -0.6 (0.8) 0.8 0.4
30 µM Cu, Cu···Fe1 0.53 (0.24) 3.00 (0.03) 0.007
0.3 mM Fe,
60 µM P
Cu-O-O 12 3.88 0.005
Pb 5.2 pH=4.59 Pb–O 2 2.38 (0.04) 0.009 (0.007) -0.8 (3.6) 1 4.0
30 µM Pb, Pb–O2 4 2.62 (0.07) 0.027 (0.018)
3 mM Fe Pb···Fe 1 3.39 (0.06) 0.008 (0.005)
Pb 7.2 pH=4.04 Pb–O 2 2.38 (0.03) 0.013 (0.070) -3.1 (3.5) 1 1.1
30 µM Pb, Pb–O2 4 2.60 (0.08) 0.031 (0.016)
3 mM Fe, Pb···Fe1 0.40 (0.40) 3.43 (0.10) 0.008
600 µM P Pb···Fe2 0.60 4.04 (0.09) 0.007 (0.013)
Pb 8 pH=5.16 Pb–O 2 2.36 (0.03) 0.011 (0.003) -1.1 (2.5) 1 4.2
30 µM Pb, Pb–O2 4 2.62 (0.04) 0.026 (0.008)
0.3 mM Fe Pb···Fe1 1 3.40 (0.04) 0.013 (0.005)
Pb 9 pH=4.68 Pb–O 2 2.33 (0.05) 0.011 (0.004) -8.1 (3.2) 1 1.5
30 µM Pb, Pb–O2 4 2.56 (0.07) 0.006 (0.008)
0.3 mM Fe, Pb···Fe1 0.46 (0.61) 3.36 (0.10) 0.013
60 µM P Pb···Fe2 0.54 4.03 (0.10) 0.010 (0.020) a
CN = Coordination number; R = Atomic distance; σ2 = Debye-Waller factor; ΔE = Energy shift parameter; S0
2 =
Passive amplitude reduction factor; R-factor = goodness-of-fit parameter of the Fourier Transform; sum of the
squares of the differences between the data and the fit at each data point, divided by the sum of the squares of
the data at each corresponding point. In general, R-factor values less than 5 % are considered to reflect a
reasonable fit. Parameters in italics were constrained during fitting. CN of the Pb···Fe2 paths were defined as 1-
CN of Pb···Fe1 paths. Uncertainties of fitted parameters as given in Artemis (Ravel and Newville,2005).

38
Figure 1. Copper(II) (1a) and lead(II) (1b) adsorption to ferrihydrite. Results from batch experiments (symbols) and from CD-MUSIC modeling with the optimized parameters of Table 1 (lines). The Cu/Fe and Pb/Fe ratios were approximately 0.0001, 0.001, 0.01 and 0.1. NaNO3 concentration 0.01 M.

39
0
10
20
30
40
50
60
70
80
90
100
3 4 5 6 7 8 9 10
% P
so
rbe
d
pH
P=60 uM, Fe=0.3 mM, Edk
P=60 uM, Fe=0.3 mM, Lar
P=200 uM, Fe=1 mM, Lar
P=200 uM, Fe=1 mM, Gus
P=600 uM, Fe=3 mM, Edk
P=600 uM, Fe=3 mM, Lar
P=200 uM, Fe=3 mM, Gus
0
10
20
30
40
50
60
70
80
90
100
3 4 5 6 7 8 9 10
% P
so
rbe
dpH
P=60 uM, Fe=0.3 mM
With 28 uM Pb
Figure 2. Results from batch experiments with phosphate and ferrihydrite (symbols) and from the CD-MUSIC modeling with the optimized parameters of Table 1 (solid lines). The abbreviations “Edk” and “Lar” refer to different batches of this study, whereas “Gus” refers to data of Gustafsson (2003; see also Table S3, Electronic Annex). On the right, phosphate adsorption in a system without and with added lead(II) is shown. The dashed lines represent the CD-MUSIC model prediction with model 1, and its 95 % confidence interval and the solid red line model 2.

40
0
10
20
30
40
50
60
70
80
90
100
3 4 5 6 7
% C
u s
orb
ed
pH
Cu=30 uM, Fe=0.3 mM
With 60 uM PO4-P
0
10
20
30
40
50
60
70
80
90
100
3 4 5 6 7
% C
u s
orb
ed
pH
Cu=30 uM, Fe=3 mM
With 600 uM PO4-P
0
10
20
30
40
50
60
70
80
90
100
3 4 5 6 7
% C
u s
orb
ed
pH
Cu=3 uM, Fe=3 mM
With 600 uM PO4-P
0
10
20
30
40
50
60
70
80
90
100
3 4 5 6 7
% C
u s
orb
ed
pH
Cu=0.3 uM, Fe=3 mM
With 600 uM PO4-P
Figure 3. Results from batch experiments with copper(II) and ferrihydrite (symbols) and from the CD-MUSIC modeling with the optimized parameters of model 2 (Table 1; solid lines), samples with addition of phosphate (filled circles) and without addition of phosphate (empty circles). NaNO3 concentration 0.01 M. The model prediction with model 1 for the ternary system, with its 95 % confidence interval, is shown as dashed lines. Positions of the four samples for EXAFS analysis are
marked in the two upper plots.
Cu 17
Cu 18
Cu 14
Cu 16

41
0
10
20
30
40
50
60
70
80
90
100
2.8 3.8 4.8 5.8 6.8
% P
b s
orb
ed
pH
Pb=28 uM, Fe=0.3 mM
With 60 uM PO4-P
0
10
20
30
40
50
60
70
80
90
100
2.8 3.8 4.8 5.8 6.8
% P
b s
orb
ed
pH
Pb=28 uM, Fe=3 mM
With 300 uM PO4-P
With 600 uM PO4-P
0
10
20
30
40
50
60
70
80
90
100
2.8 3.8 4.8 5.8 6.8
% P
b s
orb
ed
pH
Pb=2.8 uM, Fe=3 mM
With 600 uM PO4-P
0
10
20
30
40
50
60
70
80
90
100
2.8 3.8 4.8 5.8 6.8
% P
b s
orb
ed
pH
Pb=0.28 uM, Fe=3 mM
With 600 uM PO4-P
Figure 4. Results from batch experiments with lead(II) and ferrihydrite (symbols) and from the CD-MUSIC modeling with the optimized parameters of model 2 (Table 1; solid lines), samples with addition of phosphate (filled circles) and without addition of phosphate (empty circles). NaNO3 concentration is 0.01 M. The model prediction with model 1 for the ternary system, with its 95 % confidence interval, is shown as dashed lines. The 95 % confidence interval was not available at the lowest Pb/Fe ratio (see Electronic Annex). Positions of the four samples for EXAFS analysis are marked in the two upper plots.
Pb 7.2
Pb 5.2
Pb 8
Pb 9

42
Figure 5. Results from Wavelet transform analysis of copper(II) EXAFS spectra. K-range used was 2.7-9 Å
-1 for Cu 14 and Cu 16, 2.7-10.5 Å
-1 for Cu 17 and 2.7-10 Å
-1 for Cu 18. X-axis (k) indicates
energy expressed as the photoelectron wavenumber and y-axis (r) is not corrected for phase shift. White/brown areas indicate high intensity whereas blue/green areas indicate low intensity of the WT
modulus. Below R+R=2.3 Å the high intensity is contributions from Cu-O distances at all k.
4.0
3.5
3.0
2.5
2.0
151050
R+
ΔR
(Å
)
k (Å-1)
4.0
3.5
3.0
2.5
2.0
2 4 6 8 10
Cu 14
Cu = 30 µM, Fe = 3 mM
4.0
3.5
3.0
2.5
2.0
151050
R+
ΔR
(Å
)
k (Å-1)
4.0
3.5
3.0
2.5
2.0
2 4 6 8 10
R+
ΔR
(Å
)
k (Å-1)
4.0
3.5
3.0
2.5
2.0
2 4 6 8 10
4.0
3.5
3.0
2.5
2.0
2 4 6 8 10
4.0
3.5
3.0
2.5
2.0
2 4 6 8 10
4.0
3.5
3.0
2.5
2.0
4.0
3.5
3.0
2.5
2.0
2 4 6 8 102 4 6 8 10
Cu 14
Cu = 30 µM, Fe = 3 mM
4.0
3.5
3.0
2.5
2.0
151050
R+
ΔR
(Å
)
k (Å-1)
4.0
3.5
3.0
2.5
2.0
2 4 6 8 10
Cu 16
Cu = 30 µM, Fe = 3 mM, PO4 = 600 µM
4.0
3.5
3.0
2.5
2.0
151050
R+
ΔR
(Å
)
k (Å-1)
4.0
3.5
3.0
2.5
2.0
2 4 6 8 10
R+
ΔR
(Å
)
k (Å-1)
4.0
3.5
3.0
2.5
2.0
2 4 6 8 10
4.0
3.5
3.0
2.5
2.0
2 4 6 8 10
4.0
3.5
3.0
2.5
2.0
2 4 6 8 10
4.0
3.5
3.0
2.5
2.0
4.0
3.5
3.0
2.5
2.0
2 4 6 8 102 4 6 8 10
Cu 16
Cu = 30 µM, Fe = 3 mM, PO4 = 600 µM
4.0
3.5
3.0
2.5
2.0
151050-5
R+
ΔR
(Å
)
k (Å-1)
4.0
3.5
3.0
2.5
2.0
2 4 6 8 10
Cu 17
Cu = 30 µM, Fe = 0.3 mM
4.0
3.5
3.0
2.5
2.0
151050-5
R+
ΔR
(Å
)
k (Å-1)
4.0
3.5
3.0
2.5
2.0
2 4 6 8 10
R+
ΔR
(Å
)
k (Å-1)
4.0
3.5
3.0
2.5
2.0
2 4 6 8 10
4.0
3.5
3.0
2.5
2.0
2 4 6 8 10
4.0
3.5
3.0
2.5
2.0
2 4 6 8 10
4.0
3.5
3.0
2.5
2.0
4.0
3.5
3.0
2.5
2.0
2 4 6 8 102 4 6 8 10
Cu 17
Cu = 30 µM, Fe = 0.3 mM
4.0
3.5
3.0
2.5
2.0
151050
R+
ΔR
(Å
)
k (Å-1)
4.0
3.5
3.0
2.5
2.0
2 4 6 8 10
Cu 18
Cu = 30 µM, Fe = 0.3 mM, PO4 = 60 µM
4.0
3.5
3.0
2.5
2.0
151050
R+
ΔR
(Å
)
k (Å-1)
4.0
3.5
3.0
2.5
2.0
2 4 6 8 10
R+
ΔR
(Å
)
k (Å-1)
4.0
3.5
3.0
2.5
2.0
2 4 6 8 10
4.0
3.5
3.0
2.5
2.0
2 4 6 8 10
4.0
3.5
3.0
2.5
2.0
2 4 6 8 10
4.0
3.5
3.0
2.5
2.0
4.0
3.5
3.0
2.5
2.0
2 4 6 8 102 4 6 8 10
Cu 18
Cu = 30 µM, Fe = 0.3 mM, PO4 = 60 µM

43
2 3 4 5 6 7 8 9 10 11 12
k³*χ
(k)
k (1/Å)
Cu=30uM Fe=3mM
Cu=30uM Fe=0.3mM
Cu=30uM Fe=3uM PO4=600uM
Cu=30uM Fe=0.3mM PO4=60uM
0 2 4 6 8
R (Å)
Cu=30uM Fe=3mM
Cu=30uM Fe=0.3mM
Cu=30uM Fe=3mM PO4=600uM
Cu=30uM Fe=0.3mM PO4=60uMCu14
Cu 17
Cu 16
Cu 18
Cu14
Cu 17
Cu 16
Cu 18
Figure 6. Left: k3-weighted EXAFS spectra for copper(II) in ferrihydrite samples with and without phosphate. Lines are raw data and dashed lines are best fits. Right: Fourier Transforms (FT magnitudes) of the k3-weighted EXAFS spectra. Lines are raw data and dashed lines are best fits.

44
Figure 7. Results from Wavelet transform analysis of lead(II) EXAFS spectra. K-range used was 2.25-8 Å
-1 for spectra Pb 5.2, Pb 7.2, and Pb 9, and 2.25-9 Å
-1 for Pb 8. X-axis (k) indicates energy
expressed as the photoelectron wavenumber and y-axis (r) is not corrected for phase shift. White/brown areas indicate high intensity whereas blue/green areas indicate low intensity of the WT
modulus. Below R+R=2.3 Å the high intensity is contributions from Pb-O distances at all k.
4.0
3.5
3.0
2.5
2.0
121086420-2 2
R+
ΔR
(Å
)
k (Å-1)
4.0
3.5
3.0
2.5
2.0
64
Pb 5.2
Pb = 30 µM, Fe = 3 mM
8
4.0
3.5
3.0
2.5
2.0
121086420-2 2
R+
ΔR
(Å
)
k (Å-1)
4.0
3.5
3.0
2.5
2.0
64
Pb 5.2
Pb = 30 µM, Fe = 3 mM
4.0
3.5
3.0
2.5
2.0
121086420-2 2
R+
ΔR
(Å
)
k (Å-1)
4.0
3.5
3.0
2.5
2.0
642
R+
ΔR
(Å
)
k (Å-1)
4.0
3.5
3.0
2.5
2.0
64
R+
ΔR
(Å
)
k (Å-1)
4.0
3.5
3.0
2.5
2.0
6
R+
ΔR
(Å
)
k (Å-1)
4.0
3.5
3.0
2.5
2.0
4.0
3.5
3.0
2.5
2.0
64
Pb 5.2
Pb = 30 µM, Fe = 3 mM
88
4.0
3.5
3.0
2.5
2.0
121086420-2 82
R+
ΔR
(Å
)
k (Å-1)
4.0
3.5
3.0
2.5
2.0
64
Pb 7.2
Pb = 30 µM, Fe = 3 mM,
PO4 = 600 µM
4.0
3.5
3.0
2.5
2.0
121086420-2 82
R+
ΔR
(Å
)
k (Å-1)
4.0
3.5
3.0
2.5
2.0
642
R+
ΔR
(Å
)
k (Å-1)
4.0
3.5
3.0
2.5
2.0
642
R+
ΔR
(Å
)
k (Å-1)
4.0
3.5
3.0
2.5
2.0
64
R+
ΔR
(Å
)
k (Å-1)
4.0
3.5
3.0
2.5
2.0
6
R+
ΔR
(Å
)
k (Å-1)
4.0
3.5
3.0
2.5
2.0
4.0
3.5
3.0
2.5
2.0
64
Pb 7.2
Pb = 30 µM, Fe = 3 mM,
PO4 = 600 µM
4.0
3.5
3.0
2.5
2.0
151050 82R
+Δ
R (
Å)
k (Å-1)
4.0
3.5
3.0
2.5
2.0
64
Pb 8
Pb = 30 µM, Fe = 0.3 mM
4.0
3.5
3.0
2.5
2.0
151050 82R
+Δ
R (
Å)
k (Å-1)
4.0
3.5
3.0
2.5
2.0
642R
+Δ
R (
Å)
k (Å-1)
4.0
3.5
3.0
2.5
2.0
642R
+Δ
R (
Å)
k (Å-1)
4.0
3.5
3.0
2.5
2.0
64R
+Δ
R (
Å)
k (Å-1)
4.0
3.5
3.0
2.5
2.0
6R
+Δ
R (
Å)
k (Å-1)
4.0
3.5
3.0
2.5
2.0
4.0
3.5
3.0
2.5
2.0
64
Pb 8
Pb = 30 µM, Fe = 0.3 mM
4.0
3.5
3.0
2.5
2.0
121086420-2 82
R+
ΔR
(Å
)
k (Å-1)
4.0
3.5
3.0
2.5
2.0
64
Pb 9
Pb = 30 µM, Fe = 0.3 mM,
PO4 = 60 µM
4.0
3.5
3.0
2.5
2.0
121086420-2 82
R+
ΔR
(Å
)
k (Å-1)
4.0
3.5
3.0
2.5
2.0
642
R+
ΔR
(Å
)
k (Å-1)
4.0
3.5
3.0
2.5
2.0
642
R+
ΔR
(Å
)
k (Å-1)
4.0
3.5
3.0
2.5
2.0
64
R+
ΔR
(Å
)
k (Å-1)
4.0
3.5
3.0
2.5
2.0
6
R+
ΔR
(Å
)
k (Å-1)
4.0
3.5
3.0
2.5
2.0
4.0
3.5
3.0
2.5
2.0
64
Pb 9
Pb = 30 µM, Fe = 0.3 mM,
PO4 = 60 µM

45
Figure 8. Left: k3-weighted EXAFS spectra for lead(II) in ferrihydrite samples with and without phosphate. Lines are raw data and dashed lines are best fits. Right: Fourier Transforms (FT magnitudes) of the k3-weighted EXAFS spectra. Lines are raw data and dashed lines are best fits.

46
A. Edge-sharing
(FeOH)2CuOH
B. Monodentate
FeOHCu+1.5
C. Ternary monodentate
(FeO)2HCuPO3H0
D. Ternary corner-sharing
(FeOH)2CuPO4H20
E. Edge-sharing
(FeOH)2Pb+
F. Monodentate
FeOHPb+1.5
G. Ternary monodentate
(FeO)2HPbPO3H0
H. Ternary corner-sharing
(FeOH)2PbPO4H20
Figure 9. Structures of copper(II) and lead(II) complexes discussed in the text as described in the CD-MUSIC model. Red is oxygen and white hydrogen, iron, copper(II), lead(II) and phosphorus are marked in the figures along with the Cu···Fe/ Pb···Fe distances from interpretation of EXAFS spectra.
Fe
Pb P
Fe
≈4.0 Å
Fe
Cu
≈3.0 Å
Fe
Cu P
Fe
≈3.6
Å
Fe Fe
Cu
P
≈3.6 Å
Fe
Pb
≈3.3 Å
Fe
Fe
Pb P
≈4.0 Å
Fe
Cu
≈3.6
Å
Fe
Pb
≈4.0 Å

47
0.0E+00
5.0E-07
1.0E-06
1.5E-06
2.0E-06
2.5E-06
3.0E-06
1.0E-08 1.0E-07 1.0E-06 1.0E-05 1.0E-04
Co
nc
en
tra
tio
n (
M)
Dissolved PO4 (M)
(FeOH)2CuOH
(FeO)2HCuPO3H
0.0E+00
5.0E-07
1.0E-06
1.5E-06
2.0E-06
2.5E-06
3.0E-06
1.00E-08 1.00E-07 1.00E-06 1.00E-05 1.00E-04
Co
nc
en
tra
tio
n (
M)
Dissolved PO4 (M)
(FeOH)2Pb
(FeO)2HPbPO3H
0.0E+00
5.0E-07
1.0E-06
1.5E-06
2.0E-06
2.5E-06
3.0E-06
1.0E-08 1.0E-07 1.0E-06 1.0E-05 1.0E-04
Co
nc
en
tra
tio
n (
M)
Dissolved PO4 (M)
(FeOH)2CuOH
(FeO)2HCuPO3H
0.0E+00
5.0E-07
1.0E-06
1.5E-06
2.0E-06
2.5E-06
3.0E-06
1.0E-08 1.0E-07 1.0E-06 1.0E-05 1.0E-04
Co
nc
en
tra
tio
n (
M)
Dissolved PO4 (M)
(FeOH)2Pb
(FeO)2HPbPO3H
0.0E+00
5.0E-07
1.0E-06
1.5E-06
2.0E-06
2.5E-06
3.0E-06
1.0E-08 1.0E-07 1.0E-06 1.0E-05 1.0E-04
Co
nce
ntr
ati
on
(M
)
Dissolved PO4 (M)
(FeOH)2CuOH
(FeO)2HCuPO3H
0.0E+00
5.0E-07
1.0E-06
1.5E-06
2.0E-06
2.5E-06
3.0E-06
1.0E-08 1.0E-07 1.0E-06 1.0E-05 1.0E-04
Co
nc
en
tra
tio
n (
M)
Dissolved PO4 (M)
(FeOH)2Pb
(FeO)2HPbPO3H
Figure 10. Concentrations of different surface complexes as a function of the total dissolved phosphate concentration at pH 4, 5 and 6 under the following conditions: total Fe = 3 mM, total metal: 3 µM, background electrolyte = 0.01 M NaNO3. Left column: copper(II); right column: lead(II).
pH 4
pH 5
pH6

48
Phosphate effects on copper(II) and lead(II) sorption to ferrihydrite
Charlotta Tiberg, Carin Sjöstedt, Ingmar Persson, Jon Petter Gustafsson
Electronic annex
Contents
Fig. S1. Surface charge of ferrihydrite at three different NaNO3 concentrations.
Fig. S2. Fit of the optimized surface complexation model to the copper(II) adsorption data of
Swedlund and Webster (2001) and to the data of Benjamin and Leckie (1981, 1982).
Fig. S3. Fit of the optimized surface complexation model to the lead(II) adsorption data of
Swedlund et al. (2003) and to the data of Benjamin and Leckie (1981, 1982).
Table S1. Equilibrium constants and heats of reaction for lead(II)- and copper(II)-containing
soluble complexes and solid phases considered in the modeling.
Table S2. Data sets used for optimization of copper(II) and lead(II) surface complexation
constants for ferrihydrite (Fh).
Table S3. Data sets used for optimization of phosphate surface complexation constants for
ferrihydrite (Fh).
Table S4. Intrinsic surface complexation constants for copper(II) adsorption on ferrihydrite.
Table S5. Intrinsic surface complexation constants for lead(II) adsorption on ferrihydrite.
Table S6. Intrinsic surface complexation constants for phosphate adsorption on ferrihydrite.
Model 3: Can the presence of a monodentate complex successfully explain the phosphate
effects on lead(II) sorption? (Text with three additional figures.)
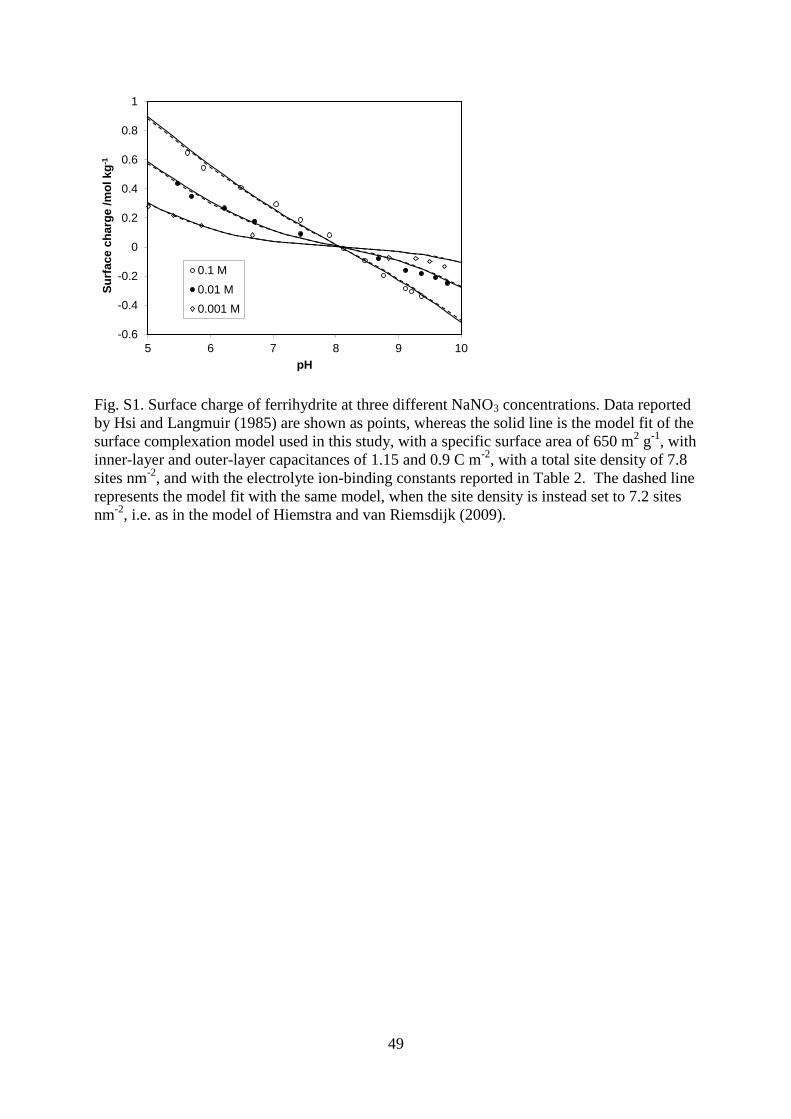
49
-0.6
-0.4
-0.2
0
0.2
0.4
0.6
0.8
1
5 6 7 8 9 10
Su
rface c
harg
e /m
ol kg
-1
pH
0.1 M
0.01 M
0.001 M
Fig. S1. Surface charge of ferrihydrite at three different NaNO3 concentrations. Data reported
by Hsi and Langmuir (1985) are shown as points, whereas the solid line is the model fit of the
surface complexation model used in this study, with a specific surface area of 650 m2 g
-1, with
inner-layer and outer-layer capacitances of 1.15 and 0.9 C m-2
, with a total site density of 7.8
sites nm-2
, and with the electrolyte ion-binding constants reported in Table 2. The dashed line
represents the model fit with the same model, when the site density is instead set to 7.2 sites
nm-2
, i.e. as in the model of Hiemstra and van Riemsdijk (2009).

50
0
10
20
30
40
50
60
70
80
90
100
3 3.5 4 4.5 5 5.5 6 6.5 7
% C
u s
orb
ed
pH
Cu=24.4 uM, Fe=14.7 mM
Cu=16.5 uM, Fe=4.8 mM
Cu=8.37 uM, Fe=0.93 mM
Cu=24.7 uM, Fe=0.935 mM
0
10
20
30
40
50
60
70
80
90
100
4 4.5 5 5.5 6 6.5 7
% C
u s
orb
ed
pH
Cu=0.5 uM, Fe=1 mM
Cu=0.5 uM, Fe=0.3 mM
Cu=0.5 uM, Fe=0.1 mM
Cu=50 uM, Fe=1 mM
Fig. S2. Fit of the optimized surface complexation model to the copper(II) adsorption data of
Swedlund and Webster (2001; left) and to the data of Benjamin and Leckie (1981, 1982;
right).
0
10
20
30
40
50
60
70
80
90
100
3 3.5 4 4.5 5 5.5 6
% P
b s
orb
ed
pH
Pb=9.66 uM, Fe=15 mM
Pb=9.66 uM, Fe=5 mM
Pb=9.86 uM, Fe=1.09 mM
Pb=28 uM, Fe=0.3 mM
Fig. S3. Fit of the optimized surface complexation model to the lead(II) adsorption data of
Swedlund et al. (2003; left) and to the data of Benjamin and Leckie (1981, 1982; right). For
the latter data set the model fits are shown as dashed lines, as these data were not used for the
calculation of weighted averages.
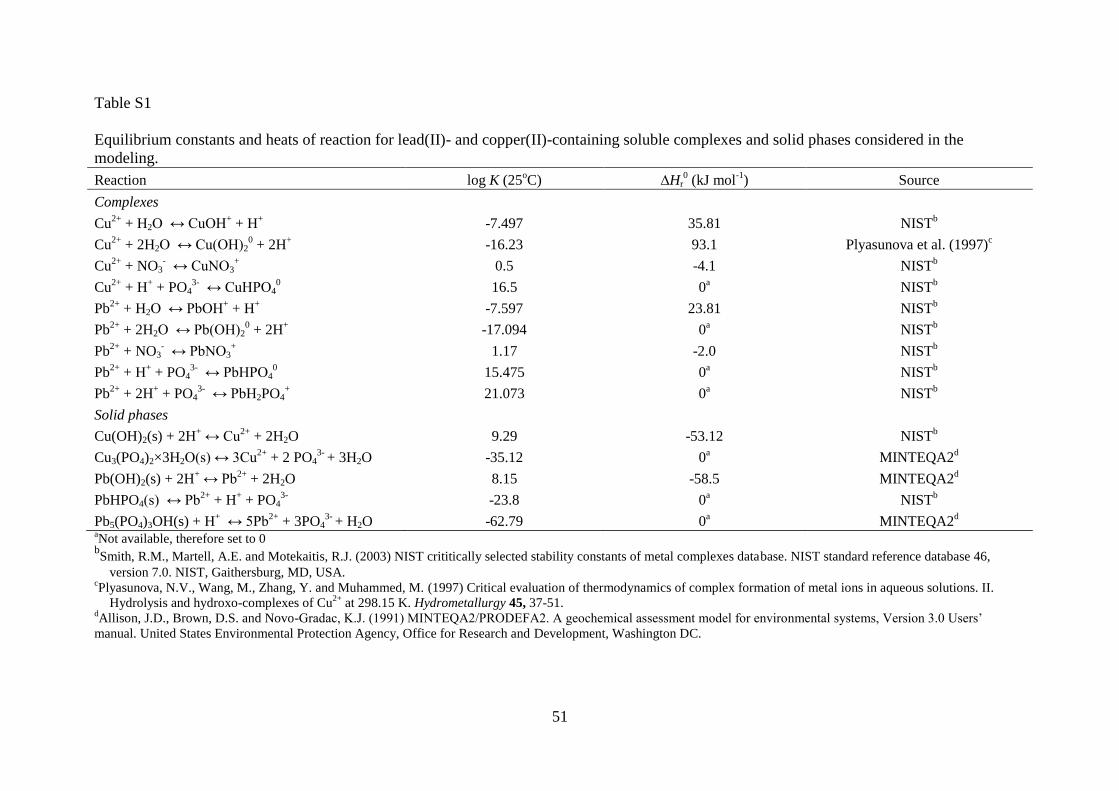
51
Table S1
Equilibrium constants and heats of reaction for lead(II)- and copper(II)-containing soluble complexes and solid phases considered in the
modeling.
Reaction log K (25oC) ∆Hr
0 (kJ mol
-1) Source
Complexes
Cu2+
+ H2O ↔ CuOH+ + H
+ -7.497 35.81 NIST
b
Cu2+
+ 2H2O ↔ Cu(OH)20 + 2H
+ -16.23 93.1 Plyasunova et al. (1997)
c
Cu2+
+ NO3- ↔ CuNO3
+ 0.5 -4.1 NIST
b
Cu2+
+ H+ + PO4
3- ↔ CuHPO4
0 16.5 0
a NIST
b
Pb2+
+ H2O ↔ PbOH+ + H
+ -7.597 23.81 NIST
b
Pb2+
+ 2H2O ↔ Pb(OH)20 + 2H
+ -17.094 0
a NIST
b
Pb2+
+ NO3- ↔ PbNO3
+ 1.17 -2.0 NIST
b
Pb2+
+ H+ + PO4
3- ↔ PbHPO4
0 15.475 0
a NIST
b
Pb2+
+ 2H+ + PO4
3- ↔ PbH2PO4
+ 21.073 0
a NIST
b
Solid phases
Cu(OH)2(s) + 2H+ ↔ Cu
2+ + 2H2O 9.29 -53.12 NIST
b
Cu3(PO4)2×3H2O(s) ↔ 3Cu2+
+ 2 PO43-
+ 3H2O -35.12 0a MINTEQA2
d
Pb(OH)2(s) + 2H+ ↔ Pb
2+ + 2H2O 8.15 -58.5 MINTEQA2
d
PbHPO4(s) ↔ Pb2+
+ H+ + PO4
3- -23.8 0
a NIST
b
Pb5(PO4)3OH(s) + H+ ↔ 5Pb
2+ + 3PO4
3- + H2O -62.79 0
a MINTEQA2
d
aNot available, therefore set to 0
bSmith, R.M., Martell, A.E. and Motekaitis, R.J. (2003) NIST crititically selected stability constants of metal complexes database. NIST standard reference database 46,
version 7.0. NIST, Gaithersburg, MD, USA. cPlyasunova, N.V., Wang, M., Zhang, Y. and Muhammed, M. (1997) Critical evaluation of thermodynamics of complex formation of metal ions in aqueous solutions. II.
Hydrolysis and hydroxo-complexes of Cu2+
at 298.15 K. Hydrometallurgy 45, 37-51. dAllison, J.D., Brown, D.S. and Novo-Gradac, K.J. (1991) MINTEQA2/PRODEFA2. A geochemical assessment model for environmental systems, Version 3.0 Users’
manual. United States Environmental Protection Agency, Office for Research and Development, Washington DC.

52
Table S2
Data sets used for optimization of copper(II) and lead(II) surface complexation constants for ferrihydrite (Fh)
ID number Source Total Pb or
Cu (M)
Fh concentration
(mM)
Equilibration time (h) Background
electrolyte
Copper(II)
Fh-Cu-01 Benjamin and Leckie (1981, 1982) 5 10-7
1 4 0.1 M NaNO3
Fh-Cu-02 ” ” 0.3 ” ”
Fh-Cu-03 ” ” 0.1 ” ”
Fh-Cu-04 ” 5 10-5
1 ” ”
Fh-Cu-05 Swedlund and Webster (2001) 1.44 10-5
14.5 24 ”
Fh-Cu-06 ” 1.65 10-5
4.8 ” ”
Fh-Cu-07 ” 8.37 10-6
0.93 ” ”
Fh-Cu-08 ” 2.47 10-5
0.935 ” ”
Fh-Cu-09 This study 3.86 10-7
3 ” 0.01 M NaNO3
Fh-Cu-10 ” 3 10-6
” ” ”
Fh-Cu-11 ” 3 10-5
” ” ”
Fh-Cu-12 ” 3 10-5
0.3 ” ”
Lead(II)
Fh-Pb-01 Benjamin and Leckie (1981, 1982) 5 10-7
3 4 0.1 M NaNO3
Fh-Pb-02 ” 5 10-6
” ” ”
Fh-Pb-03 ” 5 10-5
” ” ”
Fh-Pb-04 Swedlund et al. (2003) 9.66 10-6
15 24 ”
Fh-Pb-05 ” 9.66 10-6
5 ” ”
Fh-Pb-06 ” 9.86 10-6
1.09 ” ”
Fh-Pb-07 ” 1.97 10-5
1.1 ” ”
Fh-Pb-08 Gustafsson et al. (2011) 2.82 10-7
3 24 0.01 M NaNO3
Fh-Pb-09 ” 2.82 10-6 ” ” ”
Fh-Pb-10 ” 2.82 10-5 ” ” “
Fh-Pb-11 ” 2.82 10-5 0.3 ” ”

53
Table S3
Data sets used for optimization of phosphate surface complexation constants for ferrihydrite (Fh)
ID number Source Total P (M) Fh concentration
(mM)
Equilibration time (h) Background
electrolyte
Fh-P-01 Gustafsson (2003) 2 10-4
1 24 0.01 M NaNO3
Fh-P-02 This study; batch ”Larsson” 6 10-4
3 ” ”
Fh-P-03 This study; batch ”Edkymish” 6 10-4
3 ” ”
Fh-P-04 This study; batch ”Larsson” 2 10-4
1 ” ”
Fh-P-05 ” 6 10-5
0.3 ” ”
Fh-P-06 This study; batch ”Edkymish” 6 10-5
0.3 ” ”

54
Table S4
Intrinsic surface complexation constants for copper(II) adsorption on ferrihydrite (standard deviations in parentheses). Weighted average
equilibrium constants are shown, with the 95 % confidence interval (italics in parentheses).
Data set log K, (FeOH)2CuOH VYa
Fh-Cu-01 1.32 (0.011) 5.7
Fh-Cu-02 1.04 (0.019) 13.6
Fh-Cu-03 1.09 (0.019) 2.0
Fh-Cu-04 0.64 (0.011) 4.9
Fh-Cu-05 0.73 (0.016) 6.3
Fh-Cu-06 1.00 (0.011) 9.6
Fh-Cu-07 0.85 (0.010) 25.2
Fh-Cu-08 0.85 (0.013) 168
Fh-Cu-09 1.31 (0.018) 9.4
Fh-Cu-10 1.03 (0.019) 6.8
Fh-Cu-11 0.99 (0.014) 2.4
Fh-Cu-12 1.31 (0.021) 16.3
Weighted averages 0.97 (0.95, 1.03) aWeighted sum of squares, according to Herbelin and Westall (1999)

55
Table S5
Intrinsic surface complexation constants for lead(II) adsorption on ferrihydrite (standard deviations in parentheses). Weighted average
equilibrium constants are shown, with the 95 % confidence interval (italics in parentheses).
Data set log K, (FeOH)2Pb+ (99 %) log K, (FeOH)2Pb
+ (0.9 %) log K, (FeOH)2Pb
+ (0.1 %) VY
a
Fh-Pb-01b - 12.13 (0.047) 13.66 (0.129) 6.5
Fh-Pb-02b 9.02 (0.029) - - 101
Fh-Pb-03b 9.06 (0.010) - - 27.8
Fh-Pb-04 - 12.42 (0.020) - 36.1
Fh-Pb-05 9.55 (0.079) 12.46 (0.051) - 10.9
Fh-Pb-06 9.64 (0.021) 12.36 (0.043) - 2.3
Fh-Pb-07 9.33 (0.015) 12.07 (0.044) - 2.1
Fh-Pb-08 - - 14.24 (0.018) 45
Fh-Pb-09 - 11.81 (0.050) - 4.4
Fh-Pb-10 9.58 (0.015) 12.20 (0.024) - 7.2
Fh-Pb-11 9.80 (0.015) - - 4.2
Weighted averages 9.58 (9.48, 9.69) 12.25 (12.16, 12.35) 14.24c
aWeighted sum of squares, according to FITEQL (Herbelin and Westall, 1999)
bThese data sets were not used for calculation of the weighted averages as the data showed consistently weaker binding compared to the two
other data sets (see also main text) cNo confidence interval could be defined

56
Table S6
Intrinsic surface complexation constants for phosphate adsorption on ferrihydrite (standard deviations in parentheses). Weighted average
equilibrium constants are shown, with the 95 % confidence interval (italics in parentheses).
Data set log K, (FeOH)2PO2-
log K, (FeOH)2POOH log K, FeOPO3H2 VYa
Fh-P-01 27.45 (0.071) 32.89 (0.025) 30.26 (0.035) 0.61
Fh-P-02 28.92 (0.098) 33.31 (0.027) 30.57 (0.043) 0.21
Fh-P-03 27.53 (0.057) 32.58 (0.036) 30.22 (0.028) 227
Fh-P-04 27.94 (0.089) 33.16 (0.028) 30.24 (0.041) 1.59
Fh-P-05 27.13 (0.033) 31.95 (0.075) 30.11 (0.033) 182
Fh-P-06 27.56 (0.057) 32.66 (0.052) 30.01 (0.043) 5.16
Weighted averages 27.59 (27.35, 27.83) 32.89 (32.71, 33.06) 30.23 (30.15, 30.30) aWeighted sum of squares, according to Herbelin and Westall (1999)

Model 3: can the presence of a monodentate complex successfully explain the phosphate
effects on lead(II) sorption?
The idea behind model 3
In systems with only ferrihydrite and Pb2+
, edge-sharing bidentate complexes predominate.
This is what the EXAFS results show. With the EXAFS results at hand, we cannot exclude
the presence of a minor contribution from a monodentate complex (< 30 % of the total). Such
a small contribution would not be easily identified in an EXAFS spectrum.
When PO4 is added, however, monodentate complexes may become predominant, thus
explaining the longer Pb∙∙∙Fe distances found in the EXAFS spectra without the need to
invoke any ternary surface complexes.
The monodentate complex
For a monodentate complex to behave in the way described above, it needs to be strongly
involved in electrostatic interactions with the oxide surface. In other words, the increased
negative charge brought about by sorbing PO4 ions should increase the sorption of the
monodentate complex strongly, more strongly than that of the edge-sharing bidentate
complex. Therefore in the simulations described below, we did not consider any ternary
surface complex, instead we included the following surface complexation reaction into the
Visual MINTEQ calculations:
Reaction
FeOH½- + Pb2+ ↔ FeOHPb+1.5
(z0, z1, z2)
(0.5,1.5,0)
log K
7.3
This complex fulfills these requirements as it increases the surface charge with two molar
units, and that the z1 value is relatively high. The CD values (z0, z1) are what would be
expected for a complex that causes saturation of the surface oxygen. Letting these numbers
vary in a realistic range (e.g., (0.3, 1.7) to (0.7.1.3)) does not change the conclusions shown
below significantly.
Simulations
The Visual MINTEQ simulations for this system can be set up in a number of ways,
depending on what parameter to optimize. In the following simulations we have optimized the
log K value of the monodentate complex so that it fulfills two conditions:
1. It should ideally not comprise more than 30 % of the sorbed Pb in systems with only
ferrihydrite and Pb, since this would be in conflict with the EXAFS results.
2. The log K value should provide the best possible fit to dissolved Pb in the Pb-PO4-Fh systems.
Moreover, we performed the simulations only for the two systems with the highest Pb/Fe
ratios, since in both these systems the low-affinity Pb surface complex (i.e. the one with log K
= 9.58 in Table 2) predominates.

58
Results
0
10
20
30
40
50
60
70
80
90
100
2.8 3.8 4.8 5.8 6.8
% P
b s
orb
ed
pH
Pb=28 uM, Fe=0.3 mM
With 60 uM PO4-P
0
10
20
30
40
50
60
70
80
90
100
2.8 3.8 4.8 5.8 6.8
% P
b s
orb
ed
pH
Pb=28 uM, Fe=3 mM
With 300 uM PO4-P
With 600 uM PO4-P
Fig. S4. Percent Pb2+
adsorption as a function of the pH value and at different PO4
concentrations. Left: Pb = 28.2 µM, Fe = 0.3 mM; Right: Pb = 28.2 µM, Fe = 3 mM. The
lines are model fits assuming a combination of edge-sharing bidentate and monodentate
complexes as described in the text.
0
10
20
30
40
50
60
70
80
90
100
3 4 5 6 7 8 9 10
% P
so
rbe
d
pH
P=60 uM, Fe=0.3 mM
With 28 uM Pb
Fig. S5. Percent PO4 adsorption as a function of the pH value in the absence and presence of
Pb. Pb = 28.2 µM, Fe = 0.3 mM. The lines are model fits assuming a combination of edge-
sharing bidentate and monodentate Pb complexes as described in the text. Results for the
lower Pb/Fe ratio are not shown here because neither the results nor the model indicate a
significant dependence on dissolved Pb.
As Fig. S4 shows, it is indeed possible to construct a model that correctly predicts the Pb2+
adsorption in PO4-containing systems using the assumption that there is a monodentate Pb
complex in the system that increases in importance when PO4 is present. The goodness-of-fit
is comparable to the model with ternary surface complexes, although not perfect. However,
Fig. S5 shows that the model does not predict PO4 sorption very well in the presence of Pb2+
.
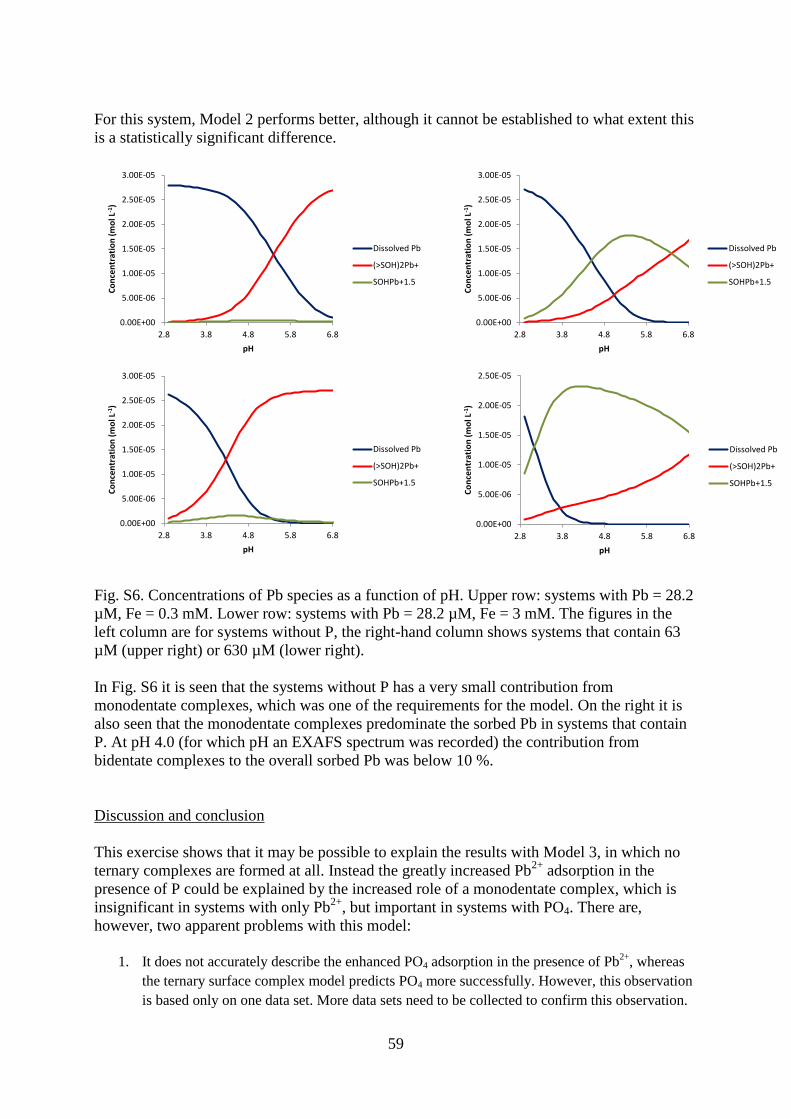
59
For this system, Model 2 performs better, although it cannot be established to what extent this
is a statistically significant difference.
0.00E+00
5.00E-06
1.00E-05
1.50E-05
2.00E-05
2.50E-05
3.00E-05
2.8 3.8 4.8 5.8 6.8
Co
nce
ntr
atio
n (
mo
l L-1
)
pH
Dissolved Pb
(>SOH)2Pb+
SOHPb+1.5
0.00E+00
5.00E-06
1.00E-05
1.50E-05
2.00E-05
2.50E-05
3.00E-05
2.8 3.8 4.8 5.8 6.8
Co
nce
ntr
atio
n (
mo
l L-1
)
pH
Dissolved Pb
(>SOH)2Pb+
SOHPb+1.5
0.00E+00
5.00E-06
1.00E-05
1.50E-05
2.00E-05
2.50E-05
3.00E-05
2.8 3.8 4.8 5.8 6.8
Co
nce
ntr
atio
n (
mo
l L-1
)
pH
Dissolved Pb
(>SOH)2Pb+
SOHPb+1.5
0.00E+00
5.00E-06
1.00E-05
1.50E-05
2.00E-05
2.50E-05
2.8 3.8 4.8 5.8 6.8
Co
nce
ntr
atio
n (
mo
l L-1
)
pH
Dissolved Pb
(>SOH)2Pb+
SOHPb+1.5
Fig. S6. Concentrations of Pb species as a function of pH. Upper row: systems with Pb = 28.2
µM, Fe = 0.3 mM. Lower row: systems with Pb = 28.2 µM, Fe = 3 mM. The figures in the
left column are for systems without P, the right-hand column shows systems that contain 63
µM (upper right) or 630 µM (lower right).
In Fig. S6 it is seen that the systems without P has a very small contribution from
monodentate complexes, which was one of the requirements for the model. On the right it is
also seen that the monodentate complexes predominate the sorbed Pb in systems that contain
P. At pH 4.0 (for which pH an EXAFS spectrum was recorded) the contribution from
bidentate complexes to the overall sorbed Pb was below 10 %.
Discussion and conclusion
This exercise shows that it may be possible to explain the results with Model 3, in which no
ternary complexes are formed at all. Instead the greatly increased Pb2+
adsorption in the
presence of P could be explained by the increased role of a monodentate complex, which is
insignificant in systems with only Pb2+
, but important in systems with PO4. There are,
however, two apparent problems with this model:
1. It does not accurately describe the enhanced PO4 adsorption in the presence of Pb
2+, whereas
the ternary surface complex model predicts PO4 more successfully. However, this observation
is based only on one data set. More data sets need to be collected to confirm this observation.
60
2. The equilibrium constant of the monodentate complex cannot be verified experimentally, as it
is not observed in a pure Pb-Fe system. The basis for the assumed affinity of the monodentate
complex is therefore shaky.
None of these arguments is sufficiently strong to discount model 3 at the present stage, and
therefore it needs to be taken into consideration seriously. To obtain more evidence on what
model that is correct, we suggest using additional EXAFS spectroscopy as well as ATR-FTIR
spectroscopy.
Similar conclusions can be drawn for the Cu-Fh systems with PO4. However, with our data it
is more difficult to evaluate model 1 for these, for two reasons: (i) the overall weaker Cu-PO4
interaction found for these systems, and (ii) the absence of strong Cu-PO4 interactions for the
system with the highest Cu/Fe ratio, for which PO4 may have been affected by Cu.
Copyright © 2022 FDOKUMEN