
Ph.D. Thesis - Tourists’ Visual Perceptions of Forests and Forest Management in Vancouver Island...
269
Tourists’ Visual Perceptions of Forests and Forest Management in Vancouver Island and Tasmania by Kyle W. Hilsendager M.Env.Mgmt., University of Tasmania, 2006 B.A., University of Alberta, 2004 A THESIS SUBMITTED IN PARTIAL FULFILLMENT OF THE REQUIREMENTS FOR THE DEGREE OF DOCTOR OF PHILOSOPHY in THE FACULTY OF GRADUATE AND POSTDOCTORAL STUDIES (FORESTRY) THE UNIVERSITY OF BRITISH COLUMBIA (Vancouver) April 2014 ©Kyle W. Hilsendager, 2014
Transcript of Ph.D. Thesis - Tourists’ Visual Perceptions of Forests and Forest Management in Vancouver Island...
Tourists’ Visual Perceptions of Forests and Forest Management in
Vancouver Island and Tasmania
by
Kyle W. Hilsendager
M.Env.Mgmt., University of Tasmania, 2006
B.A., University of Alberta, 2004
A THESIS SUBMITTED IN PARTIAL FULFILLMENT OF THE REQUIREMENTS FOR THE
DEGREE OF
DOCTOR OF PHILOSOPHY
in
THE FACULTY OF GRADUATE AND POSTDOCTORAL STUDIES
(FORESTRY)
THE UNIVERSITY OF BRITISH COLUMBIA
(Vancouver)
April 2014
©Kyle W. Hilsendager, 2014
ii
Abstract
In the past, forested areas have been used primarily for timber production. However, the recent
growth of nature-based tourism has given monetary value to the recreation and scenic
characteristics associated the forests in many places. This can lead to conflicts between forestry
and tourism raising questions relating to the management of these two industries. What impact
does forestry have on the perception of tourists in region’s that promote natural landscapes?
Are certain tourist segments affected differently by the impacts of forestry in regions that market
natural landscapes? How can forests be managed to ensure that tourism values are not
compromised by other forest interests?
To gain a better perspective of tourism and forestry related conflicts this investigation utilized a
comparative case study method. The case study locations selected include Vancouver Island,
Canada and Tasmania, Australia. At each destination visitors were surveyed at three types of
attractions to understand differences in forestry perceptions between user groups. Forestry and
tourism professionals from both regions were also interviewed. Vancouver Island and Tasmania
were chosen because of the important role that both forestry and nature-based tourism play in
shaping the economies of both places. Despite these similarities, differences exist in the way
these two industries are managed. These differences were important for providing insight into
management strategies that could be used to address these conflicts.
Results suggest that forestry impacts have the potential to negatively impact upon visitor
perceptions. However, this seems partly dependent upon the type of impact observed, as
differences were noted between harvested areas, tree plantations, logging trucks and saw/pulp
mills. Results from the different sample groups were compared to learn whether or not
differences exist in the way that tourist user groups are affected by exposure to forestry impacts.
Findings provided a limited amount of evidence to support this. Through the analysis of the
semi-structured interviews a set of recommendations were developed to help assist forestry and
tourism managers who may be dealing with similar land use conflicts. These recommendations
would be useful for land managers in other jurisdictions where similar conflicts between forestry
and tourism exist.

iii
Preface
Data collection instruments (questionnaire and interview script) required ethics approval. This
was obtained from the UBC Behavioral Research Ethics Board. The number for the ethics
certificate that was obtained is H12-00999.
iv
Table of Contents Abstract....................................................................................................................................... ii
Preface ...................................................................................................................................... iii
Table of Contents ....................................................................................................................... iv
List of Tables .............................................................................................................................. x
List of Figures .......................................................................................................................... xiii
Acknowledgements .................................................................................................................. xiv
Chapter 1: Introduction ............................................................................................................... 1
1.1 Context and Rationale .......................................................................................................... 1
1.2 Research Problem ................................................................................................................ 3
1.2.1 Research Questions ...................................................................................................... 5
1.2.2 Research Objectives ...................................................................................................... 7
1.3 Study Area Descriptions ....................................................................................................... 8
1.3.1 Vancouver Island ........................................................................................................... 9
1.3.2 Tasmania ......................................................................................................................11
1.4 Organization of Thesis ........................................................................................................13
Chapter 2: Literature Review .....................................................................................................14
2.1 Introduction .........................................................................................................................14
2.2 Tourist Gaze & Performance ...............................................................................................14
2.3 Tourist Motivation ................................................................................................................16
2.4 Destination Image ...............................................................................................................18
2.5 Public Perception ................................................................................................................21
2.5.1 Environmental Values ...................................................................................................22
2.5.2 Recreation Setting Preferences ....................................................................................25
2.5.3 Landscape Perception ..................................................................................................26
2.5.4 Forest Management ......................................................................................................28
v
2.5.5 Theory Synthesis ..........................................................................................................30
2.6 Sense of Place ....................................................................................................................35
2.6.1 Sense of Place Application Challenges.........................................................................38
2.6.2 Place Based Governance .............................................................................................40
2.6.3 Sense of Place Application for Tourism Regions ..........................................................41
2.7 Vancouver Island and Tasmania Resource Conflict in the Media ........................................42
2.7.1 Carmanah/Walbran Conflict (Vancouver Island) ...........................................................43
2.7.2 Clayoquot Sound (Vancouver Island) ...........................................................................45
2.7.3 Franklin-Gordon Dam (Tasmania) ................................................................................47
2.7.4 Harvesting of Old-Growth Forests (Tasmania) ..............................................................49
2.8 Regulatory Framework ........................................................................................................52
2.8.1 Vancouver Island ..........................................................................................................52
2.8.2 Tasmania ......................................................................................................................56
2.8.3 Summary ......................................................................................................................59
Chapter 3: Research Methods ..................................................................................................61
3.1 Introduction .........................................................................................................................61
3.2 Comparative Case Study ....................................................................................................62
3.2.1 Case Study Regions .....................................................................................................62
3.3 Questionnaire ......................................................................................................................64
3.3.1 Sample Design .............................................................................................................64
3.3.2 Questionnaire Design & Analysis ..................................................................................67
3.3.2.1 Section 1: Pre-visit Destination Image ....................................................................67
3.3.2.2 Section 2: Tourist Motivation ..................................................................................68
3.3.2.3 Section 3: Recreation Opportunity Spectrum .........................................................69
3.3.2.4 Section 4: Visitor Experience .................................................................................69
3.3.2.5 Section 5: Nature-based Tourism Setting Preferences ...........................................70
3.3.2.6 Section 6: Forestry Observations and Perceptions ................................................71
vi
3.3.2.7 Section 7: Forest Management Options .................................................................72
3.3.2.8 Section 8: New Ecological Paradigm ......................................................................73
3.3.2.9 Section 9: Demographic Characteristics .................................................................74
3.4 Semi-structured Interviews ..................................................................................................75
3.4.1 Sample Design .............................................................................................................76
3.4.2 Interview Topics ............................................................................................................76
3.4.2.1 Section1: Introductory Questions ...........................................................................77
3.4.2.2 Section 2: Forest/Tourism Conflicts ........................................................................77
3.4.2.3 Section 3: Forestry/Tourism Conflict Resolution .....................................................77
3.5 Summary ............................................................................................................................77
Chapter 4: Vancouver Island Results ........................................................................................79
4.1 Introduction .........................................................................................................................79
4.2 Methods of Analysis ............................................................................................................79
4.3 Results ................................................................................................................................80
4.3.1 Sample Characteristics .................................................................................................80
4.3.1.1 Demographic Characteristics .................................................................................81
4.3.1.2 Destination Image Scale ........................................................................................85
4.3.1.3 Motivation ...............................................................................................................89
4.3.1.4 Recreation Opportunity Spectrum ..........................................................................90
4.3.1.5 Visitor Experience Ratings .....................................................................................91
4.3.1.6 Nature-based Tourism Setting Preferences ............................................................92
4.3.1.7 Forestry Observations ............................................................................................96
4.3.1.8 Forestry Perceptions ..............................................................................................97
4.3.1.9 Forest Management Preferences ...........................................................................98
4.3.1.10 Environmental Values ........................................................................................ 100
4.3.2 Linear Regression Models for Forest Industry Impacts and Tourism Image ................ 103
4.3.2.1 Harvested Areas .................................................................................................. 104
vii
4.3.2.2 Tree Plantations ................................................................................................... 105
4.3.2.3 Logging Trucks..................................................................................................... 106
4.3.2.4 Saw/Pulp Mills ...................................................................................................... 107
4.4 Summary of Results .......................................................................................................... 108
4.5 Conclusion ........................................................................................................................ 110
Chapter 5: Tasmania Results .................................................................................................. 112
5.1 Introduction ....................................................................................................................... 112
5.2 Methods of Analysis .......................................................................................................... 113
5.3 Results .............................................................................................................................. 113
5.3.1 Sample Characteristics ............................................................................................... 113
5.3.1.1 Demographic Characteristics ............................................................................... 114
5.3.1.2 Destination Image ................................................................................................ 118
5.3.1.3 Motivation ............................................................................................................. 123
5.3.1.4 Recreation Opportunity Spectrum ........................................................................ 124
5.3.1.5 Visitor Experience Ratings ................................................................................... 125
5.3.1.6 Nature-based Tourism Setting Preferences .......................................................... 126
5.3.1.7 Forestry Observations .......................................................................................... 130
5.3.1.8 Forestry Perceptions ............................................................................................ 131
5.3.1.9 Forest Management Preferences ......................................................................... 132
5.3.1.10 Environmental Values ........................................................................................ 134
5.3.2 Linear Regression Models for Forest Industry Impacts and Tourism Image ................ 137
5.3.2.1 Harvested Areas .................................................................................................. 138
5.3.2.2 Tree Plantations ................................................................................................... 139
5.3.2.3 Logging Trucks..................................................................................................... 140
5.3.2.4 Saw/Pulp Mills ...................................................................................................... 141
5.4 Summary of Results .......................................................................................................... 142
5.5 Conclusion ........................................................................................................................ 144
viii
Chapter 6: Vancouver Island & Tasmania Interview Results ................................................... 145
6.1 Introduction ....................................................................................................................... 145
6.2 Analysis of Results ............................................................................................................ 146
6.2.1 Overview .................................................................................................................... 146
6.2.2 Positive Impacts ......................................................................................................... 147
6.2.3 Negative Impacts ........................................................................................................ 148
6.2.4 Conflict Solutions in Vancouver Island ........................................................................ 155
6.2.5 Conflict Solutions in Tasmania .................................................................................... 159
6.2.6 Tourism and Forestry Relationship in Vancouver Island ............................................. 165
6.2.7 Tourism and Forestry Relationship in Tasmania ......................................................... 166
6.3 Summary .......................................................................................................................... 168
Chapter 7: Disucussion & Conclusion ..................................................................................... 172
7.1 Introduction ....................................................................................................................... 172
7.2 Impact of Forestry on Tourist Perceptions ......................................................................... 172
7.2.1 Destination Image ....................................................................................................... 173
7.2.2 Environmental Values ................................................................................................. 173
7.2.3 Nature-based Tourism Setting Preferences ................................................................ 173
7.2.4 Forestry Impact on Visitor Perceptions ....................................................................... 174
7.2.5 Observation of Forestry Impacts ................................................................................. 175
7.2.6 Summary .................................................................................................................... 175
7.3 Impact of Forestry on Different Tourist Segments ............................................................. 176
7.3.1 Destination Image ....................................................................................................... 177
7.3.2 Environmental Values ................................................................................................. 177
7.3.3 Nature-based Tourism Setting Preferences ................................................................ 177
7.3.4 Forestry Impact on Visitor Perceptions ....................................................................... 178
7.3.5 Observation of Forestry Impacts ................................................................................. 180
7.3.6 Visitor Experience ....................................................................................................... 180
ix
7.3.7 Summary .................................................................................................................... 181
7.4 Theoretical Implications..................................................................................................... 182
7.4.1 Destination Image ....................................................................................................... 182
7.4.2 Visitor Perceptions ...................................................................................................... 183
7.4.3 Environmental Values ................................................................................................. 185
7.4.4 Visitor Satisfaction ...................................................................................................... 186
7.4.5 Tourist Gaze ............................................................................................................... 187
7.4.6 Summary .................................................................................................................... 188
7.5 Management Solutions ..................................................................................................... 188
7.5.1 Exposure to Forestry Impacts ..................................................................................... 189
7.5.2 Forest Management Preferences ................................................................................ 194
7.5.3 Conflict Reduction Strategies ...................................................................................... 196
7.5.3.1 Vancouver Island ................................................................................................. 196
7.5.3.2 Tasmania ............................................................................................................. 201
7.5.4 Summary .................................................................................................................... 206
7.6 Management Recommendations ....................................................................................... 209
7.7 Study Limitations and Suggestions for Future Research ................................................... 212
7.8 Conclusion ........................................................................................................................ 213
References ............................................................................................................................. 216
Appendix A: Vancouver Island Questionnaire & Consent Information ..................................... 232
Appendix B: Tasmania Questionnaire & Consent Information ................................................. 240
Appendix C: Interview Contact Letter, Consent Form & Script ................................................ 248
x
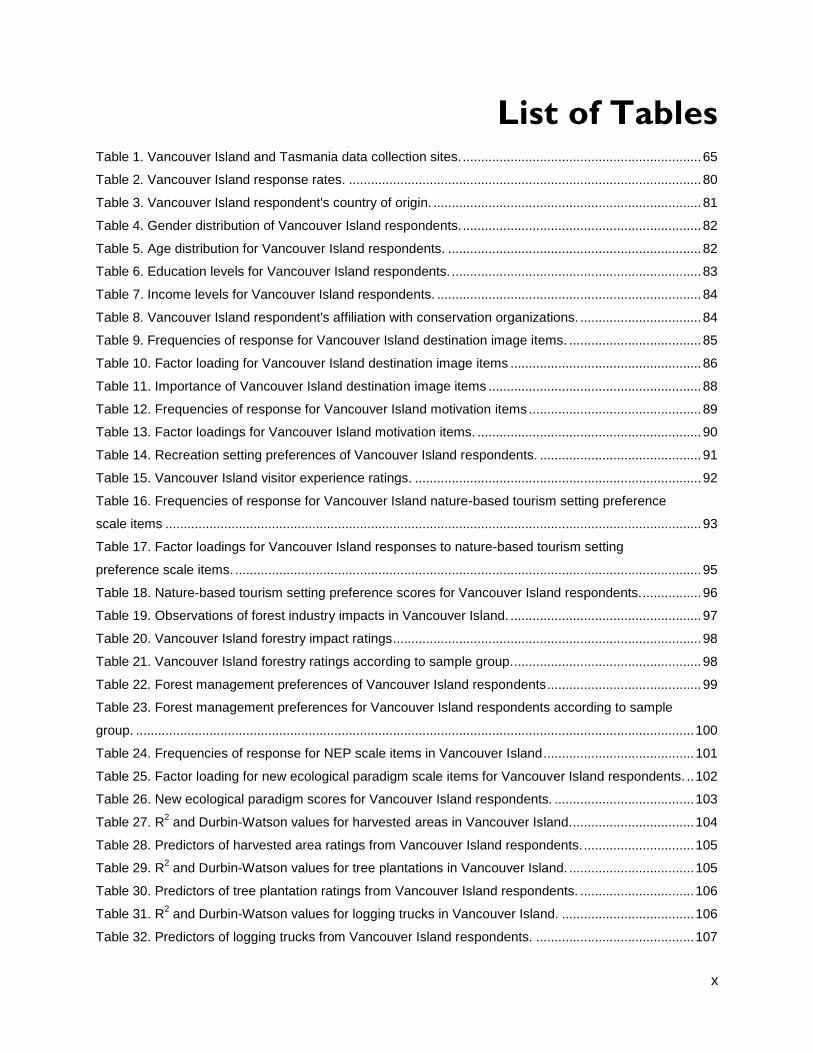
List of Tables Table 1. Vancouver Island and Tasmania data collection sites. ................................................................. 65
Table 2. Vancouver Island response rates. ................................................................................................ 80
Table 3. Vancouver Island respondent's country of origin. ......................................................................... 81
Table 4. Gender distribution of Vancouver Island respondents. ................................................................. 82
Table 5. Age distribution for Vancouver Island respondents. ..................................................................... 82
Table 6. Education levels for Vancouver Island respondents. .................................................................... 83
Table 7. Income levels for Vancouver Island respondents. ........................................................................ 84
Table 8. Vancouver Island respondent's affiliation with conservation organizations. ................................. 84
Table 9. Frequencies of response for Vancouver Island destination image items. .................................... 85
Table 10. Factor loading for Vancouver Island destination image items .................................................... 86
Table 11. Importance of Vancouver Island destination image items .......................................................... 88
Table 12. Frequencies of response for Vancouver Island motivation items ............................................... 89
Table 13. Factor loadings for Vancouver Island motivation items. ............................................................. 90
Table 14. Recreation setting preferences of Vancouver Island respondents. ............................................ 91
Table 15. Vancouver Island visitor experience ratings. .............................................................................. 92
Table 16. Frequencies of response for Vancouver Island nature-based tourism setting preference
scale items .................................................................................................................................................. 93
Table 17. Factor loadings for Vancouver Island responses to nature-based tourism setting
preference scale items. ............................................................................................................................... 95
Table 18. Nature-based tourism setting preference scores for Vancouver Island respondents. ................ 96
Table 19. Observations of forest industry impacts in Vancouver Island. .................................................... 97
Table 20. Vancouver Island forestry impact ratings .................................................................................... 98
Table 21. Vancouver Island forestry ratings according to sample group. ................................................... 98
Table 22. Forest management preferences of Vancouver Island respondents .......................................... 99
Table 23. Forest management preferences for Vancouver Island respondents according to sample
group. ........................................................................................................................................................ 100
Table 24. Frequencies of response for NEP scale items in Vancouver Island ......................................... 101
Table 25. Factor loading for new ecological paradigm scale items for Vancouver Island respondents. .. 102
Table 26. New ecological paradigm scores for Vancouver Island respondents. ...................................... 103
Table 27. R2 and Durbin-Watson values for harvested areas in Vancouver Island. ................................. 104
Table 28. Predictors of harvested area ratings from Vancouver Island respondents. .............................. 105
Table 29. R2 and Durbin-Watson values for tree plantations in Vancouver Island. .................................. 105
Table 30. Predictors of tree plantation ratings from Vancouver Island respondents. ............................... 106
Table 31. R2 and Durbin-Watson values for logging trucks in Vancouver Island. .................................... 106
Table 32. Predictors of logging trucks from Vancouver Island respondents. ........................................... 107
xi
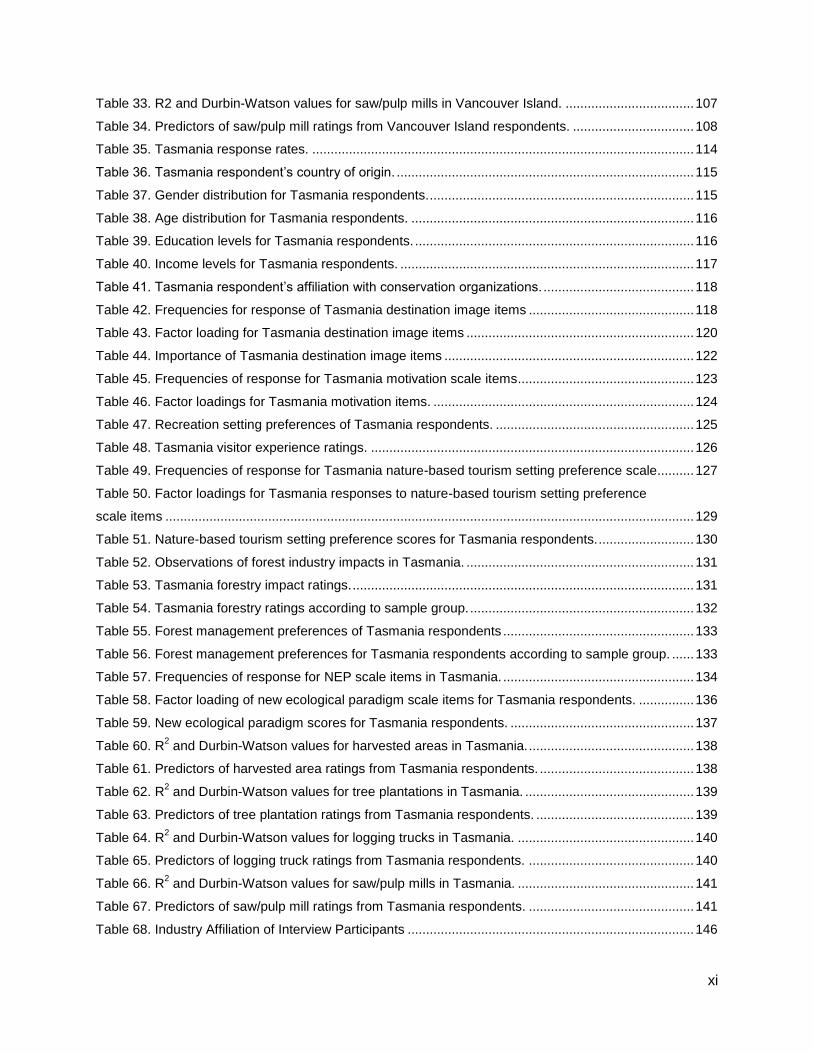
Table 33. R2 and Durbin-Watson values for saw/pulp mills in Vancouver Island. ................................... 107
Table 34. Predictors of saw/pulp mill ratings from Vancouver Island respondents. ................................. 108
Table 35. Tasmania response rates. ........................................................................................................ 114
Table 36. Tasmania respondent’s country of origin. ................................................................................. 115
Table 37. Gender distribution for Tasmania respondents. ........................................................................ 115
Table 38. Age distribution for Tasmania respondents. ............................................................................. 116
Table 39. Education levels for Tasmania respondents. ............................................................................ 116
Table 40. Income levels for Tasmania respondents. ................................................................................ 117
Table 41. Tasmania respondent’s affiliation with conservation organizations. ......................................... 118
Table 42. Frequencies for response of Tasmania destination image items ............................................. 118
Table 43. Factor loading for Tasmania destination image items .............................................................. 120
Table 44. Importance of Tasmania destination image items .................................................................... 122
Table 45. Frequencies of response for Tasmania motivation scale items ................................................ 123
Table 46. Factor loadings for Tasmania motivation items. ....................................................................... 124
Table 47. Recreation setting preferences of Tasmania respondents. ...................................................... 125
Table 48. Tasmania visitor experience ratings. ........................................................................................ 126
Table 49. Frequencies of response for Tasmania nature-based tourism setting preference scale .......... 127
Table 50. Factor loadings for Tasmania responses to nature-based tourism setting preference
scale items ................................................................................................................................................ 129
Table 51. Nature-based tourism setting preference scores for Tasmania respondents. .......................... 130
Table 52. Observations of forest industry impacts in Tasmania. .............................................................. 131
Table 53. Tasmania forestry impact ratings. ............................................................................................. 131
Table 54. Tasmania forestry ratings according to sample group. ............................................................. 132
Table 55. Forest management preferences of Tasmania respondents .................................................... 133
Table 56. Forest management preferences for Tasmania respondents according to sample group. ...... 133
Table 57. Frequencies of response for NEP scale items in Tasmania. .................................................... 134
Table 58. Factor loading of new ecological paradigm scale items for Tasmania respondents. ............... 136
Table 59. New ecological paradigm scores for Tasmania respondents. .................................................. 137
Table 60. R2 and Durbin-Watson values for harvested areas in Tasmania. ............................................. 138
Table 61. Predictors of harvested area ratings from Tasmania respondents. .......................................... 138
Table 62. R2 and Durbin-Watson values for tree plantations in Tasmania. .............................................. 139
Table 63. Predictors of tree plantation ratings from Tasmania respondents. ........................................... 139
Table 64. R2 and Durbin-Watson values for logging trucks in Tasmania. ................................................ 140
Table 65. Predictors of logging truck ratings from Tasmania respondents. ............................................. 140
Table 66. R2 and Durbin-Watson values for saw/pulp mills in Tasmania. ................................................ 141
Table 67. Predictors of saw/pulp mill ratings from Tasmania respondents. ............................................. 141
Table 68. Industry Affiliation of Interview Participants .............................................................................. 146

xii
Table 69. Conflict issues and solutions identified by interview participants. ............................................ 169
xiii
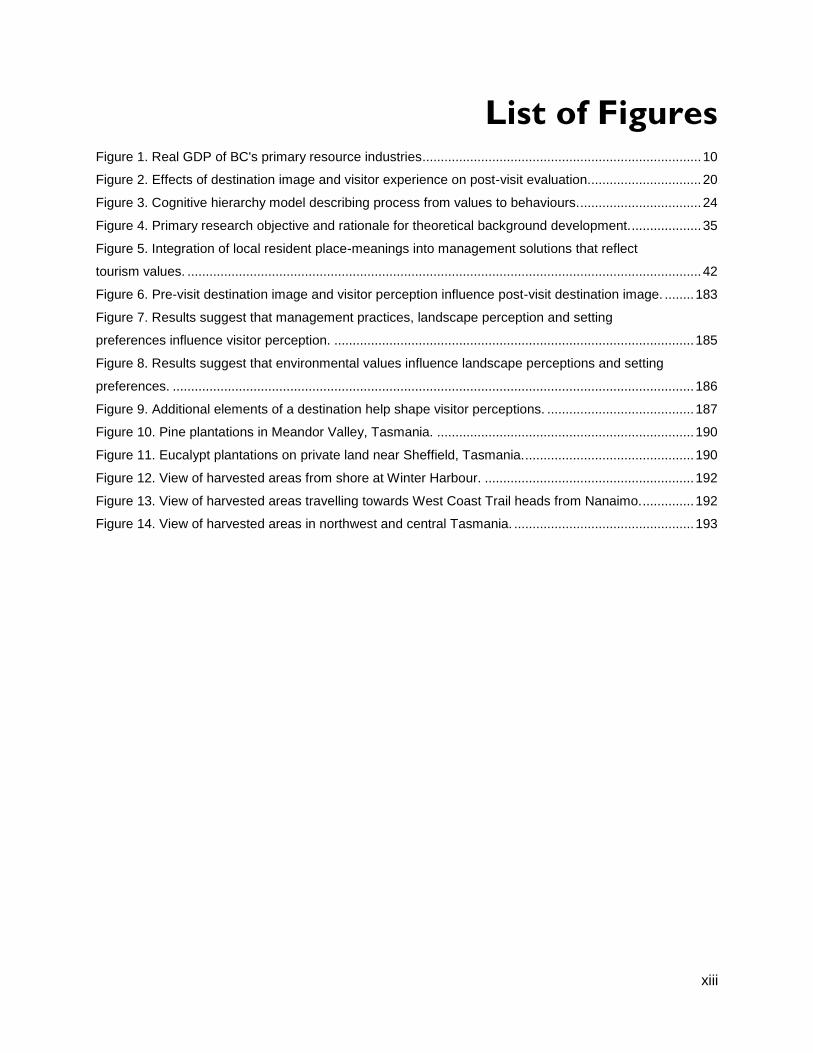
List of Figures
Figure 1. Real GDP of BC's primary resource industries............................................................................ 10
Figure 2. Effects of destination image and visitor experience on post-visit evaluation............................... 20
Figure 3. Cognitive hierarchy model describing process from values to behaviours. ................................. 24
Figure 4. Primary research objective and rationale for theoretical background development. ................... 35
Figure 5. Integration of local resident place-meanings into management solutions that reflect
tourism values. ............................................................................................................................................ 42
Figure 6. Pre-visit destination image and visitor perception influence post-visit destination image. ........ 183
Figure 7. Results suggest that management practices, landscape perception and setting
preferences influence visitor perception. .................................................................................................. 185
Figure 8. Results suggest that environmental values influence landscape perceptions and setting
preferences. .............................................................................................................................................. 186
Figure 9. Additional elements of a destination help shape visitor perceptions. ........................................ 187
Figure 10. Pine plantations in Meandor Valley, Tasmania. ...................................................................... 190
Figure 11. Eucalypt plantations on private land near Sheffield, Tasmania. .............................................. 190
Figure 12. View of harvested areas from shore at Winter Harbour. ......................................................... 192
Figure 13. View of harvested areas travelling towards West Coast Trail heads from Nanaimo. .............. 192
Figure 14. View of harvested areas in northwest and central Tasmania. ................................................. 193
xiv
Acknowledgements I would like to acknowledge the contributions of my committee members, Howard Harshaw, Rob
Kozak, Stephen Sheppard and Celmara Pocock for their support and encouragement
throughout the entire Ph.D. journey. I would also like to thank Parks Canada and the Tasmania
Parks & Wildlife Service for the logistical support that they provided during the data collection
process, as well as the fishing lodge owners in both Vancouver Island and Tasmania who
allowed me to survey their guests. All of the survey and interview participants that I met in
Vancouver Island and Tasmania deserve special thanks for providing me with the insight that
ultimately made this research possible. I would also like to acknowledge the financial support
that has been provided by the UBC Faculty of Graduate Studies, UBC Faculty of Forestry and
‘Namgis First Nation.
Thank you to the many friends that I have met during my time as a graduate student in both
Vancouver and Hobart. All the fun times we have had helped me to get through the stressful
moments that often come with graduate research. Special thanks to my good friends Mark
Wickham, as well as Ben and Kelli Michell for providing me with a place to sleep during my data
collection trip in Tasmania. Finally, I would like to thank my many family members for the love
and support that have provided throughout my life. Especially my parents, Randy and Marina
Hilsendager, who have always provided me with financial, moral and emotional support, while
teaching me the value of persistence and dedication.
1
Chapter 1
Introduction
1.1 Context and Rationale
Often described as the world’s largest industry (Robinson, 2001), tourism is somewhat difficult
to define in absolute terms (McKercher, 1996). However, Williams & Shaw (2009) define tourism
as spending at least 24 hours away from home for leisure purposes, whereas recreation refers
to activities that are undertaken for pleasure. Therefore, recreation can take place without it
being considered tourism (e.g. at home). However, tourism generally involves recreation
activities of some description since leisure is the primary purpose of tourist activity. One of the
fastest growing sectors of the industry is nature-based tourism (Kuenzi & McNeely, 2008). Like
tourism itself the nature-based tourism sector is also somewhat difficult to define since nature-
based tourists are such a diverse group. Valentine (1992) states that nature-based tourism is
mostly concerned with the direct enjoyment of undisturbed aspects of nature. However the
extent to which nature is the focus of activities can vary. Therefore, three types of nature-based
activities have been proposed. These include experiences that are dependent upon nature,
experiences that are enhanced by nature and experiences for which a natural setting is
incidental (Mehmetoglu, 2007).
Sustainable forest management requires decision-makers to balance a range of ecological,
social and economic values (Sheppard & Meitner, 2005). This can be attributed to increasingly
2
diverse forest interests that commonly include tourism and recreation values (Williams, Penrose
& Hawkes, 1998; Campos, Caparros & Oviedo; 2007). Because competing stakeholders often
have substantial differences in their attitudes toward the use of natural areas, their management
preferences may differ, often resulting in conflict (McKercher, 1992). As a result, multiple-use
forest management has emerged as an important approach for forest managers. This type of
management philosophy generally requires trade-offs to be made between regularly conflicting
management objectives in order to achieve multiple-use forest management goals (Racevskis &
Lupi, 2006).
To help address conflicts surrounding forest resources, the concept of sustainable forest
management (SFM) has broadened traditional forest management to explicitly include
economic, environmental, cultural and social dimensions of sustainability (Castaneda, 2000).
The Statement of Forest Principles was developed in 1992 at the United Nations Conference on
Environment and Development (UNCED) to help address these new philosophies and concepts
(McDonald & Lane, 2004). Since this time a number of countries throughout the world have
developed criteria and indicators to measure and monitor success in sustainable forest
management (Siry, Cubbage & Ahmed, 2005). Some examples of international initiatives
include the Montreal Process, the Tarapoto Proposal and the Pan-European Forest Process
(Castaneda, 2000). In addition to these initiatives, national and regional legislation and policies
that address SFM have been implemented in various places, including the British Columbia
Forest and Range Practices Act (2004), Canadian Council of Forest Ministers Criteria &
Indicators of Sustainable Forest Management (2006), Tasmania Forest Practices Code (Forest
Practices Board, 2000) and the UK Forestry Standard (Forestry Commission, 2004).
Despite the attempts to consider multiple aspects of forest management, one could argue that
SFM has a number of limitations. For example, tourism is often unaccounted for in SFM plans,
despite the industry’s potential to contribute to economic, environmental and social sustainability
goals. A study by Harshaw, Sheppard & Lewis (2007) reviewed eleven forest certification and
standard programs representing four levels of forest management jurisdiction (international,
national, regional and private/local). Findings revealed that tourism has generally been poorly
addressed in most SFM frameworks. For example, The Montreal Process Working Group
(2007) addresses tourism in the context of recreation. However, the three indicators given for
3
tourism are indistinguishable from the recreation indicators. Even though tourists often engage
in outdoor recreation, it is important to make distinctions between the two since tourists are
much more than just outdoor recreationists. Tourists tend to differ from outdoor recreationists in
terms of their expectations, travel patterns and economic contributions to the regions they visit
(McKercher, 1996).
This lack of focus on tourism in SFM criteria and indicator frameworks is significant because
forestry and tourism values have the potential to conflict with one another (McKercher, 1992;
Wilson, 1998; Tourism Industry Council of Tasmania, 2007). Traditionally, forested land has
been considered to be of lower economic value than agricultural land, which has resulted in
these areas being used primarily for timber production (Font & Tribe, 2000). However, many
landholders and public agencies have turned to nature tourism and recreation to help
supplement or replace economic activities such as farming or forestry (Buckley, 2003). This
demonstrates the increasing influence that the tourism industry has had on land management
decision making. Therefore, forestry and tourism managers must work together to balance the
needs of timber production with those of the tourism industry. This is especially true when one
considers the growing economic potential that the nature tourism sector can bring to a region
(Buckley, 2003). Given the growth of nature-based tourism in forested areas and the need to
balance competing interests, it is important that issues relating to tourism are addressed within
SFM frameworks.
1.2 Research Problem
In many places the forest industry is the target of criticism from environmental groups,
politicians and the media. This opposition generally relates to a range of environmental issues
that are associated with the industry such as the harvesting of old growth or ecologically
significant forests, the development of logging roads, threats posed to native species and
sustainability of harvesting techniques (Shindler, Brunson & Stankey, 2002). Although much
criticism does originate locally, issues related to forest management can also receive negative
attention nationally and internationally. For example, the Clayoquot Land Use Decision in
British Columbia, Canada was reached in 1993 that authorized the harvesting of two-thirds of
the area’s forests. The plan sparked public outcry and resulted in large scale protests and the
4
arrest of over 800 demonstrators (Magnusson & Shaw, 2002). This high profile conflict received
global attention and led to condemnation from a range of critics that included international and
local media, international politicians and celebrities (Wilson, 1998). In addition to this, protests
have been held at Australian embassies in the United States, Canada, Japan and United
Kingdom to decry the destruction of old growth forests in the island state of Tasmania
(Rainforest Action Network, 2006). This is the type of attention that can lead to negative
perceptions, which may ultimately impact the forestry industry.
Not only do public perception issues have the potential to negatively impact the forest industry,
they could also have negative effects for other sectors that rely on forested landscapes, such as
tourism. This is particularly true for regions that promote natural landscapes and outdoor
activities to attract visitors to local communities (McKercher, 1992). Examples of countries that
use these types of images to promote tourism include Canada, Australia and New Zealand
(New Zealand Ministry for the Environment, 2001). This can be seen in marketing campaigns
such as ‘Supernatural British Columbia’ (Tourism British Columbia, 2010), ‘100% Pure NZ’
(Morgan, 2002) and ‘Pure Tasmania’ (Pure Tasmania, 2010). Because these places use the
natural environment to attract visitors, it is likely that they are particularly vulnerable to the
negative perceptions that are often associated with forestry impacts.
There have been situations in the past where tourism operators have expressed concern over
the impact that forestry has on their product. Much of the local opposition directed at forestry in
the Clayoquot Sound area can be traced to the importance of tourism in this region. Some of the
most active members of the Friends of Clayoquot Sound (FOCS) organization were employees
or owners of tourism businesses with a stake in maintaining the natural beauty of the area.
These include whale-watching charters, kayak rental stores, restaurants and hotels (Wilson,
1998). Similarly, the proposed Bell Bay Pulp Mill in Tasmania has sparked significant concern
from the state tourism industry. A survey conducted by the Tourism Industry Council of
Tasmania (2007) revealed that 58% of Tasmanian tourism operators believe that the pulp mill
would have a negative effect on the Tasmanian brand. It could be argued that proposed
developments such as these could violate current SFM principles if they appear to neglect any
of the four SFM dimensions (economic, environmental, cultural, social). Therefore, it is
important for decision-makers to consider potential implications of resource development near
5
areas that rely on the natural environment to attract tourists. This raises the question of how
these two industries can be managed to reduce the impact that forestry activities can have on
tourism image in destinations that promote the natural environment.
1.2.1 Research Questions
Based upon the above research problem the following three questions have been developed to
frame this research.
1. What type of impact can forestry have on the perception of tourists in regions that market
the natural environment and the outdoor activities that take place in these settings?
Destination image can be described as an expression of the knowledge, impressions, prejudice,
imaginations or emotions that an individual has for a particular place. Past research has shown
that the most negative evaluation of a destination occurs when a positive pre-trip destination
image is followed by a negative visitor experience (Jenkins, 1999). In addition to this, numerous
studies have documented public displeasure with the visual impacts associated with forestry in
both British Columbia and Tasmania (e.g., Picard & Sheppard, 2001; British Columbia Ministry
of Forests, 2003; Ford, Williams, Bishop & Webb, 2009). Thus, one could assume that tourists
are also sensitive to the visual impacts associated with forestry. Therefore, a destination that
promotes the natural environment is likely more vulnerable to the visual impacts associated with
forestry than a destination that portrays a different marketing image. This is especially true if
these visual impacts appear to contradict the tourism image being conveyed.
Hypothesis – Forest management practices that produce visible impacts on the landscape are
likely to have a negative impact on the tourism image of regions that market the natural
environment and outdoor activities that take place in these settings.
2. Are certain tourist market segments affected differently by the impacts of forestry in regions
that market the natural environment and the outdoor activities that take place in these
settings?

6
Past studies has shown that setting preferences often differ between tourist market segments
(Paquet & Belanger, 1997; Hunt, Twynam, Haider & Robinson 2000). Research has also
demonstrated that certain personal characteristics can influence how individuals perceive
environmental quality. These include socio-economic status, cultural background and past
experiences (Petrosillo, Zurlini, Corliano, Zaccarelli & Dadamo, 2007). Similarly, these types of
individual characteristics also play a role in the formation of tourist expectations and preferences
(Beerli & Martin, 2004a). Therefore, one might expect that certain tourist market segments may
respond differently than others to the visual impacts that they encounter while visiting
destinations that market the natural environment.
Hypothesis – Tourist market segments that tend to be most attracted to natural landscapes are
more likely to have their perceptions negatively affected by forest industry impacts than tourist
market segments that are attracted by other aspects of a destination.
3. How can forests be managed to ensure that tourism values are not compromised by other
forest interests in regions that market the natural environment and the outdoor activities that
take place in these settings?
According to Gundersen & Frivold (2008) numerous studies have demonstrated that large
unnatural openings associated with clear-cuts tend to be viewed negatively by the public.
Research has also shown that tourists tend to be less accepting of landscape alteration than
local residents (British Columbia Ministry of Forests, 2003; British Columbia Ministry of Forests
and Range, 2006). However, planning which considers tourists landscape preferences can
provide benefits to the tourism industry (Tyrvainen, Silvennoinen & Nousiainen, 2002). If forestry
developments are planned in ways that reduces visitor exposure to obvious forestry impacts,
tourists may be less likely to develop negative images associated with the forest industry. It is
also expected that this research will also lead to the development of additional measures that
can be used in tourism to reduce the impacts that forestry can have on destination image.
Hypothesis – Forest management policies and frameworks that reflect the landscape
preferences of nature-based tourists will help to reduce the likelihood that recreation and
tourism values will compromised by other forest interests in regions that market the natural
environment and the outdoor activities that take place in these settings.
7
1.2.2 Research Objectives
This research will address three main objectives. Firstly, information will be obtained relating to
the potential impacts that forest practices can have on destination image. Ways in which
forestry may affect different market segments will also be examined. This will be done by
comparing Vancouver Island and Tasmania. These two places have been identified as case
study locations because they both rely on forestry and tourism to create employment. In addition
to this, the destination image of both regions is heavily influenced by the natural environment
and the outdoor activities that take place there.
Secondly, this research will provide benefits to governments in places where forestry and
tourism conflict with each other. The development of conflict reduction strategies will provide
governments with tools that can be used to inform policies that better manage the competing
interests of forestry and tourism. Information will also be obtained that can be applied to other
situations where governments must deal with conflicts between tourism and resource
development industries. For example, tourism could potentially face similar threats from other
industries, such as mining, electrical power generation or oil and gas development. Therefore,
conflict reduction strategies developed in this research could be applied to other situations
where tourism is threatened by resource development.
Finally, this research will make contributions to existing tourism and forest management
literature by exploring, applying and synthesizing relevant theories that have been developed in
past research. Examples of theories that will be addressed in this particular research include
sense of place (Cheng, Kruger & Daniels, 2003), tourist gaze (Urry, 2002), tourist motivation
(Yoon & Uysal, 2005), destination image (Gallarza, Saura & Garcia, 2002) and various concepts
relating to public perception of forest management practices (Ribe, 2006; Ford, Williams, Bishop
& Webb, 2005). These theories will be discussed in detail in the following section. Along with
these theories, new concepts relating to environmental and resource use conflict management
will be developed. Lastly the relationships between forestry and tourism management policies
will be analyzed and explained.
8
1.3 Study Area Descriptions
Two study regions were selected for this research. Vancouver Island is located off the
southwest coast of British Columbia. Both tourism and forestry are important industries
throughout the island (Tourism British Columbia, 2009a). However, conflict has occurred
between these two industries because Vancouver Island relies heavily on the natural
environment to attract visitors (Wilson, 1998). This can be seen in many promotional documents
that are distributed by the tourism industry. A wide range of outdoor recreation activities can be
found throughout the region, ranging from very accessible ‘soft eco-tourism’ opportunities (e.g.
short walks, whale watching, etc.) to more challenging pursuits that require a certain level of
expertise (e.g. multi-day hikes, saltwater fishing, etc.). Additionally, there is a strong aboriginal
history and culture throughout the region, which is also attractive to many tourists. Other types
of sites popular with visitors include golf courses, vineyards, festivals and various city attractions
(Tourism Vancouver Island, 2012).
Located off the southeast coast of Australia, Tasmania also relies heavily on both forestry and
tourism to create employment (Felmingham, Poate & McMahon, 2009). Like Vancouver Island,
the potential for conflict also exists between these two industries in Tasmania, due to the
important role that the natural environment plays in attracting visitors. It is these natural settings
that provide the backdrop for a number of outdoor activities that are popular with tourists, such
as hiking, kayaking, wildlife observation and fishing. Tasmania is also famous for its rich convict
history, with Port Arthur being its most famous convict heritage site. Other types of tourist
attractions that are popular with visitors include vineyards, markets, boat cruises and a variety of
city attractions (Tourism Tasmania, 2009).
There were three main factors that influenced the selection of these two study regions: (1) both
regions rely heavily on a tourism industry that promotes the natural environment and outdoor
activities that take place in these settings; (2) forestry, which is also a dominant industry in both
regions, relies on the resources found within these settings and (3) investigator’s familiarity with
forestry and tourism related issues in both study regions. Despite the similarities that exist
between these two regions, there are also many differences in terms of how land use is
managed. It is these differences that are likely to provide the most insight into the ways that
9
conflict can be reduced between forestry and tourism in regions that market the natural
environment to potential visitors.
1.3.1 Vancouver Island
Covering an area of approximately 31 000 km2 (Natural Resources Canada, 2007), Vancouver
Island can be easily accessed by a ferry trip of approximately two hours from metropolitan
Vancouver. Alternatively, visitors can also access the island by commercial or charter flights,
with airports in major centers such as Victoria and Nanaimo, as well as smaller hubs including
Comox and Campbell River. With a population of roughly 750 000, Vancouver Island relies
heavily on the tourism industry as demonstrated by the more than 20 000 people employed in
the industry in 2011 (Tourism British Columbia, 2012, p.52). It is also home to the most tourism
related businesses and generates the most revenue from tourist overnight accommodation in
British Columbia, outside of the Vancouver region (Tourism British Columbia, 2009a). When
surveyed about their primary motivations for visiting Vancouver Island 28% of all leisure visitors
identified ‘scenic beauty’ as their primary motivation (Tourism Vancouver Island, 2008, p.22),
which speaks to the important role that the natural environment plays in attracting tourists to the
region.
The natural settings of Vancouver Island provide visitors with a variety of different front- and
back-country recreation opportunities. One of the most well known outdoor attractions in the
region is the West Coast Trail, which provides walkers with a challenging multi-day trek through
the temperate rainforest on the Pacific Coast. There are also numerous shorter hikes available,
as well as trails that can accommodate other activities such as cycling and horseback riding.
Many activities that take place on water are also popular with tourists. Saltwater fishing is an
activity that attracts many visitors, due to the high number of charter companies available and
the diversity of species that can be caught in the waters surrounding Vancouver Island. Other
water-based activities include kayaking, canoeing, sailing diving and whale watching. In addition
to the many outdoor activities available, visitors are also attracted by the many charismatic
wildlife species that inhabit the region including bears, eagles, cougars and elk (Tourism
Vancouver Island, 2011). With such a range of outdoor recreation activities available it is easy
to see why the maintenance of environmental quality is so important for Vancouver Island’s
tourism industry.
10
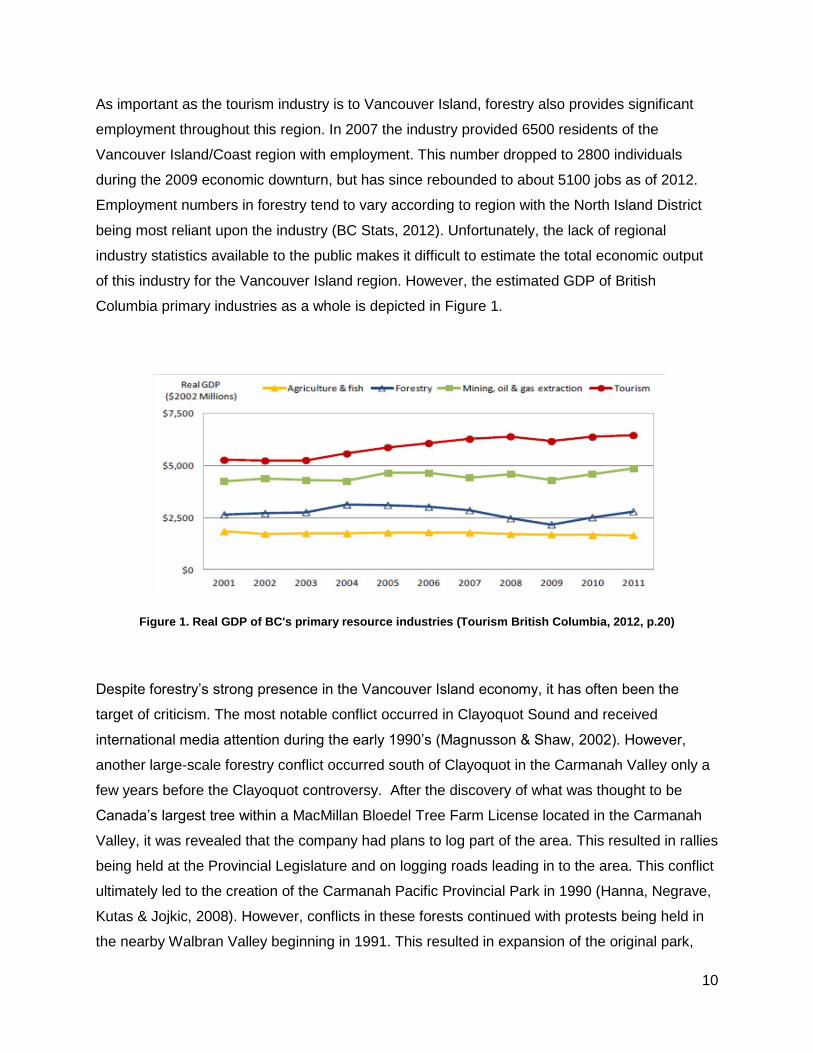
As important as the tourism industry is to Vancouver Island, forestry also provides significant
employment throughout this region. In 2007 the industry provided 6500 residents of the
Vancouver Island/Coast region with employment. This number dropped to 2800 individuals
during the 2009 economic downturn, but has since rebounded to about 5100 jobs as of 2012.
Employment numbers in forestry tend to vary according to region with the North Island District
being most reliant upon the industry (BC Stats, 2012). Unfortunately, the lack of regional
industry statistics available to the public makes it difficult to estimate the total economic output
of this industry for the Vancouver Island region. However, the estimated GDP of British
Columbia primary industries as a whole is depicted in Figure 1.
Figure 1. Real GDP of BC's primary resource industries (Tourism British Columbia, 2012, p.20)
Despite forestry’s strong presence in the Vancouver Island economy, it has often been the
target of criticism. The most notable conflict occurred in Clayoquot Sound and received
international media attention during the early 1990’s (Magnusson & Shaw, 2002). However,
another large-scale forestry conflict occurred south of Clayoquot in the Carmanah Valley only a
few years before the Clayoquot controversy. After the discovery of what was thought to be
Canada’s largest tree within a MacMillan Bloedel Tree Farm License located in the Carmanah
Valley, it was revealed that the company had plans to log part of the area. This resulted in rallies
being held at the Provincial Legislature and on logging roads leading in to the area. This conflict
ultimately led to the creation of the Carmanah Pacific Provincial Park in 1990 (Hanna, Negrave,
Kutas & Jojkic, 2008). However, conflicts in these forests continued with protests being held in
the nearby Walbran Valley beginning in 1991. This resulted in expansion of the original park,
11
which became the Carmanah Walbran Provincial Park 1995. Like Clayoquot Sound, the
Carmanah-Walbran conflict also gained international media attention with protest vigils being
held outside the parent offices of Fletcher Challenge in New Zealand (Stanbury, 2000).
Environmental conflicts that receive attention internationally could potentially impact upon a
region destination image, due to the international context that characterizes this industry. This is
especially true for regions that promote the natural environment. Therefore, a reduction in these
types of conflicts is likely to have positive implications for destinations that are known for their
natural features.
1.3.2 Tasmania
With a land area covering about 68 000 km2 the island state of Tasmania is located roughly 240
kilometers south of mainland Australia (TPWS & DTPHA, 2004). It can be accessed from
Melbourne by a flight of approximately 1 hour or a ferry trip which generally takes between nine
and eleven hours. However, due to the vast difference in travelling times between these two
modes, tourists more commonly fly to Tasmania, with approximately 740 000 air arrivals and
125 000 sea arrivals in 2011 (Tourism Tasmania, 2012). The tourism industry plays a prominent
role in the Tasmanian economy employing 6.1% of the state’s 500 000 residents (Australian
Bureau of Statistics, 2009). The industry contributes about 4.9% to the total Gross State Product
of Tasmania, which is well above tourism’s national share of Australia’s Gross Domestic
Product of 3.7% (Tourism & Transport Forum, 2009). With almost 330 000 tourists visiting
Tasmanian national parks in 2011 and many others participating in outdoor activities elsewhere,
the natural environment plays a vital role in shaping the image of Tasmania’s tourism industry
(Tourism Tasmania, 2012).
About one third of Tasmania is contained within reserves that are managed by the Parks and
Wildlife Service (Department of Primary Industries, Parks, Water & Environment, 2011) with
additional reserves being managed by Forestry Tasmania (Forestry Tasmania, 2012).
Therefore, it is often referred to as ‘Australia’s Natural State’ (Tourism Tasmania, 2008), as the
region natural environment provides an important backdrop for numerous outdoor activities that
are popular with tourists. The Overland Track is considered to be Australia’s most iconic
‘bushwalk’ and provides hikers with a challenging, multi-day trek through Cradle Mountain-Lake
St. Clair National Park. There are also many other options for both short walks and overnight
12
hikes that can be found throughout the state. Along with the many hikes available, an
abundance of unique wildlife species, including penguins, platypus and Tasmanian devils
provide visitors with nature-based experiences that are distinct to Tasmania. Other outdoor
activities popular with tourists include both freshwater and saltwater fishing, kayaking and diving
(Tourism Tasmania, 2009). Because so many attractions in Tasmania rely upon the natural
environment, the maintenance of environmental quality is likely to be a critical element in the
preservation of the state’s image as a leading nature-based tourist destination.
Despite the importance of tourism, forestry has also made significant contributions to the
Tasmanian economy. In 2008 the industry was responsible for generating 2.8% of Tasmania’s
Gross State Product (Felmingham et al., 2009, p. 16). With an estimated 6300 people employed
in the forest industry (Shirmer, 2008, p. 54), this sector represented about 3.1% of the state’s
employed labor force in 2006 (Shirmer, 2008, p.59) making it one of Tasmania’s most important
industries. Dependence on the forest industry in Tasmania varies considerably depending on
the region, with rural areas generally being more reliant upon it. For example, 32% of the
workforce in the Derwent Valley Local Government Area (LGA), 23% in the Dorset LGA and
19% in the Kentish LGA were employed in forestry in 2006 (Shirmer, 2008, p. 25), This
suggests that rural areas are most likely to experience the most significant impacts if there are
any changes or disruptions to the forest industry. Despite the recent strength of this sector, it
has experienced significant declines in recent years beginning in 2008, which can be attributed
to a variety of factors. Between 2008 and 2010 employment in the industry fell by one third with
over 2300 jobs being lost (Shirmer, 2010, p. 2). This can be attributed to a variety of factors
including the global financial crisis, reduced investments in plantations and successful
campaigns by environmental organizations to reduce the demand for woodchips coming from
the state (Shirmer, 2010). Since 2010 these declines have continued, leaving current forest
industry in Tasmania struggling to remain viable.
Even though the forestry industry makes significant contributions to the Tasmanian economy, it
often comes under scrutiny from the public, with many notable forestry related conflicts taking
place in recent decades. The Tasmanian Wilderness Society was founded in 1976 in response
to the flooding of Lake Pedder four years earlier. After a successful campaign to save the
Franklin-Gordon River from being dammed in 1983, the organization’s focus shifted to
13
protection of the state’s forests. This has led to numerous high-profile campaigns that have
included road blockades, tree-sits and public rallies against many forest industry related
developments (Gee, 2005). One the most controversial issues relating to the Tasmanian forest
industry during this time is the harvesting of old-growth forests, which has led to conflicts in
places like the Weld Valley, Styx Valley, Blue Tier and Tarkine regions (Affolderbach, 2011).
However, pulp-mill developments have also become the target of environmentalist groups in
Tasmania with a successful campaign against the Wesley Vale pulp mill construction in 1989
and another campaign against the proposed Bell Bay pulp mill, which is currently ongoing
(Tranter, 2009). These types of conflicts have the potential to damage Tasmania’s tourism
image, due to the industry’s reliance on the natural environment. Therefore, steps should be
taken to minimize conflict and foster cooperation between forestry and tourism, as this would
likely provide benefits to both industries.
1.4 Organization of Thesis
The following chapters will detail relevant theories surrounding this research, as well as present
the results and implications arising from this investigation. Chapter 2 reviews the relevant
literature from the fields of tourism and natural resource management. These include tourist
motivation, destination image, tourist gaze, environmental values, public perception and
theories relating to forest management. Chapter 3 details the survey instrument design,
development of interview topics and the sampling methods used. Chapter 4 presents the results
from the surveys distributed in Vancouver Island, while Chapter 5 presents the results from
Tasmania survey respondents. The sixth chapter will present the results from interviews that
were conducted with forestry and tourism professionals in both Vancouver Island and
Tasmania. Finally, Chapter 7 discusses practical implications from the results presents a set of
management recommendations for natural resource managers who are dealing with similar
conflicts between forestry and tourism.
14
Chapter 2
Literature Review
2.1 Introduction
Due to the nature-based tourism industry’s reliance upon intact natural settings, it is important
that forest management decisions incorporate a broader range of values than what was
previously required. Although past investigations have examined the relationships between
forestry and tourism, the impact that forestry can have on tourist perceptions in regions that
market the natural environment has not been studied in significant depth. However, a
considerable amount of research has been done on related topics, which have helped to
provide a theoretical background for this study. Therefore, this chapter will review theories that
include tourist motivation, destination image, tourist gaze/performance, environmental
perceptions and sense of place. This will be followed by a section detailing some of the high
profile environmental conflicts that have occurred in both Tasmania and Vancouver Island.
Potential impact that these types of conflicts could have upon the tourism industry will also be
discussed.
2.2 Tourist Gaze & Performance
Conceived by Urry (1990), the tourist gaze theory attempts to conceptualize the various objects
that people gaze upon as tourists. According to Urry (2002), the objects that tourists expect to
gaze upon are the images that are depicted in postcards and other forms of media, which differ
15
from those normally encountered in everyday life. Therefore, one might expect that these
images play a significant role in the destinations that tourists choose to visit. However, when
objects being gazed upon do not live up to the images portrayed, they are likely to have a
negative impact on the tourist experience. Urry (1992) states that certain types of developments
can visually contaminate an environment making it unsuitable for the tourist gaze. Hence, the
preservation of visual quality in places frequented by tourists can potentially enhance the
tourism value of a particular region.
The notion of tourist gaze suggests that the environment is not just passively observed, but also
given meaning by the viewer. For example, tourists typically travel for leisure purposes and
therefore view the world through what could be described as hedonistic cultural lens, which is
much different than the way that local residents view the same areas. This ultimately helps to
define the locality in relation to the degree to which expectations are met and leisure needs are
fulfilled (Janes, 2008). If these expectations and needs are met, visitors are likely to consider
their tourist experience to have been a positive one. Unfortunately, the inherent differences
found among visitors can make tourism planning difficult, as pre-trip expectations and
experiences are bound to vary widely. However, shaping pre-trip expectations and making
attempts to direct tourists towards areas where their expectations are met could ultimately
enhance visitor experience, resulting in positive benefits for the tourism industry.
The prevalence of instant communication and mass media in today’s society means that tourist
regions can easily convey certain types of images to help shape the pre-trip expectations of
visitors. For example, England has become known as a destination to gaze upon scenes that
depict history and heritage, such as Westminster Abbey (Urry, 2002). Vancouver Island and
Tasmania also contain a wealth of images suitable for the tourist gaze. Many of the images from
these places that are marketed to tourists include those showing natural features, such as
coastlines, mountains and temperate rainforests. Even though natural features are suitable
objects of the tourist gaze, it could be argued that the tourist gaze theory does not fully
encapsulate the tourist experience for many visitors. This is especially true when one considers
destinations that rely on natural features to attract visitors. This is because many tourists who
visit these places, often do so to participate in active forms of touristic recreation. Therefore,
16
gazing is only one element of the tourist experience in these types of destinations (Perkins &
Thorns, 2001).
In an attempt to address some of these shortcomings, the tourist performance theory was
developed by Perkins and Thorns (2001). They argue that the tourist gaze theory is too passive
since many tourist activities involve physical, intellectual and cognitive engagement, in addition
to simply gazing. Therefore, a performance-based approach to interpreting tourism has been
proposed to help improve understanding of changes in the international tourism market and
address alternative forms of tourism. The diverse nature of the tourism industry has resulted in
different groups of tourists frequenting different places, participating in different activities and
ultimately being catered to by different elements of the tourism industry. Despite these
differences, each tourist participates in a performance that includes aspects of the gaze, along
with physical, intellectual and cognitive activities (Cloke & Perkins, 1998).
Because of the differing characteristics found amongst tourists and the attractions that they visit,
the contextual nature of the tourist experience is essential for its interpretation. The tourist gaze
theory has been criticized for its focus on the European perspective and associated historical,
cultural and social experiences (Perkins & Thorns, 2001). However, places like Vancouver
Island and Tasmania provide visitors with a more diverse tourist experience by offering a wide
range of outdoor activities such as fishing, camping, walking, boating and diving. Therefore, the
use of the tourist gaze theory in these contexts can only provide limited perspectives into the
overall experience of visitors. However, incorporation of the tourist performance theory is likely
to provide better insight into the factors that motivate tourists to choose certain destinations over
others and the experiences that they hope to engage in while visiting these places.
2.3 Tourist Motivation
Motivation is often described as an inner state that directs human behavior, which is based
upon a drive to satisfy both physiological and psychological needs (Jang, Bai, Hu & Wu, 2009).
In tourism research, motivation can be understood through two main constructs that attempt to
explain why individuals travel. These are commonly referred to as ‘push’ and ‘pull’ factors.

17
These two forces explain how tourists are ‘pushed’ by motivation variables into making travel
decisions (e.g. desire to escape) and how they are ‘pulled’, or attracted by certain
characteristics of a particular destination (e.g. natural scenery). Therefore, push motivations can
be understood as the internal or emotional aspects of travel decision making, whereas pull
motivations are external to the individual and are aroused the by specific attributes associated
with a destination (Yoon & Uysal, 2005; Jang, et al., 2009).
Push factors represent certain desires within individuals that are ultimately responsible for
initiating the travel decision making process (Jang & Cai, 2002). Some examples of push factors
that are common amongst tourists include the desire for escape, adventure, excitement, social
interaction, rest and relaxation or health and fitness (Yoon & Uysal, 2005). Therefore, push
factors tend to be intangible, intrinsic desires that originate away from the actual destination.
Despite this, it is important to understand push factors, as specific attributes of a destination are
likely to cater to certain types of intrinsic motivations more than others (Jang, et al., 2009). For
example, a tourist seeking adventure and excitement is more likely to have these desires
fulfilled at destinations that specialize in adventure activities as opposed to cultural heritage
attractions. If tourism industry managers are able to identify common factors that motivate
individuals to make certain travel decisions, they will be better equipped when it comes to
providing experiences that satisfy the desires visitors.
In contrast to push factors, pull factors relate to the features or attributes of the destination itself
(Kim, Lee & Klenosky, 2003). Pull factors tend to consist of tangible resources, such as
attractions, activities and facilities, as well as the attractiveness of these resources in the eyes
of the traveler. Once push factors have initiated a desire within an individual to travel, pull
factors motivate them to choose a specific destination over others (Baloglu & Uysal, 1996). This
decision tends to be based on the attractiveness of the destination, in terms of how likely it is to
satisfy push motivations within the individual (Jang, et al., 2009). For example, a tourist that is
hoping to experience new cultures is likely to be most satisfied visiting a destination with a local
culture that is much different to their own. Therefore, the images associated with certain tourist
destinations can play an important role in their overall success, due to their ability to attract
those who are seeking specific types of experiences.
18
2.4 Destination Image
Destination image is considered to be an important element to the success of a tourist
destination, as it is often perceptions rather than reality that motivate individuals to visit specific
places (Gallarza et al., 2001). Therefore, the general perceptions that tourists and local
residents have of a specific place can potentially impact on its success as a tourist destination.
This is why it is important to carefully manage the destination image that is presented to both
tourists and residents in jurisdictions that promote outdoor activities and the natural
environment.
Although the concept of destination image has many elements, it has been defined as an
expression of all knowledge, impressions, prejudice, imaginations and emotions that a group or
individual has for a particular place (Jenkins, 1999). Despite the simplicity of this definition,
characterising a specific destination’s image can prove to be quite difficult, as a tourism product,
service or destination can be understood as a multi-item construct. This is due to the multiple
attributes of a region that contribute to its overall image (e.g. quality of service, attractions,
infrastructure, scenery, etc.). In addition to this, the concept is inherently subjective and can be
analysed from a range of disciplines including anthropology, sociology, geography and
marketing, adding even more complexity to the characterisation of a particular destination’s
image (Gallarza et al., 2001).
For the most part, tourists have idealized images of destinations. These tend to be developed
through exposure to various media representations of these destinations (Mercille, 2005). In
order to increase visitation, tourism industry managers try to promote images in ways that are
likely maximize patronage (Sirgy & Su, 2000). Therefore, destinations that promote outdoor
activities tend to depict individuals enjoying these activities amongst scenic landscapes.
However, the degree of influence that images have upon visitor perception appears to vary
between tourist market segments. According to Gallarza et al. (2001), distance plays an
important role in the image formation process, as there seems to be a positive correlation
between a tourist’s distance from a destination and their degree of perception of it. For example,
the greater distance travelled by a visitor tends to result in an increased distortion of reality.
Image has also been shown to depend upon previous experience and degree of familiarity with
a destination (Chen & Kerstetter, 1999). Therefore, it could be suggested that first time visitors

19
who have travelled a greater distance are more likely to be influenced by images portrayed in
tourism promotion materials than a repeat visitor who has travelled a shorter distance.
According to Obenour, Groves and Lengfelder (1991), destination image has a number of
distinct dimensions (e.g. nature, culture, activities) all of which are perceived differently by
tourists. Therefore, a destination’s image is composed of various products and attributes that
combine to form an individual’s overall impression. (MacKay & Fesenmaier, 1997). Because
tourists evaluate potential destinations based on the types of leisure they would like to engage
in (Ahmed, 1996), the activities and settings promoted have the potential to influence
destination image. For example, destinations that promote outdoor recreation activities tend to
project images associated with pristine natural settings, whereas the images associated with
cultural destinations tend to emphasize various aspects of human development. Therefore,
understanding a destination’s dominant market segments is essential for providing the types of
experiences that match the desires and expectations of visitors.
The image formation process involves the integration of various information sources that act
independently of one another to form an individual’s image of a specific destination. Along with
distance and marketing, there are a number of personal characteristics that help to shape the
image that a tourist has of a particular destination (Beerli & Martin, 2004b), including age,
gender, education level and place of residence (Beerli & Martin, 2004a). This image is also
partly formed by a combination of an individual’s needs, motivations, prior knowledge and
preferences (Beerli & Martin, 2004b). Therefore, tourism managers must account for a number
of factors in their attempts to portray a destination in a way that is attractive to their target
market. This is especially true since potential customers come from a wide range of different
backgrounds and therefore possess a wide variety of personal characteristics.
The importance of destination image is widely acknowledged throughout the tourism industry.
This is because a destination’s image can affect an individual’s subjective perception,
consequent behaviour and ultimately destination choice (Gallarza et al., 2001). Destination
image also has the potential to help shape the visitor experience and influence the degree of
satisfaction that a visitor feels about their tourist experience. According to Jenkins (1999), the
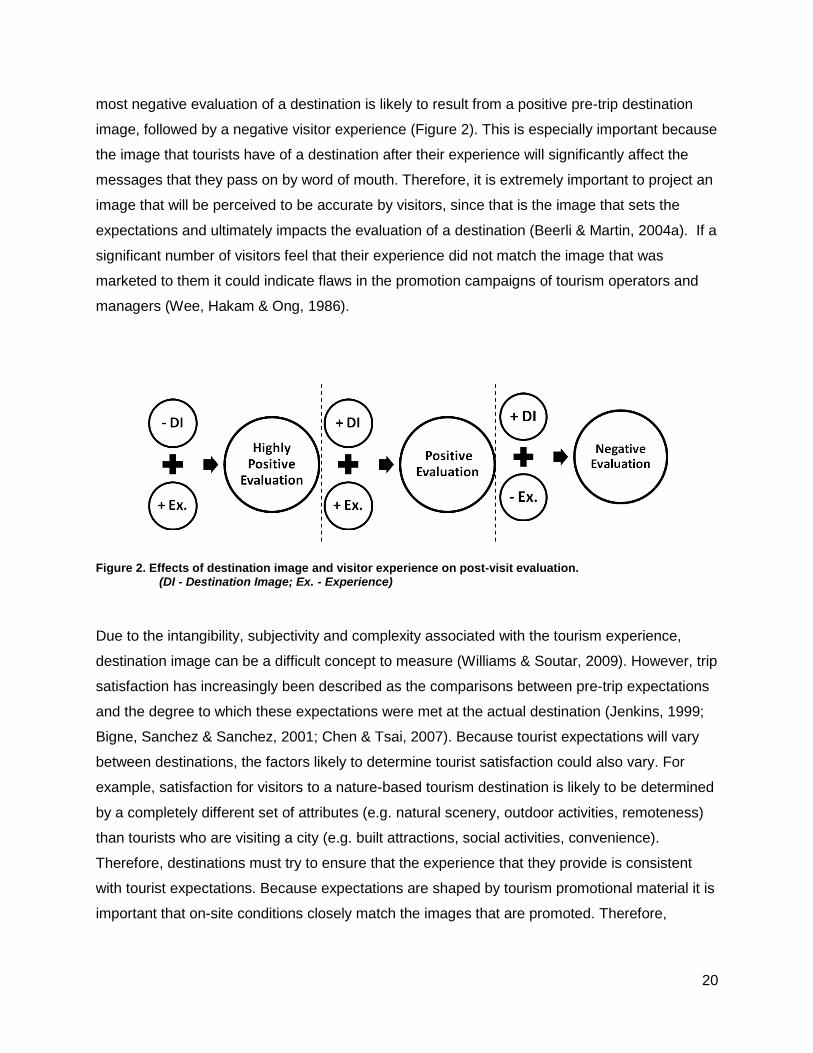
20
most negative evaluation of a destination is likely to result from a positive pre-trip destination
image, followed by a negative visitor experience (Figure 2). This is especially important because
the image that tourists have of a destination after their experience will significantly affect the
messages that they pass on by word of mouth. Therefore, it is extremely important to project an
image that will be perceived to be accurate by visitors, since that is the image that sets the
expectations and ultimately impacts the evaluation of a destination (Beerli & Martin, 2004a). If a
significant number of visitors feel that their experience did not match the image that was
marketed to them it could indicate flaws in the promotion campaigns of tourism operators and
managers (Wee, Hakam & Ong, 1986).
Figure 2. Effects of destination image and visitor experience on post-visit evaluation. (DI - Destination Image; Ex. - Experience)
Due to the intangibility, subjectivity and complexity associated with the tourism experience,
destination image can be a difficult concept to measure (Williams & Soutar, 2009). However, trip
satisfaction has increasingly been described as the comparisons between pre-trip expectations
and the degree to which these expectations were met at the actual destination (Jenkins, 1999;
Bigne, Sanchez & Sanchez, 2001; Chen & Tsai, 2007). Because tourist expectations will vary
between destinations, the factors likely to determine tourist satisfaction could also vary. For
example, satisfaction for visitors to a nature-based tourism destination is likely to be determined
by a completely different set of attributes (e.g. natural scenery, outdoor activities, remoteness)
than tourists who are visiting a city (e.g. built attractions, social activities, convenience).
Therefore, destinations must try to ensure that the experience that they provide is consistent
with tourist expectations. Because expectations are shaped by tourism promotional material it is
important that on-site conditions closely match the images that are promoted. Therefore,
21
destinations that promote natural attractions should ensure that they consistently present
landscapes that appear natural and intact.
There are many factors that help to shape a destination’s image. However, it seems as though
the visual impacts associated with forestry could potentially affect the aesthetic qualities of
certain destinations. This could have a negative effect on post-visit image and ultimately word of
mouth promotion. This is especially true in places where the natural environment features
heavily in the destination image that is promoted. Beerli and Martin (2004b) argue that an
individual’s pre-visit destination image is often much different than the image that they form
post-visit. Because the pre-visit destination image is developed through secondary sources,
such as brochures and websites, it tends to be less accurate than the image that is formed post-
visit. Therefore, if an individual is exposed to tourism marketing material that promotes the
natural environment, they may be more likely to develop a negative image, upon viewing land
uses that they consider to be unsustainable. This could ultimately reduce the likelihood of return
visits and positive word of mouth advertising from previous visitors.
2.5 Public Perception
In many places the forestry industry faces a significant amount of public opposition. This can be
attributed to a number of different causes. Even though timber production is viewed as a
legitimate use of forest resources by most, there seems to be a desire for a better balance
between commodity and non-commodity uses in forests amongst many members of the public
(Shindler, et.al., 2002). Some of the forest management issues that can lead to negative public
perceptions include clear-cutting, the use of herbicides (Wagner, Flynn, Gregory, Mertz &
Slovik, 1998) and the visual effects of landscape alteration (Kearney, 2001). Visual effects on
the landscape caused by forestry seem to be a particularly important issue in determining public
acceptance of management practices. It was the visual effects of clear-cutting that was the
primary cause of the Bitterroot and Monogahela National Forest controversies in the United
States during the early 1970’s (McCool, Benson & Ashor, 1986) and the Clayoquot Sound
conflict in the 1990’s (Wilson, 1998). These scenes of clear-cuts are often used by
environmental advocacy groups to help demonstrate forest destruction and gain support for
stricter management regulations (Kearney, 2001). There are a number of factors that appear to
22
influence perception of land management practices. These include environmental values,
recreation preferences, landscape perceptions and forest management practices.
2.5.1 Environmental Values
In economics the term value is generally used to express monetary worth. However, in a social
science context the term values is often used to describe cultural ideas about what is
considered to be desirable, right and appropriate (Tindall, 2003). An important factor in
determining the degree to which forest management practices are considered to be acceptable
is an individual’s environmental values. These consist of personal beliefs relating to the basic
condition of nature and the role human beings have in manipulating the environment.
Environmental values may be influenced by factors such as moral, ethical or cultural norms
(Wagner et al., 1998). These values are important determinants of how members of the public
judge the appropriateness of resource management decisions and should be considered by
natural resource managers. Research conducted by Ford et al. (2005) revealed that people with
stronger non-use (intrinsic) values for the environment tend to value the aesthetics or forests
and view clear-cutting as unacceptable. This helps to demonstrate the ways in which
environmental values can influence acceptability of land management practices.
Researchers have classified environmental values into two broad perspectives. On one end of
the spectrum is the biocentric perspective, which considers the natural world to have inherent
value. This perspective extends ethical considerations to non-human entities and life-forms. On
the opposite end of the spectrum is the anthropocentric perspective, which characterizes the
value of nature in terms of its ability to provide benefits to society. This perspective considers
human needs and desires to be most important and prioritizes these needs and desires above
environmental concerns (Bengston, Webb, & Fan, 2004). Research has shown that these
orientations often correspond with different social characteristics. For example, biocentric
orientations have been found to correspond with younger people, who come from larger
communities and have higher income and educational levels. It has also been found that
women more commonly hold a biocentric perspective than men (Abrams, Kelly, Shindler &
Wilton, 2005). Therefore, demographic characteristics, such as age, gender and ethnicity can
potentially have a significant influence on public perception of land management practices
(Gobster, 1996).
23
It has also been demonstrated that the degree of opposition a person feels towards industrial
activities can depend on their personal values and affiliation with industry or environmental
groups. Past studies have demonstrated that individuals with an ‘economic’ perspective support
industrial activities more than those who believe the natural world has ‘intrinsic’ value (Abrams
et al., 2005). Whether or not a person has an economic perspective depends partly on their
degree of affiliation with industry or environmental groups. An investigation conducted by Ford
et al. (2005) revealed significant differences between people affiliated with environmental
groups, people affiliated with industrial groups and those with no affiliation at all. The study
showed that conservation and non-affiliated individuals viewed clear-cutting as the least
acceptable harvesting technique, whereas the industry affiliated participants found it to be more
acceptable. The trend was reversed when participants were asked about their opinion of
selective logging, with industry affiliated individuals viewing the harvesting technique to be
unacceptable and conservation and non-affiliated people perceiving it to be most acceptable.
A technique that is commonly used to measure the environmental orientation of individuals is
the New Ecological Paradigm (NEP) Scale. The NEP Scale has been used widely over the past
three decades to examine the environmental beliefs of individuals exhibiting a wide range of
demographic characteristics (Dunlap, Van Liere, Mertig & Jones, 2000). The revised version of
the NEP contains 15 items that are separated into five factors which measure beliefs about
relationships between human society and the environment. Participants are asked to indicate
their level of agreement with the 15 items, which contain statements relating to balance of
nature, likelihood of eco-crisis, exemptionalism (belief that humans are exempt from laws of
nature), limits to growth and anthropocentrism (Cardano, Welcomer & Scherer, 2003). The 15
items are worded so as to produce eight pro-environment and seven anthropocentric items to
ensure that no single facet is measured with items worded in only one direction. A high score on
the NEP generally indicates that the participant has pro-environmental beliefs and attitudes on a
wide range of issues. Past research has shown that certain demographic characteristics can
play a role in people’s environmental attitudes. For example, pro-environmental attitudes,
indicated by a high NEP score, are consistently found in young, well-educated and politically
liberal adults, whereas anthropocentric views tend to be found in their counterparts (Dunlap,
2008).
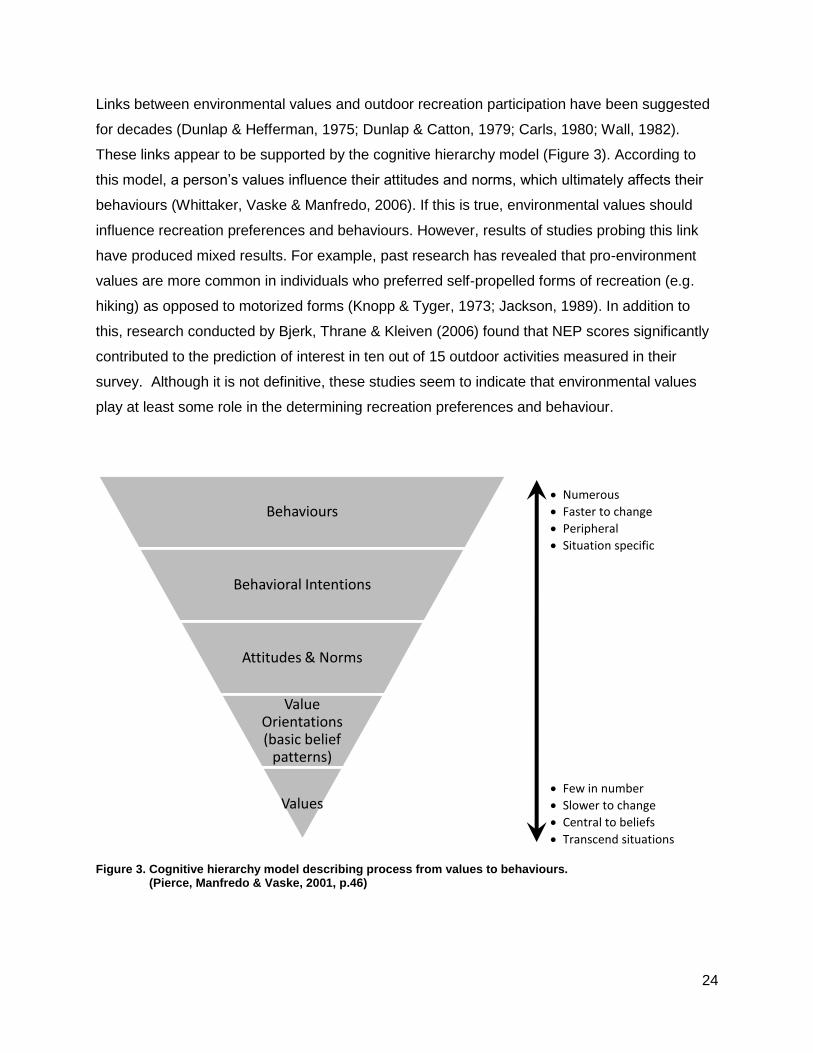
24
Links between environmental values and outdoor recreation participation have been suggested
for decades (Dunlap & Hefferman, 1975; Dunlap & Catton, 1979; Carls, 1980; Wall, 1982).
These links appear to be supported by the cognitive hierarchy model (Figure 3). According to
this model, a person’s values influence their attitudes and norms, which ultimately affects their
behaviours (Whittaker, Vaske & Manfredo, 2006). If this is true, environmental values should
influence recreation preferences and behaviours. However, results of studies probing this link
have produced mixed results. For example, past research has revealed that pro-environment
values are more common in individuals who preferred self-propelled forms of recreation (e.g.
hiking) as opposed to motorized forms (Knopp & Tyger, 1973; Jackson, 1989). In addition to
this, research conducted by Bjerk, Thrane & Kleiven (2006) found that NEP scores significantly
contributed to the prediction of interest in ten out of 15 outdoor activities measured in their
survey. Although it is not definitive, these studies seem to indicate that environmental values
play at least some role in the determining recreation preferences and behaviour.
Figure 3. Cognitive hierarchy model describing process from values to behaviours. (Pierce, Manfredo & Vaske, 2001, p.46)
Behaviours
Behavioral Intentions
Attitudes & Norms
Value Orientations (basic belief
patterns)
Values
Numerous
Faster to change
Peripheral
Situation specific
Few in number
Slower to change
Central to beliefs
Transcend situations
25
Despite research that seems to support the link between environmental values and preferred
recreation activities, other studies appear to contradict this assertion. For example, Dunlap &
Hefferman (1975) explored the issue of whether involvement in outdoor recreation was
associated with environmental concern amongst the general public; results from this research
producing only weak support for this theory. Van Leire & Noe (1981) also attempted to confirm
that involvement in outdoor activities is positively associated with pro-environmental beliefs.
This was done by surveying visitors to a national seashore in North Carolina and residents of
the surrounding area. Like Dunlap & Hefferman (1975), results provided only weak support for
their hypothesis. The mixed results found in the current body of research seem to suggest that a
complex relationship between many variables is ultimately responsible for the links between
environmental values and preferred recreation activities. This demonstrates the importance of
considering tourist market segments individually when making land-use decisions, as they are
likely to differ depending on the specific characteristics of their preferred outdoor recreation
activity.
2.5.2 Recreation Setting Preferences
According to Floyd & Gramman (1997), relationships exist between the quality of recreation
experiences and the settings in which they occur. Past research has demonstrated that setting
preferences often differ between tourist market segments. For example, consumptive
recreationists (e.g. hunters, sport fishermen) are much more likely to tolerate harvested areas
than other recreationists (Paquet & Belanger, 1997). Additionally, motorized recreationists tend
to exhibit a greater acceptability for logged settings than non-motorized recreationists, which
has been documented in comparisons between snowmobilers and cross-country skiers, as well
as snowmobilers and wilderness recreationists (Hunt, et al., 2000). This demonstrates the
importance of considering a variety of user groups, when making forest management decisions
that could impact upon outdoor recreationists, as setting preferences are likely to vary according
to the activity.
It appears that differences relating to setting preferences can also exist within tourist market
segments. Past studies have demonstrated that hunters seek experiences associated with
harvesting game, along with other experiences such as nature appreciation (Decker, Brown &
Gutierrez, 1980; Hazel, Langenau & Levine, 1990). Research conducted by Floyd & Gramman
26
(1997) looked at whether hunters displayed any variability in terms of recreation setting
preferences. From the data collected four distinct hunter segments emerged which were
labelled as: non-harvesters, high-challenge harvesters, low-challenge harvesters and outdoor
enthusiasts. Each of these four groups displayed differences in desired outcomes and ultimately
preferences for different settings. For example, non-harvesters were most interested in enjoying
nature and experiencing a change in routine, whereas high-challenge harvesters considered
harvesting animals and developing hunting skills to be most important. Each segment was
shown to prefer different setting attributes depending on their desired outcomes. Based upon
this research, it seems that a range of desired outcomes can exist within certain tourism and
recreation market segments. It is possible that understanding these differences could permit
land managers to provide settings that are more likely to meet the needs of recreationists who
desire a range of different experiences.
Recreation setting preferences have also been linked to certain demographic characteristics,
which appears to correspond with some of the concepts relating to environmental values. When
environmental values are assessed, younger people tend to exhibit a biocentric perspective.
According to Hunt et al. (2000) younger individuals also have less desire to engage in outdoor
recreation within harvested areas than older people. Additionally, higher education levels have
been linked to the biocentric perspective. Biocentric individuals have also expressed a lack
desire for recreation in logged settings (Hunt et al., 2000). Based on this it appears that
individuals who hold a biocentric perspective may be less willing to recreate in logged settings
than those with anthropocentric views. This could also suggest that younger, more educated
people who hold a biocentric perspective may be more sensitive to forestry impacts around
recreation areas. If this is indeed true, it seems logical that acceptability of forestry impacts near
outdoor recreation areas will decrease with time because society as a whole is becoming more
environmentally aware (Inglehart, 2008) and educated (Altbach, Reisberg & Rumbley, 2009).
2.5.3 Landscape Perception
Past research has demonstrated that there are a number of elements associated with visual
settings that appear to influence perception of landscapes (Brown & Daniel, 1986; Bell, 1999;
Sheppard, 2004). Factors such as weather, viewing distance and observer position can all
shape an individual’s perception of landscapes. Characteristics of the land itself can also affect
27
these perceptions. For example, angle of slope, vegetation patterns and soil colour have all
been shown to influence how landscapes are perceived by the public (Sheppard, 2004). This
seems to suggest that perception of forestry practices can be at least partly managed by
understanding the impacts that are most likely to lead to negative perceptions. Once this occurs,
steps can be taken to minimize the visibility and contrast of these impacts, which could
ultimately improve tourism experiences.
The findings from past studies suggest that natural appearing landscapes are considered to be
more scenic than those that have been altered by humans. However, the difference between
natural scenes and altered landscapes is not always clear to those perceiving them. The
presence of vegetation cover has been shown to be an important feature for influencing the way
that individuals perceive landscapes (Fyhri, Jacobsen & Tommervik, 2009 ). Research
conducted by Ode, Fry, Tveit, Messager & Miller (2009) revealed that certain vegetation cover
characteristics (e.g. degree of fragmentation, shape of edges, level of succession) can influence
the ways in which people perceive landscapes. By understanding the characteristics that are
viewed most favourably it becomes possible to influence vegetation cover in a way that
minimizes negative perceptions. At the landscape level vegetation cover patterns form a mosaic
of visual elements that appear to change at various spatial and temporal scales. Aspects that
include weather, season, time of day and viewer position can all influence the way in which
elements of landscapes are perceived. The effect of spatial and temporal changes on an
individual’s perception of a landscape has the potential to be either positive or negative (Bell,
2001). Understanding the ways that individuals react to different types of alteration at various
temporal and spatial scales can increase the likelihood that land managers will make decisions
that are viewed as favourable by both locals and tourists.
The extent to which visual settings influence landscape perception have been shown to vary
between tourists and residents. In research conducted by the British Columbia Ministry of
Forests (2003), visitors to a wilderness tourism resort were surveyed to learn about their
acceptance threshold for visual disturbances in the landscape. Visitors to this resort were shown
to have a much lower acceptance threshold for landscape alteration than has been exhibited by
British Columbia residents in other perception studies. This may be partly attributed to the
nature of outdoor recreation activities that visitors were involved in, which relied heavily on intact
28
natural surroundings. However, when the British Columbia Ministry of Forests and Range
(2006) examined the differences between tourists and residents using the same photographic
scenes, tourists were also less accepting of forest alteration than residents. This demonstrates
how tourists and local residents may perceive the same landscapes in different ways. By
understanding these differences landscape managers will be better equipped to make decisions
that are less likely to impact upon the image of tourism regions that promote the natural
environment.
It has also been suggested that differences exist in the ways that recreation user groups
perceive landscapes. A study conducted by Brunson & Shelby (1992) had 95 respondents visit
an old-growth Douglas-fir stand and five nearby stands that had been harvested in the past two
years using various harvesting techniques. Participants were then asked to judge each stand’s
acceptability as a scenic landscape, as a place to hike and as a place to camp. Results showed
that sites were rated higher for scenic and hiking quality than camping quality. This suggests
that forest quality judgements may vary according to the type of activity that an individual
participates in. For many outdoor recreation activities, a scenic backdrop is considered to be an
important element influencing quality of experience. However, many other elements are also
conducive to the enjoyment of these activities. For example, flat ground is an important element
for the enjoyment of camping, despite the fact that the presence of varying topography is often
associated with improved scenic quality (Kent, 1993). Therefore, areas with flat ground may be
more attractive to campers, even if they are considered to be less scenic.
2.5.4 Forest Management
Evidence from a number of studies seem to support the notion that the general public’s
preferred forest management option lies in the middle between preservation and utilization
(Brunson, Shindler & Steel, 1997; Shindler, List & Steel, 1993; Shindler, Steel & List, 1996).
Most people recognize that landscapes must be modified to produce goods, but feel that care
should be taken to minimize the impacts of such developments. This especially seems to be
true when it comes to perceptions regarding visual impacts (McCool et al., 1986). In a review of
public perception studies, Picard & Sheppard (2001) suggest that people are more accepting of
natural appearing conditions and much less accepting of highly modified landscapes. It has
also been shown that the public finds more beauty in landscapes that exhibit intact patterns of
29
forest cover as opposed to the obvious forest opening found when clear-cutting is employed as
a harvesting method (Ribe, 2004). Findings from these studies seem to indicate that the public
is accepting of forestry as long as the associated visual impacts are minimized.
Past studies have also investigated the impact that forest management practices can have on
tourism. The British Columbia Ministry of Forests and Range (2006) conducted research that
looked at public responses to harvest practices within the province. In this study 714 British
Columbia residents and 181 tourists were surveyed. Findings revealed that tourists were less
accepting of forest harvesting than residents. Another study conducted by Hunt, Haider &
Johnson (2000) surveyed resource-based tourism operators in Ontario to learn about the
perceived impacts that forest management activities have on their businesses. Results from this
research revealed that tourism operators believed that forest harvesting operations have a high
likelihood of negatively impacting their tourism operations. This type of research highlights the
importance of forest management decision making that is responsive to the needs of the
tourism industry. If this does not occur it could potentially cause damage to the brand of tourism
businesses that rely on the natural environment to attract visitors and generate revenue.
There are policy measures that can be taken to reduce the aesthetic impacts that forestry can
have upon tourism values for places that rely upon the natural environment. In many cases
visual buffers that consist of standing timber adjacent to natural attractions may be an effective
way to minimize the visual impacts associated with forestry operations. In many instances the
presence of buffers alone is not enough to obscure the presence of forestry activities. When this
occurs harvest patterns can be designed in ways that resemble natural stand boundaries, as
this has been shown to improve the aesthetics and reduce the visibility of harvested areas in
many cases. Partial harvesting can also be used to minimize the visual impact of forestry in
areas that rely on the aesthetic values of natural landscapes. This allows for harvesting to occur
while maintaining the forested appearance of areas frequented by tourists. By employing these
types of principles to forest management in regions that rely on the natural environment to
attract tourists, forestry would be less likely to impact upon tourism values, which could
ultimately reduce conflict between these two industries (Ontario Ministry of Natural Resources,
2001).
30
Attempts have been made in some jurisdictions to reduce conflicts that can occur between the
forestry and the resource-based tourism industry. For example, the Ontario Ministry of Natural
Resources (2001) developed a set of forest management guidelines to assist with the planning
of forestry operations in areas of the province’s forests which are used for both forestry and
tourism. These guidelines summarise management options to be considered when developing
prescriptions in forest management plans which could affect resource-based tourism interests.
Under the Crown Forest Sustainability Act (CFSA) 1994, individuals who are responsible for
preparing forest management plans are required to consult with these guidelines. Despite the
presence of these plans, many critics within the tourism industry view them to be ineffective,
due to a lack of proper implementation (Hunt, et al., 2000b).
2.5.5 Theory Synthesis
Synthesis of the theories discussed can be used to help address the first research question by
providing insight into the influence that forestry can have on tourism image in regions that
market the natural environment. They may also be used to address the second research
question by explaining differences that may be found between tourist market segments.
Despite the apparent relevance of tourist gaze, these ideas are similar to those presented within
destination image theory. Urry (2002) states that the objects tourists expect to gaze upon are
those that are commonly depicted in post cards and other forms of promotional media. The idea
that marketing images motivate individuals to visit specific destinations and form expectations
has also been documented in the destination image literature (Mercille, 2005; Tasci & Kozak,
2006; Sirgy & Su, 2000; Buzinde, Santos & Smith, 2006; Beerli & Martin, 2004b). Additionally,
Urry (2002) argues that objects of the gaze that do not meet expectations will likely have a
negative impact upon the tourist experience. This is similar to the idea that presented by
Jenkins (1999), which states that the most negative evaluation of a destination is likely to occur
when a positive pre-trip destination image is followed by a visitor experience that does not
match the image portrayed in promotional media (see Figure 2).
Various aspects of the tourist performance theory can also be explained through the use of
destination image literature. Like tourist performance, destination image theories go beyond
31
visual aspects to include more active dimensions of a destination, such as the recreation
opportunities available (Obenour, Groves & Lengfelder, 1991). Because tourists evaluate
destinations based on the types of leisure they would like to engage in, the types of recreation
opportunities promoted have the potential to significantly impact destination image (Ahmed,
1996). However, the tourist gaze and performance theories only account for the visual images
and activities associated with a particular destination. The strength of destination image theory
is that it considers other elements that contribute to the overall tourist experience. These may
include, but are not limited to, tourist facilities, infrastructure, nature and culture.
Despite the extensive theory development associated with tourist gaze, no reliable methods
were able to be identified in the literature that could be used to help operationalize this theory.
However, destination image has been the subject of considerable research within the tourism
industry over the past four decades (Gallarza, Saura & Garcia, 2002). Due to the wide breadth
of coverage given to the elements that shape tourist experience and the prevalence of survey
methods used to measure destination image, it seems that this theory is most suitable for
analyzing the effects that visitor experience has on tourism image. Therefore, destination image
theory will be used to guide theoretical development and data collection methods.
Ultimately the goal of this investigation is to learn about the effect that forest management
practices have on the perceptions of tourists who visit regions that market the natural
environment. Therefore, it is important to understand the factors that help to shape destination
image. As mentioned previously, the two primary elements that relate to destination image are
pre-visit and post-visit destination image. The image that a particular destination portrays to
potential visitors can affect an individual’s subjective perception, consequent behaviour and
ultimately destination choice (Gallarza et al., 2001). However, an individual’s pre-visit
destination image is often different from their post-visit destination image. This is because pre-
visit destination image is based upon secondary sources, whereas post-visit destination image
is based on first-hand experience (Beerli & Martin, 2004b). Since negative evaluations of
destinations are often associated with positive expectations followed by a negative experience,
tourism managers must ensure that the images promoted accurately reflect scenes that tourists
are likely to encounter throughout their trip. If this does not occur it can result in negative
publicity, which could have a detrimental impact on the tourism destination as a whole.
32
Theories related to pre-visit destination image can help to explain some of the factors that
motivate tourists to visit specific places. For example, personal characteristics, such as age,
gender and occupation can all play important roles in shaping the pre-visit image that tourists
have of specific destinations (Beerli & Martin, 2004a). Other factors that can help shape an
individual’s pre-visit destination image include tourism marketing images, prior knowledge
(Beerli & Martin, 2004b), and distance between home residence and destination (Gallarza et al.,
2001). By understanding these factors, tourism practitioners can gain insight into how a
destination is perceived by their target markets.
To learn about the effect that forestry can have on the tourism image for destinations that
market the natural environment, it is also important to understand the elements that determine
visitor satisfaction. This is because post-visit destination image is determined by the degree to
which visitor experience matches pre-visit expectations. If an individual’s visitor experience
matches their expectations they are likely to be satisfied. Public perception literature has
demonstrated that the sustainability of land management practices is important for determining
public acceptance of forestry (Wagner et al., 1998; Kearney, 2001). Research has also shown
that tourists tend to be less accepting of altered landscapes than local residents (British
Columbia Ministry of Forests and Range, 2006). Therefore, it seems logical that forest
management practices could affect destination image for regions that promote the natural
environment, due to the expectations that are formed by tourism marketing material.
Because an individual’s environmental values play such an important role in determining
whether or not forestry practices are considered to be acceptable (Wagner et al., 1998), it
seems likely that this could also impact on post-visit destination image for places that market the
natural environment to potential visitors. Past research has shown that environmental values
are partly determined by certain personal characteristics (Bengston, Webb & Fan, 2004).
Therefore, understanding of the demographic characteristics that influence environmental
values, could give an indication as to how certain individuals are likely to view forest practices in
destinations that promote the natural environment.
33
Links between environmental values and preferred recreation activities have also been
suggested in past research (Dunlap & Hefferman, 1975; Carls, 1980; Wall, 1982). However, the
mixed results found within the body of research appear to suggest that these links are highly
dependent upon a variety of factors that are activity specific. While some outdoor activities
appear to correspond with specific values, others do not. This suggests that the use of broad
classifications (e.g. eco-tourists) to help define tourist segments is less desirable than
considering user groups individually (e.g. back country hikers). Therefore, a specific
management solution that may be suitable for one segment may not be ideal for others (Vaske,
Kiriakos, Cottrell & Khuong, 2009). If forest managers are able to better understand the desires
of various user groups it will help them to provide experiences that meet expectations. This is
because recreation setting attributes have been shown to have an influence on quality of
experience (Floyd & Gramman, 1997; Manfredo, Driver & Brown, 1983; Decker, et al., 1980).
Relationships also exist between recreation setting preference and quality of experience (Floyd
& Gramman, 1997). Past studies have shown that setting preferences regularly differ when
comparing tourist market segments (Paquet & Belanger, 1997; Hunt et al., 2000). This suggests
that certain tourist market segments would be impacted differently than others when exposed to
forest industry impacts. However, it is important to note that differences also exist within tourist
market segments. These differences tend to be dependent upon the desired outcomes of the
recreationist (Floyd & Gramman, 1997). For example, the primary outcome for some
recreational fishermen is to catch fish, whereas others are more concerned with relaxation and
nature-enjoyment. By understanding differences in recreation setting preferences natural
resource managers will be able to better predict the reaction that certain visitors will have when
exposed to various forest management options.
According to landscape perception theory, visual impacts have the potential to influence the
ways that individuals perceive various settings (Brown & Daniel, 1986; Bell, 1999; Sheppard,
2004). Because setting attributes can influence quality of experience it seems likely that these
principles could be used to help understand how forestry practices could impact upon tourist
experience and ultimately destination image. Since certain forest management practices
produce more noticeable impacts to the landscape than others, it seems that they would also be
likely to affect tourist experience most. This is especially true for user groups who are most
34
susceptible to having their experience influenced by recreation setting attributes. Therefore, the
use of landscape perception theory could potentially help to explain which forest treatments are
most likely to be perceived negatively by tourists.
An illustration of how the theoretical framework relates to the research objective of identifying
the type of impact that forestry can have on destination image in places that market the natural
environment is presented in Figure 4. Arrows with solid lines indicate links documented in the
literature presented, while arrows with dotted lines indicate links that will be probed in this
research. The framework suggests that forest management practices, setting preferences and
landscape perceptions all play a role in shaping visitor experience and ultimately post-visit
destination image. Some of the factors that help shape visitor experience (i.e. setting
preferences) cannot be influenced by tourism or forestry managers. However, forest
management practices could influence certain elements of the visitor experience. By
understanding the ways in which forest management practices can affect the tourism
experience it would likely provide benefits to the tourism industry.
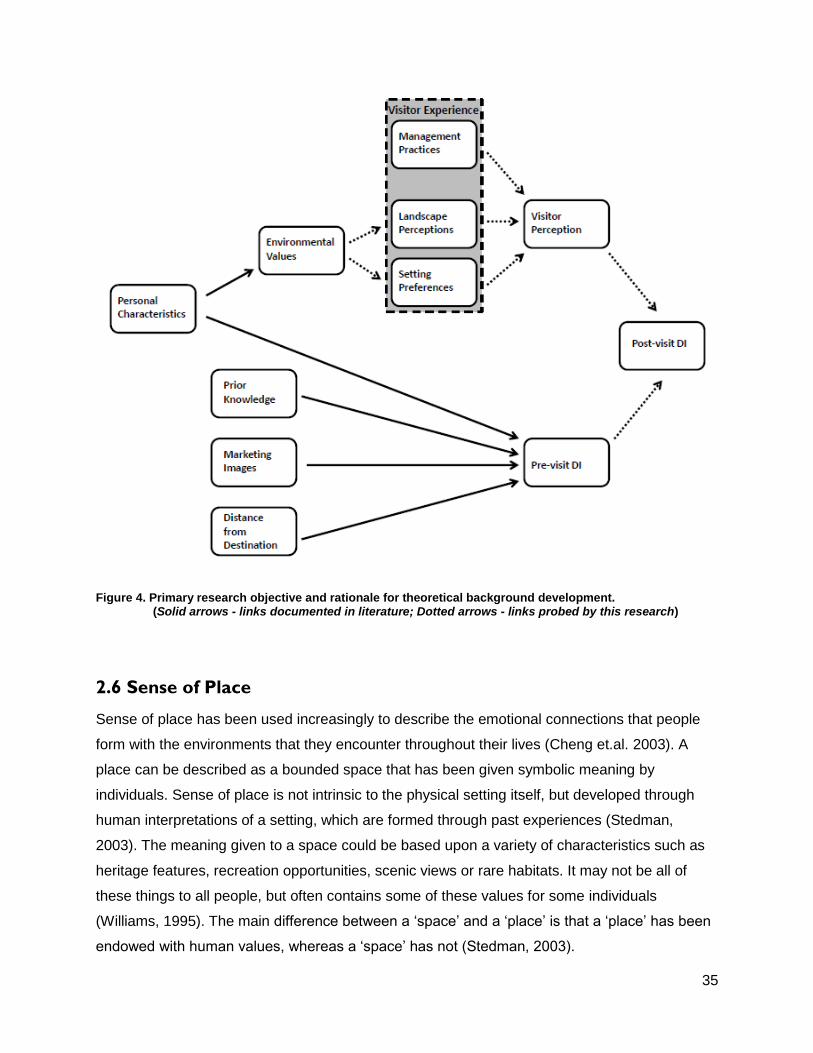
35
Figure 4. Primary research objective and rationale for theoretical background development. (Solid arrows - links documented in literature; Dotted arrows - links probed by this research)
2.6 Sense of Place
Sense of place has been used increasingly to describe the emotional connections that people
form with the environments that they encounter throughout their lives (Cheng et.al. 2003). A
place can be described as a bounded space that has been given symbolic meaning by
individuals. Sense of place is not intrinsic to the physical setting itself, but developed through
human interpretations of a setting, which are formed through past experiences (Stedman,
2003). The meaning given to a space could be based upon a variety of characteristics such as
heritage features, recreation opportunities, scenic views or rare habitats. It may not be all of
these things to all people, but often contains some of these values for some individuals
(Williams, 1995). The main difference between a ‘space’ and a ‘place’ is that a ‘place’ has been
endowed with human values, whereas a ‘space’ has not (Stedman, 2003).
36
Past research has demonstrated that there are many different factors that can play roles in
shaping an individual’s sense of place. Factors that influence place meaning can be classified
into three separate categories. Social and cultural meanings inform ideas, beliefs and values
that shape an individual’s view of the world. These meanings can play an important role in
constructing the attachments that people form with places (Cheng et al., 2003). Social and
political processes are also important aspects in shaping place meaning. These may include
factors relating to political ideologies and economic/social class. (Young, 1999). Along with
these factors, the biophysical characteristics and processes of a specific place can also have an
important influence on the emotional connections that people form with it. For example, the
presence of unique features (Shindler et al., 2002) or proximity of a place to an individual’s
residence are both important factors in determining the degree of place attachment one feels
towards a specific location (Eisenhauer, Krannich & Blahna, 2000).
Although distinct from one another, each of the three factors that play a role in the determination
of place meaning, overlap in most locales. For example, a national park includes elements of
the social and cultural meaning realm (e.g., evaluations of aesthetic qualities), the social and
political process realm (e.g., management actions) and biophysical characteristics and process
realm (e.g., flora/fauna, hydrological/geological processes). It is the interaction between these
elements that determine a locations ‘place meaning’ (Young, 1999). However, one must
consider that the three factors mentioned can differ between individuals, as well as groups of
individuals. This generally results in the emergence of a variety of place meanings associated
with an individual location, which can contribute to the land management conflicts that have
become so prevalent in today’s society (Cheng et al., 2003).
Because sense of place describes the emotional connections that people form with the
environments they encounter it seems as though local residents would be more likely than
visitors to form deep emotional connections to landscapes. However, modern globalized
lifestyles have lead to a highly mobile population, with individuals who spend significant
amounts of time in many different regions. This results in place bonds and social connections
that extend over large geographic areas. Because many tourists have spent time in a variety of
destinations, this group seems more likely to develop emotional connections with places that
are farther away from their homes (Budruk, Wilhelm-Stanis, Schneider & Anderson, 2001).
37
Therefore, resource managers should try to consider the emotional connections that visitors
form with certain landscapes, as this could help to maximize repeat visitation and word of mouth
promotion, resulting in economic benefits to local communities.
When considering sense of place it is also important to acknowledge the differences in meaning
given to places by tourists, as opposed to residents. Past research suggests that both tourists
and local residents can experience a high degree of place attachment (Hall, Farnum, Slider &
Ludlow, 2009; Kianicka, Buchecker, Hunziker & Muller-Boker, 2006). However, these two
groups seem to experience place in different ways. Sense of place for local residents tends to
be primarily shaped by aspects of everyday life, such as occupation, property ownership and
especially social relationships. Memories of childhood and youth are important factors that help
shape sense of place for this group. For tourists sense of place is shaped by the aesthetics and
characteristics of the place, which are often experienced in the context of leisure activities.
Therefore, the activities through which these places are experienced have a significant impact
on the way that tourists construct their sense of place (Kianicka et al., 2006).
There is also variation in the ways that different types of tourists experience place. This may be
based on a variety of factors. For example, the number of different places visited and amount of
time spent in a given place appears to affect level of attachment. Tourists who have spent
significant time at a specific destination over many trips are likely to have stronger place
attachment than those visiting for the first time (Bricker & Kerstetter, 2000). Furthermore,
frequency and type of use seems to have an influence on the meaning that recreationists and
tourists give to specific places. For example, tourists who participate in highly specialized
recreation activities, such as hunting, tend to show significant attachment to the places where
they engage in these activities (Williams, Patterson, Roggenbuck & Watson, 1992). The type of
experiential outcome that the tourist hopes to achieve also plays a role in the way that place
attachment is formed. An eco-tourist with an interest in tropical ecology is likely to experience a
place like Costa Rica differently than a backpacker who is motivated by a desire to relax on the
beach (Young, 1999). Because of the many factors that can influence place meaning for
tourists, one must consider the types of experiences they desire when making decisions that
impact on a destination’s sense of place.
38
The sense of place theory could be useful for land management agencies, as place can affect
how people determine the appropriateness of management objectives (Bricker & Kerstetter,
2000). Therefore, consideration of this concept can provide managers with an indication about
how certain management actions may be perceived by the public (Shindler et al., 2002). This is
because the interpretation of place provides an indication of the various attachments that
individuals, local communities and other stakeholders have towards different environments
(Knudson, Cable & Beck, 2003). Therefore, one could expect that a better understanding of
place would allow management agencies to adopt strategies that could increase public
acceptance of land management policies and actions. The following sections will discuss some
of the challenges of integrating this concept into land management then propose ways in which
better integration may be achieved.
2.6.1 Sense of Place Application Challenges
Despite the apparent significance of sense of place, it seems that it often gets overlooked by
decision-makers. There are a few explanations of why this may be the case. Sense of place is
based upon the emotional connections that people form with environments that they encounter.
Traditionally emotions have been studied from either a biological, cultural or social perspective.
However, these perspectives tend to fall on either side of the division between nature and
culture. Therefore, these approaches have failed to recognize that emotions bridge this division,
as they can be considered to be both biological and cultural (Milton, 2005). Because emotion
and meanings can be analysed from many different perspectives, it likely makes them more
difficult to apply to land management decision making.
Another reason that sense of place may not get much consideration by land managers is the
difficulty in applying the concept in practice. As mentioned above, a single place can hold many
different meanings, because individuals prescribe different meanings to the same place.
Therefore, making decisions based on this concept can prove to be quite difficult. Because of
this, decision making is often based on more traditional measures, such as ‘yield’ or ‘use’, which
tends to be easier to measure than individual place meanings. However, many societies value
natural resources in ways that are not as easily measured by these more traditional measures
(Williams, 1995) (e.g. spiritual, cultural or emotional connections). Therefore, application of the
39
sense of place concept by land managers has the potential to result in policies which are more
reactive to specific concerns that may be raised by the public.
Some land managers may be reluctant to integrate the sense of place concept into decision
making due to some of the limitations identified. A major problem with sense of place is that the
concept can be equated with whether or not a locale is special. However, many places are
considered to be special by individuals and the meanings given to specific places by people
often contradict each other. These differing perceptions can make application of the place
concept quite difficult. Additionally, places that carry special meanings may not be particularly
important for ecological functions (Shindler et al., 2002). This can result in cases where land
managers must make decisions based on whether to preserve those locales that perform
valuable ecological functions or those that hold special place meaning to local residents.
Although not commonly practiced, aspects of the sense of place theory have been applied to
resource management situations in the past. For example the United States Department of
Agriculture, Forest Service (USFS) employs a Visual Quality Management System (VQMS) to
identify visual-quality management objectives for specific geographic locations (Williams &
Patterson, 1999). However, this technique only considers the visual aspect of place and
neglects things such as cultural heritage, recreation opportunities and rare habitats. A set of
procedures and standards known as the Recreation Features Inventory was developed by the
British Columbia Ministry of Forests (1998a) to help managers go beyond visual resources and
consider the recreation values of natural features within a local context. This document provides
guidelines to assist with the identification of significant recreation features, which can then be
used to help develop higher level plans that better address recreation values. Although the
place concept is not explicitly mentioned within this document, it does consider ideas found
within the sense of place literature, including the recreation values and uniqueness of an area.
However, it still fails to specifically address the sense of place concept.
In an attempt to better incorporate the place concept into land use planning a project was
undertaken by the USFS with the aim of considering place meaning and attachment, along with
biophysical data, to help guide policy development in Washington and Oregon. This is done by
40
inviting participants to workshops, where they are asked to identify places throughout the region
that have different value sets associated with them. The information gathered through this
process was used to construct maps detailing place meanings and values as described by the
participants. This can then be used by resource managers to help improve land management
(Hall et al., 2009). Other planning and management frameworks that recognize the relationships
between people and place include the Recreation Opportunity Spectrum (ROS) and Limits of
Acceptable Change (LAC) framework (Budruk et al., 2001). It is likely that increased use of
these types of frameworks would allow managers to better integrate emotional connections into
resource management decision making.
2.6.2 Place Based Governance
Despite the difficulties associated with integrating sense of place into land management
decision making, there are some additional ways in which such integration can be achieved. A
place-based approach to governance has been identified as a possible way to help overcome
some of the obstacles associated with integrating place into resource management decisions.
This approach seeks to engage the public in the decision making processes by utilizing local
and regional place-based identities which can help to promote a local sense of place without the
constraint of political boundaries (Edge & McAllister, 2009). This is similar to the idea of
transactive planning, which allows stakeholders to bring their experiences and personal
knowledge of local conditions to the planning process (Wray, 2011). Place-based governance
puts emphasis on the collaborative process by eliciting the opinions of local residents. This is
much different from the ‘one size fits all’ planning models which have dominated natural
resource management in the past. These approaches recognize the bonds people form with
certain places and the importance of incorporating these meanings into land management
decisions (McIntyre, Moore & Yuan, 2008).
Place-based governance requires decision-makers to understand the diverse individuals,
communities and interests that reside within a particular place (Edge & McAllister, 2009). In
order to facilitate this understanding it is important to elicit the opinions of stakeholders, which
can be useful in identifying where certain ecosystem management practices may be considered
unacceptable or inappropriate (Shindler et al., 2002). This approach is also likely to leave
decisions less open to public criticism, as local residents would know that their concerns were at
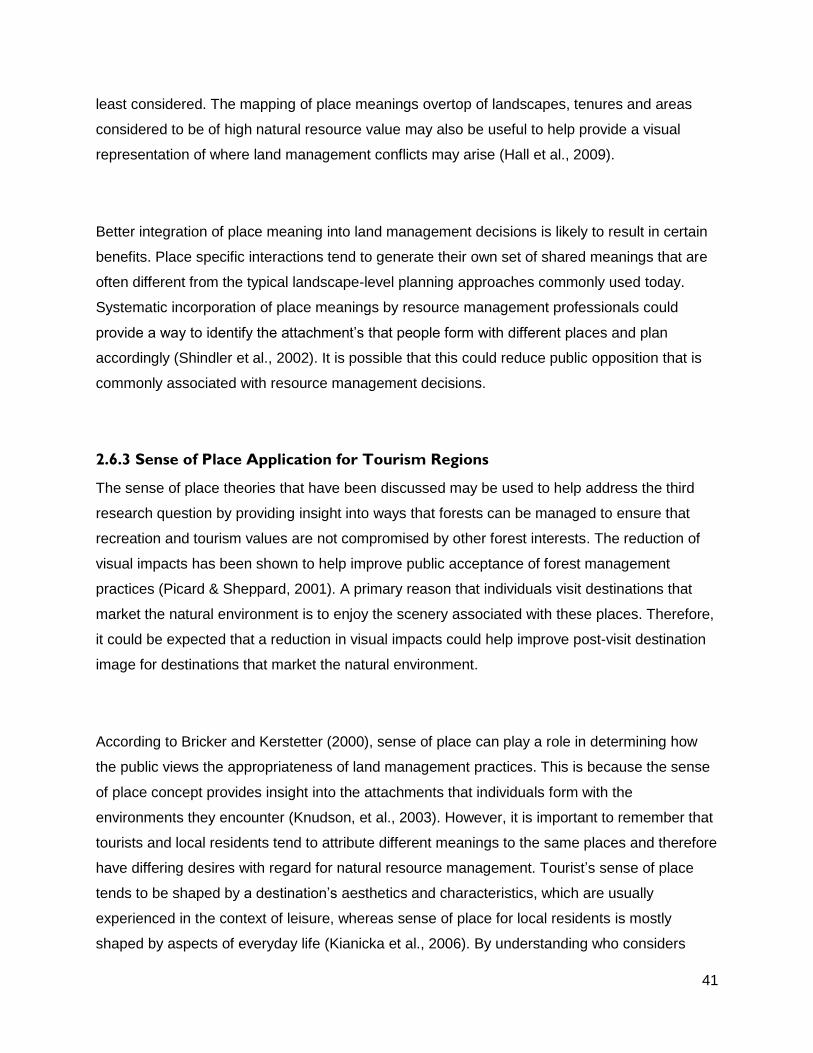
41
least considered. The mapping of place meanings overtop of landscapes, tenures and areas
considered to be of high natural resource value may also be useful to help provide a visual
representation of where land management conflicts may arise (Hall et al., 2009).
Better integration of place meaning into land management decisions is likely to result in certain
benefits. Place specific interactions tend to generate their own set of shared meanings that are
often different from the typical landscape-level planning approaches commonly used today.
Systematic incorporation of place meanings by resource management professionals could
provide a way to identify the attachment’s that people form with different places and plan
accordingly (Shindler et al., 2002). It is possible that this could reduce public opposition that is
commonly associated with resource management decisions.
2.6.3 Sense of Place Application for Tourism Regions
The sense of place theories that have been discussed may be used to help address the third
research question by providing insight into ways that forests can be managed to ensure that
recreation and tourism values are not compromised by other forest interests. The reduction of
visual impacts has been shown to help improve public acceptance of forest management
practices (Picard & Sheppard, 2001). A primary reason that individuals visit destinations that
market the natural environment is to enjoy the scenery associated with these places. Therefore,
it could be expected that a reduction in visual impacts could help improve post-visit destination
image for destinations that market the natural environment.
According to Bricker and Kerstetter (2000), sense of place can play a role in determining how
the public views the appropriateness of land management practices. This is because the sense
of place concept provides insight into the attachments that individuals form with the
environments they encounter (Knudson, et al., 2003). However, it is important to remember that
tourists and local residents tend to attribute different meanings to the same places and therefore
have differing desires with regard for natural resource management. Tourist’s sense of place
tends to be shaped by a destination’s aesthetics and characteristics, which are usually
experienced in the context of leisure, whereas sense of place for local residents is mostly
shaped by aspects of everyday life (Kianicka et al., 2006). By understanding who considers
42
certain places to be special and why, it would improve the ability of forest management
agencies to plan their activities in a way that considers the attachments people form with certain
areas. One might expect that this could help to reduce the impact that forestry has on tourism
values in places that market the natural environment.
Although integrating the sense of place concept into natural resource management can be
difficult, a place-based approach to management and governance is a possible solution for
overcoming these difficulties. By utilizing local and regional place-based identities, decisions are
more likely to reflect the meanings that the public ascribes to these places. As mentioned
previously, place meanings are partly influenced by an individual’s values (Cheng et al., 2003).
Environmental values are determined in part by an individual’s affiliation with industry (Abrams
et al., 2005; Brown & Harris, 1992). Therefore, one might expect that a significant proportion of
residents in regions that promote the natural environment would exhibit a high degree of place
attachment to landscapes that appear intact and natural. By integrating place meaning into
resource management decisions in regions where nature-based tourism and outdoor recreation
activities are considered to be important by locals it may help to preserve the tourism values
that are most important to a region. This could ultimately improve destination image. An
illustration of how integrating the place meanings of local residents into decision making could
help preserve tourism values is presented in Figure 5.
Figure 5. Integration of local resident place-meanings into management solutions that reflect tourism values.
2.7 Vancouver Island and Tasmania Resource Conflict in the Media
Destination image is an expression of an individual’s knowledge, impressions, prejudice and
emotions in relation to a particular place (Jenkins, 1999). To help attract visitors tourism
Residents Affiliated with
Tourism Industry
Environmental Values
Place Meanings
Place-based Management Solutions that
Reflect Tourism Values
43
managers attempt to portray destinations in a way that matches the desires of the targeted
market (Sirgy & Su, 2000). However, tourism managers do not have complete control over the
messages that may influence potential visitors. The way that a region is portrayed in the media
may also affect destination image (Mercille, 2005). Therefore, regions that promote the natural
environment to attract visitors and generate tourism revenue are likely vulnerable to the effects
of high-profile environmental conflicts that get played out in the media. This is especially true for
those conflicts that gain international coverage. Therefore, the following sections will discuss
some of the high-profile environmental conflicts in both Vancouver Island and Tasmania that
have received international attention. According to destination image theory, coverage of such
events could potentially influence the perceptions of potential visitors, ultimately affecting the
tourism industry.
2.7.1 Carmanah/Walbran Conflict (Vancouver Island)
The Carmanah and Walbran Valley’s were at the epicentre of an important conflict relating to
forestry and environmental values in Vancouver Island during the late 1980’s and early 1990’s.
In the spring of 1988 two members of the Western Canada Wilderness Committee (WCWC)
discovered that MacMillan Bloedel logging operations were moving toward stands of giant Sitka
Spruce located in the Carmanah Valley (Wilson, 1998). Upon learning about MacMillan
Bloedel’s plans to move into the valley the Sierra Club of Western Canada (SCWC) and the
Heritage Forests Society developed a public brief that was presented to the provincial
government calling for protection of the entire Carmanah Valley with an immediate moratorium
of the construction of logging roads. These actions combined with public pressure convinced
MacMillan Bloedel to stop road construction in the area. It was during this time that they
discovered the tallest known tree in Canada, which also turned out to be the world’s largest
recorded Sitka Spruce. This tree became known as the Carmanah Giant and stood
approximately ninety-five meters in height (Tindall & Begoray, 1993).
This discovery convinced MacMillan Bloedel to release a proposal that would establish two
reserves surrounding the largest Sitka Spruce protecting about ninety-nine hectares (Wilson,
1998) and covering approximately 1.4 percent of the valley. Environmental groups criticized
these plans and called for the preservation of the entire valley to help reduce the negative
effects associated with erosion and wind. In an attempt to draw attention to the area the WCWC
44
printed 8000 copies of a poster glorifying the area and began construction of a hiking trail into
the valley. In response MacMillan Bloedel sought a British Columbia Supreme Court injunction
to stop trail construction in the area. This was ultimately dismissed on the grounds that the
public has the right to access Crown Lands that are under a Tree Farm License (Tindall &
Begoray, 1993). Upon the trail’s completion hundreds of people began hiking into the valley,
which could easily be reached from Victoria by road (Wilson, 1998).
The WCWC campaign to protect the Carmanah Valley included the creation and distribution of a
news publication dedicated to the issue, additional posters, a collection of artworks and a video
that was narrated by David Suzuki. The video, along with the publications, posters and artworks
reached a surprisingly wide audience, further publicizing the issue. According to WCWC
estimates more than 2 million copies of their publication were distributed. In addition to this, the
poster sold more than 20 000 copies and the art book sold 15 000 copies within a year. During
this time the WCWC increased its sponsorship of scientific research into old growth ecosystems
and constructed a platform in one of the area’s trees to help facilitate scientific research.
Protests were also held at the legislature by environmental groups, as well as forest workers
and their supporters (Wilson, 1998). By this point the issue began receiving national attention
with the federal Environment Minister Lucien Bouchard expressing the opinion that logging
should be delayed pending further investigation and the delivery of a petition calling for full
preservation to the House of Commons that was signed by more than 18 000 people (Tindall &
Begoray, 1993).
In April 1990 the Provincial Minister of Forests announced that the lower half of the Carmanah
Valley would become a 3600 hectare provincial park. However, logging would still be allowed to
take place in the upper part of the valley. Not surprisingly the WCWC was happy with this result
(Wilson, 1998). The decision also gained international attention when Jup Weber, a forest
engineer and Luxembourg Green Party MP visited BC in 1990. He was said to be appalled by
the Government’s decision to allow harvesting to take place in the upper half of the valley
(Stanbury, 2000). In response to government’s decision the WCWC began increasing their
sponsorship of research activities and expanding their trail network into the upper reaches of the
valley. During this research the first known nest of the threatened marbled murrelet was
45
discovered further strengthening the case for preservation of the entire valley (Wilson, 1998)
(Stanbury, 2000).
During this time an area known as the Walbran located immediately south of Carmanah was
also gaining significant attention when members of the Carmanah Forest Society began building
trails in this area. Fletcher Challenge who controlled most of the rights in this area attempted to
gain public support through an extensive public information campaign, Despite these efforts,
their attempt to construct roads in the valley during the summer of 1991 were met with a
blockade and protests. Many of these protesters were members of the Environmental Youth
Alliance who had travelled from across Canada to employ a number of direct action tactics such
as fasting and tree perching (Wilson, 1998). The issue even received attention as far away as
New Zealand where a protest vigil was held outside the offices of the parent company to
Fletcher Challenge Canada (Stanbury, 2000).
In response to conflicts within the Carmanah and Walbran Valley’s, as well as other areas, the
Commission on Resources and the Environment (CORE) was formed. Its purpose was to give
communities and other stakeholders a voice in regional land use planning and recommend
lands for protection within some of the more contentious areas in the province. One of the
organization’s first activities was to initiate a land use planning process for all of Vancouver
Island, which would become known as the Vancouver Island Land Use Plan. This plan
recommended an expanded park in the Carmanah/Walbran area, which ultimately became the
Carmanah Walbran Provincial Park and includes the entire Carmanah Valley and most of the
Walbran Valley’s lower portion (Hanna, et al., 2008).
2.7.2 Clayoquot Sound (Vancouver Island)
One of the most high profile environmental conflicts in Canadian history took place in Clayoquot
Sound during the late 1980’s and early 1990’s. The earliest campaigns to restrict logging in the
area took place during the 1970’s. By the early 1980’s residents of Tofino and the nearby Nuu-
chah-nulth First Nations started to voice their concerns about logging in the area. They were
particularly concerned about plans to log Meares Island, which is located close to Tofino and the
nearby First Nations settlement of Ahousat. This resulted in a land use planning process that
46
included a recommendation calling for the exclusion of harvesting from the portion of Meares
Island most visible to Tofino. After MacMillan Bloedel expressed their disagreement with this
recommendation the provincial Cabinet also decided to reject the outcome. This ultimately led to
resentment within local communities and would set the stage for a larger conflict that would gain
media attention both nationally and internationally (Hanna et al., 2008).
Some of the first forestry blockades in British Columbia history occurred in 1984 and 1985 when
MacMillan Bloedel attempted to begin logging on Meares Island. Eventually the Nuu-chah-nulth
were able to obtain an injunction that resulted in a suspension of logging on the island (Hanna
et al., 2008). By the late 1980’s the local First Nations groups (Wilson, 1998), as well as
environmental groups expanded the scope of their campaign to include the entire Clayoquot
Sound area (Hanna, et al., 2008). This growing movement was a reflection of local residents
who were attracted to the area’s natural beauty and lifestyle during the 1960’s and 1970’s. Many
of these people eventually became active players in the local tourist industry owning a variety of
companies including whale-watching charters, kayak stores and other small businesses that
became reliant upon the visitors attracted by the region’s natural beauty (Wilson, 1998).
Tension began to rise when local residents discovered landslides caused by the construction of
logging roads north of Tofino. Representatives from the Friends of Clayoquot Sound met with
officials from BC Forest Products and the Ministry of Forests. However, it failed to significantly
alter the company’s plans. This resulted in the initiation of blockades by the Friends of
Clayoquot Sound in June 1988, which ultimately led to arrests (Wilson, 1998). In response to
increasing blockades and growing public interest in the area the government initiated a land use
planning process for the Clayoquot Sound region. However, environmental groups viewed the
process as being flawed and favouring the forest industry. In 1993 the provincial government
attempted to implement findings from the land use planning process (Hanna, et al., 2008). It
called for the permanent protection of one third of the land within Clayoquot Sound. However,
45% of the area would still be available for logging and other forms of resource extraction
(Stanbury, 2000).
47
In response to this announcement the WCWC employed a similar tactic that was used in the
Carmanah conflict and constructed a trail to bring additional visitors in the area (Stanbury,
2000). This was accompanied by large scale protests and blockades during the summer of
1993, which ultimately led to the arrest of approximately 850 people (Hanna, et al., 2008).
Those taking part in the blockades came from a wide variety of backgrounds and included
individuals such as NDP MP Svend Robinson and Paul Staes who was a Belgian Green Party
representative in the European Parliament. Those arrested included a 72 year old Judith
Robinson and two young boys aged 11 and 12 who had their parents take them to the protests
(Stanbury, 2000). Eventually the action by environmental groups led to an extensive national
and international media campaign that included calls for a boycott of products from forest
companies that were operating in the area (Hanna, et al., 2008).
Through discussions with the Nuu-Chah-Nulth Tribal Council an interim agreement was
developed that provided for a cooperative land-management plan between the government and
native groups. The Scientific Panel for Sustainable Forest Practices in Clayoquot Sound was
also created with the purpose of developing a sustainable forest management plan for the area.
The advisory panel completed its final set of recommendations for forestry in Clayoquot Sound
in April 1995 (Lavallee & Suedfeld, 1997). These included significant changes to forestry in the
area, including the elimination of clear-cut logging practices (Hanna, et al., 2008). It also called
for a departure from conventional methods used in the development and approval of logging
plans. Difficulties with adopting recommendations given by the advisory panel has since put a
stop to logging operations in the region for the most part (Lavallee & Suedfeld, 1997). Today the
region has become one of the most iconic nature-based tourism destinations in all of British
Columbia.
2.7.3 Franklin-Gordon Dam (Tasmania)
One of the more notable environmental conflicts in Australian history, the Franklin-Gordon Dam
dispute, began in 1979 when the Hydro-Electric Commission of Tasmania (HEC) released its
Report on the Gordon River Power Development Stage 2 (Aiken & Leigh, 1986). Stage 1 of the
development had just been completed, submerging Lake Pedder, despite the area’s status as a
National Park (Bandler, 1987). This evoked a public outcry from conservationists who objected
to the flooding of this area, due to its scenic values, endemic species and unique quartzite sand
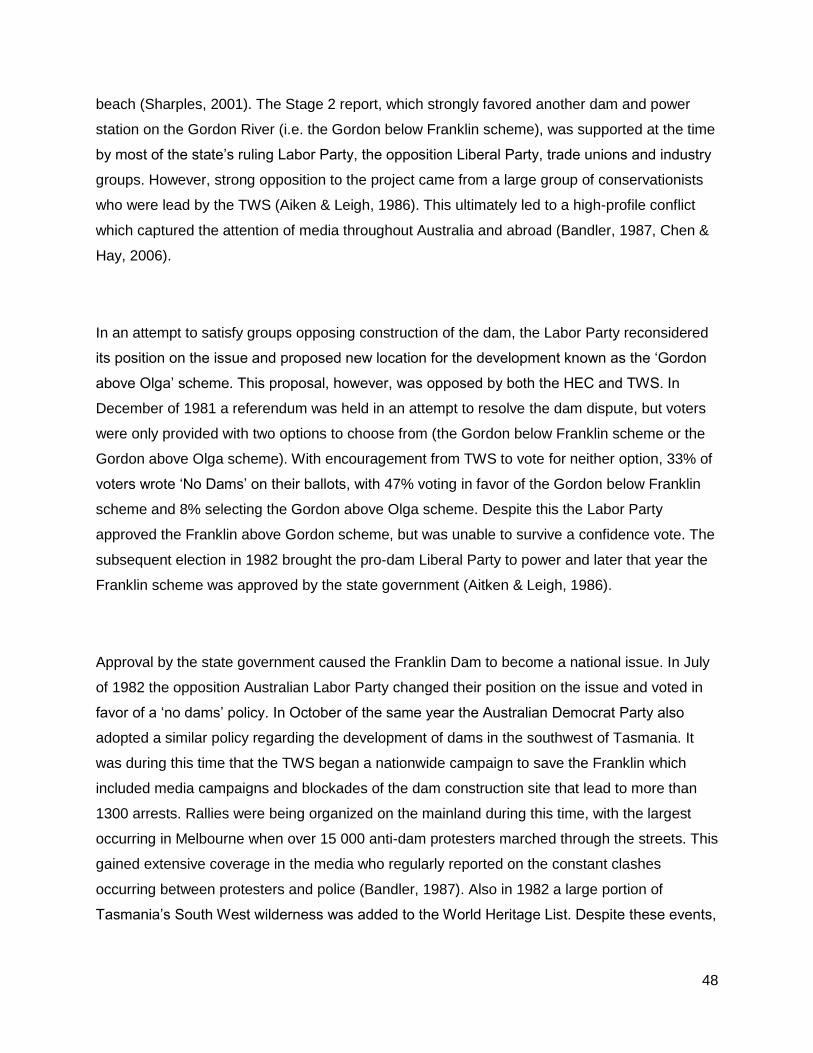
48
beach (Sharples, 2001). The Stage 2 report, which strongly favored another dam and power
station on the Gordon River (i.e. the Gordon below Franklin scheme), was supported at the time
by most of the state’s ruling Labor Party, the opposition Liberal Party, trade unions and industry
groups. However, strong opposition to the project came from a large group of conservationists
who were lead by the TWS (Aiken & Leigh, 1986). This ultimately led to a high-profile conflict
which captured the attention of media throughout Australia and abroad (Bandler, 1987, Chen &
Hay, 2006).
In an attempt to satisfy groups opposing construction of the dam, the Labor Party reconsidered
its position on the issue and proposed new location for the development known as the ‘Gordon
above Olga’ scheme. This proposal, however, was opposed by both the HEC and TWS. In
December of 1981 a referendum was held in an attempt to resolve the dam dispute, but voters
were only provided with two options to choose from (the Gordon below Franklin scheme or the
Gordon above Olga scheme). With encouragement from TWS to vote for neither option, 33% of
voters wrote ‘No Dams’ on their ballots, with 47% voting in favor of the Gordon below Franklin
scheme and 8% selecting the Gordon above Olga scheme. Despite this the Labor Party
approved the Franklin above Gordon scheme, but was unable to survive a confidence vote. The
subsequent election in 1982 brought the pro-dam Liberal Party to power and later that year the
Franklin scheme was approved by the state government (Aitken & Leigh, 1986).
Approval by the state government caused the Franklin Dam to become a national issue. In July
of 1982 the opposition Australian Labor Party changed their position on the issue and voted in
favor of a ‘no dams’ policy. In October of the same year the Australian Democrat Party also
adopted a similar policy regarding the development of dams in the southwest of Tasmania. It
was during this time that the TWS began a nationwide campaign to save the Franklin which
included media campaigns and blockades of the dam construction site that lead to more than
1300 arrests. Rallies were being organized on the mainland during this time, with the largest
occurring in Melbourne when over 15 000 anti-dam protesters marched through the streets. This
gained extensive coverage in the media who regularly reported on the constant clashes
occurring between protesters and police (Bandler, 1987). Also in 1982 a large portion of
Tasmania’s South West wilderness was added to the World Heritage List. Despite these events,
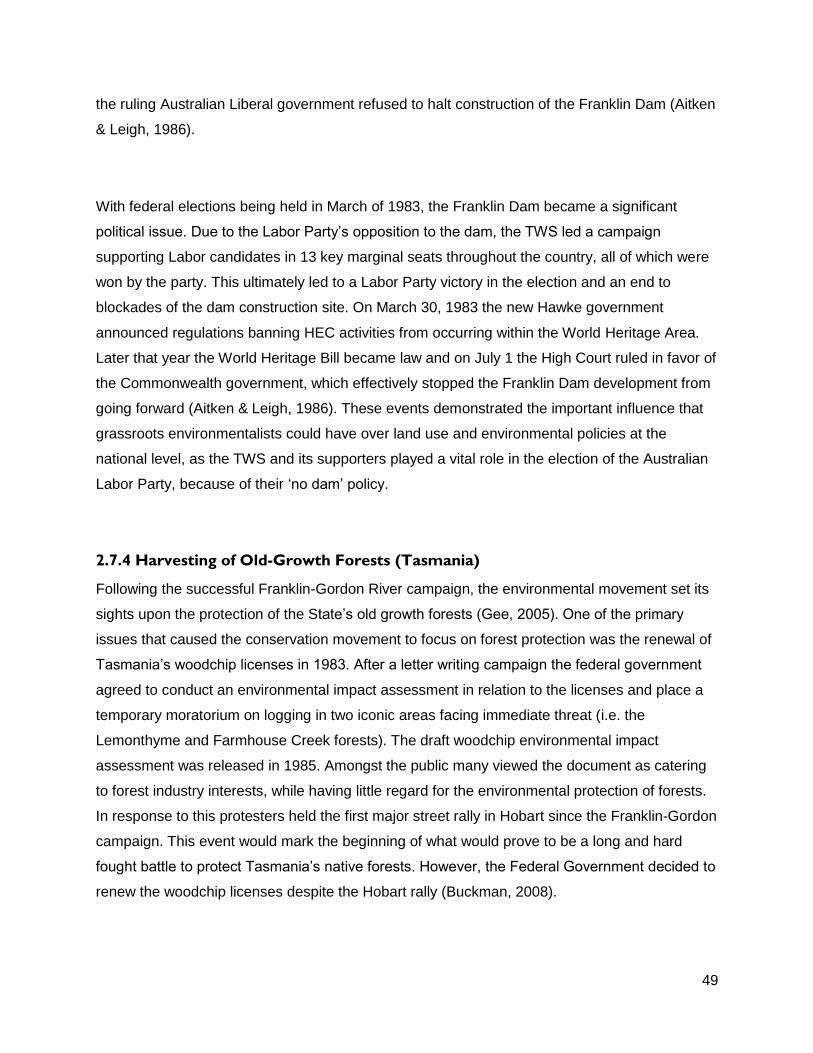
49
the ruling Australian Liberal government refused to halt construction of the Franklin Dam (Aitken
& Leigh, 1986).
With federal elections being held in March of 1983, the Franklin Dam became a significant
political issue. Due to the Labor Party’s opposition to the dam, the TWS led a campaign
supporting Labor candidates in 13 key marginal seats throughout the country, all of which were
won by the party. This ultimately led to a Labor Party victory in the election and an end to
blockades of the dam construction site. On March 30, 1983 the new Hawke government
announced regulations banning HEC activities from occurring within the World Heritage Area.
Later that year the World Heritage Bill became law and on July 1 the High Court ruled in favor of
the Commonwealth government, which effectively stopped the Franklin Dam development from
going forward (Aitken & Leigh, 1986). These events demonstrated the important influence that
grassroots environmentalists could have over land use and environmental policies at the
national level, as the TWS and its supporters played a vital role in the election of the Australian
Labor Party, because of their ‘no dam’ policy.
2.7.4 Harvesting of Old-Growth Forests (Tasmania)
Following the successful Franklin-Gordon River campaign, the environmental movement set its
sights upon the protection of the State’s old growth forests (Gee, 2005). One of the primary
issues that caused the conservation movement to focus on forest protection was the renewal of
Tasmania’s woodchip licenses in 1983. After a letter writing campaign the federal government
agreed to conduct an environmental impact assessment in relation to the licenses and place a
temporary moratorium on logging in two iconic areas facing immediate threat (i.e. the
Lemonthyme and Farmhouse Creek forests). The draft woodchip environmental impact
assessment was released in 1985. Amongst the public many viewed the document as catering
to forest industry interests, while having little regard for the environmental protection of forests.
In response to this protesters held the first major street rally in Hobart since the Franklin-Gordon
campaign. This event would mark the beginning of what would prove to be a long and hard
fought battle to protect Tasmania’s native forests. However, the Federal Government decided to
renew the woodchip licenses despite the Hobart rally (Buckman, 2008).
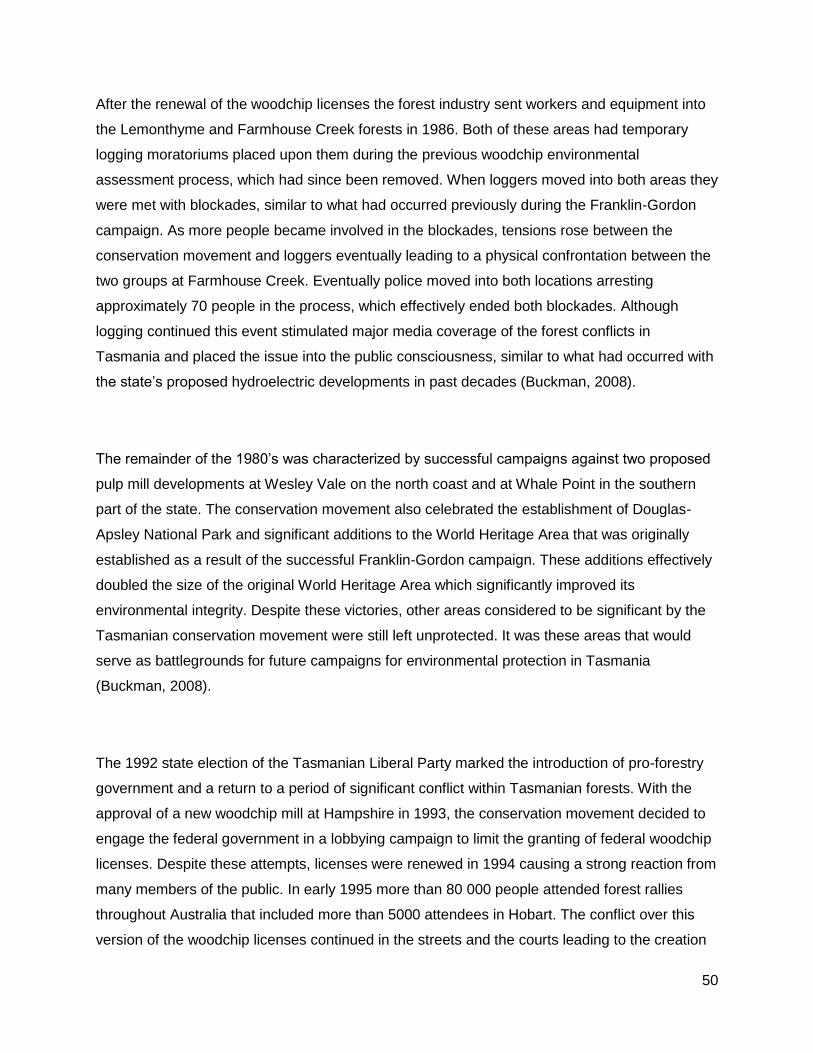
50
After the renewal of the woodchip licenses the forest industry sent workers and equipment into
the Lemonthyme and Farmhouse Creek forests in 1986. Both of these areas had temporary
logging moratoriums placed upon them during the previous woodchip environmental
assessment process, which had since been removed. When loggers moved into both areas they
were met with blockades, similar to what had occurred previously during the Franklin-Gordon
campaign. As more people became involved in the blockades, tensions rose between the
conservation movement and loggers eventually leading to a physical confrontation between the
two groups at Farmhouse Creek. Eventually police moved into both locations arresting
approximately 70 people in the process, which effectively ended both blockades. Although
logging continued this event stimulated major media coverage of the forest conflicts in
Tasmania and placed the issue into the public consciousness, similar to what had occurred with
the state’s proposed hydroelectric developments in past decades (Buckman, 2008).
The remainder of the 1980’s was characterized by successful campaigns against two proposed
pulp mill developments at Wesley Vale on the north coast and at Whale Point in the southern
part of the state. The conservation movement also celebrated the establishment of Douglas-
Apsley National Park and significant additions to the World Heritage Area that was originally
established as a result of the successful Franklin-Gordon campaign. These additions effectively
doubled the size of the original World Heritage Area which significantly improved its
environmental integrity. Despite these victories, other areas considered to be significant by the
Tasmanian conservation movement were still left unprotected. It was these areas that would
serve as battlegrounds for future campaigns for environmental protection in Tasmania
(Buckman, 2008).
The 1992 state election of the Tasmanian Liberal Party marked the introduction of pro-forestry
government and a return to a period of significant conflict within Tasmanian forests. With the
approval of a new woodchip mill at Hampshire in 1993, the conservation movement decided to
engage the federal government in a lobbying campaign to limit the granting of federal woodchip
licenses. Despite these attempts, licenses were renewed in 1994 causing a strong reaction from
many members of the public. In early 1995 more than 80 000 people attended forest rallies
throughout Australia that included more than 5000 attendees in Hobart. The conflict over this
version of the woodchip licenses continued in the streets and the courts leading to the creation
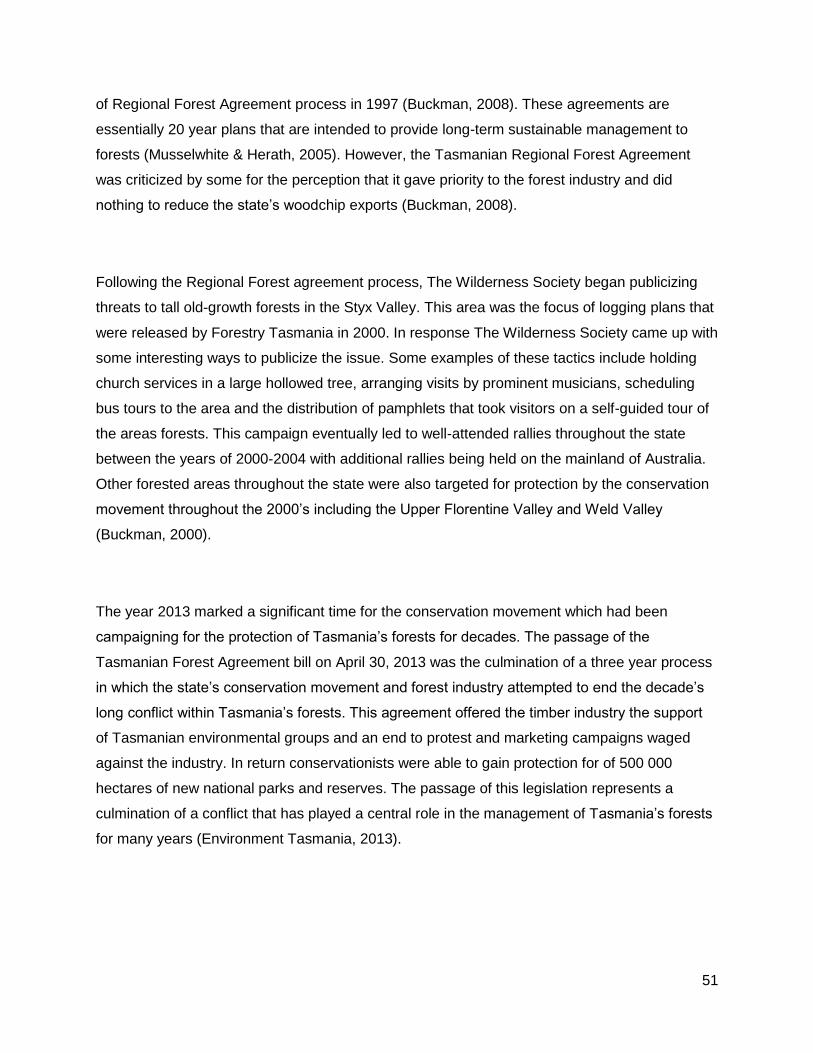
51
of Regional Forest Agreement process in 1997 (Buckman, 2008). These agreements are
essentially 20 year plans that are intended to provide long-term sustainable management to
forests (Musselwhite & Herath, 2005). However, the Tasmanian Regional Forest Agreement
was criticized by some for the perception that it gave priority to the forest industry and did
nothing to reduce the state’s woodchip exports (Buckman, 2008).
Following the Regional Forest agreement process, The Wilderness Society began publicizing
threats to tall old-growth forests in the Styx Valley. This area was the focus of logging plans that
were released by Forestry Tasmania in 2000. In response The Wilderness Society came up with
some interesting ways to publicize the issue. Some examples of these tactics include holding
church services in a large hollowed tree, arranging visits by prominent musicians, scheduling
bus tours to the area and the distribution of pamphlets that took visitors on a self-guided tour of
the areas forests. This campaign eventually led to well-attended rallies throughout the state
between the years of 2000-2004 with additional rallies being held on the mainland of Australia.
Other forested areas throughout the state were also targeted for protection by the conservation
movement throughout the 2000’s including the Upper Florentine Valley and Weld Valley
(Buckman, 2000).
The year 2013 marked a significant time for the conservation movement which had been
campaigning for the protection of Tasmania’s forests for decades. The passage of the
Tasmanian Forest Agreement bill on April 30, 2013 was the culmination of a three year process
in which the state’s conservation movement and forest industry attempted to end the decade’s
long conflict within Tasmania’s forests. This agreement offered the timber industry the support
of Tasmanian environmental groups and an end to protest and marketing campaigns waged
against the industry. In return conservationists were able to gain protection for of 500 000
hectares of new national parks and reserves. The passage of this legislation represents a
culmination of a conflict that has played a central role in the management of Tasmania’s forests
for many years (Environment Tasmania, 2013).

52
2.8 Regulatory Framework
Past natural resource management conflicts in Vancouver Island and Tasmania have played an
important role in shaping the land use decision making process in both of these places. The
following section will detail the regulatory framework surrounding forest management in
Vancouver Island and Tasmania.
2.8.1 Vancouver Island
To help address the growing number of forest management conflicts in British Columbia during
the early 1990’s CORE was created with the purpose of improving resource management, while
giving stakeholders a voice in regional land use decision making processes (Hanna et. al.,
2008). A commitment to public enquiry and disclosure helped to reinforce the goal of improving
legitimacy of the land use decision making process (Mason, 1997). CORE would act as an
independent advisor to the cabinet for land use strategies and related resource management
issues, as well as facilitator for regional planning, community based participation and dispute
resolution (Wilson, 1998). CORE also embraced economic, environmental and social
sustainability principles, even making direct reference to international sustainable development
protocols. (Mason, 1997)
Soon after its establishment CORE set out to create regional negotiation processes in areas
that had been identified as having a high degree of land use conflict (Mason, 1997). This
ultimately led to four regional processes being launched in Vancouver Island, Cariboo-Chilcotin,
East Kootenays and West Kootenays-Boundary with the purpose of creating land use plans for
each of these areas (Wilson, 1998). With these processes officials from CORE hoped to
implement a shared decision making approach (Cashore, Hoberg, Howlett, Rayner & Wilson,
1998). However, each of the four regional processes were characterized by a wide diversity of
interests being represented, which ultimately prevented full consensus from being achieved at
any. Despite the collapse of the Vancouver Island process, a set of recommendations were
prepared and the Vancouver Island Land Use Plan was delivered in February of 1994 (Wilson,
1998).
53
With the introduction of new protected areas, as well as land’s that would be zoned as
‘regionally significant’, it was estimated that the original Vancouver Island Land Use Plan would
result in a reduction of 6 percent in overall island harvest levels. This led to a hostile reaction
from forestry dependent communities throughout Vancouver Island. In response the
government launched an effort to adapt the original Vancouver Island Land Use Plan into a
version that would be more acceptable to the forest industry, while accelerating efforts to devise
a transition plan for workers. A revised version of the plan was released to the public in June of
1994 with provisions to help address the concerns that had been raised by forestry workers.
Despite the government’s indication that this version of the plan would be final, its release
marked the start of further negotiations that mainly centered around the designation and
boundaries of protected areas. In April of 1995 the government released its final version of the
Vancouver Island Land Use Plan (Wilson, 1998). However, consensus was never achieved and
the results of the plan can be likened to a broad multi-use plan with the additional inclusion of
some protected area designations (Hanna et. al. 2008).
The Vancouver Island Land Use Plan does have certain provisions that are able to help protect
or enhance tourism and recreation values. For example, Special Management Zones were
established in certain areas where scenic, recreation and other natural values have been given
management priority. The protection of these types of values has direct benefits to the nature-
based tourism industry, due to its reliance on scenery, nature and outdoor recreation
opportunities. Additionally, a number of new protected areas were created as a result of the
Vancouver Island Land Use Plan. The establishment of these new parks helped to further
enhance the scenic and natural values of Vancouver Island (British Columbia, 2000)
strengthening nature-based tourism values.
The principle of equal representation was central during the creation of CORE and the
Vancouver Island Land Use Plan (Hanna, et. al., 2008). It could be argued that certain elements
of the four regional planning processes that arose from CORE followed similar principles to
those discussed within place based governance theory. For example, public involvement was
an important feature of the four regional planning processes that were undertaken by CORE.
This idea is also central to place-based governance theory, as a way to help ensure that land
management decision making reflects local and regional place-based identities (Edge &
54
McAllister, 2009). However, the difficulties experienced while trying to achieve consensus during
the four regional planning processes speak to the challenges that can be associated with
integrating place meanings into the land management decision making process.
In 1996 CORE was ended with the province handing over much of the land use and resource
planning to various government agencies (Hanna et. al. 1996). Despite its short time in
operation, CORE was an ambitious attempt to improve dispute resolution throughout the
province of British Columbia (Mason, 1997). However, it has been suggested that one of the
problems with CORE was the fact that recommendations from the government often seemed
very different from what was being said during the consultation process (Burrows, 2000).
Although the establishment of CORE and the subsequent regional planning processes did
receive criticism, they were also responsible for reducing tensions between opposing sides by
promoting a better understanding of other perspectives amongst stakeholders (Wilson, 1998).
It is important to note the exclusion of Clayoquot Sound from the Vancouver Island Land Use
planning process. This is because forest management issues surrounding this area were being
addressed through a separate planning process that was taking place around the same time
(Hanna et. al., 2008). Because of forest management issues that were specific to this part of
Vancouver Island an advisory panel was established that would be independent of government.
The panel was given the task of assessing the environmental effects of a sustainable forest
management plan that would be developed for the area. This group was known as the Scientific
Panel for Sustainable Forest Practices in Clayoquot Sound. In 1995 the advisory panel brought
forth its final set of recommendations for forestry within the Clayoquot Sound area (Lavallee &
Suedfeld, 1997). Therefore, it was these principles that were used to help guide forest
management in the Clayoquot Sound region of Vancouver Island, rather than the Vancouver
Island Land Use Plan.
Due in part to the efforts of environmental groups who brought international attention to their
old-growth forest protection campaign, the Forest Practices Code was developed and enacted
into the legislature in July 1994 (Wilson, 1998). Its introduction was designed to help address a
number of issues associated with forest management including poor stewardship, inadequate
55
monitoring and enforcement, as well as weak penalties for violators (Malkinson, 2011).
Therefore, some defining features of the Forest Practices Code included an emphasis upon
improved environmental protection and world class forest practices, as well as the introduction
of stiff enforcement penalties. When the code was introduced the Minister of Forests stated that
the introduction of the Forest Practices Code would ensure that ecological requirements would
drive forest management decision making (Cashore et. al., 2001). Like the Vancouver Island
Land Use Plan, it is likely that environmental provisions within the Forest Practices Code also
provided benefits to the nature-based tourism industry.
Despite the environmental benefits associated with the Forest Practices Code, certain
drawbacks were also identified. For example, the British Columbia Forest Practices Board
(2006) accused the code of being too prescriptive and preventing innovation from occurring
within the forest sector. Additionally, the Forest Practices Code was criticized for placing
additional administrative burden upon government staff (Reader, 2006), as well as increasing
financial costs to both government and industry. To help overcome some of these issues the
Forest and Range Practices Act was introduced in 2004 replacing the Forest Practices Code
(Malkinson, 2011).
Often described as a ‘results-based’ approach to forest management regulation (British
Columbia Forest Practices Board, 2006), the Forest and Range Practices Act currently governs
forest management within the province of British Columbia. Although it still tries to articulate a
vision of stewardship, the new approach shifts the focus from forest management processes to
the achievement of desired results. This allows tenure holders to design their own regulatory
regimes that are tenure-specific, provided that they meet the specified government
management objectives (Reader, 2006). These objectives can relate to a wide range of forest
resource values and may consider things like timber, soils, community watersheds, visual
quality and cultural heritage resources (British Columbia Forest Practices Board, 2006). Under
the Forest and Range Practices Act tenure holders are required to develop Forest Stewardship
Plans (Malkinson, 2011). The purpose of these plans is to describe how licensees will meet
specific government objectives that have been established for the area. Despite helping to
reduce costs and streamlining the management process, certain deficiencies have been
identified. For example, Forest Stewardship Plans have been criticized for their complexity.
56
Additionally, Forest Stewardship Plans are the only plans in which the public has a legislated
right to review and provide comment. According to the British Columbia Forest Practices Board
(2006), this limited review period is not appropriate.
2.8.2 Tasmania
Unlike Vancouver Island, there is no specific plan in Tasmania that governs land use throughout
the island. However, the Tasmanian government introduced a framework in 1993 called the
Tasmanian Resource Management and Planning System. The main purpose of this system is to
describe the policy and regulatory arrangements that apply for the use and development of land
and natural resources within the state (Cradle Coast Authority, 2010). Objectives of the
Tasmanian Resource Management and Planning System include the promotion of sustainable
resource development, encouragement of public involvement in decision making and the
facilitation of economic development (NRM South, 2010). As part of the Tasmanian Resource
Management and Planning System a series of regional land use strategies were created to
guide coordination between local planning schemes and provide a regional perspective for the
use and development of natural resources. Although these documents do not allocate land uses
to specific areas they do provide a policy framework that helps to guide land use activities
(Cradle Coast Authority, 2010). The Tasmanian Resource Management and Planning System
does encourage public involvement in the decision making process. This suggests that there is
an opportunity for local place meanings to be incorporated into regional land use strategies.
However, the degree to which this actually occurs is not known.
Forestry Tasmania is a government business enterprise that has been entrusted with the
stewardship of approximately 1.5 million hectares of State forest located on public land
throughout Tasmania (Forestry Tasmania, 2012). The Management Decision Classification is a
zoning system used by Forestry Tasmania to express the legal status of the land it manages
and facilitate the management of competing demands for land use. This system identifies two
levels of zoning which include primary zones and special management zones. Primary zones
classify land according to its availability for timber production. Land within these zones is
categorized to define whether it will be managed primarily for production or protection. Special
management zones identify areas where management priority extends to specific values that
are also considered to be of importance. The range of values that may be considered is
57
reflected in the wide variety of special management zone categories that are available, including
agricultural, water, cultural heritage, recreation, flora and fauna (Forestry Tasmania, 2011). The
presence of this classification system provides evidence that Forestry Tasmania management
priorities go beyond timber production. Because the Management Decision Classification is a
formalized a system providing protection to values important for nature-based tourism, it is likely
that its use does benefit the tourism industry in Tasmania to some degree.
In Tasmania the Forest Practices Act was established in 1985 with the purpose of providing a
consolidated legal framework for forest management in the state. Under this legislation the
Forest Practices Authority was established to act as Tasmania’s governing body for forest
management. Additionally, a requirement of the Forest Practices Act was the development and
implementation of the Forest Practices Code, which details forest management requirements
that are applicable to both private and public forests (McDermott, Cashore & Kanowski, 2007).
The Forest Practices Code was developed through extensive consultation and public comment
with periodic reviews occurring to incorporate new suggestions from scientists, government,
industry and the public. The main purpose of these forest management requirements is to help
ensure that forestry is conducted in a manner that provides for the long-term maintenance of
natural and cultural values (Forest Practices Authority, 2010a). The Forest Practices Code is
supported by numerous technical guides and planning manuals that cover a wide range of
topics including flora, fauna, visual resource management, cultural heritage and silviculture
practices (McDermott, Cashore & Kanowski, 2007). Because it does provide protection for
features that are important for nature-based tourism, the Tasmania Forest Practices Code
inherently provides benefits to the tourism industry.
Forest Practice Plans are required for most forest practices on both public and private land.
These plans must be prepared in accordance with the Forest Practices Code, as well as other
legislation. In this context the term ‘forest practices’ refers to a wide range of activities including
forest clearance, timber harvesting and even firewood collection in some cases (McDermott,
Cashore & Kanowski, 2007) These documents provide specific details about the forest
operation including the location of boundaries, roads, landings and bridges. Forest Practice
Plans also contain prescriptions for the protection of natural and cultural values (Forest
Practices Authority, 2010a). The Forest Practices Authority maintains a policy of communication
58
in relation to Forest Practice Plans. Provisions within this policy require consultation with local
government in relation to operations that could affect local water quality or areas zoned for
landscape protection (Forest Practices Authority, 2010b). Before operation begins Forest
Practice Plans must be certified by the Forest Practices Authority to ensure that they meet
requirements (Forest Practices Authority, 2010a).
The federal government in Australia also plays a role in the development of forest policy. As a
response to increasing forest use conflicts Regional Forest Agreements were developed in the
1990’s as a way to integrate national and international forest management priorities into state
and local legislation. These agreements were partly designed around the Montreal Process
Criteria and Indicators for the Conservation and Sustainable Management of Temperate and
Boreal Forests. The Tasmania Regional Forest Agreement was signed in 1997 helping to
ensure that economic, social and environmental values all receive consideration during the
forest management decision making process (McDermott, Cashore & Kanowski, 2007). Despite
the apparent environmental benefits associated with the Tasmania Regional Forest Agreement
it has also received some criticism. Opponents have claimed that this agreement has given
priority to forest interests and done nothing to reduce woodchip exports. The Regional Forest
Agreement was also denounced by some for a perception that it allowed for very little genuine
public input. In spite of this criticism, the Tasmania Regional Forest Agreement was responsible
for additional protection of significant forests as well as the expansion of already existing
national parks (Buckman, 2008). Therefore, it is likely that certain outcomes may have provided
benefits to the state’s nature-based tourism industry.
The Tourism and Forestry Protocol Agreement also influences the way that forests are
managed in Tasmania. This voluntary agreement was signed between Forestry Tasmania,
Tourism Industry Council of Tasmania, Forest Industries Association of Tasmania and Private
Forests Tasmania. Initially implemented in 2003 the purpose of this agreement is to help
facilitate communication, consultation and liaison between the forestry and tourism industries.
This is done through meetings, briefings, stakeholder consultation and information sharing.
Within the agreement a set of guidelines were developed to advise conflict resolution for many
of the common issues that arise between forestry and tourism (sightline planning, controlled
burns, forestry access roads, transportation, branding and education). Compliance requirements
59
outline relevant rules, legislation, codes and policies that are enforceable. Additional
commitments that have been made by all parties to facilitate co-operation between forestry and
tourism are also outlined in this document (TICT, FT, FIAT & PFT, 2009). Even though the
agreement itself is not governed by any specific laws or acts, it does provide a useful tool to
help improve communication and understanding between the tourism and forest industries,
which is something that often lacks in other regions where these two industries conflict.
2.8.3 Summary
There are some significant differences to be noted between Vancouver Island and Tasmania in
terms of the regulatory frameworks that surround the tourism and forest industries. Firstly,
Vancouver Island is governed by the Vancouver Island Land Use Plan, which was a product of
CORE. A key feature of this planning process was a shared decision making approach that
attempted to achieve consensus among stakeholders. Due to the diversity of interests present,
no consensus was met. However, the nature of the planning process meant that concerns from
a wide range of interest groups were at least heard during the process. Unlike Vancouver
Island, there is no single land use plan that covers the entire island of Tasmania. However, the
Tasmanian Resource Management and Planning System describes relevant policy and
regulatory arrangements that apply to the development of natural resources. As part of this
system a series of regional land use strategies have been created to help guide natural
resource planning. A primary objective of the Tasmanian Resource Management and Planning
System is the encouragement of public involvement in the decision making process (NRM
South, 2010). Despite their differences, it appears that the planning systems within Vancouver
Island and Tasmania both allow for the integration of place-based meanings. However, further
investigation would be required to understand the degree to which this has actually occurred.
Some interesting differences were also noted in the forest policy regulatory approaches of the
two case study regions. According to McDermott, Cashore and Kanowski (2007), the forest
policy structure within Tasmania is quite prescriptive when compared to other regions. This is
much different from the British Columbia’s Forest and Range Practices Act, which is often
described as a results-based approach (British Columbia Forest Practices Board, 2006).
Prescriptive methods tend to lay out certain steps that must be taken in order to achieve a
specific management objective, whereas a results-based approach allows for a more flexibility

60
as long as objectives are achieved in the final outcome. Although a prescriptive approach was
used in British Columbia until 2004 with the Forest Practices Code, it was criticized for
increasing administrative burden and financial costs and eventually replaced by the less
prescriptive Forest and Range Practices Act (Reader, 2006; Malkinson, 2011).
Finally, the Tourism and Forestry Protocol Agreement was developed with the purpose of
facilitating communication and consultation between the tourism and forest industries in
Tasmania. This voluntary agreement was signed between major tourism and forest industry
stakeholder groups and provides guidelines to help advise during conflict resolution for many of
the issues that commonly arise between forestry and tourism. This appears to be a useful tool
for improving cooperation between the two industries. No equivalent agreement currently exists
for Vancouver Island, or British Columbia as a whole, to help facilitate consultation between
forestry and tourism.
61
Chapter 3
Research Methods
3.1 Introduction
This research seeks to describe the relationship between forest management practices and
tourist preferences in destinations that market the natural environment and the outdoor activities
that take place in these settings. It also attempts to uncover measures that can be used to
better manage the conflict that often occurs between forestry and tourism. Therefore, several
data collection methods were identified as appropriate for this investigation. In many cases,
research that investigates the social world is best approached through the use of qualitative
research methods (Kraus & Allen, 1997). These methods are especially useful for researchers
who seek to answer questions about how a social experience is created and given meaning
(Denzin & Lincoln, 2000) Therefore, a large portion of this research utilized qualitative
approaches. However, quantitative techniques were also used in the construction of research
instruments and analysis of the data.
Both qualitative and quantitative research methods have unique characteristics, as well as
inherent strengths and weaknesses. For example, quantitative research techniques rely heavily
on standardized data collection and statistical analysis making these methods particularly useful
for theory/hypothesis testing, explanation and prediction. Qualitative methods, on the other
hand, tend to be less standardized than most quantitative techniques. This makes them
particularly useful for induction, exploration and theory/hypothesis generation (Johnson &
62
Onwuegbuzie, 2004). Mixed method research designs involve the collection, analysis and
interpretation of both quantitative and qualitative data in an attempt to understand the same
underlying phenomenon (Leech & Onwuegbuzie, 2009).
One of the major benefits associated with mixed methods research is that it allows the
investigator to draw on the strengths and minimize weaknesses associated with quantitative or
qualitative techniques when used individually (Johnson & Onwuegbuzie, 2004). In theory this
will help the researcher to achieve complimentary results, by using the strengths of each
method to enhance the other. Mixed methods also allow for triangulation of results, which
involves the combination of two or more data sources to study the same research problem. This
allows the researcher to gain a more complete understanding of the problem under investigation
(Sale, Lohfeld & Brazil, 2002). Therefore, a mixed methods design was used for this research.
3.2 Comparative Case Study
Conflict between the tourism and forestry industries is a common issue in parts of the world
where these two sectors contribute to regional economies. However, it is likely that certain
aspects of this conflict and the measures taken to address these conflicts differ from region to
region. Therefore, this investigation utilized a comparative case study method to gain a better
perspective. This method is particularly useful for the investigation of global industries, such as
tourism, because it better allows for researchers to develop generalizations and test theories
(Pearce, 1993). Two regions where conflict between these industries is evident are Vancouver
Island, Canada and Tasmania, Australia. Therefore, these two locations were identified as
suitable settings for a study of this nature.
3.2.1 Case Study Regions
Vancouver Island and Tasmania are useful for analysis because of their many similarities and
differences. Both forestry and tourism play important roles in the economies of both places
(Tourism British Columbia, 2009a; Felmingham, et al., 2010). Benefits provided by these
industries include the generation of tax revenue and foreign exchange dollars, as well as the
creation of jobs. Both regions also market a variety of natural features and outdoor activities to
63
attract visitors. This is demonstrated in the ‘Supernatural British Columbia’ (Tourism British
Columbia, 2010) and ‘Pure Tasmania’ (Pure Tasmania, 2010) marketing campaigns. However,
forestry also relies on these same natural features to harvest timber and generate profits. It is
these fundamental differences in resource use that ultimately lead to the conflicts that can occur
between forestry and tourism in destinations that market the natural environment to potential
visitors.
Despite the similarities that exist between these two places, there are also a number of
significant differences. It is these differences that will likely provide the most insight into the
impact that forestry can have on tourism image and how this can be minimized. One of the most
notable differences between the two study regions is the degree to which forestry has become
involved in the development of tourism attractions. Forestry Tasmania is somewhat unique as a
forest management agency because of the extent to which it has pursued tourism developments
within state forests. According to the Forestry Tasmania tourism and recreation policy, the
organization is committed to providing recreation and tourism opportunities that raise awareness
of forests and sustainable forest management (Forestry Tasmania, 1999). This is being
accomplished through the development of various tourism sites throughout the state including
the Tahune Airwalk, Styx Big Tree Reserve, Tarkine Forest Adventures and Arm River
Education Reserve. Like Tasmania, the forestry industry in Vancouver Island has also
developed tourism sites, such as the Jordan River Recreation Site. However, this has been
carried out on a much smaller scale.
Another significant difference between the two study regions is the degree to which forestry and
tourism consult with one another. In Tasmania, this has been partly facilitated by the Tourism-
Forestry Protocol Agreement, which was implemented in 2009. This agreement was made
between Forestry Tasmania, Tourism Industry Council Tasmania, Forest Industries Association
of Tasmania and Private Forests Tasmania with the purpose of facilitating communication and
consultation between the involved parties at both a strategic and operational level (TICT, FT,
FIAT & PFT, 2009). Unlike Tasmania, very few provisions have been made on a formal level to
help facilitate cooperation between forestry and tourism in British Columbia. The absence of this
type of agreement is likely to result in decisions being made that are less sensitive to the needs
of other sectors.
64
3.3 Questionnaire
Surveys are a useful and efficient tool for learning about people’s opinions. This method allows
researchers to estimate the characteristics of a large population with confidence by collecting
information from a sample within that population (Dillman, Smyth & Christian, 2009). Surveys
also allow for a large amount of data to be collected within a relatively short period of time
(Kraus & Allen, 1997). For these reasons survey methods are ideal for situations where a
significant amount of data is needed and it is impractical for the researcher to gather information
from each member of a population. Because this particular research requires opinions from a
large number of individual’s survey methods were utilized.
A questionnaire was developed to address research question number one (i.e. impact that
forestry practices can have upon tourist perceptions in regions that market the environment) and
learn how forestry is viewed by tourists and how this may ultimately impact upon destination
image. It also helped to address research question two (i.e. are certain tourist segments
affected differently by the impacts of forestry in regions that market the natural environment) by
providing insight into the ways that different user groups are affected by forest practices. The
questionnaires were then administered at tourism attractions throughout both study areas.
Different attraction types were selected in order to learn what effect forest practices have on
various user groups. The questionnaire attempted to uncover visitor perspectives on forest
management issues by administering questions relating to personal opinions, past experiences
and demographic characteristics. To help reduce the likelihood of researcher influence
questionnaires were self-completed in the absence of researchers and deposited into a drop
box upon completion. The questionnaire was composed of nine sections, which are described
below.
3.3.1 Sample Design
The questionnaire was administered at various tourist sites in order to solicit opinions from
visitors at natural attractions. This strategy was chosen to help control some of the factors that
may have influenced responses to certain questions (e.g. physical setting, time of year, stage of
tourist experience, etc.). Due to the importance of capturing a diverse set of visitors, an
entry/exit intercept method was used to recruit participants. The second research question is
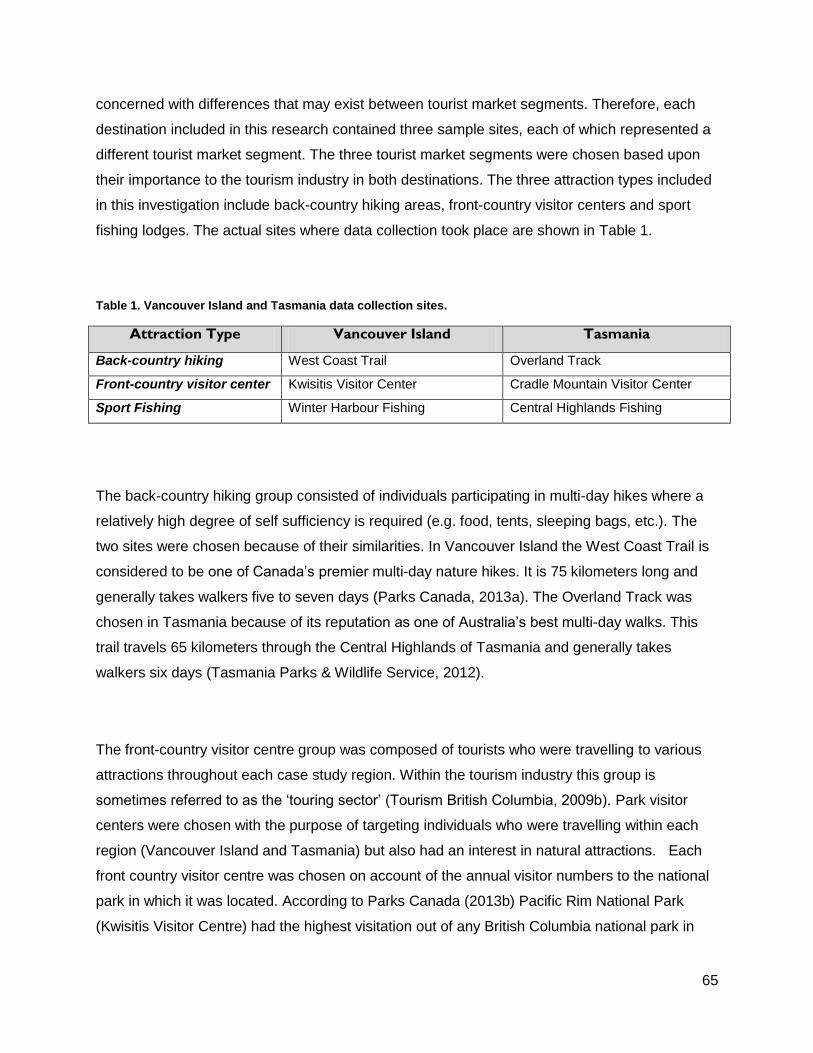
65
concerned with differences that may exist between tourist market segments. Therefore, each
destination included in this research contained three sample sites, each of which represented a
different tourist market segment. The three tourist market segments were chosen based upon
their importance to the tourism industry in both destinations. The three attraction types included
in this investigation include back-country hiking areas, front-country visitor centers and sport
fishing lodges. The actual sites where data collection took place are shown in Table 1.
Table 1. Vancouver Island and Tasmania data collection sites.
Attraction Type Vancouver Island Tasmania
Back-country hiking West Coast Trail Overland Track
Front-country visitor center Kwisitis Visitor Center Cradle Mountain Visitor Center
Sport Fishing Winter Harbour Fishing Central Highlands Fishing
The back-country hiking group consisted of individuals participating in multi-day hikes where a
relatively high degree of self sufficiency is required (e.g. food, tents, sleeping bags, etc.). The
two sites were chosen because of their similarities. In Vancouver Island the West Coast Trail is
considered to be one of Canada’s premier multi-day nature hikes. It is 75 kilometers long and
generally takes walkers five to seven days (Parks Canada, 2013a). The Overland Track was
chosen in Tasmania because of its reputation as one of Australia’s best multi-day walks. This
trail travels 65 kilometers through the Central Highlands of Tasmania and generally takes
walkers six days (Tasmania Parks & Wildlife Service, 2012).
The front-country visitor centre group was composed of tourists who were travelling to various
attractions throughout each case study region. Within the tourism industry this group is
sometimes referred to as the ‘touring sector’ (Tourism British Columbia, 2009b). Park visitor
centers were chosen with the purpose of targeting individuals who were travelling within each
region (Vancouver Island and Tasmania) but also had an interest in natural attractions. Each
front country visitor centre was chosen on account of the annual visitor numbers to the national
park in which it was located. According to Parks Canada (2013b) Pacific Rim National Park
(Kwisitis Visitor Centre) had the highest visitation out of any British Columbia national park in
66
2011-2012 with more than 750 000 visitors. Similarly Cradle Mountain-Lake St. Clair National
Park received the most visits out of all national parks in Tasmania with 240 000 visitors during
the 2012-2013 financial year (Tasmania Parks & Wildlife Service, 2013).
The sport fishing group consisted of individuals who were customers at fishing lodges. In
Vancouver Island opinions were solicited from saltwater fishermen in a small village called
Winter Harbour. This location was chosen because of its popularity as a sport fishing destination
with tourists. In Tasmania trout fishermen were targeted in the Central Highland Lakes region.
The reason that freshwater fishermen were surveyed in Tasmania is because this type fishing
tends to be much more popular than saltwater fishing with visitors to Tasmania. The Central
Highland Lakes region was specifically chosen due to the prevalence of trout fishing lodges in
this area.
Sample periods were designed to maximize response rates and capture tourists who possess a
broad range of characteristics. Because the questionnaire focused on tourism and outdoor
activities, questionnaires were distributed during the peak summer tourist season when outdoor
recreation participation is at its highest. Therefore, the months of July and August (2012) were
selected for sampling visitors at Vancouver Island attractions, whereas data collection at
attractions located in Tasmania was conducted during the months of January and February
(2013).
All participants who appeared to be over the age of 18 were approached and asked to
participate. This was done to comply with the UBC Behavioral Research Ethics Boards
requirements for minors to obtain legal guardian consent to participate in any UBC related
research. Those approached were asked to confirm their age. The questionnaire also contained
a question asking respondents to indicate the year that they were born. In order to calculate
response rate, the number of individuals approached for inclusion in the study was recorded. A
standard introduction statement was read to prospective participants, which summarized the
cover letter accompanying the questionnaire (Appendix A & Appendix B). Introduction
statements, cover letters and questionnaires were all customized for the two study regions.
Those who agreed to participate were given copies of the cover letter and questionnaire, which
67
was then completed independently. Upon completion participants deposited their surveys into a
collection box that was located on site. This was done to help preserve the anonymity of
research participants.
3.3.2 Questionnaire Design & Analysis
3.3.2.1 Section 1: Pre-visit Destination Image
(Please indicate the degree of importance each of the activities/attractions are to you when thinking about
tourism in Vancouver Island/Tasmania)
The purpose of this section is to understand respondent’s pre-visit destination image of the
study region that they are visiting. Ideally this question would be asked before a trip has taken
place. However, the difficulty associated with surveying individuals before their visit and then
again during their trip made it necessary to ask this question at the destination. This is similar to
what has been done in other studies analysing destination image (Beerli & Martin, 2004b; Kwan,
Eagles & Gebhardt, 2010). This question is composed of twenty items that are commonly
associated with the tourism industry of each study region. Respondents were asked to rate the
degree to which each item influenced their opinions about Vancouver Island and Tasmania as
tourist destinations on a 5-point ordinal scale. Scale attributes were developed through content
analysis of tourist brochures, websites and trip planners for both study destinations. This is
similar to the approach used in other research investigating destination image (Obenour,
Groves & Lengfelder, 2006). Final items were selected to represent a range of
activities/attractions, as opposed to focussing on a single tourism subsector (e.g. nature-based
tourism).
Destination image questions are considered to be important because it is often perceptions,
rather than reality, that influence people to visit specific destinations (Gallarza et al., 2001). This
is because the destination image formation process is developed through exposure to a variety
of information sources, rather than first hand experiences. Therefore, this question helped to
provide a picture of the destination images associated with each study region. Additionally, they
were able to give insight into some of the more important factors that help to shape the tourism
images of these two destinations.
68
Principle component analysis was applied to the scale of twenty items often associated with the
tourism industry in Vancouver Island and Tasmania. The purpose of this was to understand the
elements that help shape destination image in each case study region. This technique is
particularly useful for condensing many variables and discovering any underlying dimensions
that may exist between them. Factor rotation is a common method used to achieve the simplest
and most practical factor solution possible. Therefore, varimax rotation was chosen because it is
known to give the clearest separation of factors when compared to other rotation techniques
(Hair et al., 2010). ANOVA is a test that is used to determine whether mean scores differ
between groups. This test was used to reveal any differences that may exist between
destination image item ratings between the three sample groups (i.e. back-country hikers, front-
country visitor center guests, sport fishermen). Scheffe and Games-Howell post hoc tests were
then used to help determine where significant differences exist. These two post-hoc tests were
selected because of their accuracy with unequal sample sizes (Field, 2009)
3.3.2.2 Section 2: Tourist Motivation
(Please indicate the degree to which each item motivated you to take this vacation to Vancouver
Island/Tasmania)
The second section of the questionnaire contains twelve items that are commonly used to
measure various aspects of tourist motivation. Items for this scale were adapted from past
studies researching tourist motivation and destination image (Beerli & Martin, 2004a; Beerli &
Martin, 2004b; Fodness, 1994). Respondents were asked to rate the degree to which each item
was a factor in motivating them to take their vacation using a 5-point ordinal scale. This is
important due to the strong link between motivation and destination choice (Jang, et al., 2009).
When individuals choose to travel for leisure purposes, they may be motivated by a number of
different reasons. Understanding motivations can prove valuable when it comes to segmenting
tourist markets. This is because the various aspects of a particular destination’s image are likely
to appeal to certain types of motivations more than others, and therefore attract certain types of
tourists (Jang, et al., 2009). By understanding tourist motivations we can better understand the
types of experiences that visitors are seeking when visiting a particular destination.
Principle component analysis with varimax rotation was applied to the scale of twelve items that
commonly motivate people to take vacations. Like the destination image scale, the purpose of

69
this was to reduce its dimensions and identify determinant factors that motivated respondents to
take their vacation. Varimax rotation was also used to help interpret factors that emerged from
the analysis, due to the clarity of separation between factors when compared to alternative
rotation techniques (Hair et al., 2010).
3.3.2.3 Section 3: Recreation Opportunity Spectrum
(Which settings do you most prefer when participating in outdoor recreation activities?)
The third section of the questionnaire provided participants with a list of six recreation activity
setting types. Respondents were asked to indicate the recreation setting types that they
preferred when participating in outdoor activities. This question was adapted from the
Recreation Opportunity Spectrum (ROS) manual, which has been used to classify areas into
recreation opportunity categories and assist resource managers when making decisions about
management prescriptions that may affect these recreation values (British Columbia Ministry of
Forests, 1998b). Past research has suggested that relationships do exist between recreation
settings and experiential outcomes (Floyd & Gramman, 1997). Understanding the types of
recreation activity settings that various tourist segments desire most can help to provide insight
into the settings most likely to result in positive experiential outcomes and high levels of
satisfaction.
To help understand differences in preference between the three sample groups univariate
statistics were calculated. Chi-square is used to determine whether or not a relationship exists
between two variables (e.g. is preference for certain setting types related to certain sample
groups). Cramer’s V post hoc test then conducted to measure the strength of any associations
that may be present (Field, 2009).
3.3.2.4 Section 4: Visitor Experience
(How well did this visit to Vancouver Island/Tasmania meet your expectations?)
(How likely is it that you would recommend Vancouver Island/Tasmania as a vacation destination to
family/friends?)
(How likely is it that you will return to Vancouver Island/Tasmania for vacation again in the future?)
70
Section four of the questionnaire measured respondent’s visitor experience. Because trip
satisfaction is often described as the comparisons between pre-trip expectations and the degree
to which these have been met (Jenkins, 1999), the first question in this section asks participants
to rate the degree to which this particular trip has met their expectations. Past research has
also demonstrated that a significant relationship exists between visitor satisfaction, intention to
make a return visit and positive word-of-mouth communication (Kozak & Rimmington, 2000).
Therefore, the next questions asked respondents how likely they are to revisit the destination
again in the future and how likely they are to recommend the destination to others. Both of these
questions were measured on a 5 point ordinal scale. The final two questions of this section
asked respondents to identify up to three main reasons for visiting the destination again and
three reasons that may prevent a return visit in the future. This is similar to a question format
that was used by Vaughan & Edwards (1999) to learn about some of the factors that may
influence levels of visitor satisfaction.
Univariate statistics were calculated for the three questions that measured satisfaction levels.
ANOVA and post hoc tests (Games-Howell and Scheffe) were conducted on participant
responses to the questions that asked about the degree to which expectations were met,
likelihood of recommending the destination and the likelihood of returning in the future. The
purpose of this was to reveal any significant differences in mean scores that may exist between
sample groups. Games-Howell and Scheffe were chosen for post hoc tests because of their
accuracy when comparing groups with unequal sample sizes (Field, 2009).
3.3.2.5 Section 5: Nature-based Tourism Setting Preferences
(Listed below are statements expressing views about forestry and tourism. Please rate your level of agreement
with each statement.)
The purpose of section five is to understand the preferences of visitors to forested areas and
their expectations in regards to the forest industry. Because there have been very few studies in
the past that have examined this particular idea, a scale was developed which contained twelve
items. Six of these items were worded in a way that assessed the impact of forestry on tourism
experience, while the other six items measured the impact that forestry has on outdoor
recreation experience. In addition to this, half of the items included within this section were
worded negatively, while the other half was composed of positively worded items. The purpose
71
of this is to help avoid acquiescence bias, which refers to a respondent’s tendency to agree or
disagree with all items irrespective of their content (DeVellis, 2003).
To help confirm the reliability of the scale measuring nature-based tourism setting preferences
principle component analysis with varimax rotation was applied to the twelve questions used in
this scale. After principle component analysis, scores were calculated for each participant. This
was done by reverse coding all negatively worded items and adding the ratings given to
produce a score out of 60. This was then divided by 12 to create an index out of 5. The possible
scores that respondents could receive ranged between 1 and 5, with 1 representing a high
degree of acceptance for settings with visible forest industry impacts and 5 representing a low
degree of acceptance for these settings. Mean score comparisons between the three sample
groups were then made using ANOVA and post hoc tests (Games-Howell and Scheffe).
3.3.2.6 Section 6: Forestry Observations and Perceptions
(Please indicate which forestry impacts/activities you observed as a tourist to Vancouver Island/Tasmania. For
each one observed, please indicate the degree to which it affected your perception of Vancouver Island/Tasmania
as a tourist destination.)
Section six of the questionnaire addressed forestry activities in British Columbia and Tasmania.
This question asked respondents to indicate the types of forestry impacts they had observed
while travelling within Vancouver Island/Tasmania (harvested areas, plantations, log trucks,
mills, etc.). This helped to provide an indication about how visible the industry is to tourists.
Respondents were then asked how viewing forestry operations affected their perceptions of
each destination (Vancouver Island & Tasmania). Past research has revealed that public
acceptability is highest for scenes of preservation and retention, but quite low for modified
landscapes (British Columbia Ministry of Forests, 2003; Ribe, 2004). These studies suggest that
respondents who notice the presence of forestry impacts are most likely to have a negative
perception of the industry. Therefore, it seems that a negative perception of forestry could
translate into a negative perception of a region that markets the natural environment to attract
tourists. This question will attempt to confirm or deny this assumption.
72
Chi-square was conducted on participant responses to the question that asked which forest
industry impacts had been observed during their trip. The purpose of this was to understand the
degree to which certain sample sites were associated with any of the four forest industry impact
types measured. Phi post hoc test was then used to identify any significant differences that may
exist. To help understand the effect that forestry impacts can have on visitor perceptions
ANOVA was used to analyze the ratings given to each type of forest industry impacts observed.
The purpose of this was to reveal where significant differences exist between the three sample
groups. Games-Howell and Scheffe post hoc tests were selected due to their accuracy when
comparing groups with unequal sample sizes (Field, 2009).
Linear regression is used to predict the value of a single dependent variable by using the values
found within a set of independent variables (Hair, et al. 2010). Following ANOVA and post hoc
tests, this technique was employed to help understand some of the ways that certain sample
characteristics may influence the degree to which forestry impacts upon tourism image.
Because perceptions of four forestry impact types were measured (i.e. harvested areas, tree
plantations, log trucks and saw/pulp mills) four regression models were produced (one for each
impact type). Independent variables used to try and predict forestry impact type ratings include
age, gender, education, affiliation with conservation organizations, nature-based tourism setting
preferences, environmental values, place of residency and destination image.
3.3.2.7 Section 7: Forest Management Options
(Listed below are possible options for the management of Vancouver Island’s/Tasmania’s forests. Please indicate
your level of agreement with each option.)
Section seven of the questionnaire focused on forest management options in the two study
regions. In this section respondents were asked to rate their level of agreement with a variety of
management options that could be used to help preserve visual quality within each study region.
The format for this question is similar to that which was used in a questionnaire by Andereck &
Vogt (2000) to measure the acceptability of various tourism development options. However, in
this instance it has been adapted to measure acceptability of forest management options
instead. Visual impacts play an important role in determining public acceptance of forest
management practices (Kearney, 2001). Because tourists expect to gaze upon images that are
depicted in postcards and other types of promotional media (Urry, 2002), it could be assumed
73
that they may be particularly sensitive to the visual impacts associated with forestry. This
section attempts to test this assumption. Additionally, it was able to provide insight into the types
of management practices that could be used to help maintain the images that are promoted to
potential visitors. This is especially important when considering that a negative destination
evaluation tends to result from a positive pre-visit destination image followed by a negative
experience (Beerli & Martin, 2004b).
To help understand the forest management preferences of each sample group univariate
statistics were calculated. ANOVA was conducted on the agreement ratings expressed for each
management option presented. The main purpose of this was to learn about any significant
differences that may exist between the sample groups. Games-Howell and Scheffe post hoc
tests were used because of their accuracy when comparing groups with uneven sample sizes
(Field, 2009).
3.3.2.8 Section 8: New Ecological Paradigm
(Listed below are statement’s expressing different views about the environment. Please indicate your level of
agreement with each statement.)
As mentioned previously, environmental values play a role in determining how individuals
perceive forest management practices. Therefore, the NEP scale was adopted for this
questionnaire, due to its widely accepted use over the past three decades as a method for
measuring environmental values (Dunlap et al., 2000). This scale contained 15 items used to
measure an individual’s beliefs about the relationship between human’s and the environment.
Past research has demonstrated that specific demographic characteristics tend to correspond
with certain scores on the NEP scale (Dunlap, 2008). By comparing this data with respondent’s
demographic information, the question will attempt to validate this claim. Additionally, it will give
an indication as to how environmental values can impact on the destination image formation
process.
To help confirm the reliability of the New Ecological Paradigm (NEP) scale principle component
analysis with varimax rotation was applied to the fifteen questions used to measure this
construct. Once this was complete, scores were calculated for each of the participants. This was
74
done by reverse coding all negatively worded statements and adding the ratings given to
produce a score out of 75. This score was then divided by 15 to create a summed index out of
5, with 1 representing a anthropocentric worldview and 5 representing an environmentalist
worldview. Comparisons between the three sample groups were then made using ANOVA and
post hoc tests (Games-Howell & Scheffe).
3.3.2.9 Section 9: Demographic Characteristics
The final section is composed of various questions asking respondents about themselves. The
first question asked them to indicate the number of previous visits they had taken to the
destination in which they are being surveyed. This will help to provide an indication of each
research participant’s familiarity with the destination in question. This is likely to affect various
aspects of the decision making process such as motivations, expectations and prior knowledge.
This was followed by a question asking respondents to state their usual place of residence.
Research suggests that demographic characteristics relating to culture can play an important
role in the public’s perception of forest management practices (Gobster, 1996). Identifying
respondent’s place of residence gives an indication of some cultural aspects that may affect
perception (e.g., environmental values, religion, dominant industries, quality of educational
system, etc.). These questions also give an indication as to how familiar visitors are with each
destination’s forestry industry and the tourism image that they portray, as place of residence will
affect a person’s degree of exposure to the media of each study region.
Questions within the demographic characteristics asked about gender, age, education,
occupation and affiliation with conservation organizations or natural resource agencies.
Demographic characteristics, such as education level, culture and occupation can all play an
important role in the formation of an individual’s environmental values (Dunlap, 2008; Inglehart,
2008) and perception of forest management practices (Patel, Rapport, Vanderlinden & Eyles,
1999; Gobster, 1996; Ford et al., 2005). Because gender, occupation and affiliation with specific
organizations are all major determinants of an individual’s life experience, these questions help
give an indication about the individual characteristics that influence perceptions of forestry. This
was followed by an opportunity for respondents to add any comments they may have relating to
either the tourism or forestry industry in the study site. The main purpose of this was to elicit any
75
additional feelings that respondents may have about the issues addressed in the survey
instrument.
In order to characterize the sample groups, univariate statistics were calculated for demographic
variables, including country of origin, age, gender, education levels and household income. Chi-
square tests are used to determine whether or not there is a relationship between two
categorical variables (Field, 2009). Therefore, this method was employed to find possible
relationships between sample groups and each of the demographic variables that were
measured. Although chi-square tests determine if a relationship exists between variables, post
hoc tests are needed to reveal the path of any relationships that may be present (Hair, Black,
Babin & Anderson, 2010). Phi is most useful for situations where categorical variables contain
only two categories, whereas Cramer’s V is used a categorical variable contains more than two
categories (Field, 2009). Therefore, Phi and Cramer’s V post hoc tests were conducted to
identify significant differences between the three sample groups.
3.4 Semi-structured Interviews
The semi-structured interview is one of the more popular qualitative techniques employed by
researchers. There are a number of advantages associated with having questions administered
directly by a researcher. For example, interviewers are generally able to explain questions
better than a written questionnaire and can answer any questions that may be unclear to the
participant. It also allows researchers to probe deeper for answers than a typical questionnaire.
This was especially useful for learning about the specific forest management issues that affect
tourism and how this can be minimized. Finally, interviewers can observe the body language of
respondents as well as ask questions (Babbie, 2004).
The purpose of the semi-structured interviews was to test hypotheses number one and learn
about the impact that forestry can have on tourism image. Additionally, the interviews addressed
research question three by uncovering measures that could be used to better integrate tourism
values into forest management decision making. Semi-structured interviews were conducted
with forestry professionals from government and industry, in both study regions. Tourism
76
professionals from academia, government and industry were also interviewed. To control the
content and scope of the interviews, a guide was developed to help ensure that all relevant
topics were covered. All interviews were digitally recorded and then transcribed to a text
document.
3.4.1 Sample Design
To understand the perspectives of individuals who are knowledgeable about some of the
conflicts that can occur between forestry and tourism, a set of broad interview topics were
developed. These topics were then used to conduct semi-structured interviews in Vancouver
Island and Tasmania with individuals who are employed in either the tourism or forestry sectors.
To help capture a broad range of opinions a list of potential interviewees was first compiled.
These individuals were then sent an email explaining the study and requesting an interview. The
email also asked these individuals for help in identifying additional interviewees who could
provide unique insight into the research problem. Those who agreed to be interviewed were
then sent a consent form that was signed and returned in order to comply with the UBC
Behavioral Research Ethics Boards requirements. All semi-structured interviews were
conducted either by phone or in-person.
3.4.2 Interview Topics
One of the main benefits associated with the interview method is the ability that it gives
researchers to follow up on certain questions by asking for more detail (Kraus & Allen, 1997).
Therefore, many of the interviews differed in terms of some of the topics that were discussed
and the depth that these discussions went into. However, they were all guided by a
predetermined script containing questions that could be categorized into three broad topics
(Appendix C). The primary purpose of the semi-structured interviews was to address the third
research question (i.e. how to manage forests to ensure tourism values are not compromised by
other forest interests). Therefore, interview questions were designed to uncover information
about this. The introductory theme was designed to provide context about the participant’s
background, knowledge and experience. The other two interview themes were chosen based
upon the type of information required to understand the types of conflicts that occur between
forestry and tourism in each case study destination, as well as possible solutions used to help
address these types of issues.
77
3.4.2.1 Section1: Introductory Questions
The first section asked respondents a series of introductory questions. This included items such
as occupational history and length of time at current position. The purpose of this was to help
provide an indication of the participant’s experience in the tourism industry and familiarity with
issues being discussed. Respondents were also asked about their time spent living and working
in the region. Because an individual’s local residence has been shown to correspond with both
place meaning (Eisenhauer et al., 2000; Budruk et al., 2011) and environmental values
(Abrams, et al., 2005), these questions helped to provide insight into some of the life
experiences that may have influenced the values expressed by each interviewee.
3.4.2.2 Section 2: Forest/Tourism Conflicts
Past research has documented public displeasure with the visual impacts associated with the
forest industry (Picard & Sheppard, 2001; British Columbia Ministry of Forests, 2003). Because
the British Columbia and Tasmania tourism industries rely so heavily on scenic values is seems
likely that this could lead to conflict with the forest industry. Therefore, the purpose of questions
contained in this section was to reveal some of the potential threats that forestry may pose to
the tourism industry in each study region.
3.4.2.3 Section 3: Forestry/Tourism Conflict Resolution
Studies have demonstrated that certain measures can be taken to reduce the potential impact
that forestry can have upon tourism values (Jenson, 2000; Tyrvainen, Silvennoinen &
Nousiainen, 2002). The purpose of the third section was to help uncover additional measures
that could be used to reduce these types of conflicts. Therefore, these questions asked
participants about methods that could be used to help reduce the potential impact that forestry
can have upon tourism values.
3.5 Summary
The questionnaire was developed with the primary purpose of addressing the first research
question, which seeks to understand the potential impact that forestry can have on tourism
image. Therefore, questions focused on elements associated with the tourist experience and the
ways in which forestry may have impacted upon this. In order to address the second research
78
question and understand the differences between tourist user groups, questionnaires were
distributed at various sites throughout both case study regions.
The main purpose of the semi-structured interviews was to address the first and third research
question and understand ways in which forests can be managed to help ensure that tourism and
recreation values are not compromised by other forest interests. Therefore, interview topics
were focused upon the sources of conflict between forestry and tourism, as well as ways in
which these conflicts could potentially be resolved.
79
Chapter 4
Vancouver Island Results
4.1 Introduction
This chapter presents results from the questionnaire that was presented to Vancouver Island
tourists. It is important to note possible limitations associated with these results in relation to
non-response bias. Because the survey instrument was only printed in English, those who did
not speak the language were unable to participate. It is possible that a survey targeting another
language group may have produced different results. Additionally, certain individuals who were
approached agreed to participate, while others declined. It is possible that certain differences
between those who declined and those that accepted could have influenced results. The
chapter begins with a short discussion explaining the methods used for analysis. This is
followed by a section providing an overview of the methods used to summarize the sample
characteristics. Sample characteristics and results are then discussed.
4.2 Methods of Analysis
An alpha level of 0.05 was used for all statistical tests. SPSS version 20.0 was used to conduct
all calculations and analyses. Chi-square along with Phi and Cramer’s V post hoc tests were
used to discover any relationships present between categorical variables. These include the
responses to questions about demographic characteristics, recreation opportunity spectrum and
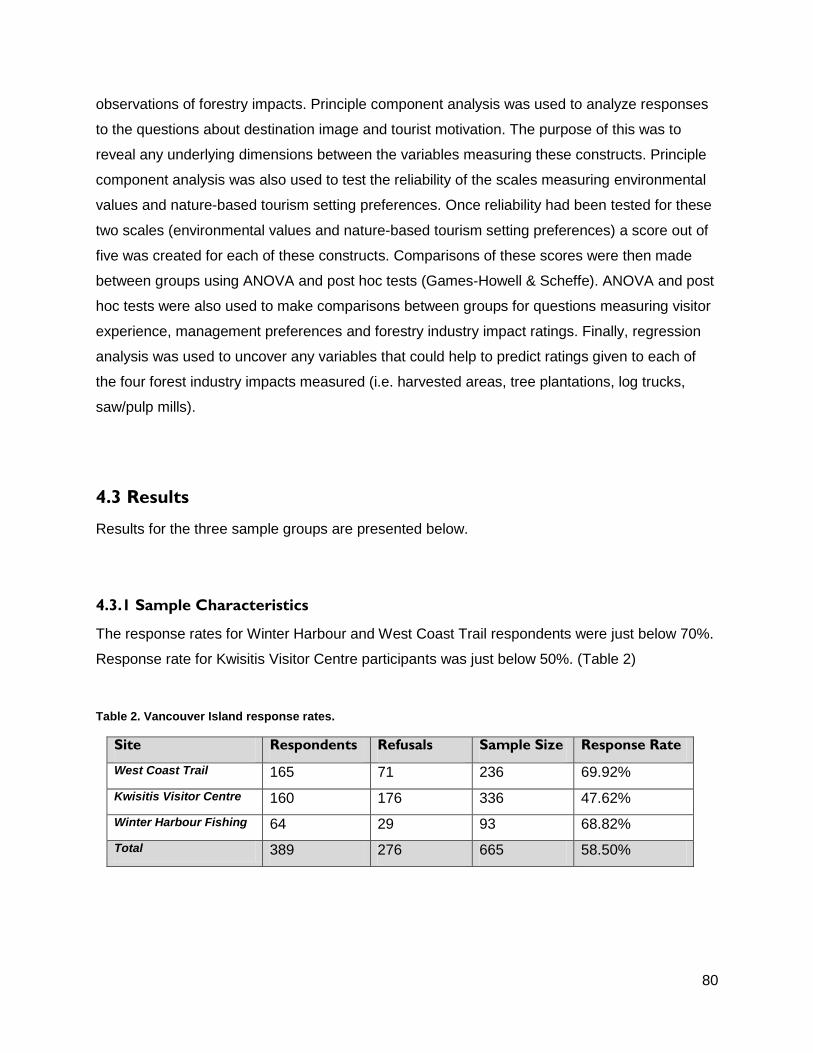
80
observations of forestry impacts. Principle component analysis was used to analyze responses
to the questions about destination image and tourist motivation. The purpose of this was to
reveal any underlying dimensions between the variables measuring these constructs. Principle
component analysis was also used to test the reliability of the scales measuring environmental
values and nature-based tourism setting preferences. Once reliability had been tested for these
two scales (environmental values and nature-based tourism setting preferences) a score out of
five was created for each of these constructs. Comparisons of these scores were then made
between groups using ANOVA and post hoc tests (Games-Howell & Scheffe). ANOVA and post
hoc tests were also used to make comparisons between groups for questions measuring visitor
experience, management preferences and forestry industry impact ratings. Finally, regression
analysis was used to uncover any variables that could help to predict ratings given to each of
the four forest industry impacts measured (i.e. harvested areas, tree plantations, log trucks,
saw/pulp mills).
4.3 Results
Results for the three sample groups are presented below.
4.3.1 Sample Characteristics
The response rates for Winter Harbour and West Coast Trail respondents were just below 70%.
Response rate for Kwisitis Visitor Centre participants was just below 50%. (Table 2)
Table 2. Vancouver Island response rates.
Site Respondents Refusals Sample Size Response Rate
West Coast Trail 165 71 236 69.92%
Kwisitis Visitor Centre 160 176 336 47.62%
Winter Harbour Fishing 64 29 93 68.82%
Total 389 276 665 58.50%
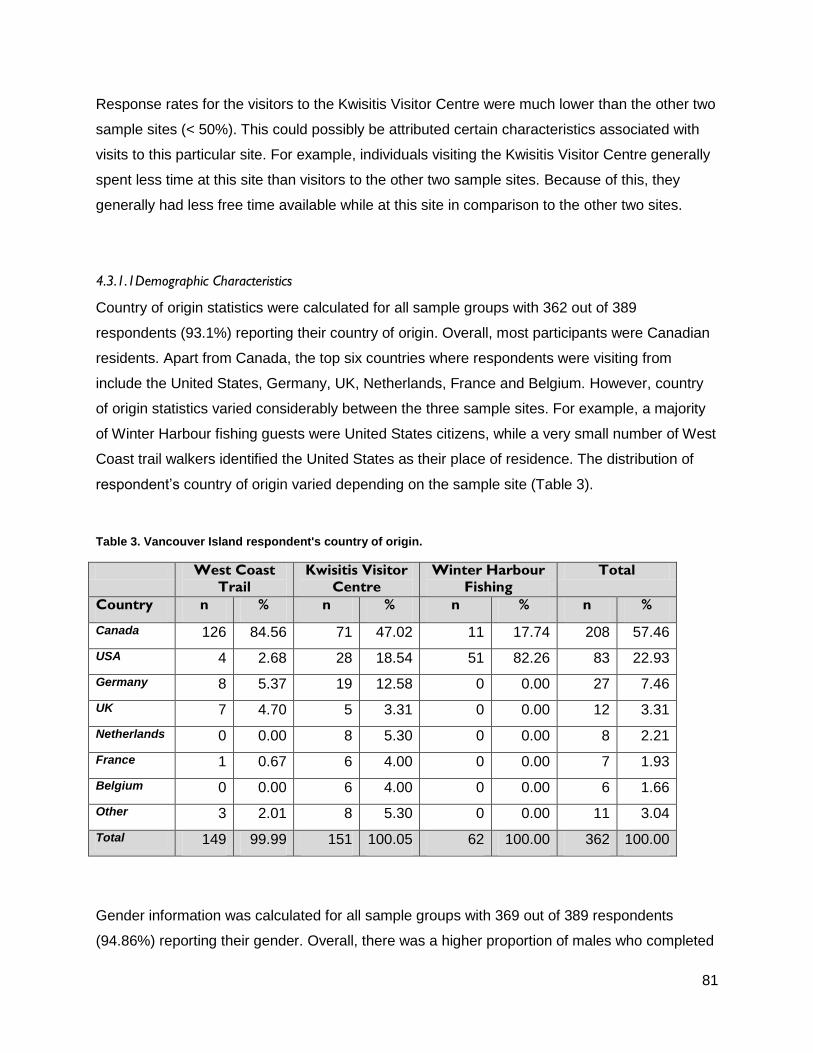
81
Response rates for the visitors to the Kwisitis Visitor Centre were much lower than the other two
sample sites (< 50%). This could possibly be attributed certain characteristics associated with
visits to this particular site. For example, individuals visiting the Kwisitis Visitor Centre generally
spent less time at this site than visitors to the other two sample sites. Because of this, they
generally had less free time available while at this site in comparison to the other two sites.
4.3.1.1Demographic Characteristics
Country of origin statistics were calculated for all sample groups with 362 out of 389
respondents (93.1%) reporting their country of origin. Overall, most participants were Canadian
residents. Apart from Canada, the top six countries where respondents were visiting from
include the United States, Germany, UK, Netherlands, France and Belgium. However, country
of origin statistics varied considerably between the three sample sites. For example, a majority
of Winter Harbour fishing guests were United States citizens, while a very small number of West
Coast trail walkers identified the United States as their place of residence. The distribution of
respondent’s country of origin varied depending on the sample site (Table 3).
Table 3. Vancouver Island respondent's country of origin.
West Coast
Trail
Kwisitis Visitor
Centre
Winter Harbour
Fishing
Total
Country n % n % n % n %
Canada 126 84.56 71 47.02 11 17.74 208 57.46
USA 4 2.68 28 18.54 51 82.26 83 22.93
Germany 8 5.37 19 12.58 0 0.00 27 7.46
UK 7 4.70 5 3.31 0 0.00 12 3.31
Netherlands 0 0.00 8 5.30 0 0.00 8 2.21
France 1 0.67 6 4.00 0 0.00 7 1.93
Belgium 0 0.00 6 4.00 0 0.00 6 1.66
Other 3 2.01 8 5.30 0 0.00 11 3.04
Total 149 99.99 151 100.05 62 100.00 362 100.00
Gender information was calculated for all sample groups with 369 out of 389 respondents
(94.86%) reporting their gender. Overall, there was a higher proportion of males who completed
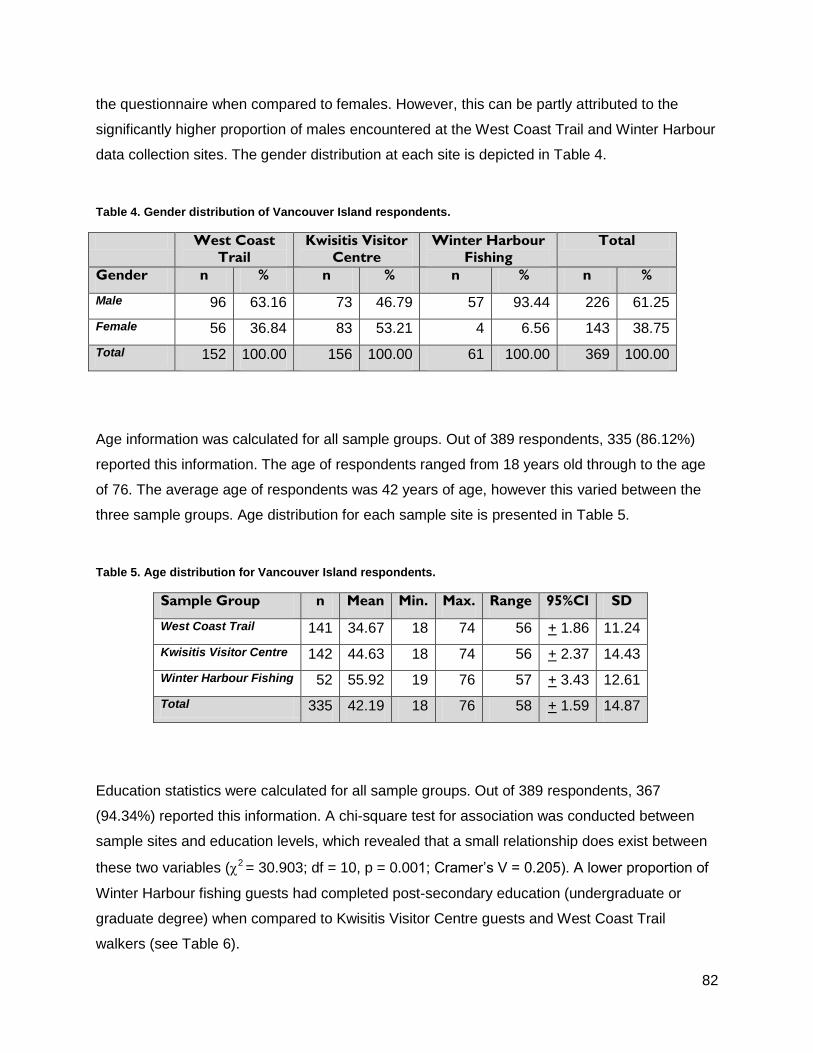
82
the questionnaire when compared to females. However, this can be partly attributed to the
significantly higher proportion of males encountered at the West Coast Trail and Winter Harbour
data collection sites. The gender distribution at each site is depicted in Table 4.
Table 4. Gender distribution of Vancouver Island respondents.
West Coast
Trail
Kwisitis Visitor
Centre
Winter Harbour
Fishing
Total
Gender n % n % n % n %
Male 96 63.16 73 46.79 57 93.44 226 61.25
Female 56 36.84 83 53.21 4 6.56 143 38.75
Total 152 100.00 156 100.00 61 100.00 369 100.00
Age information was calculated for all sample groups. Out of 389 respondents, 335 (86.12%)
reported this information. The age of respondents ranged from 18 years old through to the age
of 76. The average age of respondents was 42 years of age, however this varied between the
three sample groups. Age distribution for each sample site is presented in Table 5.
Table 5. Age distribution for Vancouver Island respondents.
Sample Group n Mean Min. Max. Range 95%CI SD
West Coast Trail 141 34.67 18 74 56 + 1.86 11.24
Kwisitis Visitor Centre 142 44.63 18 74 56 + 2.37 14.43
Winter Harbour Fishing 52 55.92 19 76 57 + 3.43 12.61
Total 335 42.19 18 76 58 + 1.59 14.87
Education statistics were calculated for all sample groups. Out of 389 respondents, 367
(94.34%) reported this information. A chi-square test for association was conducted between
sample sites and education levels, which revealed that a small relationship does exist between
these two variables (2 = 30.903; df = 10, p = 0.001; Cramer’s V = 0.205). A lower proportion of
Winter Harbour fishing guests had completed post-secondary education (undergraduate or
graduate degree) when compared to Kwisitis Visitor Centre guests and West Coast Trail
walkers (see Table 6).
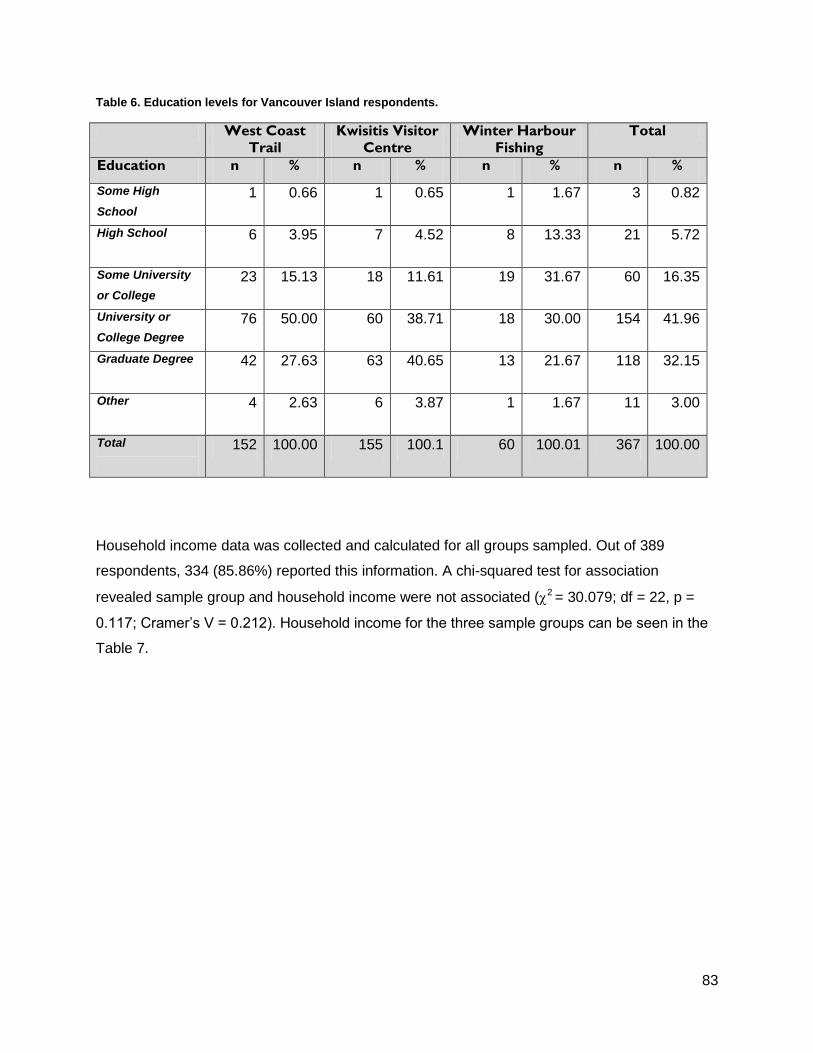
83
Table 6. Education levels for Vancouver Island respondents.
West Coast
Trail
Kwisitis Visitor
Centre
Winter Harbour
Fishing
Total
Education n % n % n % n %
Some High
School
1 0.66 1 0.65 1 1.67 3 0.82
High School
6 3.95 7 4.52 8 13.33 21 5.72
Some University
or College
23 15.13 18 11.61 19 31.67 60 16.35
University or
College Degree
76 50.00 60 38.71 18 30.00 154 41.96
Graduate Degree
42 27.63 63 40.65 13 21.67 118 32.15
Other
4 2.63 6 3.87 1 1.67 11 3.00
Total
152 100.00 155 100.1 60 100.01 367 100.00
Household income data was collected and calculated for all groups sampled. Out of 389
respondents, 334 (85.86%) reported this information. A chi-squared test for association
revealed sample group and household income were not associated (2 = 30.079; df = 22, p =
0.117; Cramer’s V = 0.212). Household income for the three sample groups can be seen in the
Table 7.
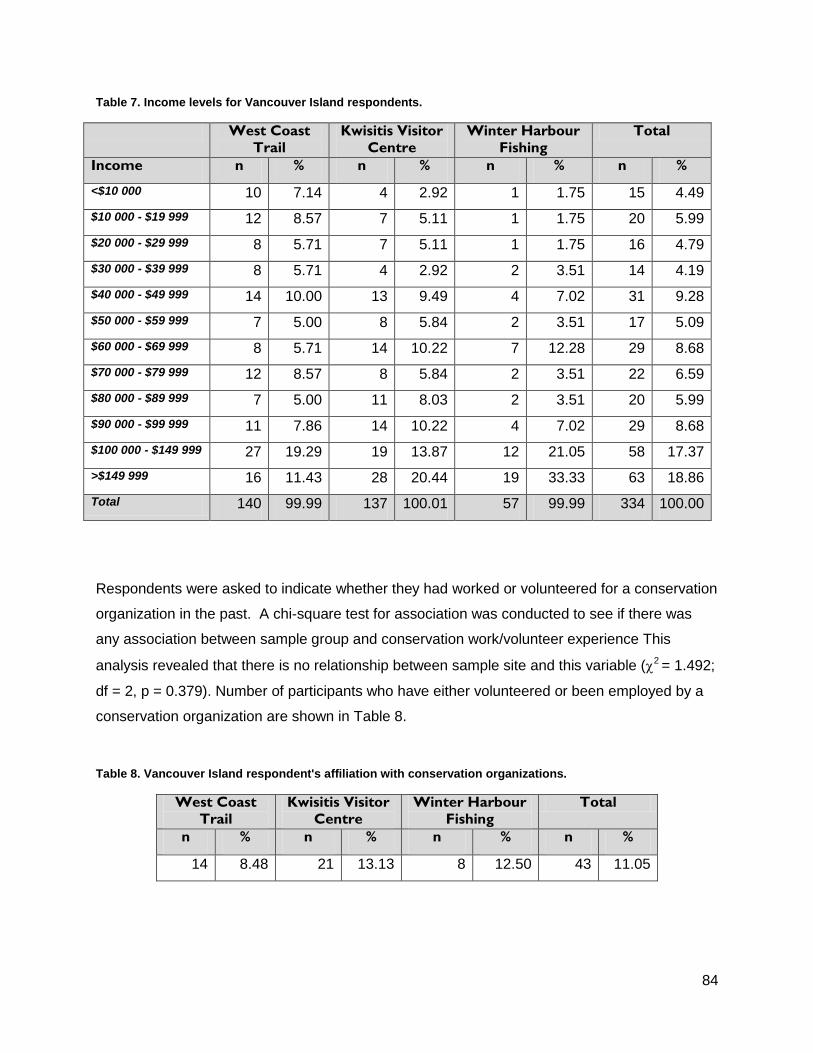
84
Table 7. Income levels for Vancouver Island respondents.
West Coast
Trail
Kwisitis Visitor
Centre
Winter Harbour
Fishing
Total
Income n % n % n % n %
<$10 000 10 7.14 4 2.92 1 1.75 15 4.49
$10 000 - $19 999 12 8.57 7 5.11 1 1.75 20 5.99
$20 000 - $29 999 8 5.71 7 5.11 1 1.75 16 4.79
$30 000 - $39 999 8 5.71 4 2.92 2 3.51 14 4.19
$40 000 - $49 999 14 10.00 13 9.49 4 7.02 31 9.28
$50 000 - $59 999 7 5.00 8 5.84 2 3.51 17 5.09
$60 000 - $69 999 8 5.71 14 10.22 7 12.28 29 8.68
$70 000 - $79 999 12 8.57 8 5.84 2 3.51 22 6.59
$80 000 - $89 999 7 5.00 11 8.03 2 3.51 20 5.99
$90 000 - $99 999 11 7.86 14 10.22 4 7.02 29 8.68
$100 000 - $149 999 27 19.29 19 13.87 12 21.05 58 17.37
>$149 999 16 11.43 28 20.44 19 33.33 63 18.86
Total 140 99.99 137 100.01 57 99.99 334 100.00
Respondents were asked to indicate whether they had worked or volunteered for a conservation
organization in the past. A chi-square test for association was conducted to see if there was
any association between sample group and conservation work/volunteer experience This
analysis revealed that there is no relationship between sample site and this variable (2 = 1.492;
df = 2, p = 0.379). Number of participants who have either volunteered or been employed by a
conservation organization are shown in Table 8.
Table 8. Vancouver Island respondent's affiliation with conservation organizations.
West Coast
Trail
Kwisitis Visitor
Centre
Winter Harbour
Fishing
Total
n % n % n % n %
14 8.48 21 13.13 8 12.50 43 11.05
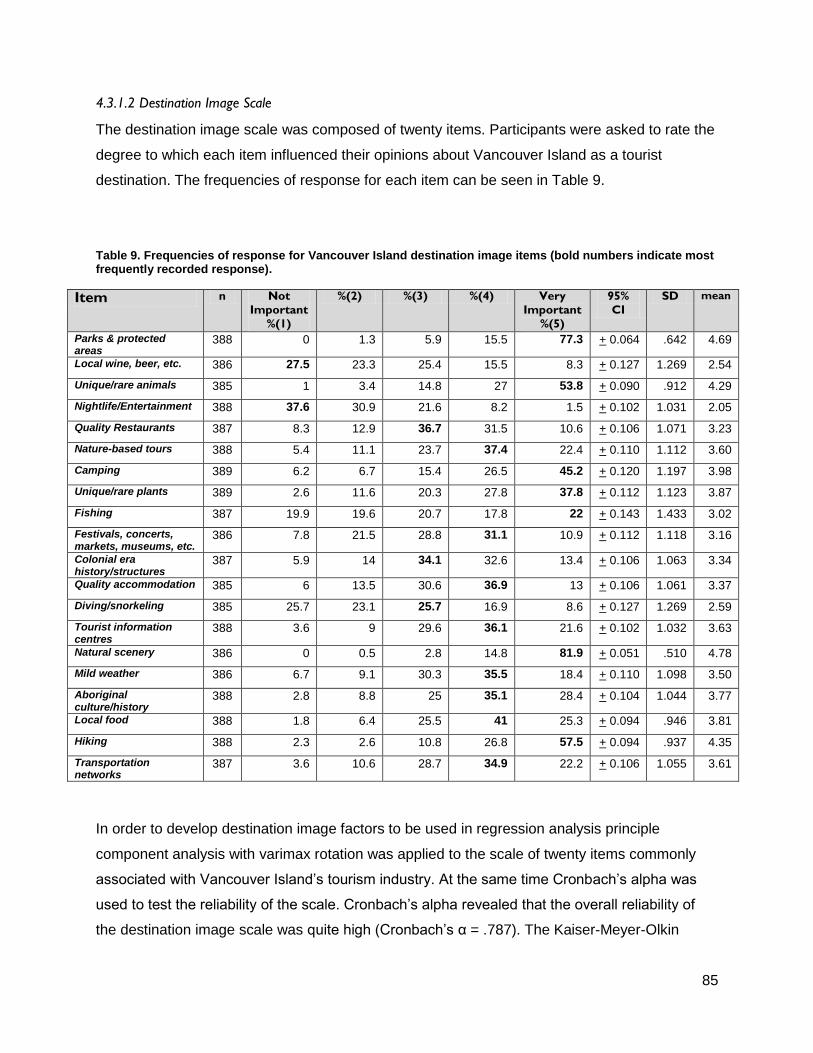
85
4.3.1.2 Destination Image Scale
The destination image scale was composed of twenty items. Participants were asked to rate the
degree to which each item influenced their opinions about Vancouver Island as a tourist
destination. The frequencies of response for each item can be seen in Table 9.
Table 9. Frequencies of response for Vancouver Island destination image items (bold numbers indicate most frequently recorded response).
Item n Not
Important
%(1)
%(2) %(3) %(4) Very
Important
%(5)
95%
CI
SD mean
Parks & protected areas
388 0 1.3 5.9 15.5 77.3 + 0.064 .642 4.69
Local wine, beer, etc. 386 27.5 23.3 25.4 15.5 8.3 + 0.127 1.269 2.54
Unique/rare animals 385 1 3.4 14.8 27 53.8 + 0.090 .912 4.29
Nightlife/Entertainment 388 37.6 30.9 21.6 8.2 1.5 + 0.102 1.031 2.05
Quality Restaurants 387 8.3 12.9 36.7 31.5 10.6 + 0.106 1.071 3.23
Nature-based tours 388 5.4 11.1 23.7 37.4 22.4 + 0.110 1.112 3.60
Camping 389 6.2 6.7 15.4 26.5 45.2 + 0.120 1.197 3.98
Unique/rare plants 389 2.6 11.6 20.3 27.8 37.8 + 0.112 1.123 3.87
Fishing 387 19.9 19.6 20.7 17.8 22 + 0.143 1.433 3.02
Festivals, concerts, markets, museums, etc.
386 7.8 21.5 28.8 31.1 10.9 + 0.112 1.118 3.16
Colonial era history/structures
387 5.9 14 34.1 32.6 13.4 + 0.106 1.063 3.34
Quality accommodation 385 6 13.5 30.6 36.9 13 + 0.106 1.061 3.37
Diving/snorkeling 385 25.7 23.1 25.7 16.9 8.6 + 0.127 1.269 2.59
Tourist information centres
388 3.6 9 29.6 36.1 21.6 + 0.102 1.032 3.63
Natural scenery 386 0 0.5 2.8 14.8 81.9 + 0.051 .510 4.78
Mild weather 386 6.7 9.1 30.3 35.5 18.4 + 0.110 1.098 3.50
Aboriginal culture/history
388 2.8 8.8 25 35.1 28.4 + 0.104 1.044 3.77
Local food 388 1.8 6.4 25.5 41 25.3 + 0.094 .946 3.81
Hiking 388 2.3 2.6 10.8 26.8 57.5 + 0.094 .937 4.35
Transportation networks
387 3.6 10.6 28.7 34.9 22.2 + 0.106 1.055 3.61
In order to develop destination image factors to be used in regression analysis principle
component analysis with varimax rotation was applied to the scale of twenty items commonly
associated with Vancouver Island’s tourism industry. At the same time Cronbach’s alpha was
used to test the reliability of the scale. Cronbach’s alpha revealed that the overall reliability of
the destination image scale was quite high (Cronbach’s α = .787). The Kaiser-Meyer-Olkin
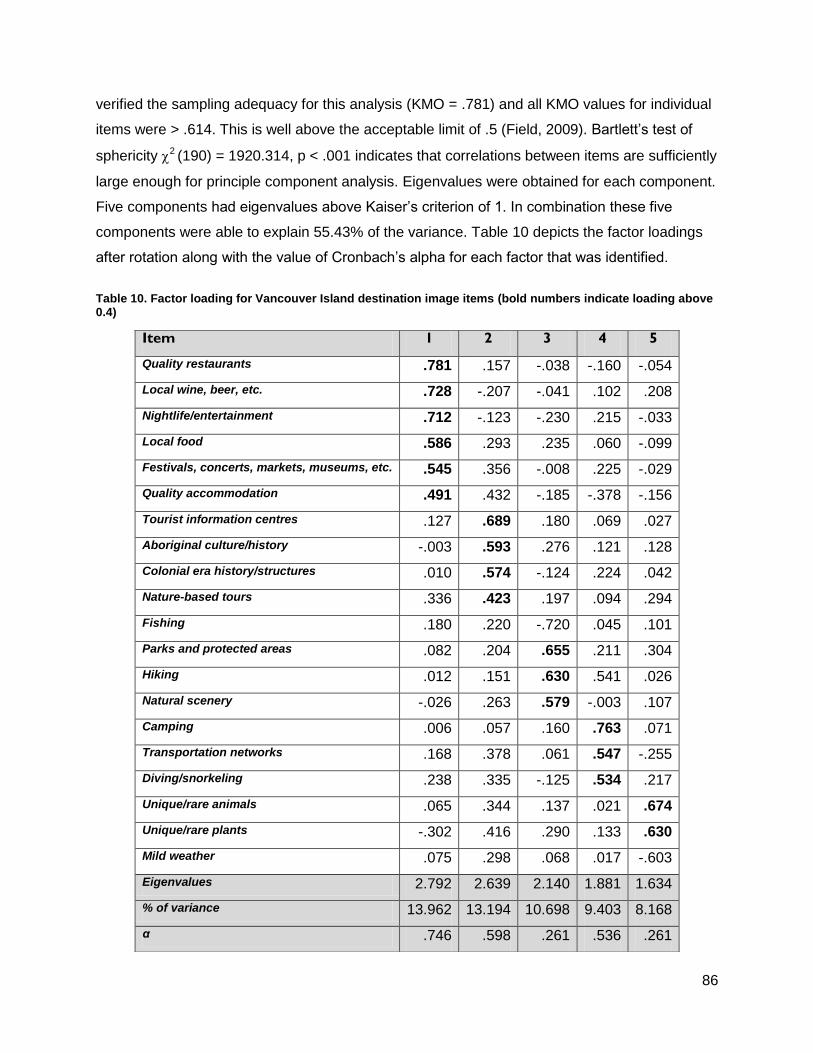
86
verified the sampling adequacy for this analysis (KMO = .781) and all KMO values for individual
items were > .614. This is well above the acceptable limit of .5 (Field, 2009). Bartlett’s test of
sphericity 2 (190) = 1920.314, p < .001 indicates that correlations between items are sufficiently
large enough for principle component analysis. Eigenvalues were obtained for each component.
Five components had eigenvalues above Kaiser’s criterion of 1. In combination these five
components were able to explain 55.43% of the variance. Table 10 depicts the factor loadings
after rotation along with the value of Cronbach’s alpha for each factor that was identified.
Table 10. Factor loading for Vancouver Island destination image items (bold numbers indicate loading above 0.4)
Item 1 2 3 4 5
Quality restaurants .781 .157 -.038 -.160 -.054
Local wine, beer, etc. .728 -.207 -.041 .102 .208
Nightlife/entertainment .712 -.123 -.230 .215 -.033
Local food .586 .293 .235 .060 -.099
Festivals, concerts, markets, museums, etc. .545 .356 -.008 .225 -.029
Quality accommodation .491 .432 -.185 -.378 -.156
Tourist information centres .127 .689 .180 .069 .027
Aboriginal culture/history -.003 .593 .276 .121 .128
Colonial era history/structures .010 .574 -.124 .224 .042
Nature-based tours .336 .423 .197 .094 .294
Fishing .180 .220 -.720 .045 .101
Parks and protected areas .082 .204 .655 .211 .304
Hiking .012 .151 .630 .541 .026
Natural scenery -.026 .263 .579 -.003 .107
Camping .006 .057 .160 .763 .071
Transportation networks .168 .378 .061 .547 -.255
Diving/snorkeling .238 .335 -.125 .534 .217
Unique/rare animals .065 .344 .137 .021 .674
Unique/rare plants -.302 .416 .290 .133 .630
Mild weather .075 .298 .068 .017 -.603
Eigenvalues 2.792 2.639 2.140 1.881 1.634
% of variance 13.962 13.194 10.698 9.403 8.168
α .746 .598 .261 .536 .261
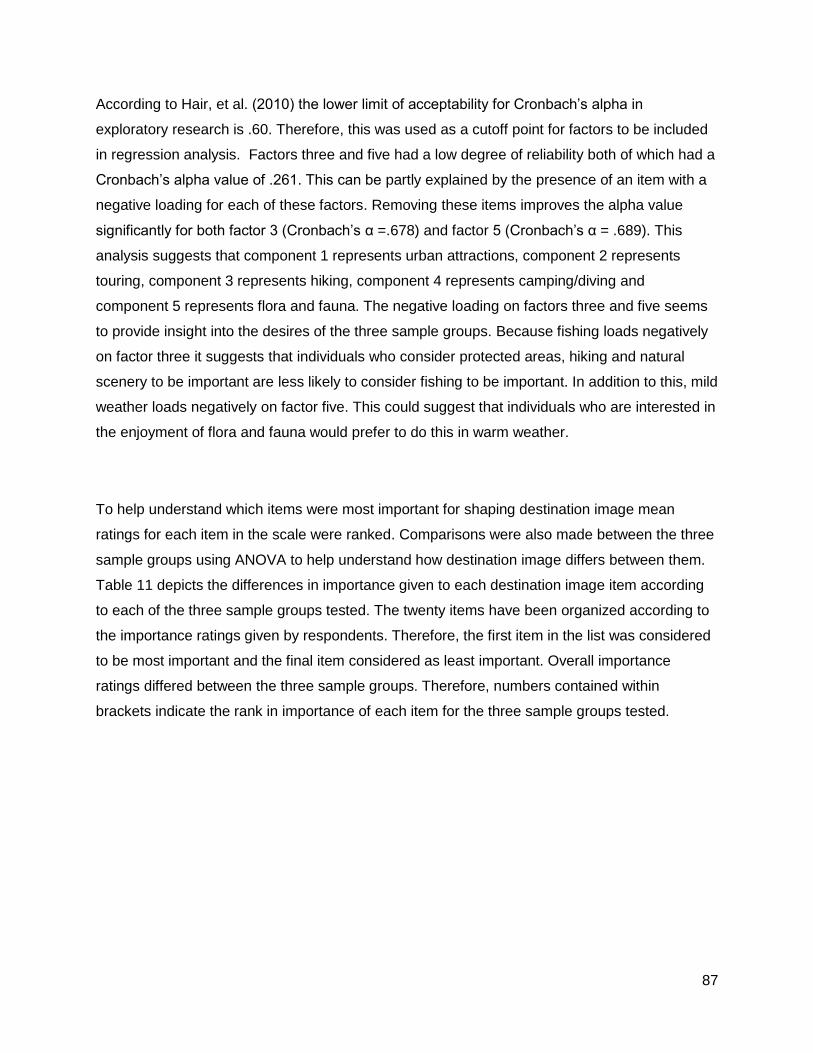
87
According to Hair, et al. (2010) the lower limit of acceptability for Cronbach’s alpha in
exploratory research is .60. Therefore, this was used as a cutoff point for factors to be included
in regression analysis. Factors three and five had a low degree of reliability both of which had a
Cronbach’s alpha value of .261. This can be partly explained by the presence of an item with a
negative loading for each of these factors. Removing these items improves the alpha value
significantly for both factor 3 (Cronbach’s α =.678) and factor 5 (Cronbach’s α = .689). This
analysis suggests that component 1 represents urban attractions, component 2 represents
touring, component 3 represents hiking, component 4 represents camping/diving and
component 5 represents flora and fauna. The negative loading on factors three and five seems
to provide insight into the desires of the three sample groups. Because fishing loads negatively
on factor three it suggests that individuals who consider protected areas, hiking and natural
scenery to be important are less likely to consider fishing to be important. In addition to this, mild
weather loads negatively on factor five. This could suggest that individuals who are interested in
the enjoyment of flora and fauna would prefer to do this in warm weather.
To help understand which items were most important for shaping destination image mean
ratings for each item in the scale were ranked. Comparisons were also made between the three
sample groups using ANOVA to help understand how destination image differs between them.
Table 11 depicts the differences in importance given to each destination image item according
to each of the three sample groups tested. The twenty items have been organized according to
the importance ratings given by respondents. Therefore, the first item in the list was considered
to be most important and the final item considered as least important. Overall importance
ratings differed between the three sample groups. Therefore, numbers contained within
brackets indicate the rank in importance of each item for the three sample groups tested.
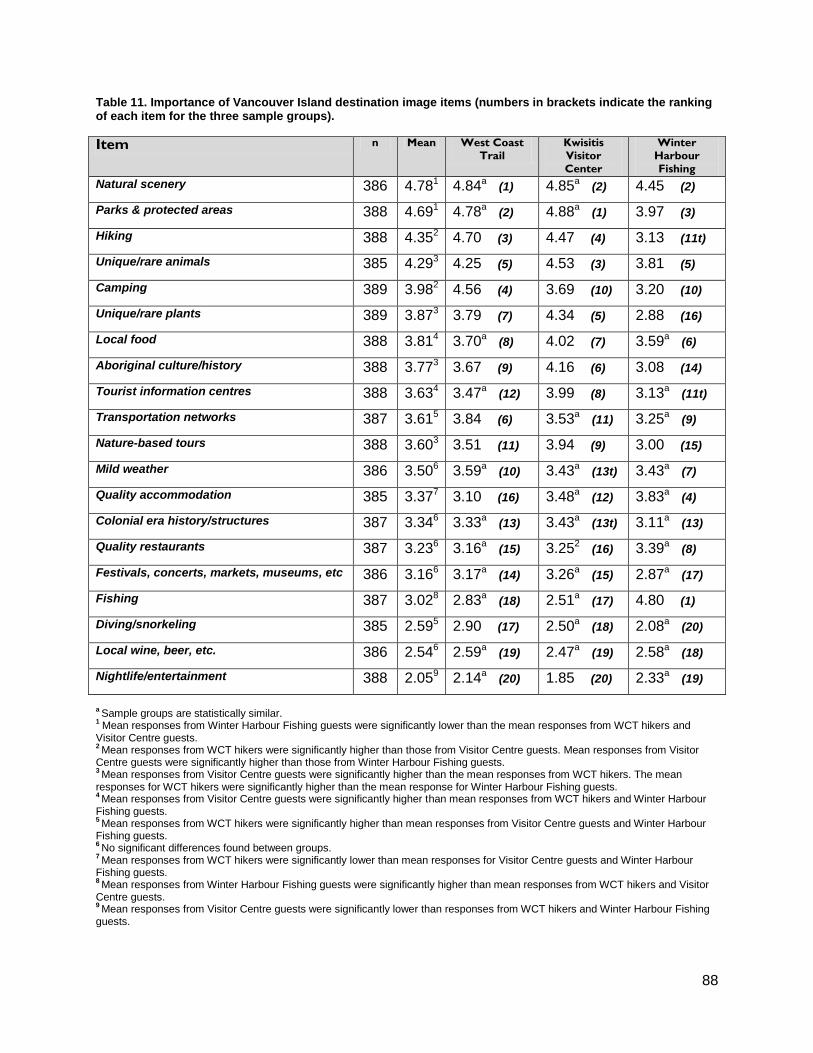
88
Table 11. Importance of Vancouver Island destination image items (numbers in brackets indicate the ranking of each item for the three sample groups).
Item n Mean West Coast
Trail
Kwisitis
Visitor
Center
Winter
Harbour
Fishing
Natural scenery 386 4.781 4.84a (1) 4.85a (2) 4.45 (2)
Parks & protected areas 388 4.691 4.78a (2) 4.88a (1) 3.97 (3)
Hiking 388 4.352 4.70 (3) 4.47 (4) 3.13 (11t)
Unique/rare animals 385 4.293 4.25 (5) 4.53 (3) 3.81 (5)
Camping 389 3.982 4.56 (4) 3.69 (10) 3.20 (10)
Unique/rare plants 389 3.873 3.79 (7) 4.34 (5) 2.88 (16)
Local food 388 3.814 3.70a (8) 4.02 (7) 3.59a (6)
Aboriginal culture/history 388 3.773 3.67 (9) 4.16 (6) 3.08 (14)
Tourist information centres 388 3.634 3.47a (12) 3.99 (8) 3.13a (11t)
Transportation networks 387 3.615 3.84 (6) 3.53a (11) 3.25a (9)
Nature-based tours 388 3.603 3.51 (11) 3.94 (9) 3.00 (15)
Mild weather 386 3.506 3.59a (10) 3.43a (13t) 3.43a (7)
Quality accommodation 385 3.377 3.10 (16) 3.48a (12) 3.83a (4)
Colonial era history/structures 387 3.346 3.33a (13) 3.43a (13t) 3.11a (13)
Quality restaurants 387 3.236 3.16a (15) 3.252 (16) 3.39a (8)
Festivals, concerts, markets, museums, etc 386 3.166 3.17a (14) 3.26a (15) 2.87a (17)
Fishing 387 3.028 2.83a (18) 2.51a (17) 4.80 (1)
Diving/snorkeling 385 2.595 2.90 (17) 2.50a (18) 2.08a (20)
Local wine, beer, etc. 386 2.546 2.59a (19) 2.47a (19) 2.58a (18)
Nightlife/entertainment 388 2.059 2.14a (20) 1.85 (20) 2.33a (19)
a Sample groups are statistically similar.
1 Mean responses from Winter Harbour Fishing guests were significantly lower than the mean responses from WCT hikers and
Visitor Centre guests. 2 Mean responses from WCT hikers were significantly higher than those from Visitor Centre guests. Mean responses from Visitor
Centre guests were significantly higher than those from Winter Harbour Fishing guests. 3 Mean responses from Visitor Centre guests were significantly higher than the mean responses from WCT hikers. The mean
responses for WCT hikers were significantly higher than the mean response for Winter Harbour Fishing guests. 4 Mean responses from Visitor Centre guests were significantly higher than mean responses from WCT hikers and Winter Harbour
Fishing guests. 5 Mean responses from WCT hikers were significantly higher than mean responses from Visitor Centre guests and Winter Harbour
Fishing guests. 6 No significant differences found between groups.
7 Mean responses from WCT hikers were significantly lower than mean responses for Visitor Centre guests and Winter Harbour
Fishing guests. 8 Mean responses from Winter Harbour Fishing guests were significantly higher than mean responses from WCT hikers and Visitor
Centre guests. 9 Mean responses from Visitor Centre guests were significantly lower than responses from WCT hikers and Winter Harbour Fishing
guests.
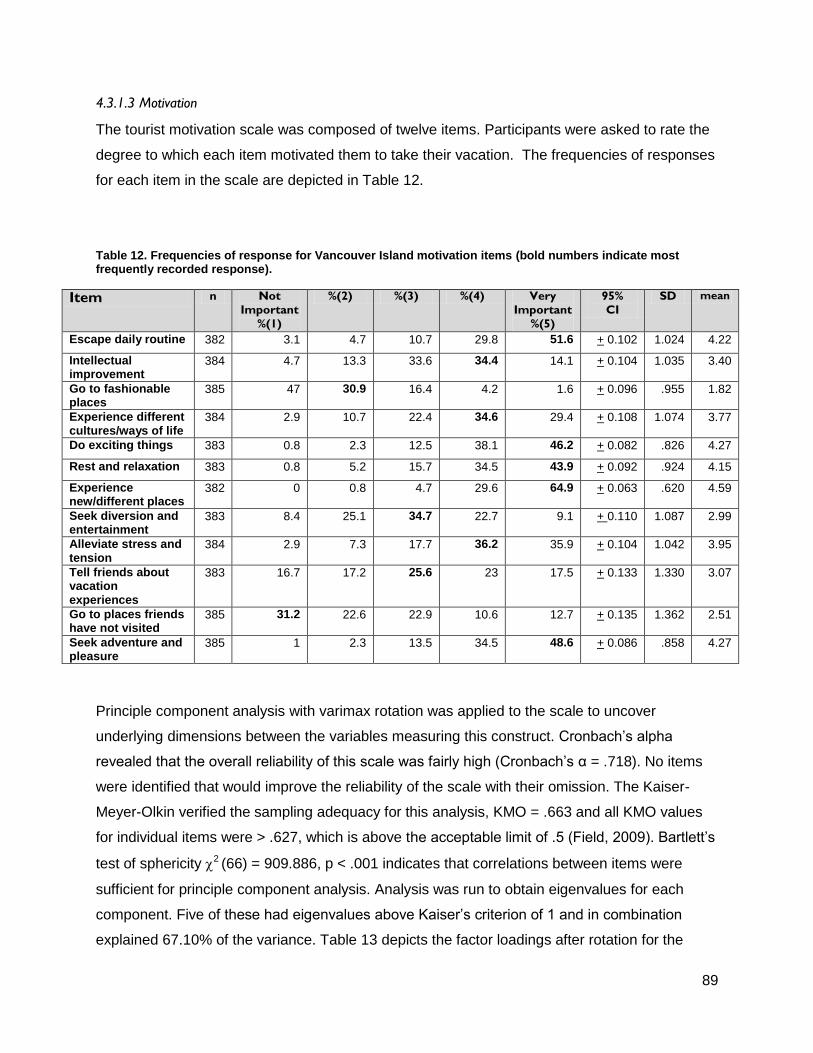
89
4.3.1.3 Motivation
The tourist motivation scale was composed of twelve items. Participants were asked to rate the
degree to which each item motivated them to take their vacation. The frequencies of responses
for each item in the scale are depicted in Table 12.
Table 12. Frequencies of response for Vancouver Island motivation items (bold numbers indicate most frequently recorded response).
Item n Not
Important
%(1)
%(2) %(3) %(4) Very
Important
%(5)
95%
CI
SD mean
Escape daily routine 382 3.1 4.7 10.7 29.8 51.6 + 0.102 1.024 4.22
Intellectual improvement
384 4.7 13.3 33.6 34.4 14.1 + 0.104 1.035 3.40
Go to fashionable places
385 47 30.9 16.4 4.2 1.6 + 0.096 .955 1.82
Experience different cultures/ways of life
384 2.9 10.7 22.4 34.6 29.4 + 0.108 1.074 3.77
Do exciting things 383 0.8 2.3 12.5 38.1 46.2 + 0.082 .826 4.27
Rest and relaxation 383 0.8 5.2 15.7 34.5 43.9 + 0.092 .924 4.15
Experience new/different places
382 0 0.8 4.7 29.6 64.9 + 0.063 .620 4.59
Seek diversion and entertainment
383 8.4 25.1 34.7 22.7 9.1 + 0.110 1.087 2.99
Alleviate stress and tension
384 2.9 7.3 17.7 36.2 35.9 + 0.104 1.042 3.95
Tell friends about vacation experiences
383 16.7 17.2 25.6 23 17.5 + 0.133 1.330 3.07
Go to places friends have not visited
385 31.2 22.6 22.9 10.6 12.7 + 0.135 1.362 2.51
Seek adventure and pleasure
385 1 2.3 13.5 34.5 48.6 + 0.086 .858 4.27
Principle component analysis with varimax rotation was applied to the scale to uncover
underlying dimensions between the variables measuring this construct. Cronbach’s alpha
revealed that the overall reliability of this scale was fairly high (Cronbach’s α = .718). No items
were identified that would improve the reliability of the scale with their omission. The Kaiser-
Meyer-Olkin verified the sampling adequacy for this analysis, KMO = .663 and all KMO values
for individual items were > .627, which is above the acceptable limit of .5 (Field, 2009). Bartlett’s
test of sphericity 2 (66) = 909.886, p < .001 indicates that correlations between items were
sufficient for principle component analysis. Analysis was run to obtain eigenvalues for each
component. Five of these had eigenvalues above Kaiser’s criterion of 1 and in combination
explained 67.10% of the variance. Table 13 depicts the factor loadings after rotation for the
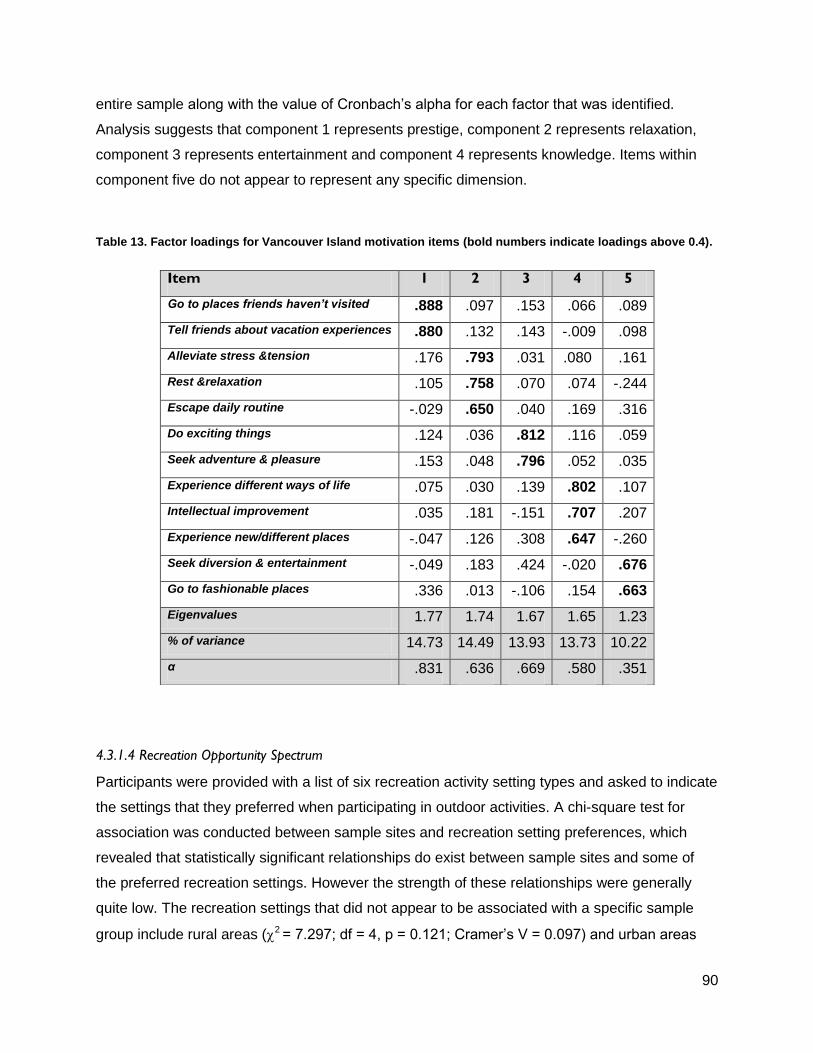
90
entire sample along with the value of Cronbach’s alpha for each factor that was identified.
Analysis suggests that component 1 represents prestige, component 2 represents relaxation,
component 3 represents entertainment and component 4 represents knowledge. Items within
component five do not appear to represent any specific dimension.
Table 13. Factor loadings for Vancouver Island motivation items (bold numbers indicate loadings above 0.4).
4.3.1.4 Recreation Opportunity Spectrum
Participants were provided with a list of six recreation activity setting types and asked to indicate
the settings that they preferred when participating in outdoor activities. A chi-square test for
association was conducted between sample sites and recreation setting preferences, which
revealed that statistically significant relationships do exist between sample sites and some of
the preferred recreation settings. However the strength of these relationships were generally
quite low. The recreation settings that did not appear to be associated with a specific sample
group include rural areas (2 = 7.297; df = 4, p = 0.121; Cramer’s V = 0.097) and urban areas
Item 1 2 3 4 5
Go to places friends haven’t visited .888 .097 .153 .066 .089
Tell friends about vacation experiences .880 .132 .143 -.009 .098
Alleviate stress &tension .176 .793 .031 .080 .161
Rest &relaxation .105 .758 .070 .074 -.244
Escape daily routine -.029 .650 .040 .169 .316
Do exciting things .124 .036 .812 .116 .059
Seek adventure & pleasure .153 .048 .796 .052 .035
Experience different ways of life .075 .030 .139 .802 .107
Intellectual improvement .035 .181 -.151 .707 .207
Experience new/different places -.047 .126 .308 .647 -.260
Seek diversion & entertainment -.049 .183 .424 -.020 .676
Go to fashionable places .336 .013 -.106 .154 .663
Eigenvalues 1.77 1.74 1.67 1.65 1.23
% of variance 14.73 14.49 13.93 13.73 10.22
α .831 .636 .669 .580 .351
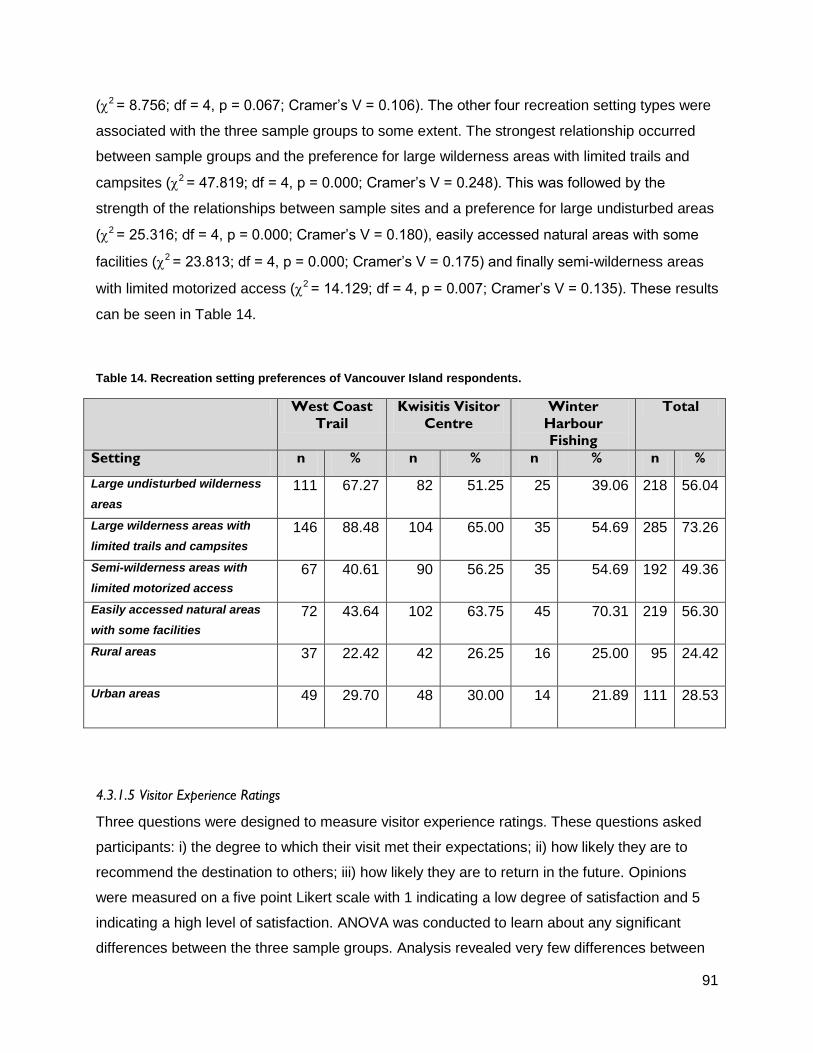
91
(2 = 8.756; df = 4, p = 0.067; Cramer’s V = 0.106). The other four recreation setting types were
associated with the three sample groups to some extent. The strongest relationship occurred
between sample groups and the preference for large wilderness areas with limited trails and
campsites (2 = 47.819; df = 4, p = 0.000; Cramer’s V = 0.248). This was followed by the
strength of the relationships between sample sites and a preference for large undisturbed areas
(2 = 25.316; df = 4, p = 0.000; Cramer’s V = 0.180), easily accessed natural areas with some
facilities (2 = 23.813; df = 4, p = 0.000; Cramer’s V = 0.175) and finally semi-wilderness areas
with limited motorized access (2 = 14.129; df = 4, p = 0.007; Cramer’s V = 0.135). These results
can be seen in Table 14.
Table 14. Recreation setting preferences of Vancouver Island respondents.
West Coast
Trail
Kwisitis Visitor
Centre
Winter
Harbour
Fishing
Total
Setting n % n % n % n %
Large undisturbed wilderness
areas
111 67.27 82 51.25 25 39.06 218 56.04
Large wilderness areas with
limited trails and campsites
146 88.48 104 65.00 35 54.69 285 73.26
Semi-wilderness areas with
limited motorized access
67 40.61 90 56.25 35 54.69 192 49.36
Easily accessed natural areas
with some facilities
72 43.64 102 63.75 45 70.31 219 56.30
Rural areas
37 22.42 42 26.25 16 25.00 95 24.42
Urban areas
49 29.70 48 30.00 14 21.89 111 28.53
4.3.1.5 Visitor Experience Ratings
Three questions were designed to measure visitor experience ratings. These questions asked
participants: i) the degree to which their visit met their expectations; ii) how likely they are to
recommend the destination to others; iii) how likely they are to return in the future. Opinions
were measured on a five point Likert scale with 1 indicating a low degree of satisfaction and 5
indicating a high level of satisfaction. ANOVA was conducted to learn about any significant
differences between the three sample groups. Analysis revealed very few differences between
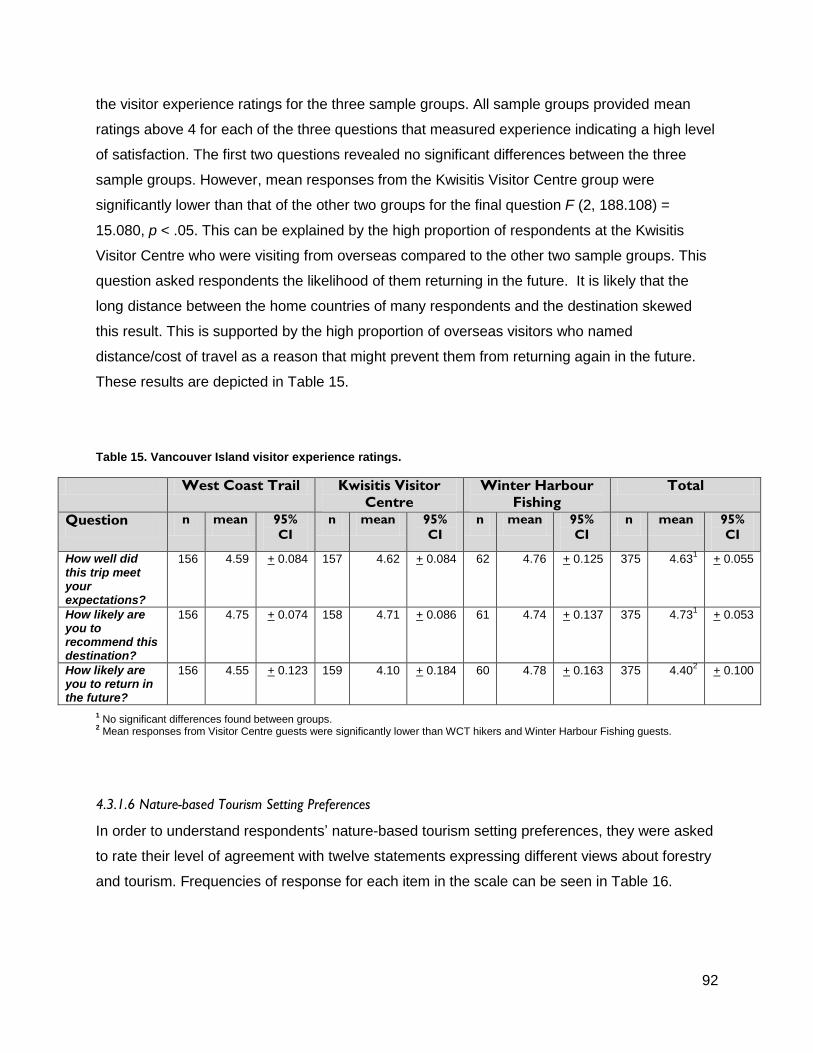
92
the visitor experience ratings for the three sample groups. All sample groups provided mean
ratings above 4 for each of the three questions that measured experience indicating a high level
of satisfaction. The first two questions revealed no significant differences between the three
sample groups. However, mean responses from the Kwisitis Visitor Centre group were
significantly lower than that of the other two groups for the final question F (2, 188.108) =
15.080, p < .05. This can be explained by the high proportion of respondents at the Kwisitis
Visitor Centre who were visiting from overseas compared to the other two sample groups. This
question asked respondents the likelihood of them returning in the future. It is likely that the
long distance between the home countries of many respondents and the destination skewed
this result. This is supported by the high proportion of overseas visitors who named
distance/cost of travel as a reason that might prevent them from returning again in the future.
These results are depicted in Table 15.
Table 15. Vancouver Island visitor experience ratings.
West Coast Trail Kwisitis Visitor
Centre
Winter Harbour
Fishing
Total
Question n mean 95%
CI
n mean 95%
CI
n mean 95%
CI
n mean 95%
CI
How well did this trip meet your expectations?
156 4.59 + 0.084 157 4.62 + 0.084 62 4.76 + 0.125 375 4.631
+ 0.055
How likely are you to recommend this destination?
156 4.75 + 0.074 158 4.71 + 0.086 61 4.74 + 0.137 375 4.731
+ 0.053
How likely are you to return in the future?
156 4.55 + 0.123 159 4.10 + 0.184 60 4.78 + 0.163 375 4.402
+ 0.100
1 No significant differences found between groups.
2 Mean responses from Visitor Centre guests were significantly lower than WCT hikers and Winter Harbour Fishing guests.
4.3.1.6 Nature-based Tourism Setting Preferences
In order to understand respondents’ nature-based tourism setting preferences, they were asked
to rate their level of agreement with twelve statements expressing different views about forestry
and tourism. Frequencies of response for each item in the scale can be seen in Table 16.
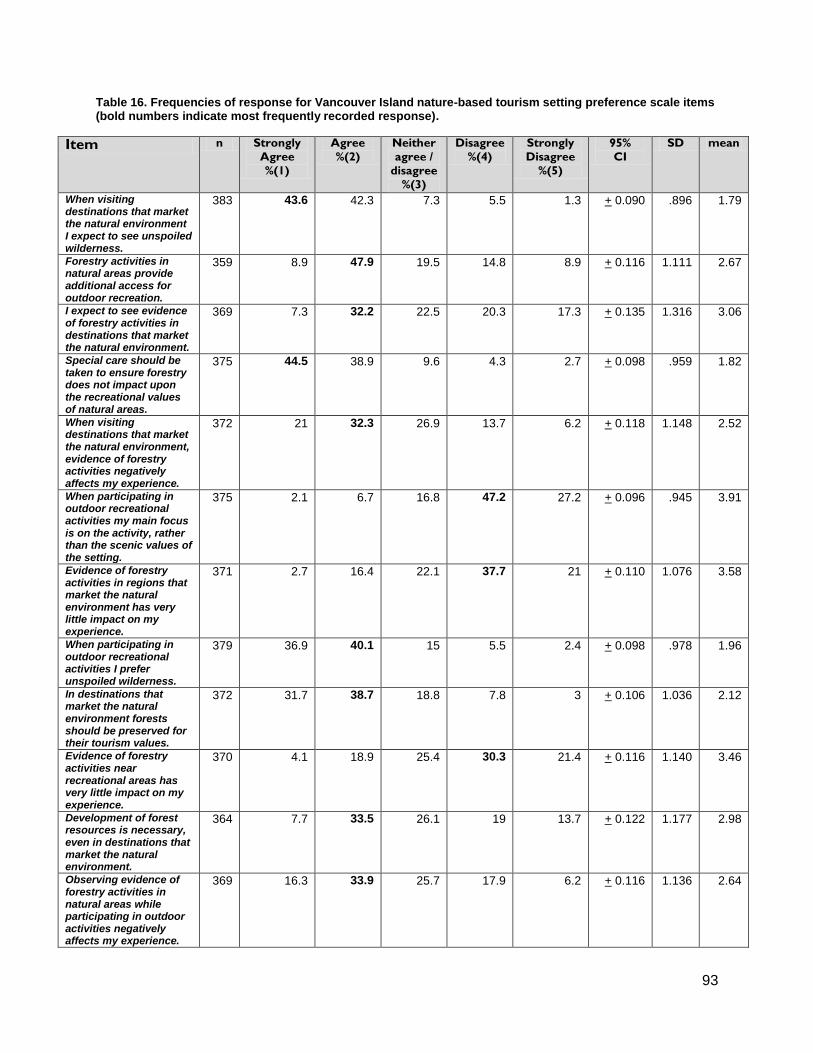
93
Table 16. Frequencies of response for Vancouver Island nature-based tourism setting preference scale items (bold numbers indicate most frequently recorded response).
Item n Strongly
Agree
%(1)
Agree
%(2)
Neither
agree /
disagree
%(3)
Disagree
%(4)
Strongly
Disagree
%(5)
95%
CI
SD mean
When visiting destinations that market the natural environment I expect to see unspoiled wilderness.
383 43.6 42.3 7.3 5.5 1.3 + 0.090 .896 1.79
Forestry activities in natural areas provide additional access for outdoor recreation.
359 8.9 47.9 19.5 14.8 8.9 + 0.116 1.111 2.67
I expect to see evidence of forestry activities in destinations that market the natural environment.
369 7.3 32.2 22.5 20.3 17.3 + 0.135 1.316 3.06
Special care should be taken to ensure forestry does not impact upon the recreational values of natural areas.
375 44.5 38.9 9.6 4.3 2.7 + 0.098 .959 1.82
When visiting destinations that market the natural environment, evidence of forestry activities negatively affects my experience.
372 21 32.3 26.9 13.7 6.2 + 0.118 1.148 2.52
When participating in outdoor recreational activities my main focus is on the activity, rather than the scenic values of the setting.
375 2.1 6.7 16.8 47.2 27.2 + 0.096 .945 3.91
Evidence of forestry activities in regions that market the natural environment has very little impact on my experience.
371 2.7 16.4 22.1 37.7 21 + 0.110 1.076 3.58
When participating in outdoor recreational activities I prefer unspoiled wilderness.
379 36.9 40.1 15 5.5 2.4 + 0.098 .978 1.96
In destinations that market the natural environment forests should be preserved for their tourism values.
372 31.7 38.7 18.8 7.8 3 + 0.106 1.036 2.12
Evidence of forestry activities near recreational areas has very little impact on my experience.
370 4.1 18.9 25.4 30.3 21.4 + 0.116 1.140 3.46
Development of forest resources is necessary, even in destinations that market the natural environment.
364 7.7 33.5 26.1 19 13.7 + 0.122 1.177 2.98
Observing evidence of forestry activities in natural areas while participating in outdoor activities negatively affects my experience.
369 16.3 33.9 25.7 17.9 6.2 + 0.116 1.136 2.64
94
Principle component analysis with varimax rotation was applied to this scale. Cronbach’s alpha
revealed that the overall reliability of the questionnaire was very high (Cronbach’s α = .885).
Analysis revealed that removal of the sixth item in list would improve the reliability of the scale
with its removal. However, the improvement was minimal (Cronbach’s α = .890) so the item was
retained for the analysis. The Kaiser-Meyer-Olkin verified the sampling adequacy for this
analysis, KMO = .900 and all KMO values for individual items were > .778. Bartlett’s test of
sphericity 2 (66) = 1551.389, p < .001 indicates that correlations between items were
sufficiently high enough for principle component analysis. Analysis was run to obtain
eigenvalues for each component. Two of these had eigenvalues above Kaiser’s criterion of 1
and in combination explained 55.48% of the variance. Table 17 shows the factor loadings after
rotation along with the value of Cronbach’s alpha for each of the two factors that were identified.
Analysis suggests that component 1 represents a high degree of acceptance for settings with
visible forest industry impacts, while 5 represents a low degree of acceptance for these settings.
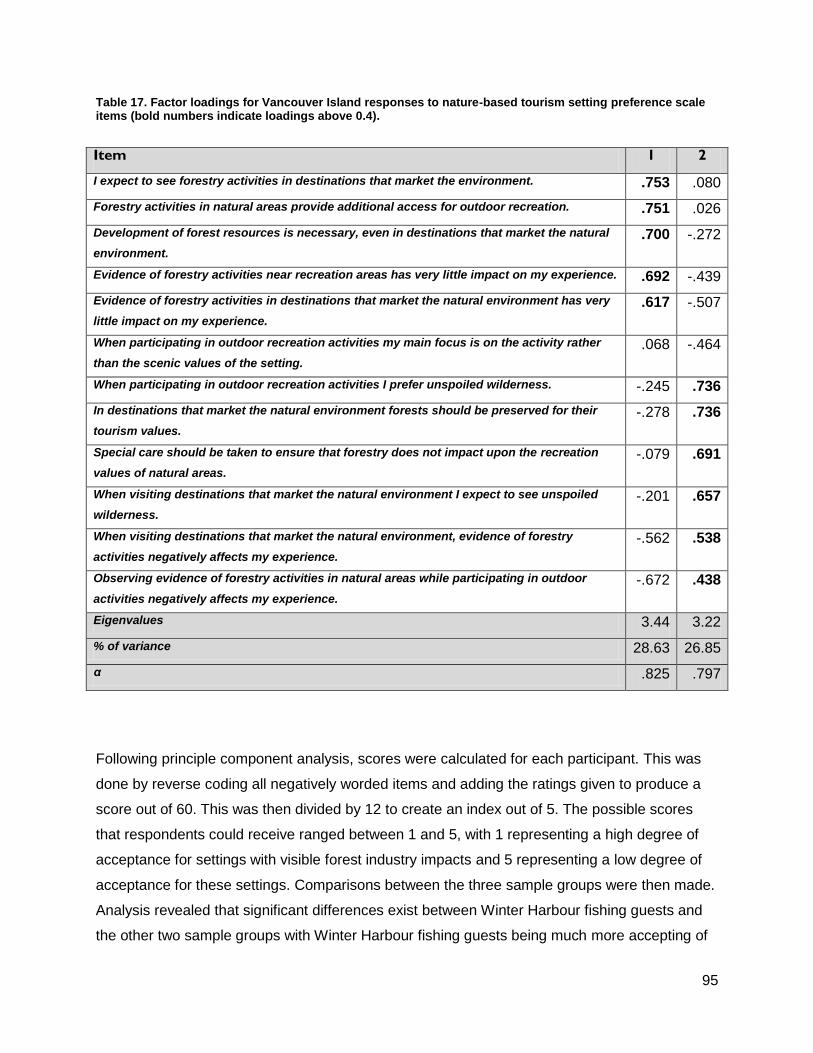
95
Table 17. Factor loadings for Vancouver Island responses to nature-based tourism setting preference scale items (bold numbers indicate loadings above 0.4).
Following principle component analysis, scores were calculated for each participant. This was
done by reverse coding all negatively worded items and adding the ratings given to produce a
score out of 60. This was then divided by 12 to create an index out of 5. The possible scores
that respondents could receive ranged between 1 and 5, with 1 representing a high degree of
acceptance for settings with visible forest industry impacts and 5 representing a low degree of
acceptance for these settings. Comparisons between the three sample groups were then made.
Analysis revealed that significant differences exist between Winter Harbour fishing guests and
the other two sample groups with Winter Harbour fishing guests being much more accepting of
Item 1 2
I expect to see forestry activities in destinations that market the environment. .753 .080
Forestry activities in natural areas provide additional access for outdoor recreation. .751 .026
Development of forest resources is necessary, even in destinations that market the natural
environment.
.700 -.272
Evidence of forestry activities near recreation areas has very little impact on my experience. .692 -.439
Evidence of forestry activities in destinations that market the natural environment has very
little impact on my experience.
.617 -.507
When participating in outdoor recreation activities my main focus is on the activity rather
than the scenic values of the setting.
.068 -.464
When participating in outdoor recreation activities I prefer unspoiled wilderness. -.245 .736
In destinations that market the natural environment forests should be preserved for their
tourism values.
-.278 .736
Special care should be taken to ensure that forestry does not impact upon the recreation
values of natural areas.
-.079 .691
When visiting destinations that market the natural environment I expect to see unspoiled
wilderness.
-.201 .657
When visiting destinations that market the natural environment, evidence of forestry
activities negatively affects my experience.
-.562 .538
Observing evidence of forestry activities in natural areas while participating in outdoor
activities negatively affects my experience.
-.672 .438
Eigenvalues 3.44 3.22
% of variance 28.63 26.85
α .825 .797
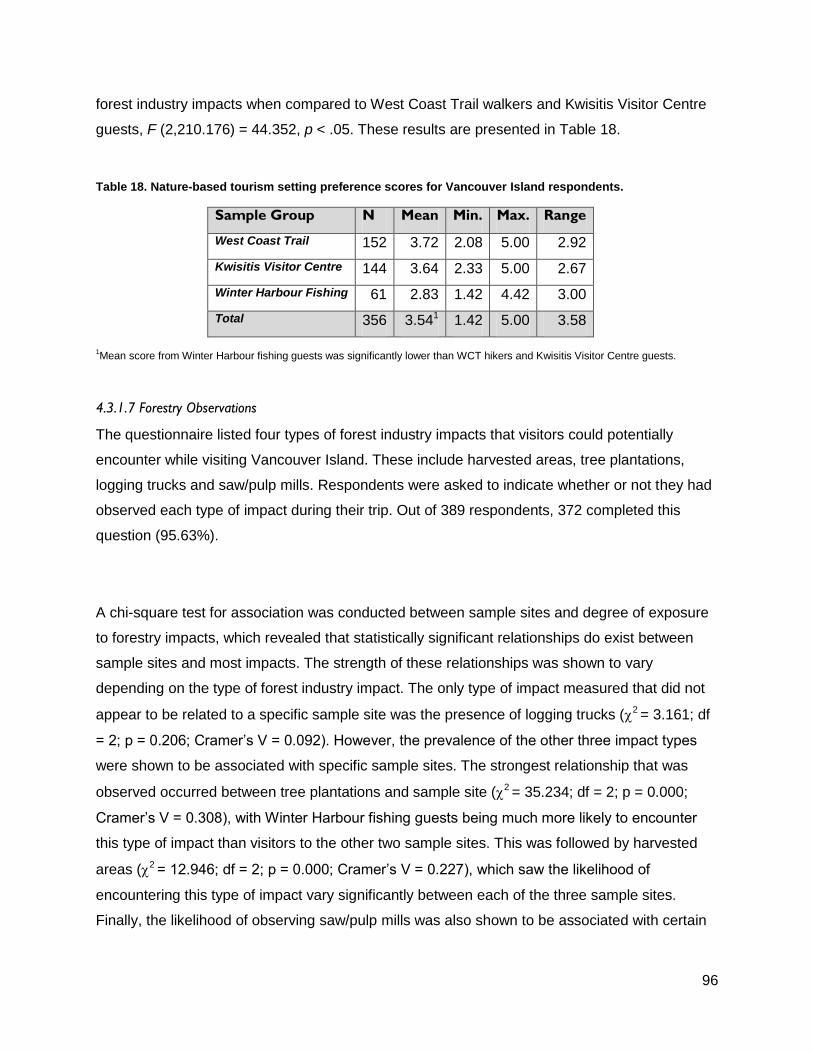
96
forest industry impacts when compared to West Coast Trail walkers and Kwisitis Visitor Centre
guests, F (2,210.176) = 44.352, p < .05. These results are presented in Table 18.
Table 18. Nature-based tourism setting preference scores for Vancouver Island respondents.
Sample Group N Mean Min. Max. Range
West Coast Trail 152 3.72 2.08 5.00 2.92
Kwisitis Visitor Centre 144 3.64 2.33 5.00 2.67
Winter Harbour Fishing 61 2.83 1.42 4.42 3.00
Total 356 3.541 1.42 5.00 3.58
1Mean score from Winter Harbour fishing guests was significantly lower than WCT hikers and Kwisitis Visitor Centre guests.
4.3.1.7 Forestry Observations
The questionnaire listed four types of forest industry impacts that visitors could potentially
encounter while visiting Vancouver Island. These include harvested areas, tree plantations,
logging trucks and saw/pulp mills. Respondents were asked to indicate whether or not they had
observed each type of impact during their trip. Out of 389 respondents, 372 completed this
question (95.63%).
A chi-square test for association was conducted between sample sites and degree of exposure
to forestry impacts, which revealed that statistically significant relationships do exist between
sample sites and most impacts. The strength of these relationships was shown to vary
depending on the type of forest industry impact. The only type of impact measured that did not
appear to be related to a specific sample site was the presence of logging trucks (2 = 3.161; df
= 2; p = 0.206; Cramer’s V = 0.092). However, the prevalence of the other three impact types
were shown to be associated with specific sample sites. The strongest relationship that was
observed occurred between tree plantations and sample site (2 = 35.234; df = 2; p = 0.000;
Cramer’s V = 0.308), with Winter Harbour fishing guests being much more likely to encounter
this type of impact than visitors to the other two sample sites. This was followed by harvested
areas (2 = 12.946; df = 2; p = 0.000; Cramer’s V = 0.227), which saw the likelihood of
encountering this type of impact vary significantly between each of the three sample sites.
Finally, the likelihood of observing saw/pulp mills was also shown to be associated with certain
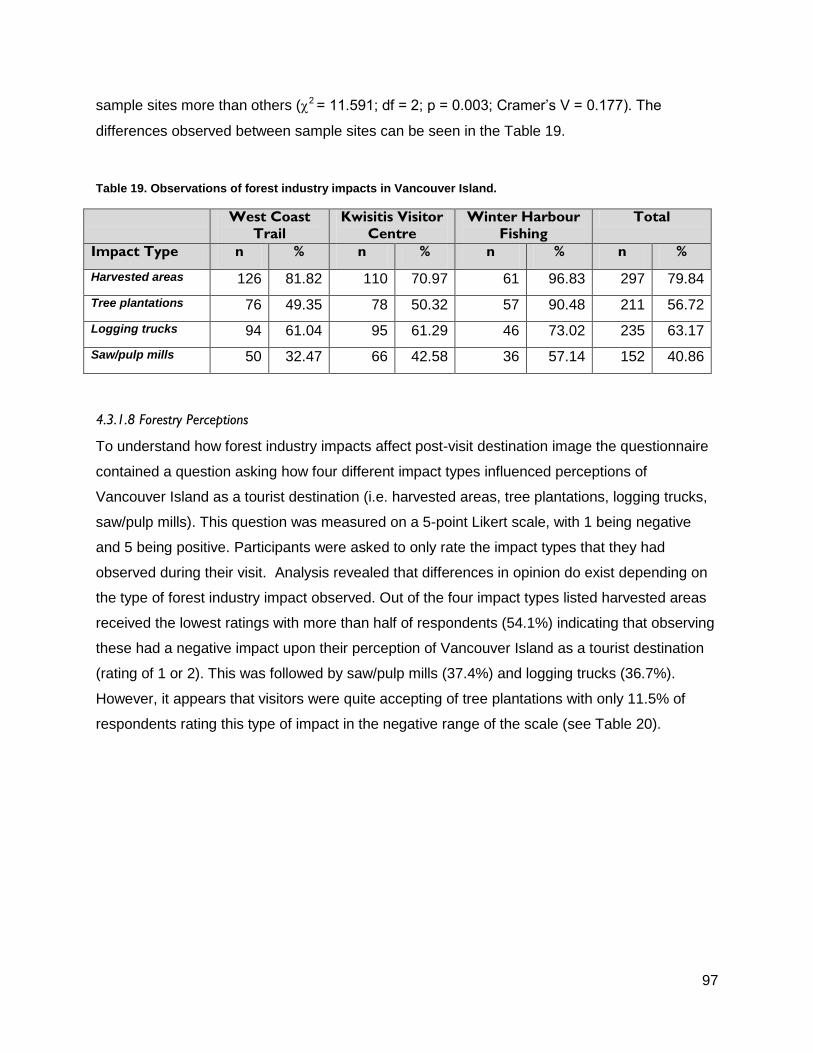
97
sample sites more than others (2 = 11.591; df = 2; p = 0.003; Cramer’s V = 0.177). The
differences observed between sample sites can be seen in the Table 19.
Table 19. Observations of forest industry impacts in Vancouver Island.
West Coast
Trail
Kwisitis Visitor
Centre
Winter Harbour
Fishing
Total
Impact Type n % n % n % n %
Harvested areas 126 81.82 110 70.97 61 96.83 297 79.84
Tree plantations 76 49.35 78 50.32 57 90.48 211 56.72
Logging trucks 94 61.04 95 61.29 46 73.02 235 63.17
Saw/pulp mills 50 32.47 66 42.58 36 57.14 152 40.86
4.3.1.8 Forestry Perceptions
To understand how forest industry impacts affect post-visit destination image the questionnaire
contained a question asking how four different impact types influenced perceptions of
Vancouver Island as a tourist destination (i.e. harvested areas, tree plantations, logging trucks,
saw/pulp mills). This question was measured on a 5-point Likert scale, with 1 being negative
and 5 being positive. Participants were asked to only rate the impact types that they had
observed during their visit. Analysis revealed that differences in opinion do exist depending on
the type of forest industry impact observed. Out of the four impact types listed harvested areas
received the lowest ratings with more than half of respondents (54.1%) indicating that observing
these had a negative impact upon their perception of Vancouver Island as a tourist destination
(rating of 1 or 2). This was followed by saw/pulp mills (37.4%) and logging trucks (36.7%).
However, it appears that visitors were quite accepting of tree plantations with only 11.5% of
respondents rating this type of impact in the negative range of the scale (see Table 20).
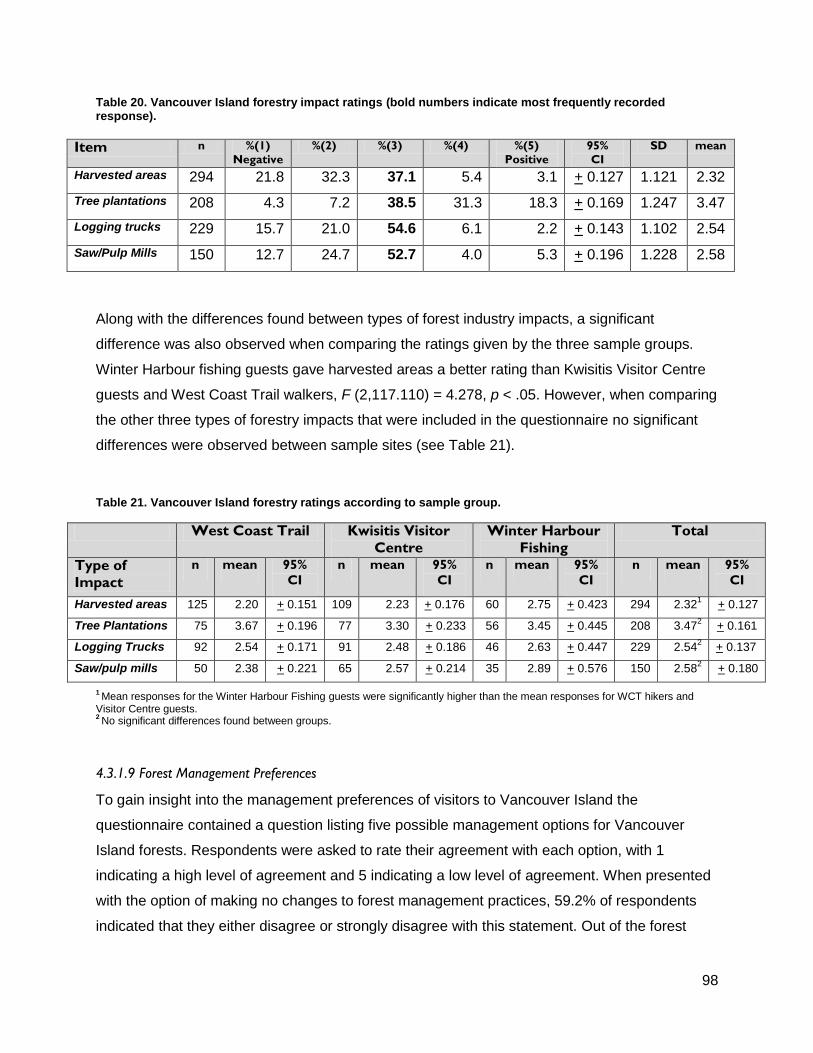
98
Table 20. Vancouver Island forestry impact ratings (bold numbers indicate most frequently recorded response).
Item n %(1)
Negative
%(2) %(3) %(4) %(5)
Positive
95%
CI
SD mean
Harvested areas 294 21.8 32.3 37.1 5.4 3.1 + 0.127 1.121 2.32
Tree plantations 208 4.3 7.2 38.5 31.3 18.3 + 0.169 1.247 3.47
Logging trucks 229 15.7 21.0 54.6 6.1 2.2 + 0.143 1.102 2.54
Saw/Pulp Mills 150 12.7 24.7 52.7 4.0 5.3 + 0.196 1.228 2.58
Along with the differences found between types of forest industry impacts, a significant
difference was also observed when comparing the ratings given by the three sample groups.
Winter Harbour fishing guests gave harvested areas a better rating than Kwisitis Visitor Centre
guests and West Coast Trail walkers, F (2,117.110) = 4.278, p < .05. However, when comparing
the other three types of forestry impacts that were included in the questionnaire no significant
differences were observed between sample sites (see Table 21).
Table 21. Vancouver Island forestry ratings according to sample group.
West Coast Trail Kwisitis Visitor
Centre
Winter Harbour
Fishing
Total
Type of
Impact
n mean 95%
CI
n mean 95%
CI
n mean 95%
CI
n mean 95%
CI
Harvested areas 125 2.20 + 0.151 109 2.23 + 0.176 60 2.75 + 0.423 294 2.321
+ 0.127
Tree Plantations 75 3.67 + 0.196 77 3.30 + 0.233 56 3.45 + 0.445 208 3.472
+ 0.161
Logging Trucks 92 2.54 + 0.171 91 2.48 + 0.186 46 2.63 + 0.447 229 2.542
+ 0.137
Saw/pulp mills 50 2.38 + 0.221 65 2.57 + 0.214 35 2.89 + 0.576 150 2.582
+ 0.180
1 Mean responses for the Winter Harbour Fishing guests were significantly higher than the mean responses for WCT hikers and
Visitor Centre guests. 2 No significant differences found between groups.
4.3.1.9 Forest Management Preferences
To gain insight into the management preferences of visitors to Vancouver Island the
questionnaire contained a question listing five possible management options for Vancouver
Island forests. Respondents were asked to rate their agreement with each option, with 1
indicating a high level of agreement and 5 indicating a low level of agreement. When presented
with the option of making no changes to forest management practices, 59.2% of respondents
indicated that they either disagree or strongly disagree with this statement. Out of the forest
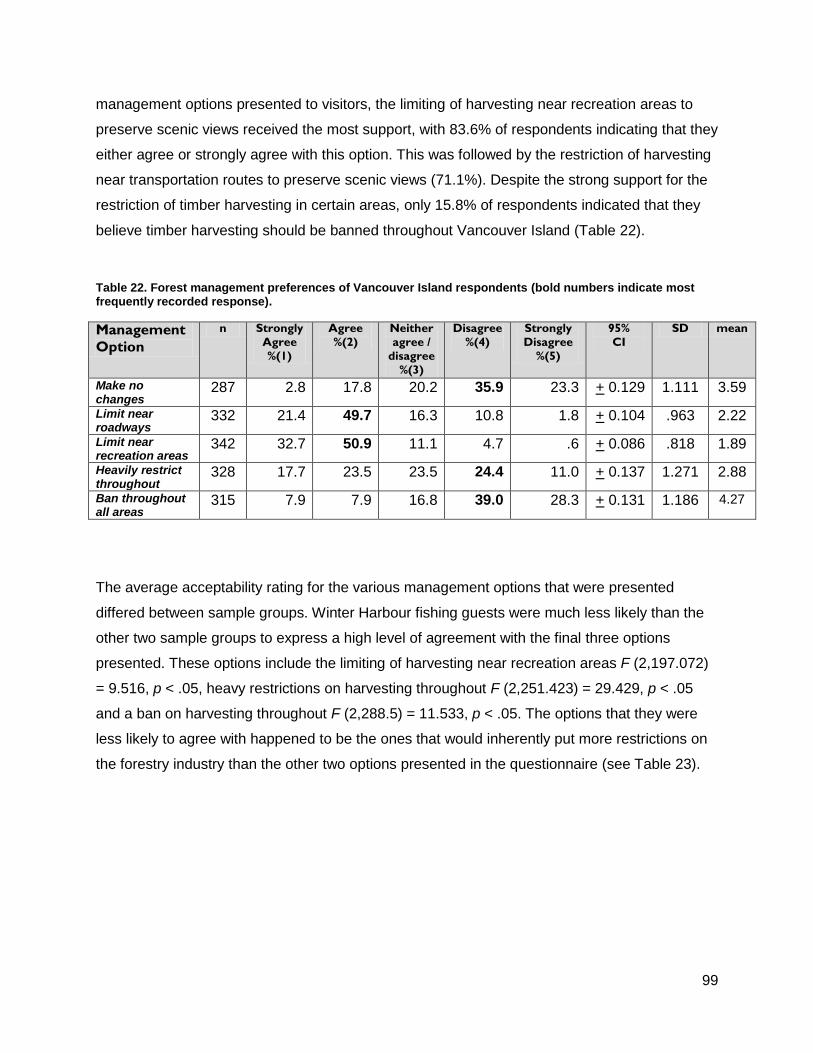
99
management options presented to visitors, the limiting of harvesting near recreation areas to
preserve scenic views received the most support, with 83.6% of respondents indicating that they
either agree or strongly agree with this option. This was followed by the restriction of harvesting
near transportation routes to preserve scenic views (71.1%). Despite the strong support for the
restriction of timber harvesting in certain areas, only 15.8% of respondents indicated that they
believe timber harvesting should be banned throughout Vancouver Island (Table 22).
Table 22. Forest management preferences of Vancouver Island respondents (bold numbers indicate most frequently recorded response).
Management
Option
n Strongly
Agree
%(1)
Agree
%(2)
Neither
agree /
disagree
%(3)
Disagree
%(4)
Strongly
Disagree
%(5)
95%
CI
SD mean
Make no changes
287 2.8 17.8 20.2 35.9 23.3 + 0.129 1.111 3.59
Limit near roadways
332 21.4 49.7 16.3 10.8 1.8 + 0.104 .963 2.22
Limit near recreation areas
342 32.7 50.9 11.1 4.7 .6 + 0.086 .818 1.89
Heavily restrict throughout
328 17.7 23.5 23.5 24.4 11.0 + 0.137 1.271 2.88
Ban throughout all areas
315 7.9 7.9 16.8 39.0 28.3 + 0.131 1.186 4.27
The average acceptability rating for the various management options that were presented
differed between sample groups. Winter Harbour fishing guests were much less likely than the
other two sample groups to express a high level of agreement with the final three options
presented. These options include the limiting of harvesting near recreation areas F (2,197.072)
= 9.516, p < .05, heavy restrictions on harvesting throughout F (2,251.423) = 29.429, p < .05
and a ban on harvesting throughout F (2,288.5) = 11.533, p < .05. The options that they were
less likely to agree with happened to be the ones that would inherently put more restrictions on
the forestry industry than the other two options presented in the questionnaire (see Table 23).
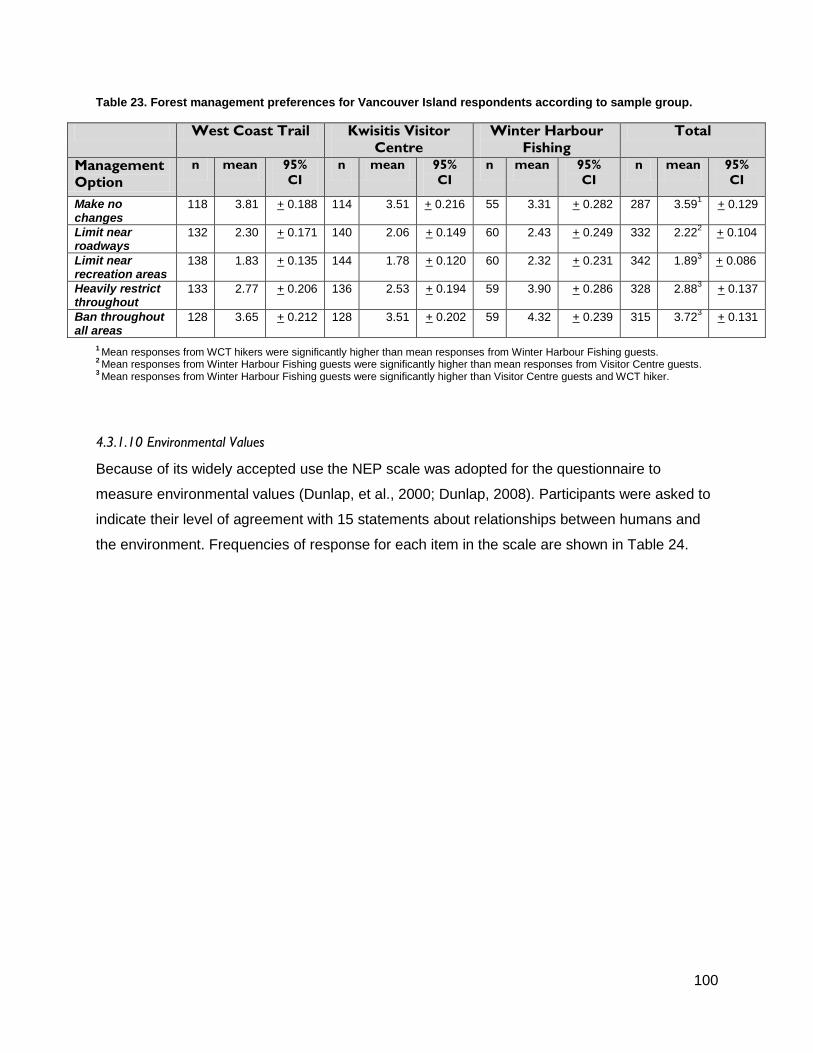
100
Table 23. Forest management preferences for Vancouver Island respondents according to sample group.
West Coast Trail Kwisitis Visitor
Centre
Winter Harbour
Fishing
Total
Management
Option
n mean 95%
CI
n mean 95%
CI
n mean 95%
CI
n mean 95%
CI
Make no changes
118 3.81 + 0.188 114 3.51 + 0.216 55 3.31 + 0.282 287 3.591
+ 0.129
Limit near roadways
132 2.30 + 0.171 140 2.06 + 0.149 60 2.43 + 0.249 332 2.222
+ 0.104
Limit near recreation areas
138 1.83 + 0.135 144 1.78 + 0.120 60 2.32 + 0.231 342 1.893
+ 0.086
Heavily restrict throughout
133 2.77 + 0.206 136 2.53 + 0.194 59 3.90 + 0.286 328 2.883
+ 0.137
Ban throughout all areas
128 3.65 + 0.212 128 3.51 + 0.202 59 4.32 + 0.239 315 3.723
+ 0.131
1 Mean responses from WCT hikers were significantly higher than mean responses from Winter Harbour Fishing guests.
2 Mean responses from Winter Harbour Fishing guests were significantly higher than mean responses from Visitor Centre guests.
3 Mean responses from Winter Harbour Fishing guests were significantly higher than Visitor Centre guests and WCT hiker.
4.3.1.10 Environmental Values
Because of its widely accepted use the NEP scale was adopted for the questionnaire to
measure environmental values (Dunlap, et al., 2000; Dunlap, 2008). Participants were asked to
indicate their level of agreement with 15 statements about relationships between humans and
the environment. Frequencies of response for each item in the scale are shown in Table 24.
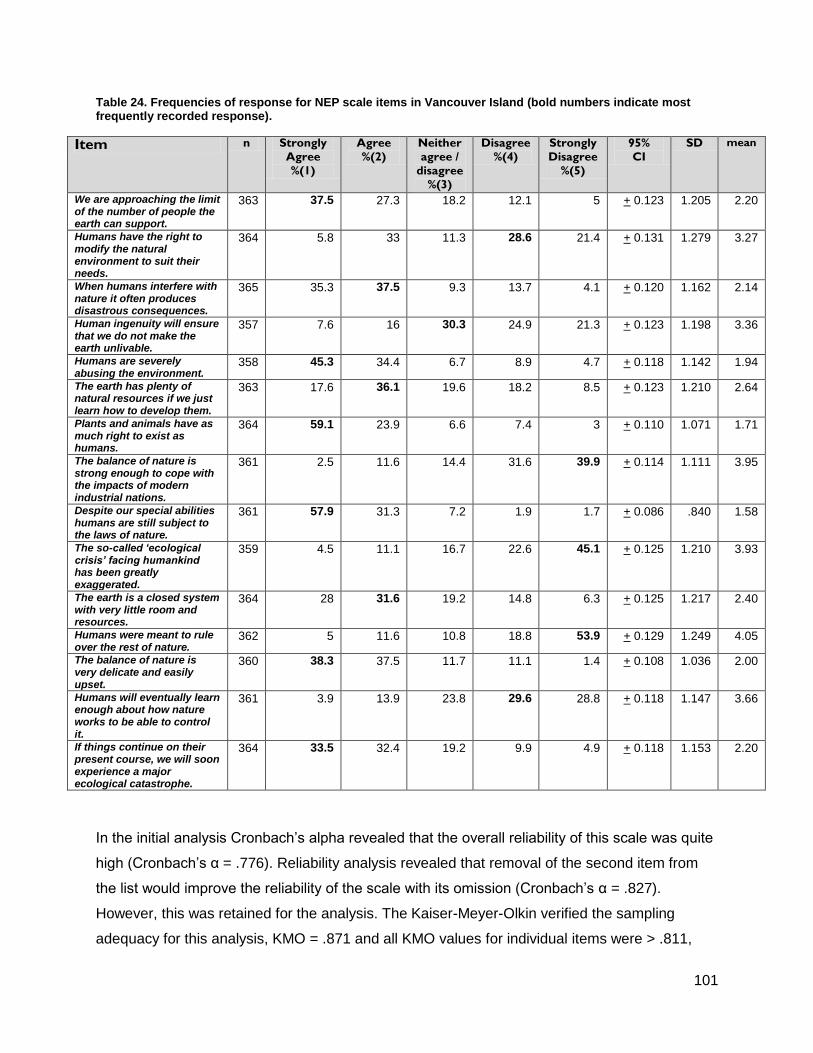
101
Table 24. Frequencies of response for NEP scale items in Vancouver Island (bold numbers indicate most frequently recorded response).
Item n Strongly
Agree
%(1)
Agree
%(2)
Neither
agree /
disagree
%(3)
Disagree
%(4)
Strongly
Disagree
%(5)
95%
CI
SD mean
We are approaching the limit of the number of people the earth can support.
363 37.5 27.3 18.2 12.1 5 + 0.123 1.205 2.20
Humans have the right to modify the natural environment to suit their needs.
364 5.8 33 11.3 28.6 21.4 + 0.131 1.279 3.27
When humans interfere with nature it often produces disastrous consequences.
365 35.3 37.5 9.3 13.7 4.1 + 0.120 1.162 2.14
Human ingenuity will ensure that we do not make the earth unlivable.
357 7.6 16 30.3 24.9 21.3 + 0.123 1.198 3.36
Humans are severely abusing the environment.
358 45.3 34.4 6.7 8.9 4.7 + 0.118 1.142 1.94
The earth has plenty of natural resources if we just learn how to develop them.
363 17.6 36.1 19.6 18.2 8.5 + 0.123 1.210 2.64
Plants and animals have as much right to exist as humans.
364 59.1 23.9 6.6 7.4 3 + 0.110 1.071 1.71
The balance of nature is strong enough to cope with the impacts of modern industrial nations.
361 2.5 11.6 14.4 31.6 39.9 + 0.114 1.111 3.95
Despite our special abilities humans are still subject to the laws of nature.
361 57.9 31.3 7.2 1.9 1.7 + 0.086 .840 1.58
The so-called ‘ecological crisis’ facing humankind has been greatly exaggerated.
359 4.5 11.1 16.7 22.6 45.1 + 0.125 1.210 3.93
The earth is a closed system with very little room and resources.
364 28 31.6 19.2 14.8 6.3 + 0.125 1.217 2.40
Humans were meant to rule over the rest of nature.
362 5 11.6 10.8 18.8 53.9 + 0.129 1.249 4.05
The balance of nature is very delicate and easily upset.
360 38.3 37.5 11.7 11.1 1.4 + 0.108 1.036 2.00
Humans will eventually learn enough about how nature works to be able to control it.
361 3.9 13.9 23.8 29.6 28.8 + 0.118 1.147 3.66
If things continue on their present course, we will soon experience a major ecological catastrophe.
364 33.5 32.4 19.2 9.9 4.9 + 0.118 1.153 2.20
In the initial analysis Cronbach’s alpha revealed that the overall reliability of this scale was quite
high (Cronbach’s α = .776). Reliability analysis revealed that removal of the second item from
the list would improve the reliability of the scale with its omission (Cronbach’s α = .827).
However, this was retained for the analysis. The Kaiser-Meyer-Olkin verified the sampling
adequacy for this analysis, KMO = .871 and all KMO values for individual items were > .811,
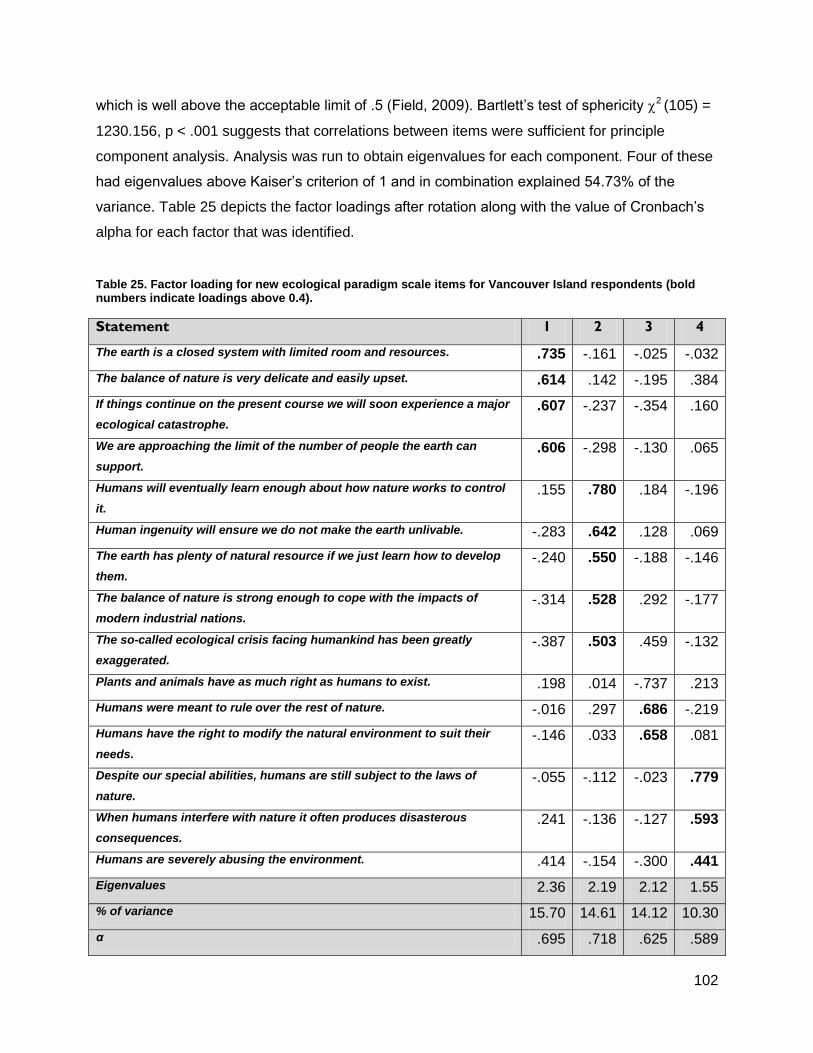
102
which is well above the acceptable limit of .5 (Field, 2009). Bartlett’s test of sphericity 2 (105) =
1230.156, p < .001 suggests that correlations between items were sufficient for principle
component analysis. Analysis was run to obtain eigenvalues for each component. Four of these
had eigenvalues above Kaiser’s criterion of 1 and in combination explained 54.73% of the
variance. Table 25 depicts the factor loadings after rotation along with the value of Cronbach’s
alpha for each factor that was identified.
Table 25. Factor loading for new ecological paradigm scale items for Vancouver Island respondents (bold numbers indicate loadings above 0.4).
Statement 1 2 3 4
The earth is a closed system with limited room and resources. .735 -.161 -.025 -.032
The balance of nature is very delicate and easily upset. .614 .142 -.195 .384
If things continue on the present course we will soon experience a major
ecological catastrophe.
.607 -.237 -.354 .160
We are approaching the limit of the number of people the earth can
support.
.606 -.298 -.130 .065
Humans will eventually learn enough about how nature works to control
it.
.155 .780 .184 -.196
Human ingenuity will ensure we do not make the earth unlivable. -.283 .642 .128 .069
The earth has plenty of natural resource if we just learn how to develop
them.
-.240 .550 -.188 -.146
The balance of nature is strong enough to cope with the impacts of
modern industrial nations.
-.314 .528 .292 -.177
The so-called ecological crisis facing humankind has been greatly
exaggerated.
-.387 .503 .459 -.132
Plants and animals have as much right as humans to exist. .198 .014 -.737 .213
Humans were meant to rule over the rest of nature. -.016 .297 .686 -.219
Humans have the right to modify the natural environment to suit their
needs.
-.146 .033 .658 .081
Despite our special abilities, humans are still subject to the laws of
nature.
-.055 -.112 -.023 .779
When humans interfere with nature it often produces disasterous
consequences.
.241 -.136 -.127 .593
Humans are severely abusing the environment. .414 -.154 -.300 .441
Eigenvalues 2.36 2.19 2.12 1.55
% of variance 15.70 14.61 14.12 10.30
α .695 .718 .625 .589
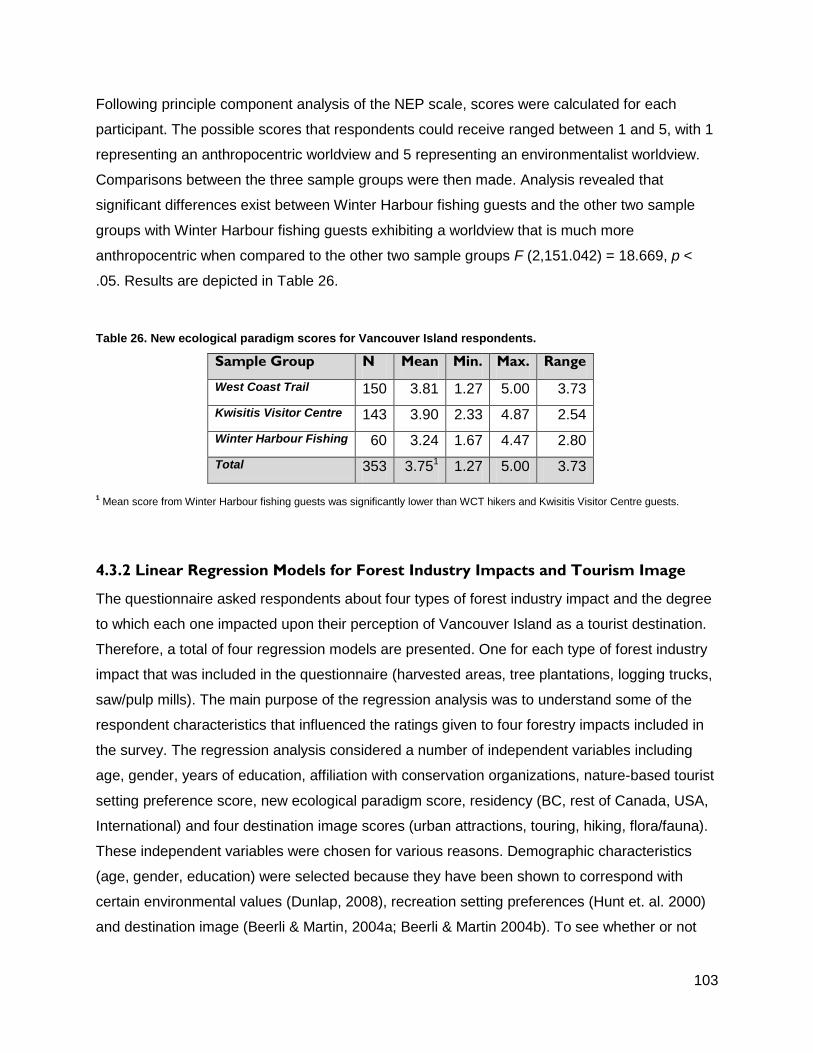
103
Following principle component analysis of the NEP scale, scores were calculated for each
participant. The possible scores that respondents could receive ranged between 1 and 5, with 1
representing an anthropocentric worldview and 5 representing an environmentalist worldview.
Comparisons between the three sample groups were then made. Analysis revealed that
significant differences exist between Winter Harbour fishing guests and the other two sample
groups with Winter Harbour fishing guests exhibiting a worldview that is much more
anthropocentric when compared to the other two sample groups F (2,151.042) = 18.669, p <
.05. Results are depicted in Table 26.
Table 26. New ecological paradigm scores for Vancouver Island respondents.
Sample Group N Mean Min. Max. Range
West Coast Trail 150 3.81 1.27 5.00 3.73
Kwisitis Visitor Centre 143 3.90 2.33 4.87 2.54
Winter Harbour Fishing 60 3.24 1.67 4.47 2.80
Total 353 3.751 1.27 5.00 3.73
1 Mean score from Winter Harbour fishing guests was significantly lower than WCT hikers and Kwisitis Visitor Centre guests.
4.3.2 Linear Regression Models for Forest Industry Impacts and Tourism Image
The questionnaire asked respondents about four types of forest industry impact and the degree
to which each one impacted upon their perception of Vancouver Island as a tourist destination.
Therefore, a total of four regression models are presented. One for each type of forest industry
impact that was included in the questionnaire (harvested areas, tree plantations, logging trucks,
saw/pulp mills). The main purpose of the regression analysis was to understand some of the
respondent characteristics that influenced the ratings given to four forestry impacts included in
the survey. The regression analysis considered a number of independent variables including
age, gender, years of education, affiliation with conservation organizations, nature-based tourist
setting preference score, new ecological paradigm score, residency (BC, rest of Canada, USA,
International) and four destination image scores (urban attractions, touring, hiking, flora/fauna).
These independent variables were chosen for various reasons. Demographic characteristics
(age, gender, education) were selected because they have been shown to correspond with
certain environmental values (Dunlap, 2008), recreation setting preferences (Hunt et. al. 2000)
and destination image (Beerli & Martin, 2004a; Beerli & Martin 2004b). To see whether or not
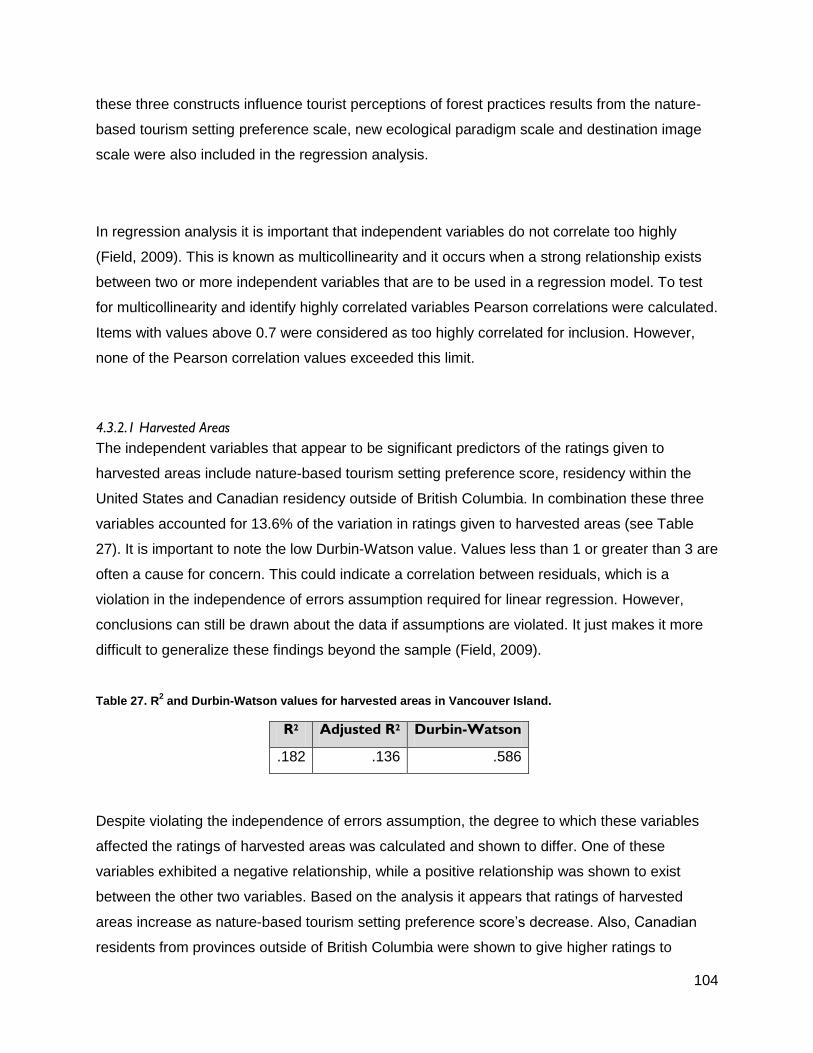
104
these three constructs influence tourist perceptions of forest practices results from the nature-
based tourism setting preference scale, new ecological paradigm scale and destination image
scale were also included in the regression analysis.
In regression analysis it is important that independent variables do not correlate too highly
(Field, 2009). This is known as multicollinearity and it occurs when a strong relationship exists
between two or more independent variables that are to be used in a regression model. To test
for multicollinearity and identify highly correlated variables Pearson correlations were calculated.
Items with values above 0.7 were considered as too highly correlated for inclusion. However,
none of the Pearson correlation values exceeded this limit.
4.3.2.1 Harvested Areas
The independent variables that appear to be significant predictors of the ratings given to
harvested areas include nature-based tourism setting preference score, residency within the
United States and Canadian residency outside of British Columbia. In combination these three
variables accounted for 13.6% of the variation in ratings given to harvested areas (see Table
27). It is important to note the low Durbin-Watson value. Values less than 1 or greater than 3 are
often a cause for concern. This could indicate a correlation between residuals, which is a
violation in the independence of errors assumption required for linear regression. However,
conclusions can still be drawn about the data if assumptions are violated. It just makes it more
difficult to generalize these findings beyond the sample (Field, 2009).
Table 27. R2 and Durbin-Watson values for harvested areas in Vancouver Island.
R2 Adjusted R2 Durbin-Watson
.182 .136 .586
Despite violating the independence of errors assumption, the degree to which these variables
affected the ratings of harvested areas was calculated and shown to differ. One of these
variables exhibited a negative relationship, while a positive relationship was shown to exist
between the other two variables. Based on the analysis it appears that ratings of harvested
areas increase as nature-based tourism setting preference score’s decrease. Also, Canadian
residents from provinces outside of British Columbia were shown to give higher ratings to
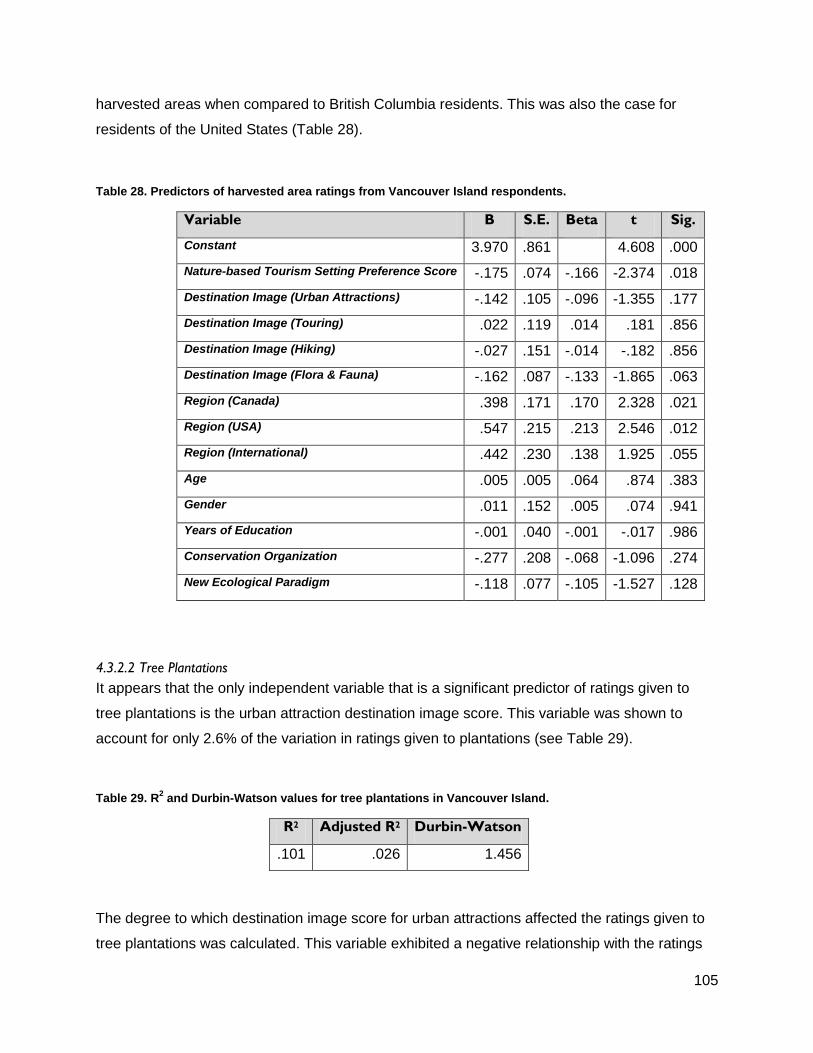
105
harvested areas when compared to British Columbia residents. This was also the case for
residents of the United States (Table 28).
Table 28. Predictors of harvested area ratings from Vancouver Island respondents.
Variable B S.E. Beta t Sig.
Constant 3.970 .861 4.608 .000
Nature-based Tourism Setting Preference Score -.175 .074 -.166 -2.374 .018
Destination Image (Urban Attractions) -.142 .105 -.096 -1.355 .177
Destination Image (Touring) .022 .119 .014 .181 .856
Destination Image (Hiking) -.027 .151 -.014 -.182 .856
Destination Image (Flora & Fauna) -.162 .087 -.133 -1.865 .063
Region (Canada) .398 .171 .170 2.328 .021
Region (USA) .547 .215 .213 2.546 .012
Region (International) .442 .230 .138 1.925 .055
Age .005 .005 .064 .874 .383
Gender .011 .152 .005 .074 .941
Years of Education -.001 .040 -.001 -.017 .986
Conservation Organization -.277 .208 -.068 -1.096 .274
New Ecological Paradigm -.118 .077 -.105 -1.527 .128
4.3.2.2 Tree Plantations
It appears that the only independent variable that is a significant predictor of ratings given to
tree plantations is the urban attraction destination image score. This variable was shown to
account for only 2.6% of the variation in ratings given to plantations (see Table 29).
Table 29. R2 and Durbin-Watson values for tree plantations in Vancouver Island.
R2 Adjusted R2 Durbin-Watson
.101 .026 1.456
The degree to which destination image score for urban attractions affected the ratings given to
tree plantations was calculated. This variable exhibited a negative relationship with the ratings
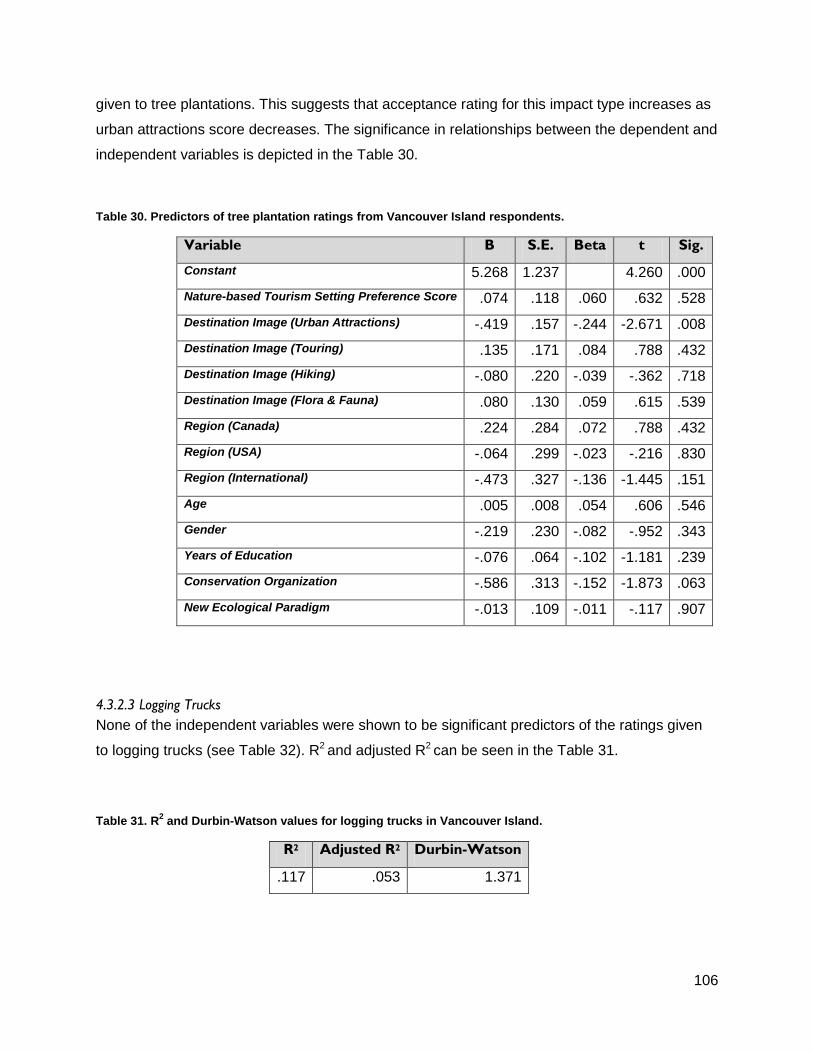
106
given to tree plantations. This suggests that acceptance rating for this impact type increases as
urban attractions score decreases. The significance in relationships between the dependent and
independent variables is depicted in the Table 30.
Table 30. Predictors of tree plantation ratings from Vancouver Island respondents.
Variable B S.E. Beta t Sig.
Constant 5.268 1.237 4.260 .000
Nature-based Tourism Setting Preference Score .074 .118 .060 .632 .528
Destination Image (Urban Attractions) -.419 .157 -.244 -2.671 .008
Destination Image (Touring) .135 .171 .084 .788 .432
Destination Image (Hiking) -.080 .220 -.039 -.362 .718
Destination Image (Flora & Fauna) .080 .130 .059 .615 .539
Region (Canada) .224 .284 .072 .788 .432
Region (USA) -.064 .299 -.023 -.216 .830
Region (International) -.473 .327 -.136 -1.445 .151
Age .005 .008 .054 .606 .546
Gender -.219 .230 -.082 -.952 .343
Years of Education -.076 .064 -.102 -1.181 .239
Conservation Organization -.586 .313 -.152 -1.873 .063
New Ecological Paradigm -.013 .109 -.011 -.117 .907
4.3.2.3 Logging Trucks
None of the independent variables were shown to be significant predictors of the ratings given
to logging trucks (see Table 32). R2 and adjusted R2 can be seen in the Table 31.
Table 31. R2 and Durbin-Watson values for logging trucks in Vancouver Island.
R2 Adjusted R2 Durbin-Watson
.117 .053 1.371
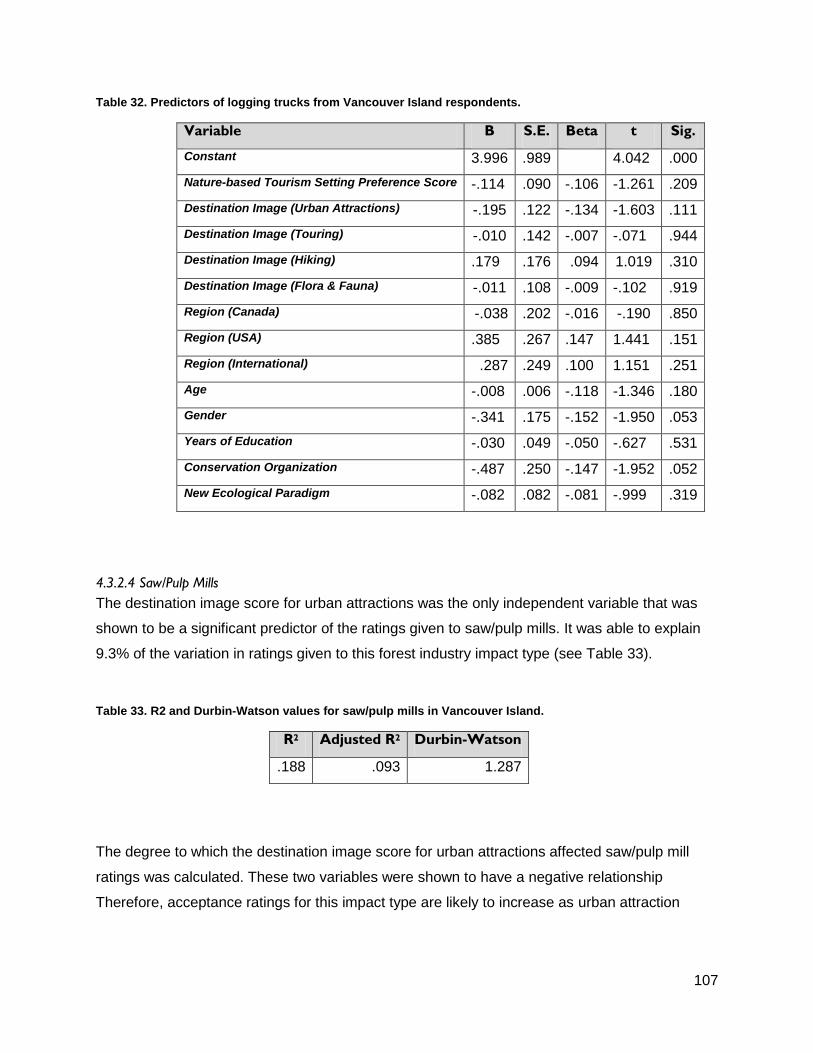
107
Table 32. Predictors of logging trucks from Vancouver Island respondents.
Variable B S.E. Beta t Sig.
Constant 3.996 .989 4.042 .000
Nature-based Tourism Setting Preference Score -.114 .090 -.106 -1.261 .209
Destination Image (Urban Attractions) -.195 .122 -.134 -1.603 .111
Destination Image (Touring) -.010 .142 -.007 -.071 .944
Destination Image (Hiking) .179 .176 .094 1.019 .310
Destination Image (Flora & Fauna) -.011 .108 -.009 -.102 .919
Region (Canada) -.038 .202 -.016 -.190 .850
Region (USA) .385 .267 .147 1.441 .151
Region (International) .287 .249 .100 1.151 .251
Age -.008 .006 -.118 -1.346 .180
Gender -.341 .175 -.152 -1.950 .053
Years of Education -.030 .049 -.050 -.627 .531
Conservation Organization -.487 .250 -.147 -1.952 .052
New Ecological Paradigm -.082 .082 -.081 -.999 .319
4.3.2.4 Saw/Pulp Mills
The destination image score for urban attractions was the only independent variable that was
shown to be a significant predictor of the ratings given to saw/pulp mills. It was able to explain
9.3% of the variation in ratings given to this forest industry impact type (see Table 33).
Table 33. R2 and Durbin-Watson values for saw/pulp mills in Vancouver Island.
R2 Adjusted R2 Durbin-Watson
.188 .093 1.287
The degree to which the destination image score for urban attractions affected saw/pulp mill
ratings was calculated. These two variables were shown to have a negative relationship
Therefore, acceptance ratings for this impact type are likely to increase as urban attraction
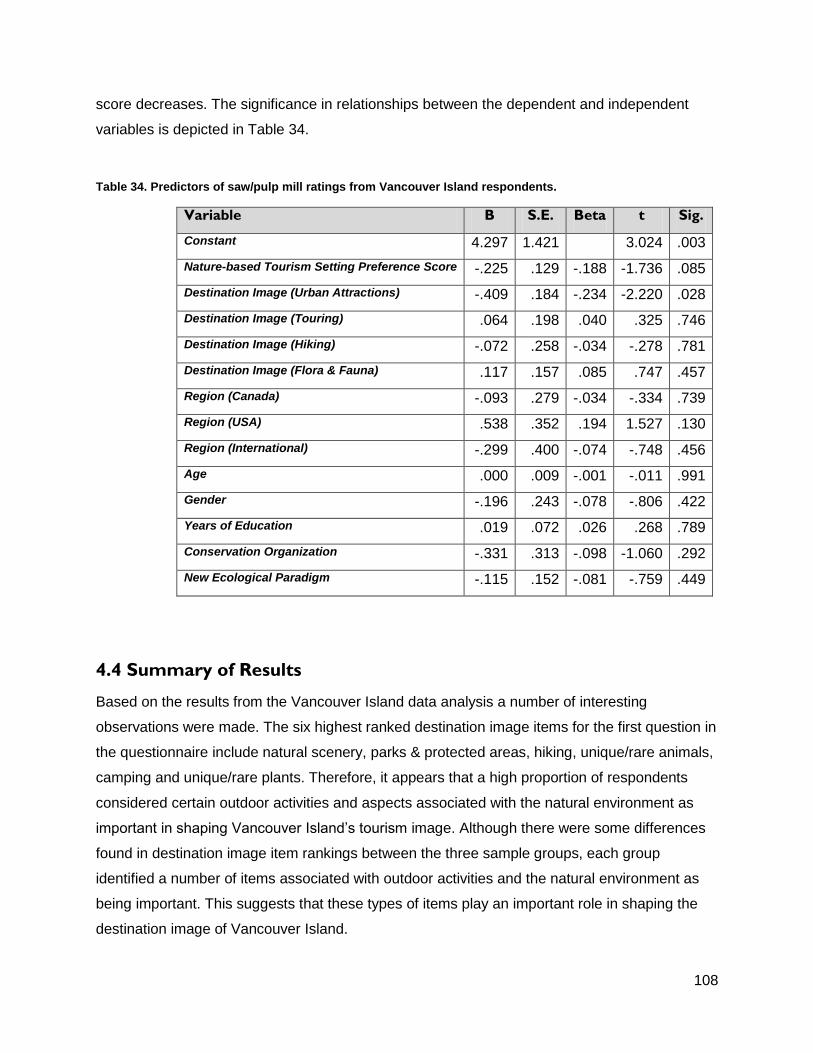
108
score decreases. The significance in relationships between the dependent and independent
variables is depicted in Table 34.
Table 34. Predictors of saw/pulp mill ratings from Vancouver Island respondents.
Variable B S.E. Beta t Sig.
Constant 4.297 1.421 3.024 .003
Nature-based Tourism Setting Preference Score -.225 .129 -.188 -1.736 .085
Destination Image (Urban Attractions) -.409 .184 -.234 -2.220 .028
Destination Image (Touring) .064 .198 .040 .325 .746
Destination Image (Hiking) -.072 .258 -.034 -.278 .781
Destination Image (Flora & Fauna) .117 .157 .085 .747 .457
Region (Canada) -.093 .279 -.034 -.334 .739
Region (USA) .538 .352 .194 1.527 .130
Region (International) -.299 .400 -.074 -.748 .456
Age .000 .009 -.001 -.011 .991
Gender -.196 .243 -.078 -.806 .422
Years of Education .019 .072 .026 .268 .789
Conservation Organization -.331 .313 -.098 -1.060 .292
New Ecological Paradigm -.115 .152 -.081 -.759 .449
4.4 Summary of Results
Based on the results from the Vancouver Island data analysis a number of interesting
observations were made. The six highest ranked destination image items for the first question in
the questionnaire include natural scenery, parks & protected areas, hiking, unique/rare animals,
camping and unique/rare plants. Therefore, it appears that a high proportion of respondents
considered certain outdoor activities and aspects associated with the natural environment as
important in shaping Vancouver Island’s tourism image. Although there were some differences
found in destination image item rankings between the three sample groups, each group
identified a number of items associated with outdoor activities and the natural environment as
being important. This suggests that these types of items play an important role in shaping the
destination image of Vancouver Island.
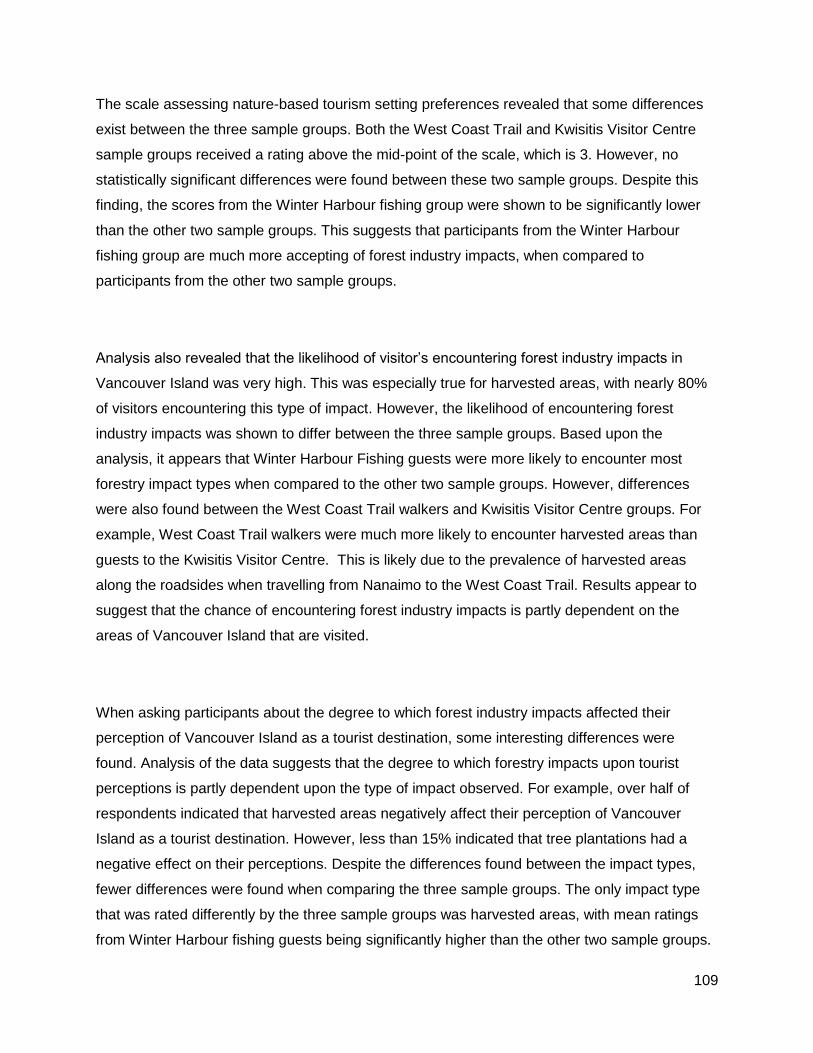
109
The scale assessing nature-based tourism setting preferences revealed that some differences
exist between the three sample groups. Both the West Coast Trail and Kwisitis Visitor Centre
sample groups received a rating above the mid-point of the scale, which is 3. However, no
statistically significant differences were found between these two sample groups. Despite this
finding, the scores from the Winter Harbour fishing group were shown to be significantly lower
than the other two sample groups. This suggests that participants from the Winter Harbour
fishing group are much more accepting of forest industry impacts, when compared to
participants from the other two sample groups.
Analysis also revealed that the likelihood of visitor’s encountering forest industry impacts in
Vancouver Island was very high. This was especially true for harvested areas, with nearly 80%
of visitors encountering this type of impact. However, the likelihood of encountering forest
industry impacts was shown to differ between the three sample groups. Based upon the
analysis, it appears that Winter Harbour Fishing guests were more likely to encounter most
forestry impact types when compared to the other two sample groups. However, differences
were also found between the West Coast Trail walkers and Kwisitis Visitor Centre groups. For
example, West Coast Trail walkers were much more likely to encounter harvested areas than
guests to the Kwisitis Visitor Centre. This is likely due to the prevalence of harvested areas
along the roadsides when travelling from Nanaimo to the West Coast Trail. Results appear to
suggest that the chance of encountering forest industry impacts is partly dependent on the
areas of Vancouver Island that are visited.
When asking participants about the degree to which forest industry impacts affected their
perception of Vancouver Island as a tourist destination, some interesting differences were
found. Analysis of the data suggests that the degree to which forestry impacts upon tourist
perceptions is partly dependent upon the type of impact observed. For example, over half of
respondents indicated that harvested areas negatively affect their perception of Vancouver
Island as a tourist destination. However, less than 15% indicated that tree plantations had a
negative effect on their perceptions. Despite the differences found between the impact types,
fewer differences were found when comparing the three sample groups. The only impact type
that was rated differently by the three sample groups was harvested areas, with mean ratings
from Winter Harbour fishing guests being significantly higher than the other two sample groups.
110
However, no significant differences were found when comparing ratings of the other three forest
industry impact types.
Analysis of the forest management preference question revealed that nearly 60% of
respondents would like to see some changes made to forest management practices in
Vancouver Island. The forest management option that received the most support was the
restriction of harvesting near recreation areas to preserve scenic views. This was followed by
the restriction of harvesting along transportation corridors. Despite the support for harvesting
restrictions in certain areas, very few respondents indicated that they support a ban on
harvesting throughout Vancouver Island. Analysis also revealed that forest management
preferences were partly dependent upon sample group, with a number of significant differences
being found between them.
Linear regression analysis was conducted to help understand the degree to which certain
variables were able to predict ratings given to the four forest industry impact types included in
the questionnaire. The degree to which these variables were able to predict ratings was shown
to differ according to the type of impact. However, none of the regression models were shown to
have much predictive power. Variables that were able to help predict ratings given to harvested
areas include nature-based tourism setting preference score, residency within the United States
and Canadian residency outside of British Columbia. The only variable that was able to help
predict ratings given to tree plantations was the urban attractions destination image score.
There were no independent variables were able to help predict the ratings given to logging
trucks. Finally, urban attractions destination image score was the only independent variable
shown to help predict the ratings that were given to saw/pulp mills.
4.5 Conclusion
The highest ranked items in the destination image scale related to the natural environment and
outdoor activities. This suggests that natural landscapes and associated activities were
important for shaping the destination image for research participants. The nature-based tourism
setting preference scale revealed that certain visitors to Vancouver Island prefer landscapes
that have not been impacted by forestry. This was supported by responses to the question
111
asking about the degree to which forest industry impacts affected perceptions. Overall,
harvested areas were rated on the low end of the scale. This is likely because they tend to be
quite visible within the landscape. However, visitors were much more accepting of tree
plantations, which usually blend into the landscape much better. Questionnaire responses also
suggest that changes to forest management practices could improve perceptions of visitors to
Vancouver Island, as nearly 60% of respondents indicated that they either disagree or strongly
disagree with the statement suggesting ‘no forest management changes are need on
Vancouver Island.’ Management options that received the most support include harvest
restrictions near recreational areas, as well as restrictions along transportation routes.
Certain differences were found to exist between the sample groups. For the question measuring
destination image the Winter Harbour fishing group ranked fishing as most important. However,
fishing was ranked much lower for the other two sample groups. Despite this difference, the
Winter Harbour group ranked items associated with natural landscapes very high, which was
similar to the other two sample groups. This suggests that natural landscapes are important for
shaping the destination image of all three sample groups. Results from the nature-based
tourism setting preference scale suggest that Winter Harbour fishing group was much more
accepting of forest industry impacts than the other two sample groups. This was supported by
responses to the question asking about the degree to which forestry impacts affected
perceptions of Vancouver Island. Analysis revealed that this Winter Harbour fishing guests were
much less likely to have their perceptions affected by harvested area than the other two sample
groups. This group was also less likely than the other two sample groups to support
management options that placed restrictions upon timber harvesting for tourism purposes.
Based upon the survey results it appears that Winter Harbour fishing guests are much more
accepting of forestry and less likely to have their perceptions affected by forest industry impacts
than the other two sample groups.
112
Chapter 5
Tasmania Results
5.1 Introduction
This chapter presents the results from the questionnaire that was distributed to tourists in
Tasmania. It is important to note possible limitations of these results because of issues that
relate to non-response bias. The survey instrument was only printed in English. Therefore,
individuals who did not speak the language could not participate. It is conceivable that a survey
targeting another language group may have produced different results. Additionally, certain
individuals who were approached agreed to participate, whereas others chose not to. It is
possible that certain differences between those who declined and those that accepted could
have influenced results. Finally, certain characteristics associated with the Central Highlands
fishing group influenced certain aspects of results. Because of the low sample size from this
group it is difficult to draw any solid conclusions from the findings. Due to logistical challenges,
the survey was not administered by the researcher. Therefore, it is possible that this could have
also influenced results. The chapter will begin with a short discussion which explains the
methods used for analysis. This is followed by a section providing an overview of the methods
used to summarize the sample characteristics. Finally, sample characteristics and results are
discussed.
113
5.2 Methods of Analysis
Methods used to analyze the questionnaires collected in Tasmania were similar to those used
for Vancouver Island. An alpha level of 0.05 was used for all statistical tests. SPSS version 20.0
was used to conduct all calculations and analyses. Chi-square along with Phi and Cramer’s V
post hoc tests were used to uncover any relationships present between categorical variables
including demographic characteristics, recreation opportunity spectrum and observations of
forestry impacts. Principle component analysis was used for questions measuring destination
image and tourist motivation. The purpose of this was to reveal any underlying dimensions that
may exist between the variables used to measure these constructs. Principle component
analysis was also used to test the reliability of the scales measuring environmental values and
nature-based tourism setting preferences. After reliability was tested for these scales
(environmental values and nature-based tourism setting preferences) a score out of five was
created for each construct. Comparisons were then made between groups using ANOVA and
post hoc tests (Games-Howell & Scheffe). Comparisons between groups were also made using
ANOVA for questions measuring visitor experience, management preferences and forestry
industry impact ratings. Regression analysis was used to discover possible variables that could
help predict ratings given to each of the four forest industry impacts measured.
5.3 Results
Results for the three sample groups are presented below.
5.3.1 Sample Characteristics
The response rate for Overland track walkers was just above 85%. Response rate for Cradle
Mountain Visitor Centre guests was just above 30%. Response rates for Central Highlands
fishing guests was just below 15% (see Table 31).
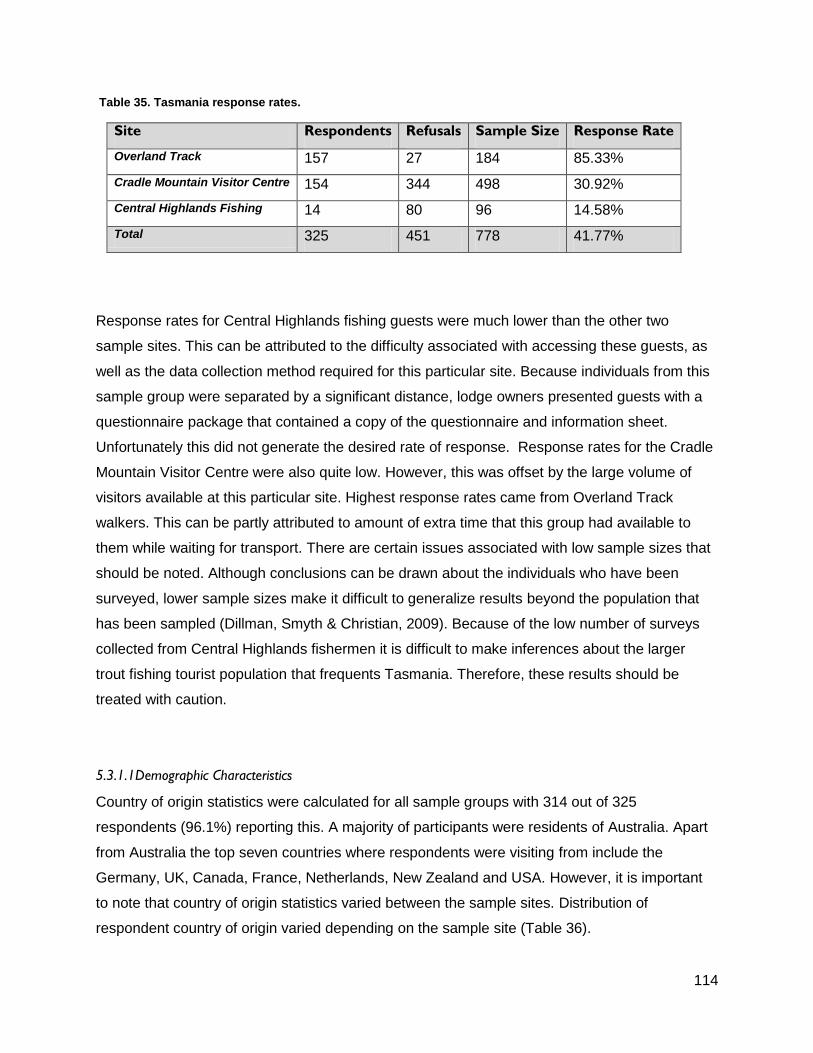
114
Table 35. Tasmania response rates.
Site Respondents Refusals Sample Size Response Rate
Overland Track 157 27 184 85.33%
Cradle Mountain Visitor Centre 154 344 498 30.92%
Central Highlands Fishing 14 80 96 14.58%
Total 325 451 778 41.77%
Response rates for Central Highlands fishing guests were much lower than the other two
sample sites. This can be attributed to the difficulty associated with accessing these guests, as
well as the data collection method required for this particular site. Because individuals from this
sample group were separated by a significant distance, lodge owners presented guests with a
questionnaire package that contained a copy of the questionnaire and information sheet.
Unfortunately this did not generate the desired rate of response. Response rates for the Cradle
Mountain Visitor Centre were also quite low. However, this was offset by the large volume of
visitors available at this particular site. Highest response rates came from Overland Track
walkers. This can be partly attributed to amount of extra time that this group had available to
them while waiting for transport. There are certain issues associated with low sample sizes that
should be noted. Although conclusions can be drawn about the individuals who have been
surveyed, lower sample sizes make it difficult to generalize results beyond the population that
has been sampled (Dillman, Smyth & Christian, 2009). Because of the low number of surveys
collected from Central Highlands fishermen it is difficult to make inferences about the larger
trout fishing tourist population that frequents Tasmania. Therefore, these results should be
treated with caution.
5.3.1.1Demographic Characteristics
Country of origin statistics were calculated for all sample groups with 314 out of 325
respondents (96.1%) reporting this. A majority of participants were residents of Australia. Apart
from Australia the top seven countries where respondents were visiting from include the
Germany, UK, Canada, France, Netherlands, New Zealand and USA. However, it is important
to note that country of origin statistics varied between the sample sites. Distribution of
respondent country of origin varied depending on the sample site (Table 36).
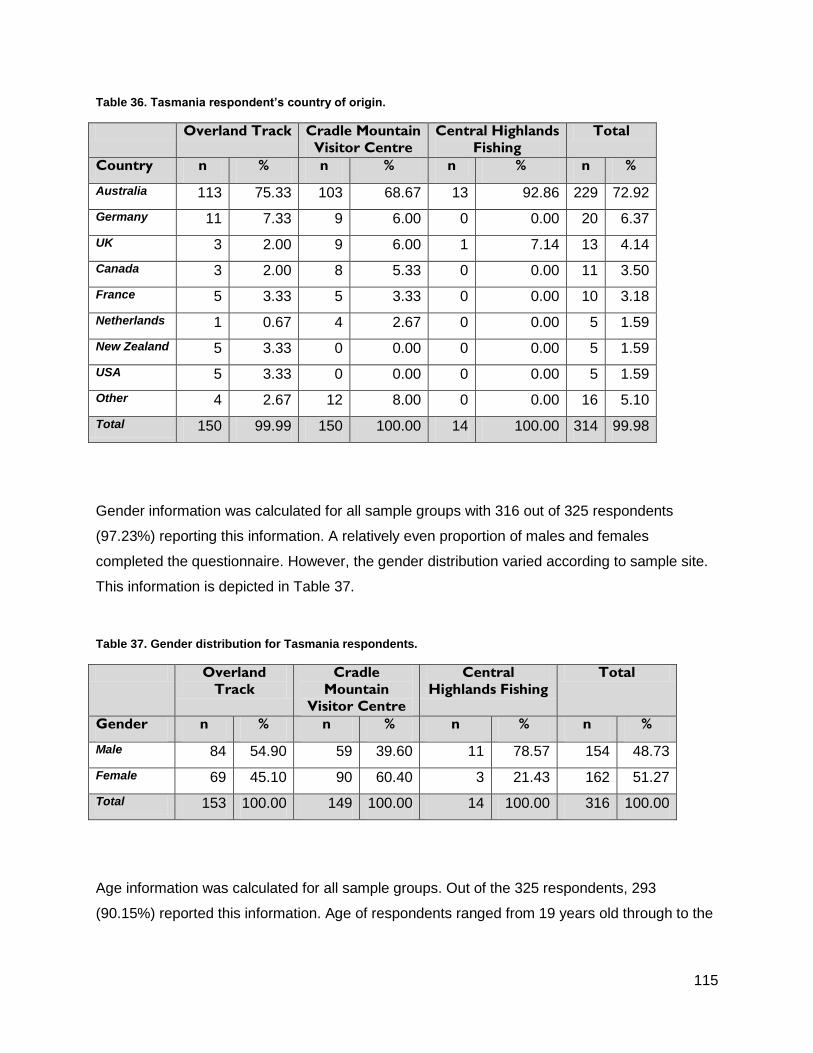
115
Table 36. Tasmania respondent’s country of origin.
Overland Track Cradle Mountain
Visitor Centre
Central Highlands
Fishing
Total
Country n % n % n % n %
Australia 113 75.33 103 68.67 13 92.86 229 72.92
Germany 11 7.33 9 6.00 0 0.00 20 6.37
UK 3 2.00 9 6.00 1 7.14 13 4.14
Canada 3 2.00 8 5.33 0 0.00 11 3.50
France 5 3.33 5 3.33 0 0.00 10 3.18
Netherlands 1 0.67 4 2.67 0 0.00 5 1.59
New Zealand 5 3.33 0 0.00 0 0.00 5 1.59
USA 5 3.33 0 0.00 0 0.00 5 1.59
Other 4 2.67 12 8.00 0 0.00 16 5.10
Total 150 99.99 150 100.00 14 100.00 314 99.98
Gender information was calculated for all sample groups with 316 out of 325 respondents
(97.23%) reporting this information. A relatively even proportion of males and females
completed the questionnaire. However, the gender distribution varied according to sample site.
This information is depicted in Table 37.
Table 37. Gender distribution for Tasmania respondents.
Overland
Track
Cradle
Mountain
Visitor Centre
Central
Highlands Fishing
Total
Gender n % n % n % n %
Male 84 54.90 59 39.60 11 78.57 154 48.73
Female 69 45.10 90 60.40 3 21.43 162 51.27
Total 153 100.00 149 100.00 14 100.00 316 100.00
Age information was calculated for all sample groups. Out of the 325 respondents, 293
(90.15%) reported this information. Age of respondents ranged from 19 years old through to the
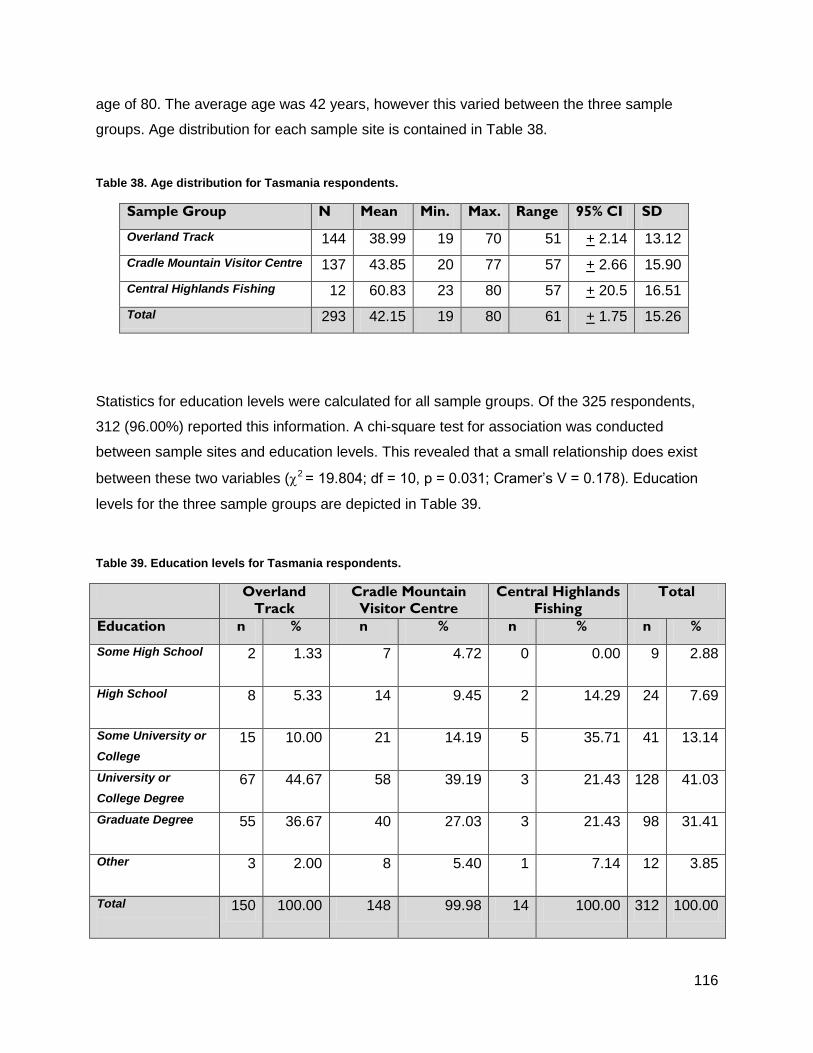
116
age of 80. The average age was 42 years, however this varied between the three sample
groups. Age distribution for each sample site is contained in Table 38.
Table 38. Age distribution for Tasmania respondents.
Sample Group N Mean Min. Max. Range 95% CI SD
Overland Track 144 38.99 19 70 51 + 2.14 13.12
Cradle Mountain Visitor Centre 137 43.85 20 77 57 + 2.66 15.90
Central Highlands Fishing 12 60.83 23 80 57 + 20.5 16.51
Total 293 42.15 19 80 61 + 1.75 15.26
Statistics for education levels were calculated for all sample groups. Of the 325 respondents,
312 (96.00%) reported this information. A chi-square test for association was conducted
between sample sites and education levels. This revealed that a small relationship does exist
between these two variables (2 = 19.804; df = 10, p = 0.031; Cramer’s V = 0.178). Education
levels for the three sample groups are depicted in Table 39.
Table 39. Education levels for Tasmania respondents.
Overland
Track
Cradle Mountain
Visitor Centre
Central Highlands
Fishing
Total
Education n % n % n % n %
Some High School
2 1.33 7 4.72 0 0.00 9 2.88
High School
8 5.33 14 9.45 2 14.29 24 7.69
Some University or
College
15 10.00 21 14.19 5 35.71 41 13.14
University or
College Degree
67 44.67 58 39.19 3 21.43 128 41.03
Graduate Degree
55 36.67 40 27.03 3 21.43 98 31.41
Other
3 2.00 8 5.40 1 7.14 12 3.85
Total
150 100.00 148 99.98 14 100.00 312 100.00
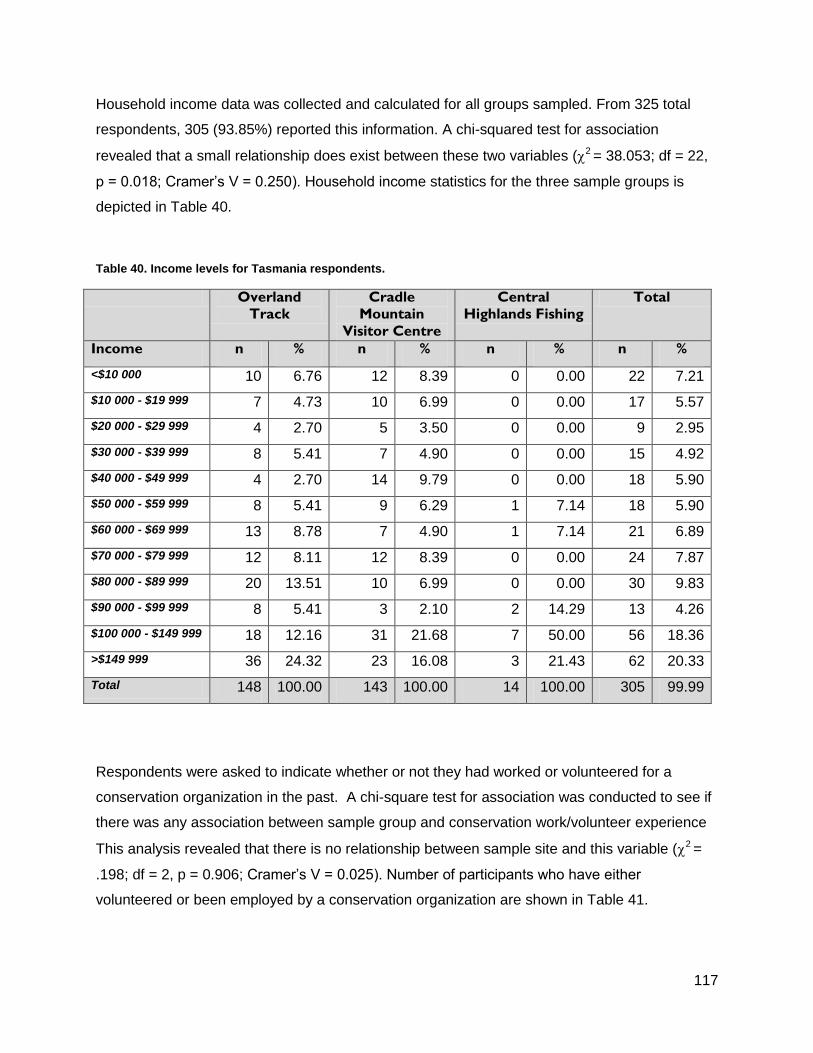
117
Household income data was collected and calculated for all groups sampled. From 325 total
respondents, 305 (93.85%) reported this information. A chi-squared test for association
revealed that a small relationship does exist between these two variables (2 = 38.053; df = 22,
p = 0.018; Cramer’s V = 0.250). Household income statistics for the three sample groups is
depicted in Table 40.
Table 40. Income levels for Tasmania respondents.
Overland
Track
Cradle
Mountain
Visitor Centre
Central
Highlands Fishing
Total
Income n % n % n % n %
<$10 000 10 6.76 12 8.39 0 0.00 22 7.21
$10 000 - $19 999 7 4.73 10 6.99 0 0.00 17 5.57
$20 000 - $29 999 4 2.70 5 3.50 0 0.00 9 2.95
$30 000 - $39 999 8 5.41 7 4.90 0 0.00 15 4.92
$40 000 - $49 999 4 2.70 14 9.79 0 0.00 18 5.90
$50 000 - $59 999 8 5.41 9 6.29 1 7.14 18 5.90
$60 000 - $69 999 13 8.78 7 4.90 1 7.14 21 6.89
$70 000 - $79 999 12 8.11 12 8.39 0 0.00 24 7.87
$80 000 - $89 999 20 13.51 10 6.99 0 0.00 30 9.83
$90 000 - $99 999 8 5.41 3 2.10 2 14.29 13 4.26
$100 000 - $149 999 18 12.16 31 21.68 7 50.00 56 18.36
>$149 999 36 24.32 23 16.08 3 21.43 62 20.33
Total 148 100.00 143 100.00 14 100.00 305 99.99
Respondents were asked to indicate whether or not they had worked or volunteered for a
conservation organization in the past. A chi-square test for association was conducted to see if
there was any association between sample group and conservation work/volunteer experience
This analysis revealed that there is no relationship between sample site and this variable (2 =
.198; df = 2, p = 0.906; Cramer’s V = 0.025). Number of participants who have either
volunteered or been employed by a conservation organization are shown in Table 41.
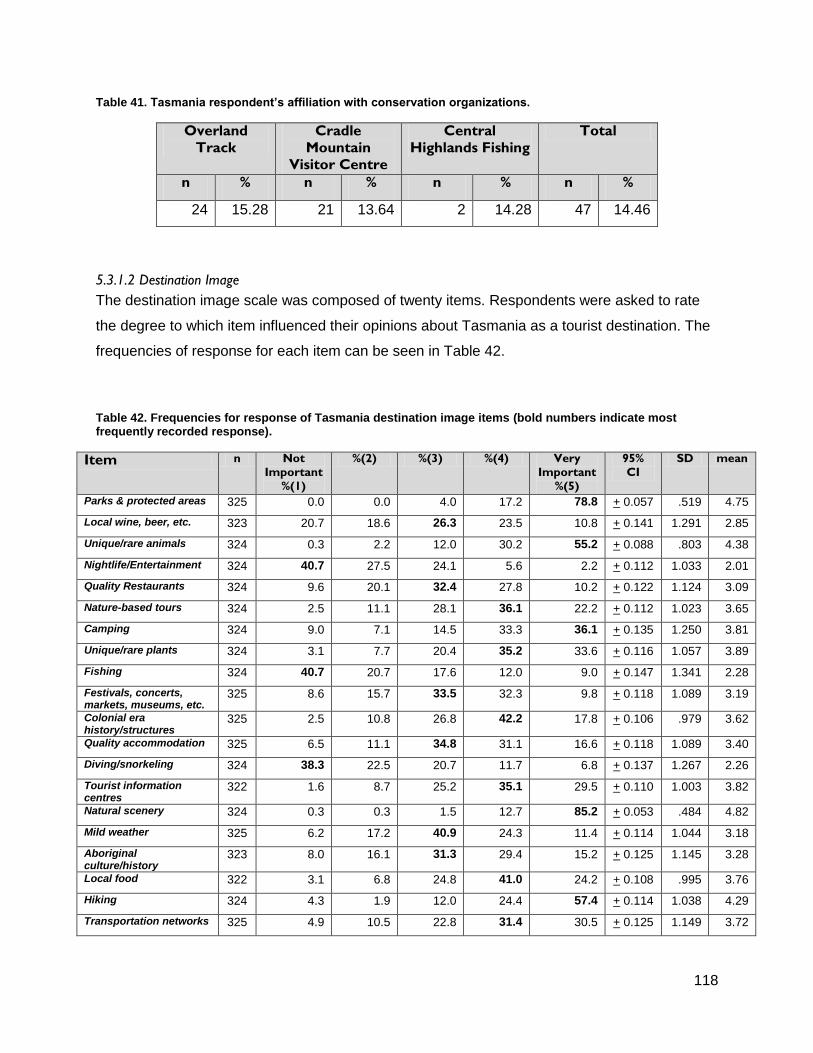
118
Table 41. Tasmania respondent’s affiliation with conservation organizations.
Overland
Track
Cradle
Mountain
Visitor Centre
Central
Highlands Fishing
Total
n % n % n % n %
24 15.28 21 13.64 2 14.28 47 14.46
5.3.1.2 Destination Image
The destination image scale was composed of twenty items. Respondents were asked to rate
the degree to which item influenced their opinions about Tasmania as a tourist destination. The
frequencies of response for each item can be seen in Table 42.
Table 42. Frequencies for response of Tasmania destination image items (bold numbers indicate most frequently recorded response).
Item n Not
Important
%(1)
%(2) %(3) %(4) Very
Important
%(5)
95%
CI
SD mean
Parks & protected areas 325 0.0 0.0 4.0 17.2 78.8 + 0.057 .519 4.75
Local wine, beer, etc. 323 20.7 18.6 26.3 23.5 10.8 + 0.141 1.291 2.85
Unique/rare animals 324 0.3 2.2 12.0 30.2 55.2 + 0.088 .803 4.38
Nightlife/Entertainment 324 40.7 27.5 24.1 5.6 2.2 + 0.112 1.033 2.01
Quality Restaurants 324 9.6 20.1 32.4 27.8 10.2 + 0.122 1.124 3.09
Nature-based tours 324 2.5 11.1 28.1 36.1 22.2 + 0.112 1.023 3.65
Camping 324 9.0 7.1 14.5 33.3 36.1 + 0.135 1.250 3.81
Unique/rare plants 324 3.1 7.7 20.4 35.2 33.6 + 0.116 1.057 3.89
Fishing 324 40.7 20.7 17.6 12.0 9.0 + 0.147 1.341 2.28
Festivals, concerts, markets, museums, etc.
325 8.6 15.7 33.5 32.3 9.8 + 0.118 1.089 3.19
Colonial era history/structures
325 2.5 10.8 26.8 42.2 17.8 + 0.106 .979 3.62
Quality accommodation 325 6.5 11.1 34.8 31.1 16.6 + 0.118 1.089 3.40
Diving/snorkeling 324 38.3 22.5 20.7 11.7 6.8 + 0.137 1.267 2.26
Tourist information centres
322 1.6 8.7 25.2 35.1 29.5 + 0.110 1.003 3.82
Natural scenery 324 0.3 0.3 1.5 12.7 85.2 + 0.053 .484 4.82
Mild weather 325 6.2 17.2 40.9 24.3 11.4 + 0.114 1.044 3.18
Aboriginal culture/history
323 8.0 16.1 31.3 29.4 15.2 + 0.125 1.145 3.28
Local food 322 3.1 6.8 24.8 41.0 24.2 + 0.108 .995 3.76
Hiking 324 4.3 1.9 12.0 24.4 57.4 + 0.114 1.038 4.29
Transportation networks 325 4.9 10.5 22.8 31.4 30.5 + 0.125 1.149 3.72
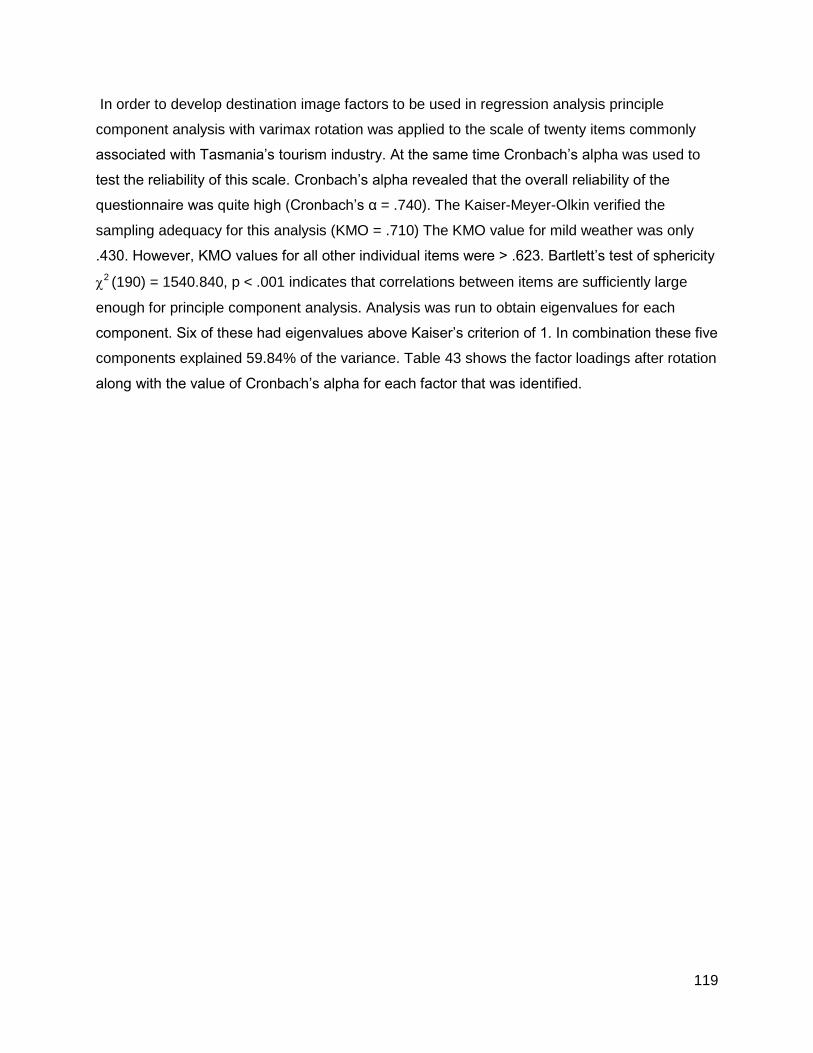
119
In order to develop destination image factors to be used in regression analysis principle
component analysis with varimax rotation was applied to the scale of twenty items commonly
associated with Tasmania’s tourism industry. At the same time Cronbach’s alpha was used to
test the reliability of this scale. Cronbach’s alpha revealed that the overall reliability of the
questionnaire was quite high (Cronbach’s α = .740). The Kaiser-Meyer-Olkin verified the
sampling adequacy for this analysis (KMO = .710) The KMO value for mild weather was only
.430. However, KMO values for all other individual items were > .623. Bartlett’s test of sphericity
2 (190) = 1540.840, p < .001 indicates that correlations between items are sufficiently large
enough for principle component analysis. Analysis was run to obtain eigenvalues for each
component. Six of these had eigenvalues above Kaiser’s criterion of 1. In combination these five
components explained 59.84% of the variance. Table 43 shows the factor loadings after rotation
along with the value of Cronbach’s alpha for each factor that was identified.
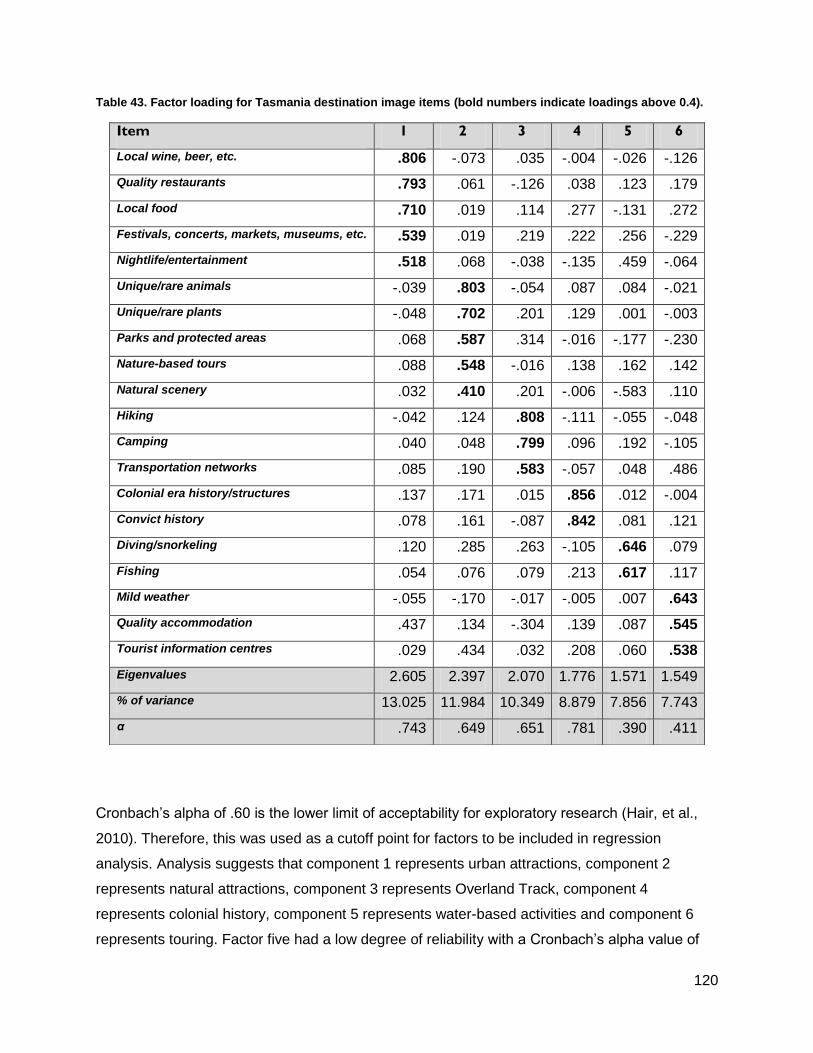
120
Table 43. Factor loading for Tasmania destination image items (bold numbers indicate loadings above 0.4).
Cronbach’s alpha of .60 is the lower limit of acceptability for exploratory research (Hair, et al.,
2010). Therefore, this was used as a cutoff point for factors to be included in regression
analysis. Analysis suggests that component 1 represents urban attractions, component 2
represents natural attractions, component 3 represents Overland Track, component 4
represents colonial history, component 5 represents water-based activities and component 6
represents touring. Factor five had a low degree of reliability with a Cronbach’s alpha value of
Item 1 2 3 4 5 6
Local wine, beer, etc. .806 -.073 .035 -.004 -.026 -.126
Quality restaurants .793 .061 -.126 .038 .123 .179
Local food .710 .019 .114 .277 -.131 .272
Festivals, concerts, markets, museums, etc. .539 .019 .219 .222 .256 -.229
Nightlife/entertainment .518 .068 -.038 -.135 .459 -.064
Unique/rare animals -.039 .803 -.054 .087 .084 -.021
Unique/rare plants -.048 .702 .201 .129 .001 -.003
Parks and protected areas .068 .587 .314 -.016 -.177 -.230
Nature-based tours .088 .548 -.016 .138 .162 .142
Natural scenery .032 .410 .201 -.006 -.583 .110
Hiking -.042 .124 .808 -.111 -.055 -.048
Camping .040 .048 .799 .096 .192 -.105
Transportation networks .085 .190 .583 -.057 .048 .486
Colonial era history/structures .137 .171 .015 .856 .012 -.004
Convict history .078 .161 -.087 .842 .081 .121
Diving/snorkeling .120 .285 .263 -.105 .646 .079
Fishing .054 .076 .079 .213 .617 .117
Mild weather -.055 -.170 -.017 -.005 .007 .643
Quality accommodation .437 .134 -.304 .139 .087 .545
Tourist information centres .029 .434 .032 .208 .060 .538
Eigenvalues 2.605 2.397 2.070 1.776 1.571 1.549
% of variance 13.025 11.984 10.349 8.879 7.856 7.743
α .743 .649 .651 .781 .390 .411
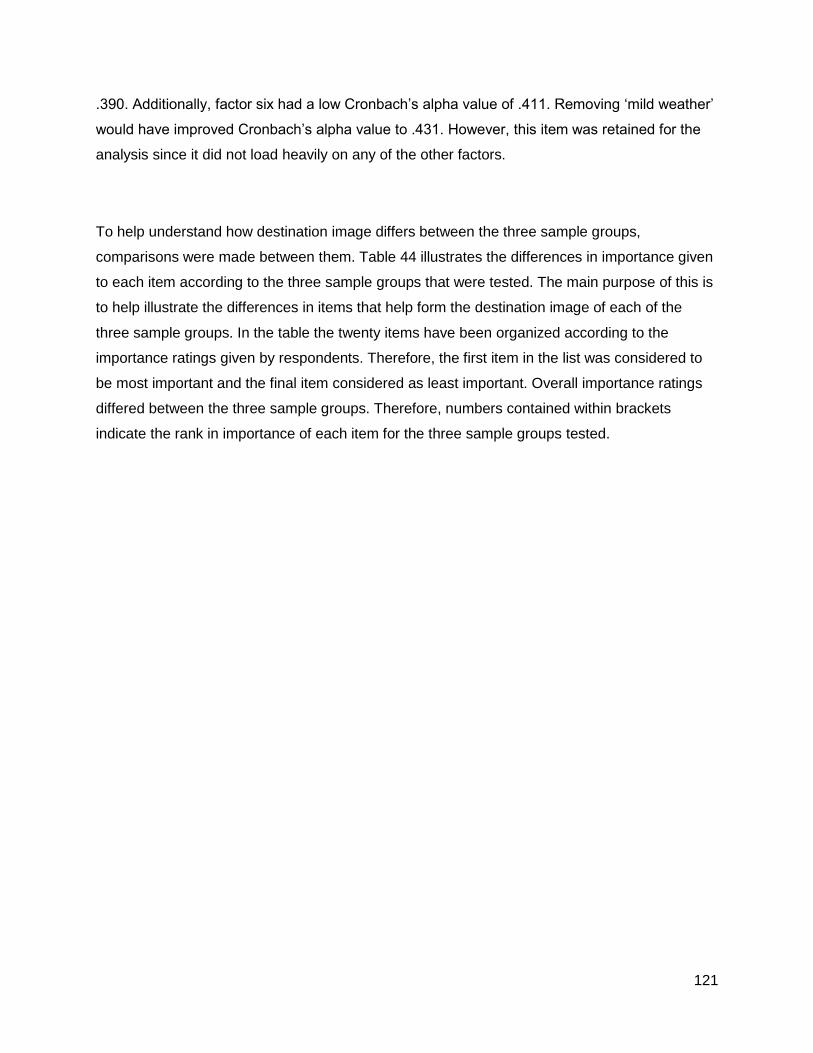
121
.390. Additionally, factor six had a low Cronbach’s alpha value of .411. Removing ‘mild weather’
would have improved Cronbach’s alpha value to .431. However, this item was retained for the
analysis since it did not load heavily on any of the other factors.
To help understand how destination image differs between the three sample groups,
comparisons were made between them. Table 44 illustrates the differences in importance given
to each item according to the three sample groups that were tested. The main purpose of this is
to help illustrate the differences in items that help form the destination image of each of the
three sample groups. In the table the twenty items have been organized according to the
importance ratings given by respondents. Therefore, the first item in the list was considered to
be most important and the final item considered as least important. Overall importance ratings
differed between the three sample groups. Therefore, numbers contained within brackets
indicate the rank in importance of each item for the three sample groups tested.

122
Table 44. Importance of Tasmania destination image items (numbers in brackets indicate the ranking of each item for the three sample groups).
Item n Mean Overland
Track
Cradle
Mountain
Visitor
Center
Central
Highlands
Fishing
Natural scenery 324 4.821 4.84a (1) 4.81a (1) 4.69a (2)
Parks & protected areas 325 4.752 4.83a (2) 4.70a (2) 4.36 (3)
Unique/rare animals 324 4.381 4.29a (5) 4.48a (3) 4.29a (4)
Hiking 324 4.293 4.74 (3) 3.94a (6) 3.00a (15t)
Unique/rare plants 324 3.891 3.85a (7) 3.97a (5) 3.36a (11t)
Tourist information centres 322 3.824 3.63 (8) 4.05 (4) 3.46 (9)
Camping 324 3.813 4.38 (4) 3.29a (14) 2.93a (17)
Local Food 322 3.764 3.61 (9) 3.90 (7) 4.00 (6)
Transportation networks 325 3.723 4.04 (6) 3.46a (12) 3.00a (15t)
Nature-based tours 324 3.651 3.54a (10t) 3.78a (8) 3.36a (11t)
Colonial era history/structures 325 3.621 3.54a (10t) 3.70a (9) 3.64a (8)
Quality accommodation 325 3.405 3.22 (13) 3.53a (11) 4.07a (5)
Convict history 323 3.284 2.99 (16) 3.55 (10) 3.43 (10)
Festivals, concerts, markets, museums, etc 325 3.191 3.27a (12) 3.10a (15t) 3.29a (13)
Mild weather 325 3.184 3.02 (14) 3.33 (13) 3.21 (14)
Quality restaurants 324 3.096 3.01a (15) 3.10a (15t) 3.93 (7)
Local wine, beer, etc. 323 2.851 2.82a (17) 2.82a (17) 2.57a (18)
Fishing 324 2.286 2.20a (19) 2.12a (19) 4.93 (1)
Diving/snorkeling 324 2.262 2.26a (18) 2.34a (18) 1.43 (20)
Nightlife/entertainment 324 2.011 1.96a (20) 2.05a (20) 2.21a (19)
a Sample groups are statistically similar.
1 No significant differences found between groups.
2 Mean responses from Overland Track walkers and Cradle Mountain Visitor Centre guests were significantly higher than mean
responses from Central Highlands fishing guests. 3Mean responses from Overland Track walkers were significantly higher than mean responses from Cradle Mountain Visitor Centre
guests and Central Highlands fishing guests. 4Mean responses from Cradle Mountain Visitor Centre guests were significantly higher than mean responses from Overland Track
walkers. 5Mean responses from Overland Track walkers were significantly lower than mean responses from Cradle Mountain Visitor Centre
guests and Winter Harbour fishing guests. 6Mean responses from Central Highlands fishing guests were significantly higher than mean responses from Cradle Mountain
fishing guests and Overland Track walkers.
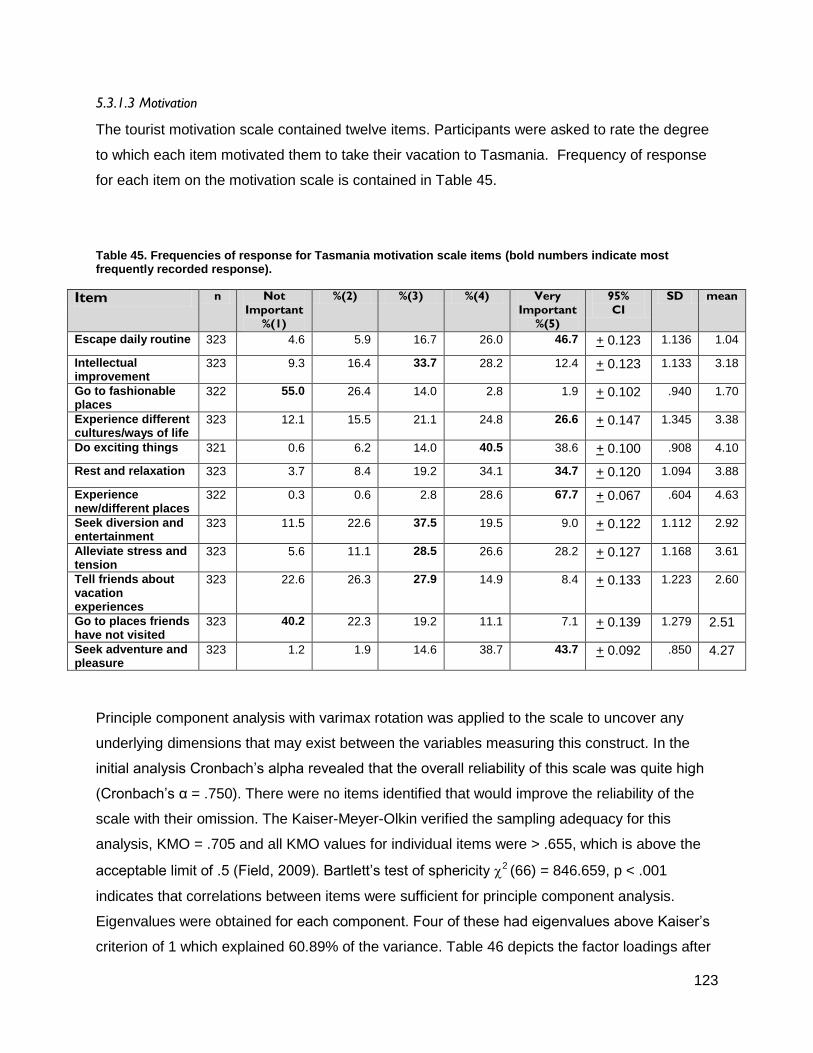
123
5.3.1.3 Motivation
The tourist motivation scale contained twelve items. Participants were asked to rate the degree
to which each item motivated them to take their vacation to Tasmania. Frequency of response
for each item on the motivation scale is contained in Table 45.
Table 45. Frequencies of response for Tasmania motivation scale items (bold numbers indicate most frequently recorded response).
Item n Not
Important
%(1)
%(2) %(3) %(4) Very
Important
%(5)
95%
CI
SD mean
Escape daily routine 323 4.6 5.9 16.7 26.0 46.7 + 0.123 1.136 1.04
Intellectual improvement
323 9.3 16.4 33.7 28.2 12.4 + 0.123 1.133 3.18
Go to fashionable places
322 55.0 26.4 14.0 2.8 1.9 + 0.102 .940 1.70
Experience different cultures/ways of life
323 12.1 15.5 21.1 24.8 26.6 + 0.147 1.345 3.38
Do exciting things 321 0.6 6.2 14.0 40.5 38.6 + 0.100 .908 4.10
Rest and relaxation 323 3.7 8.4 19.2 34.1 34.7 + 0.120 1.094 3.88
Experience new/different places
322 0.3 0.6 2.8 28.6 67.7 + 0.067 .604 4.63
Seek diversion and entertainment
323 11.5 22.6 37.5 19.5 9.0 + 0.122 1.112 2.92
Alleviate stress and tension
323 5.6 11.1 28.5 26.6 28.2 + 0.127 1.168 3.61
Tell friends about vacation experiences
323 22.6 26.3 27.9 14.9 8.4 + 0.133 1.223 2.60
Go to places friends have not visited
323 40.2 22.3 19.2 11.1 7.1 + 0.139 1.279 2.51
Seek adventure and pleasure
323 1.2 1.9 14.6 38.7 43.7 + 0.092 .850 4.27
Principle component analysis with varimax rotation was applied to the scale to uncover any
underlying dimensions that may exist between the variables measuring this construct. In the
initial analysis Cronbach’s alpha revealed that the overall reliability of this scale was quite high
(Cronbach’s α = .750). There were no items identified that would improve the reliability of the
scale with their omission. The Kaiser-Meyer-Olkin verified the sampling adequacy for this
analysis, KMO = .705 and all KMO values for individual items were > .655, which is above the
acceptable limit of .5 (Field, 2009). Bartlett’s test of sphericity 2 (66) = 846.659, p < .001
indicates that correlations between items were sufficient for principle component analysis.
Eigenvalues were obtained for each component. Four of these had eigenvalues above Kaiser’s
criterion of 1 which explained 60.89% of the variance. Table 46 depicts the factor loadings after
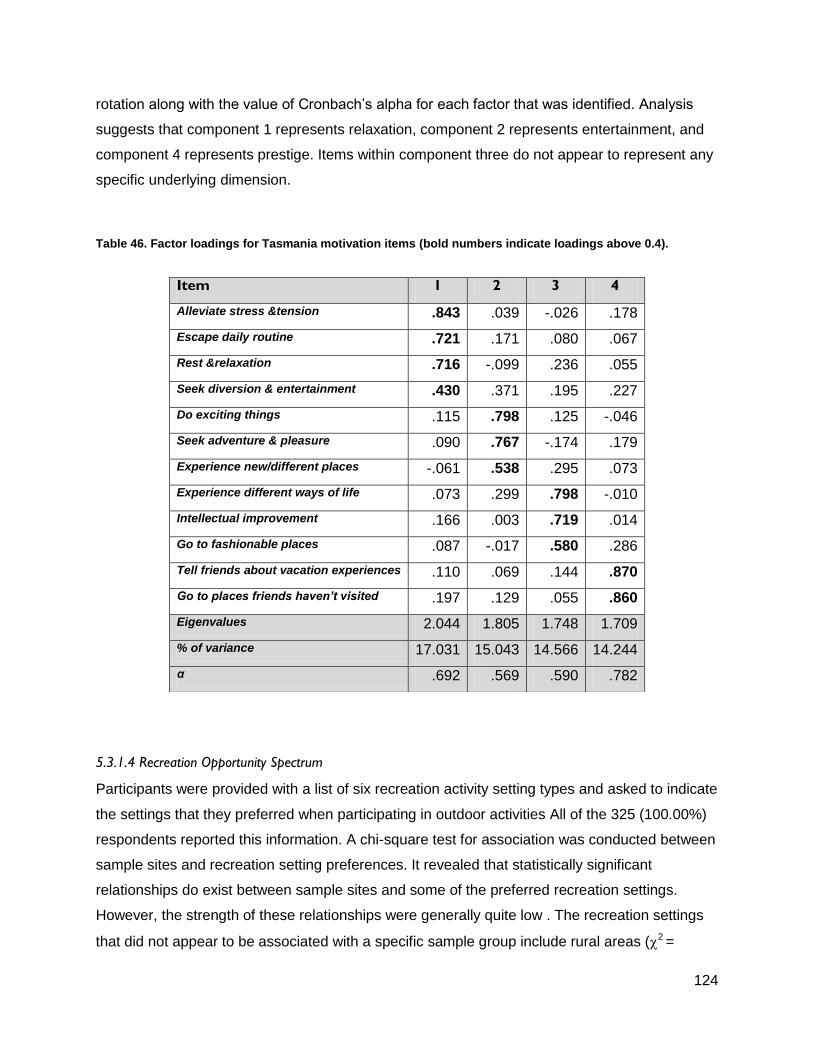
124
rotation along with the value of Cronbach’s alpha for each factor that was identified. Analysis
suggests that component 1 represents relaxation, component 2 represents entertainment, and
component 4 represents prestige. Items within component three do not appear to represent any
specific underlying dimension.
Table 46. Factor loadings for Tasmania motivation items (bold numbers indicate loadings above 0.4).
5.3.1.4 Recreation Opportunity Spectrum
Participants were provided with a list of six recreation activity setting types and asked to indicate
the settings that they preferred when participating in outdoor activities All of the 325 (100.00%)
respondents reported this information. A chi-square test for association was conducted between
sample sites and recreation setting preferences. It revealed that statistically significant
relationships do exist between sample sites and some of the preferred recreation settings.
However, the strength of these relationships were generally quite low . The recreation settings
that did not appear to be associated with a specific sample group include rural areas (2 =
Item 1 2 3 4
Alleviate stress &tension .843 .039 -.026 .178
Escape daily routine .721 .171 .080 .067
Rest &relaxation .716 -.099 .236 .055
Seek diversion & entertainment .430 .371 .195 .227
Do exciting things .115 .798 .125 -.046
Seek adventure & pleasure .090 .767 -.174 .179
Experience new/different places -.061 .538 .295 .073
Experience different ways of life .073 .299 .798 -.010
Intellectual improvement .166 .003 .719 .014
Go to fashionable places .087 -.017 .580 .286
Tell friends about vacation experiences .110 .069 .144 .870
Go to places friends haven’t visited .197 .129 .055 .860
Eigenvalues 2.044 1.805 1.748 1.709
% of variance 17.031 15.043 14.566 14.244
α .692 .569 .590 .782
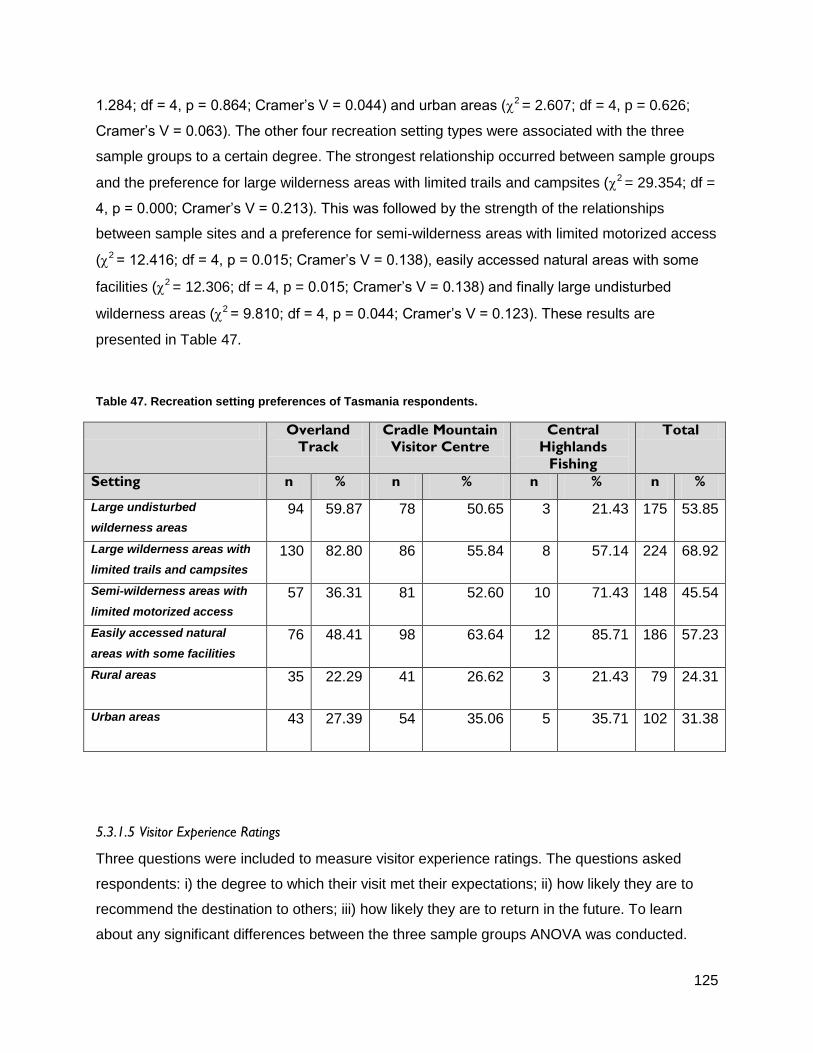
125
1.284; df = 4, p = 0.864; Cramer’s V = 0.044) and urban areas (2 = 2.607; df = 4, p = 0.626;
Cramer’s V = 0.063). The other four recreation setting types were associated with the three
sample groups to a certain degree. The strongest relationship occurred between sample groups
and the preference for large wilderness areas with limited trails and campsites (2 = 29.354; df =
4, p = 0.000; Cramer’s V = 0.213). This was followed by the strength of the relationships
between sample sites and a preference for semi-wilderness areas with limited motorized access
(2 = 12.416; df = 4, p = 0.015; Cramer’s V = 0.138), easily accessed natural areas with some
facilities (2 = 12.306; df = 4, p = 0.015; Cramer’s V = 0.138) and finally large undisturbed
wilderness areas (2 = 9.810; df = 4, p = 0.044; Cramer’s V = 0.123). These results are
presented in Table 47.
Table 47. Recreation setting preferences of Tasmania respondents.
Overland
Track
Cradle Mountain
Visitor Centre
Central
Highlands
Fishing
Total
Setting n % n % n % n %
Large undisturbed
wilderness areas
94 59.87 78 50.65 3 21.43 175 53.85
Large wilderness areas with
limited trails and campsites
130 82.80 86 55.84 8 57.14 224 68.92
Semi-wilderness areas with
limited motorized access
57 36.31 81 52.60 10 71.43 148 45.54
Easily accessed natural
areas with some facilities
76 48.41 98 63.64 12 85.71 186 57.23
Rural areas
35 22.29 41 26.62 3 21.43 79 24.31
Urban areas
43 27.39 54 35.06 5 35.71 102 31.38
5.3.1.5 Visitor Experience Ratings
Three questions were included to measure visitor experience ratings. The questions asked
respondents: i) the degree to which their visit met their expectations; ii) how likely they are to
recommend the destination to others; iii) how likely they are to return in the future. To learn
about any significant differences between the three sample groups ANOVA was conducted.
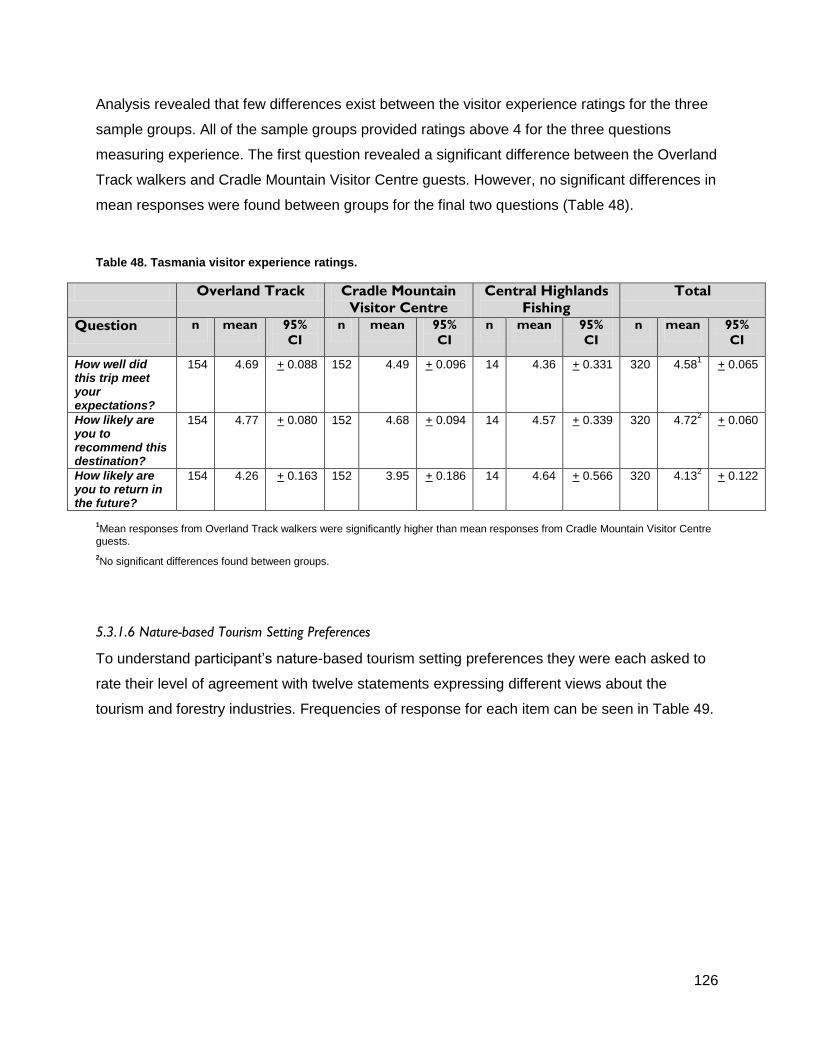
126
Analysis revealed that few differences exist between the visitor experience ratings for the three
sample groups. All of the sample groups provided ratings above 4 for the three questions
measuring experience. The first question revealed a significant difference between the Overland
Track walkers and Cradle Mountain Visitor Centre guests. However, no significant differences in
mean responses were found between groups for the final two questions (Table 48).
Table 48. Tasmania visitor experience ratings.
Overland Track Cradle Mountain
Visitor Centre
Central Highlands
Fishing
Total
Question n mean 95%
CI
n mean 95%
CI
n mean 95%
CI
n mean 95%
CI
How well did this trip meet your expectations?
154 4.69 + 0.088 152 4.49 + 0.096 14 4.36 + 0.331 320 4.581
+ 0.065
How likely are you to recommend this destination?
154 4.77 + 0.080 152 4.68 + 0.094 14 4.57 + 0.339 320 4.722
+ 0.060
How likely are you to return in the future?
154 4.26 + 0.163 152 3.95 + 0.186 14 4.64 + 0.566 320 4.132
+ 0.122
1Mean responses from Overland Track walkers were significantly higher than mean responses from Cradle Mountain Visitor Centre
guests.
2No significant differences found between groups.
5.3.1.6 Nature-based Tourism Setting Preferences
To understand participant’s nature-based tourism setting preferences they were each asked to
rate their level of agreement with twelve statements expressing different views about the
tourism and forestry industries. Frequencies of response for each item can be seen in Table 49.

127
Table 49. Frequencies of response for Tasmania nature-based tourism setting preference scale (bold numbers indicate most frequently recorded response).
Item n Strongly
Agree
%(1)
Agree
%(2)
Neither
agree /
disagree
%(3)
Disagree
%(4)
Strongly
Disagree
%(5)
95%
CI
SD mean
When visiting destinations that market the natural environment I expect to see unspoiled wilderness.
322 47.8 40.4 10.8 0.9 0.0 + 0.078 .709 1.65
Forestry activities in natural areas provide additional access for outdoor recreation.
293 7.5 31.7 32.1 15.7 13.0 + 0.129 1.138 2.95
I expect to see evidence of forestry activities in destinations that market the natural environment.
296 3.0 16.9 21.6 31.1 27.4 + 0.129 1.143 3.63
Special care should be taken to ensure forestry does not impact upon the recreational values of natural areas.
316 49.1 38.0 8.2 2.5 2.2 + 0.098 .889 1.71
When visiting destinations that market the natural environment, evidence of forestry activities negatively affects my experience.
310 22.9 31.9 22.9 17.4 4.8 + 0.129 1.162 2.49
When participating in outdoor recreational activities my main focus is on the activity, rather than the scenic values of the setting.
315 1.0 3.8 19.0 47.6 28.6 + 0.094 .846 3.99
Evidence of forestry activities in regions that market the natural environment has very little impact on my experience.
309 1.6 16.5 21.0 34.3 26.5 + 0.122 1.087 3.68
When participating in outdoor recreational activities I prefer unspoiled wilderness.
315 43.2 41.3 12.4 3.2 0.0 + 0.088 .790 1.76
In destinations that market the natural environment forests should be preserved for their tourism values.
315 36.8 37.8 19.4 4.1 1.9 + 0.104 .949 1.97
Evidence of forestry activities near recreational areas has very little impact on my experience.
310 1.9 17.4 26.1 30.0 24.5 + 0.122 1.097 3.58
Development of forest resources is necessary, even in destinations that market the natural environment.
291 7.6 23.4 31.6 21.3 16.2 + 0.135 1.173 3.15
Observing evidence of forestry activities in natural areas while participating in outdoor activities negatively affects my experience.
307 20.5 34.2 26.7 14.3 4.2 + 0.123 1.097 2.48
128
Principle component analysis with varimax rotation was applied to the scale. Cronbach’s alpha
revealed that the overall reliability of this scale was very high (Cronbach’s α = .876). Reliability
analysis revealed reliability could be improved with the removal of the first item (Cronbach’s α =
.877) and sixth item (Cronbach’s α = .881). However, these two items were retained for the
analysis as improvement to reliability would have been minimal with their omission. The Kaiser-
Meyer-Olkin verified the sampling adequacy for this analysis, KMO = .906 and all KMO values
for individual items were > .852, which is well above the acceptable limit of .5 (Field, 2009).
Bartlett’s test of sphericity 2 (66) = 1155.590, p < .001 indicates that correlations between items
were sufficiently high enough for principle component analysis. Eigenvalues were calculated for
each of the three components. Three of these had eigenvalues higher than Kaiser’s criterion of
1, which explained 62.22% of the total variance. Table 50 shows the factor loadings after
rotation along with the value of Cronbach’s alpha for each of the three factors identified.
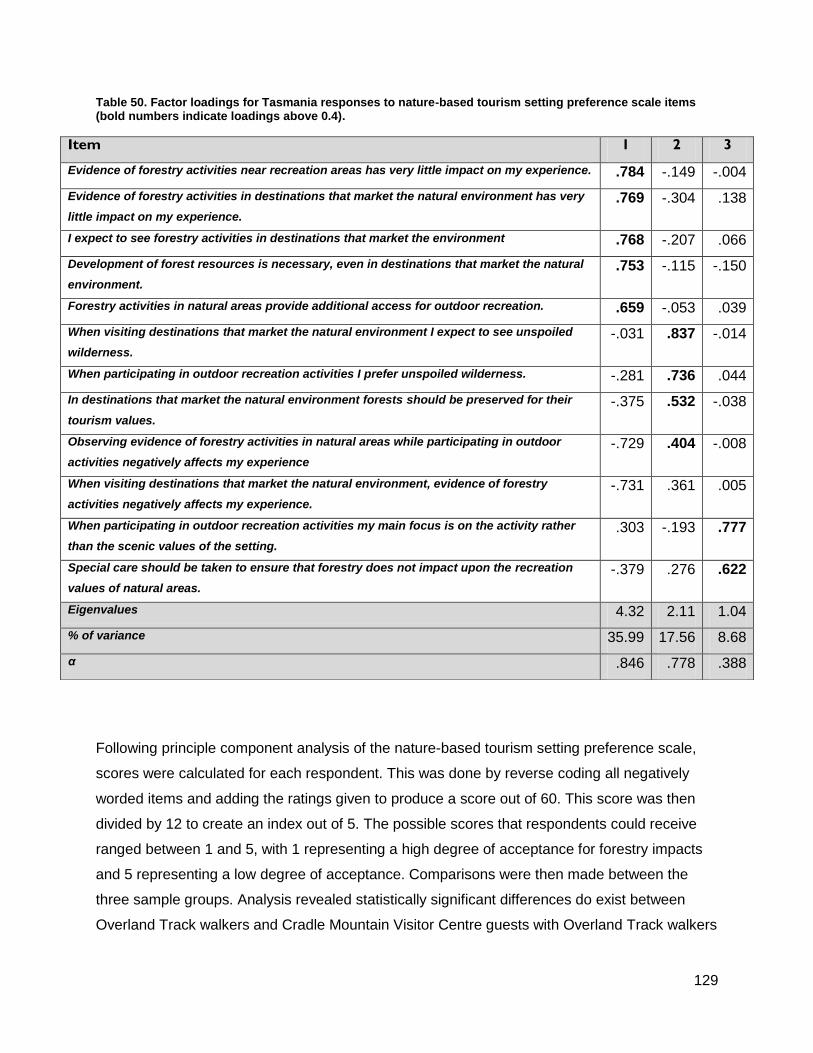
129
Table 50. Factor loadings for Tasmania responses to nature-based tourism setting preference scale items (bold numbers indicate loadings above 0.4).
Following principle component analysis of the nature-based tourism setting preference scale,
scores were calculated for each respondent. This was done by reverse coding all negatively
worded items and adding the ratings given to produce a score out of 60. This score was then
divided by 12 to create an index out of 5. The possible scores that respondents could receive
ranged between 1 and 5, with 1 representing a high degree of acceptance for forestry impacts
and 5 representing a low degree of acceptance. Comparisons were then made between the
three sample groups. Analysis revealed statistically significant differences do exist between
Overland Track walkers and Cradle Mountain Visitor Centre guests with Overland Track walkers
Item 1 2 3
Evidence of forestry activities near recreation areas has very little impact on my experience. .784 -.149 -.004
Evidence of forestry activities in destinations that market the natural environment has very
little impact on my experience.
.769 -.304 .138
I expect to see forestry activities in destinations that market the environment .768 -.207 .066
Development of forest resources is necessary, even in destinations that market the natural
environment.
.753 -.115 -.150
Forestry activities in natural areas provide additional access for outdoor recreation. .659 -.053 .039
When visiting destinations that market the natural environment I expect to see unspoiled
wilderness.
-.031 .837 -.014
When participating in outdoor recreation activities I prefer unspoiled wilderness. -.281 .736 .044
In destinations that market the natural environment forests should be preserved for their
tourism values.
-.375 .532 -.038
Observing evidence of forestry activities in natural areas while participating in outdoor
activities negatively affects my experience
-.729 .404 -.008
When visiting destinations that market the natural environment, evidence of forestry
activities negatively affects my experience.
-.731 .361 .005
When participating in outdoor recreation activities my main focus is on the activity rather
than the scenic values of the setting.
.303 -.193 .777
Special care should be taken to ensure that forestry does not impact upon the recreation
values of natural areas.
-.379 .276 .622
Eigenvalues 4.32 2.11 1.04
% of variance 35.99 17.56 8.68
α .846 .778 .388
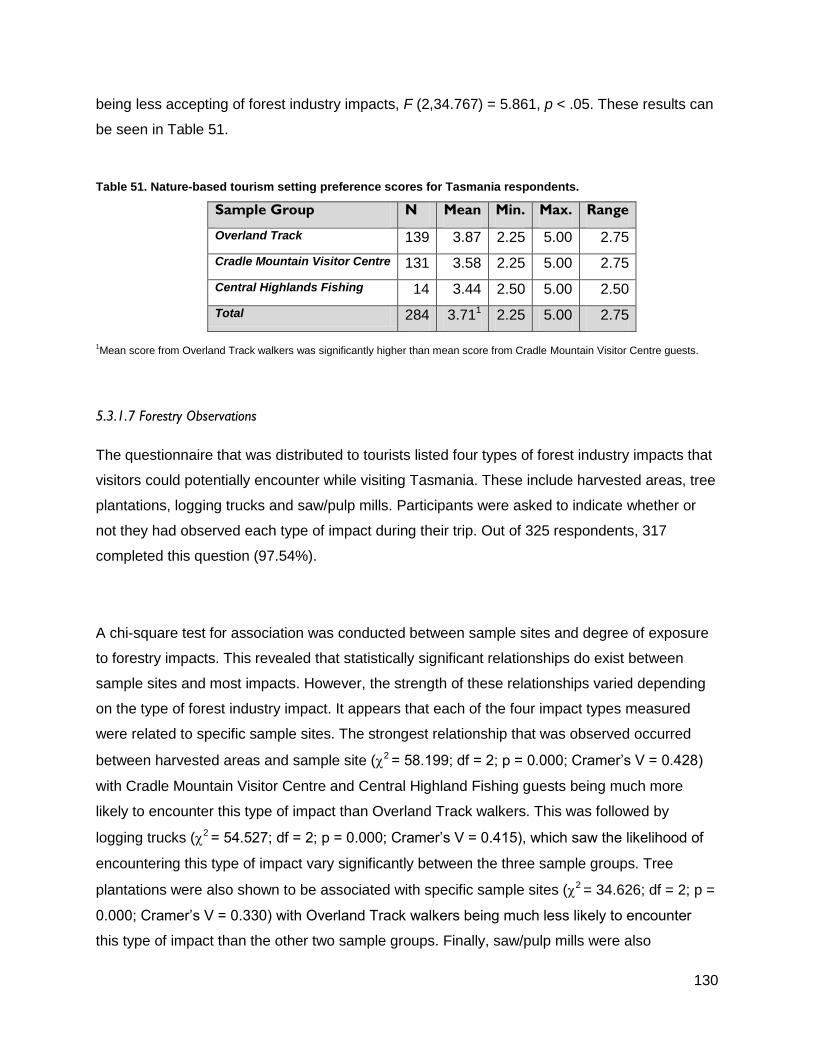
130
being less accepting of forest industry impacts, F (2,34.767) = 5.861, p < .05. These results can
be seen in Table 51.
Table 51. Nature-based tourism setting preference scores for Tasmania respondents.
Sample Group N Mean Min. Max. Range
Overland Track 139 3.87 2.25 5.00 2.75
Cradle Mountain Visitor Centre 131 3.58 2.25 5.00 2.75
Central Highlands Fishing 14 3.44 2.50 5.00 2.50
Total 284 3.711 2.25 5.00 2.75
1Mean score from Overland Track walkers was significantly higher than mean score from Cradle Mountain Visitor Centre guests.
5.3.1.7 Forestry Observations
The questionnaire that was distributed to tourists listed four types of forest industry impacts that
visitors could potentially encounter while visiting Tasmania. These include harvested areas, tree
plantations, logging trucks and saw/pulp mills. Participants were asked to indicate whether or
not they had observed each type of impact during their trip. Out of 325 respondents, 317
completed this question (97.54%).
A chi-square test for association was conducted between sample sites and degree of exposure
to forestry impacts. This revealed that statistically significant relationships do exist between
sample sites and most impacts. However, the strength of these relationships varied depending
on the type of forest industry impact. It appears that each of the four impact types measured
were related to specific sample sites. The strongest relationship that was observed occurred
between harvested areas and sample site (2 = 58.199; df = 2; p = 0.000; Cramer’s V = 0.428)
with Cradle Mountain Visitor Centre and Central Highland Fishing guests being much more
likely to encounter this type of impact than Overland Track walkers. This was followed by
logging trucks (2 = 54.527; df = 2; p = 0.000; Cramer’s V = 0.415), which saw the likelihood of
encountering this type of impact vary significantly between the three sample groups. Tree
plantations were also shown to be associated with specific sample sites (2 = 34.626; df = 2; p =
0.000; Cramer’s V = 0.330) with Overland Track walkers being much less likely to encounter
this type of impact than the other two sample groups. Finally, saw/pulp mills were also
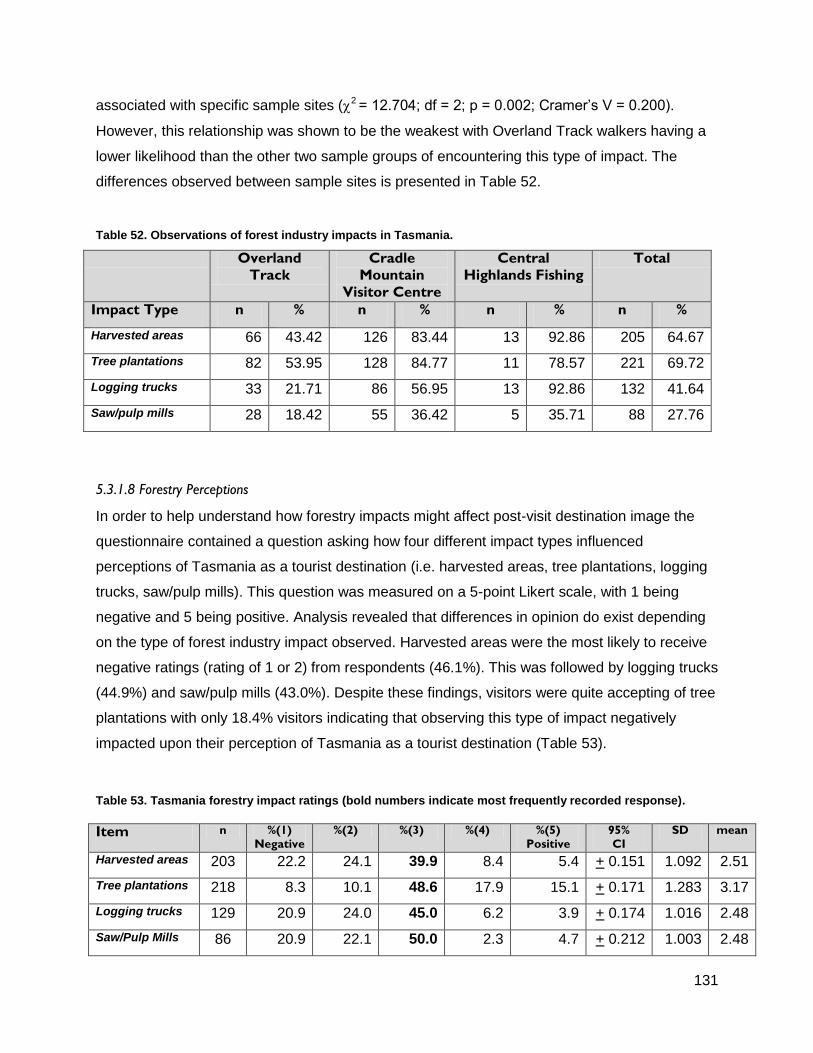
131
associated with specific sample sites (2 = 12.704; df = 2; p = 0.002; Cramer’s V = 0.200).
However, this relationship was shown to be the weakest with Overland Track walkers having a
lower likelihood than the other two sample groups of encountering this type of impact. The
differences observed between sample sites is presented in Table 52.
Table 52. Observations of forest industry impacts in Tasmania.
Overland
Track
Cradle
Mountain
Visitor Centre
Central
Highlands Fishing
Total
Impact Type n % n % n % n %
Harvested areas 66 43.42 126 83.44 13 92.86 205 64.67
Tree plantations 82 53.95 128 84.77 11 78.57 221 69.72
Logging trucks 33 21.71 86 56.95 13 92.86 132 41.64
Saw/pulp mills 28 18.42 55 36.42 5 35.71 88 27.76
5.3.1.8 Forestry Perceptions
In order to help understand how forestry impacts might affect post-visit destination image the
questionnaire contained a question asking how four different impact types influenced
perceptions of Tasmania as a tourist destination (i.e. harvested areas, tree plantations, logging
trucks, saw/pulp mills). This question was measured on a 5-point Likert scale, with 1 being
negative and 5 being positive. Analysis revealed that differences in opinion do exist depending
on the type of forest industry impact observed. Harvested areas were the most likely to receive
negative ratings (rating of 1 or 2) from respondents (46.1%). This was followed by logging trucks
(44.9%) and saw/pulp mills (43.0%). Despite these findings, visitors were quite accepting of tree
plantations with only 18.4% visitors indicating that observing this type of impact negatively
impacted upon their perception of Tasmania as a tourist destination (Table 53).
Table 53. Tasmania forestry impact ratings (bold numbers indicate most frequently recorded response).
Item n %(1)
Negative
%(2) %(3) %(4) %(5)
Positive
95%
CI
SD mean
Harvested areas 203 22.2 24.1 39.9 8.4 5.4 + 0.151 1.092 2.51
Tree plantations 218 8.3 10.1 48.6 17.9 15.1 + 0.171 1.283 3.17
Logging trucks 129 20.9 24.0 45.0 6.2 3.9 + 0.174 1.016 2.48
Saw/Pulp Mills 86 20.9 22.1 50.0 2.3 4.7 + 0.212 1.003 2.48
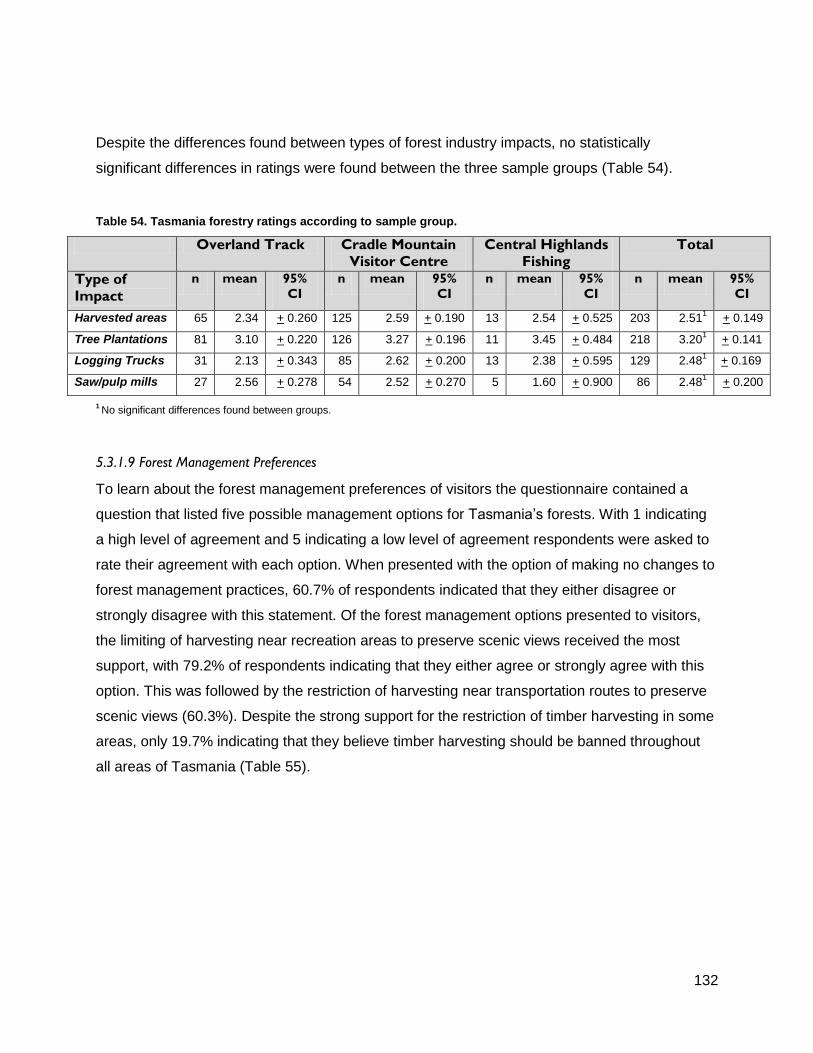
132
Despite the differences found between types of forest industry impacts, no statistically
significant differences in ratings were found between the three sample groups (Table 54).
Table 54. Tasmania forestry ratings according to sample group.
Overland Track Cradle Mountain
Visitor Centre
Central Highlands
Fishing
Total
Type of
Impact
n mean 95%
CI
n mean 95%
CI
n mean 95%
CI
n mean 95%
CI
Harvested areas 65 2.34 + 0.260 125 2.59 + 0.190 13 2.54 + 0.525 203 2.511
+ 0.149
Tree Plantations 81 3.10 + 0.220 126 3.27 + 0.196 11 3.45 + 0.484 218 3.201
+ 0.141
Logging Trucks 31 2.13 + 0.343 85 2.62 + 0.200 13 2.38 + 0.595 129 2.481
+ 0.169
Saw/pulp mills 27 2.56 + 0.278 54 2.52 + 0.270 5 1.60 + 0.900 86 2.481
+ 0.200
1 No significant differences found between groups.
5.3.1.9 Forest Management Preferences
To learn about the forest management preferences of visitors the questionnaire contained a
question that listed five possible management options for Tasmania’s forests. With 1 indicating
a high level of agreement and 5 indicating a low level of agreement respondents were asked to
rate their agreement with each option. When presented with the option of making no changes to
forest management practices, 60.7% of respondents indicated that they either disagree or
strongly disagree with this statement. Of the forest management options presented to visitors,
the limiting of harvesting near recreation areas to preserve scenic views received the most
support, with 79.2% of respondents indicating that they either agree or strongly agree with this
option. This was followed by the restriction of harvesting near transportation routes to preserve
scenic views (60.3%). Despite the strong support for the restriction of timber harvesting in some
areas, only 19.7% indicating that they believe timber harvesting should be banned throughout
all areas of Tasmania (Table 55).
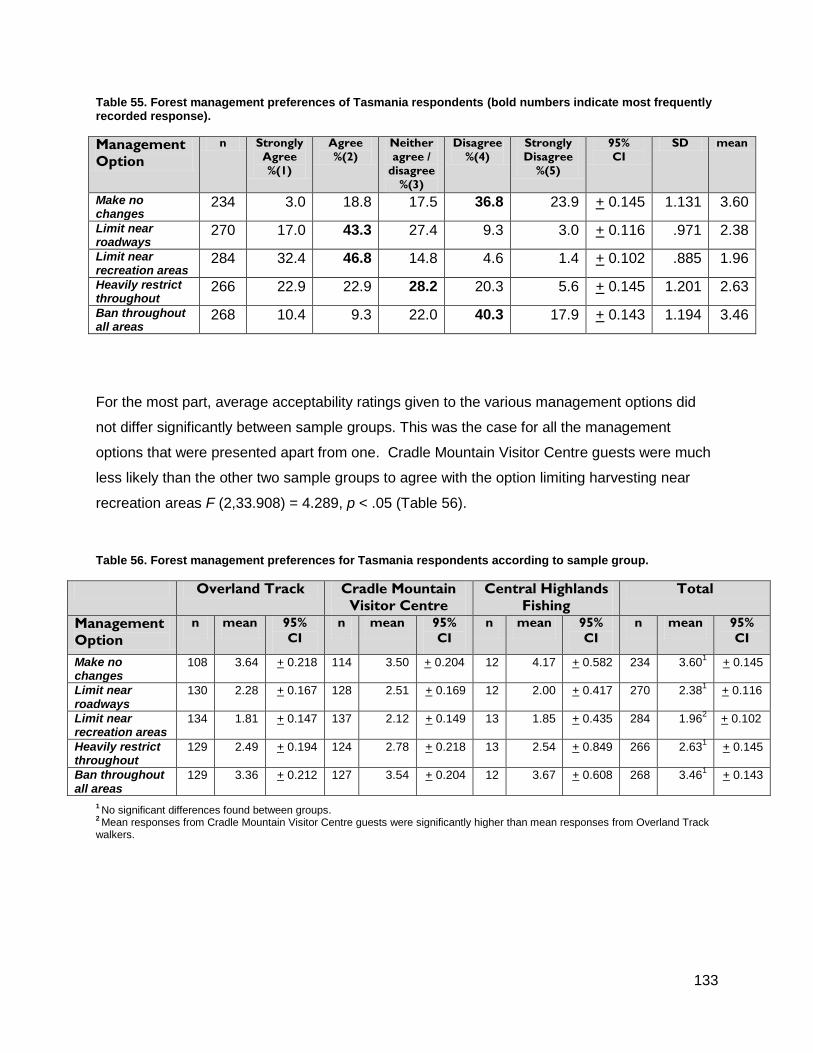
133
Table 55. Forest management preferences of Tasmania respondents (bold numbers indicate most frequently recorded response).
Management
Option
n Strongly
Agree
%(1)
Agree
%(2)
Neither
agree /
disagree
%(3)
Disagree
%(4)
Strongly
Disagree
%(5)
95%
CI
SD mean
Make no changes
234 3.0 18.8 17.5 36.8 23.9 + 0.145 1.131 3.60
Limit near roadways
270 17.0 43.3 27.4 9.3 3.0 + 0.116 .971 2.38
Limit near recreation areas
284 32.4 46.8 14.8 4.6 1.4 + 0.102 .885 1.96
Heavily restrict throughout
266 22.9 22.9 28.2 20.3 5.6 + 0.145 1.201 2.63
Ban throughout all areas
268 10.4 9.3 22.0 40.3 17.9 + 0.143 1.194 3.46
For the most part, average acceptability ratings given to the various management options did
not differ significantly between sample groups. This was the case for all the management
options that were presented apart from one. Cradle Mountain Visitor Centre guests were much
less likely than the other two sample groups to agree with the option limiting harvesting near
recreation areas F (2,33.908) = 4.289, p < .05 (Table 56).
Table 56. Forest management preferences for Tasmania respondents according to sample group.
Overland Track Cradle Mountain
Visitor Centre
Central Highlands
Fishing
Total
Management
Option
n mean 95%
CI
n mean 95%
CI
n mean 95%
CI
n mean 95%
CI
Make no changes
108 3.64 + 0.218 114 3.50 + 0.204 12 4.17 + 0.582 234 3.601
+ 0.145
Limit near roadways
130 2.28 + 0.167 128 2.51 + 0.169 12 2.00 + 0.417 270 2.381
+ 0.116
Limit near recreation areas
134 1.81 + 0.147 137 2.12 + 0.149 13 1.85 + 0.435 284 1.962
+ 0.102
Heavily restrict throughout
129 2.49 + 0.194 124 2.78 + 0.218 13 2.54 + 0.849 266 2.631
+ 0.145
Ban throughout all areas
129 3.36 + 0.212 127 3.54 + 0.204 12 3.67 + 0.608 268 3.461
+ 0.143
1 No significant differences found between groups.
2 Mean responses from Cradle Mountain Visitor Centre guests were significantly higher than mean responses from Overland Track
walkers.
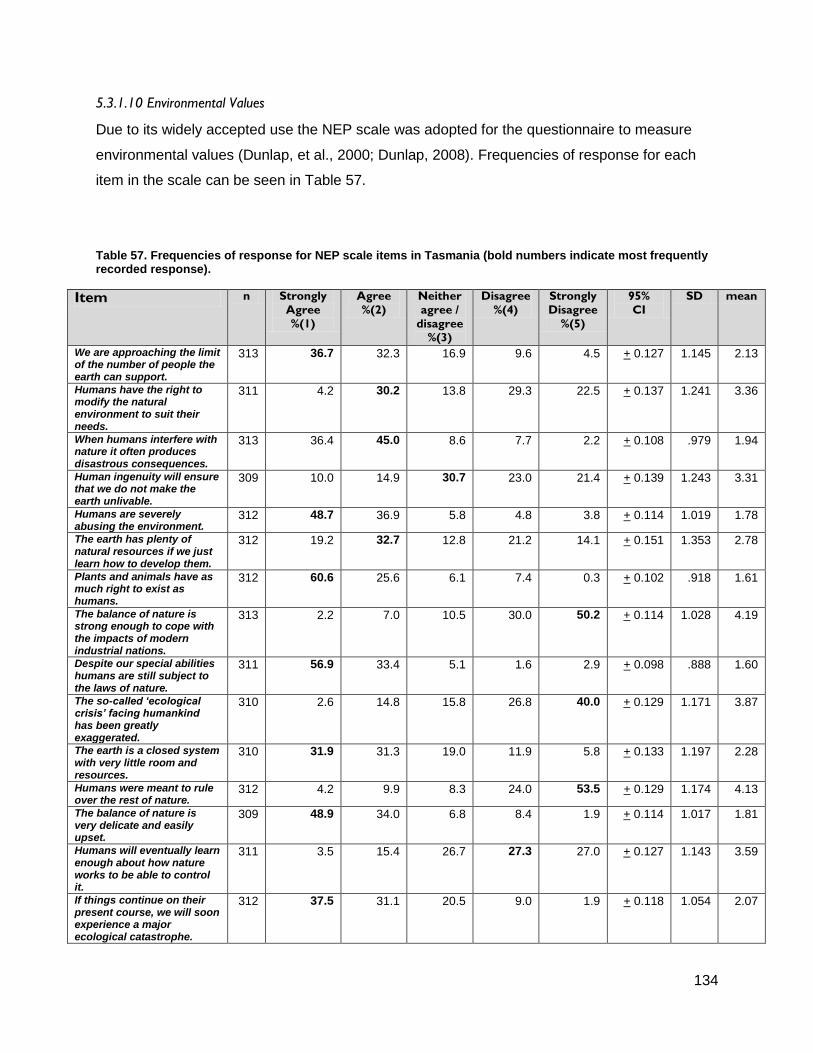
134
5.3.1.10 Environmental Values
Due to its widely accepted use the NEP scale was adopted for the questionnaire to measure
environmental values (Dunlap, et al., 2000; Dunlap, 2008). Frequencies of response for each
item in the scale can be seen in Table 57.
Table 57. Frequencies of response for NEP scale items in Tasmania (bold numbers indicate most frequently recorded response).
Item n Strongly
Agree
%(1)
Agree
%(2)
Neither
agree /
disagree %(3)
Disagree
%(4)
Strongly
Disagree
%(5)
95%
CI
SD mean
We are approaching the limit of the number of people the earth can support.
313 36.7 32.3 16.9 9.6 4.5 + 0.127 1.145 2.13
Humans have the right to modify the natural environment to suit their needs.
311 4.2 30.2 13.8 29.3 22.5 + 0.137 1.241 3.36
When humans interfere with nature it often produces disastrous consequences.
313 36.4 45.0 8.6 7.7 2.2 + 0.108 .979 1.94
Human ingenuity will ensure that we do not make the earth unlivable.
309 10.0 14.9 30.7 23.0 21.4 + 0.139 1.243 3.31
Humans are severely abusing the environment.
312 48.7 36.9 5.8 4.8 3.8 + 0.114 1.019 1.78
The earth has plenty of natural resources if we just learn how to develop them.
312 19.2 32.7 12.8 21.2 14.1 + 0.151 1.353 2.78
Plants and animals have as much right to exist as humans.
312 60.6 25.6 6.1 7.4 0.3 + 0.102 .918 1.61
The balance of nature is strong enough to cope with the impacts of modern industrial nations.
313 2.2 7.0 10.5 30.0 50.2 + 0.114 1.028 4.19
Despite our special abilities humans are still subject to the laws of nature.
311 56.9 33.4 5.1 1.6 2.9 + 0.098 .888 1.60
The so-called ‘ecological crisis’ facing humankind has been greatly exaggerated.
310 2.6 14.8 15.8 26.8 40.0 + 0.129 1.171 3.87
The earth is a closed system with very little room and resources.
310 31.9 31.3 19.0 11.9 5.8 + 0.133 1.197 2.28
Humans were meant to rule over the rest of nature.
312 4.2 9.9 8.3 24.0 53.5 + 0.129 1.174 4.13
The balance of nature is very delicate and easily upset.
309 48.9 34.0 6.8 8.4 1.9 + 0.114 1.017 1.81
Humans will eventually learn enough about how nature works to be able to control it.
311 3.5 15.4 26.7 27.3 27.0 + 0.127 1.143 3.59
If things continue on their present course, we will soon experience a major ecological catastrophe.
312 37.5 31.1 20.5 9.0 1.9 + 0.118 1.054 2.07
135
In the initial analysis Cronbach’s alpha revealed that the overall reliability of the scale was fairly
high (Cronbach’s α = .800). Reliability analysis revealed that there were no items that would
improve the reliability of the scale with their omission. Therefore, all fifteen items were retained
for analysis. The Kaiser-Meyer-Olkin verified the sampling adequacy for this analysis, KMO =
.843 and all KMO values for individual items were > .769, which is well above the acceptable
limit of .5 (Field, 2009). Bartlett’s test of sphericity 2 (105) = 823.812, p < .001 suggests that
correlations between items were sufficient for principle component analysis. Analysis was run to
obtain eigenvalues for each component. Four of these had eigenvalues above Kaiser’s criterion
of 1 and in combination explained 52.20% of the variance. Table 58 depicts the factor loadings
after rotation along with the value of Cronbach’s alpha for each factor that was identified.
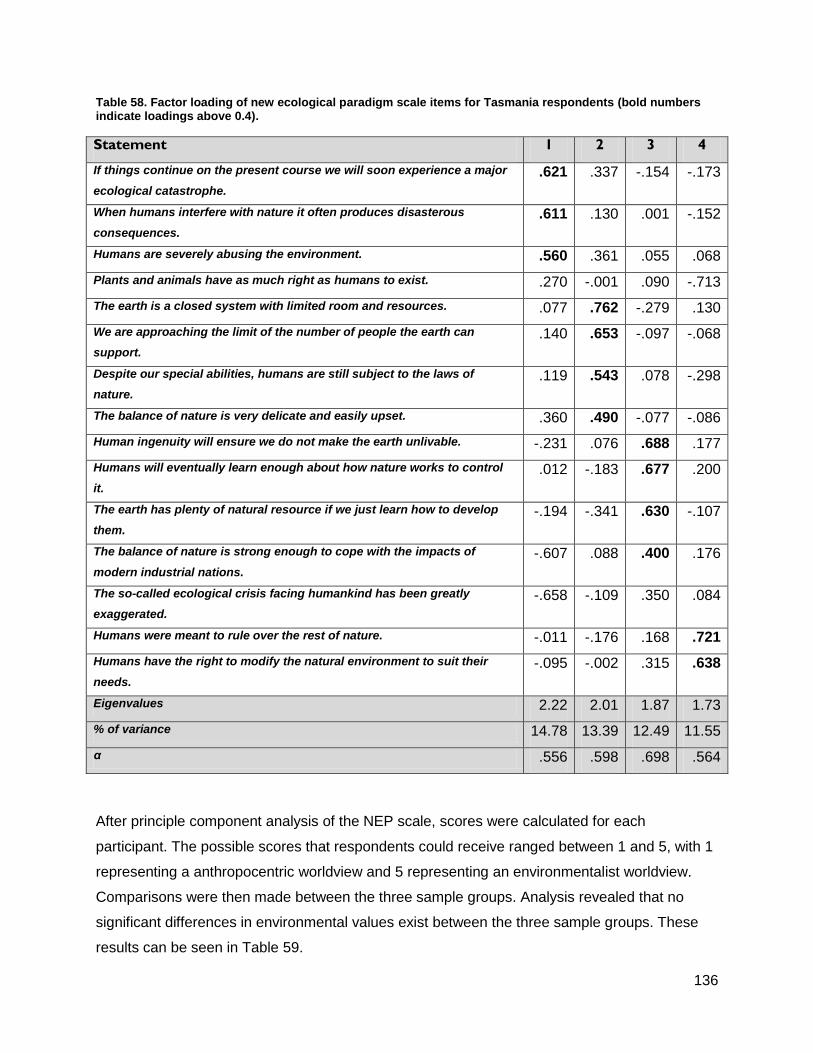
136
Table 58. Factor loading of new ecological paradigm scale items for Tasmania respondents (bold numbers indicate loadings above 0.4).
After principle component analysis of the NEP scale, scores were calculated for each
participant. The possible scores that respondents could receive ranged between 1 and 5, with 1
representing a anthropocentric worldview and 5 representing an environmentalist worldview.
Comparisons were then made between the three sample groups. Analysis revealed that no
significant differences in environmental values exist between the three sample groups. These
results can be seen in Table 59.
Statement 1 2 3 4
If things continue on the present course we will soon experience a major
ecological catastrophe.
.621 .337 -.154 -.173
When humans interfere with nature it often produces disasterous
consequences.
.611 .130 .001 -.152
Humans are severely abusing the environment. .560 .361 .055 .068
Plants and animals have as much right as humans to exist. .270 -.001 .090 -.713
The earth is a closed system with limited room and resources. .077 .762 -.279 .130
We are approaching the limit of the number of people the earth can
support.
.140 .653 -.097 -.068
Despite our special abilities, humans are still subject to the laws of
nature.
.119 .543 .078 -.298
The balance of nature is very delicate and easily upset. .360 .490 -.077 -.086
Human ingenuity will ensure we do not make the earth unlivable. -.231 .076 .688 .177
Humans will eventually learn enough about how nature works to control
it.
.012 -.183 .677 .200
The earth has plenty of natural resource if we just learn how to develop
them.
-.194 -.341 .630 -.107
The balance of nature is strong enough to cope with the impacts of
modern industrial nations.
-.607 .088 .400 .176
The so-called ecological crisis facing humankind has been greatly
exaggerated.
-.658 -.109 .350 .084
Humans were meant to rule over the rest of nature. -.011 -.176 .168 .721
Humans have the right to modify the natural environment to suit their
needs.
-.095 -.002 .315 .638
Eigenvalues 2.22 2.01 1.87 1.73
% of variance 14.78 13.39 12.49 11.55
α .556 .598 .698 .564
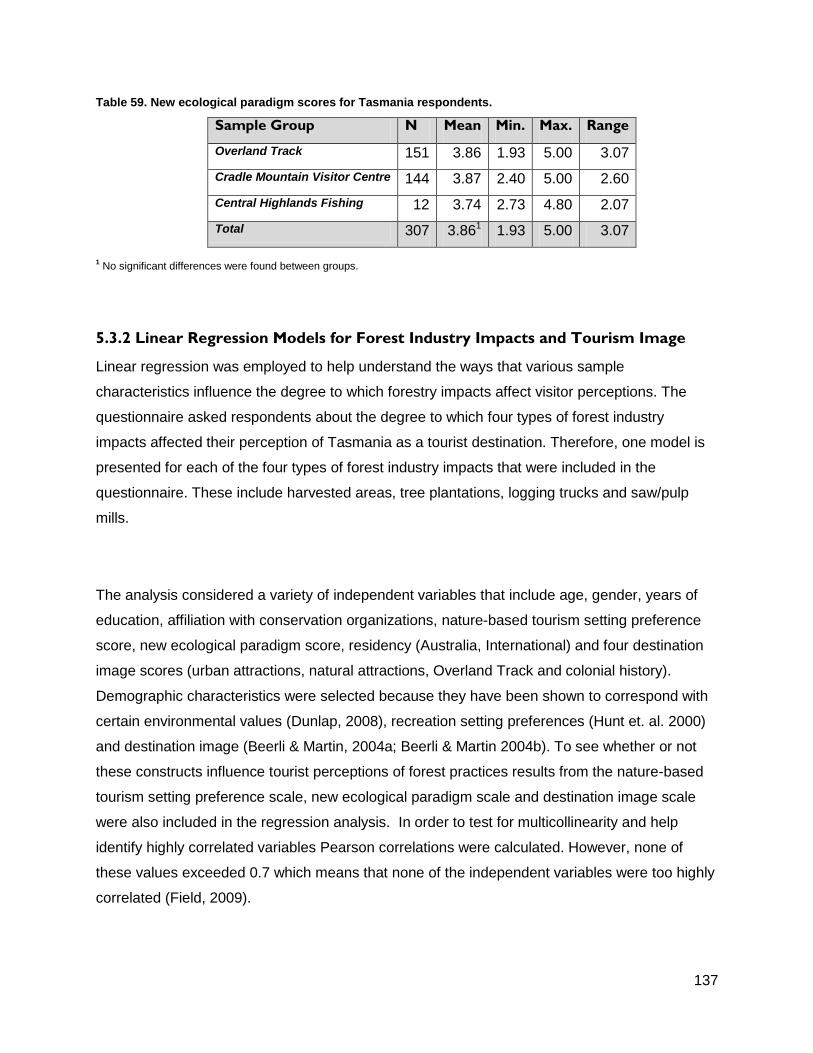
137
Table 59. New ecological paradigm scores for Tasmania respondents.
Sample Group N Mean Min. Max. Range
Overland Track 151 3.86 1.93 5.00 3.07
Cradle Mountain Visitor Centre 144 3.87 2.40 5.00 2.60
Central Highlands Fishing 12 3.74 2.73 4.80 2.07
Total 307 3.861 1.93 5.00 3.07
1 No significant differences were found between groups.
5.3.2 Linear Regression Models for Forest Industry Impacts and Tourism Image
Linear regression was employed to help understand the ways that various sample
characteristics influence the degree to which forestry impacts affect visitor perceptions. The
questionnaire asked respondents about the degree to which four types of forest industry
impacts affected their perception of Tasmania as a tourist destination. Therefore, one model is
presented for each of the four types of forest industry impacts that were included in the
questionnaire. These include harvested areas, tree plantations, logging trucks and saw/pulp
mills.
The analysis considered a variety of independent variables that include age, gender, years of
education, affiliation with conservation organizations, nature-based tourism setting preference
score, new ecological paradigm score, residency (Australia, International) and four destination
image scores (urban attractions, natural attractions, Overland Track and colonial history).
Demographic characteristics were selected because they have been shown to correspond with
certain environmental values (Dunlap, 2008), recreation setting preferences (Hunt et. al. 2000)
and destination image (Beerli & Martin, 2004a; Beerli & Martin 2004b). To see whether or not
these constructs influence tourist perceptions of forest practices results from the nature-based
tourism setting preference scale, new ecological paradigm scale and destination image scale
were also included in the regression analysis. In order to test for multicollinearity and help
identify highly correlated variables Pearson correlations were calculated. However, none of
these values exceeded 0.7 which means that none of the independent variables were too highly
correlated (Field, 2009).
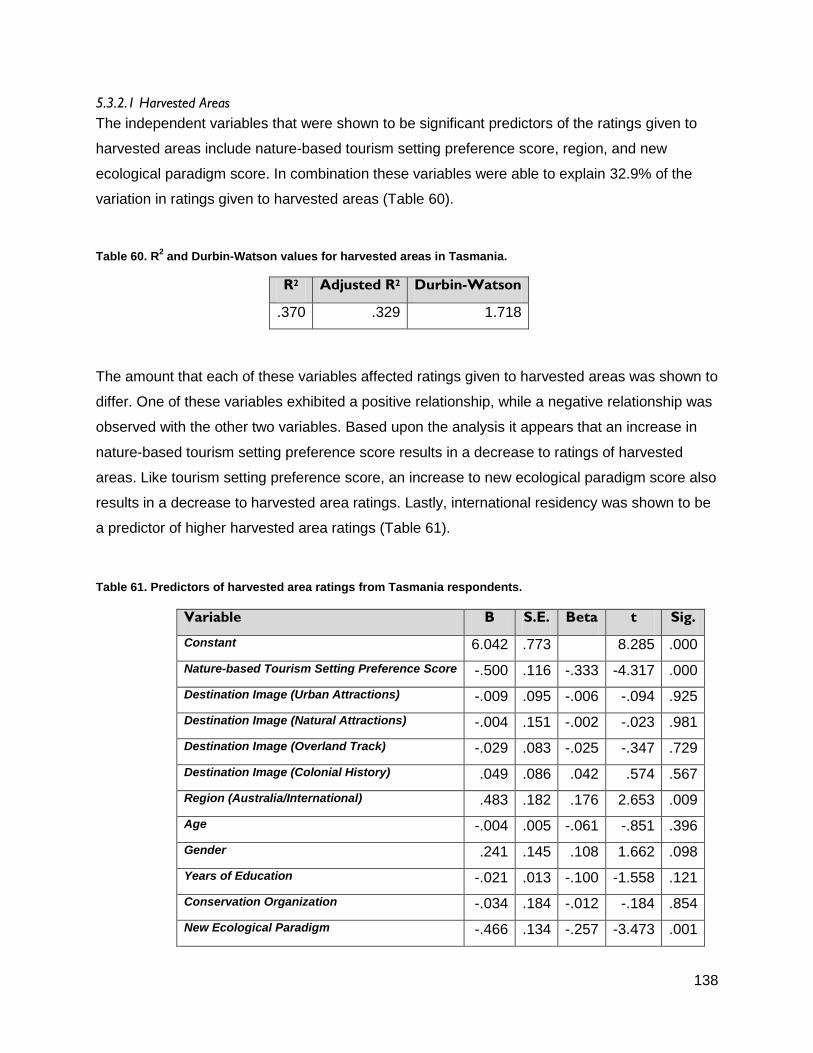
138
5.3.2.1 Harvested Areas
The independent variables that were shown to be significant predictors of the ratings given to
harvested areas include nature-based tourism setting preference score, region, and new
ecological paradigm score. In combination these variables were able to explain 32.9% of the
variation in ratings given to harvested areas (Table 60).
Table 60. R2 and Durbin-Watson values for harvested areas in Tasmania.
R2 Adjusted R2 Durbin-Watson
.370 .329 1.718
The amount that each of these variables affected ratings given to harvested areas was shown to
differ. One of these variables exhibited a positive relationship, while a negative relationship was
observed with the other two variables. Based upon the analysis it appears that an increase in
nature-based tourism setting preference score results in a decrease to ratings of harvested
areas. Like tourism setting preference score, an increase to new ecological paradigm score also
results in a decrease to harvested area ratings. Lastly, international residency was shown to be
a predictor of higher harvested area ratings (Table 61).
Table 61. Predictors of harvested area ratings from Tasmania respondents.
Variable B S.E. Beta t Sig.
Constant 6.042 .773 8.285 .000
Nature-based Tourism Setting Preference Score -.500 .116 -.333 -4.317 .000
Destination Image (Urban Attractions) -.009 .095 -.006 -.094 .925
Destination Image (Natural Attractions) -.004 .151 -.002 -.023 .981
Destination Image (Overland Track) -.029 .083 -.025 -.347 .729
Destination Image (Colonial History) .049 .086 .042 .574 .567
Region (Australia/International) .483 .182 .176 2.653 .009
Age -.004 .005 -.061 -.851 .396
Gender .241 .145 .108 1.662 .098
Years of Education -.021 .013 -.100 -1.558 .121
Conservation Organization -.034 .184 -.012 -.184 .854
New Ecological Paradigm -.466 .134 -.257 -3.473 .001
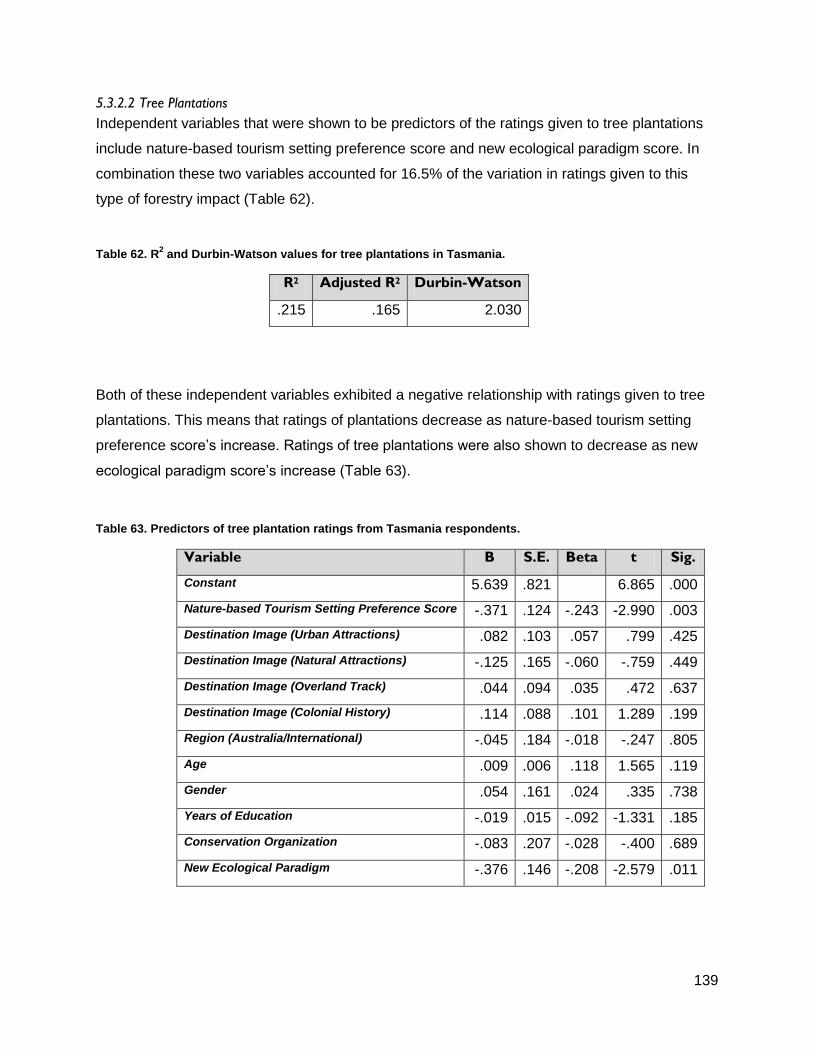
139
5.3.2.2 Tree Plantations
Independent variables that were shown to be predictors of the ratings given to tree plantations
include nature-based tourism setting preference score and new ecological paradigm score. In
combination these two variables accounted for 16.5% of the variation in ratings given to this
type of forestry impact (Table 62).
Table 62. R2 and Durbin-Watson values for tree plantations in Tasmania.
R2 Adjusted R2 Durbin-Watson
.215 .165 2.030
Both of these independent variables exhibited a negative relationship with ratings given to tree
plantations. This means that ratings of plantations decrease as nature-based tourism setting
preference score’s increase. Ratings of tree plantations were also shown to decrease as new
ecological paradigm score’s increase (Table 63).
Table 63. Predictors of tree plantation ratings from Tasmania respondents.
Variable B S.E. Beta t Sig.
Constant 5.639 .821 6.865 .000
Nature-based Tourism Setting Preference Score -.371 .124 -.243 -2.990 .003
Destination Image (Urban Attractions) .082 .103 .057 .799 .425
Destination Image (Natural Attractions) -.125 .165 -.060 -.759 .449
Destination Image (Overland Track) .044 .094 .035 .472 .637
Destination Image (Colonial History) .114 .088 .101 1.289 .199
Region (Australia/International) -.045 .184 -.018 -.247 .805
Age .009 .006 .118 1.565 .119
Gender .054 .161 .024 .335 .738
Years of Education -.019 .015 -.092 -1.331 .185
Conservation Organization -.083 .207 -.028 -.400 .689
New Ecological Paradigm -.376 .146 -.208 -2.579 .011
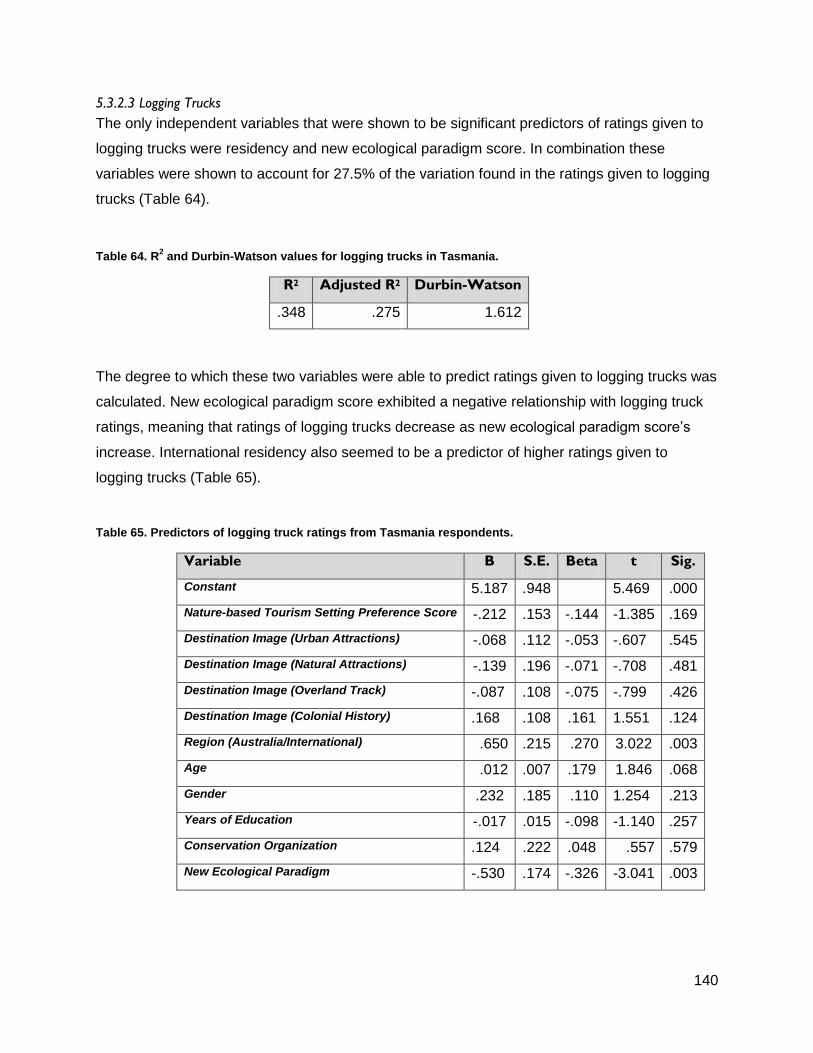
140
5.3.2.3 Logging Trucks
The only independent variables that were shown to be significant predictors of ratings given to
logging trucks were residency and new ecological paradigm score. In combination these
variables were shown to account for 27.5% of the variation found in the ratings given to logging
trucks (Table 64).
Table 64. R2 and Durbin-Watson values for logging trucks in Tasmania.
R2 Adjusted R2 Durbin-Watson
.348 .275 1.612
The degree to which these two variables were able to predict ratings given to logging trucks was
calculated. New ecological paradigm score exhibited a negative relationship with logging truck
ratings, meaning that ratings of logging trucks decrease as new ecological paradigm score’s
increase. International residency also seemed to be a predictor of higher ratings given to
logging trucks (Table 65).
Table 65. Predictors of logging truck ratings from Tasmania respondents.
Variable B S.E. Beta t Sig.
Constant 5.187 .948 5.469 .000
Nature-based Tourism Setting Preference Score -.212 .153 -.144 -1.385 .169
Destination Image (Urban Attractions) -.068 .112 -.053 -.607 .545
Destination Image (Natural Attractions) -.139 .196 -.071 -.708 .481
Destination Image (Overland Track) -.087 .108 -.075 -.799 .426
Destination Image (Colonial History) .168 .108 .161 1.551 .124
Region (Australia/International) .650 .215 .270 3.022 .003
Age .012 .007 .179 1.846 .068
Gender .232 .185 .110 1.254 .213
Years of Education -.017 .015 -.098 -1.140 .257
Conservation Organization .124 .222 .048 .557 .579
New Ecological Paradigm -.530 .174 -.326 -3.041 .003
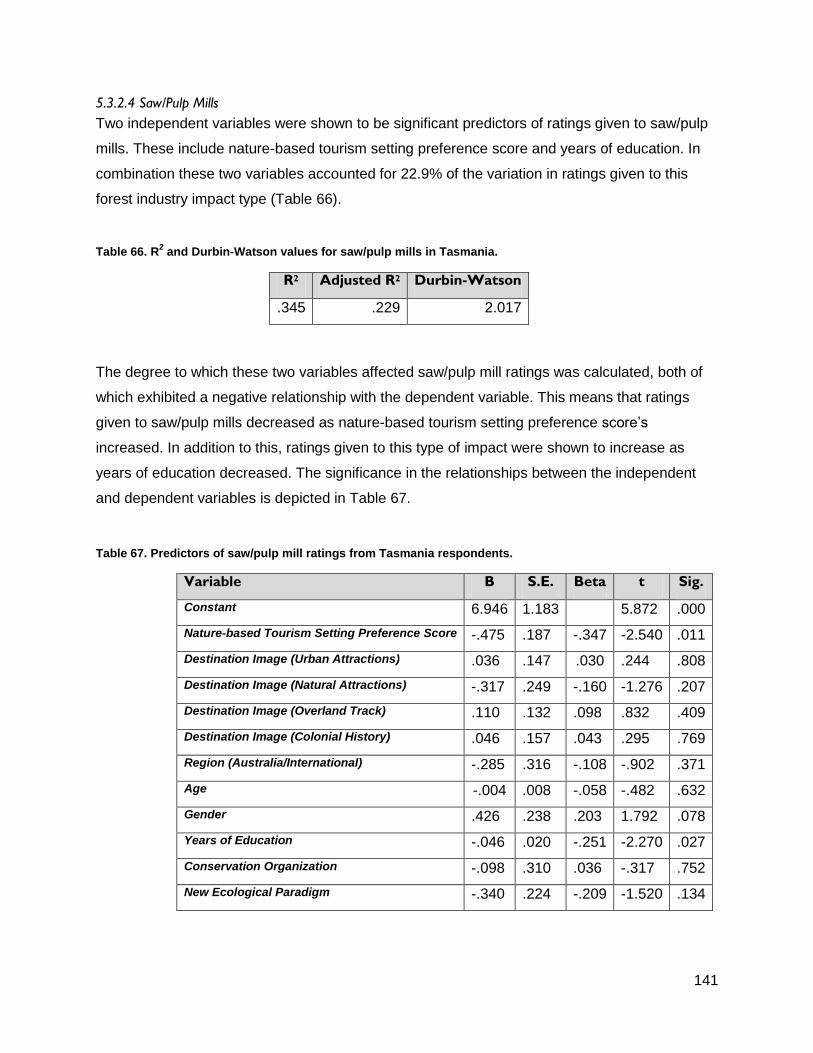
141
5.3.2.4 Saw/Pulp Mills
Two independent variables were shown to be significant predictors of ratings given to saw/pulp
mills. These include nature-based tourism setting preference score and years of education. In
combination these two variables accounted for 22.9% of the variation in ratings given to this
forest industry impact type (Table 66).
Table 66. R2 and Durbin-Watson values for saw/pulp mills in Tasmania.
R2 Adjusted R2 Durbin-Watson
.345 .229 2.017
The degree to which these two variables affected saw/pulp mill ratings was calculated, both of
which exhibited a negative relationship with the dependent variable. This means that ratings
given to saw/pulp mills decreased as nature-based tourism setting preference score’s
increased. In addition to this, ratings given to this type of impact were shown to increase as
years of education decreased. The significance in the relationships between the independent
and dependent variables is depicted in Table 67.
Table 67. Predictors of saw/pulp mill ratings from Tasmania respondents.
Variable B S.E. Beta t Sig.
Constant 6.946 1.183 5.872 .000
Nature-based Tourism Setting Preference Score -.475 .187 -.347 -2.540 .011
Destination Image (Urban Attractions) .036 .147 .030 .244 .808
Destination Image (Natural Attractions) -.317 .249 -.160 -1.276 .207
Destination Image (Overland Track) .110 .132 .098 .832 .409
Destination Image (Colonial History) .046 .157 .043 .295 .769
Region (Australia/International) -.285 .316 -.108 -.902 .371
Age -.004 .008 -.058 -.482 .632
Gender .426 .238 .203 1.792 .078
Years of Education -.046 .020 -.251 -2.270 .027
Conservation Organization -.098 .310 .036 -.317 .752
New Ecological Paradigm -.340 .224 -.209 -1.520 .134
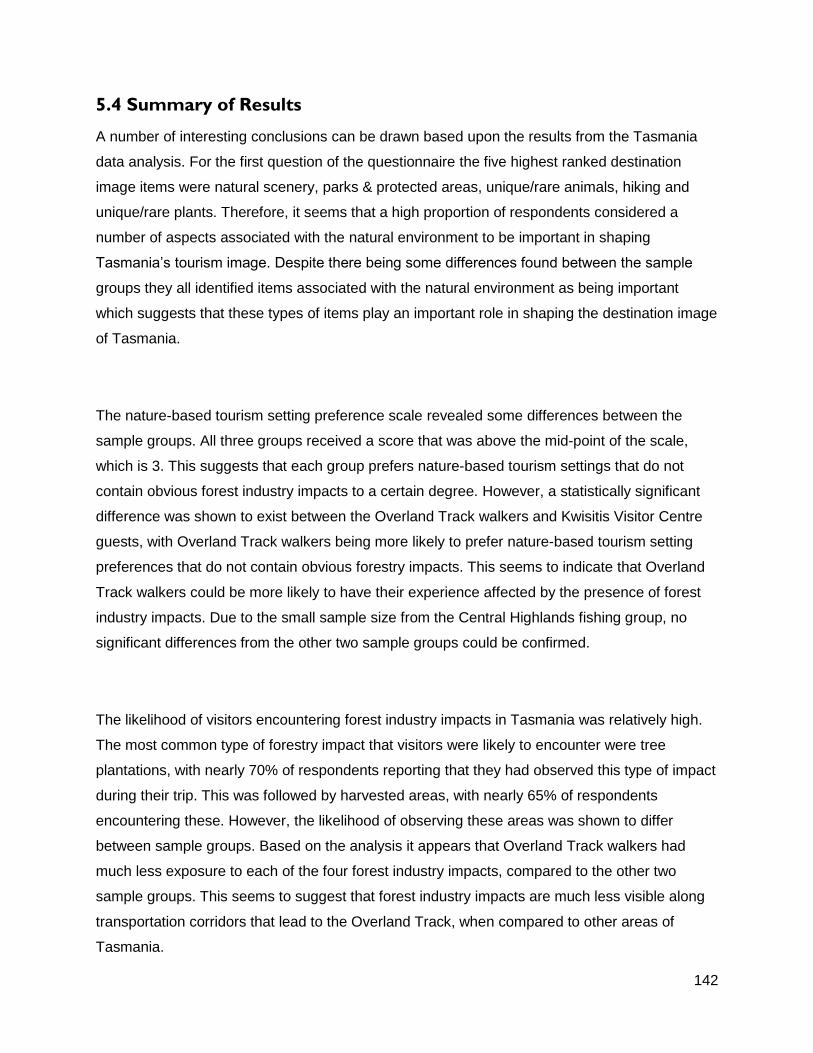
142
5.4 Summary of Results
A number of interesting conclusions can be drawn based upon the results from the Tasmania
data analysis. For the first question of the questionnaire the five highest ranked destination
image items were natural scenery, parks & protected areas, unique/rare animals, hiking and
unique/rare plants. Therefore, it seems that a high proportion of respondents considered a
number of aspects associated with the natural environment to be important in shaping
Tasmania’s tourism image. Despite there being some differences found between the sample
groups they all identified items associated with the natural environment as being important
which suggests that these types of items play an important role in shaping the destination image
of Tasmania.
The nature-based tourism setting preference scale revealed some differences between the
sample groups. All three groups received a score that was above the mid-point of the scale,
which is 3. This suggests that each group prefers nature-based tourism settings that do not
contain obvious forest industry impacts to a certain degree. However, a statistically significant
difference was shown to exist between the Overland Track walkers and Kwisitis Visitor Centre
guests, with Overland Track walkers being more likely to prefer nature-based tourism setting
preferences that do not contain obvious forestry impacts. This seems to indicate that Overland
Track walkers could be more likely to have their experience affected by the presence of forest
industry impacts. Due to the small sample size from the Central Highlands fishing group, no
significant differences from the other two sample groups could be confirmed.
The likelihood of visitors encountering forest industry impacts in Tasmania was relatively high.
The most common type of forestry impact that visitors were likely to encounter were tree
plantations, with nearly 70% of respondents reporting that they had observed this type of impact
during their trip. This was followed by harvested areas, with nearly 65% of respondents
encountering these. However, the likelihood of observing these areas was shown to differ
between sample groups. Based on the analysis it appears that Overland Track walkers had
much less exposure to each of the four forest industry impacts, compared to the other two
sample groups. This seems to suggest that forest industry impacts are much less visible along
transportation corridors that lead to the Overland Track, when compared to other areas of
Tasmania.
143
The question asking participants about the degree to which forest industry impacts affected their
perception of Tasmania as a tourist destination revealed that some differences do exist
depending upon the type of impact observed. For example, more than 45% of respondents
indicated that observing harvested areas had a negative effect on their perception of Tasmania
as a tourist destination. This number was even higher for saw/pulp mills with more than 60% of
respondents rating them unfavorably. Despite these findings, less than 20% of respondents said
that tree plantations negatively affected their perception. Despite these findings, no statistically
significant differences were found between the three sample groups. However, this could be a
result of the low numbers of respondents in the Overland Track and Central Highlands fishing
groups who observed certain types of forest industry impacts.
Analysis of the forest management preference question revealed that more than 60% of
respondents would like to see some changes made to forest management practices in
Tasmania. The management option receiving the most support was the limiting of harvesting
near recreation areas with nearly 80% of respondents supporting this option. This was followed
by limiting harvesting near roadways with over 60% indicating that they agree with this option.
Despite the support that was shown for the restriction of forestry in certain areas, very few
individuals indicated that they support a complete ban on forestry throughout the state. The only
difference found between the three sample groups was in relation to the option of limiting
harvesting near recreation areas, with Overland Track walkers being more likely to support this
option than Cradle Mountain Visitor Centre guests.
To understand the degree to which certain variables were able to predict ratings given to the
four forest industry impact types, linear regression analysis was used. The amount that each of
these variables was able to predict ratings was partly dependent upon the type forest industry
impact in question. Although the predictive power of each of the models was quite limited,
nature-based tourism setting preference score, new ecological paradigm score and residency
seemed to be the most significant predictors of ratings given to forest industry impacts.
Variables that were able to help predict ratings given to harvested areas include nature-based
tourism setting preference score, new ecological paradigm score and region of residency
(Australia or international). Nature-based tourism setting preference score and new ecological
paradigm score were also shown to be significant predictors of ratings given to tree plantations.
144
Residency and new ecological paradigm score were significant predictors of logging truck
ratings. Lastly, tourist sensitivity score and years of education were significant predictors of
ratings given to saw/pulp mills.
5.5 Conclusion
The highest ranked items on the destination image scale related to natural landscapes and
outdoor activities suggesting that this is important for shaping the destination image of research
participants in Tasmania. The nature-based tourism setting preference scale revealed that a
high proportion of visitors to Tasmania prefer landscapes that have not been visibly impacted by
forestry. This was supported by responses to the question asking about the degree to which
certain forest industry impacts affected perceptions. Overall, harvested areas were rated
towards the lower end of the scale. However, visitors rated tree plantations much higher. This is
likely because they are often less visible within the landscape. More than 60% of respondents
disagreed with the statement suggesting ‘no forest management changes are need in
Tasmania.’ This could suggest that changes to forest management practices could produce
positive results for tourism.
Certain differences between the sample groups were also uncovered. According to the nature-
based tourism setting preference scale Overland Track walkers were less accepting of forest
industry impacts than Cradle Mountain Visitor Centre guests. Despite this finding, no significant
differences were found between groups for the question that asked participants to rate the
degree to which certain forest industry impacts affected their perceptions. In terms of support for
various forest management options, Cradle Mountain Visitor Centre guests were more likely
than the other sample groups to agree with the statement suggesting that harvesting should be
limited near recreational areas. However, no other differences were noted between the sample
groups. When considering these results it is important to note the small sample size from the
Central Highlands fishing group. It is possible that a larger sample size may have resulted in the
discovery of more significant differences between this sample group and the others. Even
though this limits reliability of findings from the Central Highlands fishing group, the other two
sample groups received a sufficient number of responses.
145
Chapter 6
Vancouver Island & Tasmania
Interview Results
6.1 Introduction
This chapter presents results from the interviews that were conducted with tourism and forestry
professionals from both Vancouver Island and Tasmania. The primary purpose of these
interviews was to gain insight into the actual conflicts that do occur between forestry and
tourism and uncover measures that may be used to manage these types of conflicts most
effectively. The analysis was based on interviews with tourism and forestry professionals from
both study regions and includes business owners, academics, government employees and
representatives from industry organizations. In total 37 individuals were interviewed (19 in
Tasmania and 18 in Vancouver Island). In both case study destinations there were a higher
number of tourism affiliated interview participants than forest industry participants. This was
because saturation was achieved much earlier with forest industry affiliated interviewees. Those
working for forest management organizations showed a tendency to answer many interview
questions in a similar way, whereas the opinions of tourism operators were highly dependent
upon their personal situations, experiences and opinions. Therefore, more interviews were
required with tourism affiliated interviewees to account for the diversity found within that group.
The number of interviewees affiliated with tourism and forestry is shown in Table 68. Interviews
were either conducted in-person or by telephone and generally lasted between 30 and 60
minutes.
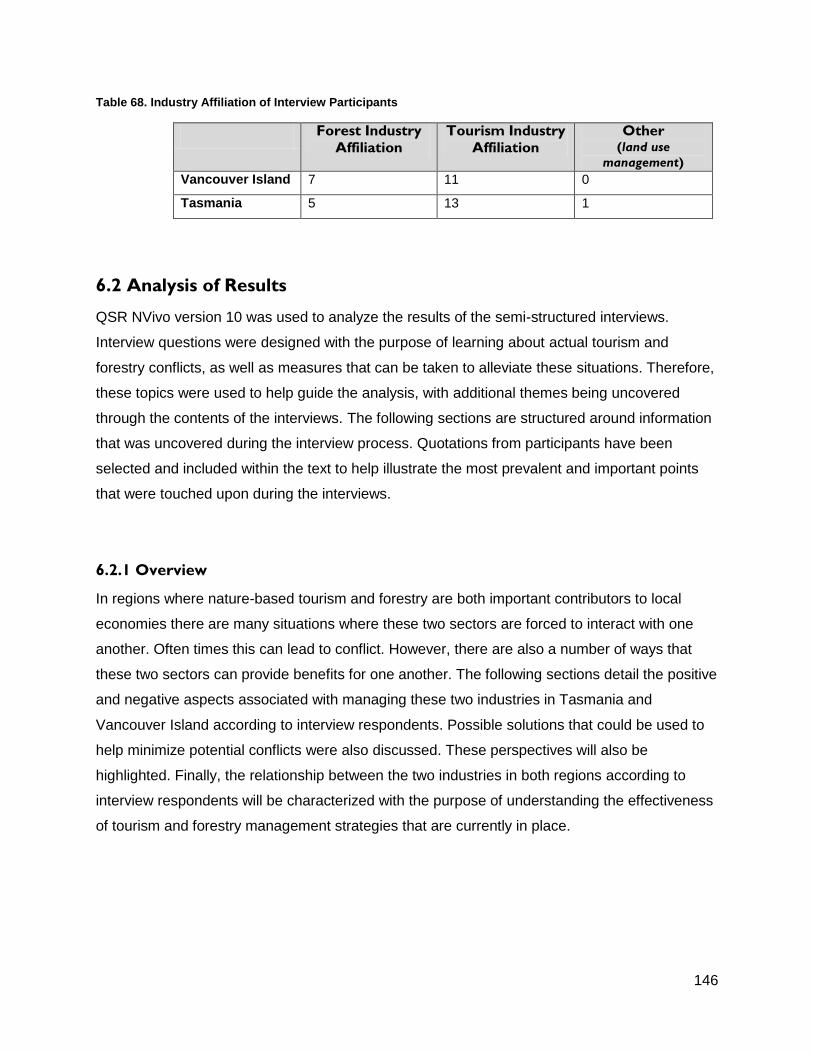
146
Table 68. Industry Affiliation of Interview Participants
Forest Industry
Affiliation
Tourism Industry
Affiliation
Other (land use
management)
Vancouver Island 7 11 0
Tasmania 5 13 1
6.2 Analysis of Results
QSR NVivo version 10 was used to analyze the results of the semi-structured interviews.
Interview questions were designed with the purpose of learning about actual tourism and
forestry conflicts, as well as measures that can be taken to alleviate these situations. Therefore,
these topics were used to help guide the analysis, with additional themes being uncovered
through the contents of the interviews. The following sections are structured around information
that was uncovered during the interview process. Quotations from participants have been
selected and included within the text to help illustrate the most prevalent and important points
that were touched upon during the interviews.
6.2.1 Overview
In regions where nature-based tourism and forestry are both important contributors to local
economies there are many situations where these two sectors are forced to interact with one
another. Often times this can lead to conflict. However, there are also a number of ways that
these two sectors can provide benefits for one another. The following sections detail the positive
and negative aspects associated with managing these two industries in Tasmania and
Vancouver Island according to interview respondents. Possible solutions that could be used to
help minimize potential conflicts were also discussed. These perspectives will also be
highlighted. Finally, the relationship between the two industries in both regions according to
interview respondents will be characterized with the purpose of understanding the effectiveness
of tourism and forestry management strategies that are currently in place.
147
6.2.2 Positive Impacts
Like many other regions, the forest industry in Vancouver Island does provide certain benefits to
the nature-based tourism industry. Many of these benefits were identified in the semi-structured
interviews. For example, forestry helps to provide access to remote places for many nature-
based tourists. Roads that were originally constructed for logging provide visitors with numerous
opportunities to participate in activities such as wildlife viewing, fishing and hiking. This is the
case in Vancouver Island, as well as the rest of British Columbia. These benefits were noted by
two of the participants who were affiliated with the tourism industry. One of these individuals
stated:
There is a lot of tourism products in the province that probably wouldn’t exist in the way
that they do right now without the road access that has been created by the forest
industry, there is no doubt. So that is really a positive thing (VI 5).
Although this is not the case for all types of operations, forestry often provides extra revenue for
tourism businesses. In many regional areas forest industry workers utilize tourism related
services such as accommodation and food establishments. According to one of the tourism
affiliated interview participants, a large proportion of revenue for these types of businesses can
actually come from workers who are working away from home. This is especially true during the
low season for tourism (e.g. winter) and for more remote areas. Other potential benefits
identified by interview participants include the interpretive value associated with certain types of
forest industry impacts and the extra publicity that can be created by high-profile resource use
conflicts that attract media attention.
Similar to Vancouver Island the forest industry in Tasmania has been credited with providing
certain benefits to the tourism industry. A number of these benefits were touched on during the
semi-structured interviews that took place with Tasmanian tourism and forestry professionals.
The additional access that forestry provides to many remote areas in the state can benefit the
tourism industry by increasing opportunities. This was explained by one forestry affiliated
interviewee who said:
Nearly all access to these more remote areas in Tasmania has been created in the past
either by the mining industry or the forest industry. Through road and infrastructure put in
148
to undertake either mining or forestry. Tourism operators use those roads. They use
them to gain access and build their premises, set up their businesses… (TA 19)
Additional business from forestry workers was also identified by multiple interview participants
as a benefit that the industry provides to tourism businesses in Tasmania. When speaking about
the current downturn in the Tasmania forest industry, one of the tourism affiliated interviewees
expressed concern about the impact it could have on their accommodation and restaurant
business. It is this additional revenue which has led some tourism operators (mainly food and
accommodation providers) to become strong supporters of the forest industry. This was
explained by one of the tourism affiliated interview participants who stated:
There are parts of the state where the motel operator’s other major clients are the
truckies who drive for forestry. They are major supporters of the forest industry (TA 12).
The other major benefit that the Tasmania forest industry provides tourism relates to the
numerous regional development projects that have been initiated by Forestry Tasmania. This
forest management organization is unique in terms of its development of tourism attractions.
Although these attractions have met with varying levels of success, some have been credited
with rejuvenated local economies that were previously experiencing economic hardships. When
speaking about the Tahune Airwalk, which is Forestry Tasmania’s feature tourist attraction, one
forest industry affiliated interviewee explained:
For example, the Huon Valley. You look at all these little B&B’s and they have got lodges
and whatever else. And everybody says ‘10km away from the airwalk or 15 km away
and pictures from the airwalk.’ So it is the main attraction down there in the Huon Valley.
Dispersement into that area. Without that there would be a lot less people going there.
Development is still going on because of the success of the Tahune Airwalk (TA 5).
6.2.3 Negative Impacts
Despite the benefits identified, many individuals within the tourism industry view forestry as a
detriment to their business. This is supported by the interviewees who identified situations in
which forestry has negatively impacted upon the nature-based tourism sector. The most obvious
149
impacts associated with forestry relate to the visual effects that harvesting can have on scenic
landscapes. This seems to be recognized by individuals who work in both forestry and tourism,
as multiple interviewees from both industries discussed this. The potential impact that
insensitive forest practices can have on a tourism product that relies on natural attractions was
highlighted by one interviewee who explained:
Our product involves selling an experience to people who travel to British Columbia to
experience that wilderness and nature, natural values that BC has historically had a
reputation for. So industrial activity and the visual impact of clear-cuts diminishes that
wilderness value in the eyes of the tourists, which in turn lowers the value of our tours
and makes them less marketable, less saleable and lowers the quality of experience for
people (VI 4).
Like Vancouver Island, interviewees from Tasmania indicated that forestry can negatively affect
tourism if harvesting practices lead to visual impacts that are insensitive to the needs of nature-
based tourists. When speaking about the way that encounters with clear-cut areas affected the
perceptions of tourists one tourism affiliated interview participant said:
I have a lot of tourists come this way and they talk about the clearfelling. I think it’s one
of the key things that forestry did wrong. If you drive through sassafras where the apple
orchards and all that are, where the pine plantations are. People on coach buses will
come to me and tourists will come to me and talk about all that clearfelling there (TA 11).
Along with the visual impacts associated with forestry, other aspects of land use were identified
by interviewees as having the potential to negatively impact upon the tourism industry.
Landscape scale alterations over large areas were identified as a concern in regions of
Vancouver Island that are considered to have exceptional tourism value. While discussing the
impact that numerous tourism businesses are facing in their region one interviewee stated:
It seems like the more you talk about the issue with people, the more you hear them say,
‘oh, my camp is dealing with impending forestry activity in the channel.’ It just never
seems to end (VI 3).
150
The previous quote suggests that some nature-based tourism businesses struggle in
landscapes that are dominated by forest industry impacts. However, a large number of nature-
based tourism operators have no choice but to operate in these highly altered landscapes. This
is because commercial tourism opportunities are limited within protected areas and very few
regions outside of protected areas are specifically managed for the maintenance of tourism
values. Instead, most areas of Vancouver Island are managed for timber production. The lack of
areas accessible to commercial nature-based tourism opportunities was highlighted by one
forest industry affiliated interviewee who said:
We have a very extensive parks and recreation system in Vancouver Island, where we
as members of the public can go and enjoy that pristine wilderness setting, the trail
networks, the campground networks. But tourism operators cannot facilitate that
experience for us because they are unable to get tenure. And so they are locked out
looking in. And because they cannot get tenure they cannot offer a wilderness
experience in the wilderness settings that we are managing for (VI 14).
When speaking about the impacts associated with the clear-cuts that can be found in many
areas of Tasmania, one of the tourism affiliated interviewees expressed concern about the
negative effect that this has upon his tourism product.
So I would have a track I would go to, so I could just get away from cleared areas. I
would come back in a month’s time and it would be cut down. And I’m like, ‘no, not
again.’ (TA 3).
Additional access to remote areas was identified as a benefit that is provided by forestry.
However, the presence of a forest industry can also result in certain areas being closed to the
public. This is an issue that was brought forward during interviews with multiple tourism industry
affiliated participants in Vancouver Island. In certain instances this could negatively impact upon
tourism operators who may have previously used these areas to support their businesses.
Other concerns expressed by tourism affiliated interviewees in Vancouver Island include issues
related to traffic congestion on tourist routes and impacts to the natural environment. Although
151
not an issue in all areas of Vancouver Island, roads frequented by both tourists and logging
trucks were identified as a potential source of conflict between the two industries because of
safety concerns. This is especially true for gravel and dirt roads in some of the more remote
areas. Concerns about the natural environment were also mentioned by some interviewees as a
source of conflict. These concerns included impacts to wildlife populations and watersheds in
certain areas.
Although they did not feature as prominently as the impacts associated with timber harvesting,
other ways in which forestry can negatively affect tourism in Tasmania were also identified
during the semi-structured interviews. Traffic issues have arisen in the past where logging
trucks and tourist traffic are forced to share the same roads. However, the downturn in the
Tasmania forest industry in recent years has significantly reduced the number of logging truck
encounters that visitors are likely to have. Unfortunately, this downturn has indirectly led to a
new traffic related issue. Over the years many forestry roads have also become popular tourist
access routes in certain areas. Some of these have fallen into disrepair as a result of the current
economic problems facing the Tasmanian forest industry. When speaking about this issue one
of the forestry affiliated interview participant explained:
Things like roads on Bruny Island that are forestry roads. These types of things, in terms
of maintenance, we cannot afford to maintain these things anymore. In the case of the
roads on Bruny we are not harvesting in that area anymore so we do not maintain the
roads. Tourists and people who have shacks on Bruny use those roads. And then they
get angry at us because we are not maintaining the roads (VI 18).
Because of the high proportion of eucalypt forests found within Tasmania, regeneration and fuel
reduction burning is a common forest management practice to help maintain forest health and
protect assets. If not planned in a way that considers nearby communities, this practice has the
potential to negatively affect surrounding areas due to the visual and health effects associated
with the smoke. When speaking about the problems that this could cause for tourism operators
one of the tourism affiliated interviewees explained:
The main thing is the regen burns. The main issue that would tick people off, operators,
would be if you are down in the Huon Valley and a little B&B charging $300 a night and
152
there is a bloody napalm bomb in the back of your hills. And you are selling Beautiful
Tasmania (TA 12).
The distribution of protected areas was also identified as an issue that may lead to conflict
between forestry and tourism in Tasmania. Despite having such a high proportion of protected
land in Tasmania, much of this is concentrated in the southwest portion of the state. According
to one tourism affiliated interview participant, this has caused other areas to become more
heavily impacted by the forest industry, ultimately impacting upon tourism. When speaking
about this issue they stated:
We have got all these up here but unfortunately it looks like a bloody checkerboard at
the moment because you have got a nice bit here, but a big chunk taken out over there,
a nice bit there with a big chunk taken out over here. So there are no corridors for me to
continue to go through and do what I do without running into some bloody mess
somewhere. That is the annoying part (TA 3).
The way that forest management is structured within Tasmania was identified as another
potential source of conflict between forestry and tourism. As a ‘forest management corporation’,
Forestry Tasmania is responsible for managing forests for a wide range of values that include
tourism, conservation and recreation. However, they must also concern themselves with
generating profits which primarily comes from timber products. It is the inherent conflicts
associated with these diverse responsibilities that are a cause of concern for certain individuals.
As stated by one tourism affiliated interview participant:
So the model that we have got where the government agency is both the manager, the
protector, but also the exploiter is not a good model. You don’t get transparency in those
sorts of models. Particularly from a public perspective (TA 13).
A number of structural issues that help contribute to some of the conflict situations in Vancouver
Island were revealed during the interview process. Because timber production gets such a high
priority in British Columbia it puts businesses that utilize forested areas for other purposes at a
153
disadvantage. The influence that forestry has in the province was expressed by one forestry
affiliated interviewee who stated:
The development of the forest sector in the early 1900’s and the assumptions that kept
happening until at least 1984 or so were very clearly skewed to developing the major
economic driver of the province, which at that time was forestry. And we zoned literally
all of the sector to forestry… Now we are talking about changing zoning in favor of
tourism… All the government action regulation says is that if you are going to change the
zoning, you have to have a better public outcome than the current zoning. While you are
right that it puts a lot of power in the forest industry’s hands, it is predicated on the fact
that it was king at one point (VI 17).
Frustration with the priority that is given to timber production as opposed to other economic
activities in the province was expressed by one tourism industry affiliated interviewee who said:
It (tourism) generates a lot of money and a lot of taxation. But the Ministry of Forests is
still managing the forest and viewscapes like it’s 1965. Like forestry is ‘where it’s at.’ (VI
13)
It was also argued that some of the legislation governing natural resource management in
British Columbia is somewhat skewed in favor of the forest industry. Some of this concern was
directed towards the introduction of the Forest Range and Practices Act that was introduced in
2003 and the degree of power that it gives to the forest industry. One tourism affiliated
interviewee expressed his concern about this by stating:
I think it was in 2003 when the Liberal government changed the Forest Range and
Practices Act and basically took all of the accountability out of it. So it did not really
matter what type of tenure you had. You did not need to inform the community of what
your plans were (VI 13).
154
Concerns about the Forest Range and Practices Act and the power it gives to forestry were
echoed by another tourism affiliated interviewee. When speaking about the Forest Practices
Code that was replaced by the Forest Range and Practices Act in 2003 this individual said:
With all the watering down of the Forest Practices Code and implementation of
stewardship agreements with the companies, which is basically the fox looking after the
henhouse. I think things have really gone backwards (VI 7).
Another underlying issue mentioned by one of the tourism industry affiliated interviewees in
Vancouver Island was the incomplete or out of date information used to develop visual quality
objectives in certain situations. This can ultimately affect the ways in which forest practices
impact upon the scenic values of areas used for nature-based tourism. Some deficiencies within
the visual quality framework were also acknowledged by one of the forest industry affiliated
participants who stated:
I think there is room to improve them (visual quality objectives) to be sure from a bunch
of vantage points. How exactly and fitting them into the existing budget regime is another
question. But just in terms of what I would call an academic assessment of it, rather than
sort of an operational implementation assessment of it I do see some weaknesses
potentially (VI 17).
Although tourism can be negatively affected by the presence of the forest industry, tourism also
has the ability to negatively impact upon forestry. This was addressed by one of the forestry
affiliated interview participants in Vancouver Island. Because of the considerations that must be
made to the tourism industry, it restricts the degree of access that forestry has to timber in many
areas. This can lead to a reduction in cost efficiencies ultimately affecting the profitability of
logging companies. In regards to this one forest industry affiliated interviewee explained:
A lot of the regulation was based around viewscapes, which is of course for tourists
because there is no one else here. The people who live here are fine with it. So we
started seeing smaller clear-cuts. Places where we couldn’t log period. Less efficient
logging so it affects us on a cost basis (VI 8).
155
6.2.4 Conflict Solutions in Vancouver Island
Despite the many ways in which the tourism and forest industries come into conflict with one
another in Vancouver Island, there are currently measures in place to help reduce these types
of conflicts. When speaking about the evolution of forestry practices in past decades one of the
forestry affiliated interviewees said:
If you compare us to where we were 20 or 25 years ago we had really large clear-cuts
and scenic area management was not a big consideration. We have come a long ways.
And that was in part recognizing that there were public recreation interests and concerns
about the health of the environment and biodiversity and tourism values and so on. (VI
11).
The Forest Range and Practices Act identifies scenery as one of eleven forest values to be
managed and includes provisions for visual quality objectives. Although the system is not
perfect and received some criticism from interview participants, it can still be credited with the
preservation of certain viewscapes that have been maintained throughout many areas of
Vancouver Island. In order to comply with the legal framework, forest companies that operate in
visually sensitive areas are often required to dedicate a significant amount of time and
resources to help ensure developments are planned in a way that reduces the visual impact that
they might have on an area. When speaking about this one forestry affiliated interviewee
explained:
There is a legal framework in the province that manages visual quality objectives and we
put a lot of effort into testing ahead of time, testing what we think our harvesting is going
to look like (VI 9).
As well as managing viewscapes, significant effort has been made towards improving
communication and consultation with tourism operators and other stakeholders. The purpose of
this is to help address potential concerns about forest industry impacts in certain areas. To
ensure that this occurs certain legal requirements are in place. For example, forest companies
are required to publish ads in local newspapers when a forest stewardship plan is either created
or amended so that they can receive feedback from stakeholders. This was explained by one
forestry affiliated interviewee who stated:
156
When we advertise our forest stewardship plan or if we make certain types of
amendments to our plan the current legislative framework requires us to publish ads in
the newspaper. It requires us to figure out who else operates on the land base… So we
need to figure out who holds tenures in the area and get ahold of them to let them know
that we are either writing a plan, or advertising a plan, or amending a plan and we would
like their input (VI 9).
Although not exactly a legal tool, a voluntary agreement was signed in 1996 between the
Council of Forest Industries, Forest Alliance of British Columbia and the Council of Tourism
Associations of British Columbia. This single page document is known as the Statement of
Mutual Recognition and Respect and reaffirms the notion that both industries recognize the
other as important. Although it did not feature heavily in the interview process, it was touched on
briefly by two of the tourism industry affiliated participants.
In addition to legal tools, a number of forest companies take certain voluntary steps to
communicate their plans to other stakeholders. This is encouraged by the British Columbia
Ministry of Forests, Lands and Natural Resource Operations. When addressing this one of the
interviewees stated:
We are trying to encourage licensees to develop relationships with tourism operators.
And there is a role for us in facilitating that. Over the last couple of years we have had a
couple of workshops with licensees talking about their management practices in various
areas. We encourage them to be proactive and build relationships with tourism operators
and members of the public (VI 11).
Along with the measures already in place, a number of suggestions were put forward with
regard to additional ways that conflicts between forestry and tourism could potentially be
reduced. Two interview participants thought that some of the criticism the forest industry
receives could be partly related to a lack of public understanding about many aspects of the
industry. It was suggested that initiatives to improve public understanding could result in a
157
higher degree of acceptance towards forestry activities. When speaking about this one of the
forestry affiliated interviewees explained:
I would like to see the general public and tourists understand the business better. To not
just create their opinion based on what they see or what they read or what they hear in
newspapers. I would like them to educate themselves so that they better understand the
benefits and renewability of it. And what they use every day from the forest products
industry that they don’t know about. It’s not just paper and wood. Plastics, tires,
everything. If they understood that, I think it would be a little better (VI 8).
Despite the current measures that are in place to help encourage communication and
consultation between the tourism and forest industries, some interviewees suggested that
further improvements still need to be made in this area. Better communication between the two
industries and a more proactive approach to management were identified as possible ways to
improve the relationship between forestry and tourism.
I think more frequent dialogue would be beneficial and a more proactive approach would
be beneficial. It is better than it was, but it is still not perfect. So, and this is just my
opinion, if the forest industry and the Tourism Industry Association of BC were more
frequently communicating with each other and proactively looking at what the future
looks like as far as forest development and tourism development and how they impact
each other that would definitely improve things from where they are now (VI 6).
In addition to a more proactive approach to management, a suggestion was also made to
increase forest companies degree of responsibility when engaging with other licensees. In the
opinion of some interview participants the degree to which this occurs can vary considerably
depending of the forest licensee. Certain aspects of the Forest Range and Practices Act were
identified as causing this. For example, one tourism affiliated interviewee suggested that this
piece of legislation was introduced to give the forest companies more flexibility, decrease the
size of the forest management organization and give the forest industry a higher degree of self-
regulation. This participant also expressed concern that fewer mechanisms are now in place to
ensure that the concerns of stakeholders are addressed (VI 13).
158
It was also suggested that the identification and special management of high value tourism
areas could provide significant benefits to the tourism industry in Vancouver Island. Under the
old Forest Practices Act the Recreation Features Inventory was established to provide
information about recreational features to resource managers in order to assist them when
making land-use decisions. However, the most recent version of this document is over fifteen
year’s old (British Columbia Ministry of Forests, 1998a) leaving questions about its current
relevance. Ideally these areas would not require exclusion of the forest industry. Instead forest
management practices would consider the tourism industry first, as opposed to what currently
occurs in most parts of the province which is currently zoned for forestry. When speaking about
this one of the tourism affiliated interviewees stated:
There are places in British Columbia, especially along coastal BC, that are really
exemplary. They are totally amazing places… So we need to identify places of great
tourism value like this… And we need to say, ‘these have such incredible tourism values
that we need be careful what we do here.’ Many of them already have tourism sectors
that are active… Just give the industry something to work with and we can do amazing
things. That minimal consideration, that minimal foresight on recognizing the exceptional
places is just not happening at all (VI 13).
Although visual quality objectives have been responsible for the preservation of many visually
sensitive areas throughout all of British Columbia, there were multiple interviewee’s who
suggested that these could be improved in some areas of Vancouver Island. Despite the
budgetary constraints that were identified as a barrier to this, it seems likely that benefits to the
tourism industry could potentially make this worthwhile. This is especially true for areas that
have been identified as having significant tourism value.
Some interviewee’s indicated that addressing certain issues relating to organizational structure
could help to improve land management outcomes that would provide benefits to the tourism
industry. One tourism affiliated interviewee expressed the viewpoint that the organizational
structure of government departments within British Columbia does not represent tourism
interests very well. When speaking about this they stated:
159
It feels like nobody is speaking for tourism. You know there is a Ministry of Forests,
Lands and Natural Resources and there is a Ministry of Tourism, Jobs and Innovation,
but that ‘jobs’ also includes forestry jobs. You know there are district forest managers,
there is all the different levels of forestry, but there does not seem to be adequate
representation for the needs of tourism (VI 3).
Certain tourism affiliated interviewee’s expressed the opinion that a paradigm shift in terms of
forest management needs to be considered in British Columbia. It has already been argued that
the current legislative and management framework is skewed towards the needs of forestry in
many ways. This ignores the fact that tourism is one of the most significant drivers of the British
Columbia economy and much of that can be attributed to its promotion of the natural
environment. When discussing this one tourism affiliated interviewee explained:
The larger structural thing, where the balance between tourism and industry issues
needs to be a bit more equitable is where we need to go in the long term. So,
recognizing that wilderness tourism is a significant driver of the economy on the coast. In
certain high value areas it should be a priority to value tourism over extractive uses
because it is more sustainable over the long term (VI 4).
6.2.5 Conflict Solutions in Tasmania
Like Vancouver Island forestry has the potential to impact the tourism industry in Tasmania. In
fact, serious tourism and forest industry conflicts that would get played out in the media were
not uncommon in previous years. According to one of the forestry affiliated interviewees:
Before 2003 the two industries and the participants within each of the industries were at
loggerheads. We were slagging off at each other regularly in the media. We would do a
fuel reduction burn or regeneration burn and the tourism industry would immediately
issue media releases saying that it was destroying the tourism industry in Tasmania (TA
19).
According to interview participants, the two industries eventually realized that this conflict was
producing negative results for both sides. This ultimately convinced them to cooperate and find
160
a solution to the problems that they were causing for one another. As a result of this
collaborative effort the first version of the Tourism and Forestry Protocol Agreement was signed
between the Tourism Industry Council of Tasmania, Forestry Tasmania, Private Forests of
Tasmania and the Forest Industries Association of Tasmania in 2003. The purpose of the
document was to provide a framework for the tourism and forestry industries to work together
and has since been refined with the 2009 version (TICT et al., 2009).
The Tourism and Forestry Protocol Agreement featured heavily in the semi-structured
interviews that were conducted with both tourism and forestry affiliated participants. There are a
number of features within the document that help contribute to its effectiveness. Many of these
were identified by interview participants. The document contains a statement of guiding
principles with the first being recognition that both industries are important for the growth of the
Tasmanian economy (TICT et al., 2009). The importance of this idea was reinforced by one
forestry affiliated interviewee who stated:
So what we have tried to do in the protocol agreement is recognize that both industries
are important for Tasmania’s economy. There are effectively five pillars of the
Tasmanian economy, which are the main wealth creators for the state. Tourism is one of
those and forestry is one of those. If any one of those falls the house of cards starts to
implode somewhat. So what we have tried to do is recognize that both are important and
try to find ways to work together and work in harmony with each other so that we don’t
destroy each other’s brands (TA 19).
The document also sets out guidelines for meetings, stakeholder communications, issue
resolution and media briefings. These features have led to the development of a relationship
that is based upon regular communication, which did not exist before the agreement was
signed. However, it was noted that the agreement is essentially little more than a few pieces of
paper with some words on it. One of the more important features of its success seems to be the
willingness of all parties to make it work. Interviewees from both industries expressed a genuine
commitment to maintaining a positive relationship between forestry and tourism in Tasmania. As
stated by one forestry affiliated interview participant:
161
The key thing is the willingness of both parties to make it work. Even though they are
just words, they are words with a genuine intent behind them and that is what we have
been guided by. Every time we have sat down to try and consider and issue we have
always gone back to, not the written words in the protocol, but the intent behind why we
went into the actual protocol… and used those to guide us (TA 19).
The commitment to maintaining a positive relationship becomes evident when learning about
the precautions taken by the forest industry in Tasmania to ensure that it does not negatively
impact upon tourism. For example, each year Forestry Tasmania requests a list of special
events that are scheduled to occur during the summer season throughout the state. The
purpose of this is to assist with the planning of burn programs. Forestry Tasmania uses this
information to help ensure that these programs do not have a negative impact upon any of the
major festivals that are held annually throughout Tasmania. Their commitment to ensuring
burning programs do not negatively impact upon events and communities was expressed by
one forestry affiliated interviewee who stated:
There have been times when unpredicted weather conditions have happened and we
called off burns. We have been all set up, crew is ready to go, sitting there but the
smoke is going the wrong direction. So we will call it off and go somewhere else (TA 17).
In addition to burning programs, the introduction of the Tourism and Forestry Protocol
Agreement has also produced positive results in regards to the visual impact that harvesting
operations can potentially have on tourism. When discussing their considerations for nearby
tourism stakeholders one of the forestry affiliated interview participants explained:
Visual management, particularly view field management. And largely as a result of the
protocol, not just Forestry Tasmania, but private forest companies do a lot of very
detailed view field management activities before and during the planning and
undertaking of forestry operations… So you identify the points most likely to have a view
over the operational area and you redesign your coupe boundaries, your harvesting
activity and the intensity of the operations to minimize the impact on the environment
(TA 19).
162
Individuals from both industries praised the effectiveness of the Tourism and Forestry Protocol
Agreement in cultivating a constructive relationship between forestry and tourism in Tasmania.
Since the original agreement was signed both sides have agreed to approach each other to
work out their issues, rather than release statements in the media. This has ultimately had a
positive impact upon the brand of both industries because fewer conflicts are now present. The
effectiveness of the agreement in reducing conflict situations was explained by one forestry
affiliated interviewee who stated:
In those first few years after signing the agreement I think we had four or five issues
being brought to our monthly meetings by the tourism industry almost exclusively saying,
‘these are major issues of concern for us that need to be resolved.’ Now we get nothing
(TA 19).
The introduction of the Forest Practices Act 1985 has helped to ensure that a range of forest
values in addition to timber production are considered by decision makers (McDermott, Cashore
& Kanowski, 2007). It was suggested that the introduction of this legislation has played a role in
the protection of tourism values, which ultimately has helped to reduce conflict between the
tourism and forestry industries in Tasmania. When speaking about it this individual stated:
At some point there was a turnaround. It was probably largely came about because of
the Forest Practices Act I think. In terms of having to take on board a whole range of
different values, including landscape values, which are inherently tied to tourism issues. I
think that process within the forest industry made people realize that there were aspects
where forestry could impact on tourism issues. In terms of particularly the landscape
side of things, but also the log truck issue which has always been a bit of an issue in the
background (TA 4).
It could also be argued that Forestry Tasmania’s pursuit of tourism developments help to reduce
conflicts between the tourism and forestry industries. The role that the organization has played
in regional tourism development has helped to rejuvenate certain communities within Tasmania.
This is particularly true for the Huon Valley. With the Tahune Airwalk becoming such an
important attraction in the region, many tourism operators are very appreciative of the extra

163
visitors that this development has attracted. This ultimately has a positive impact upon the
relationship between forestry and tourism in this area of the state.
Along with the positive economic impact that Forestry Tasmania tourism developments have
had on certain communities, the interpretation that they offer at many of these sites could also
be seen as having a benefit to both the tourism and forest industries. Forestry Tasmania tourism
sites offer interpretation covering a range of topics from native species to forest practices.
According to certain interview respondents, perceptions of the forest industry may have a bigger
impact upon tourism than the actual forest practices themselves. Assuming that this is at least
partly true, it seems that providing visitors with information about measures taken by the forest
industry to address sustainability issues could provide benefits to both forestry and tourism.
In addition to measures that are already in place the semi-structured interview process also
revealed ways in which the potential conflicts between forestry and tourism could be further
reduced. Despite the ways in which the Tourism and Forestry Protocol Agreement has improved
the situation in Tasmania, one interview participant suggested that its success has reduced the
amount of communication that has happened recently. This individual explained the importance
of maintaining the communication channels that the agreement has helped to create.
I guess the criticism that I have got of the current agreement is one that maybe it, in
conjunction with the 2003 agreement has been too successful. Both groups now are not
paying the time and attention to it that we were previously. There are not the issues.
Unfortunately, we all get stuck dealing with wheels that need oil because they are
squeaky, so you deal with them. So that has not been the tourism industry’s relationship
with the forest industry. Of course the danger of that is that it slips back to where it was.
And that is not a good thing (TA 19).
Certain interview participants also expressed a desire to see further improvements to the
sustainability of forest practices in Tasmania. Many expressed their disapproval with past and
current management practices. Issues raised include Tasmania’s past reliance on wood
chipping, development of non-native pine plantations, harvesting of old growth forests and lack
164
of investment into the specialty timber market. Certain interviewees also expressed a desire to
see Tasmania adopt more selective logging practices that utilize a more diverse range of
species and create less waste. When considering these comments it is important to note that
the Tasmanian forest industry is currently in a period of transition, which will likely lead to many
of the practices identified as undesirable being either reduced in scale or eliminated all together.
However, the strong disapproval of certain forest practices is still evident amongst many
members of the public. Some of these ideas were captured by one of the tourism affiliated
interviewees who said:
Selectively harvest. Supply the small saw millers and do the fine quality furniture and
instruments, like guitars and violins and boatbuilding. That could all still be happening.
The reason that we are in trouble now with our forest industry is because of the waste
and mismanagement with clearfelling and wood chipping (TA 14).
Despite the measures taken by Forestry Tasmania to educate visitors and the public about their
forest management practices, some interviewees believed that this could be done on an even
greater scale. Although the industry has tried to gain wider acceptance in Tasmania and
Australia as a whole, many would argue that forestry in the state still suffers from a negative
public image because of high profile conflicts that have occurred in the past. This could
potentially have direct implications on the domestic tourism market, which is particularly
important to Tasmania. To improve perceptions amongst both visitors and locals certain
interviewees suggested the expansion of forest industry tourism attractions to help address this.
One tourism affiliated interviewee suggested:
What would be best I think would be public relations and getting people into the forests
and seeing what they have done. Maybe selling their timber as high-value timber and
promoting it that way. And then maybe encourage the timber that they are extracting to
be used in a more special way, rather than just wood chips. Increasing people’s
understanding and therefore value of the product that they are pulling out might help
tourism (TA 1).
165
6.2.6 Tourism and Forestry Relationship in Vancouver Island
After discussing some of the tourism and forest industry conflicts and solutions in Vancouver
Island, interviewees were asked to characterize the relationship between the two industries. As
expected, responses seemed to be dependent upon the individual situation of the interviewee.
For example, certain tourism affiliated interviewees characterized the relationship as negative,
whereas others viewed the relationship as positive. Additionally, some forestry affiliated
interviewee’s indicated that the relationship varies depending on the project that is being
proposed and who they happen to be dealing with. Some factors that seemed to influence
responses to this question include geographic area and industry affiliation. However, there are
likely many other personal factors that are likely to influence the perception that interviewees
have about the relationship between the two industries.
Positive attitudes about the relationship between forestry and tourism were expressed by both
forestry and tourism industry affiliated interview participants. One tourism affiliated participant
suggested that the nature of their business likely contributed to the positive perceptions that
they had about this relationship. This individual thought that their reliance on forestry workers for
revenue, combined with the fact that most of their customer’s were not traditional nature-based
tourists played a role in shaping this view. Others remarked upon improvements that have been
made over recent decades. For example, one tourism affiliated interviewee stated:
Certainly there has been a better relationship in the last 10 to 20 years of forestry and
tourism in terms of communicating with each other and trying to work more closely with
each other to ensure that the forestry industry can do what they need to do, but limit the
impact that they can have on those things I mentioned like viewscapes (VI 6).
Despite the positive remarks, both tourism and forestry affiliated interview participants also had
some negative comments with regard to the relationship that exists between the two industries.
One tourism affiliated interviewee pointed to the fundamentally different needs of the two
industries and the difficulty associated with finding a compromise. This individual stated:
Everyone tried to start out on a positive note, but ultimately it boils down to a negative
relationship because we are at such odds for what we want from the forest resources.
Ultimately it boils down to trees standing or not. Coming from such divergent
166
perspectives, no matter how much communicating and talking you are doing, you want
different things in the end (VI 3).
This interviewee went on to talk about the frustration and the feeling of hopelessness that they
felt over the power that forest companies seem to have over the natural resource decisions
being made in Vancouver Island.
That leads to lots of frustration in industries such as tourism because of the feeling of
hopelessness and powerlessness due to current legislation and past rulings. You know
there is not a lot of hope for you if a forestry company is not legislated to sit down and
talk to be more specific in their areas or cuts, or make revisions to plans based on your
feedback. A lot of it is fairly voluntary and it is not getting the results needed for
industries such as tourism (VI 3).
Because there are so many different factors that influence the relationship between forestry and
tourism, it is impossible to characterize it as being either positive or negative. The diverging
responses from both tourism and forestry affiliated interview participants are evidence of this.
However, it is important to recognize that that this relationship is not perfect and there are many
ways in which it could potentially be improved. Considering some of the issues raised in the
previous sections could likely provide clues about ways in which this can be achieved.
6.2.7 Tourism and Forestry Relationship in Tasmania
Like the Vancouver Island interview participants, those in Tasmania were also asked to
characterize the relationship between forestry and tourism in the state. As expected certain
participants characterized it as negative, some characterized it as neutral, while others
suggested that it was positive. Certain interviewees also suggested that the relationship tends to
vary depending on the issue and which individuals happen to be involved.
A surprisingly high number of interview participants from both tourism and forestry characterized
the relationship between the two industries as positive. A variety of reasons were cited for this.
167
Some of these include the additional business that the industry creates, steps that have been
taken to consult with tourism stakeholders and also the recent reduction in forestry activity that
goes on throughout Tasmania caused by the economic issues that the industry is currently
facing.
Few interview participants characterized the overall relationship between the two industries as
negative. However, one of the individuals who did suggested that tourism does not get the
consideration that it deserves in certain regions of Tasmania. Despite the efforts that have been
made to develop a constructive relationship between forestry and tourism in Tasmania, this
individual expressed concern about nature-based tourism operators in regions of the state that
are primarily dedicated to the extraction of natural resources. When speaking about consultation
between the two industries one of the tourism affiliated interviewees remarked:
It doesn’t happen around here, because it’s all been earmarked for logging and that is
the end of the story. That is not going to change… You can go and see and talk to them,
but they don’t listen to me. They are just going to do what they want to do anyways (TA
3).
One of the more interesting findings in terms of the relationship between tourism and forestry in
Tasmania is the degree to which interview participants spoke about improvements in recent
years. Those who spoke about a negative relationship seemed more likely to refer to past
issues, as opposed to those that are currently presenting problems. Some of these individuals
went on to discuss how past sources of conflict have become less of an issue in recent years.
Although part of the improvements may be related to the current reduction in forestry activity, it
also speaks to the effectiveness that certain conflict reduction measures have had in Tasmania
in terms of improving the relationship between the two industries. When speaking about this one
of the forestry affiliated interview participants stated:
15 years ago the relationship was probably not that good with a lot of individual, sort of
one to one tourism operator stuff. And that was a bit negative. Usually you only get to
hear about the things that are bad. But I have got to say, there really have not been any
of those sorts of issues (TA 4).
168
Not only was this feeling expressed by individuals within forestry, but those affiliated with the
tourism industry also remarked on the vast improvements that have been made in recent years.
For example, one tourism affiliated interviewee stated:
The only thing that I would like to highlight again is that it is much better than it used to
be. If you were talking to me four years ago there would have been anger. It was just
getting out of control. The amount of logging trucks, everywhere was getting closed. I
was getting e-mails two to three times a day saying, ‘you can’t go into here, you can’t go
into there.’ I don’t get any now. It was like a tree grab that was happening, but that is not
happening anymore (TA 7).
6.3 Summary
Table 69 compares the main conflict issues and solutions identified by interview participants in
both Vancouver Island and Tasmania.
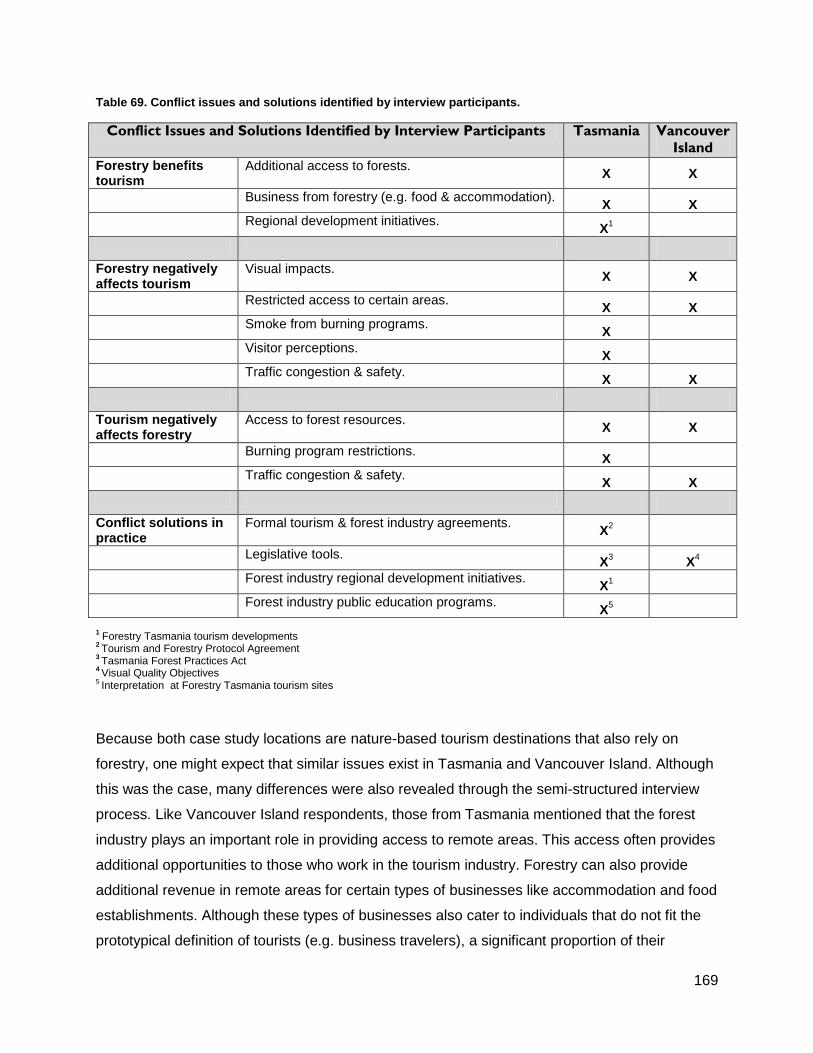
169
Table 69. Conflict issues and solutions identified by interview participants.
Conflict Issues and Solutions Identified by Interview Participants Tasmania Vancouver
Island
Forestry benefits tourism
Additional access to forests. X X
Business from forestry (e.g. food & accommodation). X X
Regional development initiatives. X
1
Forestry negatively affects tourism
Visual impacts. X X
Restricted access to certain areas. X X
Smoke from burning programs. X
Visitor perceptions. X
Traffic congestion & safety. X X
Tourism negatively affects forestry
Access to forest resources. X X
Burning program restrictions. X
Traffic congestion & safety. X X
Conflict solutions in practice
Formal tourism & forest industry agreements. X
2
Legislative tools. X
3 X
4
Forest industry regional development initiatives. X
1
Forest industry public education programs. X
5
1 Forestry Tasmania tourism developments
2 Tourism and Forestry Protocol Agreement
3 Tasmania Forest Practices Act
4 Visual Quality Objectives
5 Interpretation at Forestry Tasmania tourism sites
Because both case study locations are nature-based tourism destinations that also rely on
forestry, one might expect that similar issues exist in Tasmania and Vancouver Island. Although
this was the case, many differences were also revealed through the semi-structured interview
process. Like Vancouver Island respondents, those from Tasmania mentioned that the forest
industry plays an important role in providing access to remote areas. This access often provides
additional opportunities to those who work in the tourism industry. Forestry can also provide
additional revenue in remote areas for certain types of businesses like accommodation and food
establishments. Although these types of businesses also cater to individuals that do not fit the
prototypical definition of tourists (e.g. business travelers), a significant proportion of their
170
revenue does come from actual tourists. Additionally, much of the revenue generated by these
types of businesses tends considered when placing value on the tourism industry in economic
reports (Tourism British Columbia, 2012; Nichol, Shi & Campi, 2013)
A significant difference between the two destinations is the amount of investment that the
Tasmania forest industry has put towards the development of tourism attractions. Although
some small-scale sites have been created by the forest industry in Vancouver Island, they do
not compare in scope to the ones that Forestry Tasmania has developed. The creation of these
sites provides visitors with information about various aspects of Tasmanian forests, including
some of the ways in which they are managed. Additionally, some of these sites have played an
important role in the rejuvenating the local economy in certain areas.
As expected, visual impacts were mentioned as a way in which forestry negatively affects the
nature-based tourism industry in both destinations. Interview participants from both study
regions expressed concern over the potential impact that clear-cuts can have on scenic values.
Due to the nature of the tourism industry in destinations that promote the natural environment,
this is likely to be an issue in other places that rely on both forestry and nature-based tourism to
create employment. Therefore, a reduction in the visibility of these areas could produce positive
results for tourism. Traffic issues relating to tourist traffic and logging trucks were also named by
interviewees in both regions.
One aspect of forest management that was a potential issue in Tasmania, but of little concern in
Vancouver Island relates to burning programs. In many areas of Tasmania forests must be
burned to maintain the health of Eucalypt forests. This is generally not required for the
management of forest communities in Vancouver Island. Because of this, forest managers in
Tasmania must consider the potential impact that these programs could have on surrounding
communities. This is generally less of a concern for those that are responsible for the
management of Vancouver Island forests.

171
The ways in which the relationship between tourism and forestry is managed was also shown to
differ between the two destinations. According to interview participants, vast improvements have
been made in both places in terms of the consideration that now given to nature-based tourism
by forestry. However, different approaches have been taken to achieve this. A number of
legislative tools are used to manage the relationships between the two industries in Vancouver
Island. These include visual quality objectives and various requirements within the Forest
Range and Practices Act. While certain legal tools are also used to manage the relationship
between forestry and tourism in Tasmania, it appears that the Tourism and Forestry Protocol
Agreement has created a climate where tourism and forestry actually share a close working
relationship in which mutual consultation has become the norm. This seems less evident in
Vancouver Island. By introducing similar industry agreements within British Columbia it is
possible that this could help to address some of the conflicts that currently exist between the
two industries in Vancouver Island.

172
Chapter 7
Discussion & Conclusion
7.1 Introduction
This chapter synthesizes the results that have been presented in the previous three chapters in
relation to the literature that has been reviewed. This will be discussed in the context of the
three primary research questions that were presented in the first chapter. In addition to this, the
theoretical and practical implications of this research will be explored.
7.2 Impact of Forestry on Tourist Perceptions
The first research question asked what type of impact forestry can have on the perception of
tourists in region that market the natural environment and outdoor activities that take place in
these settings. The working hypothesis suggested that forestry has a negative impact upon
tourism in these types of destinations. This hypothesis was based upon past studies that have
demonstrated displeasure with the visual impacts associated with forestry amongst the public
(Picard & Sheppard, 2001) and with tourists (British Columbia Ministry of Forests, 2003).
Therefore, the questionnaire contained questions intended to measure the forest industry’s
potential impact on visitor perceptions.
173
7.2.1 Destination Image
The top five destination image items for Vancouver Island survey participants include natural
scenery, parks/protected areas, hiking, unique/rare animals and camping. The highest ranked
items for Tasmania participants were natural scenery, parks/protected areas, unique/rare
animals, hiking and unique/rare plants. This suggests that the natural environment and outdoor
activities were important determinants of destination image for survey participants in both
Vancouver Island and Tasmania. According to tourist gaze theory, visitors tend to define a
locality in relation to the degree that expectations have been met and desires have been fulfilled
(Janes, 2008). This is similar to destination image theory which suggests that pre-visit
destination image shapes expectations, ultimately affecting the final evaluation of a destination.
When visitors feel that their experience did not match expectations it is most likely to result in a
negative evaluation (Beerli & Martin, 2004a). Because survey respondents in both case study
destinations were attracted by elements associated with the natural environment and outdoor
activities it seems logical they would have expectations of scenic landscapes. Those that do not
meet expectations could potentially negatively impact upon visitor evaluations of the destination.
7.2.2 Environmental Values
The way in which individuals judge the appropriateness of natural resource management
decisions is partly determined by their environmental values (Wagner et al., 1998; Ford et. al.,
2005). Therefore, the survey instrument contained a question with a set of items assessing this
construct. Overall, scores seemed to indicate that a high proportion of research participants
could be categorized as being on the pro-environment side of the spectrum. Additionally, very
little difference was noted between Vancouver Island participants and those from Tasmania.
7.2.3 Nature-based Tourism Setting Preferences
Past research has found that relationships exist between quality of recreational experience and
the settings in which they occur (Floyd & Gramman, 1997; Hunt et al., 2000). Preference for
certain settings was assessed using the nature-based tourism setting preference scale. The
mean score from Vancouver Island participants was 3.54, while the mean score for Tasmania
survey respondents was 3.71. With the mid-point of the index being 3, results appear to
suggest that visitors surveyed in both regions prefer nature-based tourism settings that do not
contain obvious evidence of forestry. Based upon this, one might expect that the observation of
174
forest industry impacts could negatively impact upon the experience of visitors to both Tasmania
and Vancouver Island. However, it is important to note the variation in scores between
individual participants. Because the range in scores was 3.58 (range of 1.42 – 5.00) for
Vancouver Island visitors and 2.75 (range of 2.25 – 5.00) for visitors to Tasmania it suggests
that certain respondents in both destinations are sensitive to forest industry impacts in nature-
based tourism settings, while others seemed much more accepting of forestry impacts.
7.2.4 Forestry Impact on Visitor Perceptions
It seems likely that the type of impact observed could influence the degree to which tourist
perceptions are influenced by the industry. This is supported by Ribe (2004) who suggested that
the public prefers landscapes that exhibit intact patterns of forest cover, as opposed to the
obvious openings that are seen when clear cutting is employed. Sheppard & Picard (2001) have
also stated that people tend to prefer natural appearing conditions, as opposed to highly
modified landscapes. Results from both case study locations appear to support past research
suggesting that less obvious visual impacts are preferred by the public. Amongst Vancouver
Island participants 54.1% indicated that observing harvested areas negatively impacted upon
their perception of Vancouver Island as a tourist destination. This is in sharp contrast to the
11.5% of respondents who said that observing tree plantations had a negative impact on their
perception. Similar results were found in Tasmania with 46.1% of those surveyed indicating that
harvested areas negatively impacted upon their perceptions, while only 18.4% suggested that
plantations had this effect. Despite the differences in percentages between Tasmania and
Vancouver Island, it is clear that landscapes with intact patterns of forest cover (tree plantations)
were preferred to those that exhibited obvious openings (clear cuts) in both places.
Although their impact on the landscape is much smaller than harvested areas and tree
plantations, logging trucks and saw/pulp mills are also commonly encountered by the public in
both case study regions. Therefore, questionnaire participants were asked about the type of
impact these had upon their perceptions of Vancouver Island and Tasmania as tourist
destinations. In both places encounters with logging trucks and mills were more likely to result in
negative perceptions when compared to encounters with tree plantations. However, encounters
with logging trucks and mills were less likely to result in negative perceptions for the Vancouver
Island sample group, when compared to harvested areas. This was different than the Tasmania
175
sample group who were more likely to rate mills and tree plantations either worse than, or
similar to harvested areas. It is unclear exactly why these differences exist. Although it could be
partly attributed to recent high profile forest industry conflicts in Tasmania, where media
attention has been given to logging traffic and the proposal of a pulp mill for the Tamar Valley.
7.2.5 Observation of Forestry Impacts
Results suggest that different types of forest industry impacts influence visitor perceptions in
different ways. Over half of respondents in Vancouver Island indicated that observation of
harvested areas negatively impacted on their experience. According to results nearly 80% of
survey participants in Vancouver Island observed harvested areas. This suggests that reducing
the visibility of harvested areas in Vancouver Island could produce positive results for the
tourism industry. Harvested areas also produced a negative response from visitors in Tasmania
with nearly half of respondents suggesting that they negatively impacted upon their perceptions.
According to results harvested areas are less visible to tourists visiting Tasmania with fewer
than 65% of respondents reporting that they had observed this type of impact during their trip.
Despite these findings, tree plantations were much more visible to visitors in Tasmania than
Vancouver Island. However, less than 20% of respondents in both case study destinations
reported that this type of impact negatively affected upon their perceptions.
7.2.6 Summary
Results from both cases seem to indicate that forestry does have the potential to negatively
impact upon tourism in destinations that promote the natural environment and outdoor activities
that take place in these settings. Based upon the nature-based tourism setting preference scale
both the Vancouver Island and Tasmania sample groups exhibited a certain degree of
sensitivity towards forest industry impacts. However, it should be noted that those who are
particularly sensitive to forestry impacts are unlikely to have their perceptions affected if they do
not encounter any evidence of the forest industry during their visit. Therefore, it seems plausible
that effective visual management techniques could reduce the likelihood that visitors who prefer
nature-based tourism settings without obvious forestry impacts will have their perceptions
negatively affected.
176
Results also appear to suggest that the type of forest industry impact observed determines the
degree to which visitor perceptions are affected. For harvested areas 45.9% of visitors to
Tasmania and 53.7% of visitors to Vancouver Island indicated that this type of impact negatively
affected their perceptions. This is in contrast to the 18.4% of visitors to Tasmania and 11.6% of
visitors to Vancouver Island who indicated that tree plantations had a negative impact upon their
perceptions. Based upon these results it seems that encounters with plantations are much less
likely to negatively impact upon visitor perceptions than encounters with harvested areas.
The presence of logging trucks and saw/pulp mills also appears to impact upon visitor
perceptions in both Tasmania and Vancouver Island. However, the extent to which this is true
was shown to differ between the two case study regions. Visitors to Tasmania seemed to be
much more critical of logging trucks and mills than visitors to Vancouver Island with 45.3% of
participants in Tasmania indicating that logging trucks negatively impact upon their perceptions.
Only 35.3% of respondents in Vancouver Island indicated the same. Likewise, 62.8% of
participants in Tasmania indicated that saw/pulp mills negatively impacted upon their
experience, whereas only 36% of Vancouver Island respondents indicated this. Although there
is no certain way to explain these variations, it could be partly attributed to differences in the
political climate surrounding the forest industry in each region.
7.3 Impact of Forestry on Different Tourist Segments
The second research question asked whether or not certain tourist segments are affected
differently by the impacts of forestry in regions that market the natural environment and outdoor
activities that take place in these settings. The working hypothesis suggested it is likely that
certain tourism segments would be affected differently than others when encountering forest
industry impacts. This was based upon research demonstrating that personal characteristics
have been shown to influence how individuals form tourist expectations and preferences (Beerli
& Martin, 2004a), as well as perceive environmental quality (Petrosillo et al., 2007). Therefore, it
seems logical that these differences in personal characteristics would influence questionnaire
responses to questions asking about visitor perceptions. Responses to questions measuring the
forest industry’s impact upon tourist perceptions were compared between sample groups to
learn whether or not this is true. However, it is important to note the small sample size from the
177
Central Highlands fishing group. Although this limits the reliability of findings from this sample
group, the others received sufficient responses to draw reliable conclusions.
7.3.1 Destination Image
There were a few differences in the highest ranked destination image items between the three
sample groups in both destinations. For example, fishing was ranked first for both sport-fishing
groups, yet ranked very low for the other sample groups (i.e. back-country hiking, front-country
visitor centre). Similarly, hiking ranked low for the sport fishing groups, but quite high for
members of the other sample groups. Despite the differences found between groups, elements
associated with the natural environment and outdoor activities featured high for all three sample
groups in both case study destinations. This suggests that a large proportion of survey
participants were attracted by elements associated with the natural environment, regardless of
their sample group. Details about the differences in importance given to each of the destination
image items for the three sample groups in both case study destinations can be seen in Table
11 and Table 44.
7.3.2 Environmental Values
Mean scores from Winter Harbour fishing guests were significantly lower than the other two
sample groups. This suggests that these individuals have more of a anthropocentric worldview
when compared to the other two sample groups, who exhibited more of an environmentalist set
of values. Overall, mean scores from survey respondents in Tasmania were fairly similar to
those from Vancouver Island. No significant differences were found between the three sample
groups with the sport-fishing group having similar scores to the other three sample groups.
However, it is important to note the small sample size from the Central Highlands Fishing group.
It is possible that a larger sample would have produced more significant differences. Differences
in new ecological paradigm score for the three sample groups in both case study regions is
shown in Table 26 and Table 59.
7.3.3 Nature-based Tourism Setting Preferences
Comparisons between sample groups were made for the question assessing nature-based
tourism setting preferences. The purpose of this was to help understand possible differences
178
that may exist between user groups (back-country hikers, front-country visitor centre guests,
recreational fishermen). Differences between the Vancouver Island sample groups revealed that
Winter Harbour fishing guests were more accepting of forest industry impacts than West Coast
Trail hikers and Kwisitis Visitor Centre guests. Analysis of questionnaire responses from the
Tasmania participants also revealed differences between the sample groups. Mean scores from
Overland Track walkers were shown to be significantly higher than those from of Cradle
Mountain Visitor Centre guests.
In both cases back-country hikers received the highest scores on this particular scale meaning
that they are least accepting of forest industry impacts when compared to the other sample
groups. This was followed by the front-country visitor centre group and then the recreational
fishermen. However, it is important to note that statistically significant differences were not
found between each of the sample groups. All sample groups apart from the Winter Harbour
fishing guests received mean scores that were above the mid-point of the nature-based tourism
setting preference index. This seems to suggest that recreational fishermen visiting Winter
Harbour are much less likely than the other sample groups to have their perceptions negatively
affected by forestry impacts. This lends support to past research that suggests consumptive
recreationists (e.g. hunters, sport fishermen) are more likely to tolerate harvested areas than
other recreationists (Paquet & Belanger, 1997; Hunt, et al., 2000a). Unfortunately, the low
sample size from the Central Highlands fishing group prevented similar conclusions from being
made about recreational fishermen in the Central Highlands of Tasmania. Nature-based tourism
setting preference scores for the three sample groups in both case study destinations can be
seen in Table 18 and Table 51.
7.3.4 Forestry Impact on Visitor Perceptions
Past research has demonstrated that differences exist in the ways that recreation user groups
perceive landscapes (Brunson & Shelby, 1992). Therefore, it seems logical that exposure to
forest industry impacts would affect visitor perceptions differently depending upon the tourist
user group. To learn whether or not this is the case ratings given to each of the four forest
industry impacts were compared according to sample group. Results from the Vancouver Island
data give some support to the idea that exposure to forest industry impacts affects tourist user
groups differently. When comparing ratings given to harvested areas mean scores for Winter

179
Harbour fishing guests were found to be significantly higher that of the other two sample groups.
This suggests that this group is less likely to have their perceptions negatively affected by
exposure to harvested areas. However, it should be noted that mean score for the Winter
Harbour fishing group was still below the scale’s mid-point of 3 meaning that a large number of
Winter Harbour participants indicated that exposure to harvested areas negatively affected their
perceptions of Vancouver Island as a tourist destination. In spite of this finding, no significant
differences were found between sample groups when comparing ratings given to the other three
impact types (i.e. tree plantations, logging trucks, saw/pulp mills).
Unlike the Vancouver Island data, results from Tasmania did not identify any differences in the
way that user groups are affected by forest industry impacts. When comparing ratings given to
each of the four impact types no statistically significant differences were found between any of
the sample groups. However, it is important to consider the possible effect that the low sample
size from the Central Highlands fishing group may have had upon this result. It is possible that a
larger sample size for this group may have produced some statistically significant differences,
like the recreation fishermen that were surveyed in Vancouver Island. Details about the
differences in ratings given to each of the four forest industry impact types measured for the
three sample groups in both case study destinations can is contained in Table 21 and Table 54.
There were not many differences in the ways that tourist user groups were impacted by
exposure to forest industry impacts. Therefore, linear regression was employed to help reveal
other predictors of ratings given to the four types of forest industry impacts measured.
Vancouver Island results suggest that tourist nature-based tourism setting preference score and
residency outside of British Columbia are predictors of ratings given to harvested areas. It
appears that visitors are more likely to have their perceptions negatively affected by harvested
areas if they receive a higher score on the nature-based tourism setting preference scale.
Additionally, those visiting from outside of British Columbia seem more likely to give harvested
areas a better rating when compared to residents of the province. The only predictor for the
other three impact types was destination image score for urban attractions helped to predict
ratings given to plantations and saw/pulp mills.
180
Results from Tasmania questionnaire respondents suggest that the most significant predictors
of ratings given to the four impact types include nature-based tourism setting preference score,
new ecological paradigm score and residency. Setting preference score was shown to be a
predictor of ratings given to harvested areas, tree plantations and saw/pulp mills. As setting
preference scores increased ratings given to these three types of forest impacts appeared to
decrease. New ecological paradigm score was a predictor of ratings given to harvested areas,
tree plantations and logging trucks. As new ecological paradigm scores increased ratings given
to these three types of forest industry impact types were shown to decrease. Finally, residency
outside of Australia was associated with higher ratings given to harvested areas and logging
trucks.
7.3.5 Observation of Forestry Impacts
Because they are both large geographic areas, regions within Vancouver Island and Tasmania
are likely to differ in terms of the visibility of forest industry impacts. Therefore, visitors are likely
to have different degrees of exposure to forestry impacts depending on the areas visited. To
understand which visitors had the highest likelihood of encountering forest industry impacts
comparisons were made between sample groups. It seems likely that tourists travelling along
routes which expose visitors to certain forest industry impacts (e.g. harvested areas) would be
more likely to have their perceptions negatively affected than those who are not exposed to
similar impacts. Comparisons of forest industry impacts between the three sample groups in
both Vancouver Island and Tasmania are shown in Table 19 and Table 52. In both Vancouver
Island and Tasmania the likelihood of encountering forest industry impacts was highly
dependent upon sample site. For example, Winter Harbour fishermen were much more likely to
encounter harvested areas than visitors to the Kwisitis Visitor Centre. Additionally, Cradle
Mountain Visitor Centre guests had a much higher likelihood of observing harvested areas than
Overland Track walkers. This appears to suggest that the scale of forestry impacts present in
both case study regions is quite variable and depends upon the area that has been visited.
7.3.6 Visitor Experience
The survey contained questions designed to assess visitor satisfaction with their tourist
experience. Past research suggests that the most negative evaluation of a destination is likely to
occur in when a negative evaluation follows a positive pre-visit destination image (Jenkins,

181
1999). For this reason visitors were asked to indicate the degree to which their experience
matched their expectations. Research has also identified links between satisfaction, intention to
return and positive word of mouth communication (Kozak & Rimmington, 2000). Therefore,
visitors were also asked about the likelihood that they would return in the future and recommend
the destination to friends and family. Responses to these questions revealed that a majority of
participants were quite satisfied with their trip, as very few differences were noted between
sample groups in the two case study destinations. This is despite the negative ratings given to
certain forest industry impacts that were observed by many respondents. These findings
suggest that there are a number of additional variables apart from natural resource
management practices that influence overall trip satisfaction.
7.3.7 Summary
Results give a limited amount of support to the notion that tourist user groups are affected
differently by exposure to forest industry impacts. Based on the nature-based tourism setting
preference scale results Winter Harbour fishing guests appear much more accepting of forest
industry impacts than West Coast Trail hikers and Kwisitis Visitor Centre guests. This seems to
suggest that this group is less likely than the other two sample groups to have their perceptions
negatively affected by forestry impacts. Results from the question asking about the degree to
which perceptions were affected by forestry impacts supports this, with the Winter Harbour
sample group rating harvested areas significantly higher than the other two sample groups.
However, no statistically significant differences were found between groups when comparing
ratings given the other three forest industry impact types included in the questionnaire.
When considering the results from Tasmania, nature-based tourism setting preference scores
from Overland Track walkers were shown to be significantly higher than those from Cradle
Mountain Visitor Centre guests. Based upon this, one would expect that Overland Track walkers
would be more likely to have their perceptions negatively affected by exposure to forestry
impacts. However, this is not supported by the results from the question asking about the
degree to which perceptions were affected, as no statistically significant differences were found
between groups for any of the four forest industry impact types. This could potentially be
explained by differences between the sample groups in terms of their degree of exposure to
182
forest industry impacts, since Overland Track walkers were much less likely to encounter forest
industry impacts than Cradle Mountain Visitor Centre guests.
In spite of the hypothesis suggesting that tourist user groups would be affected differently by
exposure to forest industry impacts, results showed very limited support for this. The only
significant difference in ratings given to forestry impacts was for harvested areas in Vancouver
Island where the Winter Harbour fishing group rated these higher than the other two sample
groups. Apart from this no statistically significant differences were found between groups for any
of the other types of forest industry impact in either Vancouver Island and Tasmania. Therefore,
linear regression was employed to help identify other predictors of ratings given to forestry
impacts. Significant predictors for the Vancouver Island group include nature-based tourism
setting preference score, destination image score and residency outside of British Columbia.
Significant predictors for the Tasmania participants include nature-based tourism setting
preference score, new ecological paradigm score and residency outside of Australia. Out of all
the variables included in the regression models nature-based tourism setting preference score
was the most prevalent predictor of scores given to forest industry impacts. This suggests that
the scale is an effective way to predict the setting preferences of tourists who are exposed to
forestry impacts in destinations that market the natural environment.
7.4 Theoretical Implications
Figure 4 provided a framework that illustrated how theory presented relates to the primary
research objective of learning about the type of impact forestry can have on destination image in
places that market the natural environment. The following sections will discuss the results in
relation to this framework in an attempt to confirm the validity of the theoretical model that was
proposed.
7.4.1 Destination Image
Pre-visit destination image is known to affect an individual’s perception, consequent behavior
and ultimately their destination choice (Gallarza et. al., 2001). According to the survey results a
high proportion of respondents were influenced by destination features relating to the natural
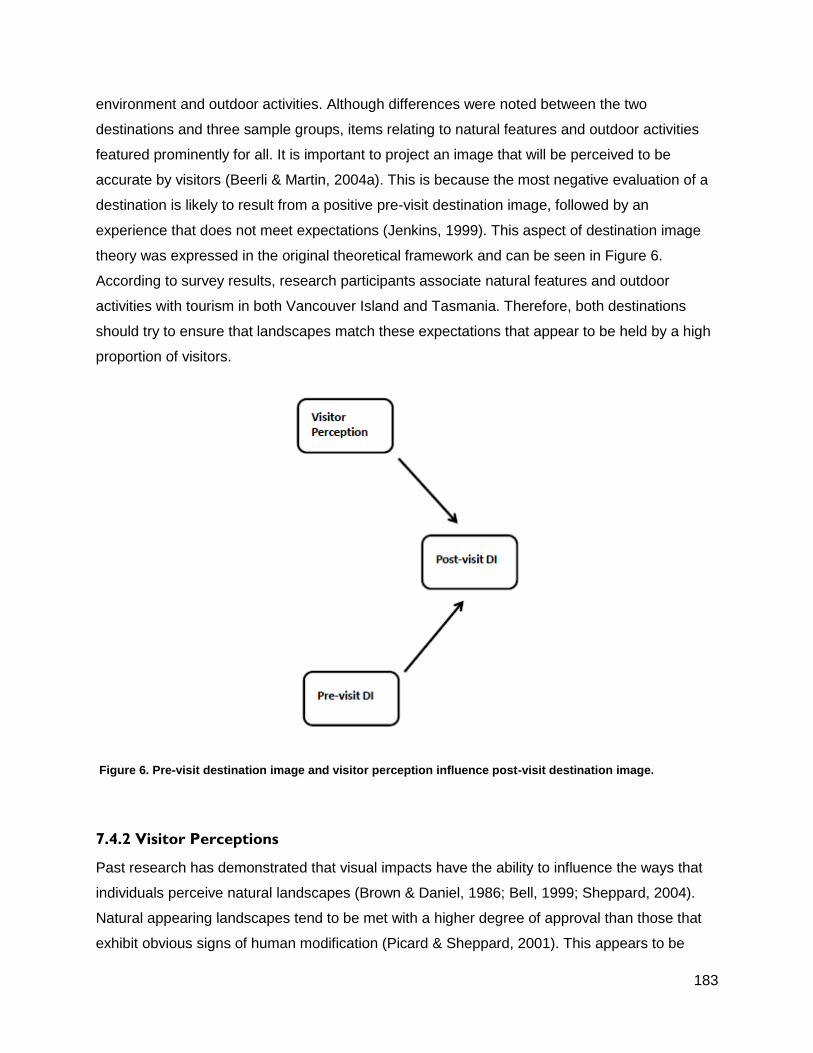
183
environment and outdoor activities. Although differences were noted between the two
destinations and three sample groups, items relating to natural features and outdoor activities
featured prominently for all. It is important to project an image that will be perceived to be
accurate by visitors (Beerli & Martin, 2004a). This is because the most negative evaluation of a
destination is likely to result from a positive pre-visit destination image, followed by an
experience that does not meet expectations (Jenkins, 1999). This aspect of destination image
theory was expressed in the original theoretical framework and can be seen in Figure 6.
According to survey results, research participants associate natural features and outdoor
activities with tourism in both Vancouver Island and Tasmania. Therefore, both destinations
should try to ensure that landscapes match these expectations that appear to be held by a high
proportion of visitors.
Figure 6. Pre-visit destination image and visitor perception influence post-visit destination image.
7.4.2 Visitor Perceptions
Past research has demonstrated that visual impacts have the ability to influence the ways that
individuals perceive natural landscapes (Brown & Daniel, 1986; Bell, 1999; Sheppard, 2004).
Natural appearing landscapes tend to be met with a higher degree of approval than those that
exhibit obvious signs of human modification (Picard & Sheppard, 2001). This appears to be
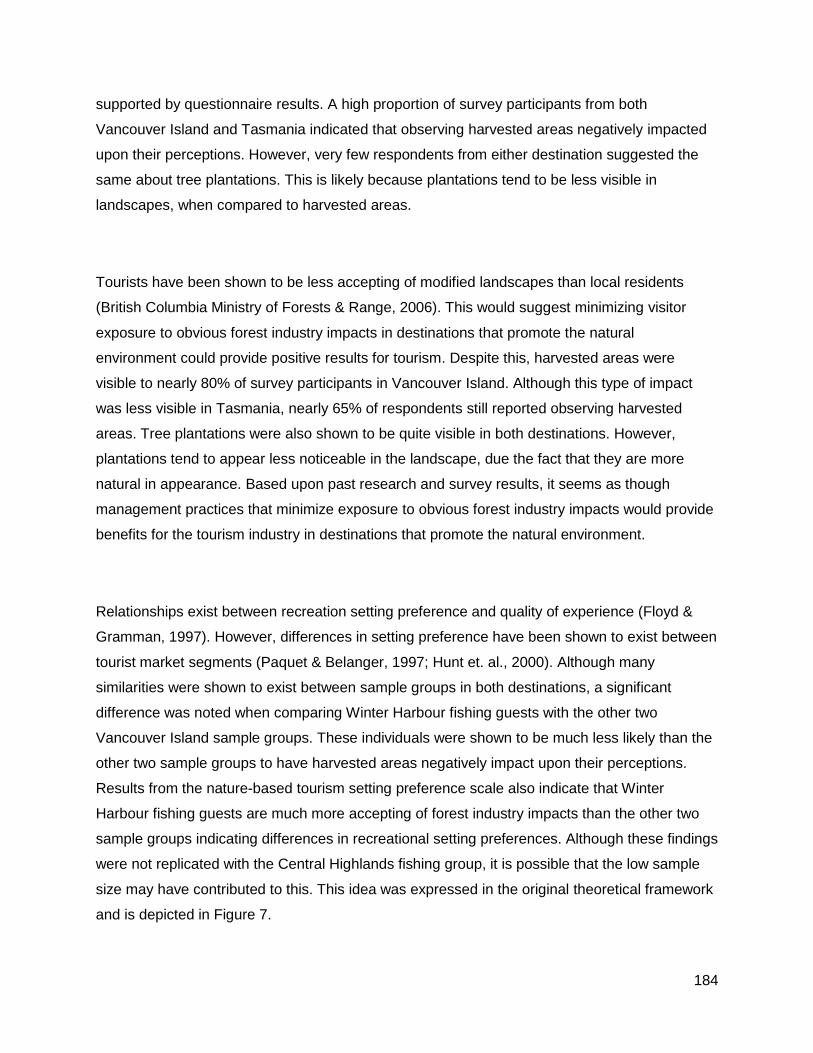
184
supported by questionnaire results. A high proportion of survey participants from both
Vancouver Island and Tasmania indicated that observing harvested areas negatively impacted
upon their perceptions. However, very few respondents from either destination suggested the
same about tree plantations. This is likely because plantations tend to be less visible in
landscapes, when compared to harvested areas.
Tourists have been shown to be less accepting of modified landscapes than local residents
(British Columbia Ministry of Forests & Range, 2006). This would suggest minimizing visitor
exposure to obvious forest industry impacts in destinations that promote the natural
environment could provide positive results for tourism. Despite this, harvested areas were
visible to nearly 80% of survey participants in Vancouver Island. Although this type of impact
was less visible in Tasmania, nearly 65% of respondents still reported observing harvested
areas. Tree plantations were also shown to be quite visible in both destinations. However,
plantations tend to appear less noticeable in the landscape, due the fact that they are more
natural in appearance. Based upon past research and survey results, it seems as though
management practices that minimize exposure to obvious forest industry impacts would provide
benefits for the tourism industry in destinations that promote the natural environment.
Relationships exist between recreation setting preference and quality of experience (Floyd &
Gramman, 1997). However, differences in setting preference have been shown to exist between
tourist market segments (Paquet & Belanger, 1997; Hunt et. al., 2000). Although many
similarities were shown to exist between sample groups in both destinations, a significant
difference was noted when comparing Winter Harbour fishing guests with the other two
Vancouver Island sample groups. These individuals were shown to be much less likely than the
other two sample groups to have harvested areas negatively impact upon their perceptions.
Results from the nature-based tourism setting preference scale also indicate that Winter
Harbour fishing guests are much more accepting of forest industry impacts than the other two
sample groups indicating differences in recreational setting preferences. Although these findings
were not replicated with the Central Highlands fishing group, it is possible that the low sample
size may have contributed to this. This idea was expressed in the original theoretical framework
and is depicted in Figure 7.
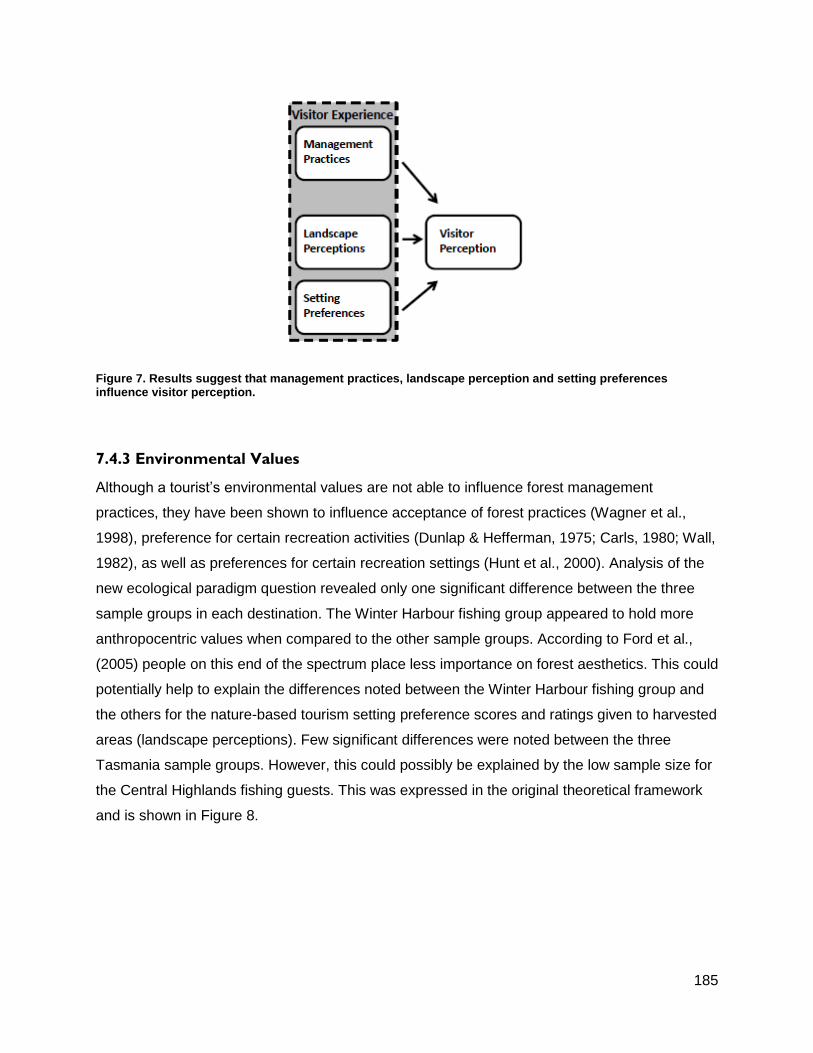
185
Figure 7. Results suggest that management practices, landscape perception and setting preferences influence visitor perception.
7.4.3 Environmental Values
Although a tourist’s environmental values are not able to influence forest management
practices, they have been shown to influence acceptance of forest practices (Wagner et al.,
1998), preference for certain recreation activities (Dunlap & Hefferman, 1975; Carls, 1980; Wall,
1982), as well as preferences for certain recreation settings (Hunt et al., 2000). Analysis of the
new ecological paradigm question revealed only one significant difference between the three
sample groups in each destination. The Winter Harbour fishing group appeared to hold more
anthropocentric values when compared to the other sample groups. According to Ford et al.,
(2005) people on this end of the spectrum place less importance on forest aesthetics. This could
potentially help to explain the differences noted between the Winter Harbour fishing group and
the others for the nature-based tourism setting preference scores and ratings given to harvested
areas (landscape perceptions). Few significant differences were noted between the three
Tasmania sample groups. However, this could possibly be explained by the low sample size for
the Central Highlands fishing guests. This was expressed in the original theoretical framework
and is shown in Figure 8.
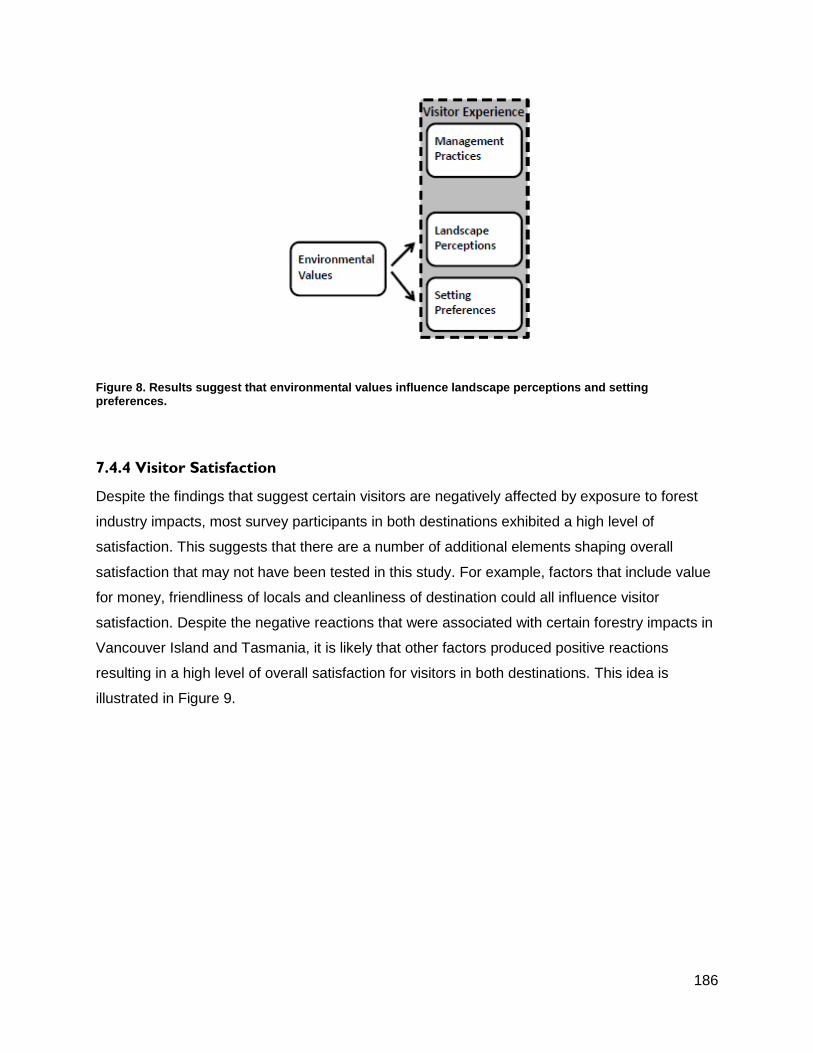
186
Figure 8. Results suggest that environmental values influence landscape perceptions and setting preferences.
7.4.4 Visitor Satisfaction
Despite the findings that suggest certain visitors are negatively affected by exposure to forest
industry impacts, most survey participants in both destinations exhibited a high level of
satisfaction. This suggests that there are a number of additional elements shaping overall
satisfaction that may not have been tested in this study. For example, factors that include value
for money, friendliness of locals and cleanliness of destination could all influence visitor
satisfaction. Despite the negative reactions that were associated with certain forestry impacts in
Vancouver Island and Tasmania, it is likely that other factors produced positive reactions
resulting in a high level of overall satisfaction for visitors in both destinations. This idea is
illustrated in Figure 9.
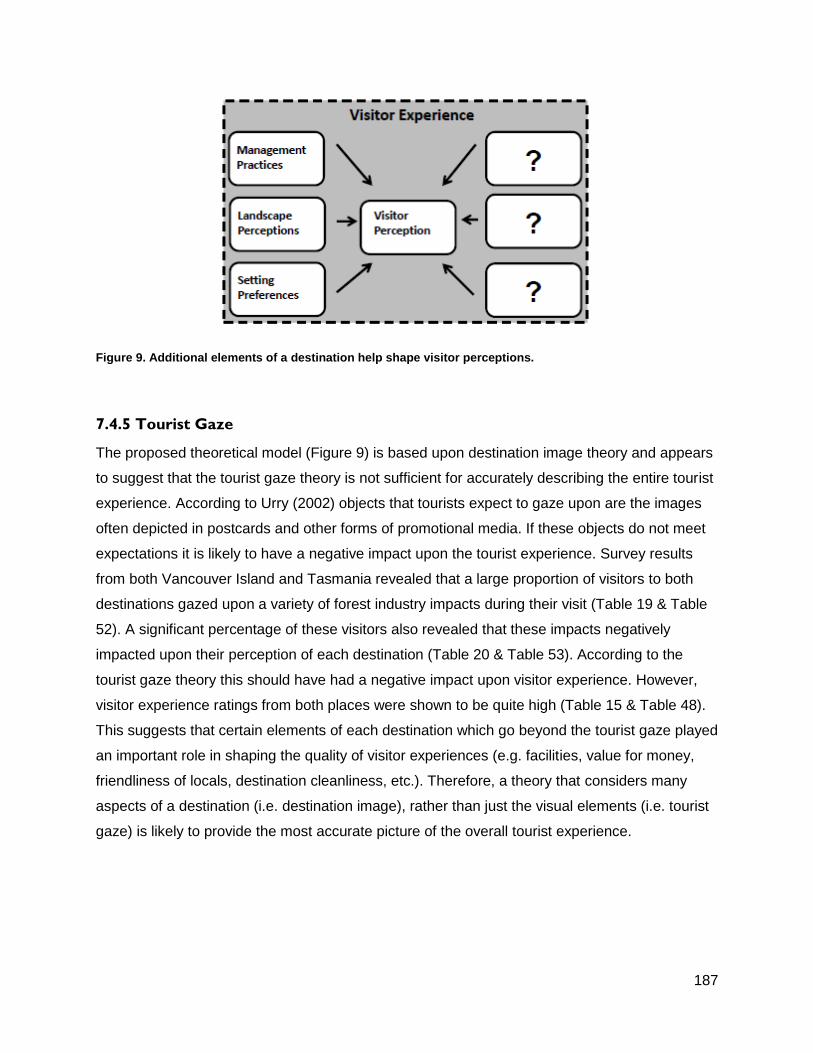
187
Figure 9. Additional elements of a destination help shape visitor perceptions.
7.4.5 Tourist Gaze
The proposed theoretical model (Figure 9) is based upon destination image theory and appears
to suggest that the tourist gaze theory is not sufficient for accurately describing the entire tourist
experience. According to Urry (2002) objects that tourists expect to gaze upon are the images
often depicted in postcards and other forms of promotional media. If these objects do not meet
expectations it is likely to have a negative impact upon the tourist experience. Survey results
from both Vancouver Island and Tasmania revealed that a large proportion of visitors to both
destinations gazed upon a variety of forest industry impacts during their visit (Table 19 & Table
52). A significant percentage of these visitors also revealed that these impacts negatively
impacted upon their perception of each destination (Table 20 & Table 53). According to the
tourist gaze theory this should have had a negative impact upon visitor experience. However,
visitor experience ratings from both places were shown to be quite high (Table 15 & Table 48).
This suggests that certain elements of each destination which go beyond the tourist gaze played
an important role in shaping the quality of visitor experiences (e.g. facilities, value for money,
friendliness of locals, destination cleanliness, etc.). Therefore, a theory that considers many
aspects of a destination (i.e. destination image), rather than just the visual elements (i.e. tourist
gaze) is likely to provide the most accurate picture of the overall tourist experience.
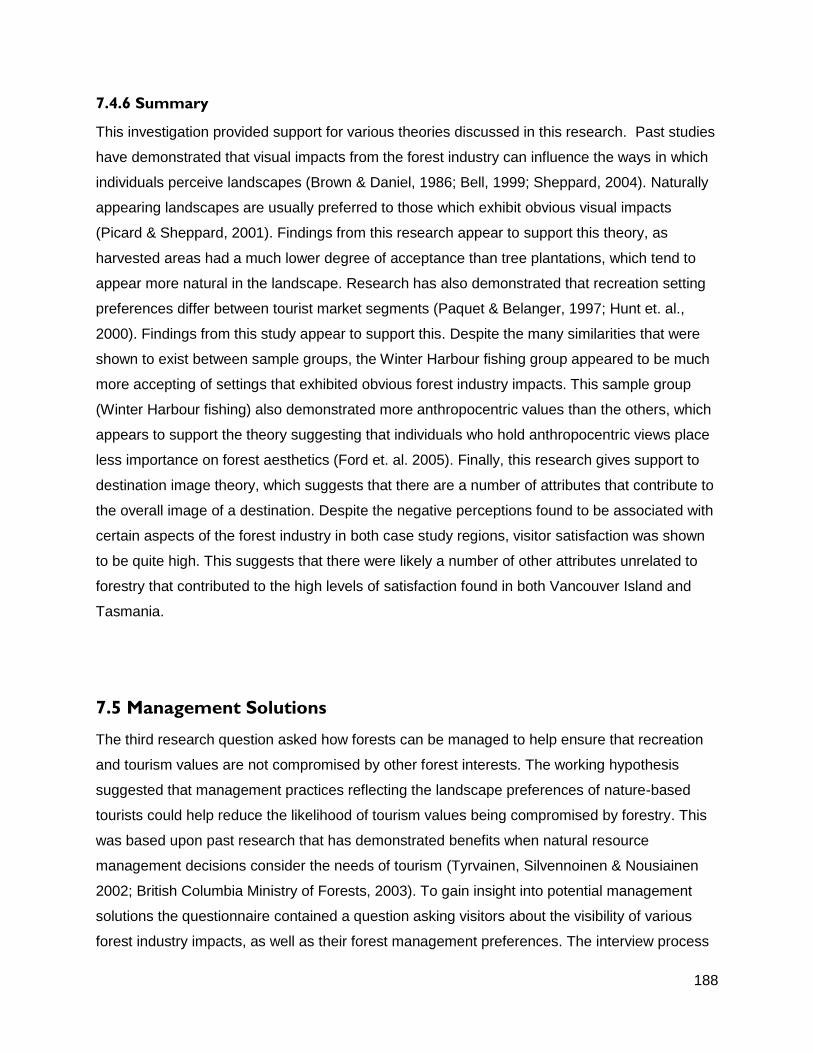
188
7.4.6 Summary
This investigation provided support for various theories discussed in this research. Past studies
have demonstrated that visual impacts from the forest industry can influence the ways in which
individuals perceive landscapes (Brown & Daniel, 1986; Bell, 1999; Sheppard, 2004). Naturally
appearing landscapes are usually preferred to those which exhibit obvious visual impacts
(Picard & Sheppard, 2001). Findings from this research appear to support this theory, as
harvested areas had a much lower degree of acceptance than tree plantations, which tend to
appear more natural in the landscape. Research has also demonstrated that recreation setting
preferences differ between tourist market segments (Paquet & Belanger, 1997; Hunt et. al.,
2000). Findings from this study appear to support this. Despite the many similarities that were
shown to exist between sample groups, the Winter Harbour fishing group appeared to be much
more accepting of settings that exhibited obvious forest industry impacts. This sample group
(Winter Harbour fishing) also demonstrated more anthropocentric values than the others, which
appears to support the theory suggesting that individuals who hold anthropocentric views place
less importance on forest aesthetics (Ford et. al. 2005). Finally, this research gives support to
destination image theory, which suggests that there are a number of attributes that contribute to
the overall image of a destination. Despite the negative perceptions found to be associated with
certain aspects of the forest industry in both case study regions, visitor satisfaction was shown
to be quite high. This suggests that there were likely a number of other attributes unrelated to
forestry that contributed to the high levels of satisfaction found in both Vancouver Island and
Tasmania.
7.5 Management Solutions
The third research question asked how forests can be managed to help ensure that recreation
and tourism values are not compromised by other forest interests. The working hypothesis
suggested that management practices reflecting the landscape preferences of nature-based
tourists could help reduce the likelihood of tourism values being compromised by forestry. This
was based upon past research that has demonstrated benefits when natural resource
management decisions consider the needs of tourism (Tyrvainen, Silvennoinen & Nousiainen
2002; British Columbia Ministry of Forests, 2003). To gain insight into potential management
solutions the questionnaire contained a question asking visitors about the visibility of various
forest industry impacts, as well as their forest management preferences. The interview process

189
also attempted to uncover additional ways to help reduce conflicts between forestry and tourism
in destinations that promote natural attractions.
7.5.1 Exposure to Forestry Impacts
Whether or not an individual is exposed to forestry impacts is likely to influence the degree to
which their experience is impacted upon by the industry. For example, somebody who is
particularly sensitive to forestry impacts is unlikely to have their experience negatively impacted
if they do not encounter any evidence of the forest industry. To understand how visible forestry
impacts are to visitors, section six of the questionnaire asked participants to indicate whether or
not they had observed harvested areas, tree plantations, logging trucks or saw/pulp mills during
their trip. Because visitors to certain areas are more likely to encounter forestry impacts than
visitors to other areas these results could be highly dependent upon the location of the chosen
sample sites. Therefore, comparisons were made between sample sites.
Results revealed that certain types of forest industry impacts were more visible to some visitors
than others. A high proportion of visitors to both destinations encountered harvested areas at
some point during their trip. According to the results 79.8% of those sampled in Vancouver
Island observed harvested areas, while 64.7% of participants in Tasmania observed this type of
impact. This seems to suggest that harvested areas are more visible to tourists in Vancouver
Island than they are in Tasmania. Harvested areas were shown to negatively impact upon the
perceptions of a high proportion of questionnaire participants in both destinations. The fact that
this type of impact is so visible to visitors in Vancouver Island and Tasmania appears to
rationalize concerns regarding visual impacts that were expressed by interview respondents.
Results also revealed that 69.7% of visitors to Tasmania encountered tree plantations, which is
much higher than the 56.7% of Vancouver Island tourists who observed them. Once again,
location of sample sites may have influenced these numbers. However, it is likely that the
visibility of plantations in many parts of Tasmania were also a determining factor. Plantations
within Tasmania seem particularly visible for two reasons. Despite many plantations being
eucalypt species, there is also a large percentage of plantations containing Pinus radiata
(Forestry Tasmania, 2012). Because this species of pine is not native to Australia it tends to be
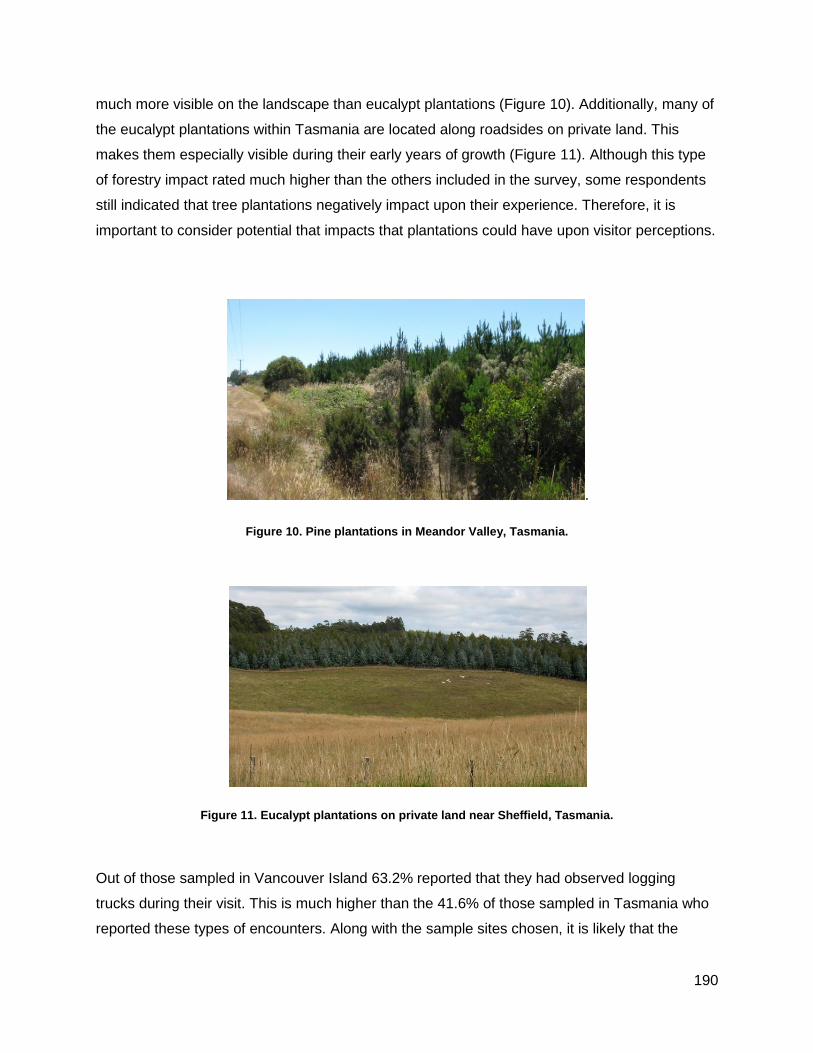
190
much more visible on the landscape than eucalypt plantations (Figure 10). Additionally, many of
the eucalypt plantations within Tasmania are located along roadsides on private land. This
makes them especially visible during their early years of growth (Figure 11). Although this type
of forestry impact rated much higher than the others included in the survey, some respondents
still indicated that tree plantations negatively impact upon their experience. Therefore, it is
important to consider potential that impacts that plantations could have upon visitor perceptions.
.
Figure 10. Pine plantations in Meandor Valley, Tasmania.
Figure 11. Eucalypt plantations on private land near Sheffield, Tasmania.
Out of those sampled in Vancouver Island 63.2% reported that they had observed logging
trucks during their visit. This is much higher than the 41.6% of those sampled in Tasmania who
reported these types of encounters. Along with the sample sites chosen, it is likely that the

191
recent decline of the Tasmanian forest industry may have influenced this result. Due to less
activity in the forests, there has been a noticeable decline in forestry traffic on Tasmanian roads
in recent years.
Finally, out of the individuals sampled in Vancouver Island 40.9% reported that they had
observed saw or pulp mills during their visit. Once again, this was much higher the 27.8% of
Tasmania visitors who encountered these. As with the previous three impact types discussed,
this could be a product of the sample sites chosen. However, it is also possible that mills are
more visible to Vancouver Island visitors than they are to those visiting Tasmania.
Degree of exposure to forest industry impacts was shown to differ according to the two case
study destinations. However, it is likely that degree of exposure will also differ according to the
regions that are visited within each destination. For example, routes to certain attractions may
travel through protected areas, while routes to others may require travel across highly
industrialized landscapes. To help account for this, participants were asked to indicate whether
or not they had observed harvested areas, tree plantations, logging trucks or saw/pulp mills
during their trip. Comparisons were then made between sample groups to understand which
sites were associated with the most noticeable forest industry impacts.
According to Vancouver Island results, the only impact type that was not associated with sample
site was logging trucks. The proportion of visitors exposed to harvested areas was greatest for
the Winter Harbour Fishing group. This was followed by the West Coast Trail group and then
the Kwisitis Visitor Centre group. Despite being the least likely to observe harvested areas,
more than 70% of visitors centre guests still encountered this type of impact. This suggests that
harvested areas are quite visible throughout many areas that tourists visit on Vancouver Island.
Observations while travelling to these sites support this, as visitors to Winter Harbour are
heavily exposed to highly industrialized forest areas (Figure 3). This is also the case for West
Coast Trail Walkers who travel from the Nanaimo ferries (Figure 4). Although the route towards
the Kwisitis Visitor Centre has much less exposure to harvested areas, the nature of this site
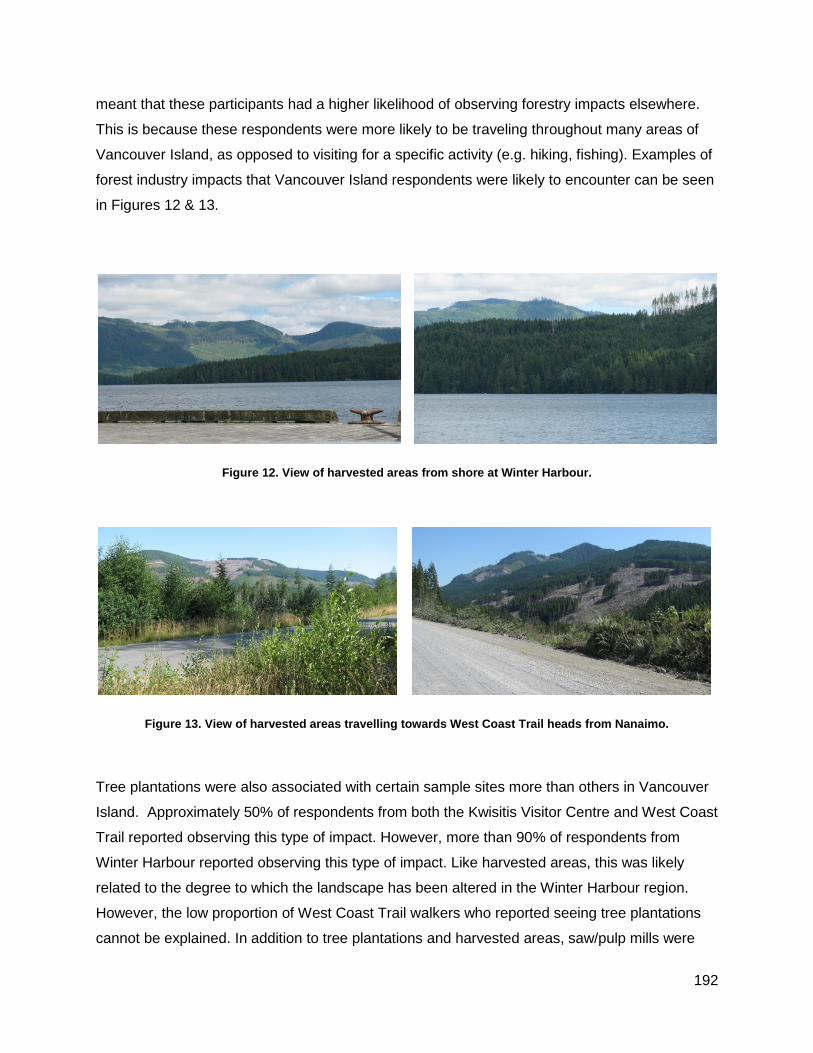
192
meant that these participants had a higher likelihood of observing forestry impacts elsewhere.
This is because these respondents were more likely to be traveling throughout many areas of
Vancouver Island, as opposed to visiting for a specific activity (e.g. hiking, fishing). Examples of
forest industry impacts that Vancouver Island respondents were likely to encounter can be seen
in Figures 12 & 13.
Figure 12. View of harvested areas from shore at Winter Harbour.
Figure 13. View of harvested areas travelling towards West Coast Trail heads from Nanaimo.
Tree plantations were also associated with certain sample sites more than others in Vancouver
Island. Approximately 50% of respondents from both the Kwisitis Visitor Centre and West Coast
Trail reported observing this type of impact. However, more than 90% of respondents from
Winter Harbour reported observing this type of impact. Like harvested areas, this was likely
related to the degree to which the landscape has been altered in the Winter Harbour region.
However, the low proportion of West Coast Trail walkers who reported seeing tree plantations
cannot be explained. In addition to tree plantations and harvested areas, saw/pulp mills were
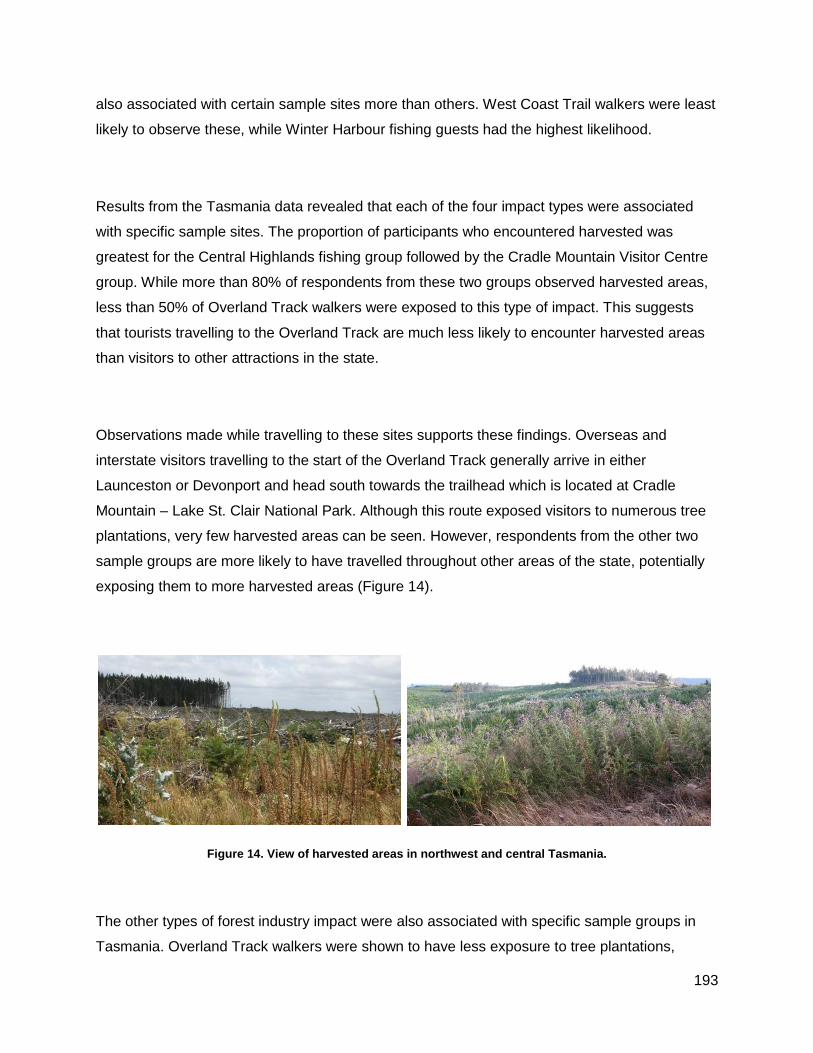
193
also associated with certain sample sites more than others. West Coast Trail walkers were least
likely to observe these, while Winter Harbour fishing guests had the highest likelihood.
Results from the Tasmania data revealed that each of the four impact types were associated
with specific sample sites. The proportion of participants who encountered harvested was
greatest for the Central Highlands fishing group followed by the Cradle Mountain Visitor Centre
group. While more than 80% of respondents from these two groups observed harvested areas,
less than 50% of Overland Track walkers were exposed to this type of impact. This suggests
that tourists travelling to the Overland Track are much less likely to encounter harvested areas
than visitors to other attractions in the state.
Observations made while travelling to these sites supports these findings. Overseas and
interstate visitors travelling to the start of the Overland Track generally arrive in either
Launceston or Devonport and head south towards the trailhead which is located at Cradle
Mountain – Lake St. Clair National Park. Although this route exposed visitors to numerous tree
plantations, very few harvested areas can be seen. However, respondents from the other two
sample groups are more likely to have travelled throughout other areas of the state, potentially
exposing them to more harvested areas (Figure 14).
Figure 14. View of harvested areas in northwest and central Tasmania.
The other types of forest industry impact were also associated with specific sample groups in
Tasmania. Overland Track walkers were shown to have less exposure to tree plantations,
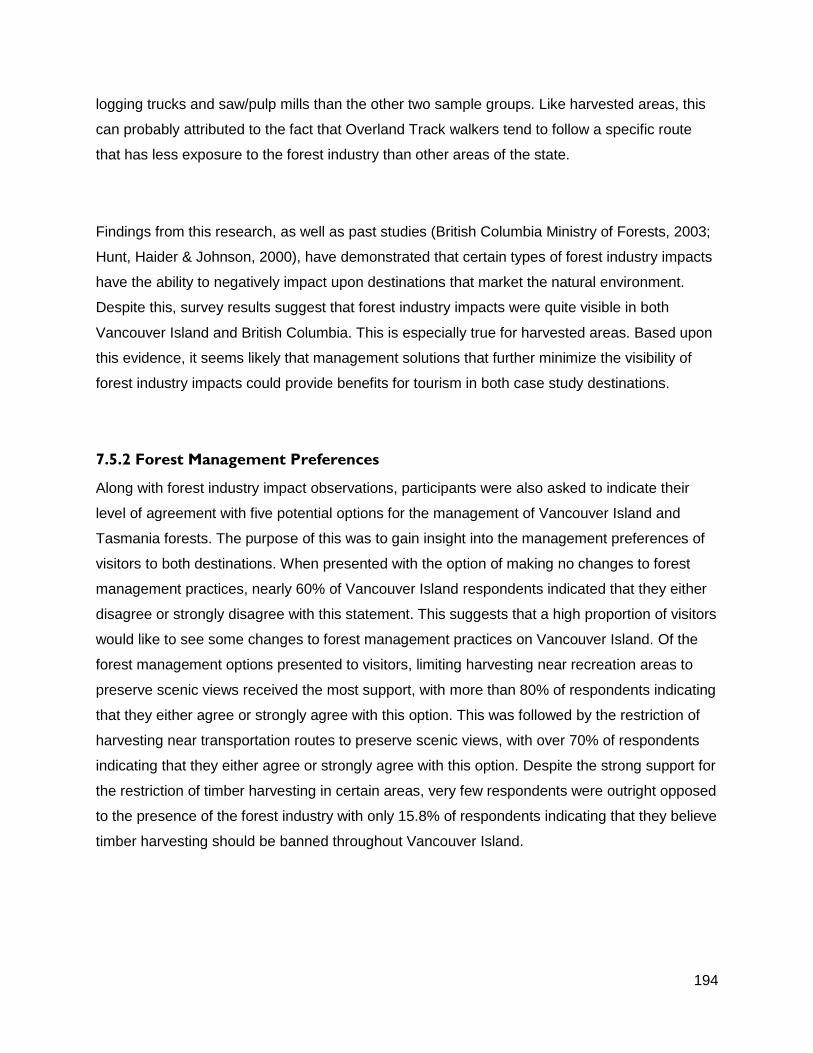
194
logging trucks and saw/pulp mills than the other two sample groups. Like harvested areas, this
can probably attributed to the fact that Overland Track walkers tend to follow a specific route
that has less exposure to the forest industry than other areas of the state.
Findings from this research, as well as past studies (British Columbia Ministry of Forests, 2003;
Hunt, Haider & Johnson, 2000), have demonstrated that certain types of forest industry impacts
have the ability to negatively impact upon destinations that market the natural environment.
Despite this, survey results suggest that forest industry impacts were quite visible in both
Vancouver Island and British Columbia. This is especially true for harvested areas. Based upon
this evidence, it seems likely that management solutions that further minimize the visibility of
forest industry impacts could provide benefits for tourism in both case study destinations.
7.5.2 Forest Management Preferences
Along with forest industry impact observations, participants were also asked to indicate their
level of agreement with five potential options for the management of Vancouver Island and
Tasmania forests. The purpose of this was to gain insight into the management preferences of
visitors to both destinations. When presented with the option of making no changes to forest
management practices, nearly 60% of Vancouver Island respondents indicated that they either
disagree or strongly disagree with this statement. This suggests that a high proportion of visitors
would like to see some changes to forest management practices on Vancouver Island. Of the
forest management options presented to visitors, limiting harvesting near recreation areas to
preserve scenic views received the most support, with more than 80% of respondents indicating
that they either agree or strongly agree with this option. This was followed by the restriction of
harvesting near transportation routes to preserve scenic views, with over 70% of respondents
indicating that they either agree or strongly agree with this option. Despite the strong support for
the restriction of timber harvesting in certain areas, very few respondents were outright opposed
to the presence of the forest industry with only 15.8% of respondents indicating that they believe
timber harvesting should be banned throughout Vancouver Island.
195
Significant differences were also observed when comparing the acceptance ratings given by the
three sample groups. Winter Harbour fishing guests were much more likely than the other two
sample groups to agree with the statement suggesting that no changes to forest management
practices were needed. Additionally, this group was less likely than the other two sample groups
to support the three of the management options presented (i. Limit harvesting near recreation
areas; ii. Heavily restrict harvesting throughout Vancouver Island; iii. Ban harvesting throughout
Vancouver Island). This seems to suggest that Winter Harbour fishing guests are more
supportive of current forest management practices than are West Coast Trail walkers and
Kwisitis Visitor Centre guests.
When presented with the option of making no changes to forest management practices, more
than 60% of Tasmania questionnaire respondents indicated that they either disagree or strongly
disagree with this statement. This seems to suggest that a high proportion of visitors would like
to see some changes to forest management practices in Tasmania. Out of the forest
management options presented to visitors, the limiting of harvesting near recreation areas to
preserve scenic views received the most support, with nearly 80% of respondents indicating that
they either agree or strongly agree with this option. This was followed by the restriction of
harvesting near roadways to preserve scenic views with over 60% supporting this option.
Despite the strong support for the restriction of timber harvesting in certain areas, very few
respondents were outright opposed to the presence of the forest industry with less than 20% of
respondents indicating that they believe timber harvesting should be banned throughout all
areas of Tasmania.
Only one significant difference was observed when comparing the acceptance ratings given by
the sample groups from Tasmania. Cradle Mountain Visitor Centre guests were much more
likely than Overland Track walkers to agree with the statement suggesting that harvesting
should be limited near recreation areas to help preserve scenic views at these sites. However,
no other significant differences were found between the Tasmania sample groups.
196
7.5.3 Conflict Reduction Strategies
The purpose of the interview process was to uncover measures that could be used to help
reduce conflicts between forestry and tourism in destinations that promote natural attractions.
Therefore, the following sections will discuss certain issues that may have may have contributed
to conflicts between forestry and tourism in the past, as well as potential solutions that may be
used to alleviate them.
7.5.3.1 Vancouver Island
In Vancouver Island a number of issues relating to the management of forestry and tourism
were identified by interview participants. The visual impacts associated with the forest industry
and the ways in which this could negatively affect tourism was a topic that received significant
attention from interviewees. Survey results from both case study locations and results from
previous studies (British Columbia Ministry of Forests, 2003; Hunt, Haider & Johnson, 2000)
appear to support this. Additionally, the landscape scale alterations that occur as a result of
forest harvesting were also discussed by interview participants. Although some strategies have
been developed to help address some of these issues, there are still measures that can be
taken to improve the situation further.
The British Columbia Ministry of Forests acknowledged that the Province’s landscapes are one
of the foundations of the tourism industry (British Columbia Ministry of Forests, 2001).
Additionally, the British Columbia Council of Tourism Associations has indicated that the health
of the province’s tourism industry rests on its reputation for natural beauty (Council of Tourism
Associations, 2007). To help address some of the issues relating to visual impacts associated
with the forest industry visual resource management is practiced throughout British Columbia.
Visual quality objectives are used to set visibility thresholds for landscape alterations (Picard &
Sheppard, 2001). These are essentially management objectives that reflect the desired level of
visual quality for a given area. Visual quality objectives are generally based upon physical
characteristics and social concern for an area and help dictate the degree of visual alteration
that can occur in a landscape. Any forestry operation that is to occur within a known scenic area
that has established visual quality objectives must first complete a visual impact assessment
before approval is granted. This has to be completed before any road construction or harvesting
begins (British Columbia Ministry of Forests, 2001). Although this system has produced some
197
positive results, it could be argued that there is significant room for improvements. For example,
a survey of landscapes across the province taken between 2007 and 2008 revealed that only
61% of these actually achieved the visual quality objectives that had been set. This number
drops significantly when considering areas considered as highly sensitive (retention landscapes)
where objectives were met only 33% of the time (Forest and Range Evaluation Program, 2011).
These figures seem to suggest that many positive aspects of the visual quality objective system
are often cancelled out by poor adherence to the required standards. Therefore, it is likely that
some type of enforcement program would produce positive results for tourism.
During the interview process certain participants expressed concern that the visual quality
objectives in many areas of the province may be outdated. This could potentially put forestry
into conflict with the needs of the nature-based tourism industry. An example of this, can be
seen along two of the more commonly travelled routes leading to the West Coast Trail head
where clear cuts dominate the landscape along many of the roadsides leading from the
Nanaimo ferries towards Pachena Bay and Port Renfrew (see Figure 5). With the West Coast
Trail having gained such a strong international reputation as a world-class nature-based tourism
attraction it seems that these routes should be subject to stricter visual quality objectives. It
could be argued that this may also be the case in certain areas of the Discovery Islands. This
region has become one of the most important marine tourism destinations in the province.
However, the Discovery Islands Marine Tourism Group has voiced serious concerns about the
effect that visual impacts from insensitive forestry practices are having upon the nature-based
tourism industry in this area (Hume, 2012). Despite opposition from tourism operators, BC
Timber Sales approved logging on Maurelle Island during the summer of 2013. According to
members of the Discovery Islands Marine Tourism Group most of their concerns were ignored
during the consultation process leading up to this decision (Rudan, 2013). These examples
seem to suggest that the needs of nature-based tourism are often ignored or overlooked when it
comes to visual resource management in certain areas of Vancouver Island.
Another concern voiced by certain interview participants relates to the lack of communication
that is required by the forest industry when it comes to consultation with other stakeholders.
Although this issue was identified during the interview process, it has also been echoed by the
Council of Tourism Associations in British Columbia (2007) who consider current consultation
198
requirements to be inadequate. According to the Forest and Range Practices Act all licensees
are required to create a Forest Stewardship Plan. Before a draft of the plan is submitted,
licensees must provide a mandatory period for public review. By publishing a notice in a
newspaper licensees have satisfied the requirement for public notice. However, there is
currently no requirement for licensees to identify specific stakeholders who may be affected and
notify them of their plans. This does not appear to follow principles of effective consultation as
defined by the British Columbia Forest Practices Board (Gooch, 2013). These principles include
early and effective communication that gives sufficient time for public involvement. Adequate
resources should also be made available to the public to allow for effective participation that is
inclusive, informative, accessible and continuous. In addition to this, forest company responses
to public input should be genuine and responsive. Based upon these principles of effective
communication the Forest Practices Board has criticized the level of consultation required by
the Forest and Range Practices Act stating that its requirements for public involvement in
operational planning is minimal (British Columbia Forest Practices Board, 2003). Although there
are other stage’s of the management process where additional opportunities for input exist, the
Forest Practices Board has stated that the public should have the opportunity to provide input at
all planning levels, from strategic to operational. Therefore, more stringent requirements in
regards to consultation could produce better results for other forest users, such as tourism
operators.
A contributing factor to the landscape scale alterations created by forestry is the high priority
that the industry receives when it comes to land use planning. The priority given to the forest
industry was acknowledged by both tourism and forestry affiliated interview participants. It is
possible that this practice could potentially put other businesses that utilize forested landscapes
(e.g. tourism) at a disadvantage. During the development of the forest sector in the early part of
the twentieth century most of British Columbia was zoned for timber production. In order to
change zoning from an existing land use to something different the Minister must be satisfied
that ‘the importance of the land use objective or amendment outweighs any adverse impact on
opportunities for timber harvesting’ (British Columbia Ministry of Agriculture and Lands, 2008,
p.13). This is despite the fact that forestry may or may not be the best land use option for a
given area (British Columbia Ministry of Forests, 2003). Because the tourism industry plays
such vital role in the British Columbia economy it seems logical that tourism interests should be
given a higher priority when it comes to forest management decision making. However, current
199
legislation appears to give top priority to the forest industry. This is based on the idea that
forestry was considered the province’s most important industry at one time. However, it can
easily be argued that this is no longer the case.
It appears that the priority given to forestry in British Columbia may have been enhanced by the
introduction of the Forest and Range Practices Act. This framework is commonly described as a
‘results based’ approach to forest management. This means that government specifies desired
forest management outcomes while forest licensees are given the flexibility to determine the
practices used to achieve these outcomes (Gooch, 2013; Malkinson, 2011). An objective of the
old Forest Practices Code was to create a level playing field for all forest licensees.
Unfortunately this led to increased costs for both government and the forest industry. In attempt
to address this issue the Forest and Range Practices Act was introduced. Reasons for its
development include a reduction in costs to government and industry, as well as increased
flexibility for forest licensees (British Columbia, 2005). One could argue that this gives increased
priority to forestry interests at the expense of other forest users, removing much of the
accountability from the forest companies. This view was expressed by multiple tourism affiliated
interview participants. Despite increased costs, it seems that a regulatory framework
surrounding forest resource management in British Columbia that is more equitable to all forest
users would not only be fair, but also beneficial for all other industries that rely on the province’s
forest resources.
According to certain interview participants it seems as though it is becoming more difficult to find
prime areas to conduct nature-based tourism activities. Although the amount of private land in
certain parts of Vancouver Island was identified as a contributing factor, visual impacts from
forestry were also mentioned. Unfortunately, many nature-based tourism operators are forced to
operate within highly altered landscapes. The prevalence of these landscapes is supported by
data showing the strong likelihood of visitors encountering harvested areas while travelling
throughout Vancouver Island. Commercial tourism opportunities are limited within Vancouver
Island’s current protected area system. However, few places located outside of protected areas
are managed in ways that are conducive to the maintenance of nature-based tourism values.
Therefore, it may be useful to identify additional areas within Vancouver Island that possess
significant tourism values and subject them to additional protection and special management
200
regimes, similar to what has been done in the Tofino region. It is possible that the importance of
the nature-based tourism industry in the Discovery Islands, combined with current threats posed
by logging in the region would make this region an ideal candidate for a similar management
system.
Although no official figures currently exist, the Western Canadian Wilderness Committee
estimates that 12 – 14% of Vancouver Island is currently protected (T. Coste, personal
communication, July 17, 2013). This is roughly on par with recommendations made by the
World Commission on Environment and Development in 1987 which suggest an international
goal of 12% protected areas (Dearden & Rollins, 2009, p. 17). However, it is less than the 17%
target for 2020 that is recommended by the Convention on Biological Diversity (2013). It seems
that a region promoting itself as a world-class nature destination should strive to exceed
minimum international recommendations for wilderness protection. This would be similar to what
is seen in other nature-based tourism destinations, such as New Zealand where 29% of its land
is protected (Convention on Biological Diversity, 2013b) or Costa Rica where approximately
25% of land is under some form of protection (Convention on Biological Diversity, 2013a).
Although the establishment of protected areas can limit opportunities for nature-based tourism
developments in some situations, this could potentially be addressed if protected area
categories are assigned in a way that is sensitive to the needs of the tourism industry. For
example, Category V protected areas allow for more intensive uses than some of the other
protected area categories (International Union for the Conservation of Nature, 2008). Therefore,
it seems conceivable that this category of protected area could be used to facilitate certain
ecotourism activities under the right circumstances.
During the 2013 provincial election a key platform used by the BC Liberal Party was a jobs plan
with primary objectives being job creation and the expansion of markets for British Columbia
products and services (British Columbia, 2012). As part of this jobs plan the provincial
government released a five year tourism strategy intended to help guide government, industry,
stakeholders and communities in working together to deliver the best results for the tourism
sector. One of the key objectives of the five year tourism strategy is to achieve 5% growth per
year within the British Columbia tourism industry. This plan acknowledges that outdoor
adventure experiences in pristine natural settings are critical to tourism experiences within the
201
province and ‘intrinsic to the Super Natural British Columbia brand’ (British Columbia Ministry of
Jobs, Tourism and Innovation, 2012, p.31). However, evidence presented indicates that forestry
has the potential to negatively impact upon nature-based tourism if forest practices are not
sensitive to the needs of the tourism industry. It also appears that forestry receives a higher
priority than tourism in many regions of Vancouver Island. This is despite the vital importance of
tourism to the British Columbia economy. Therefore, it seems as though a forest industry that is
more sensitive to the needs of nature-based tourism would help to facilitate the provincial
government’s goal of 5% growth in the tourism industry per year.
7.5.3.2 Tasmania
Despite sharing many similarities with Vancouver Island, a number of issues that were unique to
Tasmania were also identified during the interview process. Like Vancouver Island, visual
impacts associated with the forest industry in Tasmania were identified as a potential threat to
nature-based tourism. This is supported by survey results, as well as other studies that have
examined forestry and tourism related issues (British Columbia Ministry of Forests, 2003; Hunt,
Haider & Johnson, 2000). As well as visual impacts, forest managers in Tasmania must also
consider the effect that their regeneration and fuel reduction burning programs could have on
the tourism industry and surrounding communities. It appears that these two main issues have
lead to serious conflicts in the past. However, there have been a number of attempts in recent
years to address these types of issues and find ways in which tourism and forestry can work
together more closely.
According to many of the interview participants in Tasmania the relationship between the
forestry and tourism industry has gone from being quite negative in past years to the current
situation which is increasingly seen as being positive. A primary reason cited for this
improvement by both tourism and forestry affiliated interview participants was the establishment
of Tourism and Forestry Protocol Agreement. This document was developed to help provide a
framework to guide communication and consultation between the tourism and forestry
industries. Although these types of agreements are not common, they have been seen in other
places. For example, in Ontario the Tourism and Forestry Industry Memorandum of
Understanding was signed between the Ministry of Natural Resources, the Ministry of Tourism,
the Ministry of Northern Development, as well as representatives from the forestry and
202
resource-based tourism industry. The purpose of this was to create a framework for negotiating
resource stewardship agreements that allow both industries to co-exist and prosper (Ontario
Ministry of Natural Resources, 2006). This document is used in combination with the
Management Guidelines for Forestry and Resource-Based Tourism to help ensure that forestry
and tourism are managed in a way that is equitable for both industries (Ontario Ministry of
Natural Resources, 2001).
One of the features making the Tourism and Forestry Protocol Agreement unique is that its
signatories are all industry organizations without the inclusion of any government departments.
Although Forestry Tasmania is responsible for managing the state’s forests, they are technically
a forest management corporation and separate from other government departments, such as
the Department of Primary Industries, Parks, Water and Environment who are responsible for
the overall management of Tasmania’s natural and cultural assets. Because this solution was
created by industry organizations means that very little government resources were dedicated to
the development and maintenance of this solution. A key principle contributing to the success of
the Tourism and Forestry Protocol Agreement is the fact that it is based upon recognition that
both industries are vital to the Tasmanian economy and a commitment to close and ongoing
cooperation in order to maximize benefits for both industries (TICT, FT, FIAT & PFT, 2009).
This means that each industry is required to conduct its business in way that considers the
needs of the other industry. Close communication channels are also maintained to help ensure
that each industry remains informed about what the other is doing in order to help minimize
potential conflicts.
The interview process revealed how far the forest industry in Tasmania is willing to go in order
to try and accommodate the needs of tourism. For example, each year the Tourism Industry
Council of Tasmania provides Forestry Tasmania with a list of special events that are to occur
throughout the state. The purpose of this is to assist with the planning of burning programs so
that they are conducted in a way that will not impact upon any major events during the tourist
season. One interview participant even stated that there have been situations in the past where
burns have been called off due to unpredicted weather after all staff and equipment have arrived
on site. A consideration of the costs associated with this helps to demonstrate the commitment
that Forestry Tasmania has when it comes minimizing the impact that their operations have
203
upon local communities and the tourism industry. Interview participants in Tasmania also
praised the positive results in relation to visual resource management that are a result of the
Tourism and Forestry Protocol Agreement. Because the introduction of the agreement has
created a formalized policy in regards to communication and consultation, harvesting operations
are now much more likely to consider the visual needs of the tourism industry. In situations
where future cut blocks have the potential to impact upon nature-based tourism operations
business owners are able to raise their issue with the Tourism Industry Council of Tasmania
who then have a standardized protocol to follow in order to address the issue with the forest
industry.
A key to the success of the Tourism and Forestry Protocol Agreement is not the document itself,
but the commitment on the part of its signatories to making it work. Interview participants from
both tourism and forestry stated that a commitment from both sides is required to ensure that
improvements to the relationship between the two industries continue to be made. However, the
interview process revealed that the agreement’s success has actually led to a reduction in
communication between the two industries. In previous years when forestry and tourism
conflicts were more common the two industries seemed to be much more vigilant in terms of
maintaining regular communication channels. However, a product of the agreement’s success
has been a reduction in communication since fewer conflict issues now arise. This was
recognized by interview participants who indicated that reduced communication has the
potential to cancel out some of the positive gains that have been made. Therefore, a renewed
commitment to the maintenance of communication from both industries in Tasmania would likely
help to ensure that an increase in conflict situations does not occur.
Certain aspects of the legislative framework within Tasmania also play a role in the protection of
tourism values. The introduction of the Forest Practices Act and the Forest Practices Code has
helped to make sure that a range of values in addition to forestry are considered by decision
makers. The Forest Practices Act outlines forest planning requirements from the forest to state
level. A requirement of this legislation was the development and implementation of the Forest
Practices Code. Its purpose is to provide detailed requirements governing forest practices on
both private and public land (McDermott, Cashore & Kanowski, 2007). The guidelines provided
by the Forest Practices Code help to ensure that management is carried out in a way that
204
provides for reasonable protection of the environment. The Forest Practices Code is legally
enforceable under the Forest Practices Act (Forest Practices Authority, 2010a) and includes
standards that provide protection for a range of values that include the visual landscape and
cultural heritage, amongst others (Forest Practices Board, 2000). Because these values are
inherently connected to tourism, their maintenance ultimately provides benefits to the tourism
industry. In addition to the actual Forest Practices Code, it has been supplemented with
planning manuals and technical guides to help ensure practitioners conduct their activities in a
manner that is aligned with the values identified to be important (McDermott, Cashore &
Kanowski, 2007).
One aspect of Forestry Tasmania that makes it distinct from many other forest management
organizations is their development of tourism attractions within state forests. According to the
Forestry Tasmania tourism and recreation policy they are committed to providing recreation and
tourism opportunities that raise awareness of forests and sustainable forest management
(Forestry Tasmania, 1999). This is being accomplished through the development of various
tourism sites throughout the state that include the Tahune Airwalk, Tarkine Forest Adventures
and the Geeveston Forest and Heritage Centre. It seems as though there may be two potential
advantages associated with these types of developments. Firstly, they give Forestry Tasmania
the opportunity to provide visitors with information about their forest management practices.
Assuming that information is truthful and forest management is carried out in a publicly
acceptable manner, interpretation at these sites could benefit the organization and Tasmania as
a nature-based tourism destination by communicating the forest industry’s commitment to
sustainable forest management.
As well as communicating forest management practices, certain Forestry Tasmania tourism
developments have helped to rejuvenate the local economy in certain communities. Nowhere is
this more evident than in the Huon Valley where development of the Tahune Airwalk has played
a significant role in attracting tourists into an area that was previously experiencing economic
hardships (Felmingham, 2005). Because of their potential for stimulating economic development
in certain regions, Forestry Tasmania tourism developments clearly have the ability to benefit
the tourism industry. However, it should also be noted that other Forestry Tasmania tourism
sites have not been as successful. This means that forest management agencies considering
205
this strategy should ensure that these developments have a high probability of achieving
commercial success, as they can require a significant amount of investment.
Even though significant improvements have been made to the relationship between forestry and
tourism in Tasmania, it appears that certain tourism operators still feel as though they do not
receive sufficient consideration when it comes to forest management. This issue was raised by
an interview participant who operates in an area where forestry is the dominant industry.
Although this was raised by only one interviewee, it is likely that this is not the only nature-based
tourism operator within Tasmania who holds this view. When discussing the issue this individual
spoke about the way in which forestry dominates the landscape in their region and displeasure
with the way in which past concerns have been addressed. Therefore, an increased focus on
building relationships with tourism operators in regions where resource extraction industries are
most prevalent could further reduce conflicts that may exist in these areas.
Despite Forestry Tasmania’s management of reserves and development of tourism attractions,
some would suggest that the forest industry in Tasmania suffers from negative perceptions
amongst the public. This was mentioned during the semi-structured interview process. Much of
this is likely attributed to high profile conflicts that have surrounded the industry in the past three
decades in regards to certain forest management practices, as well as their support for
unpopular forestry related developments (e.g. Bell Bay, Wesley Value & Whale Point Pulp
Mills). Although much of the criticism does originate regionally, issues relating to the Tasmanian
forest industry also receive significant attention from interstate media. Because the Tasmania
tourism industry relies heavily on interstate visitors a negative public image associated with the
state’s forest industry could potentially have implications for tourism and other sectors. Despite
this issue, it appears that the forest industry in Tasmania has made attempts in recent years to
improve their image amongst the public. This can be seen through the development of the
Tourism and Forest Industry Protocol Agreement, which attempts to reduce conflicts with the
tourism industry (TICT, FT, FIAT & PFT, 2009), as well as the Tasmanian Forest Agreement bill
that addresses many of the concerns held by environmental groups (Environment Tasmania,
2013). In order to build on these successes the forest industry in Tasmania should try to
continue being reactive to concerns raised by citizens, as well as other industry groups. It is
likely that this could potentially provide benefits for both the tourism and forest industries.
206
7.5.4 Summary
Survey participants were asked about the types of forest industry impacts that they had
observed during their trip. Although harvested areas were quite visible to visitors in both
destinations, those visiting Vancouver Island were more likely to observe this type of impact
than visitors to Tasmania. Because harvested areas have been shown to influence visitor
perceptions it seems as though a reduction in the visibility of these areas could benefit the
tourism industry in both case study destinations. Tree plantations were much less likely to
produce negative ratings from survey participants, despite the fact that they were quite visible in
both Vancouver Island and Tasmania. This is likely because this type of forest industry impact
tends to appear much more natural in the landscape. However, certain respondents still
indicated that plantations negatively impacted upon their perceptions. Therefore, efforts should
be made to ensure that they appear as natural as possible in regions that promote natural
landscapes to attract visitors.
Survey participants were also presented with a set of forest management options and asked to
rate their level of agreement with each. When presented with the option of making no changes
to forest management practices, more than half of visitors to both Vancouver Island and
Tasmania indicated that they either disagree or strongly disagree with this statement. This
seems to suggest that improvements to forest management practices could produce positive
results for the tourism industry in both places. The management options that received the most
support in both Vancouver Island and Tasmania include the restriction of harvesting near
recreational areas to preserve scenic views and the restriction of harvesting near transportation
routes to preserve scenic views. This appears to suggest that further efforts to limit the visibility
of forest industry impacts in areas frequented by tourists could produce benefits for the tourism
industry in destinations that market the natural environment.
Analysis of the semi-structured interviews provided insight into the ways that conflict is currently
being managed between the tourism and forest industries in both case study regions. Ideas
were also raised about ways in which conflicts could be further reduced. Despite the importance
of nature-based tourism and forestry in both Vancouver Island and Tasmania, many differences
were found to exist in terms of how conflicts between these two industries are managed. The
examination of interview results has uncovered a number of useful tools that could potentially

207
help to reduce conflict between forestry and tourism in regions that market natural landscapes
and outdoor activities.
It seems clear that the management of visual impacts associated with forestry is critical in areas
where tourism relies heavily on the maintenance of natural landscapes. This issue was
identified as important by interview participants in both Vancouver Island and Tasmania and is
being addressed differently in both places. In Vancouver Island a legal framework managing
visual quality objectives is present to help preserve viewscapes that have been identified as
visually sensitive. Forest companies who operate in visually sensitive areas must comply with
this legal framework. Although the system has produced some positive results, it has also
received criticism. Certain interview participants suggested that visual quality objectives in some
areas are outdated. In addition to this, the Forest and Range Evaluation Program (2011) found
that a high percentage of harvested landscapes that were surveyed did not meet specified
visual quality objectives. Based upon the findings of this research it seems possible that this
could negatively impact upon the tourism industry. Perhaps a system that would penalize
companies for not meeting legislated objectives could help to address this issue and provide
positive results for the nature-based tourism industry and the general public. In Vancouver
Island many of the issues relating to visual resource management are addressed within the
Forest Practices Code, which is legally enforceable under the Forest Practices Act (Forest
Practices Authority, 2010a). This includes various standards intended to protect a range of
values, including the visual landscape (Forest Practices Board, 2000).
Even though a legal framework exists in British Columbia to help address visual management
concerns, certain aspects of the legislation surrounding forest management in British Columbia
appear to prioritize the forest industry. It could be argued that the introduction of the Forest and
Range Practices Act provides forestry with too much power at the cost of other forest users.
Despite reducing costs to government, certain interview participants believe that the introduction
of this legislation has negatively impacted upon their tourism product. Interviewees also
criticized the Forest and Range Practices Act for the lack of consultation that is actually required
by forest companies. This is a concern that has been supported by the Forest Practices Board
who criticized the level of communication required by the Forest and Range Practices Act,
stating that its provisions do not follow principles of effective communication (British Columbia
208
Forest Practices Board, 2003). Despite increased government costs, a regulatory framework
that better addresses a range of forest users and management concerns like the old Forest
Practices Code in British Columbia or the current Forest Practices Code in Tasmania could
provide positive benefits for tourism.
In addition to using legislated requirements, formal agreements between the tourism and forest
industries can be useful when trying to prevent or reduce conflict between these two sectors in
destinations that rely on the maintenance of natural landscapes. According to interview
participants in Tasmania, the introduction of the Tourism and Forest Industry Protocol
Agreement has led to vast improvements in the relationship between the two industries over the
past decade. Key elements of this agreement include a mutual recognition that each industry is
important to a healthy economy, identification of the most critical issues when it comes to
managing the two industries, as well as a commitment to ongoing communication and
consultation. Similar agreements between the tourism and forestry sectors can be seen in
Ontario where the Ministry of Natural Resources have released the Management Guidelines for
Forestry and Resource-Based Tourism to assist with forest management in areas used for both
forestry and tourism (Ontario Ministry of Natural Resources, 2001). This is accompanied by a
memorandum of understanding that is intended to encourage cooperation between the two
industries (Ontario Ministry of Natural Resources, 2006). Although the Statement of Mutual
Recognition and Respect was signed in 1996 between representatives of the British Columbia
tourism and forest industries, this document only consists of a single page that does very little to
provide any specific direction in how to manage potential conflicts between tourism and forestry.
According to Routledge (2008) this statement became a ‘sleeping document’ shortly after its
initial use, meaning that it currently has little to no relevance when it comes to managing conflict
between the two industries. In order make a serious attempt at addressing conflicts between
tourism and forestry in British Columbia the initiation of a more detailed agreement that holds
both sides accountable would be likely provide benefits to both industries.
In many places the forest industry must deal with issues relating to negative public perceptions.
Under certain circumstances these perceptions can lead to high profile conflicts, similar to the
controversies surrounding old-growth logging in Tasmania and Clayoquot Sound in Vancouver
Island. Along with the impact that this can have upon the forest industry, negative perceptions
209
also have the potential to affect other industries that rely on forested landscapes. To help
address this issue, forestry should be reactive to concerns that are commonly raised by the
public, such as old growth harvesting, the prevalence of clear cuts and improvements to
sustainability. Failure to do this could potentially lead to future high-profile conflicts that could
produce negative results for both tourism and forestry.
To help address possible concerns relating to tourist perceptions, attempts can be made to
educate visitors about forest management. This may be done through the development of visitor
sites that provide interpretation about management practices. If these practices are considered
to be socially responsible and information is truthful, education can potentially play a role in
managing negative perceptions. This has been done to some extent in Vancouver Island where
visitor sites that provide information about forest management have been developed by forest
companies in some areas. An example of this is Cathedral Grove, which is a common stop for
visitors travelling to certain areas within Pacific Rim National Park. However, public education is
being carried out on a larger scale in Tasmania, where Forestry Tasmania has dedicated
significant resources to the development of tourism attractions. Many of these attractions
provide interpretation about management of the state’s forests. Although some have only
achieved limited commercial success, others have become very popular and help to shape the
perceptions of visitors in regards to forest practices in Tasmania.
7.6 Management Recommendations
Based upon the findings from this research a set of management recommendations have been
developed to help guide jurisdictions that may be dealing with conflicts between nature-based
tourism and forestry. Although each situation tends to be unique, conflicts between these two
industries also share many similarities. Therefore, the following principles may be used to help
natural resource managers address issues which are similar to those that have been discussed
in this research.
1. Recognition that both industries are very important for the economic sustainability a
particular region and that the operations of one industry should not negatively impact
upon the viability of the other. Assuming that both industries are critical to a healthy
210
economy, neither industry should get special consideration over the other when it comes
to the management of forest resources.
2. Visual resource management is essential in destinations that promote natural attractions
to help mitigate the visual impacts often associated with the forest industry. This may be
achieved through the development and implementation of visual quality objectives where
visual impact limits are set depending upon the level of sensitivity assigned to an area.
Visual quality objectives should be regularly updated and based upon information that is
accurate and up to date. To help ensure that these objectives are adhered to visual
management plans should be subject to an approval process with violators risking
penalties. Examples of measures that can be used to help mitigate visual impacts
associated with forestry in sensitive areas may include retention harvesting techniques,
visual buffers of standing timber and the design of harvest patterns that resemble natural
vegetation boundaries.
3. Identification of specific regions within nature-based tourism destination that possess
significant tourism values. These areas should be subjected to special management
regimes that place a priority on nature-based tourism development. Any forest activity in
these areas should be conducted in a way that is sensitive to needs the tourism industry.
This may be achieved through the establishment of protected areas networks that utilize
a variety of IUCN protected area categories and special management zones to achieve
desired results.
4. Formal agreements between forest industry partners and all relevant stakeholders within
the tourism industry are critical. This should be accompanied by a document(s) that
provides a framework to help facilitate consultation and foster a positive relationship
between the two industries. There are a number of key features that these documents
should contain.
a. Recognition that both industries are critical for the sustainable development of
the economy of the region.
b. Recognition that the actions of one industry have the potential to negatively
impact upon the other industry, ultimately hurting the region’s economy as a
whole.

211
c. Commitment from each industry to minimize the impact that their operations may
have on the viability/economic sustainability of the other.
d. Commitment to ongoing communication and consultation along with
predetermined dates for meetings between groups who are signatories to the
agreement. These meetings should be used to discuss/resolve issues raised by
tourism or forestry stakeholders.
e. Industry representative organizations must consult widely with their members
and stakeholders to ensure that relevant issues get raised at meetings between
forestry and tourism representatives.
f. All stakeholders provided with a list of key contacts within the organization that
represents their industry so that they are able to raise potential issues that may
be affecting their business.
g. Agreement from both industries to provide the other with briefings and education
to help assist in the planning of operations (e.g. sensitive areas, sensitive times,
tourism value mapping, etc.)
h. Identification of the most critical issues when it comes to the management of
these two industries. This may include, but is not limited to visual resource
management, sustainability of important fish/game habitat/populations,
maintaining ‘sense of remoteness’, etc.
i. Detailed framework for managing the most important issues, as identified by the
agreement.
j. Framework that provides guidelines for issue resolution and the negotiation of
conflicts (e.g. third party arbitrator).
5. Special legislation should be used to govern forests that are important for both forestry
and nature-based tourism. These tools must:
a. Recognize the importance of both industries and contain prescriptions that
ensure that the interests of one industry are not compromised by the other.
b. Provide a requirement that each industry is represented fairly. It is critical that
legislation does not place a majority of the power into the hands of either the
forest industry or the tourism industry.
c. Requirement that forest companies must conduct sufficient research proving that
their proposed operations will not negatively impact on the sustainability of
surrounding businesses. This may include, but is not limited to visual impact
212
studies, economic impact analysis, environmental impact assessments, etc.
Costs of ensuring that forest operations do not negatively impact upon
surrounding businesses (tourism or otherwise) should be the responsibility of the
forest company.
d. Ensure that tools are in place that requires forest licensees to communicate and
consult with other stakeholders before forest developments occur. Consultations
should occur as early as possible and give sufficient time and opportunity for
public involvement. Consultations should also be conducted in a way that is
accessible to all interested stakeholders and continuous throughout the entire
planning process.
6. A negative public perception of a region’s forest industry has the potential to negatively
impact upon both forestry and tourism in destinations that rely on natural landscapes.
Therefore, the forest industry should make genuine attempts to maintain a positive
public image. This could likely be achieved if the forest industry is reactive to concerns
raised by members of the public. These may include, but are not limited to the
harvesting of old-growth forests, sustainability of management practices, visual impacts
associated with the industry and uses for timber that is harvested.
7.7 Study Limitations and Suggestions for Future Research
Certain limitations associated with the research have been identified despite efforts to reduce
this. Ideally survey numbers for the sport fishermen would have been closer to the amount
collected for back-country hikers and front-country visitor centre guests (150 or more). However,
sample size targets were not met with either of the two sport-fishing groups. This is especially
true for the Central Highlands fishing group in Tasmania where only 14 surveys were collected.
Although the low sample size from Central Highlands fishermen limited the degree to which
conclusions could be drawn, the sample size from the Winter Harbour fishing group allowed
certain conclusions to be made. Nevertheless, additional research would be useful to see
whether or not the differences between the sport-fishing group and the other two sample groups
in Vancouver Island could be replicated elsewhere.
213
Due to limited amounts of time and resources available, only three tourist user groups were
included for this investigation. However, there are other user groups that can be found
throughout each of the two case study regions. For example, tourists also travel to Vancouver
Island and Tasmania to experience cultural heritage sites, festivals and urban attractions. It is
possible that other tourist user groups may have their perceptions impacted by forestry in ways
that are different from the three groups tested in this study. Therefore, it would be useful to
survey tourists at other types of visitor sites to see if any differences can be found.
Finally, participants could only complete the questionnaire in English. This placed restrictions on
the type of individuals who were able to participate. Because of this, only individuals from
English speaking countries or those who are able speak English as a second language could
submit a questionnaire. Past research has demonstrated that an individual’s environmental
values may be partly influenced by cultural norms (Wagner et. al., 1998). Therefore, it is
conceivable that a method which samples only English speakers may produce different results
than a survey produced in a different language. Consequently, it may be useful to conduct
similar research using a survey instrument that is able to include those who speak languages
other than English. This is especially true when trying to understand issues relating to tourism,
which is inherently a global industry.
7.8 Conclusion
The primary objective of this research was to understand whether or not forest practices have
the potential to negatively impact upon the perception of tourists in destinations that promote
natural landscapes and outdoor activities. It also attempted to understand any differences that
may exist between tourist user groups. Finally, this study aimed to uncover methods that could
be used to help reduce potential conflicts between forestry and tourism in regions where the
economy relies heavily on both industries.
Data from both Vancouver Island and Tasmania appear to suggest that forest industry impacts
have the potential to have a negative effect upon the perception of visitors in destinations that
promote natural landscapes. However, the degree to which perceptions are affected appears to
214
be dependent upon the type of forestry impact observed. In Vancouver Island harvested areas
had the most negative impact upon visitor perceptions. This was followed by logging trucks and
saw/pulp mills. Like Vancouver Island, harvested areas in Tasmania also received a mean
rating below three, which indicates a negative overall effect upon visitor perceptions. However,
mean ratings given to harvested areas in Tasmania were higher than those given to the same
impact type in Vancouver Island. This suggests that visitors to Tasmania were more accepting
of harvested areas than those in Vancouver Island. Despite the negative ratings given to
harvested areas, logging trucks and saw/pulp mills, tree plantations were rated much higher by
respondents from both destinations, suggesting that visitors are much more accepting of this
type of forest industry impact.
Results from the various sample groups were compared to learn whether or not there are any
differences in the way that user groups are affected by exposure to forest industry impacts.
Findings provide a limited amount of support to the notion that tourist user groups are affected
differently. Although differences were revealed between the Winter Harbour sample groups and
the other two Vancouver Island groups, there were also many similarities. Winter Harbour
fishing guests rated harvested areas significantly higher than the West Coast Trail walkers and
Kwisitis Visitor Centre guests. However, no other statistically significant differences were found
when comparing ratings given to the other three forest industry impact types. When comparing
ratings given to forest industry impacts in Tasmania no significant differences were found
between sample groups. However, it is possible that a larger sample size from the Central
Highland fishing guests may have produced statistically significant differences. It is also
possible that the selection of other tourist user groups for this research may have produced
results with more statistically significant differences.
Semi-structured interviews revealed various measures that can be used to either reduce or help
prevent conflicts between forestry and tourism in destinations that promote natural attractions.
This information was used to develop a set of management recommendations for natural
resource managers who deal with conflicts between forestry and tourism. In places where
forestry and nature-based tourism are critical to a region’s economy efforts must be made to
ensure that visual impacts from forestry do not impact upon tourism values. Close
communication and consultation between the two industries should also occur to make sure that

215
each is informed of the other’s activities. The establishment of formal agreements can also be
used to help to guide consultation and foster a positive relationship between the two industries.
However, this should also be accompanied by a legislative framework that is equitable to both
sides.
It is not uncommon for nature-based tourism destinations to rely upon the same resources as
the forest industry. The fundamental differences in desires for forest use between these two
industries can often lead to conflict situations. In jurisdictions that rely heavily on both industries
it is in the best interest of governments to ensure that the actions of one sector do not impact
upon the viability of the other. Therefore, it desirable to manage these two industries in a way
that minimizes the potential for resource use conflicts. For natural resource managers who are
dealing with conflicts between nature-based tourism and forestry, consideration of the principles
discussed in this research could help provide solutions that maximize benefits for both
industries.
216
References
Abrams, J., Kelly, E., Shindler, B. & Wilton, J. 2005. ‘Value orientation and forest management:
the forest health debate.’ Environmental Management. 36(4): 495-505.
Affolderbach, J. 2011. ‘Environmental bargains: power struggles and decision making over
British Columbia’s and Tasmania’s old-growth forests.’ Economic Geography. 87(2): 181-206.
Ahmed, Z.U. 1996. ‘The need for the identification of the constituents of a destination’s tourist
image: a promotional segmentation perspective.’ The Tourism Review. 51(2): 44-57.
Aiken, S.R. & Leigh, C.H. 1986. ‘Land use conflicts and rain forest conservation in Malaysia and
Australia: the Endau-Rompin and Gordon-Franklin controversies.’ Land Use Policy. 3: 161-
179.
Altbach, P.G., Reisberg, L. & Rumbley, L.E. 2009. Trends in Global Higher Education:
Tracking an Academic Revolution. UNESCO: Paris.
Andereck, K.L. & Vogt, C.A. 2000. ‘The relationship between residents’ attitudes toward tourism
and tourism development options.’ Journal of Travel Research. 39: 27-36.
Australian Bureau of Statistics. 2009. Australian Demographic Statistics: June Quarter
2009. Australian Bureau of Statistics: Canberra.
Babbie, E. 2004. The Practice of Social Research (10th ed.). Wadsworth/Thomson Learning:
Toronto.
Baloglu, S. & Uysal, M. 1996. ‘Market segments of push and pull motivations: a canonical
correlation approach.’ International Journal of Contemporary Hospitality Management. 8(3):
32-38.
Bandler, H. 1987. ‘Gordon below Franklin dam, Tasmania, Australia: environmental factors in a
decision of national significance.’ The Environmentalist. 7(1): 43-53.
BC Stats. 2012. Employment and Unemployment Rates by Industry, Vancouver
Island/Coast. [online] BC Stats. Available at: http://www.bcstats.gov.bc.ca/StatisticsBySubject/
BusinessIndustry/BusinessCountsEmploymentByIndustry.aspx [Accessed 9 April, 2012].
Bell, S. 1999. Landscape Pattern, Perception and Process. Routledge: New York.
Bell, S. 2001. ‘Landscape pattern, perception and visualization in the visual management of
forests.’ Landscape and Urban Planning. 54: 201-211.
Bengston, D.N., Webb, T.J. & Fan, D.P. 2004. ‘Shifting value orientations in the United States,
1980-2001: a computer content analysis.’ Environmental Values. 13: 373-392.
217
Beerli, A. & Martin, J.D. 2004a. ‘Tourists’ characteristics and the perceived image of tourist
destinations: a quantitative analysis – a case study of Lanzarote, Spain.’ Tourism
Management. 25: 623-636.
Beerli, A. & Martin, J.D. 2004b. ‘Factors influencing destination image.’ Annals of Tourism
Research. 31(3): 657-681.
Bigne, J.E., Sanchez, M.I. & Sanchez, J. 2001. ‘Tourism image, evaluation variables and after
purchase behaviour: inter-relationship.’ Tourism Management. 22: 607-616.
Bjerke, B., Thrane, C. & Kleiven, J. 2006. ‘Outdoor recreation interests and environmental
attitudes in Norway.’ Managing Leisure. 11: 116-128.
Bliss, J.C, Nepal, S.K., Brooks, R.T. & Larsen, M.D. 1994. ‘Forestry community of granfalloon?
Do forest owners share the public’s views?’ Journal of Forestry. 92(9): 6-10.
Bricker, K.S. & Kerstetter, D.L. 2000. ‘Level of specialization and place attachment: an
exploratory study of whitewater recreationists.’ Leisure Sciences. 22: 233-257.
British Columbia. 2000. Vancouver Island Summary Land Use Plan. Government of British
Columbia.
British Columbia, 2005. FRPA Training Companion Guide: Version 2.3. Government of
British Columbia.
British Columbia. 2012. Canada Starts Here: The BC Jobs Plan. Government of British
Columbia.
British Columbia Forest Practices Board. 2003. Opportunity for Public Consultation Under
FRPA – Bulletin 003. Forest Practices Board: Victoria, BC.
British Columbia Forest Practices Board. 2006. A Review of the Early Forest Stewardship
Plans Under FRPA. Forest Practices Board: Victoria, BC.
British Columbia Ministry of Agriculture and Lands. 2008. Land Use Objectives Regulation:
Policy and Procedures. Strategic Land Policy and Legislation Branch and Integrated Land
Management Bureau: Victoria, BC.
British Columbia Ministry of Forests. 1998a. Recreation Features Inventory: Procedures and
Standards Manual. Forest Practices Branch: Victoria, BC.
British Columbia Ministry of Forests. 1998b. Recreation Opportunity Spectrum Inventory:
Procedures and Standards Manual. Forest Practices Branch: Victoria, BC.
British Columbia Ministry of Forests. 2001. Visual Impact Assessment Guidebook (2nd ed.).
Forest Practices Branch: Victoria, BC.
218
British Columbia Ministry of Forests. 2003. Economic Benefits of Managing Forestry and
Tourism at Nimmo Bay: A Public Perception Study and Economic Analysis. Forest
Practices Branch and Economics Trade Branch: Victoria, BC.
British Columbia Ministry of Forests and Range. 2006. The Public Response to Harvest
Practices in British Columbia at the Landscape and Stand Level. Forest Practices Branch:
Victoria, BC.
British Columbia Ministry of Jobs, Tourism and Innovation. 2012. Gaining the Edge: A Five-
year Strategy for Tourism in British Columbia 2012-2016. Government of British Columbia.
Brown, G. & Harris, C. 1992. ‘The USDA Forest Service: toward the new resource management
paradigm?’ Society and Natural Resources. 5: 231-245.
Brown, T.C. & Daniel, T.C. 1986. ‘Predicting scenic beauty of timber stands.’ Forest Science.
32(2): 471-487.
Brunson, M.W. & Shelby. B. 1992. ‘Assessing recreation and scenic quality: how does new
forestry rate?’ Journal of Forestry. 90(7): 37-41.
Brunson, M.W., Shindler, B. & Steel, B.S. 1997. ‘Consensus and dissension among rural and
urban publics concerning federal forest management in the Northwest.’ In Steel, B.S. (ed.).
Public Lands Management in the West: Citizens, Interest Groups and values. Greenwood
Press, Westport, CT: 83-94.
Buckley, R. 2003. ‘The practice and politics of tourism and land management.’ In Buckley, R.,
Pickering, C. & Weaver D.B. (eds.) Nature-based Tourism, Environment and Land
Management. CAB International: 1-6.
Buckman, G. 2008. Tasmania’s Wilderness Battles: A History. Allen & Unwin: Crow’s Nest,
Australia.
Budruk, M., Wilhelm-Stanis, S.A., Schneider, I.E. & Anderson, D.H. 2011. ‘Differentiating place
attachment dimensions among proximate and distant visitors to two water-based recreation
areas.’ Society and Natural Resources. 0: 1-16.
Burrows, M. 2000. ‘Multistakeholder processes: activist containment versus grassroots
mobilization.’ In Salazar, C.D., Alper, D.K. (eds.). Sustaining the Forests of the Pacific
Coast: Forging Truces in the War of the Woods. UBC Press: Vancouver: 209-228.
Buzinde, C.N., Santos, C.A. & Smith, S.L.J. 2006. ‘Ethnic representations: destination imagery.’
Annals of Tourism Research. 33(3): 707-728.
Campos, P., Caparros, A. & Oviedo, J.L. 2007. ‘Comparing payment-vehicle effects in
contingent valuation studies for recreational use in two protected Spanish forests.’ Journal of
Leisure Research. 39(1): 60-85.

219
Canadian Council of Forest Ministers. 2006. Criteria and Indicators of Sustainable Forest
Management in Canada. Natural Resources Canada: Ottawa.
Cardano, M., Welcomer, S.A. & Scherer, R.F. 2003. ‘An analysis of the predictive validity of the
new ecological paradigm scale.’ Journal of Environmental Education. 34(3): 22-28.
Carls, E.G. 1980. ‘So long Frank Buck: some changes in the ecology of outdoor recreation.’ In
Goodale, T.L. & Witt, P.A. (eds.) Recreation and Leisure: Issues in an Era of Change.
Venture Publishing, State College, PA: 154-164.
Cashore, B., Hoberg, G., Howlett, M., Rayner, J. & Wilson, J. 2001. In Search of
Sustainability: British Columbia Forest Policy in the 1990’s. UBC Press: Vancouver.
Castaneda, F. 2000. ‘Criteria and indicators for sustainable forest management: international
processes, current status and the way ahead.’ Unasylva. 203(51): 34-40.
Chen, C.F. & Tsai, D.C. 2007. ‘How destination image and evaluative factors affect behavioral
intentions.’ Tourism Management. 28: 1115-1122.
Chen, H.C.L. & Hay, P. 2006. ‘Defending island ecologies: environmental campaigns in
Tasmania and Taiwan.’ Journal of Developing Societies. 22(3): 303-326.
Chen, P.J. & Kerstetter, D.L. 1999. ‘International students’ image of rural Pennsylvania as a
travel destination.’ Journal of Travel Research. 37: 256-266.
Cheng, A.S., Kruger, L.E. & Daniels, S.E. 2003. ‘”Place” as an integrating concept in natural
resource politics: propositions for a social science research agenda.’ Society and Natural
Resources. 16: 87-104.
Cloke, P. & Perkins, H.C. 1998. ‘“Cracking the canyon with the awesome foursome”:
representations of adventure tourism in New Zealand.’ Environment and Planning (D):
Society and Space. 16(2): 185-218.
Convention of Biological Diversity. 2011a. Costa Rica – Overview. [online] Available at:
https://www.cbd.int/countries/?country=cr [Accessed 25 July, 2013].
Convention of Biological Diversity. 2011b. New Zealand – Overview. [online] Available at:
https://www.cbd.int/countries/?country=nz [Accessed 25 July, 2013].
Convention of Biological Diversity. 2013. Quick Guides to the Aichi Biodiversity Targets
(Version 2). Convention of Biological Diversity: Montreal.
Council of Tourism Associations. 2007. A Tourism Industry Strategy for Forests. COTA:
British Columbia.
Cradle Coast Authority. 2010. Living on the Coast: The Cradle Coast Regional Land Use
Planning Framework. Cradle Coast Authority: Burnie, Australia.
220
Dearden, P. & Rollins, R. 2009. ‘Parks and protected areas in Canada’ In Dearden, P. & Rollins,
R. (eds.) Parks and Protected Areas in Canada. Oxford University Press: Toronto.
Decker, D.J., Brown, T.L. & Gutierrez, R.J. 1980. ‘Further insights into the multiple-satisfactions
approach for hunter management.’ Wildlife Society Bulletin. 8(4): 323-331.
Denzin, N.K. & Lincoln, Y.S. 2000. Handbook of Qualitative Research. Sage Publications:
New Delhi.
Department of Primary Industries, Parks, Water & Environment. 2011. DPIPWE Annual Report
2010-2011. DPIPWE: Tasmania.
DeVellis, R.F. 2003. Scale Development: Theory and Applications (2nd ed.). SAGE
Publications: Thousand Oaks, CA.
Dillman, D.A., Smyth, J.D. & Christian, L.M. 2009. Internet, Mail, and Mixed-Mode Surveys:
The Tailored Design Method (3rd ed.). John Wiley & Sons: Hoboken, NJ.
Dunlap, R.E. 2008. ‘The new environmental paradigm scale: from marginality to worldwide use.’
Journal of Environmental Education. 40(1): 3-18.
Dunlap, R.E. & Catton, W.R. 1979. ‘Environmental Sociology.’ Annual Review of Sociology. 5:
243-273.
Dunlap. R.E. & Hefferman, R.B. 1975. ‘Outdoor recreation and environmental concern: an
empirical examination.’ Rural Sociology. 40: 18-30.
Dunlap, R.E., Van Liere, K.D., Mertig, A.G. & Jones, R.E. 2000. ‘Measuring endorsement of the
new ecological paradigm: a revised NEP scale.’ Journal of Social Issues. 56(3): 425-442.
Edge, S. & McAllister, M.L. 2009. ‘Place-based local governance and sustainable communities:
lessons from Canadian biosphere reserves.’ Journal of Environmental Planning and
Management. 52(3): 279-295.
Eisenhauer, B.W., Krannich, R.S. & Blahna, D.J. 2000. ‘Attachments to special places on public
lands: an analysis of activities, reason for attachments, and community connections.’ Society
and Natural Resources. 13: 421-441.
Environment Tasmania. 2013. The facts about the Tasmanian Forest Agreement. [online]
Available at: https://www.et.org.au/facts-tasmanian-forests-agreement [Accessed 13 July,
2013].
Felmingham, B. 2005. Socioeconomic Benefits of the Tahune Airwalk. University of
Tasmania School of Economics: Hobart, Australia.
Felmingham, B., Poate, S. & McMahon, I. 2009. Assessing Direct Government Subsidies
Paid to Tasmania Industries. IMC Link: Hobart, Australia.
221
Field, A. 2009. Discovering Statistics Using SPSS (3rd ed.). SAGE Publications: Thousand
Oaks, CA.
Floyd, M.F. & Gramman, J.H. 1997. ‘Experience-based setting management: implications for
market segmentation of hunters.’ Leisure Sciences. 19(2): 113-128.
Fodness, D. 1994. ‘Measuring tourist motivation.’ Annals of Tourism Research. 21(3): 555-
581.
Font, X. & Tribe, J. 2000. ‘Recreation, conservation and sustainable timber production: a
sustainable relationship?’ In Font, X. & Tribe, J. (eds.) Forest Tourism and Recreation. CAB
International: 1-22.
Ford, R.M., Williams, K.J.H., Bishop, I.D. & Webb, T. 2005. Social Acceptability of Forest
Management Systems. University of Melbourne: Melbourne.
Ford, R.M., Williams, K.J.H., Bishop, I.D. & Webb, T. 2009. ‘A value basis for the social
acceptability of clearfelling in Tasmania, Australia.’ Landscape and Urban Planning. 90:196-
206.
Forest Practices Authority. 2010a. The Tasmanian Forest Practices System. Forest Practices
Authority: Hobart.
Forest Practices Authority. 2010b. Communication of Information in Relation to Forest
Practice Plans. Forest Practices Authority: Hobart.
Forest Practices Board. 2000. Forest Practices Code. Forest Practices Board: Hobart,
Tasmania.
Forest and Range Evaluation Program. 2011. Chief Forester’s 2010 Annual Report on the
Forest and Range Evaluation Program. Forest and Range Evaluation Program.
Forestry Commission. 2004. The UK Forestry Standard: The Government’s Approach to
Sustainable Forestry. Forestry Commission: Edinburgh, UK.
Forestry Tasmania. 1999. Derwent Forest District Forest Management Plan – June 1999.
Forestry Tasmania: Hobart.
Forestry Tasmania. 2011. Management Decision Classification: For Zoning in State Forest
Management Areas (User Manual). Forestry Tasmania: Hobart.
Forestry Tasmania, 2012. Stewardship Report 2011-12. Forestry Tasmania: Hobart.
Fransson, N. & Garling, T. 1999. ‘Environmental concern: conceptual difinitions, measurement,
methods and research findings.’ Journal of Environmental Psychology. 19: 369-382.
Fyhri, A. Jacobsen, J.K.S. & Tommervik, H. 2009. ‘Tourists’ landscape perceptiosn and
preferences in a Scandinavian coastal region.’ Landscape and Urban Planning. 91: 201-211.
222
Gallarza, M.G., Saura, I.G. & Garcia, H.G. 2002. ‘Destination image: towards a conceptual
framework.’ Annals of Tourism Research. 29(1): 56-78.
Gee, H. 2005. ‘The Wilderness Society.’ In Alexander, A. (ed.). The Companion to Tasmanian
History. Centre for Historical Tasmanian Studies: Hobart: 385-386.
Gobster, P.H. 1996. ‘Forest aesthetics, biodiversity and the perceived appropriateness of
ecosystem management practices.’ In Brunson, M.W., Kruger, L.E. Tyler, C.B. & Schroeder,
S.A. (eds.). Defining Social Acceptability in Ecosystem Management: Workshop
Proceedings. 1992. June 23-25: Kelso, WA.
Gooch, N. 2013. ‘Tourism and forestry tenure on crown land: a time for change.’ Appeal. 18:
37-54.
Gunderson, V.S. & Frivold, L.H. 2008. ‘Public preferences for forest structures: a review of
quantitative surveys from Finland, Norway and Sweden.’ Urban Forestry & Urban Greening.
7: 241-258.
Hair, J.F. Jr., Black, W.C., Babin, B.J., Anderson, R.E. 2010. Multivariate Data Analysis (7th
ed.). Prentice Hall: Upper Saddle River, NJ.
Hall, T.E., Farnum, J.O., Slider, T.C. & Ludlow, K. 2009. New Approaches to Forest Planning:
Inventorying and Mapping Place Values in the Pacific Northwest Region. United States
Department of Agriculture, Forest Service: Portland.
Hanna, K.S., Negrave, R.W., Kutas, B. & Jojkic, D. 2008. ‘Conflict and protected areas
establishment: British Columbia’s political parks.’ In. Hanna, K.S., Clark, D.A. & Slocombe, D.S.
(eds.). Transforming Parks and Protected Areas: Policy and Governance in a Changing
World. Routledge: New York.
Harshaw, H.W., Sheppard, S.R.J. & Lewis, J.L. 2007. ‘A review and synthesis of social
indicators for sustainable forest management.’ BC Journal of Ecosystems and Management.
8(2): 17-36.
Hazel, K.L., Langenau, E.E. & Levine, R.L. 1990. ‘Dimensions of hunting satisfaction: multiple-
satisfactions of wild turkey hunting.’ Leisure Sciences. 12: 383-393.
Hume, M. ‘Tourism in the Discovery Islands feels the force of logging.’ The Globe and Mail.
[online] Available at: http://www.theglobeandmail.com/news/british-columbia/tourism-in-the-
discovery-islands-feels-the-force-of-logging/article9703141 [Accessed 27 July, 2013].
Hunt, L., Twyman, G.D., Haider, W. & Robinson, D. 2000. ‘Examining the desirability of
recreating in logged settings.’ Society and Natural Resources. 13: 717-734.
Hunt, L., Haider, W. & Johnson, M. 2000. Ontario Resource Based Tourism Operators and
Forest Management: Highlights of an Operator Survey. Ontario Ministry of Natural
Resources, Centre for Northern Forest Ecosystem Research: Thunder Bay, ON.
223
Inglehart, R.F. 2008. ‘Changing values among western publics from 1970 to 2006.’ West
European Politics. 31(1-2): 130-146.
International Union for the Conservation of Nature. 2008. Guidelines for Applying Protected
Area Management Categories. IUCN: Gland, Switzerland.
Jackson, E.L. 1989. ‘Environmental attitudes, values and recreation.’ In Jackson, E.L. & Burton,
T. (eds.). Understanding Leisure and Recreation: Mapping the Past, Charting the Future.
Venture Publishing, State College, PA: 357-383.
Janes, D. 2008. ‘Beyond the tourist gaze? Cultural learning on an American ‘semester abroad’
programme in London.’ Journal of Research in International Education. 7(1): 21-35.
Jang, S., Bai, B., Hu, C. & Wu, C. 2009. ‘Affect, travel motivation, and travel intention: a senior
market.’ Journal of Hospitality and Tourism Research. 33(1): 51-73.
Jang, S. & Cai, L.A. 2002. ‘Travel motivations and destination choice: a study of British
outbound market.’ Journal of Travel & Tourism Marketing. 13(3): 111-133.
Jenkins, O.H. 1999. ‘Understanding and measuring tourist destination images.’ International
Journal of Tourism Research. 1: 1-15.
Johnson, R.B. & Onwuegbuzie, A.J. 2004. ‘Mixed methods research: a research paradigm
whose time has come.’ Educational Researcher. 33(7): 14-26.
Kearney, A.R. 2001. ‘Effects of an informational intervention on public reactions to clear-cutting.’
Society and Natural Resources. 14: 777-790.
Kent, R.L. 1993. ‘Determining scenic quality along highways: a cognitive approach.’ Landscape
and Urban Planning. 27: 29-45.
Kianicka, S., Buchecker, M., Hunziker, M & Muller-Boker, U. 2006. ‘Locals’ and tourists’ sense
of place: a case study of a Swiss alpine village.’ Mountain Research and Development. 26(1):
55-63.
Kim, S.S., Lee, C.K. & Klenosky, D.B. 2003. ‘The influence of push and pull factors at Korean
national parks.’ Tourism Management. 24: 169-180.
Knopp, T.B. & Tyger, J.D. 1973. ‘A study of conflict in recreation land use: snowmobiling vs. Ski-
touring.’ Journal of Leisure Research. 5: 6-17.
Knudson, D.M., Cable, T.T. & Beck, L. 2003. Interpretation of Natural and Cultural
Resources (2nd ed.). Venture Publishing: State College. PA.
Kozak, M. & Rimmington, R. 2000. ‘Tourist satisfaction with Mallorca, Spain, as an off-season
holiday destination.’ Journal of Travel Research. 38: 260-269.
Kraus, R. & Allen, L. 1997. Research & Evaluation in Recreation, Parks & Leisure Studies
(2nd ed.). Gorsuch Scarisbrook Publishers: Scottsdale, AZ.
224
Kuenzi, C. & McNeely, J. 2008. ‘Nature-based tourism.’ In Renn, O. & Walker, K. (eds.) Global
Risk Governance: Concept and Practice Using the IRRGC Framework. Springer, Dordrecht,
Netherlands: 155-178.
Kwan, P., Eagles, P.F.J. & Gebhardt, A. 2010. ‘Ecolodge patrons’ characteristics and
motivations: a study of Belize.’ Journal of Ecotourism. 9(1): 1-20.
Lavallee, L. & Suedfeld, P. 1997. ‘Conflict in Clayoquot Sound: using thematic content analysis
to understand psychological aspects of environmental controversy.’ Canadian Journal of
Behavioural Science. 29(3): 194-209.
Leech, N.L. & Onwuegbuzie, 2009. ‘A typology of mixed methods research designs.’ Quality
and Quantity. 43(2): 265-275.
MacKay, K.J. & Fesenmaier, D.R. 1997. ‘Pictorial element of destination image formation.’
Annals of Tourism Research. 24(3): 537-565.
Magnusson, W. & Shaw, K. eds. 2002. A Political Space: Reading the Global through
Clayoquot Sound. McGill-Queens University Press: Montreal.
Malkinson, L. 2011. A Preliminary Evaluation of the Results-Based Forest and Range
Practices Act: Fostering Innovation in Forest Practices? M.Sc. Thesis. The University of
British Columbia.
Manfredo, M.J., Driver, B. & Brown, P. 1983. ‘A test of concepts inherent in experience based
setting management for outdoor recreation areas.’ Journal of Leisure Research. 15: 263-283.
Mason, M.R. 1997. ‘Administrative fairness and land use sustainability: restructuring forest land
decision-making in British Columbia, Canada.’ The London Journal of Canadian Studies. 13:
25-59.
McCool, S.F., Benson, R.E. & Ashor, J.L. 1986. ‘How the public perceives the visual effects of
timber harvesting: an evaluation of interest group preferences.’ Environmental Management.
10(3): 385-391.
McDermott, C.L., Cashore, B. & Kanowski, P. 2007. A Global Comparison of Forest Practice
Policies Using Tasmania as a Constant Case. Yale Program on Forest Policy and
Governance: New Haven, CT.
McDonald, G.T. & Lane, M.B. 2004. ‘Converging global indicators for sustainable forest
management.’ Forest Policy and Economics. 6: 63-70.
McGaurr, L. 2010. ‘Travel journalism and environmental conflict.’ Journalism Studies. 11(1):
50-67.
McIntyre, N., Moore, J. & Yuan, M. 2008. ‘A place-based, values-centered approach to
managing recreation on Canadian crown lands.’ Society and Natural Resources. 21: 657-670.
225
McKercher, B. 1992. ‘Tourism as a conflicting land use.’ Annals of Tourism Research. 19:
467-481.
McKercher, B. 1996. ‘Differences between tourism and recreation in parks.’ Annals of Tourism
Research. 23(3): 563-575.
Mehmetoglu, M. 2007. ‘Typologising nature-based tourists by activity – theoretical and practical
implications.’ Tourism Management. 28: 651-660.
Mercille, J. 2005. ‘Media effects on image: the case of Tibet.’ Annals of Tourism Research.
32(4): 1039-1055.
Milton, K. 2005. ‘Emotion (or Life, the Universe, Everything)’ The Australian Journal of
Anthropology. 16(2): 198-211.
Montreal Process Working Group. 2007. The Montreal Process: Criteria and Indicators for
the Conservation and Sustainable Management of Temperate and Boreal Forests (3rd ed.).
Natural Resources Canada: Ottawa.
Morgan, N. 2002. ‘New Zealand, 100% Pure. The creation of a niche destination brand’.
Journal of Brand Management. 9(4/5): 335-354.
Musselwhite, G. & Herath, G. 2005. ‘Australia’s regional forest agreement process: analysis of
the potential and problems.’ Forest Policy and Economics. 7: 579-588.
NRM South. 2010. Natural Resource Management Strategy for Southern Tasmania 2010 –
2015. NRM South: Hobart.
Natural Resources Canada. 2007. The Atlas of Canada. [online] Available at:
http://atlas.nrcan.gc.ca/site/english/index.html. [Accessed 27 March, 2012].
New Zealand Ministry for the Environment. 2001. Valuing New Zealand’s Clean Green Image.
Ministry for the Environment: New Zealand.
Nichol, M., Shi, H. & Campi, S. 2013. Economic Impact Analysis: Tourism in Tasmania’s
South. Remplan: Bendigo, Australia.
Obenour, W., Groves, D. & Lengfelder, J. 2006. ‘Image segmentation and implications for the
development of a nature-based destination’. Journal of Hospitality Marketing & Mangement.
14(1): 23-47.
Ode, A., Fry, G. Tveit, M.S. Messager, P. & Miller, D. ‘Indicators of perceived naturalness as
drivers of landscape preference.’ Journal of Environmental Management. 90: 375-383.
O’Leary, T.N., McCormack, A.G. Clinch, J.P. 2000. ‘Afforestation in Ireland - regional
differences in attitude.’ Land Use Policy. 17(1). 39-48.
Ontario Ministry of Natural Resources. 2001. Management Guidelines for Forestry and
Resource-Based Tourism. Forest Management Branch: Toronto.
226
Ontario Ministry of Natural Resources. 2006. Tourism and Forestry Memorandum of
Understanding. Ontario Government: Toronto.
Paquet, J. & Belanger, L. 1997. ‘Public acceptability thresholds of clear-cutting to maintain
visual quality of Boreal Balsam Fir landscapes.’ Forest Science. 43(1): 46-55.
Parks Canada. 2013a. Pacific Rim National Park Reserve West Coast Trail 2013 Hiker
Preparation Guide. Parks Canada: Ucluelet, BC.
Parks Canada. 2013b. Parks Canada Attendance 2007-08 to 2011-12. [online] Available at:
http://www.pc.gc.ca/docs/pc/attend/table1.aspx [Accessed 26 September, 2013].
Patel, A, Rapport, D., Vanderlinden, L. & Eyles, J. 1999. ‘Forests and societal values:
comparing scientific and public opinion of forest values.’ The Environmentalist. 19: 239-249.
Pearce, D.G. 1993. ‘Comparative studies in tourism research.’ In Pearce, D.G. & Butler, R.W.
(eds.). Tourism Research: Critiques and Challenges. Routledge: New York: 20-35.
Perkins, H.C. & Thorns, D.C. 2001. ‘Gazing or performing? Reflections on Urry’s tourist gaze in
the contemporary experience in the Antipodes.’ International Sociology. 16: 185-204.
Petrosillo, I., Zurlini, G., Corliano, M.E., Zaccarelli, N. & Dadano, M. 2007. ‘Tourist perception of
recreation environment and management in a marine protected area.’ Landscape and Urban
Planning. 79: 29-37.
Picard, P. & Sheppard, S. 2001. ‘The effects of visual resource management on timber
availability: a review of case studies and policy.’ BC Journal of Ecosystems and
Management. 1(2): 1-12.
Pierce, C.L., Manfredo, M.J. & Vaske, J.J. 2001. ‘Social science theories in wildlife
management.’ In Decker, D.J., Brown, T.L., Siemer, W.F. (eds.). Human Dimensions of
Wildlife Management in North America. The Wildlife Society: Bethesda, MD: 39-56.
Pure Tasmania, 2010. Pure Tasmania. [online]. Available at: www.puretasmania.com.au
[Accessed 28 July, 2010].
Racevskis, L.A. & Lupi, F. 2006. ‘Comparing urban and rural perceptions of and familiarity with
the management of forest ecosystems.’ Society and Natural Resources. 19: 479-495.
Rainforest Action Network. 2006. Global Outcry Over Falling Forests and Failing
Democracy on Australia’s Island State of Tasmania. [Online Press Release] Rainforest
Action Network. Available at: http://ran.org/media_center/news_article/?uid=4213 [Accessed 5
January 2010].
Reader. 2006. The Expectations that Affect the Management of Public Forest and Range
Lands in British Columbia: Looking Outside the Legislation. Government of British
Columbia.
227
Ribe, R. 2004. ‘Aesthetic perceptions of green-tree retention harvests in vista views: the
interaction of cut level, retention patterns and harvest shape.’Landscape and Urban Planning.
73: 277-293.
Ribe, R. 2006. ‘Perceptions of forestry alternatives in the US Pacific Northwest: information
effects and acceptability distribution analysis.’ Journal of Environmental Psychology. 26:
100-115.
Robinson, M. 2001. ‘Tourism encounters: inter- and intra-cultural conflicts and the world’s
largest industry.’ In Al Sayyad, N. (ed.) Consuming Tradition, Manufacturing Heritage:
Global Norms and Urban Forms in the Age of Tourism. Routledge, London: 34-67.
Routledge, D.A. 2008. ‘Tourism Industry Agreements from Cooperation to Collaboration: A
Forest Industry Perspective.’ Presented to The Council of Tourism Associations of BC 2008
Tourism Industry Conference. Vancouver, Canada. 22 February 2008. Council of Forest
Industries.
Rudan, P. 2013. ‘Maurelle Island logging to proceed in spite of opposition.’ Campbell River
Mirror. [online] Available at: http://www.campbellrivermirror.com/news/214026781.html
[Accessed 27 July, 2013].
Sale, J.E.M., Lohfeld, L.H. & Brazil, K. 2002. ‘Revisiting the quantitative-qualitative debate:
implications for mixed-methods research.’ Quality and Quantity. 36: 43-53.
Sharples, C. 2001. Lake Pedder: Values and Restoration. Centre for Environmental Studies,
University of Tasmania, Hobart.
Sheppard, S.R.J. 2001. ‘Beyond visual resource management: emerging theories of an
ecological aesthetic and visible stewardship. In Sheppard, S.R.J. & Harshaw, H.W. (eds.),
Forests and Landscapes: Linking Ecology, Sustainability and Aesthetics. CAB
International: New York. 149-172.
Sheppard, S.R.J. 2004. ‘Visual analysis of forest landscapes.’ Encyclopedia of Forest
Planning, Landscape and Planning Section. Elsevier: Oxford, UK. 440-450.
Sheppard, S.R.J. & Meitner, M. 2005. ‘Using multi-criteria analysis and visualization for
sustainable forest management planning with stakeholder groups.’ Forest Ecology and
Management. 207: 171-187.
Shindler, B.A., Brunson, M. & Stankey, G.H. 2002. Social Acceptability of Forest Conditions
and Management Practices: A Problem Analysis. United States Department of Agriculture:
Portland, Oregon.
Shindler, B.A., List, P., & Steel, B.S. 1993. ‘Managing federal forests: public attitudes in Oregon
and nationwide.’ Journal of Forestry. 91(7): 36-42.
Shindler, B.A., Steel, BS. & List, P. 1996. ‘Public judgements of adaptive management: a
response from forest communities.’ Journal of Forestry. 94(6): 4-12.
228
Shirmer, J. 2008. Forestry, Jobs and Spending: Forest Industry Employment and
Expenditure in Tasmania, 2005-2006 (technical report 184). Cooperative Research Centre
for Forestry: Hobart.
Shirmer, J. 2010. Tasmania’s Forest Industry: Trends in Forest Industry Employment and
Turnover 2006-2010 (technical report 206). Cooperative Research Centre for Forestry:
Hobart.
Siry, J.P., Cubbage, F.W. & Ahmed, M.R. 2005. ‘Sustainable forest management: global trends
and opportunities.’ Forest Policy and Economics. 7: 551-561.
Sirgy, M.J. & Su, C. 2000. ‘Destination Image, self-congruity and travel behaviour: toward an
integrative model.’ Journal of Travel Research. 38: 340-352.
Stanbury, W.T. 2000. Environmental Groups and the International Conflict Over the
Forests of British Columbia, 1990 to 2000. UBC-SFU Centre for the Study of Government
and Business: Vancouver.
Stedman, R.C. 2003. ‘Is it really just a social construction?: the contribution of the physical
environment to sense of place.’ Society and Natural Resources. 16: 671-685.
Tasci, A.D.A. & Kozak, M. 2006. ‘Destination brands vs. destination image: do we know what
we mean?’ Journal of Vacation Marketing. 12(4): 299-317.
Tasmania Parks and Wildlife Service. 2012. The Overland Track Frequently Asked
Questions. Department of Primary Industries, Parks, Water and Environment: Tasmania.
Tasmania Parks and Wildlife Service. 2013. Visitor Research and Statistics: National Parks
& Reserves Attendance. [online] Available at: http://www.parks.tas.gov.au/index.aspx?base=86
[Accessed 26 September, 2013].
Tasmania Parks and Wildlife Service & Department of Tourism, Parks, Heritage and the Arts.
2003. The Tasmanian Advantage: Natural and Cultural Features of Tasmania: A Resource
Manual Aimed at Developing Knowledge and Interpretive Skills Specific to Tasmania.
Department of Education, Science and Training: Canberra.
Tindall, D. 2003. ‘Social values and the contingent nature of public opinion and attitudes about
forests.’ The Forestry Chronicle. 79(3): 692-705.
Tindall, D. & Begoray, N. 1993. ‘Old growth defenders: the battle for the Carmanah Valley.’ In
Lerner, S. (ed.), Environmental Stewardship: Studies in Active Earth Keeping. University of
Waterloo Geography Series: Waterloo. 296-322.
Tourism British Columbia. 2009a. The Value of Tourism in British Columbia: Trends from
1998 to 2008. Tourism BC: British Columbia.
Tourism British Columbia. 2009b. Touring Product Overview. Tourism British Columbia:
Victoria.
229
Tourism British Columbia. 2010. Super, Natural British Columbia, Canada. [online] Tourism
British Columbia. Available at: http://www.hellobc.com [Accessed 12 February, 2010].
Tourism British Columbia. 2012. The Value of Tourism in British Columbia: Trends from
2001 to 2011. Tourism BC: British Columbia.
Tourism Industry Council of Tasmania. 2007. Pulp Mill Tourism Operators Research Report.
Enterprise Research and Marketing Services: Moonah, Australia.
Tourism Industry Council of Tasmania, Forestry Tasmania, Forest Industries Association of
Tasmania & Private Forests Tasmania. 2009. Tourism & Forestry Protocol Agreement: A
Code of Mutual Understanding. TICT, FT, FIAT & PFT: Tasmania.
Tourism Tasmania. 2008. Discover Tasmania: Australia’s Natural State. Tourism Tasmania:
Tasmania.
Tourism Tasmania. 2009. Discover Tasmania: Your Island of Inspiration. Tourism Tasmania:
Tasmania.
Tourism Tasmania. 2012. Tasmanian Visitor Survey Results Report. [online] Tourism
Tasmania: Hobart. Available at: http://www.tourismtasmania.com.au/research/webreporter
[Accessed: 1 April, 2012].
Tourism & Transport Forum. 2009. Tourism in Tasmania: Industry Update. Tourism &
Transport Forum: Sydney.
Tourism Vancouver Island. 2008. Vancouver Island Exit Survey. Industry Services
Department: Nanaimo, BC.
Tourism Vancouver Island. 2011. Vancouver Island Outdoor Guide. Page One Publishing:
Victoria, BC.
Tourism Vancouver Island. 2012. Vancouver Island Vacation Guide. Page One Publishing:
Victoria, BC.
Tranter, B. 2009. ‘Leadership and change in the Tasmanian environment movement.’ The
Leadership Quarterly. 20: 708-724.
Tyrvainen, L., Silvennoinen, H. & Nousiainen, I. 2002. ‘Combining forestry and nature-based
tourism in Finland: an analysis of development potentials and constraints.’ Collaboration and
Partnerships in Forestry. Proceedings from IUFRO Division 6 Meeting. 2002, November 11-
17: Valdivia, Chile.
Urry, J. 1990. The Tourist Gaze. SAGE Publications: London.
Urry, J. 1992. ‘The tourist gaze “revisited”’. The American Behavioural Scientist. 36(2): 172-
186.
Urry, J. 2002. The Tourist Gaze (2nd ed.). SAGE Publications: London.
230
Valentine, P. S. 1992. ‘Nature-based tourism.’ In Weiler, B. & Hall, M. (eds.) Special Interest
Tourism. Belhaven Press, London: 105-127.
Van Liere, K.D. & Noe, F.P. 1981. ‘Outdoor recreation and environmental attitudes: further
examination of the Dunlap-Hefferman thesis.’ Rural Sociology. 46(3): 505-513.
Vaske, J.J., Kiriakos, R., Cottrell, S.P. & Khuong, M.N. 2009. ‘Importance-performance and
segmentation: an application at a biosphere reserve in Vietnam.’ Journal of Travel & Tourism
Marketing. 26: 30-41.
Vaughan, D.R. & Edwards, J.R. 1999. ‘Experiential perceptions of two winter sun destinations:
the Algarve and Cyprus.’ Journal of Vacation Marketing. 5(4): 356-368.
Wagner, R.G., Flynn, J., Gregory, R., Mertz, C.K. & Slovic, P. 1998. ‘Acceptable practices in
Ontario’s forests: differences between public and forestry professionals.’ New Forests. 16: 139-
154.
Wall, G. 1982. ‘Changing views of the land as a recreation resource.’ In Wall, G. & March, J.S.
(eds.) Recreation Land Use: Perspectives on its Evolution in Canada. Carleton University
Press, Ottawa: 15-25.
Wee, C.H., Hakam, A.N. & Ong, E. 1986. ‘Temporal and regional differences in image of a
tourist destination: implications for promoters of tourism.’ The Service Industries Journal. 6(1):
104-114.
Whittaker, D., Vaske, J.J. & Manfredo, M.J. 2006. ‘Specificity and the cognitive hierarchy: value
orientations and the acceptability of urban wildlife management actions.’ Society and Natural
Resources. 19: 515-530.
Williams, A.M. & Shaw, G. 2009. ‘Future play: tourism, recreation and land use.’ Land Use
Policy. 265: S326-S335.
Williams, D.R. 1995. Mapping Place Meanings for Ecosystem Management (technical
report). USDA Forest Service: Walla Walla, Washington.
Williams, D.R. & Patterson, M.E. 1999. ‘Environmental psychology: mapping landscape
meanings for ecosystem management.’ In H.K. Cordell & J.C. Bergstrom (eds.) Integrating
Social Sciences and Ecosystem Management: Human Dimensions in Assessment, Policy
and Management. Sagamore Press, Champaign, Illinois: 141-160.
Williams, D.R., Patterson, M.E., Roggenbuck, J.W. & Watson, A.E. 1992. ‘Beyond the
commodity metaphor: examining emotional and symbolic attachment to place.’ Leisure
Sciences. 14: 29-46.
Williams, P. & Soutar, G.N. 2009. ‘Value, satisfaction and behavioral intentions in an adventure
tourism context.’ Annals of Tourism Research. 36(3): 413-438.
231
Williams, P.W., Penrose, R.W. & Hawkes, S. 1998. ‘Shared decision-making in tourism land use
planning.’ Annals of Tourism Research. 25(4): 860-889.
Wilson, 1998. Talk and Log: Wilderness Politics in British Columbia. UBC Press:
Vancouver.
Wray, M. 2011. ‘Adopting and implementing a transactive approach to sustainable tourism
planning: translating theory into practice.’ Journal of Sustainable Tourism. 19(4-5): 605-627.
Yoon, Y. & Uysal, M. 2005. ‘An examination of the effects of motivations and satisfaction on
destination loyalty: a structural model.’ Tourism Management. 26: 45-56.
Young, M. 1999. ‘The relationship between tourist motivations and the interpretation of place
meanings.’ Tourism Geographies. 1(4): 387-405.

232
Appendix A
Vancouver Island Questionnaire &
Consent Information

233
VANCOUVER ISLAND TOURISM SURVEY
CONSENT INFORMATION
Kyle Hilsendager Howard Harshaw PhD Candidate Research Associate Forest Resources Management Forest Resources Management Faculty of Forestry Faculty of Forestry University of British Columbia University of British Columbia Email: Email:
Greetings, We are asking for your input in an important study about tourism on Vancouver Island, British Columbia.
PURPOSE The purpose of this research is to examine the conflict that exists between forestry and tourism in regions that market the natural environment and activities that take place in these settings. The results of this survey will help provide insight into the ways that different tourist user groups are affected by the impacts of forest management practices. This particular survey collects information about:
Opinions about Vancouver Island as a tourist destination.
Encounters with forestry impacts while visiting Vancouver Island.
Opinions regarding potential forest management options on Vancouver Island.
Attitudes about the environment.
Demographic information. This project will help contribute to our understanding about the conflict that may exist between forestry and tourism. Overall results will be shared publicly and may be used to guide discussions and develop policies to address issues regarding forestry and tourism. Upon completion of this study, results of this research will be made available at:
www.hd-research.ca/tourism
234
STUDY PROCEDURES
This survey will take approximately 10-15 minutes to complete. Please take your time as you consider your answers to the questions. Remember there are no right or wrong answers. If not enough space is provided for your answer, feel free to use the extra space provided at the end of the questionnaire. Please, return the completed survey to the research assistant that originally gave it to you.
CONFIDENTIALITY Your identity will be kept strictly confidential. You will not be identified by name in any reports resulting from the completed study. All documents will be identified only by a code number and kept in a locked filing cabinet and a password protected computer file. The data that is collected in this research project will be kept for future use regarding public opinions and beliefs about tourism and forestry conflicts. Please do not write your name anywhere on the questionnaire. Individual responses will not be made available to anyone outside the research team.
CONTACT INFORMATION If you have any questions about the research, or would like further information, please do not hesitate to contact Mr. Hilsendager at the phone number listed at the top of this letter. If you have any concerns about your rights or treatment as a research subject, you may contact: UBC Office of Research Services Research Subject Information Line
CONSENT Participation in this study is completely voluntary, and you may refuse to participate at any time without penalty. You may skip any question if you not feel comfortable answering it, though we encourage you to complete all questions if possible. By completing and returning this survey, you grant your consent to participate in this study. Thankyou for your help with this important study. Sincerely, Kyle Hilsendager
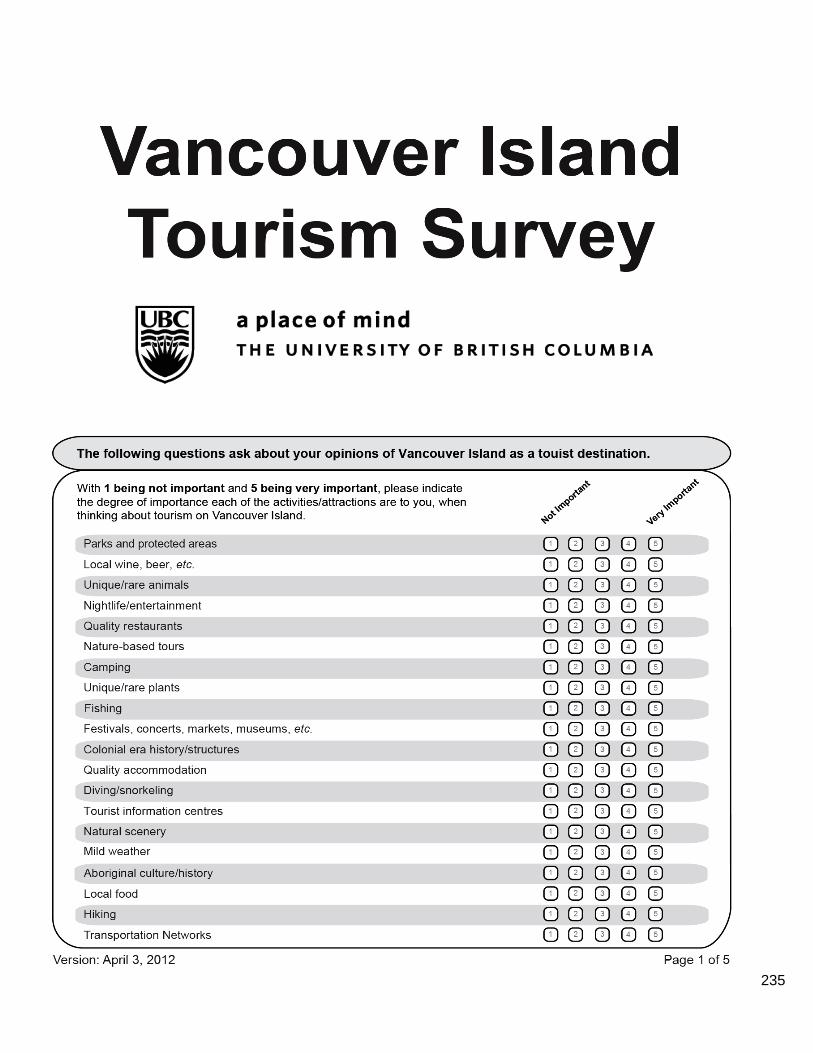
235
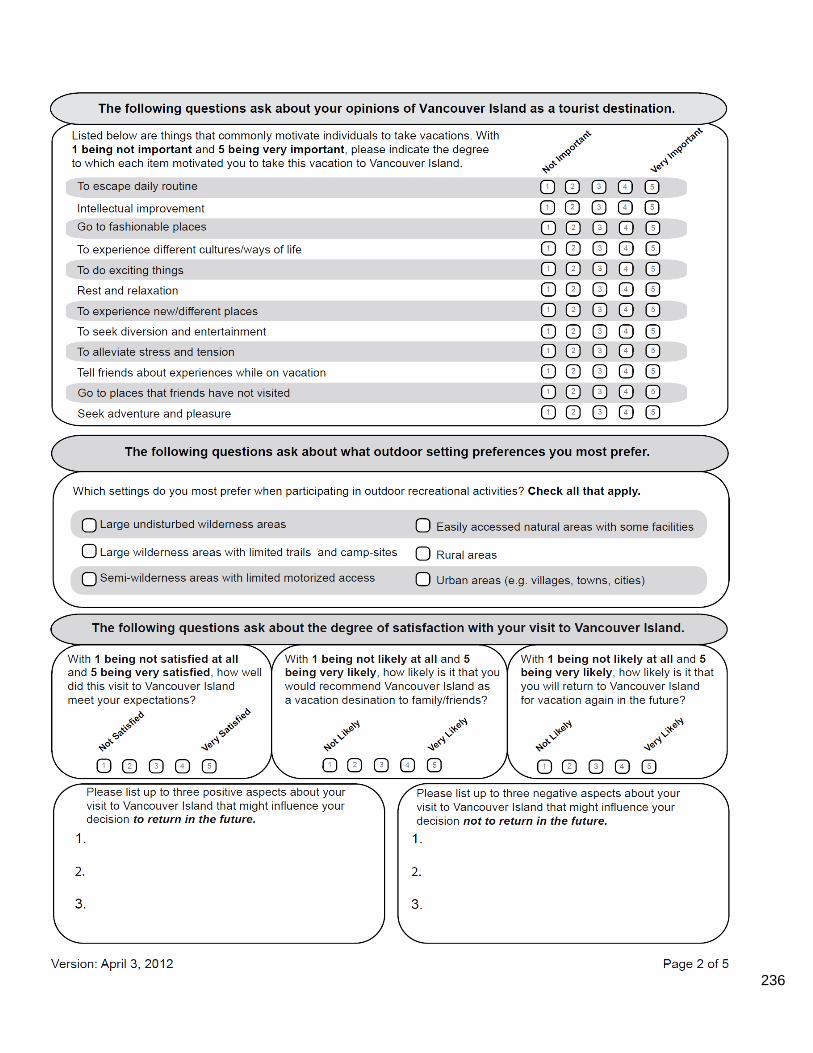
236
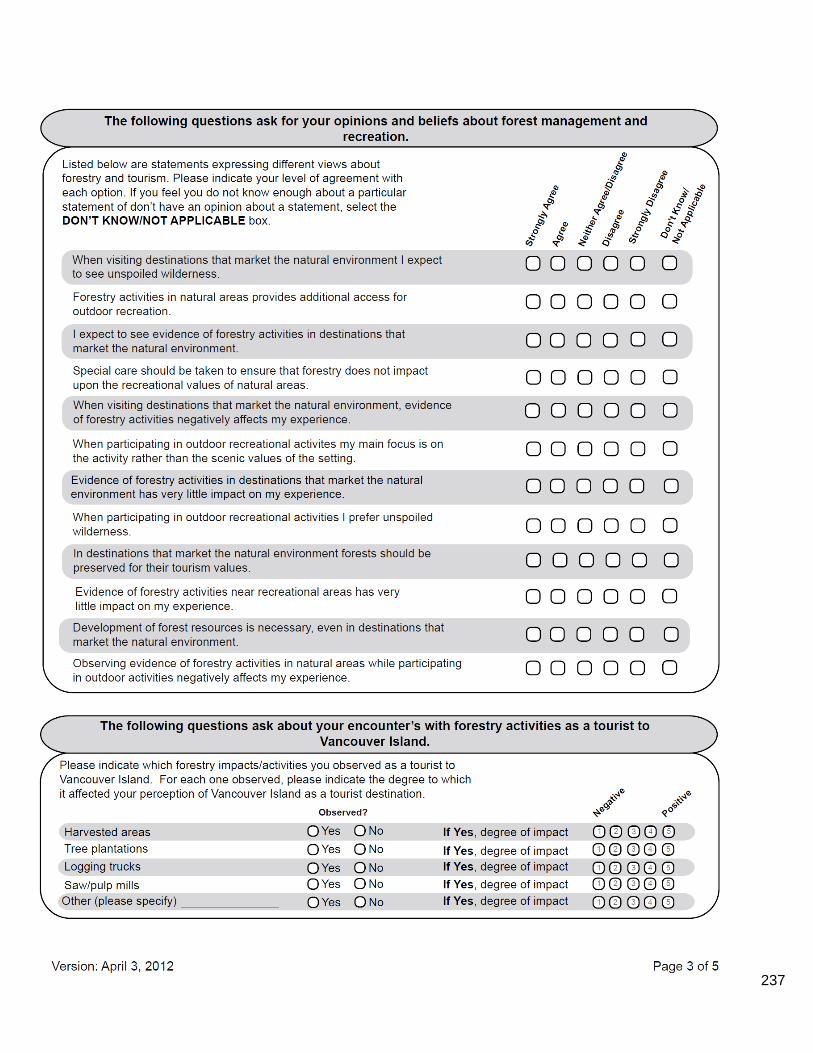
237
238
239

240
Appendix B
Tasmania Questionnaire &
Consent Information
241
TASMANIA TOURISM SURVEY
CONSENT INFORMATION
Kyle Hilsendager Howard Harshaw PhD Candidate Research Associate Forest Resources Management Forest Resources Management Faculty of Forestry Faculty of Forestry University of British Columbia University of British Columbia Email: Email:
Greetings, We are asking for your input in an important study about tourism in Tasmania, Australia
PURPOSE The purpose of this research is to examine the conflict that exists between forestry and tourism in regions that market the natural environment and activities that take place in these settings. The results of this survey will help provide insight into the ways that different tourist user groups are affected by the impacts of forest management practices. This particular survey collects information about:
Opinions about Tasmania as a tourist destination.
Encounters with forestry impacts while visiting Tasmania.
Opinions regarding potential forest management options in Tasmania.
Attitudes about the environment.
Demographic information. This project will help contribute to our understanding about the conflict that may exist between forestry and tourism. Overall results will be shared publicly and may be used to guide discussions and develop policies to address issues regarding forestry and tourism. Upon completion of this study, results of this research will be made available at:
www.hd-research.ca/tourism

242
STUDY PROCEDURES
This survey will take approximately 10-15 minutes to complete. Please take your time as you consider your answers to the questions. Remember there are no right or wrong answers. If not enough space is provided for your answer, feel free to use the extra space provided at the end of the questionnaire. Please, return the completed survey to the research assistant that originally gave it to you.
CONFIDENTIALITY Your identity will be kept strictly confidential. You will not be identified by name in any reports resulting from the completed study. All documents will be identified only by a code number and kept in a locked filing cabinet and a password protected computer file. The data that is collected in this research project will be kept for future use regarding public opinions and beliefs about tourism and forestry conflicts. Please do not write your name anywhere on the questionnaire. Individual responses will not be made available to anyone outside the research team.
CONTACT INFORMATION If you have any questions about the research, or would like further information, please do not hesitate to contact Mr. Hilsendager at the phone number listed at the top of this letter. If you have any concerns about your rights or treatment as a research subject, you may contact: UBC Office of Research Services Research Subject Information Line
CONSENT Participation in this study is completely voluntary, and you may refuse to participate at any time without penalty. You may skip any question if you not feel comfortable answering it, though we encourage you to complete all questions if possible. By completing and returning this survey, you grant your consent to participate in this study. Thankyou for your help with this important study. Sincerely, Kyle Hilsendager
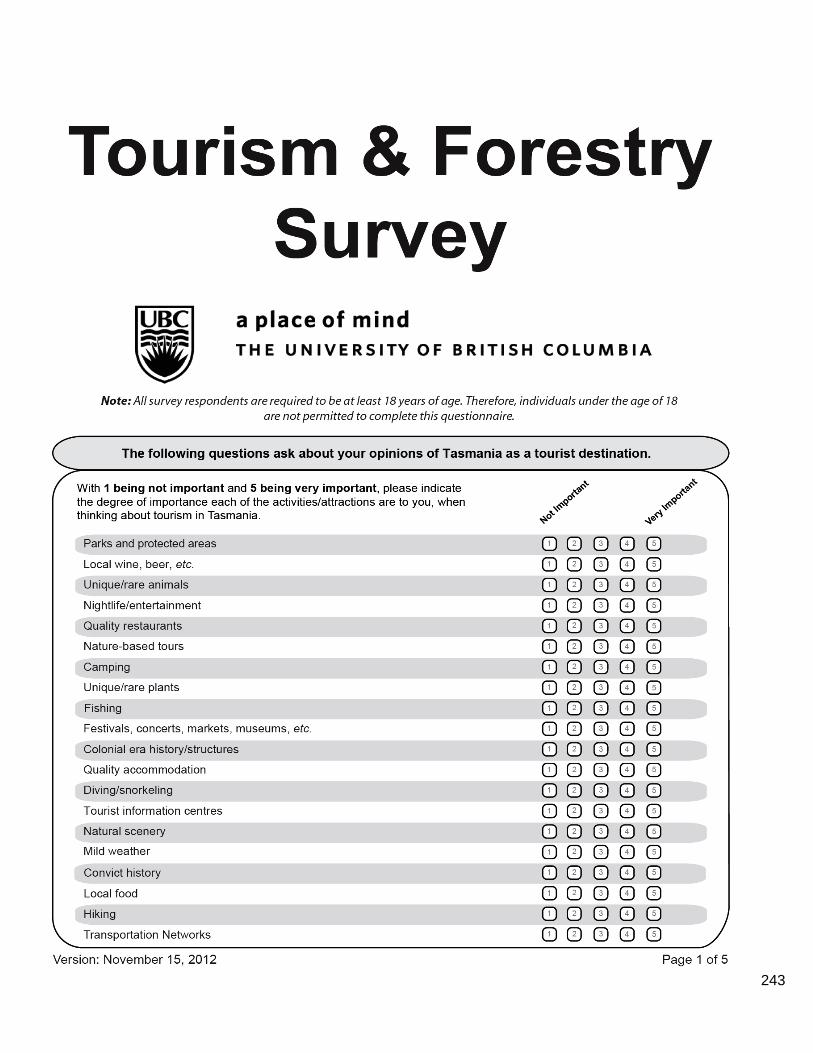
243
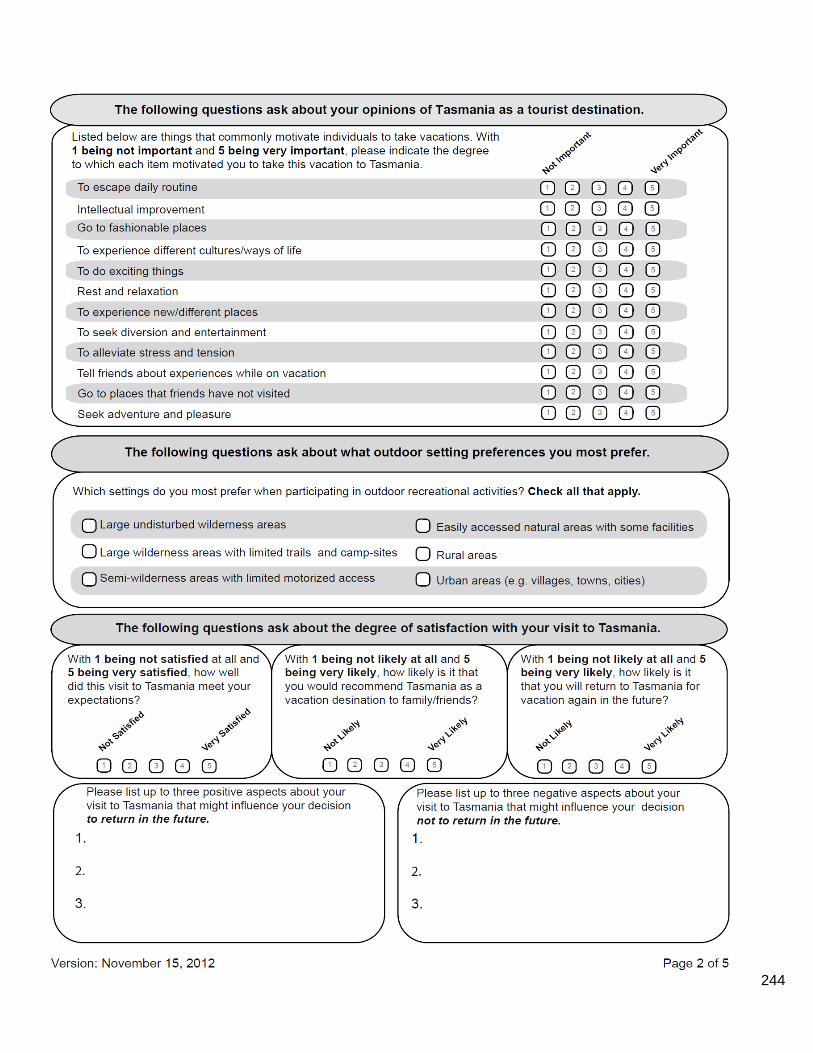
244
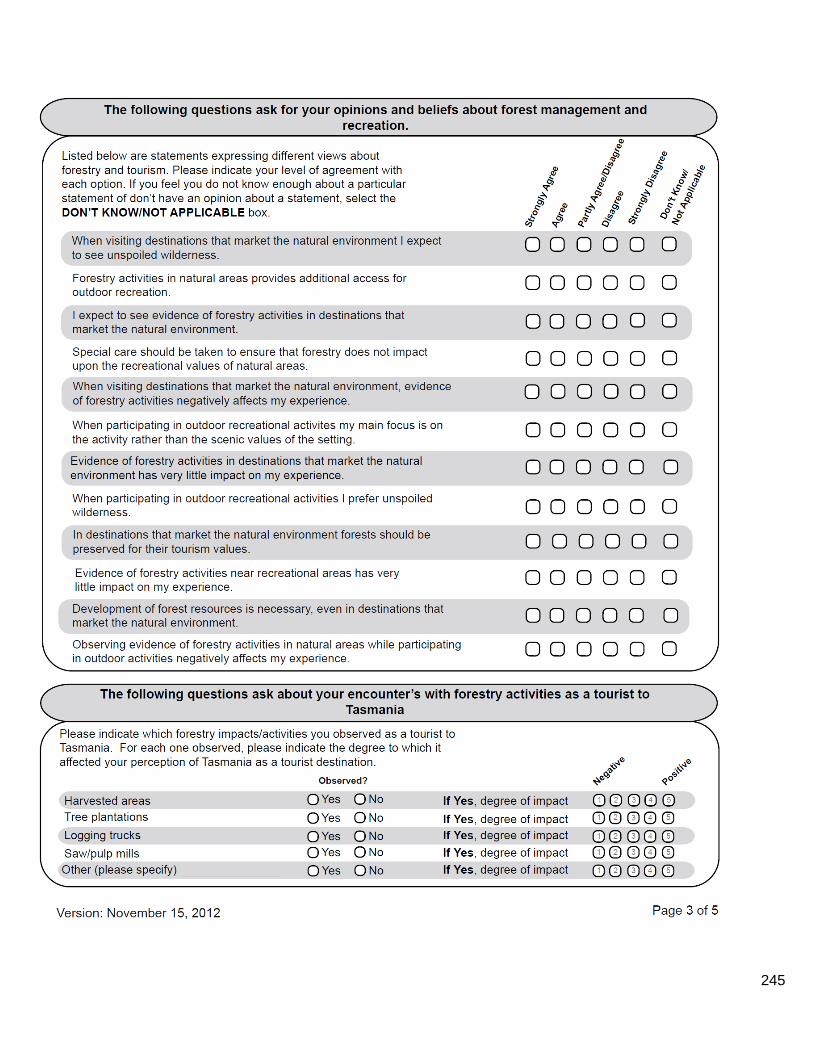
245
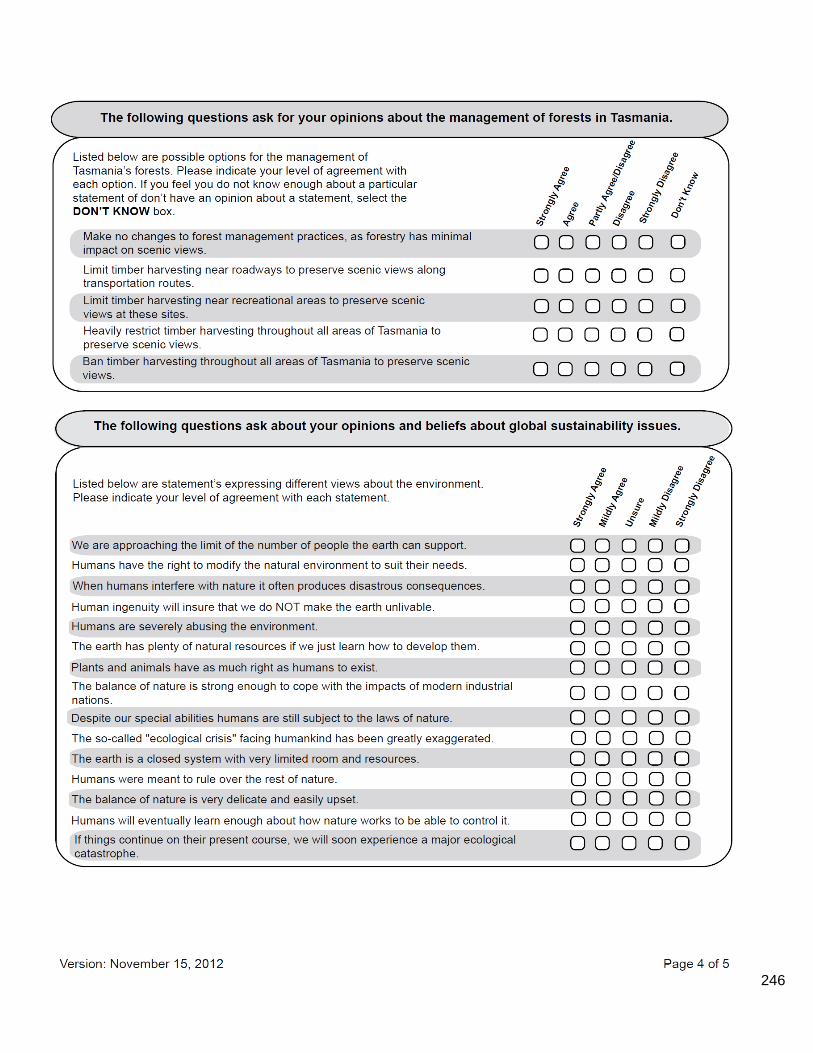
246
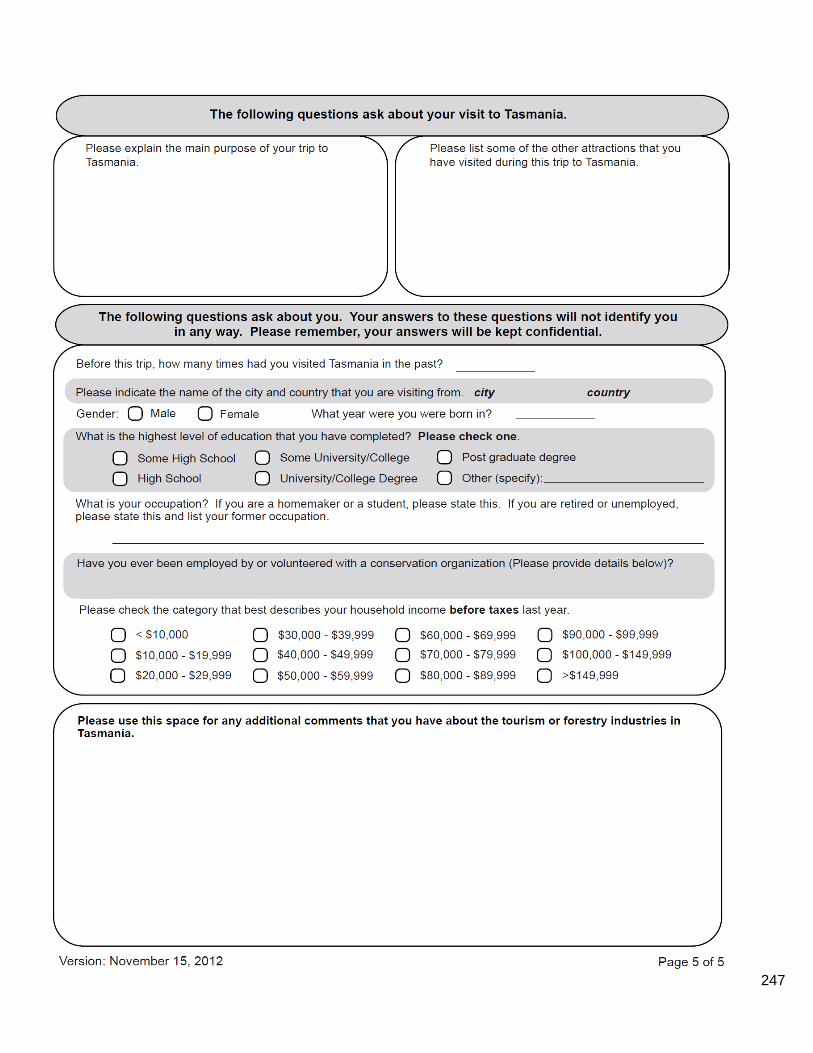
247

248
Appendix C
Interview Contact Letter,
Consent Form & Script
249
[Date]
[Address of Potential Interviewee]
[Address]
[Address]
[Address]
Re: Environmental and Resource Use Conflicts in British Columbia and Tasmania
Dear [Name]:
Due to your involvement in the tourism [forestry] industry in Vancouver Island
[Tasmania], I am writing to invite you to participate in a research project that is
being conducted through the University of British Columbia (UBC), Vancouver.
This project seeks to improve our understanding about the conflicts that can
arise between forestry and tourism, as well as develop strategies that can be
used to help mediate these types of conflicts.
In accomplishing these objectives, we seek to understand the impact that
forestry may have on the tourism image of regions that market the natural
environment and outdoor activities. In addition to this, we intend to develop
strategies that can be used to help reduce the likelihood of tourism values being
compromised by other forest interests. It is expected that the results of this study
will provide a number of benefits to both governments and business in regions
where tourism and forestry conflict.
We are hoping that you will agree to a confidential interview which will be
conducted by Mr. Hilsendager. The interview is expected to last approximately
30 minutes – 1 hour. This interview would take place at the time and place of
your convenience if you would like to participate in this research.
A consent form for your participation is enclosed for your review. Mr. Hilsendager
will be contacting you by phone to see if you would like to participate in this
research. If you would like to participate a time and location will be arranged
during this phone call. You may also ask any questions that you may have
regarding this project at this time. Questions may also be directed to Principal
250
Investigator, Howard Harshaw. Please see the end of this letter, where all
relevant contact information is included.
At your scheduled interview time, the enclosed consent form will be reviewed
again with Mr. Hilsendager, at which point you may ask any further questions
that you may have. If you would still like to be interviewed, you will be asked to
sign the consent form at that time and retain a copy for yourself.
Through your participation you will have contributed toward greater
understanding of the conflicts that can originate between the forest and tourism
industries.
We look forward to hearing from you.
Best Regards,
Mr. Kyle Hilsendager Dr. Howard Harshaw
Title: PhD Candidate
Address: Department of Forest
Resources Management, Faculty of
Forestry
The University of British Columbia
2nd Floor, Forest Sciences Centre
#2045 - 2424 Main Mall
Vancouver, BC V6T 1Z4.
Phone:
E-mail:
Title: Research Associate
Address: Department of Forest
Resources Management, Faculty
of Forestry
The University of British Columbia
2nd Floor, Forest Sciences Centre
#2045 - 2424 Main Mall
Vancouver, BC V6T 1Z4.
Phone:
E-mail:
251
Consent Form
for participation in the study:
Environmental and Resource Use Conflicts in
British Columbia and Tasmania.
1. Principal Investigator
Dr. Howard Harshaw
Research Associate
Department of Forest Resources Management, Faculty of Forestry
Phone Number:
E-mail Address:
2. Co-Investigator
Name: Kyle Hilsendager
Ph.D. Candidate
Department of Forest Resources Management, Faculty of Forestry
Phone Number:
Email Address:
This research is a requirement of Kyle Hilsendager’s Ph.D. degree in the Faculty
of Forestry, Department of Forest Resource Management at UBC. The final
outcome will be the production of a Ph.D. thesis, which will become available in
the public domain. The identity of all participants will remain strictly confidential.
Data or expressions made public will not be traceable to the original provider.
3. Sponsor
The investigators have not received a grant or contract to conduct this study.
4. Purpose
In many places the forest industry is the target of criticism from environmental
groups, politicians and the media. This opposition generally relates to a range of
environmental issues that are associated with the industry such as the harvesting
of old growth or ecologically significant forests, development of logging roads,
potential threats posed to native species and sustainability of harvesting
252
techniques. Not only do public perception issues have the potential to
negatively affect the forest industry, but it could also have negative effects for
other sectors that profit from forested landscapes, such as tourism.
This is particularly true for regions that promote natural landscapes and outdoor
activities to attract business to local communities. Because these places use the
natural environment to attract visitors, it is likely that they are particularly
vulnerable to the negative perceptions that are often associated with forestry
impacts. This raises the question: how can these two industries be managed to
reduce the impact that forestry activities can have on tourism image?
5. Objectives
The main objectives of this study are to understand the tensions that often exist
between forestry and tourism, and to uncover measures that can be taken to
alleviate these types of conflicts.
In accomplishing this objective, we seek to understand the root causes of
conflicts that exist between tourism and forestry, as well as possible
management policies and techniques that could be used to alleviate such
conflicts.
6. Interview Participation and Conditions
The research team has determined interviews to be the most effective and
reliable means to gather the required information. Therefore, you have been
invited to participate, due to your involvement in Vancouver Island’s
[Tasmania’s] forestry [tourism] industry.
If you agree to participate, you may contact Kyle Hilsendager (contact details
above) to arrange an interview time and location of your choice.
7. Interview Procedures
It is expected that the interview will last between 30 minutes – 1 hour. The
interview will include semi structured, open-ended questions, which means that
you will have liberty to respond unconstrained. You have the right to refuse any
question asked without providing a reason or stop the interview at any point
without stating grounds.
Once interviews with all participants are completed, Mr. Hilsendager will work at
the UBC campus in Vancouver to analyze the material and develop an initial
report on findings.
253
8. Audio Recordings
All interviews will be audio-recorded. These will later be translated into computer
text documents which will be used for data analysis. All recordings will be
destroyed upon completion of the text documentation.
9. Statement of Confidentiality
Interview transcripts and digital recordings will be saved on a hard disk drive,
which is protected by firewalls and passwords and saved in a locked room, with
Dr. Harshaw and Mr. Hilsendager having sole access to the data. No data that
identifies individuals be available to persons or agencies outside of the
University.
All interviews will be identified by code numbers. In none of the reports or articles
of the completed study made publicly available, will your identification be
traceable.
10. Potential Benefits
The outcome of the research may not provide any direct, measurable benefit to
you. However, through this research you will contribute greater external, and
perhaps internal, understanding of this resource management conflict. This
would be of further benefit to other parties facing similar challenges.
11. Contact for information about the study
If you have any questions or desire further information with respect to this study,
you may contact Dr. Harshaw or Mr. Hilsendager by phone or email at the
details provided above.
12. Contact for concerns about the rights of research subjects
If you have any concerns about your treatment or rights as a research subject,
you may contact the Research Subject Information Line in the UBC Office of
Research Services at 604-822-8598 or if long distance e-mail to [email protected].
13. Study Results
The results of this study will be a completed Ph.D. thesis and journal articles in
scientific publications. Overall results will be shared publicly and may be used to
guide discussions and develop policies to address issues regarding forestry and
tourism. Upon completion of this study, results of this research will be made
available at:
www.hd-research.ca/tourism

254
Your signature below indicates that you have received a copy of this consent
form for your own records.
Your signature indicates that you consent to participate in this study.
____________________________________________________
Subject Signature Date
____________________________________________________
Printed Name of the Subject signing above
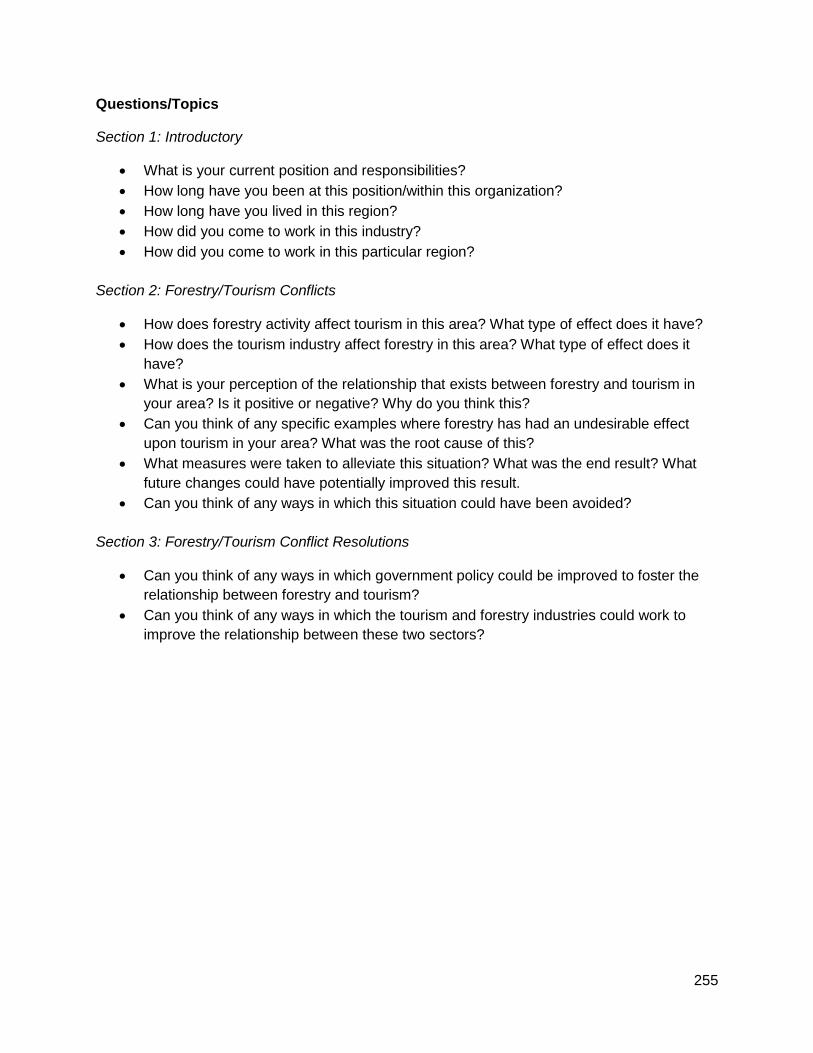
255
Questions/Topics
Section 1: Introductory
What is your current position and responsibilities?
How long have you been at this position/within this organization?
How long have you lived in this region?
How did you come to work in this industry?
How did you come to work in this particular region?
Section 2: Forestry/Tourism Conflicts
How does forestry activity affect tourism in this area? What type of effect does it have?
How does the tourism industry affect forestry in this area? What type of effect does it
have?
What is your perception of the relationship that exists between forestry and tourism in
your area? Is it positive or negative? Why do you think this?
Can you think of any specific examples where forestry has had an undesirable effect
upon tourism in your area? What was the root cause of this?
What measures were taken to alleviate this situation? What was the end result? What
future changes could have potentially improved this result.
Can you think of any ways in which this situation could have been avoided?
Section 3: Forestry/Tourism Conflict Resolutions
Can you think of any ways in which government policy could be improved to foster the
relationship between forestry and tourism?
Can you think of any ways in which the tourism and forestry industries could work to
improve the relationship between these two sectors?