Performance Report P3 2020 January – October 2020 - EFSA
10
Performance Report P3 2020 January – October 2020 Management Board 17 December 2020
-
Upload
khangminh22 -
Category
Documents
-
view
1 -
download
0
Transcript of Performance Report P3 2020 January – October 2020 - EFSA

Performance Report P3 2020
January – October 2020
Management Board
17 December 2020

SARS-COV-2 outbreak & EFSA:Priority setting for 2020
High priorities(feasibility shall be ensured)
Low priorities(discontinuation or postponement)
✓ Transparency Regulation - all measures includingpreparatory work for ad hoc studies and sustainabilitymeasures (*) - together with organisation and processesminimum adjustments
✓ Science and communication processes in general withfocus on core activities and legal deadlines
✓ People management
✓ Corporate planning and reporting minimum set
✓ Infrastructure/enabling services business continuity
✓ Strategy implementation plan and newperformance framework integration inProgramming Document 2021-2023
✓ Full organisation and processes redesign
✓ Identified scientific activities
✓ Identified communication and engagementactivities
(*) Ad hoc studies and sustainability measures may be postponed in case EFSA budget is reduced in the MFF 2027. Scenarios are considering EFSA’s budget envelope for the coming years as currently forecasted
ASSESSMENT OF THE IMPACT OF THE SARS-CoV-2 PANDEMIC TO THE EFSA WORK PROGRAMME 2020
2
P2 2020 Performance Highlights
# of KPIs
❖ SO2 activities remained stable P-on-P
❖ MS cooperation activities affected by SARS-CoV-2 implications
❖ Cooperation with international parties less impacted
❖ ART Programme registering shortage of resources/delays, focus on safeguarding mandatory deliverables
❖ Budgetary indexes under control
❖ Occupancy rate close to target
❖ Development activities following P1&P2 trends, with less output closed than expected
❖ Scientific production behind initial targets❖ Timeliness of adoption registered a slight increase P-on-P
but, especially for Regulated Products, still below the targets set ❖ Communication activities registering positive results
3

SO1 Prioritise public and stakeholder engagement in the process of scientific assessment
General Risk Assessment
l l l 163 scientific questions closed, below the target of 202
l l l Timeliness at 97.8%, close to target (100%) and in line with P2 (97.3%)
Regulated Products
l l l 342 scientific questions closed, in line with target (353)
l l l Timeliness stands at 76.5%, below target (90%) but in line with P2 (76%)
l l l Bulk evaluation for MRL Art. 12 reduced by 18 vs a forecast of 22
Engagement l l lRegistration on new Stakeholders on track. Total number of stakeholdersdecreased due to Brexit implications
Communication of findings
l l lTimeliness of publication in EJ (90%) higher than target and better thanprevious two periods
l l lAccess, downloads, and number of citations of EFSA’s scientific outputs in theEFSA Journal above their quarterly targets
Visibilityl l l Media perception of EFSA in neutral area
l l l Social Media presence remains very high
Performance highlightsP1
P2
P3
€ 38.9M
216 FTEs
Inputs
*
* For FTEs, the figure reported refers to the plan and not to the actual
4

Impact of SARS-CoV-2 on scientific production
Evolution of questions closed
Timeliness of adoption (all SOs) stable P-on-P and not far away from historical trends.
Forecast for year-end is to remain on the same levels (between 82% and 86%)
Number of questions closed (all SOs) remains below the target (-10% in P3) and the yearly target of 780 is
unlikely to be met, as already forecasted. Estimated number of questions closed by year end:
between 690 and 730 questions
Evolution of Timeliness
5
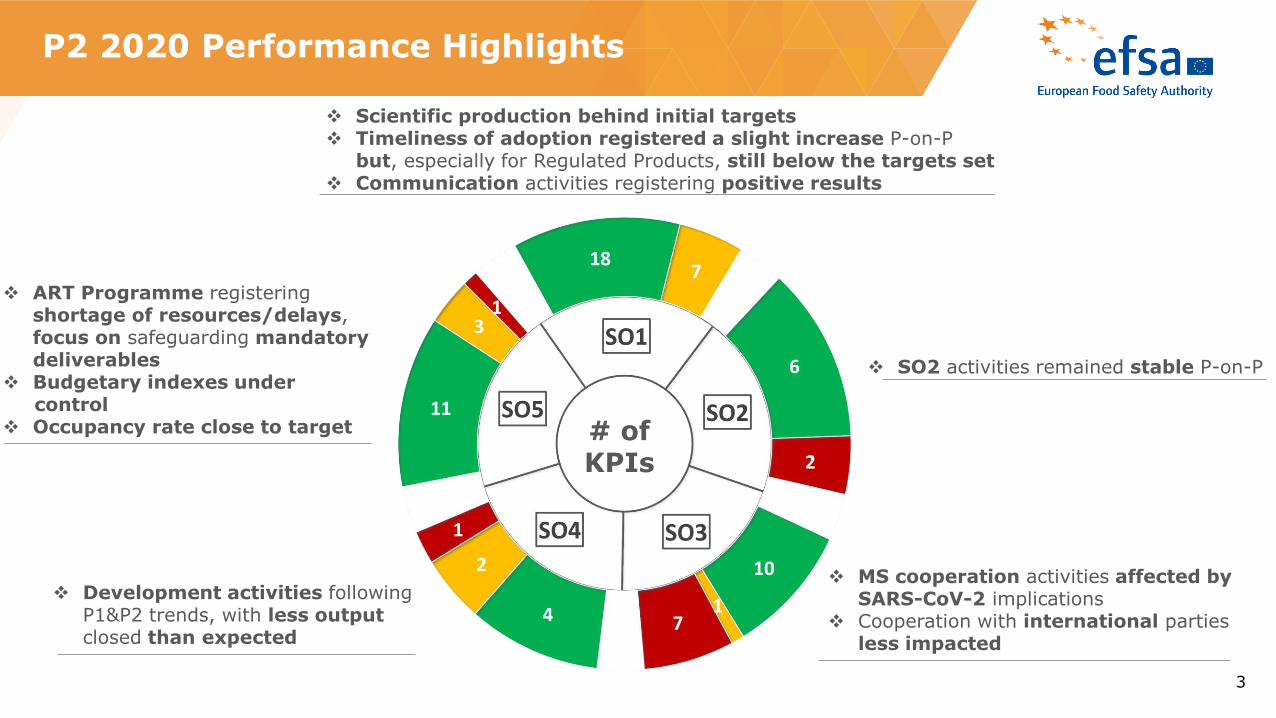
Data collection & reporting
l l lNumber of new data collections implemented below the foreseen target(5 vs 7)
l l l12 questions closed, above the forecast of 9, no new questions adopted inP3
l l l Timeliness of technical reports adopted on track (100%)
Wider data coverage
l l l 1102 active registered users in Scientific DWH (target 645)
l l l 275 uploads to EFSA’s open repository (target 247)
Improved data access l l l Production of dashboards above target (22 vs 20)
SO2 Widen EFSA’s evidence base and optimiseaccess to its data
Performance highlights
P1
P2
P3
Inputs
€ 4.2M
24 FTEs
*
* For FTEs, the figure reported refers to the plan and not to the actual
6

SO3 Build the EU’s scientific assessment capacity and knowledge community
Efficiency at EU & international
levell l l
25 Member States (plus 3 Pre-Accession countries) shared RA informationwith EFSA
Scientific cooperation
l l l# of cooperation activities carried out with Member States below theforecast (37 vs 58) due to the effect of SARS-CoV-2
l l lPerformance of RA agenda take-up index in the red area, but metricsexpected to improve in the closing months of the year
l l l45 international cooperation activities carried out, slightly higher thantarget
Scientific capacity building
l l lOutreach of G&P supporting publications surpassing the targets set interms of access to publications, downloads, and citations
l l l6 questions closed, slightly below the target (7). Timeliness on track(100%)
Performance highlights
P1
P2
P3
Inputs
€ 5.7M
31 FTEs
*
* For FTEs, the figure reported refers to the plan and not to the actual
7

SO4 Prepare for future risk assessment challenges
Preparedness& Response
l l l 32 questions closed in P1, less than forecasted (47)
l l lTimeliness of adoption at 81.2%, below the target of 100% but 4 p.p.better than P2
Harmonisation & Accessibility of methods/tools
l l lOverall positive performance reported by RAMPRO Programme, albeitsmall deteriorations p-on-p with regards to FTEs availability
l l lAccess to EFSA’s guidance documents via EFSA Journal on track,recovering from the moderate deviation in P1
Performance highlights
P1
P2
P3
Inputs
€ 8.7M
41 FTEs
*
* For FTEs, the figure reported refers to the plan and not to the actual
8

SO5 Create an environment and culture that reflects EFSA’s values
Sound operational
performance and compliance
l l lFinancial index on commitments slightly below target (89% vs 92%).Annual target of 100% expected to be reached
l l l
Payments below the target for differentiated credits, whilst non-differentiated credits are close to target (67% vs 69%). For the non-differentiated credits, a small deviation is expected by year end
l l lComposite indexes on performance of KPIs showing a decrease Y-on-Y,likely due to the effects (direct and indirect) of SARS-CoV-2
Efficiency l l l Service delivery index surpassing the target (86.3% vs 80%)L
Enabling working environment
l l lDue to SARS-CoV-2 measures, % of tele-meetings rose to 90.2% (target of25%, P2 result of 86.3%)
l l l 113 social collaboration platforms active in P3
People & culturel l l Occupancy rate on track at 91.7% (target of 92%)
l l l Hiring for TR-related posts is on track
178 implementation l l l
ART Programme with moderate deviations (shortage of resources and delays). Focus on ensuring delivery of legal requirements
Performance highlightsP1
P2
P3
Inputs
€ 32.3M
190 FTEs
*
* For FTEs, the figure reported refers to the plan and not to the actual
9

MANAGEMENT OF RESOURCES | Budget execution & transfers October 2020
T1
€47.8M*
€ 0.7 M internal transfers between the
chapters
€12.7M*
€ 1.2M internal transfers between the
chapters
T2
T3
€42.5M*
€ 0.6M internal transfers between the
chapters
BUDGET TRANSFERS(Nov. 2020)
INFRASTRUCTURE
PERSONNEL
OPERATIONS
SCIENTIFIC COOPERATION 63% (-23%)
86% (-7%)
87% (-7%)
BUDGET EXECUTION
85% (-12%)
59% (-7%)
51% (-10%)
65% (-3%)
COMMITMENTS EXECUTION RATE (vs
MONTHLY PLAN)
89% (-3%)
91% (1%) 81% (0%)
PAYMENTS EXECUTION RATE (vs MONTHLY
PLAN)
• amended budget (Commitments -> initial:108.0M, current. after Aug 2020 budget amendment: 103.0MPayments -> initial:103.9M, current. after Aug 2020 budget amendment: 98.9M)
€0.03M
10