PERFORMANCE OF YEAR 3,5,7 AND 9 STUDENTS IN WA ...
86
PERFORMANCE OF YEAR 3, 5, 7 AND 9 STUDENTS IN WA PUBLIC SCHOOLS 2016 National Assessment Program Literacy and Numeracy
-
Upload
khangminh22 -
Category
Documents
-
view
0 -
download
0
Transcript of PERFORMANCE OF YEAR 3,5,7 AND 9 STUDENTS IN WA ...

PERFORMANCE OF YEAR 3,5,7 AND 9
STUDENTS IN WA PUBLIC SCHOOLS
2016 National Assessment Program Literacy and Numeracy
i© Department of Education, Western Australia, 2017
Performance of Year 3, 5, 7 and 9 students in Western Australian public schools 2016 National Assessment Program – Literacy and Numeracy
Performance of Year 3, 5, 7 and 9 students in Western Australian public schools 2016 National Assessment Program – Literacy and Numeracy ISBN 978-0-7307-4609-6 SCIS NO. 1837847
© Department of Education
Reproduction of this work in whole or part for educational purposes, within an educational institution and on condition that it is not offered for sale, is permitted by the Department of Education.
This material is available on request in appropriate alternative formats.
Department of Education 151 Royal Street East Perth WA 6004
Further information please contact:
Evaluation and Accountability Directorate T: +61 8 9264 5127 W: education.wa.edu.au/education/accountability
ii© Department of Education, Western Australia, 2017
Contents
List of graphs and tables iii
Introduction 1
Notes and definitions 3
Year 3 5
Year 5 15
Year 7 25
Year 9 35
Achievement of Western Australian public school students in Reading, Language Conventions and Numeracy 2008–2016 comparison 45
Cohort gains 75
iii© Department of Education, Western Australia, 2017
GraphsFigure 1.1: Achievement of Year 3 students in all subject areas 2016 5
Figure 1.2: Achievement of Year 3 students in all subject areas by sex 2016 6
Figure 1.3: Achievement of Year 3 students in all subject areas by Indigenous status 2016 7
Figure 1.4: Achievement of Year 3 students in all subject areas by LBOTE status 2016 8
Figure 1.5: Percentage of Year 3 students at or above the national minimum standard in all subject areas by geolocation 2016 10
Figure 1.6: Percentage of Year 3 students at or above the national minimum standard in all subject areas by geolocation and Indigenous status 2016 13
Figure 2.1: Achievement of Year 5 students in all subject areas 2016 15
Figure 2.2: Achievement of Year 5 students in all subject areas by sex 2016 16
Figure 2.3: Achievement of Year 5 students in all subject areas by Indigenous status 2016 17
Figure 2.4: Achievement of Year 5 students in all subject areas by LBOTE status 2016 18
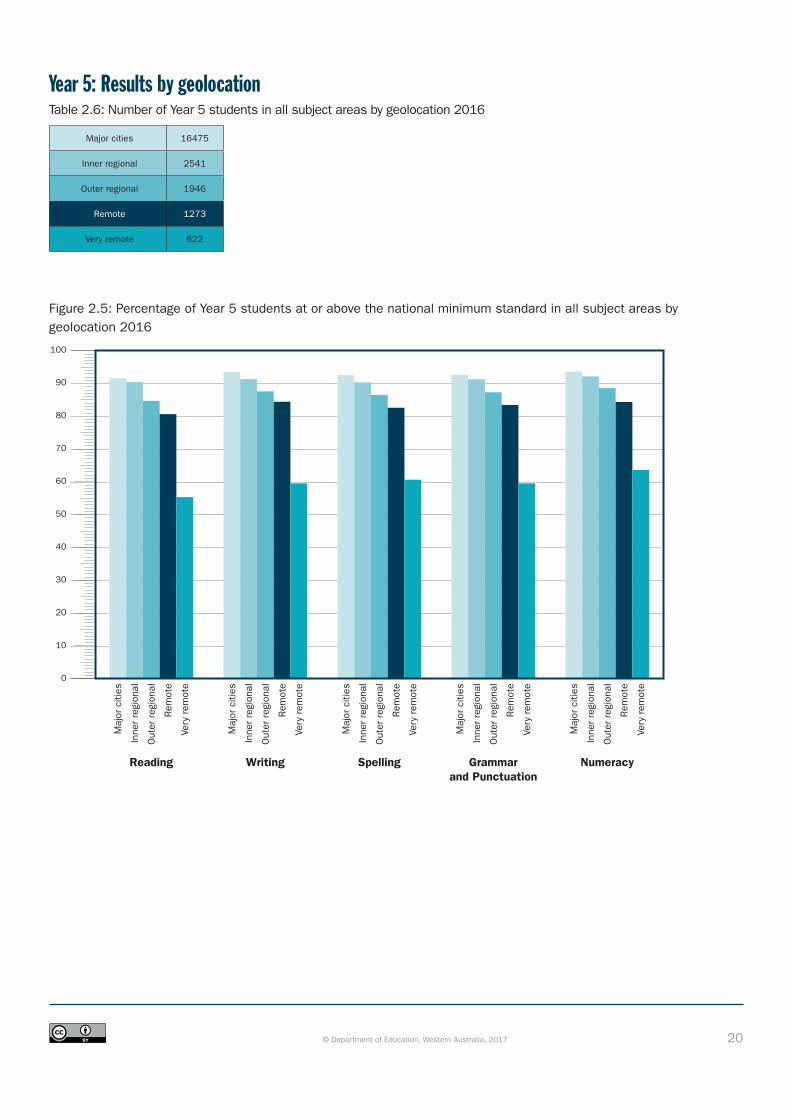
Figure 2.5: Percentage of Year 5 students at or above the national minimum standard in all subject areas by geolocation 2016 20
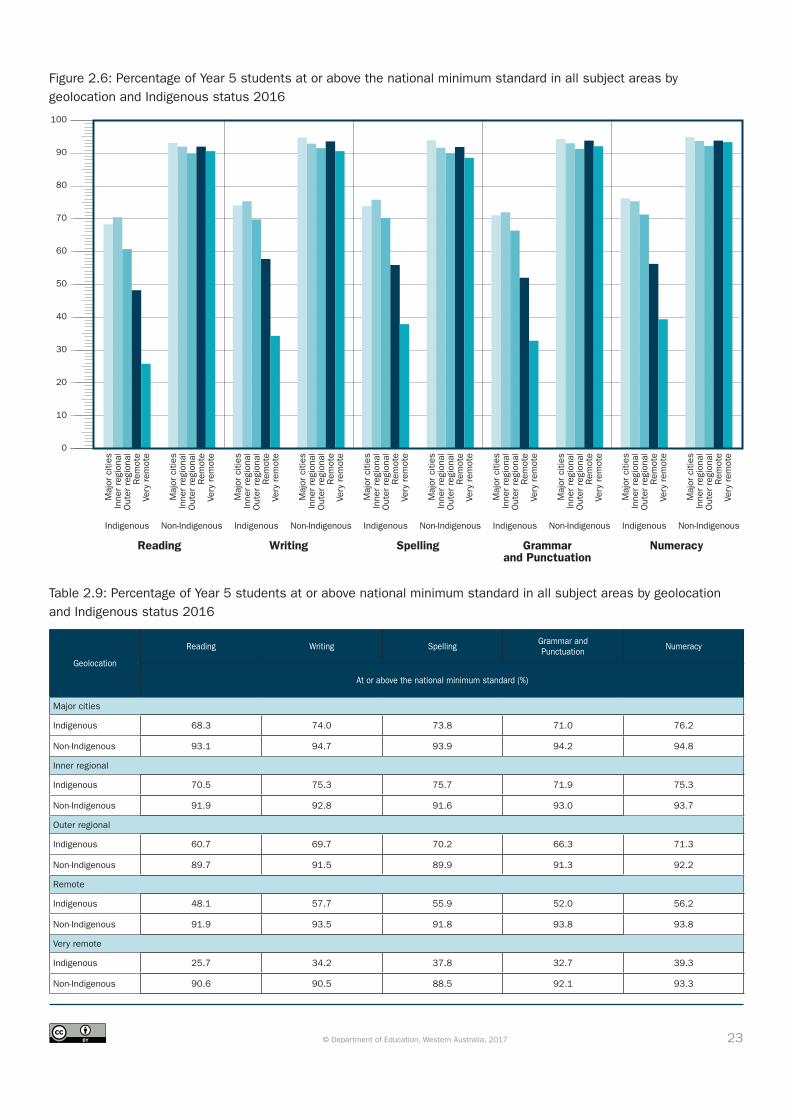
Figure 2.6: Percentage of Year 5 students at or above the national minimum standard in all subject areas by geolocation and Indigenous status 2016 23
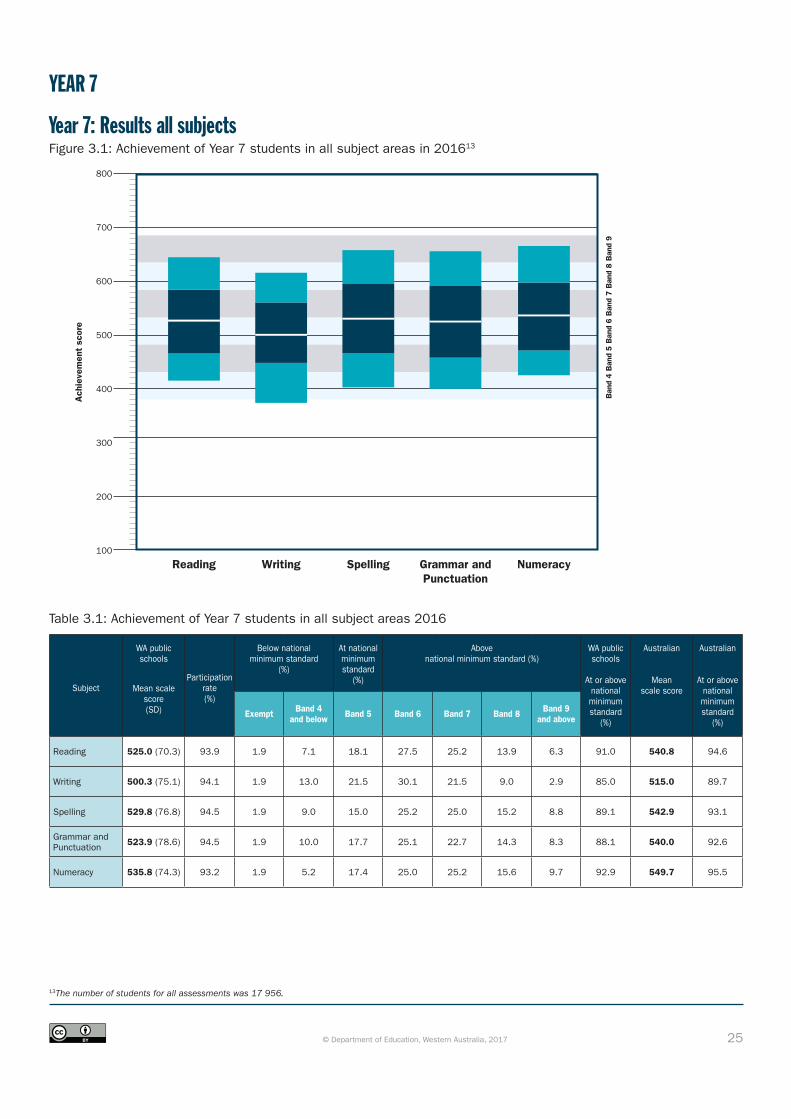
Figure 3.1: Achievement of Year 7 students in all subject areas 2016 25
Figure 3.2: Achievement of Year 7 students in all subject areas by sex 2016 26
Figure 3.3: Achievement of Year 7 students in all subject areas by Indigenous status 2016 27
Figure 3.4: Achievement of Year 7 students in all subject areas by LBOTE status 2016 28
Figure 3.5: Percentage of Year 7 students at or above the national minimum standard in all subject areas by geolocation 2016 30
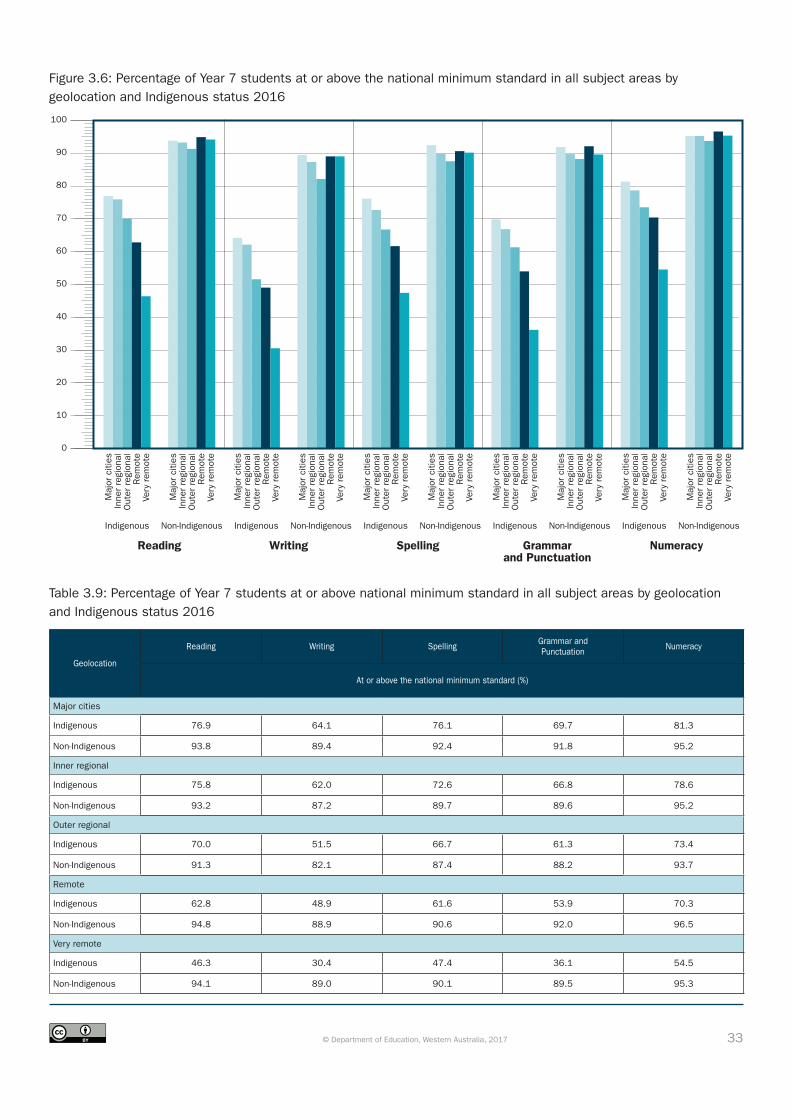
Figure 3.6: Percentage of Year 7 students at or above the national minimum standard in all subject areas by geolocation and Indigenous status 2016 33
Figure 4.1: Achievement of Year 9 students in all subject areas 2016 35
Figure 4.2: Achievement of Year 9 students in all subject areas by sex 2016 36
Figure 4.3: Achievement of Year 9 students in all subject areas by Indigenous status 2016 37
Figure 4.4: Achievement of Year 9 students in all subject areas by LBOTE status 2016 38
Figure 4.5: Percentage of Year 9 students at or above the national minimum standard in all subject areas by geolocation 2016 40
Figure 4.6: Percentage of Year 9 students at or above the national minimum standard in all subject areas by geolocation and Indigenous status 2016 43
Figure 5.1: Mean Reading scores 2008–2016 46
Figure 5.2: Mean Writing scores 2011–2016 47
Figure 5.3: Mean Spelling scores 2008–2016 48
Figure 5.4: Mean Grammar and Punctuation scores 2008–2016 49
Figure 5.5: Mean Numeracy scores 2008–2016 50
Figure 6.1: Year 3 mean Reading scores by subgroup 2008–2016 51
Figure 6.2: Year 3 mean Writing Scores by subgroup 2011–2016 52
Figure 6.3: Year 3 mean Spelling scores by subgroup 2008–2016 53
Figure 6.4: Year 3 mean Grammar and Punctuation scores by subgroup 2008–2016 54
Figure 6.5: Year 3 mean Numeracy scores by subgroup 2008–2016 55
iv© Department of Education, Western Australia, 2017
Figure 7.1: Year 5 mean Reading scores by subgroup 2008–2016 56
Figure 7.2: Year 5 mean Writing scores by subgroup 2011–2016 57
Figure 7.3: Year 5 mean Spelling scores by subgroup 2008–2016 58
Figure 7.4: Year 5 mean Grammar and Punctuation scores by subgroup 2008–2016 59
Figure 7.5: Year 5 mean Numeracy scores by subgroup 2008–2016 60
Figure 8.1: Year 7 mean Reading scores by subgroup 2008–2016 61
Figure 8.2: Year 7 mean Writing scores by subgroup 2011–2016 62
Figure 8.3: Year 7 mean Spelling scores by subgroup 2008–2016 63
Figure 8.4: Year 7 mean Grammar and Punctuation scores by subgroup 2008–2016 64
Figure 8.5: Year 7 mean Numeracy scores by subgroup 2008–2016 65
Figure 9.1: Year 9 mean Reading scores by subgroup 2008–2016 66
Figure 9.2: Year 9 mean Writing scores by subgroup 2011–2016 67
Figure 9.3: Year 9 mean Spelling scores by subgroup 2008–2016 68
Figure 9.4: Year 9 mean Grammar and Punctuation scores by subgroup 2008–2016 69
Figure 9.5: Year 9 mean Numeracy scores by subgroup 2008–2016 70
Graphs (continued)
v© Department of Education, Western Australia, 2017
TablesTable 1.1: Achievement of Year 3 students in all subject areas 2016 5
Table 1.2: Achievement of Year 3 students in all subject areas by sex 2016 6
Table 1.3: Achievement of Year 3 students in all subject areas by Indigenous status 2016 7
Table 1.4: Achievement of Year 3 students in all subject areas by LBOTE status 2016 8
Table 1.5: Number and percentage of Year 3 students by participation in all subject areas by subgroup 2016 9
Table 1.6: Number of Year 3 students in all subject areas by geolocation 2016 10
Table 1.7: Achievement of Year 3 students in all subject areas by geolocation 2016 11
Table 1.8: Achievement of Year 3 students in all subject areas by geolocation and Indigenous status 2016 12
Table 1.9: Percentage of Year 3 students at or above the national minimum standard in all subject areas by geolocation and Indigenous status 2016 13
Table 1.10: Achievement and percentage of Year 3 students at or above the national minimum standard in all subject areas by education region 2016 14
Table 2.1: Achievement of Year 5 students in all subject areas 2016 15
Table 2.2: Achievement of Year 5 students in all subject areas by sex 2016 16
Table 2.3: Achievement of Year 5 students in all subject areas by Indigenous status 2016 17
Table 2.4: Achievement of Year 5 students in all subject areas by LBOTE status 2016 18
Table 2.5: Number and percentage of Year 5 students by participation in all subject areas by subgroup 2016 19
Table 2.6: Number of Year 5 students in all subject areas by geolocation 2016 20
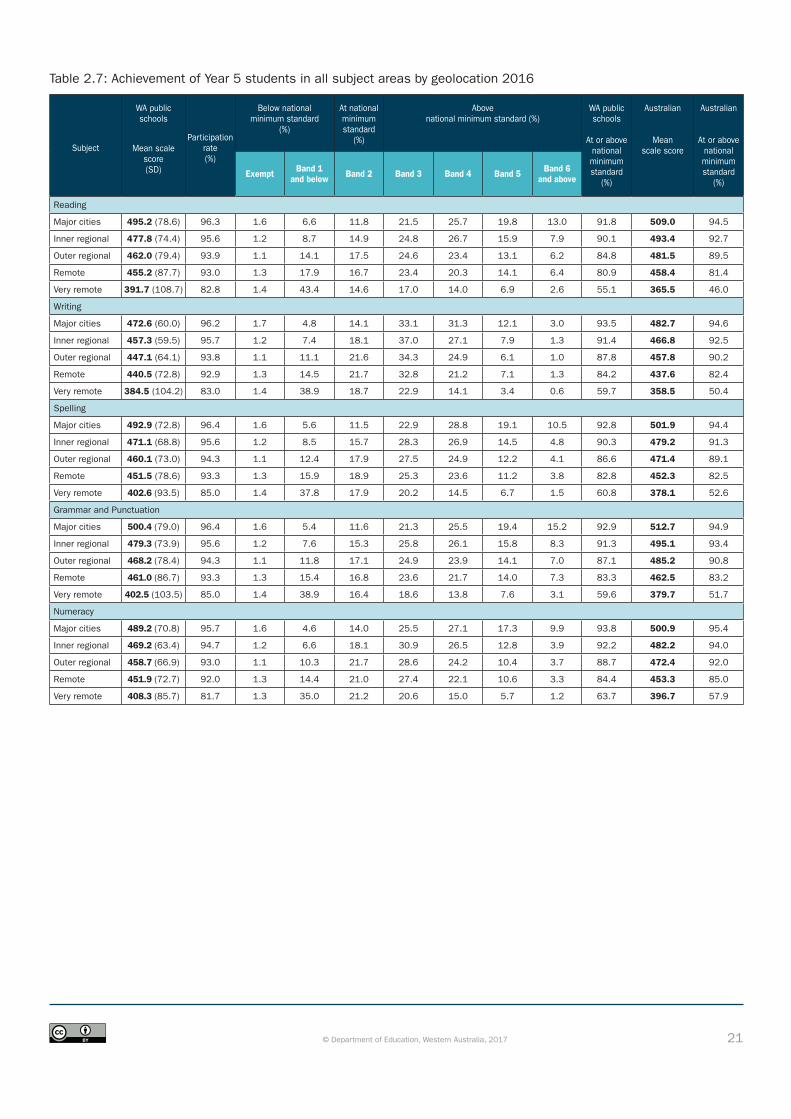
Table 2.7: Achievement of Year 5 students in all subject areas by geolocation 2016 21
Table 2.8: Achievement of Year 5 students in all subject areas by geolocation and Indigenous status 2016 22
Table 2.9: Percentage of Year 5 students at or above the national minimum standard in all subject areas by geolocation and Indigenous status 2016 23
Table 2.10: Achievement and percentage of Year 5 students at or above the national minimum standard in all subject areas by education region 2016 24
Table 3.1: Achievement of Year 7 students in all subject areas 2016 25
Table 3.2: Achievement of Year 7 students in all subject areas by sex 2016 26
Table 3.3: Achievement of Year 7 students in all subject areas by Indigenous status 2016 27
Table 3.4: Achievement of Year 7 students in all subject areas by LBOTE status 2016 28
Table 3.5: Number and percentage of Year 7 students by participation in all subject areas by subgroup 2016 29
Table 3.6: Number of Year 7 students in all subject areas by geolocation 2016 30
Table 3.7: Achievement of Year 7 students in all subject areas by geolocation 2016 31
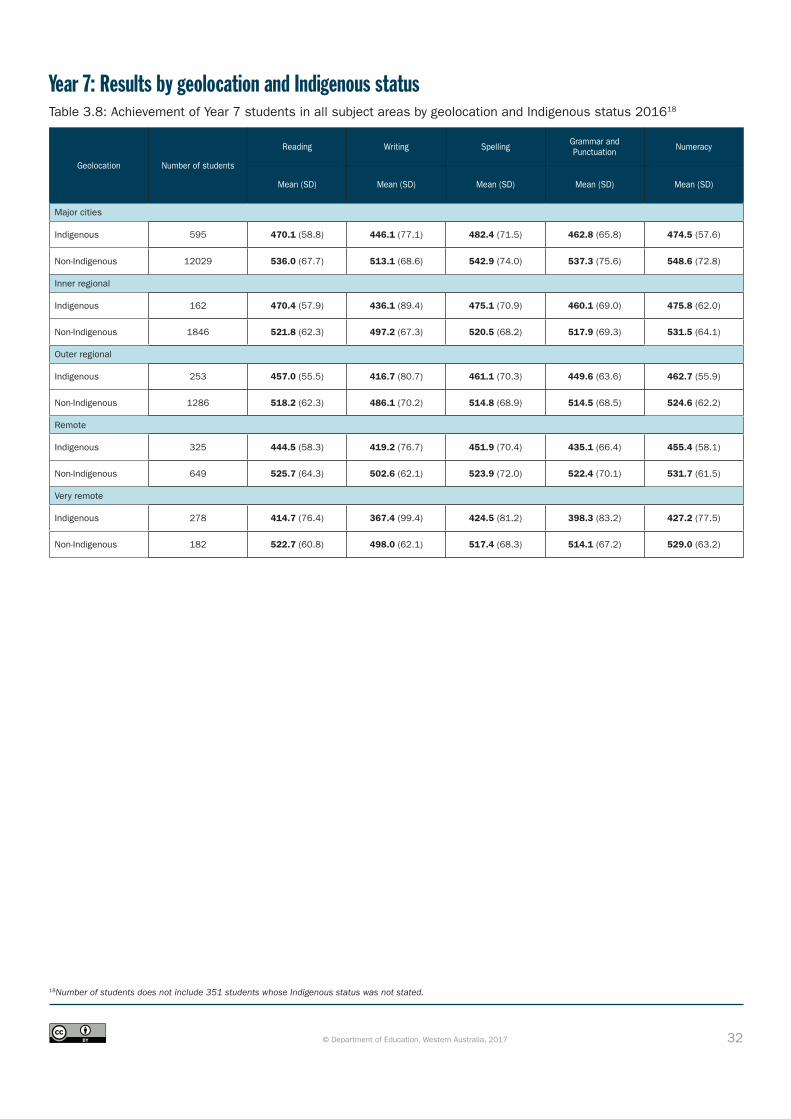
Table 3.8: Achievement of Year 7 students in all subject areas by geolocation and Indigenous status 2016 32
Table 3.9: Percentage of Year 7 students at or above the national minimum standard in all subject areas by geolocation and Indigenous status 2016 33
Table 3.10: Achievement and percentage of Year 7 students at or above the national minimum standard in all subject areas by education region 2016 34
vi© Department of Education, Western Australia, 2017
Table 4.1: Achievement of Year 9 students in all subject areas 2016 35
Table 4.2: Achievement of Year 9 students in all subject areas by sex 2016 36
Table 4.3: Achievement of Year 9 students in all subject areas by Indigenous status 2016 37
Table 4.4: Achievement of Year 9 students in all subject areas by LBOTE status 2016 38
Table 4.5: Number and percentage of Year 9 students by participation in all subject areas by subgroup 2016 39
Table 4.6: Number of Year 9 students in all subject areas by geolocation 2016 40
Table 4.7: Achievement of Year 9 students in all subject areas by geolocation 2016 41
Table 4.8: Achievement of Year 9 students in all subject areas by geolocation and Indigenous status 2016 42
Table 4.9: Percentage of Year 9 students at or above the national minimum standard in all subject areas by geolocation and Indigenous status 2016 43
Table 4.10: Achievement and percentage of Year 9 students at or above the national minimum standard in all subject areas by education region 2016 44
Table 5.1: Mean Reading scores 2008–2016 46
Table 5.2: Mean Writing scores 2008–2016 47
Table 5.3: Mean Spelling scores 2008–2016 48
Table 5.4: Mean Grammar and Punctuation scores 2008–2016 49
Table 5.5: Mean Numeracy scores 2008–2016 50
Table 6.1: Achievement of Year 3 students in Reading by subgroup 2008–2016 51
Table 6.2: Achievement of Year 3 students in Writing by subgroup 2008–2016 52
Table 6.3: Achievement of Year 3 students in Spelling by subgroup 2008–2016 53
Table 6.4: Achievement of Year 3 students in Grammar and Punctuation by subgroup 2008–2016 54
Table 6.5: Achievement of Year 3 students in Numeracy by subgroup 2008–2016 55
Table 7.1: Achievement of Year 5 students in Reading by subgroup 2008–2016 56
Table 7.2: Achievement of Year 5 students in Writing by subgroup 2008–2016 57
Table 7.3: Achievement of Year 5 students in Spelling by subgroup 2008–2016 58
Table 7.4: Achievement of Year 5 students in Grammar and Punctuation by subgroup 2008–2016 59
Table 7.5: Achievement of Year 5 students in Numeracy by subgroup 2008–2016 60
Table 8.1: Achievement of Year 7 students in Reading by subgroup 2008–2016 61
Table 8.2: Achievement of Year 7 students in Writing by subgroup 2008–2016 62
Table 8.3: Achievement of Year 7 students in Spelling by subgroup 2008–2016 63
Table 8.4: Achievement of Year 7 students in Grammar and Punctuation by subgroup 2008–2016 64
Table 8.5: Achievement of Year 7 students in Numeracy by subgroup 2008–2016 65
Table 9.1: Achievement of Year 9 students in Reading by subgroup 2008–2016 66
Table 9.2: Achievement of Year 9 students in Writing by subgroup 2008–2016 67
Table 9.3: Achievement of Year 9 students in Spelling by subgroup 2008–2016 68
Table 9.4: Achievement of Year 9 students in Grammar and Punctuation by subgroup 2008–2016 69
Table 9.5: Achievement of Year 9 students in Numeracy by subgroup 2008–2016 70
Tables (continued)
vii© Department of Education, Western Australia, 2017
Table 10.1: Achievement of Year 3 students in all subject areas by geolocation and Indigenous status 2014–2016 71
Table 10.2: Percentage of Year 3 students at or above the national minimum standard in all subject areas by geolocation and Indigenous status 2014–2016 71
Table 10.3: Achievement of Year 5 students in all subject areas by geolocation and Indigenous status 2014–2016 72
Table 10.4: Percentage of Year 5 students at or above the national minimum standard in all subject areas by geolocation and Indigenous status 2014–2016 72
Table 10.5: Achievement of Year 7 students in all subject areas by geolocation and Indigenous status 2014–2016 73
Table 10.6: Percentage of Year 7 students at or above the national minimum standard in all subject areas by geolocation and Indigenous status 2014–2016 73
Table 10.7: Achievement of Year 9 students in all subject areas by geolocation and Indigenous status 2014–2016 74
Table 10.8: Percentage of Year 9 students at or above the national minimum standard in all subject areas by geolocation and Indigenous status 2014–2016 74
Table 10.9: Year 3 to 5 cohort gains 75
Table 10.10: Year 5 to 7 cohort gains 76
Table 10.11: Year 7 to 9 cohort gains 77
Tables (continued)
1© Department of Education, Western Australia, 2017
Introduction The National Assessment Program – Literacy and Numeracy (NAPLAN) was introduced in 2008, replacing the previous State and Territory full cohort assessment programs. NAPLAN tests are collaboratively developed by the Australian Curriculum, Assessment and Reporting Authority (ACARA), the States and Territories, the private education sectors and the Australian Government.
In May 2016, almost 84 000 Year 3, 5, 7 and 9 public school students in Western Australia sat the same tests in literacy and numeracy as their counterparts in other schools across Australia.
This report provides the 2016 results for Western Australian public school students and includes comparisons with the 2008 to 2015 results and data on gains by the 2014/16 and previous cohorts.
This report complements the 2016 National Assessment Program – Literacy and Numeracy – Achievement in Reading, Writing, Language Conventions and Numeracy national report, which was released by Education Ministers in 2016.
The tests
Students sat tests in Reading, Writing, Language Conventions and Numeracy.
In the Reading test, students read several short texts of varying length and difficulty, then answered multiple choice and open response questions about those texts.
In the Writing test, students wrote a persuasive response to a colour stimulus page and prompt.
In the Language Conventions test, students identified and corrected errors in spelling, and answered multiple choice questions in grammar and punctuation.
In the Numeracy test, students answered multiple choice and short response questions. Year 3 and 5 students completed the test without calculators. Year 7 and 9 students completed two tests, one in which a calculator was allowed and one without a calculator.
Reporting scales and achievement bands
There are five NAPLAN achievement scales: one each for Reading, Writing, Spelling, Grammar and Punctuation, and Numeracy. Each scale is divided into 10 achievement bands which represent the increasing complexity of the skills and understandings assessed by NAPLAN from Years 3 to 9. Six bands are used for reporting student performance in each year level. Year 3 performance is reported using Bands 1 to 6, Year 5 uses Bands 3 to 8, Year 7 uses Bands 4 to 9, and Year 9 uses Bands 5 to 10.
Within the NAPLAN program, any given score in an assessed area represents the same level of achievement over time. For example, a score of 700 in Reading will have the same meaning in previous and future testing years.
A NAPLAN score in one assessment learning area is not comparable with a NAPLAN score in another assessment learning area. It is not correct to compare a score in Reading, for example, with a score in Numeracy or Writing.
A new writing scale was introduced in 2011. As this is a different scale, results from 2011, 2012, 2013, 2014, 2015 and 2016 should not be directly compared with writing results from previous years.
2© Department of Education, Western Australia, 2017
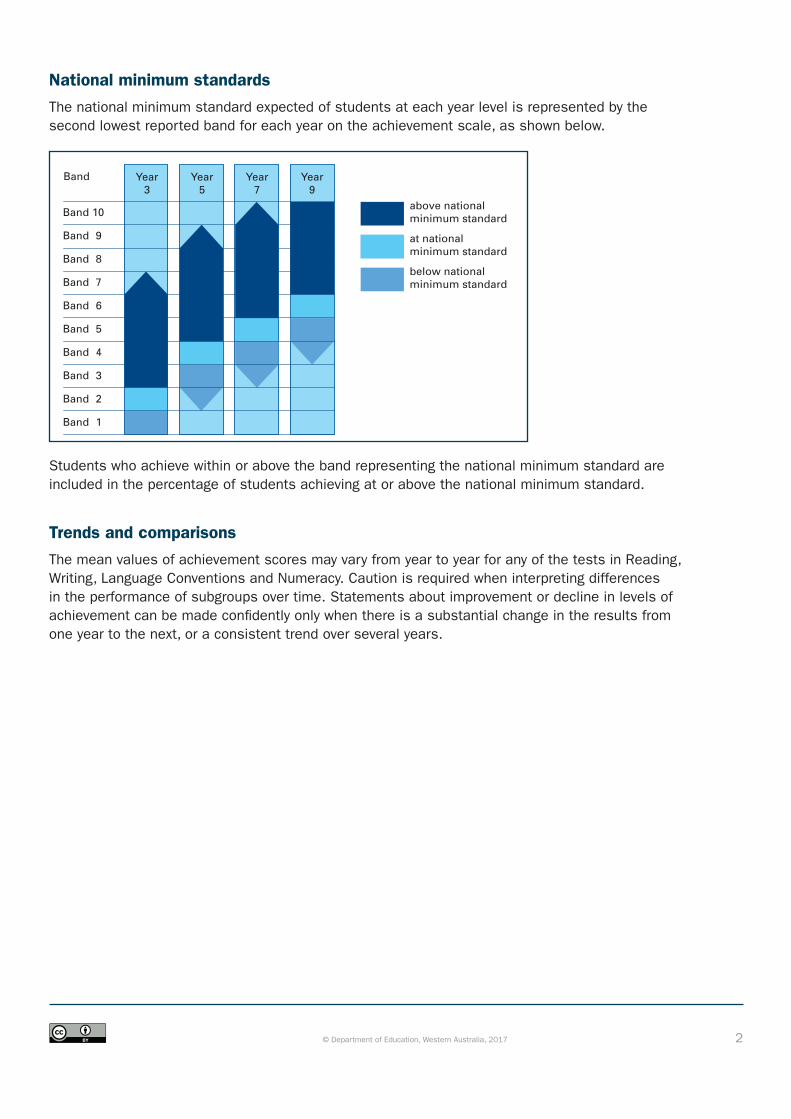
National minimum standards
The national minimum standard expected of students at each year level is represented by the second lowest reported band for each year on the achievement scale, as shown below.
Students who achieve within or above the band representing the national minimum standard are included in the percentage of students achieving at or above the national minimum standard.
Trends and comparisons
The mean values of achievement scores may vary from year to year for any of the tests in Reading, Writing, Language Conventions and Numeracy. Caution is required when interpreting differences in the performance of subgroups over time. Statements about improvement or decline in levels of achievement can be made confidently only when there is a substantial change in the results from one year to the next, or a consistent trend over several years.
3© Department of Education, Western Australia, 2017
Notes and definitionsThe Standard Deviation (SD)
The Standard Deviation (SD) is reported for each mean score. The SD is a measure of spread in the scores of a particular group. A higher SD indicates scores are spread more; a lower SD will have scores more clustered around the mean.
Percentages shown in tables
In the tables shown in this report, the percentages of students shown have been rounded and may not sum to 100.
Exempt students
Formal exemptions were granted to students with a significant intellectual or functional disability. Exemptions were also granted to students with English as a Second Language from mainstream classes and Intensive English Centres who had been in Australia for less than one year. All exemptions have been registered. The decision to exempt a student is made by the principal after discussions with the classroom teacher and/or school-based specialists and with the signed agreement of parents/caregivers. Exempt students were not assessed. They were deemed to have not met the national minimum standards.
Exemption figures were included in calculating participation rates and in calculating the number of students not meeting the national minimum standards.
Withdrawn students
Parents/caregivers, with the endorsement of the principal, could exercise their right to withdraw their child from the NAPLAN tests by completing and providing a parent/caregiver withdrawal form to the school before testing commenced.
Number of students for each test
For each test, the number of students includes all students reported by schools as well as those who were exempt, absent or withdrawn from each test. Participation rates are calculated on the basis of assessed and exempt students as a proportion of all students, including absent and withdrawn students.
Data used for calculations
Exempt students are not included in the calculation of means. Scores for students who were absent or withdrawn from the test(s) have been imputed and these students’ data are included in all calculations.
LBOTE (Language Background Other Than English)
A student is classified as having a language background other than English if either he or she or the parents/caregivers speak a language other than English at home.
Indigenous status
A student is considered Indigenous if he or she identifies as being of Aboriginal or Torres Strait Islander origin. The term ‘origin’ is considered to relate to people’s Australian Aboriginal or Torres Strait Islander descent and for some, but not all, their cultural identity.
A student’s Indigenous status is drawn from enrolment data.
4© Department of Education, Western Australia, 2017
Unstated background information
Background information relating to Indigenous and/or language background status was not available for all students.
Students with unstated background information are not included in calculations for these subgroups.
Geolocation
The Australian Bureau of Statistics (ABS) Australian Statical Geography Standard (ASGS) Remoteness Structure is based on the locality of individual schools and is used to disaggregate data according to major cities of Australia, inner regional Australia, outer regional Australia, remote Australia and very remote Australia. In 2016 the ABS ASGS replaces the School Geographic Location Classification System used in previous reports.
Language Conventions test
The Language Conventions test included Spelling, and Grammar and Punctuation. Results were reported on two scales. As participating students completed the paper in one sitting, the total number of students is identical and is reflected as such in Tables 1.5, 2.5, 3.5 and 4.5.
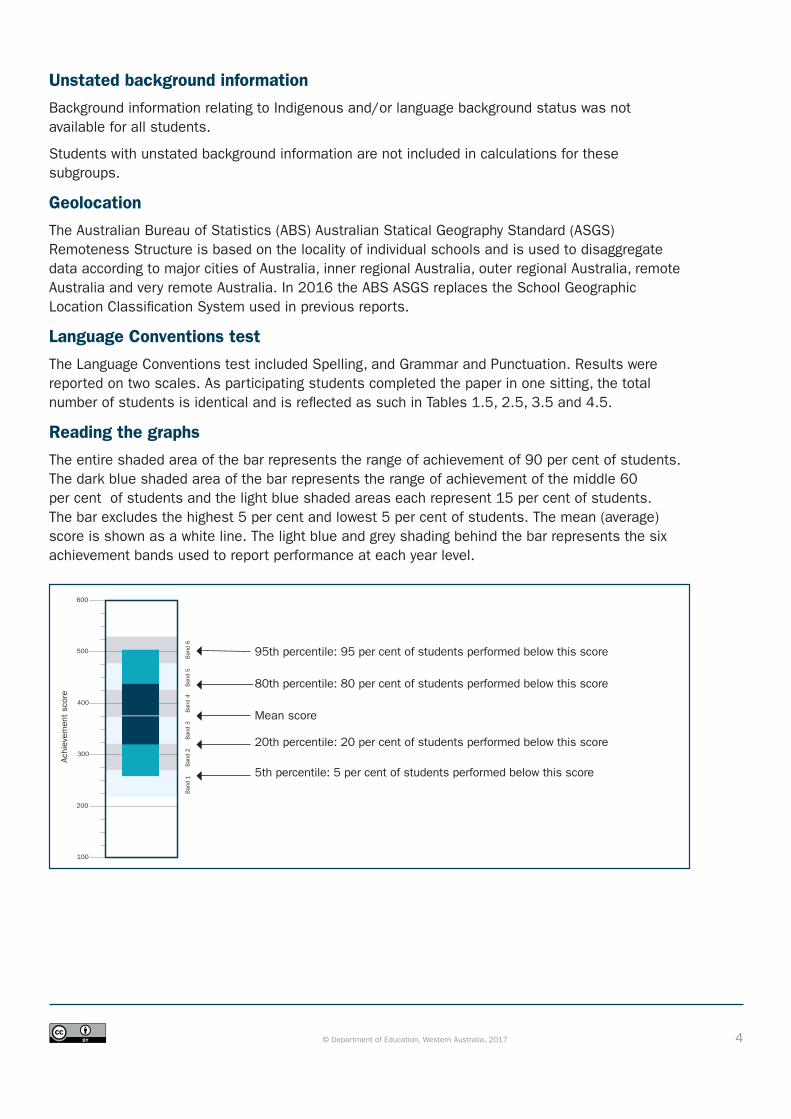
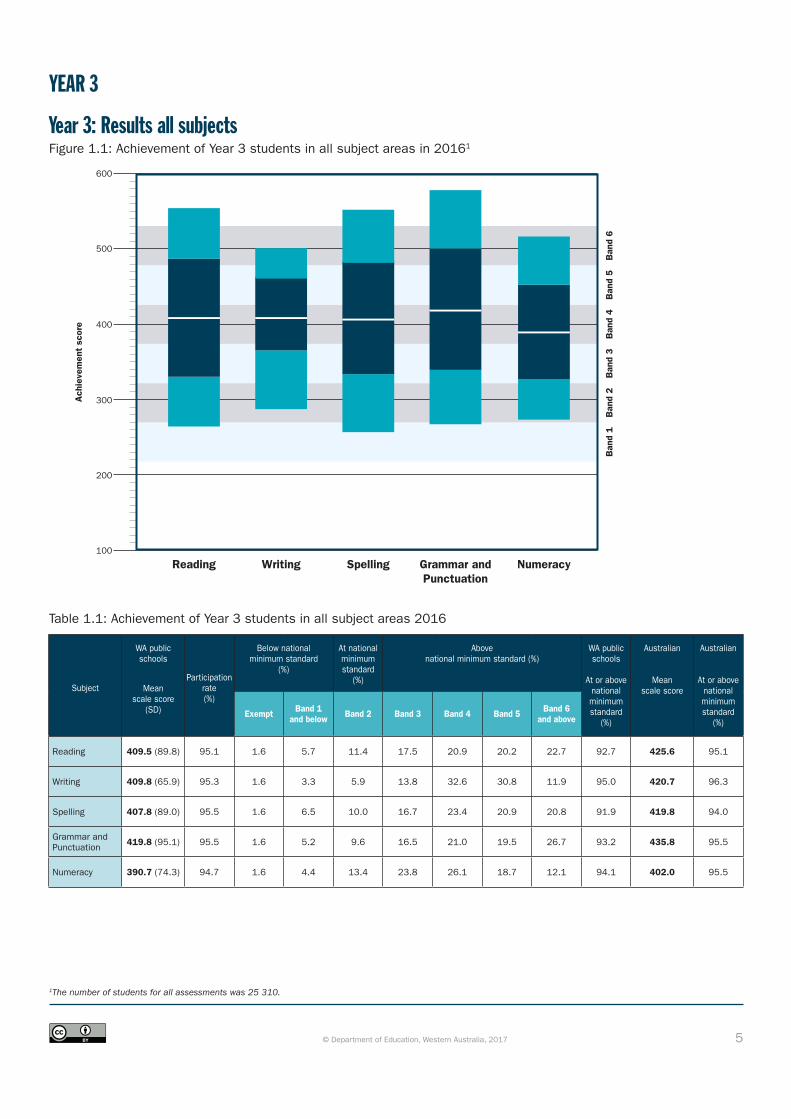
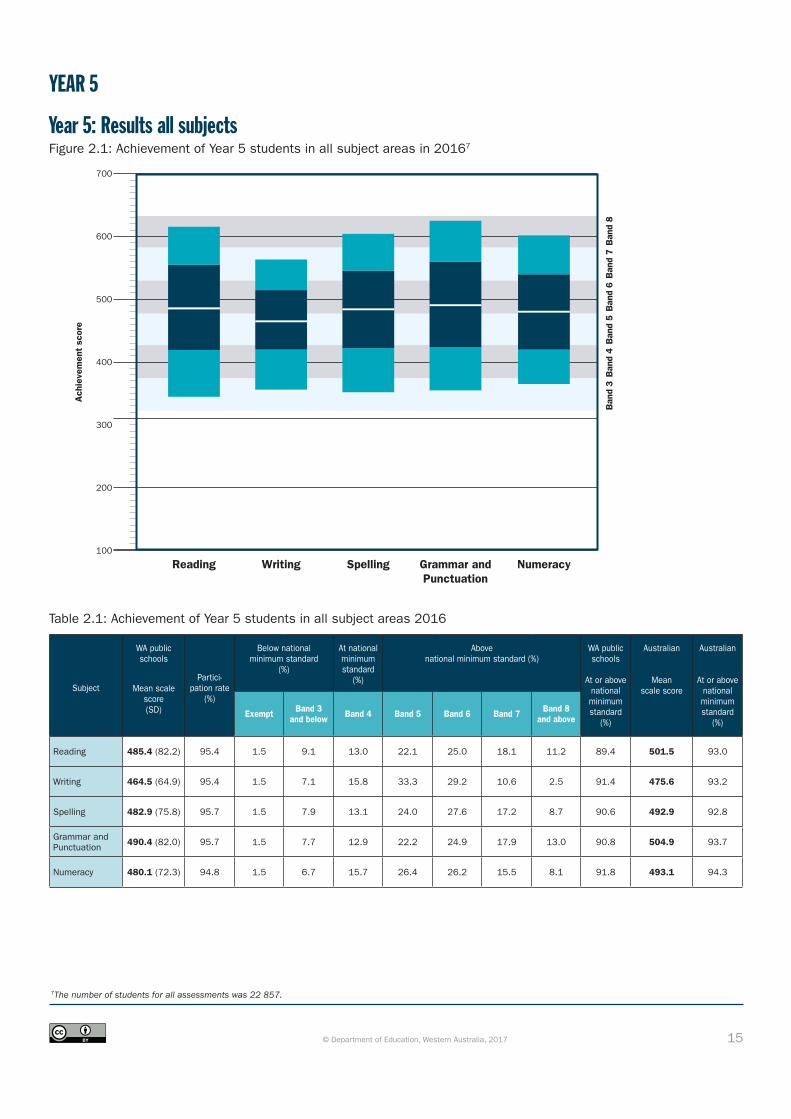
Reading the graphs
The entire shaded area of the bar represents the range of achievement of 90 per cent of students. The dark blue shaded area of the bar represents the range of achievement of the middle 60 per cent of students and the light blue shaded areas each represent 15 per cent of students. The bar excludes the highest 5 per cent and lowest 5 per cent of students. The mean (average) score is shown as a white line. The light blue and grey shading behind the bar represents the six achievement bands used to report performance at each year level.
600
500
400
300
200
100
Achi
evem
ent
scor
e
Ban
d 1
Ban
d 2
Ban
d 3
Ban
d 4
Ban
d 5
Ban
d 6
95th percentile: 95 per cent of students performed below this score
80th percentile: 80 per cent of students performed below this score
Mean score
20th percentile: 20 per cent of students performed below this score
5th percentile: 5 per cent of students performed below this score
5© Department of Education, Western Australia, 2017
Table 1.1: Achievement of Year 3 students in all subject areas 2016
Subject
WA public schools
Mean scale score
(SD)
Partici pation rate(%)
Below national minimum standard
(%)
At national minimum standard
(%)
Above national minimum standard (%)
WA public schools
At or above national minimum standard
(%)
Australian
Mean scale score
Australian
At or above national minimum standard
(%)Exempt Band 1
and below Band 2 Band 3 Band 4 Band 5 Band 6 and above
Reading 409.5 (89.8) 95.1 1.6 5.7 11.4 17.5 20.9 20.2 22.7 92.7 425.6 95.1
Writing 409.8 (65.9) 95.3 1.6 3.3 5.9 13.8 32.6 30.8 11.9 95.0 420.7 96.3
Spelling 407.8 (89.0) 95.5 1.6 6.5 10.0 16.7 23.4 20.9 20.8 91.9 419.8 94.0
Grammar and Punctuation 419.8 (95.1) 95.5 1.6 5.2 9.6 16.5 21.0 19.5 26.7 93.2 435.8 95.5
Numeracy 390.7 (74.3) 94.7 1.6 4.4 13.4 23.8 26.1 18.7 12.1 94.1 402.0 95.5
Year 3: Results all subjectsFigure 1.1: Achievement of Year 3 students in all subject areas in 20161
1The number of students for all assessments was 25 310.
Ban
d 1
Ban
d 2
Ban
d 3
Ban
d 4
Ban
d 5
Ban
d 6
100
200
300
400
500
600
Ach
ieve
men
t sc
ore
Reading Writing Spelling Grammar and Punctuation
Numeracy
YEAR 3

6© Department of Education, Western Australia, 2017
Table 1.2: Achievement of Year 3 students in all subject areas by sex 2016
Subject
WA public schools
Mean scale score
(SD)
Partici pation rate(%)
Below national minimum standard
(%)
At national minimum standard
(%)
Above national minimum standard (%)
WA public schools
At or above national minimum standard
(%)
Australian
Mean scale score
Australian
At or above national minimum standard
(%)Exempt Band 1
and below Band 2 Band 3 Band 4 Band 5 Band 6 and above
Reading
Male 399.4 (90.6) 94.3 2.1 7.2 13.0 18.5 20.5 19.1 19.5 90.6 415.8 93.5
Female 420.2 (87.7) 96.0 1.0 4.1 9.7 16.4 21.2 21.4 26.1 94.9 435.8 96.7
Writing
Male 397.3 (69.0) 94.4 2.2 4.8 7.7 16.7 33.7 26.3 8.6 93.0 408.7 94.8
Female 423.2 (59.5) 96.2 1.0 1.7 4.0 10.7 31.3 35.8 15.4 97.2 433.3 97.9
Spelling
Male 401.3 (91.5) 94.8 2.1 7.8 11.1 17.5 22.6 19.5 19.3 90.1 413.5 92.5
Female 414.7 (85.6) 96.3 1.0 5.1 8.9 15.9 24.2 22.4 22.5 93.9 426.4 95.5
Grammar and Punctuation
Male 408.8 (95.5) 94.8 2.1 6.6 11.1 17.7 21.1 18.4 23.0 91.3 425.2 94.1
Female 431.6 (93.2) 96.3 1.0 3.7 8.0 15.1 21.0 20.6 30.6 95.3 446.8 97.0
Numeracy
Male 394.2 (76.3) 94.0 2.1 4.3 12.6 22.9 25.6 18.8 13.7 93.6 407.0 95.1
Female 386.9 (71.9) 95.4 1.0 4.4 14.2 24.8 26.6 18.5 10.4 94.6 396.9 96.0
Year 3: Results by sexFigure 1.2: Achievement of Year 3 students in all subject areas by sex 20162
2For all assessments the number of males was 13 130 the number of females 12 180.
Ban
d 1
Ban
d 2
Ban
d 3
Ban
d 4
Ban
d 5
Ban
d 6
100
200
300
400
500
600
Ach
ieve
men
t sc
ore
Reading Writing Spelling Grammar and Punctuation
NumeracyMale Female Male Female Male Female Male Female Male Female

7© Department of Education, Western Australia, 2017
Table 1.3: Achievement of Year 3 students in all subject areas by Indigenous status 2016
Subject
WA public schools
Mean scale score
(SD)
Partici pation rate(%)
Below national minimum standard
(%)
At national minimum standard
(%)
Above national minimum standard (%)
WA public schools
At or above national minimum standard
(%)
Australian
Mean scale score
Australian
At or above national minimum standard
(%)Exempt Band 1
and below Band 2 Band 3 Band 4 Band 5 Band 6 and above
Reading
Indigenous 320.5 (86.1) 84.4 1.5 26.6 26.6 20.2 13.6 7.7 3.8 71.9 346.5 80.6
Non-Indigenous 417.9 (85.6) 96.2 1.6 3.8 10.0 17.2 21.5 21.4 24.6 94.7 430.5 96.0
Writing
Indigenous 335.4 (83.9) 86.1 1.5 19.5 18.4 23.8 24.9 10.2 1.7 79.0 358.3 85.1
Non-Indigenous 416.8 (59.5) 96.2 1.6 1.9 4.7 12.8 33.2 32.8 12.9 96.5 424.6 97.1
Spelling
Indigenous 325.3 (92.3) 86.9 1.5 29.0 19.8 19.5 16.0 9.1 5.2 69.5 348.6 78.3
Non-Indigenous 415.5 (84.7) 96.4 1.6 4.4 9.1 16.4 24.2 22.1 22.3 94.0 424.2 95.0
Grammar and Punctuation
Indigenous 326.0 (92.3) 86.9 1.5 25.3 23.5 21.9 14.3 8.0 5.5 73.2 354.7 82.4
Non-Indigenous 428.7 (90.7) 96.4 1.6 3.4 8.3 15.9 21.7 20.6 28.7 95.1 440.8 96.3
Numeracy
Indigenous 320.2 (68.8) 82.9 1.5 21.7 30.7 26.2 13.1 5.0 1.7 76.8 336.8 82.6
Non-Indigenous 397.4 (71.4) 95.9 1.5 2.7 11.7 23.6 27.2 20.0 13.2 95.7 406.1 96.4
Year 3: Results by Indigenous statusFigure 1.3: Achievement of Year 3 students in all subject areas by Indigenous status 20163
3For all assessments the number of Indigenous students was 2 068 and the number of non-Indigenous students 22 803. These numbers do not include 439 students whose Indigenous status was not stated.
Ban
d 1
Ban
d 2
Ban
d 3
Ban
d 4
Ban
d 5
Ban
d 6
100
200
300
400
500
600
Ach
ieve
men
t sc
ore
Reading Writing Spelling Grammar and Punctuation
NumeracyIndig. Non-Indig. Indig. Non-Indig. Indig. Non-Indig. Indig. Non-Indig. Indig. Non-Indig.

8© Department of Education, Western Australia, 2017
Table 1.4: Achievement of Year 3 students in all subject areas by LBOTE status 2016
Subject
WA public schools
Mean scale score
(SD)
Partici pation rate(%)
Below national minimum standard
(%)
At national minimum standard
(%)
Above national minimum standard (%)
WA public schools
At or above national minimum standard
(%)
Australian
Mean scale score
Australian
At or above national minimum standard
(%)Exempt Band 1
and below Band 2 Band 3 Band 4 Band 5 Band 6 and above
Reading
LBOTE 419.1 (93.8) 95.4 2.8 5.5 9.6 15.0 19.3 21.1 26.7 91.8 428.2 94.0
Non-LBOTE 406.7 (88.3) 95.0 1.4 5.8 11.8 18.1 21.5 20.0 21.5 92.9 425.3 95.5
Writing
LBOTE 418.8 (69.7) 95.5 2.8 3.7 4.3 10.8 29.1 33.1 16.2 93.5 428.9 95.4
Non-LBOTE 407.3 (64.6) 95.2 1.4 3.2 6.3 14.6 33.5 30.2 10.7 95.4 418.5 96.7
Spelling
LBOTE 433.2 (94.6) 95.8 2.7 5.0 7.0 11.5 20.2 22.0 31.5 92.3 441.7 94.0
Non-LBOTE 400.5 (85.8) 95.4 1.3 7.0 10.9 18.2 24.3 20.4 17.8 91.7 413.2 94.0
Grammar and Punctuation
LBOTE 430.0 (101.9) 95.8 2.7 5.5 8.2 14.1 18.7 19.1 31.7 91.8 441.5 94.3
Non-LBOTE 417.3 (92.8) 95.4 1.3 5.1 9.9 17.1 21.7 19.4 25.5 93.6 434.5 96.0
Numeracy
LBOTE 398.9 (80.6) 95.0 2.7 4.6 12.0 21.0 23.9 19.6 16.2 92.7 406.8 94.3
Non-LBOTE 388.1 (72.2) 94.6 1.3 4.3 13.8 24.6 26.6 18.5 10.9 94.4 400.8 96.0
Year 3: Results by LBOTE statusFigure 1.4: Achievement of Year 3 students in all subject areas by LBOTE status 20164
4For all assessments the number of LBOTE students was 5 459 and the number of non-LBOTE students 12 019. These numbers do not include 7 832 students whose language background status was not stated.
Ban
d 1
Ban
d 2
Ban
d 3
Ban
d 4
Ban
d 5
Ban
d 6
100
200
300
400
500
600
Ach
ieve
men
t sc
ore
Reading Writing Spelling Grammar and Punctuation
NumeracyLBOTE Non-LBOTE LBOTE Non-LBOTE LBOTE Non-LBOTE LBOTE Non-LBOTE LBOTE Non-LBOTE
9© Department of Education, Western Australia, 2017
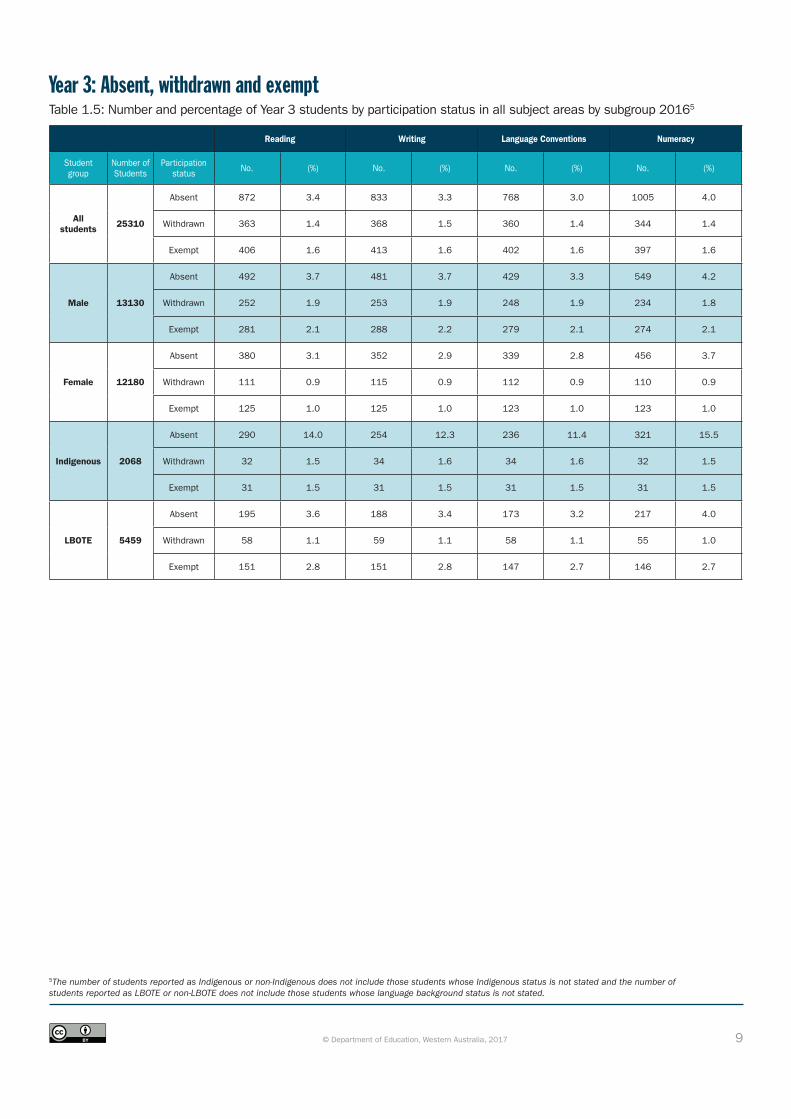
Table 1.5: Number and percentage of Year 3 students by participation status in all subject areas by subgroup 20165
Reading Writing Language Conventions Numeracy
Student group
Number of Students
Participation status No. (%) No. (%) No. (%) No. (%)
All students 25310
Absent 872 3.4 833 3.3 768 3.0 1005 4.0
Withdrawn 363 1.4 368 1.5 360 1.4 344 1.4
Exempt 406 1.6 413 1.6 402 1.6 397 1.6
Male 13130
Absent 492 3.7 481 3.7 429 3.3 549 4.2
Withdrawn 252 1.9 253 1.9 248 1.9 234 1.8
Exempt 281 2.1 288 2.2 279 2.1 274 2.1
Female 12180
Absent 380 3.1 352 2.9 339 2.8 456 3.7
Withdrawn 111 0.9 115 0.9 112 0.9 110 0.9
Exempt 125 1.0 125 1.0 123 1.0 123 1.0
Indigenous 2068
Absent 290 14.0 254 12.3 236 11.4 321 15.5
Withdrawn 32 1.5 34 1.6 34 1.6 32 1.5
Exempt 31 1.5 31 1.5 31 1.5 31 1.5
LBOTE 5459
Absent 195 3.6 188 3.4 173 3.2 217 4.0
Withdrawn 58 1.1 59 1.1 58 1.1 55 1.0
Exempt 151 2.8 151 2.8 147 2.7 146 2.7
5The number of students reported as Indigenous or non-Indigenous does not include those students whose Indigenous status is not stated and the number of students reported as LBOTE or non-LBOTE does not include those students whose language background status is not stated.
Year 3: Absent, withdrawn and exempt
10© Department of Education, Western Australia, 2017
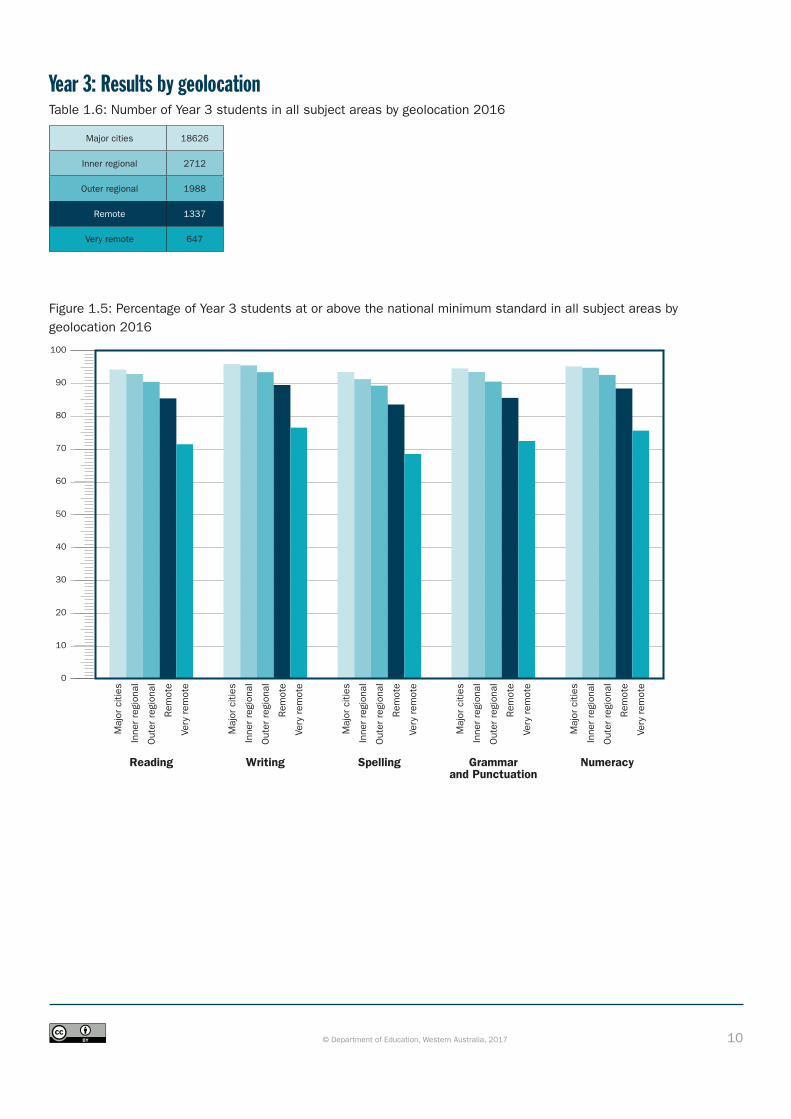
Year 3: Results by geolocationTable 1.6: Number of Year 3 students in all subject areas by geolocation 2016
Major cities 18626
Inner regional 2712
Outer regional 1988
Remote 1337
Very remote 647
Figure 1.5: Percentage of Year 3 students at or above the national minimum standard in all subject areas by geolocation 2016
0
10
20
30
40
50
60
70
80
90
100
Reading Writing Spelling Grammarand Punctuation
Numeracy
Maj
or c
ities
Inne
r re
gion
al
Out
er r
egio
nal
Rem
ote
Very
rem
ote
Maj
or c
ities
Inne
r re
gion
al
Out
er r
egio
nal
Rem
ote
Very
rem
ote
Maj
or c
ities
Inne
r re
gion
al
Out
er r
egio
nal
Rem
ote
Very
rem
ote
Maj
or c
ities
Inne
r re
gion
al
Out
er r
egio
nal
Rem
ote
Very
rem
ote
Maj
or c
ities
Inne
r re
gion
al
Out
er r
egio
nal
Rem
ote
Very
rem
ote
11© Department of Education, Western Australia, 2017
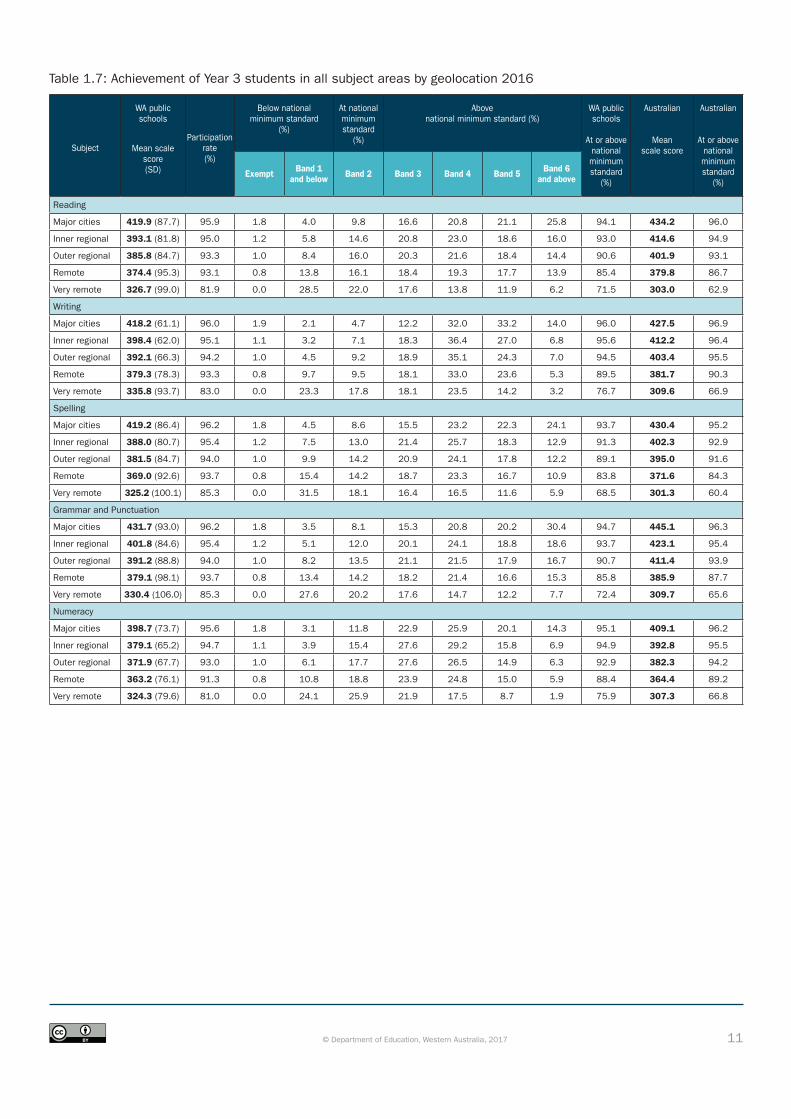
Table 1.7: Achievement of Year 3 students in all subject areas by geolocation 2016
Subject
WA public schools
Mean scale score (SD)
Partici pation rate(%)
Below national minimum standard
(%)
At national minimum standard
(%)
Above national minimum standard (%)
WA public schools
At or above national minimum standard
(%)
Australian
Mean scale score
Australian
At or above national minimum standard
(%)Exempt Band 1
and below Band 2 Band 3 Band 4 Band 5 Band 6 and above
Reading
Major cities 419.9 (87.7) 95.9 1.8 4.0 9.8 16.6 20.8 21.1 25.8 94.1 434.2 96.0
Inner regional 393.1 (81.8) 95.0 1.2 5.8 14.6 20.8 23.0 18.6 16.0 93.0 414.6 94.9
Outer regional 385.8 (84.7) 93.3 1.0 8.4 16.0 20.3 21.6 18.4 14.4 90.6 401.9 93.1
Remote 374.4 (95.3) 93.1 0.8 13.8 16.1 18.4 19.3 17.7 13.9 85.4 379.8 86.7
Very remote 326.7 (99.0) 81.9 0.0 28.5 22.0 17.6 13.8 11.9 6.2 71.5 303.0 62.9
Writing
Major cities 418.2 (61.1) 96.0 1.9 2.1 4.7 12.2 32.0 33.2 14.0 96.0 427.5 96.9
Inner regional 398.4 (62.0) 95.1 1.1 3.2 7.1 18.3 36.4 27.0 6.8 95.6 412.2 96.4
Outer regional 392.1 (66.3) 94.2 1.0 4.5 9.2 18.9 35.1 24.3 7.0 94.5 403.4 95.5
Remote 379.3 (78.3) 93.3 0.8 9.7 9.5 18.1 33.0 23.6 5.3 89.5 381.7 90.3
Very remote 335.8 (93.7) 83.0 0.0 23.3 17.8 18.1 23.5 14.2 3.2 76.7 309.6 66.9
Spelling
Major cities 419.2 (86.4) 96.2 1.8 4.5 8.6 15.5 23.2 22.3 24.1 93.7 430.4 95.2
Inner regional 388.0 (80.7) 95.4 1.2 7.5 13.0 21.4 25.7 18.3 12.9 91.3 402.3 92.9
Outer regional 381.5 (84.7) 94.0 1.0 9.9 14.2 20.9 24.1 17.8 12.2 89.1 395.0 91.6
Remote 369.0 (92.6) 93.7 0.8 15.4 14.2 18.7 23.3 16.7 10.9 83.8 371.6 84.3
Very remote 325.2 (100.1) 85.3 0.0 31.5 18.1 16.4 16.5 11.6 5.9 68.5 301.3 60.4
Grammar and Punctuation
Major cities 431.7 (93.0) 96.2 1.8 3.5 8.1 15.3 20.8 20.2 30.4 94.7 445.1 96.3
Inner regional 401.8 (84.6) 95.4 1.2 5.1 12.0 20.1 24.1 18.8 18.6 93.7 423.1 95.4
Outer regional 391.2 (88.8) 94.0 1.0 8.2 13.5 21.1 21.5 17.9 16.7 90.7 411.4 93.9
Remote 379.1 (98.1) 93.7 0.8 13.4 14.2 18.2 21.4 16.6 15.3 85.8 385.9 87.7
Very remote 330.4 (106.0) 85.3 0.0 27.6 20.2 17.6 14.7 12.2 7.7 72.4 309.7 65.6
Numeracy
Major cities 398.7 (73.7) 95.6 1.8 3.1 11.8 22.9 25.9 20.1 14.3 95.1 409.1 96.2
Inner regional 379.1 (65.2) 94.7 1.1 3.9 15.4 27.6 29.2 15.8 6.9 94.9 392.8 95.5
Outer regional 371.9 (67.7) 93.0 1.0 6.1 17.7 27.6 26.5 14.9 6.3 92.9 382.3 94.2
Remote 363.2 (76.1) 91.3 0.8 10.8 18.8 23.9 24.8 15.0 5.9 88.4 364.4 89.2
Very remote 324.3 (79.6) 81.0 0.0 24.1 25.9 21.9 17.5 8.7 1.9 75.9 307.3 66.8
12© Department of Education, Western Australia, 2017
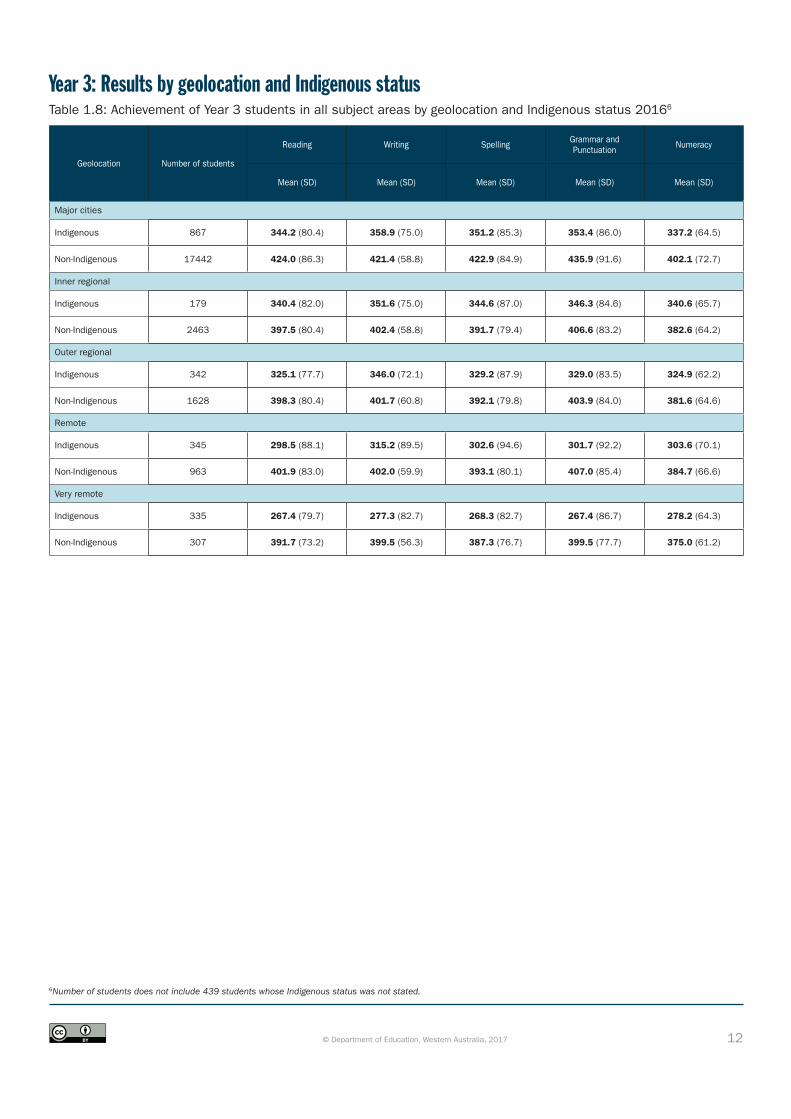
Year 3: Results by geolocation and Indigenous statusTable 1.8: Achievement of Year 3 students in all subject areas by geolocation and Indigenous status 20166
Geolocation Number of students
Reading Writing Spelling Grammar and Punctuation Numeracy
Mean (SD) Mean (SD) Mean (SD) Mean (SD) Mean (SD)
Major cities
Indigenous 867 344.2 (80.4) 358.9 (75.0) 351.2 (85.3) 353.4 (86.0) 337.2 (64.5)
Non-Indigenous 17442 424.0 (86.3) 421.4 (58.8) 422.9 (84.9) 435.9 (91.6) 402.1 (72.7)
Inner regional
Indigenous 179 340.4 (82.0) 351.6 (75.0) 344.6 (87.0) 346.3 (84.6) 340.6 (65.7)
Non-Indigenous 2463 397.5 (80.4) 402.4 (58.8) 391.7 (79.4) 406.6 (83.2) 382.6 (64.2)
Outer regional
Indigenous 342 325.1 (77.7) 346.0 (72.1) 329.2 (87.9) 329.0 (83.5) 324.9 (62.2)
Non-Indigenous 1628 398.3 (80.4) 401.7 (60.8) 392.1 (79.8) 403.9 (84.0) 381.6 (64.6)
Remote
Indigenous 345 298.5 (88.1) 315.2 (89.5) 302.6 (94.6) 301.7 (92.2) 303.6 (70.1)
Non-Indigenous 963 401.9 (83.0) 402.0 (59.9) 393.1 (80.1) 407.0 (85.4) 384.7 (66.6)
Very remote
Indigenous 335 267.4 (79.7) 277.3 (82.7) 268.3 (82.7) 267.4 (86.7) 278.2 (64.3)
Non-Indigenous 307 391.7 (73.2) 399.5 (56.3) 387.3 (76.7) 399.5 (77.7) 375.0 (61.2)
6Number of students does not include 439 students whose Indigenous status was not stated.
13© Department of Education, Western Australia, 2017
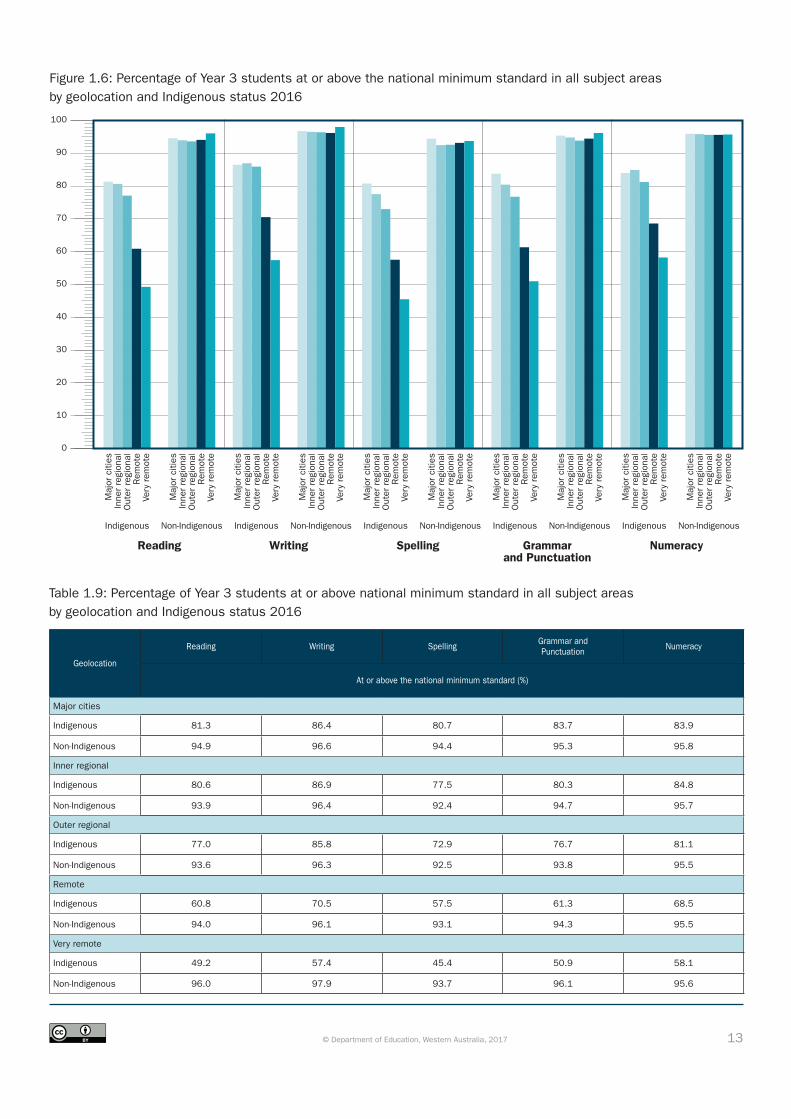
Table 1.9: Percentage of Year 3 students at or above national minimum standard in all subject areas by geolocation and Indigenous status 2016
Geolocation
Reading Writing Spelling Grammar and Punctuation Numeracy
At or above the national minimum standard (%)
Major cities
Indigenous 81.3 86.4 80.7 83.7 83.9
Non-Indigenous 94.9 96.6 94.4 95.3 95.8
Inner regional
Indigenous 80.6 86.9 77.5 80.3 84.8
Non-Indigenous 93.9 96.4 92.4 94.7 95.7
Outer regional
Indigenous 77.0 85.8 72.9 76.7 81.1
Non-Indigenous 93.6 96.3 92.5 93.8 95.5
Remote
Indigenous 60.8 70.5 57.5 61.3 68.5
Non-Indigenous 94.0 96.1 93.1 94.3 95.5
Very remote
Indigenous 49.2 57.4 45.4 50.9 58.1
Non-Indigenous 96.0 97.9 93.7 96.1 95.6
Figure 1.6: Percentage of Year 3 students at or above the national minimum standard in all subject areas by geolocation and Indigenous status 2016
0
10
20
30
40
50
60
70
80
90
100
Reading Writing Spelling Grammarand Punctuation
Numeracy
Indigenous Non-Indigenous
Maj
or c
ities
Inne
r re
gion
alO
uter
reg
iona
lR
emot
eVe
ry r
emot
e
Maj
or c
ities
Inne
r re
gion
alO
uter
reg
iona
lR
emot
eVe
ry r
emot
e
Indigenous Non-Indigenous
Maj
or c
ities
Inne
r re
gion
alO
uter
reg
iona
lR
emot
eVe
ry r
emot
e
Maj
or c
ities
Inne
r re
gion
alO
uter
reg
iona
lR
emot
eVe
ry r
emot
e
Indigenous Non-Indigenous
Maj
or c
ities
Inne
r re
gion
alO
uter
reg
iona
lR
emot
eVe
ry r
emot
e
Maj
or c
ities
Inne
r re
gion
alO
uter
reg
iona
lR
emot
eVe
ry r
emot
e
Indigenous Non-Indigenous
Maj
or c
ities
Inne
r re
gion
alO
uter
reg
iona
lR
emot
eVe
ry r
emot
e
Maj
or c
ities
Inne
r re
gion
alO
uter
reg
iona
lR
emot
eVe
ry r
emot
e
Indigenous Non-Indigenous
Maj
or c
ities
Inne
r re
gion
alO
uter
reg
iona
lR
emot
eVe
ry r
emot
e
Maj
or c
ities
Inne
r re
gion
alO
uter
reg
iona
lR
emot
eVe
ry r
emot
e
14© Department of Education, Western Australia, 2017
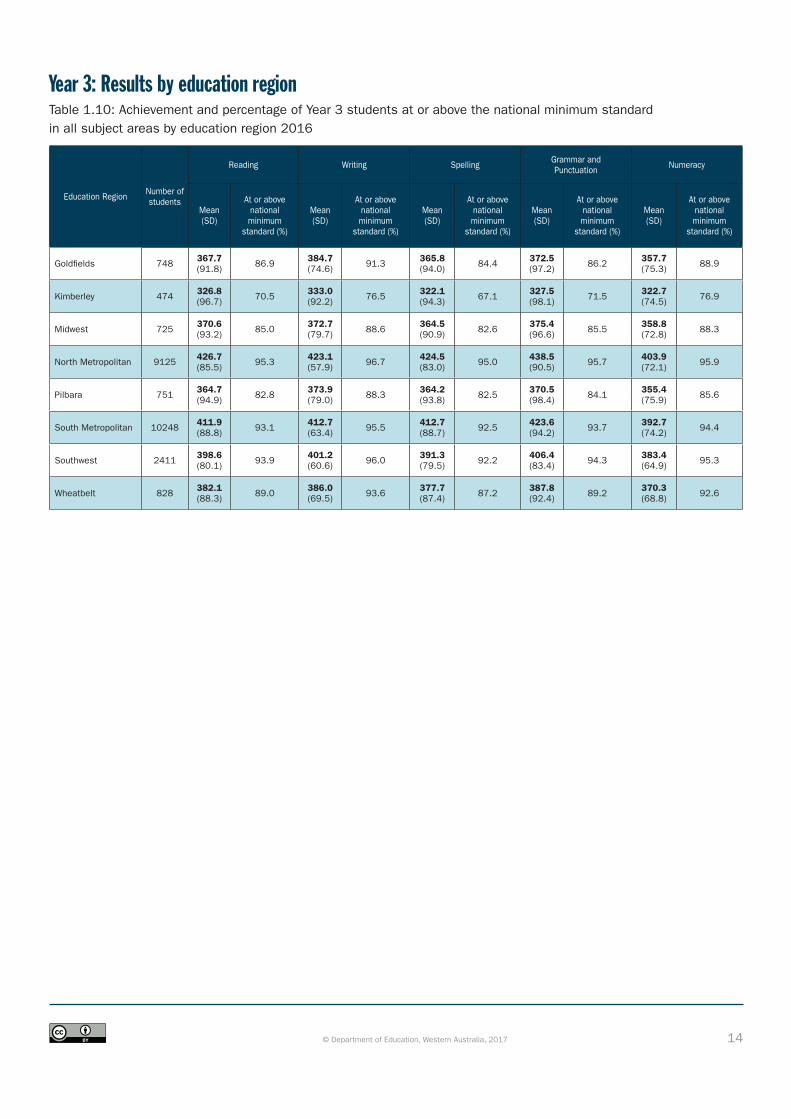
Year 3: Results by education regionTable 1.10: Achievement and percentage of Year 3 students at or above the national minimum standard in all subject areas by education region 2016
Education Region Number of students
Reading Writing Spelling Grammar and Punctuation Numeracy
Mean(SD)
At or above national minimum
standard (%)
Mean(SD)
At or above national minimum
standard (%)
Mean(SD)
At or above national minimum
standard (%)
Mean(SD)
At or above national minimum
standard (%)
Mean(SD)
At or above national minimum
standard (%)
Goldfields 748 367.7 (91.8) 86.9 384.7
(74.6) 91.3 365.8 (94.0) 84.4 372.5
(97.2) 86.2 357.7 (75.3) 88.9
Kimberley 474 326.8 (96.7) 70.5 333.0
(92.2) 76.5 322.1 (94.3) 67.1 327.5
(98.1) 71.5 322.7 (74.5) 76.9
Midwest 725 370.6 (93.2) 85.0 372.7
(79.7) 88.6 364.5 (90.9) 82.6 375.4
(96.6) 85.5 358.8 (72.8) 88.3
North Metropolitan 9125 426.7 (85.5) 95.3 423.1
(57.9) 96.7 424.5 (83.0) 95.0 438.5
(90.5) 95.7 403.9 (72.1) 95.9
Pilbara 751 364.7 (94.9) 82.8 373.9
(79.0) 88.3 364.2 (93.8) 82.5 370.5
(98.4) 84.1 355.4 (75.9) 85.6
South Metropolitan 10248 411.9 (88.8) 93.1 412.7
(63.4) 95.5 412.7 (88.7) 92.5 423.6
(94.2) 93.7 392.7 (74.2) 94.4
Southwest 2411 398.6 (80.1) 93.9 401.2
(60.6) 96.0 391.3 (79.5) 92.2 406.4
(83.4) 94.3 383.4 (64.9) 95.3
Wheatbelt 828 382.1 (88.3) 89.0 386.0
(69.5) 93.6 377.7 (87.4) 87.2 387.8
(92.4) 89.2 370.3 (68.8) 92.6
15© Department of Education, Western Australia, 2017
Table 2.1: Achievement of Year 5 students in all subject areas 2016
Subject
WA public schools
Mean scale score (SD)
Partici-pation rate
(%)
Below national minimum standard
(%)
At national minimum standard
(%)
Above national minimum standard (%)
WA public schools
At or above national minimum standard
(%)
Australian
Mean scale score
Australian
At or above national minimum standard
(%)Exempt Band 3
and below Band 4 Band 5 Band 6 Band 7 Band 8 and above
Reading 485.4 (82.2) 95.4 1.5 9.1 13.0 22.1 25.0 18.1 11.2 89.4 501.5 93.0
Writing 464.5 (64.9) 95.4 1.5 7.1 15.8 33.3 29.2 10.6 2.5 91.4 475.6 93.2
Spelling 482.9 (75.8) 95.7 1.5 7.9 13.1 24.0 27.6 17.2 8.7 90.6 492.9 92.8
Grammar and Punctuation 490.4 (82.0) 95.7 1.5 7.7 12.9 22.2 24.9 17.9 13.0 90.8 504.9 93.7
Numeracy 480.1 (72.3) 94.8 1.5 6.7 15.7 26.4 26.2 15.5 8.1 91.8 493.1 94.3
Year 5: Results all subjectsFigure 2.1: Achievement of Year 5 students in all subject areas in 20167
7The number of students for all assessments was 22 857.
Ban
d 3
Ban
d 4
Ban
d 5
Ban
d 6
Ban
d 7
Ban
d 8
Reading Writing Spelling Grammar and Punctuation
Numeracy100
200
300
400
500
700
600
Ach
ieve
men
t sc
ore
YEAR 5
16© Department of Education, Western Australia, 2017
Table 2.2: Achievement of Year 5 students in all subject areas by sex 2016
Subject
WA public schools
Mean scale score (SD)
Partici-pation rate
(%)
Below national minimum standard
(%)
At national minimum standard
(%)
Above national minimum standard (%)
WA public schools
At or above national minimum standard
(%)
Australian
Mean scale score
Australian
At or above national minimum standard
(%)Exempt Band 3
and below Band 4 Band 5 Band 6 Band 7 Band 8 and above
Reading
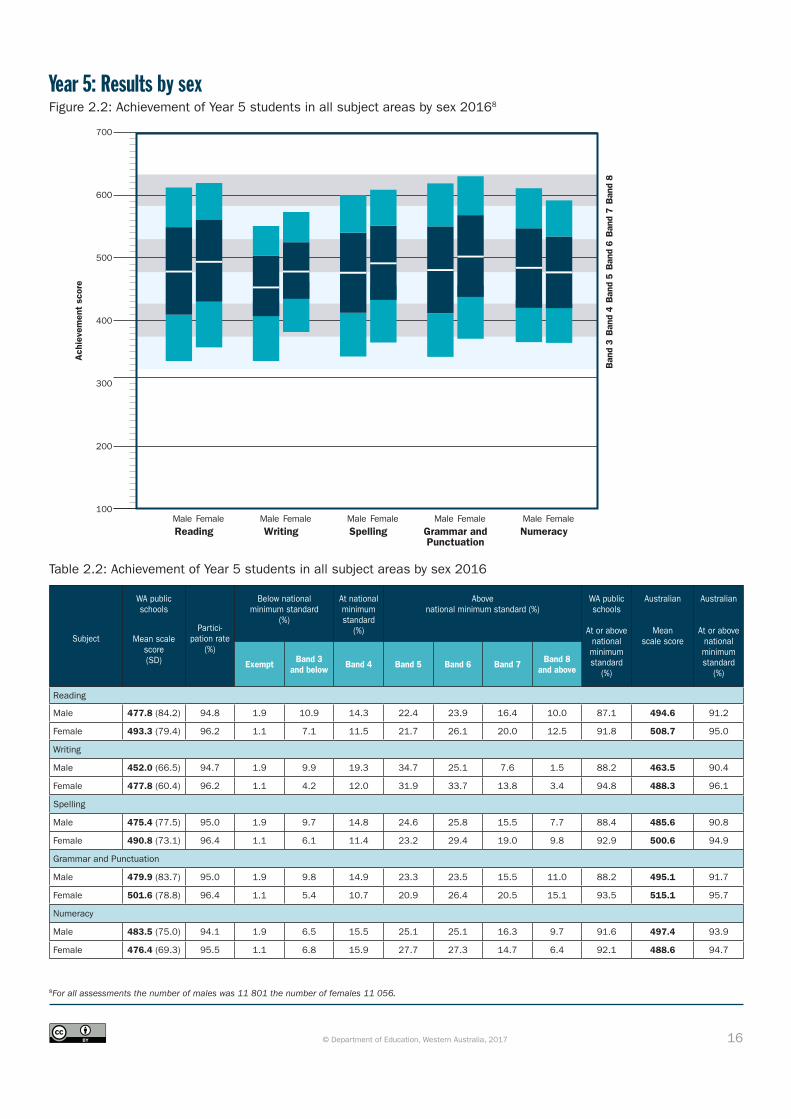
Male 477.8 (84.2) 94.8 1.9 10.9 14.3 22.4 23.9 16.4 10.0 87.1 494.6 91.2
Female 493.3 (79.4) 96.2 1.1 7.1 11.5 21.7 26.1 20.0 12.5 91.8 508.7 95.0
Writing
Male 452.0 (66.5) 94.7 1.9 9.9 19.3 34.7 25.1 7.6 1.5 88.2 463.5 90.4
Female 477.8 (60.4) 96.2 1.1 4.2 12.0 31.9 33.7 13.8 3.4 94.8 488.3 96.1
Spelling
Male 475.4 (77.5) 95.0 1.9 9.7 14.8 24.6 25.8 15.5 7.7 88.4 485.6 90.8
Female 490.8 (73.1) 96.4 1.1 6.1 11.4 23.2 29.4 19.0 9.8 92.9 500.6 94.9
Grammar and Punctuation
Male 479.9 (83.7) 95.0 1.9 9.8 14.9 23.3 23.5 15.5 11.0 88.2 495.1 91.7
Female 501.6 (78.8) 96.4 1.1 5.4 10.7 20.9 26.4 20.5 15.1 93.5 515.1 95.7
Numeracy
Male 483.5 (75.0) 94.1 1.9 6.5 15.5 25.1 25.1 16.3 9.7 91.6 497.4 93.9
Female 476.4 (69.3) 95.5 1.1 6.8 15.9 27.7 27.3 14.7 6.4 92.1 488.6 94.7
Year 5: Results by sexFigure 2.2: Achievement of Year 5 students in all subject areas by sex 20168
8For all assessments the number of males was 11 801 the number of females 11 056.
Ban
d 3
Ban
d 4
Ban
d 5
Ban
d 6
Ban
d 7
Ban
d 8
100
200
300
400
500
700
600
Ach
ieve
men
t sc
ore
Reading Writing Spelling Grammar and Punctuation
NumeracyMale Female Male Female Male Female Male Female Male Female
17© Department of Education, Western Australia, 2017
Table 2.3: Achievement of Year 5 students in all subject areas by Indigenous status 2016
Subject
WA public schools
Mean scale score (SD)
Partici-pation rate
(%)
Below national minimum standard
(%)
At national minimum standard
(%)
Above national minimum standard (%)
WA public schools
At or above national minimum standard
(%)
Australian
Mean scale score
Australian
At or above national minimum standard
(%)Exempt Band 3
and below Band 4 Band 5 Band 6 Band 7 Band 8 and above
Reading
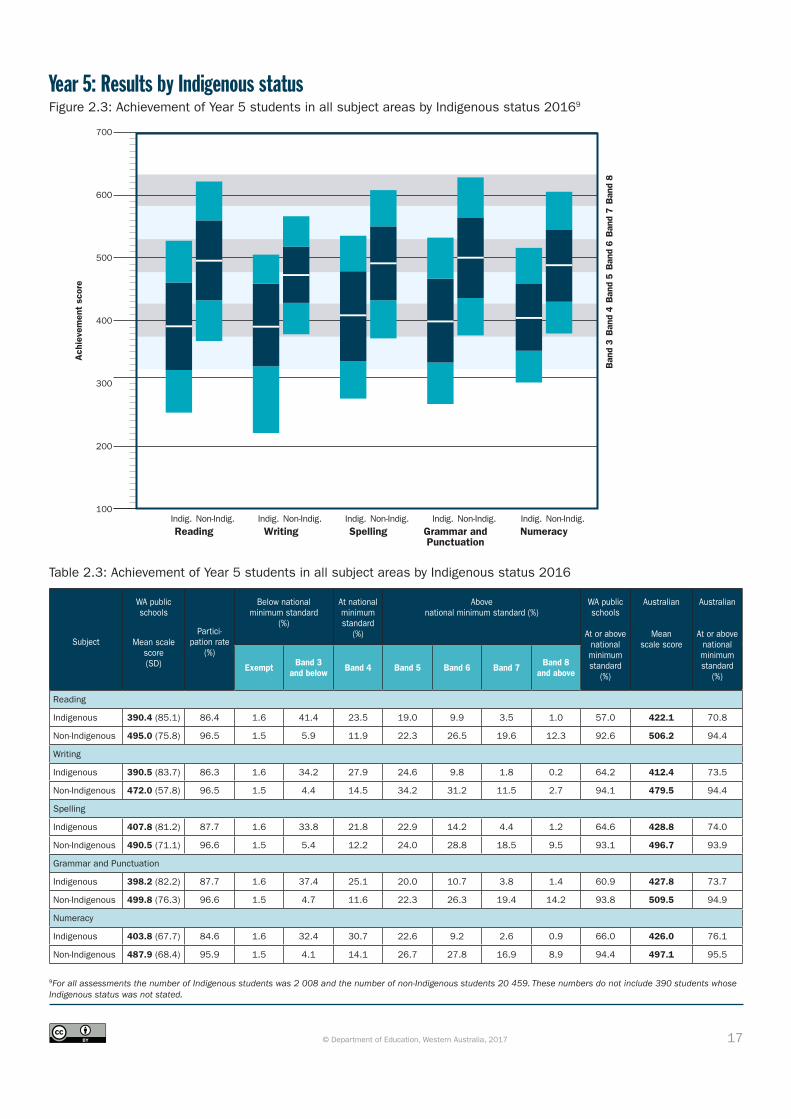
Indigenous 390.4 (85.1) 86.4 1.6 41.4 23.5 19.0 9.9 3.5 1.0 57.0 422.1 70.8
Non-Indigenous 495.0 (75.8) 96.5 1.5 5.9 11.9 22.3 26.5 19.6 12.3 92.6 506.2 94.4
Writing
Indigenous 390.5 (83.7) 86.3 1.6 34.2 27.9 24.6 9.8 1.8 0.2 64.2 412.4 73.5
Non-Indigenous 472.0 (57.8) 96.5 1.5 4.4 14.5 34.2 31.2 11.5 2.7 94.1 479.5 94.4
Spelling
Indigenous 407.8 (81.2) 87.7 1.6 33.8 21.8 22.9 14.2 4.4 1.2 64.6 428.8 74.0
Non-Indigenous 490.5 (71.1) 96.6 1.5 5.4 12.2 24.0 28.8 18.5 9.5 93.1 496.7 93.9
Grammar and Punctuation
Indigenous 398.2 (82.2) 87.7 1.6 37.4 25.1 20.0 10.7 3.8 1.4 60.9 427.8 73.7
Non-Indigenous 499.8 (76.3) 96.6 1.5 4.7 11.6 22.3 26.3 19.4 14.2 93.8 509.5 94.9
Numeracy
Indigenous 403.8 (67.7) 84.6 1.6 32.4 30.7 22.6 9.2 2.6 0.9 66.0 426.0 76.1
Non-Indigenous 487.9 (68.4) 95.9 1.5 4.1 14.1 26.7 27.8 16.9 8.9 94.4 497.1 95.5
Year 5: Results by Indigenous statusFigure 2.3: Achievement of Year 5 students in all subject areas by Indigenous status 20169
9For all assessments the number of Indigenous students was 2 008 and the number of non-Indigenous students 20 459. These numbers do not include 390 students whose Indigenous status was not stated.
Ban
d 3
Ban
d 4
Ban
d 5
Ban
d 6
Ban
d 7
Ban
d 8
100
200
300
400
500
700
600
Ach
ieve
men
t sc
ore
Reading Writing Spelling Grammar and Punctuation
NumeracyIndig. Non-Indig. Indig. Non-Indig. Indig. Non-Indig. Indig. Non-Indig. Indig. Non-Indig.
18© Department of Education, Western Australia, 2017
Table 2.4: Achievement of Year 5 students in all subject areas by LBOTE status 2016
Subject
WA public schools
Mean scale score (SD)
Partici-pation rate
(%)
Below national minimum standard
(%)
At national minimum standard
(%)
Above national minimum standard (%)
WA public schools
At or above national minimum standard
(%)
Australian
Mean scale score
Australian
At or above national minimum standard
(%)Exempt Band 3
and below Band 4 Band 5 Band 6 Band 7 Band 8 and above
Reading
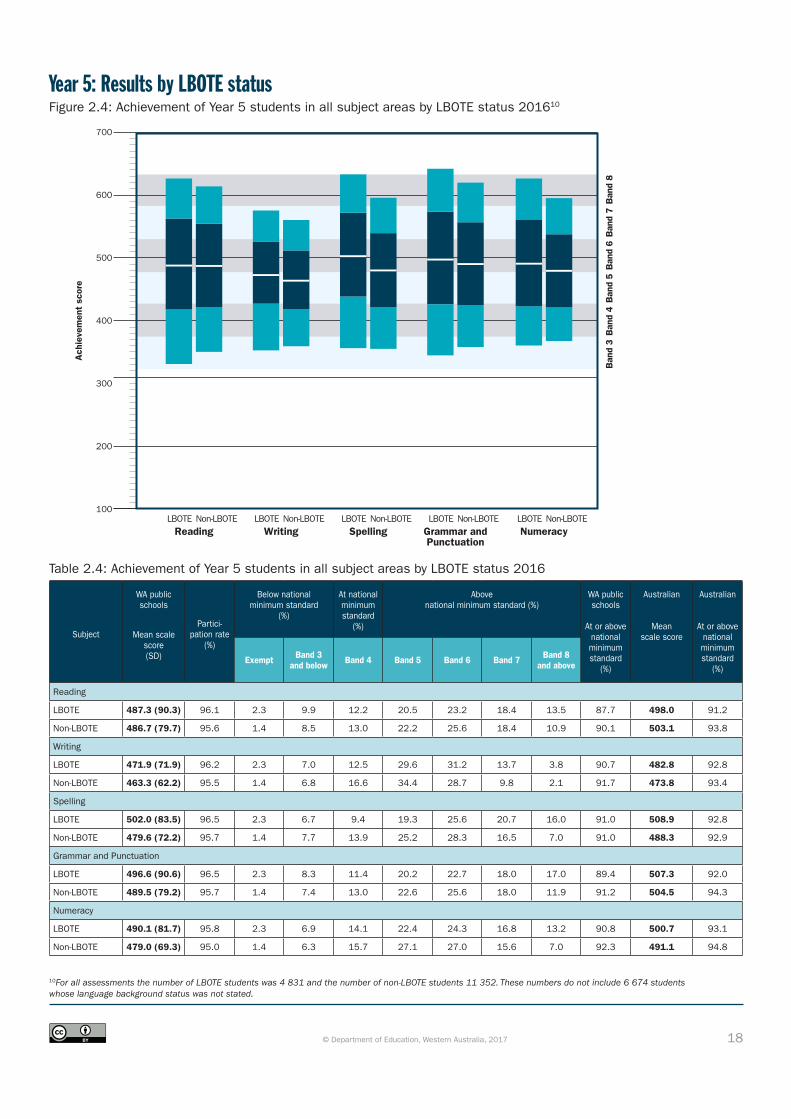
LBOTE 487.3 (90.3) 96.1 2.3 9.9 12.2 20.5 23.2 18.4 13.5 87.7 498.0 91.2
Non-LBOTE 486.7 (79.7) 95.6 1.4 8.5 13.0 22.2 25.6 18.4 10.9 90.1 503.1 93.8
Writing
LBOTE 471.9 (71.9) 96.2 2.3 7.0 12.5 29.6 31.2 13.7 3.8 90.7 482.8 92.8
Non-LBOTE 463.3 (62.2) 95.5 1.4 6.8 16.6 34.4 28.7 9.8 2.1 91.7 473.8 93.4
Spelling
LBOTE 502.0 (83.5) 96.5 2.3 6.7 9.4 19.3 25.6 20.7 16.0 91.0 508.9 92.8
Non-LBOTE 479.6 (72.2) 95.7 1.4 7.7 13.9 25.2 28.3 16.5 7.0 91.0 488.3 92.9
Grammar and Punctuation
LBOTE 496.6 (90.6) 96.5 2.3 8.3 11.4 20.2 22.7 18.0 17.0 89.4 507.3 92.0
Non-LBOTE 489.5 (79.2) 95.7 1.4 7.4 13.0 22.6 25.6 18.0 11.9 91.2 504.5 94.3
Numeracy
LBOTE 490.1 (81.7) 95.8 2.3 6.9 14.1 22.4 24.3 16.8 13.2 90.8 500.7 93.1
Non-LBOTE 479.0 (69.3) 95.0 1.4 6.3 15.7 27.1 27.0 15.6 7.0 92.3 491.1 94.8
Year 5: Results by LBOTE statusFigure 2.4: Achievement of Year 5 students in all subject areas by LBOTE status 201610
10For all assessments the number of LBOTE students was 4 831 and the number of non-LBOTE students 11 352. These numbers do not include 6 674 students whose language background status was not stated.
Ban
d 3
Ban
d 4
Ban
d 5
Ban
d 6
Ban
d 7
Ban
d 8
100
200
300
400
500
700
600
Ach
ieve
men
t sc
ore
Reading Writing Spelling Grammar and Punctuation
NumeracyLBOTE Non-LBOTE LBOTE Non-LBOTE LBOTE Non-LBOTE LBOTE Non-LBOTE LBOTE Non-LBOTE
19© Department of Education, Western Australia, 2017
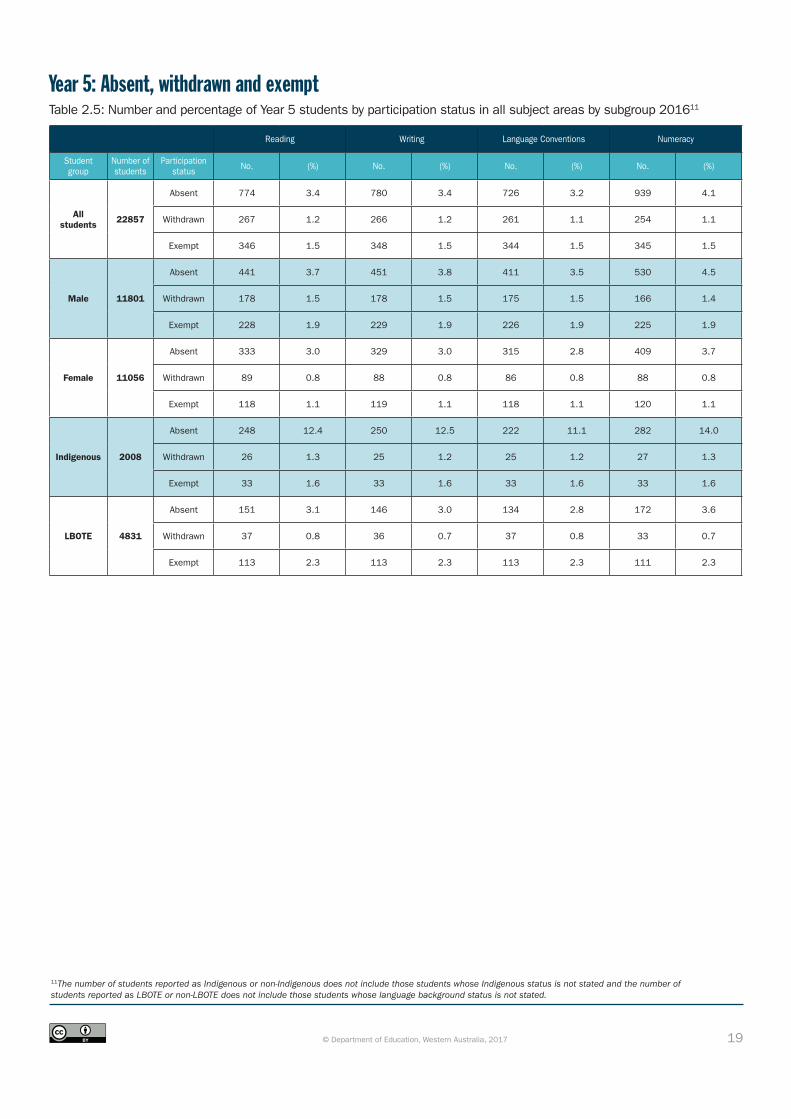
Year 5: Absent, withdrawn and exemptTable 2.5: Number and percentage of Year 5 students by participation status in all subject areas by subgroup 201611
Reading Writing Language Conventions Numeracy
Student group
Number of students
Participation status No. (%) No. (%) No. (%) No. (%)
All students 22857
Absent 774 3.4 780 3.4 726 3.2 939 4.1
Withdrawn 267 1.2 266 1.2 261 1.1 254 1.1
Exempt 346 1.5 348 1.5 344 1.5 345 1.5
Male 11801
Absent 441 3.7 451 3.8 411 3.5 530 4.5
Withdrawn 178 1.5 178 1.5 175 1.5 166 1.4
Exempt 228 1.9 229 1.9 226 1.9 225 1.9
Female 11056
Absent 333 3.0 329 3.0 315 2.8 409 3.7
Withdrawn 89 0.8 88 0.8 86 0.8 88 0.8
Exempt 118 1.1 119 1.1 118 1.1 120 1.1
Indigenous 2008
Absent 248 12.4 250 12.5 222 11.1 282 14.0
Withdrawn 26 1.3 25 1.2 25 1.2 27 1.3
Exempt 33 1.6 33 1.6 33 1.6 33 1.6
LBOTE 4831
Absent 151 3.1 146 3.0 134 2.8 172 3.6
Withdrawn 37 0.8 36 0.7 37 0.8 33 0.7
Exempt 113 2.3 113 2.3 113 2.3 111 2.3
11The number of students reported as Indigenous or non-Indigenous does not include those students whose Indigenous status is not stated and the number of students reported as LBOTE or non-LBOTE does not include those students whose language background status is not stated.
20© Department of Education, Western Australia, 2017
Year 5: Results by geolocationTable 2.6: Number of Year 5 students in all subject areas by geolocation 2016
Major cities 16475
Inner regional 2541
Outer regional 1946
Remote 1273
Very remote 622
Figure 2.5: Percentage of Year 5 students at or above the national minimum standard in all subject areas by geolocation 2016
0
10
20
30
40
50
60
70
80
90
100
Reading Writing Spelling Grammarand Punctuation
Numeracy
Maj
or c
ities
Inne
r re
gion
al
Out
er r
egio
nal
Rem
ote
Very
rem
ote
Maj
or c
ities
Inne
r re
gion
al
Out
er r
egio
nal
Rem
ote
Very
rem
ote
Maj
or c
ities
Inne
r re
gion
al
Out
er r
egio
nal
Rem
ote
Very
rem
ote
Maj
or c
ities
Inne
r re
gion
al
Out
er r
egio
nal
Rem
ote
Very
rem
ote
Maj
or c
ities
Inne
r re
gion
al
Out
er r
egio
nal
Rem
ote
Very
rem
ote
21© Department of Education, Western Australia, 2017
Table 2.7: Achievement of Year 5 students in all subject areas by geolocation 2016
Subject
WA public schools
Mean scale score (SD)
Partici pation rate(%)
Below national minimum standard
(%)
At national minimum standard
(%)
Above national minimum standard (%)
WA public schools
At or above national minimum standard
(%)
Australian
Mean scale score
Australian
At or above national minimum standard
(%)Exempt Band 1
and below Band 2 Band 3 Band 4 Band 5 Band 6 and above
Reading
Major cities 495.2 (78.6) 96.3 1.6 6.6 11.8 21.5 25.7 19.8 13.0 91.8 509.0 94.5
Inner regional 477.8 (74.4) 95.6 1.2 8.7 14.9 24.8 26.7 15.9 7.9 90.1 493.4 92.7
Outer regional 462.0 (79.4) 93.9 1.1 14.1 17.5 24.6 23.4 13.1 6.2 84.8 481.5 89.5
Remote 455.2 (87.7) 93.0 1.3 17.9 16.7 23.4 20.3 14.1 6.4 80.9 458.4 81.4
Very remote 391.7 (108.7) 82.8 1.4 43.4 14.6 17.0 14.0 6.9 2.6 55.1 365.5 46.0
Writing
Major cities 472.6 (60.0) 96.2 1.7 4.8 14.1 33.1 31.3 12.1 3.0 93.5 482.7 94.6
Inner regional 457.3 (59.5) 95.7 1.2 7.4 18.1 37.0 27.1 7.9 1.3 91.4 466.8 92.5
Outer regional 447.1 (64.1) 93.8 1.1 11.1 21.6 34.3 24.9 6.1 1.0 87.8 457.8 90.2
Remote 440.5 (72.8) 92.9 1.3 14.5 21.7 32.8 21.2 7.1 1.3 84.2 437.6 82.4
Very remote 384.5 (104.2) 83.0 1.4 38.9 18.7 22.9 14.1 3.4 0.6 59.7 358.5 50.4
Spelling
Major cities 492.9 (72.8) 96.4 1.6 5.6 11.5 22.9 28.8 19.1 10.5 92.8 501.9 94.4
Inner regional 471.1 (68.8) 95.6 1.2 8.5 15.7 28.3 26.9 14.5 4.8 90.3 479.2 91.3
Outer regional 460.1 (73.0) 94.3 1.1 12.4 17.9 27.5 24.9 12.2 4.1 86.6 471.4 89.1
Remote 451.5 (78.6) 93.3 1.3 15.9 18.9 25.3 23.6 11.2 3.8 82.8 452.3 82.5
Very remote 402.6 (93.5) 85.0 1.4 37.8 17.9 20.2 14.5 6.7 1.5 60.8 378.1 52.6
Grammar and Punctuation
Major cities 500.4 (79.0) 96.4 1.6 5.4 11.6 21.3 25.5 19.4 15.2 92.9 512.7 94.9
Inner regional 479.3 (73.9) 95.6 1.2 7.6 15.3 25.8 26.1 15.8 8.3 91.3 495.1 93.4
Outer regional 468.2 (78.4) 94.3 1.1 11.8 17.1 24.9 23.9 14.1 7.0 87.1 485.2 90.8
Remote 461.0 (86.7) 93.3 1.3 15.4 16.8 23.6 21.7 14.0 7.3 83.3 462.5 83.2
Very remote 402.5 (103.5) 85.0 1.4 38.9 16.4 18.6 13.8 7.6 3.1 59.6 379.7 51.7
Numeracy
Major cities 489.2 (70.8) 95.7 1.6 4.6 14.0 25.5 27.1 17.3 9.9 93.8 500.9 95.4
Inner regional 469.2 (63.4) 94.7 1.2 6.6 18.1 30.9 26.5 12.8 3.9 92.2 482.2 94.0
Outer regional 458.7 (66.9) 93.0 1.1 10.3 21.7 28.6 24.2 10.4 3.7 88.7 472.4 92.0
Remote 451.9 (72.7) 92.0 1.3 14.4 21.0 27.4 22.1 10.6 3.3 84.4 453.3 85.0
Very remote 408.3 (85.7) 81.7 1.3 35.0 21.2 20.6 15.0 5.7 1.2 63.7 396.7 57.9

22© Department of Education, Western Australia, 2017
Year 5: Results by geolocation and Indigenous statusTable 2.8: Achievement of Year 5 students in all subject areas by geolocation and Indigenous status 201612
Geolocation Number of students
Reading Writing Spelling Grammar and Punctuation Numeracy
Mean (SD) Mean (SD) Mean (SD) Mean (SD) Mean (SD)
Major cities
Indigenous 829 414.1 (75.5) 412.1 (71.8) 429.5 (74.5) 420.3 (73.8) 422.6 (61.3)
Non-Indigenous 15367 500.0 (76.2) 476.2 (57.3) 496.7 (71.1) 505.2 (76.9) 493.3 (69.4)
Inner regional
Indigenous 201 419.2 (79.7) 412.9 (73.1) 429.9 (78.7) 420.6 (80.6) 420.9 (65.1)
Non-Indigenous 2268 483.2 (71.8) 461.0 (56.8) 474.6 (66.8) 484.5 (71.3) 473.7 (61.8)
Outer regional
Indigenous 325 395.7 (70.9) 400.0 (69.7) 413.9 (70.3) 404.7 (69.4) 408.8 (57.6)
Non-Indigenous 1605 475.4 (74.2) 456.6 (58.2) 469.7 (70.0) 481.1 (73.7) 468.9 (64.0)
Remote
Indigenous 314 374.3 (79.1) 379.7 (80.2) 390.4 (78.1) 381.2 (78.2) 388.2 (63.9)
Non-Indigenous 939 482.7 (72.4) 461.3 (56.8) 472.3 (67.4) 488.1 (71.9) 473.5 (62.3)
Very remote
Indigenous 339 325.8 (90.8) 325.9 (96.3) 352.5 (81.4) 340.9 (86.4) 358.2 (71.8)
Non-Indigenous 280 471.2 (66.8) 455.5 (59.8) 462.8 (67.3) 476.6 (66.7) 468.6 (57.3)
12Number of students does not include 390 students whose Indigenous status was not stated.
23© Department of Education, Western Australia, 2017
Figure 2.6: Percentage of Year 5 students at or above the national minimum standard in all subject areas by geolocation and Indigenous status 2016
Table 2.9: Percentage of Year 5 students at or above national minimum standard in all subject areas by geolocation and Indigenous status 2016
Geolocation
Reading Writing Spelling Grammar and Punctuation Numeracy
At or above the national minimum standard (%)
Major cities
Indigenous 68.3 74.0 73.8 71.0 76.2
Non-Indigenous 93.1 94.7 93.9 94.2 94.8
Inner regional
Indigenous 70.5 75.3 75.7 71.9 75.3
Non-Indigenous 91.9 92.8 91.6 93.0 93.7
Outer regional
Indigenous 60.7 69.7 70.2 66.3 71.3
Non-Indigenous 89.7 91.5 89.9 91.3 92.2
Remote
Indigenous 48.1 57.7 55.9 52.0 56.2
Non-Indigenous 91.9 93.5 91.8 93.8 93.8
Very remote
Indigenous 25.7 34.2 37.8 32.7 39.3
Non-Indigenous 90.6 90.5 88.5 92.1 93.3
0
10
20
30
40
50
60
70
80
90
100
Reading Writing Spelling Grammarand Punctuation
Numeracy
Indigenous Non-Indigenous
Maj
or c
ities
Inne
r re
gion
alO
uter
reg
iona
lR
emot
eVe
ry r
emot
e
Maj
or c
ities
Inne
r re
gion
alO
uter
reg
iona
lR
emot
eVe
ry r
emot
e
Indigenous Non-Indigenous
Maj
or c
ities
Inne
r re
gion
alO
uter
reg
iona
lR
emot
eVe
ry r
emot
e
Maj
or c
ities
Inne
r re
gion
alO
uter
reg
iona
lR
emot
eVe
ry r
emot
e
Indigenous Non-Indigenous
Maj
or c
ities
Inne
r re
gion
alO
uter
reg
iona
lR
emot
eVe
ry r
emot
e
Maj
or c
ities
Inne
r re
gion
alO
uter
reg
iona
lR
emot
eVe
ry r
emot
e
Indigenous Non-Indigenous
Maj
or c
ities
Inne
r re
gion
alO
uter
reg
iona
lR
emot
eVe
ry r
emot
e
Maj
or c
ities
Inne
r re
gion
alO
uter
reg
iona
lR
emot
eVe
ry r
emot
e
Indigenous Non-Indigenous
Maj
or c
ities
Inne
r re
gion
alO
uter
reg
iona
lR
emot
eVe
ry r
emot
e
Maj
or c
ities
Inne
r re
gion
alO
uter
reg
iona
lR
emot
eVe
ry r
emot
e

24© Department of Education, Western Australia, 2017
Year 5: Results by education regionTable 2.10: Achievement and percentage of Year 5 students at or above the national minimum standard in all subject areas by education region 2016
Education Region Number of students
Reading Writing Spelling Grammar and Punctuation Numeracy
Mean(SD)
At or above national minimum
standard (%)
Mean(SD)
At or above national minimum
standard (%)
Mean(SD)
At or above national minimum
standard (%)
Mean(SD)
At or above national minimum
standard (%)
Mean(SD)
At or above national minimum
standard (%)
Goldfields 703 444.0 (94.7) 79.4 437.3
(79.9) 85.1 444.6 (82.0) 81.5 451.3
(90.9) 82.3 444.6 (77.6) 84.2
Kimberley 448 393.0 (102.2) 53.0 385.0
(100.6) 59.0 401.5 (87.4) 60.1 402.9
(97.1) 57.8 407.4 (78.4) 61.3
Midwest 696 441.6 (90.4) 76.3 430.8
(76.4) 80.1 442.1 (80.8) 78.8 447.7
(89.6) 79.1 443.0 (75.3) 80.5
North Metropolitan 8191 499.4 (76.6) 92.9 475.5
(57.6) 94.5 495.6 (70.1) 93.9 504.3
(77.2) 93.9 492.9 (68.8) 94.8
Pilbara 697 449.4 (86.0) 79.4 433.1
(73.4) 80.5 449.4 (80.3) 81.3 454.5
(84.5) 81.8 446.4 (69.9) 83.8
South Metropolitan 8967 490.0 (79.7) 90.7 469.0
(61.8) 92.6 489.0 (74.8) 91.7 495.3
(80.2) 92.0 484.2 (71.9) 92.8
Southwest 2368 480.3 (74.5) 90.6 457.5
(59.8) 91.8 472.9 (68.7) 90.9 482.9
(73.9) 91.9 472.5 (63.9) 92.7
Wheatbelt 787 462.8 (79.3) 84.4 449.7
(63.8) 87.7 458.6 (72.3) 85.8 468.6
(78.7) 86.6 458.7 (66.3) 88.4
25© Department of Education, Western Australia, 2017
Ban
d 4
Ban
d 5
Ban
d 6
Ban
d 7
Ban
d 8
Ban
d 9
Table 3.1: Achievement of Year 7 students in all subject areas 2016
Subject
WA public schools
Mean scale score (SD)
Partici pation rate(%)
Below national minimum standard
(%)
At national minimum standard
(%)
Above national minimum standard (%)
WA public schools
At or above national minimum standard
(%)
Australian
Mean scale score
Australian
At or above national minimum standard
(%)Exempt Band 4
and below Band 5 Band 6 Band 7 Band 8 Band 9 and above
Reading 525.0 (70.3) 93.9 1.9 7.1 18.1 27.5 25.2 13.9 6.3 91.0 540.8 94.6
Writing 500.3 (75.1) 94.1 1.9 13.0 21.5 30.1 21.5 9.0 2.9 85.0 515.0 89.7
Spelling 529.8 (76.8) 94.5 1.9 9.0 15.0 25.2 25.0 15.2 8.8 89.1 542.9 93.1
Grammar and Punctuation 523.9 (78.6) 94.5 1.9 10.0 17.7 25.1 22.7 14.3 8.3 88.1 540.0 92.6
Numeracy 535.8 (74.3) 93.2 1.9 5.2 17.4 25.0 25.2 15.6 9.7 92.9 549.7 95.5
Year 7: Results all subjectsFigure 3.1: Achievement of Year 7 students in all subject areas in 201613
13The number of students for all assessments was 17 956.
Reading Writing Spelling Grammar and Punctuation
Numeracy100
200
300
400
500
800
700
600
Ach
ieve
men
t sc
ore
YEAR 7
26© Department of Education, Western Australia, 2017
Table 3.2: Achievement of Year 7 students in all subject areas by sex 2016
Subject
WA public schools
Mean scale score (SD)
Partici pation rate(%)
Below national minimum standard
(%)
At national minimum standard
(%)
Above national minimum standard (%)
WA public schools
At or above national minimum standard
(%)
Australian
Mean scale score
Australian
At or above national minimum standard
(%)Exempt Band 4
and below Band 5 Band 6 Band 7 Band 8 Band 9 and above
Reading
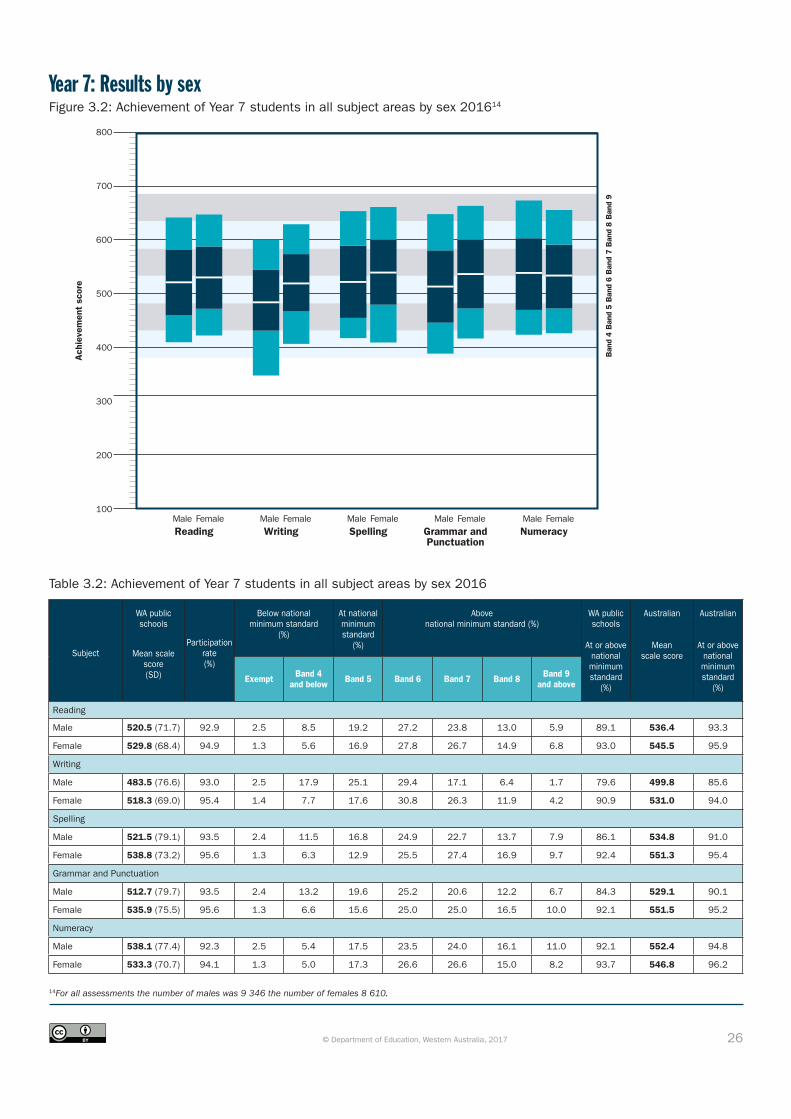
Male 520.5 (71.7) 92.9 2.5 8.5 19.2 27.2 23.8 13.0 5.9 89.1 536.4 93.3
Female 529.8 (68.4) 94.9 1.3 5.6 16.9 27.8 26.7 14.9 6.8 93.0 545.5 95.9
Writing
Male 483.5 (76.6) 93.0 2.5 17.9 25.1 29.4 17.1 6.4 1.7 79.6 499.8 85.6
Female 518.3 (69.0) 95.4 1.4 7.7 17.6 30.8 26.3 11.9 4.2 90.9 531.0 94.0
Spelling
Male 521.5 (79.1) 93.5 2.4 11.5 16.8 24.9 22.7 13.7 7.9 86.1 534.8 91.0
Female 538.8 (73.2) 95.6 1.3 6.3 12.9 25.5 27.4 16.9 9.7 92.4 551.3 95.4
Grammar and Punctuation
Male 512.7 (79.7) 93.5 2.4 13.2 19.6 25.2 20.6 12.2 6.7 84.3 529.1 90.1
Female 535.9 (75.5) 95.6 1.3 6.6 15.6 25.0 25.0 16.5 10.0 92.1 551.5 95.2
Numeracy
Male 538.1 (77.4) 92.3 2.5 5.4 17.5 23.5 24.0 16.1 11.0 92.1 552.4 94.8
Female 533.3 (70.7) 94.1 1.3 5.0 17.3 26.6 26.6 15.0 8.2 93.7 546.8 96.2
Year 7: Results by sexFigure 3.2: Achievement of Year 7 students in all subject areas by sex 201614
14For all assessments the number of males was 9 346 the number of females 8 610.
Ban
d 4
Ban
d 5
Ban
d 6
Ban
d 7
Ban
d 8
Ban
d 9
100
200
300
400
500
800
700
600
Ach
ieve
men
t sc
ore
Reading Writing Spelling Grammar and Punctuation
NumeracyMale Female Male Female Male Female Male Female Male Female
27© Department of Education, Western Australia, 2017
Table 3.3: Achievement of Year 7 students in all subject areas by Indigenous status 2016
Subject
WA public schools
Mean scale score (SD)
Partici pation rate(%)
Below national minimum standard
(%)
At national minimum standard
(%)
Above national minimum standard (%)
WA public schools
At or above national minimum standard
(%)
Australian
Mean scale score
Australian
At or above national minimum standard
(%)Exempt Band 4
and below Band 5 Band 6 Band 7 Band 8 Band 9 and above
Reading
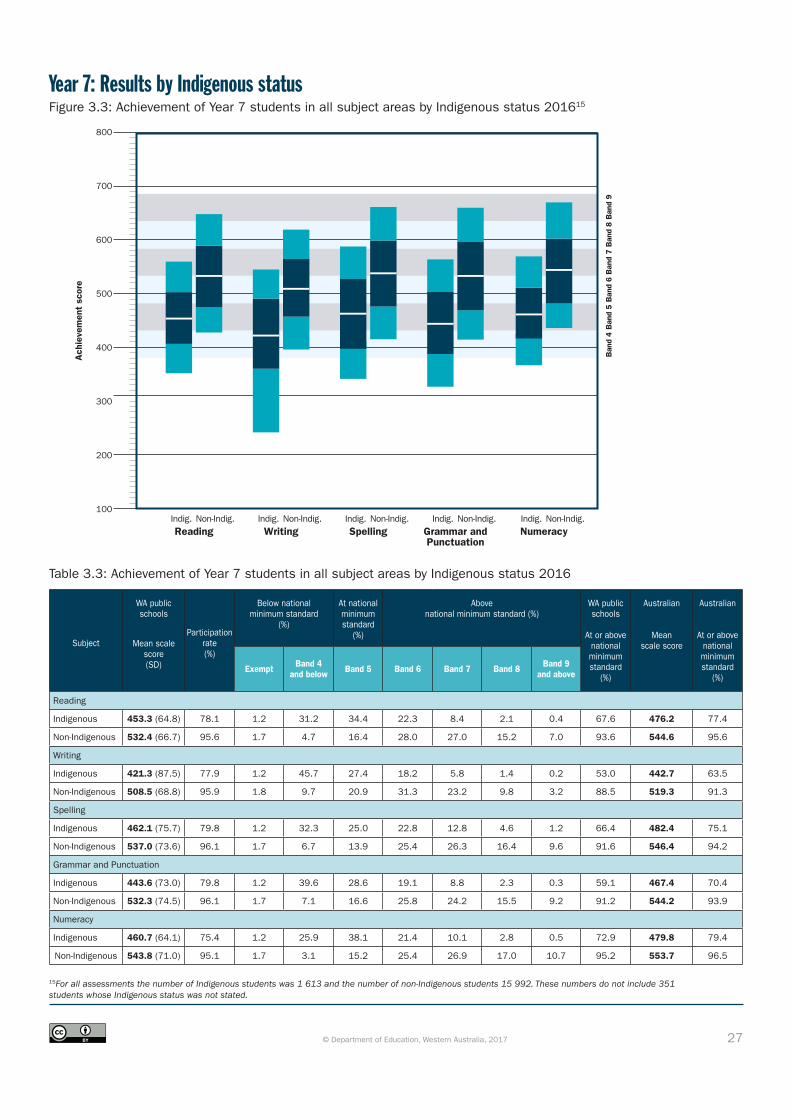
Indigenous 453.3 (64.8) 78.1 1.2 31.2 34.4 22.3 8.4 2.1 0.4 67.6 476.2 77.4
Non-Indigenous 532.4 (66.7) 95.6 1.7 4.7 16.4 28.0 27.0 15.2 7.0 93.6 544.6 95.6
Writing
Indigenous 421.3 (87.5) 77.9 1.2 45.7 27.4 18.2 5.8 1.4 0.2 53.0 442.7 63.5
Non-Indigenous 508.5 (68.8) 95.9 1.8 9.7 20.9 31.3 23.2 9.8 3.2 88.5 519.3 91.3
Spelling
Indigenous 462.1 (75.7) 79.8 1.2 32.3 25.0 22.8 12.8 4.6 1.2 66.4 482.4 75.1
Non-Indigenous 537.0 (73.6) 96.1 1.7 6.7 13.9 25.4 26.3 16.4 9.6 91.6 546.4 94.2
Grammar and Punctuation
Indigenous 443.6 (73.0) 79.8 1.2 39.6 28.6 19.1 8.8 2.3 0.3 59.1 467.4 70.4
Non-Indigenous 532.3 (74.5) 96.1 1.7 7.1 16.6 25.8 24.2 15.5 9.2 91.2 544.2 93.9
Numeracy
Indigenous 460.7 (64.1) 75.4 1.2 25.9 38.1 21.4 10.1 2.8 0.5 72.9 479.8 79.4
Non-Indigenous 543.8 (71.0) 95.1 1.7 3.1 15.2 25.4 26.9 17.0 10.7 95.2 553.7 96.5
Year 7: Results by Indigenous statusFigure 3.3: Achievement of Year 7 students in all subject areas by Indigenous status 201615
15For all assessments the number of Indigenous students was 1 613 and the number of non-Indigenous students 15 992. These numbers do not include 351 students whose Indigenous status was not stated.
Ban
d 4
Ban
d 5
Ban
d 6
Ban
d 7
Ban
d 8
Ban
d 9
100
200
300
400
500
800
700
600
Ach
ieve
men
t sc
ore
Reading Writing Spelling Grammar and Punctuation
NumeracyIndig. Non-Indig. Indig. Non-Indig. Indig. Non-Indig. Indig. Non-Indig. Indig. Non-Indig.

28© Department of Education, Western Australia, 2017
Table 3.4: Achievement of Year 7 students in all subject areas by LBOTE status 2016
Subject
WA public schools
Mean scale score (SD)
Partici pation rate(%)
Below national minimum standard
(%)
At national minimum standard
(%)
Above national minimum standard (%)
WA public schools
At or above national minimum standard
(%)
Australian
Mean scale score
Australian
At or above national minimum standard
(%)Exempt Band 4
and below Band 5 Band 6 Band 7 Band 8 Band 9 and above
Reading
LBOTE 525.0 (78.7) 95.3 1.7 8.9 18.3 25.4 22.9 14.1 8.6 89.3 536.7 92.4
Non-LBOTE 525.9 (67.6) 94.3 1.8 6.4 17.9 27.9 26.2 14.2 5.8 91.8 542.3 95.3
Writing
LBOTE 508.3 (80.6) 95.4 1.7 12.5 18.6 28.3 22.7 11.7 4.6 85.8 520.1 89.6
Non-LBOTE 500.2 (72.6) 94.4 1.8 12.6 22.1 30.5 21.6 8.7 2.7 85.5 513.9 89.9
Spelling
LBOTE 549.8 (87.2) 95.8 1.7 7.9 12.1 19.9 22.6 18.6 17.2 90.4 558.1 92.7
Non-LBOTE 526.3 (72.7) 94.9 1.8 8.9 15.3 26.4 25.7 15.0 6.7 89.3 538.7 93.4
Grammar and Punctuation
LBOTE 532.7 (89.7) 95.8 1.7 10.6 16.2 21.9 20.9 15.4 13.4 87.7 545.2 91.2
Non-LBOTE 523.2 (74.8) 94.9 1.8 9.5 17.7 25.8 23.6 14.6 6.9 88.7 538.8 93.1
Numeracy
LBOTE 550.0 (87.2) 94.6 1.7 5.6 14.9 21.8 21.9 17.0 17.0 92.6 559.5 94.4
Non-LBOTE 534.1 (70.2) 93.3 1.8 4.9 17.6 25.3 26.6 15.8 8.1 93.3 547.1 95.9
Year 7: Results by LBOTE statusFigure 3.4: Achievement of Year 7 students in all subject areas by LBOTE status 201616
16For all assessments the number of LBOTE students was 3 569 and the number of non-LBOTE students 9 008. These numbers do not include 5 379 students whose language background status was not stated.
Ban
d 4
Ban
d 5
Ban
d 6
Ban
d 7
Ban
d 8
Ban
d 9
100
200
300
400
500
800
700
600
Ach
ieve
men
t sc
ore
Reading Writing Spelling Grammar and Punctuation
NumeracyLBOTE Non-LBOTE LBOTE Non-LBOTE LBOTE Non-LBOTE LBOTE Non-LBOTE LBOTE Non-LBOTE

29© Department of Education, Western Australia, 2017
Year 7: Absent, withdrawn and exemptTable 3.5: Number and percentage of Year 7 students by participation status in all subject areas by subgroup 201617
Reading Writing Language Conventions Numeracy
Student group
Number of students
Participation status No. (%) No. (%) No. (%) No. (%)
All students 17956
Absent 1038 5.8 996 5.5 932 5.2 1168 6.5
Withdrawn 59 0.3 57 0.3 56 0.3 58 0.3
Exempt 343 1.9 348 1.9 341 1.9 343 1.9
Male 9346
Absent 616 6.6 613 6.6 565 6.0 676 7.2
Withdrawn 43 0.5 41 0.4 41 0.4 42 0.4
Exempt 229 2.5 231 2.5 227 2.4 229 2.5
Female 8610
Absent 422 4.9 383 4.4 367 4.3 492 5.7
Withdrawn 16 0.2 16 0.2 15 0.2 16 0.2
Exempt 114 1.3 117 1.4 114 1.3 114 1.3
Indigenous 1613
Absent 349 21.6 351 21.8 321 19.9 394 24.4
Withdrawn 5 0.3 5 0.3 5 0.3 3 0.2
Exempt 19 1.2 20 1.2 20 1.2 19 1.2
LBOTE 3569
Absent 161 4.5 159 4.5 143 4.0 187 5.2
Withdrawn 7 0.2 6 0.2 6 0.2 7 0.2
Exempt 62 1.7 62 1.7 61 1.7 61 1.7
17The number of students reported as Indigenous or non-Indigenous does not include those students whose Indigenous status is not stated and the number of students reported as LBOTE or non-LBOTE does not include those students whose language background status is not stated.
30© Department of Education, Western Australia, 2017
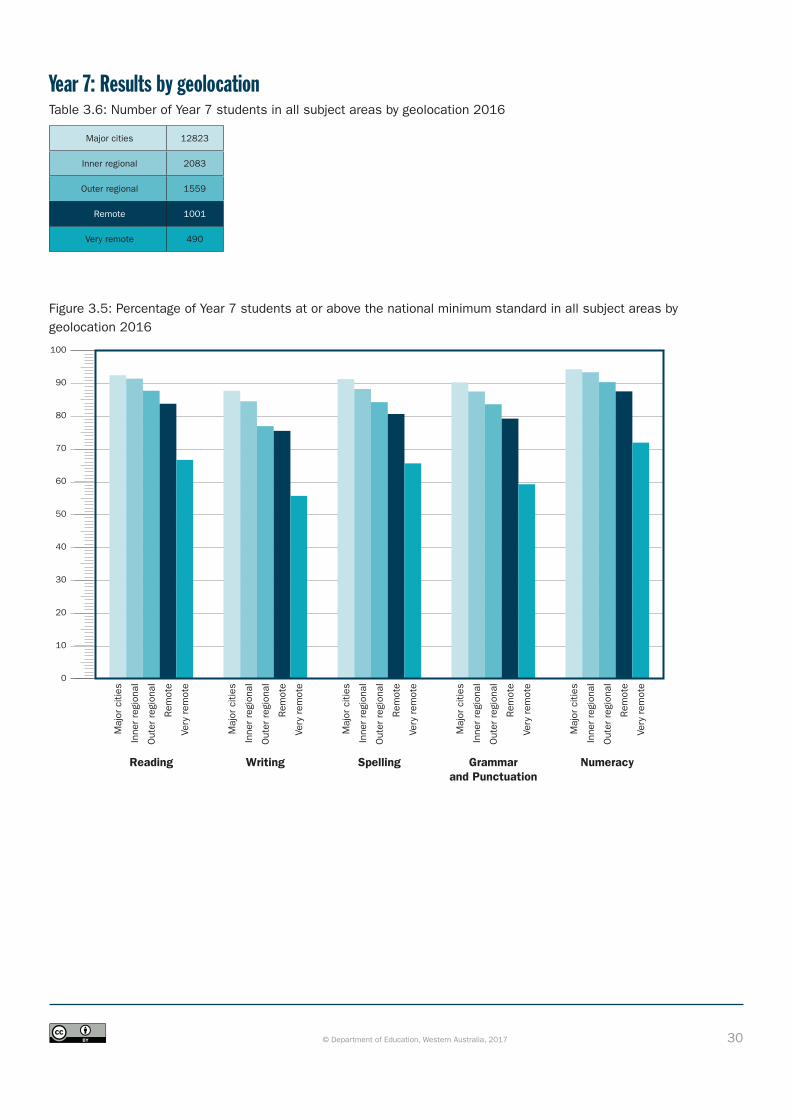
Year 7: Results by geolocationTable 3.6: Number of Year 7 students in all subject areas by geolocation 2016
Major cities 12823
Inner regional 2083
Outer regional 1559
Remote 1001
Very remote 490
Figure 3.5: Percentage of Year 7 students at or above the national minimum standard in all subject areas by geolocation 2016
0
10
20
30
40
50
60
70
80
90
100
Reading Writing Spelling Grammarand Punctuation
Numeracy
Maj
or c
ities
Inne
r re
gion
al
Out
er r
egio
nal
Rem
ote
Very
rem
ote
Maj
or c
ities
Inne
r re
gion
al
Out
er r
egio
nal
Rem
ote
Very
rem
ote
Maj
or c
ities
Inne
r re
gion
al
Out
er r
egio
nal
Rem
ote
Very
rem
ote
Maj
or c
ities
Inne
r re
gion
al
Out
er r
egio
nal
Rem
ote
Very
rem
ote
Maj
or c
ities
Inne
r re
gion
al
Out
er r
egio
nal
Rem
ote
Very
rem
ote
31© Department of Education, Western Australia, 2017
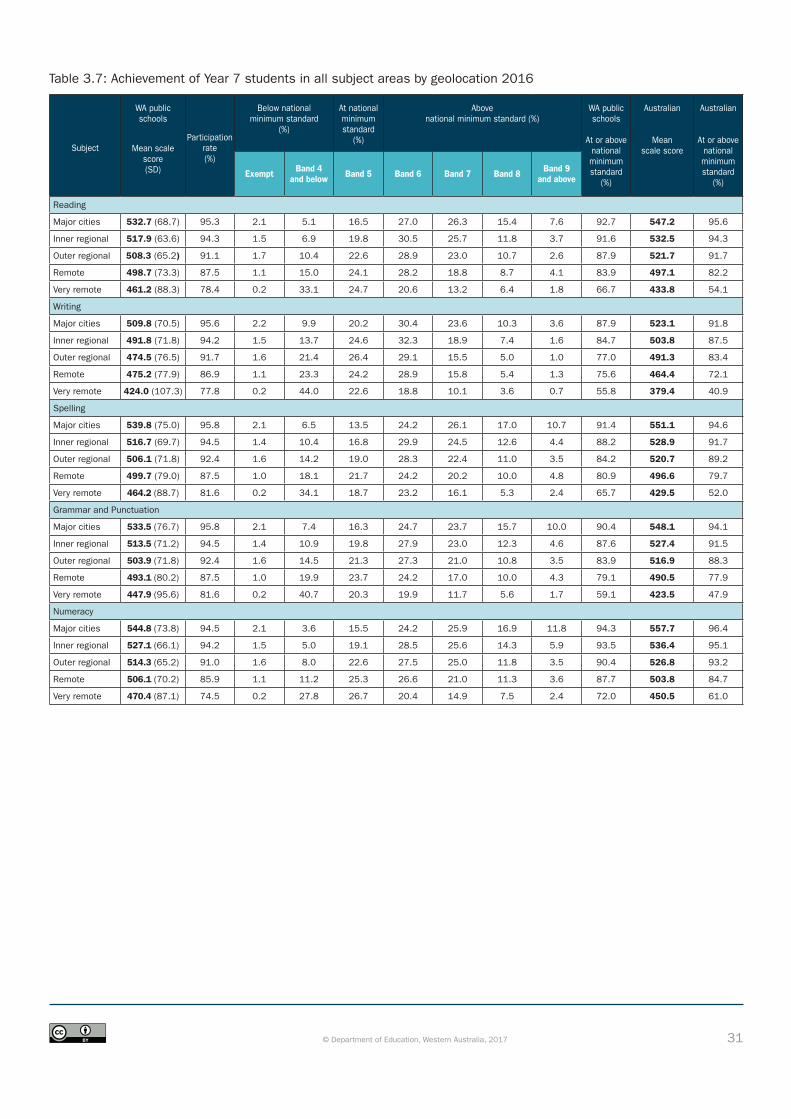
Table 3.7: Achievement of Year 7 students in all subject areas by geolocation 2016
Subject
WA public schools
Mean scale score (SD)
Partici pation rate(%)
Below national minimum standard
(%)
At national minimum standard
(%)
Above national minimum standard (%)
WA public schools
At or above national minimum standard
(%)
Australian
Mean scale score
Australian
At or above national minimum standard
(%)Exempt Band 4
and below Band 5 Band 6 Band 7 Band 8 Band 9 and above
Reading
Major cities 532.7 (68.7) 95.3 2.1 5.1 16.5 27.0 26.3 15.4 7.6 92.7 547.2 95.6
Inner regional 517.9 (63.6) 94.3 1.5 6.9 19.8 30.5 25.7 11.8 3.7 91.6 532.5 94.3
Outer regional 508.3 (65.2) 91.1 1.7 10.4 22.6 28.9 23.0 10.7 2.6 87.9 521.7 91.7
Remote 498.7 (73.3) 87.5 1.1 15.0 24.1 28.2 18.8 8.7 4.1 83.9 497.1 82.2
Very remote 461.2 (88.3) 78.4 0.2 33.1 24.7 20.6 13.2 6.4 1.8 66.7 433.8 54.1
Writing
Major cities 509.8 (70.5) 95.6 2.2 9.9 20.2 30.4 23.6 10.3 3.6 87.9 523.1 91.8
Inner regional 491.8 (71.8) 94.2 1.5 13.7 24.6 32.3 18.9 7.4 1.6 84.7 503.8 87.5
Outer regional 474.5 (76.5) 91.7 1.6 21.4 26.4 29.1 15.5 5.0 1.0 77.0 491.3 83.4
Remote 475.2 (77.9) 86.9 1.1 23.3 24.2 28.9 15.8 5.4 1.3 75.6 464.4 72.1
Very remote 424.0 (107.3) 77.8 0.2 44.0 22.6 18.8 10.1 3.6 0.7 55.8 379.4 40.9
Spelling
Major cities 539.8 (75.0) 95.8 2.1 6.5 13.5 24.2 26.1 17.0 10.7 91.4 551.1 94.6
Inner regional 516.7 (69.7) 94.5 1.4 10.4 16.8 29.9 24.5 12.6 4.4 88.2 528.9 91.7
Outer regional 506.1 (71.8) 92.4 1.6 14.2 19.0 28.3 22.4 11.0 3.5 84.2 520.7 89.2
Remote 499.7 (79.0) 87.5 1.0 18.1 21.7 24.2 20.2 10.0 4.8 80.9 496.6 79.7
Very remote 464.2 (88.7) 81.6 0.2 34.1 18.7 23.2 16.1 5.3 2.4 65.7 429.5 52.0
Grammar and Punctuation
Major cities 533.5 (76.7) 95.8 2.1 7.4 16.3 24.7 23.7 15.7 10.0 90.4 548.1 94.1
Inner regional 513.5 (71.2) 94.5 1.4 10.9 19.8 27.9 23.0 12.3 4.6 87.6 527.4 91.5
Outer regional 503.9 (71.8) 92.4 1.6 14.5 21.3 27.3 21.0 10.8 3.5 83.9 516.9 88.3
Remote 493.1 (80.2) 87.5 1.0 19.9 23.7 24.2 17.0 10.0 4.3 79.1 490.5 77.9
Very remote 447.9 (95.6) 81.6 0.2 40.7 20.3 19.9 11.7 5.6 1.7 59.1 423.5 47.9
Numeracy
Major cities 544.8 (73.8) 94.5 2.1 3.6 15.5 24.2 25.9 16.9 11.8 94.3 557.7 96.4
Inner regional 527.1 (66.1) 94.2 1.5 5.0 19.1 28.5 25.6 14.3 5.9 93.5 536.4 95.1
Outer regional 514.3 (65.2) 91.0 1.6 8.0 22.6 27.5 25.0 11.8 3.5 90.4 526.8 93.2
Remote 506.1 (70.2) 85.9 1.1 11.2 25.3 26.6 21.0 11.3 3.6 87.7 503.8 84.7
Very remote 470.4 (87.1) 74.5 0.2 27.8 26.7 20.4 14.9 7.5 2.4 72.0 450.5 61.0
32© Department of Education, Western Australia, 2017
Table 3.8: Achievement of Year 7 students in all subject areas by geolocation and Indigenous status 201618
Geolocation Number of students
Reading Writing Spelling Grammar and Punctuation Numeracy
Mean (SD) Mean (SD) Mean (SD) Mean (SD) Mean (SD)
Major cities
Indigenous 595 470.1 (58.8) 446.1 (77.1) 482.4 (71.5) 462.8 (65.8) 474.5 (57.6)
Non-Indigenous 12029 536.0 (67.7) 513.1 (68.6) 542.9 (74.0) 537.3 (75.6) 548.6 (72.8)
Inner regional
Indigenous 162 470.4 (57.9) 436.1 (89.4) 475.1 (70.9) 460.1 (69.0) 475.8 (62.0)
Non-Indigenous 1846 521.8 (62.3) 497.2 (67.3) 520.5 (68.2) 517.9 (69.3) 531.5 (64.1)
Outer regional
Indigenous 253 457.0 (55.5) 416.7 (80.7) 461.1 (70.3) 449.6 (63.6) 462.7 (55.9)
Non-Indigenous 1286 518.2 (62.3) 486.1 (70.2) 514.8 (68.9) 514.5 (68.5) 524.6 (62.2)
Remote
Indigenous 325 444.5 (58.3) 419.2 (76.7) 451.9 (70.4) 435.1 (66.4) 455.4 (58.1)
Non-Indigenous 649 525.7 (64.3) 502.6 (62.1) 523.9 (72.0) 522.4 (70.1) 531.7 (61.5)
Very remote
Indigenous 278 414.7 (76.4) 367.4 (99.4) 424.5 (81.2) 398.3 (83.2) 427.2 (77.5)
Non-Indigenous 182 522.7 (60.8) 498.0 (62.1) 517.4 (68.3) 514.1 (67.2) 529.0 (63.2)
18Number of students does not include 351 students whose Indigenous status was not stated.
Year 7: Results by geolocation and Indigenous status
33© Department of Education, Western Australia, 2017
Figure 3.6: Percentage of Year 7 students at or above the national minimum standard in all subject areas by geolocation and Indigenous status 2016
Table 3.9: Percentage of Year 7 students at or above national minimum standard in all subject areas by geolocation and Indigenous status 2016
Geolocation
Reading Writing Spelling Grammar and Punctuation Numeracy
At or above the national minimum standard (%)
Major cities
Indigenous 76.9 64.1 76.1 69.7 81.3
Non-Indigenous 93.8 89.4 92.4 91.8 95.2
Inner regional
Indigenous 75.8 62.0 72.6 66.8 78.6
Non-Indigenous 93.2 87.2 89.7 89.6 95.2
Outer regional
Indigenous 70.0 51.5 66.7 61.3 73.4
Non-Indigenous 91.3 82.1 87.4 88.2 93.7
Remote
Indigenous 62.8 48.9 61.6 53.9 70.3
Non-Indigenous 94.8 88.9 90.6 92.0 96.5
Very remote
Indigenous 46.3 30.4 47.4 36.1 54.5
Non-Indigenous 94.1 89.0 90.1 89.5 95.3
0
10
20
30
40
50
60
70
80
90
100
Reading Writing Spelling Grammarand Punctuation
Numeracy
Indigenous Non-Indigenous
Maj
or c
ities
Inne
r re
gion
alO
uter
reg
iona
lR
emot
eVe
ry r
emot
e
Maj
or c
ities
Inne
r re
gion
alO
uter
reg
iona
lR
emot
eVe
ry r
emot
e
Indigenous Non-Indigenous
Maj
or c
ities
Inne
r re
gion
alO
uter
reg
iona
lR
emot
eVe
ry r
emot
e
Maj
or c
ities
Inne
r re
gion
alO
uter
reg
iona
lR
emot
eVe
ry r
emot
e
Indigenous Non-Indigenous
Maj
or c
ities
Inne
r re
gion
alO
uter
reg
iona
lR
emot
eVe
ry r
emot
e
Maj
or c
ities
Inne
r re
gion
alO
uter
reg
iona
lR
emot
eVe
ry r
emot
e
Indigenous Non-Indigenous
Maj
or c
ities
Inne
r re
gion
alO
uter
reg
iona
lR
emot
eVe
ry r
emot
e
Maj
or c
ities
Inne
r re
gion
alO
uter
reg
iona
lR
emot
eVe
ry r
emot
e
Indigenous Non-Indigenous
Maj
or c
ities
Inne
r re
gion
alO
uter
reg
iona
lR
emot
eVe
ry r
emot
e
Maj
or c
ities
Inne
r re
gion
alO
uter
reg
iona
lR
emot
eVe
ry r
emot
e
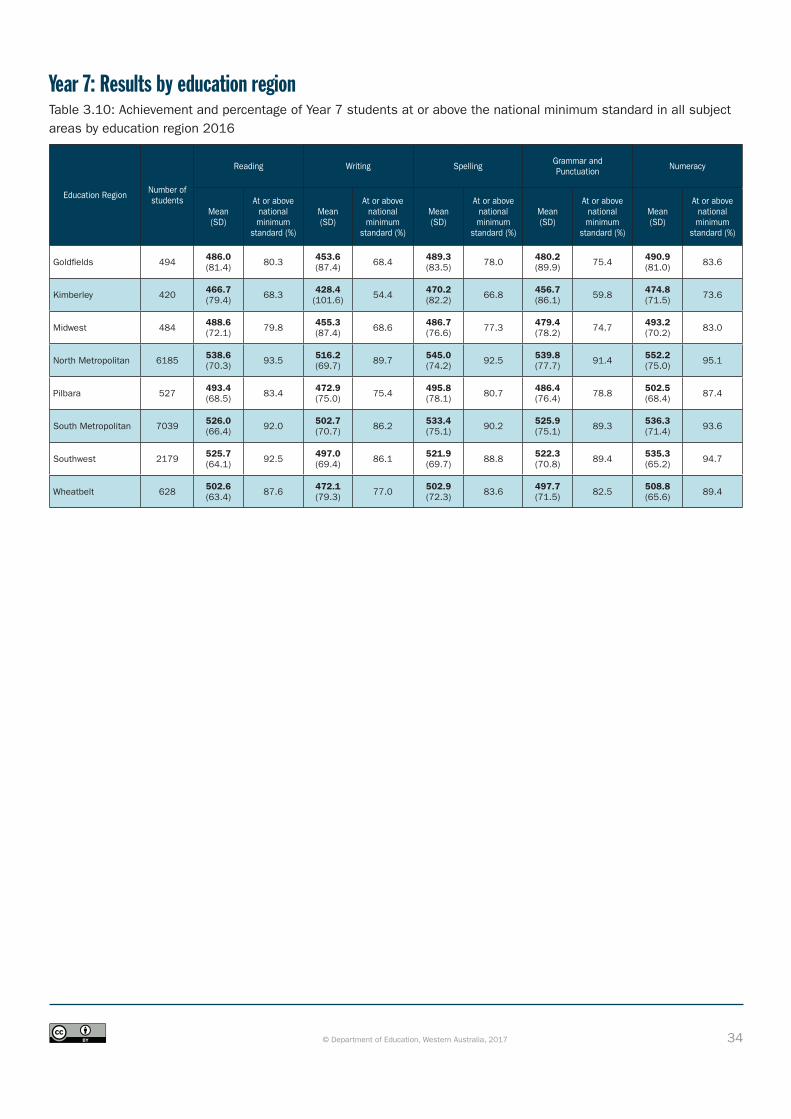
34© Department of Education, Western Australia, 2017
Year 7: Results by education regionTable 3.10: Achievement and percentage of Year 7 students at or above the national minimum standard in all subject areas by education region 2016
Education Region Number of students
Reading Writing Spelling Grammar and Punctuation Numeracy
Mean(SD)
At or above national minimum
standard (%)
Mean(SD)
At or above national minimum
standard (%)
Mean(SD)
At or above national minimum
standard (%)
Mean(SD)
At or above national minimum
standard (%)
Mean(SD)
At or above national minimum
standard (%)
Goldfields 494 486.0 (81.4) 80.3 453.6
(87.4) 68.4 489.3 (83.5) 78.0 480.2
(89.9) 75.4 490.9 (81.0) 83.6
Kimberley 420 466.7 (79.4) 68.3 428.4
(101.6) 54.4 470.2 (82.2) 66.8 456.7
(86.1) 59.8 474.8 (71.5) 73.6
Midwest 484 488.6 (72.1) 79.8 455.3
(87.4) 68.6 486.7 (76.6) 77.3 479.4
(78.2) 74.7 493.2 (70.2) 83.0
North Metropolitan 6185 538.6 (70.3) 93.5 516.2
(69.7) 89.7 545.0 (74.2) 92.5 539.8
(77.7) 91.4 552.2 (75.0) 95.1
Pilbara 527 493.4 (68.5) 83.4 472.9
(75.0) 75.4 495.8 (78.1) 80.7 486.4
(76.4) 78.8 502.5 (68.4) 87.4
South Metropolitan 7039 526.0 (66.4) 92.0 502.7
(70.7) 86.2 533.4 (75.1) 90.2 525.9
(75.1) 89.3 536.3 (71.4) 93.6
Southwest 2179 525.7 (64.1) 92.5 497.0
(69.4) 86.1 521.9 (69.7) 88.8 522.3
(70.8) 89.4 535.3 (65.2) 94.7
Wheatbelt 628 502.6 (63.4) 87.6 472.1
(79.3) 77.0 502.9 (72.3) 83.6 497.7
(71.5) 82.5 508.8 (65.6) 89.4
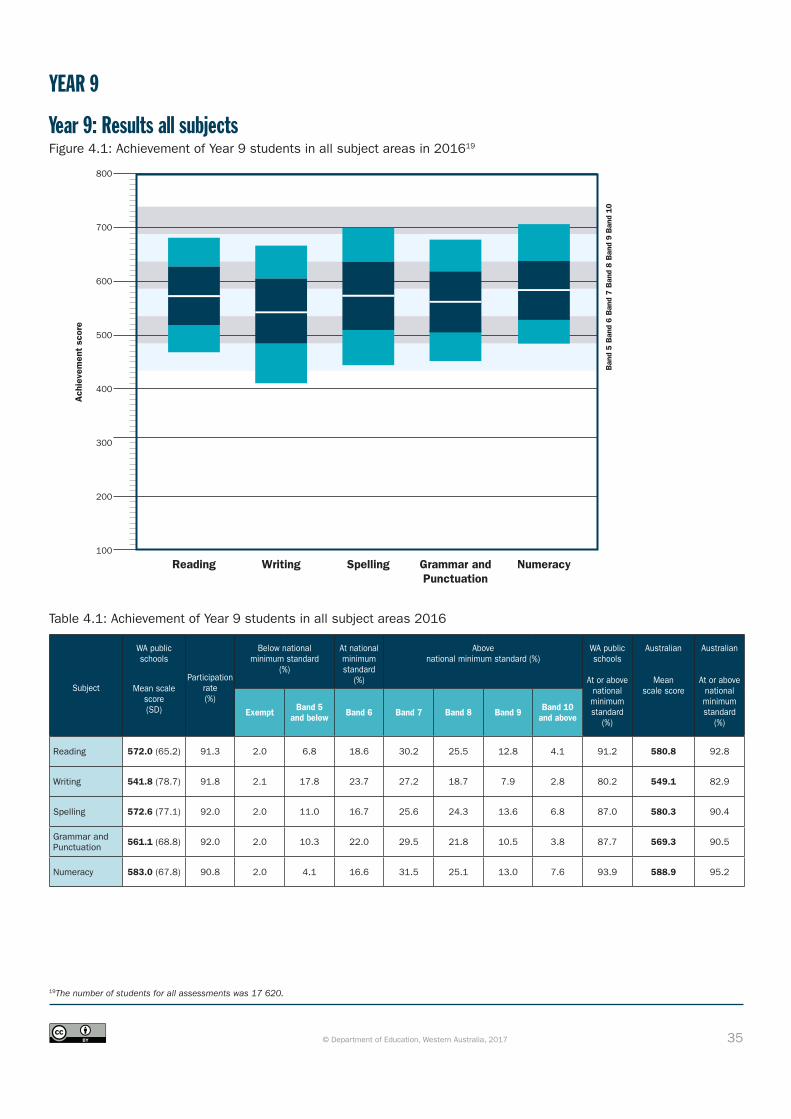
35© Department of Education, Western Australia, 2017
Table 4.1: Achievement of Year 9 students in all subject areas 2016
Subject
WA public schools
Mean scale score (SD)
Partici pation rate(%)
Below national minimum standard
(%)
At national minimum standard
(%)
Above national minimum standard (%)
WA public schools
At or above national minimum standard
(%)
Australian
Mean scale score
Australian
At or above national minimum standard
(%)Exempt Band 5
and below Band 6 Band 7 Band 8 Band 9 Band 10 and above
Reading 572.0 (65.2) 91.3 2.0 6.8 18.6 30.2 25.5 12.8 4.1 91.2 580.8 92.8
Writing 541.8 (78.7) 91.8 2.1 17.8 23.7 27.2 18.7 7.9 2.8 80.2 549.1 82.9
Spelling 572.6 (77.1) 92.0 2.0 11.0 16.7 25.6 24.3 13.6 6.8 87.0 580.3 90.4
Grammar and Punctuation 561.1 (68.8) 92.0 2.0 10.3 22.0 29.5 21.8 10.5 3.8 87.7 569.3 90.5
Numeracy 583.0 (67.8) 90.8 2.0 4.1 16.6 31.5 25.1 13.0 7.6 93.9 588.9 95.2
Year 9: Results all subjectsFigure 4.1: Achievement of Year 9 students in all subject areas in 201619
19The number of students for all assessments was 17 620.
Ban
d 5
Ban
d 6
Ban
d 7
Ban
d 8
Ban
d 9
Ban
d 10
Reading Writing Spelling Grammar and Punctuation
Numeracy100
200
300
400
500
800
700
600
Ach
ieve
men
t sc
ore
YEAR 9
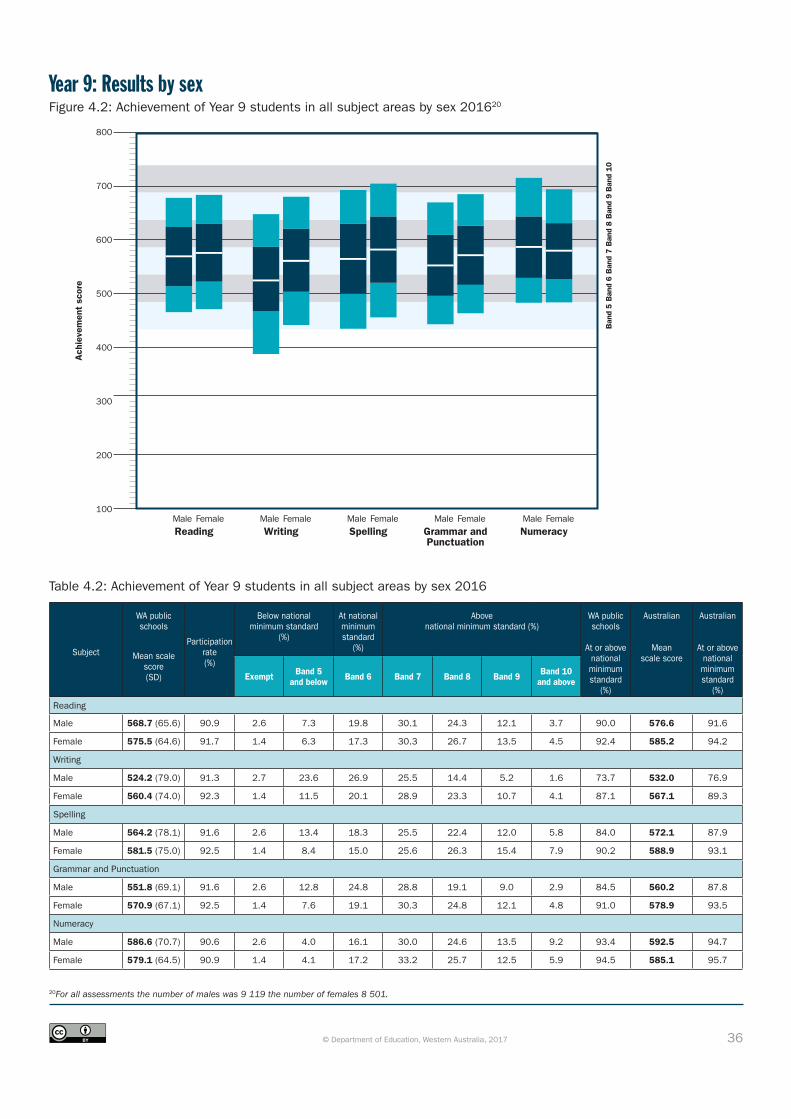
36© Department of Education, Western Australia, 2017
Table 4.2: Achievement of Year 9 students in all subject areas by sex 2016
Subject
WA public schools
Mean scale score (SD)
Partici pation rate(%)
Below national minimum standard
(%)
At national minimum standard
(%)
Above national minimum standard (%)
WA public schools
At or above national minimum standard
(%)
Australian
Mean scale score
Australian
At or above national minimum standard
(%)
Exempt Band 5 and below Band 6 Band 7 Band 8 Band 9 Band 10
and above
Reading
Male 568.7 (65.6) 90.9 2.6 7.3 19.8 30.1 24.3 12.1 3.7 90.0 576.6 91.6
Female 575.5 (64.6) 91.7 1.4 6.3 17.3 30.3 26.7 13.5 4.5 92.4 585.2 94.2
Writing
Male 524.2 (79.0) 91.3 2.7 23.6 26.9 25.5 14.4 5.2 1.6 73.7 532.0 76.9
Female 560.4 (74.0) 92.3 1.4 11.5 20.1 28.9 23.3 10.7 4.1 87.1 567.1 89.3
Spelling
Male 564.2 (78.1) 91.6 2.6 13.4 18.3 25.5 22.4 12.0 5.8 84.0 572.1 87.9
Female 581.5 (75.0) 92.5 1.4 8.4 15.0 25.6 26.3 15.4 7.9 90.2 588.9 93.1
Grammar and Punctuation
Male 551.8 (69.1) 91.6 2.6 12.8 24.8 28.8 19.1 9.0 2.9 84.5 560.2 87.8
Female 570.9 (67.1) 92.5 1.4 7.6 19.1 30.3 24.8 12.1 4.8 91.0 578.9 93.5
Numeracy
Male 586.6 (70.7) 90.6 2.6 4.0 16.1 30.0 24.6 13.5 9.2 93.4 592.5 94.7
Female 579.1 (64.5) 90.9 1.4 4.1 17.2 33.2 25.7 12.5 5.9 94.5 585.1 95.7
Year 9: Results by sexFigure 4.2: Achievement of Year 9 students in all subject areas by sex 201620
20For all assessments the number of males was 9 119 the number of females 8 501.
Ban
d 5
Ban
d 6
Ban
d 7
Ban
d 8
Ban
d 9
Ban
d 10
100
200
300
400
500
800
700
600
Ach
ieve
men
t sc
ore
Reading Writing Spelling Grammar and Punctuation
NumeracyMale Female Male Female Male Female Male Female Male Female
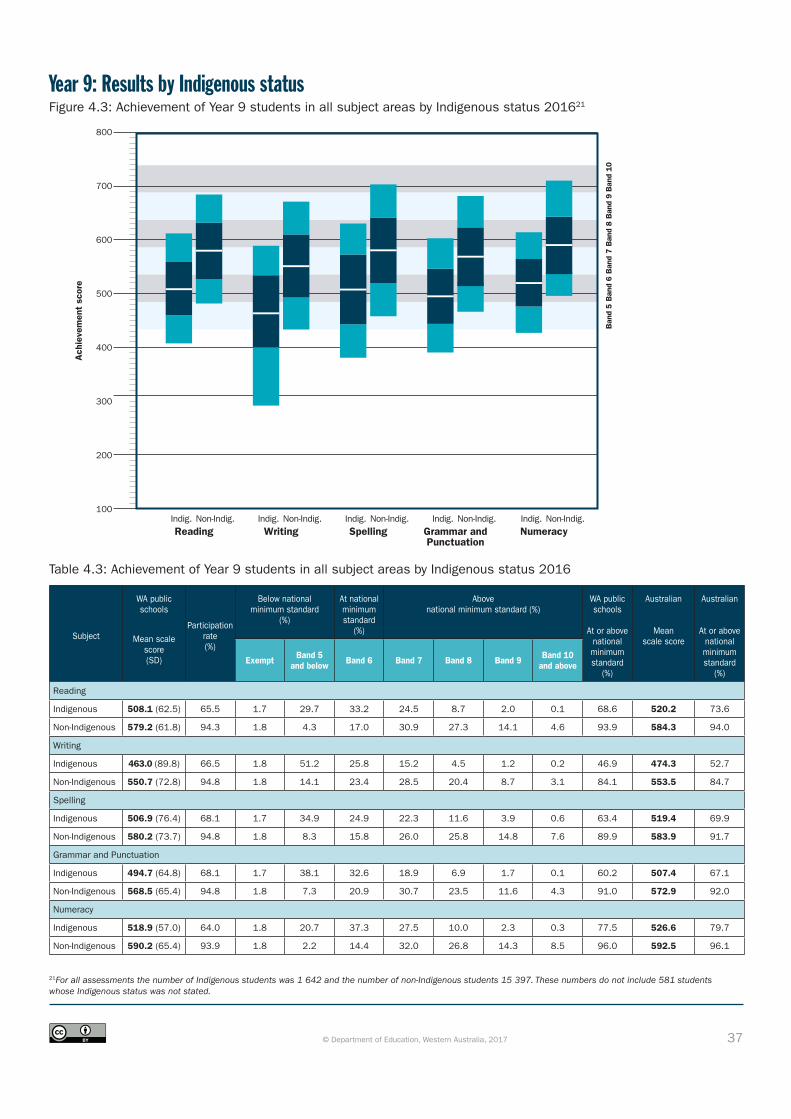
37© Department of Education, Western Australia, 2017
Table 4.3: Achievement of Year 9 students in all subject areas by Indigenous status 2016
Subject
WA public schools
Mean scale score (SD)
Partici pation rate(%)
Below national minimum standard
(%)
At national minimum standard
(%)
Above national minimum standard (%)
WA public schools
At or above national minimum standard
(%)
Australian
Mean scale score
Australian
At or above national minimum standard
(%)Exempt Band 5
and below Band 6 Band 7 Band 8 Band 9 Band 10 and above
Reading
Indigenous 508.1 (62.5) 65.5 1.7 29.7 33.2 24.5 8.7 2.0 0.1 68.6 520.2 73.6
Non-Indigenous 579.2 (61.8) 94.3 1.8 4.3 17.0 30.9 27.3 14.1 4.6 93.9 584.3 94.0
Writing
Indigenous 463.0 (89.8) 66.5 1.8 51.2 25.8 15.2 4.5 1.2 0.2 46.9 474.3 52.7
Non-Indigenous 550.7 (72.8) 94.8 1.8 14.1 23.4 28.5 20.4 8.7 3.1 84.1 553.5 84.7
Spelling
Indigenous 506.9 (76.4) 68.1 1.7 34.9 24.9 22.3 11.6 3.9 0.6 63.4 519.4 69.9
Non-Indigenous 580.2 (73.7) 94.8 1.8 8.3 15.8 26.0 25.8 14.8 7.6 89.9 583.9 91.7
Grammar and Punctuation
Indigenous 494.7 (64.8) 68.1 1.7 38.1 32.6 18.9 6.9 1.7 0.1 60.2 507.4 67.1
Non-Indigenous 568.5 (65.4) 94.8 1.8 7.3 20.9 30.7 23.5 11.6 4.3 91.0 572.9 92.0
Numeracy
Indigenous 518.9 (57.0) 64.0 1.8 20.7 37.3 27.5 10.0 2.3 0.3 77.5 526.6 79.7
Non-Indigenous 590.2 (65.4) 93.9 1.8 2.2 14.4 32.0 26.8 14.3 8.5 96.0 592.5 96.1
Year 9: Results by Indigenous statusFigure 4.3: Achievement of Year 9 students in all subject areas by Indigenous status 201621
21For all assessments the number of Indigenous students was 1 642 and the number of non-Indigenous students 15 397. These numbers do not include 581 students whose Indigenous status was not stated.
Ban
d 5
Ban
d 6
Ban
d 7
Ban
d 8
Ban
d 9
Ban
d 10
100
200
300
400
500
800
700
600
Ach
ieve
men
t sc
ore
Reading Writing Spelling Grammar and Punctuation
NumeracyIndig. Non-Indig. Indig. Non-Indig. Indig. Non-Indig. Indig. Non-Indig. Indig. Non-Indig.
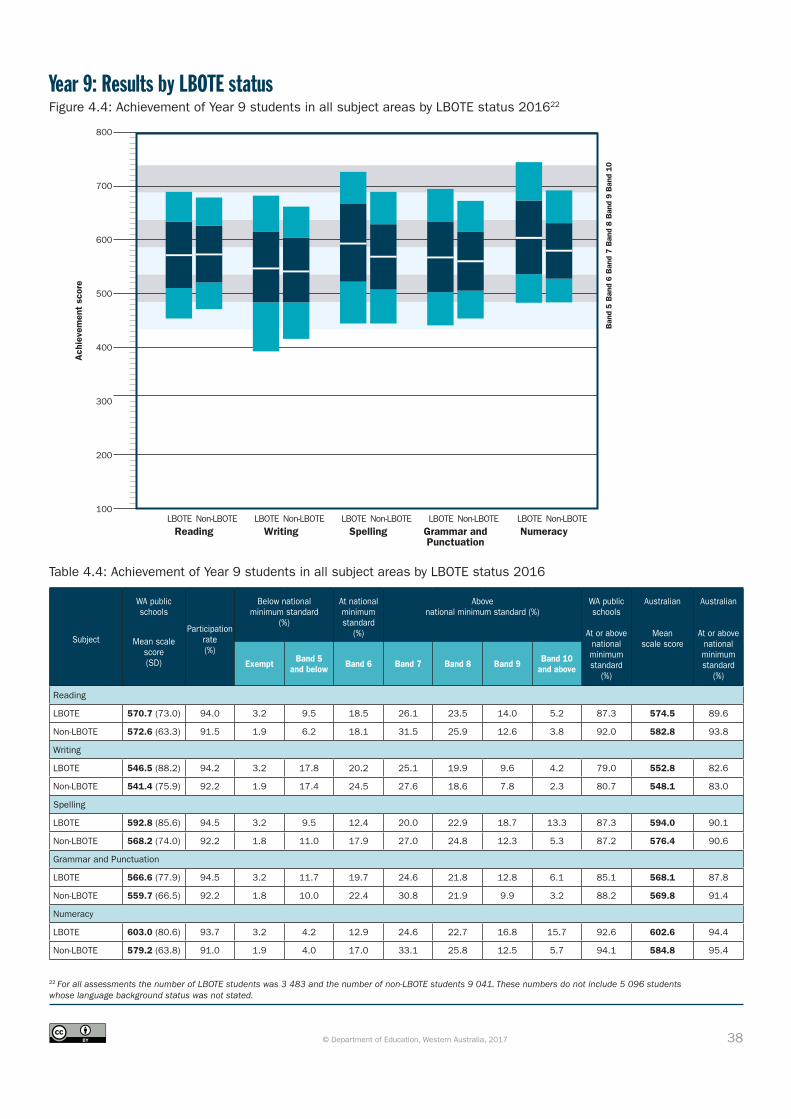
38© Department of Education, Western Australia, 2017
Table 4.4: Achievement of Year 9 students in all subject areas by LBOTE status 2016
Subject
WA public schools
Mean scale score (SD)
Partici pation rate(%)
Below national minimum standard
(%)
At national minimum standard
(%)
Above national minimum standard (%)
WA public schools
At or above national minimum standard
(%)
Australian
Mean scale score
Australian
At or above national minimum standard
(%)Exempt Band 5
and below Band 6 Band 7 Band 8 Band 9 Band 10 and above
Reading
LBOTE 570.7 (73.0) 94.0 3.2 9.5 18.5 26.1 23.5 14.0 5.2 87.3 574.5 89.6
Non-LBOTE 572.6 (63.3) 91.5 1.9 6.2 18.1 31.5 25.9 12.6 3.8 92.0 582.8 93.8
Writing
LBOTE 546.5 (88.2) 94.2 3.2 17.8 20.2 25.1 19.9 9.6 4.2 79.0 552.8 82.6
Non-LBOTE 541.4 (75.9) 92.2 1.9 17.4 24.5 27.6 18.6 7.8 2.3 80.7 548.1 83.0
Spelling
LBOTE 592.8 (85.6) 94.5 3.2 9.5 12.4 20.0 22.9 18.7 13.3 87.3 594.0 90.1
Non-LBOTE 568.2 (74.0) 92.2 1.8 11.0 17.9 27.0 24.8 12.3 5.3 87.2 576.4 90.6
Grammar and Punctuation
LBOTE 566.6 (77.9) 94.5 3.2 11.7 19.7 24.6 21.8 12.8 6.1 85.1 568.1 87.8
Non-LBOTE 559.7 (66.5) 92.2 1.8 10.0 22.4 30.8 21.9 9.9 3.2 88.2 569.8 91.4
Numeracy
LBOTE 603.0 (80.6) 93.7 3.2 4.2 12.9 24.6 22.7 16.8 15.7 92.6 602.6 94.4
Non-LBOTE 579.2 (63.8) 91.0 1.9 4.0 17.0 33.1 25.8 12.5 5.7 94.1 584.8 95.4
Year 9: Results by LBOTE statusFigure 4.4: Achievement of Year 9 students in all subject areas by LBOTE status 201622
22 For all assessments the number of LBOTE students was 3 483 and the number of non-LBOTE students 9 041. These numbers do not include 5 096 students whose language background status was not stated.
Ban
d 5
Ban
d 6
Ban
d 7
Ban
d 8
Ban
d 9
Ban
d 10
100
200
300
400
500
800
700
600
Ach
ieve
men
t sc
ore
Reading Writing Spelling Grammar and Punctuation
NumeracyLBOTE Non-LBOTE LBOTE Non-LBOTE LBOTE Non-LBOTE LBOTE Non-LBOTE LBOTE Non-LBOTE
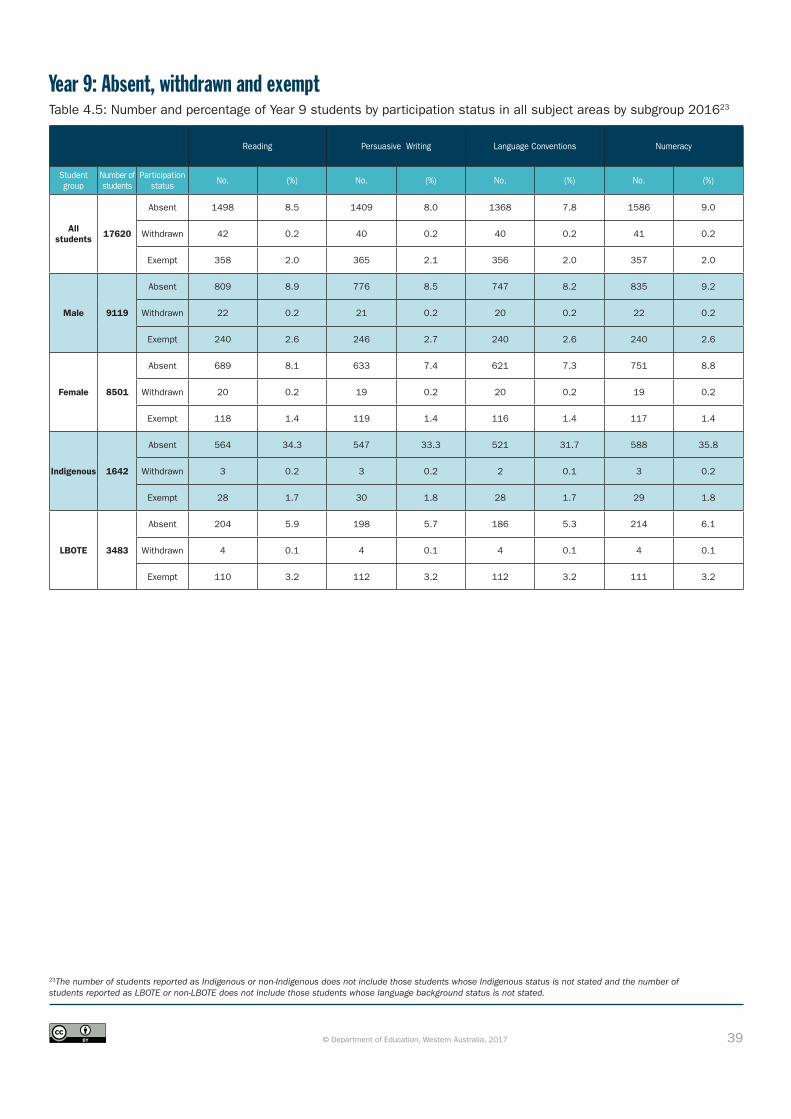
39© Department of Education, Western Australia, 2017
Year 9: Absent, withdrawn and exemptTable 4.5: Number and percentage of Year 9 students by participation status in all subject areas by subgroup 201623
Reading Persuasive Writing Language Conventions Numeracy
Student group
Number of students
Participation status No. (%) No. (%) No. (%) No. (%)
All students 17620
Absent 1498 8.5 1409 8.0 1368 7.8 1586 9.0
Withdrawn 42 0.2 40 0.2 40 0.2 41 0.2
Exempt 358 2.0 365 2.1 356 2.0 357 2.0
Male 9119
Absent 809 8.9 776 8.5 747 8.2 835 9.2
Withdrawn 22 0.2 21 0.2 20 0.2 22 0.2
Exempt 240 2.6 246 2.7 240 2.6 240 2.6
Female 8501
Absent 689 8.1 633 7.4 621 7.3 751 8.8
Withdrawn 20 0.2 19 0.2 20 0.2 19 0.2
Exempt 118 1.4 119 1.4 116 1.4 117 1.4
Indigenous 1642
Absent 564 34.3 547 33.3 521 31.7 588 35.8
Withdrawn 3 0.2 3 0.2 2 0.1 3 0.2
Exempt 28 1.7 30 1.8 28 1.7 29 1.8
LBOTE 3483
Absent 204 5.9 198 5.7 186 5.3 214 6.1
Withdrawn 4 0.1 4 0.1 4 0.1 4 0.1
Exempt 110 3.2 112 3.2 112 3.2 111 3.2
23The number of students reported as Indigenous or non-Indigenous does not include those students whose Indigenous status is not stated and the number of students reported as LBOTE or non-LBOTE does not include those students whose language background status is not stated.

40© Department of Education, Western Australia, 2017
Year 9: Results by geolocationTable 4.6: Number of Year 9 students in all subject areas by geolocation 2016
Major cities 12473
Inner regional 2095
Outer regional 1642
Remote 968
Very remote 442
Figure 4.5: Percentage of Year 9 students at or above the national minimum standard in all subject areas by geolocation 2016
0
10
20
30
40
50
60
70
80
90
100
Reading Writing Spelling Grammarand Punctuation
Numeracy
Maj
or c
ities
Inne
r re
gion
al
Out
er r
egio
nal
Rem
ote
Very
rem
ote
Maj
or c
ities
Inne
r re
gion
al
Out
er r
egio
nal
Rem
ote
Very
rem
ote
Maj
or c
ities
Inne
r re
gion
al
Out
er r
egio
nal
Rem
ote
Very
rem
ote
Maj
or c
ities
Inne
r re
gion
al
Out
er r
egio
nal
Rem
ote
Very
rem
ote
Maj
or c
ities
Inne
r re
gion
al
Out
er r
egio
nal
Rem
ote
Very
rem
ote
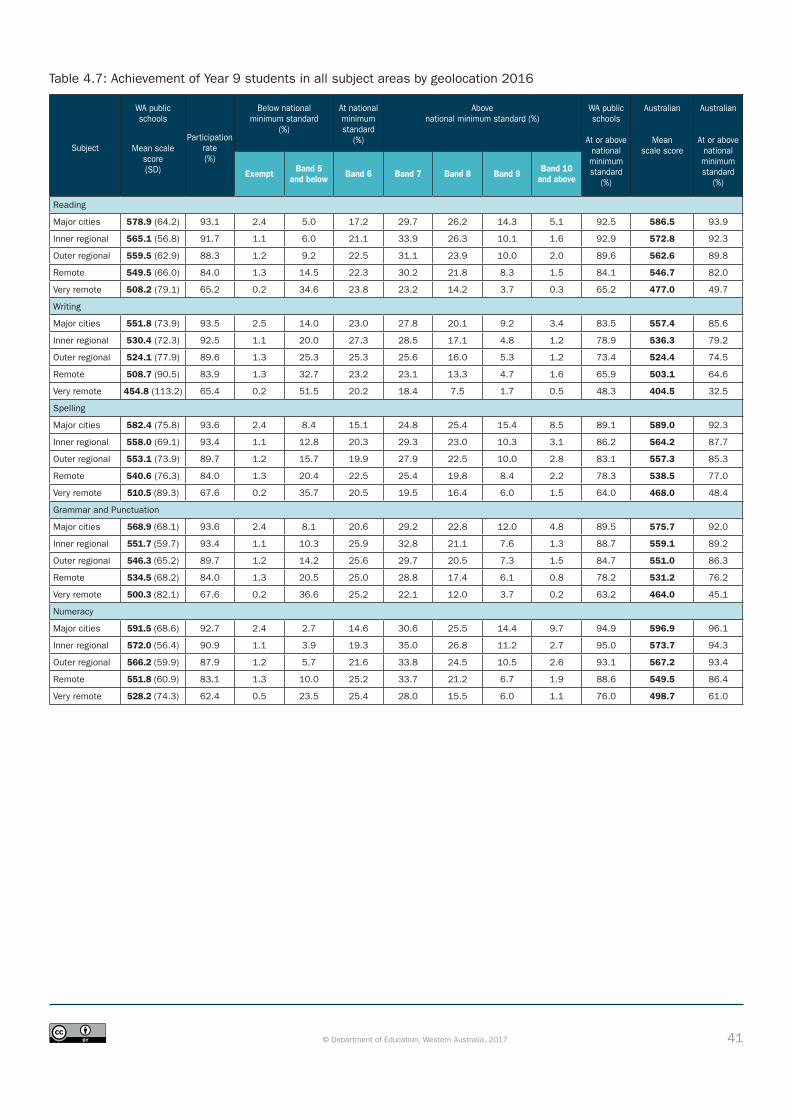
41© Department of Education, Western Australia, 2017
Table 4.7: Achievement of Year 9 students in all subject areas by geolocation 2016
Subject
WA public schools
Mean scale score (SD)
Partici pation rate(%)
Below national minimum standard
(%)
At national minimum standard
(%)
Above national minimum standard (%)
WA public schools
At or above national minimum standard
(%)
Australian
Mean scale score
Australian
At or above national minimum standard
(%)Exempt Band 5
and below Band 6 Band 7 Band 8 Band 9 Band 10 and above
Reading
Major cities 578.9 (64.2) 93.1 2.4 5.0 17.2 29.7 26.2 14.3 5.1 92.5 586.5 93.9
Inner regional 565.1 (56.8) 91.7 1.1 6.0 21.1 33.9 26.3 10.1 1.6 92.9 572.8 92.3
Outer regional 559.5 (62.9) 88.3 1.2 9.2 22.5 31.1 23.9 10.0 2.0 89.6 562.6 89.8
Remote 549.5 (66.0) 84.0 1.3 14.5 22.3 30.2 21.8 8.3 1.5 84.1 546.7 82.0
Very remote 508.2 (79.1) 65.2 0.2 34.6 23.8 23.2 14.2 3.7 0.3 65.2 477.0 49.7
Writing
Major cities 551.8 (73.9) 93.5 2.5 14.0 23.0 27.8 20.1 9.2 3.4 83.5 557.4 85.6
Inner regional 530.4 (72.3) 92.5 1.1 20.0 27.3 28.5 17.1 4.8 1.2 78.9 536.3 79.2
Outer regional 524.1 (77.9) 89.6 1.3 25.3 25.3 25.6 16.0 5.3 1.2 73.4 524.4 74.5
Remote 508.7 (90.5) 83.9 1.3 32.7 23.2 23.1 13.3 4.7 1.6 65.9 503.1 64.6
Very remote 454.8 (113.2) 65.4 0.2 51.5 20.2 18.4 7.5 1.7 0.5 48.3 404.5 32.5
Spelling
Major cities 582.4 (75.8) 93.6 2.4 8.4 15.1 24.8 25.4 15.4 8.5 89.1 589.0 92.3
Inner regional 558.0 (69.1) 93.4 1.1 12.8 20.3 29.3 23.0 10.3 3.1 86.2 564.2 87.7
Outer regional 553.1 (73.9) 89.7 1.2 15.7 19.9 27.9 22.5 10.0 2.8 83.1 557.3 85.3
Remote 540.6 (76.3) 84.0 1.3 20.4 22.5 25.4 19.8 8.4 2.2 78.3 538.5 77.0
Very remote 510.5 (89.3) 67.6 0.2 35.7 20.5 19.5 16.4 6.0 1.5 64.0 468.0 48.4
Grammar and Punctuation
Major cities 568.9 (68.1) 93.6 2.4 8.1 20.6 29.2 22.8 12.0 4.8 89.5 575.7 92.0
Inner regional 551.7 (59.7) 93.4 1.1 10.3 25.9 32.8 21.1 7.6 1.3 88.7 559.1 89.2
Outer regional 546.3 (65.2) 89.7 1.2 14.2 25.6 29.7 20.5 7.3 1.5 84.7 551.0 86.3
Remote 534.5 (68.2) 84.0 1.3 20.5 25.0 28.8 17.4 6.1 0.8 78.2 531.2 76.2
Very remote 500.3 (82.1) 67.6 0.2 36.6 25.2 22.1 12.0 3.7 0.2 63.2 464.0 45.1
Numeracy
Major cities 591.5 (68.6) 92.7 2.4 2.7 14.6 30.6 25.5 14.4 9.7 94.9 596.9 96.1
Inner regional 572.0 (56.4) 90.9 1.1 3.9 19.3 35.0 26.8 11.2 2.7 95.0 573.7 94.3
Outer regional 566.2 (59.9) 87.9 1.2 5.7 21.6 33.8 24.5 10.5 2.6 93.1 567.2 93.4
Remote 551.8 (60.9) 83.1 1.3 10.0 25.2 33.7 21.2 6.7 1.9 88.6 549.5 86.4
Very remote 528.2 (74.3) 62.4 0.5 23.5 25.4 28.0 15.5 6.0 1.1 76.0 498.7 61.0

42© Department of Education, Western Australia, 2017
Year 9: Results by geolocation and Indigenous statusTable 4.8: Achievement of Year 9 students in all subject areas by geolocation and Indigenous status 201624
Geolocation Number of students
Reading Writing Spelling Grammar and Punctuation Numeracy
Mean (SD) Mean (SD) Mean (SD) Mean (SD) Mean (SD)
Major cities
Indigenous 623 520.4 (57.6) 489.4 (71.8) 522.7 (72.6) 507.1 (59.9) 528.9 (52.7)
Non-Indigenous 11595 582.4 (63.0) 555.7 (72.5) 586.0 (74.5) 572.6 (66.9) 595.2 (67.7)
Inner regional
Indigenous 151 521.7 (55.4) 479.2 (83.2) 516.9 (70.7) 506.9 (57.7) 529.5 (51.5)
Non-Indigenous 1708 568.2 (54.8) 534.4 (70.1) 561.5 (67.1) 554.7 (57.6) 574.6 (54.3)
Outer regional
Indigenous 289 512.7 (58.3) 471.8 (77.2) 507.7 (73.4) 498.7 (61.7) 522.5 (52.3)
Non-Indigenous 1321 569.8 (59.2) 535.7 (73.1) 563.2 (70.0) 556.7 (61.1) 575.7 (57.0)
Remote
Indigenous 315 502.6 (58.7) 447.8 (90.7) 496.0 (73.1) 486.0 (60.5) 508.4 (53.2)
Non-Indigenous 637 573.7 (55.8) 539.9 (73.5) 563.9 (67.2) 559.5 (57.6) 574.4 (51.8)
Very remote
Indigenous 264 473.7 (71.7) 401.7 (108.4) 476.6 (83.8) 464.8 (75.8) 498.3 (69.9)
Non-Indigenous 136 560.6 (60.0) 532.1 (66.3) 563.2 (73.8) 554.0 (60.9) 573.9 (57.0)
24Number of students does not include 581 students whose Indigenous status was not stated.
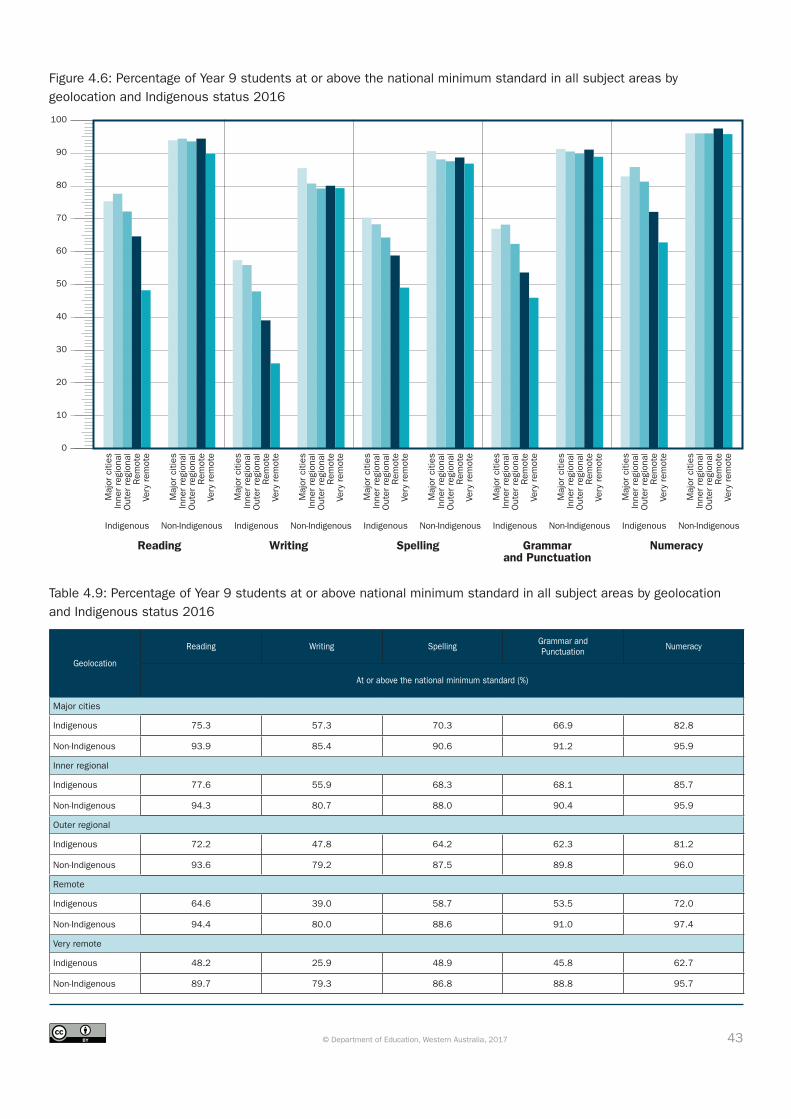
43© Department of Education, Western Australia, 2017
Figure 4.6: Percentage of Year 9 students at or above the national minimum standard in all subject areas by geolocation and Indigenous status 2016
Table 4.9: Percentage of Year 9 students at or above national minimum standard in all subject areas by geolocation and Indigenous status 2016
Geolocation
Reading Writing Spelling Grammar and Punctuation Numeracy
At or above the national minimum standard (%)
Major cities
Indigenous 75.3 57.3 70.3 66.9 82.8
Non-Indigenous 93.9 85.4 90.6 91.2 95.9
Inner regional
Indigenous 77.6 55.9 68.3 68.1 85.7
Non-Indigenous 94.3 80.7 88.0 90.4 95.9
Outer regional
Indigenous 72.2 47.8 64.2 62.3 81.2
Non-Indigenous 93.6 79.2 87.5 89.8 96.0
Remote
Indigenous 64.6 39.0 58.7 53.5 72.0
Non-Indigenous 94.4 80.0 88.6 91.0 97.4
Very remote
Indigenous 48.2 25.9 48.9 45.8 62.7
Non-Indigenous 89.7 79.3 86.8 88.8 95.7
0
10
20
30
40
50
60
70
80
90
100
Reading Writing Spelling Grammarand Punctuation
Numeracy
Indigenous Non-Indigenous
Maj
or c
ities
Inne
r re
gion
alO
uter
reg
iona
lR
emot
eVe
ry r
emot
e
Maj
or c
ities
Inne
r re
gion
alO
uter
reg
iona
lR
emot
eVe
ry r
emot
e
Indigenous Non-Indigenous
Maj
or c
ities
Inne
r re
gion
alO
uter
reg
iona
lR
emot
eVe
ry r
emot
e
Maj
or c
ities
Inne
r re
gion
alO
uter
reg
iona
lR
emot
eVe
ry r
emot
e
Indigenous Non-Indigenous
Maj
or c
ities
Inne
r re
gion
alO
uter
reg
iona
lR
emot
eVe
ry r
emot
e
Maj
or c
ities
Inne
r re
gion
alO
uter
reg
iona
lR
emot
eVe
ry r
emot
e
Indigenous Non-Indigenous
Maj
or c
ities
Inne
r re
gion
alO
uter
reg
iona
lR
emot
eVe
ry r
emot
e
Maj
or c
ities
Inne
r re
gion
alO
uter
reg
iona
lR
emot
eVe
ry r
emot
e
Indigenous Non-Indigenous
Maj
or c
ities
Inne
r re
gion
alO
uter
reg
iona
lR
emot
eVe
ry r
emot
e
Maj
or c
ities
Inne
r re
gion
alO
uter
reg
iona
lR
emot
eVe
ry r
emot
e
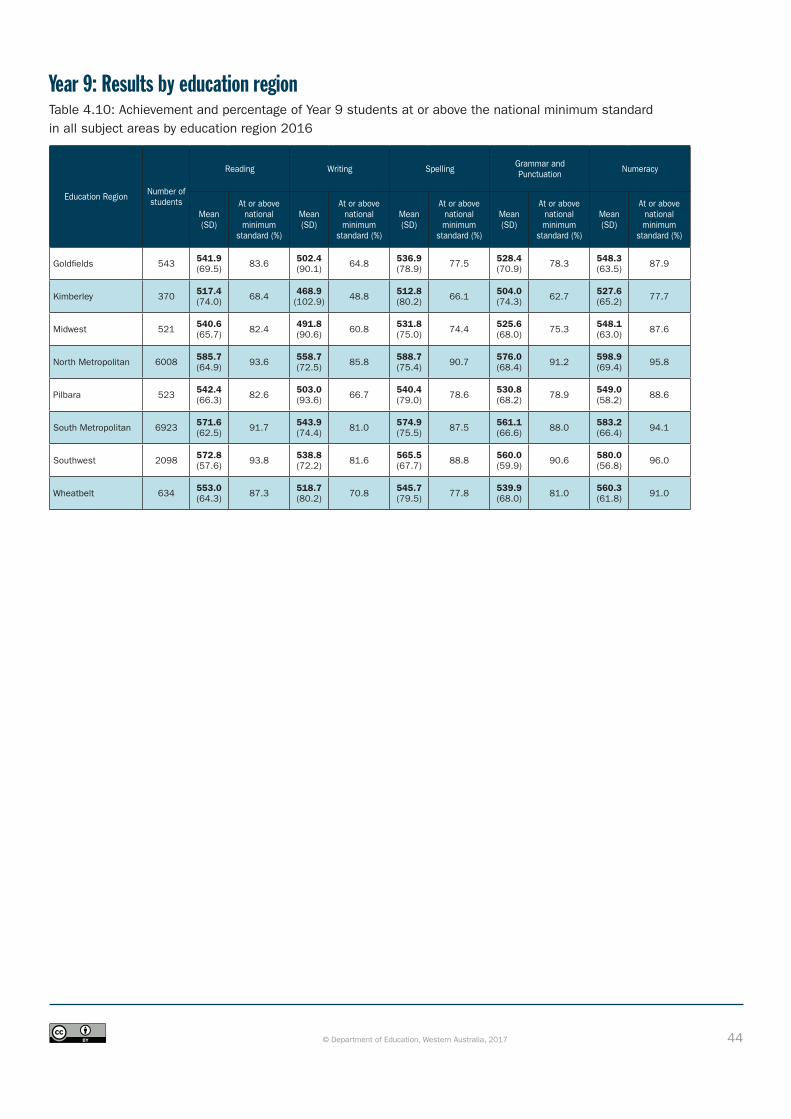
44© Department of Education, Western Australia, 2017
Year 9: Results by education regionTable 4.10: Achievement and percentage of Year 9 students at or above the national minimum standard in all subject areas by education region 2016
Education Region Number of students
Reading Writing Spelling Grammar and Punctuation Numeracy
Mean(SD)
At or above national minimum
standard (%)
Mean(SD)
At or above national minimum
standard (%)
Mean(SD)
At or above national minimum
standard (%)
Mean(SD)
At or above national minimum
standard (%)
Mean(SD)
At or above national minimum
standard (%)
Goldfields 543 541.9 (69.5) 83.6 502.4
(90.1) 64.8 536.9 (78.9) 77.5 528.4
(70.9) 78.3 548.3 (63.5) 87.9
Kimberley 370 517.4 (74.0) 68.4 468.9
(102.9) 48.8 512.8 (80.2) 66.1 504.0
(74.3) 62.7 527.6 (65.2) 77.7
Midwest 521 540.6 (65.7) 82.4 491.8
(90.6) 60.8 531.8 (75.0) 74.4 525.6
(68.0) 75.3 548.1 (63.0) 87.6
North Metropolitan 6008 585.7 (64.9) 93.6 558.7
(72.5) 85.8 588.7 (75.4) 90.7 576.0
(68.4) 91.2 598.9 (69.4) 95.8
Pilbara 523 542.4 (66.3) 82.6 503.0
(93.6) 66.7 540.4 (79.0) 78.6 530.8
(68.2) 78.9 549.0 (58.2) 88.6
South Metropolitan 6923 571.6 (62.5) 91.7 543.9
(74.4) 81.0 574.9 (75.5) 87.5 561.1
(66.6) 88.0 583.2 (66.4) 94.1
Southwest 2098 572.8 (57.6) 93.8 538.8
(72.2) 81.6 565.5 (67.7) 88.8 560.0
(59.9) 90.6 580.0 (56.8) 96.0
Wheatbelt 634 553.0 (64.3) 87.3 518.7
(80.2) 70.8 545.7 (79.5) 77.8 539.9
(68.0) 81.0 560.3 (61.8) 91.0
45© Department of Education, Western Australia, 2017
Achievement of Western Australian public school students in Reading, Writing,
Language Conventions and Numeracy 2008–2016 comparison
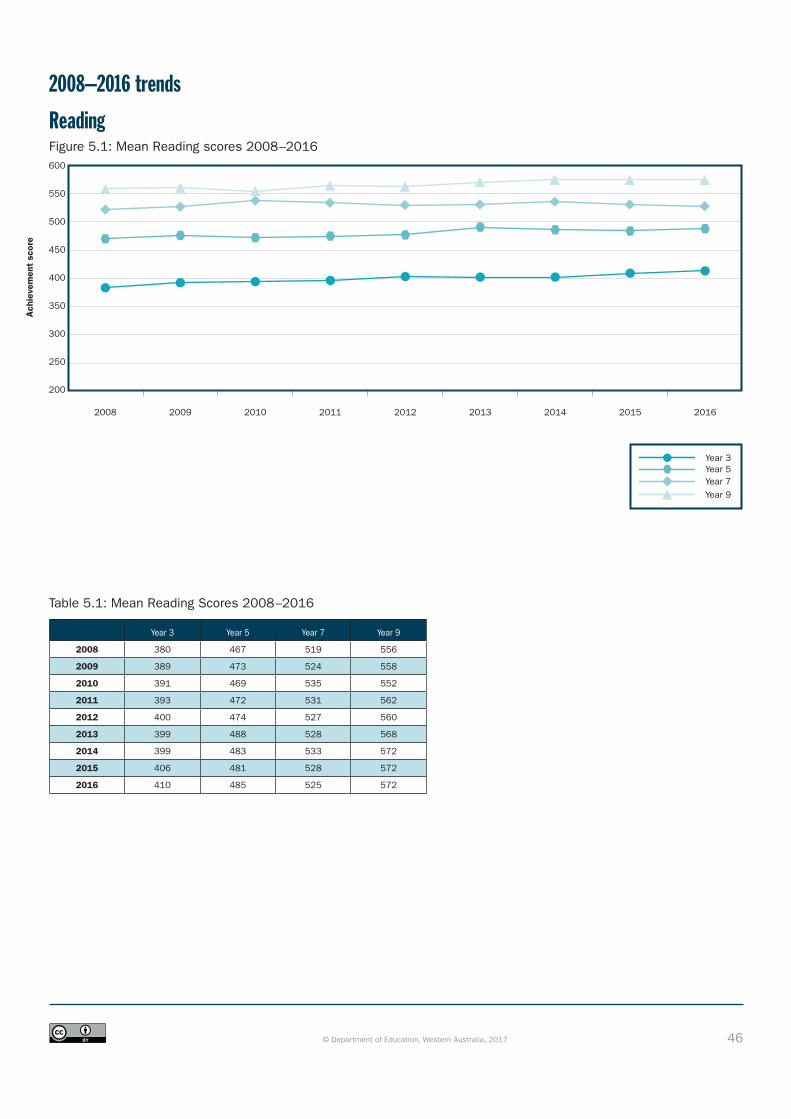
46© Department of Education, Western Australia, 2017
Table 5.1: Mean Reading Scores 2008–2016
Year 3 Year 5 Year 7 Year 9
2008 380 467 519 556
2009 389 473 524 558
2010 391 469 535 552
2011 393 472 531 562
2012 400 474 527 560
2013 399 488 528 568
2014 399 483 533 572
2015 406 481 528 572
2016 410 485 525 572
2008–2016 trends
ReadingFigure 5.1: Mean Reading scores 2008–2016600
200
250
300
350
400
450
500
550
Ach
ieve
men
t sc
ore
2008 2009 2010 2011 2012 2013 2014 2015 2016
Year 3Year 5Year 7Year 9
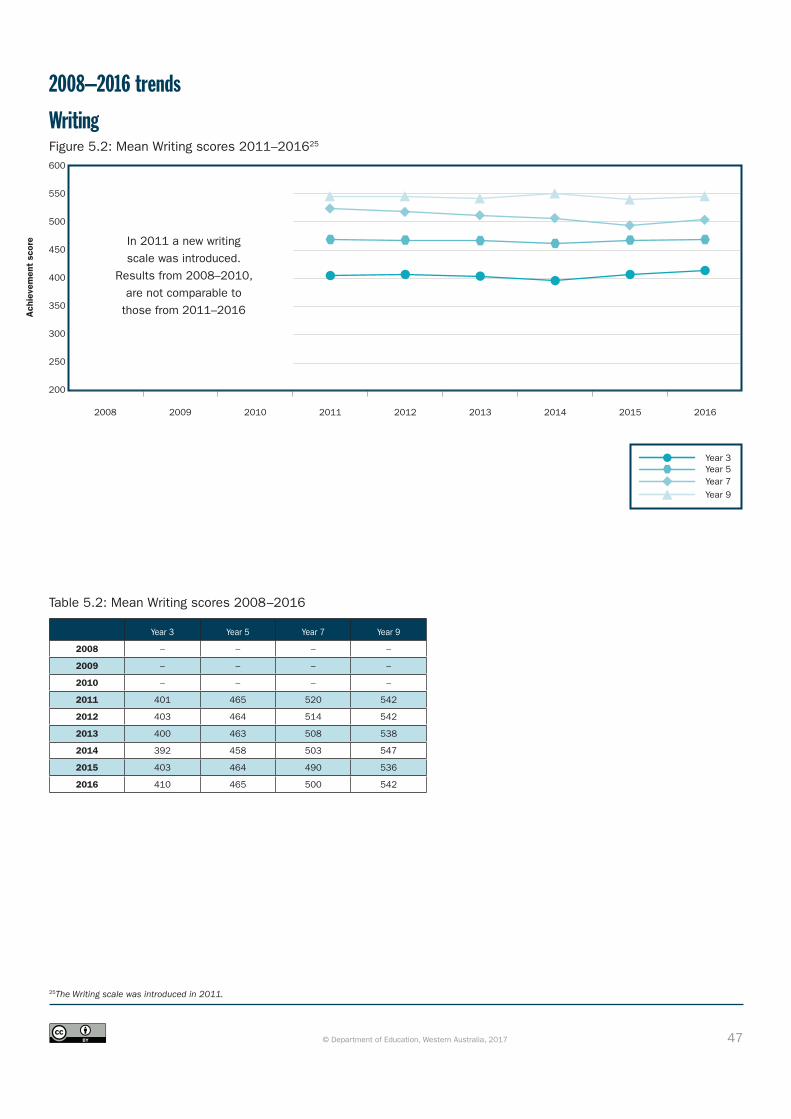
47© Department of Education, Western Australia, 2017
Table 5.2: Mean Writing scores 2008–2016
Year 3 Year 5 Year 7 Year 9
2008 – – – –
2009 – – – –
2010 – – – –
2011 401 465 520 542
2012 403 464 514 542
2013 400 463 508 538
2014 392 458 503 547
2015 403 464 490 536
2016 410 465 500 542
WritingFigure 5.2: Mean Writing scores 2011–201625
25The Writing scale was introduced in 2011.
2008–2016 trends
600
200
250
300
350
400
450
500
550
Ach
ieve
men
t sc
ore
2008 2009 2010 2011 2012 2013 2014 2015 2016
In 2011 a new writingscale was introduced.
Results from 2008–2010, are not comparable to
those from 2011–2016
Year 3Year 5Year 7Year 9
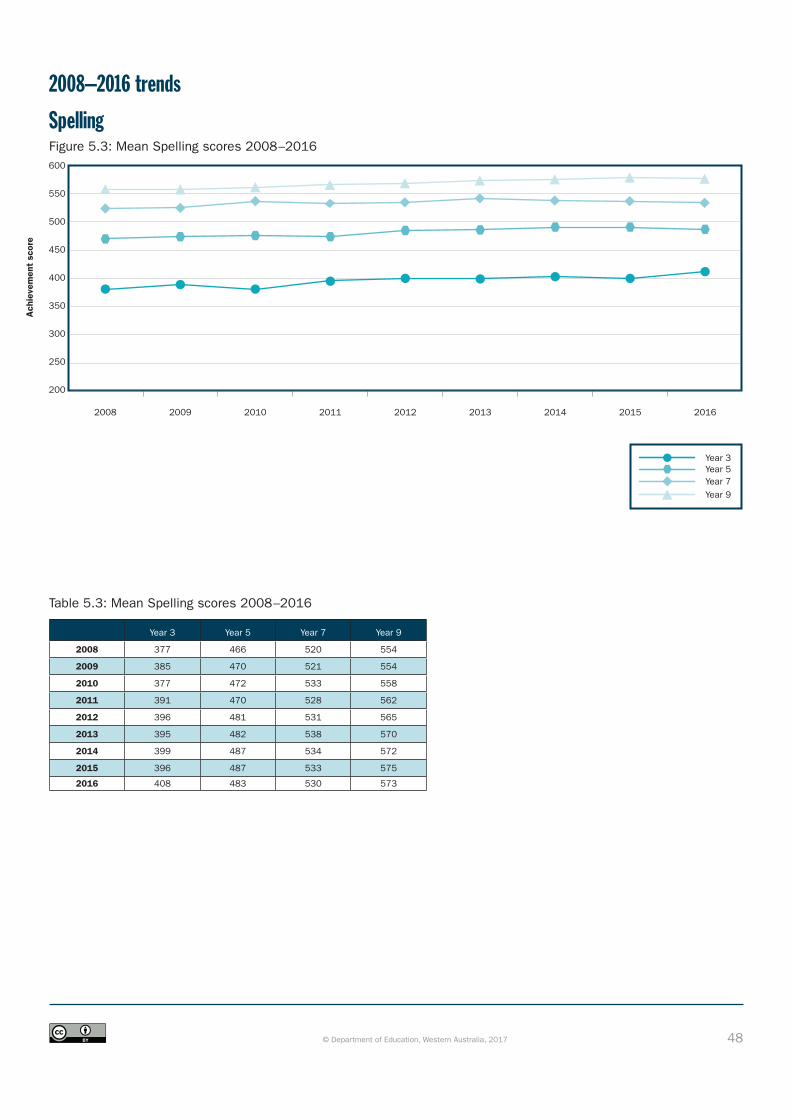
48© Department of Education, Western Australia, 2017
Table 5.3: Mean Spelling scores 2008–2016
Year 3 Year 5 Year 7 Year 9
2008 377 466 520 554
2009 385 470 521 554
2010 377 472 533 558
2011 391 470 528 562
2012 396 481 531 565
2013 395 482 538 570
2014 399 487 534 572
2015 396 487 533 575
2016 408 483 530 573
SpellingFigure 5.3: Mean Spelling scores 2008–2016
2008–2016 trends
600
200
250
300
350
400
450
500
550
Ach
ieve
men
t sc
ore
2008 2009 2010 2011 2012 2013 2014 2015 2016
Year 3Year 5Year 7Year 9
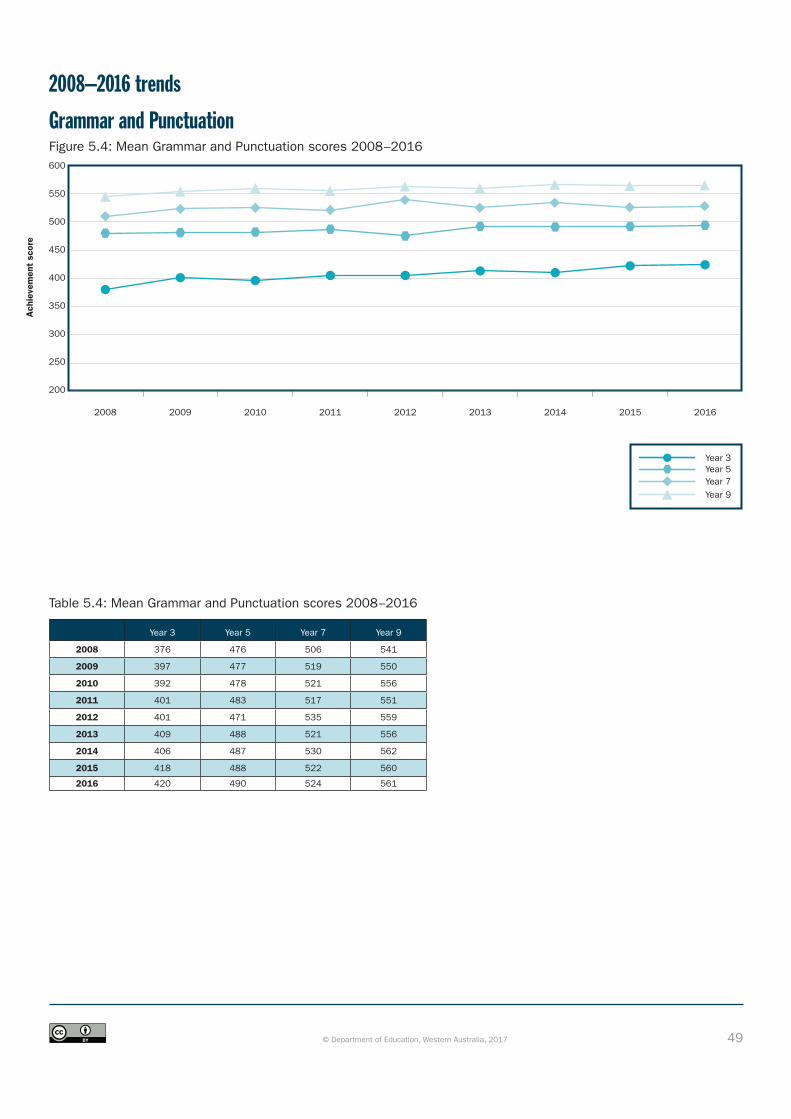
49© Department of Education, Western Australia, 2017
Table 5.4: Mean Grammar and Punctuation scores 2008–2016
Year 3 Year 5 Year 7 Year 9
2008 376 476 506 541
2009 397 477 519 550
2010 392 478 521 556
2011 401 483 517 551
2012 401 471 535 559
2013 409 488 521 556
2014 406 487 530 562
2015 418 488 522 560
2016 420 490 524 561
Grammar and PunctuationFigure 5.4: Mean Grammar and Punctuation scores 2008–2016
2008–2016 trends
600
200
250
300
350
400
450
500
550
Ach
ieve
men
t sc
ore
2008 2009 2010 2011 2012 2013 2014 2015 2016
Year 3Year 5Year 7Year 9

50© Department of Education, Western Australia, 2017
Table 5.5: Mean Numeracy Scores 2008–2016
Year 3 Year 5 Year 7 Year 9
2008 378 455 526 556
2009 377 467 528 568
2010 379 471 539 565
2011 383 473 537 568
2012 379 470 527 570
2013 383 471 532 572
2014 388 474 534 579
2015 384 479 527 584
2016 391 480 536 583
NumeracyFigure 5.5: Mean Numeracy scores 2008–2016
2008–2016 trends
600
200
250
300
350
400
450
500
550
Ach
ieve
men
t sc
ore
2008 2009 2010 2011 2012 2013 2014 2015 2016
Year 3Year 5Year 7Year 9

51© Department of Education, Western Australia, 2017
Table 6.1: Achievement of Year 3 students in reading by subgroup 2008–2016
All Males Females Indigenous Non-Indigenous LBOTE Non-LBOTE
Mean% at or above NMS
Mean% at or above NMS
Mean% at or above NMS
Mean% at or above NMS
Mean% at or above NMS
Mean% at or above NMS
Mean% at or above NMS
2008 380 87.6 371 84.9 391 90.3 292 56.6 389 90.7 383 86.6 383 88.6
2009 389 89.7 378 87.0 400 92.7 305 66.9 398 92.2 394 87.3 391 91.2
2010 391 90.0 383 88.1 399 91.9 308 67.2 400 92.5 394 87.7 393 91.3
2011 393 90.7 385 88.5 400 92.9 314 71.4 400 92.6 399 89.8 393 91.4
2012 400 90.1 393 88.0 407 92.3 304 64.1 409 92.4 405 88.4 401 91.0
2013 399 93.1 392 91.5 408 94.9 321 75.5 407 94.8 404 91.8 399 93.5
2014 399 90.3 393 88.4 405 92.3 303 63.4 409 92.8 401 88.7 402 91.4
2015 406 91.7 396 89.6 416 94.1 308 66.7 416 94.2 412 90.5 404 92.2
2016 410 92.7 399 90.6 420 94.9 321 71.9 418 94.7 419 91.8 407 92.9
Year 3: Subgroup trendsReadingFigure 6.1: Year 3 mean Reading scores by subgroup 2008–2016
All
Males
Females
IndigenousNon-Indigenous
LBOTENon-LBOTE
440
260
240
280
300
320
340
360
380
400
420
Mea
n sc
ore
2008 2009 2010 2011 2012 2013 2014 2015 2016
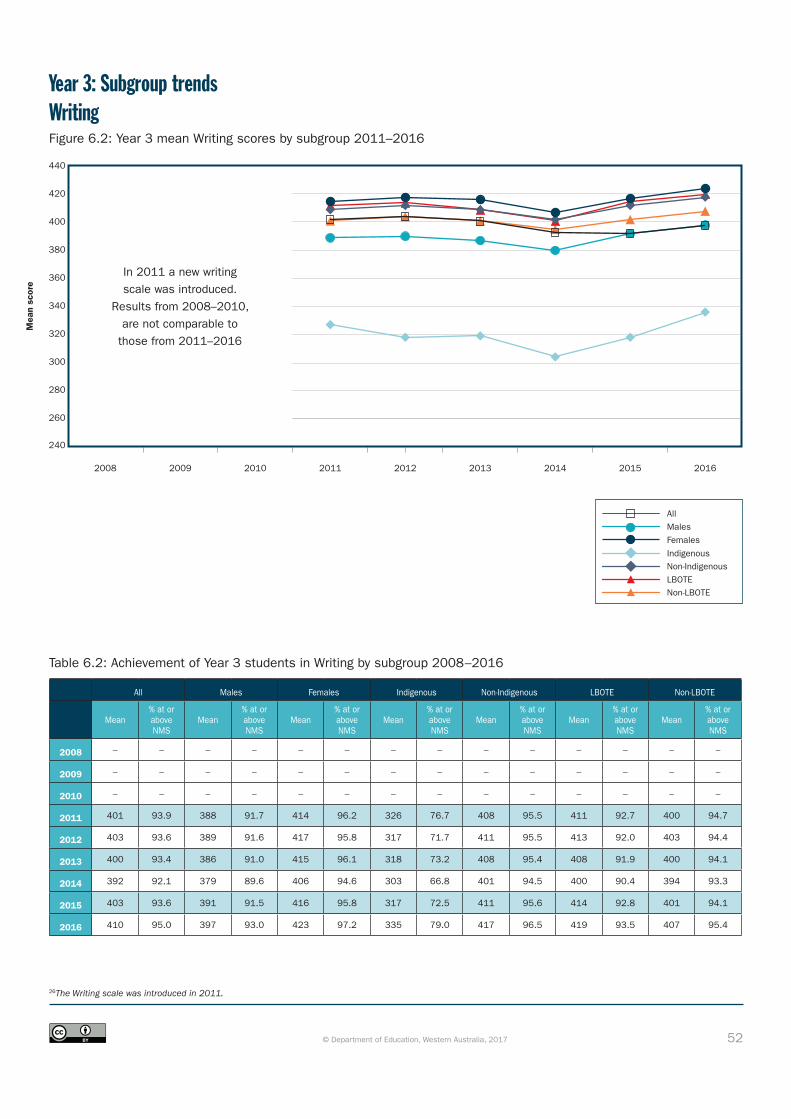
52© Department of Education, Western Australia, 2017
Year 3: Subgroup trendsWritingFigure 6.2: Year 3 mean Writing scores by subgroup 2011–2016
Table 6.2: Achievement of Year 3 students in Writing by subgroup 2008–2016
All Males Females Indigenous Non-Indigenous LBOTE Non-LBOTE
Mean% at or above NMS
Mean% at or above NMS
Mean% at or above NMS
Mean% at or above NMS
Mean% at or above NMS
Mean% at or above NMS
Mean% at or above NMS
2008 – – – – – – – – – – – – – –
2009 – – – – – – – – – – – – – –
2010 – – – – – – – – – – – – – –
2011 401 93.9 388 91.7 414 96.2 326 76.7 408 95.5 411 92.7 400 94.7
2012 403 93.6 389 91.6 417 95.8 317 71.7 411 95.5 413 92.0 403 94.4
2013 400 93.4 386 91.0 415 96.1 318 73.2 408 95.4 408 91.9 400 94.1
2014 392 92.1 379 89.6 406 94.6 303 66.8 401 94.5 400 90.4 394 93.3
2015 403 93.6 391 91.5 416 95.8 317 72.5 411 95.6 414 92.8 401 94.1
2016 410 95.0 397 93.0 423 97.2 335 79.0 417 96.5 419 93.5 407 95.4
26The Writing scale was introduced in 2011.
All
Males
Females
IndigenousNon-Indigenous
LBOTENon-LBOTE
440
260
240
280
300
320
340
360
380
400
420
Mea
n sc
ore
2008 2009 2010 2011 2012 2013 2014 2015 2016
In 2011 a new writingscale was introduced.
Results from 2008–2010, are not comparable to
those from 2011–2016
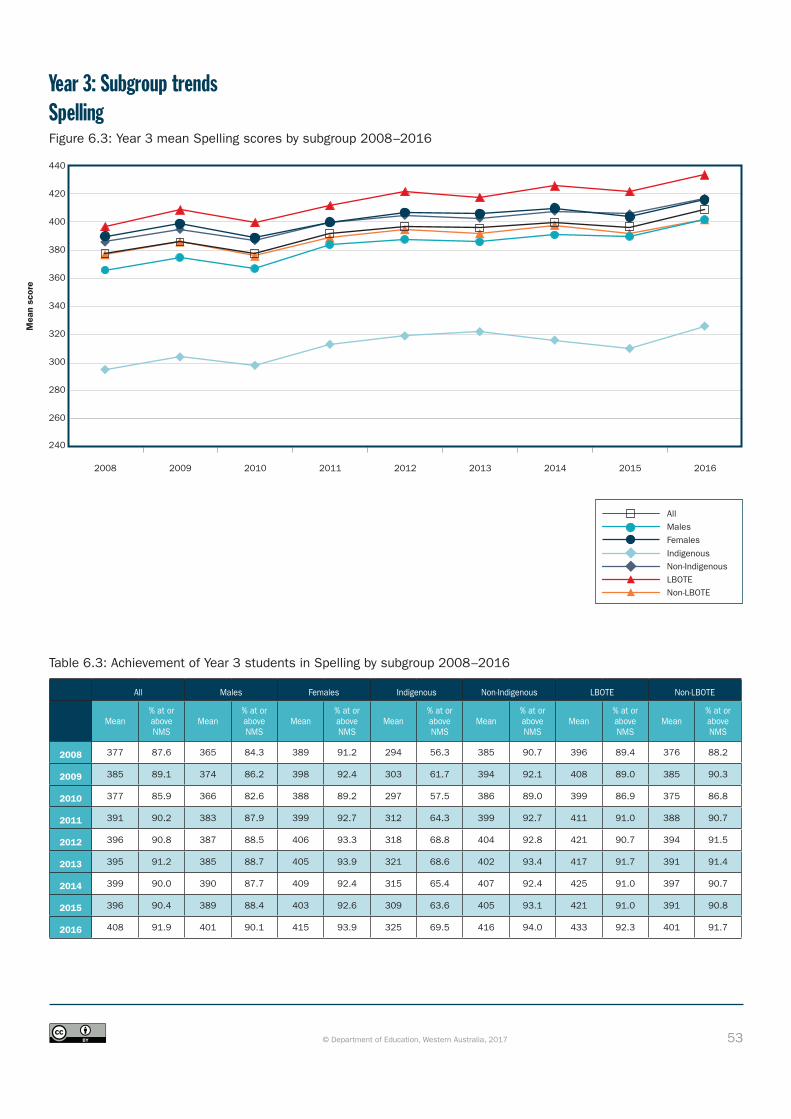
53© Department of Education, Western Australia, 2017
Year 3: Subgroup trendsSpellingFigure 6.3: Year 3 mean Spelling scores by subgroup 2008–2016
Table 6.3: Achievement of Year 3 students in Spelling by subgroup 2008–2016
All Males Females Indigenous Non-Indigenous LBOTE Non-LBOTE
Mean% at or above NMS
Mean% at or above NMS
Mean% at or above NMS
Mean% at or above NMS
Mean% at or above NMS
Mean% at or above NMS
Mean% at or above NMS
2008 377 87.6 365 84.3 389 91.2 294 56.3 385 90.7 396 89.4 376 88.2
2009 385 89.1 374 86.2 398 92.4 303 61.7 394 92.1 408 89.0 385 90.3
2010 377 85.9 366 82.6 388 89.2 297 57.5 386 89.0 399 86.9 375 86.8
2011 391 90.2 383 87.9 399 92.7 312 64.3 399 92.7 411 91.0 388 90.7
2012 396 90.8 387 88.5 406 93.3 318 68.8 404 92.8 421 90.7 394 91.5
2013 395 91.2 385 88.7 405 93.9 321 68.6 402 93.4 417 91.7 391 91.4
2014 399 90.0 390 87.7 409 92.4 315 65.4 407 92.4 425 91.0 397 90.7
2015 396 90.4 389 88.4 403 92.6 309 63.6 405 93.1 421 91.0 391 90.8
2016 408 91.9 401 90.1 415 93.9 325 69.5 416 94.0 433 92.3 401 91.7
All
Males
Females
IndigenousNon-Indigenous
LBOTENon-LBOTE
440
260
240
280
300
320
340
360
380
400
420
Mea
n sc
ore
2008 2009 2010 2011 2012 2013 2014 2015 2016
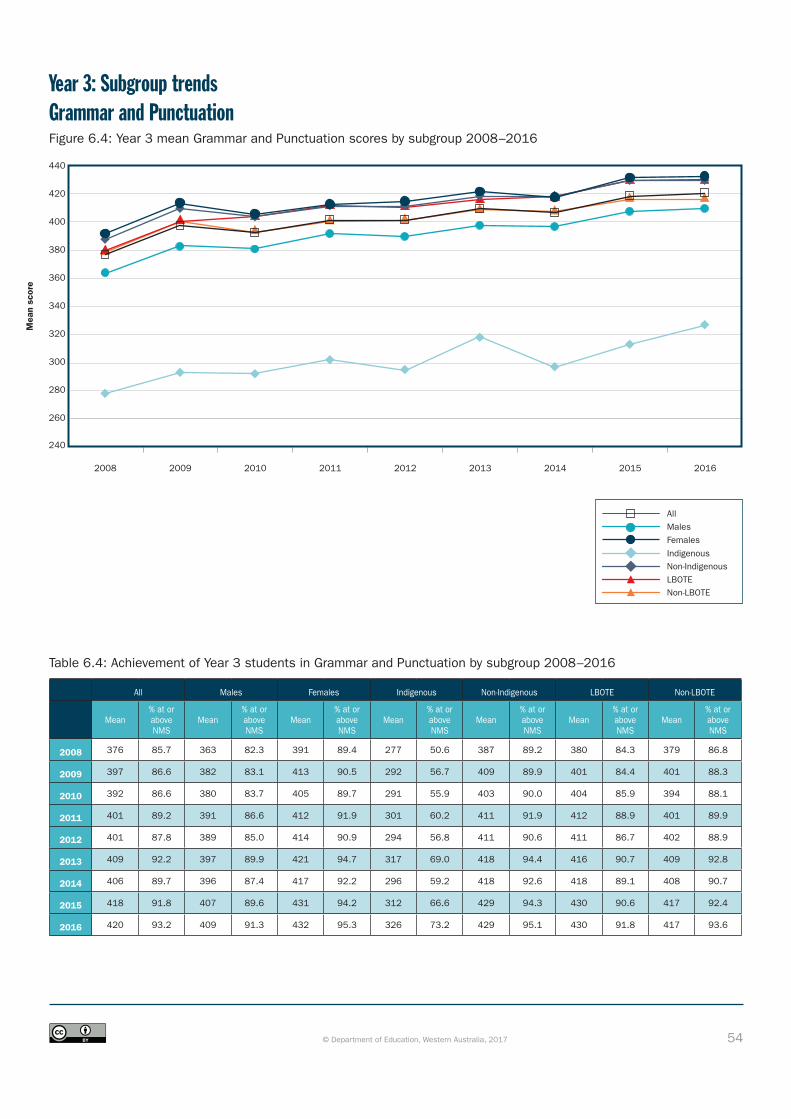
54© Department of Education, Western Australia, 2017
Year 3: Subgroup trendsGrammar and PunctuationFigure 6.4: Year 3 mean Grammar and Punctuation scores by subgroup 2008–2016
Table 6.4: Achievement of Year 3 students in Grammar and Punctuation by subgroup 2008–2016
All Males Females Indigenous Non-Indigenous LBOTE Non-LBOTE
Mean% at or above NMS
Mean% at or above NMS
Mean% at or above NMS
Mean% at or above NMS
Mean% at or above NMS
Mean% at or above NMS
Mean% at or above NMS
2008 376 85.7 363 82.3 391 89.4 277 50.6 387 89.2 380 84.3 379 86.8
2009 397 86.6 382 83.1 413 90.5 292 56.7 409 89.9 401 84.4 401 88.3
2010 392 86.6 380 83.7 405 89.7 291 55.9 403 90.0 404 85.9 394 88.1
2011 401 89.2 391 86.6 412 91.9 301 60.2 411 91.9 412 88.9 401 89.9
2012 401 87.8 389 85.0 414 90.9 294 56.8 411 90.6 411 86.7 402 88.9
2013 409 92.2 397 89.9 421 94.7 317 69.0 418 94.4 416 90.7 409 92.8
2014 406 89.7 396 87.4 417 92.2 296 59.2 418 92.6 418 89.1 408 90.7
2015 418 91.8 407 89.6 431 94.2 312 66.6 429 94.3 430 90.6 417 92.4
2016 420 93.2 409 91.3 432 95.3 326 73.2 429 95.1 430 91.8 417 93.6
All
Males
Females
IndigenousNon-Indigenous
LBOTENon-LBOTE
440
260
240
280
300
320
340
360
380
400
420
Mea
n sc
ore
2008 2009 2010 2011 2012 2013 2014 2015 2016
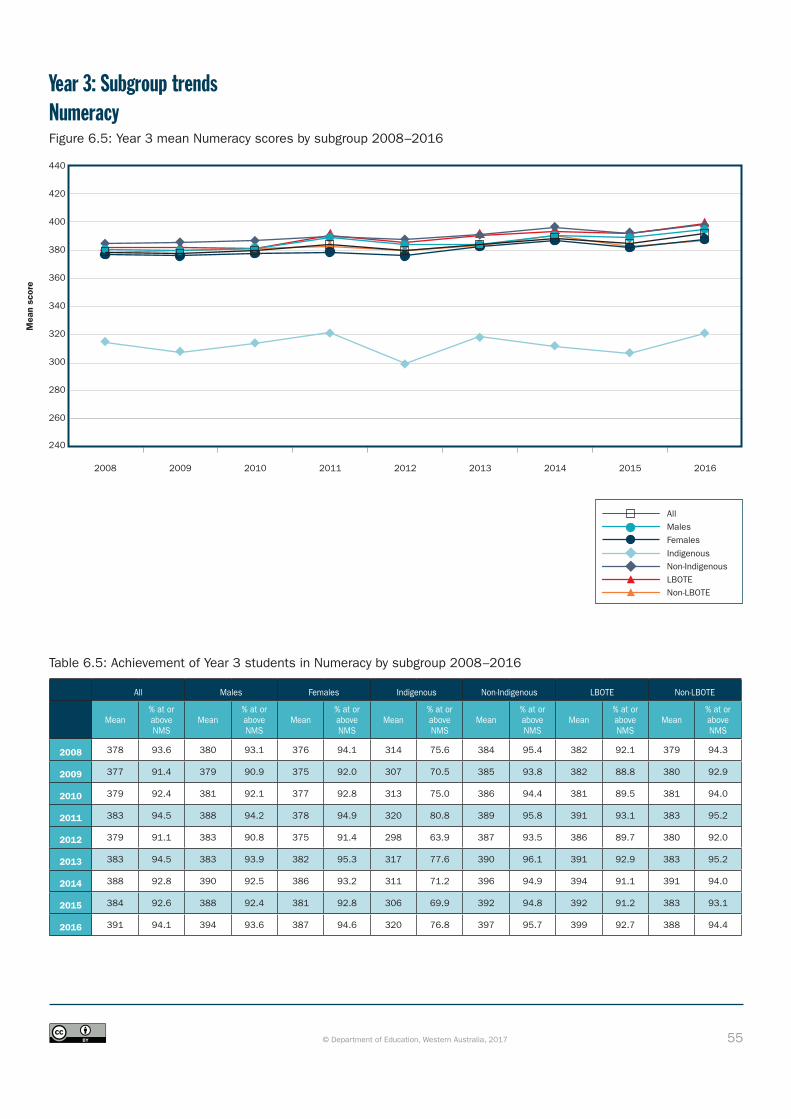
55© Department of Education, Western Australia, 2017
Year 3: Subgroup trendsNumeracyFigure 6.5: Year 3 mean Numeracy scores by subgroup 2008–2016
Table 6.5: Achievement of Year 3 students in Numeracy by subgroup 2008–2016
All Males Females Indigenous Non-Indigenous LBOTE Non-LBOTE
Mean% at or above NMS
Mean% at or above NMS
Mean% at or above NMS
Mean% at or above NMS
Mean% at or above NMS
Mean% at or above NMS
Mean% at or above NMS
2008 378 93.6 380 93.1 376 94.1 314 75.6 384 95.4 382 92.1 379 94.3
2009 377 91.4 379 90.9 375 92.0 307 70.5 385 93.8 382 88.8 380 92.9
2010 379 92.4 381 92.1 377 92.8 313 75.0 386 94.4 381 89.5 381 94.0
2011 383 94.5 388 94.2 378 94.9 320 80.8 389 95.8 391 93.1 383 95.2
2012 379 91.1 383 90.8 375 91.4 298 63.9 387 93.5 386 89.7 380 92.0
2013 383 94.5 383 93.9 382 95.3 317 77.6 390 96.1 391 92.9 383 95.2
2014 388 92.8 390 92.5 386 93.2 311 71.2 396 94.9 394 91.1 391 94.0
2015 384 92.6 388 92.4 381 92.8 306 69.9 392 94.8 392 91.2 383 93.1
2016 391 94.1 394 93.6 387 94.6 320 76.8 397 95.7 399 92.7 388 94.4
All
Males
Females
IndigenousNon-Indigenous
LBOTENon-LBOTE
440
260
240
280
300
320
340
360
380
400
420
Mea
n sc
ore
2008 2009 2010 2011 2012 2013 2014 2015 2016

56© Department of Education, Western Australia, 2017
Table 7.1: Achievement of Year 5 students in Reading by subgroup 2008–2016
All Males Females Indigenous Non-Indigenous LBOTE Non-LBOTE
Mean% at or above NMS
Mean% at or above NMS
Mean% at or above NMS
Mean% at or above NMS
Mean% at or above NMS
Mean% at or above NMS
Mean% at or above NMS
2008 467 87.2 460 84.9 474 89.7 383 52.7 475 90.6 465 84.4 470 88.6
2009 473 86.6 464 84.0 483 89.5 391 56.2 483 89.9 476 83.8 477 88.3
2010 469 86.6 461 83.8 478 89.6 386 53.5 477 89.8 471 84.3 471 87.9
2011 472 87.5 465 85.1 481 90.2 389 55.7 480 90.5 473 84.9 474 88.7
2012 474 87.2 467 84.6 481 90.0 386 53.6 483 90.4 471 84.6 476 88.0
2013 488 95.0 484 93.8 492 96.3 424 79.6 495 96.5 491 93.7 489 95.7
2014 483 89.1 478 86.9 490 91.5 395 59.6 492 91.9 483 86.4 485 90.3
2015 481 90.1 475 88.0 487 92.3 401 63.9 489 92.8 484 88.7 480 90.4
2016 485 89.4 478 87.1 493 91.8 390 57.0 495 92.6 487 87.7 487 90.1
Year 5: Subgroup trendsReadingFigure 7.1: Year 5 mean Reading scores by subgroup 2008–2016
All
Males
Females
IndigenousNon-Indigenous
LBOTENon-LBOTE
Mea
n sc
ore
2008 2009 2010 2011 2012 2013 2014 2015 2016
520
360
380
400
420
440
460
480
500
340
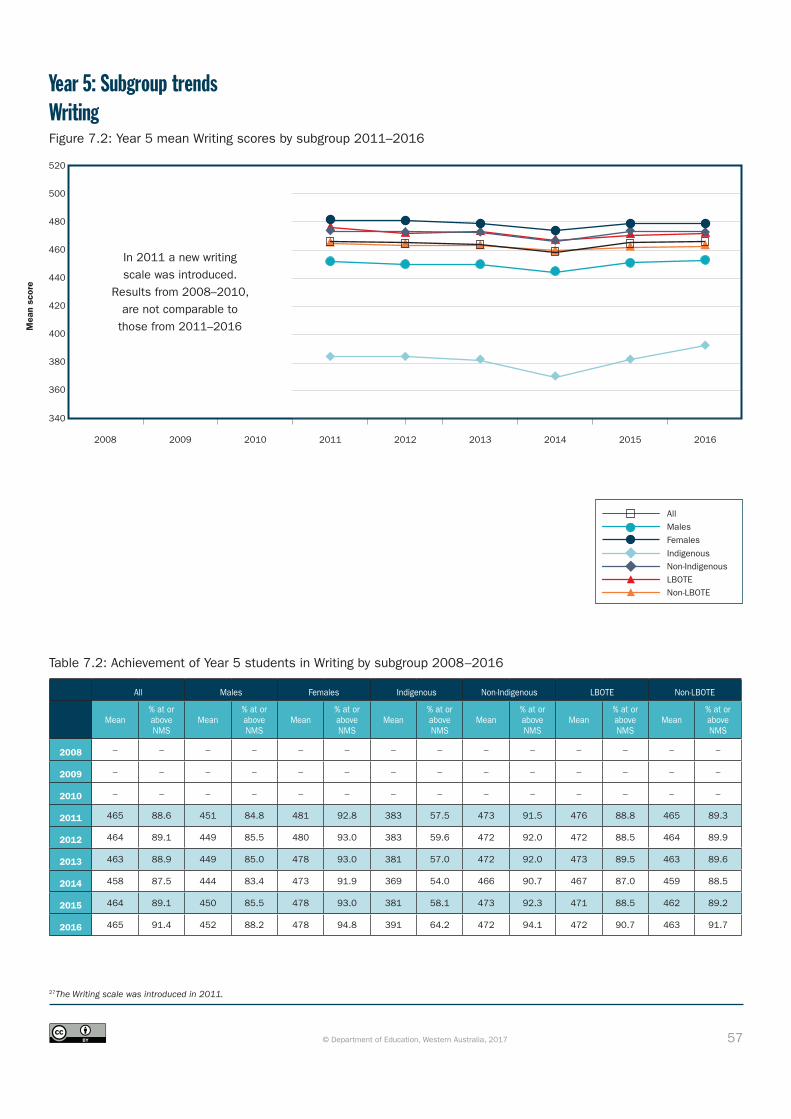
57© Department of Education, Western Australia, 2017
Table 7.2: Achievement of Year 5 students in Writing by subgroup 2008–2016
All Males Females Indigenous Non-Indigenous LBOTE Non-LBOTE
Mean% at or above NMS
Mean% at or above NMS
Mean% at or above NMS
Mean% at or above NMS
Mean% at or above NMS
Mean% at or above NMS
Mean% at or above NMS
2008 – – – – – – – – – – – – – –
2009 – – – – – – – – – – – – – –
2010 – – – – – – – – – – – – – –
2011 465 88.6 451 84.8 481 92.8 383 57.5 473 91.5 476 88.8 465 89.3
2012 464 89.1 449 85.5 480 93.0 383 59.6 472 92.0 472 88.5 464 89.9
2013 463 88.9 449 85.0 478 93.0 381 57.0 472 92.0 473 89.5 463 89.6
2014 458 87.5 444 83.4 473 91.9 369 54.0 466 90.7 467 87.0 459 88.5
2015 464 89.1 450 85.5 478 93.0 381 58.1 473 92.3 471 88.5 462 89.2
2016 465 91.4 452 88.2 478 94.8 391 64.2 472 94.1 472 90.7 463 91.7
Year 5: Subgroup trendsWritingFigure 7.2: Year 5 mean Writing scores by subgroup 2011–2016
27The Writing scale was introduced in 2011.
All
Males
Females
IndigenousNon-Indigenous
LBOTENon-LBOTE
2008 2009 2010 2011 2012 2013 2014 2015 2016
Mea
n sc
ore
520
360
380
400
420
440
460
480
500
340
In 2011 a new writingscale was introduced.
Results from 2008–2010, are not comparable to
those from 2011–2016

58© Department of Education, Western Australia, 2017
Year 5: Subgroup trendsSpellingFigure 7.3: Year 5 mean Spelling scores by subgroup 2008–2016
Table 7.3: Achievement of Year 5 students in Spelling by subgroup 2008–2016
All Males Females Indigenous Non-Indigenous LBOTE Non-LBOTE
Mean% at or above NMS
Mean% at or above NMS
Mean% at or above NMS
Mean% at or above NMS
Mean% at or above NMS
Mean% at or above NMS
Mean% at or above NMS
2008 466 87.9 455 84.2 477 91.9 399 61.2 473 90.6 482 87.9 466 88.8
2009 470 88.2 461 85.4 480 91.3 404 62.9 478 91.0 492 87.3 471 89.6
2010 472 88.0 461 84.5 484 91.7 402 60.6 479 90.7 491 88.2 471 88.9
2011 470 87.7 462 84.8 479 91.0 399 60.0 477 90.3 492 88.5 467 88.3
2012 481 89.5 472 87.0 491 92.1 409 64.9 488 91.8 500 89.4 479 90.1
2013 482 90.7 473 88.2 490 93.3 413 66.1 489 93.2 504 92.3 478 91.0
2014 487 89.8 477 87.1 497 92.7 414 66.0 494 92.1 509 90.1 484 90.3
2015 487 91.2 481 88.9 494 93.7 417 68.6 494 93.5 506 91.6 482 91.1
2016 483 90.6 475 88.4 491 92.9 408 64.6 491 93.1 502 91.0 480 91.0
All
Males
Females
IndigenousNon-Indigenous
LBOTENon-LBOTE
Mea
n sc
ore
2008 2009 2010 2011 2012 2013 2014 2015 2016
520
360
380
400
420
440
460
480
500
340

59© Department of Education, Western Australia, 2017
Table 7.4: Achievement of Year 5 students in Grammar and Punctuation by subgroup 2008–2016
All Males Females Indigenous Non-Indigenous LBOTE Non-LBOTE
Mean% at or above NMS
Mean% at or above NMS
Mean% at or above NMS
Mean% at or above NMS
Mean% at or above NMS
Mean% at or above NMS
Mean% at or above NMS
2008 476 87.4 462 83.9 490 91.2 376 50.2 485 91.1 474 84.4 479 88.9
2009 477 86.4 464 83.2 491 89.9 380 51.1 488 90.2 483 83.5 481 88.2
2010 478 87.6 464 83.9 493 91.6 381 50.4 488 91.3 487 86.1 479 88.8
2011 483 87.7 470 84.4 496 91.3 382 51.7 492 91.1 491 86.2 484 88.8
2012 471 84.9 460 81.4 483 88.5 369 47.9 481 88.4 478 83.8 472 85.6
2013 488 92.5 480 90.4 496 94.7 407 66.2 496 95.1 497 92.2 487 93.2
2014 487 88.9 477 86.1 497 91.9 387 55.1 497 92.1 498 87.7 486 89.7
2015 488 89.3 478 86.4 498 92.5 394 58.3 498 92.5 501 88.9 485 89.5
2016 490 90.8 480 88.2 502 93.5 398 60.9 500 93.8 497 89.4 490 91.2
Year 5: Subgroup trendsGrammar and PunctuationFigure 7.4: Year 5 mean Grammar and Punctuation scores by subgroup 2008–2016
All
Males
Females
IndigenousNon-Indigenous
LBOTENon-LBOTE
Mea
n sc
ore
2008 2009 2010 2011 2012 2013 2014 2015 2016
520
360
380
400
420
440
460
480
500
340
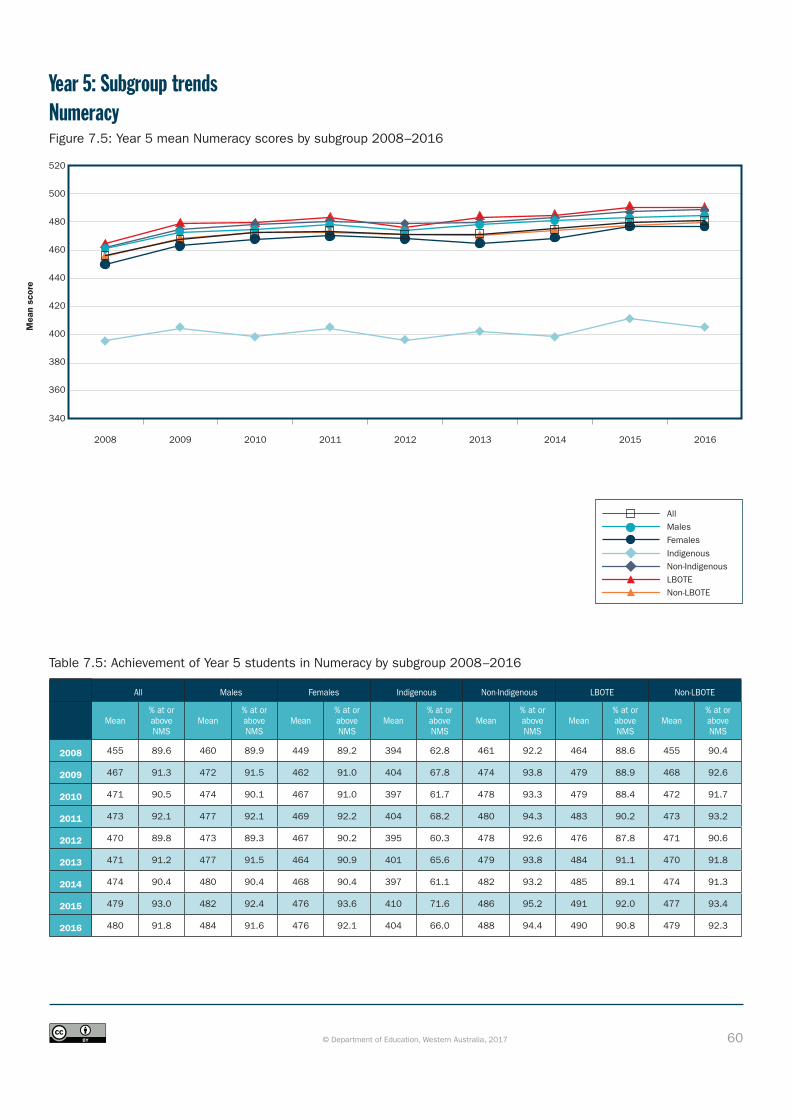
60© Department of Education, Western Australia, 2017
Table 7.5: Achievement of Year 5 students in Numeracy by subgroup 2008–2016
All Males Females Indigenous Non-Indigenous LBOTE Non-LBOTE
Mean% at or above NMS
Mean% at or above NMS
Mean% at or above NMS
Mean% at or above NMS
Mean% at or above NMS
Mean% at or above NMS
Mean% at or above NMS
2008 455 89.6 460 89.9 449 89.2 394 62.8 461 92.2 464 88.6 455 90.4
2009 467 91.3 472 91.5 462 91.0 404 67.8 474 93.8 479 88.9 468 92.6
2010 471 90.5 474 90.1 467 91.0 397 61.7 478 93.3 479 88.4 472 91.7
2011 473 92.1 477 92.1 469 92.2 404 68.2 480 94.3 483 90.2 473 93.2
2012 470 89.8 473 89.3 467 90.2 395 60.3 478 92.6 476 87.8 471 90.6
2013 471 91.2 477 91.5 464 90.9 401 65.6 479 93.8 484 91.1 470 91.8
2014 474 90.4 480 90.4 468 90.4 397 61.1 482 93.2 485 89.1 474 91.3
2015 479 93.0 482 92.4 476 93.6 410 71.6 486 95.2 491 92.0 477 93.4
2016 480 91.8 484 91.6 476 92.1 404 66.0 488 94.4 490 90.8 479 92.3
Year 5: Subgroup trendsNumeracyFigure 7.5: Year 5 mean Numeracy scores by subgroup 2008–2016
All
Males
Females
IndigenousNon-Indigenous
LBOTENon-LBOTE
Mea
n sc
ore
2008 2009 2010 2011 2012 2013 2014 2015 2016
520
360
380
400
420
440
460
480
500
340

61© Department of Education, Western Australia, 2017
Year 7: Subgroup trendsReadingFigure 8.1: Year 7 mean Reading scores by subgroup 2008–2016
560
400
420
440
460
480
500
520
540
380
Table 8.1: Achievement of Year 7 students in Reading by subgroup 2008–2016
All Males Females Indigenous Non-Indigenous LBOTE Non-LBOTE
Mean% at or above NMS
Mean% at or above NMS
Mean% at or above NMS
Mean% at or above NMS
Mean% at or above NMS
Mean% at or above NMS
Mean% at or above NMS
2008 519 91.0 514 89.1 525 93.2 450 64.1 526 93.6 518 88.4 522 92.0
2009 524 89.6 517 87.3 532 92.4 458 65.8 532 92.2 526 85.8 528 91.4
2010 535 92.2 530 90.5 541 94.1 463 70.1 542 94.4 532 87.6 538 93.6
2011 531 92.8 526 91.4 536 94.3 465 72.9 538 94.9 531 89.6 533 93.5
2012 527 91.2 519 89.0 536 93.6 459 68.3 534 93.5 525 87.9 530 92.3
2013 528 91.4 522 89.8 534 93.3 460 68.8 536 93.9 530 89.7 528 92.1
2014 533 92.8 528 91.0 538 94.6 466 72.5 541 95.1 535 90.4 533 93.5
2015 528 92.2 523 90.4 533 94.2 464 72.9 535 94.4 535 91.0 527 92.7
2016 525 91.0 521 89.1 530 93.0 453 67.6 532 93.6 525 89.3 526 91.8
All
Males
Females
IndigenousNon-Indigenous
LBOTENon-LBOTE
Mea
n sc
ore
2008 2009 2010 2011 2012 2013 2014 2015 2016
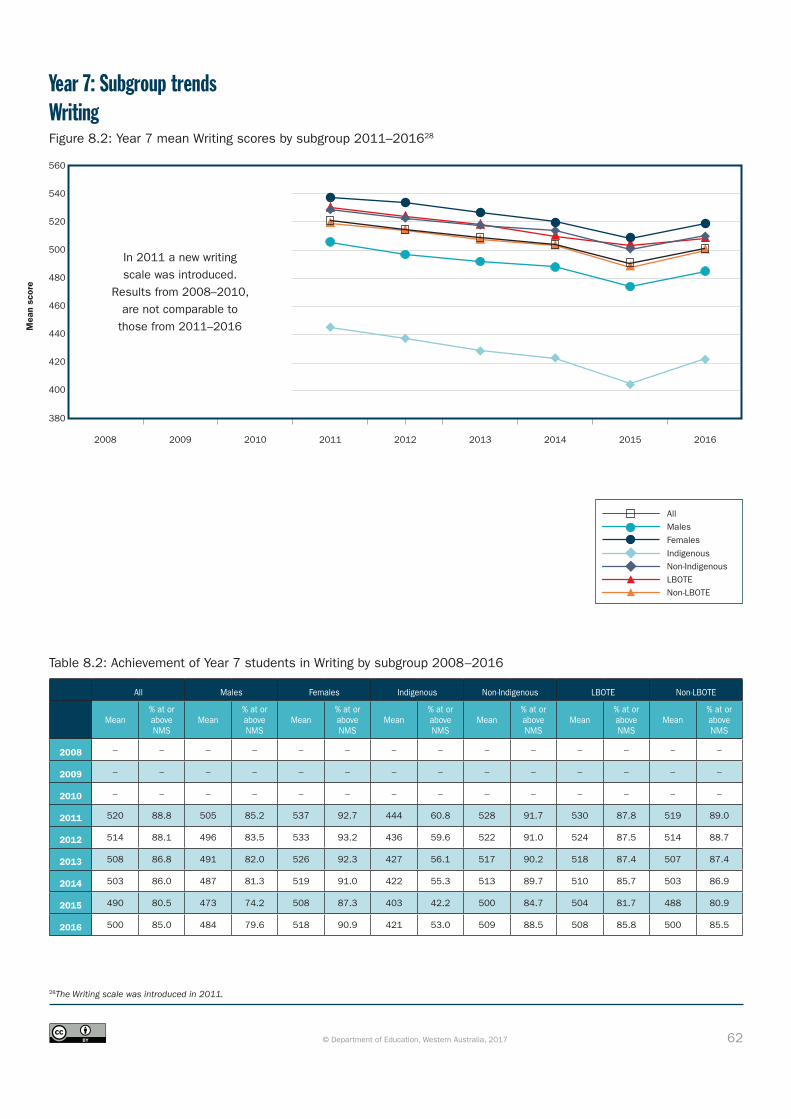
62© Department of Education, Western Australia, 2017
Year 7: Subgroup trendsWritingFigure 8.2: Year 7 mean Writing scores by subgroup 2011–201628
560
400
420
440
460
480
500
520
540
380
Table 8.2: Achievement of Year 7 students in Writing by subgroup 2008–2016
All Males Females Indigenous Non-Indigenous LBOTE Non-LBOTE
Mean% at or above NMS
Mean% at or above NMS
Mean% at or above NMS
Mean% at or above NMS
Mean% at or above NMS
Mean% at or above NMS
Mean% at or above NMS
2008 – – – – – – – – – – – – – –
2009 – – – – – – – – – – – – – –
2010 – – – – – – – – – – – – – –
2011 520 88.8 505 85.2 537 92.7 444 60.8 528 91.7 530 87.8 519 89.0
2012 514 88.1 496 83.5 533 93.2 436 59.6 522 91.0 524 87.5 514 88.7
2013 508 86.8 491 82.0 526 92.3 427 56.1 517 90.2 518 87.4 507 87.4
2014 503 86.0 487 81.3 519 91.0 422 55.3 513 89.7 510 85.7 503 86.9
2015 490 80.5 473 74.2 508 87.3 403 42.2 500 84.7 504 81.7 488 80.9
2016 500 85.0 484 79.6 518 90.9 421 53.0 509 88.5 508 85.8 500 85.5
28The Writing scale was introduced in 2011.
All
Males
Females
IndigenousNon-Indigenous
LBOTENon-LBOTE
2008 2009 2010 2011 2012 2013 2014 2015 2016
Mea
n sc
ore
In 2011 a new writingscale was introduced.
Results from 2008–2010, are not comparable to
those from 2011–2016
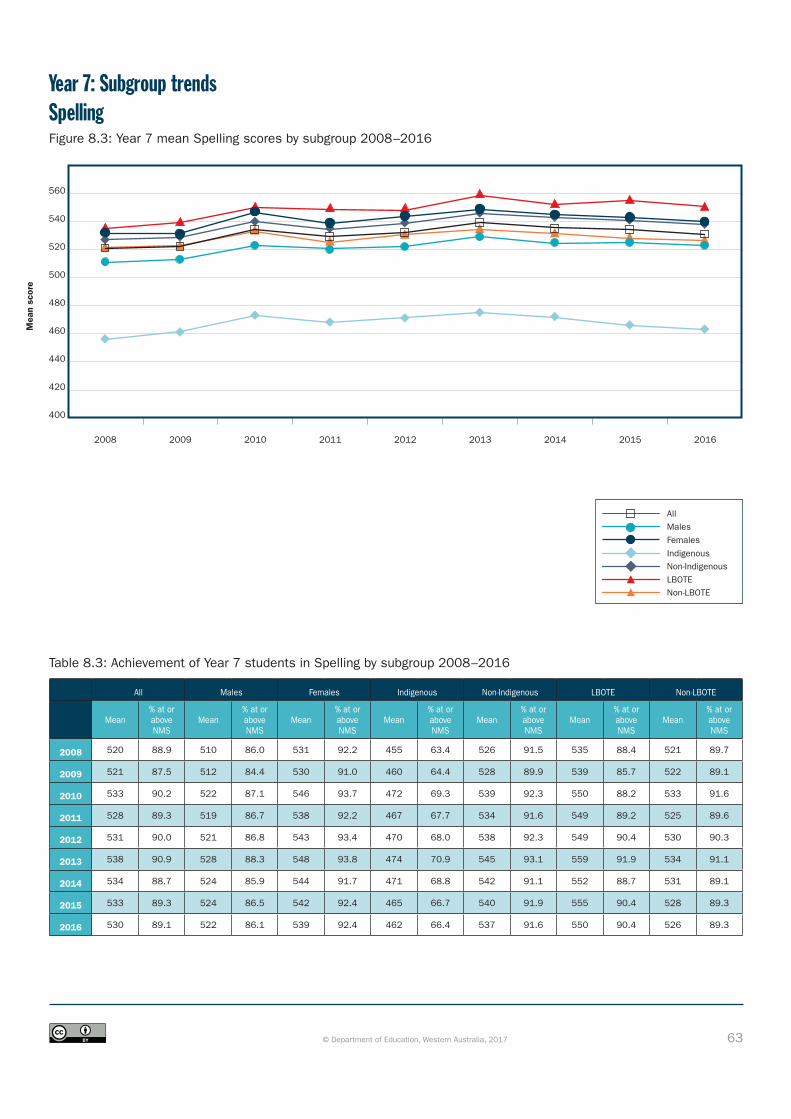
63© Department of Education, Western Australia, 2017
560
400
420
440
460
480
500
520
540
Table 8.3: Achievement of Year 7 students in Spelling by subgroup 2008–2016
All Males Females Indigenous Non-Indigenous LBOTE Non-LBOTE
Mean% at or above NMS
Mean% at or above NMS
Mean% at or above NMS
Mean% at or above NMS
Mean% at or above NMS
Mean% at or above NMS
Mean% at or above NMS
2008 520 88.9 510 86.0 531 92.2 455 63.4 526 91.5 535 88.4 521 89.7
2009 521 87.5 512 84.4 530 91.0 460 64.4 528 89.9 539 85.7 522 89.1
2010 533 90.2 522 87.1 546 93.7 472 69.3 539 92.3 550 88.2 533 91.6
2011 528 89.3 519 86.7 538 92.2 467 67.7 534 91.6 549 89.2 525 89.6
2012 531 90.0 521 86.8 543 93.4 470 68.0 538 92.3 549 90.4 530 90.3
2013 538 90.9 528 88.3 548 93.8 474 70.9 545 93.1 559 91.9 534 91.1
2014 534 88.7 524 85.9 544 91.7 471 68.8 542 91.1 552 88.7 531 89.1
2015 533 89.3 524 86.5 542 92.4 465 66.7 540 91.9 555 90.4 528 89.3
2016 530 89.1 522 86.1 539 92.4 462 66.4 537 91.6 550 90.4 526 89.3
Year 7: Subgroup trendsSpellingFigure 8.3: Year 7 mean Spelling scores by subgroup 2008–2016
All
Males
Females
IndigenousNon-Indigenous
LBOTENon-LBOTE
Mea
n sc
ore
2008 2009 2010 2011 2012 2013 2014 2015 2016
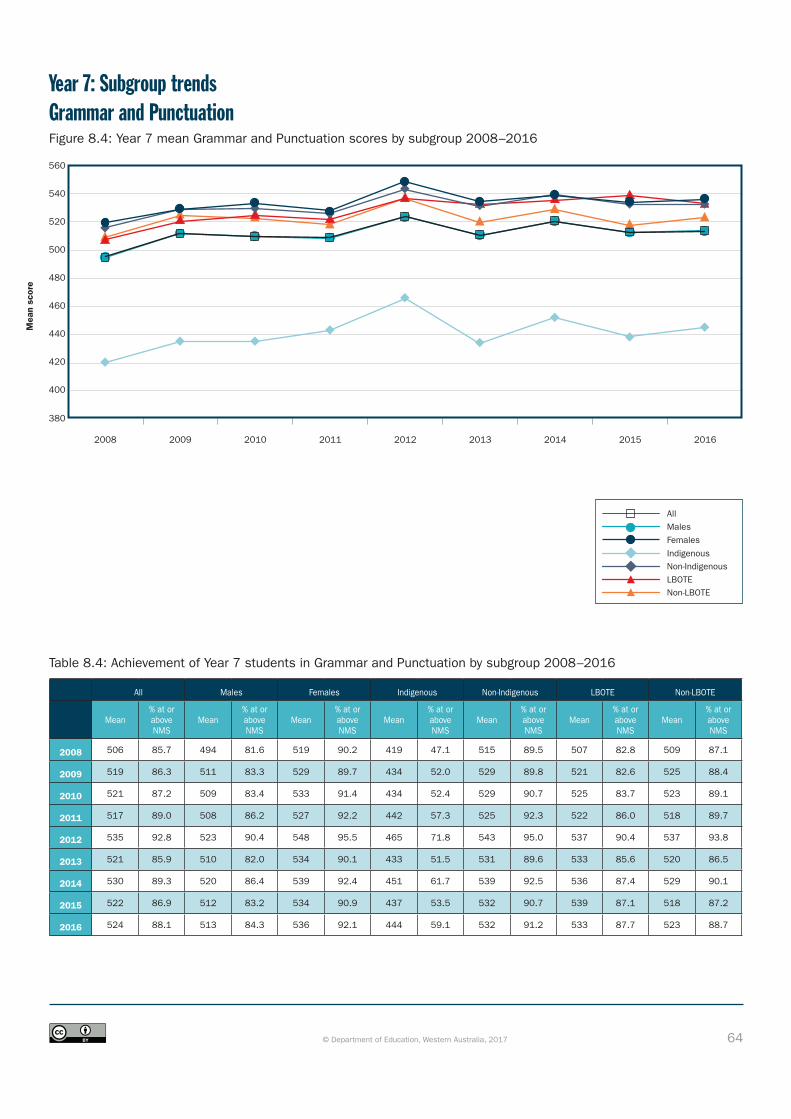
64© Department of Education, Western Australia, 2017
560
400
420
440
460
480
500
520
540
380
Table 8.4: Achievement of Year 7 students in Grammar and Punctuation by subgroup 2008–2016
All Males Females Indigenous Non-Indigenous LBOTE Non-LBOTE
Mean% at or above NMS
Mean% at or above NMS
Mean% at or above NMS
Mean% at or above NMS
Mean% at or above NMS
Mean% at or above NMS
Mean% at or above NMS
2008 506 85.7 494 81.6 519 90.2 419 47.1 515 89.5 507 82.8 509 87.1
2009 519 86.3 511 83.3 529 89.7 434 52.0 529 89.8 521 82.6 525 88.4
2010 521 87.2 509 83.4 533 91.4 434 52.4 529 90.7 525 83.7 523 89.1
2011 517 89.0 508 86.2 527 92.2 442 57.3 525 92.3 522 86.0 518 89.7
2012 535 92.8 523 90.4 548 95.5 465 71.8 543 95.0 537 90.4 537 93.8
2013 521 85.9 510 82.0 534 90.1 433 51.5 531 89.6 533 85.6 520 86.5
2014 530 89.3 520 86.4 539 92.4 451 61.7 539 92.5 536 87.4 529 90.1
2015 522 86.9 512 83.2 534 90.9 437 53.5 532 90.7 539 87.1 518 87.2
2016 524 88.1 513 84.3 536 92.1 444 59.1 532 91.2 533 87.7 523 88.7
Year 7: Subgroup trendsGrammar and PunctuationFigure 8.4: Year 7 mean Grammar and Punctuation scores by subgroup 2008–2016
All
Males
Females
IndigenousNon-Indigenous
LBOTENon-LBOTE
Mea
n sc
ore
2008 2009 2010 2011 2012 2013 2014 2015 2016
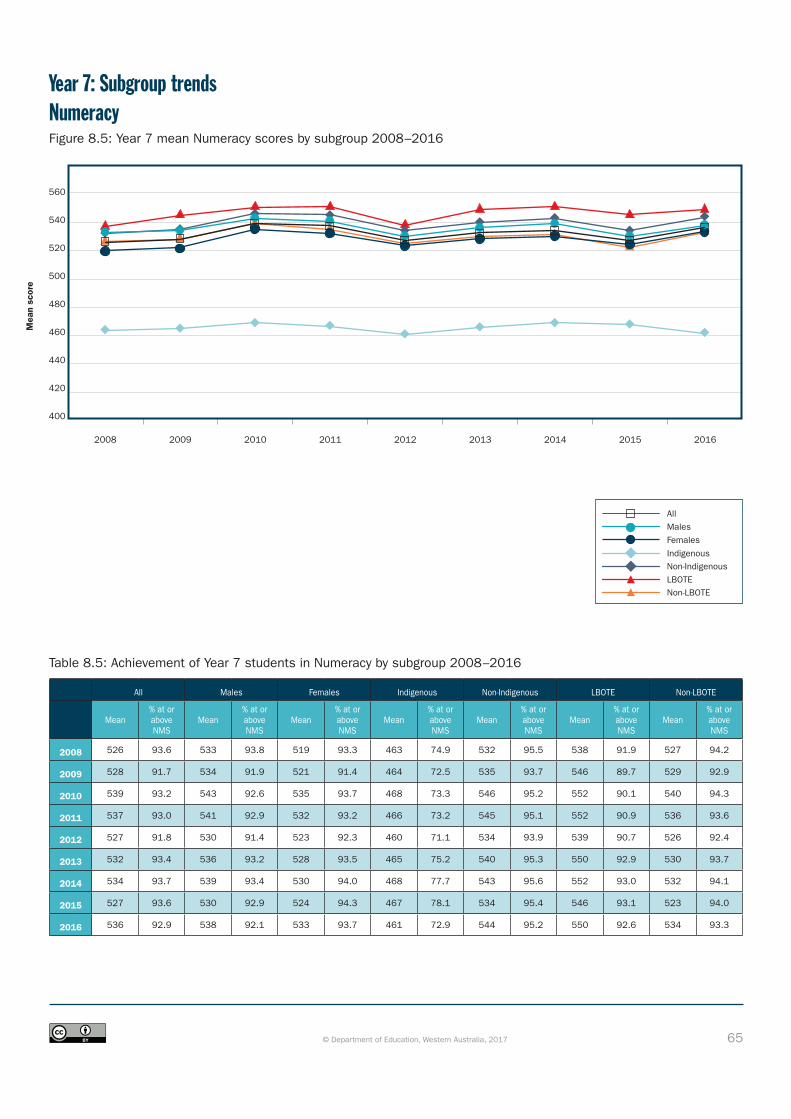
65© Department of Education, Western Australia, 2017
560
400
420
440
460
480
500
520
540
Table 8.5: Achievement of Year 7 students in Numeracy by subgroup 2008–2016
All Males Females Indigenous Non-Indigenous LBOTE Non-LBOTE
Mean% at or above NMS
Mean% at or above NMS
Mean% at or above NMS
Mean% at or above NMS
Mean% at or above NMS
Mean% at or above NMS
Mean% at or above NMS
2008 526 93.6 533 93.8 519 93.3 463 74.9 532 95.5 538 91.9 527 94.2
2009 528 91.7 534 91.9 521 91.4 464 72.5 535 93.7 546 89.7 529 92.9
2010 539 93.2 543 92.6 535 93.7 468 73.3 546 95.2 552 90.1 540 94.3
2011 537 93.0 541 92.9 532 93.2 466 73.2 545 95.1 552 90.9 536 93.6
2012 527 91.8 530 91.4 523 92.3 460 71.1 534 93.9 539 90.7 526 92.4
2013 532 93.4 536 93.2 528 93.5 465 75.2 540 95.3 550 92.9 530 93.7
2014 534 93.7 539 93.4 530 94.0 468 77.7 543 95.6 552 93.0 532 94.1
2015 527 93.6 530 92.9 524 94.3 467 78.1 534 95.4 546 93.1 523 94.0
2016 536 92.9 538 92.1 533 93.7 461 72.9 544 95.2 550 92.6 534 93.3
Year 7: Subgroup trendsNumeracyFigure 8.5: Year 7 mean Numeracy scores by subgroup 2008–2016
All
Males
Females
IndigenousNon-Indigenous
LBOTENon-LBOTE
Mea
n sc
ore
2008 2009 2010 2011 2012 2013 2014 2015 2016

66© Department of Education, Western Australia, 2017
Table 9.1: Achievement of Year 9 students in Reading by subgroup 2008–2016
All Males Females Indigenous Non-Indigenous LBOTE Non-LBOTE
Mean% at or above NMS
Mean% at or above NMS
Mean% at or above NMS
Mean% at or above NMS
Mean% at or above NMS
Mean% at or above NMS
Mean% at or above NMS
2008 556 88.4 552 86.3 561 90.7 495 62.0 562 90.9 548 85.3 561 89.8
2009 558 85.3 548 81.6 570 89.5 491 54.5 566 88.5 547 78.2 554 84.6
2010 552 84.6 545 81.6 560 87.9 487 52.3 558 87.7 542 77.1 558 87.0
2011 562 86.8 559 84.9 566 88.9 500 61.6 568 88.9 558 80.2 568 88.6
2012 560 86.6 552 83.9 568 89.7 490 55.3 566 89.6 552 82.2 565 88.5
2013 568 89.7 563 87.9 574 91.6 503 64.1 575 92.4 567 87.4 570 90.5
2014 572 89.8 563 87.2 581 92.5 504 64.1 579 92.6 574 87.8 573 90.6
2015 572 90.1 563 87.6 581 92.8 504 65.1 579 92.6 577 87.2 571 91.0
2016 572 91.2 569 90.0 576 92.4 508 68.6 579 93.9 571 87.3 573 92.0
Year 9: Subgroup trendsReadingFigure 9.1: Year 9 mean Reading scores by subgroup 2008–2016
600
440
460
480
500
520
540
560
580
420
All
Males
Females
IndigenousNon-Indigenous
LBOTENon-LBOTE
Mea
n sc
ore
2008 2009 2010 2011 2012 2013 2014 2015 2016

67© Department of Education, Western Australia, 2017
Table 9.2: Achievement of Year 9 students in Writing by subgroup 2008–2016
All Males Females Indigenous Non-Indigenous LBOTE Non-LBOTE
Mean% at or above NMS
Mean% at or above NMS
Mean% at or above NMS
Mean% at or above NMS
Mean% at or above NMS
Mean% at or above NMS
Mean% at or above NMS
2008 – – – – – – – – – – – – – –
2009 – – – – – – – – – – – – – –
2010 – – – – – – – – – – – – – –
2011 542 76.3 523 69.5 563 84.2 460 44.1 549 79.1 553 76.2 546 78.4
2012 542 77.1 521 69.6 564 85.6 455 41.0 550 80.7 551 78.8 545 78.8
2013 538 77.1 517 69.3 560 85.7 451 41.0 547 81.0 544 78.3 539 77.6
2014 547 80.2 527 73.5 568 87.6 458 45.9 556 84.0 555 81.3 548 81.1
2015 536 76.7 517 69.2 557 85.0 440 37.8 546 80.8 546 77.6 535 76.4
2016 542 80.2 524 73.7 560 87.1 463 46.9 551 84.1 547 79.0 541 80.7
Year 9: Subgroup trendsWritingFigure 9.2: Year 9 mean Writing scores by subgroup 2011–201629
29The Writing scale was introduced in 2011.
600
440
460
480
500
520
540
560
580
420
All
Males
Females
IndigenousNon-Indigenous
LBOTENon-LBOTE
2008 2009 2010 2011 2012 2013 2014 2015 2016
Mea
n sc
ore In 2011 a new writing
scale was introduced.Results from 2008–2010,
are not comparable to those from 2011–2016
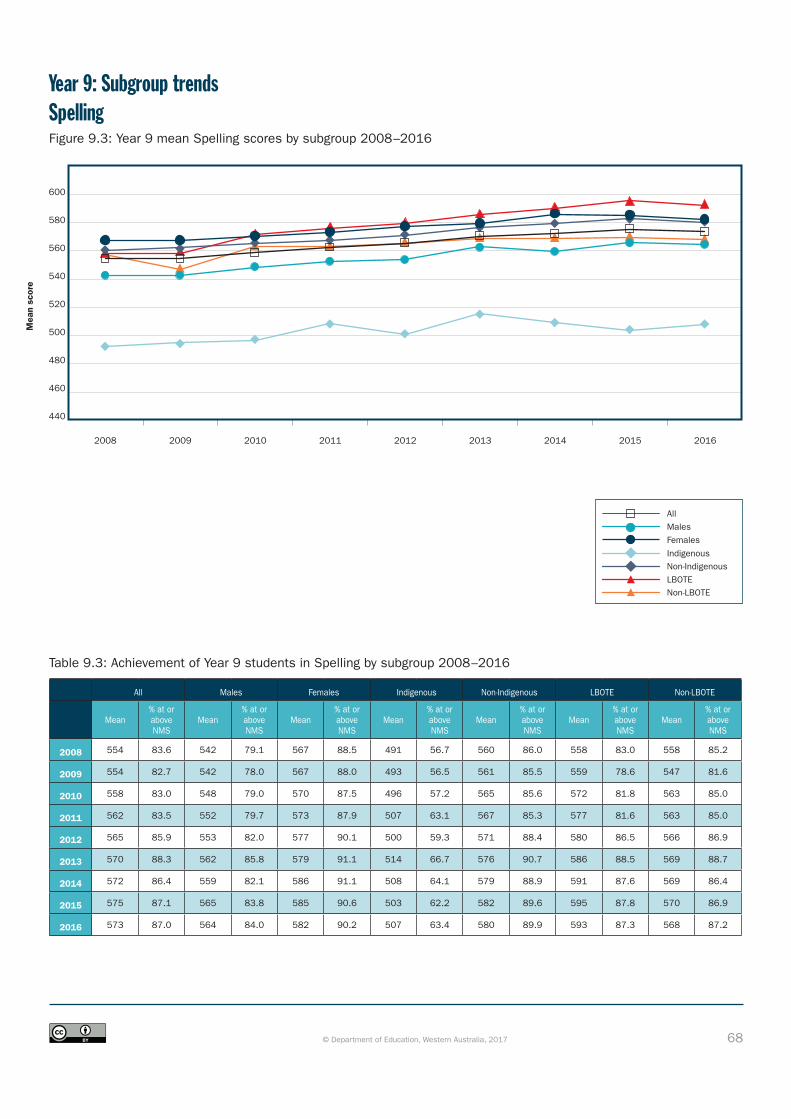
68© Department of Education, Western Australia, 2017
600
440
460
480
500
520
540
560
580
Table 9.3: Achievement of Year 9 students in Spelling by subgroup 2008–2016
All Males Females Indigenous Non-Indigenous LBOTE Non-LBOTE
Mean% at or above NMS
Mean% at or above NMS
Mean% at or above NMS
Mean% at or above NMS
Mean% at or above NMS
Mean% at or above NMS
Mean% at or above NMS
2008 554 83.6 542 79.1 567 88.5 491 56.7 560 86.0 558 83.0 558 85.2
2009 554 82.7 542 78.0 567 88.0 493 56.5 561 85.5 559 78.6 547 81.6
2010 558 83.0 548 79.0 570 87.5 496 57.2 565 85.6 572 81.8 563 85.0
2011 562 83.5 552 79.7 573 87.9 507 63.1 567 85.3 577 81.6 563 85.0
2012 565 85.9 553 82.0 577 90.1 500 59.3 571 88.4 580 86.5 566 86.9
2013 570 88.3 562 85.8 579 91.1 514 66.7 576 90.7 586 88.5 569 88.7
2014 572 86.4 559 82.1 586 91.1 508 64.1 579 88.9 591 87.6 569 86.4
2015 575 87.1 565 83.8 585 90.6 503 62.2 582 89.6 595 87.8 570 86.9
2016 573 87.0 564 84.0 582 90.2 507 63.4 580 89.9 593 87.3 568 87.2
Year 9: Subgroup trendsSpellingFigure 9.3: Year 9 mean Spelling scores by subgroup 2008–2016
All
Males
Females
IndigenousNon-Indigenous
LBOTENon-LBOTE
Mea
n sc
ore
2008 2009 2010 2011 2012 2013 2014 2015 2016
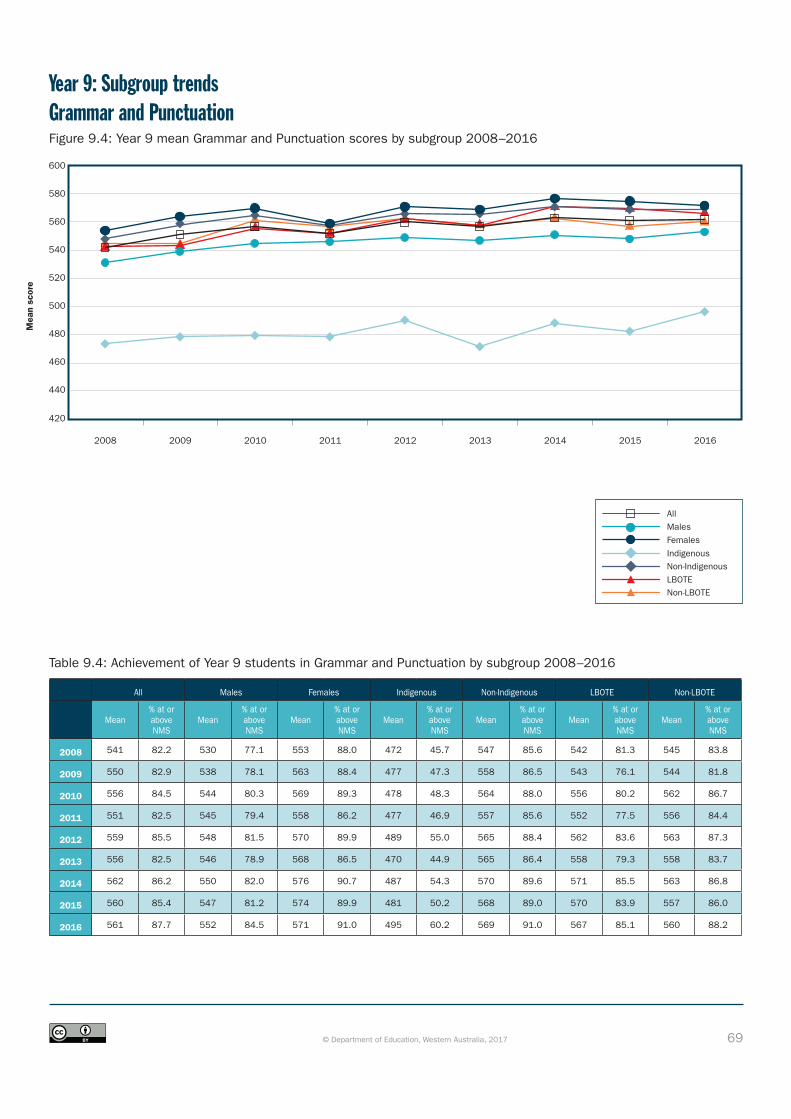
69© Department of Education, Western Australia, 2017
600
440
460
480
500
520
540
560
580
420
Table 9.4: Achievement of Year 9 students in Grammar and Punctuation by subgroup 2008–2016
All Males Females Indigenous Non-Indigenous LBOTE Non-LBOTE
Mean% at or above NMS
Mean% at or above NMS
Mean% at or above NMS
Mean% at or above NMS
Mean% at or above NMS
Mean% at or above NMS
Mean% at or above NMS
2008 541 82.2 530 77.1 553 88.0 472 45.7 547 85.6 542 81.3 545 83.8
2009 550 82.9 538 78.1 563 88.4 477 47.3 558 86.5 543 76.1 544 81.8
2010 556 84.5 544 80.3 569 89.3 478 48.3 564 88.0 556 80.2 562 86.7
2011 551 82.5 545 79.4 558 86.2 477 46.9 557 85.6 552 77.5 556 84.4
2012 559 85.5 548 81.5 570 89.9 489 55.0 565 88.4 562 83.6 563 87.3
2013 556 82.5 546 78.9 568 86.5 470 44.9 565 86.4 558 79.3 558 83.7
2014 562 86.2 550 82.0 576 90.7 487 54.3 570 89.6 571 85.5 563 86.8
2015 560 85.4 547 81.2 574 89.9 481 50.2 568 89.0 570 83.9 557 86.0
2016 561 87.7 552 84.5 571 91.0 495 60.2 569 91.0 567 85.1 560 88.2
Year 9: Subgroup trendsGrammar and PunctuationFigure 9.4: Year 9 mean Grammar and Punctuation scores by subgroup 2008–2016
All
Males
Females
IndigenousNon-Indigenous
LBOTENon-LBOTE
Mea
n sc
ore
2008 2009 2010 2011 2012 2013 2014 2015 2016

70© Department of Education, Western Australia, 2017
620
460
480
500
520
540
560
580
600
440
Table 9.5: Achievement of Year 9 students in Numeracy by subgroup 2008–2016
All Males Females Indigenous Non-Indigenous LBOTE Non-LBOTE
Mean% at or above NMS
Mean% at or above NMS
Mean% at or above NMS
Mean% at or above NMS
Mean% at or above NMS
Mean% at or above NMS
Mean% at or above NMS
2008 556 89.0 560 89.4 552 88.5 498 64.9 562 91.3 564 87.8 560 89.9
2009 568 90.4 569 89.8 566 91.0 504 66.6 575 92.9 577 87.3 559 89.6
2010 565 88.6 570 89.2 559 87.8 499 61.7 571 91.2 571 85.1 570 90.2
2011 568 88.4 573 88.6 562 88.3 505 66.1 574 90.4 581 85.1 572 90.0
2012 570 90.0 575 90.3 565 89.8 504 66.0 576 92.3 583 90.3 572 91.0
2013 572 87.2 578 88.3 565 86.0 495 59.2 580 90.2 591 86.7 572 87.9
2014 579 92.4 583 92.1 575 92.6 515 73.0 586 94.6 594 92.2 578 92.9
2015 584 94.7 588 94.6 581 94.7 523 80.0 591 96.2 605 93.5 581 95.1
2016 583 93.9 587 93.4 579 94.5 519 77.5 590 96.0 603 92.6 579 94.1
Year 9: Subgroup trendsNumeracyFigure 9.5: Year 9 mean Numeracy scores by subgroup 2008–2016
All
Males
Females
IndigenousNon-Indigenous
LBOTENon-LBOTE
Mea
n sc
ore
420
2008 2009 2010 2011 2012 2013 2014 2015 2016

71© Department of Education, Western Australia, 2017
Year 3: Comparisons by geolocation and Indigenous status 2014–2016Table 10.1: Achievement of Year 3 students in all subject areas by geolocation and Indigenous status 2014–2016
Geolocation
Reading Mean scale score
Writing Mean scale score
Spelling Mean scale score
Grammar and Punctuation Mean scale score
Numeracy Mean scale score
2014 2015 2016 2014 2015 2016 2014 2015 2016 2014 2015 2016 2014 2015 2016
Major Cities
Indigenous 324.9 335.7 344.2 329.1 347.9 358.9 338.4 339.2 351.2 319.4 341.5 353.4 326.3 328.0 337.2
Non-Indigenous 414.9 422.0 424.0 407.0 417.2 421.4 415.7 412.5 422.9 426.0 436.8 435.9 401.3 397.8 402.1
Inner Regional
Indigenous 330.2 318.4 340.4 325.4 327.9 351.6 334.0 315.8 344.6 319.9 322.0 346.3 329.0 312.4 340.6
Non-Indigenous 393.0 394.7 397.5 386.0 395.4 402.4 386.1 383.0 391.7 395.2 406.1 406.6 381.1 375.1 382.6
Outer Regional
Indigenous 305.5 303.4 325.1 317.4 315.3 346.0 321.6 302.3 329.2 298.0 306.7 329.0 313.6 299.7 324.9
Non-Indigenous 384.6 393.0 398.3 379.8 387.3 401.7 380.8 378.4 392.1 386.5 403.2 403.9 374.8 371.9 381.6
Remote
Indigenous 279.2 296.3 298.5 281.3 298.5 315.2 295.8 296.4 302.6 273.0 297.6 301.7 297.7 297.2 303.6
Non-Indigenous 391.2 402.9 401.9 386.4 400.1 402.0 381.0 385.4 393.1 396.0 412.2 407.0 382.7 383.5 384.7
Very Remote
Indigenous 258.6 259.4 267.4 240.8 263.7 277.3 262.3 257.6 268.3 247.7 260.4 267.4 275.0 268.4 278.2
Non-Indigenous 380.8 387.6 391.7 373.7 389.2 399.5 364.9 373.8 387.3 385.6 400.0 399.5 372.6 370.3 375.0
Table 10.2: Percentage of Year 3 students at or above national minimum standard in all subject areas by geolocation and Indigenous status 2014–2016
Geolocation
Reading Mean scale score
Writing Mean scale score
Spelling Mean scale score
Grammar and Punctuation Mean scale score
Numeracy Mean scale score
2014 2015 2016 2014 2015 2016 2014 2015 2016 2014 2015 2016 2014 2015 2016
Major Cities
Indigenous 73.7 76.3 81.3 78.2 83.0 86.4 75.2 75.2 80.7 69.8 77.0 83.7 79.5 80.5 83.9
Non-Indigenous 93.4 94.5 94.9 94.8 96.0 96.6 93.3 93.9 94.4 93.3 94.7 95.3 95.2 95.1 95.8
Inner Regional
Indigenous 75.4 75.9 80.6 77.9 79.0 86.9 75.9 69.7 77.5 71.3 73.0 80.3 80.8 75.2 84.8
Non-Indigenous 92.3 93.1 93.9 94.0 95.1 96.4 90.6 90.9 92.4 91.2 93.2 94.7 94.7 94.3 95.7
Outer Regional
Indigenous 64.6 64.7 77.0 75.1 73.3 85.8 69.7 60.3 72.9 60.9 64.9 76.7 73.9 66.8 81.1
Non-Indigenous 90.0 92.1 93.6 93.1 93.9 96.3 88.9 89.4 92.5 89.1 92.0 93.8 93.0 92.8 95.5
Remote
Indigenous 52.0 61.8 60.8 55.6 65.2 70.5 57.0 59.6 57.5 49.0 60.9 61.3 63.1 63.8 68.5
Non-Indigenous 91.4 94.3 94.0 93.4 95.0 96.1 90.1 92.2 93.1 91.5 94.7 94.3 94.0 95.8 95.5
Very Remote
Indigenous 43.2 47.7 49.2 38.3 52.3 57.4 41.7 41.6 45.4 36.6 47.7 50.9 52.4 52.6 58.1
Non-Indigenous 89.2 92.6 96.0 91.1 93.2 97.9 85.0 89.5 93.7 90.1 92.5 96.1 94.0 93.7 95.6

72© Department of Education, Western Australia, 2017
Year 5: Comparisons by geolocation and Indigenous status 2014–2016Table 10.3: Achievement of Year 5 students in all subject areas by geolocation and Indigenous status 2014–2016
Geolocation
Reading Mean scale score
Writing Mean scale score
Spelling Mean scale score
Grammar and Punctuation Mean scale score
Numeracy Mean scale score
2014 2015 2016 2014 2015 2016 2014 2015 2016 2014 2015 2016 2014 2015 2016
Major Cities
Indigenous 419.6 424.2 414.1 398.1 410.5 412.1 438.0 441.7 429.5 413.4 420.5 420.3 417.4 428.1 422.6
Non-Indigenous 496.8 493.4 500.0 471.8 476.9 476.2 500.6 499.9 496.7 502.9 503.7 505.2 486.8 491.3 493.3
Inner Regional
Indigenous 412.2 411.9 419.2 385.3 393.0 412.9 421.6 424.4 429.9 404.1 403.0 420.6 407.2 419.1 420.9
Non-Indigenous 479.4 474.9 483.2 451.8 460.5 461.0 475.8 477.5 474.6 480.3 479.2 484.5 469.3 470.5 473.7
Outer Regional
Indigenous 392.2 405.3 395.7 369.8 396.1 400 414.6 426.3 413.9 383.6 399.5 404.7 394.1 416.6 408.8
Non-Indigenous 473.6 477.6 475.4 448.3 460.2 456.6 472.6 479.1 469.7 474.1 481.8 481.1 464.1 473.1 468.9
Remote
Indigenous 381.6 386.9 374.3 350.6 359.5 379.7 398.2 400.5 390.4 371.2 375.4 381.2 386.9 399.3 388.2
Non-Indigenous 485.4 478.7 482.7 454.1 459.7 461.3 476.8 474.3 472.3 483.7 481.5 488.1 471.3 475.8 473.5
Very Remote
Indigenous 351.5 355.4 325.8 316.2 318.0 325.9 373.3 369.3 352.5 342.5 344.0 340.9 361.9 371.9 358.2
Non-Indigenous 472.0 467.1 471.2 448.3 446.5 455.5 468.6 467.2 462.8 473.4 470.2 476.6 459.8 462.3 468.6
Table 10.4: Percentage of Year 5 students at or above national minimum standard in all subject areas by geolocation and Indigenous status 2014–2016
Geolocation
Reading Mean scale score
Writing Mean scale score
Spelling Mean scale score
Grammar and Punctuation Mean scale score
Numeracy Mean scale score
2014 2015 2016 2014 2015 2016 2014 2015 2016 2014 2015 2016 2014 2015 2016
Major Cities
Indigenous 72.8 76.3 68.3 67.6 70.8 74.0 76.5 80.2 73.8 67.3 72.4 71.0 73.0 82.3 76.2
Non-Indigenous 92.4 93.1 93.1 91.6 92.9 94.7 93.0 94.2 93.9 92.8 93.0 94.2 93.6 95.4 94.8
Inner Regional
Indigenous 65.9 67.4 70.5 64.4 62.7 75.3 70.6 71.9 75.7 63.6 62.7 71.9 68.1 76.4 75.3
Non-Indigenous 91.2 91.9 91.9 88.3 90.6 92.8 90.0 91.9 91.6 91.1 91.1 93.0 93.0 94.5 93.7
Outer Regional
Indigenous 57.5 66.0 60.7 52.1 66.0 69.7 67.4 73.9 70.2 54.0 62.3 66.3 59.5 75.6 71.3
Non-Indigenous 88.8 91.3 89.7 87.2 90.6 91.5 88.8 91.7 89.9 88.5 90.6 91.3 90.6 94.6 92.2
Remote
Indigenous 54.1 54.9 48.1 44.6 48.5 57.7 59.5 60.3 55.9 47.2 46.9 52.0 55.5 64.8 56.2
Non-Indigenous 91.1 92.2 91.9 88.6 90.7 93.5 89.8 91.9 91.8 90.7 91.4 93.8 92.9 95.6 93.8
Very Remote
Indigenous 35.9 41.7 25.7 31.1 30.5 34.2 47.2 44.8 37.8 34.1 32.7 32.7 39.2 48.7 39.3
Non-Indigenous 89.7 89.7 90.6 89.1 85.9 90.5 89.4 88.8 88.5 89.5 89.2 92.1 89.4 92.8 93.3
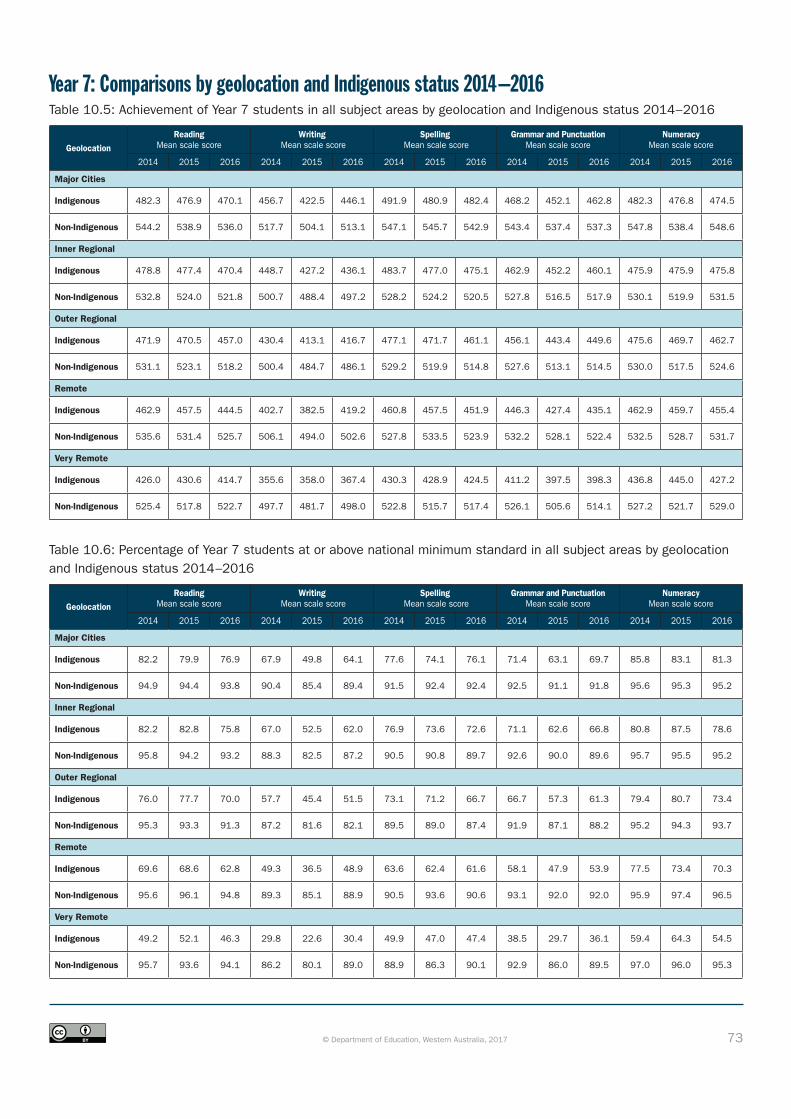
73© Department of Education, Western Australia, 2017
Year 7: Comparisons by geolocation and Indigenous status 2014–2016Table 10.5: Achievement of Year 7 students in all subject areas by geolocation and Indigenous status 2014–2016
Geolocation
Reading Mean scale score
Writing Mean scale score
Spelling Mean scale score
Grammar and Punctuation Mean scale score
Numeracy Mean scale score
2014 2015 2016 2014 2015 2016 2014 2015 2016 2014 2015 2016 2014 2015 2016
Major Cities
Indigenous 482.3 476.9 470.1 456.7 422.5 446.1 491.9 480.9 482.4 468.2 452.1 462.8 482.3 476.8 474.5
Non-Indigenous 544.2 538.9 536.0 517.7 504.1 513.1 547.1 545.7 542.9 543.4 537.4 537.3 547.8 538.4 548.6
Inner Regional
Indigenous 478.8 477.4 470.4 448.7 427.2 436.1 483.7 477.0 475.1 462.9 452.2 460.1 475.9 475.9 475.8
Non-Indigenous 532.8 524.0 521.8 500.7 488.4 497.2 528.2 524.2 520.5 527.8 516.5 517.9 530.1 519.9 531.5
Outer Regional
Indigenous 471.9 470.5 457.0 430.4 413.1 416.7 477.1 471.7 461.1 456.1 443.4 449.6 475.6 469.7 462.7
Non-Indigenous 531.1 523.1 518.2 500.4 484.7 486.1 529.2 519.9 514.8 527.6 513.1 514.5 530.0 517.5 524.6
Remote
Indigenous 462.9 457.5 444.5 402.7 382.5 419.2 460.8 457.5 451.9 446.3 427.4 435.1 462.9 459.7 455.4
Non-Indigenous 535.6 531.4 525.7 506.1 494.0 502.6 527.8 533.5 523.9 532.2 528.1 522.4 532.5 528.7 531.7
Very Remote
Indigenous 426.0 430.6 414.7 355.6 358.0 367.4 430.3 428.9 424.5 411.2 397.5 398.3 436.8 445.0 427.2
Non-Indigenous 525.4 517.8 522.7 497.7 481.7 498.0 522.8 515.7 517.4 526.1 505.6 514.1 527.2 521.7 529.0
Table 10.6: Percentage of Year 7 students at or above national minimum standard in all subject areas by geolocation and Indigenous status 2014–2016
Geolocation
Reading Mean scale score
Writing Mean scale score
Spelling Mean scale score
Grammar and Punctuation Mean scale score
Numeracy Mean scale score
2014 2015 2016 2014 2015 2016 2014 2015 2016 2014 2015 2016 2014 2015 2016
Major Cities
Indigenous 82.2 79.9 76.9 67.9 49.8 64.1 77.6 74.1 76.1 71.4 63.1 69.7 85.8 83.1 81.3
Non-Indigenous 94.9 94.4 93.8 90.4 85.4 89.4 91.5 92.4 92.4 92.5 91.1 91.8 95.6 95.3 95.2
Inner Regional
Indigenous 82.2 82.8 75.8 67.0 52.5 62.0 76.9 73.6 72.6 71.1 62.6 66.8 80.8 87.5 78.6
Non-Indigenous 95.8 94.2 93.2 88.3 82.5 87.2 90.5 90.8 89.7 92.6 90.0 89.6 95.7 95.5 95.2
Outer Regional
Indigenous 76.0 77.7 70.0 57.7 45.4 51.5 73.1 71.2 66.7 66.7 57.3 61.3 79.4 80.7 73.4
Non-Indigenous 95.3 93.3 91.3 87.2 81.6 82.1 89.5 89.0 87.4 91.9 87.1 88.2 95.2 94.3 93.7
Remote
Indigenous 69.6 68.6 62.8 49.3 36.5 48.9 63.6 62.4 61.6 58.1 47.9 53.9 77.5 73.4 70.3
Non-Indigenous 95.6 96.1 94.8 89.3 85.1 88.9 90.5 93.6 90.6 93.1 92.0 92.0 95.9 97.4 96.5
Very Remote
Indigenous 49.2 52.1 46.3 29.8 22.6 30.4 49.9 47.0 47.4 38.5 29.7 36.1 59.4 64.3 54.5
Non-Indigenous 95.7 93.6 94.1 86.2 80.1 89.0 88.9 86.3 90.1 92.9 86.0 89.5 97.0 96.0 95.3

74© Department of Education, Western Australia, 2017
Year 9: Comparisons by geolocation and Indigenous status 2014–2016Table 10.7: Achievement of Year 9 students in all subject areas by geolocation and Indigenous status 2014–2016
Geolocation
Reading Mean scale score
Writing Mean scale score
Spelling Mean scale score
Grammar and Punctuation Mean scale score
Numeracy Mean scale score
2014 2015 2016 2014 2015 2016 2014 2015 2016 2014 2015 2016 2014 2015 2016
Major cities
Indigenous 523.2 519.3 520.4 490.0 466.7 489.4 529.9 520.9 522.7 506.9 497.5 507.1 530.5 531.9 528.9
Non-Indigenous 582.8 582.7 582.4 561.5 551.2 555.7 584.9 587.4 586.0 574.6 572.6 572.6 590.5 595.5 595.2
Inner regional
Indigenous 527.2 524.8 521.7 490.7 474.7 479.2 530.2 522.7 516.9 509.0 501.1 506.9 533.6 535.9 529.5
Non-Indigenous 568.5 570.7 568.2 543.2 537.3 534.4 562.8 570.2 561.5 556.3 558.3 554.7 575.9 582.0 574.6
Outer regional
Indigenous 506.1 510.9 512.7 457.3 450.6 471.8 509.8 512.3 507.7 488.2 488.4 498.7 517.5 529.5 522.5
Non-Indigenous 566.1 564.0 569.8 535.7 522.3 535.7 560.3 561.2 563.2 553.9 549.6 556.7 571.9 572.9 575.7
Remote
Indigenous 492.7 488.7 502.6 440.0 416.5 447.8 497.2 485.9 496.0 477.6 464.2 486.0 505.8 512.3 508.4
Non-Indigenous 569.1 568.7 573.7 543.4 532.3 539.9 564.6 567.6 563.9 558.1 555.6 559.5 571.8 578.4 574.4
Very remote
Indigenous 458.5 465.3 473.7 395.8 368.6 401.7 458.2 461.1 476.6 444.4 439.3 464.8 477.2 496.5 498.3
Non-Indigenous 559.2 558.0 560.6 524.4 519.1 532.1 559.2 556.1 563.2 551.6 543.4 554.0 566.4 569.2 573.9
Table 10.8: Percentage of Year 9 students at or above national minimum standard in all subject areas by geolocation and Indigenous status 2014–2016
Geolocation
Reading Mean scale score
Writing Mean scale score
Spelling Mean scale score
Grammar and Punctuation Mean scale score
Numeracy Mean scale score
2014 2015 2016 2014 2015 2016 2014 2015 2016 2014 2015 2016 2014 2015 2016
Major cities
Indigenous 74.6 75.1 75.3 57.4 45.7 57.3 73.1 71.8 70.3 64.5 60.9 66.9 79.6 84.0 82.8
Non-Indigenous 92.8 92.6 93.9 85.2 81.8 85.4 89.7 90.1 90.6 90.1 89.3 91.2 94.7 95.9 95.9
Inner regional
Indigenous 78.4 76.4 77.6 58.7 48.2 55.9 75.9 72.0 68.3 68.6 60.5 68.1 86.0 89.7 85.7
Non-Indigenous 92.7 93.9 94.3 81.9 80.6 80.7 86.5 89.8 88.0 87.9 89.6 90.4 94.9 97.1 95.9
Outer regional
Indigenous 66.4 70.9 72.2 42.7 41.7 47.8 66.6 69.1 64.2 54.1 55.8 62.3 76.9 85.5 81.2
Non-Indigenous 90.8 91.8 93.6 78.2 74.5 79.2 86.3 86.0 87.5 86.5 86.1 89.8 93.2 96.4 96.0
Remote
Indigenous 57.8 55.2 64.6 41.5 29.2 39.0 60.3 51.3 58.7 48.8 39.3 53.5 69.9 75.7 72.0
Non-Indigenous 93.1 92.2 94.4 83.0 77.5 80.0 88.1 88.7 88.6 90.0 87.3 91.0 95.0 97.6 97.4
Very remote
Indigenous 38.3 40.0 48.2 21.9 18.2 25.9 40.1 39.6 48.9 30.7 25.9 45.8 51.2 62.9 62.7
Non-Indigenous 92.5 90.6 89.7 77.6 73.5 79.3 85.2 86.5 86.8 89.6 85.8 88.8 95.1 97.2 95.7

75© Department of Education, Western Australia, 2017
Year 3–5 Cohort gainsTable 10.9: Year 3 to 5 cohort gains
Reading Writing Spelling Grammar and Punctuation
Numeracy
WA public schools
Australia WA public schools
Australia WA public schools
Australia WA public schools
Australia WA public schools
Australia
Mean scale score Year 3 2014 All 399.0 418.3 392.4 402.2 398.9 411.8 406.4 426.0 387.9 401.8
Mean scale score Year 5 2016 All 485.4 501.5 464.5 475.6 482.9 492.9 490.4 504.9 480.1 493.1
2014 - 2016 All average gain 86.4 83.2 72.1 73.4 84.0 81.1 84.0 78.9 92.2 91.3
2013 - 2015 All average gain 81.6 79.4 64.0 62.5 92.3 87.3 79.3 74.9 96.2 95.6
2012 - 2014 All average gain 83.4 81.0 55.1 52.5 90.4 83.3 85.9 79.9 95.0 92.1
2011 - 2013 All average gain 95.5 86.6 62.7 62.0 90.9 88.3 86.2 79.4 88.2 87.7
2010 - 2012 All average gain 82.7 79.3 – – 104.1 95.7 78.8 74.1 90.9 93.3
2009 - 2011 All average gain 83.4 77.3 – – 85.0 79.3 85.9 79.4 96.1 93.9
2008 - 2010 All average gain 88.7 86.9 – – 95.6 87.6 101.6 96.5 92.7 91.9
Mean scale score Year 3 2014 Boys 393.1 413.2 379.0 389.0 389.6 403.7 396.0 416.3 390.2 405.2
Mean scale score Year 5 2016 Boys 477.8 494.6 452.0 463.5 475.4 485.6 479.9 495.1 483.5 497.4
2014 - 2016 Boys average gain 84.7 81.4 73.0 74.5 85.8 81.9 83.9 78.8 93.3 92.2
2013 - 2015 Boys average gain 83.1 82.0 64.8 63.6 96.1 91.1 81.0 75.7 98.4 97.8
2012 - 2014 Boys average gain 84.5 82.1 54.5 52.0 90.5 83.7 88.1 82.8 96.9 93.8
2011 - 2013 Boys average gain 98.9 91.0 61.1 60.5 90.3 88.6 88.7 83.1 89.6 89.6
2010 - 2012 Boys average gain 83.4 80.0 – – 106.0 96.9 79.8 75.3 92.1 94.3
2009 - 2011 Boys average gain 86.4 79.5 – – 88.0 82.3 88.0 80.1 98.6 95.9
2008 - 2010 Boys average gain 90.1 87.4 – – 96.1 87.7 101.5 95.9 94.7 93.8
Mean scale score Year 3 2014 Girls 405.1 423.5 406.4 415.9 408.5 420.2 417.3 436.2 385.5 398.4
Mean scale score Year 5 2016 Girls 493.3 508.7 477.8 488.3 490.8 500.6 501.6 515.1 476.4 488.6
2014 - 2016 Girls average gain 88.2 85.2 71.4 72.4 82.3 80.4 84.3 78.9 90.9 90.2
2013 - 2015 Girls average gain 79.8 76.8 63.2 61.3 88.2 83.3 77.5 74.0 94.0 93.4
2012 - 2014 Girls average gain 82.2 79.8 55.7 53.0 90.3 82.7 83.4 76.8 93.0 90.5
2011 - 2013 Girls average gain 92.1 82.1 64.6 63.5 91.5 88.0 83.7 75.7 86.7 85.7
2010 - 2012 Girls average gain 82.2 78.4 – – 102.2 94.6 77.9 73.0 89.7 92.2
2009 - 2011 Girls average gain 80.3 75.3 – – 81.7 76.2 83.4 78.5 93.4 91.7
2008 - 2010 Girls average gain 87.3 86.2 – – 94.9 87.6 101.9 97.2 90.4 89.9
Mean scale score Year 3 2014 Indigenous 302.9 332.9 303.1 327.9 314.6 338.1 295.5 331.3 310.6 331.5
Mean scale score Year 5 2016 Indigenous 390.4 422.1 390.5 412.4 407.8 428.8 398.2 427.8 403.8 426.0
2014 - 2016 Indigenous average gain 87.5 89.2 87.4 84.5 93.2 90.7 102.7 96.5 93.2 94.5
2013 - 2015 Indigenous average gain 79.6 81.4 63.0 65.5 96.7 94.9 76.9 77.1 93.2 95.7
2012 - 2014 Indigenous average gain 90.7 88.8 51.6 52.0 95.5 92.0 92.7 92.0 98.8 97.8
2011 - 2013 Indigenous average gain 110.0 107.8 54.9 56.7 100.5 100.0 105.7 99.0 81.0 83.0
2010 - 2012 Indigenous average gain 78.7 78.2 – – 111.9 107.3 78.1 80.9 81.9 88.7
2009 - 2011 Indigenous average gain 84.0 82.4 – – 96.4 92.8 90.2 87.1 97.2 100.6
2008 - 2010 Indigenous average gain 94.6 95.9 – – 107.1 103.8 103.9 103.9 83.5 89.3
Mean scale score Year 3 2014 LBOTE 400.5 414.1 399.7 409.0 424.9 433.5 418.4 431.6 393.7 402.6
Mean scale score Year 5 2016 LBOTE 487.3 498.0 471.9 482.8 502.0 508.9 496.6 507.3 490.1 500.7
2014 - 2016 LBOTE average gain 86.8 83.9 72.2 73.8 77.1 75.4 78.2 75.7 96.4 98.1
2013 - 2015 LBOTE average gain 79.9 79.1 62.8 62.1 88.7 84.1 84.8 80.9 100.4 100.0
2012 - 2014 LBOTE average gain 77.8 76.5 54.2 51.1 88.2 78.8 86.3 80.1 98.4 93.4
2011 - 2014 LBOTE average gain 92.1 85.8 62.8 61.5 93.0 89.7 84.9 80.5 92.8 92.7
2010 - 2012 LBOTE average gain 76.7 72.9 101.5 95.2 74.1 71.1 94.4 96.5
2009 - 2011 LBOTE average gain 78.3 69.9 84.3 74.1 89.4 80.6 101.3 98.8
2008 - 2010 LBOTE average gain 87.7 87.5 94.8 88.3 107.1 103.7 97.5 96.8
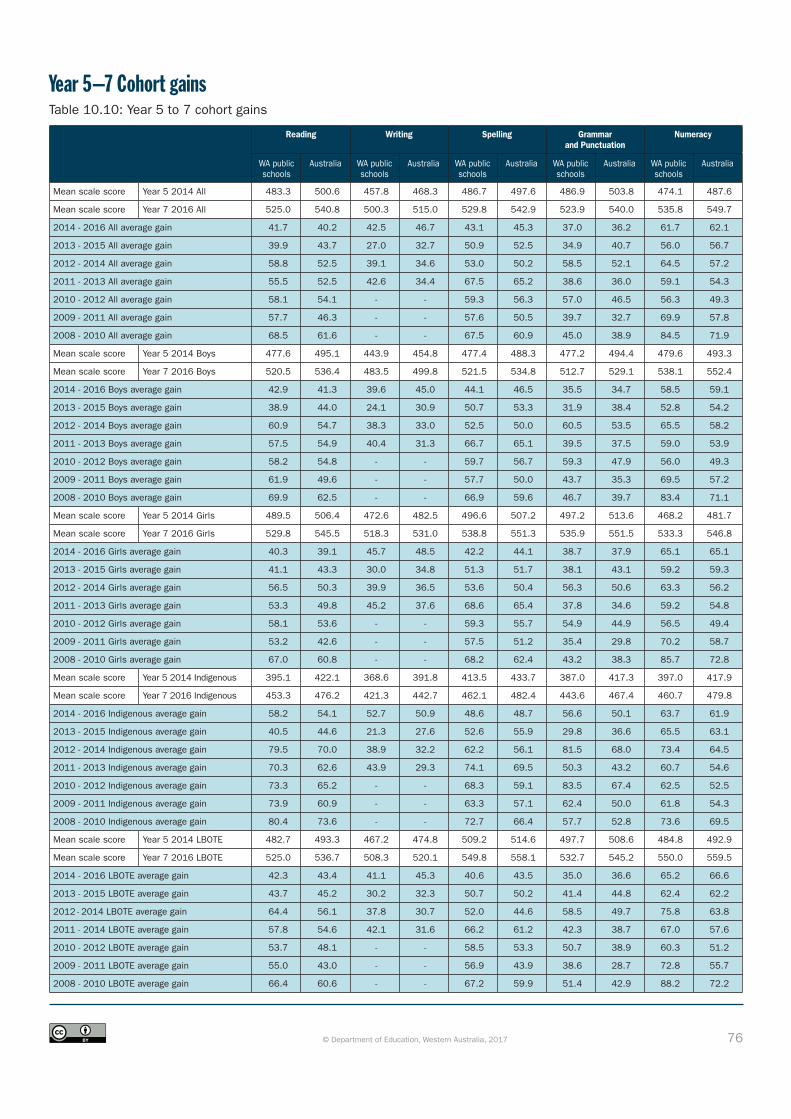
76© Department of Education, Western Australia, 2017
Year 5–7 Cohort gainsTable 10.10: Year 5 to 7 cohort gains
Reading Writing Spelling Grammar and Punctuation
Numeracy
WA public schools
Australia WA public schools
Australia WA public schools
Australia WA public schools
Australia WA public schools
Australia
Mean scale score Year 5 2014 All 483.3 500.6 457.8 468.3 486.7 497.6 486.9 503.8 474.1 487.6
Mean scale score Year 7 2016 All 525.0 540.8 500.3 515.0 529.8 542.9 523.9 540.0 535.8 549.7
2014 - 2016 All average gain 41.7 40.2 42.5 46.7 43.1 45.3 37.0 36.2 61.7 62.1
2013 - 2015 All average gain 39.9 43.7 27.0 32.7 50.9 52.5 34.9 40.7 56.0 56.7
2012 - 2014 All average gain 58.8 52.5 39.1 34.6 53.0 50.2 58.5 52.1 64.5 57.2
2011 - 2013 All average gain 55.5 52.5 42.6 34.4 67.5 65.2 38.6 36.0 59.1 54.3
2010 - 2012 All average gain 58.1 54.1 - - 59.3 56.3 57.0 46.5 56.3 49.3
2009 - 2011 All average gain 57.7 46.3 - - 57.6 50.5 39.7 32.7 69.9 57.8
2008 - 2010 All average gain 68.5 61.6 - - 67.5 60.9 45.0 38.9 84.5 71.9
Mean scale score Year 5 2014 Boys 477.6 495.1 443.9 454.8 477.4 488.3 477.2 494.4 479.6 493.3
Mean scale score Year 7 2016 Boys 520.5 536.4 483.5 499.8 521.5 534.8 512.7 529.1 538.1 552.4
2014 - 2016 Boys average gain 42.9 41.3 39.6 45.0 44.1 46.5 35.5 34.7 58.5 59.1
2013 - 2015 Boys average gain 38.9 44.0 24.1 30.9 50.7 53.3 31.9 38.4 52.8 54.2
2012 - 2014 Boys average gain 60.9 54.7 38.3 33.0 52.5 50.0 60.5 53.5 65.5 58.2
2011 - 2013 Boys average gain 57.5 54.9 40.4 31.3 66.7 65.1 39.5 37.5 59.0 53.9
2010 - 2012 Boys average gain 58.2 54.8 - - 59.7 56.7 59.3 47.9 56.0 49.3
2009 - 2011 Boys average gain 61.9 49.6 - - 57.7 50.0 43.7 35.3 69.5 57.2
2008 - 2010 Boys average gain 69.9 62.5 - - 66.9 59.6 46.7 39.7 83.4 71.1
Mean scale score Year 5 2014 Girls 489.5 506.4 472.6 482.5 496.6 507.2 497.2 513.6 468.2 481.7
Mean scale score Year 7 2016 Girls 529.8 545.5 518.3 531.0 538.8 551.3 535.9 551.5 533.3 546.8
2014 - 2016 Girls average gain 40.3 39.1 45.7 48.5 42.2 44.1 38.7 37.9 65.1 65.1
2013 - 2015 Girls average gain 41.1 43.3 30.0 34.8 51.3 51.7 38.1 43.1 59.2 59.3
2012 - 2014 Girls average gain 56.5 50.3 39.9 36.5 53.6 50.4 56.3 50.6 63.3 56.2
2011 - 2013 Girls average gain 53.3 49.8 45.2 37.6 68.6 65.4 37.8 34.6 59.2 54.8
2010 - 2012 Girls average gain 58.1 53.6 - - 59.3 55.7 54.9 44.9 56.5 49.4
2009 - 2011 Girls average gain 53.2 42.6 - - 57.5 51.2 35.4 29.8 70.2 58.7
2008 - 2010 Girls average gain 67.0 60.8 - - 68.2 62.4 43.2 38.3 85.7 72.8
Mean scale score Year 5 2014 Indigenous 395.1 422.1 368.6 391.8 413.5 433.7 387.0 417.3 397.0 417.9
Mean scale score Year 7 2016 Indigenous 453.3 476.2 421.3 442.7 462.1 482.4 443.6 467.4 460.7 479.8
2014 - 2016 Indigenous average gain 58.2 54.1 52.7 50.9 48.6 48.7 56.6 50.1 63.7 61.9
2013 - 2015 Indigenous average gain 40.5 44.6 21.3 27.6 52.6 55.9 29.8 36.6 65.5 63.1
2012 - 2014 Indigenous average gain 79.5 70.0 38.9 32.2 62.2 56.1 81.5 68.0 73.4 64.5
2011 - 2013 Indigenous average gain 70.3 62.6 43.9 29.3 74.1 69.5 50.3 43.2 60.7 54.6
2010 - 2012 Indigenous average gain 73.3 65.2 - - 68.3 59.1 83.5 67.4 62.5 52.5
2009 - 2011 Indigenous average gain 73.9 60.9 - - 63.3 57.1 62.4 50.0 61.8 54.3
2008 - 2010 Indigenous average gain 80.4 73.6 - - 72.7 66.4 57.7 52.8 73.6 69.5
Mean scale score Year 5 2014 LBOTE 482.7 493.3 467.2 474.8 509.2 514.6 497.7 508.6 484.8 492.9
Mean scale score Year 7 2016 LBOTE 525.0 536.7 508.3 520.1 549.8 558.1 532.7 545.2 550.0 559.5
2014 - 2016 LBOTE average gain 42.3 43.4 41.1 45.3 40.6 43.5 35.0 36.6 65.2 66.6
2013 - 2015 LBOTE average gain 43.7 45.2 30.2 32.3 50.7 50.2 41.4 44.8 62.4 62.2
2012 - 2014 LBOTE average gain 64.4 56.1 37.8 30.7 52.0 44.6 58.5 49.7 75.8 63.8
2011 - 2014 LBOTE average gain 57.8 54.6 42.1 31.6 66.2 61.2 42.3 38.7 67.0 57.6
2010 - 2012 LBOTE average gain 53.7 48.1 - - 58.5 53.3 50.7 38.9 60.3 51.2
2009 - 2011 LBOTE average gain 55.0 43.0 - - 56.9 43.9 38.6 28.7 72.8 55.7
2008 - 2010 LBOTE average gain 66.4 60.6 - - 67.2 59.9 51.4 42.9 88.2 72.2
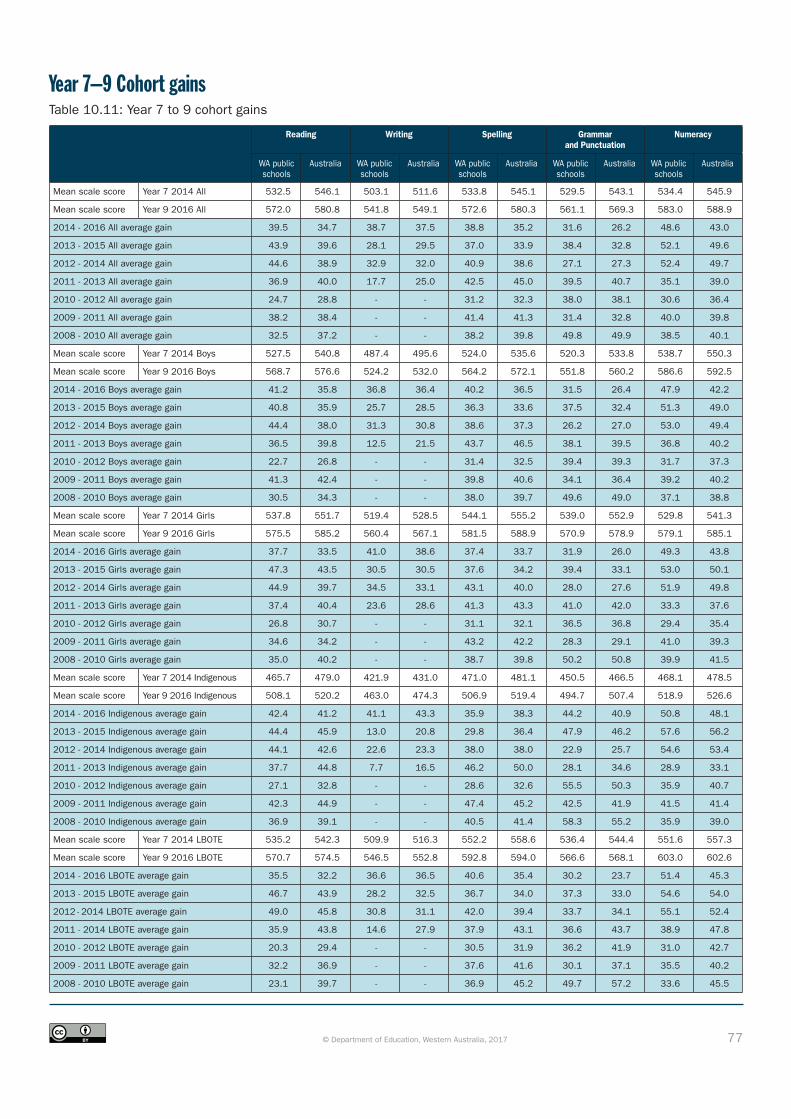
77© Department of Education, Western Australia, 2017
Year 7–9 Cohort gainsTable 10.11: Year 7 to 9 cohort gains
Reading Writing Spelling Grammar and Punctuation
Numeracy
WA public schools
Australia WA public schools
Australia WA public schools
Australia WA public schools
Australia WA public schools
Australia
Mean scale score Year 7 2014 All 532.5 546.1 503.1 511.6 533.8 545.1 529.5 543.1 534.4 545.9
Mean scale score Year 9 2016 All 572.0 580.8 541.8 549.1 572.6 580.3 561.1 569.3 583.0 588.9
2014 - 2016 All average gain 39.5 34.7 38.7 37.5 38.8 35.2 31.6 26.2 48.6 43.0
2013 - 2015 All average gain 43.9 39.6 28.1 29.5 37.0 33.9 38.4 32.8 52.1 49.6
2012 - 2014 All average gain 44.6 38.9 32.9 32.0 40.9 38.6 27.1 27.3 52.4 49.7
2011 - 2013 All average gain 36.9 40.0 17.7 25.0 42.5 45.0 39.5 40.7 35.1 39.0
2010 - 2012 All average gain 24.7 28.8 - - 31.2 32.3 38.0 38.1 30.6 36.4
2009 - 2011 All average gain 38.2 38.4 - - 41.4 41.3 31.4 32.8 40.0 39.8
2008 - 2010 All average gain 32.5 37.2 - - 38.2 39.8 49.8 49.9 38.5 40.1
Mean scale score Year 7 2014 Boys 527.5 540.8 487.4 495.6 524.0 535.6 520.3 533.8 538.7 550.3
Mean scale score Year 9 2016 Boys 568.7 576.6 524.2 532.0 564.2 572.1 551.8 560.2 586.6 592.5
2014 - 2016 Boys average gain 41.2 35.8 36.8 36.4 40.2 36.5 31.5 26.4 47.9 42.2
2013 - 2015 Boys average gain 40.8 35.9 25.7 28.5 36.3 33.6 37.5 32.4 51.3 49.0
2012 - 2014 Boys average gain 44.4 38.0 31.3 30.8 38.6 37.3 26.2 27.0 53.0 49.4
2011 - 2013 Boys average gain 36.5 39.8 12.5 21.5 43.7 46.5 38.1 39.5 36.8 40.2
2010 - 2012 Boys average gain 22.7 26.8 - - 31.4 32.5 39.4 39.3 31.7 37.3
2009 - 2011 Boys average gain 41.3 42.4 - - 39.8 40.6 34.1 36.4 39.2 40.2
2008 - 2010 Boys average gain 30.5 34.3 - - 38.0 39.7 49.6 49.0 37.1 38.8
Mean scale score Year 7 2014 Girls 537.8 551.7 519.4 528.5 544.1 555.2 539.0 552.9 529.8 541.3
Mean scale score Year 9 2016 Girls 575.5 585.2 560.4 567.1 581.5 588.9 570.9 578.9 579.1 585.1
2014 - 2016 Girls average gain 37.7 33.5 41.0 38.6 37.4 33.7 31.9 26.0 49.3 43.8
2013 - 2015 Girls average gain 47.3 43.5 30.5 30.5 37.6 34.2 39.4 33.1 53.0 50.1
2012 - 2014 Girls average gain 44.9 39.7 34.5 33.1 43.1 40.0 28.0 27.6 51.9 49.8
2011 - 2013 Girls average gain 37.4 40.4 23.6 28.6 41.3 43.3 41.0 42.0 33.3 37.6
2010 - 2012 Girls average gain 26.8 30.7 - - 31.1 32.1 36.5 36.8 29.4 35.4
2009 - 2011 Girls average gain 34.6 34.2 - - 43.2 42.2 28.3 29.1 41.0 39.3
2008 - 2010 Girls average gain 35.0 40.2 - - 38.7 39.8 50.2 50.8 39.9 41.5
Mean scale score Year 7 2014 Indigenous 465.7 479.0 421.9 431.0 471.0 481.1 450.5 466.5 468.1 478.5
Mean scale score Year 9 2016 Indigenous 508.1 520.2 463.0 474.3 506.9 519.4 494.7 507.4 518.9 526.6
2014 - 2016 Indigenous average gain 42.4 41.2 41.1 43.3 35.9 38.3 44.2 40.9 50.8 48.1
2013 - 2015 Indigenous average gain 44.4 45.9 13.0 20.8 29.8 36.4 47.9 46.2 57.6 56.2
2012 - 2014 Indigenous average gain 44.1 42.6 22.6 23.3 38.0 38.0 22.9 25.7 54.6 53.4
2011 - 2013 Indigenous average gain 37.7 44.8 7.7 16.5 46.2 50.0 28.1 34.6 28.9 33.1
2010 - 2012 Indigenous average gain 27.1 32.8 - - 28.6 32.6 55.5 50.3 35.9 40.7
2009 - 2011 Indigenous average gain 42.3 44.9 - - 47.4 45.2 42.5 41.9 41.5 41.4
2008 - 2010 Indigenous average gain 36.9 39.1 - - 40.5 41.4 58.3 55.2 35.9 39.0
Mean scale score Year 7 2014 LBOTE 535.2 542.3 509.9 516.3 552.2 558.6 536.4 544.4 551.6 557.3
Mean scale score Year 9 2016 LBOTE 570.7 574.5 546.5 552.8 592.8 594.0 566.6 568.1 603.0 602.6
2014 - 2016 LBOTE average gain 35.5 32.2 36.6 36.5 40.6 35.4 30.2 23.7 51.4 45.3
2013 - 2015 LBOTE average gain 46.7 43.9 28.2 32.5 36.7 34.0 37.3 33.0 54.6 54.0
2012 - 2014 LBOTE average gain 49.0 45.8 30.8 31.1 42.0 39.4 33.7 34.1 55.1 52.4
2011 - 2014 LBOTE average gain 35.9 43.8 14.6 27.9 37.9 43.1 36.6 43.7 38.9 47.8
2010 - 2012 LBOTE average gain 20.3 29.4 - - 30.5 31.9 36.2 41.9 31.0 42.7
2009 - 2011 LBOTE average gain 32.2 36.9 - - 37.6 41.6 30.1 37.1 35.5 40.2
2008 - 2010 LBOTE average gain 23.1 39.7 - - 36.9 45.2 49.7 57.2 33.6 45.5