PERFORMANCE OF PENDULUM ABSORBER FOR A NON-LINEAR SYSTEM OF VARYING ORIENTATION
21
Journal of Sound and < ibration (2000) 229(4), 913 } 933 doi:10.1006/jsvi.1999.2521, available online at http://www.idealibrary.com on PERFORMANCE OF PENDULUM ABSORBER FOR A NON- LINEAR SYSTEM OF VARYING ORIENTATION A. ERTAS, O. CUVALCI AND S. EKWARO-OSIRE Department of Mechanical Engineering, ¹ exas ¹ ech ;niversity, ¸ubbock, ¹X 79409, ;.S.A. (Received 11 January 1999, and in ,nal form 22 July 1999) Pendulum-type vibration absorbers are used extensively in engineering. These devices are particularly useful in practical applications where oscillations of a structure are to be constrained within a prescribed envelope. In this study, the primary structure under investigation consists of a #exible beam with a tip mass. The primary structure has a single degree of freedom and is subjected to vertical sinusoidal excitation at its base. Non-linearity in the primary structure is due to large de#ections. The rotation point of the pendulum-type absorber is connected to the primary structure's tip mass. Together, the primary structure and absorber constitute a coupled system with two degrees of freedom. The motivation for study was the need to understand the e!ectiveness of passive vibration absorbers on structures that change their orientation, e.g., satellites. The primary objective is to assess the e!ectiveness of pendulum-type passive vibration absorber attached to a primary structure whose orientation varies. The orientations are at "ve degree increments about a vertical plane. In this study the orientation at which the absorber is e!ective is established and the factors that a!ect performance of the absorber are highlighted. ( 2000 Academic Press 1. INTRODUCTION Large #exible structures and aerospace structures can be studied by building a model consisting of #exible beams or columns with appendages. Since the oscillations of such structures are of large amplitude, this often can cause structural failure. In order to protect these structures from failure, suitable absorber devices are often installed to control or limit the amplitude of oscillation. Vibration absorbers have found extensive use in engineering. The recent activities in the area of design, development, and application of tuned vibration absorbers was provided by Sun et al. [1]. Korenev and Reznikov [2] o!ered an excellent collection of examples and consequent practical industrial application of such devices. The underlying physical phenomenon of vibration attenuation involves energy transfer from a primary structure to a vibration absorber. This phenomenon can easily be demonstrated for quadratically non-linear systems that have autoparametric resonance [3]. For such systems, energy transfer may occur when the lower mode frequency is equal to one-half of the higher mode response may exponentially increase while the higher mode response may decrease due to the 0022-460X/00/040913#21 $35.00/0 ( 2000 Academic Press
-
Upload
independent -
Category
Documents
-
view
3 -
download
0
Transcript of PERFORMANCE OF PENDULUM ABSORBER FOR A NON-LINEAR SYSTEM OF VARYING ORIENTATION

Journal of Sound and <ibration (2000) 229(4), 913}933doi:10.1006/jsvi.1999.2521, available online at http://www.idealibrary.com on
PERFORMANCE OF PENDULUM ABSORBER FOR A NON-LINEAR SYSTEM OF VARYING ORIENTATION
A. ERTAS, O. CUVALCI AND S. EKWARO-OSIRE
Department of Mechanical Engineering, ¹exas ¹ech ;niversity, ¸ubbock, ¹X 79409, ;.S.A.
(Received 11 January 1999, and in ,nal form 22 July 1999)
Pendulum-type vibration absorbers are used extensively in engineering. Thesedevices are particularly useful in practical applications where oscillations ofa structure are to be constrained within a prescribed envelope. In this study, theprimary structure under investigation consists of a #exible beam with a tip mass.The primary structure has a single degree of freedom and is subjected to verticalsinusoidal excitation at its base. Non-linearity in the primary structure is due tolarge de#ections. The rotation point of the pendulum-type absorber is connected tothe primary structure's tip mass. Together, the primary structure and absorberconstitute a coupled system with two degrees of freedom. The motivation for studywas the need to understand the e!ectiveness of passive vibration absorbers onstructures that change their orientation, e.g., satellites. The primary objective is toassess the e!ectiveness of pendulum-type passive vibration absorber attached toa primary structure whose orientation varies. The orientations are at "ve degreeincrements about a vertical plane. In this study the orientation at which theabsorber is e!ective is established and the factors that a!ect performance of theabsorber are highlighted.
( 2000 Academic Press
1. INTRODUCTION
Large #exible structures and aerospace structures can be studied by buildinga model consisting of #exible beams or columns with appendages. Since theoscillations of such structures are of large amplitude, this often can cause structuralfailure. In order to protect these structures from failure, suitable absorber devicesare often installed to control or limit the amplitude of oscillation. Vibrationabsorbers have found extensive use in engineering. The recent activities in the areaof design, development, and application of tuned vibration absorbers was providedby Sun et al. [1]. Korenev and Reznikov [2] o!ered an excellent collection ofexamples and consequent practical industrial application of such devices.
The underlying physical phenomenon of vibration attenuation involves energytransfer from a primary structure to a vibration absorber. This phenomenon caneasily be demonstrated for quadratically non-linear systems that haveautoparametric resonance [3]. For such systems, energy transfer may occur whenthe lower mode frequency is equal to one-half of the higher mode response mayexponentially increase while the higher mode response may decrease due to the
0022-460X/00/040913#21 $35.00/0 ( 2000 Academic Press

914 A. ERTAS E¹ A¸.
energy transfer between the modes. Nayfeh and Mook [4] performed an extensivestudy on the energy transfer from low- to high-frequency modes. They showed thein#uence of internal resonance on this energy transfer. They also alluded toa situation were exciting a high-frequency mode resulted into large-amplitudeoscillation in a low-frequency mode due to autoparametric resonance.Autoparametric resonance is one of the interesting research topics in vibration andhas been studied extensively in literature [5}7]. Currently, in engineering, the mostwidely used passive absorbers include: tuned mass absorbers, impact absorbers,pendulum-type absorbers, beam absorbers, and last but not least, liquid absorbers.The response characteristics and e!ectiveness of which is well documented.
In most industrial application, vibration absorbers interact with non-linearstructures. For this matter, the majority of analysis of vibration absorbers involvesan excursion in non-linear dynamics. Assuming no damping, Arnold [8]investigated the steady state response of a primary structure with a non-lineardynamic vibration absorber. Using the Ritz averaging method, the author was ableto approximately quantify the dynamics of the primary structure and non-linearabsorber. Considering damping, Shaw et al. [9] carried out an extensive study onthe behavior of a weakly non-linear vibration absorber. These researchers clearlydemonstrated the occurrence of a combination resonance that was detrimental tothe e!ectiveness of the absorber. An experimental and theoretical study ofa pendulum absorber of a non-linear structure was conducted by Cuvalci and Ertas[10]. Tondl [11] demonstrated the e!ectiveness of an &&inverted'' pendulum-typeabsorber compared to the &&traditional'' pendulum absorber. It was clearly shownthat the location of the oscillation point vis-a-vis the center of gravity did impactthe e!ectiveness of the absorber.
2. DELAYED CO-ORDINATES
In the non-linear dynamics of systems, a two-dimensional phase space often usedis the Torus. The most important long-term behavior derived behavior derivedform a torus is quasiperiodicity. A concise experimental and theoretical overviewon quasiperiodicity was presented by Glazier and Libchaber [12]. The theoryproposed by the authors is e!ective only in the neighborhood of the transition tochaos. Mustafa and Ertas [13] presented experimental evidence of quasiperiodicityin a column-pendulum oscillator. Further, the same authors studied the detaileddynamics and bifurcation of a coupled oscillator [14].
The observation of the experimental model is the most challenging aspect inexperimental dynamics. Experimental models generally have high-dimensionalphase spaces, and the dimensions of the experimental model are far greater than thenumber of variables that can be measured. In this study, the mechanical systeminvestigated was actually four dimensional. However, it was only possible tomeasure two displacement variables at a particular point to determine the actualdynamics of the system. The two variables measured, in this study, were thetranslational displacement of the primary structure and the angular displacementof the absorber. For a detailed analysis of the two experimentally extracted time

PENDULUM ABSORBER 915
series, in terms of dynamical systems theory, state-space reconstruction had to becarried out. The method used in this study was based on Casdagli et al. [15] and itis brie#y outlined below.
Consider a dynamical system whose response is governed by
xR "g(t, x) (1)
and let its experimental reconstruction be sought. A quantity that is typically usedfor the values of state-space co-ordinate is the time series, Mx(t
i)N, i"1, 2,2, N and
is obtained by sampling a co-ordinate of equation (1). Let g : R]MPM, withdim(M)"d. The time series x(t) is ¸-dimensional, ¸(d and ¸ is implicitlyassumed one. Assuming that h is a measurement function h : MPRL/1, thena scalar time series can be formulated as
f (t)"h(x (t)). (2)
From the onset, the functions g and h are unknown. This state space is useful forqualitative analysis, such as phase portraits. For any measurable quantity witha well-selected time delay, vectors of the form of equation (2) can be constructed.Assuming a delay reconstruction map, which maps the states of a d-dimensionaldynamical system into m-dimensional delay vectors
U (x)"Mh (x), h (/1(x)),2, h (/
2n(x))N, (3)
where /tis the #ow generated by the vector "eld g. Takens [16] showed that U is an
embedding, where an embedding was de"ned as a smooth one-to-onetransformation with a smooth inverse. Since U is an embedding, then there isa smooth dynamic G on the space of reconstructed vectors, i.e.,
G(U(x))"U(g(x)), (4)
where G is equivalent to the original dynamics g. The function G can be used forany purpose in the original dynamics. In reconstruction dynamics, the choice of thedelay time q is paramount. Ideally, the delay time is selected such that its value isneither too large nor too small. Mustafa and Ertas [13] provide a detaileddiscussion on the implications of the choice of a delay time.
As previously discussed, in this study only two quantities could be acquired fromthe experimental model, namely, the primary structure displacement r
1(t) and the
absorber angular displacement r2(t). The other two quantities sought, r
1(t!q) and
r2(t!q), were obtained using delay co-ordinate embedding. However, if any
system was N*4-dimensional, then according to Newhouse et al. [17], N couldextend down to the case N"3. If the system motion was assumed as quasiperiodic,one could seek the characteristics typical of a 3-torus. Based on the proceduresoutlined by Battelino et al. [18] and Mustafa and Ertas [13], a PoincareH sectioncan be de"ned with two angles u
1and u
2, such that
u1(i)"arctan
r1(t~q)(i)r (i)
, u2(i)"arctan
r2(t~q)(i)r (i)
. (5)
1(t) 2(t)
916 A. ERTAS E¹ A¸.
The PoincareH map, which is a 2-torus, can be de"ned by using the above anglede"nition such as
u1(i#1)"g
1(u
1(i), u
2(i)), u
2(i#1)"g
2(u
1(i), u
2(i)), (6)
where g1
and g2
are experimentally extracted maps. One of the two angles abovecan be taken to be a constant thus reducing the dimension by one:
u1(i#1)"g
1(u
1(i), u
2#), u
2(i#1)"g
2(u
1c, u
2(i)), (7)
where u1#
and u2#
are constant angles on the attractor. If the distribution of thepoints that lie on the one-dimensional attractor is smooth, the circle map isa one-to-one invertible map and any two locations from each equations (7) aretopologically conjugate to a circle.
Based on the theoretical background provided in the previous sections, Mustafaand Ertas [14] used the afore outlined delay-co-ordinate embedding technique toinvestigate a #exible column with an appendage consisting of a mass-pendulumattached to its tip. And also Cuvalci and Ertas [10] studied the beam-tip mass-pendulum model as a vibration absorber device. The model was subjected to directand parametric excitation. The dynamics of the primary structure was observed asa strong periodic motion because direct excitation was dominant on the system.The column-tip mass-pendulum model shows more complex behavior than thebeam-tip mass-pendulum model because it was only subjected to parametricexcitation. However, the experimental response curves show that the pendulum can
Figure 1. Mechanical model: (a) primary structure; (b) pendulum absorber.

Figure 2. Experimental setup: (a) shaker table; (b) ampli"er; (c) vibration control system;(d) acquisition and analysis; (c) accelerometer; (f ) angle transducer; (g) displacement transducer;(h) mechanical model.
PENDULUM ABSORBER 917
be used as a passive vibration absorber device for #exible structures. If sucha system is rotated about a vertical xy-plane, does the absorber device still absorbenergy from the primary structure? In this study, an attempt is made to answer thequestion. The motivation in answering the posed question results from the need ofaddressing the performance of passive absorbers attached to primary structureswhose orientation changes, e.g., satellites. The objective of this study was to assessthe e!ectiveness of a pendulum-type passive vibration absorber attached toa primary structure whose orientation varies. The orientation at which theabsorber is e!ective was established and the factors that a!ect performance of theabsorber were highlighted.
3. EXPERIMENTS
3.1. SETUP
The primary structure consisted of a slender beam (also referred to as &&column''in upright position and as &&beam'' in horizontal position) of about 336 mm long

Figure 3. Response plots for the vertical orientation with A"300 mV and 3)90 Hz(fo(4)65 Hz:
(a) primary structure; (b) absorber.
918 A. ERTAS E¹ A¸.
with a tip mass housing an encoder. The tip mass weighed about 212 g. Thedamping coe$cient of the primary structure was determined to be about0)07 kg s/m. The passive vibration absorber was of the pendulum-type consisting ofa light composite rod with a mass at one end. The absorber is mounted on theprimary structure to form the mechanical system shown in Figure 1. The primarystructure is under sinusoidal excitation and undergoes large de#ections. Theequation of motion of such a coupled system is of the form
rR1"f
1(r1, rR
1, r
2, rR
2)#non-linear terms,
rR2"f
2(r1, rR
1, r
2, rR
2)#non-linear terms, (8)
where the non-linear terms are due to large de#ections of the primary structure andthe coupling between the primary structure and absorber.
The experimental set-up used in this study is shown in Figure 2. The setupconsists of a shaker table (MB Dynamics C10E), ampli"er (MB Dynamics S6K),vibration control system, acquisition and analysis, and transducers. In the lattersetup, the vibration control was made up of sweep generator (Trig-Tek 701 LM),signal compressor (Trig-Tek 801 B), vibration monitor (Trig-Tek 610 B), and
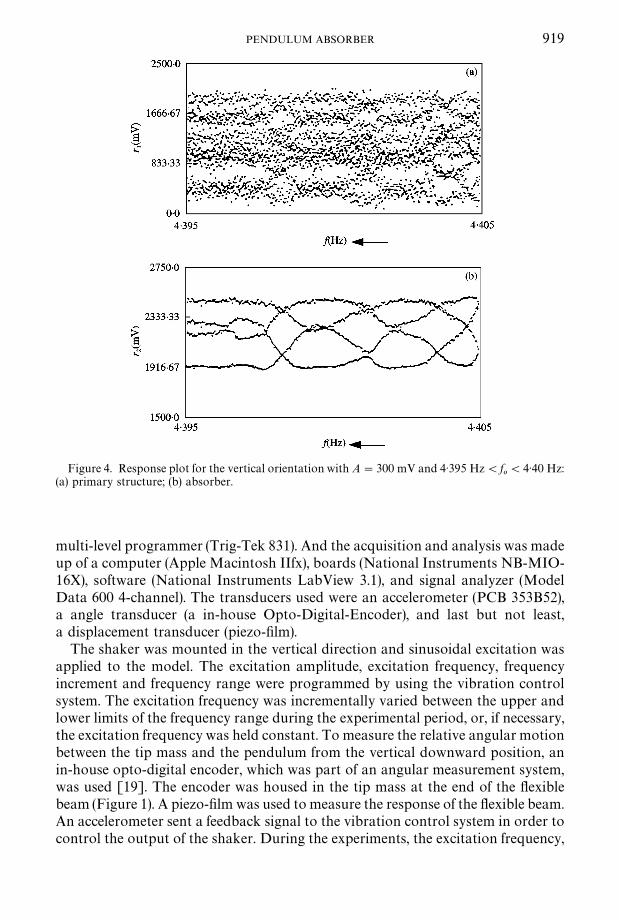
Figure 4. Response plot for the vertical orientation with A"300 mV and 4)395 Hz(fo(4)40 Hz:
(a) primary structure; (b) absorber.
PENDULUM ABSORBER 919
multi-level programmer (Trig-Tek 831). And the acquisition and analysis was madeup of a computer (Apple Macintosh IIfx), boards (National Instruments NB-MIO-16X), software (National Instruments LabView 3.1), and signal analyzer (ModelData 600 4-channel). The transducers used were an accelerometer (PCB 353B52),a angle transducer (a in-house Opto-Digital-Encoder), and last but not least,a displacement transducer (piezo-"lm).
The shaker was mounted in the vertical direction and sinusoidal excitation wasapplied to the model. The excitation amplitude, excitation frequency, frequencyincrement and frequency range were programmed by using the vibration controlsystem. The excitation frequency was incrementally varied between the upper andlower limits of the frequency range during the experimental period, or, if necessary,the excitation frequency was held constant. To measure the relative angular motionbetween the tip mass and the pendulum from the vertical downward position, anin-house opto-digital encoder, which was part of an angular measurement system,was used [19]. The encoder was housed in the tip mass at the end of the #exiblebeam (Figure 1). A piezo-"lm was used to measure the response of the #exible beam.An accelerometer sent a feedback signal to the vibration control system in order tocontrol the output of the shaker. During the experiments, the excitation frequency,

Figure 5. Response characteristics for the vertical orientation with A"300 mV and fo"4)40 Hz.
Delay co-ordinates: (a) primary structures; (c) absorber; (b) projection on r1}r
2plane. Time history:
(d) primary structure; (e) absorber. FFT: (f ) primary structure; (g) absorber.
920 A. ERTAS E¹ A¸.
natural frequencies, excitation signal, and the Fast Fourier Transforms (FFT) of theresponse were observed through the signal analyzer. The Macintosh IIfx computerwas used to store data from two channels, one was the piezo-"lm transducer toinvestigate the dynamics of the beam, and the other was the opto-digital-encoder toinvestigate the dynamics of the absorber. Additionally, the data analysis was doneusing the software LabView.
3.2. DATA ANALYSIS
To observe the dynamics of the experimental system, four categories of plotswere extracted from experimental data. These included: frequency response curves,time histories, phase planes, FFT; cover of the 2-Torus, speci"ed section on it, "rstreturn-map of speci"ed section; and last but not least vibration absorption studies.
The "rst category of plots was frequency response curves. These plots includedata obtained by sweeping between two frequencies. The latter sweep directionsestablished after a series of experiments showed that indeed these directions didprovide interesting responses of the system. The excitation amplitude was heldconstant during the sweep with the smallest sweep rate (0)1 oct/min), which was

Figure 6. (5.11)-Periodic motion on ¹2 for the vertical orientation with A"mV and fo"4)40 Hz:
(a) cover of ¹2; (b) slice of ¹2; (c) "rst return map.
PENDULUM ABSORBER 921
available from the vibration control system. The sweep rate was assumed smallenough to reach the system steady state within each increment of forcing frequency.During the frequency sweep, special attention was paid to the nature of oscillationsof the absorber. At the start of the down sweep the absorber showed no oscillation("rst steady state). As soon as the absorber showed the "rst sudden increase inoscillations ("rst jump phenomenon), the sweep was halted at a constant forcingfrequency for about 3 min. When oscillations of the absorber were deemed constant(second steady state), the frequency down sweep was once again initiated. As thedown sweep progressed, when the absorber showed signs of losing its steady stateoscillation (second jump phenomenon) the sweep was again halted for about 3 min.At the constant forcing frequency, when the absorber oscillations were againdeemed constant (third steady state), the down sweep was again re-initiated andcontinued till the end of the experiment run. In all, during the down sweep, theresponse of the absorber depicted two jump phenomena which will clearly beshown in the response plots discussed in the next section of the paper. For theexperiments where an up sweep was used, the previously outlined procedure was

Figure 7. Quasiperiodic motion on ¹2 for the vertical orientation with A"300 mV andfo"4)37 Hz: (a) cover of ¹2; (b) slice of ¹2; (c) "rst return map.
922 A. ERTAS E¹ A¸.
also followed. Experimental response curves were obtained by plotting localmaximums of experimental data acquired during down sweep and up sweep.
The second category of plots includes time histories (r1(n)
versus t and r2(n)
versust), phase planes (r
1(n~r)versus r
1(n), r
2(n~q) versus r2(n)
, and e2(n)
versus r1(n)
) andFFT. These plots were produced from time series that were recorded at constantforcing frequency and forcing amplitude by choosing a suitable delay time q.
To further have an insight in the dynamics of the system, a third category ofplots, pertaining to the torus, was justi"ed. A torus is simply another two-dimensional phase space. This category of plots are based on equations (5)}(7). Theplots show the cover of the 2-torus (u
2versus u
1), speci"ed section on it (r
1(n~q)versus r
1(n)), and the "rst return map (u
1(i#1) versus u
1(i)) of the speci"ed section.
If the response is periodic, there is a "nite number of patterns on the cover of the2-torus. We can say that the response is (n, m)-periodic, where n is the numberto intersect u
1-axis and m is the number to intersect u
2-axis. A slice of the cover of
a 2-torus can be taken parallel to the u1- or u
2-axis. If the slice is taken parallel
to the u -axis, then the slice shows n discrete clusters of points. If it is taken
1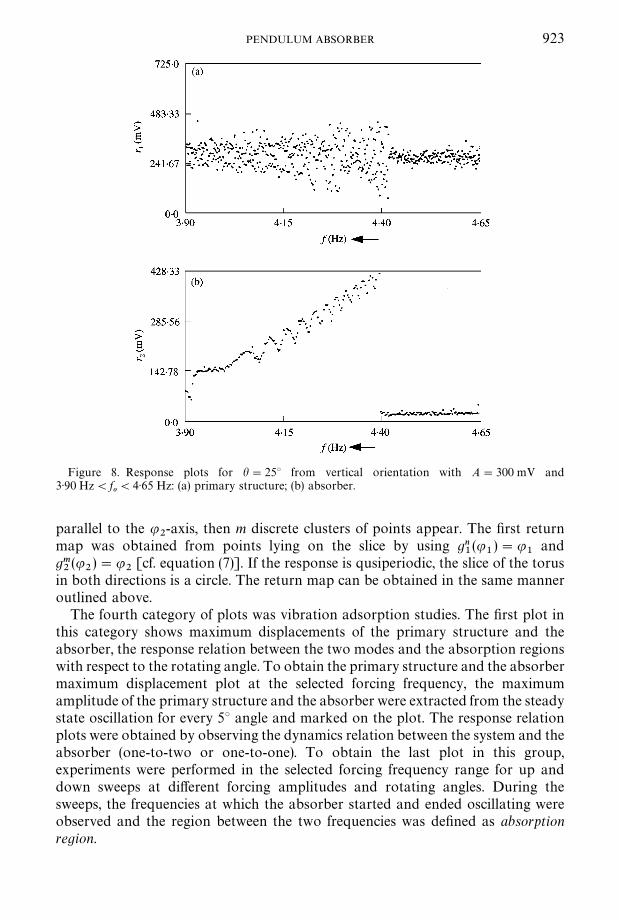
Figure 8. Response plots for h"253 from vertical orientation with A"300 mV and3)90 Hz(f
o(4)65 Hz: (a) primary structure; (b) absorber.
PENDULUM ABSORBER 923
parallel to the u2-axis, then m discrete clusters of points appear. The "rst return
map was obtained from points lying on the slice by using gn1(u
1)"u
1and
gm2(u
2)"u
2[cf. equation (7)]. If the response is qusiperiodic, the slice of the torus
in both directions is a circle. The return map can be obtained in the same manneroutlined above.
The fourth category of plots was vibration adsorption studies. The "rst plot inthis category shows maximum displacements of the primary structure and theabsorber, the response relation between the two modes and the absorption regionswith respect to the rotating angle. To obtain the primary structure and the absorbermaximum displacement plot at the selected forcing frequency, the maximumamplitude of the primary structure and the absorber were extracted from the steadystate oscillation for every 53 angle and marked on the plot. The response relationplots were obtained by observing the dynamics relation between the system and theabsorber (one-to-two or one-to-one). To obtain the last plot in this group,experiments were performed in the selected forcing frequency range for up anddown sweeps at di!erent forcing amplitudes and rotating angles. During thesweeps, the frequencies at which the absorber started and ended oscillating wereobserved and the region between the two frequencies was de"ned as absorptionregion.

Figure 9. Quasiperiodic motion on ¹2 for h"253 from the vertical orientation with A"300 mV( f
o"4)25 Hz): (a) cover of ¹2; (b) slice of ¹2; (c) "rst return map.
924 A. ERTAS E¹ A¸.
4. RESULTS AND DISCUSSIONS
Experimental investigations were conducted to obtain the frequency responsecurves for a range of excitation frequencies, which included the natural frequency ofthe system. Phase planes, time histories, FFT, and "rst return map were also doneto detail the dynamics of the system. In both the horizontal and verticalorientations, the natural frequencies of the system and absorber were tuned tofs"2)80 Hz and f
a"1)40 Hz respectively. During the experiments, the natural
frequency of the system, the tip mass, the pendulum mass, and the internalfrequency ratio were not altered. In order to obtain the system dynamics theexperiments were conducted starting from the horizontal position (beam) to the
c
Figure 11. Response characteristics for the horizontal orientation with A"300 mV andfo"3)00 Hz. Delay co-ordinates: (a) primary structures; (c) absorber; (b) projection on r
1}r
2plane.
Time history: (d) primary structure; (e) absorber. FFT: (f ) primary structure; (g) absorber.

Figure 10. Response plots for the horizontal orientation with A"300 mV and2)50 Hz(f
o(3)50 Hz: (a) primary structure; (b) absorber.
PENDULUM ABSORBER 925

Figure 12. Response plots for h"703 from horizontal orientation with A"300 mV and2)50 Hz(f
o(3)50 Hz: (a) primary structure; (b) absorber.
926 A. ERTAS E¹ A¸.
vertical position (column) with 19 di!erent angles and vice versa. For theexperiments starting from the horizontal position to vertical position, the excitationfrequency was swept up, from 2)50 to 3)50 Hz. This frequency range spannedfs"2f
a"2)80 Hz. For the experiments starting from the vertical position to
horizontal position, the excitation frequency was swept down, from 4)65 to 3)90 Hz.This frequency range spanned 1)5f
s"3f
a"4)20 Hz.
Experiments were performed for two main setups. First, the model was set-up asa beam-tip mass-pendulum system. Then it was rotated in 53 increments to thevertical orientation. Second, the model was set-up as a column-tip mass-pendulumsystem. Then it was rotated in 53 increments to the horizontal orientation. For bothcases, the internal frequency ratio was tuned in the initial position (vertical orhorizontal) of the system, such as f"f
s"2f
a. The above ratio remained unchanged
for each of the rotation. To investigate the system response, the excitationfrequency was swept down or up about a selected interval at the sweep rate of0)1 oct/min with a constant amplitude.
Figure 3 shows the response plots for the vertical orientation for an excitationamplitude of A"300 mV. The excitation frequency was swept down from 4)65 to3)90 Hz. Note that in the response plots, of this study, the direction of the sweep isindicated by the arrow in the label of the abscissa. The response of the primarystructure and absorber show a response jump at 3)95 and 4)58 Hz. The absorber
Figure 13. Response characteristics for h"703 from horizontal orientation with A"300 mV andfo"2)95 Hz. Delay co-ordinates: (a) primary structures; (c) absorber; (b) projection on r
1}r
2plane.
Time history: (d) primary structure; (e) absorber. FFT: (f ) primary structure; (g) absorber.
PENDULUM ABSORBER 927
response is quasiperiodic with widows of periodicity. This observation is akin tothat made by other researchers [13]. To analyze the motion, experiments wereperformed for smaller ranges of the chosen interval. Figure 4 shows the response ofthe primary structure and absorber for a smaller frequency range of f
o3(4)395,
4)405). From this "gure the absorber response is clearly periodic. The primarystructure also depicts some periodicity, though there were some scatters in theresponse, possibly related to the piezo-"lm instead of the dynamics of the structure.
To further analyze the dynamics of the absorber and primary structure, theresponse at the excitation frequency, f
o"4)40 Hz, was analyzed. Figure 5 show the
reconstructed dynamics, time series, and FFT plots for the vertical orientation withA"300 mV. In Figures 5(f ) and 5(g), the signal was not "ltered and shows the FFTfor the primary structure and the absorber respectively. As seen from Figure 5(f ) theprimary structure has harmonics of f+3)0 Hz, related to the natural frequency ofthe primary structure, and f+1)5 Hz, which is related to the coupling e!ect. InFigure 5(g) the absorber has harmonics of f+1)5 Hz, related to the naturalfrequency of the absorber, and f+3)0 Hz, which is related to the coupling e!ect.The forcing frequency was f
o+4)40 Hz but could not be seen as a harmonic in
Figures 5(f ) and 5(g) because the parametric excitation was more dominant thanthe direct (or external) excitation. From Figure 5, it is clear that the response ofboth absorber and primary structure shows periodicity. In Figures 5(c) and 5(g) it isclear that the absorber shows periodicity with a dominant single frequency. On the

Figure 14. Critical boundary de"nition: A, critical boundary; I, absorption region (Region I); II,non-absorption region (Region II).
928 A. ERTAS E¹ A¸.
other hand, Figures 5(a) and 5(f ), the primary structure response is also periodic butmore frequencies are in play. To fully ascertain the periodicity, patterns on thetorus were studied at the excitation amplitude of A"300 mV and excitationfrequency of f
o"4)40 Hz (Figure 6). A square with periodic boundary conditions is
used to best depict the phase portraits [20]. A response is (m, n)-periodic if its orbitscan be shown to intersect the h
1and h
2-axis m and n times respectively. Based on
the latter approach, it can be seen from Figure 6(a) that the response of the primarystructure depicts a (5, 11)-periodic motion on ¹2. Slices of the cover of ¹2, Figures6(b) and 6(c), con"rm the (5, 11)-periodicity.
Again, referring to Figure 3, an excitation frequency of fo"4)37 Hz is selected to
investigate the possibility of the quasiperiodic motion (Figure 7). Figure 7(a) showsthat the torus is dense with orbits. And additionally, the slice of the torus, Figure7(b), shows that the orbit points form a closed path. The latter observations fromFigure 7 con"rm that the response is qusiperiodic.
Experiments of the system were conducted at orientations of 53 increments fromthe vertical orientation. Figure 8 shows the response plots at h"253 from thevertical orientation with A"300 mV and the excitation frequency was swept downfrom 4)65 to 3)90 Hz. On comparing Figures 8 and 3, it is observed that the overallmagnitude of the primary structure response amplitude in Figure 8 is less bya factor of 10 compared to that in Figure 3. From Figure 8, it is evident that theprimary structure can hardly drive the absorber. At this orientation (h"253) the

Figure 15. Critical boundaries (rotating from horizontal position) for A"100, 300, 400 mV incurves A, B, C respectively.
PENDULUM ABSORBER 929
detail dynamics were studied as fo"4)25 Hz. (Figure 9). At this system orientation,
quasiperiodicity was still evident.The experimental response curve (Figure 10) shows for the system in the
horizontal orientation for an excitation amplitude A"300 mV. In this case, theexcitation frequency was swept up from 2)50 to 3)50 Hz. This "gure shows clearinteraction between the absorber and primary structure. It is seen from this "gurethat as the frequency is swept up, the primary structure initially oscillates whilethe absorber hardly oscillates. But at about 2)65 Hz, an energy transfer occurs fromthe primary structure to the absorber. This is a similar trend observed by otherauthors [10] for a similar system. Detailed dynamics of the motion, forfo"3)00 Hz, are shown in Figure 11. Based on Figures 11(g) and 11(f ), it is evident
that the dominant response frequency of the absorber (+1)5 Hz) is half theresponse frequency of the primary structure (+3 Hz). It is important to note thatthe predominant oscillation frequency of the primary system is that of the direct (orexternal) excitation.
Experiments were conducted of the system at orientations of 53 increments fromthe horizontal orientation. Figure 12 shows the response plots at h"703 from thehorizontal orientation with A"300 mV and the excitation frequency was swept upfrom 2)50 to 3)50 Hz. At this orientation, the energy exchange between the absorberand primary structure is substantially weaker. For this orientation, detaileddynamics were conducted at an excitation frequency of f
o"2)95 Hz (Figure 13). At

Figure 16. Critical boundaries (rotating from vertical position) for A"100, 300, 400 mV in curvesA, B, C respectively.
930 A. ERTAS E¹ A¸.
this excitation frequency both the primary system and absorber oscillate at thesame frequency (+3 Hz). This is the evidence of a one-to-one coupling. Thisobservation implies that the autoparametric relation (one-to-two) between theprimary structure and absorber has disappeared resulting in zero energy transferbetween the primary structure and absorber. Hence, at this orientation, theabsorber is ine!ective.
A series of experiments were conducted at 53 increments from the verticalorientation and at 53 increments from the horizontal orientation. An orientationwas established beyond which a one-to-one coupling was evident, or in otherwords, the absorber was ine!ectual. This angle orientation is referred to as thecritical boundary. Below the critical boundary an one-to-two ( f
o"f
s"2f
a) relation
exists and the absorber is e!ective. The region where the absorber is e!ective willalso be referred to as Region I. On the other hand, above the critical boundary anone-to-one ( f
o"f
s"f
a) relation exists and the absorber is ine!ective. The region
where the absorber is ine!ective will also be referred to as Region II. The absorptionregion studied here is the parametric resonance of the system. It should further benoted that this system does not dissipate energy, but rather energy is transferredfrom one mode to another. This is due to the fact that system under study iscoupled.

Figure 17. Absorption regions (rotating from horizontal position) for h"0, 45, 603 in areas A, B,C respectively.
PENDULUM ABSORBER 931
Figure 14 depicts the de"nition of a critical boundary, where to the right of theboundary is the Region I, and to the left is Region II. As will be shown later, thelocation of the two regions, relative to the critical boundary is dependent on whetherthe rotation is from the horizontal or vertical position. Figures 15 shows the e!ectof the excitation amplitude on the critical boundary measured from the horizontalorientation. For each of the three critical boundaries in Figure 15, Regions I and IIare on the right side and left side respectively. From this "gure, it is evident thatincrease of the excitation amplitude leads to an increase in the absorption region ofthe absorber. Figure 16 shows the e!ect of the excitation amplitude on theabsorption region at an orientation measured from the vertical orientation. In this"gure Region I is on the left side of each critical boundary. In Figure 16, an increaseof the excitation amplitude also translates to an expansion of the absorption region,hence an increase of the angle of the critical boundary. It is observed that the criticalboundaries A, B, and C in Figure 15 coincide with critical boundaries C, B, and A inFigure 16 respectively.
Figure 17 portrays the variation of the absorption region with respect to rotationangle and forcing amplitude. In this "gure, only the orientation from the horizontalposition was selected for analysis. In this case, the natural frequency of the system,fswas 2)80 Hz. For this exhibit, the system was tuned such that the conditions f
o"1
2fs"f
a"1)4 Hz and f
o"f
s"2f
a"2)8 Hz were satis"ed where the former is the
subharmonic condition and the latter is the autoparametric resonance condition.As seen from this "gure, the absorber absorbs energy from the primary structure,

932 A. ERTAS E¹ A¸.
even when the primary structure is subjected to a very small excitation amplitude(A"25 mV) in the neighborhood of the autoparametric resonance ( f
o"f
s"2f
a).
For the subharmonic resonance case, comparing to the fundamental resonancecase a very small absorption region was observed related to the rotation angle atvery high forcing amplitude. From Figure 17, increasing the rotation angle oforientation narrowed the absorption region. It can also be observed from this "gurethat with an increase in the rotation angle of orientation, required a higherexcitation amplitude A for the absorber to begin oscillating.
5. CONCLUSIONS
Based on the narrative in the previous section, a number of conclusions can bedrawn. First, the system in vertical direction shows more complex dynamics thanthe system in horizontal direction. Secondly, the energy is absorbed from thesystem by the absorber until a critical boundary is reached. The range of this criticalboundary is shown to depend on the forcing amplitude, whereby increasing theforcing amplitude results in an increase of the boundary region. Thirdly,the systematic approach developed in this study can be used to establish thedemarcation of the e!ectiveness of the passive vibration absorber for systems thatchange their orientation. This has practical implication since it has been shownthat for primary structures that change orientation, passive vibration absorbersmay become mistuned and consequently lose their e!ectiveness.
REFERENCES
1. J. Q. SUN, M. R. JOLLY and M. A. NORRIS 1995 Journal of Mechanical Design 117,234}242. Passive, adaptive and active tuned vibration absorbers*a survey.
2. B. G. KORENEV and L. M. REZNIKOV 1993 Dynamic <ibration Absorbers. New York:Wiley.
3. S. S. OUEINI, A. H. NAYFEH and J. R. PRATT 1998 Nonlinear Dynamics 15, 259}282.A nonlinear vibration absorber for #exible structures.
4. A. H. NAYFEH and D. T. MOOK 1995 Journal of Mechanical Design 117, 186}195. Energytransfer from high-frequency to low-frequency modes in structures.
5. B. MCLAUGHLIN 1981 Journal of Statistical Physics 24, 375}388. Period-doublingbifurcation and chaotic motion for a parametrically forced pendulum.
6. H. SPRYSL 1987 Journal of Sound and <iburation 112, 63}67. Internal resonance ofnon-linear autonomous vibrating systems with two-degrees-of-freedom.
7. L. D. ZAVODNEY and A. H. NAYFEH 1986 International Journal of Non-¸inear Mechanics24, 105}125. The nonlinear response of a slender beam carrying a lumped mass toa principle parametric excitation: theory and experiment.
8. F. R. ARNOLD 1955 Journal of Applied Mechanics 22, 487}492. Steady-state behavior ofsystem provided with nonlinear dynamic vibration absorber.
9. J. SHAW, S. W. SHAW and A. G. HADDOW 1989 International Journal of Non-¸inearMechanics 24, 281}293. On the response of the non-linear vibration absorber.
10. O. CUVALCI and A. ERTAS 1996 Journal of <ibration and Acoustics 118, 558}566.Pendulum as vibration absorber for #exible structures: experiments and theory.
11. A. TONDL 1998 Acta ¹echnica CSA< 43, 301}309. Vibration quencing of an externallyexcited system by means of dynamic absorber.

PENDULUM ABSORBER 933
12. J. A. GLAZIER and A. LIBCHABER 1998 IEEE ¹ransactions on Circuits and Systems 35,790}806. Quasi-periodicity and dynamical systems: an experimental's view.
13. G. MUSTAFA and A. ERTAS 1995 Journal of Dynamic Systems, Measurement, and Control117, 218}225. Experimental evidence of quasiperiodicity and its breakdown in thecolumn-pendulum oscillator.
14. G. MUSTAFA and A. ERTAS 1995 Journal of Sound and<ibration 182, 393}413. Dynamicsand bifurcations of a coupled column-pendulum oscillator.
15. M. CASDAGLI, S. EUBANK, J. D. FARMER and J. GIBSON 1991 Physica D 51, 52}58. Statespace reconstruction in the presence of noise.
16. F. TAKENS 1981 Dynamical Systems and ¹urbulence (D. S. Rand and L.-S. Young,editors). New York: Springer-Verlag Detecting strange attractors in turbulence.
17. S. E. NEWHOUSE, D. RUELLE and F. TAKENS 1978 Communications in MathematicalPhysics 64, 35}40. Occurrence of strange axiom A attractors near quasi periodic #ow on¹m, m*3.
18. P. M. BATTELINO, C. GREBOGI, E. OTT and J. A. YORKE 1989 Physica D 39, 299}314.Chaotic attractors on a 3-torus, and torus break-up.
19. A. ERTAS and G. MUSTAFA 1992 Experimental ¹echniques 16, 33}35. Real-time responseof the simple pendulum: an experimental technique.
20. S. H. STROGATZ 1994 Nonlinear Dynamics and Chaos. Reading, MA: Addsion-Wesley.
APPENDIX: PRINCIPAL NOTATION
A forcing amplitude (peak-to-peak)f frequency (Hz)fa
natural frequency of absorber (Hz)fo
forcing frequency (Hz)fs
natural frequency of system (Hz)r1
translational displacement of primary structurer2
angular displacement of absorberr1(n~q) delay co-ordinate of primary structure
r2(n~q) delay co-ordinate of absorber¹2 two-dimensional torus (2-torus)h variable angle from the horizontal position and the vertical positionq delay timeu1
angular co-ordinate of ¹2 formed by r1(t~q) and r
1(i)(primary structure)
u2
angular co-ordinate of ¹2 formed by r2(t~q) and r
2(t)(absorber)