Performance evaluation of the microPET R4 PET scanner for rodents
11
European Journal of Nuclear Medicine and Molecular Imaging Vol. 30, No. 5, May 2003 Abstract. The microPET R4 scanner is a dedicated posi- tron emission tomograph (PET) for studies of rodents. A number of scanner parameters such as spatial resolution, sensitivity, scatter, and count rate performance were de- termined in this work, which showed that the microPET R4 is a suitable PET scanner for small animals like mice and rats. In the center of the field of view (FOV) a maxi- mal sensitivity of 43.66 cps/kBq for a centered point source was calculated from a measurement with a ger- manium-68 line source within an energy widow of 250–750 keV. A spatial resolution of 1.85 mm full-width at half-maximum (FWHM) in the axial direction and 1.66 mm FWHM in the transaxial direction was mea- sured in the center with a 1-mm-diameter sodium-22 point source. Within the inner 20 mm of the FOV the volumetric resolution is better than 15.6 µl, correspond- ing to a linear resolution of less than 2.5 mm in all three dimensions. Images of a high-resolution phantom and from mice and rat studies illustrate the good performance of the scanner. A maximal noise equivalent count rate (NECR) was reached at 174 kcps for a mouse phantom and at 93 kcps for a rat phantom (energy window 250–750 keV). Scatter fractions were measured between 0.30 and 0.42 for an energy window of 250–750 keV and phantom diameters similar to mice and rats. A compari- son with the microPET P4 model for primates illustrates the gain in sensitivity due to a smaller detector ring di- ameter but also the changes in NECR. Keywords: microPET – PET – Performance evaluation – Molecular imaging – Small animal imaging Eur J Nucl Med Mol Imaging (2003) 30:737–747 DOI 10.1007/s00259-002-1052-6 Introduction The use of positron emission tomography (PET) in small animal imaging is a helpful tool for drug development, the imaging of gene expression, the monitoring of gene therapy, and the development of new animal models [1, 2, 3]. Especially for the imaging of mice and rats, high res- olution and high sensitivity are the main criteria. Except for the High Resolution Research Tomograph (ECAT HRRT, [4]), no clinical PET scanner is in the position to provide a spatial resolution of 2.5 mm and a sensitivity greater than 3.5%. In addition, clinical scanners have limited availability for experimental work. For this rea- son there is a trend towards the development of dedicat- ed animal PET scanners [3]. Advantages of these sys- tems are lower selling price, higher flexibility, full-time availability for animal experiments, better spatial resolu- tion due to smaller crystals and smaller detector ring di- ameters. The microPET R4 (rodent) system (Concorde Mi- crosystems Inc.) is a commercially available animal PET scanner that was installed at the Max-Planck-Insti- tute for Neurological Research (Cologne, Germany) in 2001. This scanner is designed for the requirements of rodent studies and is used at our institution for studies of mice and rats to image gene expression and tumour proliferation [5, 6]. With an axial field of view (FOV) of 78 mm, whole-body scans of rodents can be per- formed with a few bed positions. A number of micro- PET R4 parameters were evaluated within the scope of this work to characterize the performance of this system in practice. Christof Knoess ( ✉ ) Max-Planck-Institute for Neurological Research, Gleuelerstrasse 50, 50931 Cologne, Germany e-mail: [email protected] Tel.: +49-221-4785713, Fax: +49-221-4726298 Molecular imaging Performance evaluation of the microPET R4 PET scanner for rodents Christof Knoess 1 , Stefan Siegel 2 , Anne Smith 2 , Danny Newport 2 , Norbert Richerzhagen 1 , Alexandra Winkeler 1, 3 , Andreas Jacobs 1, 3, 4 , Rhonda N. Goble 2 , Rudolf Graf 1 , Klaus Wienhard 1 , Wolf-Dieter Heiss 1, 3, 4 1 Max-Planck-Institute for Neurological Research, Gleuelerstrasse 50, 50931 Cologne, Germany 2 Concorde Microsystems Inc., Knoxville, Tenn., USA 3 Center of Molecular Medicine, Cologne, Germany 4 Department of Neurology at the University of Cologne, Cologne, Germany Published online: 21 January 2003 © Springer-Verlag 2003
-
Upload
rohitkaranth -
Category
Documents
-
view
1 -
download
0
Transcript of Performance evaluation of the microPET R4 PET scanner for rodents

European Journal of Nuclear Medicine and Molecular Imaging Vol. 30, No. 5, May 2003
Abstract. The microPET R4 scanner is a dedicated posi-tron emission tomograph (PET) for studies of rodents. Anumber of scanner parameters such as spatial resolution,sensitivity, scatter, and count rate performance were de-termined in this work, which showed that the microPETR4 is a suitable PET scanner for small animals like miceand rats. In the center of the field of view (FOV) a maxi-mal sensitivity of 43.66 cps/kBq for a centered pointsource was calculated from a measurement with a ger-manium-68 line source within an energy widow of250–750 keV. A spatial resolution of 1.85 mm full-widthat half-maximum (FWHM) in the axial direction and1.66 mm FWHM in the transaxial direction was mea-sured in the center with a 1-mm-diameter sodium-22point source. Within the inner 20 mm of the FOV thevolumetric resolution is better than 15.6 µl, correspond-ing to a linear resolution of less than 2.5 mm in all threedimensions. Images of a high-resolution phantom andfrom mice and rat studies illustrate the good performanceof the scanner. A maximal noise equivalent count rate(NECR) was reached at 174 kcps for a mouse phantomand at 93 kcps for a rat phantom (energy window250–750 keV). Scatter fractions were measured between0.30 and 0.42 for an energy window of 250–750 keV andphantom diameters similar to mice and rats. A compari-son with the microPET P4 model for primates illustratesthe gain in sensitivity due to a smaller detector ring di-ameter but also the changes in NECR.
Keywords: microPET – PET – Performance evaluation –Molecular imaging – Small animal imaging
Eur J Nucl Med Mol Imaging (2003) 30:737–747DOI 10.1007/s00259-002-1052-6
Introduction
The use of positron emission tomography (PET) in smallanimal imaging is a helpful tool for drug development,the imaging of gene expression, the monitoring of genetherapy, and the development of new animal models [1,2, 3].
Especially for the imaging of mice and rats, high res-olution and high sensitivity are the main criteria. Exceptfor the High Resolution Research Tomograph (ECATHRRT, [4]), no clinical PET scanner is in the position toprovide a spatial resolution of 2.5 mm and a sensitivitygreater than 3.5%. In addition, clinical scanners havelimited availability for experimental work. For this rea-son there is a trend towards the development of dedicat-ed animal PET scanners [3]. Advantages of these sys-tems are lower selling price, higher flexibility, full-timeavailability for animal experiments, better spatial resolu-tion due to smaller crystals and smaller detector ring di-ameters.
The microPET R4 (rodent) system (Concorde Mi-crosystems Inc.) is a commercially available animalPET scanner that was installed at the Max-Planck-Insti-tute for Neurological Research (Cologne, Germany) in2001. This scanner is designed for the requirements ofrodent studies and is used at our institution for studiesof mice and rats to image gene expression and tumourproliferation [5, 6]. With an axial field of view (FOV)of 78 mm, whole-body scans of rodents can be per-formed with a few bed positions. A number of micro-PET R4 parameters were evaluated within the scope ofthis work to characterize the performance of thissystem in practice.
Christof Knoess ()Max-Planck-Institute for Neurological Research, Gleuelerstrasse 50, 50931 Cologne, Germanye-mail: [email protected].: +49-221-4785713, Fax: +49-221-4726298
Molecular imaging
Performance evaluation of the microPET R4 PET scannerfor rodentsChristof Knoess1, Stefan Siegel2, Anne Smith2, Danny Newport2, Norbert Richerzhagen1, Alexandra Winkeler1, 3, Andreas Jacobs1, 3, 4, Rhonda N. Goble2, Rudolf Graf1, Klaus Wienhard1, Wolf-Dieter Heiss1, 3, 4
1 Max-Planck-Institute for Neurological Research, Gleuelerstrasse 50, 50931 Cologne, Germany2 Concorde Microsystems Inc., Knoxville, Tenn., USA3 Center of Molecular Medicine, Cologne, Germany4 Department of Neurology at the University of Cologne, Cologne, Germany
Published online: 21 January 2003© Springer-Verlag 2003
Materials and methods
System description
The microPET R4 is a dedicated animal PET scanner designed forstudies of small animals like mice and rats. With an animal port of120 mm diameter even larger animals like cats can be studied inbrain research. A second model of this scanner is supplied with alarger opening of 220 mm, designed in particular for primates (mi-croPET P4). The P4 system was evaluated by Tai et al. in 2001[7].
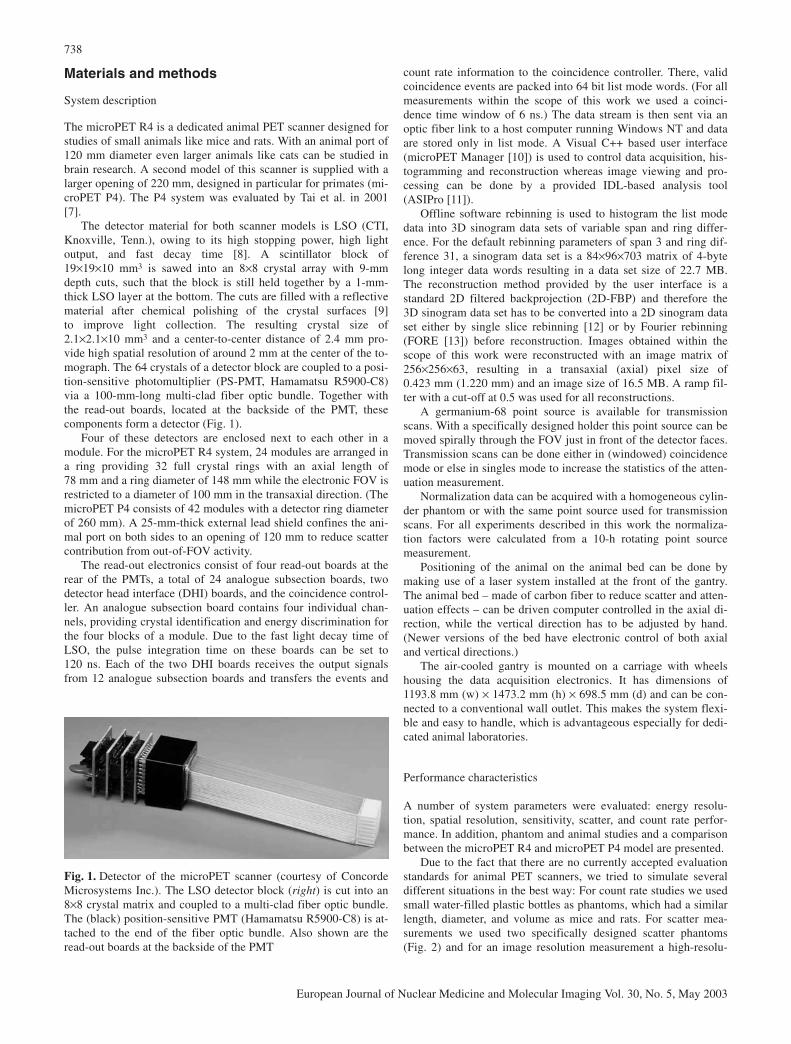
The detector material for both scanner models is LSO (CTI,Knoxville, Tenn.), owing to its high stopping power, high lightoutput, and fast decay time [8]. A scintillator block of19×19×10 mm3 is sawed into an 8×8 crystal array with 9-mmdepth cuts, such that the block is still held together by a 1-mm-thick LSO layer at the bottom. The cuts are filled with a reflectivematerial after chemical polishing of the crystal surfaces [9] to improve light collection. The resulting crystal size of2.1×2.1×10 mm3 and a center-to-center distance of 2.4 mm pro-vide high spatial resolution of around 2 mm at the center of the to-mograph. The 64 crystals of a detector block are coupled to a posi-tion-sensitive photomultiplier (PS-PMT, Hamamatsu R5900-C8)via a 100-mm-long multi-clad fiber optic bundle. Together withthe read-out boards, located at the backside of the PMT, thesecomponents form a detector (Fig. 1).
Four of these detectors are enclosed next to each other in amodule. For the microPET R4 system, 24 modules are arranged ina ring providing 32 full crystal rings with an axial length of78 mm and a ring diameter of 148 mm while the electronic FOV isrestricted to a diameter of 100 mm in the transaxial direction. (ThemicroPET P4 consists of 42 modules with a detector ring diameterof 260 mm). A 25-mm-thick external lead shield confines the ani-mal port on both sides to an opening of 120 mm to reduce scattercontribution from out-of-FOV activity.
The read-out electronics consist of four read-out boards at therear of the PMTs, a total of 24 analogue subsection boards, twodetector head interface (DHI) boards, and the coincidence control-ler. An analogue subsection board contains four individual chan-nels, providing crystal identification and energy discrimination forthe four blocks of a module. Due to the fast light decay time ofLSO, the pulse integration time on these boards can be set to120 ns. Each of the two DHI boards receives the output signalsfrom 12 analogue subsection boards and transfers the events and
count rate information to the coincidence controller. There, validcoincidence events are packed into 64 bit list mode words. (For allmeasurements within the scope of this work we used a coinci-dence time window of 6 ns.) The data stream is then sent via anoptic fiber link to a host computer running Windows NT and dataare stored only in list mode. A Visual C++ based user interface(microPET Manager [10]) is used to control data acquisition, his-togramming and reconstruction whereas image viewing and pro-cessing can be done by a provided IDL-based analysis tool (ASIPro [11]).
Offline software rebinning is used to histogram the list modedata into 3D sinogram data sets of variable span and ring differ-ence. For the default rebinning parameters of span 3 and ring dif-ference 31, a sinogram data set is a 84×96×703 matrix of 4-bytelong integer data words resulting in a data set size of 22.7 MB.The reconstruction method provided by the user interface is astandard 2D filtered backprojection (2D-FBP) and therefore the3D sinogram data set has to be converted into a 2D sinogram dataset either by single slice rebinning [12] or by Fourier rebinning(FORE [13]) before reconstruction. Images obtained within thescope of this work were reconstructed with an image matrix of256×256×63, resulting in a transaxial (axial) pixel size of0.423 mm (1.220 mm) and an image size of 16.5 MB. A ramp fil-ter with a cut-off at 0.5 was used for all reconstructions.
A germanium-68 point source is available for transmissionscans. With a specifically designed holder this point source can bemoved spirally through the FOV just in front of the detector faces.Transmission scans can be done either in (windowed) coincidencemode or else in singles mode to increase the statistics of the atten-uation measurement.
Normalization data can be acquired with a homogeneous cylin-der phantom or with the same point source used for transmissionscans. For all experiments described in this work the normaliza-tion factors were calculated from a 10-h rotating point sourcemeasurement.
Positioning of the animal on the animal bed can be done bymaking use of a laser system installed at the front of the gantry.The animal bed – made of carbon fiber to reduce scatter and atten-uation effects – can be driven computer controlled in the axial di-rection, while the vertical direction has to be adjusted by hand.(Newer versions of the bed have electronic control of both axialand vertical directions.)
The air-cooled gantry is mounted on a carriage with wheelshousing the data acquisition electronics. It has dimensions of1193.8 mm (w) × 1473.2 mm (h) × 698.5 mm (d) and can be con-nected to a conventional wall outlet. This makes the system flexi-ble and easy to handle, which is advantageous especially for dedi-cated animal laboratories.
Performance characteristics
A number of system parameters were evaluated: energy resolu-tion, spatial resolution, sensitivity, scatter, and count rate perfor-mance. In addition, phantom and animal studies and a comparisonbetween the microPET R4 and microPET P4 model are presented.
Due to the fact that there are no currently accepted evaluationstandards for animal PET scanners, we tried to simulate severaldifferent situations in the best way: For count rate studies we usedsmall water-filled plastic bottles as phantoms, which had a similarlength, diameter, and volume as mice and rats. For scatter mea-surements we used two specifically designed scatter phantoms(Fig. 2) and for an image resolution measurement a high-resolu-
738
European Journal of Nuclear Medicine and Molecular Imaging Vol. 30, No. 5, May 2003
Fig. 1. Detector of the microPET scanner (courtesy of ConcordeMicrosystems Inc.). The LSO detector block (right) is cut into an8×8 crystal matrix and coupled to a multi-clad fiber optic bundle.The (black) position-sensitive PMT (Hamamatsu R5900-C8) is at-tached to the end of the fiber optic bundle. Also shown are theread-out boards at the backside of the PMT

tion phantom consisting of holes with different diameter and cen-ter-to-center spacing (Fig. 10a). Beyond that a 1-mm-diameter so-dium-22 point source was used to measure the intrinsic systemresolution and a 68Ge line source was used for the measurement ofthe absolute sensitivity.
Energy resolution. During detector setup of the microPET R4scanner, the software acquires crystal energy spectra for the totalnumber of 6,144 crystals within an energy window of200–800 keV. For this measurement a 10.5-MBq 68Ge line sourcewas placed axially centered in the FOV and data were acquired for300 s in energy spectrum mode.
The resulting energy spectra were analyzed for the position ofthe 511 keV energy peak and a Gaussian curve was fitted to eachpeak. The FWHM (in keV) of the Gaussian curve was then used tocalculate the energy resolution ∆E/E of the corresponding crystalby ∆E/E=FWHM/E, where E is the peak position in keV. Asystem energy resolution was calculated from the mean value ofall crystal energy resolutions.
Spatial resolution. A 2,360 kBq 22Na point source with a diameterof 1 mm was used to measure the spatial resolution of the system.The point source, embedded in a plastic disk, was centered in theFOV and fixed on the animal bed. Then the bed was moved in aradial (vertical) direction in steps of 1 mm from the scanner axis(0 mm) to the edge of the electronic FOV (50 mm). For each pointsource position, data were acquired for 60 s within an energy win-dow of 350–750 keV, rebinned into sinogram data sets of span 3and ring difference 31, and reconstructed with FORE+2D-FBP.Data were not corrected for source dimension, non-collinearity ofthe two photons, or attenuation. The FWHM in radial, tangential,and axial directions of the resulting images were calculated by lin-ear interpolation between the points with a count rate just aboveand those with a count rate just below half of the maximal countrate and plotted against the source position.
The same point source was then used to measure the slice widthof the image planes: the source was centered in the transaxial direc-
tion of the FOV and fixed on the animal bed. The bed was movedin steps of 250 µm along the scanner axis through the whole FOV.List mode data were acquired for 60 s at each point source positionand rebinned into sinogram data sets of span 3 and ring difference31. For every image plane, the total count rate was extracted fromthe non-oblique sinograms of the data set (segment 0) and plottedagainst the known source position. The FWHM of the resultingcurve was then calculated in the same way as described above.
Sensitivity. An 18.3-cm-long, 10.5-MBq 68Ge line source was usedto measure the absolute sensitivity of the microPET R4 system.The line source was placed along the axis of the scanner and wascentered in the transaxial direction. Similar to the NEMA NU 2-2001 standard [14], five aluminum sleeves with different diame-ters and wall thickness were used to create a shielding thickness of1, 2, 3, 4, and 5 mm around the source. For each shielding thick-ness and energy windows of 250–750 keV, 350–650 keV, and410–613 keV, data were acquired for 100 s and rebinned into 3Dsinogram data sets of span 3 and ring difference 31. Delayedevents were subtracted before rebinning and the dead time-cor-rected total trues count rates were calculated for every shieldingthickness. By plotting the trues rate against the total shieldingthickness, the extrapolation to the trues count rate of an unshieldedline source with no attenuation is possible [15]. The sensitivity ofthe scanner was then calculated as the fraction of the extrapolatedtrues count rate compared with the source activity in the FOV, cor-rected for the branching ratio of 68Ge (0.89).
Since the sensitivity of a line source located on the scanner axis is half the sensitivity of a point source centered in the FOV (ifdata are acquired with the maximal ring difference), the so mea-sured sensitivity values can be converted into a sensitivity value ofthe scanner for a centered point source.
An additional measurement was done with a 22Na point sourceto measure a three-dimensional sensitivity profile of the microPETR4 system. The source was centered in the transaxial direction ofthe FOV and fixed on the animal bed. Then the bed was moved insteps of 5 mm in the axial direction over the whole FOV. The radi-al direction was scanned from 0 mm to 50 mm offset in steps of5 mm. At each point source location, data were acquired for 60 sand rebinned into 3D sinogram data sets of span 3 and ring differ-ence 31. Delayed events were subtracted before rebinning and thetotal trues count rate was calculated for every source position.
Scatter. Scattered events in the object and the detectors will resultin falsely located coincidence events. To measure the scatter frac-tion we used two phantoms similar to the NEMA NU 2-2001 stan-dard [14]. A 60-mm-diameter, 150-mm-long polyethylene (HDPE)phantom (density 0.95 g/cm3) with a hole at 13 mm distance fromthe axis and a 30-mm-diameter, 150-mm-long HDPE phantomwith a hole at 7 mm distance from the axis represent objects with adiameter similar to a rat (referred to as the “rat scatter phantom” inthe following) and a mouse (referred to as the “mouse scatterphantom” in the following, Fig. 2). A line source with an inner di-ameter of 1.0 mm was filled with a start activity of around18.5 MBq FDG and inserted in the drillings. The phantoms werecentered axially and transaxially in the FOV and data were ac-quired for five different energy windows: the lower level discrimi-nator (lld) was changed between 250 and 450 keV in 50-keV stepswhile the upper level discriminator (uld) was held at 750 keV (thevalue used for all animal scans). After single slice rebinning of thesinogram data set, the source position was aligned in all angularprojections of the 2D sinograms. For a single sinogram the sum-mation over all these aligned projections results in a projection
739
European Journal of Nuclear Medicine and Molecular Imaging Vol. 30, No. 5, May 2003
Fig. 2. Scatter phantoms designed for animal PET scanners. Therat scatter phantom (left) is 150 mm long and 60 mm in diameter.The mouse scatter phantom (middle) is 150 mm long and 30 mmin diameter. A line source (right) can be filled with activity and in-serted into the phantoms: at 13 mm distance from the axis for therat scatter phantom and at 7 mm distance from the axis for themouse scatter phantom
with a defined peak corresponding to the line source. To estimatethe scatter fraction, a 25-mm-wide (21 sinogram bins) region wascentered over the line source peak. All pixels outside this regionwere assumed to be scattered events, whereas the pixel values in-side the region are a combination of scattered and unscatteredevents. To calculate the number of scattered events, the mean val-ue of the number of events at the left and right region border wasassumed to be the scatter portion of every pixel inside the region.
The scatter fraction SFslice per sinogram was then defined (ac-cording to the NEMA NU 2-2001 standard [14]) as:
(1)
where S is the number of scattered events, T is the number of un-scattered events and T+S corresponds to the total number ofevents in the summed profile. An overall scatter fraction SF wascalculated as the mean value over the scatter fraction valuesSFslice. Since single slice rebinning on the 3D sinogram data setwas performed before analysis, the image planes at the end of theFOV show less statistics than the planes in the inner part of theFOV, which leads to more noise in SFslice for these planes (Fig. 8).Therefore we decided to ignore the end planes for the computationof an overall scatter fraction and to use only planes 4–60 (this cor-responds to the inner 70 mm of the axial FOV). In this way theformula for the overall scatter fraction becomes:
Count rate performance. The count rate performance was mea-sured with three different phantoms:
A 100-mm-diameter, 100-mm-long, water-filled phantom witha volume of 785 ml
A 60-mm-diameter, 96-mm-long, water-filled phantom with avolume of 270 ml, referred to as the “rat phantom” in the fol-lowing
A 43-mm-diameter, 76-mm-long, water-filled phantom with avolume of 110 ml, referred to as the “mouse phantom” in thefollowing
These phantoms were filled with a minimum amount of 167 MBqcarbon-11 activity (see Table 2) and scanned for different energywindows over more than nine half-lives of the isotope. The listmode data were rebinned offline into frames of 180 s each and theprompts, randoms, and trues count rates for each frame were de-termined.
To calculate the NECR, the scatter fractions for the mouse andthe rat phantom were calculated by summing all projections froma single angular projection angle and by fitting a Gaussian func-tion to the tails (outside the phantom) of the resulting distribution.The number of scatter events within the phantom was assumed tobe identical to this function, and the NECR was then defined as:
(2)
where k is the transversal coverage of the phantom compared withthe FOV:
(3)
and T, S, and R are the trues, scatter, and randoms count rates.
Phantom and animal studies
The high-resolution phantom (Fig. 10a) consists of a 19-mm-thicklucite disk with a diameter of 80 mm. It is divided into four areaswhere each area consists of holes with a different diameter anddifferent center-to-center spacing. The hole diameters (center-to-center spacing) are 2 mm (4 mm), 2.5 mm (5 mm), 3 mm (6 mm),and 4 mm (8 mm). The holes were filled with approximately56 MBq FDG in water and the phantom was placed vertically andcentered in the FOV. After an acquisition for 3 h, the list mode da-ta were rebinned into a single frame (span 3, ring difference 31),resulting in a sinogram with high statistics. To show the possibleachievable image quality of the system, the data were reconstruct-ed with the standard reconstruction algorithm (FORE+2D-FBP).An evaluation of other reconstruction methods (FORE+2D-OSEM, 3D-OSEM [16]) is under investigation.
Several rodents were injected with FDG and fluorine-18 andscanned with two bed positions for mice (each 30 min) and fourbed positions for rats (each 15 min). The bed displacement waschosen in such a way that the FOV was optimally utilized (18-mmoverlap between subsequent bed positions). No transmission scanswere performed since the proper calculation of attenuation andalso scatter correction is not yet provided. After reconstruction ofthe data, non-overlapping parts were extracted from the imagesand put together to form a whole-body image of the animal. In ad-dition, a cat brain study with FDG was performed. All animalswere anesthetized by adequate anesthetics during the scans, whichwere performed in accordance with the German Laws for AnimalProtection and were approved by the local animal care committeeand the Bezirksregierung Köln.
Comparison of microPET R4 and microPET P4
Due to the different detector ring diameters for the two models(148 mm for the R4 and 260 mm for the P4), certain variations inthe performance parameters may be expected. The resolution inthe center should be slightly better for the R4 system owing to thelower adverse effect of the non-collinearity of the two photons. Onthe other hand, the resolution at radial offsets should deterioratefaster for the R4 model due to the more pronounced depth of inter-action (DOI) or parallax effect. Sensitivity of the microPET R4should be considerably higher owing to the greater solid angle,and trues, randoms, and scatter count rates as a function of the ac-tivity concentration inside the FOV can be expected to show a dif-ferent behavior compared with the P4 model, resulting in a differ-ent NECR behavior.
The measured performance parameters for the R4 model werecompared with the parameters of the P4 model cited in [7].
Results
Energy resolution
A histogram of all crystal energy resolution values isshown in Fig. 3. The crystals with the best energy resolu-tion have a value of 17% whereas the crystals with theworst resolution have a value around 36%. The energyresolution averaged over the whole gantry is 23%. Thisis better than for the P4 system (26%) and is most likelydue to improvements in the process of manufacture ofthe detector blocks.
740
European Journal of Nuclear Medicine and Molecular Imaging Vol. 30, No. 5, May 2003
Spatial resolution
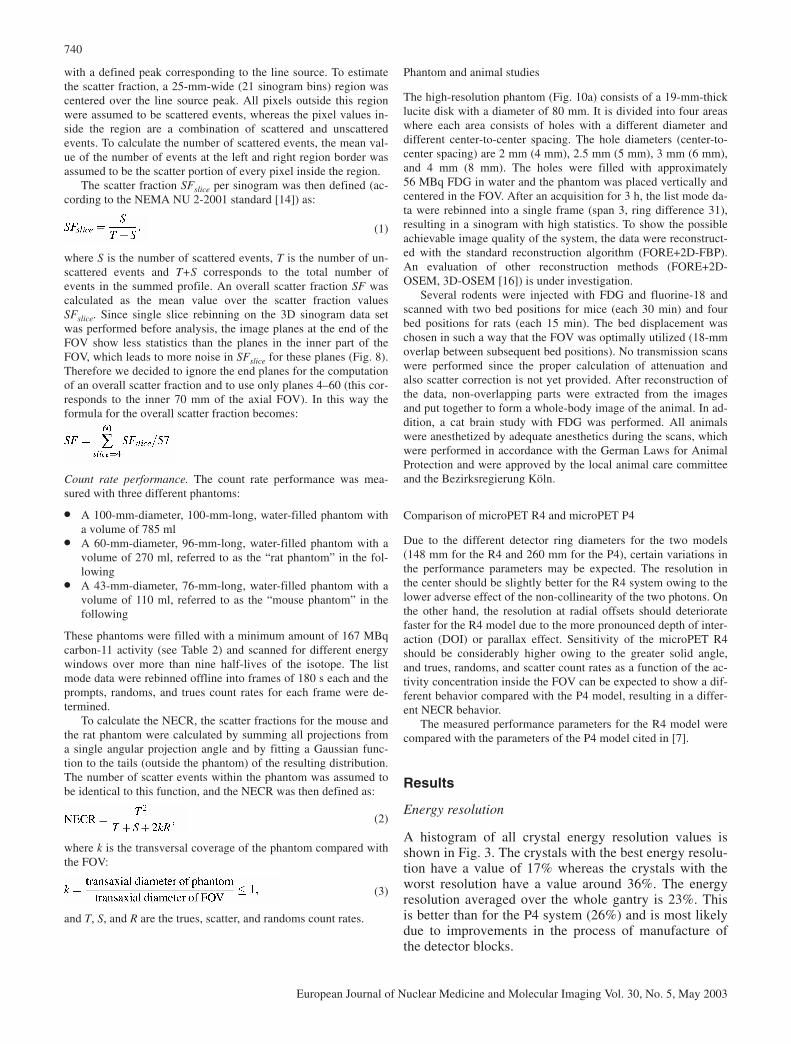
The axial and transaxial resolutions are plotted in Fig. 4for different radial offsets from the scanner axis. The res-olution in the center was measured with 1.84 mmFWHM in the axial direction, 1.65 mm FWHM in the ra-dial direction (vertical direction of the FOV), and1.66 mm FWHM in the tangential direction (horizontaldirection of the FOV). At 5 mm radial offset, these val-ues deteriorate to 2.50 mm FWHM (axial), 2.61 mmFWHM (radial), and 2.27 mm FWHM (tangential). Thisdrop in resolution from 0 mm to 5 mm radial offset isdue to sampling effects, which are known to cause rapidfluctuations in resolution at the center of a scanner.
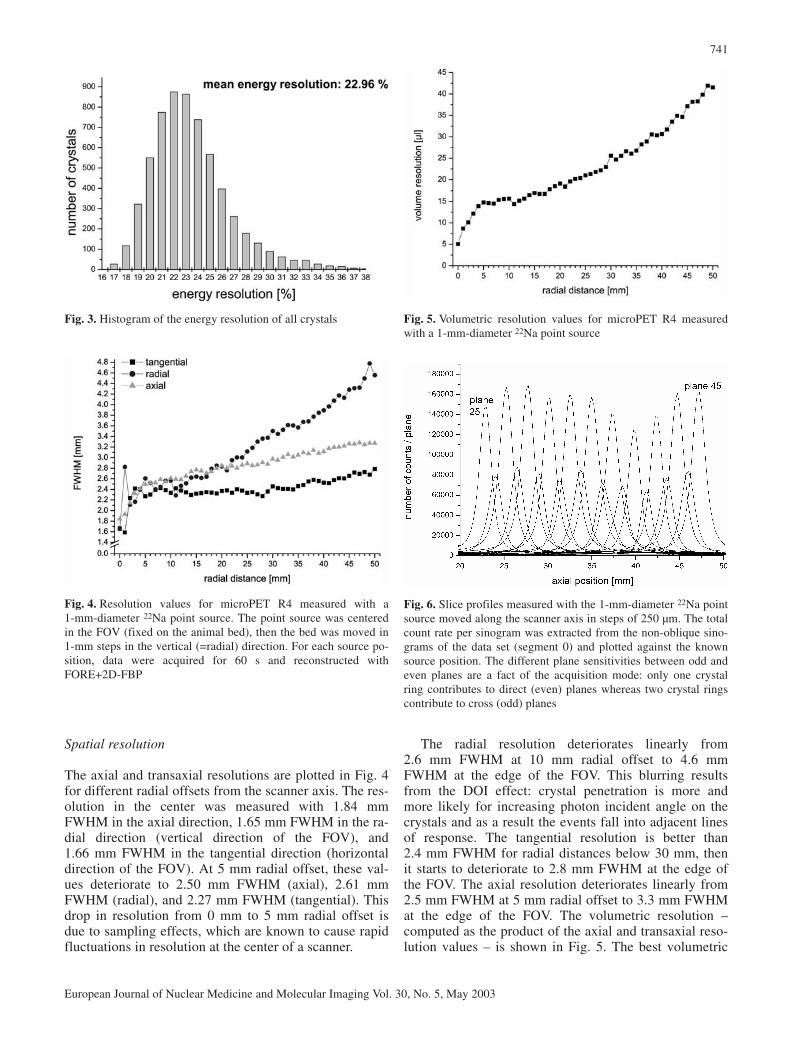
The radial resolution deteriorates linearly from2.6 mm FWHM at 10 mm radial offset to 4.6 mmFWHM at the edge of the FOV. This blurring resultsfrom the DOI effect: crystal penetration is more andmore likely for increasing photon incident angle on thecrystals and as a result the events fall into adjacent linesof response. The tangential resolution is better than2.4 mm FWHM for radial distances below 30 mm, thenit starts to deteriorate to 2.8 mm FWHM at the edge ofthe FOV. The axial resolution deteriorates linearly from2.5 mm FWHM at 5 mm radial offset to 3.3 mm FWHMat the edge of the FOV. The volumetric resolution –computed as the product of the axial and transaxial reso-lution values – is shown in Fig. 5. The best volumetric
741
European Journal of Nuclear Medicine and Molecular Imaging Vol. 30, No. 5, May 2003
Fig. 3. Histogram of the energy resolution of all crystals
Fig. 4. Resolution values for microPET R4 measured with a 1-mm-diameter 22Na point source. The point source was centeredin the FOV (fixed on the animal bed), then the bed was moved in1-mm steps in the vertical (=radial) direction. For each source po-sition, data were acquired for 60 s and reconstructed withFORE+2D-FBP
Fig. 5. Volumetric resolution values for microPET R4 measuredwith a 1-mm-diameter 22Na point source
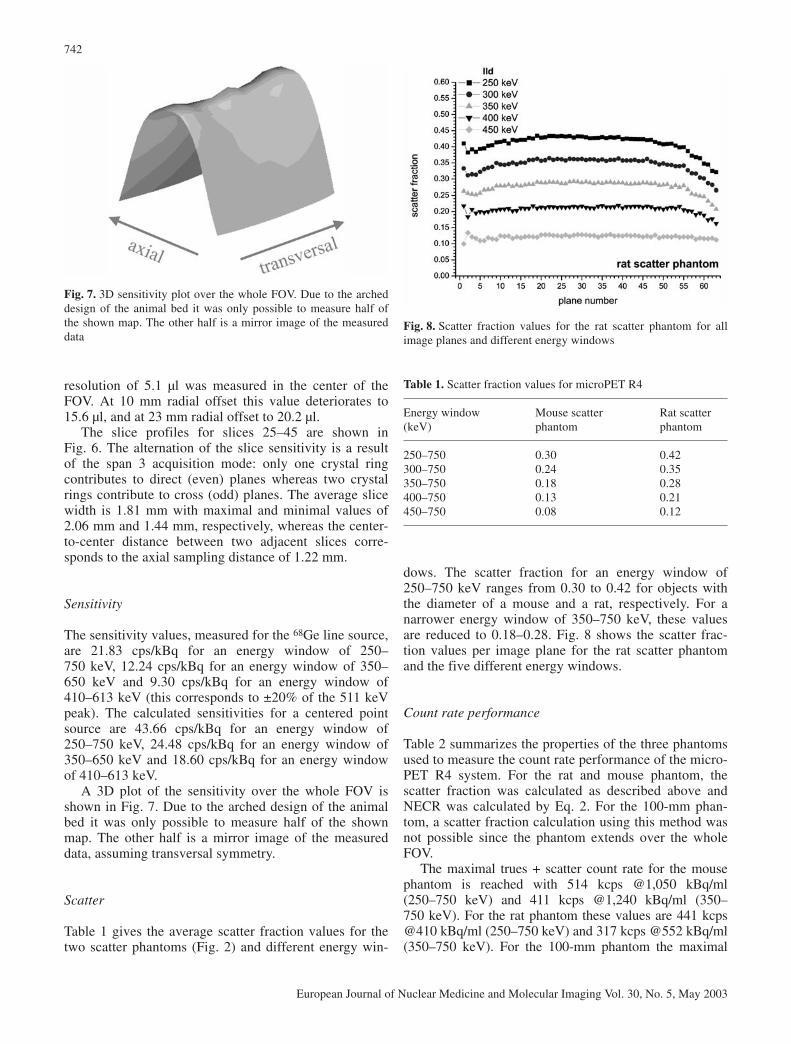
Fig. 6. Slice profiles measured with the 1-mm-diameter 22Na pointsource moved along the scanner axis in steps of 250 µm. The totalcount rate per sinogram was extracted from the non-oblique sino-grams of the data set (segment 0) and plotted against the knownsource position. The different plane sensitivities between odd andeven planes are a fact of the acquisition mode: only one crystalring contributes to direct (even) planes whereas two crystal ringscontribute to cross (odd) planes
resolution of 5.1 µl was measured in the center of theFOV. At 10 mm radial offset this value deteriorates to15.6 µl, and at 23 mm radial offset to 20.2 µl.
The slice profiles for slices 25–45 are shown inFig. 6. The alternation of the slice sensitivity is a resultof the span 3 acquisition mode: only one crystal ringcontributes to direct (even) planes whereas two crystalrings contribute to cross (odd) planes. The average slicewidth is 1.81 mm with maximal and minimal values of2.06 mm and 1.44 mm, respectively, whereas the center-to-center distance between two adjacent slices corre-sponds to the axial sampling distance of 1.22 mm.
Sensitivity
The sensitivity values, measured for the 68Ge line source,are 21.83 cps/kBq for an energy window of 250–750 keV, 12.24 cps/kBq for an energy window of 350–650 keV and 9.30 cps/kBq for an energy window of410–613 keV (this corresponds to ±20% of the 511 keVpeak). The calculated sensitivities for a centered pointsource are 43.66 cps/kBq for an energy window of250–750 keV, 24.48 cps/kBq for an energy window of350–650 keV and 18.60 cps/kBq for an energy windowof 410–613 keV.
A 3D plot of the sensitivity over the whole FOV isshown in Fig. 7. Due to the arched design of the animalbed it was only possible to measure half of the shownmap. The other half is a mirror image of the measureddata, assuming transversal symmetry.
Scatter
Table 1 gives the average scatter fraction values for thetwo scatter phantoms (Fig. 2) and different energy win-
dows. The scatter fraction for an energy window of250–750 keV ranges from 0.30 to 0.42 for objects withthe diameter of a mouse and a rat, respectively. For anarrower energy window of 350–750 keV, these valuesare reduced to 0.18–0.28. Fig. 8 shows the scatter frac-tion values per image plane for the rat scatter phantomand the five different energy windows.
Count rate performance
Table 2 summarizes the properties of the three phantomsused to measure the count rate performance of the micro-PET R4 system. For the rat and mouse phantom, thescatter fraction was calculated as described above andNECR was calculated by Eq. 2. For the 100-mm phan-tom, a scatter fraction calculation using this method wasnot possible since the phantom extends over the wholeFOV.
The maximal trues + scatter count rate for the mousephantom is reached with 514 kcps @1,050 kBq/ml(250–750 keV) and 411 kcps @1,240 kBq/ml (350–750 keV). For the rat phantom these values are 441 kcps@410 kBq/ml (250–750 keV) and 317 kcps @552 kBq/ml(350–750 keV). For the 100-mm phantom the maximal
742
European Journal of Nuclear Medicine and Molecular Imaging Vol. 30, No. 5, May 2003
Fig. 7. 3D sensitivity plot over the whole FOV. Due to the archeddesign of the animal bed it was only possible to measure half ofthe shown map. The other half is a mirror image of the measureddata
Table 1. Scatter fraction values for microPET R4
Energy window Mouse scatter Rat scatter (keV) phantom phantom
250–750 0.30 0.42300–750 0.24 0.35350–750 0.18 0.28400–750 0.13 0.21450–750 0.08 0.12
Fig. 8. Scatter fraction values for the rat scatter phantom for allimage planes and different energy windows

trues + scatter count rate is reached with 290 kcps@161 kBq/ml (350–750 keV).
NECR for the mouse and the rat phantom are shown inFig. 9. For the rat phantom the maximal NECR is 94 kcps@222 kBq/ml or 60 MBq total activity for an energy
window of 250–750 keV and 89 kcps @298 kBq/ml or81 MBq total activity for an energy window of350–750 keV owing to the lower randoms count rate. Forthe mouse phantom the maximal NECR is 174 kcps@696 kBq/ml (77 MBq total activity) for an energy win-dow of 250–750 keV and 168 kcps @824 kq/ml (91 MBqtotal activity) for an energy window of 350–750 keV.
The linearity of the dead time correction was checkedwith the mouse phantom filled with 110 MBq FDG andmeasured with an energy window of 350–750 keV formore than ten half-lives. Up to an activity concentrationof 808 kBq/ml the loss of true events due to dead time isless than 45% and the dead time correction can correctfor this to better than 10%. Beyond that activity concen-tration the dead time correction gives an unacceptable er-ror of more than 10%.
Phantom and animal studies
The FORE+2D-FBP image of the high-resolution phan-tom is shown in Fig. 10b. All hot spots in the four holeconfigurations can be clearly resolved, even the 2-mmholes. Also obvious is the degradation of the image reso-lution in the radial direction, especially for the 2-mm and2.5-mm holes. The peak-to-valley ratio in the center ofthe FOV for the 2-mm holes is approximately 2, asshown in Fig. 10c.
Figure 11 illustrates images of the same mouse135 min after injection of 5.55 MBq FDG (upper part of
743
European Journal of Nuclear Medicine and Molecular Imaging Vol. 30, No. 5, May 2003
Table 2. Properties of the three phantoms used to measure the count rate performance of the microPET R4 system
Phantom Dimensions and volume k factor Energy window Estimated Start activity (11C) (keV) scatter fraction in FOV (MBq)
100-mm phantom ø 100 mm, 100 mm long 785 ml 1.0 350–750 – 258
Rat phantom ø 60 mm, 96 mm long 270 ml 0.60 250–750 0.38 167350–750 0.31 276
Mouse phantom ø 43 mm, 76 mm long 110 ml 0.43 250–750 0.32 263350–750 0.24 187
Fig. 9. NECR for different phantoms and energy windows
Fig. 10. a The high-resolution phantom with holes of different di-ameter and center-to-center spacing (see text). b Image of thehigh-resolution phantom as measured with the microPET R4 andreconstructed with FORE+2D-FBP. The phantom was placed ver-tically and centered in the FOV. The lines indicate the position ofthe profile shown in c
744
European Journal of Nuclear Medicine and Molecular Imaging Vol. 30, No. 5, May 2003
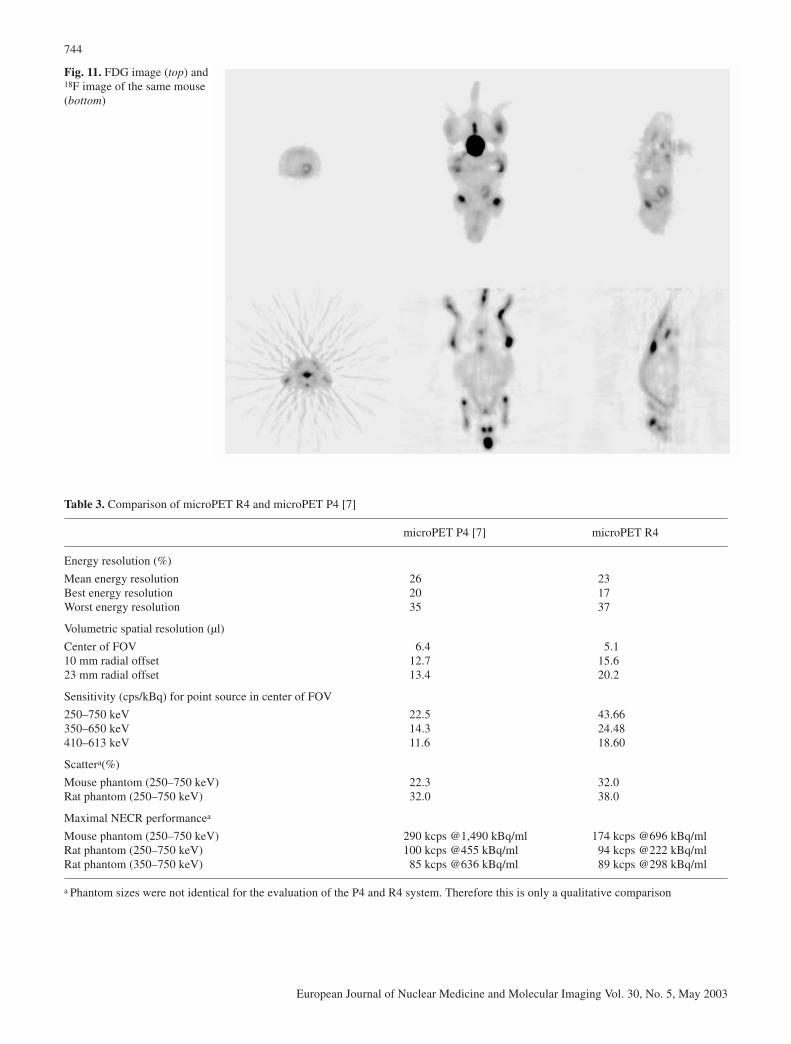
Fig. 11. FDG image (top) and18F image of the same mouse(bottom)
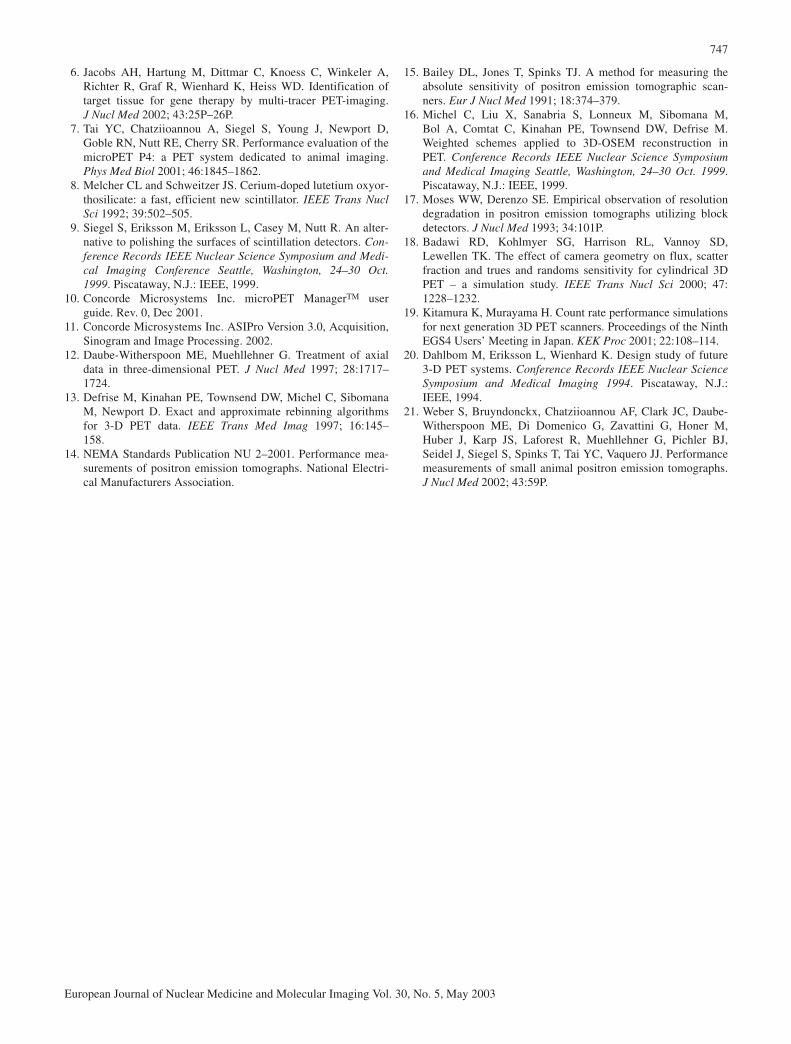
Table 3. Comparison of microPET R4 and microPET P4 [7]
microPET P4 [7] microPET R4
Energy resolution (%)
Mean energy resolution 26 23Best energy resolution 20 17Worst energy resolution 35 37
Volumetric spatial resolution (µl)
Center of FOV 6.4 5.110 mm radial offset 12.7 15.623 mm radial offset 13.4 20.2
Sensitivity (cps/kBq) for point source in center of FOV
250–750 keV 22.5 43.66350–650 keV 14.3 24.48410–613 keV 11.6 18.60
Scattera(%)
Mouse phantom (250–750 keV) 22.3 32.0Rat phantom (250–750 keV) 32.0 38.0
Maximal NECR performancea
Mouse phantom (250–750 keV) 290 kcps @1,490 kBq/ml 174 kcps @696 kBq/mlRat phantom (250–750 keV) 100 kcps @455 kBq/ml 94 kcps @222 kBq/mlRat phantom (350–750 keV) 85 kcps @636 kBq/ml 89 kcps @298 kBq/ml
a Phantom sizes were not identical for the evaluation of the P4 and R4 system. Therefore this is only a qualitative comparison
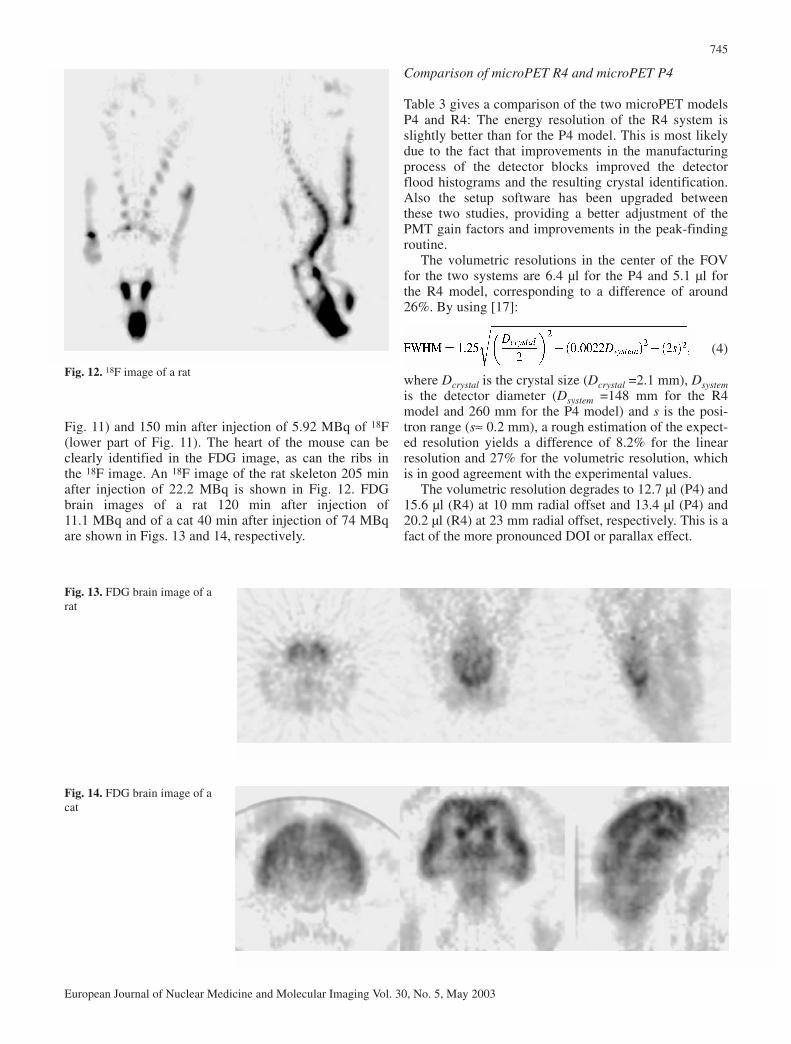
Fig. 11) and 150 min after injection of 5.92 MBq of 18F(lower part of Fig. 11). The heart of the mouse can beclearly identified in the FDG image, as can the ribs inthe 18F image. An 18F image of the rat skeleton 205 minafter injection of 22.2 MBq is shown in Fig. 12. FDGbrain images of a rat 120 min after injection of11.1 MBq and of a cat 40 min after injection of 74 MBqare shown in Figs. 13 and 14, respectively.
Comparison of microPET R4 and microPET P4
Table 3 gives a comparison of the two microPET modelsP4 and R4: The energy resolution of the R4 system isslightly better than for the P4 model. This is most likelydue to the fact that improvements in the manufacturingprocess of the detector blocks improved the detectorflood histograms and the resulting crystal identification.Also the setup software has been upgraded betweenthese two studies, providing a better adjustment of thePMT gain factors and improvements in the peak-findingroutine.
The volumetric resolutions in the center of the FOVfor the two systems are 6.4 µl for the P4 and 5.1 µl forthe R4 model, corresponding to a difference of around26%. By using [17]:
(4)
where Dcrystal is the crystal size (Dcrystal =2.1 mm), Dsystemis the detector diameter (Dsystem =148 mm for the R4model and 260 mm for the P4 model) and s is the posi-tron range (s≈ 0.2 mm), a rough estimation of the expect-ed resolution yields a difference of 8.2% for the linearresolution and 27% for the volumetric resolution, whichis in good agreement with the experimental values.
The volumetric resolution degrades to 12.7 µl (P4) and15.6 µl (R4) at 10 mm radial offset and 13.4 µl (P4) and20.2 µl (R4) at 23 mm radial offset, respectively. This is afact of the more pronounced DOI or parallax effect.
745
European Journal of Nuclear Medicine and Molecular Imaging Vol. 30, No. 5, May 2003
Fig. 12. 18F image of a rat
Fig. 13. FDG brain image of arat
Fig. 14. FDG brain image of acat

The sensitivity of the R4 system for a centered pointsource and an energy window of 410–613 keV, whichcorresponds to ±20% of the 511 keV peak, is around60% higher than for the P4 system. This is due to thegreater solid angle of the P4 system.
The solid angle Ω can be calculated from:
(5)
where A is the axial extension of the detector rings(78 mm for both models) and D is the ring diameter.With a ring diameter of 148 mm for the R4 and 260 mmfor the P4 model, the expected increase in sensitivity is62%, which is in good accordance with the measuredvalue.
For an energy window of 350–650 keV the increasein sensitivity is around 71%, and for an open energywindow of 250–750 keV it is around 94%.
The NECR measurements can only be comparedqualitatively with the values stated in [7]. For the ratphantom the NECR show similar peak values but the P4NECR peak is reached at twice the activity amount com-pared with the R4 system. For the mouse phantom the P4NECR peak is also reached at twice the activity level ofthe R4 system but the peak value is 66% higher. Theseresults are expected from simulations considering the ef-fects of different scanner geometries on the count rateperformance [18, 19, 20]: the smaller ring diameter ofthe microPET R4 increases the trues but also the ran-doms and scattered event rates and leads to a higher sin-gles flux, changing the dead time of the detectors. In ad-dition, several other factors may contribute to this differ-ence: The P4 model has 168 detector blocks for two DHIboards and one coincidence controller, whereas the R4model has only 96 detector blocks for the same electron-ics. Therefore the overall data throughput will be differ-ent. Also the measurements for the P4 system were donewith a 4 ns wider timing window compared with themeasurements for this work, and the differences in phan-tom dimensions result in different scatter values, contri-butions from out-of-FOV activity, and randoms countrates.
Discussion
Performance parameters for the microPET R4 scannerwere evaluated. The scanner shows a high resolution inthe central part of the FOV with a volumetric resolutionbelow 15.6 µl within the inner 20 mm of the FOV. Thesensitivity is 43.66 cps/kBq for an open energy windowof 250–750 keV and 24.48 cps/kBq for an energy win-dow of 350–650 keV. The maximal NECR is reached at174 kcps @696 kBq/ml for the mouse phantom, mea-sured with an energy window of 250–750 keV, and 94 kcps @222 kBq/ml (89 kcps @298 kBq/ml) for therat phantom, measured with an energy window of250–750 keV (350–750 keV).
A study of the high-resolution phantom demonstratesthe good resolution in the inner part but also the loss inimage resolution towards the edges of the FOV with thecurrently used FORE+2D-FBP reconstruction algorithm.To overcome the degradation effects resulting from thisreconstruction scheme, the implementation of a fully 3D-OSEM reconstruction is under investigation. With that afurther improvement in resolution could be expected, es-pecially at greater radial offsets from the axis. However,the images of mice and rat studies as well as first catbrain studies (Figs. 11, 12, 13, 14) show the high infor-mation content of the microPET R4 images for molecu-lar imaging and cancer research.
The absence of an evaluation standard for animal PETscanners led to problems in comparing the R4 and P4models because of differences in point source and phan-tom dimensions. Therefore, an accepted evaluation stan-dard would help to make performance results from dif-ferent animal PET scanners more comparable [21].
The system is user friendly and easy to maintain. Thescanner hardware was stable over the period of this workand only one read-out board had to be exchanged due tofailure. Detector setup can be performed within less than1 day and scanner control is easy to handle with the pro-vided software packages. In addition, data processing isstraightforward and fast: histogramming into sinogramdata sets – even for long list mode data sets of severalGBs – is in the range of minutes and reconstruction of a256×256 image requires only seconds.
With the described performance parameters and theflexibility of the system, the microPET R4 is a suitablescanner for small animals, especially for laboratorieswith little or no access to clinical high-resolution PETscanners.
References
1. Cherry SR, Shao Y, Silverman RW, Meadors K, Siegel S,Chatziioannou A, Young JW, Jones W, Moyers JC, Newport D, Boutefnouchet A, Farquhar TH, Andreaco M,Paulus MJ, Binkley DM, Nutt R, Phelps ME. MicroPET: ahigh resolution PET scanner for imaging small animals. IEEETrans Nucl Sci 1997; 44:1161–1166.
2. Myers R. The biological application of small animal PET im-aging. Nucl Med Biol 2001; 28:585–593.
3. Chatziioannou AF. Molecular imaging of small animals withdedicated PET tomographs. Eur J Nucl Med 2002; 29:98–114.
4. Wienhard K, Schmand M, Casey ME, Baker K, Bao J, Eriksson L, Jones WF, Knoess C, Lenox M, Lercher M, Luk P,Michel C, Reed JH, Richerzhagen N, Treffert J, Vollmar S,Young J, Heiss WD, Nutt R. The ECAT HRRT: performanceand first clinical application of the new high resolution re-search tomograph. IEEE Trans Nucl Sci 2002; 49:104–110.
5. Heiss WD, Winkeler A, Dittmar C, Knoess C, Hartung M,Richter R, Graf R, Wienhard K, Jacobs AH. High-resolutionimaging of gene expression by positron emission tomography.J Nucl Med 2002; 43:68P.
746
European Journal of Nuclear Medicine and Molecular Imaging Vol. 30, No. 5, May 2003
6. Jacobs AH, Hartung M, Dittmar C, Knoess C, Winkeler A,Richter R, Graf R, Wienhard K, Heiss WD. Identification oftarget tissue for gene therapy by multi-tracer PET-imaging. J Nucl Med 2002; 43:25P–26P.
7. Tai YC, Chatziioannou A, Siegel S, Young J, Newport D,Goble RN, Nutt RE, Cherry SR. Performance evaluation of themicroPET P4: a PET system dedicated to animal imaging.Phys Med Biol 2001; 46:1845–1862.
8. Melcher CL and Schweitzer JS. Cerium-doped lutetium oxyor-thosilicate: a fast, efficient new scintillator. IEEE Trans NuclSci 1992; 39:502–505.
9. Siegel S, Eriksson M, Eriksson L, Casey M, Nutt R. An alter-native to polishing the surfaces of scintillation detectors. Con-ference Records IEEE Nuclear Science Symposium and Medi-cal Imaging Conference Seattle, Washington, 24–30 Oct.1999. Piscataway, N.J.: IEEE, 1999.
10. Concorde Microsystems Inc. microPET ManagerTM userguide. Rev. 0, Dec 2001.
11. Concorde Microsystems Inc. ASIPro Version 3.0, Acquisition,Sinogram and Image Processing. 2002.
12. Daube-Witherspoon ME, Muehllehner G. Treatment of axialdata in three-dimensional PET. J Nucl Med 1997; 28:1717–1724.
13. Defrise M, Kinahan PE, Townsend DW, Michel C, SibomanaM, Newport D. Exact and approximate rebinning algorithmsfor 3-D PET data. IEEE Trans Med Imag 1997; 16:145–158.
14. NEMA Standards Publication NU 2–2001. Performance mea-surements of positron emission tomographs. National Electri-cal Manufacturers Association.
15. Bailey DL, Jones T, Spinks TJ. A method for measuring theabsolute sensitivity of positron emission tomographic scan-ners. Eur J Nucl Med 1991; 18:374–379.
16. Michel C, Liu X, Sanabria S, Lonneux M, Sibomana M,Bol A, Comtat C, Kinahan PE, Townsend DW, Defrise M.Weighted schemes applied to 3D-OSEM reconstruction inPET. Conference Records IEEE Nuclear Science Symposiumand Medical Imaging Seattle, Washington, 24–30 Oct. 1999.Piscataway, N.J.: IEEE, 1999.
17. Moses WW, Derenzo SE. Empirical observation of resolutiondegradation in positron emission tomographs utilizing blockdetectors. J Nucl Med 1993; 34:101P.
18. Badawi RD, Kohlmyer SG, Harrison RL, Vannoy SD, Lewellen TK. The effect of camera geometry on flux, scatterfraction and trues and randoms sensitivity for cylindrical 3DPET – a simulation study. IEEE Trans Nucl Sci 2000; 47:1228–1232.
19. Kitamura K, Murayama H. Count rate performance simulationsfor next generation 3D PET scanners. Proceedings of the NinthEGS4 Users’ Meeting in Japan. KEK Proc 2001; 22:108–114.
20. Dahlbom M, Eriksson L, Wienhard K. Design study of future3-D PET systems. Conference Records IEEE Nuclear ScienceSymposium and Medical Imaging 1994. Piscataway, N.J.:IEEE, 1994.
21. Weber S, Bruyndonckx, Chatziioannou AF, Clark JC, Daube-Witherspoon ME, Di Domenico G, Zavattini G, Honer M,Huber J, Karp JS, Laforest R, Muehllehner G, Pichler BJ, Seidel J, Siegel S, Spinks T, Tai YC, Vaquero JJ. Performancemeasurements of small animal positron emission tomographs.J Nucl Med 2002; 43:59P.
747
European Journal of Nuclear Medicine and Molecular Imaging Vol. 30, No. 5, May 2003