Evidence for competition in small rodents
12
FORUM FORUM FORUM FORUM is intended to facilitate communication between reader and author and reader and reader. Comments, viewpoints or suggestions caused.by speculative controversial papers are welcome. Discussion about important issues in ecology, e.g. theory or terminology may also be included. Contributions should be as concise as possible. A summary introducing the topic and summarizing the argument may be included. Reference should be made only to work basic to the topic. A lighter prose, designed to att¡act readers, will be permitted. Formal research reports, albeit short, will not be accepted. Ed. Evidence for compeütion in small rodents Carlos Galindo and Charles J. Krebs, Inst. of Animal Resource Ecology, Univ. of British Columbia, Vancouver, 8.C., Canada V6T lws Summary. Many studies of interspecific competition in small rodent communities suffer from methodological shortcomings. They may have been done in small enclosures less than one home range in size or have lacked replication and proper con- trols. We cannot yet determine how important interspecific competition is in small rodent community organization. Reviews play a major role in the development of a field. Throughout the last ten years a variety of general re- views about interspecific competition has appeared in the literature (Connell t975, 1.983, Diamond 1978, Birch 1979, Lawton and Strong 1981, Schoener 1982, 1983, Simberloff 1982). One outstanding feature of these reviews is the difference between the sets of evi- dence included to emphasize the relevance or irrel- evance of competition in nature. To a certain extent the selection of evidence depends on which side of the con- troversy the reviewers have been working. More impor- tant, though, is that the evidence presented is selected according to their different scientific standards' one ecologist's evidence is another's fairy tale. The general trend of these reviews is to include re- search done with more rigorous experimental designs that include replicates and contemporaneous controls, and to discard simple post hoc explanations. Unfor- tunately, the trend is not consistent: some reviews dis- miss or omit important articles that contradict the evi- dence or give alternative explanations, others include articles that have been severely criticized before. An ex- ample of the first error is the weakness of natural niche shifts and character displacement as evidence for com- petition. .This has been criticized (Grant 1972a, 1978, Connell 1975) because of the lack of controls and there- fore the variety of alternative explanations that account 116 for the same patterns, but these examples continue be- ing used as evidence in favor of competitive interactions (Diamond 1978, 1983). An example of the second error is the Koplin and Hoffmann (1968) study of Microtus montanus and M. pennsylvanicus. This study has been criticized in earlier reviews (Grant 1972b , Co¡nell 197 5 , Birch 1979) as an inadequate test of the competition hy- pothesis, because of differences in densities and condi- tions of the plots. The experimental plot in this study was fenced and not grazedby bison and had 4 to 5 times more animals than the control. In spite of such criticism this study is continually used as evidence for competi- tion among voles (Schoener 1982, 1983). Connell (1983) pointed out that because of the status of experimental evidence in ecology, people tend to ac- cept the conclusio4s of experimental studies uncriti- cally. We agree with him and feel that the conclusion drawn from the 18 studies selected in Schoener's review (1983) misrepresents the state of the art in small mam- mal research. This author seems oblivious of the many methodological shortcomings in his selection of studies on competition among rodents (mice). One-third (6 of 18) of the studies used by Schoener (1983) were done in small enclosures or exclosures (Grant 1969,I97L,Mor- ris and Grant 1972, Hoffmeyer 1973, Price 1978, Mun- ger and Brown 1981). In all but one study (Munger and Brown 1981) the resident population was trapped out and individuals caught somewhere else and kept in cap- tivity for different periods of time were introduced into the enclosure. Once there, the animals were exposed to a novel environment and unknown individuals. Their movements were highly restricted. In most cases the home ranges of the individuals introduced were larger than the enclosures. For example, the home range of deer mice (Peromyscus maniculatus) ranges for 0.28 to L.89 hectares (Blair 1940, Eisenberg 1981, Taitt 1981). Yet Grant (1971) used enclosures of only 0.4 ha. The OIKOS 46:1 (1986)
Transcript of Evidence for competition in small rodents
FORUMFORUM
FORUM
FORUM is intended to facilitate communication between reader and author and reader andreader. Comments, viewpoints or suggestions caused.by speculative controversial papers arewelcome. Discussion about important issues in ecology, e.g. theory or terminology may alsobe included. Contributions should be as concise as possible. A summary introducing thetopic and summarizing the argument may be included. Reference should be made only towork basic to the topic. A lighter prose, designed to att¡act readers, will be permitted.Formal research reports, albeit short, will not be accepted.
Ed.
Evidence for compeütion in small rodents
Carlos Galindo and Charles J. Krebs, Inst. of Animal Resource Ecology, Univ. of British Columbia, Vancouver,8.C., Canada V6T lws
Summary. Many studies of interspecific competition in smallrodent communities suffer from methodological shortcomings.They may have been done in small enclosures less than onehome range in size or have lacked replication and proper con-trols. We cannot yet determine how important interspecificcompetition is in small rodent community organization.
Reviews play a major role in the development of a field.Throughout the last ten years a variety of general re-views about interspecific competition has appeared inthe literature (Connell t975, 1.983, Diamond 1978,Birch 1979, Lawton and Strong 1981, Schoener 1982,1983, Simberloff 1982). One outstanding feature ofthese reviews is the difference between the sets of evi-dence included to emphasize the relevance or irrel-evance of competition in nature. To a certain extent theselection of evidence depends on which side of the con-troversy the reviewers have been working. More impor-tant, though, is that the evidence presented is selectedaccording to their different scientific standards' oneecologist's evidence is another's fairy tale.
The general trend of these reviews is to include re-search done with more rigorous experimental designsthat include replicates and contemporaneous controls,and to discard simple post hoc explanations. Unfor-tunately, the trend is not consistent: some reviews dis-miss or omit important articles that contradict the evi-dence or give alternative explanations, others includearticles that have been severely criticized before. An ex-ample of the first error is the weakness of natural nicheshifts and character displacement as evidence for com-petition. .This has been criticized (Grant 1972a, 1978,Connell 1975) because of the lack of controls and there-fore the variety of alternative explanations that account
116
for the same patterns, but these examples continue be-ing used as evidence in favor of competitive interactions(Diamond 1978, 1983). An example of the second erroris the Koplin and Hoffmann (1968) study of Microtusmontanus and M. pennsylvanicus. This study has beencriticized in earlier reviews (Grant 1972b , Co¡nell 197 5 ,
Birch 1979) as an inadequate test of the competition hy-pothesis, because of differences in densities and condi-tions of the plots. The experimental plot in this studywas fenced and not grazedby bison and had 4 to 5 timesmore animals than the control. In spite of such criticismthis study is continually used as evidence for competi-tion among voles (Schoener 1982, 1983).
Connell (1983) pointed out that because of the statusof experimental evidence in ecology, people tend to ac-cept the conclusio4s of experimental studies uncriti-cally. We agree with him and feel that the conclusiondrawn from the 18 studies selected in Schoener's review(1983) misrepresents the state of the art in small mam-mal research. This author seems oblivious of the manymethodological shortcomings in his selection of studieson competition among rodents (mice). One-third (6 of18) of the studies used by Schoener (1983) were done insmall enclosures or exclosures (Grant 1969,I97L,Mor-ris and Grant 1972, Hoffmeyer 1973, Price 1978, Mun-ger and Brown 1981). In all but one study (Munger andBrown 1981) the resident population was trapped outand individuals caught somewhere else and kept in cap-tivity for different periods of time were introduced intothe enclosure. Once there, the animals were exposed toa novel environment and unknown individuals. Theirmovements were highly restricted. In most cases thehome ranges of the individuals introduced were largerthan the enclosures. For example, the home range ofdeer mice (Peromyscus maniculatus) ranges for 0.28 toL.89 hectares (Blair 1940, Eisenberg 1981, Taitt 1981).Yet Grant (1971) used enclosures of only 0.4 ha. The
OIKOS 46:1 (1986)
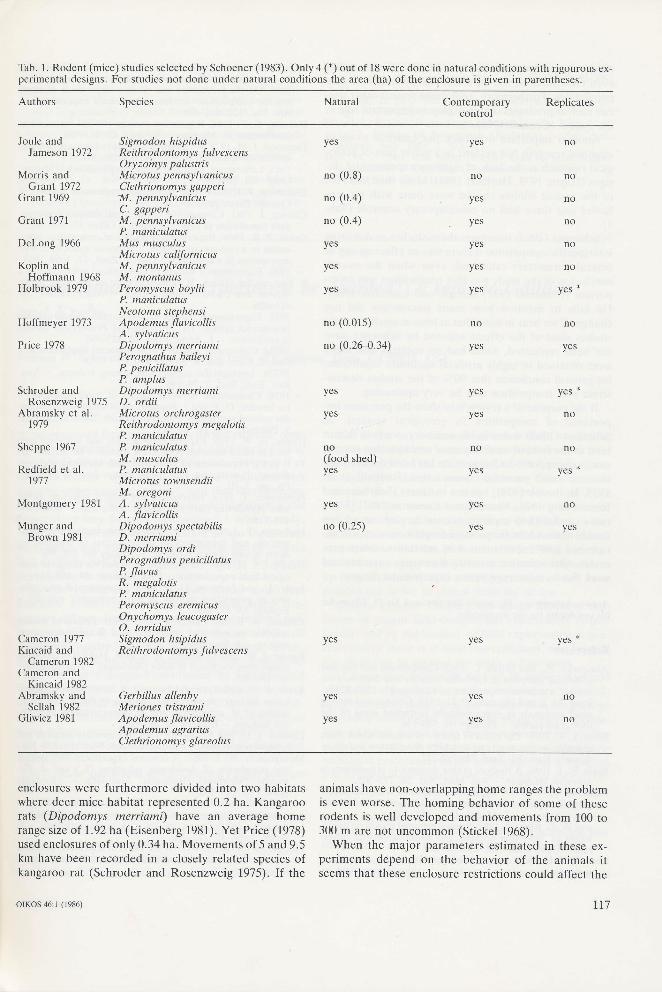
Táb. 1. Rodent (mice) studies selected by Schoener (1983). Only a (*) out of 18 were done in natural conditions with rigourous ex-perimental designs. For studies not done under natural conditions the area (ha) of the enclosure is given in parentheses.
Authors Species Natural Contemporarycontrol
Replicates
Joule andJameson 7972
Morris andGranf 1972
Grant 1969
Grant 1971
Delong 1966
Koplin andHoffmann 1968
Holbrook 1979
Hoffmeyer 1973
Price 1978
Schroder andRosenzweig 1975
Abramsky et al.1979
Sheppe 1967
Redfield et al.1977
Montgomery 1981
Munger andBrown 1981
Cameron 1977Kincaid and
Cameron 1982Cameron and
Kincaid 1982Abramsky and
Sellah 1982Gliwicz 1981
Sigmodon híspidusReithrQ donto my s fulv escensOryzoinys palwtisM icrotus pennsy lvanicusClethrionomys gapperiM. pennsylvanicusC. gapperiM. pennsylvanicusP. maniculatusMus musculusMicrotus californicusM. pqnnsylvanicusM. montanusPeromyscus boyliiP. maniculatusNeotoma stephensiApodemus flavicollkA. sylvaticusDipodomys merriamiPerognathus baileyiP. penicillatusP. amplusDipodomys merríamiD. ordiiMicrotus orchrogasterReithrodontomys megalotisP. maniculatusP. maniculatusM. musculusP. maniculatusMicrotus townsendiiM. oregoniA. sylvaticusA. flavicollisDipodomys spectabilisD. merriamiDipodomys ordiPerognathus penicillatusP. flavusR. megalotisP. maniculatusPeromyscus eremicusOnychomys leucogasterO. torridusSigmodon hsipidusReithro do ntomy s fulv es ce ns
Gerbillus allenbyMeriones tristramiApodemus flavicollisApodemus agrariusClethrionomys glareolus
yes
no (0.8)
no (0.4)
no (0.4)
yes
yes
yes
no (0.015)
no (0.26{.34)
no(food shed)yes
yes
no (0.25)
yes
yes
no
yes
yes
yes
yes
yes
no
yes
no
no
no
no
no
yes
yes
yes
yes
no
yes
no
no
yes
yes
yes
yes
yes
no
yes
no
yes
yes *
yes *
no
no
yes *
yes *
yes
yes
enclosures were furthermore divided into two habitatswhere deer mice habitat represented 0.2 ha. Kangaroorats (Dipodomys merrinml) have an average homerange size of 1.92 ha (Eisenberg 1981). Yet Price (1978)used enclosures of only 0.34 ha. Movements of 5 and 9.5km have been recorded in a closely related species ofkangaroo rat (Schroder and Rosenzweig 1975). If the
OIKOS 46:1 (1986)
animals have non-overlapping home ranges the problemis even worse. The homing behavior of some of theserodents is well developed and movements from 100 to300 m are not uncommon (Stickel 1968).
When the major parameters estimated in these ex-periments depend on the behavior of the animals itseems that these enclosure restrictions could affect the
117

results significantly. Krebs et al. (1969) have shown that
even enclosures of 0.8 ha affect the dynamics of vole
populations. Furthermore, enclosures restrict other spe-
cies such as predators that may play an important role inthe system (Connell 1975).
Another important drawback not endemic to small
mammal research but evident in a major part of ecolo-gical research is the lack of rigorous experimental de-
signs (Hayne 1978, Hurlbert 1984). More than half (10)
of the rodent studies chosen were done with no rep-
licates and three had no contemporary controls (Thb.
1).Schoener (1983) interprets these studies as detecting
interspecific competition if there was an effect on any ofseveral parameters estimated, even when the overallconclusion of the study was that competition was unim-portant (Cameron 1977, Kincaid and Cameron 1982).
He fails to mention how many parameters did notchange. If we bear in mind that at least in small mammal
studies most of the effects selected by Schoener have
not been replicated, some had no controls and many
were obtained in highly artificial enclosure conditions'his general conclusion that 90% of the studies demon-
strate som competition may be very misleading.If the purpose of a review is to show the pervasive im-
portance of competition in ecological systems' as
Schoener (1983) states in his summary, we find that at
least in the field of small mammal research that conclu-
sion is unsupported. Competition has been documented
in some small mammal communities (Redfield et al.
1977, Holbrook 1979), but not in others (Schroder and
Rosenzweig 1975, Kincaid and Cameron 1982). IJntilmore careful field experiments are carried out we can
decide neither how frequently competition occurs in na-
ture nor how important it is in relation to other pro-
cesses. Our intention is not to discourage experimentalwork but to encourage better experimental disigns.
Acknowledgement - We would like to thank Dr D. Chitty forhis comments on the manuscript.
References
Abramsky, 2., and Sellah, C. 1982. Competition-and.the roleof habitat selection in Gerbillus allenbyi and Meriones tri-strami : a removal experiment. - Ecology 63: 1242-1247 '
- Dyer, M. L and Harrison, P. D. 1979. Competition amongsmall mammals in experimentally perturbed areas of theshortgrass paririe. - Ecology 60: 530-536.
girch, L]C. 1979. The effect of species of animals which share
common resoufces on one another's distribution and abun-dance. - Fortschr. Zool.25: 197221.
Blair, W. F. 1940. A study of prairie deermouse populations insoulhern Michigan. --Am. Midl. Nat. 24: 273-305.
Cameron, G. N. 1-977. Experimental species removal: demo-graphic responses by Sigmodon hispidus,and Reithrodonto'myi futveséens. - J. Mammal. 58: 488-506.
- ai¿ W. B. Kincaid. 1982. Species removal effects on move-ments of Sigmodon hispidus and Reithrodontomys fulves-cens. - Arn. Midl. Nat. 108: 60-67.
Connell, J. H. 1975. Some mechanisms producing structure innatural communities: a model and evidence from field ex-
118
periments. - In: Cody, M. L. and Diamond, J. M. (eds'),écology and evolution of communities, pp. 460-490.
- 1983. On the preválence and relative importance of inter-specific competition: evidence from field experiments. -Am. Nat. 122:661-696.
Delong, K. T. 1966. Population ecology of feral house mice:interference loy Microtus. - Ecology 47: 481484.
Diamond, J. M. 1978. Niche shifts and the rediscovery of inter-specific competition. - Am. Sci. 66:322-33L.
- 1983. Laboratory, field and natural experiments. - Nature,Lond. 304: 58G587.
Eisenberg, J. F. 1981. The mammalian radiations. - Univ. ofChicago Press, pp. 210-229.
Gliwicz, J. 1981. Competitive interactions within a forest ro-dent community in central Poland. - Oikos 37: 353-362.
Grant, P. R. 1969. Experimental studies of competitive inter-action in a two-species system. I Microtus and Clethriono-rnys species in enclosures. - Can. J. Zool. 47: 1059*1082.
- 1970. Experimental studies of competitive interaction in a
two-species system. II. The behaviour of Microtus, Pero'myscus and Clethrionomys species. - Anim. Behav. L8:
41t426.1971. Experimental studies of competitive interaction in a
two-species system. III. Microtus and Peromyscus specíesin enclosures. - J. Anim. Ecol. 40: 323-350.1972a. Convergent and divergent character displacement. -Biol. J. Linn. Soc. 4: 39-68.
- 1972b. Interspecific competition among rodents. - Ann.Rev. Ecol. Syst. 3: 79-106.
- 19'78. Competition between species of small mammals. -In: Snyder, D. P. (ed.), Populations of small mammals un-der nalural conditions, Pymatuning Lab. Ecol. Symp. Vol.5, Pittsburg, PA, pp. 38-51.
Hayne, D. W. 1978. Experimental designs and statistical ana-lyses in small mammal population studies. - In: Snyder, D.P. (ed.), Populations of small mammals under natural con-ditions, Pymatuning Lab. Ecol. Symp. Vol. 5, PittsburgPA, pp. 3-10.
Hoffmeyer, l. 7973. Interaction and habitat selection in themice Apodemus flavicollis and A. sylvaticas. - Oikos 24:108-1 16.
Holbrook, S. J. 1979. Habitat utilization, competitive inter-actions, and coexistence of three species of cricetine ro-dents in east-central Arizone. - Ecology 60:75&-769.
Hurlbert, S. H. 1984. Pseudoreplication and the design of ecol-ogical field experiments. - Ecol. Monogr. 54: 187-211-
Joulé, J., and Jameson, D. L. 1972. Experimental manipula-tion of population density in three sympatric rodents. -Ecology 53: 653-660.
Kincaid, W. B. and Cameron, G. N. 1982. Effects of speciesremoval on resource utilization in a Texas rodent com-munity. - J. Mammal. 63:229-235.
Koplin, J. R., and Hoffmann, R. S. 1968. Habitat overlap andcompetitive exclusion in voles (MiÜotus). - Am. Midl. Nat80: 494-507.
Krebs, C. J., Keller, B. and Thmarin, R. 1969. Microtus poprt'lation biology: demographic changes in fluctuating popu-lations of M. ochrogaster and M. pennsylvanicus in south-ern Indiana. - Ecology 50: 587-607.
Lawton, J. H. and Strong, D. 1981. Community patterns andcompetition in folivorous insects. - Am. Nat' 118: 317-338-
Montgomery, W. I. 1981. A removal experiment with sympa-trió population of Apodemus sylvaticus (L.) and A. fla-ulco&s (Melchoir) (Rodentia: Muridae). - Oecologia(Berl.) 51: 723-132.
Morris, R. D., and Grant, P. R. 1972. Experimental studies ofcompetitive interaction in a two-species system. lY. Micro-¡as ánd Clethrionomys species in a single enclosure' - J.Anim. Ecol. 4l: 275-290.
Munger, J. C., and Brown, J. H. 1981. Competition in desertrodents: an experiment with semipermeable exclosures. -Science 21tr: 5lV5l2.
OIKOS 46:1 (1986)
Price, M. V. 1978. The role of microhabitat in structuring des-ert rodent communities. Ecology 59: 9IV92l.
Redfield, J. A., Krebs, C. J. and Taitt, M. J.1977. Competi-tion between Peromyscus maniculatus and Microtus towns-endii in grasslands of coastal B¡itish Columbia. - J. Anim.Ecol. 46: 607416.
Schoener, T. W. 1982. The controversy over interspecific com-petition. Am. Sci. 70: 586-595.
- 1983. Field experiments on interspecific competition. -Am. Nat. 122:24-285.
Schroder, G. D., and Rosenzweig, M. L. 1975. Perturbationanalysis of competition and overlap in habitat utilizationbetween Dípodomys ordii and Dipodomys merriami. - Oe-cologia (Berl.) l9: 9-28.
Sheppe, W. 1967. Habitat restiction by competitive exclusionin the mice Peromyscus and Mus. - Can. Field-Nat. 8l: 81-98.
Simberloff , D. 1982. The status of competition theory in ecol-ogy. - Ann. Zool. Fennici. 19:241-253.
Stickel, L. F. 1968. Home range and travels. - In: King, J. A.(ed.), Biology of Peromyscus (Rodentia). - Am. Soc.Mamm. Spec. Publ. 2:373411.
Táitt, M. J. 1981. The effect of extra food on small rodentpopulations: 1. Deermice (Peromyscus maniculatus.). - J.Anim. Ecol. 50: 711-124.
"state of the art." Connell included those studies heconsidered valid that were published in 6 journals overthe period 197+1982. In fact, all of the 7 studies fromConnell's journals and years used in my review are alsoincluded in Connells' review (except part of Price[1978], but for noncontemporaneous controls, not forthe shortcoming claimed by Galindo and Krebs). A sec-ond implication is that I have "selected" studies. In fact,as stated several times (Schoener 1983, 1985), I tried tobe exhaustive. Apparently I was relatively successful, asup to now only 4 studies meeting my criteria have beenpointed out to me as absent from my review.
General criteria. Galindo and Krebs list three crit-icisms of rodent field-competition experiments in par-ticular, and by implication, of field experiments in gen-eral; one of these is at least two criticisms, and I wouldlike therefore to arrange my reply in four parts.
l) Enclosures too small. In 6 of 18 studies, Galindoand Krebs argue that the enclosures used are too small;in all but one ofthese, they are smaller than the averageindividual home-range area of the manipulated species.This criticism would seem more interesting for studiestesting for a density effect than those testing for effectson habitat preference. In the latter case, one almost hasa behavioral experiment in the field, and virtually all be-havioral experiments on terrestrial vertebrates would beinvalid were their spatial requirement adhered to them-selves. Indeed, most of the 6 experiments faulted focuson habitat preferences. While it is more plausible thatconclusions about population density are called intoquestion when enclosures are very small, Galindo andKrebs give no argument for this, and one must ask how
when should a field experiment be counted?: a reply to Galindoand Krebs
Thomas W. Schoener, Dept. of Zoology, (Jniv. of Caffirnia, Davis, CA 95616, USA
In my review of field experiments on interspecific com-petition (Schoener 1983), 18 of 164 studies were of smallrodents. Galindo and Krebs (1986) claim that only 4 ofthese 18 studies "were done in natural conditions withrigorous experimental designs", and that therefore myconclusion "that 90'A of the studies demonstrate somecompetition may be very misleading." I offer a reply,first, to two specific claims which are at best themselvesmisleading, and second, to the general set of criteriathat Galindo and Krebs argue as necessary for an ex-periment to be counted in a review.
Specific claims. 1) Galindo and Krebs write thatSchoener (1983) "fails to mention how many par-ameters did not change" as a result of experimental per-turbation. This is false. In Tab. 1 (Schoener 1983), allparameters (under "effects") that did not change are en-closed in brackets. For example in the studies byCameron and colleagues mentioned by Galindo andKrebs, I noted that habitat use but not density or fooduse was affected, and that only 1 of 2 species was af-fected. It is correct that I did not weight studies by howmany effects were found, but this is a different issue(see Schoener 1985) and not the claim of Galindo andK¡ebs.
2) Galindo and Krebs write "Connell (1983) pointedout that because of the status of experimental evidencein ecology, people tend to accept the conclusions of ex-perimental studies uncritically. We agree with him andfeel that the conclusion drawn from the 18 studies se-lected in Schoener's review (1983) misrepresents thestate of the art in small mammal research." The implica-tion is that Connell (1983) has not misrepresented the
OIKOS 46:1 (1986) 119

such experiments would "misrepresent" (to use theirterminology) the importance of competition, especiallyin animals whose home ranges overlap a good deal inthe field. Of course, if unnaturally high densities areused, this could misrepresent competition, but Galindoand Krebs do not argue this for experiments faulted forenclosure size. (In a previous paragraph, they do arguethat differences in densities between experimental and .
control plots invalidate the Koplin-Hoffman [1968]study, but they do not say how.) Finally, one must com-prehend just how large enclosures must be in order tobe several times the area of individual home ranges.Munger and Brown (1981), for example, built 8 50 x 50m enclosures, a gargantuan labor, yet still consideredtoo small by Galindo and Krebs. Given the constraintsof seasonality, time and money, field experiments arenecessarily less-than-ideal compromises, and enclosuresize may be a reasonable place to make such a compro-mise.
Galindo and Krebs's more general implication, thatenclosures are usually not "natural", may certainly of-ten be true, yet they do serve the very important func-tion of keeping things in and, especially, out. When re-movals scarcely keep up with invasions, enclosureswould seem desirable. For example, the recently pub-lished experiment on voles by Galindo and Krebs (1985)does not use enclosures; the species to be removed wastrapped two nights every two weeks. Nonetheless, ex-cept for the last, the number removed in successive ses-sions remained about the same or even rose (their Fig.3), and the difference between the control and removalplot was not large in 5 of the 7 census periods; in the sec-ond-to-last, the "removal" plot actually had more ani-mals (their Fig. 6)! Their study concludes no competi-tion, but of course a more complete removal might havemade a difference.
2) Enclosures stocked with nonresident animals. Asecond criticism of enclosure experiments, applicable to5 of the 6 above-mentioned studies, is that resident indi-viduals were removed and nonresident individualsadded. In my view, this is generally the more desirableway to do enclosure experiments on many kinds of ani-mals, particularly vertebrates. In introduction experi-ments, residency gives a major advantage to the testspecies, whose individuals are already established intheir home ranges and thereby benefit from site famil-iarity. Not removing residents could reduce the like-lihood of detecting competition. Moreover, construc-tion of enclosures can cause much disturbance, drivingresident individuals away, so that stocking may be theonly option.
3) Controls not contemporaneous. Three studies areclaimed by Galindo and Krebs not to have contempo-raneous controls. One of these, that of Sheppe (1967),while not as clearly presented as it could be, appears tome to have contemporaneous controls (the Peromyscus-Mus manipulation, not the Peromyscus-Peromyscusmanipulation, which I did not use). Tiaps were set in-
120
side and outside the removal area during the experi-ment, and the same individuals of the test species werecaught in both areas at different times. Were the testspecies to have increased in the non-removal area, as itdid in the removal area, this surely would have beennoted by the investigator. A second experiment, that ofHoffmeyer (1973), is an experiment in behavioral timethat has sessions conducted back-to-back over a totalperiod of at most two months. Controls are not simulta-neous, but they are so nearly so that one is taxed toimagine how the experiment could have gone awry onthis basis. The third qtudy, that of Morris and Grant(1,972), compares manipulations from different years. Iagree that this procedure is very undesirable, and on re-flection now feel that I should not have included thisstudy in my review. In the authors' defense, however,they do point out the inadequacy of their controls. Al-though not noted by Galindo and Krebs, some of Price's(1978) experiments also lack contemporaneous con-trols, but I consider these in the same category as theHoffmeyer experiments and believe their inclusion iswarranted.
4) No replícation. Galindo and Krebs find 12 studieswithout replication, that is, with at most one plot pertype of experimental treatment and one control plot foreach type of treatment. I agree that the 12 studies citedhave no replication in this sense; moreover, the study ofHolbrook (1979), cited as having replication, in factdoes not if one requires in addition contemporaneouscontrols.
In some of these unreplicated studies, the authors areable to do statistics, nonetheless. For example, a com-mon comparison is to divide the experimental and con-trol plot into two habitat types, then do a 2 x 2 chi-square test on the number of individuals in each habitatfor each plot. Another technique is to compute a meanand standard deviation of some characteristic (e.g.,weight, number of éggs) using each individual as a sam-ple point, then compare plots in the usual way. As Hurl-bert (1984) writes, these are variants of pseudoreplica-tion, and they in fact allow statistical comparisons to bemade between particular Plots (say Plots A and B), notbetween kinds of plots (say kinds of treatments). Pseu-doreplication is abundant not only in the rodent liter-ature but is quite common in the field-experimental lit-erature in general (Hurlbert 1984), and it is one of theless sinful variants of assuming independence of datapoints when in fact dependence occurs. Two more sinfulvariants found in the rodent literature are to 1) usenumber of individuals in plots in a chi-square test of ho-mogeneity, and 2) compare regression slopes of cum-ulative number of individuals in a plot against time,where of course points are highly dependent.
Curiously, while Galindo and Krebs (1986) criticizelack of replication, a separate paper by the same au-thors (Galindo and Krebs 1985) reports a field manipu-lation testing for interspecific competition in voles inwhich one experimental and one control plot are used.
OIKOS 46:1 (1986)
Perhaps the authors do not appreciate the distinctionbetween no replication and pseudoreplication, but thisseems belied by their citation of Hurlbert and theirnearly exhaustive ferreting out of lack of proper rep-lication in rodent studies. I may have missed something,but their own field study would appear to fit exactlysome of those they critictze, failing to meet one of theirown crileria for inclusion in a review.
Particulars aside, we might still ask if studies with noreplication or with pseudoreplication serve any purposewhatever, or should they be expunged from the scien-
tific literature? The answer may go something like thefollowing. Studies having replication flaws cannot be
used to conclude that a particular species interaction at
a particular place and time is statistically negative, thatis, with certain probabilities of committing Type I and IIerrors. On the other hand, studies with replication flawscan be used in toto to test hypotheses about competitionon data ensembles of species/situations/times. An exam-
ple would be the following sort of test: how many stud-ies in which a putative competitor is removed show an
increase (relative to the control) in the test species as
opposed to a decrease? A sign test, for example, couldreject the null hypothesis that increases are as likely as
decreases. Use of studies with replication flaws, as inSchoener (1983) and Connell (1983), in which removalexperiments showing competition perforce show an in-crease of the test species, is actually more conservativethan the sign test just suggested. (This is because at least
as many cases conforming to competition will resultfrom the latter as from the former procedure.) Further-more, comparisons of kinds of species with respect towhether or not they show competition are perfectlyvalid provided the existence and degree of replicationhave no biases with respect to the hypotheses beingtested. Each study or experiment or species is beingused as a sample point in the above procedures.
Hence I find it puzzling that Galindo and Krebs claimthat Schoener (1983) "misrepresents the state of the artin small mammal research." Less extreme but still ques-
tionable is their claim that my conclusion on the "impor-tance" of competition is "unsupported." From a logicalviewpoint, the word "importance" was unfortunate, as
what I (and Connell) really did was to look at occur-rence, i.e. frequency of a detectable effect. Of course, Iwould not wish to bet on the side that competition,while occurring frequently, is unimportant most of thetime; occurrence is typically evaluated statistically, and
effect size (Cohen 1977) is part of what determineswhether a null hypothesis is rejected, so that occurrenceand importance (as measured by a substantial effectsize) should be very correlated. With that in mind, we
can actually investigate statistically whether Schoener(1983) misrepresents the "occurrence" of competition
among small rodents. While the 4 studies surviving Ga-lindo and Krebs's filters are characterized by a smallerfraction of species showing competition (50% vs 77%),this difference is not significant (X' : 2.019,2 df). Thustheir claim is not substantiated.
Despite disagreements with Galindo and Krebs onthe above issues, I would like to join them in urging thatinvestigators devote more attention to weeding out ob-vious methodological flaws in future experimental de-signs. No replication or pseudoreplication, or treat-ments far apart in time, are two such flaws. Issues con-cerning the existence and nature of enclosures are moremoot, as I have tried to point out above, and here theinvestigator's judgment about the biology of the organ-isms combined with temporal and funding constraintsmust determine the best procedure. Other flaws, suchas untrustworthy population estimates, or failure tostratify when replicates are non-uniform in habitat orother factors, could also be cited. From such criticismcomes improvement: Rather than dwell on past mis-takes, we must learn from them.
References
Cohen, J. 1977. Statistical power analysis for the behavioralsciences. - Academic Press. New York.
Connell, J. H. 1983. On the prevalence and relative impor-tance of interspecific competition: evidence from field ex-periments. - Am. Nat I22: 661-696.
Galindo, C. and Krebs, C. J. 1985. Habitat use by singing volesand tundra voles in the southern Yukon. - Oecologia(Berl.) 66: 43H36.
- 1986. Evidence for competition in small rodents. - Oikos46: 116-119.
Hoffmeyer, I. 1973. Interaction and habitat selection in themice Apodemus flavicollis and A. sylvatícus. - Oikos 24:108-1 16.
Holbrook, S. J. 1979. Habitat utilization, competitive inter-actions, and coexistence of three species of cricetine ro-dents in east-central Arizona. - Ecology 60:758-769.
Hurlbert, S. H. 1984..Pseudoreplication and the design of ecol-ogical field experiments. - Ecol. Monogr. 54: 187-271.
Koplin, J. R. and Hoffmann, R. S. 1968. Habitat overlap andcompetitive exclusion in voles (Microtus). -Am. Midl. Nat.80: 494-507.
Morris, R. D. and Grant, P. R 1972. Experimental studies ofcompetitive interaction in a two-species system. IY. Micro-f¿s and Clethrionomys species in a single enclosure. - J.Anim. Ecol. 4I: 275-290.
Munger, J. C. and Brown, J. H. 1981. Competition in desertrodents: an experiment with semipermeable exclosures. -Science 211: 51V512.
Price, M. V. 1978. The role of microhabitat in structuringdesert rodent communities. - Ecology 59:910-921-
Schoener, T. W. 1983. Field experiments on interspecific com-petition. - Am. Nat. 122:240-285.
- 1985. Some comments on Connell's and my reviews of fieldexperiments on interspecific competition. - Am. Nat. 125:73G-740.
Sheppe, W. 1967. Habitat restriction by competitive exclusionin the mice Peromyscus and Mus. - Can. Field-Nat. 81: 81-98.
OIKOS 46:1 (19¡t6) 121

Is there a self-thinning rule for animal populntions?
Michael Begon, Leslie Firbank and Richard Wall, Depts of Zoology and Botany (L.F.), Univ' of Liverpool, P.O. Box
147, Liverpool L69 3BX' U'K.
Summary. There is a well established (though imperfectly un-derstood) '-3l2 power rule' for self-thinning in plant popu-
lations, but no comparable rule for animal populations. Here,we search for such a rule applicable to sessile and especially mo-bile animals. Energetics allometries suggest a '-4l3 powerrule', but animal self-thinning is seen to depend on organism-re-source interactions in a way not found in plants, because of thepeculiar nature of light as a resource. Nevertheless, new and en-
iouraging experimental support for a -413 power rule is pre-sented.
and self-thinning occurs; and it is therefore assumed
(though not often established) that this overall increase
eventually ceases because of resource limitation, orstructural or physiological constraints. Total weight then
remains constant (i.e. a'carrying capacity' in the normalsense has been reached), giving an inverse relationshipbetween w and d as time progresses and thus a slope of
-1 on a log-log plot (WestobY 198$.By contrast, there has been very little interest in self-
thinning in animal populations, even though the in-creasing size of animals in growing cohorts must bringabout such self-thinning (and likewise the mortality ofanimals in growing cohorts must affect the growth rates
of those that survive). The effects of competition on
mortality in animals are usually considered independ-ently of the effects on growth. In this note, we ask (a)
whether we should expect a rule of animal self-thinningcomparable to that in plants, (b) whether there is evi-
dence to support or refute any such expectation, and (c)
whether a consideration of animal self-thinning can
teach us anything about plant self-thinning.Many sessile (especially littoral) animals require an
area to capture falling food in much the same way as
plants require an area to capture falling light. Even rela-
tively sessile Erazerc like the limpet, Patella cochlear,
appear to subsist on an approximately constant area offood, since on crowded shores, individuals that remove
food from the rocky substratum provide food of approx-imately the same area on their shells for other indivi-duals living on top'of them (Branch 1975). In such
cases, we might expect animals at sufficiently high den-
sities to show -3l2 self-thinning just like plants. We
know of little evidence with which to test this propo-sition, but certainly in the case of Branch's limpets, the
slope (approximately -0.9) is more suggestive of a bio-mass carrying capacity (-1.0) than of -3l2 self-thin-ning.
Indeed, turning to animals in general, it might be ex-
pected that -1 self-thinning (a constant carrying capac-
ity) is the general rule. However, the following ar-
gument should be considered. It is well established thatthe rate of metabolism in animals tends to be propor-tional to (individual weight)0's (Duncan and Klekowski1975; Peters 1983). The average rate of metabolismwithin a population should therefore be proportional to(mean weight)o t', i.". (w)0 ?5. But the rate of metabolismwithin a population will also be proportional to theaverage amount of food consumed per individual, F/d,where F is the total amount of food consumed and d ispopulation density as before. Thus:
Plant population ecologist have, for the past thirtyyeuts, iho*n considerable interest in the process of self-
thinning, i.e. the reduction in density accompanying
and intéracting with the increasing size of individuals in
a developing cohort or population (Yoda et al- 1963,
Harper 1977). Empiricists have uncovered the so-called
'-312 power rule' of self-thinning, whereby crowded,
even-aged monocultures approach and then track along
a line for which
w:cd t",
where w is the mean dry weight per individual, d is the
population density and c is a constant (Yoda et al'
ilO:¡. an extraordinarily wide range of plant species
have been shown to share not only the -3l2 power (and
thus a slope of -312 on a log-log plot), but also approx-
imately the same value of c (Goreham 1979; White
1e80).Túe theoretical basis for this relationship has proved
difficult to establish precisely (White 1981; Westoby
1984). Mortality is certainly almost inevitable incrowded stands, since the larger plants increasingly
shade their neighbours until the suppressed plants no
longer have access to sufficient light to survive' The sur-
viving plants, however, continue to grow in height and
weigñt. The -312 relationship seems to occur when the
.unópy has achieved its maximum effective leaf area in-
dex, tirrough which it captures light. With this constant
area, there is a (squared)-1 decrease in density accom-
panying a cubic increase of weight because of the al-
iornLtri"t involved, resulting in -312 self-thinning' The
intercept is determined by the biomass density per unitof canópy volume and the height-weight allometries,
which appear to be broadly similar for all plants (Westo-
by 1984; Firbank and Watkinson 1985).-lhe
-312 relationship means that the total weight of
the population steadily increases as the individuals grow
122OIKOS 46:1 (1986)

F/d r ¡ir':s'
(which has itself been established in a number of cases -Peters 1983); and if the amount of food is constant:
W-d 1/3'
or log w : c -413 loe d.
This is similar to an argument used by Peters and Was-senberg (1983), though they were concerned with theeffect of the average weight of different animal specieson the stocking density that could be supported. In thecontext of self-thinning within a population, however,there are two important points to be made. The firstpoint, and the first conclusion of this note, is that -4l3self-thinning is a good candidate for a mobile-animalequivalent of -312 self-thinning in plants. The secondpoint is that this conclusion can only be reached if it isassumed that F, the food (or resource) input to the pop-ulation, remains constant throughout the growth of thecohort. Amongst other things, this means that the popu-lation does not itself alter the resource input, which im-mediately alerts us to the fact thaf -312 self-thinning inplants is itself dependent on the peculiar nature of lightas a resource, i.e. it can be used once and once only, itcannot 'accumuluate', and its input to a population isnot affected by the population itself.
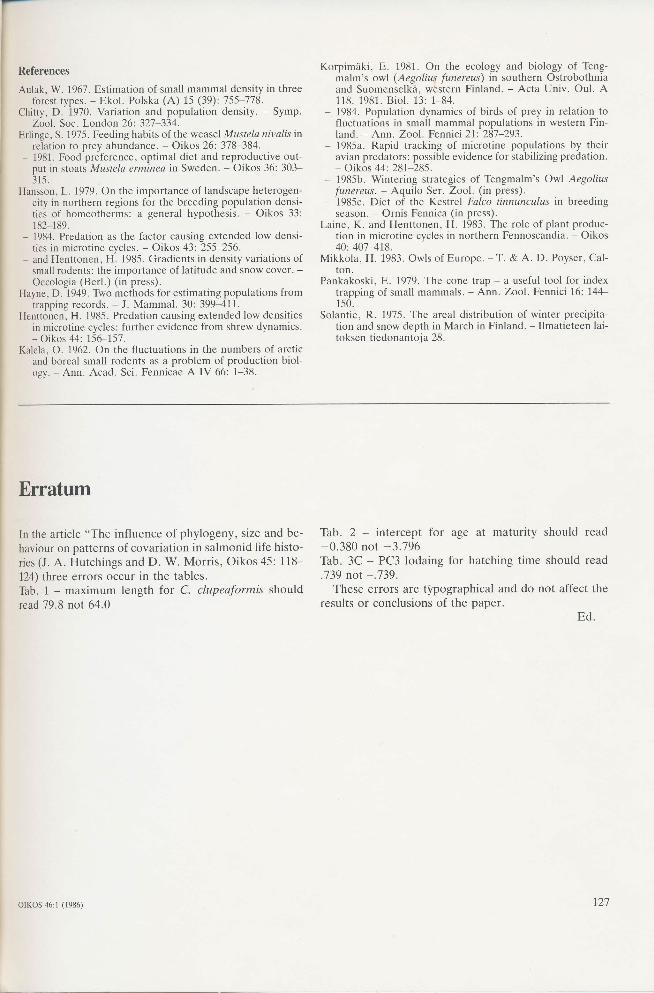
With animals, on the other hand, the constancy of Fis an assumption which is much less likely to be valid.The simplest alternatives to such constancy are set outin Fig. 1. In Fig. 1(a), dF/dt is positive during thegrowth of the cohort, as it would be, for instance, in aseasonal environment where the amount of food in-creases with time as a result of rising temperatures andrising growth rates. This would tend to steepen the self-thinning line to give a slope of less than -413 (-312, -2etc.). In Fig. I (b), dF/dt is negative, as it would be ifconsumption by the population consistently outstrippedfood growth. This would tend to make the slope of theself-thinning line less steep. Furthermore, dF/dt can be
t. I 1.2 t.3 1.4 t.s I .6 1.7LOG DETSITY
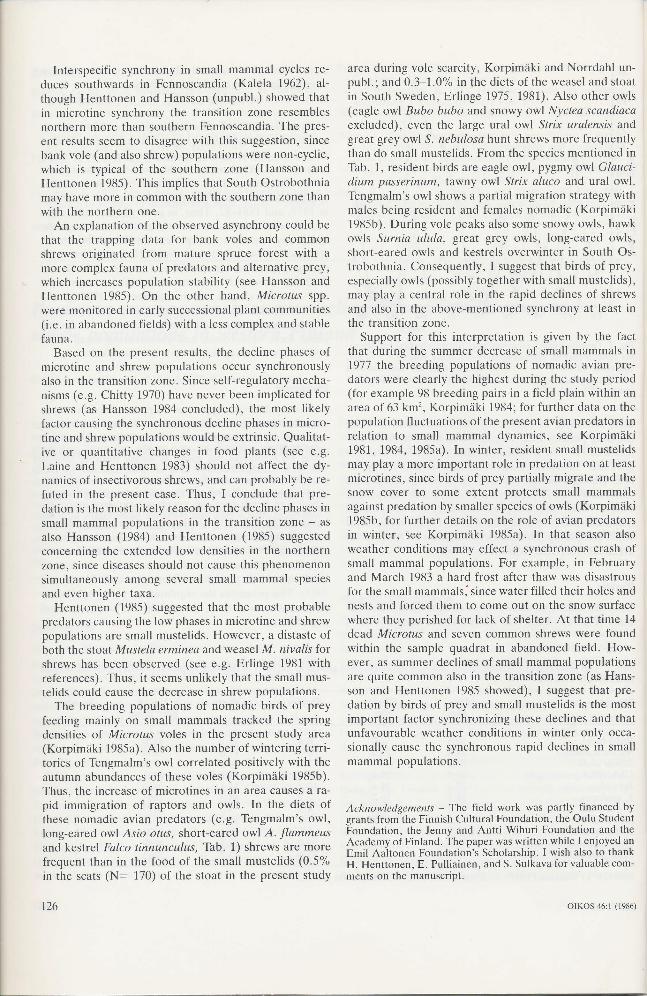
Fig. 2. Sem-thinning in experimental populations of the grass-hopper, Chorthippus brunneus. The slbpes refer to th-e sixpopulations that appear, from their tiajectories, to havereached a self-thinning boundary. The remaining four, unla-belled populations showed no evidence of having ieached sucha boundary. (See text for furthe¡ details).
altered by the behaviour of animal populations as a re-sult of, for instance, migration or territoriality. Overall,we conclude that a self-thinning line for mobile animalswill reflect not only the animals' energetics allometries,but also their interaction with their food resource.
Finally, we consider empirical evidence for a self-thinning relationship in mobile animal populations. Wecan find no relevant evidence in the literature, but pres-ent our own data from laboratory populations of thegrasshopper Chorthippus brunneus, reared from egg-hatch to adult emergence at a range of densities, andgiven a constant amoupt of food of constant qualityevery 48 h (i.e. F is constanr, and -413 self-thinning isto be expected). The results (Fig. 2) are encouraging,though clearly not conclusive. Six populations showedevidence of having approached and then followed a self-thinning line, and had a sufficient number of points onthe line (three or more) for a reduced major axis re-gression slope to be calculated. These slopes rangedfrom -1.58 to -1.03 with a mean of -1.29 (comparedwith the 'expectation' of -1.33). Further data, capableof differentiating statistically between thinning slopes of-7, -413 and -312, are needed to show whether such acorrespondence is merely fortuitous, or can be demon-strated in other populations or other species. Such datawould hopefully establish whether there is indeed a'rule' of self-thinning for cohorts or populations ofgrowing animals.
Acknowledgements -We thank J. White for discussions and forsuggesting some interesting references. The grasshopper datawere obtained by R.W. lhile in receipt oif a NÉitC Stu-dentship.
I
62.=Eoul.
=zt¡l
= t.q
SI¡PES
" -l .18v -l .O3¡ -1.35o -1.58o -1.54o -l .O7
F¡;=zt¡,¡
tJoJ
'\',, *.*
".1'', "'.
\'''..LOGDENSITY
Fig. 1. Self-thinning in animal populations is affected bychanges in the food resource with time, dF/dt. (a) dF/dt is posi-tive and the slope of the self-thinning line is < -413. (b) dF/dtis negative and the slope is > -413.
OIKOS 46:l (1986)
,tr.'.. Í{-ua\ ',, t'
\\"
" \'.tt.\\
r23
References
Branch, G. M. 1975. Intraspecific competition in Patella co-
chlear Born. - J. Anim. Bcol. 44: 263-281'.Duncan, A. and Klekowski, R. Z. 1975. Paramete¡s of an
energy budget. - In: Grodzinski, W., Klekowski, R. Z. and
Dunóán, A. (eds.), Methods for ecological bioenergetics.Blackwell Sci. Publ. , Oxford, pp. 97-14'7rank T. G and Watkinson. A. R. 1985. IFirbank. L. G. and Watkinson, A. R. 1985' A model of inter-ference within plant monocultures - J. theor. Biol. (inpress).
Goieham, E. 1979. Shoot height. weight and standing crop inrelation to density of monospecific plant stands. - Nature'Lond.279: 148-150.
Harper, I. L. 1977. The population biology of plants. - Aca-demic Press, London.
Peters, R. H. 1983. The ecological implications of body srze. -Cambridge Univ. Press, New York.
- and Wassenberg, K.'1983. The effect of body size on animalabundance. - Oecologia (Berl.) 60: 89-96.
Westoby, M. 1984. The self-thinning rule. - Adv. Ecol. Res.14: 167-225.
White, J. 1980. Demographic factors in populations of plants.
- In: Solbrig, O. T. (ed.), Demography and evolution inplant populations. Blackwell Sci. Publ., Oxford, pp.2148.
- 1981. The allometric interpretation of the self{hinningrule. - J. theor. Biol. 89: 475-500.
Yoda, K., Kira, T., Ogawa, H. and Hozumi, H. 1963. Self-thinning in overcrowded pure stands under cultivated andnatural conditions. - J. Biol. Osaka City Univ . 14: 107-129.
funereus, which is an important vole predator in Fen-
noscandian taiga (Korpimáki 1981), Korpimáki (un-publ.) showed that the transition zone extends from thesouthern coast of Finland to 63'N in the western part ofthe country. Hansson's (1984) material from vole and
shrew dynamics was collected in the southern and
northern zones and Henttonen's (1985) data from thenorthern one. In this paper I present long-term trappingdata on small mammals in the transition zone and dis-
cuss the possible reasons affecting the observed pat-terns.
Material and methods
Population fluctuations of small mammals in South Os-
trobothnia (63"N, 23'E), western Finland were studiedin May to early June (spring catches) and in late Augustto early September (autumn catches) between L976 and1984. The habitats were abandoned fields and spruce
forests. Sample quadrats ranged from 0.5 to 1..0 ha, and50-100 Finnish galvanized metal snap traps were set at10 m intervals. The traps were kept in one place for four(sometimes only three) days and were checked once a
day.Pitfall traps are more efficient than snap-traps for col-
lecting shrews (e.g. Aulak 1967, Pankakoski 1979). Al-though the Finnish snap trap is relatively efficient, it is
too robust for the smaller species of shrews. Thus, hereI use only the data on common shrew Sor¿¡ araneus toillustrate the shrew dynamics. This gives a correct pic-ture since in the present study area this species made up80% of all shrews also in pitfall trappings (Korpimákiand Norrdahl unpubl.). My trapping results showed
Predntion causing synchronous decline phases in microtine and
shrew populations in western Finlnnd
Erkki Korpimiiki, kp. 4, SF-62200 Kauhava, Finland
Summary. I show that microtine and shrew populations in west'ern Finland had synchronous decline phases, although the otherpopulation fluctuation phases were not regularly synchronous.The most probable reason in spring and summer is the pre-dation by nomadic birds of prey (which frequently feed onshrews in addition to microtines) and to a smaller extent thepredation by resident small mustelids, since the distaste of these
mammalian predators for shrews has been shown in severalstudies. In winter small mustelids may play a more importantrole than partially migrating birds of prey. Occasionally alsounfavourable weather conditions in winter may affect these syn-chronous declines observed in the transition zone of Fennoscan-dia.
Introduction
Recently Hansson (1984) showed that shrew popula-
tions in northern Sweden had a low synchronously withcyclic microtines and that both microtines and shrews
were non-cyclic in southern Sweden. Moreover, Hent-
tonen (1985) pointed out that the low phases in bothgroups were regularly synchronous in northern Finland'Both authors suggested that predation is the most likelyreason for the synchronous low densities in northernFennoscandia.
When analysing gradients in density variations ofsmall rodents Hansson and Henttonen (1985) dividedFennoscandia into three regions: 1) a southern zone
(from 55" to about 59'N) with quite stable vole popu-
lations, 2) a transition zone (about 59'-61'N) and 3) a
zone north of 61" characterized by pronounced fluctua-tions in microtine populations. Based on the gradients
in population fluctuations of Tengmalm's owl Aegolius
t24 OIKOS 46:l (1986)
9
7
5
o
.9cC\o
o()
!c
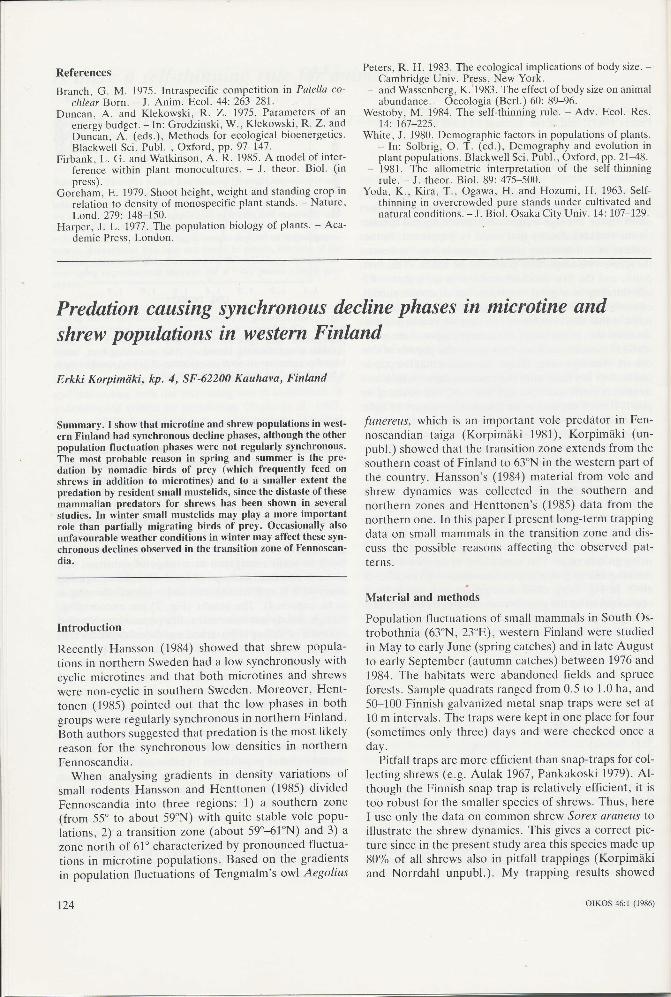
Fig. L Density.indices (trapped ind./100 trap nights) for Micro_tus ogresÍts 3nd M. epiroric{r {( . ). bank vdle (_ _ _ _) and:?TT9" shrew (- ^-'-'-'-) in spring (circles) and autumnruors, rrapprngs tn South Ostrobothnia. western Finland be_tween 1976 and 1984.
that, .according_ to Hayne,s (1949) regression, 3_4_day
trapping periods with snap traps in tñese haúitats col_lected in 7l-93% of available bánk voles Clethrionomysglareolus, 67-90% of Microtus agrestis and M. epiro_lrcus (thought earlier to be M. arvalis, e.g. Korpimáki1984) as well as 79-95% of common shrewi lforplman1981). Thus, snap trapping efficiency for ihese smallmammal species was similar and the data can be usedwhen comparing population fluctuations of these smallmammals (see also Henttonen 19g5).
Results
Only Microtus spp. showed pronounced annual fluctua_tions (Fig. 1). With one exception (in summer 1977)
bank voles had a seasonally fluctuating pattern with lownumbers in spring and high numbersln autumn. Com_mon shrews tended to parallel the clynamics of bankvoles.
Bank vole and, Microtus populations peaked synchro_nously in 1977 and 19g2 (Fig. 1), althóugh there werealso clear differences between the popñlation trends(see above). Common_shre*s showed th" highest peaksin the aurumns of 1976, 1979, and, 19g2. ,{s concernsspring densities, shrew populations were most abundantin 1977, and 1981-82. Thus, in general, also microtinesand shrews tended to fluctuate in parallel, although thesynchrony was not so complete as in the northern zone(Hansson 1984, Hentton"n teAS;. However, the three9":!h: phases (summer 1977 aná winrers tSZg_AO anO1982-83) occurred synchronously both in microtinesand common shrews. In the summer of 1977 all thesmall mammals decreased, although in other summersat least shrews increased clearly. thus, in the declinephase these herbivorous and iniectivoráus small mam_mals seem to be regulated by a common factor.
Discussion
Since-only Microtus spp. showed pronounced between_year fluctuations and the numbei of summer declinesy3s low, my trapping data confirmed the earlier result(Korpimáki, unpubl.) that the study area belongs to thetransition zone despite its quite noithern locati?n. Theprobable reason is that South Ostrobothnia is a flat low_land with relatively mild climate, exceptionally thinsnow cover (maximum snow depth onty:O_:S cm, So_lantie 1975) and with a high próportioÁ ¡+OU¡ of agri_cultural land. which increases habitat heteíogeneity(Hans_son 1979). Allthese environmental conditilns en_sure that a diverse set of alternative prey exist for thelT^u]l T*.al predatcirs (Hansson and Hentronen1985). This promotes the regulation of prey populationsby predation and thus, the stability in sÁált'-ummulpopulations.
82 83Yeors
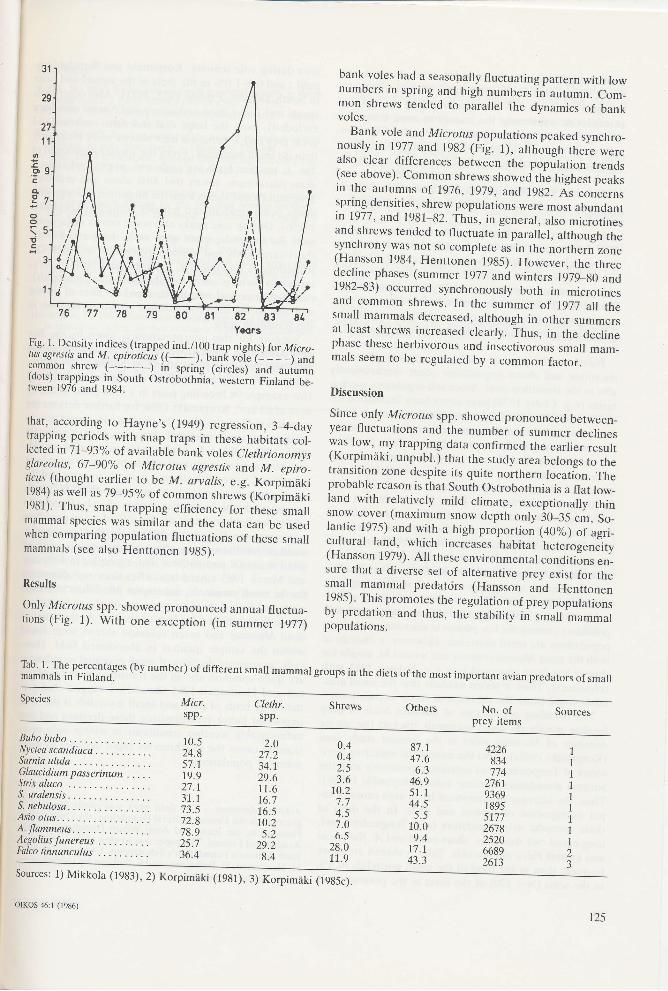
ffil.l5p|fii#:t"t (by number) of different small mammal groups in rhe diets of the most important avian predators of small
Species Micrspp.
Clethrspp.
Shrews Others No. ofprey items
Sources
Bubo buboNyctea scandiaca. .... . .
Surnia ululaGlaucidium passerinum .
10.524.857.119.927.137.173.572.878.925.736.4
2.027.234.129.611.616.716.510.25.2
29.28.4
0.40.42.53.6
10.27.74.57.06.5
28.011.9
87.147.66.3
46.951.144.55.5
10.09.4
17.143.3
4226834774
27619369189s51172678252066892613
Strix alucoS. uralensísS. nebulosaAsio otus... .. . .
A. flammeus-. . .
Aegolius funereusFalco tinnunculus
Sources: 1) Mikkola (1983),2) Korpimáki (1981),3) Korpimáki (19S5c).
OIKOS 46:l (1986)
125
Interspecific synchrony in small mammal cycles re-duces southwards in Fennoscandia (Kalela 1962), al-though Henttonen and Hansson (unpubl.) showed thatin microtine synchrony the transition zone resemblesnorthern more than southern Fennoscandia. The pres-
ent results seem to disagree with this suggestion, sincebank vole (and also shrew) populations were non-cyclic,which is typical of the southern zone (Hansson andHenttonen 1985). This implies that South Ostrobothniamay have more in common with the southern zone thanwith the northern one.
An explanation of the observed asynchrony could bethat the trapping data for bank voles and commonshrews originated from mature spruce forest with a
more complex fauna of predators and alternative prey,which increases population stability (see Hansson andHenttonen 1985). On the other hand, Microttls spp.were monitored in early successional plant communities(i.e. in abandoned fields) with a less complex and stablefauna.
Based on the present results, the decline phases ofmicrotine and shrew populations occur synchronouslyalso in the transition zone. Since self-regulatory mecha-nisms (e.g. Chitty 1970) have never been implicated forshrews (as Hansson 1984 concluded), the most likelyfactor causing the synchronous decline phases in micro-tine and shrew populations would be extrinsic. Qualitat-ive or quantitative changes in food plants (see e.g.Laine and Henttonen 1983) should not affect the dy-namics of insectivorous shrews, and can probably be re-futed in the present case. Thus, I conclude that pre-dation is the most likely reason for the decline phases insmall mammal populations in the transition zone - as
also Hansson (1984) and Henttonen (1985) suggestedconcerning the extended low densities in the northernzone, since diseases should not cause this phenomenonsimultaneously among several small mammal species
and even higher taxa.Henttonen (1985) suggested that the most probable
predators causing the low phases in microtine and shrewpopulations are small mustelids. However, a distaste ofboth the stoat Mustela erminea and weasel M. nivalis forshrews has been observed (see e.g. Erlinge 1981 withreferences). Thus, it seems unlikely that the small mus-
telids could cause the decrease in shrew populations.The breeding populations of nomadic birds of prey
feeding mainly on small mammals tracked the springdensities of Microtus voles in the present study area(Korpimáki 1985a). Also the number of wintering terri-tories of Tengmalm's owl correlated positively with theautumn abundances of these voles (Korpimáki 1985b).Thus. the increase of microtines in an area causes a ra-pid immigration of raptors and owls. In the diets ofthese nomadic avian predators (e.g. Tengmalm's owl,long-eared owl Asio o/ru, short-eared owl A. flammeusand kestrel Falco tinnunculus, Tab. 1) shrews are morefrequent than in the food of the small mustelids (0.5%in the scats (N: 170) of the stoat in the present study
126
area during vole scarcity, Korpimáki and Norrdahl un-publ.; and 0.3-1.0% in the diets of the weasel and stoatin South Sweden, Erlinge 1975, 1981). Also other owls(eagle owl Bubo bubo and snowy owl Nyctea scandiacaexcfuded), even the large ural owl S¡rix uralensis andgreat grey owl S. nebulosa hunt shrews more frequentlythan do small mustelids. From the species mentioned inTáb. 1, resident birds are eagle owl, pygmy owl Glauci-dium passerinum, fawny owl Strix aluco and ural owl.Tengmalm's owl shows a partial migration strategy withmales being resident and females nomadic (Korpimáki1985b). During vole peaks also some snowy owls, hawkowls Surnia ulula, great grey owls, long-eared owls,short-eared owls and kestrels overwinter in South Os-trobothnia. Consequently, I suggest that birds of prey,especially owls (possibly together with small mustelids),may play a central role in the rapid declines of shrewsand also in the above-mentioned synchrony at least inthe transition zone.
Support for this interpretation is given by the factthat during the summer decrease of small mammals in1,977 the breeding populations of nomadic avian pre-dators were clearly the highest during the study period(for example 98 breeding pairs in a field plain within an
area of 63 km'z, Korpimáki 1984; for further data on thepopulation fluctuations of the present avian predators inrelation to small mammal dynamics, see Korpimáki1981, 1984, 1985a). In winter, resident small mustelidsmay play a more important role in predation on at leastmicrotines, since birds of prey partially migrate and thesnow cover to some extent protects small mammalsagainst predation by smaller species of owls (Korpimáki1985b, for further details on the role of avian predatorsin winter, see Korpimáki 1985a). In that season alsoweather conditions may effect a synchronous crash ofsmall mammal populations. For example, in Februaryand March 1983 a hard frost after thaw was disastrousfor the small mammals, since water filled their holes andnests and forced them to come out on the snow surfacewhere they perished for lack of shelter. At that time 14
dead Microtu.r and seven common shrews were foundwithin the sample quadrat in abandoned field. How-ever, as summer declines of small mammal populationsare quite common also in the transition zone (as Hans-son and Henttonen 1985 showed), I suggest that pre-dation by birds of prey and small mustelids is the mostimportant factor synchronizing these declines and thatunfavourable weather conditions in winter only occa-sionally cause the synchronous rapid declines in smallmammal populations.
Acknowledgements - The field work was partly financed bygrants from the Finnish Cultural Foundation, the Oulu StudentFoundation, the Jenny and Antti Wihuri Foundation and theAcademy of Finland. The paper was written while I enjoyed anEmil Aaltonen Foundation's Scholarship. I wish also to thankH. Henttonen, E. Pulliainen, and S. Sulkava for valuable com-ments on the manuscript.
OTKOS 46:l (1986)
References
Aulak, W. 1967. Estimation of small mammal density in threeforest types. - Ekol. Polska (A) 15 (39): 755-778.
Chitty, D. 1970. Variation and population density. - Symp.Zool. Soc. London 26:327-334.
Erlinge, S. 1975. Feeding habits of the weasel Mustela nivalis inrelation to prey abundance. - Oikos 26:378 384.
- 1981. Food preference, optimal diet and reproductive out-put in stoats Mustela erminea in Sweden. - Oikos 36: 303315.
Hansson, L. 1979. On the importance of landscape heterogen-eity in northern regions for the breeding population densi-ties of homeotherms: a general hypothesis. - Oikos 33:
- 1984. Predation as the factor causing extended low densi-ties in microtine cycles. - Oikos 43: 255-256.and Henttonen, H. 1985. Gradients in density variations ofsmall rodents: the importance of latitude and snow cover. -Oecologia (Berl.) (in press).
Hayne, D. 1949. Two methods for estimating populations fromtrapping records. - J. Mammal. 30: 399411.
Henttonen, H. 1985. Predation causing extended low densitiesin microtine cycles: further evidence from shrew dynamics.- Oikos 44: l5GI51 .
Kalela, O. 7962. On the fluctuations in the numbers of arcticand boreal small rodents as a problem of production biol-ogy. - Ann. Acad. Sci. Fennicae A IV 66: 1-38.
Korpimáki, E. 1981. On the ecology and biology of Teng-malm's owl (Aegolíus funereus) in southern Ostrobothniaand Suomenselká. western Finland. - Acta Univ. Oul. A118. 1981. Biol. 13: 1-84.
- 1984. Population dynamics of birds of prey in relation tofluctuations in small mammal populations in western Fin-land. - Ann. Zool. Fennici 21: 28'7-293.
- 1985a. Rapid tracking of microtine populations by theiravian predators: possible evidence for stabilizing predation.- Oikos 44:281 285.
- 1985b. Wintering strategies of Tengmalm's Owl Aegoliusfunereus. Aquilo Ser. Zool. (in press).1985c. Diet of the Kestrel Falco tinnunculas in breedingseason. Ornis Fennica (in press).
Laine, K. and Henttonen, H. 1983. The role of plant produc-tion in microtine cycles in northern Fennoscandia. - Oikos40:401418.
Mikkola, H. 1983. Owls of Europe. - T. & A. D. Poyser, Cal-ton.
Pankakoski, E. 1979. The cone trap - a useful tool for indextrapping of small mammals. - Ann. Zool. Fennici 16: 144-150.
Solantie, R. 1975. The areal distribution of winter precipita-tion and snow depth in March in Finland. - Ilmatieteen lai-toksen tiedonantoja 28.
In the article "The influence of phylogeny, size and be-
haviour on patterns of covariation in salmonid life histo-ries (J. A. Hutchings and D. W. Morris, Oikos 45: 118-
124) three errors occur in the tables.Tab. 1 - maximum length for C. clupeaformis shouldread 79.8 not 64.0
Tab. 2 - intercept for age at maturity
-0.380 not -3.796Tab. 3C - PC3 lodaing for hatching time.739 nof -.739.
These errors are tj'pographical and do nolresults or conclusions of the paper.
should read
should read
affect the
Ed.
OIKOS 46:1 (1986) t27