Basal Clades and Molecular Systematics of Heteromyid Rodents
17
BASAL CLADES AND MOLECULAR SYSTEMATICS OF HETEROMYID RODENTS JOHN C. HAFNER,* JESSICA E. LIGHT,DAVID J. HAFNER,MARK S. HAFNER,EMILY REDDINGTON, DUKE S. ROGERS, AND BRETT R. RIDDLE Moore Laboratory of Zoology and Department of Biology, Occidental College, Los Angeles, CA 90041, USA (JCH, ER) Department of Biological Sciences and Museum of Natural Science, Louisiana State University, Baton Rouge, LA 70803, USA (JEL, MSH) New Mexico Museum of Natural History, Albuquerque, NM 87104, USA (DJH) Department of Integrative Biology and M. L. Bean Life Science Museum, Brigham Young University, Provo, UT 84602, USA (DSR) Department of Biological Sciences, Center for Aridlands Biodiversity Research and Education, University of Nevada Las Vegas, Las Vegas, NV 89154, USA (BRR) Present address of JEL: Florida Museum of Natural History, University of Florida, Gainesville, FL 32611, USA The New World rodent family Heteromyidae shows a marvelous array of ecomorphological types, from bipedal, arid-adapted forms to scansorial, tropical-adapted forms. Although recent studies have resolved most of the phylogenetic relationships among heteromyids at the shallower taxonomic levels, fundamental questions at the deeper taxonomic levels remain unresolved. This study relies on DNA sequence information from 3 relatively slowly evolving mitochondrial genes, cytochrome c oxidase subunit I, 12S, and 16S, to examine basal patterns of phylogenesis in the Heteromyidae. Because slowly evolving mitochondrial genes evolve and coalesce more rapidly than most nuclear genes, they may be superior to nuclear genes for resolving short, basal branches. Our molecular data (2,381 base pairs for the 3-gene data set) affirm the monophyly of the family and resolve the major basal clades in the family. Alternative phylogenetic hypotheses of subfamilial relationships are examined statistically and the Perognathinae and Heteromyinae are found to represent sister clades relative to the Dipodomyinae. The 3 traditional subfamilial groupings are supported; the controversial placement of Microdipodops as a sister clade to Dipodomys in the Dipodomyinae is affirmed, Perognathus and Chaetodipus are distinct sister clades within the Perognathinae, and species of Liomys and Heteromys form the resolved clade Heteromyinae. However, Liomys is found to be paraphyletic relative to Heteromys and, given that this finding corroborates earlier studies, we present a formal taxonomy of Heteromys wherein we place Liomys in synonymy. Semiparametric and parametric methods are used to estimate divergence times from our molecular data and a chronogram of the Heteromyidae, calibrated by the oldest known fossils of Dipodomys and Perognathus, is presented. Our time estimates reveal subfamilial differentiation in the early Miocene (22.3–21.8 million years ago) and pose testable times of divergence for the basal heteromyid nodes. With the basal heteromyid clades resolved and cladogenic events positioned in a time framework, we review the major geological and paleoecological events of the Oligocene and Miocene associated with the early historical biogeography of the family. Key words: Chaetodipus, Dipodomys, Heteromyidae, Heteromys, historical biogeography, Liomys, Microdipodops, mitochondrial DNA, Perognathus, phylogenetics The New World rodent family Heteromyidae shows a re- markable array of morphologically and ecologically diverse forms. The family includes the scansorial pocket mice (Perognathus and Chaetodipus) and spiny pocket mice (Heteromys and Liomys), which show the generalized rodent Bauplan. In addition to these scansorial body types, macro- evolutionary diversification has produced novel morphologies: the quadrupedal, ricochetal kangaroo mice (Microdipodops) and the bipedal, ricochetal kangaroo rats (Dipodomys—Hafner 1993; Hafner and Hafner 1983). Ecologically, heteromyids inhabit a broad spectrum of terrestrial habitats ranging from tropical evergreen forests to stabilized sand dunes in the deserts. Not surprisingly, heteromyid rodents have captured the attention of biologists and paleontologists who view them as * Correspondent: [email protected] Ó 2007 American Society of Mammalogists www.mammalogy.org Journal of Mammalogy, 88(5):1129–1145, 2007 1129
Transcript of Basal Clades and Molecular Systematics of Heteromyid Rodents

BASAL CLADES AND MOLECULAR SYSTEMATICS OFHETEROMYID RODENTS
JOHN C. HAFNER,* JESSICA E. LIGHT, DAVID J. HAFNER, MARK S. HAFNER, EMILY REDDINGTON,
DUKE S. ROGERS, AND BRETT R. RIDDLE
Moore Laboratory of Zoology and Department of Biology, Occidental College, Los Angeles, CA 90041, USA (JCH, ER)Department of Biological Sciences and Museum of Natural Science, Louisiana State University, Baton Rouge,LA 70803, USA (JEL, MSH)New Mexico Museum of Natural History, Albuquerque, NM 87104, USA (DJH)Department of Integrative Biology and M. L. Bean Life Science Museum, Brigham Young University,Provo, UT 84602, USA (DSR)Department of Biological Sciences, Center for Aridlands Biodiversity Research and Education,University of Nevada Las Vegas, Las Vegas, NV 89154, USA (BRR)Present address of JEL: Florida Museum of Natural History, University of Florida, Gainesville, FL 32611, USA
The New World rodent family Heteromyidae shows a marvelous array of ecomorphological types, from bipedal,
arid-adapted forms to scansorial, tropical-adapted forms. Although recent studies have resolved most of the
phylogenetic relationships among heteromyids at the shallower taxonomic levels, fundamental questions at the
deeper taxonomic levels remain unresolved. This study relies on DNA sequence information from 3 relatively
slowly evolving mitochondrial genes, cytochrome c oxidase subunit I, 12S, and 16S, to examine basal patterns of
phylogenesis in the Heteromyidae. Because slowly evolving mitochondrial genes evolve and coalesce more
rapidly than most nuclear genes, they may be superior to nuclear genes for resolving short, basal branches. Our
molecular data (2,381 base pairs for the 3-gene data set) affirm the monophyly of the family and resolve the major
basal clades in the family. Alternative phylogenetic hypotheses of subfamilial relationships are examined
statistically and the Perognathinae and Heteromyinae are found to represent sister clades relative to the
Dipodomyinae. The 3 traditional subfamilial groupings are supported; the controversial placement of
Microdipodops as a sister clade to Dipodomys in the Dipodomyinae is affirmed, Perognathus and Chaetodipusare distinct sister clades within the Perognathinae, and species of Liomys and Heteromys form the resolved clade
Heteromyinae. However, Liomys is found to be paraphyletic relative to Heteromys and, given that this finding
corroborates earlier studies, we present a formal taxonomy of Heteromys wherein we place Liomys in synonymy.
Semiparametric and parametric methods are used to estimate divergence times from our molecular data and
a chronogram of the Heteromyidae, calibrated by the oldest known fossils of Dipodomys and Perognathus, is
presented. Our time estimates reveal subfamilial differentiation in the early Miocene (22.3–21.8 million years ago)
and pose testable times of divergence for the basal heteromyid nodes. With the basal heteromyid clades resolved
and cladogenic events positioned in a time framework, we review the major geological and paleoecological events
of the Oligocene and Miocene associated with the early historical biogeography of the family.
Key words: Chaetodipus, Dipodomys, Heteromyidae, Heteromys, historical biogeography, Liomys, Microdipodops,
mitochondrial DNA, Perognathus, phylogenetics
The New World rodent family Heteromyidae shows a re-
markable array of morphologically and ecologically diverse
forms. The family includes the scansorial pocket mice
(Perognathus and Chaetodipus) and spiny pocket mice
(Heteromys and Liomys), which show the generalized rodent
Bauplan. In addition to these scansorial body types, macro-
evolutionary diversification has produced novel morphologies:
the quadrupedal, ricochetal kangaroo mice (Microdipodops)
and the bipedal, ricochetal kangaroo rats (Dipodomys—Hafner
1993; Hafner and Hafner 1983). Ecologically, heteromyids
inhabit a broad spectrum of terrestrial habitats ranging from
tropical evergreen forests to stabilized sand dunes in the
deserts. Not surprisingly, heteromyid rodents have captured the
attention of biologists and paleontologists who view them as
* Correspondent: [email protected]
� 2007 American Society of Mammalogistswww.mammalogy.org
Journal of Mammalogy, 88(5):1129–1145, 2007
1129

model organisms for studies of adaptive radiation. So attractive
are the heteromyid rodents as study organisms that an entire
edited volume (Genoways and Brown 1993) was devoted to
a review and synthesis of information concerning their biology.
Inferences drawn from comparative and integrative bi-
ological studies rely on our understanding of the evolutionary
history of that lineage. If we wish to study the morphological,
ecological, physiological, or behavioral modifications that
accompanied a group’s adaptive radiation, it must be kept in
mind that the strength of our interpretations rests on the
accuracy of the phylogenetic hypothesis. This is particularly
important in a lineage like the Heteromyidae that is rife with
evolutionary parallelism (Hafner and Hafner 1983; Wood
1935). Despite the popularity of the Heteromyidae as a bi-
ological model, major uncertainties remain today concerning
basal clades and their relationships within the family.
Extant genera of heteromyids are relatively ancient, with
a fossil record extending back to the early Miocene (Wahlert
1993). Alexander and Riddle (2005) and Rogers and Vance
(2005) have resolved in detail specific relationships among most
terminal taxa of the family using DNA sequence data. Riddle
et al. (2000a, 2000b) have correlated phyletic divergence of
the arid-adapted genera Chaetodipus and Dipodomys with
Pliocene–Pleistocene geological events associated with the North
American aridlands. Resolution of the timing and patterns of
deeper relationships within the family may allow placement of
this earlier diversification in the context of older (i.e., Oligocene
and Miocene) geological and paleoclimatic events. Our study
uses mitochondrial DNA sequence information in an attempt to
obtain phylogenetic resolution of the major lineages within the
Heteromyidae and to make inferences regarding the timing of
cladogenic events in the context of historical biogeography.
Monophyly of the Heteromyidae.—The evolutionary history
of the Heteromyidae is intimately linked with that of the sister
family Geomyidae (pocket gophers). Extant geomyoid rodents
are characterized by bilophodont cheek teeth and fur-lined
cheek pouches that are external to the buccal cavity. Although
extant heteromyids and geomyids are distinguished readily
using morphological characters, rodent systematists encounter
difficulty assigning fossils of extinct geomyoids to family
because of extensive parallelism in the group and a reliance on
phenotypic similarity without consideration of character-state
polarity (Wahlert 1985, 1993; Wood 1935).
Documentation of reciprocal monophyly of the Heteromyi-
dae and the Geomyidae using phylogenetic systematic methods
was 1st provided by the biochemical investigation of Hafner
(1982). Soon after, evolutionary morphologists identified a
series of synapomorphic traits that distinguish the Hetero-
myidae. In his study of cranial features, Wahlert (1985)
recognized 7 synapomorphic characters for the Heteromyidae,
including the unique rostral perforation (large perforation in the
wall of the rostrum anterior to the infraorbital canal), a character
noticed by early rodent systematists. To this list, Ryan (1989)
contributed an additional 7 shared-derived characters for the
family from his comparative myological study. There is now
broad recognition that extant members of the 2 families
represent monophyletic units within the superfamily Geo-
myoidea (Alexander and Riddle 2005; Hafner 1982, 1993;
Hafner and Hafner 1983; Reeder 1956; Ryan 1989; Wahlert
1985, 1993; Wood 1935).
Despite near-universal agreement that the Heteromyidae is
a monophyletic group, there are lingering challenges to this
hypothesis that stem from 3 sources: paleontological studies
that relied primarily on similarity in dental morphology
(Lindsay 1972; Rensberger 1971; Shotwell 1967; Wilson
1936); a cladistic analysis of carotid circulation (Brylski
1990); and a molecular phylogenetic analysis of rodents using
nuclear genes (DeBry 2003). However, more-recent paleonto-
logical studies of geomyoid rodents (e.g., Wahlert 1985, 1991,
1993; Wahlert and Souza 1988) emphasized the importance of
recognizing shared-derived characters in studies of dental and
cranial morphology and demonstrated that the Heteromyidae
and Geomyidae are separate, monophyletic taxa. Brylski (1990)
relied on a single character (stapedial artery absent in adults) to
suggest a possible sister relationship between spiny pocket mice
and pocket gophers, but, in consideration of the recent
molecular and morphological data that argue against such an
interpretation, it is more likely that the stapedial artery was lost
independently in these groups (see Wahlert 1985). Finally,
DeBry (2003) suggested that pocket mice are more closely
related to pocket gophers than to kangaroo rats. However, only
3 geomyoid taxa (including 2 heteromyids) were used in this
analysis and DeBry (2003:614) acknowledged much conflict
existed in the separate analyses (e.g., some analyses supported
heteromyid monophyly) and concluded ‘‘Expanded taxonomic
sampling is clearly needed to sort out the relationships within
Geomyoidea.’’ Although monophyly of the Heteromyidae
seems to be documented well based on a wide variety of
character sets, we reexamine this issue using data from
relatively slowly evolving mitochondrial DNA sequences.
Supraspecific evolutionary relationships.—Although mono-
phyly of the Heteromyidae is accepted by most authorities,
ambiguities still persist regarding evolutionary and taxonomic
relationships above the species level. The current taxonomic
arrangement of the Heteromyidae includes 3 subfamilies and 6
genera (Hafner and Hafner 1983; Patton 2005; Williams et al.
1993): Perognathinae (Perognathus and Chaetodipus), Hetero-
myinae (Heteromys and Liomys), and Dipodomyinae (Dipodomysand Microdipodops). Taxonomic difficulties exist at all supra-
specific levels, including recognition of genera, uncertainties
regarding subfamilial composition, and ambiguous relation-
ships among the subfamilies.
At the generic level, taxonomic interest has focused on the
status of 2 genera: Chaetodipus and Liomys. Chaetodipus,
although recognized as a subgenus of Perognathus for nearly
100 years, was elevated to full generic stature only 2 decades ago
(Hafner and Hafner 1983). Additionally, accumulating evidence
seems to indicate that the venerable genus Liomys (described
over a century ago) may be paraphyletic relative to Heteromys(Anderson et al. 2006; Rogers 1990; Rogers and Vance 2005).
Subfamilial classification of the genera seems to be rather
stable, with 2 exceptions. First, much controversy enveloped
the subfamilial placement of Microdipodops during much of
the 20th century (for review see Hafner 1978; Lindsay 1972;
1130 JOURNAL OF MAMMALOGY Vol. 88, No. 5
Reeder 1956; Setzer 1949; Wood 1935) but more recent studies
supported the placement by Hafner and Hafner (1983) of
Microdipodops in the Dipodomyinae (Alexander and Riddle
2005; Hafner 1993; Ryan 1989; Wahlert 1985). A 2nd and
more substantive challenge to the current allocation of genera
to subfamilies by Alexander and Riddle (2005) used 2 rapidly
evolving mitochondrial genes, cytochrome c oxidase subunit 3
and cytochrome b. Alexander and Riddle (2005:376) showed
‘‘no evidence for a subfamily Perognathinae containing
Perognathus and Chaetodipus.’’Lastly, uncertainty clouds our understanding of the relation-
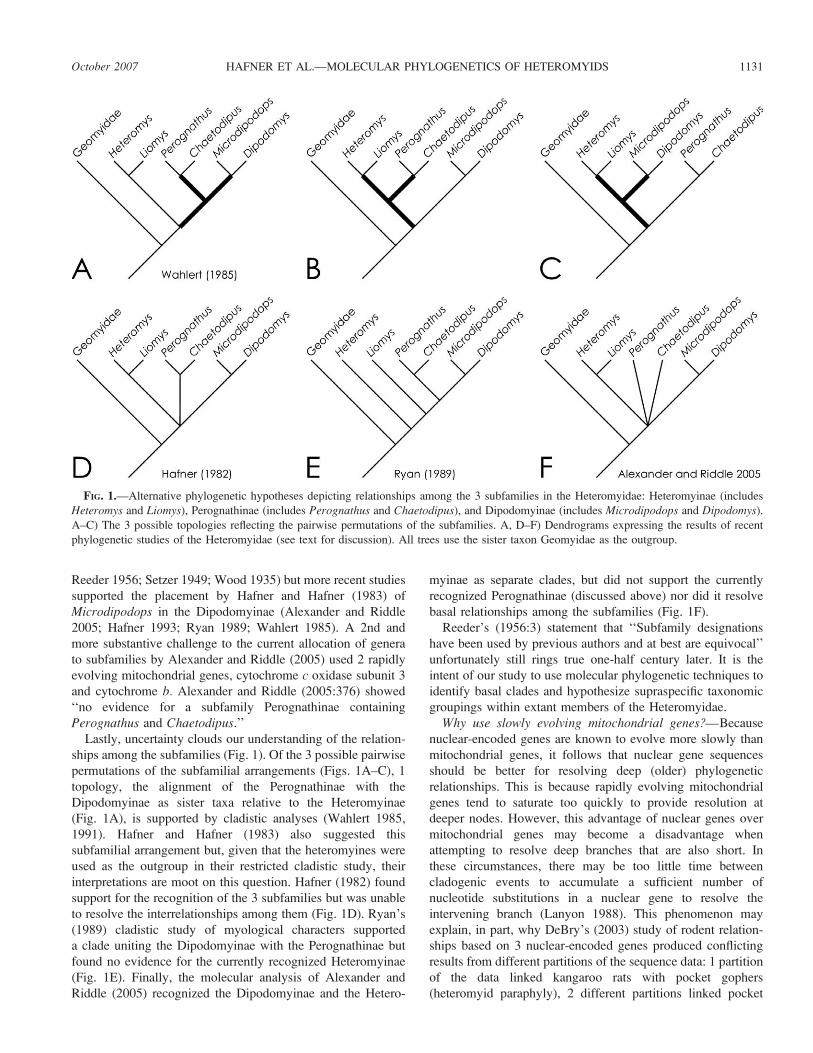
ships among the subfamilies (Fig. 1). Of the 3 possible pairwise
permutations of the subfamilial arrangements (Figs. 1A–C), 1
topology, the alignment of the Perognathinae with the
Dipodomyinae as sister taxa relative to the Heteromyinae
(Fig. 1A), is supported by cladistic analyses (Wahlert 1985,
1991). Hafner and Hafner (1983) also suggested this
subfamilial arrangement but, given that the heteromyines were
used as the outgroup in their restricted cladistic study, their
interpretations are moot on this question. Hafner (1982) found
support for the recognition of the 3 subfamilies but was unable
to resolve the interrelationships among them (Fig. 1D). Ryan’s
(1989) cladistic study of myological characters supported
a clade uniting the Dipodomyinae with the Perognathinae but
found no evidence for the currently recognized Heteromyinae
(Fig. 1E). Finally, the molecular analysis of Alexander and
Riddle (2005) recognized the Dipodomyinae and the Hetero-
myinae as separate clades, but did not support the currently
recognized Perognathinae (discussed above) nor did it resolve
basal relationships among the subfamilies (Fig. 1F).
Reeder’s (1956:3) statement that ‘‘Subfamily designations
have been used by previous authors and at best are equivocal’’unfortunately still rings true one-half century later. It is the
intent of our study to use molecular phylogenetic techniques to
identify basal clades and hypothesize supraspecific taxonomic
groupings within extant members of the Heteromyidae.
Why use slowly evolving mitochondrial genes?—Because
nuclear-encoded genes are known to evolve more slowly than
mitochondrial genes, it follows that nuclear gene sequences
should be better for resolving deep (older) phylogenetic
relationships. This is because rapidly evolving mitochondrial
genes tend to saturate too quickly to provide resolution at
deeper nodes. However, this advantage of nuclear genes over
mitochondrial genes may become a disadvantage when
attempting to resolve deep branches that are also short. In
these circumstances, there may be too little time between
cladogenic events to accumulate a sufficient number of
nucleotide substitutions in a nuclear gene to resolve the
intervening branch (Lanyon 1988). This phenomenon may
explain, in part, why DeBry’s (2003) study of rodent relation-
ships based on 3 nuclear-encoded genes produced conflicting
results from different partitions of the sequence data: 1 partition
of the data linked kangaroo rats with pocket gophers
(heteromyid paraphyly), 2 different partitions linked pocket
FIG. 1.—Alternative phylogenetic hypotheses depicting relationships among the 3 subfamilies in the Heteromyidae: Heteromyinae (includes
Heteromys and Liomys), Perognathinae (includes Perognathus and Chaetodipus), and Dipodomyinae (includes Microdipodops and Dipodomys).
A–C) The 3 possible topologies reflecting the pairwise permutations of the subfamilies. A, D–F) Dendrograms expressing the results of recent
phylogenetic studies of the Heteromyidae (see text for discussion). All trees use the sister taxon Geomyidae as the outgroup.
October 2007 1131HAFNER ET AL.—MOLECULAR PHYLOGENETICS OF HETEROMYIDS

mice with pocket gophers (a different kind of paraphyly), 3
partitions linked kangaroo rats with pocket mice (monophyly),
and 1 partition lacked sufficient variation for analysis.
Although the rapid rate of nucleotide substitution in
mitochondrial genes may be an advantage in certain circum-
stances, an accurately resolved mitochondrial tree (gene tree)
may not be congruent with the species tree because of lineage
sorting of ancestral polymorphisms. However, because of their
relatively rapid rate of coalescence, mitochondrial genes may
have a substantially higher probability (compared to nuclear
genes) of accurately tracking species trees when short branches
are involved (Moore 1995). Thus, attempts to resolve basal
branches in phylogenetic trees, which often involve branches
that are short relative to time since bifurcation, require ex-
amination of sequences that change rapidly enough to provide
resolution, slowly enough to avoid saturation, and coalesce
quickly enough to track the species tree. Slowly evolving
mitochondrial genes would seem to fulfill these requirements.
We propose to enhance the resolution of clades at deeper
taxonomic levels in the Heteromyidae by examining 3
mitochondrial genes that evolve more slowly than most other
mitochondrial genes yet have a coalescence time that is shorter
than most nuclear-encoded genes: the cytochrome c oxidase
subunit I (COI) gene and the 12S and 16S ribosomal RNA
genes (Barros et al. 2003; Ducroz et al. 2001; Ferris et al. 1983;
Frye and Hedges 1995; Johnson and O’Brien 1997; Pesole
et al. 1999). Each of these genes, especially when used in
combination with others, has proven phylogenetically in-
formative for several mammalian groups at both higher and
lower taxonomic levels (Delpero et al. 2001; Gates et al. 1992;
Hafner et al. 2005, 2006; Kuznetsova et al. 2002; Ledje and
Arnason 1996; Olson et al. 2005; Ruedas and Morales 2005;
Spradling et al. 2004; Steppan et al. 2005). Given the relatively
rapid coalescence rate of mitochondrial genes, it is unlikely that
lineage sorting of ancestral polymorphisms will cause the
mitochondrial tree to differ from the species tree for basal
heteromyid relationships (Moore 1995). Nevertheless, any
phylogeny based solely on mitochondrial genes should be
corroborated by evidence from nuclear-encoded characters.
MATERIALS AND METHODS
Taxon sampling and specimens examined.—The studies of
Alexander and Riddle (2005) and Rogers (1990) were used as
working templates for the selection of species sampled. To
achieve a manageable number of taxa and yet survey the
cladistic diversity of the family, we sampled species from all of
the divergent clades and principal species groupings identified
in those studies. As a result, 34 specimens representing 34
species and all 6 currently recognized genera of Heteromyidae
were used in the mitochondrial DNA analyses (Appendix I).
All specimens were captured in the wild using standard
trapping methods and treated in a humane manner as approved
by the Occidental College and Louisiana State University
Institutional Animal Care and Use Committees and by
following guidelines of the American Society of Mammalogists
(Gannon et al. 2007). Outgroup taxa consisted of 4 pocket
gopher species, Cratogeomys perotensis, Orthogeomys gran-dis, Pappogeomys bulleri, and Zygogeomys trichopus (Appen-
dix I). Seven sequences were obtained from GenBank: the COIgene from C. perotensis, O. grandis, P. bulleri, and Z.trichopus (GenBank accession numbers AY649478,
AY331082, AY331084, and AY331087, respectively) and
the 16S gene from Dipodomys microps (DQ422887), Micro-dipodops megacephalus (DQ422891), and M. pallidus(DQ534288). All other sequences were generated in this study.
Mitochondrial DNA amplification and sequencing.—Genomic DNA was isolated from liver or kidney tissue using
the DNeasy Tissue Kit (QIAGEN Inc., Valencia, California).
The protocol recommended by QIAGEN was used; slight
adjustments to this protocol are available upon request.
Extracted DNA was stored at �708C.
Amplification by polymerase chain reaction and sequencing
of the mitochondrial COI (1,551 base pairs [bp]) were per-
formed using the following primers: COI-5285f, COI-6929r
(Spradling et al. 2004), MCo-173f (59-TAT TAG GNG AYG
AYC ARA T-39), MCo-1480r (59-GCT TCT CAR ATT ATR
WAR ATT AT-39), and MCo-1345r (59-TGT TGW GGG AAR
AAD GTT A-39). Polymerase chain reaction amplifications
using primers COI-5285f with COI-6929r were performed in
50-ll reaction volumes following the protocol of Hafner et al.
(2005). If this primer pair failed to yield acceptable sequences,
reactions were performed using primers MCo-173f with MCo-
1480r. Amplification protocol using these primers followed
Hafner et al. (2005), except for an initial annealing temperature
of 508C.
Polymerase chain reaction amplification and sequencing of
a portion of the mitochondrial 12S (412 bp) and 16S (582 bp)
rRNA genes were performed using the 12SaL and 12SbH and
16SarL and 16SbrH primers, respectively (Hillis et al. 1996).
Polymerase chain reaction amplifications for 12S and 16S were
completed in 50-ll reaction volumes as in Hafner et al. (2006).
Amplification protocol for the 12S gene required an initial
denaturation stage of 948C for 2 min, followed by 30
polymerase chain reaction cycles of 948C (1 min 30 s), 458C
(2 min), and 728C (1 min 30 s). Amplification protocol for the
16S gene was performed as described in Hafner et al. (2006).
Before sequencing, amplified COI, 12S, and 16S products
were purified using the QIAquick PCR Purification Kit
protocol (QIAGEN). Amplified products were sequenced in
both directions at the DNA Sequencing Facility at California
State University, Northridge, and the Museum of Natural
Science, Louisiana State University. Sequencing reactions were
performed in volumes of 10 ll following the methods of
Hafner et al. (2005), although an alternative 10-ll reaction,
including 1.6 ll of BigDye (Applied Biosystems, Inc. [ABI],
Perkin-Elmer Corporation, Foster City, California), 0.32 ll of
10-lM primer, 4.08 ll of double-distilled H2O, 2 ll of 5X ABI
sequencing buffer, and 2 ll of amplification product, also was
performed. Samples were sequenced, purified, and electro-
phoresed as described in Hafner et al. (2005).
Mitochondrial sequences were edited using Sequencher
Version 4.1 software (Gene Codes Corporation, Ann Arbor,
Michigan) and the COI gene was then aligned using Se-Al
1132 JOURNAL OF MAMMALOGY Vol. 88, No. 5

version 2.0a11 (http://evolve.zps.ox.ac.uk/Se-Al/Se-Al.html).
Similar to what Spradling et al. (2004) reported for pocket
gophers, there appears to have been several insertion–deletion
(indel) events at the end of the COI gene. The stop codon
and up to 21 bp of sequence upstream of the stop codon
were eliminated before phylogenetic analysis so that each
sequence terminated with the same set of conserved amino
acids. For the rRNA genes, sequences were aligned by eye
with reference to the secondary structure models of Springer
and Douzery (1996) and Olson et al. (2005) for 12S, and Burk
et al. (2002) for 16S. Regions that could not be aligned con-
fidently (primarily regions in loops) were identified as ambig-
uously aligned sites. Only the results excluding ambiguously
aligned sites are presented here because inclusion or exclusion
of these sites yielded similar and nonconflicting results (data
available upon request). All sequences were submitted to
GenBank (GenBank accession numbers EF156834–EF156867
for COI, EF156761–EF156798 for 12S, and EF156799–
EF156833 for 16S).
Data analysis.—Phylogenetic inference can be affected by
base composition heterogeneity, especially for older diver-
gences (Barker and Lanyon 2000; Galtier and Gouy 1998;
Jansa and Weksler 2004; Lockhart et al. 1994). Therefore, base
composition bias was evaluated for each gene (and codon
positions for the COI gene) across all taxa (Jansa et al. 2006b;
Jansa and Weksler 2004). Departures from average base
composition were determined for each taxon using chi-square
goodness-of-fit tests in PAUP* (Swofford 2002). Transitions
and transversions (calculated using MEGA [Kumar et al.
2004]) were plotted against uncorrected p-distances (Barker
and Lanyon 2000) to assess saturation in the COI gene. An
incongruence length difference test (Farris et al. 1994) using
a heuristic search with 100 random addition replicates
(implemented as the partition homogeneity test in PAUP*—
Swofford 2002) was used to determine if significant conflict
existed between COI codon positions. Phylogenetic signal of
each gene was assessed with the g-statistic according to the
procedures of Hillis and Huelsenbeck (1992), and sequence
divergence among taxa was calculated using uncorrected p-distances in PAUP*.
Phylogenetic congruence of all possible combinations of the
3 mitochondrial genes COI, 12S, and 16S was evaluated using
the partition homogeneity test (Farris et al. 1994) in PAUP*
(Swofford 2002). One thousand partition replicates were
analyzed by maximum parsimony (heuristic search option
and random addition replicates of tree-bisection-reconnection
branch swapping). The partition homogeneity test did not
detect significant heterogeneity among the 3 mitochondrial
genes (P ¼ 0.7). Therefore, analyses focused on the combined,
3-gene data set throughout this study.
Phylogenetic analyses were performed using maximum-
parsimony, maximum-likelihood, and Bayesian approaches.
Equally weighted maximum-parsimony searches were per-
formed with 100 random taxon addition replicates and tree-
bisection-reconnection branch swapping (PAUP*—Swofford
2002). Nonparametic bootstrap analyses (1,000 pseudorepli-
cates and 10 random sequence additions) were performed to
assess nodal support (Felsenstein 1985).
To generate the best maximum-likelihood tree, Modeltest
(version 3.6—Posada and Crandall 1998) was used to select the
best model of evolution for the data according to hierarchical
ratio tests and the Akaike information criterion (Huelsenbeck
and Rannala 1997; Posada and Buckley 2004). Only the results
of the hierarchical ratio tests are presented here because both
approaches selected similar models and phylogenetic analysis
using these models of evolution yielded the same topology.
The general time-reversible model including among-site rate
variation and invariable sites (GTRþIþ�—Gu et al. 1995;
Tavare 1986; Yang 1994) was chosen as the best model of
evolution according to hierarchical likelihood-ratio tests for the
3-gene data set. A full heuristic maximum-likelihood search
was conducted by using the successive-approximations ap-
proach with the preferred model in PAUP* (Swofford 2002). A
full heuristic bootstrap also was performed (200 pseudorepli-
cates) using the preferred model.
Partitioned and nonpartitioned Bayesian phylogenetic anal-
yses were performed on the 3-gene data set using MrBayes
3.1.2 (Huelsenbeck and Ronquist 2001). Partitioned Bayesian
analyses were performed to avoid potential systematic error,
parameter mismodeling, and biased posterior probability esti-
mates (Brandley et al. 2005; Castoe et al. 2004; Castoe and
Parkinson 2006; Lemmon and Moriarty 2004; Mueller et al.
2004). Data partitions examined each gene separately, accounted
for rDNA secondary structure (stems and loops were exam-
ined separately), and accounted for both COI codon positions
in addition to rDNA secondary structure. Unique models,
gamma shapes, and rates were allowed for each partition. The
GTRþIþ� model was used in all analyses and model param-
eters were treated as unknown variables with uniform priors
and were estimated as part of the analysis. Bayesian analyses
were initiated with random starting trees, run for 10 million
generations with 4 incrementally heated chains (Metropolis-
coupled Markov chain Monte Carlo—Huelsenbeck and
Ronquist 2001), and sampled at intervals of 1,000 generations.
Two independent Bayesian analyses were run to avoid entrap-
ment on local optima, and log-likelihood scores were compared
for convergence (Huelsenbeck and Bollback 2001; Leache
and Reeder 2002). Stationarity was assessed and all burn-in
points were discarded as in Hafner et al. (2005). The retained
equilibrium samples were used to generate a 50% majority-rule
consensus tree with the percentage of samples recovering any
particular clade representing that clade’s posterior probability
(Huelsenbeck and Ronquist 2001).
Alternative phylogenetic hypotheses of subfamily relation-
ships (Figs. 1A–C) were compared statistically using the
Kishino–Hasegawa, Shimodaira–Hasegawa, and likelihood-ratio
tests as implemented in PAUP* (maximum-parsimony and
maximum-likelihood analyses using RELL optimization and
1,000 bootstrap replicates—Goldman et al. 2000; Shimodaira
and Hasegawa 1999). However, these methods have been crit-
icized for not being appropriate for combined or partitioned
analyses (Weins et al. 2005). Therefore, suboptimal trees from
the Bayesian nonpartitioned and partitioned analyses also were
October 2007 1133HAFNER ET AL.—MOLECULAR PHYLOGENETICS OF HETEROMYIDS
examined to assess alternative phylogenetic hypotheses. The
frequency of the Markov chain Monte Carlo trees in agreement
with an alternative hypothesis equals the probability of that
alternative hypothesis being correct (Ihlen and Ekman 2002
and references therein). The probability of trees agreeing with
alternative subfamily hypotheses was calculated by applying
constraint-based filter trees implemented in PAUP* (Hoofer
and Baker 2006; Ihlen and Ekman 2002).
Estimates of divergence dates and branch lengths.—Before
estimating divergence times, we used likelihood-ratio tests to
determine if our sequence data departed significantly from
clocklike behavior. We tested the assumption of rate uniformity
of DNA substitutions through time within the Heteromyidae
by comparing the maximum-likelihood topology obtained with
and without a molecular clock constraint using PAUP*
(Swofford 2002).
Semiparametric and parametric methods were used to
estimate divergence dates among lineages within the Hetero-
myidae (both methods relax the assumption of a molecular
clock). The topology resulting from the maximum-likelihood
analysis of the combined 3-gene data set was used in all dating
analyses. The semiparametric penalized-likelihood method
(Sanderson 2002) was implemented in the program r8s
(Sanderson 2003). A cross-validation procedure was used in
r8s to determine the optimal size of the penalty function using
the truncated Newton algorithm (Sanderson 2002) with 5
random restarts and perturbations. Confidence intervals evalu-
ating the sampling error of estimated divergence times were
calculated by generating 100 bootstrap pseudoreplicates using
the seqboot program in PHYLIP (Felsenstein 1993). For each
pseudoreplicate, branch lengths were estimated on topologically
identical trees. Penalized-likelihood analyses were then per-
formed on each data set and the command ‘‘profile’’ was used to
summarize the node statistics (mean and SD).
Unlike penalized-likelihood, the parametric Bayesian ap-
proach of Thorne and Kishino (2002) is able to accommodate
multiple loci with variable evolutionary characteristics. For the
parametric Bayesian analysis, the molecular data from the 3
genes (12S, 16S, and COI) were treated as separate data
partitions. Model parameters for the F84þ� model were
estimated for each gene partition using the baseml program in
PAML version 3.14 (Yang 1997) and these parameters were
then used in the program estbranches (Kishino et al. 2001;
Thorne and Kishino 2002) to estimate the maximum-likelihood
and the variance–covariance matrix (also using the F84þ�model) of the branch-length estimates for each gene. Lastly, the
program multidivtime (Kishino et al. 2001; Thorne and Kishino
2002), utilizing the output files from estbranches and
implementing Markov chain Monte Carlo sampling, was used
to estimate prior and posterior distribution of both the
substitution rates for each gene partition and the estimated
divergence time for each node. The prior assumption for the
mean and SD of the time of the ingroup root node (rttm) was
set to 3.0 time units, where 1 time unit represents 10 million
years. This time estimate (30 million years ago [mya]) for the
ingroup root node was obtained from paleontological estimates
of the timing of the split between the Heteromyidae and the
Geomyidae (Fahlbusch 1985; Wahlert 1993). The mean and
SD for the prior distribution of the rate of evolution at the
ingroup node (rtrate and rtratesd) was determined following the
procedure of Jansa et al. (2006a). The Markov chain was
initialized by randomly selecting the initial parameter value and
each chain was sampled every 100 cycles for 106 generations
with a burn-in of 105 cycles. Analyses were performed twice to
ensure stationarity.
The earliest fossils of extant heteromyid genera were used as
calibration points for the molecular dating analyses (see
Wahlert 1993 and included references). Only the fossil records
for Perognathus and Dipodomys were judged to be adequate
for use here. The oldest fossils for Perognathus and Dipodomysdate to the Hemingfordian and the Barstovian North American
Land Mammal ‘‘Ages,’’ respectively. The paleontological
literature does not distinguish between Perognathus and
Chaetodipus (see Wahlert 1993), but the oldest Perognathussensu lato is a fossil from the uppermost John Day Formation,
Oregon (James 1963), estimated to be 22–20 mya (T. Fremd,
pers. comm., 2006). Hence, 22–20 mya is used to calibrate our
molecular time analyses for the perognathine node. Fossil dates
of 15.9–12.5 mya (the Barstovian—Prothero 1998) are asso-
ciated with the oldest fossil Dipodomys (Reeder 1956) and
were used for calibration of the divergence of the dipodomyine
node. Our rationale for calibrating at the subfamilial nodes with
these fossils is that our method provides more conservative
estimates of the oldest ages for the Dipodomys, Perognathus,
and Chaetodipus clades than would be achieved if calibrations
were set at the generic nodes.
Possible differences in branch lengths (relative rates of
nucleotide substitution) across the major heteromyid clades
were evaluated using Kruskal–Wallis and Mann–Whitney U-
tests to examine heterogeneity among means for patristic (i.e.,
phylogenetic) distance data. Patristic distances (using the 3-
gene data set) between all 34 heteromyid taxa and an outgroup
(Zygogeomys) were calculated 2 ways: distance based on
absolute number of differences (produced from a neighbor-
joining analysis constrained with the best maximum-likelihood
tree topology and using absolute number of differences); and
patristic distance data based on our best maximum-likelihood
model (GTRþIþ� model of evolution; genetic data were
treated as noncoding). Each of the 3 subfamilies was treated as
a group and means for the patristic distances were determined.
Tests were conducted to evaluate mean branch-length hetero-
geneity among the 3 heteromyid subfamilies, between any 2
subfamilies, and between genera within the Dipodomyinae and
the Perognathinae.
RESULTS
Sequence characteristics.—None of the heteromyid taxa
showed a significant departure from expected base composition
for 12S, 16S, or COI codon positions (v2 , 17.18, d.f. ¼ 3).
Following the methods of Barker and Lanyon (2000), a plot of
uncorrected p-distance versus transitions showed no evidence
for saturation for 12S, 16S, or the 1st and 2nd codon positions
of COI. However, saturation was evident for 3rd codon
1134 JOURNAL OF MAMMALOGY Vol. 88, No. 5
positions of COI. According to the g-statistics of Hillis and
Huelsenbeck (1992), all 3 genes exhibited high levels of phy-
logenetic signal (and thereby nonrandom structure; g1 ¼ �0.46,
P , 0.01). The incongruence length difference test revealed
no significant conflict between codon positions of the COIgene (P ¼ 1), therefore all codon positions were combined in
subsequent analyses.
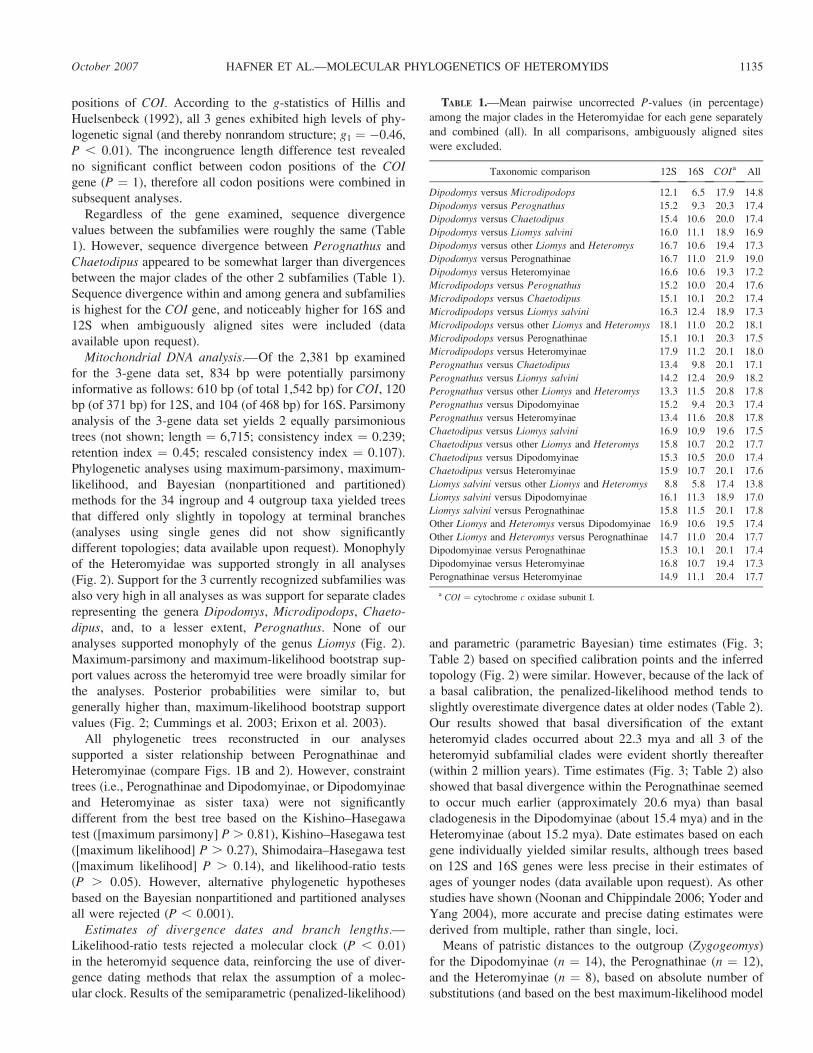
Regardless of the gene examined, sequence divergence
values between the subfamilies were roughly the same (Table
1). However, sequence divergence between Perognathus and
Chaetodipus appeared to be somewhat larger than divergences
between the major clades of the other 2 subfamilies (Table 1).
Sequence divergence within and among genera and subfamilies
is highest for the COI gene, and noticeably higher for 16S and
12S when ambiguously aligned sites were included (data
available upon request).
Mitochondrial DNA analysis.—Of the 2,381 bp examined
for the 3-gene data set, 834 bp were potentially parsimony
informative as follows: 610 bp (of total 1,542 bp) for COI, 120
bp (of 371 bp) for 12S, and 104 (of 468 bp) for 16S. Parsimony
analysis of the 3-gene data set yields 2 equally parsimonious
trees (not shown; length ¼ 6,715; consistency index ¼ 0.239;
retention index ¼ 0.45; rescaled consistency index ¼ 0.107).
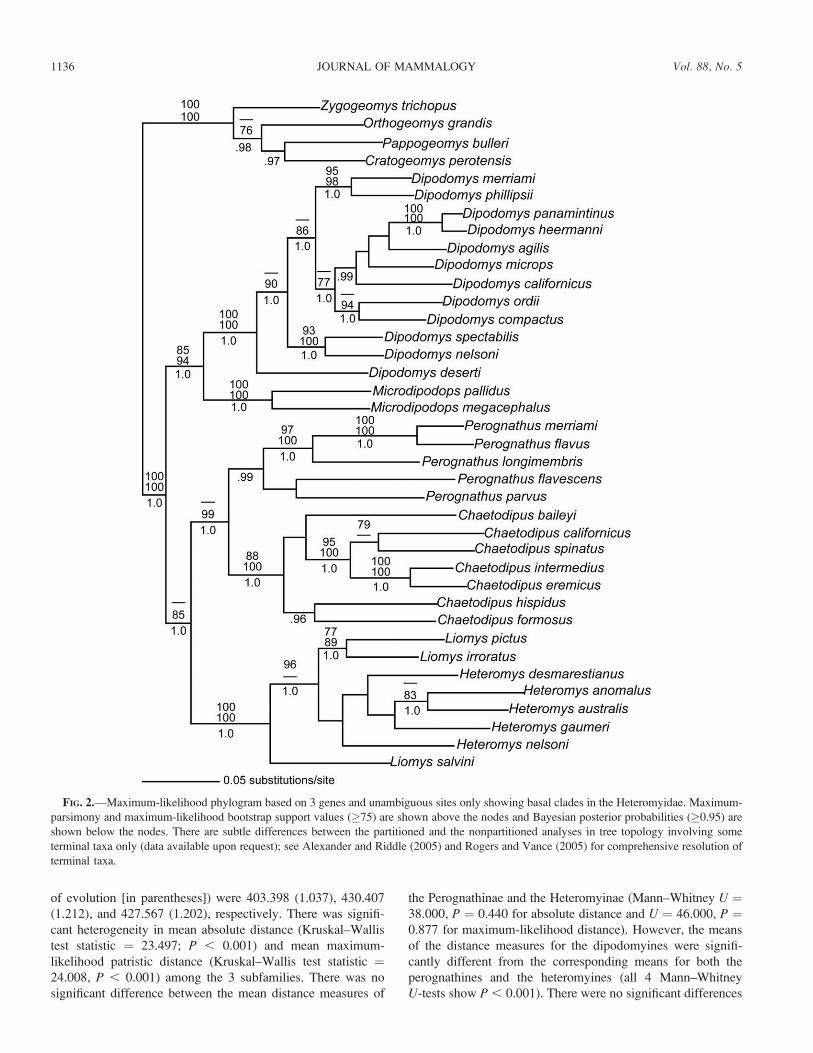
Phylogenetic analyses using maximum-parsimony, maximum-
likelihood, and Bayesian (nonpartitioned and partitioned)
methods for the 34 ingroup and 4 outgroup taxa yielded trees
that differed only slightly in topology at terminal branches
(analyses using single genes did not show significantly
different topologies; data available upon request). Monophyly
of the Heteromyidae was supported strongly in all analyses
(Fig. 2). Support for the 3 currently recognized subfamilies was
also very high in all analyses as was support for separate clades
representing the genera Dipodomys, Microdipodops, Chaeto-dipus, and, to a lesser extent, Perognathus. None of our
analyses supported monophyly of the genus Liomys (Fig. 2).
Maximum-parsimony and maximum-likelihood bootstrap sup-
port values across the heteromyid tree were broadly similar for
the analyses. Posterior probabilities were similar to, but
generally higher than, maximum-likelihood bootstrap support
values (Fig. 2; Cummings et al. 2003; Erixon et al. 2003).
All phylogenetic trees reconstructed in our analyses
supported a sister relationship between Perognathinae and
Heteromyinae (compare Figs. 1B and 2). However, constraint
trees (i.e., Perognathinae and Dipodomyinae, or Dipodomyinae
and Heteromyinae as sister taxa) were not significantly
different from the best tree based on the Kishino–Hasegawa
test ([maximum parsimony] P . 0.81), Kishino–Hasegawa test
([maximum likelihood] P . 0.27), Shimodaira–Hasegawa test
([maximum likelihood] P . 0.14), and likelihood-ratio tests
(P . 0.05). However, alternative phylogenetic hypotheses
based on the Bayesian nonpartitioned and partitioned analyses
all were rejected (P , 0.001).
Estimates of divergence dates and branch lengths.—Likelihood-ratio tests rejected a molecular clock (P , 0.01)
in the heteromyid sequence data, reinforcing the use of diver-
gence dating methods that relax the assumption of a molec-
ular clock. Results of the semiparametric (penalized-likelihood)
and parametric (parametric Bayesian) time estimates (Fig. 3;
Table 2) based on specified calibration points and the inferred
topology (Fig. 2) were similar. However, because of the lack of
a basal calibration, the penalized-likelihood method tends to
slightly overestimate divergence dates at older nodes (Table 2).
Our results showed that basal diversification of the extant
heteromyid clades occurred about 22.3 mya and all 3 of the
heteromyid subfamilial clades were evident shortly thereafter
(within 2 million years). Time estimates (Fig. 3; Table 2) also
showed that basal divergence within the Perognathinae seemed
to occur much earlier (approximately 20.6 mya) than basal
cladogenesis in the Dipodomyinae (about 15.4 mya) and in the
Heteromyinae (about 15.2 mya). Date estimates based on each
gene individually yielded similar results, although trees based
on 12S and 16S genes were less precise in their estimates of
ages of younger nodes (data available upon request). As other
studies have shown (Noonan and Chippindale 2006; Yoder and
Yang 2004), more accurate and precise dating estimates were
derived from multiple, rather than single, loci.
Means of patristic distances to the outgroup (Zygogeomys)
for the Dipodomyinae (n ¼ 14), the Perognathinae (n ¼ 12),
and the Heteromyinae (n ¼ 8), based on absolute number of
substitutions (and based on the best maximum-likelihood model
TABLE 1.—Mean pairwise uncorrected P-values (in percentage)
among the major clades in the Heteromyidae for each gene separately
and combined (all). In all comparisons, ambiguously aligned sites
were excluded.
Taxonomic comparison 12S 16S COIa All
Dipodomys versus Microdipodops 12.1 6.5 17.9 14.8
Dipodomys versus Perognathus 15.2 9.3 20.3 17.4
Dipodomys versus Chaetodipus 15.4 10.6 20.0 17.4
Dipodomys versus Liomys salvini 16.0 11.1 18.9 16.9
Dipodomys versus other Liomys and Heteromys 16.7 10.6 19.4 17.3
Dipodomys versus Perognathinae 16.7 11.0 21.9 19.0
Dipodomys versus Heteromyinae 16.6 10.6 19.3 17.2
Microdipodops versus Perognathus 15.2 10.0 20.4 17.6
Microdipodops versus Chaetodipus 15.1 10.1 20.2 17.4
Microdipodops versus Liomys salvini 16.3 12.4 18.9 17.3
Microdipodops versus other Liomys and Heteromys 18.1 11.0 20.2 18.1
Microdipodops versus Perognathinae 15.1 10.1 20.3 17.5
Microdipodops versus Heteromyinae 17.9 11.2 20.1 18.0
Perognathus versus Chaetodipus 13.4 9.8 20.1 17.1
Perognathus versus Liomys salvini 14.2 12.4 20.9 18.2
Perognathus versus other Liomys and Heteromys 13.3 11.5 20.8 17.8
Perognathus versus Dipodomyinae 15.2 9.4 20.3 17.4
Perognathus versus Heteromyinae 13.4 11.6 20.8 17.8
Chaetodipus versus Liomys salvini 16.9 10.9 19.6 17.5
Chaetodipus versus other Liomys and Heteromys 15.8 10.7 20.2 17.7
Chaetodipus versus Dipodomyinae 15.3 10.5 20.0 17.4
Chaetodipus versus Heteromyinae 15.9 10.7 20.1 17.6
Liomys salvini versus other Liomys and Heteromys 8.8 5.8 17.4 13.8
Liomys salvini versus Dipodomyinae 16.1 11.3 18.9 17.0
Liomys salvini versus Perognathinae 15.8 11.5 20.1 17.8
Other Liomys and Heteromys versus Dipodomyinae 16.9 10.6 19.5 17.4
Other Liomys and Heteromys versus Perognathinae 14.7 11.0 20.4 17.7
Dipodomyinae versus Perognathinae 15.3 10.1 20.1 17.4
Dipodomyinae versus Heteromyinae 16.8 10.7 19.4 17.3
Perognathinae versus Heteromyinae 14.9 11.1 20.4 17.7
a COI ¼ cytochrome c oxidase subunit I.
October 2007 1135HAFNER ET AL.—MOLECULAR PHYLOGENETICS OF HETEROMYIDS
of evolution [in parentheses]) were 403.398 (1.037), 430.407
(1.212), and 427.567 (1.202), respectively. There was signifi-
cant heterogeneity in mean absolute distance (Kruskal–Wallis
test statistic ¼ 23.497; P , 0.001) and mean maximum-
likelihood patristic distance (Kruskal–Wallis test statistic ¼24.008, P , 0.001) among the 3 subfamilies. There was no
significant difference between the mean distance measures of
the Perognathinae and the Heteromyinae (Mann–Whitney U ¼38.000, P ¼ 0.440 for absolute distance and U ¼ 46.000, P ¼0.877 for maximum-likelihood distance). However, the means
of the distance measures for the dipodomyines were signifi-
cantly different from the corresponding means for both the
perognathines and the heteromyines (all 4 Mann–Whitney
U-tests show P , 0.001). There were no significant differences
FIG. 2.—Maximum-likelihood phylogram based on 3 genes and unambiguous sites only showing basal clades in the Heteromyidae. Maximum-
parsimony and maximum-likelihood bootstrap support values (�75) are shown above the nodes and Bayesian posterior probabilities (�0.95) are
shown below the nodes. There are subtle differences between the partitioned and the nonpartitioned analyses in tree topology involving some
terminal taxa only (data available upon request); see Alexander and Riddle (2005) and Rogers and Vance (2005) for comprehensive resolution of
terminal taxa.
1136 JOURNAL OF MAMMALOGY Vol. 88, No. 5

in the means of branch lengths between Dipodomys and Micro-dipodops nor between Perognathus and Chaetodipus (results
of all Mann–Whitney U-tests were nonsignificant, P . 0.05).
DISCUSSION
Monophyly of the Heteromyidae.—We found strong support
for the recognition of the Heteromyidae as a monophyletic
clade relative to the outgroup, the geomyid pocket gophers.
Although analyses of individual genes and combined data sets
yielded trees that did not differ significantly in tree topology,
only when the 3 genes were combined was there strong support
at both deep and shallower levels, as seen in other molecular
studies (Delpero et al. 2001; Gates et al. 1992; Hafner et al.
2006; Kuznetsova et al. 2002; Ledje and Arnason 1996; Olson
et al. 2005; Ruedas and Morales 2005). This finding of
monophyly supports early phenetic perspectives on heteromyid
evolution (e.g., Wood 1935) and agrees with phylogenetic
analyses involving allozymic and immunological data (Hafner
1982), cranial and dental morphological traits (Wahlert 1985,
1991), and myological characters (Ryan 1989). The conflict
between this finding of monophyly and the suggestion of
Brylski (1990) and DeBry (2003) that the family is para-
phyletic may be resolved if Brylski’s (1990) single character
(stapedial artery absent in adults of Thomomys and the spiny
pocket mice) was lost independently in these groups and if
DeBry’s (2003) analyses supporting paraphyly resulted from
insufficient taxon sampling.
Recognition of the subfamilies.—Although not as slowly
evolving as nuclear genes, simultaneous use of COI, 12S, and
16S seems to provide a useful systematic tool for resolving
deeper as well as shallower nodes in the family. The 3
traditional subfamilies, Heteromyinae, Perognathinae, and
Dipodomyinae, were recognized and supported strongly in all
analyses. Microdipodops was a sister clade to Dipodomys in
the Dipodomyinae, a finding that corroborates all other
phylogenetic studies based on a wide spectrum of characters
(e.g., Alexander and Riddle 2005; Hafner 1982; Hafner and
Hafner 1983; Hafner et al. 2006; Rogers 1990; Ryan 1989;
Wahlert 1985) and should lay to rest this long-standing
controversy.
The Perognathinae, consisting of the sister clades of
Perognathus and Chaetodipus, was supported well in all of
our analyses. This arrangement was recognized early on by
rodent systematists and has been corroborated by subsequent
cladistic analyses (e.g., Hafner 1982; Hafner and Hafner 1983;
FIG. 3.—Chronogram for the Heteromyidae. This rate-smoothed tree was obtained from the parametric Bayesian divergence dating analysis
using multidivtime (Kishino et al. 2001; Thorne and Kishino 2002). Divergence dates were estimated on the maximum-likelihood topology
resulting from the combined 3-gene analysis and fossil calibrations of 15.9–12.5 mya for Dipodomyinae and 22–20 mya for Perognathinae.
Numbers at nodes indicate mean divergence date and gray bars represent the 95% credibility intervals.
October 2007 1137HAFNER ET AL.—MOLECULAR PHYLOGENETICS OF HETEROMYIDS

Ryan 1989). However, it does contrast with the findings of
Alexander and Riddle (2005), who found no support for the
traditionally defined Perognathinae. Although Alexander and
Riddle (2005) relied on molecular phylogenetic methods, they
acknowledged that they used mitochondrial genes that were too
rapidly evolving to resolve the deeper clades in the family.
The species of Heteromys and Liomys used in our analysis
formed a monophyletic clade supporting recognition of the
traditional subfamily Heteromyinae. The findings that the
genus Liomys is paraphyletic relative to Heteromys and that
L. salvini forms a well-supported sister clade relative to all
other heteromyines corroborate the findings of Rogers and
Vance (2005). Distinctiveness of L. salvini (along with a closely
related species, L. adspersus) was documented by Rogers
(1990) using allozymic data, but use of those data could not
resolve the basal heteromyine lineages. Rogers and Vance
(2005), using cytochrome-b sequence data, were 1st to
recognize that L. salvini and L. adspersus form a clade that
is basal to other heteromyine lineages, and examination of our
data supports their finding.
Subfamilial relationships.—A key goal of our study was to
resolve evolutionary relationships among the 3 heteromyid
subfamilies. Tree topologies from all phylogenetic methods
employed in this study demonstrated a sister relationship
between the Heteromyinae and the Perognathinae (Fig. 1B).
Alternative phylogenetic hypotheses (Figs. 1A and 1C) could
not be rejected using Kishino–Hasegawa, Shimodaira–Hasegawa,
and likelihood-ratio tests; however, some of these methods may
be inappropriate for comparing alternative hypotheses when
using combined or partitioned analyses, or both (Weins et al.
2005). In fact, Bayesian analyses, which may be more appro-
priate for these data, rejected all alternative hypotheses. Taken
together, these tests suggest that recognition of the Hetero-
myinae þ Perognathinae clade is superior statistically to any of
the alternative phylogenetic hypotheses for our data.
Other workers have stressed the importance of partitioning
data appropriately for accurate phylogenetic reconstruction
(Brandley et al. 2005; Castoe et al. 2004; Castoe and Parkinson
2006; Lemmon and Moriarty 2004; Mueller et al. 2004). In our
study, however, there were no differences between partitioned
and nonpartitioned data in the branching patterns reconstructed
at the deeper portions of the heteromyid clade. Although our
intent here is to focus on resolving basal clades in the family,
we did note that there were subtle differences between the
partitioned and the nonpartitioned analyses in tree topology
involving some terminal taxa (data available upon request).
The finding that the heteromyines and perognathines are
sister taxa relative to the dipodomyines was unanticipated.
Based on examination of limited fossil and Recent material,
Wood (1931) suggested the possible affinity between Het-eromys, Liomys, and Perognathus (he did not distinguish
between Perognathus and Chaetodipus), but reversed himself
by placing the heteromyines as a sister clade to the other
heteromyids in his monographic account of the family (Wood
1935). Rodent systematists throughout the 20th century viewed
the heteromyines as an evolutionarily independent lineage quite
removed from the pocket mice, kangaroo rats, and kangaroo
mice (Genoways 1973; Hafner 1978; Reeder 1956; Wood
1935). Moreover, detailed cladistic analyses of morphological
features by Walhert (1985, 1991) and Ryan (1989) supported
the phylogeny of Wood (1935) by uniting the Dipodomyinae
and the Perognathinae as sister taxa relative to the hetero-
myines. Our results showing the sister relationship of the
heteromyines and the perognathines refute previous cladistic
interpretations based on morphology. Actually, the initial
suggestion of Wood (1931) regarding subfamilial affinities
based on phenotypic similarity appears to be correct in unifying
all genera of pocket mice.
Heteromyid fossils for calibration.—The paleontological
literature was surveyed for information on the earliest fossils
representing extant heteromyid genera for calibrating our
molecular time analyses. Incorporating the fossil record presents
challenges; in addition to the fragmentary nature of the fossil
record for the heteromyids, the paleontological literature does
not distinguish between Perognathus and Chaetodipus (see
Wahlert 1993). However, the fossil record for Perognathus sensu
lato and Dipodomys is sufficiently long and plentiful (see
Wahlert 1993) that fossil time estimates for these genera are more
likely to be reliable for calibration purposes. Wahlert (1993)
mentioned that the earliest fossils of Perognathus sensu lato are
of Hemingfordian age and from the Split Rock Local Fauna of
Wyoming and the John Day Formation of Oregon. Inasmuch as
the fossil from the John Day (University of California Museum of
Paleontology [UCMP] specimen 56279) is older (22–20 mya—
T. Fremd, pers. comm., 2006) than the Split Rock fossil (17
mya—Munthe 1979) we use the former fossil for calibration of
the perognathine node. Calibration of the dipodomyine node was
based on the oldest known fossils of Dipodomys (uncatalogued
UCMP material) that were reported by Reeder (1956) from the
Barstovian of California (15.9–12.5 mya). Fossil material for the
other extant genera (Microdipodops, Liomys, and Heteromys) is
so uncommon and fragmentary that we did not include those data
in our analyses. Specifically, there is no published fossil record
for Heteromys, Liomys is known only from the late Pleistocene
TABLE 2.—Estimates of divergence time for major heteromyid
nodes obtained from semiparametric penalized-likelihood (PL) and
parametric Bayesian (PB) methods and calibrated with reference
fossils (see ‘‘Materials and Methods’’). The node ‘‘Heteromys þLiomys’’ does not include L. salvini. Values shown are the average and
SD (in parentheses) in millions of years for the PL analyses, and the
average and credibility interval (in parentheses) in millions of years for
the PB analyses.
Node PL PB
Heteromyidae 24.47 (0.99) 22.27 (20.68, 24.25)
Perognathinae 20.00 (0.06) 20.59 (20.02, 21.76)
Dipodomyinae 15.90 (0.00) 15.35 (14.10, 15.88)
Heteromyinae 11.95 (0.95) 15.19 (12.71, 18.01)
Dipodomys 10.14 (0.80) 11.35 (9.38, 13.30)
Microdipodops 7.09 (0.66) 8.06 (6.34, 10.01)
Perognathus 16.76 (0.92) 17.58 (15.54, 19.71)
Chaetodipus 13.91 (0.87) 15.15 (12.84, 17.58)
Heteromys þ Liomys 8.66 (0.80) 11.66 (9.66, 13.98)
Heteromyidae þ Perognathinae 22.66 (0.75) 21.83 (20.37, 23.66)
1138 JOURNAL OF MAMMALOGY Vol. 88, No. 5

(Rancholabrean to sub-Recent—Wahlert 1993), and Micro-dipodops is known only from the late Blancan (about 2.9–1.9
mya—Jefferson and Lindsay 2006) and the late Pleistocene
(Rancholabrean—Wahlert 1993).
Branch lengths and timing of divergence.—Molecular
divergence among heteromyid clades did not occur in a clock-
like fashion and there was significant heterogeneity among the
principal subfamilial clades in terms of mean patristic dis-
tances. In particular, the dipodomyine clade had significantly
shorter distances to the outgroup taxon and, hence, we infer
that the dipodomyines, on average, show retarded rates of
molecular evolution relative to the other 2 subfamilies. This
general pattern of branch-length difference also was evident in
Fig. 2. The argument for slower rates of molecular evolution in
the Dipodomyinae receives some support from Hafner’s (1982)
immunological study of geomyoid rodents; although Hafner
(1982) relied on only 2 dipodomyines (D. heermanni and M.megacephalus), he reported particularly small immunological
distances between M. megacephalus and the geomyid and
carnivore outgroups and only moderate distances for D.heermanni. Our study also showed short branches for Micro-dipodops but not for D. heermanni (Fig. 2).
The chronogram (Fig. 3) represents a testable proposition for
future workers. Not only does the chronogram portray
molecular phylogenetic relationships among the major hetero-
myid clades, but it incorporates the best available fossil
evidence in estimating times of divergence. Divergence time
estimates of about 22 mya for the initial diversification of the
Recent heteromyid lineages (Fig. 3) are reasonably in accord
with other molecular and paleontological studies that estimate
the timing of the split between the Heteromyidae and the
Geomyidae: Montgelard et al. (2002) estimated 30.4 mya;
Hafner (1993) recalculated the data in Hafner (1982) and
determined 32–30 mya; Wahlert (1993) suggested before the
Arikareean (about 30 mya); and Fahlbusch (1985) indicated
the late Oligocene (about 26 mya). Our time estimates for
the initial divergence of the subfamilies also are in general
agreement with Wahlert’s (1993) paleontological perspective;
although Wahlert (1993:30) believed that the perognathines are
more closely related to the dipodomyines (and not the hetero-
myines, as we show in this study), he suggested that common
ancestry of the subfamilies ‘‘must have been in the early
Miocene or late Oligocene’’ (about 24 mya). Wahlert (1993:26)
indicated that the fossil record shows that the ‘‘heteromyid
subfamilies were not sharply divided in the Miocene . . .’’; how-
ever, our chronogram disagreed with the paleontological per-
spective in showing clear separation of the subfamilies in
early Miocene time.
The chronogram (Fig. 3) suggests that the 3 subfamilies
diverged almost simultaneously and that the genera Perogna-thus and Chaetodipus are relatively ancient lineages. Among
the 3 subfamilies, divergence within the heteromyines appears
to have occurred most recently (about 15.2 mya); this may seem
somewhat surprising because the heteromyines have long been
considered to be the most morphologically primitive members
of the Recent heteromyids (e.g., Alexander and Riddle 2005;
Kelly 1969; Ryan 1989; Williams et al. 1993; Wood 1935). The
relatively old (8.1-mya) split of the 2 species of Microdipodopsalso is somewhat surprising, but recent work (J. C. Hafner et al.,
in litt.) indicates that the 2 currently recognized species actually
represent species groups. Contrary to the rather recent (early
Pleistocene) evolution of the genus as postulated by Hafner
(1978), kangaroo mice appear to be an old lineage, with
divergence from the other dipodomyines dating to about 15.4
mya. Alexander and Riddle (2005) also noted the deep
divergence between Microdipodops and Dipodomys.
Historical biogeography.—The longevity of ancient lineages
within the Heteromyidae during the dramatic landscape
evolution of western North America in the Cenozoic offers
an opportunity to examine the impact of specific geological and
climatic events on these diversifying lineages. Major events
that pertain to the phylogeny of the Heteromyidae have been
summarized thoroughly by Alexander and Riddle (2005), but
lack of resolution of deeper evolutionary nodes precluded any
consideration of causal correlation of lineage diversification
with tectonic and climatic changes. Prothero (1998) and
Woodburne (2004) reviewed and revised the Cenozoic
chronostratigraphy and biostratigraphy, and they detailed
paleoclimatic and paleogeographic events that affected mam-
malian evolution in North America. Rather than attempt
a separate overview of these formative events, we emphasize
here several salient events that appear to have had major
influence on lineage divergence within the Heteromyidae.
It is probable that Mexico and Central America represent the
center of geomyoid evolution (Wahlert and Souza 1988).
Divergence of the Geomyoidea into the Geomyidae and
Heteromyidae (;30 mya) and subsequent subfamilial differen-
tiation of the Heteromyidae (22.3–20.6 mya) follows the early
Oligocene cooling shift that Prothero (1998:18) considered ‘‘the
most dramatic temperature shift during the entire Cenozoic . . .’’(to that time) resulting in ‘‘the most extreme paleobotanical
change in all of the Cenozoic.’’ This marked an abrupt shift in
vegetation from mesic species to drier, drought-tolerant species,
with a concomitant shift in land snails, amphibians, and reptiles
(Prothero 1998). Subsequent warming led to increased com-
plexity in vegetative zones (Woodburne 2004). This period
witnessed evolutionary ‘‘experimentation’’ resulting in mor-
phologically flamboyant forms in both heteromyid and geomyid
lineages, as evidenced by extinct fossil forms as well as the
origin of extant lineages of heteromyids.
Following the relatively warm and quiescent early Miocene,
the middle Miocene experienced a temperature shift even more
dramatic than that of the early Oligocene. This rapid cooling
shift led to the return of permanent ice sheets to the Antarctic,
initiation of modern ocean circulation patterns, and the
beginning of a cooling and drying trend that has led to the
current glacial episodes (Prothero 1998; Woodburne 2004).
Western North America experienced increased aridity, de-
creased temperatures, spread of grasslands, fragmentation of
vegetation previously adapted to Mediterranean climate, and
major dispersal pulses of mammals (Woodburne 2004). In addi-
tion, the western landscape was altered tremendously: initiation
of extensive block-faulting created the Basin and Range
province; intensified plate movement shifted the Pacific
October 2007 1139HAFNER ET AL.—MOLECULAR PHYLOGENETICS OF HETEROMYIDS
coastline; the Gulf of California was opened (with transfer of
the Cape Region to the Pacific Plate); and the Baja California
Peninsula drifted northward relative to the mainland.
The impact of the major climatic shift and tectonic events
of the middle Miocene was most evident in the 2 northern,
arid-adapted heteromyid subfamilies, Dipodomyinae and
Perognathinae. Desert shrubland was emerging in western
North America in response to continued cooling, increased
aridity, and continental effects (Woodburne 2004). It is rea-
sonable to assume that the distribution of the subfamily
Heteromyinae never extended much further north than the
current northernmost distribution along the United States–
Mexican border because the fossil record of the family is
predominantly from the United States and Canada and no
extinct fossil forms are assigned to this subfamily (Wahlert
1993). Instead, this more mesic-adapted, semitropical sub-
family experienced little lineage divergence relative to the other
subfamilies, and no major differentiation from the basic
heteromyine (murinelike) Bauplan. In contrast, the 2 northern
subfamilies experienced similar (and coincident) adaptive
radiations, producing 4 different forms that have invaded
colder, continental zones: Microdipodops, Perognathus, and,
within the genus Chaetodipus, C. formosus and C. hispidus.
Further lineage divergence in these genera was in response to
climatic and geological events of the Pliocene and Pleistocene,
including continued opening of the Gulf of California, ongoing
uplift of major mountain chains and plateaus, and climatic
oscillations of the Pleistocene glaciations (Alexander and
Riddle 2005; Hafner and Riddle 2005; Riddle and Hafner
2006; Riddle et al. 2000a, 2000b).
Taxonomic conclusions.—Our study clearly resolves the
evolutionary relationship among basal clades within the
Heteromyidae. We recognize 3 basal clades that represent 3
subfamilies: the Dipodomyinae (including Dipodomys and
Microdipodops) and the sister clades Perognathinae (including
Perognathus and Chaetodipus) and Heteromyinae (including
Heteromys and Liomys).
In the subfamily Heteromyinae, the paraphyletic nature of
the genus Liomys necessitates taxonomic change. Merriam
(1902) proposed the name Liomys and indicated H. alleni(¼ L. irroratus alleni [see Genoways 1973]) as its type species.
Concern regarding the taxonomic status of the genus Liomys1st surfaced in the studies by Rogers (1986, 1990). Using
allozymic data, Rogers (1986, 1990) was unable to demonstrate
monophyly of Liomys and stated that additional evidence was
needed before making taxonomic changes. Rogers and Vance
(2005) used mitochondrial DNA data to demonstrate the
paraphyletic nature of Liomys, and corroborative data from
Anderson et al. (2006) and our study affirmed that conclusion.
In their study using allozymes and morphology, Anderson et al.
(2006:1218) urged future workers to consider the ‘‘likely
paraphyletic nature’’ of Liomys but were unable to demonstrate
paraphyly conclusively because of weak branch support.
Importantly, there are no known morphological or molecular
synapomorphies to distinguish Liomys from Heteromys(Anderson et al. 2006; Rogers 1986, 1990; Rogers and Vance
2005), and all available evidence from nuclear and mitochon-
drial markers is consistent with Liomys paraphyly; no evidence
contradicts this interpretation.
If genus-level groups are to retain approximate equivalence
within the family Heteromyidae, then taxonomic decisions at
the generic level in any heteromyid subgroup should be made
in the broader context of previous taxonomic decisions within
the entire family. Previous systematic studies of heteromyid
rodents, many of them contributed by the authors of this paper,
have maintained a high level of taxonomic equivalence across
the family. Heteromyid genera are not merely diagnosable
clades (of which there are many in the family; Fig. 3); instead
they represent relatively old, monophyletic lineages that show
substantial morphological, ecological, physiological, and
behavioral differences from other heteromyid genera. Anderson
et al. (2006) seemed to favor recognition of 3 heteromyine
genera if future studies corroborated the paraphyly of Liomys.
In our judgment, recognition of more than a single genus in the
subfamily Heteromyinae would disrupt taxonomic equivalence
in the family by elevating to generic status lineages that are
not only geologically younger but, in our experience, also
show less morphological and ecological differentiation than do
major lineages within the genera Chaetodipus and Perognathus(Fig. 3). Unless we opt to recognize additional genera within
Chaetodipus and Perognathus, the morphological and ecolog-
ical differentiation evident in the subfamily Heteromyinae is
best reflected at the subgeneric level. Given the evidence
accumulated over the past 2 decades, taxonomic consistency
within the Heteromyidae demands that Liomys be placed in
synonymy with Heteromys. Below, we provide a formal
taxonomic description of the genus Heteromys.
Family Heteromyidae Gray, 1868:201
Comments.—Following Wahlert (1991), the family includes
4 subfamilies: Harrymyinae (includes extinct taxa only),
Dipodomyinae, Perognathinae, and Heteromyinae. Wahlert
(1993) provides a summary of extinct genera of heteromyid
rodents.
Subfamily Heteromyinae Gray, 1868:201
Comments.—This subfamily contains 1 Recent genus,
Heteromys, and no extinct heteromyid genera are included in
this subfamily (Wahlert 1993).
Genus Heteromys Desmarest, 1817
Heteromys Desmarest, 1817:181. Type species Mus anomalusThompson, 1815. Synonyms include Xylomys Merriam, 1902,
and Liomys Merriam, 1902.
Diagnosis.—With Liomys placed in synonymy, Heteromysremains as the single, recognized genus in the Heteromyinae.
Hence, the diagnosis of the subfamily Heteromyinae provided
by Williams et al. (1993:99) is generally applicable to the
genus Heteromys with its new conformation. Heteromyines
exhibit the murine body form and have long been considered as
the most structurally primitive members of the family (e.g.,
Ryan 1989; Wahlert 1993; Williams et al. 1993; Wood 1935).
1140 JOURNAL OF MAMMALOGY Vol. 88, No. 5

Although identifying synapomorphies for the heteromyines has
proven difficult because of their retention of ancestral
characters (Ryan 1989:98), we identify the following morpho-
logical features that serve as synapomorphies for the Hetero-
myinae: male phallus is nonspinous (Genoways 1973; Hafner
and Hafner 1983; Kelly 1969); ventral root of anterior-alar
fissure rising above M3 (Wahlert 1985); masticatory and
buccinator foramina united (Wahlert 1985); stapedial and
sphenofrontal foramina absent (Wahlert 1985); stapedial artery
absent (Wahlert 1991); troughed overhairs with troughs
containing longitudinal lines that are formed by sculptured
fusiform cortical cells underlying the cuticular scales (Homan
and Genoways 1978).
Included taxa.—Fourteen species are now included in the
genus Heteromys, including Heteromys adspersus, H. anom-alus, H. australis, H. desmarestianus, H. gaumeri, H.irroratus, H. nelsoni, H. nubicolens, H. oasicus, H. oresterus,
H. pictus, H. salvini, H. spectabilis, and H. teleus. This listing
includes 8 species listed in Patton (2005), a newly described
species, H. nubicolens (Anderson and Jansa 2007; Anderson
and Timm 2006), and 5 species previously referred to Liomys(adspersus, irroratus, pictus, salvini, and spectabilis).
Comments.—Relative to the dipodomyines and perogna-
thines, the heteromyines have long been recognized to be the
most distinct and internally cohesive lineage within the family
(Hafner 1993; Wood 1935). In discussing the morphology of the
heteromyines, Wood (1935:249) commented that they were more
distinct than the other 2 subfamilies; specifically, Wood
(1935:230) noted that Liomys and Heteromys possessed an
interesting admixture of more primitive (skeletal) features and
more specialized (dental) characters. Homan and Genoways
(1978:758) found the hair morphology of Liomys and Heteromysto be more derived than other members of the family and agreed
with Wood’s (1935) conclusion of the morphological distinc-
tiveness of the subfamily. Ryan (1989:98) noted that ‘‘Heteromysand Liomys have many primitive characters relative to other
heteromyids and finding synapomorphies for this clade (Hetero-
myinae) had always been problematic.’’ In his myological study,
Ryan (1989) was not able to identify a synapomorphy for the
Heteromyinae. Hafner and Hafner (1983:7) examined the
descriptions of the glans penes of heteromyine rodents from
Kelly (1969) and Genoways (1973) and suggested 3 possible
synapomorphies for the family: spineless phalli, glans long
relative to bacular length, and unique urethral lappet morphol-
ogy. Our reexamination of the figures and descriptions of the
phalli in Kelly (1969) and Genoways (1973) supports the
interpretation by Hafner and Hafner (1983) that the nonspinous
phallus is a synapomorphy for the Heteromyinae, but the other 2
features appear less reliable; the relative length of the glans is
somewhat arbitrary and there is some disagreement between
Kelly (1969) and Genoways (1973) regarding the morphology of
the urethral lappets.
Rogers and Vance (2005) presented information from the
mitochondrial cytochrome-b gene that supports the recognition
of a basal clade within the heteromyines that includes H. salviniand H. adspersus. Although the present study does not include
H. adspersus, our results agree with Rogers and Vance (2005)
in showing H. salvini as a sister clade to all other heteromyines.
Molecular phylogenetic studies currently are underway to
evaluate evolutionary relationships among the species of
Heteromys (R. P. Anderson, pers. comm.). Although it is
premature to suggest taxonomic changes regarding species
groupings within Heteromys, it would not be surprising if
future workers recognized the salvini þ adspersus clade at the
subgeneric level.
ACKNOWLEDGMENTS
We thank M. D. Engstrom and B. Lim and the Department of
Natural History, Royal Ontario Museum, for allowing us to borrow
samples of D. compactus. R. C. Dowler and L. K. Ammerman
(Angelo State Natural History Collections, Angelo State University)
and R. L. Honeycutt and H. Prestridge (Texas Cooperative Wildlife
Collection) kindly provided locality and voucher information. We are
grateful to T. Fremd and D. R. Prothero for assistance in determining
dates for the Perognathus fossil from the John Day Formation. N. S.
Upham provided assistance in both library research and in the
laboratory. Appreciation is extended to I. F. Greenbaum for assistance
in locating tissue samples. Permits for fieldwork in Mexico were
issued by the Secretarıa de Medio Ambiente y Recursos Naturales
(SEMARNAT) to E. Arellano, F. X. Gonzalez-Cozatl, and F. A.
Cervantes. We are also grateful to F. X. Gonzalez-Cozatl, D. A.
Hafner, P. M. Hafner, N. Lewis-Rogers, and J. Saucier for assistance
in field collecting of specimens. We thank the Florida Museum of
Natural History, specifically D. L. Reed and M. A. Gitzendanner and
the Florida Museum of Natural History Phyloinformatics Cluster for
High Performance Computing in the Life Sciences, for additional
analytical support. F. K. Barker, S. A. Jansa, D. L. Reed, and T. A.
Spradling provided much advice regarding analytical procedures.
Appreciation is extended to the Nevada Department of Wildlife
(contract 05-21 to JCH) and the National Science Foundation
(Dissertation Improvement Grant DEB-03088787 to JEL and grants
DEB-0236957 to DJH, DEB-0343869 to MSH, and DEB-0237166 to
BRR) for support of this research. We thank Associate Editor Carey
Krajewski and 2 anonymous reviewers for constructive comments.
LITERATURE CITED
ALEXANDER, L. F., AND B. R. RIDDLE. 2005. Phylogenetics of the New
World rodent family Heteromyidae. Journal of Mammalogy
86:366–379.
ANDERSON, R. P., AND S. A. JANSA. 2007. Genetic comparisons
between Heteromys desmarestianus and the recently described H.nubicolens (Rodentia: Heteromyidae) in northwestern Costa Rica.
Mammalian Biology (Zeitschrift fur Saugetierkunde) 72:54–61.
ANDERSON, R. P., AND R. M. TIMM. 2006. A new montane species of
spiny pocket mouse (Rodentia: Heteromyidae: Heteromys) from
northwestern Costa Rica. American Museum Novitates 3509:1–38.
ANDERSON, R. P., M. WEKSLER, AND D. S. ROGERS. 2006. Phylogenetic
analyses of spiny pocket mice (Heteromyidae: Heteromyinae) based
on allozymic and morphological data. Journal of Mammalogy
87:1218–1233.
BARKER, F. K., AND S. M. LANYON. 2000. The impact of parsimony
weighting schemes on inferred relationships among toucans and
neotropical barbets (Aves: Picaformes). Molecular Phylogenetics
and Evolution 15:215–234.
BARROS, M. C., I. SAMPAIO, AND H. SCHNEIDER. 2003. Phylogenetic
analysis of 16S mitochondrial DNA data in sloths and anteaters.
Genetics and Molecular Biology 26:5–11.
October 2007 1141HAFNER ET AL.—MOLECULAR PHYLOGENETICS OF HETEROMYIDS

BRANDLEY, M. C., A. SCHMITZ, AND T. W. REEDER. 2005. Partitioned
Bayesian analyses, partition choice, and the phylogenetic relation-
ships of scincid lizards. Systematic Biology 54:373–390.
BRYLSKI, P. 1990. Development and evolution of the carotid
circulation in geomyoid rodents in relationship to their craniomor-
phology. Journal of Morphology 204:33–45.
BURK, A., E. J. P. DOUZERY, AND M. S. SPRINGER. 2002. The secondary
structure of mammalian mitochondrial 16S rRNA molecules:
refinements based on a comparative phylogenetic approach. Journal
of Mammalian Evolution 9:225–252.
CASTOE, T. A., T. M. DOAN, AND C. L. PARKINSON. 2004. Data
partitions and complex models in Bayesian analyses: the phylogeny
of gymnophthalmid lizards. Systematic Biology 53:448–469.
CASTOE, T. A., AND C. L. PARKINSON. 2006. Bayesian mixed models
and the phylogeny of pitvipers (Viperidae: Serpentes). Molecular
Phylogenetics and Evolution 39:91–110.
CUMMINGS, M. P., S. A. HADLEY, D. S. MEYERS, D. L. REED, A. ROKAS,
AND K. WINKA. 2003. Comparing bootstrap and posterior
probability values in the four-taxon case. Systematic Biology
52:477–487.
DEBRY, R. W. 2003. Identifying conflicting signal in a multigene
analysis reveals a highly resolved tree: the phylogeny of Rodentia
(Mammalia). Systematic Biology 52:604–617.
DELPERO, M., J. C. MASTERS, P. CERVELLA, S. CROVELLA, G. ARDITO,
AND Y. RUMPLER. 2001. Phylogenetic relationships among the
Malagasy lemuriforms (Primates: Strepsirrhini) as indicated by
mitochondrial data from the 12S rRNA gene. Zoological Journal of
the Linnean Society 133:83–103.
DESMAREST, A. G. 1817. Noveau dictionnaire d’historire naturelle,
appliquee aux arts, a l’agriculture, a l’economie rurale et
domestique, a la medecine, etc.; par une Societe de Naturalistes
et d’Agriculteurs. Nouvelle edition presqu’ entierement refondue
et considerablement augmentee. Deterville, Paris, France. Vol. 14.
DUCROZ, J. F., V. VOLOBOUEV, AND L. GRANJON. 2001. An assessment
of the systematics of arvicanthine rodents using mitochondrial DNA
sequences: evolutionary and biogeographical implications. Journal
of Mammalian Evolution 8:173–206.
ERIXON, P., B. SVENNBLAD, T. BRITTON, AND B. OXELMAN. 2003.
Reliability of Bayesian posterior probabilities and bootstrap
frequencies in phylogenetics. Systematic Biology 52:665–673.
FAHLBUSCH, V. 1985. Origin and evolutionary relationships among
geomyoids. Pp. 617–629 in Evolutionary relationships among
rodents: a multidisciplinary analysis (W. P. Luckett and J.-L.
Hartenberger, eds.). Plenum Press, New York.
FARRIS, J. S., M. KALLERSJO, A. G. KLUGE, AND C. BULT. 1994. Testing
significance of congruence. Cladistics 10:315–320.
FELSENSTEIN, J. 1985. Confidence limits on phylogenies with
a molecular clock. Systematic Zoology 38:406–407.
FELSENSTEIN, J. 1993. PHYLIP: phylogeny inference package. Version
3.5c. Department of Genetics, University of Washington, Seattle.
FERRIS, S. D., R. D. SAGE, E. M. PRAGER, U. RITTE, AND A. C. WILSON.
1983. Mitochondrial DNA evolution in mice. Genetics 105:681–
721.
FRYE, M. S., AND S. B. HEDGES. 1995. Monophyly of the order
Rodentia inferred from mitochondrial DNA sequences of the genes
for 12S ribosomal-RNA, 16S ribosomal-RNA, and transfer-RNA–
valine. Molecular Biology and Evolution 12:168–176.
GALTIER, N., AND M. GOUY. 1998. Inferring pattern and process:
maximum-likelihood implementation of nonhomogeneous model of
DNA sequence evolution for phylogenetic analysis. Molecular
Biology and Evolution 15:871–879.
GANNON W. L., R. S. SIKES, AND THE ANIMAL CARE and USE
COMMITTEE OF THE AMERICAN SOCIETY OF MAMMALOGISTS. 2007.
Guidelines of the American Society of Mammalogists for the use of
wild mammals in research. Journal of Mammology 88:804–823.
GATES, J., D. YELAN, R. DESALLE, AND E. S. VRBA. 1992. Phylogeny of
the Bovidae (Artiodactyla, Mammalia) based on mitochondrial
ribosomal DNA sequences. Molecular Biology and Evolution
9:433–446.
GENOWAYS, H. H. 1973. Systematics and evolutionary relationships of
spiny pocket mice, genus Liomys. Special Publications, The
Museum, Texas Tech University 5:1–368.
GENOWAYS, H. H., AND J. H. BROWN (EDS.). 1993. Biology of the
Heteromyidae. Special Publication 10, The American Society of
Mammalogists.
GOLDMAN, N., J. P. ANDERSON, AND A. G. RODRIGO. 2000. Likelihood-
based tests of topologies in phylogenetics. Systematic Biology
49:652–670.
GRAY, J. E. 1868. Synopsis of the species of Saccomyinæ, or pouched
mice, in the collection of the British Museum. Proceedings of the
Scientific Meetings of the Zoological Society of London 1868:
199–206.
GU, X., Y.-X. FU, AND W.-H. LI. 1995. Maximum likelihood
estimation of the heterogeneity of substitution rate among
nucleotide sites. Molecular Biology and Evolution 12:546–557.
HAFNER, D. J., AND B. R. RIDDLE. 2005. Mammalian phylogeography
and evolutionary history of northern Mexico’s deserts. Pp. 225–245
in Biodiversity, ecosystems, and conservation in northern Mexico
(J.-L. E. Cartron, G. Ceballos, and R. S. Felger, eds.). Oxford
University Press, New York.
HAFNER, J. C. 1978. Evolutionary relationships of kangaroo mice,
genus Microdipodops. Journal of Mammalogy 59:354–365.
HAFNER, J. C. 1993. Macroevolutionary diversification in heteromyid
rodents: heterochrony and adaptation in phylogeny. Pp. 291–318
in Biology of the Heteromyidae (H. H. Genoways and J. H.
Brown, eds.). Special Publication 10, The American Society of
Mammalogists.
HAFNER, J. C., AND M. S. HAFNER. 1983. Evolutionary relationships of
heteromyid rodents. Great Basin Naturalist Memoirs 7:3–29.
HAFNER, J. C., E. REDDINGTON, AND M. T. CRAIG. 2006. Kangaroo mice
(Microdipodops megacephalus) of the Mono Basin: phylogeog-
raphy of a peripheral isolate. Journal of Mammalogy 87:1204–
1217.
HAFNER, M. S. 1982. A biochemical investigation of geomyoid
systematics (Mammalia: Rodentia). Zeitschrift fur Zoologische
Systematik und Evolutionsforschung 20:118–130.
HAFNER, M. S., J. E. LIGHT, D. J. HAFNER, S. V. BRANT, T. A.
SPRADLING, AND J. W. DEMASTES. 2005. Cryptic species in the
Mexican pocket gopher Cratogeomys merriami. Journal of
Mammalogy 86:1095–1108.
HILLIS, D. M., AND J. P. HUELSENBECK. 1992. Signal, noise, and
reliability in molecular phylogenetic analyses. Journal of Heredity
83:189–195.
HILLIS, D. M., C. MORITZ, AND B. K. MABLE. 1996. Molecular
systematics. 2nd ed. Sinauer Associates, Inc., Publishers, Sunder-
land, Massachusetts.
HOMAN, J. A., AND H. H. GENOWAYS. 1978. An analysis of hair
structure and its phylogenetic implications among heteromyid
rodents. Journal of Mammalogy 59:740–760.
HOOFER, S. R., AND R. J. BAKER. 2006. Molecular systematics of
vampyressine bats (Phyllostomidae: Stenodermatinae) with com-
parison of direct and indirect surveys of mitochondrial DNA
variation. Molecular Phylogenetics and Evolution 39:424–438.
1142 JOURNAL OF MAMMALOGY Vol. 88, No. 5

HUELSENBECK, J. P., AND J. P. BOLLBACK. 2001. Empirical and
hierarchical Bayesian estimation of ancestral states. Systematic
Biology 50:351–366.
HUELSENBECK, J. P., AND B. RANNALA. 1997. Phylogenetic methods
come of age: testing hypotheses in an evolutionary context. Science
276:227–232.
HUELSENBECK, J. P., AND F. R. RONQUIST. 2001. MrBayes: Bayesian
inference for phylogeny. Biometrics 17:754–756.
IHLEN, P. G., AND S. EKMAN. 2002. Outline of phylogeny and character
evolution in Rhizocarpon (Rhizocarpacaea, lichenized Ascomycota)
based on nuclear ITS and mitochondrial SSU ribosomal DNA
sequences. Biological Journal of the Linnean Society 77:535–
546.
JAMES, G. T. 1963. Paleontology and nonmarine stratigraphy of the
Cuyama Valley Badlands, California. Part I. Geology, faunal
interpretations, and systematic descriptions of Chiroptera, Insecti-
vora, and Rodentia. University of California Publications in
Geological Sciences 45:i–iv, 1–171.
JANSA, S. A., F. K. BARKER, AND L. R. HEANEY. 2006a. The pattern and
timing of diversification of Philippine endemic rodents: evidence
from mitochondrial and nuclear gene sequences. Systematic
Biology 55:73–88.
JANSA, S. A., J. F. FORSMAN, AND R. S. VOSS. 2006b. Different patterns
of selection on the nuclear genes IRBP and DMP-1 affect the
efficiency but not the outcome of phylogeny estimation for
didelphid marsupials. Molecular Phylogenetics and Evolution
38:363–380.
JANSA, S. A., AND M. WEKSLER. 2004. Phylogeny of muroid rodents:
relationships within and among major lineages as determined by
IRBP gene sequences. Molecular Phylogenetics and Evolution
31:256–276.
JEFFERSON, G. T., AND L. LINDSAY (EDS.). 2006. Fossil treasures of the
Anza-Borrego Desert. Sunbelt Publications, San Diego, California.
JOHNSON, W. E., AND S. J. O’BRIEN. 1997. Phylogenetic reconstruction
of the Felidae using 16S rRNA and NADH-5 mitochondrial genes.
Journal of Molecular Evolution 44, supplement 1:S98–S116.
KELLY, T. S. 1969. The comparative morphology of the male phallus
in the genus Dipodomys. M.S. thesis, San Fernando Valley State
College, Los Angeles, California.
KISHINO, H., J. L. THORNE, AND W. J. BRUNO. 2001. Performance of
a divergence time estimation method under a probabilistic model of
rate evolution. Molecular Biology and Evolution 18:352–361.
KUMAR, S., K. TAMURA, AND M. NEI. 2004. MEGA3: integrated
software for molecular evolutionary genetics analysis and sequence
alignment. Briefings in Bioinformatics 5:150–163.
KUZNETSOVA, M. V., M. V. KHOLODOVA, AND A. A. LUSCHEKINA. 2002.
Phylogenetic analysis of sequences of the 12S and 16S rRNA
mitochondrial genes in the family Bovidae: new evidence. Russian
Journal of Genetics 38:942–950.
LANYON, S. M. 1988. The stochastic mode of molecular evolution:
what consequences for systematic investigations? Auk 105:564–
573.
LEACHE, A. D., AND T. W. REEDER. 2002. Molecular systematics of the
eastern fence lizard (Sceloporus undulatus): a comparison of
parsimony, likelihood, and Bayesian approaches. Systematic Bi-
ology 51:44–68.
LEDJE, C., AND U. ARNASON. 1996. Phylogenetic relationships within
caniform carnivores based on analysis of the mitochondrial 12S
rRNA gene. Journal of Molecular Evolution 43:641–649.
LEMMON, A. R., AND E. C. MORIARTY. 2004. The importance of proper
model assumption in Bayesian phylogenetics. Systematic Biology
53:265–277.
LINDSAY, E. H. 1972. Small mammal fossils from the Barstow
Formation, California. University of California Publications in
Geological Sciences 93:1–104.
LOCKHART, P. J., M. A. STEEL, M. D. HENDY, AND D. PENNY. 1994.
Recovering evolutionary trees under a more realistic model of
sequence evolution. Molecular Biology and Evolution 11:605–
612.
MERRIAM, C. H. 1902. Twenty new pocket mice (Heteromys and
Liomys) from Mexico. Proceedings of the Biological Society of
Washington 15:41–50.
MONTGELARD, C., S. BENTZ, C. TIRARD, O. VERNEAU, AND F. M.
CATZEFLIS. 2002. Molecular systematics of Sciurognathi (Rodentia):
the mitochondrial cytochrome b and 12S rRNA gene support the
Anomaluroidea (Pedetidae and Anomaluridae). Molecular Phylo-
genetics and Evolution 22:220–233.
MOORE, W. S. 1995. Inferring phylogenies from mtDNA variation:
mitochondrial-gene trees versus nuclear-gene trees. Evolution
49:718–726.
MUELLER, R. L., J. R. MACEY, M. JAEKEL, D. B. WAKE, AND J. L.
BOORE. 2004. Morphological homoplasy, life history evolution, and
historical biogeography of plethodontid salamanders inferred from
complete mitochondrial genomes. Proceedings of the National
Academy of Sciences 101:13820–13825.
MUNTHE, J. 1979. Summary of Miocene vertebrate fossils of the
Granite Mountains Basin, central Wyoming. Contributions to
Geology, University of Wyoming 18:33–46.
NOONAN, B. P., AND P. T. CHIPPINDALE. 2006. Dispersal and vicariance:
the complex evolutionary history of boid snakes. Molecular
Phylogenetics and Evolution 40:347–358.
OLSON, L. E., E. J. SARGIS, AND R. D. MARTIN. 2005. Intraordinal
phylogenetics of treeshrews (Mammalia: Scandentia) based on
evidence from the mitochondrial 12S rRNA gene. Molecular
Phylogenetics and Evolution 35:656–673.
PATTON, J. L. 2005. Family Heteromyidae. Pp. 844–858 in Mammal
species of the world: a taxonomic and geographic reference (D. E.
Wilson and D. M. Reeder, eds.). 3rd ed. Johns Hopkins University
Press, Baltimore, Maryland.
PESOLE, G., C. GISSI, A. DE CHIRICO, AND C. SACCONE. 1999.
Nucleotide substitution rate of mammalian mitochondrial genomes.
Journal of Molecular Evolution 48:427–434.
POSADA, D., AND T. R. BUCKLEY. 2004. Model selection and model
averaging in phylogenetics: advantages of Akaike information
criterion and Bayesian approaches over likelihood ratio tests.
Systematic Biology 53:793–808.
POSADA, D., AND K. A. CRANDALL. 1998. ModelTest: testing the model
of DNA substitution. Bioinformatics 14:817–818.
PROTHERO, D. R. 1998. The chronological, climatic, and paleogeo-
graphic background to North American mammalian evolution. Pp.
9–36 in Evolution of Tertiary mammals of North America (C. M.
Janis, K. M. Scott, and L. L. Jacobs, eds.). Cambridge University
Press, Cambridge, United Kingdom.
REEDER, W. G. 1956. A review of Tertiary rodents of the family
Heteromyidae. Ph.D. dissertation, University of Michigan, Ann
Arbor.
RENSBERGER, J. M. 1971. Entoptychine pocket gophers (Mammalia,
Geomyoidea) of the early Miocene John Day Formation, Oregon.
University of California Publications in Geological Sciences
90:vi þ 1–209.
RIDDLE, B. R., AND D. J. HAFNER. 2006. A step-wise approach to
integrating phylogeographic and phylogenetic biogeographic per-
spectives on the history of a core North American warm deserts
biota. Journal of Arid Environments 66:435–461.
October 2007 1143HAFNER ET AL.—MOLECULAR PHYLOGENETICS OF HETEROMYIDS

RIDDLE, B. R., D. J. HAFNER, AND L. F. ALEXANDER. 2000a. Comparative
phylogeography of Bailey’s pocket mouse (Chaetodipus baileyi) and
the Peromyscus eremicus species group: historical vicariance of the
Baja California Peninsular Desert. Molecular Phylogeography and
Evolution 17:161–172.
RIDDLE, B. R., D. J. HAFNER, L. F. ALEXANDER, AND J. R. JAEGER.
2000b. Cryptic vicariance in the historical assembly of a Baja
California Peninsular Desert biota. Proceedings of the National
Academy of Sciences 97:14438–14443.
ROGERS, D. S. 1986. Evolutionary relationships within the subfamily
Heteromyinae (genera Heteromys and Liomys). Ph.D. dissertation,
University of California, Berkeley.
ROGERS, D. S. 1990. Genic evolution, historical biogeography, and
systematic relationships among spiny pocket mice (subfamily
Heteromyinae). Journal of Mammalogy 71:668–685.
ROGERS, D. S., AND V. L. VANCE. 2005. Phylogenetics of spiny pocket
mice (genus Liomys): analysis of cytochrome b based on multiple
heuristic approaches. Journal of Mammalogy 86:1085–1094.
RUEDAS, L. A., AND J. C. MORALES. 2005. Evolutionary relationships
among genera of Phalangeridae (Metatheria: Diprotodontia)
inferred from mitochondrial DNA. Journal of Mammalogy
86:353–365.
RYAN, J. M. 1989. Comparative mycology and phylogenetic
systematics of the Heteromyidae (Mammalia, Rodentia). Mis-
cellaneous Publications of the Museum of Zoology, University of
Michigan 176:1–103.
SANDERSON, M. J. 2002. Estimating absolute rates of molecular
evolution and divergence times: a penalized likelihood approach.
Molecular Biology and Evolution 19:101–109.
SANDERSON, M. J. 2003. r8s: inferring absolute rates of molecular
evolution and divergence times in absence of a molecular clock.
Bioinformatics 19:301–302.
SETZER, H. W. 1949. Subspeciation in the kangaroo rat, Dipodomysordii. University of Kansas Publications, Museum of Natural
History 1:473–573.
SHIMODAIRA, H., AND M. HASEGAWA. 1999. Multiple comparisons of
log-likelihoods with applications to phylogenetic inference. Molec-
ular Biology and Evolution 16:1114–1116.
SHOTWELL, J. A. 1967. Late Tertiary geomyoid rodents of Oregon.
Bulletin, Museum of Natural History, University of Oregon 9:1–51.
SPRADLING, T. A., S. V. BRANT, M. S. HAFNER, AND C. J. DICKERSON.
2004. DNA data support rapid radiation of pocket gopher genera
(Rodentia: Geomyidae). Journal of Mammalian Evolution 11:105–
125.
SPRINGER, M. S., AND E. J. P. DOUZERY. 1996. Secondary structure and
patterns of evolution among mammalian mitochondrial 12S rRNA
molecules. Journal of Molecular Evolution 43:357–373.
STEPPAN, S. J., R. M. ADKINS, P. Q. SPINKS, AND C. HALE. 2005.
Multigene phylogeny of the Old World mice, Murinae, reveals
distinct geographic lineages and the declining utility of mitochon-
drial genes compared to nuclear genes. Molecular Phylogenetics
and Evolution 37:370–388.
SWOFFORD, D. L. 2002. PAUP*: phylogenetic analysis using
parsimony (* and other methods). Version 4.0b10. Sinauer
Associates, Inc., Publishers, Sunderland, Massachusetts.
TAVARE, S. 1986. Some probabilistic and statistical problems in the
analysis of DNA sequences. Pp. 57–87 in Some mathematical
questions in biology—DNA sequence analysis (R. M. Miura, ed.).
American Math Society, Providence, Rhode Island.
THOMPSON, J. V. 1815. Description of a new species of the genus Mus,
belonging to the section of pouched rats. Transactions of the
Linnean Society of London 11:161–163, plate 10.
THORNE, J. L., AND H. KISHINO. 2002. Divergence time and
evolutionary rate estimation using multilocus data. Systematic
Biology 51:689–702.
WAHLERT, J. H. 1985. Skull morphology and relationships of
geomyoid rodents. American Museum Novitates 2812:1–20.
WAHLERT, J. H. 1991. The Harrymyinae, a new heteromyid subfamily
(Rodentia, Geomorpha), based on cranial and dental morphology of
Harrymys Munthe, 1988. American Museum Novitates 3013:1–23.
WAHLERT, J. H. 1993. The fossil record. Pp. 1–37 in Biology of the
Heteromyidae (H. H. Genoways and J. H. Brown, eds.). Special
Publication 10, The American Society of Mammalogists.
WAHLERT, J. H., AND R. A. SOUZA. 1988. Skull morphology of
Gregorymys and relationships of the Entoptychinae (Rodentia,
Geomyidae). American Museum Novitates 2922:1–13.
WEINS, J. J., J. W. FETZNER, JR., C. L. PARKINSON, AND T. D. REEDER.
2005. Hylid frog phylogeny and sampling strategies for speciose
clades. Systematic Biology 54:719–748.
WILLIAMS, D. F., H. H. GENOWAYS, AND J. K. BRAUN. 1993.
Taxonomy. Pp. 38–196 in Biology of the Heteromyidae (H. H.
Genoways and J. H. Brown, eds.). Special Publication 10, The
American Society of Mammalogists.
WILSON, R. W. 1936. A Pliocene rodent fauna from Smiths Valley,
Nevada. Contributions to Paleontology, Carnegie Institution of
Washington 473:15–34, plates 1, 2.
WOOD, A. E. 1931. Phylogeny of the heteromyid rodents. American
Museum Novitates 501:1–19.
WOOD, A. E. 1935. Evolution and relationships of the heteromyid
rodents with new forms from the Tertiary of western North
America. Annals of Carnegie Museum 24:73–262.
WOODBURNE, M. O. 2004. Global events and the North American
mammalian biochronology. Pp. 315–343 in Late Cretaceous and
Cenozoic mammals of North America: biostratigraphy and geo-
chronology (M. O. Woodburne, ed.). Columbia University Press,
New York.
YANG, Z. 1994. Maximum likelihood phylogenetic estimation from
DNA sequences with variable sites over sites: approximate
methods. Journal of Molecular Evolution 39:306–314.
YANG, Z. 1997. PAML: a program package for phylogenetic analysis
by maximum likelihood. Computer Applications in the Biosciences
13:555–556.
YODER, A. D., AND Z. YANG. 2004. Divergence dates for Malagasy
lemurs estimated from multiple gene loci: geological and
evolutionary context. Molecular Ecology 13:757–773.
Submitted 1 December 2006. Accepted 8 February 2007.
Associate Editor was Carey W. Krajewski.
APPENDIX ISpecimens examined in the genetic analyses (molecular data were
obtained from 1 specimen per species). Specimens are grouped by
heteromyid subfamily. Collection abbreviations are as follows: Angelo
State Natural History Collection (ASNHC); M. L. Bean Life Science
Museum, Brigham Young University (BYU); Coleccion Nacional de
Mamıferos, Universidad Nacional Autonoma de Mexico (CNMA);
Louisiana State University Museum of Natural Science (LSUMZ);
University of California Museum of Vertebrate Zoology (MVZ);
Moore Laboratory of Zoology, Occidental College (MLZ); New
Mexico Museum of Natural History (NMMNH); Texas Cooperative
Wildlife Collection (TCWC).
Dipodomys agilis.—MEXICO: Baja California: 6 km S, 17 km E
Valle de la Trinidad, 905 m (MVZ 153957).
1144 JOURNAL OF MAMMALOGY Vol. 88, No. 5

Dipodomys californicus.—UNITED STATES: California: Tehama
County; 2.5 miles S, 0.2 miles E Paynes Creek, 1,960 feet (MLZ 2061).
Dipodomys compactus.—UNITED STATES: Texas: Cameron
County; 4.5 miles N, 3.6 miles E Port Isabel (ASNHC 4327).
Dipodomys deserti.—UNITED STATES: Nevada: Clark County;
Corn Creek Desert Wildlife Refuge (NMMNH 5374).
Dipodomys heermanni.—UNITED STATES: California: San Luis
Obispo County; 15.0 miles S, 8.2 miles E Simmler, 2,300 feet (MLZ
1852).
Dipodomys merriami.—MEXICO: Chihuahua; 6 miles NW
Ricardo Flores Magon, 1,500 m (NMMNH 4548).
Dipodomys microps.—UNITED STATES: California: Inyo
County; 6.0 miles N, 0.5 mile W Bishop, 4,200 feet (MLZ 1765).
Dipodomys nelsoni.—MEXICO: Coahuila; 5 km S, 16 km W
General Cepeda (NMMNH 4703).
Dipodomys ordii.—UNITED STATES: New Mexico: Grant
County; 2.6 miles N, 1.8 miles E Redrock, 1,241 m (NMMNH 4377).
Dipodomys panamintinus.—UNITED STATES: California: San
Bernadino County; 8.9 miles N, 1.1 miles E Red Mountain, 3,150 feet
(MLZ 1879).
Dipodomys phillipsii.—MEXICO: Zacatecas; 2 miles E San
Jeronimo, 2,350 m (CNMA 42050).
Dipodomys spectabilis.—UNITED STATES: New Mexico:
Hidalgo County; 6 miles SE Portal (Cochise County, Arizona)
(NMMNH 4399).
Microdipodops megacephalus.—UNITED STATES: California:
Mono County; 5 miles N Benton, 5,600 feet (MLZ 1741).
Microdipodops pallidus.—UNITED STATES: Nevada: Nye
County; 3 miles S, 4.3 miles E Gold Reed, 5,330 feet (MLZ 1959).
Heteromys anomalus.—VENEZUELA: Miranda; 40 km N Alta-
gracia (TCWC 39720).
Heteromys australis.—PANAMA: Province Darien; 6 km NW
Cana, N Slope Cerro Pirre, approximately 1,200 m (LSUMZ 25452).
Heteromys desmarestianus.—MEXICO: Veracruz; 8 km ENE
Catemaco, 480 m (LSUMZ 36300).
Heteromys gaumeri.—MEXICO: Campeche; 7 km W Escarcega
(ASNHC 7118).
Heteormys nelsoni.—MEXICO: Chiapas; Cerro Mozotal, 2,930 m
(BYU 20645).
Liomys irroratus.—MEXICO: Puebla; 6 km N Tilapa, 1,300 m
(LSUMZ 36295).
Liomys pictus.—MEXICO: Veracruz; Biological Station La
Mancha, 0 m (CNMA 41912).
Liomys salvini.—COSTA RICA: Puntarenas Province; 5 km S,
6 km W Esparza (LSUMZ 28358).
Chaetodipus baileyi.—UNITED STATES: New Mexico: Hidalgo
County; Doubtful Canyon, 8 miles N, 1 mile W Steins, 1,380 m
(NMMNH 4421).
Chaetodipus californicus.—UNITED STATES: California: San
Luis Obispo County; 15.9 miles S, 7.2 miles E Simmler, 3,200 feet
(MLZ 1843).
Chaetodipus eremicus.—UNITED STATES: New Mexico: Dona
Ana County; 1 mile S junction I-10 and Picacho Avenue, 1,314 m
(NMMNH 4433).
Chaetodipus formosus.—UNITED STATES: California: San
Bernardino County; 8.9 miles N, 1.1 miles E Red Mountain, 3,150
feet (MLZ 1863).
Chaetodipus hispidus.—UNITED STATES: Texas: Hidalgo
County; Mission, 2519 Inspiration Road (LSUMZ 36375).
Chaetodipus intermedius.—UNITED STATES: New Mexico:
Grant County; 2.6 miles N, 1.8 miles E Redrock, 1,241 m (NMMNH
4371).
Chaetodipus spinatus.—MEXICO: Baja California Sur; 4 miles SE
(by road) Migrino, 90 m (MVZ 153946).
Perognathus flavescens.—UNITED STATES: New Mexico: Ber-
nalillo County; Albuquerque (LSUMZ M4670).
Perognathus flavus.—MEXICO: Puebla; 3.1 km SW El Veladero
(LSUMZ 36254).
Perognathus longimembris.—UNITED STATES: Nevada: Lyon
County; 10.3 miles S, 2.2 miles E Yerington, 4,600 feet (MLZ 2046).
Perognathus merriami.—MEXICO: Coahuila; Plan de Guadalupe,
1,040 m (NMMNH 4728).
Perognathus parvus.—UNITED STATES: Nevada; Lincoln
County; 6 miles N, 31 miles W Hiko, 4,800 feet (MVZ 159055).
Zygogeomys trichopus.—MEXICO: Michoacan; 6 km N, 2 km W
Tancıtaro, 2,000 m (LSUMZ 34340).
Orthogeomys grandis.—MEXICO: Puebla; 6 km N Tilapa, 1,300 m
(CNMA 41821).
Pappogeomys bulleri.—MEXICO: Jalisco; 8.6 km (by road) SW
La Huerta, 374 m (CNMA 41923).
Cratogeomys perotensis.—MEXICO: Veracruz; 9 km NE Perote,
2,440 m (CNMA 41911).
October 2007 1145HAFNER ET AL.—MOLECULAR PHYLOGENETICS OF HETEROMYIDS