INDIA FY 2000 Results Review and Resource Request (R4 ...
148
INDIA FY 2000 Results Review and Resource Request (R4) April 1998
-
Upload
khangminh22 -
Category
Documents
-
view
0 -
download
0
Transcript of INDIA FY 2000 Results Review and Resource Request (R4 ...

INDIA
FY 2000 Results Review and Resource Request (R4)
April 1998
GLOSSARY OF ACRONYMS
ACE Agricultural Commercialization and EnterpriseADB Asian Development BankAIC Agribusiness Information CenterAIDS Acquired Immune Deficiency SyndromeAIJ Activities Implemented JointlyAIMS Asian Information Marketing and Social ResearchAMC Ahmedabad Municipal CorporationANE/BEO Asia and Near East/Bureau Environmental OfficerANE Asia and Near EastAPAC AIDS Prevention and ControlAPSEB Andhra Pradesh State Electricity BoardASCI Administrative Staff College of IndiaASG Asia Consulting GroupBHR/FFP Bureau for Humanitarian Response/Food for PeaceBHR/PVC Bureau for Humanitarian Response/Private and Voluntary CooperationBIS Bureau for Indian StandardsBJP Bhartiya Janta PartyBOT Build-Own-TransferBSES Bombay Suburban Electric Supply LimitedBSS Behavioral Sentinel SurveillanceCAE Common Agenda for the EnvironmentCARE Cooperative for Assistance and Relief EverywhereCCI Community Consulting InternationalCDC Center for Disease ControlCDIE Center for Development, Information and ExchangeCII Confederation of Indian IndustriesCMC Christian Medical CollegeCMIE Center for Monitoring Indian EconomyCO2 Carbon DioxideCP Congressional PresentationCRS Catholic Relief ServicesCSM Contraceptive Social MarketingCTI Clean Technology InitiativeDAP Development Activity ProposalDIET District Institute for Education and TrainingDOE Department of EnergyDSM Demand Side ManagementEA Environmental AssessmentECO Energy Conservation and CommercializationEMS Environmental Management SystemEPA Environmental Protection AgencyESCO Energy Service CompanyEV Electric Vehicle
FBO Foreign Building OfficeFCS Foreign Commercial ServiceFICCI Federation of Indian Chambers of Commerce and IndustryFIRE Financial Institutions Reform and ExpansionFSN Foreign Service NationalFWWB Friends of Women’s World BankingFY Fiscal YearGCC Global Climate ChangeGDP Gross Domestic ProductGEP Greenhouse Gas Pollution Prevention ProjectGFS Global Field SupportGHG Greenhouse GasGOI Government of IndiaHG Housing GuarantyHIV Human Immunodeficiency VirusHUDCO Housing and Urban Development CorporationICASS International Cooperative Administrative Support ServicesICDS Integrated Child Development ServicesICICI Industrial Credit and Investment Corporation of IndiaICRW International Center for Research on WomenIDI International Development InternIEC Information, Education and CommunicationIEE Initial Environmental ExaminationIFA Iron-folic AcidIFPS Innovations in Family Planning ServicesILFS Infrastructure Leasing and Financial ServicesINCLEN India Clinical Epidemiology NetworkINHP Integrated Nutrition and Health ProgramIPP Independent Power ProducerIR Intermediate ResultISO International Standards OrganizationIUD Intra Uterine DeviceKWH KilowattLOP Life-of-ProjectMMR Mumps, Measles and Rubella VaccineMOP Ministry of PowerMOU Memorandum of UnderstandingMPP Mission Performance PlanMSS Management Support ServiceMW MegawattNAC National Advisory CommitteeNACO National AIDS Control OrganizationNCPU National Council of Power UtilitiesNFHS National Family Health SurveyNGOs Non-Governmental OrganizationsNHB National Housing Bank

NIH National Institute of HealthNIUA National Institute of Urban AffairsNOA New Obligation AuthorityNPC National Productivity CouncilNSDL National Securities Depository LimitedNTPC National Thermal Power CorporationNXP Non-Expendable PropertyOE Operating ExpenseOECF Overseas Economic Cooperation FundOPV Oral Polio VaccineORG Operations Research GroupORS Oral Rehydration SolutionOYB Operational Year BudgetPACT/CRH Program for the Advancement of Commercial Technology/Child and
Reproductive HealthPHN Population, Health and NutritionPLF Plant Load FactorPP&L Pennsylvania Power and LightPPP Public-Private PartnershipPVO Private Voluntary OrganizationQCI Quality Council of IndiaR&M Rehabilitation and ModernizationR4 Results Review and Resource RequestRFP Request for ProposalRLA Regional Legal AdvisorRP Results PackageRUDO Regional Urban Development OfficeSBP Strategic Business PlanningSEB State Electricity BoardSEBI Securities and Exchange Board of IndiaSIFPSA State Innovations in Family Planning Services AgencySO Strategic ObjectiveSPO Special ObjectiveSRO Self-Regulatory OrganizationState/OES State/Oceans and International Environmental and Scientific AffairsSTD Sexually Transmitted DiseasesTANSACS Tamil Nadu State AIDS Control SocietyTBD To Be DeterminedTEST Trade in Environmental Services and TechnologiesUMASS University of MassachusettsUNICEF United Nations Children’s FundUP Uttar PradeshUSAEP United States-Asia Environmental PartnershipUSAID United States Agency for International DevelopmentUSDA United States Department of AgricultureUSDH United States Direct Hire

USG United States GovernmentUSIS United States Information ServiceVAW Violence Against WomenVHS Voluntary Health ServicesWACH Women and Child HealthWHO World Health OrganizationWIN Women’s Initiative

TABLE OF CONTENTSPage
I. Overview and Factors Affecting Program Performance. . . . . . . . . . . . . . . . . . . . . 1
II. Progress Toward Objectives. . . . . . . . . . . . . . . . . . . . . . . . . . . . . . . . . . . . . . . 6
Summary Table. . . . . . . . . . . . . . . . . . . . . . . . . . . . . . . . . . . . . . . . . . . . . . . . 6
A. Strategic Objective 1: Increased Capacity of Financial Markets toMobilize Resources. . . . . . . . . . . . . . . . . . . . . . . . . . . . . . . . . . . . . . . . . . . 7
B. Strategic Objective 2: Reduced Fertility and Improved ReproductiveHealth in North India . . . . . . . . . . . . . . . . . . . . . . . . . . . . . . . . . . . . . . . . 24
C. Strategic Objective 3: Improved Child Survival and Nutrition inSelected Areas of India. . . . . . . . . . . . . . . . . . . . . . . . . . . . . . . . . . . . . . . 48
D. Strategic Objective 4: Increased Environmental Protection in Energy,Industry and Cities. . . . . . . . . . . . . . . . . . . . . . . . . . . . . . . . . . . . . . . . . . 66
E. Special Objective 1: Reduced Transmission of HIV Infection. . . . . . . . . . . . . 86
F. Special Objective 2: Increased Investment in Agribusiness by Private Firms . . 94
G. Special Objective 3: Expanded Advocacy and Service Delivery Networksfor Women . . . . . . . . . . . . . . . . . . . . . . . . . . . . . . . . . . . . . . . . . . . . . . 100
H. Environmental Compliance. . . . . . . . . . . . . . . . . . . . . . . . . . . . . . . . . . . 109
III. Status of Management Contract. . . . . . . . . . . . . . . . . . . . . . . . . . . . . . . . . . . 110
IV. Resource Request. . . . . . . . . . . . . . . . . . . . . . . . . . . . . . . . . . . . . . . . . . . . 115
1. Financial Plan . . . . . . . . . . . . . . . . . . . . . . . . . . . . . . . . . . . . . . . . . . . . 115
2. Prioritization of Objectives. . . . . . . . . . . . . . . . . . . . . . . . . . . . . . . . . . . . 118
3. Linkage With Centrally Funded Mechanisms. . . . . . . . . . . . . . . . . . . . . . . 118
4. Workforce and Operating Expenses. . . . . . . . . . . . . . . . . . . . . . . . . . . . . . 121

Tables
1. USAID FY 1998 Budget Request by Program/Country2. USAID FY 1999 Budget Request by Program/Country3. USAID FY 2000 Budget Request by Program/Country4. Global Field Support5. Operating Expenses for FY 1998, FY 1999 and FY 20006. Cost of Controller Operations for FY 1998, FY 1999 and FY 20007. Trust Funds and FSN Separation Fund for FY 1998, FY 1999 and FY 20008. Workforce for FY 1998, FY 1999, FY 2000 and FY 2001
Annexes
1. Strategic Objective 1 Tree. . . . . . . . . . . . . . . . . . . . . . . . . . . . . . . . . . 12. Strategic Objective 2 Tree. . . . . . . . . . . . . . . . . . . . . . . . . . . . . . . . . . 23. Strategic Objective 3 Tree. . . . . . . . . . . . . . . . . . . . . . . . . . . . . . . . . . 34. Strategic Objective 4 Tree (Proposed). . . . . . . . . . . . . . . . . . . . . . . . . . 45. Special Objective 1 Tree. . . . . . . . . . . . . . . . . . . . . . . . . . . . . . . . . . . 56. Special Objective 2 Tree. . . . . . . . . . . . . . . . . . . . . . . . . . . . . . . . . . . 67. Special Objective 3 Tree. . . . . . . . . . . . . . . . . . . . . . . . . . . . . . . . . . . 7

I. OVERVIEW AND FACTORS AFFECTING PROGRAM PERFORMANCE
India--US Interests Abound
A number of factors, often seemingly contradictory, make India a country that encompassesvirtually every US national interest. An undeclared nuclear power, India is key to regionalstability and an important player in global discussions on nuclear non-proliferation. Its growingeconomy and expanding middle class, now estimated at somewhere between 100 and 200 millionpeople, make it a target for U.S. trade and investment, one of the "big emerging markets." At thesame time, India’s immense population and acute poverty create a continuing need forhumanitarian assistance and, together with expanding industrialization and urbanization, heightenconcerns about environment and health problems of global dimensions. The world’s largestdemocracy, India continues to contribute to a rapidly expanding Indian-American population,increasing commercial, cultural and political ties between the countries, while raising issuesrelated to immigration and drug control.
The remarkable comprehensiveness of US national interests in India has been reflected in thedevelopment this year of a "new strategic dialogue" between the two countries, moved forwardby visits from the Secretaries of State, Commerce and Health and Human Services, theUndersecretary of State and the USAID Administrator and an announced Presidential visit stillto be finalized. It is also illustrated in this year’s Mission Performance Plan prepared by USgovernment agencies in New Delhi. The Plan incorporates 15 of 16 possible goals and advancesall seven national interests outlined in the US Strategic Plan for International Affairs. Ratherthan prioritizing the U.S. national interests in India, the Mission has designated four--EconomicProsperity, National Security, Global Issues, and Democracy--for special emphasis.
Each of USAID’s strategic objectives relate directly to one or more of the four national interestsselected for special emphasis. Our work with women’s rights contributes to democracy.Programs to strengthen India’s capital markets, to build urban infrastructure, and to increase US-Indian collaboration on energy and environmental technologies and management support theeconomic prosperity national interest. But the greatest portion of the program--more than 80percent of our resources--is dedicated to critical global issues in population, health and theenvironment.
Recognizing our predominant interest and capabilities, the Ambassador has appointed USAID thelead agency for global issues. USAID is in charge of the Indo-US Common Agenda for theEnvironment which provides a framework for bilateral dialogue and interagency programmingon a number of key environment issues. USAID leads the Mission-wide Global Advocacy Groupto coordinate activities across government agencies relating to global issues.
Finally, USAID is the agency at the Mission responsible for the Humanitarian Response nationalinterest, both in terms of disaster prevention and mitigation, and relief programs to address theneeds of the very poorest communities in India.

Forging Partnerships to Achieve Mission Objectives
Given India’s global significance for climate change, population growth, HIV/AIDS and otheremerging diseases, USAID has forged partnerships with a number of USG agencies to achieveMission objectives. In preparing for the visit of Secretary Shalala we enhanced our existingpartnership with NIH and CDC by adding new, joint initiatives in contraceptive research, diseasesurveillance and emerging diseases. We have worked closely with the Department of Energy andthe State Department to implement annual bilateral consultations with the GOI on all aspects ofenergy policy. USAID serves as the "on-the-ground" liaison for the Environmental ProtectionAgency and assists with the design and implementation of activities as varied as air qualitymonitoring and solid waste disposal. As the convener of the Mission’s Global Advocacy Group,we have also prepared a Global Climate Change strategy which encompasses USAID, theEconomics Section of the Embassy, State/OES, DOE, EPA, FCS, the USAEP, and USIS.Finally, USAID has collaborated closely with USIS in the design of an environmental fellowsprogram which will complement USAID’s environment program and facilitate accomplishmentof overall Mission environment objectives. India is attracting the attention of an increasingnumber of US government agencies, opening new opportunities and challenges for channellingUS government resources and talent towards common national objectives.
Climate change--growing emphasis
In his September 1997 visit, Administrator Atwood highlighted India’s importance as a keyclimate change country in developing a global approach to combatting greenhouse gas (GHG)emissions. India is the sixth largest and second fastest growing producer of GHGs in the world.USAID/India has been involved in climate change-related work for some time. In 1995, itsGreenhouse Gas Pollution Prevention Project (GEP) was one of the first USAID programsqualified under the pilot phase of the Global Environmental Facility. The GEP and otheractivities contributed to avoidance of 20,000 tons of carbon dioxide emission equivalents inIndian FY 1997 and are planned to avoid nearly three million tons in FY 1998. The GEPtechnical assistance, training and investment grants aim at reducing carbon dioxide emissions perunit of electricity generated by coal fired power plants and promoting sugar cane waste as analternative to coal for power cogeneration in selected sugar mills. Recently, in collaboration withthe Department of Energy and Global Bureau, we have completed the design of a $20.0 millionamendment to the GEP which will broaden the scope to include promotion of advanced powergeneration technologies, reduction of urban sources of GHGs and a climate friendly policyinitiative. Also, a new $25 million activity, Energy Conservation and Commercialization (ECO),is under design with Global Bureau assistance. The ECO will extend USAID/India’s powersector activities into improving efficiency of transmission, distribution and demand sidemanagement through market-based and policy initiatives. The planned target of the muchexpanded climate change program is 12 million tons of carbon dioxide emission equivalentsavoided in FY 2000.
2

Changes in the past year
The most dramatic change in the past year is India’s recent election in which it swapped anunstable coalition government of 14 parties -- including communists and Harvard-educated freemarketers -- for another fragile coalition, this time with even more parties and an outlook thatis yet to be fully defined. India’s democracy is riding a wave of coalition politics and fragilegovernments which will introduce new factors affecting the shape of our relations. If currenttrends continue, the Union government at the center will find it difficult to articulate andimplement strong national policies; power will continue to devolve to the state and localgovernment levels. With an extremely diverse political base, the national government may findit more difficult to push economic reform aggressively; it may be hesitant to take strong standsvisibly favoring US positions in international fora. Annual GDP growth has slipped from 7.5percent last year to 5.5 this year. Reaching the government’s goal of 7-8 percent growth --seenas essential to make a serious impact on poverty alleviation -- may prove an overly ambitiousgoal.
At the same time, while control at the center is weakening, stronger and more active stategovernments offer new opportunities for practical support to improved governance, greateraccountability, and more effective democratic institutions. The devolving of power from thecenter may also encourage competition between states for foreign investment, spurring botheconomic and political reform from the ground up.
Our Program
Our program was not substantially affected by the churning of the political waters in New Delhi.We continued to make real and measurable progress towards most of our objectives:
• In Uttar Pradesh, a state of more than 150 million people and a female literacy rate below25 percent, NGO’s supported by USAID provided family planning and reproductive healthservices to 20 million people, 30 percent above our target.
• India’s largest power company made significant reductions in carbon dioxide emissions andhas decided to make a major investment in US technology to make improvements systemwide--a potential reduction of 3 million tons of carbon dioxide.
• Partnerships between US and Indian utilities grew and identified opportunities that will cutlosses, improve efficiency and reduce pollution.
• India’s capital market grew more efficient, increasing both in transparency and accountability.
• The city of Ahmedabad issued South Asia’s first municipal bond, and demand for USAIDassistance in financing of urban infrastructure exploded.
3

• USAID formed a National Advisory Council comprised of prominent jurists, human rightsactivists, researchers and policy makers to oversee our work on violence against women --a critical achievement given the sensitive nature of the subject.
• Studies in Tamil Nadu show that USAID-assisted NGOs working on HIV/AIDS educationand prevention have helped reduce high risk behavior among key groups. Finding ways ofreaching high-risk groups is critical; India has 3-5 million people who are HIV positive, morethan any other country in the world.
Progress towards objectives is discussed in greater detail in the subsequent narrative sections.
The future
During the past year, we have begun an expansion of our program that will take us beyond 2000,the last year of our approved strategy. Increasingly, our program has come to focus on globalissues. The recent, mid-term assessment of the population and reproductive health program inUttar Pradesh endorsed the current strategy but called for an extension through 2004. The workin Tamil Nadu on HIV/AIDS has been encouraging. With support from the Global Bureau, weare expanding that program to Maharashtra, and initiating activities in disease surveillance,consistent with the new Agency emphasis on this important issue and the national interest toprotect health in the U.S.
The Administration’s focus on the role of developing countries in the global effort to reducegreenhouse gasses is entirely consistent with work already underway and has led to a deepeningand broadening of our environment program. New designs and amendments to existing activitieswill carry us through FY 2005, focusing largely on improved efficiency in the power sector, butaddressing urban, transportation and industrial contributions to greenhouse gas emissions as well.
The work on girls’ education and violence against women--related to the national interest indemocracy--while still small, is promising. We can see a gradual and judicious expansion inthese areas, assuming we continue to get support for what is still an experimental and politicallysensitive set of activities.
Work under strategic objective one--Increased Capacity of Financial Markets to MobilizeResources--is being extended through 2003 to help capital markets reach international standardsof efficiency, transparency and accountability. We expect that models, mechanisms and capacityfor cities to gain access to the capital market will also be in place by that time, and our work oneconomic growth can focus elsewhere--on infrastructure, financial markets, fiscal reform ormicrofinance, for example. With the growing pressure on economic growth funding, however,we are cautious in our planning for future activities in this area and are expecting to phase outour agribusiness program by FY 2000.
Given that our plans for the future are consistent with US national interests, the priorities of theU.S. Mission in India, USAID global priorities, our success to date in achieving results, our
4

comparative advantage and our existing staffing and resource levels, we request an extension ofour current strategy to 2005. This issue is discussed more fully in the Management ContractSection.
5
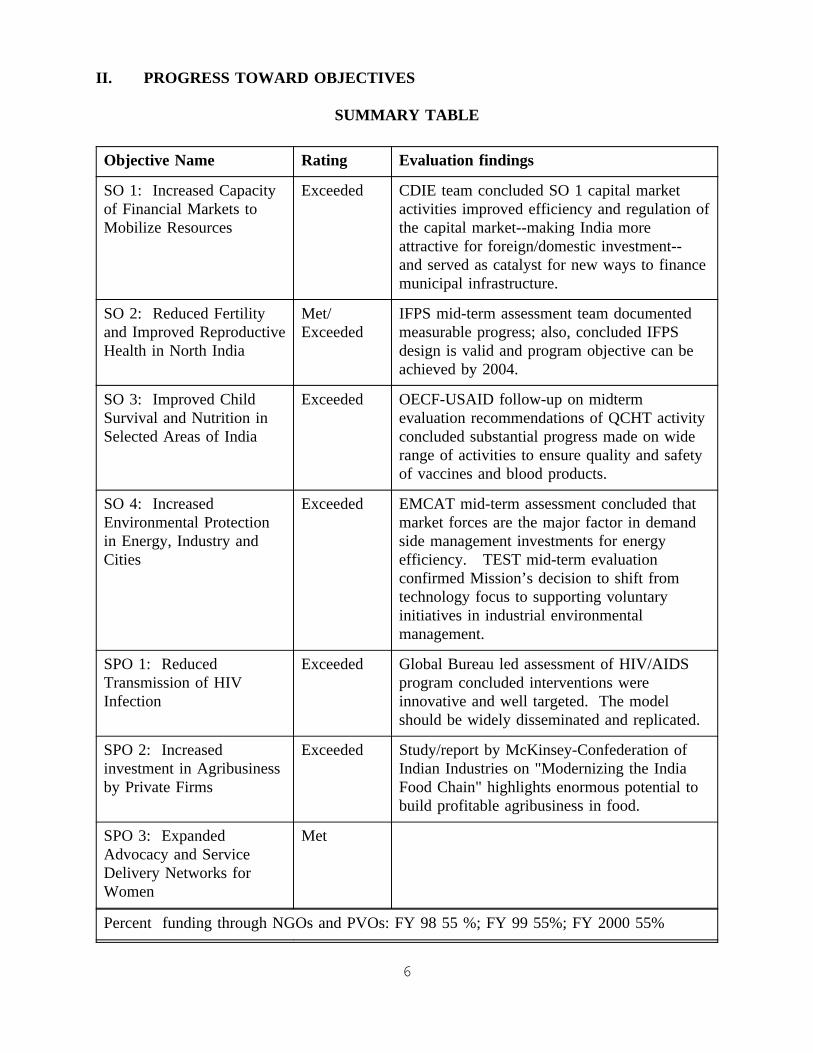
II. PROGRESS TOWARD OBJECTIVES
SUMMARY TABLE
Objective Name Rating Evaluation findings
SO 1: Increased Capacityof Financial Markets toMobilize Resources
Exceeded CDIE team concluded SO 1 capital marketactivities improved efficiency and regulation ofthe capital market--making India moreattractive for foreign/domestic investment--and served as catalyst for new ways to financemunicipal infrastructure.
SO 2: Reduced Fertilityand Improved ReproductiveHealth in North India
Met/Exceeded
IFPS mid-term assessment team documentedmeasurable progress; also, concluded IFPSdesign is valid and program objective can beachieved by 2004.
SO 3: Improved ChildSurvival and Nutrition inSelected Areas of India
Exceeded OECF-USAID follow-up on midtermevaluation recommendations of QCHT activityconcluded substantial progress made on widerange of activities to ensure quality and safetyof vaccines and blood products.
SO 4: IncreasedEnvironmental Protectionin Energy, Industry andCities
Exceeded EMCAT mid-term assessment concluded thatmarket forces are the major factor in demandside management investments for energyefficiency. TEST mid-term evaluationconfirmed Mission’s decision to shift fromtechnology focus to supporting voluntaryinitiatives in industrial environmentalmanagement.
SPO 1: ReducedTransmission of HIVInfection
Exceeded Global Bureau led assessment of HIV/AIDSprogram concluded interventions wereinnovative and well targeted. The modelshould be widely disseminated and replicated.
SPO 2: Increasedinvestment in Agribusinessby Private Firms
Exceeded Study/report by McKinsey-Confederation ofIndian Industries on "Modernizing the IndiaFood Chain" highlights enormous potential tobuild profitable agribusiness in food.
SPO 3: ExpandedAdvocacy and ServiceDelivery Networks forWomen
Met
Percent funding through NGOs and PVOs: FY 98 55 %; FY 99 55%; FY 2000 55%
6

A. Strategic Objective 1: Increased Capacity of Financial Markets to Mobilize Resources
Promotion of economic growth in India is a priority for the U.S. Government. As recentexperience in East Asia demonstrates, sustained growth requires a sound, well regulated, anddiversified financial sector. In fact, USAID’s efforts to reform and modernize Indian’s financialmarkets is cited under two Mission goals in the Mission Program Plan (MPP): "U.S. EconomicProsperity" and "Broad-based Growth."
1. Performance Analysis
USAID, working closely with a number of private and public sector partners, has the undisputedlead among donors in providing technical assistance to India’s capital market. A recent countrystudy by CDIE concluded that activities financed under SO 1 successfully accelerated the reformand strengthening of India’s capital market--thereby "making India more attractive for foreignand domestic investment".
During the past year, work under SO 1 improved investor confidence in India’s capital market,increased market transparency and efficiency, and improved access to the capital market by localgovernments. Specifically, screen based trading of equities increased from 60 percent to over90 percent of the total volume traded; the securities depository became fully functional andtrading of de-materialized shares began in earnest; the Securities Exchange Board of India (SEBI)strengthened market surveillance and enforcement; an Indian municipality began implementationof the first commercially viable Build-Operate-Transfer water supply/sewerage project; a localgovernment accessed for the first time India’s capital markets to help finance its infrastructureinvestments; and India’s credit rating agencies added municipal ratings to their investmentadvisory services. SO 1 activities have mobilized resources to improve urban environments andthus reenforced the mission’s efforts under SO 4 to address environmental concerns.
The mission has, with AID/W agreement, revised the wording of SO 1 and several SO and IR-level indicators so that they better reflect what SO 1 is trying to achieve and are more within ourmanageable interest. All SO and IR level targets within the revised framework for SO 1 weremet or exceeded.
Economic growth a priority
The governments of both the United States and India have a strong interest in seeing that Indiareaches and sustains a higher rate of economic growth. Higher growth will contribute to India’sstability, create jobs, increase markets for U.S. products, and forge closer links between the twocountries.
Higher economic growth will also generate jobs and improve standards of living. Researchindicates that nearly all reductions in poverty rates in India over the last two decades areattributable to economic growth. The newly elected BJP-led government is targeting annualeconomic growth of 7-8 percent. This rate of growth requires sound macroeconomic
7

fundamentals, a strong market orientation, openness to foreign trade and investment, adequatephysical infrastructure and human resources, an appropriate legal/regulatory system, andreasonable political stability. India’s comprehensive economic reform, underway since 1991, hasmoved India in this direction.
In the MPP U.S. Economic Prosperity has been designated by the India Mission as one of fourU.S. national interests of special emphasis. In defining Economic Prosperity, the Department ofState emphasizes the link between U.S.economic prosperity and the stability of internationalfinancial markets, particularly of the big emerging economies. As discussed below, SO 1activities contribute directly to stability of India’s financial sector.
A strong financial sector promotes growth
Higher growth requires financial markets that are able to efficiently mobilize and allocatedomestic and international financial resources efficiently. The broadest possible investorparticipation, both retail and institutional, is vital to help India raise capital for sustainedeconomic growth--including badly needed new infrastructure (costing at least $300 billion overthe next decade) and expanded social services for a rapidly increasing population. Whencomprehensive reform began in 1991, archaic capital market infrastructure, lack of transparencyand weak regulation, oversight and enforcement eroded investors’ confidence in the integrity andpredictability of the market. This limited the intermediation of household savings into productiveinvestments.
USAID has a long history of working to support economic growth in India. In the early 1990s,a highly successful multi-year collaboration helped to create and build India’s large, dynamicprivate sector housing finance institutions. As they have since 1994, USAID/India’s SO 1activities continue to focus on providing technical assistance to India’s critical capital marketinstitutions. During the past four years, USAID has become India’s preeminent partner in capitalmarket development--providing technical assistance, training, and capital support through theUrban Environmental Credit program. This assistance has led directly to: improved transparencyand efficiency of the capital-raising and investment process; modernized trading and post-tradinginfrastructure; adoption of ’best practices’ in market regulation, self-regulation and oversight;improved planning and developing of urban infrastructure; and increased mobilization of privatecapital through innovative models of financing urban infrastructure.
Modification of SO 1
The wording of SO 1 has been revised slightly to better reflect the actual objectives of themission’s work with the financial market, and to focus on results that are within USAID’smanageable interest. The revised SO now emphasizes increasing the capacity of the financialmarkets to mobilize resources, rather than resource mobilization per se. Original SO indicators1.1 and 1.2, which measured the value of new capital raised in the capital market and foreign
8

portfolio investment in India respectively, have been dropped.1 They have been replaced, asdescribed below, by a composite index of capital market development. One of the indicators forIR 1.2 was also modified. The logic behind these changes is that the values for originalindicators 1.1 and 1.2 were determined largely by exogenous factors such as India’smacroeconomic performance, its political stability, or events in other countries such as theturmoil in East Asia. Since all such factors are clearly outside AID’s influence, it makes moresense to focus SO 1 and its indicators on what it can realistically be expected to deliver--strongerfinancial market institutions.
The market is more efficient
At the IR level, SO 1 seeks to increase financial market efficiency (IR 1.1) and improveinstruments for capital mobilization (IR 1.2). Concerning the former, the Indian capital markethas become more efficient over the past year--with clearing and settlement time (Indicator 1.1.1)averaging 4-7 days, as opposed to 14-21 days as recently as 1994. Moreover, USAID consultantsare supporting the on-going shift to a rolling settlement system that will reduce clearing andsettlement to 5 days. Screen-based trading, which was promoted by USAID consultants inprevious years, continued to expand and now accounts for 96 percent of total trades (Indicator1.1.2). Finally, USAID consultants worked with the newly-established National SecuritiesDepository Limited (Indicator 1.1.3) to: improve its operational efficiency; minimize errors andrisk to the depository; and develop and deliver a countrywide public education and awarenessprogram aimed at improving acceptance of the depository concept. The end result of theseefforts is a more efficient capital market with reduced systemic risk. Transaction costs, whichaveraged 5 percent of transaction value in 1993, now average only about 2.5 percent.
Credit ratings, bond issue and model BOT transactions
USAID’s initiatives under IR 1.2 in support of improved instruments for capital mobilizationhave achieved outstanding results. Four municipal governments implemented new models offinancing urban infrastructure (Indicator 1.2.2). Moreover, there is clear evidence that thesemodels are beginning to be noticed, studied, and replicated in a number of other cities.Multilateral donors have approached USAID wanting to work together in the area of municipalfinance. The World Bank sought collaboration with USAID in preparing and implementing itsnew urban lending program. Tamil Nadu will be the initial focus for this cooperative effort. TheAsian Development Bank has also sought to work with USAID--with the result being additionalADB investments in Ahmedabad, Gujarat and Tirupur, Tamil Nadu.
1For FY 1997, Rs. 143,000 million of new capital was raised through the securities markets, as opposed toan Indicator 1.1 target of Rs. 175,000 million. The inflow of foreign portfolio investment was $2.4 billion, whilethe Indicator 1.2 target was $3.5 billion. Political uncertainties, the halting progress of economic reform, andcontinued high interest rates are some of the factors which constrained the ability of India’s capital market tomobilize resources.
9

In Tirupur, USAID consultants continued their work with financial institutions and local officialsto develop India’s first commercially viable Build-Operate-Transfer (BOT) water supply/sewerageproject. The selection process for a BOT contractor is currently underway. This year, the cityof Ahmedabad successfully issued, with USAID support, the first municipal bonds in India--raising approximately $25 million. Three other cities, Pune, Surat, and Vijaywada, are alsodeveloping, with USAID assistance, urban environmental infrastructure projects, including thefinancial packages and the means of mobilizing resources for these projects.
USAID is also working with nine cities (Agra, Ahmedabad, Cochin, Pune, Surat, Tirupur, Shimla,Varanasi, and Vijayawada) to strengthen their financial management via improved accountingsystems, better investment planning, improved pricing of municipal services and revenuecollection, and better budgeting processes. This work is designed to enable local governmentsto enhance their revenue bases, qualify for credit ratings, and eventually be able to access debtfinancing through the capital market.
USAID’s support to the National Housing Bank and housing finance companies concluded inSeptember 1997. During the last year, the volume of shelter-related credit for below medianincome households increased to Rs. 4.8 billion--which is considerably above the planned targetof Rs. 3.5 billion (Indicator 1.2.1).
Increased market capacity/more private capital mobilized
The performance of the two SO-level indicators clearly demonstrates that the capacity of thecapital market to mobilize resources has continued to increase. The capital market developmentindex (Indicator 1.1)--as scored by an independent panel of experts--now stands at 5.72. Thisestablishes the baseline against which future progress in strengthening India’s capital marketinstitutions will be measured. The value of this index was approximately 4.17 a year ago andwas as low as 1.33 in 1994.
These gains are attributable to the gains in market efficiency and transparency described abovetogether with improvements in market regulation, enforcement, and self-regulation. With thesupport of USAID consultants, the Securities and Exchange Board of India (SEBI), the principalregulator of the market, began to develop a collaborative approach to market oversight,surveillance, and enforcement aimed at reducing market fraud and boosting investor confidence.Also, USAID has funded extensive training of regulators and market surveillance andenforcement personnel at the stock exchanges; and, USAID consultants prepared a manual ofinvestigation techniques for market manipulation violations. This culminated in SEBI taking up,for the first time during 1996-97, 182 cases for investigation and 17 cases for prosecution relatingto abusive market practices.
Finally, USAID consultants worked to promote the concept of self-regulation and higherprofessional standards. Assistance to the Association of Mutual Funds of India focused onimproving mutual fund disclosure standards, compliance with those standards, and developingan investor awareness campaign. This effort paid off, with mutual funds mobilizing close to $2
10

billion in the nine months ending December 1997 as compared to $1.5 billion during the sameperiod in 1996.
The amount of private capital used to finance commercially viable urban infrastructure duringthe last year (Indicator 1.2) grew to about Rs. 3.4 billion--an increase of more than 40 percentover the previous year. This increase was due, in part, to USAID’s efforts to developcommercially viable infrastructure programs in a number of municipalities. These programsemphasize improved municipal financial management, better project development, and morecareful coordination of construction phases with the availability of needed financial resources.
2. Expected Progress through FY 2000 and Management Actions
The FIRE Project will be extended for an additional five years to September 2003, at which pointSO 1 planned results are expected to have been achieved. By that date, India’s capital marketshould have reached levels of efficiency, transparency, and regulatory oversight consistent withinternational norms and sufficient to instill reasonable investor confidence. Furthermore, themarket and its institutions should be sufficiently developed so that further external assistance isnot required. Similarly, models for commercial financing of urban infrastructure will besufficiently developed, tested, and replicated so that municipal finance systems in partnerstates/municipalities provide effective support to better urban management.
During the extension period for FIRE, work to strengthen capital market institutions andregulations will focus on: (i) helping major stock exchanges move to a rolling settlementmechanism and establish a better interface with the depository; (ii) helping SEBI and the stockexchanges develop a stockwatch system for market surveillance and strengthen their investigativeand enforcement capabilities; (iii) helping SEBI design and develop a regulatory framework forfutures and options markets; (iv) assisting with the continued development of self-regulatoryorganizations for market participants; and (v) developing the debt market.
Work to improve municipal access to capital markets will focus on developing effective systemsof municipal finance--characterized by greater access to capital markets, increased revenuegeneration, and better financial management. The successes to date have generated tremendousawareness and demand for similar assistance from other cities. SO 1 will work with at least threeadditional cities during the extension period. It will also extend its partnership on municipalfinance to three state-level governments, where decisions are reached affecting municipalinfrastructure investments. This work will continue to promote: necessary policy reforms;adoption of improved financial management practices and innovative approaches to revenueenhancement; and increased mobilization of resources through the capital market.
During the next year, the SO 1 team will explore the possibility of broader approaches toresource mobilization in support of economic growth--whether through the capital market, privateinvestment in infrastructure, or improved fiscal policies. Several new activities under the currentor revised SO are being explored, and it is likely that one or more of these will start during the
11

next year. One possible initiative would build more effective linkages between India’s capitalmarkets and community-based financial institutions to help address the shelter and infrastructureneeds of lower income families. Another possible initiative would support the introduction of"best practice" microfinance techniques into the Indian financial sector. Other initiativessupporting greater private capital mobilization for infrastructure investment and improved fiscalpolicies at the state level are also possible.
12

PERFORMANCE DATA TABLE
______________________________________________________________________________________ORGANIZATION/PROGRAM: USAID INDIASTRATEGIC OBJECTIVE: SO 1 INCREASED CAPACITY OF FINANCIAL MARKETS TO
MOBILIZE RESOURCESAPPROVED: March 24, 1998______________________________________________________________________________________INDICATOR: 1.1 Index of Capital Market Development______________________________________________________________________________________UNIT OF MEASURE: Index Number______________________________________________________________________________________SOURCE DOCUMENT:SOURCE ORGANIZATION : Panel of independent capital market experts______________________________________________________________________________________INDICATOR DESCRIPTION: The index of Capital Market Development captures systemic
development in six critical areas of the capital market. It is thesimple arithmetic mean of the scores (on a 12 point scale) in each ofthese six areas. The higher the score for a particular area, the moredeveloped is that area. The index is attached to this table.
______________________________________________________________________________________YEARS PLANNED PLANNED ACTUAL
LOW HIGH______________________________________________________________________________________1994 1.331995 2.171996 3.171997 4.171998 5.00 5.721999 6.002000 6.83______________________________________________________________________________________COMMENTS: 1. New indicator replaces last year’s SO indicators 1.1 and 1.2.
2. The index reflects the status of capital market development as of March 31 of eachyear.
3. The six major areas of market development are: (i) market oversight, surveillance andenforcement; (ii) debt market; (iii) information infrastructure; (iv) trade clearance andsettlement infrastructure; (v) self-regulation/licencing, testing and certification; and(vi) risk allocation and management infrastructure.
4. For years 1994 - 1997, values for the capital market development index wereobtained from scoring done by USAID staff. For 1998, the value of the capitalmarket development index was obtained from scoring done by an independent panelof capital market experts in March 1998.
13

Attachment
SO 1.1 INCREASED CAPACITY OF CAPITAL MARKETS TO MOBILIZE RESOURCES FOR ECONOMIC GROWTH
Objective Indicator Stage/(Score) Score
1(1-3)
2(4-6)
3(7-9)
4(10-12)
I. Marketoversight,surveillanceandenforcement:
Enhancedinvestorconfidencethroughimprovedoversight,surveillance, andenforcement.
Extent to which acollaborativesystem for marketoversight,surveillance, andenforcement hastaken shape, andfunctioning.
Minimal or nosystemicoversight,surveillance, andenforcement forthe market inplace, and littlemovement towardreform.
SEBI acknowledgesneed for integrated,collaborative marketoversight,surveillance, andenforcement andenters into dialogwith stock exchanges.
’Best practices’ inmarket oversight,surveillance, andenforcement areidentified andbeing implementedin stages.
Effective marketoversight,surveillance ,and enforcementare in place.
II. Debtmarket:
Deepen thecapital marketby promoting anactive secondarydebt market.
Extent to which aneffective policyand regulatoryregime as well asefficient tradingand settlementinfrastructure, is inplace for the debtmarket.
The debt marketis illiquid andnarrow withinefficient marketinfrastructure.
Need for wellregulated, liquid andefficient secondarymarket for debt isrecognized with keyconstraintsidentified/analyzedand industry forumfor dialogestablished.
Policy and tradinginfrastructureissues beingaddressed.
An effectiveregulatory andpolicy regime,and efficienttrading andsettlementinfrastructuresupport an activesecondary debtmarket.
14

III. Informationinfrastructure:
Make true andfair marketinformationavailable toinvestors on acontinuous basis.
Extent to whichsystemic networkfor gathering anddissemination ofquality marketinformation on realtime basis is inplace.
There is no legalframeworkrequiringcollection anddissemination ofcompanyinformation, withfiling anddissemination ofinformation doneon an ad-hocbasis.
SEBI recognizes theneed for improveddata gathering anddissemination system,and issues enhanceddisclosurerequirements underthe existing legalframework.
Legal mandate forcentralizedcollection anddissemination ofcompanyinformation inplace,with stockexchanges andother SROsstrengthening their’standalone’systems forgathering anddissemination ofinformation.
Accurate marketinformationavailable on acontinuous basisthrough anEDGAR typesystem.
IV. Tradeclearance andsettlementinfrastructure:
Reduce systemicrisk for investorsthroughenhanced tradeclearance andsettlementsystems.
Extent to whichtransparent andefficient trading,clearing andsettlement systemsare in place.
Existing trading,clearing andsettlementsystems arearchaic,inefficient andnon-transparent.
Need for transparentand efficient trading,clearing andsettlement systemsrecognized, with keyconstraints identified,analyzed, andenabling legislationbeing drafted.
Enablinglegislation andregulatoryframework inplace anddepositorydeveloped.
Systemic risksreduced due toenhancedclearing andsettlementsystem, rollingsettlementsystem, andfunctioning andwidely useddepository.
15

V. Self-regulation/licensing,testing andcertification:Brokerlicensing:
Improvedinvestorconfidencethrough higherprofessionalstandards andbetterregulation/self-regulation bymarketintermediaries.
Degree to whichassociations ofmarketintermediariesraise theirprofessionalstandards, andregulatethemselves in thepublic interest.
Associations ofmarketintermediaries notin place. Role ofprofessionalstandards ininvestorconfidence notrecognized.
Market intermediariessuch as mutual funds,brokers, debt andderivatives dealersetc recognize needfor industryassociations to raiseprofessional standardsand develop theindustry.
Some marketintermediariesorganizethemselves intoindustryassociations todevelop ’bestpractices’ in self-regulation,disclosures andprofessionalconduct. Programfor certificationand testing forsome categories ofintermediariesunderdevelopment.
Framework forSRO regulationsin place, withimproved self-regulation andprofessionalstandards ofmarketintermediaries.
VI. Riskallocation andmanagementinfrastructure:
Marketparticipants havefull access to arange of riskmanagementproducts.
Extent to which amarket forstandardized,regulated riskmanagementproducts isestablished andoperating.
No product forrisk managementexists.
Need for mechanismto hedge riskacknowledged, andkey constraints totheir availabilityincluding legal onesidentified andanalyzed.
Regulatoryframework andtrading andsettlementinfrastructureissues--bothoperational andtraining-- for riskmanagementproducts beingaddressed andunderdevelopment.
Riskmanagementproductsavailable andbeing used bymarketparticipants.
16

Cap mkt.Objective I II III IV V VI index
Year (target)1994 2 1 1 2 1 1 1.331995 3 2 1 3 2 2 2.171996 4 3 2 4 3 3 3.171997 5 4 3 5 4 4 4.171998 6 5 4 6 5 5 5.171999 7 6 4 7 6 6 6.002000 8 6 5 8 7 7 6.832001 9 7 6 9 8 8 7.832002 10 8 7 10 9 9 8.832003 11 9 8 11 10 10 9.83
17

PERFORMANCE DATA TABLE
_____________________________________________________________________________________ORGANIZATION/PROGRAM: USAID INDIASTRATEGIC OBJECTIVE: SO 1 INCREASED CAPACITY OF FINANCIAL MARKETS TO
MOBILIZE RESOURCESAPPROVED: July 09, 1997______________________________________________________________________________________INDICATOR: 1.2 Increased amount of private capital used to finance
commercially viable urban environmental infrastructure______________________________________________________________________________________UNIT OF MEASURE: Rupees in millions (cumulative)______________________________________________________________________________________SOURCE DOCUMENT: Project reports, sector assessment, annual evaluationsSOURCE ORGANIZATION: USAID, CCI, NIUA, ILFS, HUDCO______________________________________________________________________________________INDICATOR DESCRIPTION:______________________________________________________________________________________YEARS PLANNED PLANNED ACTUAL
LOW HIGH______________________________________________________________________________________1994 01995 01996 200 2001997 1,650 2,3901998 2,650 3,3901999 3,7502000 4,250______________________________________________________________________________________COMMENTS: Data reported for GOI fiscal year: April 1 to March 31.
Actual data from April 1997 to January 1998 is reported in 1998.
18

PERFORMANCE DATA TABLE
_____________________________________________________________________________________ORGANIZATION/PROGRAM : USAID INDIASTRATEGIC OBJECTIVE: SO 1 INCREASED CAPACITY OF FINANCIAL MARKETS TO
MOBILIZE RESOURCESINTERMEDIATE RESULT: IR 1.1 INCREASED FINANCIAL MARKET EFFICIENCY
THROUGH POLICY AND REGULATORY REFORMSAPPROVED: July 09, 1997______________________________________________________________________________________INDICATOR: 1.1.1 Clearing and settling time of traded securities reduced in
securities markets______________________________________________________________________________________UNIT OF MEASURE: Number of days______________________________________________________________________________________SOURCE DOCUMENT: SEBI, Price Waterhouse and stock exchange reportsSOURCE ORGANIZATION : SEBI, Price Waterhouse and stock exchanges______________________________________________________________________________________INDICATOR DESCRIPTION:______________________________________________________________________________________YEARS PLANNED PLANNED ACTUAL
LOW HIGH______________________________________________________________________________________1994 14-211995 10-21 4-211996 12-20 4-161997 10-18 4-71998 4-7 4-71999 T+5*2000 T+5**______________________________________________________________________________________COMMENTS: *T+5 rolling settlement system applied to stocks accounting for 5%of market
capitalization**T+5 rolling settlement system applied to stock accounting for 10% of marketcapitalizationData reported for GOI fiscal year. April 1 to March 31.Actual data from April 1997 to March 1998 is reported in 1998
19

PERFORMANCE DATA TABLE
______________________________________________________________________________________ORGANIZATION/PROGRAM: USAID INDIASTRATEGIC OBJECTIVE: SO 1 INCREASED CAPACITY OF FINANCIAL MARKETS TO
MOBILIZE RESOURCESINTERMEDIATE RESULT: IR 1.1 INCREASED FINANCIAL MARKET EFFICIENCY
THROUGH POLICY AND REGULATORY REFORMSAPPROVED: July 09, 1997______________________________________________________________________________________INDICATOR: 1.1.2 Price transparency improved in securities markets______________________________________________________________________________________UNIT OF MEASURE: Percentage______________________________________________________________________________________SOURCE DOCUMENT: SEBI and Price Waterhouse reportsSOURCE ORGANIZATION: SEBI and Price Waterhouse______________________________________________________________________________________INDICATOR DESCRIPTION: Proportion of screen based trading to total volume traded and
number of stock exchanges using screen based trading system.______________________________________________________________________________________YEARS PLANNED PLANNED ACTUAL
LOW HIGH______________________________________________________________________________________1994 No system1995 10% (1 exchange) 10% (1 exchange)1996 20% (2 exchanges) 57% (5 exchanges out of 23)1997 80% (7 exchanges) 96% (16 exchanges out of 23)1998 85% (8 exchanges)1999 90% (18 exchanges)2000 98% (19 exchanges)______________________________________________________________________________________COMMENTS: Data reported for GOI fiscal year: April 1 to March 31.
20

PERFORMANCE DATA TABLE
______________________________________________________________________________________ORGANIZATION/PROGRAM: USAID INDIASTRATEGIC OBJECTIVE: SO 1 INCREASED CAPACITY OF FINANCIAL MARKETS TO
MOBILIZE RESOURCESINTERMEDIATE RESULT: IR 1.1 INCREASED FINANCIAL MARKET EFFICIENCY
THROUGH POLICY AND REGULATORY REFORMSAPPROVED: July 09, 1997______________________________________________________________________________________INDICATOR: 1.1.3 Securities depository system established and functioning______________________________________________________________________________________SOURCE DOCUMENT: SEBI, Price Waterhouse and NSDL reportsSOURCE ORGANIZATION: SEBI, Price Waterhouse and NSDL______________________________________________________________________________________YEARS PLANNED ACTUAL
QUALITATIVE QUALITATIVE______________________________________________________________________________________1994 System not available
1996 Legislation enacted and Temporary legislation inregulation promulgated effect through ordinance
1997 Legislation enacted, Regulation Legislation enacted andpromulgated and Depository functioningDepository functioning
1998 Depository servicing stocksaccounting for 30% of marketcapitalization
1999 Depository servicing stocks accountingfor 50% of market capitalization
2000 Depository servicing stocks accountingfor 60% of market capitalization
______________________________________________________________________________________COMMENTS: Data reported for GOI fiscal year: April 1 to March 31.
21

PERFORMANCE DATA TABLE
______________________________________________________________________________________ORGANIZATION/PROGRAM: USAID INDIASTRATEGIC OBJECTIVE: SO 1 INCREASED CAPACITY OF FINANCIAL MARKETS TO
MOBILIZE RESOURCESINTERMEDIATE RESULT: IR 1.2 IMPROVED INSTRUMENTS FOR CAPITAL
MOBILIZATIONAPPROVED: July 09, 1997______________________________________________________________________________________INDICATOR: 1.2.1 Increased volume of shelter related credit to below median
income households______________________________________________________________________________________UNIT OF MEASURE: Rs. million (cumulative)______________________________________________________________________________________SOURCE DOCUMENT: NHB ANNUAL REPORT/SECTOR ASSESSMENT REPORT,
MSS CONTRACTOR REPORTSOURCE ORGANIZATION: NHB, MSS CONTRACTOR______________________________________________________________________________________INDICATOR DESCRIPTION:______________________________________________________________________________________YEARS PLANNED PLANNED ACTUAL
LOW HIGH______________________________________________________________________________________1992 2,3001993 2,550 1,2501994 2,800 3,1101995 3,050 3,2501996 3,300 4,0801997 3,550 4,830______________________________________________________________________________________COMMENTS: Data reported for GOI fiscal year: April 1 to March 31.
This is the last year of reporting result since this activity ended on September30, 1997.
22

PERFORMANCE DATA TABLE
______________________________________________________________________________________ORGANIZATION/PROGRAM: USAID INDIASTRATEGIC OBJECTIVE: SO 1 INCREASED CAPACITY OF FINANCIAL MARKETS TO
MOBILIZE RESOURCESINTERMEDIATE RESULT: IR 1.2 IMPROVED INSTRUMENTS FOR CAPITAL
MOBILIZATIONAPPROVED: March 24, 1998______________________________________________________________________________________INDICATOR: 1.2.2 Increased number of Municipal/State/Local Governments
adopting USAID-supported models of financing urbaninfrastructure
______________________________________________________________________________________UNIT OF MEASURE: Number of Municipal/State/Local Governments (cumulative)______________________________________________________________________________________SOURCE DOCUMENT: CCI/NIUA and Project ReportsSOURCE ORGANIZATION: CCI/NIUA______________________________________________________________________________________INDICATOR DESCRIPTION:______________________________________________________________________________________YEARS PLANNED PLANNED ACTUAL
LOW HIGH______________________________________________________________________________________1994 01995 1 11996 2 21997 3 31998 4 41999 52000 6______________________________________________________________________________________COMMENTS: Data reported for GOI fiscal year April 1 to March 31.
Actual data from April 1997 to January 1998 is reported in 1998.New indicator to replace the existing IR 1.2.2.
23

B. Strategic Objective 2: Reduced Fertility and Improved ReproductiveHealth in North India
Stable population in India a global issue of special emphasis
Successful achievement of USAID/India's SO 2 will be the most significant potentialcontribution to the Agency’s global objective of population stabilization and improvedreproductive health. North India is perhaps the largest population pool (400 million) inthe world which has yet to make significant progress toward stabilizing its growth. TheAgency will be at pains to achieve its global objectives in population stabilization andimproved reproductive health without a successful program to reduce fertility and improvereproductive health in northern India.
Activities financed under SO 2 are featured in the MPP goal of "Stable Population" andalso noted in the MPP are the critical linkages between the goals (and USAID’s role viaSO 2) of "Stable Population ", "Regional Stability", "Broad-based Economic Growth" and"Sustainable Environment".
1. Performance Analysis
In 1997, planned targets were met or exceeded for each IR despite three changes ofgovernment in Uttar Pradesh. Overcoming an initial decline in service availabilityfollowing the removal of incentives for sterilization targets, USAID’s program doubledthe cumulative population covered by reproductive health services through the privatesector to almost 20 million. The availability of family planning spacing methods ofcondoms and pills through local chemists and other outlets grew markedly. Twentymillion condoms and 300,000 cycles of oral contraceptives were sold through USAID-supported programs. The quality of services improved through the training of 30,000health care providers.
SO 2 results can be reached by FY 2004
In July/August 1997, a comprehensive assessment of the Innovations in Family PlanningServices Project was conducted. The assessment methodology included ten independentstudies (customer surveys with over 3000 female respondents), multiple field visits, andinterviews and meetings with key stakeholders, partners, beneficiaries and senior technicalexperts in India and Washington. The findings provide a compelling picture of theprogress being made in increasing quality, access, and demand for family planning andother reproductive health services. The conclusion drawn by the evaluators, the seniortechnical experts and other reviewers is that the program has demonstrated the potentialto achieve SO 2 targets for improved reproductive health and reduced fertility in NorthernIndia in a time frame that extends to FY 2004.
Based on the findings of the assessment, USAID/India submitted a revised SO and datatables detailing intermediate results and performance indicators to USAID/Washington.They were approved in December 1997. The revised SO 2 reaffirms the originalobjective of fertility reduction in northern India, but reflects the emphasis on broaderreproductive health concerns, client-centered care and quality of services. The SO 2
24

submission this year reports on the indicators in place from last year and providesbaseline data for the "interim" indicators agreed to during the last R4 review. Notably,these interim indicators all fall within the new set of approved indicators for the revisedSO 2 which will be reported on next year. Indicators reported on for this year, bothprevious existing indicators and those under the revised and expanded strategy, do notinclude results from Madhya Pradesh for the Women and Child Health (WACH) activity.Development on WACH was discontinued when USAID and the GOI were unable toreach agreement on implementing arrangements, but select reproductive healthcomponents of the WACH design have been incorporated into the Uttar Pradesh program.
The SO 2 program is beginning to reach a critical mass of people with new and improvedquality services. The program has successfully channeled funds through the UttarPradesh-based State Innovation in Family Planning Services Agency (SIFPSA) to directlystrengthen public sector institutions involved in reproductive health. It has also supportednew private sector partners. The last year has seen tremendous growth in the size, focusand impact of the program. and the impact has been measurable. New key counterpartsin the Uttar Pradesh Government and a dynamic new executive director of SIFPSA havebrought strong leadership to the program. Technical assistance from several USAID-funded cooperating agencies has facilitated program expansion, achievement ofbenchmarks and promotion and integration of quality standards. USAID has been ableto strengthen its partnerships with the implementing agency, the state and centralgovernments and with our cooperating agencies to increase communication and create ashared vision. Last and certainly not least, a comprehensive social marketing strategy hasbeen approved by the GOI, SIFSPA and USAID, thereby overcoming what had been aserious potential constraint to achieving the desired results for this strategic objective.
Access expanded and quality much improved
There have been substantial gains in achieving key intermediate results (IR in the pastyear, equaling or exceeding targets in five of six indicators.
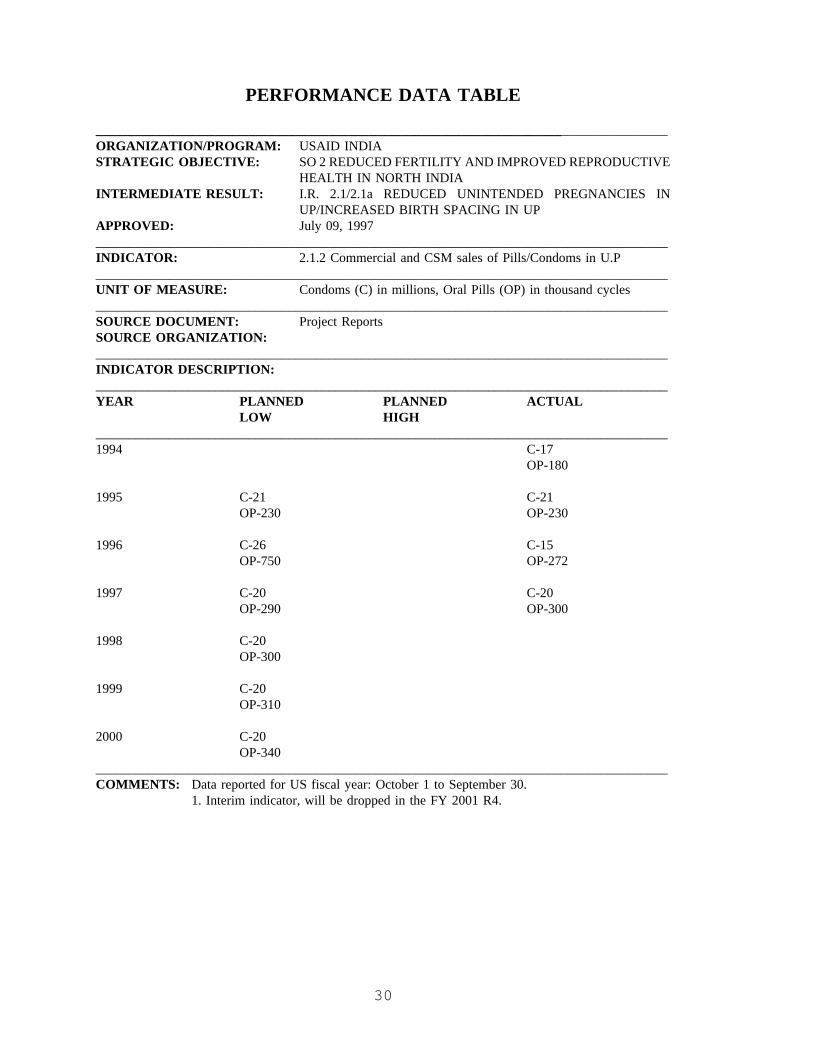
• An innovative partnership with a commercial firm, Hindustan Latex, Ltd., began inMarch 1997 to extend the reach of commercial spacing family planning methods--condoms and pills--into rural areas and towns with less than 20,000 population. Thiseffort, as well as the on-going marketing/distribution program with PopulationServices International, resulted in sales of 20 million condoms and 300,000 cycles oforal pills, an increase of 33 percent and 10 percent respectively, over 1996 levels.The condom sales equal the planned IR target of 20 million, while for pills, sales of300,000 exceeded the IR target of 290,000 cycles by three percent. (Indicator 2.1.2)
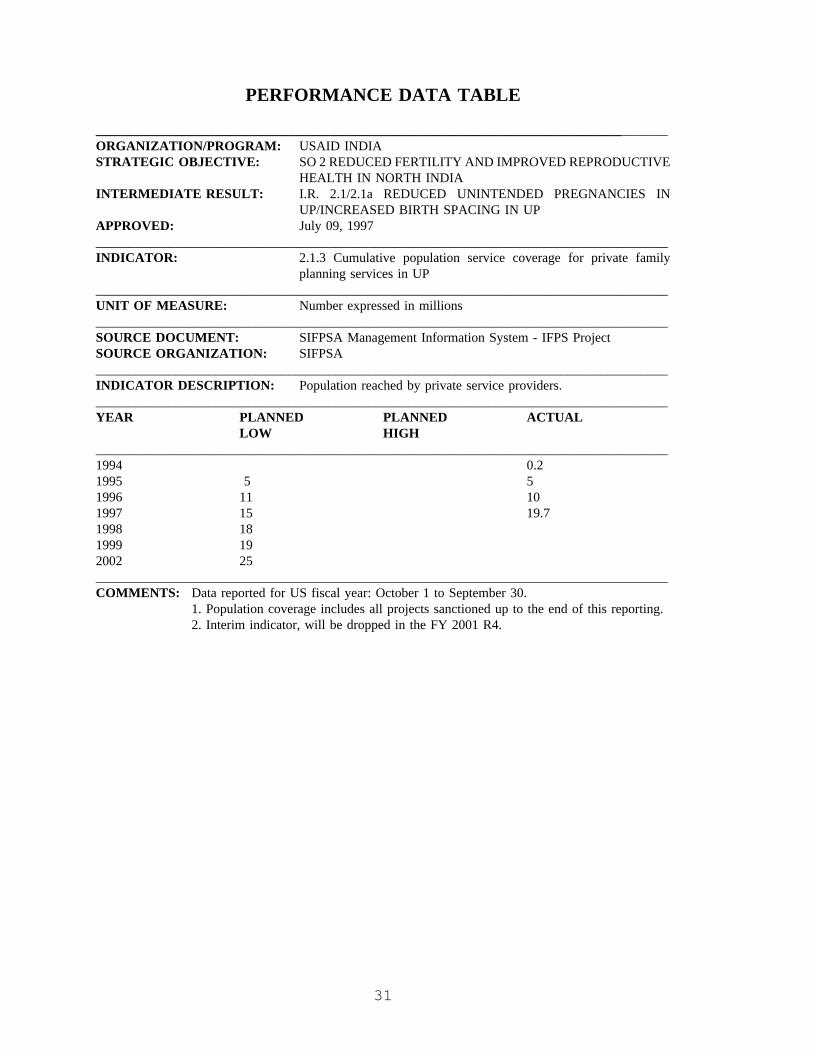
• The cumulative population covered by private service providers in Uttar Pradeshdoubled from last year's level to 19.7 million persons, about 30 percent over the IRtargeted level. (Indicator 2.1.3)
• The number of providers trained increased dramatically to 30,400--almost doublingthe planned IR target level in aggregate (Indicator 2.1.4). This was due to theunexpectedly large number of government service providers trained under thegovernment's new target free, reproductive health initiative. In responding to the GOI
25

request for USAID to support this high priority training to operationalize the newtarget free approach, other public sector training planned under SO 2 was deferred,and the planned level of 3,000 government providers to be trained was not quite met.Private sector provider training IR targets were exceeded by 16 percent.
In addition to the progress in achieving the intermediate results, there have beensubstantial gains in access and quality, as indicated from the rapid assessments and avariety of household surveys at the district level. These include:
• More women--about 50 percent of eligible women of reproductive age--are routinelybeing contacted and counseled on family planning methods by community-basedworkers in areas served by the activity. An independent assessment of trained dairycooperative community based workers (Cads) in two districts confirmed that 96percent are providing accurate counseling.
• Contraceptive prevalence in private sector activities (based on five rapid assessmentsof NGO activities) is increasing; it varies among districts between a low of 13 percentto a high of 36 percent. While sterilization is still the dominant method, thepercentage increase of spacing methods has been significant.
• In the six focus districts, an independent survey validated that supply points for oralpills and condoms increased over six-fold from 269 in 1995 to 1,879 in 1997, withrural women reporting more than a 70 percent increase in use of modern temporarymethods.
• In two districts served by dairy cooperative workers at the community level, anindependent survey confirmed that 95 percent of workers were providing some familyplanning service, and of those, 90 percent had oral pill and condom supplies on hand.
• An independent survey of sterilization acceptors indicated 85 percent received follow-up visits and medicine packets to prevent post-operative infection--representing a six-fold increase in the last two years.
• Operations research in Agra district, using a pregnancy-based approach to identify andserve pregnant women with antenatal care and with other post partum/reproductivehealth services (i.e., family planning after childbirth), found that women receivingiron and folic acid tablets and tetanus toxoid had increased from by 34 to 41 percent,an increase of over 20 percent; and contraceptive prevalence increased from 31 to 34percent, an increase of 10 percent, with greatly expanded use of spacing methods,within a span of two years.
Significant progress has also been made in communication and demand generationprograms:
• The $2 million information, education and communication (IEC) campaign isunderway. The IEC concept was designed and validated through field testing usingthe slogan "let’s talk about it." This theme, which is heavily focussed on youngercouples, has been carried into counseling materials now in production for 10,000
26
workers, with similar efforts planned for mass media television, radio messages andlocal folk media.
• A contract has been signed to initiate a major communications campaign promotingthe use of low dose pills in urban areas covering 95 million people in four northernStates of India including Uttar Pradesh. The resources for the campaign succeededin leveraging support from the market leader in oral contraceptives in India forincreasing their market share and distribution in this area.
Significant USAID support has also gone to expanding commercial sector production,distribution and marketing of contraceptives with the following results.
• Two condom producers received loans for expanding the marketing and distributionnationwide in 1997. Of their total distribution, (15.7 million condoms were sold inUttar Pradesh, adding to the 20 million subsidized condoms sales supported byUSAID’s program there).
• Two IUD manufacturers sold over 212,000 IUDs in a nascent commercial market forIUDs in India, though sales in Uttar Pradesh were limited.
There has been a significant breakthrough in contraceptive marketing. USAID, SIFPSAand the GOI, following an in-depth contraceptive market segmentation study, havedeveloped and approved a comprehensive marketing strategy and plan which includes ananalysis of the program, suggested interventions and acceptable feasible mechanisms forimplementation, to cover the whole state of Uttar Pradesh over the next five years. Thisincludes both the supply and distribution for oral contraceptives and condoms in rural andurban areas. The expansion of the contraceptive marketing component will amplifypublic-private-commercial partnerships to expand quality, access and choice toreproductive health services for the people of Uttar Pradesh.
Agreement also has been reached on the design and implementation of a second NationalFamily Health Survey which will serve the following two purposes: (1) essential data willbe provided on the national child and reproductive health program’s progress which canbe used for monitoring, evaluation, and validation; and (2) new questions will be addedto provide more comprehensive information on maternal and child health, micronutrientstatus, program effort and quality, reproductive health, and costs and sources of supplyfor key preventive services.
In conjunction with the Public Health Services and NIH, USAID/India has initiated amajor new program of Indo-US collaboration to develop and test new contraceptivetechnologies.
2. Expected Progress through FY 2000 and Management Actions
SO 2 progress, as validated by the Midterm Assessment, provides a strong basis forconfidence that the program can achieve its objectives by FY 2004. The revised SOsupports important additional intermediate results for quality of services and reproductivehealth. To bring about this expansion and broadening of efforts through other select
27

reproductive health interventions in up to 28 districts of Uttar Pradesh, the Missionexpects that:
• Our partner implementing agency, SIFPSA, in Uttar Pradesh will be strengthenedthrough hiring of additional staff for both programming and financial management,and the fully functioning management information system--which has madeconsiderable progress in 1997--will be in place.
• Major program approaches validated by field research, namely strengthening of publicsector service delivery and broad private sector participation including cooperatives,private practitioners, and community based non-government organizations, will bebuilt upon.
• A new district-level programming approach that promotes an integrated public-privateprogramming will be implemented in six districts of Uttar Pradesh throughparticipatory, decentralized district planning and delegation of authority to the districtlevel.
• Community participation will continue to be broadened through linkages withwomen’s groups and local self government.
• Increased provision of other select reproductive health interventions through improvedantenatal care and attended deliveries will be built into the program to strengthen careduring pregnancy and improved birth outcomes for mothers and newborns.
• Based on the breakthrough agreement on a major contraceptive marketing program,expanded program activities will be initiated to broaden access to oral contraceptivesand condoms to consumers in urban and rural areas of Uttar Pradesh
The anticipated results of these major activities under the revised SO 2 are reflected inthe proposed new set of Performance Data Tables included in this R4 which establishescurrent baselines and planned targets. This new set of tables also incorporates thoseinterim indicators agreed to in last year’s R4 review. The revised SO 2 plan to expandSO 2 activities into 28 districts in Uttar Pradesh, simultaneously to support statewidemarketing, communication, and logistics strengthening activities and extend the programto FY 2004 provides a strong, comprehensive basis for the achievement of the revised SO2 objectives.
USAID performance based disbursement system fully operational
The unique funding mechanism of the program’s performance-based disbursement system,in which funds are disbursed against the achievement of agreed-upon performancebenchmarks, will continue. This system requires that sufficient funding is on hand tofulfill the necessary commitments required for each set of performance benchmarks andalso allow the Mission to continuously negotiate new benchmarks with the Governmentof India and SIFPSA to maintain implementation momentum. USAID and SIFPSAproject that another 27 benchmarks with a value of $10 million will be met by April1998. Given the additional activities under SO 2, the Mission projects over $36 million
28
expenditures in the next two fiscal years. With these projected expenditures, the Missionexpects the SO 2 pipeline to be about $38 million by September 30, 2000, of which only$5 million would be uncommitted. The Mission considers the size of the pipeline to bereasonable for the reasons mentioned above.
OYB in $20 million range required for results
USAID, SIFPSA and the GOI recently agreed to the third set, and are negotiating thefourth set, of performance benchmarks to support SO 2’s revised strategy. It isanticipated that the benchmark negotiations for the fourth set will be completed by May1998; the value of these two sets of benchmarks will be approximately $25 million. Tohelp reduce the pipeline and assure that the program is sufficiently capitalized on a timelybasis, USAID and SIFPSA have agreed on a significant design change for the newbenchmarks which permits smaller, more frequent payments that more accurately reflectprogram progress and accruals, assures timely resource flow to SIFPSA to fund criticalactivities for expansion and helps reduce the SO 2 pipeline. Given the planned FY 98obligation level of $9.474 million, virtually all obligated funds will be committed afteragreement is reached on the new benchmarks. The Mission proposed obligation levelsfor SO 2 of $23.4 million in FY 99, and of $19.0 million in FY 2000 are the minimumlevel to fund the next set of benchmarks planned for FY 2000 and support other programactivities and essential technical assistance that will permit expansion to 28 districts andthe additional activities under the revised SO 2--reproductive health, contraceptivemarketing, and integrated district planning. Since SO 2 funding at these projected levelsalready necessitates a funding cut for global field support of about nine percent per year,any further reduction will jeopardize USAID/India and Agency efforts to meet thisimportant strategic objective.
29
PERFORMANCE DATA TABLE
______________________________________________________________________________________ORGANIZATION/PROGRAM: USAID INDIASTRATEGIC OBJECTIVE: SO 2 REDUCED FERTILITY AND IMPROVED REPRODUCTIVE
HEALTH IN NORTH INDIAINTERMEDIATE RESULT: I.R. 2.1/2.1a REDUCED UNINTENDED PREGNANCIES IN
UP/INCREASED BIRTH SPACING IN UPAPPROVED: July 09, 1997______________________________________________________________________________________INDICATOR: 2.1.2 Commercial and CSM sales of Pills/Condoms in U.P______________________________________________________________________________________UNIT OF MEASURE: Condoms (C) in millions, Oral Pills (OP) in thousand cycles______________________________________________________________________________________SOURCE DOCUMENT: Project ReportsSOURCE ORGANIZATION:______________________________________________________________________________________INDICATOR DESCRIPTION:______________________________________________________________________________________YEAR PLANNED PLANNED ACTUAL
LOW HIGH______________________________________________________________________________________1994 C-17
OP-180
1995 C-21 C-21OP-230 OP-230
1996 C-26 C-15OP-750 OP-272
1997 C-20 C-20OP-290 OP-300
1998 C-20OP-300
1999 C-20OP-310
2000 C-20OP-340
______________________________________________________________________________________COMMENTS: Data reported for US fiscal year: October 1 to September 30.
1. Interim indicator, will be dropped in the FY 2001 R4.
30
PERFORMANCE DATA TABLE
______________________________________________________________________________________ORGANIZATION/PROGRAM: USAID INDIASTRATEGIC OBJECTIVE: SO 2 REDUCED FERTILITY AND IMPROVED REPRODUCTIVE
HEALTH IN NORTH INDIAINTERMEDIATE RESULT: I.R. 2.1/2.1a REDUCED UNINTENDED PREGNANCIES IN
UP/INCREASED BIRTH SPACING IN UPAPPROVED: July 09, 1997______________________________________________________________________________________INDICATOR: 2.1.3 Cumulative population service coverage for private family
planning services in UP______________________________________________________________________________________UNIT OF MEASURE: Number expressed in millions______________________________________________________________________________________SOURCE DOCUMENT: SIFPSA Management Information System - IFPS ProjectSOURCE ORGANIZATION: SIFPSA______________________________________________________________________________________INDICATOR DESCRIPTION: Population reached by private service providers.______________________________________________________________________________________YEAR PLANNED PLANNED ACTUAL
LOW HIGH______________________________________________________________________________________1994 0.21995 5 51996 11 101997 15 19.71998 181999 192002 25______________________________________________________________________________________COMMENTS: Data reported for US fiscal year: October 1 to September 30.
1. Population coverage includes all projects sanctioned up to the end of this reporting.2. Interim indicator, will be dropped in the FY 2001 R4.
31

. PERFORMANCE DATA TABLE
______________________________________________________________________________________ORGANIZATION/PROGRAM: USAID INDIASTRATEGIC OBJECTIVE: SO 2 REDUCED FERTILITY AND IMPROVED REPRODUCTIVE
HEALTH IN NORTH INDIAINTERMEDIATE RESULT: I.R. 2.1/2.1a REDUCED UNINTENDED PREGNANCIES IN
UP/INCREASED BIRTH SPACING IN UPAPPROVED: July 09, 1997______________________________________________________________________________________INDICATOR: 2.1.4 Number of providers given technical/behavioral service delivery
training in UP______________________________________________________________________________________UNIT OF MEASURE: Number______________________________________________________________________________________SOURCE DOCUMENT: SIFPSA Management Information System - IFPS ProjectSOURCE ORGANIZATION: SIFPSA______________________________________________________________________________________INDICATOR DESCRIPTION: Number of people trained in competency based training including (i)
public sector; (ii) private sector; and (iii) others (adolescents andcommunity members).
______________________________________________________________________________________YEAR PLANNED PLANNED ACTUAL
LOW HIGH_______________________________________________________________________________1995 i. 500
ii. 1,300iii. 0
1996 i. 1,000ii. 1,500iii. 4,800
1997 i. 3,000 i. 2,600ii. 3,000 ii. 3,500iii 10,000 iii. 24,300
1998 i. 4,000ii. 2,000iii. 10,000
1999 i. 4,000ii. 2,000iii. 10,000
2000 i. 4,000ii. 2,000iii 10,000
______________________________________________________________________________________COMMENTS: Data reported for US fiscal year: October 1 to September 30.
1. Data reported for UP only.2. Interim indicator, will be dropped in the FY 2001 R4.
32

SO 2 INDICATORS FOR R4 REPORTING EFFECTIVE FY 2001
The following eleven tables are the set of SO 2 indicators with baselines thatUSAID/India will report on beginning in the R4 FY 2001.
33

PERFORMANCE DATA TABLE
______________________________________________________________________________________ORGANIZATION/PROGRAM: USAID INDIASTRATEGIC OBJECTIVE: SO2 REDUCED FERTILITY AND IMPROVED
REPRODUCTIVE HEALTH IN NORTH INDIAAPPROVED: December 19, 1997______________________________________________________________________________________INDICATOR: 2.1 Percent of pregnant women receiving antenatal care______________________________________________________________________________________UNIT OF MEASURE: Percentages for 28 perform districts______________________________________________________________________________________SOURCE DOCUMENT: NFHS Surveys 1992/93, PERFORM Surveys 2001/2, 2003/4SOURCE ORGANIZATION: NFHS, PERFORM______________________________________________________________________________________INDICATOR DESCRIPTION: Percent of pregnant women receiving at least two doses of tetanus
toxoid and 100 iron and folate tablets in 28 PERFORM districts.______________________________________________________________________________________YEAR PLANNED PLANNED ACTUAL
LOW HIGH______________________________________________________________________________________1993 302002 362004 40______________________________________________________________________________________COMMENTS : NFHS survey was conducted in 1992-93 and PERFORM survey will be conducted
during 2001/2, and 2003/4.
34
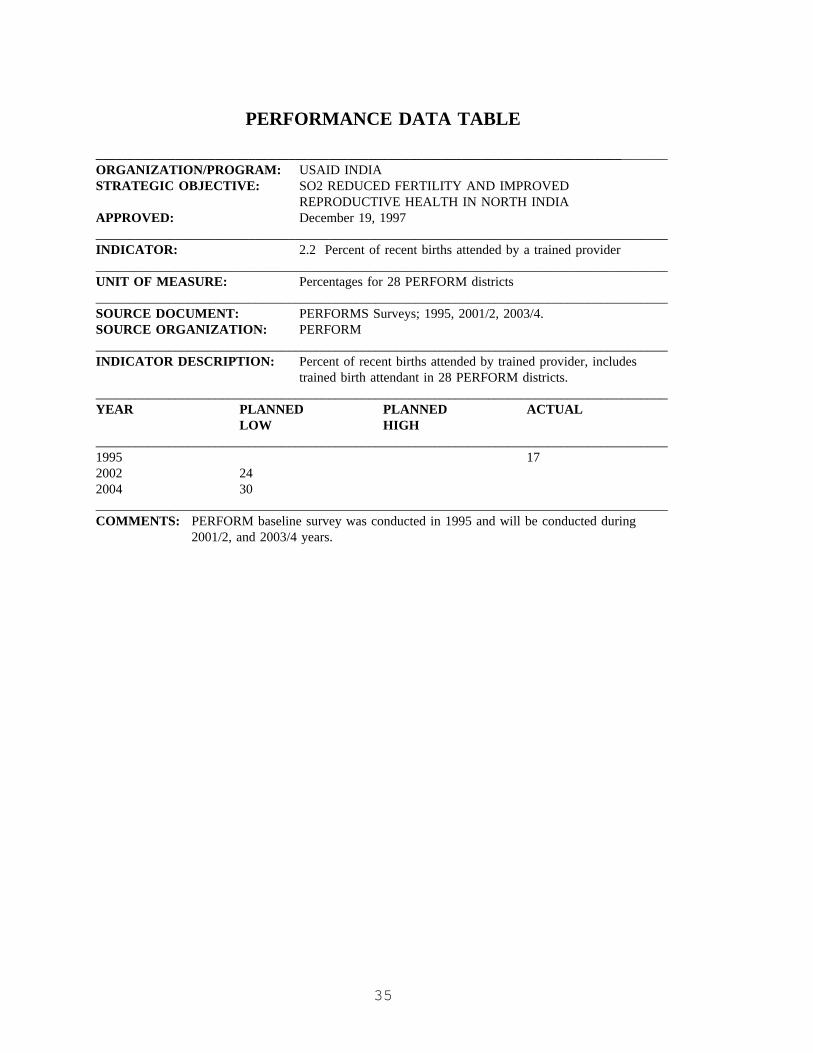
PERFORMANCE DATA TABLE
______________________________________________________________________________________ORGANIZATION/PROGRAM: USAID INDIASTRATEGIC OBJECTIVE: SO2 REDUCED FERTILITY AND IMPROVED
REPRODUCTIVE HEALTH IN NORTH INDIAAPPROVED: December 19, 1997______________________________________________________________________________________INDICATOR: 2.2 Percent of recent births attended by a trained provider______________________________________________________________________________________UNIT OF MEASURE: Percentages for 28 PERFORM districts______________________________________________________________________________________SOURCE DOCUMENT: PERFORMS Surveys; 1995, 2001/2, 2003/4.SOURCE ORGANIZATION: PERFORM______________________________________________________________________________________INDICATOR DESCRIPTION: Percent of recent births attended by trained provider, includes
trained birth attendant in 28 PERFORM districts.______________________________________________________________________________________YEAR PLANNED PLANNED ACTUAL
LOW HIGH______________________________________________________________________________________1995 172002 242004 30______________________________________________________________________________________COMMENTS: PERFORM baseline survey was conducted in 1995 and will be conducted during
2001/2, and 2003/4 years.
35

PERFORMANCE DATA TABLE
______________________________________________________________________________________ORGANIZATION/PROGRAM: USAID INDIASTRATEGIC OBJECTIVE: SO2 REDUCED FERTILITY AND IMPROVED
REPRODUCTIVE HEALTH IN NORTH INDIAAPPROVED: December 19, 1997______________________________________________________________________________________INDICATOR: 2.3 Contraceptive Prevalence Rate for modern methods______________________________________________________________________________________UNIT OF MEASURE: Percentage for state of Uttar Pradesh______________________________________________________________________________________SOURCE DOCUMENT: NFHS surveys 1992/93,1998; PERFORM surveys 2001/2, 2003/4SOURCE ORGANIZATION: NFHS, PERFORM______________________________________________________________________________________INDICATOR DESCRIPTION: Proportion of married couples with wife aged 15-49 using modern
contraceptive methods in Uttar Pradesh.______________________________________________________________________________________YEAR PLANNED PLANNED ACTUAL
LOW HIGH_______________________________________________________________________________1993 18.51998 232002 292004 35______________________________________________________________________________________COMMENTS:
36

PERFORMANCE DATA TABLE
______________________________________________________________________________________ORGANIZATION/PROGRAM: USAID INDIASTRATEGIC OBJECTIVE: SO2 REDUCED FERTILITY AND IMPROVED
REPRODUCTIVE HEALTH IN NORTH INDIAAPPROVED: December 19, 1997______________________________________________________________________________________INDICATOR: 2.4 Total fertility rate______________________________________________________________________________________UNIT OF MEASURE: Rate for state of Uttar Pradesh______________________________________________________________________________________SOURCE DOCUMENT: NFHS surveys 1992/93, 1998; PERFORM surveys 2001/2, 2003/4SOURCE ORGANIZATION: NFHS, PERFORM______________________________________________________________________________________INDICATOR DESCRIPTION: Number of children a women would bear during her reproductive
years if she were to experience the current fertility schedule.______________________________________________________________________________________YEAR PLANNED PLANNED ACTUAL
LOW HIGH______________________________________________________________________________________1993 4.81998 4.32002 4.12004 3.9______________________________________________________________________________________COMMENTS:
37

PERFORMANCE DATA TABLE
_____________________________________________________________________________________ORGANIZATION/PROGRAM: USAID INDIASTRATEGIC OBJECTIVE: SO2 REDUCED FERTILITY AND IMPROVED
REPRODUCTIVE HEALTH IN NORTH INDIAINTERMEDIATE RESULT: I.R. 2.1 INCREASED QUALITY OF FAMILY PLANNING
SERVICESAPPROVED: December 19, 1997______________________________________________________________________________________INDICATOR: 2.1.1 Number of IFPS-trained public sector providers performing to
standards______________________________________________________________________________________UNIT OF MEASURE: Cumulative numbers in 28 PERFORM districts______________________________________________________________________________________SOURCE DOCUMENT: Spot-check follow-up on training and special provider surveys, as
necessary, in 28 PERFORM districts of U.P.SOURCE ORGANIZATION: PERFORM______________________________________________________________________________________INDICATOR DESCRIPTION: 1a Cumulative number of providers (medical officers) trained in
providing sterilization services in 28 PERFORM districts.1b Cumulative number of providers (medical officers) trained, andwho meet quality standards in providing sterilization services in
28 PERFORM districts.2a Cumulative number of providers (female medical officers andANMs) trained in providing IUD services in 28 PERFORMdistricts2b Cumulative number of providers (female medical officers andANMs) trained and who meet quality standards in providing IUDservices in 28 PERFORM districts
_____________________________________________________________________________________YEAR PLANNED PLANNED ACTUAL
LOW HIGH______________________________________________________________________________________1997 1a 24
1b 132a 2632b 67
1998 1a 2001b 1252a 1,6232b 600
1999 1a 4321b 2702a 6,1842b 2,413
2000 1a 6761b 4242a11,0792b 4,627
38
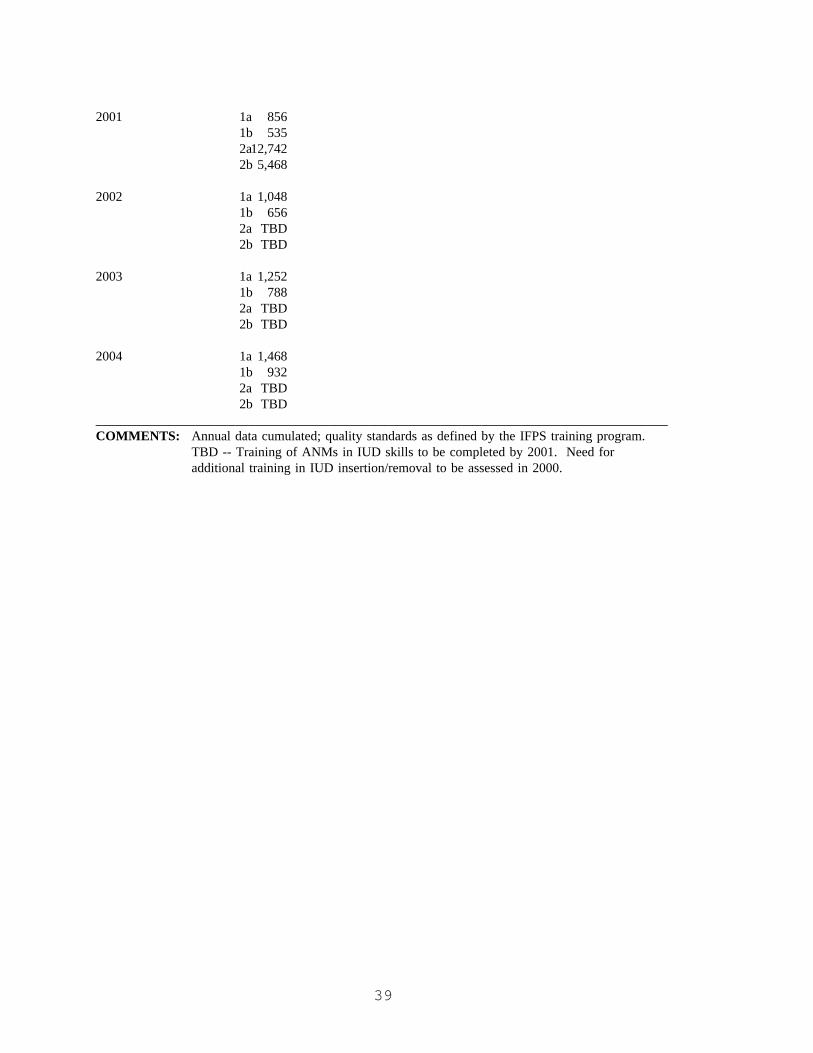
2001 1a 8561b 5352a12,7422b 5,468
2002 1a 1,0481b 6562a TBD2b TBD
2003 1a 1,2521b 7882a TBD2b TBD
2004 1a 1,4681b 9322a TBD2b TBD
______________________________________________________________________________________COMMENTS: Annual data cumulated; quality standards as defined by the IFPS training program.
TBD -- Training of ANMs in IUD skills to be completed by 2001. Need foradditional training in IUD insertion/removal to be assessed in 2000.
39

PERFORMANCE DATA TABLE
______________________________________________________________________________________ORGANIZATION/PROGRAM: USAID INDIASTRATEGIC OBJECTIVE: SO2 REDUCED FERTILITY AND IMPROVED
REPRODUCTIVE HEALTH IN NORTH INDIAINTERMEDIATE RESULT: I.R. 2.1 INCREASED QUALITY OF FAMILY PLANNING
SERVICESAPPROVED: December 19, 1997______________________________________________________________________________________INDICATOR: 2.1.2 Number of public sector clinics with satisfactory quality
ratings______________________________________________________________________________________UNIT OF MEASURE: Cumulative numbers in 28 PERFORM districts______________________________________________________________________________________SOURCE DOCUMENT: Special clinic study in 28 PERFORM districtsSOURCE ORGANIZATION: PERFORM______________________________________________________________________________________INDICATOR DESCRIPTION: Cumulative number of public sector sites upgraded under IFPS
project and performing to standards in 28 PERFORM districts.______________________________________________________________________________________YEAR PLANNED PLANNED ACTUAL
LOW HIGH_______________________________________________________________________________1997 41998 581999 1722000 2722001 3002002 3252003 3502004 361______________________________________________________________________________________COMMENTS: Quality ratings as defined under the IFPS project. It is planned that 526 public sector
clinics will be upgraded by 2004 and that 361 or 69% will receive satisfactory qualityratings.
40
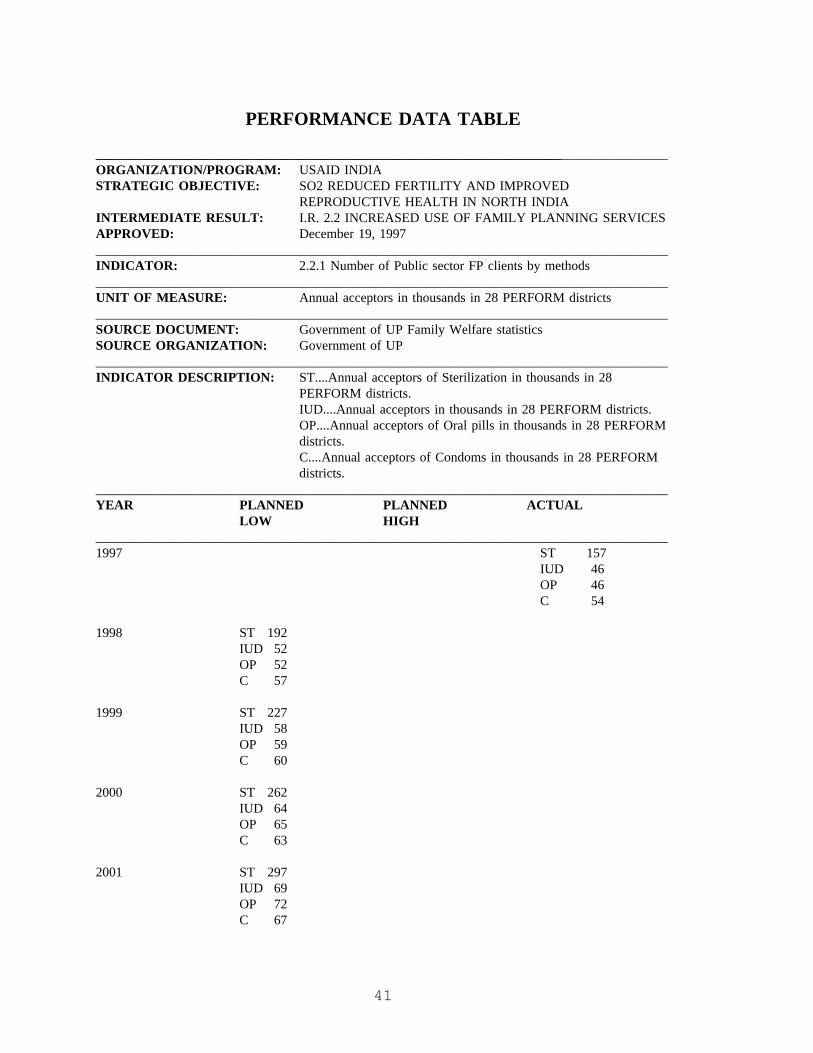
PERFORMANCE DATA TABLE
______________________________________________________________________________________ORGANIZATION/PROGRAM: USAID INDIASTRATEGIC OBJECTIVE: SO2 REDUCED FERTILITY AND IMPROVED
REPRODUCTIVE HEALTH IN NORTH INDIAINTERMEDIATE RESULT: I.R. 2.2 INCREASED USE OF FAMILY PLANNING SERVICESAPPROVED: December 19, 1997______________________________________________________________________________________INDICATOR: 2.2.1 Number of Public sector FP clients by methods______________________________________________________________________________________UNIT OF MEASURE: Annual acceptors in thousands in 28 PERFORM districts______________________________________________________________________________________SOURCE DOCUMENT: Government of UP Family Welfare statisticsSOURCE ORGANIZATION: Government of UP______________________________________________________________________________________INDICATOR DESCRIPTION: ST....Annual acceptors of Sterilization in thousands in 28
PERFORM districts.IUD....Annual acceptors in thousands in 28 PERFORM districts.OP....Annual acceptors of Oral pills in thousands in 28 PERFORMdistricts.C....Annual acceptors of Condoms in thousands in 28 PERFORMdistricts.
______________________________________________________________________________________YEAR PLANNED PLANNED ACTUAL
LOW HIGH______________________________________________________________________________________1997 ST 157
IUD 46OP 46C 54
1998 ST 192IUD 52OP 52C 57
1999 ST 227IUD 58OP 59C 60
2000 ST 262IUD 64OP 65C 63
2001 ST 297IUD 69OP 72C 67
41

2002 ST 332IUD 75OP 78C 70
2003 ST 367IUD 81OP 85C 72
2004 ST 407IUD 87OP 91C 76
_____________________________________________________________________________________COMMENTS: Annual data; Non-cumulative; Adjusted during PERFORM survey data for reliability
of reporting of government statistics.
42
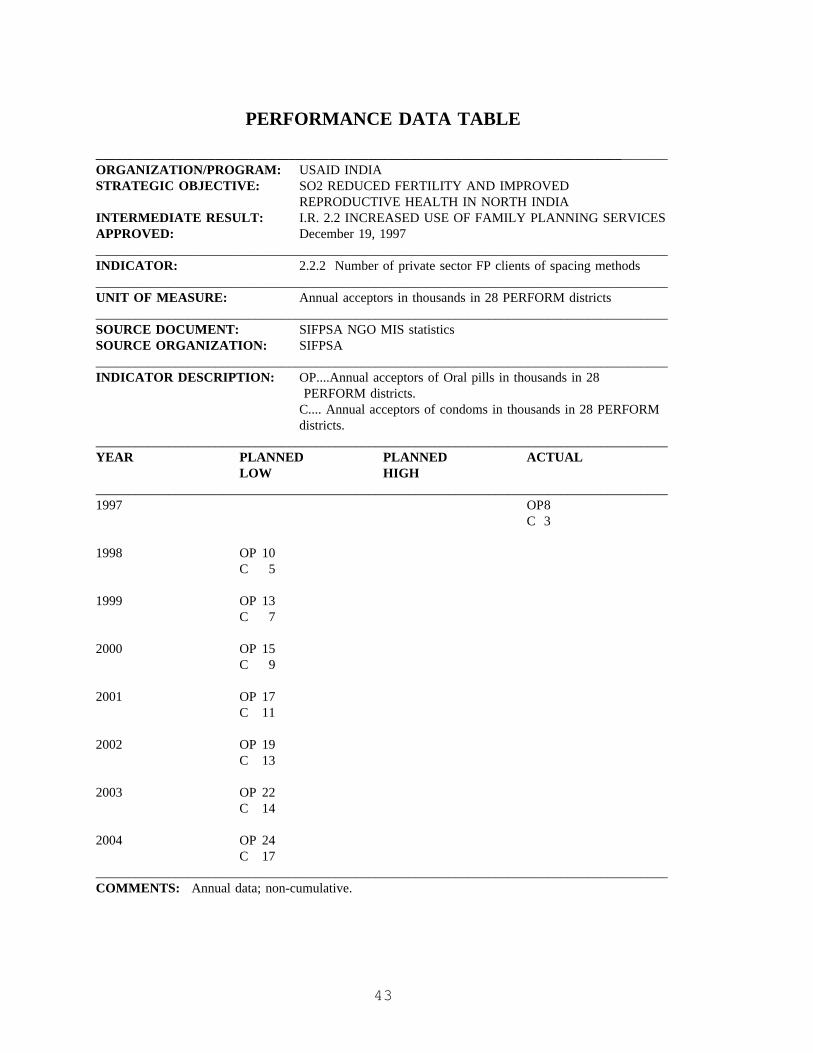
PERFORMANCE DATA TABLE
______________________________________________________________________________________ORGANIZATION/PROGRAM: USAID INDIASTRATEGIC OBJECTIVE: SO2 REDUCED FERTILITY AND IMPROVED
REPRODUCTIVE HEALTH IN NORTH INDIAINTERMEDIATE RESULT: I.R. 2.2 INCREASED USE OF FAMILY PLANNING SERVICESAPPROVED: December 19, 1997______________________________________________________________________________________INDICATOR: 2.2.2 Number of private sector FP clients of spacing methods______________________________________________________________________________________UNIT OF MEASURE: Annual acceptors in thousands in 28 PERFORM districts______________________________________________________________________________________SOURCE DOCUMENT: SIFPSA NGO MIS statisticsSOURCE ORGANIZATION: SIFPSA______________________________________________________________________________________INDICATOR DESCRIPTION: OP....Annual acceptors of Oral pills in thousands in 28
PERFORM districts.C.... Annual acceptors of condoms in thousands in 28 PERFORMdistricts.
______________________________________________________________________________________YEAR PLANNED PLANNED ACTUAL
LOW HIGH______________________________________________________________________________________1997 OP8
C 3
1998 OP 10C 5
1999 OP 13C 7
2000 OP 15C 9
2001 OP 17C 11
2002 OP 19C 13
2003 OP 22C 14
2004 OP 24C 17
______________________________________________________________________________________COMMENTS: Annual data; non-cumulative.
43
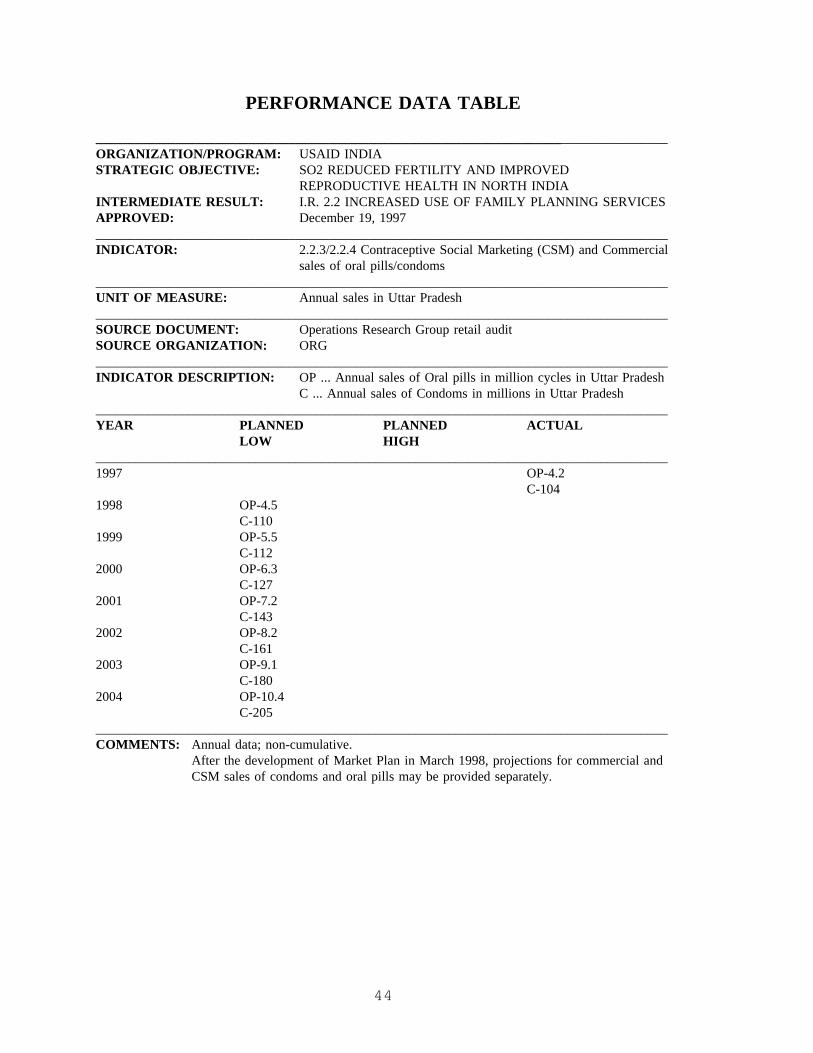
PERFORMANCE DATA TABLE
______________________________________________________________________________________ORGANIZATION/PROGRAM: USAID INDIASTRATEGIC OBJECTIVE: SO2 REDUCED FERTILITY AND IMPROVED
REPRODUCTIVE HEALTH IN NORTH INDIAINTERMEDIATE RESULT: I.R. 2.2 INCREASED USE OF FAMILY PLANNING SERVICESAPPROVED: December 19, 1997______________________________________________________________________________________INDICATOR: 2.2.3/2.2.4 Contraceptive Social Marketing (CSM) and Commercial
sales of oral pills/condoms______________________________________________________________________________________UNIT OF MEASURE: Annual sales in Uttar Pradesh______________________________________________________________________________________SOURCE DOCUMENT: Operations Research Group retail auditSOURCE ORGANIZATION: ORG______________________________________________________________________________________INDICATOR DESCRIPTION: OP ... Annual sales of Oral pills in million cycles in Uttar Pradesh
C ... Annual sales of Condoms in millions in Uttar Pradesh______________________________________________________________________________________YEAR PLANNED PLANNED ACTUAL
LOW HIGH______________________________________________________________________________________1997 OP-4.2
C-1041998 OP-4.5
C-1101999 OP-5.5
C-1122000 OP-6.3
C-1272001 OP-7.2
C-1432002 OP-8.2
C-1612003 OP-9.1
C-1802004 OP-10.4
C-205______________________________________________________________________________________COMMENTS: Annual data; non-cumulative.
After the development of Market Plan in March 1998, projections for commercial andCSM sales of condoms and oral pills may be provided separately.
44

PERFORMANCE DATA TABLE
______________________________________________________________________________________ORGANIZATION/PROGRAM: USAID INDIASTRATEGIC OBJECTIVE: SO2 REDUCED FERTILITY AND IMPROVED
REPRODUCTIVE HEALTH IN NORTH INDIAINTERMEDIATE RESULT: I.R. 2.3 INCREASED USE OF REPRODUCTIVE HEALTH
SERVICESAPPROVED: December 19, 1997______________________________________________________________________________________INDICATOR: 2.3.1 Number/percentage of pregnant women receiving Ante Natal
Care (ANC) services.______________________________________________________________________________________UNIT OF MEASURE: Annual numbers and percentages in 28 PERFORM districts______________________________________________________________________________________SOURCE DOCUMENT: Government of UP service statisticsSOURCE ORGANIZATION: Government of UP______________________________________________________________________________________INDICATOR DESCRIPTION: Annual number of pregnant women in 28 PERFORM Districts
receiving two doses of Tetanus Toxoid (TT) in thousands.Percent of pregnant women in 28 PERFORM Districts receivingtwo doses of Tetanus Toxoid (TT).Annual number of pregnant women in 28 PERFORM Districtsreceiving 100 Iron and folic acid tablets (IFA) in thousands.Percent of pregnant women in 28 PERFORM Districts receiving100 Iron and folic acid tablets (IFA).
______________________________________________________________________________________YEAR PLANNED PLANNED ACTUAL
LOW HIGH______________________________________________________________________________________1997 TT-1396
TT-43%IFA-1036IFA-32%
1998 TT-1452TT-44%IFA-1089IFA-33%
1999 TT-1508TT-45%IFA-1139IFA-34%
2000 TT-1564TT-46%IFA-1190IFA-35%
2001 TT-1617TT-47%IFA-1239IFA-36%
45
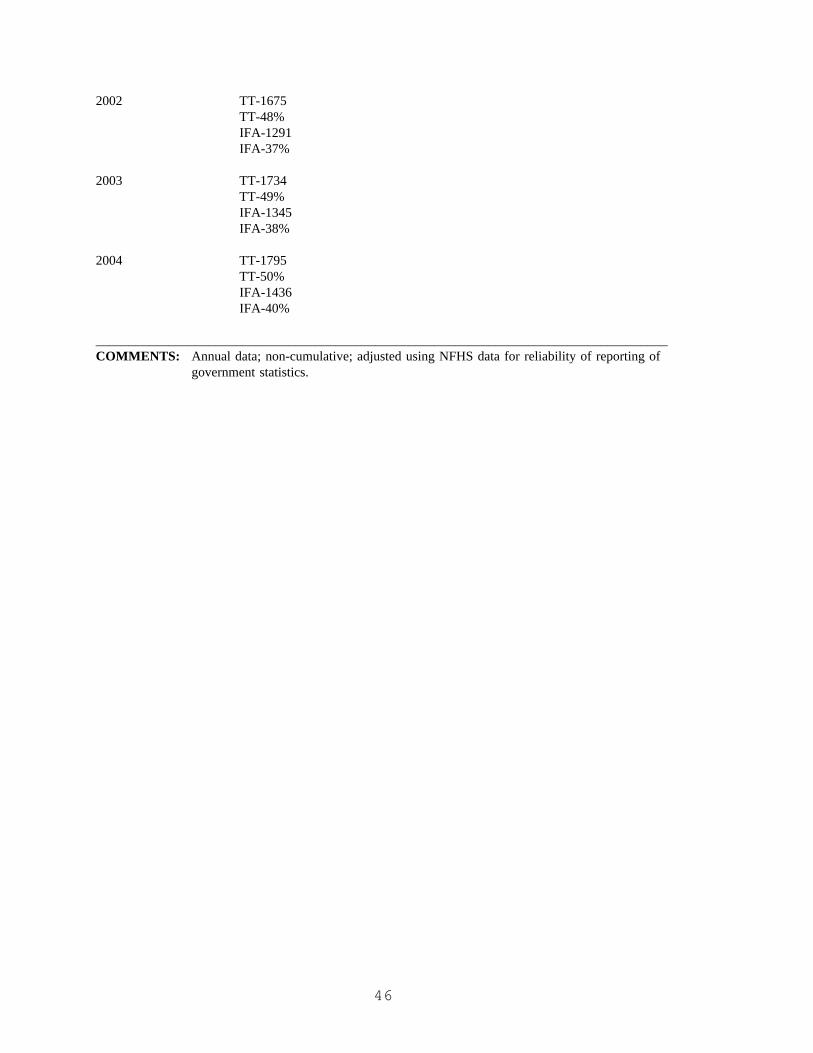
2002 TT-1675TT-48%IFA-1291IFA-37%
2003 TT-1734TT-49%IFA-1345IFA-38%
2004 TT-1795TT-50%IFA-1436IFA-40%
______________________________________________________________________________________COMMENTS: Annual data; non-cumulative; adjusted using NFHS data for reliability of reporting of
government statistics.
46
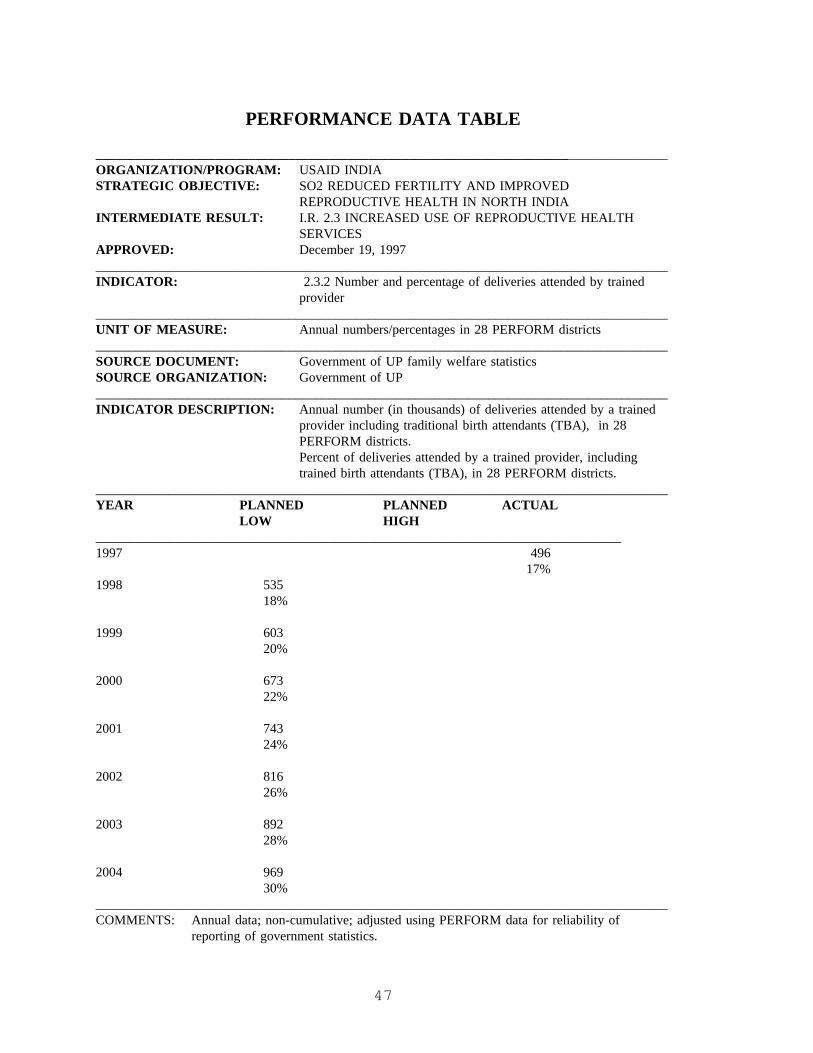
PERFORMANCE DATA TABLE
______________________________________________________________________________________ORGANIZATION/PROGRAM: USAID INDIASTRATEGIC OBJECTIVE: SO2 REDUCED FERTILITY AND IMPROVED
REPRODUCTIVE HEALTH IN NORTH INDIAINTERMEDIATE RESULT: I.R. 2.3 INCREASED USE OF REPRODUCTIVE HEALTH
SERVICESAPPROVED: December 19, 1997______________________________________________________________________________________INDICATOR: 2.3.2 Number and percentage of deliveries attended by trained
provider______________________________________________________________________________________UNIT OF MEASURE: Annual numbers/percentages in 28 PERFORM districts______________________________________________________________________________________SOURCE DOCUMENT: Government of UP family welfare statisticsSOURCE ORGANIZATION: Government of UP______________________________________________________________________________________INDICATOR DESCRIPTION: Annual number (in thousands) of deliveries attended by a trained
provider including traditional birth attendants (TBA), in 28PERFORM districts.Percent of deliveries attended by a trained provider, includingtrained birth attendants (TBA), in 28 PERFORM districts.
______________________________________________________________________________________YEAR PLANNED PLANNED ACTUAL
LOW HIGH_______________________________________________________________________________1997 496
17%1998 535
18%
1999 60320%
2000 67322%
2001 74324%
2002 81626%
2003 89228%
2004 96930%
______________________________________________________________________________________COMMENTS: Annual data; non-cumulative; adjusted using PERFORM data for reliability of
reporting of government statistics.
47
C. Strategic Objective 3: Improved Child Survival and Nutrition in SelectedAreas of India
Strategic Objective 3 supports the MPP Goal to "Protect Health," especially children’s,health. This is accomplished by integrating Title II food and development assistanceresources into programs that provide supplementary feeding and basic health services tomothers and children. Food assistance also enables the Mission to respond rapidly todisasters, contributing to the U.S. Humanitarian Response national interest by enablingthe Mission to "minimize the human costs of...natural disasters". For example, throughthe Title II logistics infrastructure and networks that extend into the most remote areasof India, USAID/India was able to respond rapidly last year to provide water, food andtemporary shelter to 50,000 people dislocated by two severe cyclones and related floodingin Andhra Pradesh; 33,000 people made homeless by the earthquake in Madhya Pradesh;and 300,000 people suffering as a result of drought in Orissa.
1. Performance Analysis
All targets exceeded
Considerable success has been achieved during the year in integrating Title II and otherresources to improve child survival and nutrition. Intermediate results for FY 1997 underthe "Improved Child Survival and Nutrition" strategic objective reflect trends that largelysurpassed expected results.
• Immunization coverage rates in program areas improved from 28 percent to 61percent of eligible children against the planned level of 35 percent;
• Percentage of children under two years (the age group most vulnerable tomalnutrition) receiving nutritious supplements increased from 40 percent to about 60percent compared to the planned level of 43 percent;
• Receipt of iron-folate supplements went up from 13 percent to 28 percent of pregnantwomen against the planned level of 20 percent; and
• Rates of timely complementary feeding improved from 46 percent to over 60 percentcompared to the planned level of 50 percent for infants 6-9 months.
These initial results from CARE’s Integrated Nutrition and Health Program (INHP), thelargest activity contributing to the SO, are encouraging. The strategy to linksupplementary food distribution more explicitly to basic health services for vulnerablegroups and to nutrition education appears to be sound. The positive trend indicated byCARE program data is further confirmed by UN data which show a decline in under-fivechild mortality from 115 per thousand in 1995 to 111 in 1996.
CARE’s data comes from a new monitoring system that it is further refining andstrengthening. Given the complexity of CARE’s program which involves a huge number
48
of personnel, many regional languages, and vast distances, reporting methodology needsto be further standardized. This year the focus is on overall trends and progression, andless emphasis is placed on exact coverage rates. The CRS health program completed abaseline survey comparable to CARE’s which provides comprehensive baseline data onSO and IR indicators. Thus, next year USAID/India will be able to provide consolidatedCARE-CRS performance tables.
Increased use of key child survival interventions
In program areas supported by CARE and CRS, basic health services focussed onreducing deaths due to vaccine-preventable diseases, diarrheas, pneumonias andmalnutrition of pregnant women and children under two. Women and children living inCARE’s "high impact" villages systematically received nutrition supplements, ante-natalcare, and immunization. A significant increase in immunization coverage rates inprogram areas from 28 percent at baseline (1996) to about 60 percent of eligible childrenhas been reported (see Table 3.1.1a).
In addition to the food aid program, USAID provided $3.9 million through WHO,UNICEF and Rotary International to support the effort to eradicate polio in India. Asa result of this large scale campaign which reached about 125 million children under fiveyears on a single day, reported polio cases have dropped by 75 percent in the past year.Largely due to the success of the first two annual National Pulse-Polio ImmunizationDays, India’s contribution to the worldwide burden of polio cases has been reduced from47 percent to 27 percent. USAID has also supported an epidemiology network (INCLEN)to conduct an evaluation of India’s Polio Initiative, and the results are expected in May1998.
USAID also continued to support the development of National Institute of Biologicals(NIB), co-sponsored by the Overseas Economic Cooperation Fund (OECF) of Japan andthe Ministry of Health and Family Welfare. The institute will strengthen India’s abilityto ensure that biological products produced or imported for use in India are safe andpotent. With USAID-financed technical assistance, NIB has finalized the design for itssophisticated laboratory including animal facilities. Construction is scheduled to beginin the summer of 1998. USAID/India has also provided technical assistance, training andequipment to help NIB develop the capacity at interim facilities to test children’s vaccinessuch as Oral Polio Vaccine (OPV) and other biologicals.
Finally, through its program promoting the commercial marketing of health technologies,USAID is assisting commercial producers of oral rehydration salts (ORS) obtain formulasto prevent and treat dehydration and a local manufacturer to develop a low-cost electronicscale--to help health workers monitor children’s weight and growth.
Maternal and child nutrition improved
Indicators of maternal and child nutrition show considerable progress in the past year.
• Distribution of iron-folate supplements has improved significantly despite a serious
49
two-year disruption in central government procurement. Twice as many pregnantwomen received iron-folate tablets as last year (see Table 3.2.1a). CARE’sorganization of a high level meeting involving national level officials and statecounterparts highlighted the supply problems and this year, for the first time in twoyears, iron folate tablets were available at village centers in Bihar, a state with a veryweak service delivery system.
• Communities are adopting improved infant nutrition practices as the result ofincreased counseling. Timely complementary feeding rates for infants have alsogrown, increasing from 46 percent at baseline (1996) to more than 60 percent duringthe year (see Table 3.2.2a).
CARE worked with both the Department of Women and Child Development (under theMinistry of Human Resource Development) and Ministry of Health at various levels toencourage joint training and improved coordination between nurse-midwives and villagenutrition workers, but strong unified leadership for nutrition in India still does not exist.The involvement of CARE and CRS in micronutrient supplementation has opened adialogue between USAID and its partners on a coordinated strategy to improve access tomicronutrients through supplementation, fortification, or other nutrition interventions. Thenational elections temporarily forced postponement of USAID’s micronutrient assessmentto test the feasibility of further work in this area.
Improved targeting of at-risk populations
During FY 97, the food program reached a total of 6.5 million women and children (95percent of the planned level) with a supplementary meal about 25 days a month. Theprogram is on track to meet its coverage targets. The coverage of the group mostvulnerable to malnutrition improved from 40 percent to 63 percent of children under twoyears of age (see Table 3.3.1a). Both CARE and CRS provided valuable technicalassistance and training to over 46,000 public and private partners and to communitymembers on how to expand coverage of at-risk mothers and children and on how toimprove program quality. CARE’s strategy to link ’take-home’ food distribution toNutrition/Health Days was critical to reaching pregnant women and mothers with infants,since many do not live close to the village nutrition center and work on farms during thehours the centers are in operation. One of the most significant management changes wasthe participation of CARE staff in district government inter-sectoral meetings which hasimproved coverage and quality and linked local organizations and the government healthand nutrition workers at the community level.
Partnerships expanded and strengthened
CARE initiated high impact activities in at least one block (100,000 people) in each ofthe seven states in which it operates. The high impact program encourages communityinvolvement and ownership, particularly by women’s groups and panchayats (local villagecouncils). Grain banks to improve food security of the extremely poor and group-savingsand loans for health-related expenditures are two examples of activities initiated bywomen’s groups. These groups are already distributing take-home rations in connection
50

with health days and managing feeding sub-centers. CARE trained some 36,400counterparts, including community members, through a Title II strengthening grant, aspart of its strategy to use motivated and charismatic local leaders rather than governmentfunctionaries.
CRS has well-developed partnerships and MOUs with 53 counterparts; about 2,400operating partners are involved in implementing the program which reaches out tounserved, lower caste and untouchable communities. Last year, 70 percent of resourceswere programmed for the most disadvantaged scheduled tribes and castes. In villagestaken up in FY-97, this grew to 84 percent. CRS trained a total of 9,426 counterpart andoperating partner staff using Title II strengthening grant funds.
Complementary activities enhance impact
Complementary activities using Farm Bill dollar assistance and local currency generationsthrough monetization of oil are enhancing the quality of child survival services. A childsurvival grant from BHR/PVC is strengthening CRS’ program in Bihar. Technicalassistance from Global Bureau projects is improving infant feeding and strengtheningmicronutrient activities under the strategic objective by building PVO technical capacityand improving health and nutrition policies.
USAID is partnering with UNICEF to promote "Integrated Management of ChildhoodIllnesses" and to streamline supply lines of drugs, vaccines, micronutrients andcontraceptives through the public sector. CARE, which has collaborated extensively withNGOs and community-based organizations, is increasingly entering into formal sub-contractual agreements with these organizations in order to build local capacity to covertraditionally hard-to-reach populations. Both CRS and CARE programs are supported bya large host country contribution for administrative costs and logistics. Indian governmentcontributions to the CARE program are perhaps the largest contribution to any Title IIprogram worldwide.
2. Expected Progress through FY 2000 and Management Actions
The approved levels of PL 480 Title II assistance for the Development Activity Proposal(DAP) period 1996-2001 are critical to the achieve SO 3’s objectives. Assumingapproved levels of resources are maintained, we expect improvement in immunizationcoverage, nutrition practices and coverage of at-risk populations as planned. We alsoexpect that the mid-term evaluations of the CARE and CRS programs, planned for nextyear, as well as the findings of the second National Family Health Survey, will showimproved under-five mortality and nutritional status. Through the Title II programresources, qualitative improvements are expected due to strengthening and capacitybuilding of CARE and CRS staff and their local counterparts. CARE’s INHP will expandhigh impact activities from the current seven blocks to 26 blocks in 1998 and to 75blocks by FY 2000. A revised capacity building strategy, based on this year’s lessons,will be implemented in 100 blocks in 1998 and in 267 blocks by FY 2000. Targetedsupplemental feeding will be operational in 219 blocks during 1998 and in 365 blocks byFY 2000.
51

The CRS health program will focus on improving impact through implementation of itsperformance monitoring system and capacity building, development and a healtheducation curriculum prepared under a USAID child survival grant. USAID will presentcombined indicator tables for CARE and CRS in the next R4. In compliance withRegulation 216, both CARE and CRS programs will submit either an "InitialEnvironmental Examination" plan or a request for "Categorical Exclusion."
As part of the re-engineering process, during FY 98 delegation of certain authorities fromBHR/FFP to USAID/India are planned such as review and approval of the annualPreviously Approved Activity proposals and the management of Farm Bill funds. A draftMOU for this purpose was discussed at the recently held CARE-CRS-USAID retreat.This will be revised in consultation with the RLA and BHR/FFP.
In the second NFHS, additional nutrition indicators, such as blood hemoglobin levels(indicator of anemia) and maternal night blindness (indicator of Vitamin A deficiency)will be included to help policy makers understand the extent and magnitude ofmicronutrient deficiencies in the country. In order to identify possible micronutrient/childsurvival activities that could be developed and determine feasibility and demand forUSAID/India support, we plan, with G/PHN assistance and international expertise, toconduct an assessment of India’s micronutrient strategies, policies and programs duringFY 98. Increased GOI attention to the supply of micronutrient supplements to vulnerablegroups as well as improvement in supplementation policies would increase impact ofCARE’s programs.
Under USAID’s support to commercial marketing of health technologies, a major genericcommunication campaign promoting the use of ORS will be undertaken. The campaignwill be launched at the beginning of the next diarrhoea season (April 1999). Also, weexpect to reach an agreement soon with the premier vaccine manufacturer in India, theSerum Institute, for production and marketing of the Mumps, Measles and RubellaVaccine (MMR) through commercial channels. Finally, USAID/India is pursuingtransactions for commercial marketing and distribution of other high priority healthproducts such as Hepatitis-B vaccine.
USAID will continue to play a key role in India’s polio eradication initiative. Along withother partner agencies, USAID will help strengthen India’s overall immunization andsurveillance systems and increase immunization coverage. Despite India’s extraordinaryprogress in drastically reducing the number of reported polio cases through immunizationof children under five, a substantial number of polio cases still go unreported. USAIDwill continue support to establish a more effective surveillance system that will not onlyhelp identify unreported cases, but will be the critical factor in enabling India to becertified as polio-free by WHO.
52
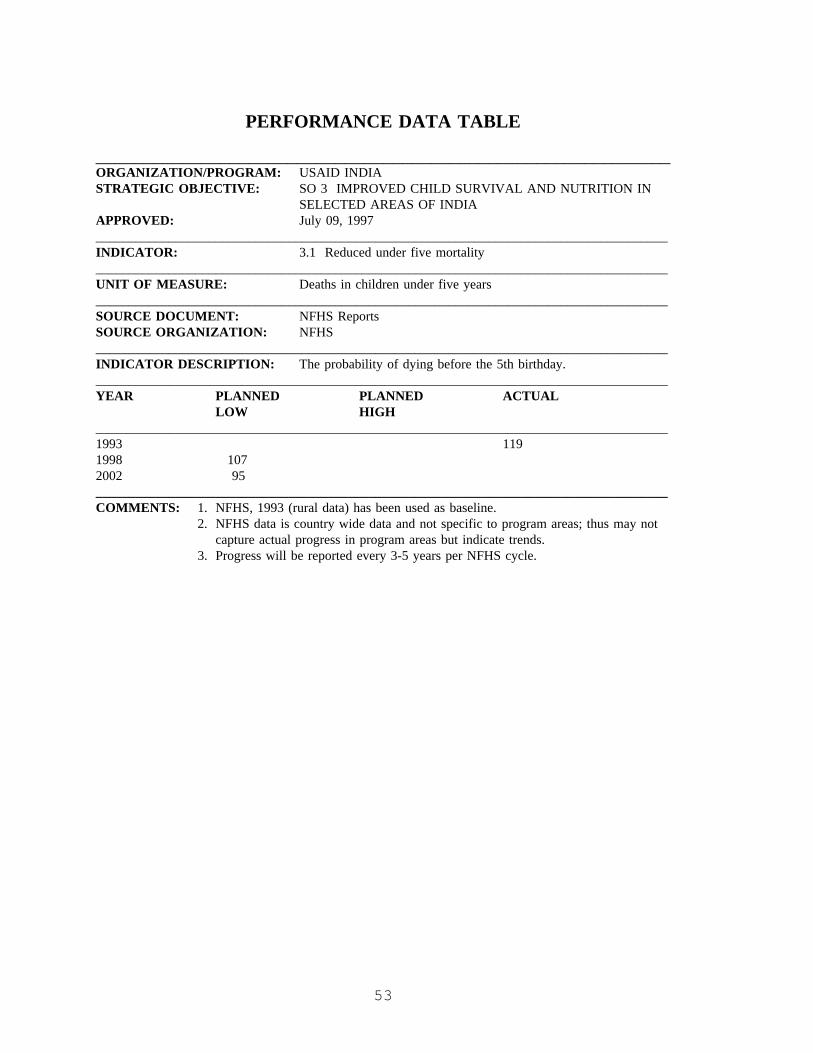
PERFORMANCE DATA TABLE
____________________________________________________________ORGANIZATION/PROGRAM: USAID INDIASTRATEGIC OBJECTIVE: SO 3 IMPROVED CHILD SURVIVAL AND NUTRITION IN
SELECTED AREAS OF INDIAAPPROVED: July 09, 1997______________________________________________________________________________________INDICATOR: 3.1 Reduced under five mortality______________________________________________________________________________________UNIT OF MEASURE: Deaths in children under five years______________________________________________________________________________________SOURCE DOCUMENT: NFHS ReportsSOURCE ORGANIZATION: NFHS______________________________________________________________________________________INDICATOR DESCRIPTION: The probability of dying before the 5th birthday.______________________________________________________________________________________YEAR PLANNED PLANNED ACTUAL
LOW HIGH______________________________________________________________________________________1993 1191998 1072002 95______________________________________________________________________________________COMMENTS: 1. NFHS, 1993 (rural data) has been used as baseline.
2. NFHS data is country wide data and not specific to program areas; thus may notcapture actual progress in program areas but indicate trends.
3. Progress will be reported every 3-5 years per NFHS cycle.
53

PERFORMANCE DATA TABLE
______________________________________________________________________________________ORGANIZATION/PROGRAM: USAID INDIASTRATEGIC OBJECTIVE: SO 3 - IMPROVED CHILD SURVIVAL AND NUTRITION IN
SELECTED AREAS OF INDIAAPPROVED: July 09, 1997______________________________________________________________________________________INDICATOR: 3.2a Improved nutritional status of young children (NFHS data)______________________________________________________________________________________UNIT OF MEASURE: Percentage of underweight children under four years______________________________________________________________________________________SOURCE DOCUMENT: NFHS ReportsSOURCE ORGANIZATION: NFHS______________________________________________________________________________________INDICATOR DESCRIPTION: Percent of children under four years who are more than two stan-
dard deviations below the median on the weight for age index for theinternational reference population (WHO). Separate tables created forCARE (3.2b) & CRS (3.2c) data.
______________________________________________________________________________________YEAR PLANNED PLANNED ACTUAL
LOW HIGH______________________________________________________________________________________1993 561998 532002 50______________________________________________________________________________________COMMENTS: 1. NFHS, 1993 (rural data) has been used as baseline. Progress will be reported every
3-5 years per NFHS cycle.2. NFHS data is country wide data and not specific to program areas; thus may not cap-
ture actual progress in program areas but indicate trends.3. Efforts will be made to disaggregate the data by age for children under 2 in order to
draw comparisons with PVO survey data.
54

PERFORMANCE DATA TABLE
______________________________________________________________________________________ORGANIZATION/PROGRAM: USAID INDIASTRATEGIC OBJECTIVE: SO 3 - IMPROVED CHILD SURVIVAL AND NUTRITION IN
SELECTED AREAS OF INDIAAPPROVED: July 09, 1997______________________________________________________________________________________INDICATOR: 3.2b Improved nutritional status of young children (CARE data)______________________________________________________________________________________UNIT OF MEASURE: Percentage of underweight children under two years______________________________________________________________________________________SOURCE DOCUMENT: CARE Results Report; CARE baseline and evaluation survey re-
portsSOURCE ORGANIZATION: CARE______________________________________________________________________________________INDICATOR DESCRIPTION: Percent of children under two years who are more than two stan-
dard deviations below the median on the weight for age index for theinternational reference population (WHO). Separate tables created forNFHS ( 3.2a) and CRS ( 3.2c) data.
______________________________________________________________________________________YEAR PLANNED PLANNED ACTUAL
LOW HIGH______________________________________________________________________________________1996 51*1999 502001 48______________________________________________________________________________________COMMENTS: 1. Results will be reported at baseline, midterm and final evaluation.
2. With improved coverage of unreached populations, an initial rise in rates of malnutri-tion in program areas is expected; thus during this five-year window, significantchange in overall nutritional status may not occur. However, reduction in severemalnutrition is expected which will be reported along with overall rates.
3. CARE Results Report data from October through September.* The revised baseline value has been arrived at using the standard international refer-
ence population as against the earlier values where the Indian Academy of Paediatrics(IAP) standards were used as the reference. Planned results have been revised ac-cordingly.
55

PERFORMANCE DATA TABLE
______________________________________________________________________________________ORGANIZATION/PROGRAM: USAID INDIASTRATEGIC OBJECTIVE: SO 3 - IMPROVED CHILD SURVIVAL AND NUTRITION IN
SELECTED AREAS OF INDIAAPPROVED: July 09, 1997______________________________________________________________________________________INDICATOR: 3.2c Improved nutritional status of young children (CRS data)______________________________________________________________________________________UNIT OF MEASURE: Percentage of underweight children under two years______________________________________________________________________________________SOURCE DOCUMENT: CRS Results Report, CRS baseline and evaluation survey reportsSOURCE ORGANIZATION: CRS______________________________________________________________________________________INDICATOR DESCRIPTION: Percentage of children under two years who are more than two
standard deviations below the median on the weight for age indexfor the international reference population (WHO). Separate tablescreated for NFHS (3.2a) and CARE (3.2b) data.
______________________________________________________________________________________YEAR PLANNED PLANNED ACTUAL
LOW HIGH______________________________________________________________________________________1997 401999 392001 37______________________________________________________________________________________COMMENTS: 1. Only preliminary baseline results are available as of this reporting. The baseline and
planned results may be revised when final baseline survey report is available.2. Results will be reported at baseline, mid term and final evaluation.3. With improved coverage of unreached populations, an initial rise in rates of malnu-
trition in program areas is expected; thus, during this five-year window, significantchange in overall malnutritional status may not occur. However, reduction in severemalnutrition is expected which will be reported along with overall rates.
4. CRS results report data from October through September.
56

PERFORMANCE DATA TABLE
______________________________________________________________________________________ORGANIZATION/PROGRAM: USAID INDIASTRATEGIC OBJECTIVE: SO 3 - IMPROVED CHILD SURVIVAL AND NUTRITION IN
SELECTED AREAS OF INDIAINTERMEDIATE RESULT: IR 3.1 INCREASED USE OF KEY CHILD SURVIVAL INTER-
VENTIONSAPPROVED:______________________________________________________________________________________INDICATOR: 3.1.1a % of children, 12-23 months old, fully immunized by age
one (CARE data)______________________________________________________________________________________UNIT OF MEASURE: Percentage of children 12-23 months old______________________________________________________________________________________SOURCE DOCUMENT: CARE Results Report, CARE baseline & evaluation survey reportsSOURCE ORGANIZATION: CARE______________________________________________________________________________________INDICATOR DESCRIPTION: Percentage of children 12-23 months old in program catchment area
who are fully immunized by age one. Separate table created for CRSdata (3.1.1.b).
______________________________________________________________________________________YEAR PLANNED PLANNED ACTUAL
LOW HIGH______________________________________________________________________________________1996 281997 31 61*1998 341999 372000 402001 44______________________________________________________________________________________COMMENTS: 1. The baseline and planned results have been revised based on the final report of the
baseline survey. (As of previous R4 reporting only preliminary baseline results from5 states out of 7 were available).
2. The out year targets will be revised, if necessary, after mid-term evaluation.3. CARE results report data from October through September.* The 1997 actual result represents children immunized by age two; CARE is revising themonitoring questionnaire and FY 1998 onwards, data will be collected for children immu-nized by age one.
57

PERFORMANCE DATA TABLE
______________________________________________________________________________________ORGANIZATION/PROGRAM: USAID INDIASTRATEGIC OBJECTIVE: SO 3 - IMPROVED CHILD SURVIVAL AND NUTRITION IN
SELECTED AREAS OF INDIAINTERMEDIATE RESULT: IR 3.1 INCREASED USE OF KEY CHILD SURVIVAL
INTERVENTIONSAPPROVED:______________________________________________________________________________________INDICATOR: 3.1.1b % of children 12-23 months old fully immunized by age one
(CRS data)______________________________________________________________________________________UNIT OF MEASURE: Percentage of children 12-23 months old______________________________________________________________________________________SOURCE DOCUMENT: CRS Results Report, CRS baseline and evaluation reportsSOURCE ORGANIZATION: CRS______________________________________________________________________________________INDICATOR DESCRIPTION: Percentage of children 12-23 months old in program catchment area
who are fully immunized by age one. Separate table created forCARE data (3.1.1.a)
______________________________________________________________________________________YEAR PLANNED PLANNED ACTUAL
LOW HIGH______________________________________________________________________________________1997 281998 331999 382000 432001 48______________________________________________________________________________________COMMENTS: 1. Only preliminary baseline results are available as of this reporting. The baseline and
planned results may be revised when final baseline survey report is available.2. CRS results report data from October through September.
58
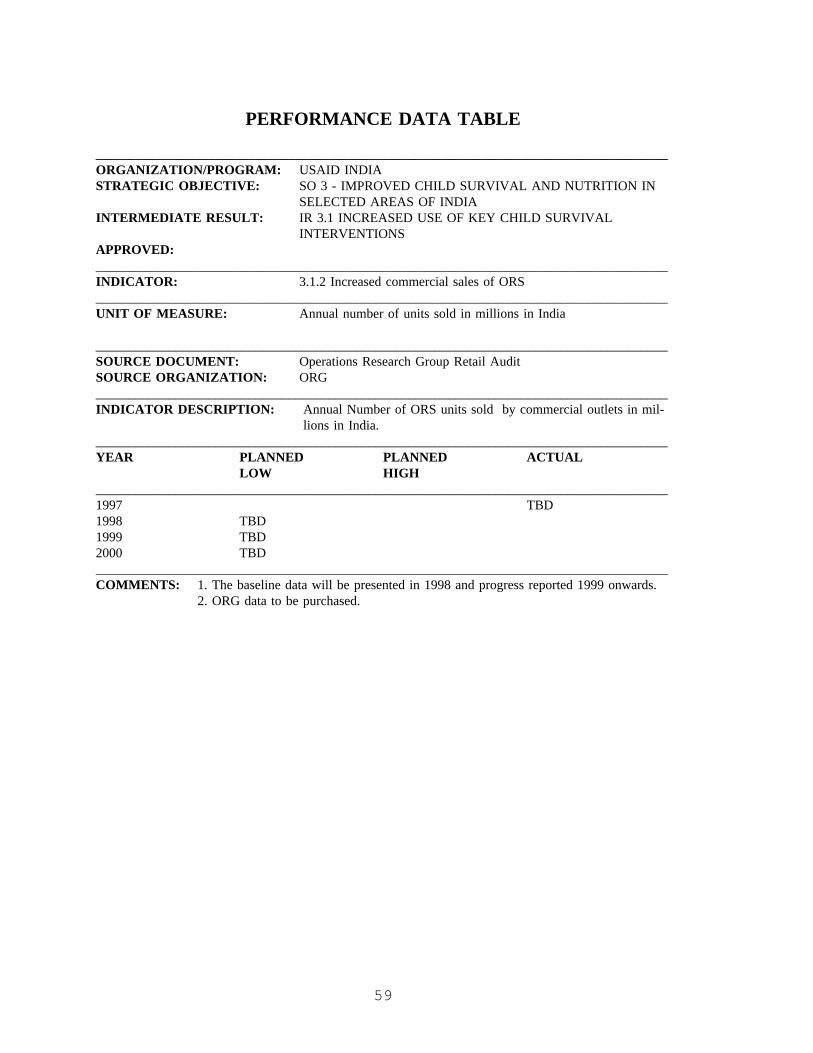
PERFORMANCE DATA TABLE
______________________________________________________________________________________ORGANIZATION/PROGRAM: USAID INDIASTRATEGIC OBJECTIVE: SO 3 - IMPROVED CHILD SURVIVAL AND NUTRITION IN
SELECTED AREAS OF INDIAINTERMEDIATE RESULT: IR 3.1 INCREASED USE OF KEY CHILD SURVIVAL
INTERVENTIONSAPPROVED:______________________________________________________________________________________INDICATOR: 3.1.2 Increased commercial sales of ORS______________________________________________________________________________________UNIT OF MEASURE: Annual number of units sold in millions in India
______________________________________________________________________________________SOURCE DOCUMENT: Operations Research Group Retail AuditSOURCE ORGANIZATION: ORG______________________________________________________________________________________INDICATOR DESCRIPTION: Annual Number of ORS units sold by commercial outlets in mil-
lions in India.______________________________________________________________________________________YEAR PLANNED PLANNED ACTUAL
LOW HIGH______________________________________________________________________________________1997 TBD1998 TBD1999 TBD2000 TBD______________________________________________________________________________________COMMENTS: 1. The baseline data will be presented in 1998 and progress reported 1999 onwards.
2. ORG data to be purchased.
59

PERFORMANCE DATA TABLE
______________________________________________________________________________________ORGANIZATION/PROGRAM: USAID INDIASTRATEGIC OBJECTIVE: SO 3 - IMPROVED CHILD SURVIVAL AND NUTRITION IN
SELECTED AREAS OF INDIAINTERMEDIATE RESULT: IR 3.2 IMPROVED MATERNAL AND CHILD NUTRITIONAPPROVED:______________________________________________________________________________________INDICATOR: 3.2.1a % of pregnant women,delivered in the past year, who re-
ceived 90-100 iron-folic acid tablets (CARE data)______________________________________________________________________________________UNIT OF MEASURE: Percentage of pregnant women______________________________________________________________________________________SOURCE DOCUMENT: CARE Results Report; CARE baseline and evaluation survey re-
portsSOURCE ORGANIZATION: CARE______________________________________________________________________________________INDICATOR DESCRIPTION: Percentage of pregnant women in program catchment area who
received 90-100 IFA tablets. Separate table created for CRS data(3.1.1b).
______________________________________________________________________________________YEAR PLANNED PLANNED ACTUAL
LOW HIGH______________________________________________________________________________________1996 131997 20 261998 241999 272000 302001 35______________________________________________________________________________________COMMENTS: 1. The baseline and planned values have been revised based on reanalysis of data for
receipt of 90-100 IFA tablets. (Data presented in previous R4 reflected receipt of 50or more IFA tablets).
2. The out year targets will be revised, if necessary, after mid-term evaluation in 1999.3. Receipt of IFA tablets is a proxy indicator for improved hemoglobin status during
pregnancy and also a proxy for ante-natal care. (IFA is distributed by the Health De-partment).
4. CARE results report data from October through September.
60

PERFORMANCE DATA TABLE
______________________________________________________________________________________ORGANIZATION/PROGRAM: USAID INDIASTRATEGIC OBJECTIVE: SO 3 - IMPROVED CHILD SURVIVAL AND NUTRITION IN
SELECTED AREAS OF INDIAINTERMEDIATE RESULT: IR 3.2 IMPROVED MATERNAL AND CHILD NUTRITIONAPPROVED:______________________________________________________________________________________INDICATOR: 3.2.1b % of pregnant women,delivered in the past year,who re-
ceived 90-100 iron-folic acid tablets (CRS data)______________________________________________________________________________________UNIT OF MEASURE: Percentage of pregnant women______________________________________________________________________________________SOURCE DOCUMENT: CRS Results Report; CRS baseline and evaluation survey reportsSOURCE ORGANIZATION: CRS______________________________________________________________________________________INDICATOR DESCRIPTION: Percentage of pregnant women in program catchment area who
received 90-100 IFA tablets. Separate table created for CARE data(3.2.1a).
______________________________________________________________________________________YEAR PLANNED PLANNED ACTUAL
LOW HIGH______________________________________________________________________________________1997 131998 181999 232000 282001 33______________________________________________________________________________________COMMENTS: 1. Only preliminary baseline results are available as of this reporting. The baseline and
planned results may be revised when final report is available.2. Receipt of IFA tablets is a proxy indicator for improved hemoglobin status during
pregnancy and also a proxy for ante-natal care. (IFA is distributed by the HealthDepartment).
3. CRS results report data from October through September.
61

PERFORMANCE DATA TABLE
_____________________________________________________________________________________ORGANIZATION/PROGRAM: USAID INDIASTRATEGIC OBJECTIVE: SO 3 - IMPROVED CHILD SURVIVAL AND NUTRITION IN
SELECTED AREAS OF INDIAINTERMEDIATE RESULT: IR 3.2 IMPROVED MATERNAL AND CHILD NUTRITIONAPPROVED:______________________________________________________________________________________INDICATOR: 3.2.2a % infants who received breast-milk and solid/mushy foods
at 6-9 months of age (CARE data)______________________________________________________________________________________UNIT OF MEASURE: % of infants______________________________________________________________________________________SOURCE DOCUMENT: CARE Results Report; CARE baseline and evaluation survey re-
portsSOURCE ORGANIZATION: CARE______________________________________________________________________________________INDICATOR DESCRIPTION: % of infants in program catchment area who received breast-milk
and solid/mushy foods at 6-9 months. Separate table created forCRS data (3.2.2b).
______________________________________________________________________________________YEAR PLANNED PLANNED ACTUAL
LOW HIGH______________________________________________________________________________________1996 461997 50 651998 531999 582000 622001 65
COMMENTS: 1. The baseline and planned results have been revised based on the final report of thebaseline survey. (As of previous R4 reporting only preliminary baseline resultswere available).
2. The out year targets will be revised, if necessary, after mid-term evaluation in1999.
3. CARE results report data from October through September.
62
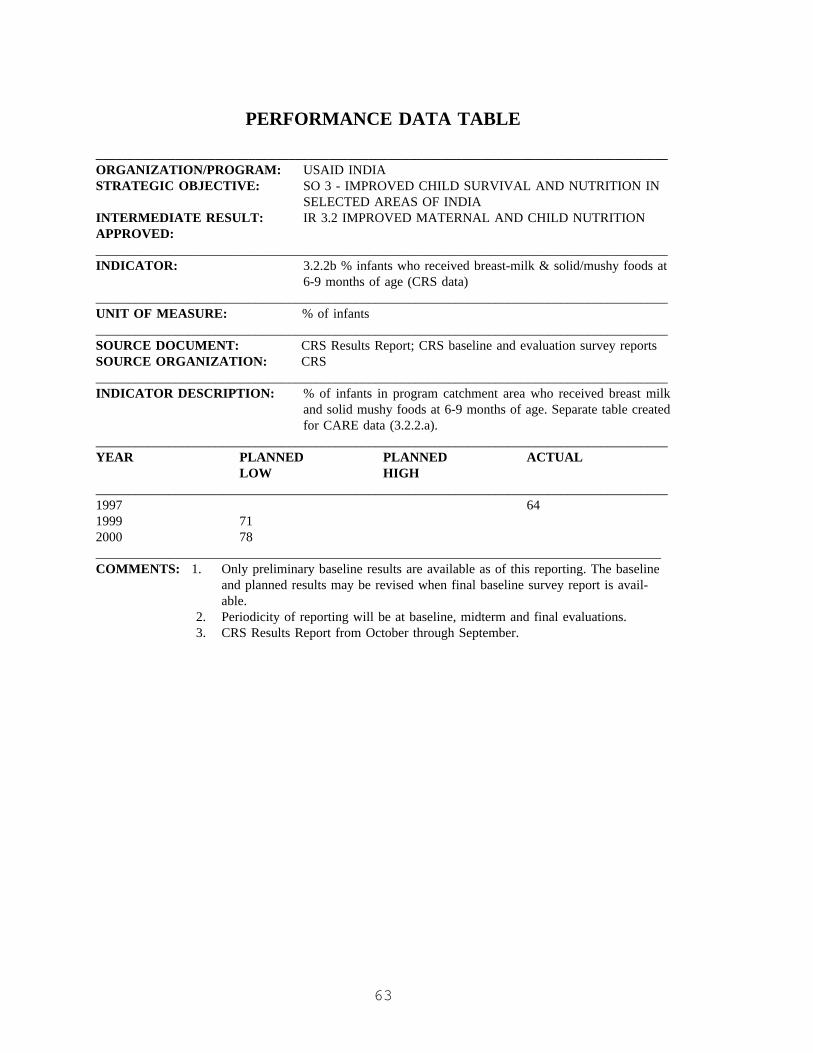
PERFORMANCE DATA TABLE
______________________________________________________________________________________ORGANIZATION/PROGRAM: USAID INDIASTRATEGIC OBJECTIVE: SO 3 - IMPROVED CHILD SURVIVAL AND NUTRITION IN
SELECTED AREAS OF INDIAINTERMEDIATE RESULT: IR 3.2 IMPROVED MATERNAL AND CHILD NUTRITIONAPPROVED:______________________________________________________________________________________INDICATOR: 3.2.2b % infants who received breast-milk & solid/mushy foods at
6-9 months of age (CRS data)______________________________________________________________________________________UNIT OF MEASURE: % of infants______________________________________________________________________________________SOURCE DOCUMENT: CRS Results Report; CRS baseline and evaluation survey reportsSOURCE ORGANIZATION: CRS______________________________________________________________________________________INDICATOR DESCRIPTION: % of infants in program catchment area who received breast milk
and solid mushy foods at 6-9 months of age. Separate table createdfor CARE data (3.2.2.a).
______________________________________________________________________________________YEAR PLANNED PLANNED ACTUAL
LOW HIGH______________________________________________________________________________________1997 641999 712000 78_____________________________________________________________________________________COMMENTS: 1. Only preliminary baseline results are available as of this reporting. The baseline
and planned results may be revised when final baseline survey report is avail-able.
2. Periodicity of reporting will be at baseline, midterm and final evaluations.3. CRS Results Report from October through September.
63

PERFORMANCE DATA TABLE
______________________________________________________________________________________ORGANIZATION/PROGRAM: USAID INDIASTRATEGIC OBJECTIVE: SO 3 - IMPROVED CHILD SURVIVAL AND NUTRITION IN
SELECTED AREAS OF INDIAINTERMEDIATE RESULT: IR 3.3 IMPROVED TARGETING OF AT-RISK POPULATIONSAPPROVED:______________________________________________________________________________________INDICATOR: 3.3.1a % children under 2 reached with supplemental food
(CARE data)______________________________________________________________________________________UNIT OF MEASURE: % children 6-24 months______________________________________________________________________________________SOURCE DOCUMENT: CARE Results Report; CARE baseline and evaluation survey
reportsSOURCE ORGANIZATION: CARE______________________________________________________________________________________INDICATOR DESCRIPTION: Percentage of children under two years in program catchment area
reached with supplemental food. Separate table created for CRSdata (3.3.1b).
______________________________________________________________________________________YEAR PLANNED PLANNED ACTUAL
LOW HIGH______________________________________________________________________________________1996 401997 43 631998 471999 522000 562001 60______________________________________________________________________________________COMMENTS: 1. Planned results have been revised based on CARE’s revised targets.
2. Supplemental food is an entry point for child survival services such as growth pro-motion, immunization, referrals etc.
3. The out year targets will be revised, if necessary, after mid-term evaluation in1999.
4. CARE Results Report data from October through September.
64

PERFORMANCE DATA TABLE
______________________________________________________________________________________ORGANIZATION/PROGRAM: USAID INDIASTRATEGIC OBJECTIVE: SO 3 - IMPROVED CHILD SURVIVAL AND NUTRITION IN
SELECTED AREAS OF INDIAINTERMEDIATE RESULT: IR 3.3 IMPROVED TARGETING OF AT-RISK POPULATIONSAPPROVED:______________________________________________________________________________________INDICATOR: 3.3.1b % children under 2 reached with supplemental food
(CRS data)______________________________________________________________________________________UNIT OF MEASURE: % children 6-24 months______________________________________________________________________________________SOURCE DOCUMENT: CRS Results Report; CRS baseline and evaluation survey reportsSOURCE ORGANIZATION: CRS______________________________________________________________________________________INDICATOR DESCRIPTION: Percentage of children under two years in program catchment area
reached with supplemental food. Separate table created for CAREdata (3.3.1a).
______________________________________________________________________________________YEAR PLANNED PLANNED ACTUAL
LOW HIGH______________________________________________________________________________________1997 821998 871999 922000 97______________________________________________________________________________________COMMENTS: 1. Only preliminary baseline results are available as of this reporting. The baseline
and planned results may be revised when final baseline survey report is available.2. Supplemental food is an entry point for child survival services such as growth
promotion, immunization, referrals etc.3. CRS results report data from October through September.
65

D. Strategic Objective 4: Increased Environmental Protection in Energy,Industry and Cities
In the past year USAID/India has successfully merged the energy, urban and environmentSOs into the new SO 4. This consolidation has strengthened the leadership roleUSAID/India plays within the larger USG community in achieving the MPP Goal of"Supporting a Sustainable Environment". USAID leadership under the Indo-U.S.Common Agenda for the Environment (CAE), a framework established in 1995 to guidebilateral environmental cooperation, is also encouraging a more constructive role by theGovernment of India and private sector counterparts in tackling global environmentalissues, especially the issue of global climate change (GCC). Activities that address bothglobal and local environmental issues such as the impact of urban pollution on GCC andenergy efficiency are emerging as mutually acceptable ways of addressing U.S. and Indianclimate change concerns.
The USAID/India environment program also contributes to the MPP goal of "OpenMarkets and Increased U.S. Exports". Activities under SO 4 increase the market for U.S.environmental goods and services in India. A unifying theme for the USAID/Indiaenvironmental program is sustainability through unleashing market forces and fosteringprivate sector commercialization of eco-friendly technologies and promotion of bestpractices.
1. Performance Analysis
SO 4 results have exceeded expectations in the past year by meeting or surpassingplanned targets for the five indicators where data was available. A new set of indicators,targets and baseline data were established over the past year with assistance from theGlobal Bureau and ANE to reflect programmatic changes. We request approval byUSAID/Washington of these changes. It should be noted that as a result of the initiationof several new activities, reporting data for half of our indicators will be available aftera year or more of project implementation. The following analysis highlights only a fewexamples of success achieved by the SO 4 Team and is not meant to provide anexhaustive accounting of all SO 4 accomplishments.
Energy efficiency to reduce global warming threat
In the past year, USAID technical assistance and training resulted in significant reductionsin carbon dioxide emissions and increased power plant efficiency from coal fired powerplants in the National Thermal Power Corporation (NTPC) system. NTPC provides 25percent of India’s electric power and is considered to be the ninth largest and the thirdmost efficient power producer in the world. Implementing techniques learned throughUSAID-financed technical assistance and training at all the units of their Dadri powerplant, NTPC has realized a 2.5 percent heat rate efficiency improvement since March1997. This action has helped avoid 18,000 tons of carbon dioxide emissions annually (SOIndicator 4.1). Encouraged by this success, NTPC has taken an executive decision recentlyto expand the use of the techniques introduced at Dadri to all NTPC power plants and toinvest $2.5 million dollars this year alone in new, mostly U.S. technology (IR Indicator
66

4.1.2). On another policy front, USAID influenced the formulation of a new lawrequiring washing (beneficiation) of all Indian coal prior to use in power plants by 2001(IR Indicator 4.1.3).
Commercialization of alternative technologies to reduce GHG emissions
USAID successfully promoted commercial scale investments in five energy efficient sugarmills powered by bagasse (the remnants of crushed sugar cane left behind during sugarproduction) instead of fossil fuels (SO 4.1 and IR 4.1.2). Other forms of biomass suchas wood chip remnants from wood processing or rice hulls are used during the off-seasonwhen bagasse is not available. Much of the energy is being sold to State ElectricityBoard (SEB) grids to augment and displace power generated from fossil fuels.
USAID support for a joint venture between the U.S. electric vehicle (EV) firm Amerigonand India's Maini Group of Industries resulted in the fielding of two prototype EVs foruse in India. USAID/India is now using one of the new EVs in place of the old, heavilypolluting three-wheel vehicle used for mail delivery and other errands. The other EV isbeing used by Winrock International's Renewable Energy Project Support Office in Delhi.To date, twelve REVA electric vehicles have been built and tested by Amerigon and theMaini Group. Commercial vehicle production in India is expected to begin this year.
"Commercial viability" means "environmental sustainability" to Indian cities
The key to increased environmental protection in India’s urban areas lies in increasedmanagement capability of cities and towns. In the past year, USAID’s achievements inimprovement of urban environmental infrastructure in India have achieved widerecognition, with coverage in the Wall Street Journalof progress in Ahmedabad and aNew Yorkermagazine article highlighting USAID collaboration with the city of Varanasi.
Responding to both the needs of city governments and NGOs working on community-based environment management initiatives,USAID has helped to develop a "tool kit" ofimproved environmental management approaches like environmental workbooks, riskassessments, and environment management action plans (IR Indicator 4.3.2). A recentaddition to this tool kit are initiatives to help Indian cities develop practical, commerciallyviable, inner city revitalization plans. By making better use of the extraordinaryendowments of historic “heritage zones,” more Indian cities will be able to improveurban environmental protection.
The single most important element of the USAID/India approach to urban managementhas been the introduction of the concept of "commercial viability" as a desirable featureof urban environmental initiatives. With USAID/India’s assistance, the AhmedabadMunicipal Corporation (AMC) qualified for an investment grade credit rating andsuccessfully issued a $25 million Municipal Bond, the first in South Asia, to help financethe city’s environmental infrastructure projects (an achievement also noted under SO 1).With USAID assistance, the AMC prepared a comprehensive package of infrastructureprojects including improved water and sewage treatment (IR Indicator 4.3.1). USAIDparticipation with a HG loan of up to $25 million has been an important "confidence
67

builder" for this innovative package of activities. USAID assistance to the AMC has alsobeen essential in helping the city privatize a number of critical environmental protectionfunctions. This is the first time an Indian city has obtained professional supervision andmonitoring services for water supply and sewage. The contract is being awarded to anIndo-U.S. consortium.
Partnerships bear fruit for global environment, U.S and Indian utilities
The USAID/India-funded utility partnership program implemented by the U.S. EnergyAssociation has achieved significant results in the past year, reflected in new Indo-U.S.partnerships and new investments in clean power technologies (IR Indicator 4.1.2). TheAndhra Pradesh State Electricity Board (APSEB), partnered with Pennsylvania Power andLight (PP&L), has used procedures from PP&L’s energy audit program to determine thatdistribution losses could be reduced by four percent by installation of single phase waterpumps in agricultural areas. Through contacts made during their visits to the U.S. underthe partnership program, APSEB has identified a U.S. company to supply 10,000 single-phase pumps for use in the agricultural sector.
Bombay Suburban Electric Supply Ltd. (BSES) and Plum Street Enterprises (a subsidiaryof Niagara Mohawk Power Corporation) have agreed to form a joint-venture to marketsolid state electric meters to be made in India under a Niagara Mohawk patent.
As a result of the partnership program, Plum Street Enterprises has opened an office inNew Delhi (Global Energy Enterprises India Pvt., Ltd.) to explore other commercialopportunities in India, while BSES has adopted a whole new approach to customerservice. Working with cutting edge firms like Niagara Mohawk will open up newopportunities for supporting a sustainable environment. For example, Niagara Mohawkhas recently agreed to sell 100,000 metric tons of greenhouse gas (GHG) reduction creditsto Suncor, a Canadian oil and gas company. This potential $6 million GHG trade is animportant breakthrough in the creation of an international GHG emission trading systemto help implement the Kyoto Climate Change Agreement. It ensures that Niagara Mohawkwill have the requisite experience to enter into similar deals with Indian partners once amutually agreed-upon trading regime is in place. Vice President Al Gore recognized theNiagara Mohawk-Suncor transaction as “proof that our market-based strategy to combatclimate change is already working...The rules for trading are not yet final, but the marketitself is already emerging."
USAID responds to states seeking power sector reform
The USAID/India initiative in power sector regulatory reform and restructuring has metwith enthusiastic response from the Ministry of Power, Power Finance Corporation andstate government partners. USAID has chosen Haryana as an initial focus state due to itsstrong interest in power sector reform and has played a significant role in donorcoordination for Haryana power sector reform. In fact, coordination with the World Bankhas resulted in the Bank seconding one of their senior energy efficiency specialists toassist the Mission in designing a new energy conservation and commercialization activity.
68

Managing for demand side results generates efficiency gains
USAID is providing technical assistance to the Bureau of Indian Standards (BIS) todevelop energy efficiency standards and labelling for stimulating the market for energyefficient appliances. It sponsored a well-received labelling workshop in early 1998,which, for the first time in India, exposed participants to state-of-the-art concepts andexamples of appliance labels from around the world. USAID’s sustained technicalassistance and training over the last two and half years at Ahmedabad Electric Companyhas resulted in a well developed demand side management (DSM) program, the first ofits kind in an Indian utility. This program has now started commercial implementationwith the signing of a performance contract with Energy Service Companies (ESCOs) forinstallation and maintenance of energy efficient lighting equipment and capacitors fordomestic as well as industrial customers.
Indian industries see bottom-line benefits from environmental management systems
On the industrial environment front, USAID/India is promoting incentives for industry tovoluntarily adopt certified environmental management systems (EMSs). USAID’s programfocuses on high growth and heavily polluting industrial sectors including textiles, pulp andpaper, pharmaceutical, automobiles, food processing and metal fabrication to assist firmsin developing EMSs and gaining ISO 14000 certification (SO Indicator 4.2). Nine firmswere identified for certification in the past year. USAID technical assistance to promoteadoption of international environmental quality standards and increase investment incleaner technologies has led to decreased pollution in key industrial sectors (IR Indicator4.2.1). One recent collaboration, between Kothari Sugar and Chemicals Ltd, India andAmcane International, Minnesota, resulted in a new technique for extracting sugarcanejuice which decreased effluent by two-thirds, while requiring less land, energy andchemicals for treatment.
2. Expected Progress through FY 2000 and Management Actions
Global climate change
A major new GCC initiative of nearly $50 million is currently under design to build onthe success of existing activities in increasing efficiency in coal-fired power plants andbiomass cogeneration in the Indian sugar industry. This results package will dramaticallyexpand Mission climate change impacts by fostering public-private partnerships andfinancial engagement, linking urban development and climate change, increasingcommercialization of energy efficient technologies, enhancing the effectiveness ofpolicies, legislation and institutions, and establishing a major new human capacitydevelopment program. In the wake of Kyoto and in the run-up to Buenos Aires, the GOIwill be defining its position on emissions trading and Activities Implemented Jointly (AIJ)and the new Clean Development Mechanism. USAID will be working on related policyissues in the next year as part of a USG interagency strategy to more fully engage theGOI in defining their role in reducing threats from global climate change.
As a result of NTPC’s recent decision to implement the efficiency techniques proven at
69

Dadri, a reduction of one million metric tons per annum of CO2 emissions and a savingsof 600,000 tons of coal worth millions of dollars is now anticipated over the next threeyears. Five sugar mills in three states will start exporting nearly 120 MW ofbiomass-fueled cogeneration capacity. The power produced from these renewable energyfacilities will offset approximately one million tons of carbon dioxide annually.
Renewable energy/alternative technologies
In the biomass cogeneration activity, USAID/India's goal is to increase the number ofparticipants from the current five companies to at least eight commercial-scale bagassecogeneration demonstration projects by 2002. The Mission is also working with theIndustrial Credit and Investment Corporation of India and the Industrial DevelopmentBank of India to encourage their engagement in financing asset cogeneration.
The introduction of the REVA electric vehicle to Delhi is expected to be followed soonby the introduction (by other U.S. and Indian partners) of two small fleets of EVs: onefor restaurant home delivery in Delhi and the other for ferrying tourists in the Taj Mahalarea of Agra. In addition, fifteen REVA kits will be shipped by Amerigon fromCalifornia to India in the near future.
Urban environmental management
USAID expects to expand support to at least three additional cities for improvedenvironmental management practices from FY 99 to FY 2003. This will increase accessof improved water, wastewater and solid waste management services to five million peo-ple by FY 2002 (IR Indicator 4.3). USAID urban environmental activities will supportadoption of improved management tools by at least 14 cities by FY 2002 (IR Indicator4.3.2). An Indo-U.S. consortium was selected to operate India’s first commercially viablewater supply and sewerage project, developed with USAID assistance in Tirrupur, TamilNadu. This project, which will provide access to potable water and improved sewerageservices to approximately 350,000 people (SO Indicator 4.3), is expected to be underconstruction by July 1998. A growing number of Indian cities are seeking to participatein USAID’s activities to expand and improve environmental protection in urban areas,including Vijayawada, Varanasi, Faridabad and Surat. USAID is also helping to fosterthe "profession" of urban management, a new theme in India. In collaboration with theU.S.-based International City/County Managers’ Association, USAID has helped establishIndia’s "City Managers’ Association-Gujarat". An agreement between USAID’s Indianpartners and Sister Cities International is expected to facilitate access to an importantadditional source of U.S. experience.
Electric power sector restructuring
In Haryana, USAID/India’s resources will continue to achieve great leverage by influ-encing a $600 million World Bank loan and a pending Japanese equipment loan. USAIDwill identify and start technical assistance and training in two more states where USAIDassistance will result in accelerating the energy sector reform process.
70
Demand side management
In response to Haryana State and World Bank’s request, USAID technical assistance willhelp develop DSM and energy efficiency projects for the World Bank’s $60 million DSMportfolio for Haryana. USAID is also uniquely positioned to influence the twin mandatesof energy auditing for industry and the enforcement of energy efficiency appliancelabelling of the proposed Bureau of Energy Efficiency under the Energy Conservation Actwhich is likely to be passed by the new government this year.
Industrial environmental management
USAID technical assistance to the Federation of Indian Chambers of Commerce andIndustry (FICCI) will result in finalization of an ISO 14000 accreditation scheme, anddefinition of the responsibilities of a new environmental accreditation body (the QualityCouncil of India). The BIS will be assisted in gaining accreditation as a certifying entity,and BIS auditors and internal auditors of companies will be trained accordingly. TheConfederation of Indian Industries will complete the first phase of the ISO 14000certification program, with targets of 15 companies certified by 1999 and 70 companiesby 2003. A functioning system of benchmarks and voluntary information disclosure forindustrial environmental performance will be completed in the next three years. Astrategic plan will be developed for initiating "environmental due diligence" with Indianbanks. USAID technical assistance will also be provided to selected firms and theirsuppliers to help Indian industry “green the supply chain.” An industrial environmentalmanagement website will be created and hosted by ICICI, which will also provide amatchmaking service for Indian and U.S. environmental technology firms. An onlineEnvironmental Information Center will be established by FICCI by mid-1998. Based oninformation gained through a clean technology needs assessment, ICICI will support atleast 15 clean technology demonstration projects in 1999, and up to 60 projects by 2003.
71

PERFORMANCE DATA TABLE
______________________________________________________________________________________ORGANIZATION/PROGRAM: USAID INDIASTRATEGIC OBJECTIVE: SO 4 INCREASED ENVIRONMENTAL PROTECTION IN
ENERGY, INDUSTRY AND CITIESAPPROVED: July 09, 1997______________________________________________________________________________________INDICATOR: 4.1 Emissions of carbon dioxide equivalents avoided______________________________________________________________________________________UNIT OF MEASURE: Million Tons______________________________________________________________________________________SOURCE DOCUMENT: Center for Monitoring Indian Economy (CMIE) reports, Project
Reports, NTPC reportsSOURCE ORGANIZATION: CMIE, NTPC, Participating Organizations______________________________________________________________________________________INDICATOR DESCRIPTION: Emissions of carbon dioxide equivalents avoided are calculated
through conversions from the MW of energy saved through SO 4activities (such as MW of renewable energy installed, MW of fossilfuel-based energy saved through enhanced energy efficiencies - inboth supply side and demand side activities - and clean coal technolo-gies).
______________________________________________________________________________________YEAR PLANNED PLANNED ACTUAL
LOW HIGH______________________________________________________________________________________1997 0.021998 2.71999 5.52000 12.02001 18.82002 27.8______________________________________________________________________________________COMMENTS: Data reported for GOI fiscal year: April 1 to March 31.
72

PERFORMANCE DATA TABLE
______________________________________________________________________________________ORGANIZATION/PROGRAM : USAID INDIASTRATEGIC OBJECTIVE: SO 4 INCREASED ENVIRONMENTAL PROTECTION IN
ENERGY, INDUSTRY AND CITIESAPPROVED: July 09, 1997______________________________________________________________________________________INDICATOR: 4.2 Increased number of firms that meet international environ-
mental quality standards in selected industrial sectors______________________________________________________________________________________UNIT OF MEASURE: Number of firms______________________________________________________________________________________SOURCE DOCUMENT: Reports of Industry Associations, Bureau of Indian Standards
(BIS), Quality Council of India) (QCI)SOURCE ORGANIZATION: CII, FICCI, BIS, QCI______________________________________________________________________________________INDICATOR DESCRIPTION: Number of firms who, with assistance from the Clean Technology
Initiative (CTI), obtained ISO 14001 certification in the followingsectors: textiles, pulp & paper, pharmaceutical, automobiles, foodprocessing, and metal fabrication. Results shown are cumulative.
______________________________________________________________________________________YEAR PLANNED PLANNED ACTUAL
LOW HIGH______________________________________________________________________________________1997 01998 01999 102000 152001 202002 25
______________________________________________________________________________________COMMENTS: 1. Data reported for GOI fiscal year: April 1 to March 31.
2. Actual targets achieved against planned targets to be determined after data collectionfrom primary/secondary sources.
3. TEST, the primary project contributing to IR 4.2, was restructured in 1997. There-fore the results for new activities just being initiated will be available from late GOIFY 98/early GOI FY 99.
73

PERFORMANCE DATA TABLE
______________________________________________________________________________________ORGANIZATION/PROGRAM : USAID INDIASTRATEGIC OBJECTIVE: SO 4 INCREASED ENVIRONMENTAL PROTECTION IN
ENERGY, INDUSTRY AND CITIESAPPROVED: July 09, 1997______________________________________________________________________________________INDICATOR: 4.3 Increased access to improved drinking water, waste water, and
solid waste services through commercially viable systems______________________________________________________________________________________UNIT OF MEASURE: Population in Million______________________________________________________________________________________SOURCE DOCUMENT: Surveys and annual evaluations, sector assessments by
municipalities, HUDCO, ILFSSOURCE ORGANIZATION: Municipal Corporations, HUDCO, ILFS, NIUA______________________________________________________________________________________YEAR PLANNED PLANNED ACTUAL
LOW HIGH______________________________________________________________________________________1996 0.001997 0.001998 0.001999 0.352000 0.702002 5.00______________________________________________________________________________________COMMENTS: Data reported for GOI fiscal year: April 1 to March 31.
74
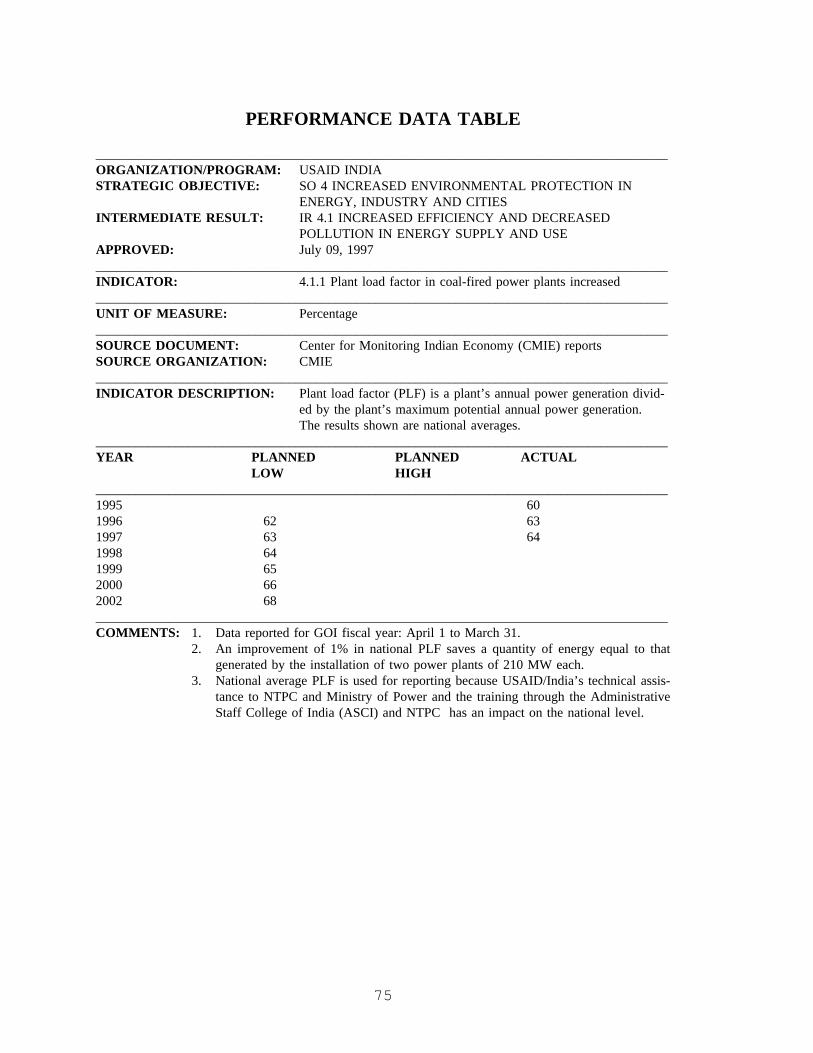
PERFORMANCE DATA TABLE
______________________________________________________________________________________ORGANIZATION/PROGRAM: USAID INDIASTRATEGIC OBJECTIVE: SO 4 INCREASED ENVIRONMENTAL PROTECTION IN
ENERGY, INDUSTRY AND CITIESINTERMEDIATE RESULT: IR 4.1 INCREASED EFFICIENCY AND DECREASED
POLLUTION IN ENERGY SUPPLY AND USEAPPROVED: July 09, 1997______________________________________________________________________________________INDICATOR: 4.1.1 Plant load factor in coal-fired power plants increased______________________________________________________________________________________UNIT OF MEASURE: Percentage______________________________________________________________________________________SOURCE DOCUMENT: Center for Monitoring Indian Economy (CMIE) reportsSOURCE ORGANIZATION: CMIE______________________________________________________________________________________INDICATOR DESCRIPTION: Plant load factor (PLF) is a plant’s annual power generation divid-
ed by the plant’s maximum potential annual power generation.The results shown are national averages.
______________________________________________________________________________________YEAR PLANNED PLANNED ACTUAL
LOW HIGH______________________________________________________________________________________1995 601996 62 631997 63 641998 641999 652000 662002 68______________________________________________________________________________________COMMENTS: 1. Data reported for GOI fiscal year: April 1 to March 31.
2. An improvement of 1% in national PLF saves a quantity of energy equal to thatgenerated by the installation of two power plants of 210 MW each.
3. National average PLF is used for reporting because USAID/India’s technical assis-tance to NTPC and Ministry of Power and the training through the AdministrativeStaff College of India (ASCI) and NTPC has an impact on the national level.
75
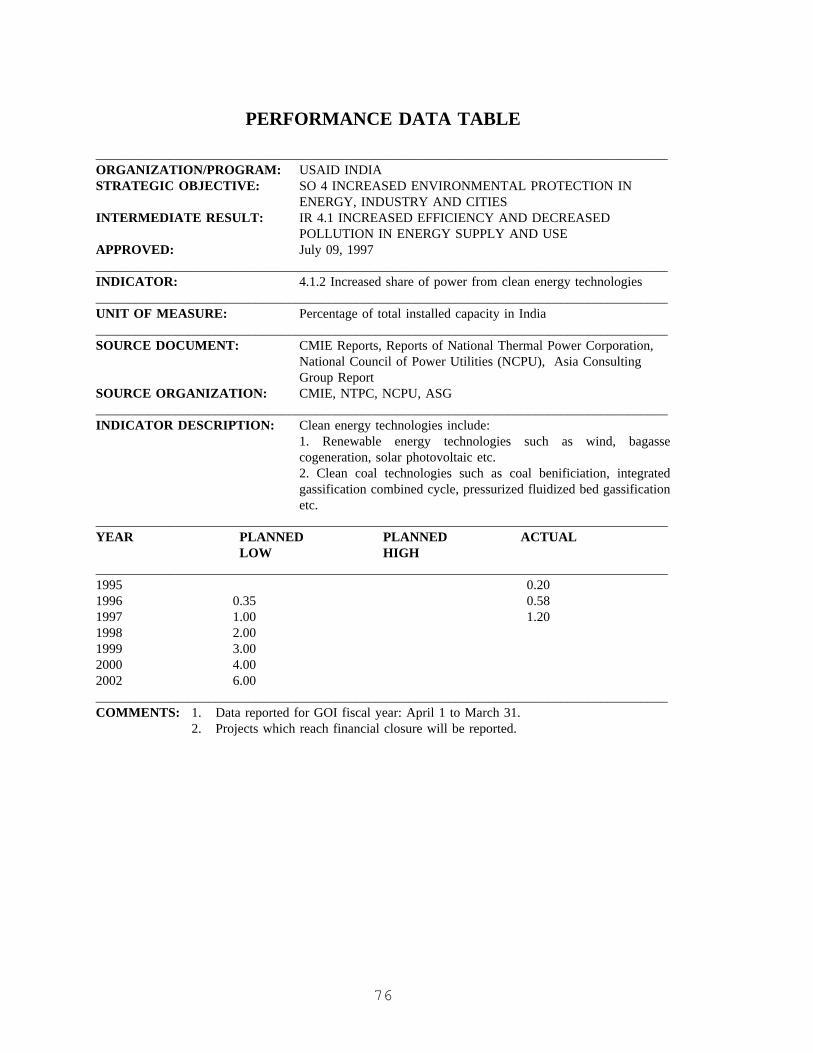
PERFORMANCE DATA TABLE
______________________________________________________________________________________ORGANIZATION/PROGRAM: USAID INDIASTRATEGIC OBJECTIVE: SO 4 INCREASED ENVIRONMENTAL PROTECTION IN
ENERGY, INDUSTRY AND CITIESINTERMEDIATE RESULT: IR 4.1 INCREASED EFFICIENCY AND DECREASED
POLLUTION IN ENERGY SUPPLY AND USEAPPROVED: July 09, 1997______________________________________________________________________________________INDICATOR: 4.1.2 Increased share of power from clean energy technologies______________________________________________________________________________________UNIT OF MEASURE: Percentage of total installed capacity in India______________________________________________________________________________________SOURCE DOCUMENT: CMIE Reports, Reports of National Thermal Power Corporation,
National Council of Power Utilities (NCPU), Asia ConsultingGroup Report
SOURCE ORGANIZATION: CMIE, NTPC, NCPU, ASG______________________________________________________________________________________INDICATOR DESCRIPTION: Clean energy technologies include:
1. Renewable energy technologies such as wind, bagassecogeneration, solar photovoltaic etc.2. Clean coal technologies such as coal benificiation, integratedgassification combined cycle, pressurized fluidized bed gassificationetc.
______________________________________________________________________________________YEAR PLANNED PLANNED ACTUAL
LOW HIGH______________________________________________________________________________________1995 0.201996 0.35 0.581997 1.00 1.201998 2.001999 3.002000 4.002002 6.00______________________________________________________________________________________COMMENTS: 1. Data reported for GOI fiscal year: April 1 to March 31.
2. Projects which reach financial closure will be reported.
76

PERFORMANCE DATA TABLE
______________________________________________________________________________________ORGANIZATION/PROGRAM: USAID INDIASTRATEGIC OBJECTIVE: SO 4 INCREASED ENVIRONMENTAL PROTECTION IN
ENERGY, INDUSTRY AND CITIESINTERMEDIATE RESULT: IR 4.1 INCREASED EFFICIENCY AND DECREASED
POLLUTION IN ENERGY SUPPLY AND USEAPPROVED: July 09, 1997
______________________________________________________________________________________INDICATOR: 4.1.3 Improved policy, legal and regulatory framework for
increased power sector efficiency______________________________________________________________________________________UNIT OF MEASURE: Percentage______________________________________________________________________________________SOURCE DOCUMENT: TBDSOURCE ORGANIZATION: TBD______________________________________________________________________________________INDICATOR DESCRIPTION: Average progress in the completion of 12 policy reforms.______________________________________________________________________________________YEAR PLANNED ACTUAL
QUALITATIVE QUALITATIVE______________________________________________________________________________________1995 TBD1996 TBD1997 22 221998 411999 582000 75______________________________________________________________________________________COMMENTS: 1. Progress in achieving Policy reform will be measured through a rating process that
tracks policy changes. Progress in policy reform in 12 specific areas covering IR 4.1will be tracked and the results reported each year.
2. See the Annexure immediately following this table for the policy results matrix, anda definition of the twelve policy issues.
77

ANNEXUREI. SO 4 POLICY MATRIX RESULTS FY97-2001
Policy Reform 97 98 99 00 01
Regulatory Reform & Restructuring:
1. GOI’s IPP approval policy simplified 10 20 40 60 80
2. G-T-D unbundling & privatization policies adopted bykey SEBs
10 10 40 60 90
3. SEB financial management improved 10 20 20 40 60
4. Key SEBs establish Regulatory Bodies 10 20 40 60 80
5. Tariffs based on prudent cost basis analysis adopted byselected SEBs
10 20 40 40 60
6. R&M financing norms refined and adopted by key SEBs10 20 40 60 80
Demand Side Management:
7. Energy Conservation Act passed 40 60 100 - -
8. Bureau of Energy Efficiency established 20 40 60 100 -
9. Design of Appliance labelling Standards by Bureau ofIndian Standards
20 40 60 100 -
Greenhouse Gas Pollution Prevention:
10. Detailed guidelines for AIl projects adopted by MOEF 0 40 100 - -
11. NTPC adopts policy to expand thermal power plant effi-ciency system-wide
60 100 - - -
12. Coal beneficiation required by 2001 60 100 - - -
TOTAL PROGRESS: 260 490 640 520 450
Average of all reforms 22
Average Targeted progress 22 41 58 65 75
78

II. Rating Process
Policy efforts generally pass through five, flexibly-defined steps, each of them weightedaccording to its importance in the process, for a total of 100% in the case of a policymeasure fully in force. These steps, which are used for all policy reform-related activitiesin SO 4, are the following:
1. Identification/analysis (10%): This step includes definition of the problem, baselinedata development, feasibility studies and cost/benefit analyses of various alternatives. Italso involves consultation with all interested parties: GOI, NGOs, local authorities, andother partners/customers.
2. Development (10%): The full development of project interventions to address theproblem identified. Development includes budgeting, identification of all costs andbenefits, and detailed project planning completed.
3. Validation/promotion/training (20%): Includes vetting proposals by relevant par-ticipants (GOI, NGOs, local authorities, etc.). The dialogue includes all interested partiesand builds awareness of the importance of what needs to be done. Coalitions which thinkthe proposal is a good idea and can lobby for adoption are identified, sensitized, andtrained. This is the stage of broadening public participation, through seminars, roundtables, etc. with the interested parties.
4. Adoption (20%): Can take the form of the voting on a law, the issuance of a decree,the adoption of a regulation, or the establishment of an operation. This is the phase ofpublic/private negotiations and GOI coordinating among ministries to get legislation,decrees and policies adopted.
5. Implementation/enforcement (40%): This puts the proposal into effect. Any TAneeds for implementation pass through the RFP stage and selection process stage. Theimplementation staff is trained in new procedures. Enforcement is monitored and actualimpact assessed.
III. Definition of Policy Issues:
Regulatory Reform and Restructuring
1. GOI’s IPP approval policy simplified . GOI will encourage competitive bidding forall future projects at the Center and encourage participating states to adopt a "one-stop"window for facilitating development within the state; establish IPP evaluations againstcost of power, dispatch considerations, fuel availability and sponsor ability to bring equityand debt financing to the project.
2. G-T-D unbundling and privatization policies adopted by key SEBs. Selected SEBswill implement plans to unbundle their generation, distribution and transmissions entities.These plans will stress the need for corporatization strategies will be development andimplemented to assure that employee issues are addressed in the plans.
79

3. Selected SEBs’ financial management improved.Selected SEBs will develop andimplement planning, forecast and budget models, understand and develop financialreports, establish relations with debt and equity financial institutions and stock holders,and start developing financial reports for regulatory commissions when these are in-stituted.
4. Key State Governments will establish electricity regulatory bodies.IndependentRegulatory Bodies will be established which will oversee and regulate the power sectorreforms stressing the need for financial soundness of power sector entities; encourageefficient use of energy and natural resources by both the power sector and end-users;allow access to all stake holders at tariff hearings; and ensure least cost planning byregulated entities.
5. Tariffs based on prudent cost basis analysis adopted by selected SEBs. SelectedSEBs will shift to tariffs that represent prudent cost of service for different customerclasses plus reasonable incentive profits.
6. R&M financing norms refined and adopted by SEBs.Selected SEBs will adoptfinancing mechanisms for rehabilitation and modernization (R&M) that attract outsideinvestors as possible equity partners with selected SEB entities, especially as they aremoving towards privatization. R&M brings the greatest systems improvement, includingplant efficiency, at the lowest cost when compared to the cost of setting up a new powerplant.
Demand Side Management
7. Energy Conservation Act passed.Encourage the progressive implementation ofpolicies to promote the efficient use of energy in the industrial sector. The Ministry ofpower(MOP) should use mandatory energy efficiency auditing to bring rational energyuse into the industrial sector. Through the establishment of the Bureau of Energy Ef-ficiency, the MOP will enforce the mandatory auditing clause of the Act to ensurecompliance by industry.
8. Bureau of Energy Efficiency established. Support the implementation of mandatoryappliance standards and labeling. Created by the Energy Conservation Act, the Bureau ofEnergy Efficiency has two mandates. To enforce mandatory auditing in the industrialsector and to enforce the use of energy efficiency appliance labeling. The bureau ofenergy efficiency should coordinate the research activities of other government agenciesto introduce readable and informative appliance label.
9. Design of Appliance Labeling by Bureau of Indian Standards.Encourage the rational design of energy efficiency appliance labeling. The Bureau ofIndian Standards (BIS) should carefully research the consumer acceptance of appliancelabeling and coordinate their findings with the newly established Bureau of Energy Ef-ficiency. Although the Government of India, Ministry of power has clearly stated theirintentions of making appliance standards and labeling mandatory, the infrastructurenecessary to implement this policy is still lacking.
80
Greenhouse Gas Pollution Prevention
10. Detailed guidelines for AIJ Projects Adopted. The Ministry of Environment andForests is the nodal government agency for GOI for all AIJ (Activities ImplementedJointly) projects which aims to test the concepts of Joint Implementation in the pilotphase. The MOEF should develop detailed guidelines for development of AIJ projectsindicating clearly the GOI priority areas, baseline determination, emissions off-setmonitoring and verification, appraisal and approval system.
11. NTPC adopts power plant efficiency improvement system-wide. NTPC hasreceived extensive technical assistance and training to implement power plant efficiencyimprovement. In order to achieve the total potential for carbon dioxide off-sets fromefficiency improvement, NTPC corporate policy should make efficiency improvement inall their power plants a time-bound policy.
12. Coal beneficiation required by 2001. Indian coal contains up to 50% inert material(mostly ash and shales) which needs to be pre-treated (beneficiated or washed) prior todespatch of the coal from the mines to the power plants, which leads to serious air, landand water pollution. Ministry of Environment and Forests should make it compulsory forall power plant users (based on coal as fuel) to use coal of a certain minimum ashpercentage. It is now anticipated that legislation will require coal washing for all thermalpower plants by 2001.
81

PERFORMANCE DATA TABLE
______________________________________________________________________________________ORGANIZATION/PROGRAM: USAID INDIASTRATEGIC OBJECTIVE: SO 4 INCREASED ENVIRONMENTAL PROTECTION IN
ENERGY, INDUSTRY AND CITIESINTERMEDIATE RESULT: IR 4.2 POLLUTION REDUCED IN SELECTED INDUSTRIAL
SECTORSAPPROVED: July 09, 1997______________________________________________________________________________________INDICATOR: 4.2.1 Increased investment by companies in clean environmental
technologies.______________________________________________________________________________________UNIT OF MEASURE: Number of companies______________________________________________________________________________________SOURCE DOCUMENT: i. Data from surveys, project reports, industry associations and
company annual reports.ii. Other secondary sources such as the GOI and CMIE.
SOURCE ORGANIZATION: CTI Project, CII, FICCI, CMIE______________________________________________________________________________________INDICATOR DESCRIPTION: Number of companies that have increased investment in clean envi-
ronmental technologies with CTI assistance.______________________________________________________________________________________
YEAR PLANNED PLANNED ACTUALLOW HIGH
______________________________________________________________________________________1997 01998 01999 102000 152001 152002 20______________________________________________________________________________________COMMENTS: 1. Data reported for GOI fiscal year: April 1 to March 31.
2. It is assumed that there is a significant response to the questionnaire survey of thefirms reached by CTI. Note that the sample size may be statistically insignificant,and that the results of the survey cannot be extrapolated within and across the sec-tors. The sample population and subjects may vary from year to year.
3. Actual targets achieved against planned targets will be determined after data col-lection from primary/secondary sources.
4. Projects which reach financial closure will be reported.5. The Trade in Environmental Services and Technologies/Clean Technology Initia-
tive (TEST/CTI), the primary project contributing to IR 4.2, was restructured in1997. Therefore the results for activities just being initiated will be available fromGOI FY 98/early GOI FY 99.
82
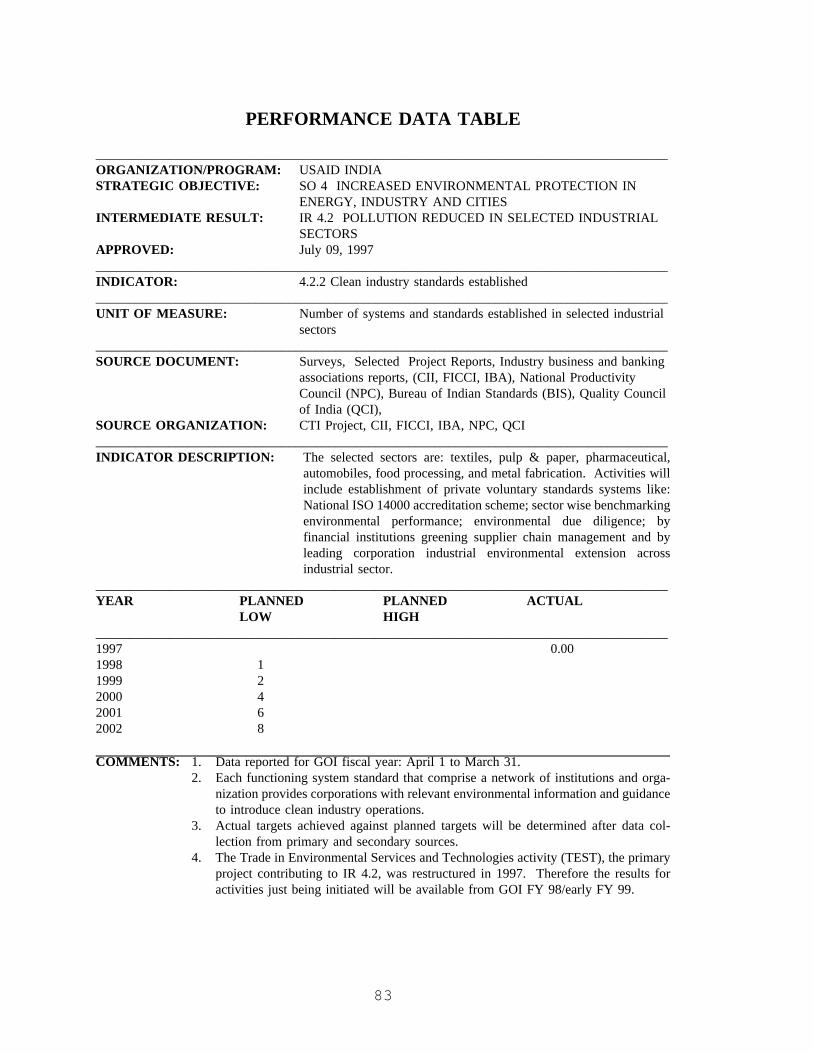
PERFORMANCE DATA TABLE
______________________________________________________________________________________ORGANIZATION/PROGRAM: USAID INDIASTRATEGIC OBJECTIVE: SO 4 INCREASED ENVIRONMENTAL PROTECTION IN
ENERGY, INDUSTRY AND CITIESINTERMEDIATE RESULT: IR 4.2 POLLUTION REDUCED IN SELECTED INDUSTRIAL
SECTORSAPPROVED: July 09, 1997______________________________________________________________________________________INDICATOR: 4.2.2 Clean industry standards established______________________________________________________________________________________UNIT OF MEASURE: Number of systems and standards established in selected industrial
sectors______________________________________________________________________________________SOURCE DOCUMENT: Surveys, Selected Project Reports, Industry business and banking
associations reports, (CII, FICCI, IBA), National ProductivityCouncil (NPC), Bureau of Indian Standards (BIS), Quality Councilof India (QCI),
SOURCE ORGANIZATION: CTI Project, CII, FICCI, IBA, NPC, QCI______________________________________________________________________________________INDICATOR DESCRIPTION: The selected sectors are: textiles, pulp & paper, pharmaceutical,
automobiles, food processing, and metal fabrication. Activities willinclude establishment of private voluntary standards systems like:National ISO 14000 accreditation scheme; sector wise benchmarkingenvironmental performance; environmental due diligence; byfinancial institutions greening supplier chain management and byleading corporation industrial environmental extension acrossindustrial sector.
______________________________________________________________________________________YEAR PLANNED PLANNED ACTUAL
LOW HIGH______________________________________________________________________________________1997 0.001998 11999 22000 42001 62002 8
COMMENTS: 1. Data reported for GOI fiscal year: April 1 to March 31.2. Each functioning system standard that comprise a network of institutions and orga-
nization provides corporations with relevant environmental information and guidanceto introduce clean industry operations.
3. Actual targets achieved against planned targets will be determined after data col-lection from primary and secondary sources.
4. The Trade in Environmental Services and Technologies activity (TEST), the primaryproject contributing to IR 4.2, was restructured in 1997. Therefore the results foractivities just being initiated will be available from GOI FY 98/early FY 99.
83

PERFORMANCE DATA TABLE
______________________________________________________________________________________ORGANIZATION/PROGRAM: USAID INDIASTRATEGIC OBJECTIVE: SO 4 INCREASED ENVIRONMENTAL PROTECTION IN
ENERGY, INDUSTRY AND CITIESINTERMEDIATE RESULT: IR4.3 IMPROVED URBAN ENVIRONMENTAL INFRA-
STRUCTURE BUILT AND SERVICES DELIVERED IN SE-LECTED CITIES.
APPROVED: July 09, 1997______________________________________________________________________________________INDICATOR: 4.3.1 Increased volume of drinking water and waste water treated,
and solid waste collected and safely disposed of, through com-mercially viable systems.
______________________________________________________________________________________UNIT OF MEASURE: a) Drinking water and b) waste water in millions of liters/day
c) Solid waste in tons/day______________________________________________________________________________________SOURCE DOCUMENT: Survey/annual evaluations, sector assessment reports by munici-
palitiesSOURCE ORGANIZATION: HUDCO, ILFS, NIUA/Project Reports.______________________________________________________________________________________INDICATOR DESCRIPTION: (a) Volume of water treated for drinking
(b) Volume of sewage given at least primary treatment(c) Tons of solid waste collected and disposed of in an environ-mentally safe manner
______________________________________________________________________________________YEAR PLANNED PLANNED ACTUAL
LOW HIGH______________________________________________________________________________________1997 0
1998 0
1999 46(a)18(b)
150(c)
2000 76(a)53(b)
650(c)
2002 370(a)140(b)850(c)
COMMENTS: Measurable data for the project will be available by the end of FY 99, whenconstruction is completed.
84

PERFORMANCE DATA TABLE
______________________________________________________________________________________ORGANIZATION/PROGRAM: USAID INDIASTRATEGIC OBJECTIVE: SO 4 INCREASED ENVIRONMENTAL PROTECTION IN
ENERGY, INDUSTRY AND CITIESINTERMEDIATE RESULT: IR 4.3 IMPROVED URBAN ENVIRONMENTAL INFRA-
STRUCTURE BUILT AND SERVICES DELIVERED INSELECTED CITIES
APPROVED: July 09, 1997______________________________________________________________________________________INDICATOR: 4.3.2 Local governments applying urban environmental
management tools______________________________________________________________________________________UNIT OF MEASURE: Number of governments which have adopted urban environmental
management tools which are the following: environmental work-books and maps, risk assessment, environmental studies and evalu-ations, and Action Plan development.
______________________________________________________________________________________SOURCE DOCUMENT: Surveys, annual evaluations, municipalities, Hudco, ILFS,
NIUA/Project Reports.SOURCE ORGANIZATION: Municipalities, Hudco, ILFS, NIUA.______________________________________________________________________________________INDICATOR DESCRIPTION: Cumulative______________________________________________________________________________________YEAR PLANNED PLANNED ACTUAL
LOW HIGH______________________________________________________________________________________1995 11996 2 21997 4 41998 61999 82000 102002 14______________________________________________________________________________________COMMENTS: Data reported for GOI fiscal year: April 1 to March 31
85

E. Special Objective 1: Reduced Transmission of HIV Infection
1. Performance Analysis
Performance in addressing HIV transmission has exceeded targets for all indicators. Programimplementation has accelerated considerably, and strategic partnerships with national and statelevel GOI entities and NGOs have been expanded and enriched. The AIDS Prevention andControl Program (APAC) in Tamil Nadu, dealing primarily with private, commercial sector andNGO interventions, has received able guidance, and quick approvals for activities from itsManagement Committee. APAC has also received funds for project implementation in a verytimely manner from the National AIDS Control Organization (NACO), thus making it possibleto accelerate and expand both public and private sector activities. The complementary publicsector program implemented by the Tamil Nadu State AIDS Control Society (TANSACS) fundedby the State of Tamil Nadu and the World Bank has also functioned effectively. Together, thetwo programs have effected some very significant behavior changes in Tamil Nadu which areclearly reflected in the indicators.
USAID/India’s SPO 1 program is a central element of the MPP goal of "Protecting Health" andcontributes also to the goal "Broad Based Economic Growth". Important complementaryactivities are financed by the National Institutes of Health and CDC, principally for bench andbehavioral research on vaccine development, new treatment alternatives and behavioral research.
Reduced high risk behavior
The Behavioral Sentinel Surveillance study (BSS) monitors HIV risk behavior in seven groupssampled from ten major metropolitan areas throughout the state of Tamil Nadu. The findings ofthe second round of the BSS study, conducted in November/December 1997, one year after thefirst baseline round, indicate significant progress by APAC in achieving its goals of behaviorchange leading to reduced risk of HIV infection. Decreases in non-regular sex partnerships,increases in condom use, and improved treatment seeking behavior for STDs--the three majorbehaviors which reduce HIV transmission--were among the changes reported between the firstand second rounds.
The proportion of males who used condoms with their non-regular sex partners (Indicator 1.1)increased from 37 percent in 1996 to 47 percent in 1997, a 27 percent increase overall, andexceeding the planned target of 44 percent by 7 percent. Use of condoms in commercial sexrelationships increased dramatically. Among truckers, for example, condom use changed from55 percent in 1996 to 66 percent in 1997, an increase of 18 percent. The BSS for 1997 alsoshows that there has been significant decline in other forms of high risk behaviors. Two out ofthree male risk groups -- truck drivers and their helpers, and male factory workers -- reporteddecreased non-regular sexual partnerships in the past year. Truck drivers and their helpersdecreased this type of partnership from 48 percent to 36 percent, and male factory workers, from15 percent to 11 percent. Male students remained unchanged at 3 percent in both rounds.
The BSS also indicated significant change in male patronage of female sex workers. In 1997,27 percent of truck drivers and their helpers reported visiting at least one sex worker during thepast year--down from 38 percent in 1996. Factory workers reported a decrease in this same
86

behavior from 7 percent in 1996 to 4 percent in 1997.
Expanding availability of, access to and demand for condoms, and increased, condom use inprotecting against HIV/STD prevention, is a major objective of APAC. Total condom sales inTamil Nadu grew 4 percent over 1996. APAC entered into a significant collaborativearrangement with a major private sector manufacturer of condoms. The purpose of the collabo-ration was to demonstrate that investments in expanded condom distribution systems could leadto both increased sales volumes and to a reduction in the direct cost of sales. The experimentwas extremely successful, resulting in the manufacturer’s sales volume doubling in a twelvemonth period between November 1996 and November 1997 from 3.57 million to 6.77 millioncondoms - a major part of the overall growth in sales for the state. The manufacturer doubledthe number of retail outlets served by sales force, and intensively promoted condoms at point ofpurchase. A large proportion of the new retail outlets added were non-traditional retail outlets,such as tea and tobacco outlets-found in the most densely populated urban areas, and mosteffective in improving access to condoms at all times of the day and night. The success of thisactivity has stimulated two other major manufacturers to apply for participation in APAC’scondom program.
Treatment of sexually transmitted diseases
The BSS also measured sexually transmitted disease (STD) treatment seeking behavior ofindividuals reporting STD symptoms (Indicator 1.2). The second round survey indicated thatindividuals seeking care from qualified medical practitioners for symptoms of urethritis increasedfrom 64 percent in 1996 to 79 percent in 1997 among trucker drivers and their helpers, and from58 percent to 83 percent among male factory workers. Students remained unchanged at22 percent. However, students have not reported any significant levels of high risk behavior inthe first place.
Five medical colleges and training institutions have received grants as planned to train 1,400physicians over the next three years, in providing high quality care for STDs. Training teamsat each institution have been identified and trained in the use of participatory andskill/competency based training. A total of 250 physicians have already been trained at thesecenters using the module for training of physicians developed by APAC in 1997. The modulewill be revised this year based on the feedback from both trainees and trainers. Four moremodules for the training of pharmacists, auxiliary nurse midwives, community health workers,and non-formal or traditional medical practitioners have been developed and the drafts await pilottesting.
Linkages are being established between these training centers and NGO grantees working inintervention areas such as the trucking points. NGOs identify those private practitioners in theirareas who are utilized by risk groups for STD treatment. The NGOs refer community patientsin need of services to such providers. The names and addresses of the private providers are alsosent to the nearest training institution, which then invites the provider to attend its trainingprograms. In two cases, the training centers have, at the request of NGOs, run special programsfor providers in the area served by the NGO.
After pilot testing alternative approaches for measuring the quality of STD services provided by
87

physicians, a methodology termed the "STD health facility survey" was designed, and a firstround of the study was commissioned in August, 1997. The results are expected in March, 98.
Grants to NGOs for AIDS prevention in Tamil Nadu
Against the planned 30 grants to be made during 1997 (Indicator 1.3), 53 grants were made toNGOs to carry out a variety of programs, exceeding the planned level by 77 percent, andbringing the project total to 71 grants. Of the 53 grants made in 1997, 21 are for three-year NGOprograms.
Among this year’s grantees are eleven NGOs who work at strategic locations on interstatehighways, providing behavior change education to the drivers of trucks transiting through thesepoints. Baseline studies show that approximately 1.5 million truckers transit through theselocations each month. Regular and repeated journeys of trucks along these routes offer NGOsmultiple opportunities for contact and behavior change communication with the two person teamsof a truck driver and helper that travel with each truck.
NGOs funded by APAC to implement community based behavior change interventions with riskgroups emphasize condom use as a part of their promotion of safe sexual behavior. They alsomap all retail outlets in their areas, and liaise with condom manufacturers to ensure that asufficient number of outlets in each community carry an uninterrupted supply of condoms. Thispart of the work has not yet been whole-heartedly accepted by the NGOs, as a large number ofthem are still ideologically inclined to distribute free government-supplied condoms. APAC willinvest time and effort in educating NGOs on the need to promote commercial condoms as theonly long-term sustainable option.
Research
A landmark community-based STD prevalence and etiology study has been completed. Theresults will be available for dissemination in early April, 1998. This hugely significant, high-quality community study of all major STD infections included a rigorous study design, an ethicalreview, counseling, informed consent, and care and treatment of those clients who attended thehealth camps where they were interviewed and examined. It is expected that the findings of thestudy will provide important information for national and state level strategic and programplanning. The study was implemented by a consortium of outstanding medical researchinstitutions.
Other USAID funded activities
The Program for Advancement of Commercial Technology/Child and Reproductive Health(PACT/CRH) also makes a significant contribution to this Special Objective. Loans have beenprovided to private sector manufacturers to expand the marketing and distribution of condoms,and to indigenously manufacture and market condom vending machines. To improve the qualityof condom production in India, an issue of central importance to HIV/AIDS prevention, technicalexperts are also assisting the Drug Controller of India to strengthen the Government’s qualitycontrol monitoring capacity and to work with the GOI and manufacturers to improve condompackaging in India. Assistance is also provided to the condom manufacturers to improve their
88

internal quality control procedures. The market leader, has already met the current revised WHOstandards and the other major player, as part of the loan plans also to meet this criteria soon. Agrant has been provided to the Confederation of Indian Industries (CII), an apex industrial bodywith an extensive country-wide network of 3,500 member companies, to develop and market aneducational package for prevention of HIV/AIDS/STD in the work place setting in Indianindustries. Over 260 industries with over 400,000 employees have purchased the packages.
2. Expected Progress through FY 2000 and Management Actions
Progress will be made in four specific areas. A mid-term evaluation of APAC, planned forSeptember/October 1998, will help directly with work in three (a.-c.) of the four areas.
• There will be increased coverage of high risk groups. Over the next year APAC will workto cover more risk groups with behavior change intervention programs. Two sets of grantsto NGOs, one to work with women in prostitution, and the other with people living in urbanslums, are planned. Both are populations which require targeted behavior changeinterventions. The present condom promotion activities will be expanded to include at leastone more major, commercial sector manufacturer, and a generic condom promotion campaignwill be launched.
• In attempting to mitigate the impact of the epidemic on low risk groups, APAC will attemptto study the feasibility of integrating STD/HIV prevention and control activities into maternaland child health and family planning activities, and one or two grants are expected to bemade on this account.
• Work on improving access to STD services will continue. Development of four trainingmodules for health care providers other than qualified medical practitioners, will be com-pleted. Training of these categories of providers in quality care of STDs will commence.The findings of the STD prevalence study will be widely disseminated and policyimplications of findings will be highlighted to the Governments of India and Tamil Nadu, andto the donor community. Several leading manufacturers will be approached for productionand marketing of low cost, rapid STD diagnostics, including for HIV.
• The Mission will expand its HIV/AIDS program to include support for the state ofMaharashtra. In December, 1997 the Mission completed an assessment of its AIDS programoptions to expand support to an additional high transmission state, and to support selectedactivities at the national level. The Mission is finalizing plans to expand its HIV/AIDSprogram to:
• Reduce STD/HIV transmission and mitigate their impact in the commercial sex industryin the urban areas of Mumbai, Thane, Pune, and the rural district of Sangli, in the stateof Maharashtra.
• Carry out a program of applied and operations research designed to provide the NationalProgram with data for decision making, advocacy, program planning, implementationand evaluation.
• Develop appropriate models of intervention programs through pilot and demonstration
89
activities in areas/groups of epidemiological or programmatic significance.
This package of new programs, when added to USAID’s current activities in STD/HIV/AIDS,results in a significant expansion of USAID’s objectives and activities in HIV/AIDS, andnecessitates the revision of its present Special Objective 1:Reducing the transmission ofHIV/AIDS. The Mission has decided to utilize the opportunity provided by this revision toredesign the objective so that it addresses not only the Agency’s HIV/AIDS agenda, but also itsnewly-announced infectious disease agenda.
Keeping in mind the Mission’s financial and management constraints, the program under the newStrategic Objectives will focus primarily on infectious disease issues that intersect withSTD/HIV/AIDS programming. Therefore, USAID/India’s support for infectious diseases workin India will focus on (a) research that will help improve preventive and curative practices forsexually transmitted diseases (STDs) and for opportunistic infections (particularly tuberculosis)that affect HIV positive people; and (b) support for developing an integrated disease surveillancesystem, particularly in those areas of Maharashtra where USAID’s STD/HIV/AIDS program isoperational.
This program expansion will necessitate a conversion of SPO 1 to a new full AIDS/InfectiousDiseases SO. USAID/India will submit to the ANE Bureau a document detailing its revisedstrategic objective, indicators, and the resources required to carry out the program The documentwill provide a comprehensive picture of all components of USAID’s proposed expandedHIV/AIDS and infectious diseases program, when fully negotiated and developed. It is expectedthat negotiations will be occur in stages. The Mission is confident of reaching agreement withthe NACO and Maharashtra State on the component dealing with HIV prevention in thecommercial sex industry in Maharashtra. It is expected that funds for this component will beobligated before September 1998. As for the other two components, namely the national researchprogram, and demonstration and pilot activities, negotiations on implementation will be finalizedlater. If agreement can be reached, these components will provide for better information fordecision making at NACO, and for future growth of USAID assistance to India in areas that willhave the greatest impact on the epidemic.
With regard to disease surveillance, the Government of India is in the process of developing aprogram with funding from the World Bank. The World Bank has expressed support for anyassistance that USAID, its sister US Agencies, and WHO can provide to the Government of Indiain developing this program. The Mission anticipates that the development of this program willtake an extended period, involving several agencies of the Indian Ministry of Health and FamilyWelfare, other than NACO. The Mission has therefore decided that it will try to build its initialbilateral support for surveillance activities around such surveillance as the MaharashtraGovernment is interested in pursuing for HIV/AIDS and related infectious diseases. Even thislimited approach will need to be discussed and negotiated with NACO and the concernedMaharashtra State agencies. The Mission also intends to communicate to the Government ofIndia its willingness to use global field support mechanisms to provide WHO and CDC assistanceto help India develop its national disease surveillance system. USAID/India’s support forstrengthening infectious/emerging diseases and surveillance activities is part of the broader USGovernment effort in this field.
90

PERFORMANCE DATA TABLE
______________________________________________________________________________________ORGANIZATION/PROGRAM: USAID INDIASPECIAL OBJECTIVE: SpO1 REDUCED TRANSMISSION OF HIV INFECTIONAPPROVED: July 09, 1997______________________________________________________________________________________INDICATOR: 1.1 Percentage of individuals belonging to specified high-risk
groups who report condom use in most recent sexual encounter witha non-regular partner
______________________________________________________________________________________UNIT OF MEASURE: Percentage______________________________________________________________________________________SOURCE DOCUMENT: Behavioral Sentinel Surveillance StudySOURCE ORGANIZATION: AIMS Research______________________________________________________________________________________
INDICATOR DESCRIPTION: Figures are simple arithmetic averages for commercial sex workers,STD clinic attenders, truck drivers and helpers. Groups such as maleand female factory workers, and male and female students are notincluded since BSS data indicates they are not "high risk groups".
______________________________________________________________________________________YEAR PLANNED PLANNED ACTUAL
LOW HIGH______________________________________________________________________________________1996 371997 42 471998 471999 522000 572002 62______________________________________________________________________________________COMMENTS: Data reported for 12 month periods ending November each year.
91
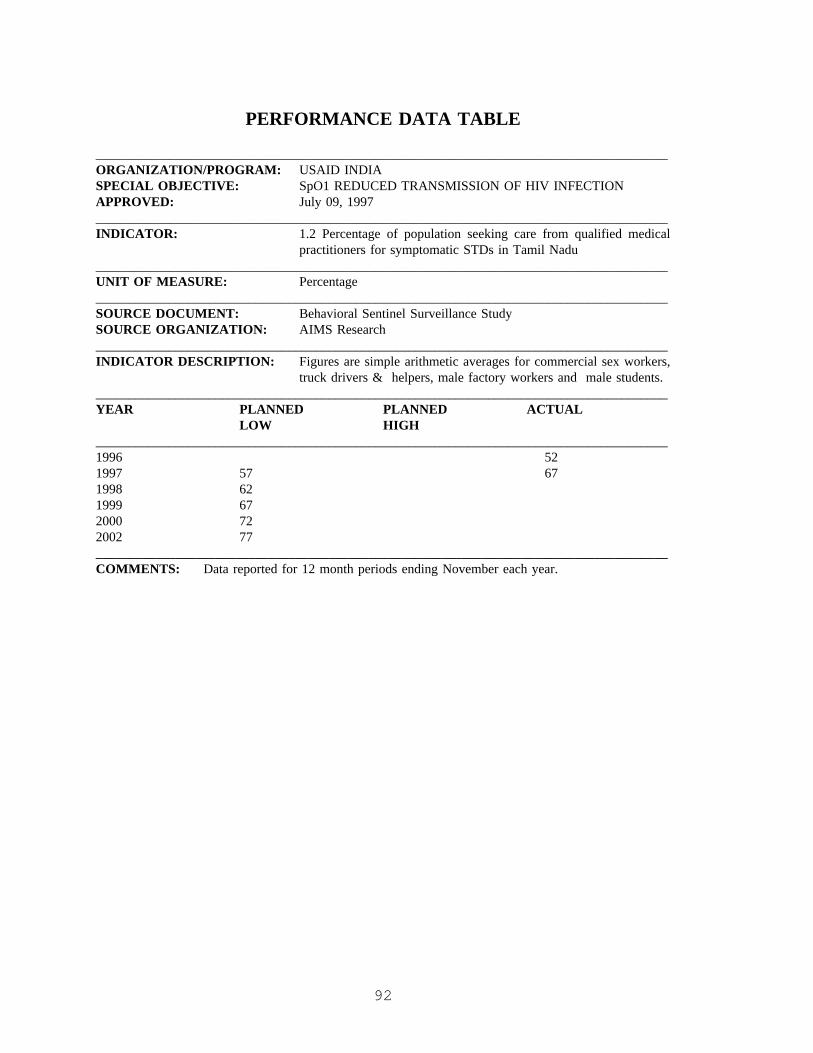
PERFORMANCE DATA TABLE
______________________________________________________________________________________ORGANIZATION/PROGRAM: USAID INDIASPECIAL OBJECTIVE: SpO1 REDUCED TRANSMISSION OF HIV INFECTIONAPPROVED: July 09, 1997______________________________________________________________________________________INDICATOR: 1.2 Percentage of population seeking care from qualified medical
practitioners for symptomatic STDs in Tamil Nadu______________________________________________________________________________________UNIT OF MEASURE: Percentage______________________________________________________________________________________SOURCE DOCUMENT: Behavioral Sentinel Surveillance StudySOURCE ORGANIZATION: AIMS Research______________________________________________________________________________________INDICATOR DESCRIPTION: Figures are simple arithmetic averages for commercial sex workers,
truck drivers & helpers, male factory workers and male students.______________________________________________________________________________________YEAR PLANNED PLANNED ACTUAL
LOW HIGH______________________________________________________________________________________1996 521997 57 671998 621999 672000 722002 77______________________________________________________________________________________COMMENTS: Data reported for 12 month periods ending November each year.
92
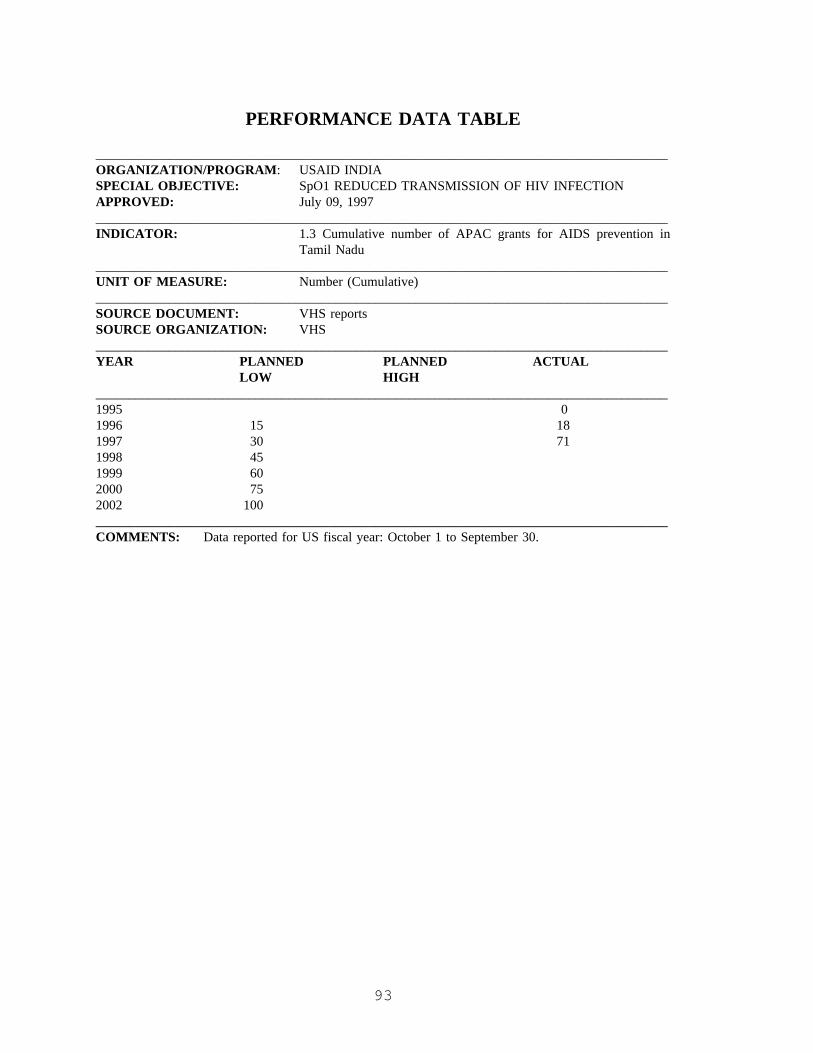
PERFORMANCE DATA TABLE
______________________________________________________________________________________ORGANIZATION/PROGRAM : USAID INDIASPECIAL OBJECTIVE: SpO1 REDUCED TRANSMISSION OF HIV INFECTIONAPPROVED: July 09, 1997______________________________________________________________________________________INDICATOR: 1.3 Cumulative number of APAC grants for AIDS prevention in
Tamil Nadu______________________________________________________________________________________UNIT OF MEASURE: Number (Cumulative)______________________________________________________________________________________SOURCE DOCUMENT: VHS reportsSOURCE ORGANIZATION: VHS______________________________________________________________________________________YEAR PLANNED PLANNED ACTUAL
LOW HIGH______________________________________________________________________________________1995 01996 15 181997 30 711998 451999 602000 752002 100______________________________________________________________________________________COMMENTS: Data reported for US fiscal year: October 1 to September 30.
93

F. Special Objective 2: Increased Investment in Agribusiness by Private Firms
The highly successful USAID/India agribusiness program supports two MPP goals:"Open Markets and Increased US Exports" and "Broad based Economic Growth" TheACE program facilitates contacts between U.S. agribusiness firms and manufacturers ofagribusiness equipment through the internet-based agricultural information centers,seminars, workshops and study tours.
1. Performance Analysis
Targets exceeded
As has been the case in previous years, all targets for this special objective were exceededfor the rating year.
Investment in ACE funded agribusiness activities (Indicator 2.1) increased to $45 millionduring FY-97 compared with a target of $42 million. This was a 26% increase over thelevel of investment in FY-96. The trend of increasing investment seems likely tocontinue next year as well. ICICI lending to the agribusiness sector (Indicator 2.2)increased by 20 percent to $76 million, which was slightly greater than the target of $75million. The value of horticultural exports (Indicator 2.3) increased by $100 million inFY-97. This 20 percent increase brought total exports to $615 million as compared witha target of $440 million.
An upward trend in the growth of the food processing industry in India has attractedinvestments of $1.95 billion, including foreign investment of $217 million since the startof the ACE program in 1992. Similarly, the installed capacity of fruits and vegetableprocessing has doubled over the last five years resulting in a 260 percent productionincrease (0.36 million metric tons to 0.96 million metric tons during the same period).The above increases in both capacity and production have put pressure on currentagribusiness infrastructure and India's capacity for preservation, handling, storage, fieldchilling and transportation of perishable products to outlets for sale and to ports for exportto meet the ever increasing overseas demand.
Opening private sector access to agribusiness information and finance, participationin agribusiness marketing infrastructure and formulation of policies and regulations
Encouraged by the success achieved to date in promoting greater investments in agri-business and increased horticultural exports, SPO 2 activities are now designed to helpIndia meet the challenges that lie ahead.
In the rating year, we expanded the existing World Wide Web-based commercialAgribusiness Information Center (AIC) from one station to a network of three located indifferent regions of the country. These AICs provide access for Indian agribusiness firmsto worldwide agricultural databases and promote Indo-US agribusiness ventures byalerting Indian investors to U.S. sources of equipment and technologies. Also, USAIDassisted in start up of a new “Center of Excellence for Post Harvest Technologies” at the
94
Punjab Agricultural University in cooperation with the Punjab Agro-Export Corporationand the University of California at Davis. This center will serve as a nucleus fordissemination of technologies on harvesting and processing of vegetables and fruits andwill promote Indo-US agribusiness linkages.
In the past year, we identified four potential public-private partnerships (PPPs) inagribusiness marketing infrastructure, cold chains and cargo facilities. Discussions arewell underway with public sector officials to allow private sector participation in projectsthat had been slated for public sector investment only. In conjunction with the provisionof advisory services for potential PPPs, USAID/India assisted in the launch of state levelpublic-private advisory panels for assessing agribusiness marketing infrastructure andformulating recommendations to state officials for improving the infrastructure in twostates--Maharashtra and the Punjab. A third state, Karnataka, is considering forming asimilar advisory panel..
Materials were developed and the first training course in agribusiness loan appraisal heldfor 15 senior loan officers from 13 leading banks in three states. The course focused onagricultural loan appraisal techniques, agribusiness risk analysis and financial productstailored to agribusiness. The course is now ready to roll out to other senior bankersaround the country.
A program of work with private agribusiness associations started during the past year. Anexpert from the U.S. worked with the troubled floriculture industry to help formassociations and identify key constraints restricting export of cut flowers. Theconsultancy resulted in formation of three regional floriculture associations. Anotherexpert advised the All India Food Processors Association on badly needed reforms ofexisting Indian food laws. Also, issues affecting the seed industry were identified andrecommendations offered for their resolution to the Indian Seed Industry Association.Technical assistance to the associations will continue.
2. Expected Progress through 2000 and Management Actions
Planned results achieved and agribusiness program ends
FY 2000 will be the last year for reporting results achieved under the agribusinessprogram. By then, it is expected that all planned results will have been met. Theactivities that have been started to help achieve the results will have been brought to asuccessful conclusion and provided beneficial demonstration effects. Specifically, thedemonstration models for marketing infrastructure development through private or jointsector options (one each tested in Maharashtra and Punjab for cold chain sector) and postharvest handling and processing through collaborative partnerships (Center of Excellencefor Post Harvest Technology at Punjab Agricultural University) will have been tested.Resolution of critical policy-cum-regulatory reforms in floriculture, the processed foodand seed industries will be in sight; the first-phase training for agribusiness lending banks/financial institutions (50-60 professionals from lead banks trained in agricultural creditlending) will be completed. The Agribusiness Information Centers for the global sharingof databases will be well on the road to sustainability. Functioning models of three joint
95

Public-Private Advisory Panels in Maharashtra, Karnataka and Punjab along with 2-3 welldesigned operating port cargo facilities for handling of horticultural products (Karnataka,Punjab and Maharashtra) should generate a level of confidence in the Indian agribusinesssector that will lead to rapid replication.
96
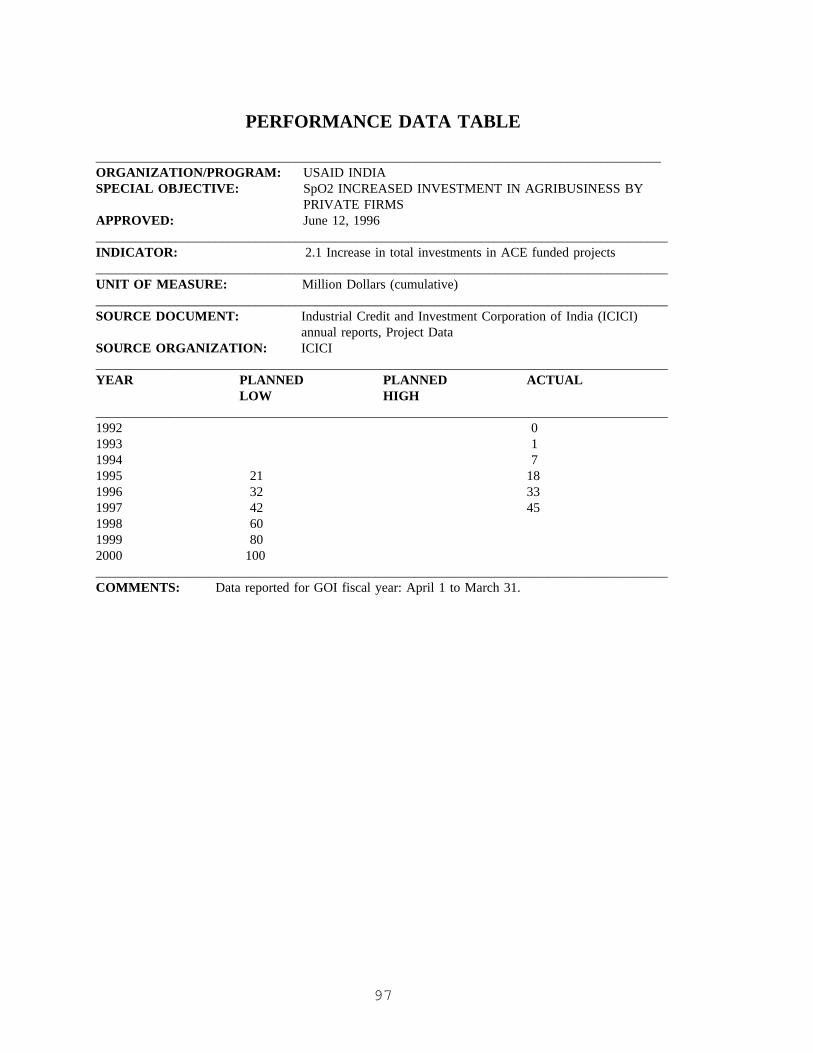
PERFORMANCE DATA TABLE
_____________________________________________________________________________________ORGANIZATION/PROGRAM: USAID INDIASPECIAL OBJECTIVE: SpO2 INCREASED INVESTMENT IN AGRIBUSINESS BY
PRIVATE FIRMSAPPROVED: June 12, 1996______________________________________________________________________________________INDICATOR: 2.1 Increase in total investments in ACE funded projects______________________________________________________________________________________UNIT OF MEASURE: Million Dollars (cumulative)______________________________________________________________________________________SOURCE DOCUMENT: Industrial Credit and Investment Corporation of India (ICICI)
annual reports, Project DataSOURCE ORGANIZATION: ICICI______________________________________________________________________________________YEAR PLANNED PLANNED ACTUAL
LOW HIGH______________________________________________________________________________________1992 01993 11994 71995 21 181996 32 331997 42 451998 601999 802000 100______________________________________________________________________________________COMMENTS: Data reported for GOI fiscal year: April 1 to March 31.
97

PERFORMANCE DATA TABLE
______________________________________________________________________________________ORGANIZATION/PROGRAM : USAID INDIASPECIAL OBJECTIVE: SpO2 INCREASED INVESTMENT IN AGRIBUSINESS BY
PRIVATE FIRMSAPPROVED: June 12, 1996______________________________________________________________________________________INDICATOR: 2.2 Increase in Industrial Credit and Investment Corporation of
India (ICICI) lending to Agribusiness sector______________________________________________________________________________________UNIT OF MEASURE: Million Dollars (cumulative)______________________________________________________________________________________SOURCE DOCUMENT: ICICI project reportsSOURCE ORGANIZATION: ICICI______________________________________________________________________________________YEAR PLANNED PLANNED ACTUAL
LOW HIGH______________________________________________________________________________________1992 41995 20 451996 60 631997 75 761998 1001999 1252000 150______________________________________________________________________________________COMMENTS: Data reported for GOI fiscal year: April 1 to March 31.
98

PERFORMANCE DATA TABLE
______________________________________________________________________________________ORGANIZATION/PROGRAM : USAID INDIASPECIAL OBJECTIVE: SpO2 INCREASED INVESTMENT IN AGRIBUSINESS BY
PRIVATE FIRMSAPPROVED: June 12, 1996______________________________________________________________________________________INDICATOR: 2.3 Increase in value of horticultural exports______________________________________________________________________________________UNIT OF MEASURE: Million Dollars______________________________________________________________________________________SOURCE DOCUMENT: Center for Monitoring Indian Economy (CMIE) reportsSOURCE ORGANIZATION: CMIE______________________________________________________________________________________INDICATOR DESCRIPTION: Horticultural produce includes fresh/processed fruits and vegeta-
bles, spices, and floriculture products.______________________________________________________________________________________YEAR PLANNED PLANNED ACTUAL
LOW HIGH______________________________________________________________________________________1992 1551993 1841994 3261995 340 3671996 380 5151997 440 6151998 5001999 5752000 650
______________________________________________________________________________________COMMENTS: Data reported for GOI fiscal year: April 1 to March 31.
99
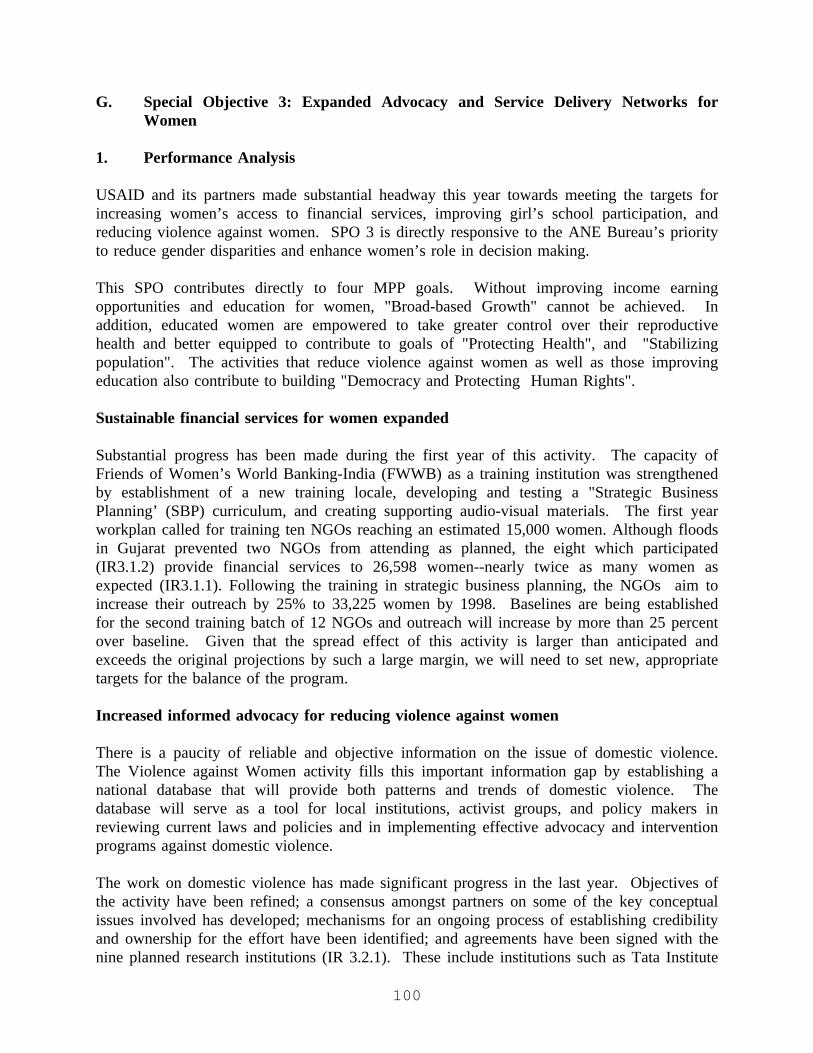
G. Special Objective 3: Expanded Advocacy and Service Delivery Networks forWomen
1. Performance Analysis
USAID and its partners made substantial headway this year towards meeting the targets forincreasing women’s access to financial services, improving girl’s school participation, andreducing violence against women. SPO 3 is directly responsive to the ANE Bureau’s priorityto reduce gender disparities and enhance women’s role in decision making.
This SPO contributes directly to four MPP goals. Without improving income earningopportunities and education for women, "Broad-based Growth" cannot be achieved. Inaddition, educated women are empowered to take greater control over their reproductivehealth and better equipped to contribute to goals of "Protecting Health", and "Stabilizingpopulation". The activities that reduce violence against women as well as those improvingeducation also contribute to building "Democracy and Protecting Human Rights".
Sustainable financial services for women expanded
Substantial progress has been made during the first year of this activity. The capacity ofFriends of Women’s World Banking-India (FWWB) as a training institution was strengthenedby establishment of a new training locale, developing and testing a "Strategic BusinessPlanning’ (SBP) curriculum, and creating supporting audio-visual materials. The first yearworkplan called for training ten NGOs reaching an estimated 15,000 women. Although floodsin Gujarat prevented two NGOs from attending as planned, the eight which participated(IR3.1.2) provide financial services to 26,598 women--nearly twice as many women asexpected (IR3.1.1). Following the training in strategic business planning, the NGOs aim toincrease their outreach by 25% to 33,225 women by 1998. Baselines are being establishedfor the second training batch of 12 NGOs and outreach will increase by more than 25 percentover baseline. Given that the spread effect of this activity is larger than anticipated andexceeds the original projections by such a large margin, we will need to set new, appropriatetargets for the balance of the program.
Increased informed advocacy for reducing violence against women
There is a paucity of reliable and objective information on the issue of domestic violence.The Violence against Women activity fills this important information gap by establishing anational database that will provide both patterns and trends of domestic violence. Thedatabase will serve as a tool for local institutions, activist groups, and policy makers inreviewing current laws and policies and in implementing effective advocacy and interventionprograms against domestic violence.
The work on domestic violence has made significant progress in the last year. Objectives ofthe activity have been refined; a consensus amongst partners on some of the key conceptualissues involved has developed; mechanisms for an ongoing process of establishing credibilityand ownership for the effort have been identified; and agreements have been signed with thenine planned research institutions (IR 3.2.1). These include institutions such as Tata Institute
100

of Social Sciences, Mumbai; SNDT Women's University, Mumbai; National Law School,Bangalore; and Vimochana, a feminist NGO which serves as the Regional Secretariat forAsian Women’s Human Rights Council.
The constitution of the National Advisory Committee (NAC) has been one of the year’s mostimportant successes. Leading lawyers, doctors, social scientists, administrators, and feministshave agreed to serve on the body. The NAC will provide overall guidance to the programand take the lead in policy formulation and dissemination and communications strategy forthe research. A major achievement is that after two meetings, the NAC is actively engaged intracking progress and planning the use of the research. This is extremely critical because thereal sense of ownership and the wider credibility that the NAC members bring to the programdirectly depends on the extent to which the NAC members are active in it.
Despite the sensitivities of U.S. participation in an Indian human rights issue, the activity ison track and research studies are underway. Results will emerge from May 1998 onwards.Research to date involves studies on: a) responses to domestic violence covering four states -Maharashtra, Madhya Pradesh, Gujarat and Karnataka; b) an analysis of institutional recordsof the police, hospitals, courts and NGOs; and c) a population-based survey in Kheda districtin Gujarat.
The Gujarat survey investigated the prevalence, nature and types of domestic violence. Somepreliminary findings were:
• 66% of Gujarati women faced verbal or physical violence• women with little or no education were subject to more violence than better educated
women• a main trigger for violence was food preparation• more than 50% of women reported being thrown out of the house• out of 42% of women who reported beatings, 10% required medical attention.• 30% of the abused reported they felt like committing suicide.
The studies of records from different institutions--hospitals, police, courts, and NGOs--willlook not only at the broad patterns that emerge from these databases, but also identify gaps inrecording of information. The studies together will provide an understanding of how keyinstitutions perceive and respond to domestic violence. An inter-related dimension that thestudies will probe is how the flow of information from one institution to another influencesthe operations of each and the response to the affected individuals. Such an approach willhelp to identify the disjunctures between the different institutions and may then form the basisfor recommendations of integrated intervention strategies.
The fundamental objective of the studies is to apply the understanding and conclusions of theresearch to reduce domestic violence. In the medium term, the activity will create aninformed advocacy body that can press for women’s access to legal and other supportsystems.
101

Enrollment and retention of girls in schools of Uttar Pradesh increased
The Girl’s Education activity targets girls of primary school age through working withteachers and communities to create support for girl’s full participation in school. The majoroutput of this activity is the development of a teacher training module and a gender handbookwhich are expected to be adopted by the District Institutes for Education and Training (DIET)in Uttar Pradesh (U.P.) for in-service training of teachers.
USAID activities build on the World Bank’s Basic Education Project in Uttar Pradesh andUNICEF’s participatory learning approach introduced in that state. The Basic EducationProgram focuses on construction of primary schools in unserved villages; introduction ofdecentralized management systems to improve district accountability to deliver primaryeducation; and strengthening education research and teacher training to improve the qualityof education. The World Bank assistance neither addresses specific factors affecting girl’sparticipation in school nor strengthening informal schools for inaccessible communities. TheUP girls’ education activity addresses the former, while the PL 480 Title II assistancechannelled through the Catholic Relief Services supports the latter.
Despite initial hurdles in Indian government clearance which delayed start of the girls’education activity, there have been visible achievements. For example, to ensure governmentacceptance and use of the training materials and modules prepared by the University ofMassachusetts (UMASS) team, a steering committee comprised of senior U.P stateadministrators, senior officials from the U.P Primary Teacher’s Association, and experts in thefield of education was established.
Intensive training workshops for teachers, with participation of the Rae Bareilly DistrictDIET, were conducted to sensitize them to gender issues, train them in action researchmethodologies and analysis, and build their skills in developing community groups committedto girls’ education. Teachers were encouraged to make the classrooms more participatory, andmodify lessons to make them more girl-friendly. Results of the action research have beenanalyzed and a workshop was organized to finalize the teacher training module and prepare agender handbook. The U.P Primary Teacher’s Union is very supportive and enthusiasticabout this activity. The training module is currently being pilot tested in one block and by1999, it will be used in 10 blocks (IR3.3.2).
As per statistics from a block in Rae Bareilly in Uttar Pradesh, 342,297 children are enrolledin schools out of a total primary school-going population of 364,100 children; 90 percent ofthe total eligible girls are enrolled in primary schools. This percentage is higher thanexpected and may be attributable to the introduction of the take-home wheat program in thelast two years. We suspect there is some connection because data from the 1993 NationalFamily Health Survey indicates that 50 percent of girls were attending primary school in U.P.Similarly, the Ministry of Education report for 1995 shows that nationally 47 percent of girlswere enrolled in primary school. USAID and UMASS will review the data for enrollmentintensively and decide whether to propose a different indicator for next year’s R4.
Catholic Relief Services (CRS) has programmed food assistance throughout India for years tosupport the education of children living in disadvantaged communities who would not
102

otherwise be able to attend school. These children live in areas where government schoolsmay not exist or teacher postings are erratic. CRS partners have provided boarding hostelsfor boys and girls, and worked with district authorities to improve the enrollment of under-privileged children in government and non-formal schools. CRS received approval last yearfor a five year Title II supported community-based education program. With an initialemphasis on U.P., it aims to improve the enrollment and attendance of girls in primary andnon-formal schools. CRS is working with partners now to establish baseline data and refineits implementation strategy in accordance with their on-the-ground experience.
2. Expected Progress through FY 2000 and Management Actions
To increase women’s access to microfinance, FWWB will provide training in businessplanning to the planned total of 50 NGOS to strengthen their capacity to wholesale financialservices to women clients, while increasing its own outreach. Training materials in twoIndian languages will be made available to grassroots institutions serving low-income women.The trained NGOs will continue to expand their micro-credit operations, providing financialservices to larger numbers of low income women, while ensuring financial viability. FWWBis expected to extend training to NGOs in the most needy northern states, perhaps offeringcourses to federations of self help women’s groups in order to further expand outreach.
The first stage of the violence against women research will result in a report entitled--"Domestic Violence in India: Patterns, Trends, and Responses," the findings of which will beshared at state and national level conferences under the guidance of the NAC. Future plans toexpand data-based advocacy include collection of population-based data from four additionalstates, which will give a clearer insight into the patterns and prevalence of domestic violence.This will be done in collaboration with the India Clinical Epidemiology Network (INCLEN)based in eight health institutions and associated communities around India. USAID will workclosely with all the stakeholders including ICRW, research institutions, and the NAC toensure that the activity results in an effective research dissemination and policy strategy.
With respect to increased girls’ enrollment in U.P. schools, we expect the teacher trainingmodule on girls’ participation in schools to be adopted by the U.P. DIETs for use in-servicetraining of teachers. With gender awareness in classrooms and communities, it is expectedthat girls’ will benefit significantly. We will define an appropriate indicator of this program’seffectiveness for approval by USAID/W prior to next year’s review. We are also in theprocess of exploring opportunities for a program to expand the girl’s education activity, whichmay look at teacher’s roles in girls’ school participation from an advocacy perspective andhelp establish a Women Teachers’ Forum or a Girls’ Education Foundation to take on theadvocacy role.
In addition, the objectives of the CRS education program will be refined according to thedemonstrated capabilities of their new local partners. Monitoring and implementationapproaches to improve informal systems and link girl’s to formal schools will be developed.
103

PERFORMANCE DATA TABLE
____________________________________________________________________________________ORGANIZATION/PROGRAM: USAID INDIASPECIAL OBJECTIVE: SpO3 EXPANDED ADVOCACY AND SERVICE DELIVERY
NETWORKS FOR WOMENINTERMEDIATE RESULT: IR 3.1 SUSTAINABLE FINANCIAL SERVICES FOR WOMEN
EXPANDEDAPPROVED: July 09, 1997______________________________________________________________________________________INDICATOR: 3.1.1 Increased number of women clients receiving financial
services from participating institutions______________________________________________________________________________________UNIT OF MEASURE: Number of women clients (cumulative)______________________________________________________________________________________SOURCE DOCUMENT: ICRW project records, FWWB (I) progress reportsSOURCE ORGANIZATION: ICRW, FWWB______________________________________________________________________________________YEAR PLANNED PLANNED ACTUAL
LOW HIGH______________________________________________________________________________________1996 *1997 26,5981998 33,2251999 TBD______________________________________________________________________________________COMMENTS: Data reported for U.S. fiscal year:from October 1 to September 31
1. * Following a detailed baseline survey by FWWB it was found that NGOs partici-pating in the training were providing financial services to 26,598 women, asopposed to the estimated figure of 15,000 women reported last year.
2. Given that the ’spread effect’ of this activity exceeds the original projections, newtargets will be set for the balance of the program.
104

PERFORMANCE DATA TABLE
______________________________________________________________________________________ORGANIZATION/PROGRAM: USAID INDIASPECIAL OBJECTIVE: SpO3 EXPANDED ADVOCACY AND SERVICE DELIVERY
NETWORKS FOR WOMENINTERMEDIATE RESULT: IR 3.1 SUSTAINABLE FINANCIAL SERVICES FOR WOMEN
EXPANDEDAPPROVED: July 09, 1997______________________________________________________________________________________INDICATOR : 3.1.2 Improved business planning process established in participat-
ing institutions.______________________________________________________________________________________UNIT OF MEASURE: Number of institutions (cumulative)______________________________________________________________________________________SOURCE DOCUMENT: ICRW project records, FWWB (I) progress reportsSOURCE ORGANIZATION: CRW, FWWB______________________________________________________________________________________INDICATOR DESCRIPTION:______________________________________________________________________________________YEARS PLANNED PLANNED ACTUAL
LOW HIGH______________________________________________________________________________________1996 0 01997 10 81998 301999 50______________________________________________________________________________________COMMENTS: Data reported for U.S. fiscal year: October 1 to September 31
105

PERFORMANCE DATA TABLE
______________________________________________________________________________________ORGANIZATION/PROGRAM: USAID INDIASPECIAL OBJECTIVE: SpO3 EXPANDED ADVOCACY AND SERVICE DELIVERY
NETWORKS FOR WOMENINTERMEDIATE RESULT: IR 3.2 INCREASED INFORMED ADVOCACY FOR REDUCING
VIOLENCE AGAINST WOMENAPPROVED: July 09, 1997______________________________________________________________________________________INDICATOR: 3.2.1 Increased number of local institutions and their constituencies
creating data and informed advocacy on violence against women(VAW)
______________________________________________________________________________________UNIT OF MEASURE: Number of Institutions______________________________________________________________________________________SOURCE DOCUMENT: ICRW project records, progress reportsSOURCE ORGANIZATION: ICRW______________________________________________________________________________________INDICATOR DESCRIPTION:______________________________________________________________________________________YEARS PLANNED PLANNED ACTUAL
LOW HIGH______________________________________________________________________________________1996 01997 9 91998 18*1999 30*______________________________________________________________________________________COMMENTS: Data reported FOR U.S. fiscal year: October 1 to September 31.
*The targets for 1998 and 1999 need to be discussed with ICRW before they arefinalized
106

PERFORMANCE DATA TABLE
______________________________________________________________________________________ORGANIZATION/PROGRAM: USAID INDIASPECIAL OBJECTIVE: SpO3 EXPANDED ADVOCACY AND SERVICE DELIVERY
NETWORKS FOR WOMENINTERMEDIATE RESULT: IR 3.3 ENROLLMENT AND RETENTION OF GIRLS IN
SCHOOLS OF U.P. INCREASEDAPPROVED: July 09, 1997______________________________________________________________________________________INDICATOR: 3.3.1 Increased enrollment of girls in primary schools in one
district of UP______________________________________________________________________________________UNIT OF MEASURE: Percentage______________________________________________________________________________________SOURCE DOCUMENT: CRS, NFHS, UMASSSOURCE ORGANIZATION:______________________________________________________________________________________INDICATOR DESCRIPTION: Gross enrollment ratio: Percentage of 6-10 years old girls enrolled
in Class I-V out of total eligible girls of primary school age.
______________________________________________________________________________________YEARS PLANNED PLANNED ACTUAL
LOW HIGH______________________________________________________________________________________1996 TBD1998 TBD1999 TBD2000 TBD______________________________________________________________________________________COMMENTS: Data reported for U.S. fiscal year: October 1 to September 31.
1. Consolidated targets will be set once the baseline data from UMASS and CRS hasbeen obtained.
107

PERFORMANCE DATA TABLE
______________________________________________________________________________________ORGANIZATION/PROGRAM: USAID INDIASPECIAL OBJECTIVE: SpO3 EXPANDED ADVOCACY AND SERVICE DELIVERY
NETWORKS FOR WOMENINTERMEDIATE RESULT: IR 3.3 ENROLLMENT AND RETENTION OF GIRLS IN
SCHOOLS OF U.P. INCREASEDAPPROVED: July 09, 1997______________________________________________________________________________________INDICATOR: 3.3.2 Training module being used in ’X’ blocks in UP______________________________________________________________________________________UNIT OF MEASURE: Number of blocks______________________________________________________________________________________SOURCE DOCUMENT: UMASS Project RecordsSOURCE ORGANIZATION: UMASS______________________________________________________________________________________INDICATOR DESCRIPTION:______________________________________________________________________________________YEARS PLANNED PLANNED ACTUAL
LOW HIGH______________________________________________________________________________________1996 01997 1 01998 2 21999 122000 6______________________________________________________________________________________
COMMENTS: Data reported for U.S. fiscal year: October 1 to September 31.1. Since project approval from GOI came in June 97, 1998 actual was achieved in
January 1998. Targets for subsequent years have been changed as per the newimplementation plan. Activity has been extended to FY 2000.
108

H. ENVIRONMENTAL COMPLIANCE
No ongoing activities have outstanding implementation actions related to therequirements under 22 CFR 216, such as IEEs or EAs.
For our FY-98 new start in the environment SO, Energy Conservation andCommercialization (ECO), USAID/India will conduct an IEE in consultation with theANE/BEO as part of the project authorization process. The amendment to theFinancial Institution Reform and Expansion (FIRE) activity will also require an IEE inFY 98 for the debt component (FIRE-D). Because of the positive environmentalobjectives of both the ECO and FIRE-D Activities, a negative determination isanticipated for both.
A new FY-98 start to address the AIDS problems faced by Maharashtra state willrequire ANE/BEO approval of a categorical exclusion from the 22 CFR 216requirement since it will provide only technical assistance and training support. TheAmendment to the Techical Assistance Support Project (TASP) will also requireANE/BEO approval of a categorical exclusion from the 22 CFR 216 reuirement sinceit too will provide only technical assistance and training support.
The environmental issues related to the Food for Peace Program, including the Foodfor Work component, will be analyzed by the implementing agencies – CARE andCatholic Relief Services (CRS) in consultation with USAID/India. CARE and CRSintend to comply with USAID requirements to submit either a Categorical Exclusionor IEE for all related activities by the end of FY-98. This will be accomplished inconsultation with the MEO and the BHR/BEO.
109

III. STATUS OF MANAGEMENT CONTRACT
Summary:
In follow up to the FY-99 R4 reporting cable, USAID/India, working in closecollaboration with the Global and ANE Bureaus, revised indicators for SOs 1, 2 and 4.The SO 1 and SO 2 indicators have been approved. A new set of SO 4 indicatorsfound in II.D. are presented for approval. Modifications in the baseline data for SO 3and SPO 3 are also described.
Important modifications are proposed in the status of two SPOs. Effective FY-99USAID/India proposes to upgrade SPO 1 to full SO status; SPO 1 would become SO5. Effective June of FY-00 SPO 2 would terminate.
Finally, USAID/India proposes extension of the "Strategic Framework, FY 1994-2000"to FY 2003. A new Strategic Framework would be submitted for approval in calen-dar year 2001 covering FY 2004-2010.
The changes proposed in the management contract are described in more detail below.A brief status report is provided for each SO and SPO as well.
SO 1 on track
All actions from FY-99 R4 review reporting cable completed and approved byUSAID/W.
Action: None
S0 2 on track
All actions from FY-99 R4 review reporting cable completed and approved byUSAID/W.
Action: None
SO 3 revision of targets
No Actions required from FY-99 R4 Review Reporting.
The FY-99 Management Contract presented indicators with baseline values and targetsdrawn from a preliminary survey report by CARE. This data was based on Indianpediatric standards. With USAID/India concurrence, CARE in its final baseline surveyused international standards and baseline data and targets were adjusted for SOIndicator 3.2b "Improved nutritional status of young children" (CARE), IR Indicator3.1.1a "Percentage of children, 12-23 months old, fully immunized by age one"(CARE), IR Indicator 3.2.1a "Percentage of pregnant women, delivered in the pastyear, who received 90-100 iron-folic acid tablets" (CARE), IR Indicator 3.3.2a
110

"Percentage of infants who received breast milk and solid/mushy foods at 6-9 monthsof age (CARE) and IR Indicator 3.3.1a "Percentage of children under 2 reached withsupplemental food" (CARE). See footnotes in each of the indicator tables for detailedexplanation of the changes.
Action: USAID/India requests that AID/W approve changes in data tables for SO 3.
SO 4 revised indicators, baseline values and targets set
The SO 4 team has worked very closely with USAID/W to refine and finalize theindicators presented last year. Greater precision has been given to indicator definition;baseline data and targets have been established.
For example, SO Indicator 4.1 has been revised from "Decreased CO2 emissions perunit of electricity provided" to "Emissions of carbon dioxide equivalents avoided," andthe unit of measurement has also changed from "Kg/KWH" to "Million Tons peryear." SO Indicator 4.2 has been modified from "Increased number of industries thatmeet international environmental quality standards" to "Increased number of firms thatmeet international environmental quality standards in selected industrial sectors." IRIndicator 4.2.1 has been modified from "Increased use of environmental technologiesas a percentage of total industrial investment" to "Increased investment by companiesin clean environmental technologies."
Action: USAID/India requests that USAID/W approve Data Tables for SO 4 found inII.D. immediately following the SO 4 narrative. Approval of this set of indicators willcomplete the actions for SO 4 from the FY-99 R4 reporting cable.
Full SO status for SPO 1
Prevention of HIV/AIDS and other infectious diseases is an increasingly high priorityfor the Agency and USAID/India. Funding for this SPO has grown from $1.0 millionin FY-96 to $2.4 million in FY-97 to $9.0 million in FY-98. In response to the newAgency priority with regard to infectious diseases, USAID/India is planning on work-ing in close conjunction with the Global Bureau and partners such as World HealthOrganization (WHO) and the Center for Disease Control (CDC) to support India’sdisease surveillance and tuberculosis programs. In response to a request from theGOI, USAID is designing a new HIV/AIDS prevention activity for the state ofMaharashtra for initial obligation in FY-98.
Action USAID/W: On the basis of the high priority and increased funding forprevention of HIV/AIDS and other infectious diseases, USAID/India recommendsUSAID/W approve upgrading SPO 1 to SO status.
Action USAID/India: By September, 1998, USAID/India will submit for USAID/Wapproval a revised SO 5 with indicators and activity descriptions. USAID/India willwork with ANE and G to develop the new SO.
111

Revised Indicator for SPO 1 (SO 5)
As agreed at FY-99 R4 review SPO Indicator 1.1 was changed in FY-00 R4 from"Percentage of high risk population using condoms in Tamil Nadu" to "Percentage ofindividuals belonging to specified high-risk groups who report condom use in mostrecent sexual encounter with a non-regular partner." We find, however, that this is nota very sensitive indicator of desired behavior change. Family Health Internationalconsultants advise that, given the relative risks of unprotected sex with commercial sexworkers versus other "non regular sex partners", the appropriate measure should focuson commercial sex workers.
Action: USAID/India requests that USAID/W approve a modification of SPOindicator 1.1 to "Percentage of individuals belonging to specified high-risk groups whoreport condom use in most recent sexual encounter with a commercial sex worker."
SPO 2 to terminate in FY-00
SPO 2 will meet planned objectives by FY-00. Accordingly, SPO 2 will end in FY-00.
FY-99 R4 review reporting cable committed to a study of impact of SPO 2 onemployment generation and incomes by ANE and G, subject to availability of timeand funding. The study was not undertaken.
Action: USAID/India requests that the recommendation for this study be rescinded.
SPO 3 revision of IR indicators
The targets for IR Indicator 3.1.1 "Increased number of women clients receivingfinancial services from participating institutions" requires refinement given the grossunderestimation of numbers of women to be served per year.
Baseline and target values for IR Indicator 3.3.1, "Increased enrollment of girls inprimary schools in one District of U.P." will be determined once the baseline datafrom the University of Massachusetts (UMASS) and CRS have been obtained. Asnoted in the text in Section III, however, there may be major problems with using theenrollment data in UP, particularly given the confounding variable of a new graindistribution program related to enrollment. If it is determined that enrollment cannotbe used as a measure of impact, USAID/India will provide to USAID/W anothermeasure of impact of this activity.
IR Indicator 3.3.2 has been modified from "Training module being used in ’X’districts in U.P." to "Training module being used in ’X’ blocksin one district of U.P."As this is essentially a research/demonstration activity, the funding and time frame asdescribed in the original program document cover only one district in UP. Extensionbeyond one district depends on the outcomes of the experimental program and theformulation of a strategy for girls education, if additional activity is to be proposed by
112
USAID/India.
Action: USAID/India will provide to USAID/W by September, 1998 revised targetsfor Indicator 3.1.1.
USAID/India will inform USAID/W by September 1998 whether enrollment can beused to measure impact for Indicator 3.3.1. At that time we will be proposingalternatives, if it is determined that enrollment is no longer valid.
USAID/India request that USAID/W approve the change in Indicator 3.3.2 fromdistricts to blocks per above.
Extension of the "Strategic Framework FY 1994-2000" to FY 2003
USAID/India proposes the extension of USAID/India’s current Strategic Frameworkwhich ends in FY 2000, to FY 2003. As noted in the Overview and ResourceSections of this document, more than 75% of USAID India’s program is devoted toglobal issues. This focus is consistent with the priority national interests outlined inthe MPP, the Mission Goals in the MPP and USAID Global priorities. For StrategicObjectives that address the Global Issues, we have either recently amended on goingactivities, or are initiating new ones, effectively extending these SO’s beyond the year2000. In all cases this has been done with USAID/W knowledge and concurrence.For example:
SO 2: As a result of the recent IFPS assessment, the evaluation team, the seniormanagement team, and the USAID/W reviewers have confirmed the validityof the strategy but note that the strategic framework and the activity itselfneeds to be extended to 2004.
SO 3: Given the new Agency and Congressional focus on micronutrients, we intendto initiate studies that will result in new activities which, if initiated in FY99, will obviously extend beyond the time frame of the current strategy. Weare adding these new program components to vastly expand the potentialimpact of the Title II program, whose levels are determined not only byresults, but by commodity availability, and commodity targets worldwide.
SO 4: Activities financed under this SO address two national interests: GlobalClimate Change and Economic Prosperity. Given India’s importance as aClimate Change priority country we have been developing new resultspackages to address various aspects of the problem, including energy,transportation, and solid waste. As these activities are slated to begin in FY-98 and FY-99, they, by definition, will extend beyond the year 2000. Theseactivities have been designed jointly with the G Bureau, the USAEP and theDOE, and have been "pre-approved" as deliverables for the upcomingPOTUS visit.
SPO 1: As India has the largest number of HIV positive people in the world, and one
113
of the least well developed disease surveillance systems, greatly increasedattention will be paid to both of these issues, when SPO 1 becomes SO 5 andwe begin to address HIV/AIDS in Maharashtra (the State with the highestnumber of HIV and AIDS cases) and the disease surveillance problemnationally. As these activities are to be initiated in FY-98 and FY-99, theywill also by definition go beyond the strategy period. The new SO 5 will besubmitted to USAID/W for approval by September 1998.
SPO 3: The low status of women in India is a problem that will take generations tosolve. To date, all of the activities under this SO have been financed throughG mechanisms, all of which already extend beyond the year 2000. If/whenwe are in a position to design bilateral activities, a new strategy for this SPOwould be required.
Activities which are not Global Issues:
SO 1: Based on the capital markets assessment of CDIE, and the successfulexperience to date of the urban management program, USAID/India hasrecently extended the FIRE project until the year 2003 when internationalstandards of capacity will have been achieved. Extension of activities iswithin the authorities of the USAID Mission.
SPO 2: This SPO ends in FY 2000.
Taking into consideration the present status of activities financed under existing SO’s-- the majority of which already exceed the time frame of the existing strategicframework -- the fact, that global issues are likely to continue to be a priorities for theUSG beyond the year 2000 and the fact that new programming options will be limitedby the existing mortgage until the year 2003, we propose that the existing strategicframework be extended to 2003.
In 2001, USAID India will prepare a new strategic framework for 2004 and beyond.This time frame, will allow for the articulation of new/revised priorities by a newAdministration and the advance time needed to design new activities which, givenresource constraints, will be in 2002 at the earliest.
Action: USAID/India requests that USAID/Washington approve an extension of thecurrent strategic framework for India from 2000 to 2003, and instruct USAID/India toprepare a new strategic framework in the year 2001. In the interim, if significantchanges within existing SO’s and SPO’s emerge, USAID/India will prepare therequired documentation to justify such changes.
114

IV. RESOURCE REQUEST
Introduction
USAID/India is a sustainable development mission and as such is implementingstrategic objectives in support of all Agency goals. As the portfolio of on goingprojects evolves into the reengineered system of results packages under SOs, we areplanning new initiatives in five of the seven SOs/SPOs in FY 1998 and FY 1999. Noadditional staffing is requested in support of these planned new initiatives.
1. Financial Plan
USAID/India requests the following resource levels to make progress in achievingstrategic objectives (SOs) and special objectives (SPOs) in FYs 1998, 1999 and 2000:
($000)
FY 1998 FY 1999 FY 2000
Development Assistance 51,345 56,500 51,350P.L. 480 Title II 90,526 88,770 90,526Housing Guaranty 9,000 15,000 15,000
---------- ----------- ------------Total: 150,871 160,270 156,876
---------- ----------- ------------
About 55 percent of our DA resources and 100 percent of our P.L. 480 Title IIresources are managed by NGOs/PVOs.
The attached tables 1, 2 and 3 summarize the above resource request levels bystrategic/special objective, and by sectoral account and earmark/directive.
The Development Assistance (DA) program funding request levels are as follows:
FY 1998 - $51.345 million (FY 1998 NOA OYB level minus Parking Fines)FY 1999 - $56.500 million (FY 1999 CP level)FY 2000 - $51.350 million (Straightlined FY 1998 NOA OYB level)
Each of these funding levels includes estimated Global Field Support for India. Theydo not include funding from USAEP with which USAID/India has an on-goingpartnership.
Funding allocations and percentage variations by sectoral account, i.e., economicgrowth (including microenterprise and agriculture), child survival and diseases(including AIDS, micronutrient, infectious diseases and polio), population,environment (including global climate change), human capacity development (basiceducation), and democracy are shown below:
115

($000)
Sector FY 1998 FY 1999 FY 2000
Amt % Amt % Amt %
Economic Growth 10,195 20% 9,900 17% 10,300 20%Child Survival & Diseases 13,969 27% 14,500 26% 12,750 25%Population 17,181 33% 20,000 35% 17,000 33%Environment 9,600 19% 11,600 21% 10,600 21%Human Capacity Dev. 400 1% 300 1% 500 1%Democracy 0 0% 200 0% 200 0%
--------- ---------- ----------Total: 51,345 56,500 51,350
--------- -------- -----------
Approximately 72 percent of our FY 1998 DA level is influenced by required earmarkand directive targets. The FY 2000 earmark and directive levels derive from FY 1998targets. In addition, given that from FY 1999 environment funds will no longer bediscretionary, the proportion of our discretionary funds will fall drastically frompresent 28 percent to about 15 percent in FY 1999 and FY 2000.
The table below shows the estimated attributions of NOA funding levels to theearmark and directive targets. In the process, USAID has made decisions in allocatingresources to our SOs and SPOs to meet these earmark/directive targets, whilereflecting their importance for achievement of results.
NOA Attributions in $000
Earmark/DirectiveDescription FY 1998 FY 1999 FY 2000
Child Survival 1,950 3,600 2,250AIDS 4,300 4,000 5,500Infectious Diseases 4,719 2,000 1,500Polio 1,000 1,000 1,000Micronutrient 2,000 3,900 2,500Basic Education 400 300 500Population 17,181 20,000 17,000Global Climate Change 5,657 4,500 5,000Environment 0 7,100 5,600Agriculture 0 1,000 1,000Microenterprise 0 900 1,200
--------- --------- ---------Total: 37,207 48,300 43,050
116

Total DA Level 51,345 56,500 51,350
Earmark/DirectiveAttributions as %of Total DA Level 72% 85% 84%
The above attributions within the request levels are consistent with the priorities of theAgency and the Congress.
Population funding allocations in each of the three fiscal years for IFPS (familyplanning and reproductive health activity in Uttar Pradesh) under SO 2 are based onprojected performance-based commitment and disbursement requirements, and they arethe minimum required to meet these requirements. Reflecting the broad objectives ofSO 2, we have allocated child survival funding to IFPS in addition to populationfunding.
The above funding levels assume new and expanded economic growth, child survival,global climate change, HIV/AIDS and human capacity development initiatives inFYs 1998 and 1999 under SOs 1, 3 and 4, and SPOs 1 and 3.
The planned FY 1998-FY 2000 expenditures and the estimated pipeline as ofSeptember 30, 2000 for the bilateral DA program by SO/SPO are:
Planned Expenditures and Estimated Pipeline($ 000)
SO/SPO Number FY 1998 FY 1999 FY 2000 Est. No. of YearsPipeline Pipeline at09/30/2000 FY 2000 Exp.
SO 1 10,527 5,300 7,500 10,200 1.4SO 2 13,000 17,000 14,760 37,874 2.6SO 3 3,353 1,500 3,891 4,400 1.1SO 4 11,860 18,405 17,900 19,808 1.1SPO 1 2,170 3,000 5,640 5,279 0.9SPO 2 1,077 1,525 1,242 0 0SPO 3 0 200 400 600 1.5
--------- --------- --------- --------- ------Total: 41,987 46,930 51,333 78,161 1.5
--------- --------- --------- --------- -------
The bilateral pipeline will progressively decrease to $78.2 million as of September 30,2000 compared to $109.3 million at the end of FY 1997. About $16.7 million, or 21percent, of this pipeline will be in new activities that will have started in FY 1998 orFY 1999. Of the remaining $61.5 million, $37.8 million will be in the IFPS Project.As explained in the past, this project requires sufficient pipeline at all times to notonly pay for outstanding benchmarks under the performance-based disbursement
117

(PBD) system, but also to allow us to continuously negotiate new benchmarks with theGovernment of India and the State Innovations in Family Planning Services Agency(SIFPSA) to maintain implementation momentum. We cannot approve newbenchmarks unless we have sufficient funds obligated and available for commitment.It is expected that only $5 million of the total IFPS pipeline as of September 30, 2000will remain uncommitted. The balance will have been committed for benchmarksunder PBD and other project activities. In sum, we consider the size of the pipeline tobe reasonable and within the Agency's norms of 18 months of expenditures and 24months of OYB. Moreover, almost all of the pipeline will have been committed forapproved activities.
2. Prioritization of Objectives
The following is USAID/India’s rank ordering of its strategic objectives, as well asspecial objectives:
SO 2 - Reduced Fertility and Improved Reproductive Health in North IndiaSO 4 - Increased Environmental Protection in Energy, Industry and CitiesSO 3 - Improved Child Survival and Nutrition in Selected Areas of IndiaSO 1 - Increased Capacity of Capital Markets to Mobilize Resources
SPO 1 - Reduced Transmission of HIV InfectionSPO 3 - Expanded Advocacy and Service Delivery Networks for WomenSPO 2 - Increased Investment in Agri-business by Private Firms
Rationale for Prioritization: The above ranking of SOs and SPOs is based on theU.S. Mission Performance Plan (MPP) priorities, SO and SPO performance and therelative importance in achieving the Agency objectives, especially global issuestargets.
The lowest ranked SOs and SPOs would be significantly reduced and/or terminatedshould resource constraints make this necessary. The top ranked SOs and SPOs wouldbe protected to the extent feasible.
In FY 1999 we see full SO status for SPO 1 and in FY 2000 we plan to terminateSPO 2.
3. Linkage With Centrally Funded Mechanisms
Field Support: USAID/India has several years of positive experience with GlobalField Support (GFS) programming and continues to rely heavily on this mechanism totap US expertise and organizational support. GFS has become critical for the designof new initiatives and experimental activities. GFS provides valuable technicalassistance to complement project staff, design specialized operations research effortsand initiate pilot activities that are often critical to the success of many of ourprograms. While the use of bilateral funds for selected technical assistance activitiesand operations research is sometimes resisted by the GOI, GFS for the same activities
118

experiences less resistance. GFS resources together with appropriate levels of in-country support are, therefore, important to USAID’s ability to introduce the latesttechnologies and effectively support field program design and implementationnecessary to achieve our strategic objectives.
Currently GFS (including OYB transfers) supports most SOs and SPOs through severalGlobal Bureau projects. Our resource request for FYs 1998, 1999 and 2000 includesGFS and OYB transfers for five of our seven strategic and special objectives. Theproposed GFS level of $19.5 million, $15.7 million and $14.8 million for FYs 1998,1999 and 2000, respectively represents approximately 38 percent of USAID/India’s FY1998 DA country level and about 29 percent of the proposed DA levels for FYs 1999and 2000. The reduction in GFS levels for FY 1999 and FY 2000 is associated withlower funding for infectious diseases. The ability to use the broad range of GFStechnical resources in a variety of complex activities depends on a critical mass ofUSDH and FSN staff who are able to identify and plan technical support needs andthen coordinate and support GFS activities in-country. Without GFS support theachievement of results targets for SOs 2, 3 and 4, and SPOs 1 and 3 would beadversely affected. It would also jeopardize the implementation of the USAID’slargest family planning program (IFPS) and would force USAID/India to eliminatesome of the cooperative agreements providing critical technical assistance to IFPS.
The above said, if resources grow scarce, especially in the PHN sector, USAID/Indiawill need to reconsider the level of support for GFS. The high cost of GFS and ourinability to exercise financial controls in the absence of regular status reports from GBureau are factors that would weigh in favor of proportionately larger cuts for GFSthan other programs should there be a severe cut in DA funding.
Global Field Support for our SO 2, SO 3 and SPO 1 activities is by far the largestcomponent, representing approximately 83 percent of our total GFS resources. For thePHN SOs/SPO, USAID/India requests $17 million GFS in FY 1998, $13.3 million inFY 1999 and $12.3 million in FY 2000. The following table provides GFS levels bysector for FYs 1998, 1999 and 2000. A project-by-project breakup of these GFSrequirements, as well as of OYB transfers, is provided in the attached Table 4.
Global Field Support ($ 000)
Sector FY 1998 FY 1999 FY 2000
PHN 16,976 13,300 12,250Environment 943 1,000 1,000
--------- --------- ---------Sub-Total: 17,919 14,300 13,250OYB Transfers (EG) 1,600 1,200 1,300OYB Transfers (DG) 0 200 200
--------- --------- ---------Total: 19,519 15,700 14,750
--------- --------- ---------
119

Non-Emergency Title II: The majority of the Title II program is well integrated intoour strategic framework and contributes to the achievement of the child survivalstrategic objective (SO 3) and the women’s empowerment special objective (SPO 3).The program, managed by CARE and CRS, is a critical resource for improving childsurvival. Through a superb logistics system the PVOs move food to provide nutritioussupplements and ancillary health services to seven million women and children fromthe most food insecure segments of society. Food is a tangible good, drawing hungrymothers and children who benefit from both the nutrition supplement and the healthservices and education given in community nutrition centers. Through the CAREprogram, Title II food and local currency generations are used to enhance the coverageand quality of the GOI’s Integrated Child Development Services (ICDS) program,arguably the largest child survival outreach program in the world. Title II Strengthen-ing Grant funds are being used to support local community organization involvementin ICDS, to train authorities in commodity management, and to provide technicalassistance to improve the quality of the services. The CRS Title II program hassuccessfully supported grassroots organizations for years in providing food andessential child survival services at a low cost to the most socially disadvantagedsections of the Indian society - the former untouchables, tribals and other low castegroups. The role of CRS, and now increasingly CARE, in demonstrating programmodels with a high level of community participation through community mobilizationis significant.
A portion of CRS’ Title II program targets school feeding to increase enrolment andretention of girls in schools in far-flung disadvantaged communities. CRS’ NGOcounterparts have for years been promoting girls’ education and have successfullycreated a demand for it in tribal areas. CRS’ boarding schools for girls, while modestoperations, offer a means to schooling in remote areas where often there is noalternative.
The Title II partners are also important to USAID’s ability for rapid response tonatural disasters. During the earthquake in Madhya Pradesh and persistent drought inOrissa, both CARE and CRS were able to provide immediate assistance to victimsthrough the existing Title II infrastructure. Without Title II resources, our efforts toimprove child survival and nutrition in seven states would be seriously jeopardized,and our ability to respond to emergencies would be hampered.
Resources Request
P.L. 480 Title II FY 1998 FY 1999 FY 2000
TonnageValue ($000)
187,17090,526
206,99488,770
200,86490,526
* Dollar values are subject to change due to commodity price fluctuations and includeocean freight.
120

Housing Guaranty Program: Under the RUDO-supported Housing Guaranty (HG)Program, HG loan resources are being provided for two important strategic objectives:SO 1, Increased Mobilization of Capital Through Financial Sector Reforms; and SO 4,Increased Environmental Protection in Energy, Industry and Cities.
Housing Guaranty authority is essential for USAID/India since it supports activitieswhich are important to both the financial markets program and the SO 4 globalclimate change initiative. HG authorizations support the expansion of India’s privateshelter finance sector and urban infrastructure, and that extends benefits to low-incomefamilies. The program has successfully contributed to linking community-basedfinancial institutions more effectively into the resources of the formal financial sector.HG authorizations support a program to help India create a debt market to finance themassive backlog of basic urban environmental infrastructure. The program focuses onwater supply, sewage treatment and solid waste management. It provides $125 millionin HG loan funds, as well as technical assistance and training, to generatecommercially viable urban environmental infrastructure projects for which municipalbonds are issued. The first USAID-supported commercially viable urban infrastructureproject for a water supply and sewage treatment system in Tirrupur, Tamil Nadu, hasbeen developed and financed through HG loan borrowings. The first-ever municipalbond in India has been issued by Ahmedabad Municipal Corporation with USAIDassistance. The success of this issue has generated considerable interest among otherlocal governments for accessing capital market for mobilization of resources forinvestment in municipal infrastructure programs, such as Pune and VijayawadaMunicipal Corporations.
USAID/India requests HG authorizations of $9 million in FY 1998, and $15 millioneach in FYs 1999 and 2000. In addition, beginning in FY 1999, USAID plans toexplore use of the new Development Credit Authority for SO 1 and SO 4.
4. Workforce and Operating Expenses
Operating Expenses:
Summary: USAID/India will need resources above the targets provided by theBureau for FY 1999 and FY 2000. FY 1999 will be our ’move’ year and as a resultwe request an additional $300,000 above the target for these one-time costs. In FY2000, our request will be lower than FY 1999 but above the FY 1998 level. Becausewe will no longer be paying office rent in FY 2000 we will be able to fund increasesin FSN wages, residential rents, travel and transportation, utility costs and supplieswith only a nominal increase over the FY 1998 level. Recent changes in fundingmechanisms for IDIs and computer upgrades will also impact our budget in both FY1999 and FY 2000.
Total funding: In FY 1999 the target level provided by USAID/W is $3.7 millionwhereas our requirement is $4.1 million (excluding ICASS). Similarly, the FY 2000target funding level provided on a straightline basis is $3.7 million, which falls short
121

of our expected requirement of just below $4 million. The reasons provided belowsupport our request for the higher levels.
Office rent: Until we co-locate with the Embassy in the summer of 1999 we will bepaying rent of $285,000 per year. This is the final year of our 10-year lease andcurrently a bargain in New Delhi. One of the deciding factors in moving to theEmbassy compound was the prospect of paying $850,000 to $1 million per year inoffice rent. This alone would have increased our OE budget by 15 to 20%. We areinvesting additional funds in FY 1999 to save money in the out years.
FSN Wages: The ICASS Council has encouraged the service provider (STATE) tofund FSN wage increases and expand health insurance benefits in an effort to achievecomparability with the market. We have provided only a 15% pay increase each year,which is much lower than the increase of 25% expected by the Embassy, and at that itis only in the 60th percentile of what comparator organizations pay. The recent salaryincrease of 40% by the GOI will mount pressure on us to give higher salary increasesin FY 1999 and FY 2000. For USAID/India, FSN salaries make up the lion’s share ofour OE costs and will have considerable impact on our FY 1999 and FY 2000 budgetrequirements.
Utility costs: The electricity rates, which historically have cost on average $5,200 perresidence per year, were increased in April 1997 by 25%. This applies to bothcommercial and domestic consumption. With privatization being encouraged, anotherincrease is expected soon which will increase our utility costs and other relatedexpense areas for FY 1999 and beyond.
’Move’: Costs estimated to be $100,000 related to the physical move of our entireMission operation will have to be funded during FY 1999. At the same time, we willstill have to fund the costs of maintaining a separate building. There will be anestimated $50,000 charge related to systems design and de-installation/ reinstallation ofour Computer Center in the West Building. Beyond that, the ’move’ provides aconvenient time to upgrade our computer hardware to comply with Agency standards.On March 10, 1998 USAID/W issued new standards for Agency "IM" profile. Thenew profile dictates a worldwide standard based on WIN 95, utilizing Office ’97 and anew virus checker. While USAID/India has positioned itself to shift smoothly to thisstandard we will still require an additional $150,000 to fund the remaining transitioncosts and to ensure we are Y2K compliant. The required hardware and softwarepurchases are not possible with the current FY 1999 target funding level.
Housing: Even though USAID had joined the Embassy housing pool effective April1997, the entry of multi-nationals into India has increased the competition in thehousing sector. Property owners have set a trend of huge rents with advance paymentsfor as high as 18-24 months. Lease agreements are not written for periods exceedingtwo to three years and the landlords expect an increase of 50-100% in the rent eachtime the lease is renewed. Even though there are fewer units it has still increased ourresidential rent requirements in FY 1999 and FY 2000 considerably.
122

NXP: In case the requested levels are not met in FY 1999 and FY 2000 we will notbe eliminating any SOs but will be covering the shortfall by not replacing NXP anddelaying compliance with Agency IM standards. This is only a short-term measure tomeet the target. The ICASS Council is promoting the innovative idea of establishingan interagency residential equipment pool which will be a cost effective means ofsharing common residential equipment. With the target level in FY 2000, we foreseea problem in not being a "team player" in this initiative. Additionally, the budgetlevel will have an adverse effect on the motor pool and other operations resulting fromnot replacing vehicles and other NXP.
ICASS: ICASS costs will only increase nominally in FY 1999 but will increasesubstantially in FY 2000. This is almost entirely related to office support costs as aresult of co-locating with the Embassy. Our calculations show that our ICASS bill willalmost double from $370,000 in FY 1998 to $649,000 in FY 2000. This will be offsetby not paying direct office rent (estimated to be > $850,000) to a commercial landlord.Additionally, because increased ICASS costs will be paid into the ICASS pool theUSG as a whole will achieve substantial savings.
Workforce: India being designated a fully sustainable mission we are notrecommending any major cuts in the staffing levels. In FY 1998, the USDH level (notincluding two USDH working in RUDO) was reduced from 13 (and one IDI) to 13(no IDI) as the IDI converted to DH status. In FY 1999 and FY 2000, the level willstay at 13 (and the mission will add one IDI).
On the FSN side there are no major cuts proposed as we are already operating withlimited staff. As mentioned in the last R4 narrative, we had reviewed our staffingneeds based on reengineering precepts and eliminated positions where foundredundant. In addition, we have recently undergone a revision of our staffing basedon requirements of each team/division and concluded that, except for attrition throughretirement, no other position need be eliminated.
There may be only marginal savings of staff due to ICASS services being taken overafter the move to the Embassy compound. The support staff reductions will be offsetby a requirement for additional FSN professional staff needed to support programinitiatives. Our continued reliance on FSNs in lieu of USDH and USPSCs hasresulted in effectively managing one of the largest programs with the least staff whencompared to other missions in the Bureau.
Accrued Separation Liability: USAID/India has fully funded its separation liabilityfor prior years and the attached R4 tables provide for full separation liability accruingat the end of each fiscal year.
123

TABLES

Program Funding
Table 1 USAID FY 1998 BUDGET REQUEST BY PROGRAM/COUNTRY
Country/Program: INDIAScenario: Base Level
S.O. # , Title FY 1998
Approp.Acct
Bilateral/Field
Support
Act. SOPipeline
End of FY97
EstimatedTotal
BasicEducation Agric.
OtherEconomic
Growth PopChild
SurvivalInfectiousDiseases HIV/AIDS
OtherHealth Environ D/G
Est.Expend.
FY 98
Est. TotalCost life of
SO
FutureCost
(POST2000)
Year ofFinalOblig.
S.O. 1: Increased Capacity of Captial Markets to Mobilize ResourcesDA Bilateral 10,594 7,300 0 0 7,300 0 0 0 0 0 0 0 10,527 72,367 2003
Field Spt 0 0 0 0 0 0 0 0 0 0 0 0Total 10,594 7,300 0 0 7,300 0 0 0 0 0 0 0 10,527 72,367
HG Bilateral 4,500 0 0 4,500 0 0 0 0 0 0 0 0 0 2003Total 0 4,500 0 0 4,500 0 0 0 0 0 0 0 0 0
S.O. 2: Reduced Fertility and Improved Reproductive Health in North IndiaDA Bilateral 48,660 9,474 0 0 0 6,981 2,493 0 0 0 0 0 13,000 237,700 2004
Field Spt 10,200 0 0 0 10,200 0 0 0 0 0 0 100,000Total 48,660 19,674 0 0 0 17,181 2,493 0 0 0 0 0 13,000 337,700
S.O. 3 Improved Child Survival & Nutrition in Selected Areas of IndiaDA Bilateral 5,844 900 0 0 0 0 900 0 0 0 0 0 3,353 25,600 2003
Field Spt 1,557 1,557 13,607Total 5,844 2,457 0 0 0 0 2,457 0 0 0 0 0 3,353 39,207
Title II Bilateral 90,526 5,901 0 6,799 0 75,989 0 0 1,837 0 0 OpenTotal 90,526 5,901 0 6,799 0 75,989 0 0 1,837 0 0 0
S.O. 4: Increased Environmental Protection in Energy, Industry and CitiesDA Bilateral 37,116 8,657 0 0 0 0 0 0 0 0 8,657 0 11,860 147,383 2005
Field Spt 943 0 0 0 0 0 0 0 0 943 0 8,000Total 37,116 9,600 0 0 0 0 0 0 0 0 9,600 0 11,860 155,383
HG Bilateral 4,500 0 0 0 0 0 0 0 0 4,500 0 0 0 2003Total 0 4,500 0 0 0 0 0 0 0 0 4,500 0 0 0
SP. O. 1: Reduced Transmission of HIV InfectionDA Bilateral 4,489 3,800 0 0 0 0 0 0 3,800 0 0 0 2,170 30,000 2003
Field Spt 5,219 0 0 0 0 0 4,719 500 0 0 0 17,719Total 4,489 9,019 0 0 0 0 0 4,719 4,300 0 0 0 2,170 47,719
SP. O. 2: Increased Investment in Agri-business by Private Firms:DA Bilateral 2,549 1,295 0 0 1,295 0 0 0 0 0 0 0 1,077 20,000 1998
Field Spt 0 0 0 0 0 0 0 0 0 0 0 0 0Total 2,549 1,295 0 0 1,295 0 0 0 0 0 0 0 1,077 20,000
SP. O. 3: Expanded Advocacy and Service Delivery Networks for WomenDA Bilateral 0 400 400 0 0 0 0 0 0 0 0 0 0 2,000 2002
Field Spt 1,600 0 1,600 0 0 0 0 0 0 0 10,000Total 0 2,000 400 0 1,600 0 0 0 0 0 0 0 0 12,000
Total Bilateral DA 109,252 31,826 400 0 8,595 6,981 3,393 0 3,800 0 8,657 0 41,987 535,050Total Field Support DA 0 19,519 0 0 1,600 10,200 1,557 4,719 500 0 943 0 0 149,326Total DA 109,252 51,345 400 0 10,195 17,181 4,950 4,719 4,300 0 9,600 0 41,987 684,376PL 480 Title II 90,526 5,901 0 6,799 0 75,989 0 0 1,837 0 0 Housing Guaranty 0 9,000 0 0 4,500 0 0 0 0 0 4,500 0 0 0TOTAL PROGRAM 109,252 150,871 6,301 0 21,494 17,181 80,939 4,719 4,300 1,837 14,100 0 41,987 684,376 FY 1998 Request Sector Totals -- DA FY 1998 Request Sector Totals -- ESF DA Title II HG Total
Econ Growth 10,195 Econ Growth 0 [Of which Microenterprise] 0 [Of which Microenterprise] 0 FY 2001 Target Program Level 55,000 90,500 15,000 160,500
HCD 400 HCD FY 2002 Target Program Level 55,000 90,500 15,000 160,500 PHN 31,150 PHN 0 FY 2003 Target Program Level 55,000 90,500 15,000 160,500 Environment 9,600 Environment 0
[Of which Biodiversity] 0 [Of which Biodiversity] 0 Notes: 1. Environment Funds include attributions to Global Climate Change. Democracy 0 Democracy 0 2. Pipeline and Estimated Expenditures data is for bilateral DA funds only. Humanitarian 0 Humanitarian 0 Est. Total Cost life of SO is for both, billateral and field support DA funds.
3. SP.O. 3 Field Support represents OYB Transfers to Global Bureau.

Program Funding
Table 2 USAID FY 1999 BUDGET REQUEST BY PROGRAM/COUNTRY
Country/Program: INDIAScenario: Base Level
S.O. # , Title FY 1999
Approp.Acct
Bilateral/Field
Support
Est. SOPipeline
End of FY98
EstimatedTotal
BasicEducation Agric.
OtherGrowth Pop
ChildSurvival
InfectiousDiseases HIV/AIDS
OtherHealth Environ D/G
Est.Expend.
FY 99
Est. TotalCost life of
SO
FutureCost
(POST2000)
Year ofFinalOblig.
S.O. 1: Increased Capacity of Captial Markets to Mobilize ResourcesDA Bilateral 7,300 7,700 0 0 7,700 0 0 0 0 0 0 0 5,300 83,867 2003
Field Spt 0 0 0 0 0 0 0 0 0 0 0Total 7,300 7,700 0 0 7,700 0 0 0 0 0 0 0 5,300 83,867
HG Bilateral 7,500 0 0 7,500 0 0 0 0 0 0 0 0 0 2003Total 0 7,500 0 0 7,500 0 0 0 0 0 0 0 0 0
S.O. 2: Reduced Fertility and Improved Reproductive Health in North IndiaDA Bilateral 45,134 14,000 0 0 0 10,600 3,400 0 0 0 0 0 17,000 237,700 2004
Field Spt 9,400 0 0 0 9,400 0 0 0 0 0 0 100,000Total 45,134 23,400 0 0 0 20,000 3,400 0 0 0 0 0 17,000 337,700
S.O. 3 Improved Child Survival & Nutrition in Selected Areas of IndiaDA Bilateral 3,391 3,900 0 0 0 0 3,900 0 0 0 0 0 1,500 25,600 2003
Field Spt 1,200 1,200 13,607Total 3,391 5,100 0 0 0 0 5,100 0 0 0 0 0 1,500 39,207
Title II Bilateral 88,770 5,943 0 7,017 0 73,970 0 0 1,840 0 0 OpenTotal 88,770 5,943 0 7,017 0 73,970 0 0 1,840 0 0 0
S.O. 4: Increased Environmental Protection in Energy, Industry and CitiesDA Bilateral 33,913 11,600 0 1,000 0 0 0 0 0 0 10,600 0 18,405 145,583 2005
Field Spt 1,000 0 0 0 0 0 0 0 0 1,000 0 8,000Total 33,913 12,600 0 1,000 0 0 0 0 0 0 11,600 0 18,405 153,583
HG Bilateral 7,500 0 0 0 0 0 0 0 0 7,500 0 0 0 2003Total 0 7,500 0 0 0 0 0 0 0 0 7,500 0 0 0
SP. O. 1: Reduced Transmission of HIV InfectionDA Bilateral 6,119 3,300 0 0 0 0 0 0 3,300 0 0 0 3,000 30,000 2003
Field Spt 2,700 0 0 0 0 0 2,000 700 0 0 0 17,719Total 6,119 6,000 0 0 0 0 0 2,000 4,000 0 0 0 3,000 47,719
SP. O. 2: Increased Investment in Agri-business by Private Firms:DA Bilateral 2,767 0 0 0 0 0 0 0 0 0 0 0 1,525 20,000 1998
Field Spt 0 0 0 0 0 0 0 0 0 0 0 0Total 2,767 0 0 0 0 0 0 0 0 0 0 0 1,525 20,000
SP. O. 3: Expanded Advocacy and Service Delivery Networks for WomenDA Bilateral 400 300 300 0 0 0 0 0 0 0 0 0 200 2,000 2002
Field Spt 1,400 0 1,200 0 0 0 0 0 0 200 10,000Total 400 1,700 300 0 1,200 0 0 0 0 0 0 200 200 12,000
Total Bilateral DA 99,024 40,800 300 1,000 7,700 10,600 7,300 0 3,300 0 10,600 0 46,930 544,750Total Field Support DA 0 15,700 0 0 1,200 9,400 1,200 2,000 700 0 1,000 200 0 149,326Total DA 99,024 56,500 300 1,000 8,900 20,000 8,500 2,000 4,000 0 11,600 200 46,930 694,076PL 480 Title II 88,770 5,943 0 7,017 0 73,970 0 0 1,840 0 0 Housing Guaranty 0 15,000 0 0 7,500 0 0 0 0 0 7,500 0 0 0TOTAL PROGRAM 99,024 160,270 6,243 1,000 23,417 20,000 82,470 2,000 4,000 1,840 19,100 200 46,930 694,076 FY 1999 Request Sector Totals -- DA FY 1999 Request Sector Totals -- ESF DA Title II HG Total
Econ Growth 9,900 Econ Growth 0 [Of which Microenterprise] 900 [Of which Microenterprise] 0 FY 2001 Target Program Level 55,000 90,500 15,000 160,500
HCD 300 HCD FY 2002 Target Program Level 55,000 90,500 15,000 160,500 PHN 34,500 PHN 0 FY 2003 Target Program Level 55,000 90,500 15,000 160,500 Environment 11,600 Environment 0
[Of which Biodiversity] 0 [Of which Biodiversity] 0 Notes: 1. Environment Funds include attributions to Global Climate Change. Democracy 200 Democracy 0 2. Pipeline and Estimated Expenditures data is for bilateral DA funds only. Humanitarian 0 Humanitarian 0 Est. Total Cost life of SO is for both, billateral and field support DA funds.
3. SP.O. 3 Field Support represents OYB Transfers to Global Bureau. 4. Estimated SO 1 pipeline end of FY 1998 is after deobligation of $67,000.

Program Funding
Table 3 USAID FY 2000 BUDGET REQUEST BY PROGRAM/COUNTRY
Country/Program: INDIAScenario: Base Level
S.O. # , Title FY 2000
Approp.Acct
Bilateral/Field
Support
Est. SOPipeline
End of FY99
EstimatedTotal
BasicEducation Agric.
OtherGrowth Pop
ChildSurvival
InfectiousDiseases HIV/AIDS
OtherHealth Environ D/G
Est.Expend.FY 2000
Est. TotalCost life of
SO
FutureCost
(POST2000)
Year ofFinalOblig.
S.O. 1: Increased Capacity of Captial Markets to Mobilize ResourcesDA Bilateral 9,700 8,000 0 0 8,000 0 0 0 0 0 0 0 7,500 83,867 28,000 2003
Field Spt 0 0 0 0 0 0 0 0 0 0 0 0 0Total 9,700 8,000 0 0 8,000 0 0 0 0 0 0 0 7,500 83,867 28,000
HG Bilateral 7,500 0 0 7,500 0 0 0 0 0 0 0 0 0 2003Total 0 7,500 0 0 7,500 0 0 0 0 0 0 0 0 0
S.O. 2: Reduced Fertility and Improved Reproductive Health in North IndiaDA Bilateral 42,134 10,500 0 0 0 8,500 2,000 0 0 0 0 0 14,760 237,700 125,426 2004
Field Spt 8,500 0 0 0 8,500 0 0 0 0 0 0 100,000 14,444Total 42,134 19,000 0 0 0 17,000 2,000 0 0 0 0 0 14,760 337,700 139,870
S.O. 3 Improved Child Survival & Nutrition in Selected Areas of IndiaDA Bilateral 5,791 2,500 0 0 0 0 2,500 0 0 0 0 0 3,891 25,600 9,600 2003
Field Spt 1,250 1,250 13,607 2,800Total 5,791 3,750 0 0 0 0 3,750 0 0 0 0 0 3,891 39,207 12,400
Title II Bilateral 90,526 5,901 0 6,799 0 75,989 0 0 1,837 0 0 OpenTotal 90,526 5,901 0 6,799 0 75,989 0 0 1,837 0 0 0
S.O. 4: Increased Environmental Protection in Energy, Industry and CitiesDA Bilateral 27,108 10,600 0 1,000 0 0 0 0 0 0 9,600 0 17,900 145,583 43,928 2005
Field Spt 1,000 0 0 0 0 0 0 0 0 1,000 0 8,000 5,057Total 27,108 11,600 0 1,000 0 0 0 0 0 0 10,600 0 17,900 153,583 48,985
HG Bilateral 7,500 0 0 0 0 0 0 0 0 7,500 0 0 0 2003Total 0 7,500 0 0 0 0 0 0 0 0 7,500 0 0 0
SP. O. 1: Reduced Transmission of HIV InfectionDA Bilateral 6,419 4,500 0 0 0 0 0 0 4,500 0 0 0 5,640 30,000 12,680 2003
Field Spt 2,500 0 0 0 0 0 1,500 1,000 0 0 0 17,719 6,000Total 6,419 7,000 0 0 0 0 0 1,500 5,500 0 0 0 5,640 47,719 18,680
SP. O. 2: Increased Investment in Agri-business by Private Firms:DA Bilateral 1,242 0 0 0 0 0 0 0 0 0 0 0 1,242 20,000 0 1998
Field Spt 0 0 0 0 0 0 0 0 0 0 0 0 0Total 1,242 0 0 0 0 0 0 0 0 0 0 0 1,242 20,000 0
SP. O. 3: Expanded Advocacy and Service Delivery Networks for WomenDA Bilateral 500 500 500 0 0 0 0 0 0 0 0 0 400 2,000 800 2,002
Field Spt 1,500 0 1,300 0 0 0 0 0 0 200 10,000 3,603Total 500 2,000 500 0 1,300 0 0 0 0 0 0 200 400 12,000 4,403
Total Bilateral DA 92,894 36,600 500 1,000 8,000 8,500 4,500 0 4,500 0 9,600 0 51,333 544,750 220,434Total Field Support DA 0 14,750 0 0 1,300 8,500 1,250 1,500 1,000 0 1,000 200 0 149,326 31,904Total DA 92,894 51,350 500 1,000 9,300 17,000 5,750 1,500 5,500 0 10,600 200 51,333 694,076 252,338PL 480 Title II 90,526 5,901 0 6,799 0 75,989 0 0 1,837 0 0 0Housing Guaranty 0 15,000 0 0 7,500 0 0 0 0 0 7,500 0 0 0 0TOTAL PROGRAM 92,894 156,876 6,401 1,000 23,599 17,000 81,739 1,500 5,500 1,837 18,100 200 51,333 694,076 252,338 FY 2000 Request Sector Totals -- DA FY 2000 Request Sector Totals -- ESF DA Title II HG Total
Econ Growth 10,300 Econ Growth 0 [Of which Microenterprise] 1,000 [Of which Microenterprise] 0 FY 2001 Target Program Level 55,000 90,500 15,000 160,500
HCD 500 HCD FY 2002 Target Program Level 55,000 90,500 15,000 160,500 PHN 29,750 PHN 0 FY 2003 Target Program Level 55,000 90,500 15,000 160,500 Environment 10,600 Environment 0
[Of which Biodiversity] 0 [Of which Biodiversity] 0 Notes: 1. Environment Funds include attributions to Global Climate Change. Democracy 200 Democracy 0 2. Pipeline and Estimated Expenditures data is for bilateral DA funds only. Humanitarian 0 Humanitarian 0 Est.Total Cost and Post FY 2000 cost is for both, bilateral and field support DA funds.
3. SP.O. 3 Field Support represents OYB Transfers to Global Bureau. 4. SP.O. 2 is planned for termination at the end of FY 2000 with unfunded mortgage.

Table 4
USAID/INDIAGLOBAL FIELD SUPPORT
Estimated Funding ($ 000)Objective Field Support: Priority Duration FY 1998 FY 1999 FY 2000
Name Activity Title and Number Obligated By Obligated By Obligated By
Operating Global Operating Global Operating GlobalUnit Bureau Unit Bureau Unit Bureau
(A) GLOBAL FIELD SUPPORT
SO. 2: Reduced Fertility and Improved Reproductive Health in North India
Population Funds:
936-3024 Population Technical Assistance High 1998 80 0 0
936-3030 Strategies for Improving Serv. Delivery High 1998-2000 500 400 300936-3038 FP Logistics Management High 1999-2000 0 200 200
936-3044 CONRAD High 1998-2000 200 200 200936-3046 Res. for the Aware. of POP Inputs (BUCEN) High 1998-1999 400 200 0
936-3050 The Population Council Program High 1998-2000 100 100 100936-3052 Population Communication Services II High 1998-2000 600 500 400
936-3058 Coop. for Assistance and Relief Everywhere High 1999-2000 0 300 200
936-3059 Access to FP Thru Women Management High 1999-2000 0 1,100 1,000936-3068 Asso. for Vol. Surgical Contracep. Program High 1998-2000 1,500 1,400 1,400
936-3072 PRIME High 1998-2000 2,000 1,800 1,500936-3078 Policy High 1998-2000 1,300 800 900
936-3083.03 MEASURE III High 1998-2000 400 400 500936-3085 Commercial Markets (SOMARC) High 1998-2000 2,200 1,800 1,800
936-5968 Program for Appropriate Technologies in Health High 1998 720 0 0AAAS Fellow High 1998-1999 200 200 0
Total SO. 2: 0 10,200 0 9,400 0 8,500
SO. 3: Improved Child Survival and Nutrition in Selected Areas of India
Child Survival Funds:
936-3080 Child Health Immunization Support (Polio Eradication) High 1998-2000 1,000 1,000 1,000
936-3094 OMNI (Follow-on) High 1998-2000 125 100 125936-3096.01 Flagship High 1998-2000 125 100 125
Child Survival/Micronutrient Funds:
936-3083.01 MEASURE I High 1998 307 0 0
Total SO. 3: 0 1,557 0 1,200 1,250
SO. 4: Increased Environmental Protection in Energy, Industry and Cities
Environment Funds:
936-5741 Energy Technology Innovation High 1998-2000 943 1,000 1,000(Sustainable Energy Program for India)
Total SO. 4: 0 943 0 1,000 0 1,000
SPO. 1: Reduced Transmission of HIV Infection
AIDS Funds:
936-3090.02 Family Health International/IMPACT High 1998-2000 250 0 500 0 750936-5994.03 Environment Health Project (For CDC) High 1998 250 0 200 0 250
Infectious Diseases Funds
936-5986 Child Health Research Project (For INCLEN) High 1998-2000 2,200 0 1,000 500
936-5994.03 Environment Health Project (For CDC) High 1998-2000 500 0 500 500
936-5994 Environment Health Project (For Grants to WHO) High 1998-2000 2,019 0 500 500
Total SPO. 1: 0 5,219 2,700 2,500
TOTAL GLOBAL FIELD SUPPORT: 0 17,919 0 14,300 0 13,250
(B) OYB TRANSFERS
SPO. 3: Expanded Advocacy and Service Delivery Networks for Women
Economic Growth Funds
936-0100 WID Strategies and Resources High 1998-2000 0 1,600 0 1,000 1,100
Economic Growth/Microenterprise Funds
936-0100 WID Strategies and Resources High 1999-2000 0 0 0 200 200
Democracry Funds
936-0100 WID Strategies and Resources High 1999-2000 0 0 0 200 200
Total SPO. 3: 0 1,600 0 1,400 0 1,500
TOTAL OYB TRANSFERS: 0 1,600 0 1,400 0 1,500
GRAND TOTAL: 0 19,519 0 15,700 0 14,750(GLOBAL FIELD SUPPORT AND OYB TRANSFERS)
PDEG:U:\Gulshan\00R4\FS-23386.wk4:03/20/98
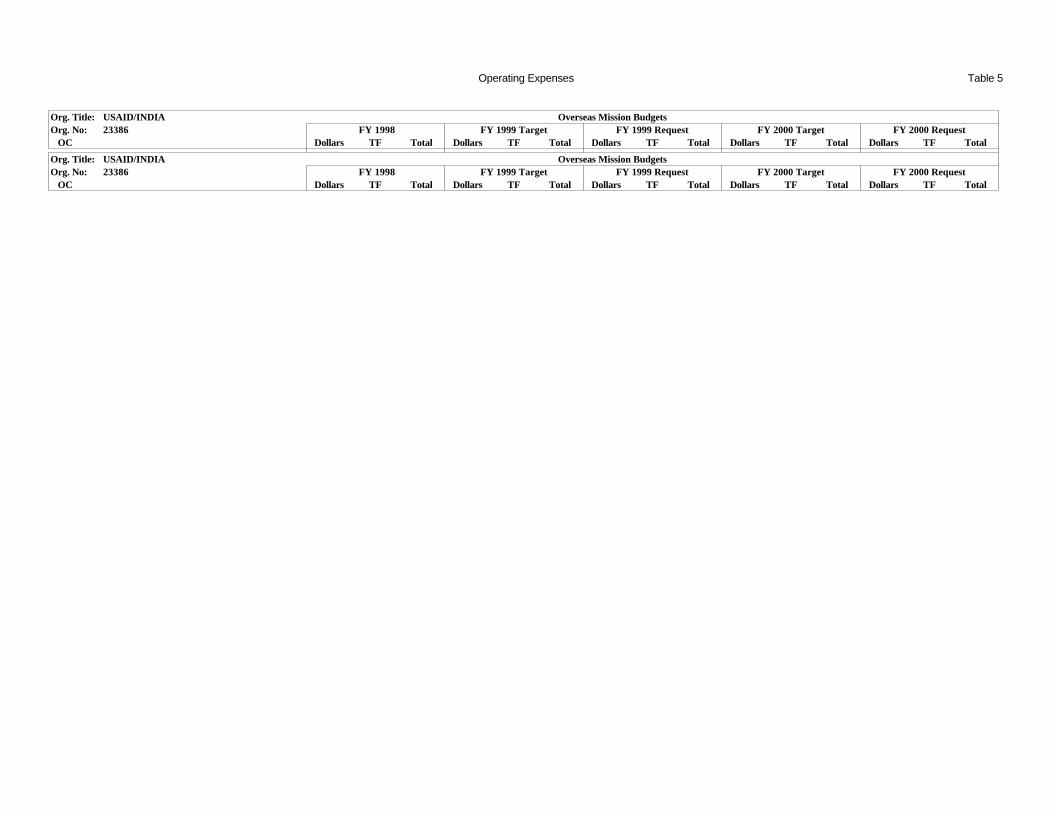
Operating Expenses Table 5
Org. Title: USAID/INDIA Overseas Mission BudgetsOrg. No: 23386 FY 1998 FY 1999 Target FY 1999 Request FY 2000 Target FY 2000 Request
OC Dollars TF Total Dollars TF Total Dollars TF Total Dollars TF Total Dollars TF Total
Org. Title: USAID/INDIA Overseas Mission BudgetsOrg. No: 23386 FY 1998 FY 1999 Target FY 1999 Request FY 2000 Target FY 2000 Request
OC Dollars TF Total Dollars TF Total Dollars TF Total Dollars TF Total Dollars TF Total

Operating Expenses Table 5
Org. Title: USAID/INDIA Overseas Mission BudgetsOrg. No: 23386 FY 1998 FY 1999 Target FY 1999 Request FY 2000 Target FY 2000 Request
OC Dollars TF Total Dollars TF Total Dollars TF Total Dollars TF Total Dollars TF Total
11.1 Personnel compensation, full-time permanent Do not enter data on this line Do not enter data on this line Do not enter data on this line Do not enter data on this line Do not enter data on this line11.1 Base Pay & pymt. for annual leave balances - FNDH 112.5 112.5 120.6 120.6 120.6 120.6 114.9 114.9 114.9 114.9
Subtotal OC 11.1 112.5 0.0 112.5 120.6 0.0 120.6 120.6 0.0 120.6 114.9 0.0 114.9 114.9 0.0 114.9
11.3 Personnel comp. - other than full-time permanent Do not enter data on this line Do not enter data on this line Do not enter data on this line Do not enter data on this line Do not enter data on this line11.3 Base Pay & pymt. for annual leave balances - FNDH 0.0 0.0 0.0 0.0 0.0
Subtotal OC 11.3 0.0 0.0 0.0 0.0 0.0 0.0 0.0 0.0 0.0 0.0 0.0 0.0 0.0 0.0 0.0
11.5 Other personnel compensation Do not enter data on this line Do not enter data on this line Do not enter data on this line Do not enter data on this line Do not enter data on this line11.5 USDH 0.0 0.0 0.0 0.0 0.011.5 FNDH 0.4 0.4 0.8 0.8 0.8 0.8 0.6 0.6 0.6 0.6
Subtotal OC 11.5 0.4 0.0 0.4 0.8 0.0 0.8 0.8 0.0 0.8 0.6 0.0 0.6 0.6 0.0 0.6
11.8 Special personal services payments Do not enter data on this line Do not enter data on this line Do not enter data on this line Do not enter data on this line Do not enter data on this line11.8 USPSC Salaries 0.0 0.0 0.0 0.0 0.011.8 FN PSC Salaries 843.6 843.6 1,023.4 1,023.4 1,023.4 1,023.4 1,141.3 1,141.3 1,141.3 1,141.311.8 IPA/Details-In/PASAs/RSSAs Salaries 0.0 0.0 0.0 0.0 0.0
Subtotal OC 11.8 843.6 0.0 843.6 1,023.4 0.0 1,023.4 1,023.4 0.0 1,023.4 1,141.3 0.0 1,141.3 1,141.3 0.0 1,141.3
12.1 Personnel benefits Do not enter data on this line Do not enter data on this line Do not enter data on this line Do not enter data on this line Do not enter data on this line12.1 USDH benefits Do not enter data on this line Do not enter data on this line Do not enter data on this line Do not enter data on this line Do not enter data on this line12.1 Educational Allowances 144.0 144.0 211.2 211.2 211.2 211.2 261.0 261.0 261.0 261.012.1 Cost of Living Allowances 0.0 0.0 0.0 0.0 0.012.1 Home Service Transfer Allowances 0.0 0.0 0.0 0.0 0.012.1 Quarters Allowances 0.0 0.0 0.0 0.0 0.012.1 Other Misc. USDH Benefits 2.1 2.1 3.5 3.5 3.5 3.5 2.1 2.1 2.1 2.112.1 FNDH Benefits Do not enter data on this line Do not enter data on this line Do not enter data on this line Do not enter data on this line Do not enter data on this line12.1 Payments to the FSN Separation Fund - FNDH 1.1 1.1 1.7 1.7 1.7 1.7 1.4 1.4 1.4 1.412.1 Other FNDH Benefits 37.6 37.6 23.0 23.0 23.0 23.0 25.1 25.1 25.1 25.112.1 US PSC Benefits 0.0 0.0 0.0 0.0 0.012.1 FN PSC Benefits Do not enter data on this line Do not enter data on this line Do not enter data on this line Do not enter data on this line Do not enter data on this line12.1 Payments to the FSN Separation Fund - FN PSC 40.1 40.1 34.1 34.1 34.1 34.1 38.0 38.0 38.0 38.012.1 Other FN PSC Benefits 204.4 204.4 236.4 236.4 236.4 236.4 260.5 260.5 260.5 260.512.1 IPA/Detail-In/PASA/RSSA Benefits 0.0 0.0 0.0 0.0 0.0
Subtotal OC 12.1 429.3 0.0 429.3 509.9 0.0 509.9 509.9 0.0 509.9 588.1 0.0 588.1 588.1 0.0 588.1
13 Benefits for former personnel Do not enter data on this line Do not enter data on this line Do not enter data on this line Do not enter data on this line Do not enter data on this line13 FNDH Do not enter data on this line Do not enter data on this line Do not enter data on this line Do not enter data on this line Do not enter data on this line13 Severance Payments for FNDH 0.0 0.0 0.0 0.0 0.013 Other Benefits for Former Personnel - FNDH 0.0 0.0 0.0 0.0 0.013 FN PSCs Do not enter data on this line Do not enter data on this line Do not enter data on this line Do not enter data on this line Do not enter data on this line13 Severance Payments for FN PSCs 0.0 0.0 0.0 0.0 0.013 Other Benefits for Former Personnel - FN PSCs 0.0 0.0 0.0 0.0 0.0

Operating Expenses Table 5
Org. Title: USAID/INDIA Overseas Mission BudgetsOrg. No: 23386 FY 1998 FY 1999 Target FY 1999 Request FY 2000 Target FY 2000 Request
OC Dollars TF Total Dollars TF Total Dollars TF Total Dollars TF Total Dollars TF Total
Subtotal OC 13.0 0.0 0.0 0.0 0.0 0.0 0.0 0.0 0.0 0.0 0.0 0.0 0.0 0.0 0.0 0.0
21 Travel and transportation of persons Do not enter data on this line Do not enter data on this line Do not enter data on this line Do not enter data on this line Do not enter data on this line21 Training Travel 55.0 55.0 55.0 55.0 55.0 55.0 60.5 60.5 60.5 60.521 Mandatory/Statutory Travel Do not enter data on this line Do not enter data on this line Do not enter data on this line Do not enter data on this line Do not enter data on this line21 Post Assignment Travel - to field 13.5 13.5 22.5 22.5 22.5 22.5 13.5 13.5 13.5 13.521 Assignment to Washington Travel 10.5 10.5 12.5 12.5 12.5 12.5 8.0 8.0 8.0 8.021 Home Leave Travel 18.5 18.5 42.0 42.0 42.0 42.0 36.0 36.0 36.0 36.021 R & R Travel 38.0 38.0 34.0 34.0 34.0 34.0 58.0 58.0 58.0 58.021 Education Travel 66.0 66.0 7.5 7.5 7.5 7.5 7.5 7.5 7.5 7.521 Evacuation Travel 25.0 25.0 25.0 25.0 25.0 25.0 25.0 25.0 25.0 25.021 Retirement Travel 0.0 0.0 0.0 0.0 0.021 Pre-Employment Invitational Travel 0.0 0.0 0.0 0.0 0.021 Other Mandatory/Statutory Travel 0.0 0.0 0.0 0.0 0.021 Operational Travel Do not enter data on this line Do not enter data on this line Do not enter data on this line Do not enter data on this line Do not enter data on this line21 Site Visits - Headquarters Personnel 10.0 10.0 10.0 10.0 10.0 10.0 11.0 11.0 11.0 11.021 Site Visits - Mission Personnel 157.5 157.5 160.0 160.0 160.0 160.0 175.5 175.5 175.5 175.521 Conferences/Seminars/Meetings/Retreats 85.0 85.0 84.0 84.0 84.0 84.0 92.0 92.0 92.0 92.021 Assessment Travel 10.0 10.0 11.0 11.0 11.0 11.0 12.0 12.0 12.0 12.021 Impact Evaluation Travel 5.0 5.0 6.0 6.0 6.0 6.0 7.0 7.0 7.0 7.021 Disaster Travel (to respond to specific disasters) 2.5 2.5 3.0 3.0 3.0 3.0 3.5 3.5 3.5 3.521 Recruitment Travel 0.0 0.0 0.0 0.0 0.021 Other Operational Travel 5.0 5.0 6.0 6.0 6.0 6.0 7.0 7.0 7.0 7.0
Subtotal OC 21.0 501.5 0.0 501.5 478.5 0.0 478.5 478.5 0.0 478.5 516.5 0.0 516.5 516.5 0.0 516.5
22 Transportation of things Do not enter data on this line Do not enter data on this line Do not enter data on this line Do not enter data on this line Do not enter data on this line22 Post assignment freight 75.0 75.0 135.0 135.0 135.0 135.0 90.0 90.0 90.0 90.022 Home Leave Freight 13.0 13.0 21.0 21.0 21.0 21.0 16.5 16.5 16.5 16.522 Retirement Freight 0.0 0.0 0.0 0.0 0.022 Transportation/Freight for Office Furniture/Equip. 63.4 63.4 50.4 50.4 114.3 114.3 32.6 32.6 61.9 61.922 Transportation/Freight for Res. Furniture/Equip. 6.3 6.3 4.5 4.5 7.6 7.6 0.0 7.6 7.6
Subtotal OC 22.0 157.7 0.0 157.7 210.9 0.0 210.9 277.9 0.0 277.9 139.1 0.0 139.1 176.0 0.0 176.0
23.2 Rental payments to others Do not enter data on this line Do not enter data on this line Do not enter data on this line Do not enter data on this line Do not enter data on this line23.2 Rental Payments to Others - Office Space 285.4 285.4 0.0 0.0 0.0 0.023.2 Rental Payments to Others - Warehouse Space 49.6 49.6 56.9 56.9 56.9 56.9 62.6 62.6 62.6 62.623.2 Rental Payments to Others - Residences 407.4 407.4 475.8 475.8 475.8 475.8 621.4 621.4 621.4 621.4
Subtotal OC 23.2 742.4 0.0 742.4 532.7 0.0 532.7 532.7 0.0 532.7 684.0 0.0 684.0 684.0 0.0 684.0
23.3 Communications, utilities, and miscellaneous charges Do not enter data on this line Do not enter data on this line Do not enter data on this line Do not enter data on this line Do not enter data on this line23.3 Office Utilities 106.8 106.8 136.8 136.8 136.8 136.8 9.6 9.6 9.6 9.623.3 Residential Utilities 68.8 68.8 75.0 75.0 75.0 75.0 82.0 82.0 82.0 82.023.3 Telephone Costs 57.0 57.0 58.7 58.7 58.7 58.7 64.4 64.4 64.4 64.423.3 ADP Software Leases 0.0 0.0 0.0 0.0 0.023.3 ADP Hardware Lease 0.0 0.0 0.0 0.0 0.0

Operating Expenses Table 5
Org. Title: USAID/INDIA Overseas Mission BudgetsOrg. No: 23386 FY 1998 FY 1999 Target FY 1999 Request FY 2000 Target FY 2000 Request
OC Dollars TF Total Dollars TF Total Dollars TF Total Dollars TF Total Dollars TF Total
23.3 Commercial Time Sharing 0.0 0.0 0.0 0.0 0.023.3 Postal Fees (Other than APO Mail) 0.9 0.9 0.9 0.9 0.9 0.9 0.9 0.9 0.9 0.923.3 Other Mail Service Costs 7.0 7.0 7.0 7.0 7.0 7.0 7.0 7.0 7.0 7.023.3 Courier Services 7.7 7.7 7.7 7.7 7.7 7.7 7.7 7.7 7.7 7.7
Subtotal OC 23.3 248.2 0.0 248.2 286.1 0.0 286.1 286.1 0.0 286.1 171.6 0.0 171.6 171.6 0.0 171.6
24 Printing and Reproduction 0.0 0.0 0.0 0.0 0.0
Subtotal OC 24.0 0.0 0.0 0.0 0.0 0.0 0.0 0.0 0.0 0.0 0.0 0.0 0.0 0.0 0.0 0.0
25.1 Advisory and assistance services Do not enter data on this line Do not enter data on this line Do not enter data on this line Do not enter data on this line Do not enter data on this line25.1 Studies, Analyses, & Evaluations 0.0 0.0 0.0 0.0 0.025.1 Management & Professional Support Services 0.0 0.0 0.0 0.0 0.025.1 Engineering & Technical Services 0.0 0.0 0.0 0.0 0.0
Subtotal OC 25.1 0.0 0.0 0.0 0.0 0.0 0.0 0.0 0.0 0.0 0.0 0.0 0.0 0.0 0.0 0.0
25.2 Other services Do not enter data on this line Do not enter data on this line Do not enter data on this line Do not enter data on this line Do not enter data on this line25.2 Office Security Guards 29.5 29.5 21.3 21.3 21.3 21.3 11.9 11.9 11.9 11.925.2 Residential Security Guard Services 15.0 15.0 15.9 15.9 15.9 15.9 16.9 16.9 16.9 16.925.2 Official Residential Expenses 0.5 0.5 0.5 0.5 0.5 0.5 0.5 0.5 0.5 0.525.2 Representation Allowances 1.0 1.0 1.0 1.0 1.0 1.0 1.0 1.0 1.0 1.025.2 Non-Federal Audits 0.0 0.0 0.0 0.0 0.025.2 Grievances/Investigations 0.0 0.0 0.0 0.0 0.025.2 Insurance and Vehicle Registration Fees 0.5 0.5 0.6 0.6 0.6 0.6 0.7 0.7 0.7 0.725.2 Vehicle Rental 0.0 0.0 0.0 0.0 0.025.2 Manpower Contracts 37.7 37.7 30.7 30.7 30.7 30.7 23.5 23.5 23.5 23.525.2 Records Declassification & Other Records Services 0.0 0.0 0.0 0.0 0.025.2 Recruiting activities 9.4 9.4 10.5 10.5 10.5 10.5 10.5 10.5 10.5 10.525.2 Penalty Interest Payments 0.0 0.0 0.0 0.0 0.025.2 Other Miscellaneous Services 9.0 9.0 24.4 24.4 24.4 24.4 13.0 13.0 13.0 13.025.2 Staff training contracts 0.0 0.0 0.0 0.0 0.025.2 ADP related contracts 10.0 10.0 12.0 12.0 12.0 12.0 12.0 12.0 12.0 12.0
Subtotal OC 25.2 112.6 0.0 112.6 116.9 0.0 116.9 116.9 0.0 116.9 90.0 0.0 90.0 90.0 0.0 90.0
25.3 Purchase of goods and services from Government accounts Do not enter data on this line Do not enter data on this line Do not enter data on this line Do not enter data on this line Do not enter data on this line25.3 ICASS 386.2 386.2 425.0 425.0 425.0 425.0 649.0 649.0 649.0 649.025.3 All Other Services from Other Gov't. accounts 0.0 0.0 0.0 0.0 0.0
Subtotal OC 25.3 386.2 0.0 386.2 425.0 0.0 425.0 425.0 0.0 425.0 649.0 0.0 649.0 649.0 0.0 649.0
25.4 Operation and maintenance of facilities Do not enter data on this line Do not enter data on this line Do not enter data on this line Do not enter data on this line Do not enter data on this line25.4 Office building Maintenance 6.3 6.3 10.6 10.6 10.6 10.6 28.8 28.8 28.8 28.825.4 Residential Building Maintenance 20.0 20.0 29.5 29.5 29.5 29.5 28.2 28.2 28.2 28.2
Subtotal OC 25.4 26.3 0.0 26.3 40.1 0.0 40.1 40.1 0.0 40.1 57.0 0.0 57.0 57.0 0.0 57.0
25.7 Operation/maintenance of equipment & storage of goods Do not enter data on this line Do not enter data on this line Do not enter data on this line Do not enter data on this line Do not enter data on this line

Operating Expenses Table 5
Org. Title: USAID/INDIA Overseas Mission BudgetsOrg. No: 23386 FY 1998 FY 1999 Target FY 1999 Request FY 2000 Target FY 2000 Request
OC Dollars TF Total Dollars TF Total Dollars TF Total Dollars TF Total Dollars TF Total
25.7 ADP and telephone operation and maintenance costs 0.8 0.8 0.9 0.9 0.9 0.9 1.0 1.0 1.0 1.025.7 Storage Services 0.0 0.0 0.0 0.0 0.025.7 Office Furniture/Equip. Repair and Maintenance 51.3 51.3 52.4 52.4 52.4 52.4 8.8 8.8 8.8 8.825.7 Vehicle Repair and Maintenance 3.4 3.4 3.8 3.8 3.8 3.8 3.0 3.0 3.0 3.025.7 Residential Furniture/Equip. Repair and Maintenance 4.0 4.0 4.1 4.1 4.1 4.1 4.1 4.1 4.1 4.1
Subtotal OC 25.7 59.5 0.0 59.5 61.2 0.0 61.2 61.2 0.0 61.2 16.9 0.0 16.9 16.9 0.0 16.9
25.8 Subsistance and support of persons (by contract or Gov't.) 0.0 0.0 0.0 0.0 0.0
Subtotal OC 25.8 0.0 0.0 0.0 0.0 0.0 0.0 0.0 0.0 0.0 0.0 0.0 0.0 0.0 0.0 0.0
26 Supplies and materials 187.4 187.4 193.7 193.7 193.7 193.7 180.0 180.0 180.0 180.0
Subtotal OC 26.0 187.4 0.0 187.4 193.7 0.0 193.7 193.7 0.0 193.7 180.0 0.0 180.0 180.0 0.0 180.0
31 Equipment Do not enter data on this line Do not enter data on this line Do not enter data on this line Do not enter data on this line Do not enter data on this line31 Purchase of Residential Furniture/Equip. 32.9 32.9 11.2 11.2 42.9 42.9 0.0 47.2 47.231 Purchase of Office Furniture/Equip. 111.2 111.2 30.0 30.0 330.3 330.3 0.0 96.4 96.431 Purchase of Vehicles 0.0 0.0 42.0 42.0 0.0 42.0 42.031 Purchase of Printing/Graphics Equipment 0.0 0.0 0.0 0.0 0.031 ADP Hardware purchases 99.5 99.5 84.0 84.0 84.0 84.0 0.0 71.5 71.5
Subtotal OC 31.0 243.6 0.0 243.6 125.2 0.0 125.2 499.2 0.0 499.2 0.0 0.0 0.0 257.1 0.0 257.1
32 Lands and structures Do not enter data on this line Do not enter data on this line Do not enter data on this line Do not enter data on this line Do not enter data on this line32 Purchase of Land & Buildings (& construction of bldgs.) 0.0 0.0 0.0 0.0 0.032 Purchase of fixed equipment for buildings 0.0 0.0 0.0 0.0 0.032 Building Renovations/Alterations - Office 0.0 0.0 0.0 0.0 0.032 Building Renovations/Alterations - Residential 0.0 0.0 0.0 0.0 0.0
Subtotal OC 32.0 0.0 0.0 0.0 0.0 0.0 0.0 0.0 0.0 0.0 0.0 0.0 0.0 0.0 0.0 0.0
42 Claims and indemnities 0.0 0.0 0.0 0.0 0.0
Subtotal OC 42.0 0.0 0.0 0.0 0.0 0.0 0.0 0.0 0.0 0.0 0.0 0.0 0.0 0.0 0.0 0.0
TOTAL BUDGET 4,051.2 0.0 4,051.2 4,125.0 0.0 4,125.0 4,566.0 0.0 4,566.0 4,349.0 0.0 4,349.0 4,643.0 0.0 4,643.0
Dollars Used for Local Currency Purchases . . . . . Exchange Rate Used in Computations $1 = Rs. 39.00 $1 = Rs. 39.00 $1 = Rs. 39.00 $1 = Rs. 39.00 $1 = Rs. 39.00

TRUST FUNDS & FSN SEPARATION FUND Table 7
Orgno:. 23386Org. Title: USAID/INDIA
Foreign National Voluntary Separation Account
FY 98 FY 99 FY 00Action OE Program Total OE Program Total OE Program Total
Deposits 41.2 1.5 42.7 35.8 0.2 36.0 39.4 2.0 41.4Withdrawals 81.6 0.0 81.6 32.1 0.0 32.1 29.7 0.0 29.7Unfunded Liability (if any) NIL at the end of each FY.
Local Currency Trust Funds - Regular ($000s)
FY 98 FY 99 FY 00
Balance Start of Year N/A N/AObligationsDepositsBalance End of Year 0.0 0.0 0.0
Exchange Rate(s) Used
Trust Funds in Dollar Equivalents, not in Local Currency Equivalents
Local Currency Trust Funds - Real Property ($000s)
FY 98 FY 99 FY 00
Balance Start of Year N/A N/AObligationsDepositsBalance End of Year 0.0 0.0 0.0
Trust Funds in Dollar Equivalents, not in Local Currency Equivalents

Workforce Table 8
Org.: USAID/INDIA Total Management Staff GrandFY 1998 SO/SpO Staff SO/SpO Org. Con- AMS/ Con- All Total Total
On-Board Estimate SO 1 SO 2 SO 3 SO 4 SpO 1 SpO 2 SpO 3 Staff Mgmt. troller EXO tract Legal Other Mgmt. Staff
U.S. Direct Hire 2 2 2 2 8 2 1 1 1 5 13
Other U.S. Citizens: 1/ OE Internationally Recruited 0 0 0 OE Locally Recruited 0 0 0 Program 1 1 0 1
FSN/TCN Direct Hire: OE Internationally Recruited 0 0 0 OE Locally Recruited 1 2 3 1 3 4 7
FSN/TCN Non-Direct Hire: OE Internationally Recruited 0 0 0 OE Locally Recruited 8 7 7 8 4 2 2 38 2 12 52 3 2 71 109 Program 3 3 0 3
Total Staff Levels 11 9 11 14 4 2 2 53 5 13 56 4 0 2 80 133
TAACS 0 0 0Fellows 0 0 01/ Excluding TAACS and Fellows

Workforce Table 8
Org.: USAID/INDIA Total Management Staff GrandFY 1999 Target SO/SpO Staff SO/SpO Org. Con- AMS/ Con- All Total Total
On-Board Estimate SO 1 SO 2 SO 3 SO 4 SpO 1 SpO 2 SpO 3 Staff Mgmt. troller EXO tract Legal Other Mgmt. Staff
U.S. Direct Hire 2 3 2 2 9 2 1 1 1 5 14
Other U.S. Citizens: 1/ OE Internationally Recruited 0 0 0 OE Locally Recruited 0 0 0 Program 1 1 0 1
FSN/TCN Direct Hire: OE Internationally Recruited 0 0 0 OE Locally Recruited 1 2 3 1 2 3 6
FSN/TCN Non-Direct Hire: OE Internationally Recruited 0 0 0 OE Locally Recruited 8 7 7 8 4 2 2 38 2 12 50 3 2 69 107 Program 2 2 0 2
Total Staff Levels 11 10 11 13 4 2 2 53 5 13 53 4 0 2 77 130
TAACS 0 0 0Fellows 2 1 3 0 31/ Excluding TAACS and Fellows
Org.: USAID/INDIA Total Management Staff GrandFY 1999 Request SO/SpO Staff SO/SpO Org. Con- AMS/ Con- All Total Total
On-Board Estimate SO 1 SO 2 SO 3 SO 4 SpO 1 SpO 2 SpO 3 Staff Mgmt. troller EXO tract Legal Other Mgmt. Staff
U.S. Direct Hire 2 3 2 2 9 2 1 1 1 5 14
Other U.S. Citizens: 1/ OE Internationally Recruited 0 0 0 OE Locally Recruited 0 0 0 Program 1 1 0 1
FSN/TCN Direct Hire: OE Internationally Recruited 0 0 0 OE Locally Recruited 1 2 3 1 2 3 6
FSN/TCN Non-Direct Hire: OE Internationally Recruited 0 0 0 OE Locally Recruited 8 7 7 8 4 2 2 38 2 12 50 3 2 69 107 Program 2 2 0 2
Total Staff Levels 11 10 11 13 4 2 2 53 5 13 53 4 0 2 77 130
TAACS 0 0 0Fellows 2 1 3 0 31/ Excluding TAACS and Fellows

Workforce Table 8
Org.: USAID/INDIA Total Management Staff GrandFY 2000 Target SO/SpO Staff SO/SpO Org. Con- AMS/ Con- All Total Total
On-Board Estimate SO 1 SO 2 SO 3 SO 4 SpO 1 SpO 2 SpO 3 Staff Mgmt. troller EXO tract Legal Other Mgmt. Staff
U.S. Direct Hire 2 3 2 2 9 2 1 1 1 5 14
Other U.S. Citizens: 1/ OE Internationally Recruited 0 0 0 OE Locally Recruited 0 0 0 Program 1 1 0 1
FSN/TCN Direct Hire: OE Internationally Recruited 0 0 0 OE Locally Recruited 1 2 3 1 2 3 6
FSN/TCN Non-Direct Hire: OE Internationally Recruited 0 0 0 OE Locally Recruited 9 8 8 9 5 1 3 43 2 12 44 3 2 63 106 Program 2 2 0 2
Total Staff Levels 12 11 12 14 5 1 3 58 5 13 47 4 0 2 71 129
TAACS 0 0 0Fellows 2 1 3 0 31/ Excluding TAACS and Fellows
Org.: USAID/INDIA Total Management Staff GrandFY 2000 Request SO/SpO Staff SO/SpO Org. Con- AMS/ Con- All Total Total
On-Board Estimate SO 1 SO 2 SO 3 SO 4 SpO 1 SpO 2 SpO 3 Staff Mgmt. troller EXO tract Legal Other Mgmt. Staff
U.S. Direct Hire 2 3 2 2 9 2 1 1 1 5 14
Other U.S. Citizens: 1/ OE Internationally Recruited 0 0 0 OE Locally Recruited 0 0 0 Program 1 1 0 1
FSN/TCN Direct Hire: OE Internationally Recruited 0 0 0 OE Locally Recruited 1 2 3 1 2 3 6
FSN/TCN Non-Direct Hire: OE Internationally Recruited 0 0 0 OE Locally Recruited 9 8 8 9 5 1 3 43 2 12 44 3 2 63 106 Program 2 2 0 2
Total Staff Levels 12 11 12 14 5 1 3 58 5 13 47 4 0 2 71 129
TAACS 0 0 0Fellows 2 1 3 0 31/ Excluding TAACS and Fellows

Workforce Table 8
Org.: USAID/INDIA Total Management Staff GrandFY 2001 SO/SpO Staff SO/SpO Org. Con- AMS/ Con- All Total Total
On-Board Estimate SO 1 SO 2 SO 3 SO 4 SpO 1 SpO 2 SpO 3 Staff Mgmt. troller EXO tract Legal Other Mgmt. Staff
U.S. Direct Hire 2 2 2 2 8 2 1 1 1 5 13
Other U.S. Citizens: 1/ OE Internationally Recruited 0 0 0 OE Locally Recruited 0 0 0 Program 1 1 0 1
FSN/TCN Direct Hire: OE Internationally Recruited 0 0 0 OE Locally Recruited 1 2 3 1 2 3 6
FSN/TCN Non-Direct Hire: OE Internationally Recruited 0 0 0 OE Locally Recruited 9 8 8 9 5 1 3 43 2 12 44 3 2 63 106 Program 2 2 0 2
Total Staff Levels 12 10 12 14 5 1 3 57 5 13 47 4 0 2 71 128
TAACS 0 0 0Fellows 0 0 01/ Excluding TAACS and Fellows
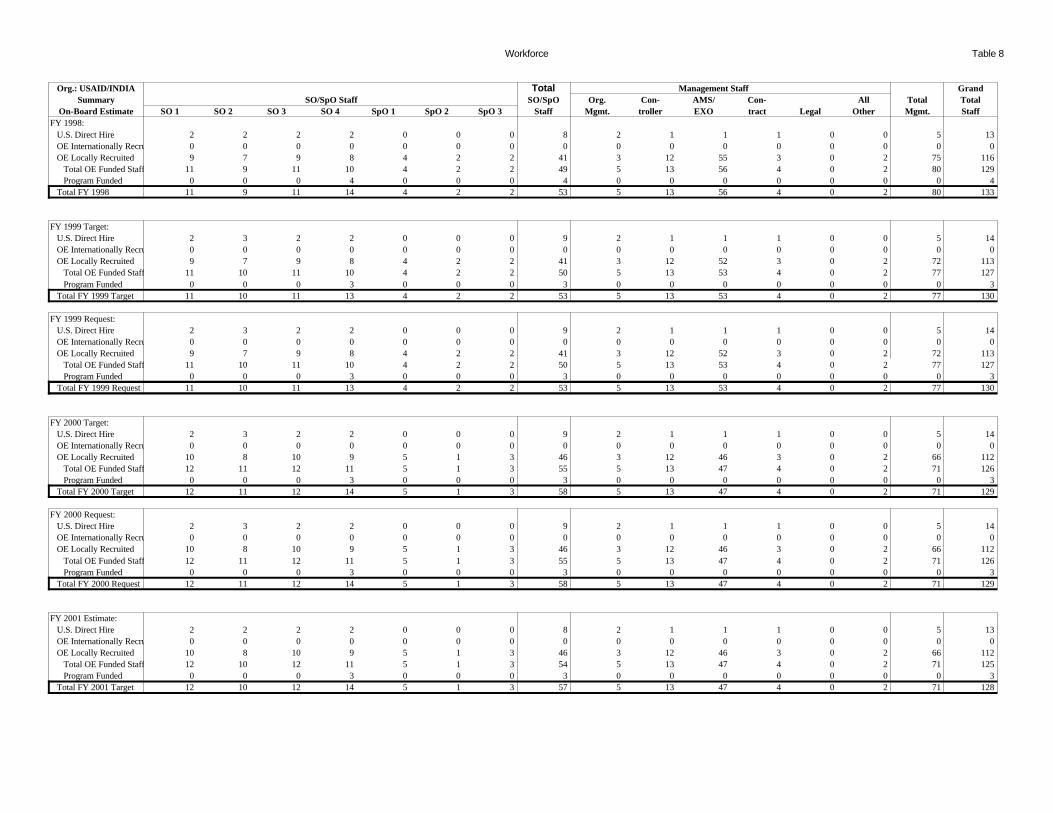
Workforce Table 8
Org.: USAID/INDIA Total Management Staff GrandSummary SO/SpO Staff SO/SpO Org. Con- AMS/ Con- All Total Total
On-Board Estimate SO 1 SO 2 SO 3 SO 4 SpO 1 SpO 2 SpO 3 Staff Mgmt. troller EXO tract Legal Other Mgmt. StaffFY 1998: U.S. Direct Hire 2 2 2 2 0 0 0 8 2 1 1 1 0 0 5 13 OE Internationally Recruited 0 0 0 0 0 0 0 0 0 0 0 0 0 0 0 0 OE Locally Recruited 9 7 9 8 4 2 2 41 3 12 55 3 0 2 75 116 Total OE Funded Staff 11 9 11 10 4 2 2 49 5 13 56 4 0 2 80 129 Program Funded 0 0 0 4 0 0 0 4 0 0 0 0 0 0 0 4 Total FY 1998 11 9 11 14 4 2 2 53 5 13 56 4 0 2 80 133
FY 1999 Target: U.S. Direct Hire 2 3 2 2 0 0 0 9 2 1 1 1 0 0 5 14 OE Internationally Recruited 0 0 0 0 0 0 0 0 0 0 0 0 0 0 0 0 OE Locally Recruited 9 7 9 8 4 2 2 41 3 12 52 3 0 2 72 113 Total OE Funded Staff 11 10 11 10 4 2 2 50 5 13 53 4 0 2 77 127 Program Funded 0 0 0 3 0 0 0 3 0 0 0 0 0 0 0 3 Total FY 1999 Target 11 10 11 13 4 2 2 53 5 13 53 4 0 2 77 130
FY 1999 Request: U.S. Direct Hire 2 3 2 2 0 0 0 9 2 1 1 1 0 0 5 14 OE Internationally Recruited 0 0 0 0 0 0 0 0 0 0 0 0 0 0 0 0 OE Locally Recruited 9 7 9 8 4 2 2 41 3 12 52 3 0 2 72 113 Total OE Funded Staff 11 10 11 10 4 2 2 50 5 13 53 4 0 2 77 127 Program Funded 0 0 0 3 0 0 0 3 0 0 0 0 0 0 0 3 Total FY 1999 Request 11 10 11 13 4 2 2 53 5 13 53 4 0 2 77 130
FY 2000 Target: U.S. Direct Hire 2 3 2 2 0 0 0 9 2 1 1 1 0 0 5 14 OE Internationally Recruited 0 0 0 0 0 0 0 0 0 0 0 0 0 0 0 0 OE Locally Recruited 10 8 10 9 5 1 3 46 3 12 46 3 0 2 66 112 Total OE Funded Staff 12 11 12 11 5 1 3 55 5 13 47 4 0 2 71 126 Program Funded 0 0 0 3 0 0 0 3 0 0 0 0 0 0 0 3 Total FY 2000 Target 12 11 12 14 5 1 3 58 5 13 47 4 0 2 71 129
FY 2000 Request: U.S. Direct Hire 2 3 2 2 0 0 0 9 2 1 1 1 0 0 5 14 OE Internationally Recruited 0 0 0 0 0 0 0 0 0 0 0 0 0 0 0 0 OE Locally Recruited 10 8 10 9 5 1 3 46 3 12 46 3 0 2 66 112 Total OE Funded Staff 12 11 12 11 5 1 3 55 5 13 47 4 0 2 71 126 Program Funded 0 0 0 3 0 0 0 3 0 0 0 0 0 0 0 3 Total FY 2000 Request 12 11 12 14 5 1 3 58 5 13 47 4 0 2 71 129
FY 2001 Estimate: U.S. Direct Hire 2 2 2 2 0 0 0 8 2 1 1 1 0 0 5 13 OE Internationally Recruited 0 0 0 0 0 0 0 0 0 0 0 0 0 0 0 0 OE Locally Recruited 10 8 10 9 5 1 3 46 3 12 46 3 0 2 66 112 Total OE Funded Staff 12 10 12 11 5 1 3 54 5 13 47 4 0 2 71 125 Program Funded 0 0 0 3 0 0 0 3 0 0 0 0 0 0 0 3 Total FY 2001 Target 12 10 12 14 5 1 3 57 5 13 47 4 0 2 71 128

Workforce Table 8
MISSION : USAID/INDIA
USDH STAFFING REQUIREMENTS BY SKILL CODEBACKSTOP NO. OF USDH NO. OF USDH NO. OF USDH NO. OF USDH
(BS) EMPLOYEES EMPLOYEES EMPLOYEES EMPLOYEESIN BACKSTOP IN BACKSTOP IN BACKSTOP IN BACKSTOP
FY 98 FY 99 FY 2000 FY 200101SMG 2 2 2 202 Program Off. 2 2 2 203 EXO 1 1 1 104 Controller 1 1 1 105/06/07 Secretary10 Agriculture.11Economics12 GDO12 Democracy14 Rural Dev.15 Food for Peace 1 1 1 121 Private Ent.25 Engineering40 Environ 2 2 2 250 Health/Pop. 3 3 3 360 Education75 Physical Sci.85 Legal92 Commodity Mgt93 Contract Mgt 1 1 1 194 PDO95 IDI 1 1Other*
TOTAL 13 14 14 13
*please list occupations covered by other if there are any

ANNEXES