Performance communication of the Belgian Railway
18
Showing results? An analysis of the perceptions of internal and external stakeholders of the public performance communication by the Belgian and Dutch Railways Dave Gelders a, ⁎ , Mirjam Galetzka b,1 , Jan Pieter Verckens c,2 , Erwin Seydel d a The Leuven School for Mass Communication Research and Public Management Institute, K. U. Leuven, Parkstraat 45 bus 3603, B-3000, Belgium b Department of Communication Science, Marketing Communication and Consumer Psychology, University of Twente, Postbox 217, NL 7500 AE Enschede, The Netherlands c Department Business Studies, Lessius University College, Korte Nieuwstraat 33, B 2000 Antwerpen, Belgium d Department of Communication Science, University of Twente, Psychology and Communication of Health and Risk, Postbox 217, NL 7500 AE Enschede, The Netherlands Available online 30 March 2007 Abstract Performance measurement and communicating about it with the broader public is not self-evident if one looks at public services organizations (Hernon, P., 1998. The government performance and results act. Government Information Quarterly , 15: 153–156). In Belgium and the Netherlands, one organization that has been under constant surveillance from its stakeholders is the railroad company. Originally a national public service, it has changed through a European directive to operate in a liberalized transportation market. In this paper, we present the results of a qualitative study into what the Belgian and Dutch railway companies measure about their performance towards travelers, how Available online at www.sciencedirect.com Government Information Quarterly 25 (2008) 221 – 238 ⁎ Corresponding author. Fax: +32 16 32 33 12. E-mail addresses: [email protected] (D. Gelders), [email protected] (M. Galetzka), [email protected] (J.P. Verckens), [email protected] (E. Seydel). 1 Fax: +31 53 489 4259. 2 Fax: +32 3 201 18 42. 0740-624X/$ - see front matter © 2007 Elsevier Inc. All rights reserved. doi:10.1016/j.giq.2007.01.003
Transcript of Performance communication of the Belgian Railway
Available online at www.sciencedirect.com
Government Information Quarterly 25 (2008) 221–238
Showing results? An analysis of the perceptions of internaland external stakeholders of the public performancecommunication by the Belgian and Dutch Railways
Dave Gelders a,⁎, Mirjam Galetzka b,1,Jan Pieter Verckens c,2, Erwin Seydel d
a The Leuven School for Mass Communication Research and Public Management Institute, K. U. Leuven,Parkstraat 45 bus 3603, B-3000, Belgium
b Department of Communication Science, Marketing Communication and Consumer Psychology,University of Twente, Postbox 217, NL 7500 AE Enschede, The Netherlands
c Department Business Studies, Lessius University College, Korte Nieuwstraat 33,B 2000 Antwerpen, Belgium
d Department of Communication Science, University of Twente, Psychology and Communication of Health andRisk, Postbox 217, NL 7500 AE Enschede, The Netherlands
Available online 30 March 2007
Abstract
Performance measurement and communicating about it with the broader public is not self-evidentif one looks at public services organizations (Hernon, P., 1998. The government performance andresults act. Government Information Quarterly, 15: 153–156). In Belgium and the Netherlands, oneorganization that has been under constant surveillance from its stakeholders is the railroad company.Originally a national public service, it has changed through a European directive to operate in aliberalized transportation market. In this paper, we present the results of a qualitative study into whatthe Belgian and Dutch railway companies measure about their performance towards travelers, how
⁎ Corresponding author. Fax: +32 16 32 33 12.E-mail addresses: [email protected] (D. Gelders), [email protected] (M. Galetzka),
[email protected] (J.P. Verckens), [email protected] (E. Seydel).1 Fax: +31 53 489 4259.2 Fax: +32 3 201 18 42.
0740-624X/$ - see front matter © 2007 Elsevier Inc. All rights reserved.doi:10.1016/j.giq.2007.01.003
222 D. Gelders et al. / Government Information Quarterly 25 (2008) 221–238
they measure it, and specifically how they communicate it to their employees and stakeholders.Although we might expect the Dutch railway company (NS) to be more transparent than the Belgianrailway company (NMBS/SNCB), in reality the two organizations do not differ that much from eachother.© 2007 Elsevier Inc. All rights reserved.
Keywords: Public communication; Performance; Performance communication; Railways; Belgium; TheNetherlands
“With high quality, trustworthy and market-oriented services, the SNCB plays a key role in the development ofsustained mobility.” http://www.sncb.be.
“The journey of the customer is the basis for NS Passengers. NS Passengers aims at having its trains arrive on time,
having enough and comfortable seats along with good service, timely information and adequate relief when servicesare disrupted. The customer demands quality, therefore we will work during the coming years on all corrections thatare necessary for ‘the journey of the customer.’ During an average working day, more than one million customersuse our services and travel by train.” http://www.ns.nl.1. Introduction
Performance measurement and communicating about it seems to be a management activitythat is self-evident in certain environments (especially the profit sector) but not in otherenvironments (i.e., the nonprofit sector). It seems obvious that production sites for any productwill keep track of the performance indicators of all or major production phases. And many(commercial) service organizations monitor their actual performance by measuring servicequality (see, e.g., Ittner & Larcker, 1998; Johnson & Fornell, 1991; Otley, 1999; Zeithaml,Bitner, & Gremler, 2006). Governmental institutions funded by tax payments may or may notscrutinize the performance of its major task.
We study the performance measurements of the Belgian and Dutch railroad companies andthe manner in which they communicate their measurements both internally and externally.There are several reasons to study Belgium and the Netherlands on this topic.
Research into intercultural communicative situations has shown there are strikingdifferences between Belgium and the Netherlands (see Hofstede, 2001; Claes & Gerritsen,2002, for an overview); above that, it often is assumed at face value by Belgian actors that theDutch way of governing and communicating is more open and transparent than the Belgianway; one may assume that this is also true for the Belgian railroad performance communication(as was also indicated in some first pretest interviews among Belgian railroad actors): byinvestigating the practices and perceptions of several actors in both countries we will try togain more insight about this issue.
In addition, the two countries have comparable mobility problems. In the Netherlands, theso-called Randstad is the core area of transportation. It is a quadrangle that is formed by thecities of Amsterdam, The Hague, Rotterdam, and Utrecht. In Belgium, a triangle that linksAntwerp, Brussels, and Ghent is known as the transportation knot. Brought together, onemight see these regions as the heart of Western European transportation in that two of the majorworld ports are located in the region as well (Rotterdam and Antwerp).
223D. Gelders et al. / Government Information Quarterly 25 (2008) 221–238
Finally, both countries have a long-standing relationship within the economic union of theBenelux, and by belonging to the European Community both countries must obey theregulations that the European Parliament works out for specific phenomena. One suchregulation is the liberalization of transportation. The liberalization of the European railroadsector has been planned in three phases:
(1) railway package accepted in 2001 by the European Parliament: liberalization of goodstransported on the basis of a Trans European goods network;
(2) railway package accepted in 2004 by the European Parliament: faster liberalization ofgoods transportation including national transportation; and
(3) railway package: discussion started in 2004, acceptance expected by 2010: liberalizationof travelers' transportation including the picking up and dropping off of travelers instations within the (national) territory.
Public railway transportation in Belgium used to be the core business of the NationaleMaatschappij voor Belgische Spoorwegen/ Société Nationale de Chemins de fer Belge(NMBS/SNCB). Public transportation in the Netherlands was offered by the NederlandseSpoorwegen (NS).
Until now, the Dutch government “owns” NS Passengers in its entirety through a holdingcompany. The same is true for ProRail, which is owned through a different holding company.The Dutch government permits the management of Dutch Railways to be conducted by NSthrough a concession. This concession is designed by LOCOV, a national advisory board forpublic transportation in which consumer organizations, the Ministry of Transportation, and NSparticipate. The concession prescribes and regulates the conditions of infrastructure andquality of transportation through key performance indicators (KPIs).
A comparable situation can be detected in Belgium where the SNCB is owned by theBelgian Federal Government. Through this ownership, they automatically own the SNCBsubsidiary in its entirety. They also own Infrabel through a one fifth ownership through theHolding Company and four fifths directly. There is also a Fund for Railroad Infrastructure, alegal entity in which the losses of the SNCB – before the split of 2005 – were recorded.
2. Literature review
The perceptions and expectations of citizens about governmental operations are not onlydetermined by the quality of these operations but also by public communication regardingthese operations (Bouckaert, 1995; Van de Walle, 2004). Lorch (quoted by Garnett, 1992)states that “Perhaps nothing is more important to successful administration than successfulcommunication.” The organizational context in which organizations communicate is scarcelyconsidered, as is illustrated by Graber (2003), Pandey and Garnett (2006), and Gelders,Bouckaert, and Van Ruler (in press).
During the last decade, liberation of the internal market has resulted in many governmentaloperations that became more market focused. At the same time, many profit companies have
224 D. Gelders et al. / Government Information Quarterly 25 (2008) 221–238
recognized societal responsibility as a major corporate mission. Consequently, managers areincreasingly interested in identifying and managing the effects of corporate performance on thecorporation's various stakeholders within society. By carefully measuring and managing theeffects of both good and bad performances, managers can make a significant contribution bothto their company and society (Epstein and Roy, 2001).
Performance measures can be used for monitoring trends in performances or forcomparative analysis of companies' performances on key performance indicators (KPIs)such as customer satisfaction indices (Grigoroudis and Siskos, 2004). Performancemeasures can be used to evaluate the companies' performances and to learn about andimprove corporate policies and optimize management processes. Through effective commu-nication, performance measures can also be used as a marketing tool to enhance corporatereputation.
In order to use performance measures effectively, corporate managers must provide aframework to establish KPIs along with relevant targets for the KPIs to drive an organizationtowards success (Rubinson and Pfeiffer, 2005). Furthermore, managers need to know how tocommunicate regarding performance throughout their organization in a language that is readilyunderstandable. Moreover, external disclosure initiatives to communicate (positive) perfor-mance indicators may be a way to overcome stakeholders' concerns and promote stakeholders'relationship with the company (Epstein and Roy, 2001). Although the importance ofperformancemeasurement for comparative andmonitoring purposes and the communication ofKPIs is widely recognized, little data are available regarding the communication of (key)performance measures.
The present study investigates the performance measures of the Belgian and Dutch railroadcompanies. We investigate which performance indicators are measured and how they arecommunicated both internally and externally. In conclusion, the present study aims to compareBelgian and Dutch performance measurements and communication practices.
3. Method
3.1. Questionnaire
In order to collect our data on performance measurements and performance communication,we developed two questionnaires. The first questionnaire was based on Van Dooren (2006) onperformance measurements but was adapted to the public organizations we selected for ourstudy. We used this questionnaire among quality engineers as a “pretest” to screen the overallsituation on performance measurements in the SNCB and the NS.
Based on this questionnaire and on public communication literature (e.g., questionnaire ofVallet et al., 2006 on performance communication), we developed a second questionnaire tobe used for the other Belgian and Dutch interviews. In these interviews we asked morespecific questions on performance measurements in order to elaborate our rather generalinsights from the “pretest.” In addition, we focused more on performance communication:how performance measurements were communicated internally and externally, with what
225D. Gelders et al. / Government Information Quarterly 25 (2008) 221–238
frequency, the quality of the communication, the pros and cons of such communication, andthe manner in which several actors interact during this communication process. Thus, weanalyze not only descriptive elements (who communicates when...), but we also presentseveral comments or evaluations of the situation made by our interviewees and ourselves.
The questionnaire included overlapping questions making it possible to detect anycontradictions in the answers of the interviewees. The overlapping questions mainly consistedof open questions in order to be able to conduct semistructured interviews that would result inin-depth probing.
3.2. Participants
In total, 22 interviews were held to compare the performance measurement practices of theBelgian and Dutch Railways. All the people we asked to participate did so. We conductedeleven face-to-face interviews in Belgium and in the Netherlands. The interviews wereconducted during April and June 2006. Anonymity of the informants was guaranteed at thebeginning and end of the interview.
In the Belgian study, four of the interviews had respondents within the SNCB Group, fourhad respondents from the political environment, and three were outside stakeholders. In theDutch study, five interviews had respondents within NS Passengers/ProRail, one from an NS-affiliated organization, one from the political environment, and four were outside stakeholders.The respondents within the SNCB Group and Passengers NS/ProRail were spokespersons ofthe companies or its subsidiaries. The respondents within the political environments arespokespersons of ministers, parties, and MPs. The outside stakeholders are representatives ofthe Ombudsman Service, consumer organizations, and journalists. In other words, allinterviewees might be called first-hand stakeholders (internal or external) that might have aslightly biased perspective on the topic, but confrontation of these perspectives would give usthe richness of data that we wanted to gather.
3.3. Analyses
The interviews were recorded on tape and later transcribed verbatim. Two Belgian and twoDutch researchers independently analyzed the interviews for remarkable quotes on the internalor external view on the topic at hand. Nowhere, was it our intention to code the interviews aswe started from a semistructured questionnaire that was presented to all interviewees in thesame form, dealing with the specific subtopics. A consensus meeting was organized to discussnotable correspondences and discrepancies between the Belgian and Dutch interviews, in theline of claims pronounced by, amongst others, Hofstede (2001, pp. 18, 63, 454).
4. Results
We will present the results of the interviews with respondents inside the SNCB Group andNS, the “politicians,” and the “third party.” We will present these results as answers to our
226 D. Gelders et al. / Government Information Quarterly 25 (2008) 221–238
double research question: what do the companies measure (and how do they do this, howfrequently, etc.) and how do they communicate it both internally and externally (howfrequently, etc.). In order to guarantee anonymity, we will only distinguish the different groupsby the labels “insiders,” “affiliate,” “politicians,” and “outside stakeholders.”
4.1. Attention to quality and measurement practices
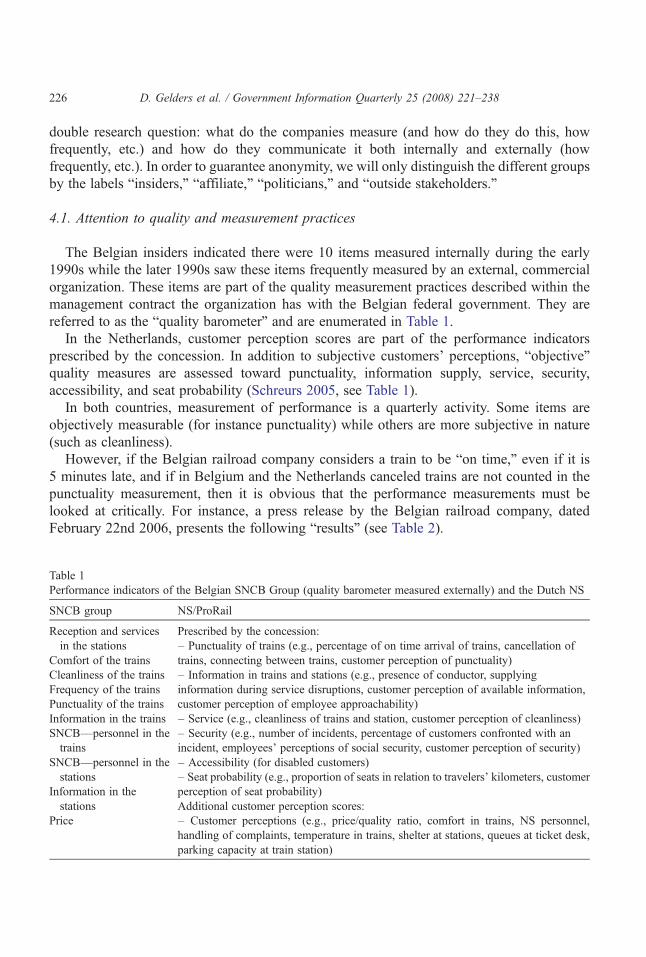
The Belgian insiders indicated there were 10 items measured internally during the early1990s while the later 1990s saw these items frequently measured by an external, commercialorganization. These items are part of the quality measurement practices described within themanagement contract the organization has with the Belgian federal government. They arereferred to as the “quality barometer” and are enumerated in Table 1.
In the Netherlands, customer perception scores are part of the performance indicatorsprescribed by the concession. In addition to subjective customers' perceptions, “objective”quality measures are assessed toward punctuality, information supply, service, security,accessibility, and seat probability (Schreurs 2005, see Table 1).
In both countries, measurement of performance is a quarterly activity. Some items areobjectively measurable (for instance punctuality) while others are more subjective in nature(such as cleanliness).
However, if the Belgian railroad company considers a train to be “on time,” even if it is5 minutes late, and if in Belgium and the Netherlands canceled trains are not counted in thepunctuality measurement, then it is obvious that the performance measurements must belooked at critically. For instance, a press release by the Belgian railroad company, datedFebruary 22nd 2006, presents the following “results” (see Table 2).
Table 1Performance indicators of the Belgian SNCB Group (quality barometer measured externally) and the Dutch NS
SNCB group NS/ProRail
Reception and servicesin the stations
Prescribed by the concession:
Comfort of the trains– Punctuality of trains (e.g., percentage of on time arrival of trains, cancellation oftrains, connecting between trains, customer perception of punctuality)
Cleanliness of the trains – Information in trains and stations (e.g., presence of conductor, supplyinginformation during service disruptions, customer perception of available information,customer perception of employee approachability)
Frequency of the trains
– Service (e.g., cleanliness of trains and station, customer perception of cleanliness)Punctuality of the trains
– Security (e.g., number of incidents, percentage of customers confronted with anincident, employees' perceptions of social security, customer perception of security)
Information in the trains
– Accessibility (for disabled customers)
SNCB—personnel in thetrains
– Seat probability (e.g., proportion of seats in relation to travelers' kilometers, customerperception of seat probability)
SNCB—personnel in thestations
Additional customer perception scores:Information in thestations
– Customer perceptions (e.g., price/quality ratio, comfort in trains, NS personnel,handling of complaints, temperature in trains, shelter at stations, queues at ticket desk,parking capacity at train station)
Price
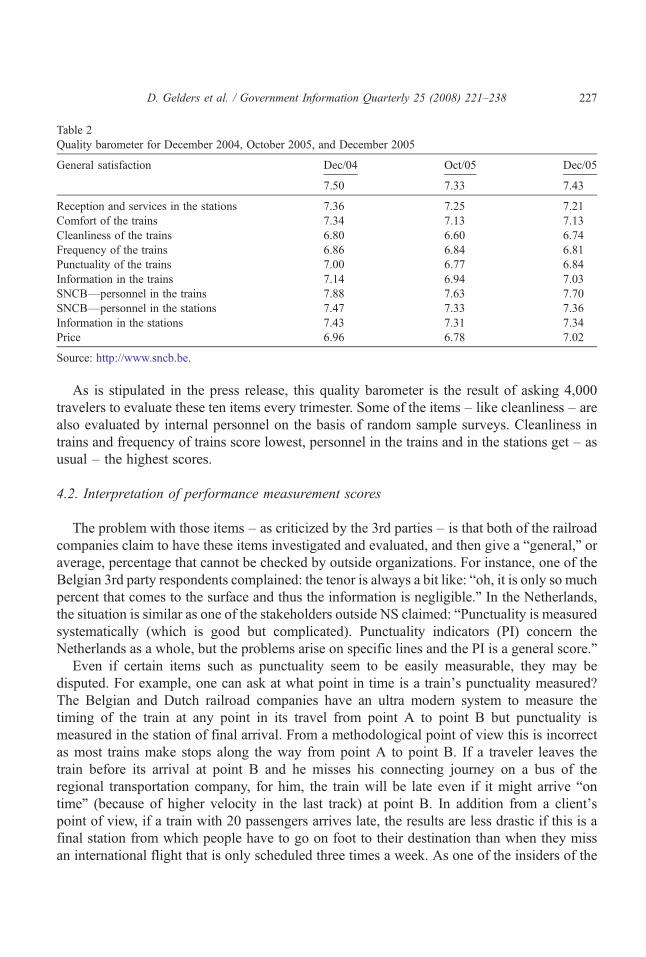
Table 2Quality barometer for December 2004, October 2005, and December 2005
General satisfaction Dec/04 Oct/05 Dec/05
7.50 7.33 7.43
Reception and services in the stations 7.36 7.25 7.21Comfort of the trains 7.34 7.13 7.13Cleanliness of the trains 6.80 6.60 6.74Frequency of the trains 6.86 6.84 6.81Punctuality of the trains 7.00 6.77 6.84Information in the trains 7.14 6.94 7.03SNCB—personnel in the trains 7.88 7.63 7.70SNCB—personnel in the stations 7.47 7.33 7.36Information in the stations 7.43 7.31 7.34Price 6.96 6.78 7.02
Source: http://www.sncb.be.
227D. Gelders et al. / Government Information Quarterly 25 (2008) 221–238
As is stipulated in the press release, this quality barometer is the result of asking 4,000travelers to evaluate these ten items every trimester. Some of the items – like cleanliness – arealso evaluated by internal personnel on the basis of random sample surveys. Cleanliness intrains and frequency of trains score lowest, personnel in the trains and in the stations get – asusual – the highest scores.
4.2. Interpretation of performance measurement scores
The problem with those items – as criticized by the 3rd parties – is that both of the railroadcompanies claim to have these items investigated and evaluated, and then give a “general,” oraverage, percentage that cannot be checked by outside organizations. For instance, one of theBelgian 3rd party respondents complained: the tenor is always a bit like: “oh, it is only so muchpercent that comes to the surface and thus the information is negligible.” In the Netherlands,the situation is similar as one of the stakeholders outside NS claimed: “Punctuality is measuredsystematically (which is good but complicated). Punctuality indicators (PI) concern theNetherlands as a whole, but the problems arise on specific lines and the PI is a general score.”
Even if certain items such as punctuality seem to be easily measurable, they may bedisputed. For example, one can ask at what point in time is a train's punctuality measured?The Belgian and Dutch railroad companies have an ultra modern system to measure thetiming of the train at any point in its travel from point A to point B but punctuality ismeasured in the station of final arrival. From a methodological point of view this is incorrectas most trains make stops along the way from point A to point B. If a traveler leaves thetrain before its arrival at point B and he misses his connecting journey on a bus of theregional transportation company, for him, the train will be late even if it might arrive “ontime” (because of higher velocity in the last track) at point B. In addition from a client'spoint of view, if a train with 20 passengers arrives late, the results are less drastic if this is afinal station from which people have to go on foot to their destination than when they missan international flight that is only scheduled three times a week. As one of the insiders of the
228 D. Gelders et al. / Government Information Quarterly 25 (2008) 221–238
SNCB said: “Your ticket guarantees that you will be transported from point A to point B andnot that it will arrive at the time mentioned in the timetable.” A Dutch colleague: “Eightypercent of the trains might be on time, but what if you miss your connection to anothertrain? 80% punctuality is a strange norm.”
According to several Belgian and Dutch interviewees, the basic problem is one of attitude,emerging from a specific organizational culture of engineers and technicians, and not of apublic service company. Railroad officials constantly talk about “trains being late/on time”whereas the 3rd party respondents would like to talk about “travelers that are late or on time.”The organization is structured similar to the military and thus importance of safety and otheraspects are measured based on that structure. The priority was, and may still be, “having steelcontainers move and if a client enters the container, that's okay” as a Belgian 3rd party states.In the Netherlands, we heard similar (albeit less explicit) statements. Even though the politicalsituation changed drastically since the implementation of the European directive, theorganizational culture did not follow at the same pace.
Other items are of such a subjective nature (cleanliness of buildings and train compartments,comfort in trains) that the results must be looked at critically.What the 3rd party respondents aremissing in this quality barometer is seating capacity of the trains (in Belgium), opening hours ofstations, and better communication on screens on the platforms and in the stations.
Overall, it can be concluded that the performance measurements can be multi-interpretedand can give opportunity for strategic communication.1 For instance, performance measurescan be interpreted literally and meticulously at a quarterly level (pending seasonal trends).However, as several respondents inside and outside SNCB and NS claim, PI measurementsshould be considered long term: “I think it is more useful to look at trends over time” (outsidestakeholder), and “At the moment, we have been conducting these performance measures forapproximately 10 years. This gives us the opportunity to look at trends” (insider).
4.3. Performance measurement criteria and objectives
There are different criteria that play a part when organizations try to determine what tomeasure (Van Dooren, 2006). We presented the respondents with a nonexhaustive list theywere asked to rank in order of importance. They were allowed to add additional criteria. Thefollowing picture can be distilled from the interviews.
If we look at the criteria that seem to be most important (they were ranked as No. 1 or 2) bymost Belgian respondents, we get the following rank order:
(1) visibility within society (media, politicians, etc.) (criterion 5); and(2) the company has no choice (criterion 1) and they indicate problems (symptoms,
complaints) (criterion 2).
1 As one may argue: this is an understatement. As a traveler it is important to know at what time I will arrive athome, the railroad station is only the final destination for the railroad company, but never for travelers. One mayalso state that PI's are indicators in the view of the system, and not that much of the clients/travelers who arelooking to the railroad company in a different way. For him, one may argue, the connection with the next bus oranother train is of more value than being 3 minutes too late.
229D. Gelders et al. / Government Information Quarterly 25 (2008) 221–238
Least important in these criteria is the feasibility of the measurement effort. Additionally,the financial importance is not an important criterion according to the Belgian intervieweesbecause the railway company is a budgeted item.
In the Dutch situation, indications of problems through symptoms seem also to be a veryimportant criterion for performance measurement (criterion 2), followed by improvement ofcustomer satisfaction (criterion 7). Contrary to the Belgian situation, the least important seemsto be the obligatory nature of performance measures.
Based on Van Dooren (2006), we also asked which specific objectives public managers ofthe railroad companies strive for while measuring performance. We presented the followingeight objectives: evaluate, control, budget, motivate, promote (public relations), celebrate,learn, and improve. The respondents were asked to evaluate these eight objectives. Therespondents were asked to evaluate these eight objectives on a scale of 0 to 10 with 10 beingthe most important and 0 being the least. Most of the time, they responded to this question inthe same manner as they did the first.
Interpreting the answers of the Belgian respondents gives us the following picture. Theinterviewed SNCB employees claim that “to evaluate” is the most important objective. Insecond place – but less unanimously – we find “to motivate.” And as the third objective – andevidently even less unanimously – they refer to the objectives “to budget” and “publicrelations” (but PR is mostly called a side effect rather than an objective).
The politicians rated the most important objectives as “to evaluate” and “to control.” Forthem (i.e., MPs of the political opposition), the second objective is “public relations.” And thethird would be “to learn” and “to correct.”
The 3rd party respondents call “public relations” the most important objective for theSNCB to measure performances. The second most important objective is “to budget.”Third – with more consensus than the politicians and the SNCB employees – is “toevaluate.”
All parties see the importance of performance measurements as a way to evaluate processesand services and as a tool of public relations (e.g., a reason for communicating performance).Only the politicians see these measurements as (very) important tools to learn from and tocorrect issues.
Overall, the Dutch respondents indicate the main objective of the performance measuresseems to be quality improvement. However, critical notes are made both by insiders, NSaffiliates and outside stakeholders: “They are doing it because they want to improve qualityand monitor the organization, but the main reason is because it is prescribed by the concession”(affiliate); “We want to show societal responsibility but we have selfish motives: we want toimprove the management cycle and adjust our policy.” (insider); and “An important objectiveis to show (externally) how well NS is doing. I am very cynical about that” (outsidestakeholder). Punctuality measures seem to be the most important performance measuresaccording to several respondents. Punctuality is one condition of the concession and, in themedia, NS is primarily judged on punctuality measures. In case of ProRail, “interruptions ininfrastructure (in hours)” is the most important performance indicator. However, acommunication manager of NS states: “I believe that the overall judgment of service qualityis of the utmost importance!”
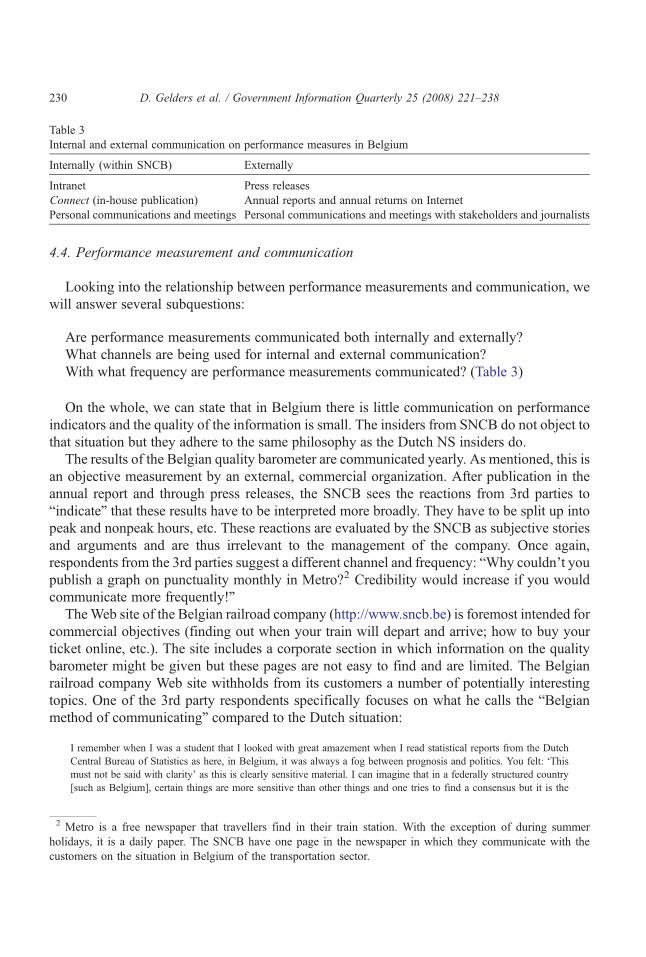
Table 3Internal and external communication on performance measures in Belgium
Internally (within SNCB) Externally
Intranet Press releasesConnect (in-house publication) Annual reports and annual returns on InternetPersonal communications and meetings Personal communications and meetings with stakeholders and journalists
230 D. Gelders et al. / Government Information Quarterly 25 (2008) 221–238
4.4. Performance measurement and communication
Looking into the relationship between performance measurements and communication, wewill answer several subquestions:
Are performance measurements communicated both internally and externally?What channels are being used for internal and external communication?With what frequency are performance measurements communicated? (Table 3)
On the whole, we can state that in Belgium there is little communication on performanceindicators and the quality of the information is small. The insiders from SNCB do not object tothat situation but they adhere to the same philosophy as the Dutch NS insiders do.
The results of the Belgian quality barometer are communicated yearly. As mentioned, this isan objective measurement by an external, commercial organization. After publication in theannual report and through press releases, the SNCB sees the reactions from 3rd parties to“indicate” that these results have to be interpreted more broadly. They have to be split up intopeak and nonpeak hours, etc. These reactions are evaluated by the SNCB as subjective storiesand arguments and are thus irrelevant to the management of the company. Once again,respondents from the 3rd parties suggest a different channel and frequency: “Why couldn't youpublish a graph on punctuality monthly in Metro?2 Credibility would increase if you wouldcommunicate more frequently!”
TheWeb site of the Belgian railroad company (http://www.sncb.be) is foremost intended forcommercial objectives (finding out when your train will depart and arrive; how to buy yourticket online, etc.). The site includes a corporate section in which information on the qualitybarometer might be given but these pages are not easy to find and are limited. The Belgianrailroad company Web site withholds from its customers a number of potentially interestingtopics. One of the 3rd party respondents specifically focuses on what he calls the “Belgianmethod of communicating” compared to the Dutch situation:
2 Mholicust
I remember when I was a student that I looked with great amazement when I read statistical reports from the DutchCentral Bureau of Statistics as here, in Belgium, it was always a fog between prognosis and politics. You felt: ‘Thismust not be said with clarity’ as this is clearly sensitive material. I can imagine that in a federally structured country[such as Belgium], certain things are more sensitive than other things and one tries to find a consensus but it is the
etro is a free newspaper that travellers find in their train station. With the exception of during summerdays, it is a daily paper. The SNCB have one page in the newspaper in which they communicate with theomers on the situation in Belgium of the transportation sector.
231D. Gelders et al. / Government Information Quarterly 25 (2008) 221–238
approach. If you read a transportation plan of the NS, you do this with pleasure. If you read a document here from theSNCB, it is difficult to read through because you want to know what it says. In the Netherlands, there is a differentreading quality as they can be more open. Do they not hide anything? I don't say this, but the approach towardscommunication is different.
Another Belgian 3rd party respondent complained as follows: “I think that communicationwith the broader public could be better regarding content. Currently, communication is toodefensive.” A political spokesperson says with a more positive viewpoint: “I have never seenpublic servants prouder than those with the SNCB.” They are part of the railroad: “Lescheminaux,” they are very proud of their company, but they do not express it very much. Thatis typical.”
Contrary to the Dutch colleagues, the Belgian railway company scarcely uses large-scalepaid publicity to communicate about their performances. An exception is the newspaper theSNCB Group distributed in June 2006 to communicate the annual results of the first year of the(new) SNCB Group. They argue that using paid publicity aimed at the general public orpassengers might be perceived as too boastful. Nevertheless, they started to move in thisdirection as the recent newspaper illustrates.
In the Netherlands, performance communication seems to be open and performancemeasures are communicated widely through a variety of communication channels. Thefrequency of performance communication seems to be okay.
Broad information is provided in-house via the intranet, newsletters, and monitors in theentrance hall of the main offices. The intranet provides the performance information that ispublicized externally. Detailed information is communicated on a more personal level to thepersons concerned through oral communication, spreadsheets, and pamphlets (published every2 weeks) with updated information on important current changes and problems. Externalcommunication is directed to the general public through advertisements in major newspapers,the Internet, press releases, annual returns (published semi-annually), and annual reportspublished on the Internet. Specific stakeholders receive in depth and tailored informationthrough a stakeholder magazine (Trens): “Trens publishes background information. We try toprovide explanations and background information regarding performance results.” (insider).Stakeholders receive advertisements and press releases in advance, and meetings are organizedfor stakeholders and journalists for further clarification of the performance measures (Table 4).
NS shows a recent tendency to provide less information and to focus on few keyperformance measures: “By now, NS believe they do not have to publish all 40 customersatisfaction scores—only the performance indicators prescribed in the concession as theother items are not necessarily published” (outside stakeholder). As stated by an insider,it is not in the interest of the customers to provide an overload of information:“Personally, I believe that 99% of our customers do not want to be informed about PIs.”Until recently, consumer organizations (e.g., Rover) received all performance measuresalthough NS seems inclined to restrict the information to key performance measures(specified and prescribed in the concession) in the near future. Detailed and in depthinformation on the performance measures is provided to consumer organizations and toother stakeholders through direct communication and (bilateral) conferences and personalconsultations.
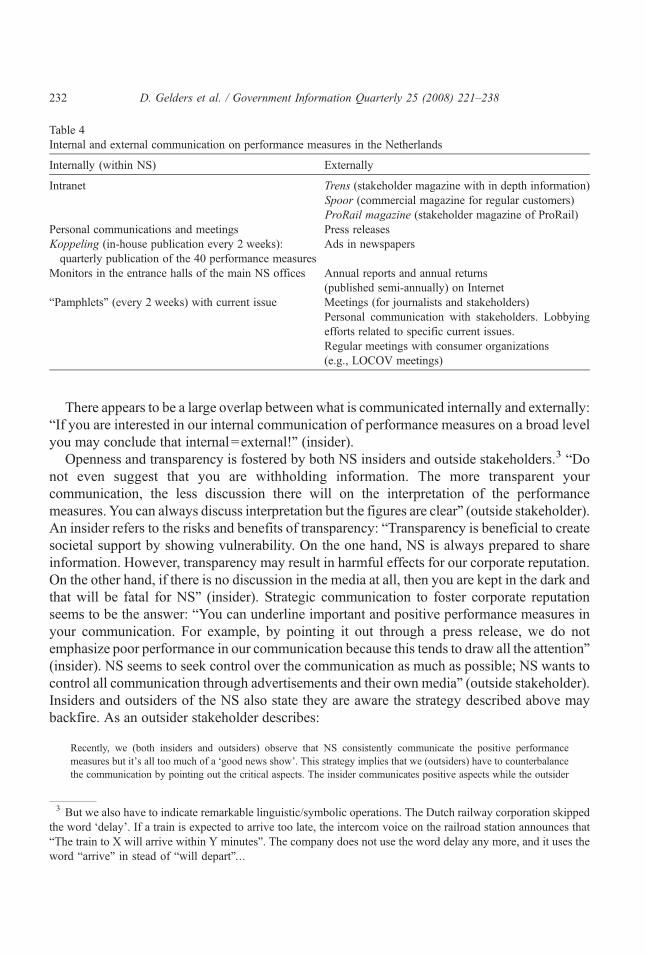
Table 4Internal and external communication on performance measures in the Netherlands
Internally (within NS) Externally
Intranet Trens (stakeholder magazine with in depth information)Spoor (commercial magazine for regular customers)ProRail magazine (stakeholder magazine of ProRail)
Personal communications and meetings Press releasesKoppeling (in-house publication every 2 weeks):quarterly publication of the 40 performance measures
Ads in newspapers
Monitors in the entrance halls of the main NS offices Annual reports and annual returns(published semi-annually) on Internet
“Pamphlets” (every 2 weeks) with current issue Meetings (for journalists and stakeholders)Personal communication with stakeholders. Lobbyingefforts related to specific current issues.Regular meetings with consumer organizations(e.g., LOCOV meetings)
232 D. Gelders et al. / Government Information Quarterly 25 (2008) 221–238
There appears to be a large overlap between what is communicated internally and externally:“If you are interested in our internal communication of performance measures on a broad levelyou may conclude that internal=external!” (insider).
Openness and transparency is fostered by both NS insiders and outside stakeholders.3 “Donot even suggest that you are withholding information. The more transparent yourcommunication, the less discussion there will on the interpretation of the performancemeasures. You can always discuss interpretation but the figures are clear” (outside stakeholder).An insider refers to the risks and benefits of transparency: “Transparency is beneficial to createsocietal support by showing vulnerability. On the one hand, NS is always prepared to shareinformation. However, transparency may result in harmful effects for our corporate reputation.On the other hand, if there is no discussion in the media at all, then you are kept in the dark andthat will be fatal for NS” (insider). Strategic communication to foster corporate reputationseems to be the answer: “You can underline important and positive performance measures inyour communication. For example, by pointing it out through a press release, we do notemphasize poor performance in our communication because this tends to draw all the attention”(insider). NS seems to seek control over the communication as much as possible; NS wants tocontrol all communication through advertisements and their own media” (outside stakeholder).Insiders and outsiders of the NS also state they are aware the strategy described above maybackfire. As an outsider stakeholder describes:
3 Bthe“Thwor
Recently, we (both insiders and outsiders) observe that NS consistently communicate the positive performancemeasures but it's all too much of a ‘good news show’. This strategy implies that we (outsiders) have to counterbalancethe communication by pointing out the critical aspects. The insider communicates positive aspects while the outsider
ut we also have to indicate remarkable linguistic/symbolic operations. The Dutch railway corporation skippedword ‘delay’. If a train is expected to arrive too late, the intercom voice on the railroad station announces thate train to X will arrive within Y minutes”. The company does not use the word delay any more, and it uses thed “arrive” in stead of “will depart”…
233D. Gelders et al. / Government Information Quarterly 25 (2008) 221–238
communicates critical ones. The relationship between us has become problematic over the last few months in terms ofthe punctuality performance measures. Both sides were wrong so we have to talk.” Another outside stakeholderconcludes: “NS pretends to be transparent and I think they are but only when they communicate the positive aspects.The moment you criticize, it gets personal.
A constructive communication strategy and solution to the impasse that arises is suggestedby one of the communication managers: “Creating realistic expectancies toward NS amongcustomers and stakeholders is a profitable communication strategy. This is not primarilyrelated to performance measures but to the package of services we provide and the creation ofrealistic expectancies.”
Again, the Belgian situation shows similar patterns but also remarkable differences. One ofthe insiders claimed:
…it has become evident. We communicate broadly about our presentations inside the group, only a little bit externally.That is evident. If we had communicated about this in the past, there almost certainly would have been a revolution(“How is it possible that you dare communicate about that?”). Now it has become evident and communication is on thebasis of documents that everybody can read but no one asks questions about this situation. On the basis of the elementsthat are delivered, they say we are not doing a good job so how are we going to solve this problem?.
One respondent clearly expressed his experience as follows:
Before 1998 it was unheard of to use the word ‘problem’ in connection to railroad activities in Belgium. But in 2000one could see posters in stations requesting travellers to contact customer service if there is a problem. However, thisdoes not mean that travellers receive a quick resolution to the problem or the solution they expect.
Respondents from the 3rd party complain: “In Belgium things are not focused onmanagement, but often on people. They have punctuality data, but they don't give publish thedata. The railways are afraid to communicate about that.” Strange as it may seem, the SNCBemployees agree with this situation. For instance, “If there is public demand regardingcommunication about performances, then you should follow the demand. What are the resultsin reality? We do not communicate about everything we are asked as we decide for ourselveswhat is possible and what is not.” “Sometimes you have to put your foot on the hand break inorder not to move too fast as there are times when you must not make a sudden big change instyle. People who have lots of experience in one area of expertise may not have the expertise inother areas—such as engineers and communication.”
However, since 2003 – when Karel Vinck was CEO of the old SNCB – there has been anattempt to communicate more openly even about negative situations. With the Europeandirective and the split into two subsidiaries, this attitude will become more obligatory in theliberalized European transportation market.
The results of the quality barometer (see above) – an instrument that should be used as amanagement tool and not as a set of data that people have to account for – are communicated tothe SNCB employees but the communication is not appropriate. For instance, only half of theemployees can access the intranet of the company. The others get the results of the barometerin the staff magazine (Connect) or through newsletters. Internal communication is not modern(up to a level that might be expected these days in a public organization with 38,000employees) and the frequency could be augmented.

234 D. Gelders et al. / Government Information Quarterly 25 (2008) 221–238
The major problem is the question “who communicates what to whom?” Having twosubsidiaries of one holding company with specific tasks does not make it easier tocommunicate internally and externally. This is certainly true in the Belgian case in which thepersonnel formally belongs to the holding company but mainly operates in one of two mainsubsidiaries (licensee or infrastructure company).
The 3rd party complains that communication activities of the SNCB are too restricted andtoo general. They communicate in such a way that they present themselves as “good,”“efficient,” “reliable,” etc., whereas the general public knows that this is not the image theypresent in their daily activities. The SNCB sees its 3,500 trains moving while the customeronly sees his particular train that does not move on time. One of the respondents of the politicalgroup expressed the “old way of doing things” as follows: “One must check whether thequality of the service was all right but it was not the objective to bring it out publicly but tobetter internal quality.” This situation is accepted as fact if we listen to the comments of anotherrespondent of a political party:
Yes but they want to learn. I think you can't reproach the SNCB to be a dinosaur to guard itself. They make great efforts, butthe causes are culture bound. 1) They have great pride with which they protect themselves from the outside world ratherdefensively, which is a culture they have lived for a long time. 2)There is a dominant social union culturemaking it difficult tochange the processes andmaking it not obvious for public managers to communicate about the organizational performances.
5. Conclusions
The perceptions and expectations of citizens regarding governmental operations are notonly determined by the quality of these operations but also by public communication aboutthese operations. This paper analyzed the performance communication by two large-scalepublic enterprises, i.e., the Belgian and the Dutch railroad companies. Originally, they weretraditional national public services, but through a European directive they have to operate in aliberalized transportation market. There is already a liberalized (national and international)cargo market. But also the passenger traffic will be increasingly subjected to competition in thenext years. The directive obligated the railroad companies in the EU to divide the formerunitary organizations into “the working of the railways” (see the licensee SNCB in Belgiumand NS Passengers in the Netherlands) and “the infrastructure” (see Infrabel in Belgium andProRail in the Netherlands).
In this paper we presented the results of a qualitative study into what the Belgian and Dutchrailway company measurements about their performance towards travelers, how they measureit, and specifically how they communicate it to their employees and stakeholders. Weconducted 22 in-depth interviews among the most important Belgian and Dutch internal andexternal stakeholders in the railway field, i.e., railroad company employees (quality engineersand spokespersons), politicians, and their spokespersons, and 3rd parties (OmbudsmanService, journalists, consumer organizations).
The analysis of the Belgian and Dutch railway performance measurements andcommunication yield surprisingly similar results, when we keep in mind the strong claimsthat Hofstede (2001) makes when he compares the two countries, and the idea that Dutch
235D. Gelders et al. / Government Information Quarterly 25 (2008) 221–238
governing and communicating style would be more open and transparent than the Belgianstyle.
The organization of Belgian and Dutch railways is similar and many of the performancemeasures are largely comparable. Punctuality is the main performance indicator in bothcountries. Other important measures are information supply in trains and stations andcleanliness of trains and stations. Both subjective customer perceptions and objective qualitymeasures are assessed towards performances indicators. Indications of problems are animportant objective of these quarterly performance measures in both countries.
Considering both internal and external communications, one can conclude that the Dutchperformance communication seems to be more open and more frequent than the Belgiancommunication. In the Netherlands, performance measures are widely communicatedthrough a variety of communication channels (paid publicity through ads, etc.), and thefrequency of performance communication is – as might be expected – higher than inBelgium (Hofstede, 2001, p. 18). In Belgium, this is less the case. Several interviewees inboth countries also referred to this difference they mainly explained by differing policy andcommunication styles; Dutch public organizations would communicate more openly thanBelgian organizations.
Nevertheless, our results show that the picture is more complicated in both countries:
-In the Netherlands: Although both insiders and outside stakeholders appreciate thefrequency, amount, and quality of performance communication in the Dutch situation, thissituation seems to be changing. The ambiguous attitude is remarkable towards transparencyin performance communication. Although it is advocated by various stakeholders and NSinsiders to take a transparent and, therefore, vulnerable position in performancecommunication, this seems to backfire. Disclosure of both positive and negativeperformance measures to consumer organizations used to be common practice in theNetherlands. To promote corporate reputation, NS used to emphasize positive performancemeasures in other communications. This seems to be a likely strategy from amarketing pointof view. However, the somewhat too rosy PR by NS encouraged consumer organizations totake a critical point of view and disclose negative performancemeasures to themedia. As oneof the respondents acknowledges, Dutch people tend to be relatively critical compared toother nationalities. Recently, the relationship between NS and consumer organizationsbecame somewhat strained and the communication of performancemeasures is restricted to aselection of positive or obligatory key performance measures.-In Belgium: Although both insiders and outside stakeholders admit that the frequency,amount and quality of performance communication in the Belgian situation is insufficient,this situation seems to be changing, in the 1990s it was unthinkable to communicate aboutproblems with customers, nowadays, due to changes in society, this kind of negativecommunication has become a fact. More of a media mix – Internet, yearly activity report,free newspaper articles – is used to reach more (relevant) inside and outside stakeholders.There seems to be a growing (albeit slowly) culture in which internal and externalperformance communication becomes more self-evident (albeit not obvious due to the olddefensive reflexes of the organization and the high impact of social union culture).
236 D. Gelders et al. / Government Information Quarterly 25 (2008) 221–238
Consequently, both organizations seem to come closer to each other in practice. A similarityin their performance communication is the focus on positive aspects. From a communicativepoint of view, it might be wise to publish negative aspects as well as the positive ones and toaccentuate the positive information. This strategy promotes corporate credibility and generaltrust in railway companies. Moreover, public transportation may be considered apredominantly experience-based service. Negative customer experiences (due to train delaysor bad weather) may be mitigated by investing in positive experiences for customers by suchactions as encouraging one's employees to engage in empathetic customer interaction orproviding an attractive environment. However, customer satisfaction will only be achievedwhen the service meets the performance that is expected. Promotion of realistic expectations ofthe service through performance communication will yield service validity (matching serviceexpectations) and thus promote customer satisfaction (Galetzka, Verhoeven, & Pruyn 2006;Zeithaml, Parasuraman, & Berry 1990).
Items that may require additional research include the following:
- The effects of counterbalanced communication of performance measures on corporatereputation and brand equity in order to examine the mediating role of corporate credibilityand trust in the company.
- A large-scale content analysis of performance communication material coming from severalactors in order to assess the actual frequency, amount, and quality in addition to theperceptions of the actors we interviewed.
- We interviewed several types of actors but not passengers (e.g., on their appreciation of thecurrent performance communication and their wishes such as would they appreciatecommunication on punctuality on the station screens, more performance figures in therailway publications,…?).
- A key performance indicator could be the number of times (the chance) that passengersarrive at their destination in time. In further research it would be interesting to comparethese results to the chance of arriving in time by car, and the extent to which these tworesults are publicly communicated.
- In Belgium, a mother company (the SNCB Holding) has been set up to coordinate both theindependent subsidiaries (licensee SNCB and infrastructure Infrabel). The (earlier) split upin the Netherlands between NS Passengers and ProRail resulted in a more “competitive”communication style in which the organizations (publicly) state to the passengers whichorganization caused the train's delay. Related to our former suggestion, the question ariseswhether the customer is interested in such communication and if such situations will alsooccur in the Belgian situation. The coordinating SNCB Holding and the independentsubsidiaries are both ambitious and aim to score points.
- It would be interesting to study the perceptions and practices in other European countriesstarting with other neighboring countries such as Germany, France, Luxembourg, and othercountries such as Switzerland and Japan (which have both a good reputation in railroadperformances/communication).
- Finally, we focused on performance communication in passengers' railway traffic. It may beinteresting to study the extent to which such communication differs with performance
237D. Gelders et al. / Government Information Quarterly 25 (2008) 221–238
communication to cargo companies, a completely different market. In this context, theAmerican railway companies are certainly useful to study.
Acknowledgments
The authors would like to thank the reviewers for their comments, and Nico de Jong for hishelp in gathering the data in the Netherlands, and for his useful comments during the analysesof the interviews.
References
Bouckaert, G. (1995). Remodeling quality and quantity in a management context. In A. Halachmi & G. Bouckaert(Ed.), Public productivity through quality and strategic management (pp. 21−38). Amsterdam: IOS Press.
Claes, M.-Th., Gerritsen, M. (2002). Culturele waarden en communicatie in internationaal perspectief [Culturalvalues and communication in an international perspective]. Bussum: Coutinho.
Epstein, M., & Roy, M. (2001). Sustainability in action: Identifying and measuring key performance drivers. LongRange Planning, 34, 585−604.
Galetzka, M., Verhoeven, J., & Pruyn, A. (2006). Service validity and service reliability of search, experience andcredence services: A scenario study. International Journal of Service Industry Management, 17, 271−283.
Garnett, J. (1992). Communicating for results in government. A strategic approach for public managers. SanFranciso: Jossey-Bass Publishers.
Gelders, D., Bouckaert, G., & Van Ruler, B. (in press). Communication management in the public sector:Consequences for public communication about policy intentions. Government Information Quarterly.
Graber, D. (2003). The power of communication. Managing information in public organizations.Washington, DC:CQPress.
Grigoroudis, E., & Siskos, Y. (2004). A survey of customer satisfaction barometers: Some results from thetransportation–communications sector. European Journal of Operational Research, 152, 334−353.
Hernon, P. (1998). The government performance and results act. Government Information Quarterly, 15,153−156.
Hofstede, G. (2001). Culture’s consequences. Comparing values, behaviours, institutions, and organizationsacross nations (2nd ed.). Thousand Oaks: Sage.
Ittner, C. D., & Larcker, D. F. (1998). Innovations in performance measurement: Trends and research implications.Journal of Management Accounting Research, 10, 205−238.
Johnson, M. D., & Fornell, C. (1991). A framework for comparing customer satisfaction across individuals andproduct categories. Journal of Economic Psychology, 12, 267−286.
Otley, D. (1999). Performance management: A framework for management control systems research.ManagementAccounting Research, 10, 363−382.
Pandey, S., & Garnett, J. (2006). Exploring public sector communication performance: Testing a model anddrawing implications. Public Administration Review, 66, 37−51.
Rubinson, J., & Pfeiffer, M. (2005). Brand key performance indicators as a force for brand equity management.Journal of Advertising Research, 187−197.
Schreurs, L. (2005).Customer satisfaction of Dutch Railways: A research approach toward the quality and objectivityof customer satisfaction scores of NS [Klanttevredenheidsonderzoek Nederlandse Spoorwegen: Een onderzoeks-matige toetsing van de kwaliteit en de onafhankelijkheid van het klanttevredenheidsonderzoek van NS].Duivendrecht: Ministry of Transportation.
Vallet, G., Perrin, A., Keller, C., & Fiesch, M. (2006). Public access to information about the services and quality ofcare in public hospitals: the need for methodologic clarity—A survey of 44 university hospital directors andadministrators. Press Médicale, 35, 388−392.

238 D. Gelders et al. / Government Information Quarterly 25 (2008) 221–238
Van de Walle, S. (2004). Perceptions of administrative performance: The key to trust in government? PhD Facultyof Social Sciences. Leuven: K.U. Leuven.
Van Dooren, W., 2006. Performance measurement in the Flemish public sector: A supply and demand approach.PhD Faculty of Social Sciences. Leuven: K.U. Leuven.
Zeithaml, V., Bitner, M. J., & Gremler, D. D. (2006). Services marketing. Integrating customer focus across thefirm (4th ed.). New York: McGraw-Hill Companies.
Zeithaml, V., Parasuraman, A., & Berry, L. (1990). Delivery quality service: Balancing customer perceptions andexpectations. London: The Free Press.