Performance Analysis of Intel Gen9.5 Integrated GPU ...
10
Performance Analysis of Intel Gen9.5 Integrated GPU Architecture Helder Duarte Abstract—CPUs have since the last years come equipped with integrated GPUs. Such coupling has the potential to offer performance improvements if said GPUs are used as accelerators. However, integrated GPUs can hardly reach the performance levels obtained with discrete GPUs due to having lower core counts. Nevertheless, their proximity to the CPU allows for sharing of data with less overhead. Furthermore, the advantages of sharing the same memory hierarchy and the lower power consumption at the cost of performance, allows for high energy efficiency gains. This thesis aims to characterize the Intel GPU micro-architecture and to benchmark its performance upper- bounds to study the limits of its energy efficiency. Through exposing the Intel GPU’s performance counters, greater insights can be gleamed about how to extract peak performance from the architecture and how to best exploit the shared memory hierarchy. I. I NTRODUCTION The emergence of General Purpose Graphics Processing Unit (GPGPU) computing followed the trend when GPUs shifted from mere fixed function accelerators limited to matrix algebra workloads, to more programmable processors capable of addressing the demand for more general purpose compu- tation to the graphics pipeline. In turn, and coupled with the increasing parallel capabilities of GPUs, the first efforts to address the GPU’s parallel performance started surging. These first attempts were set back by having to rely on graphics libraries and working with shaders, instead of abstracting and generalizing the type of data being worked with. This sparked the effort to develop programming environments targeting the GPU while allowing the programmer to abstract away from the conventional graphical programming environment. The most commonly used GPGPU computing environments in use today are Compute Unified Device Architecture (CUDA), targeting NVidia’s GPUs and OpenCL, a standard for hetero- geneous computing targeting different brands of GPU, Field Programmable Gate Arrays (FPGA) and Central Processing Unit (CPU) manufacturers. With the ability to perform general purpose computing on the massively parallel processors that are GPUs, these started to be integrated into supercomputing servers, being mainly used for scientific computing and simulation. Nevertheless, these novel workloads for GPUs started to raise concerns over power consumption, and so this became increasingly more important as time passed. By this point, manufacturers started to group GPU and CPU in the same die, opening up feasibility for heterogeneous systems. These integrated GPUs, with their proximity to the CPU hold greater energy efficiency potential than their discrete counterparts, at the expense of lower theoretical performance roofs. Notwithstanding, integrated GPUs have now taken flight and research work in their feasibility is in demand. The paper is organized as follows. Section II introduces the Intel integrated GPU architecture, focusing on the GPGPU hierarchy. In Section III, the performance counters are intro- duced. Section IV describes the developed tool that is used to read the performance counters. Section V explains the Intel GEN assembly syntax. Section VI goes into detail about the OpenCL kernels and the benchmarking of the architecture. Section VIII draws conclusions regarding the results and insights gained from the previous section. Finally, Section VII briefly describes related works. II. I NTEL I NTEGRATED GPU ARCHITECTURE The Intel Gen9.5 graphics architecture follows closely after Gen9 with a myriad of light improvements, the most notable being the switch to 14 nm process fabrication technology, providing lower power consumption than its predecessor. The architecture is divided into 3 main components, the Slice, the Unslice and the Display components (subdomains). This thesis focuses on the Slice since it is where GPGPU computations take place. The Unslice is where the 3D and Media pipelines are located, while the Display manages the transfer of pixels to the screen. The Slice contains the general purpose computation units that take care of all the calculations requested by the other pipelines and by GPGPU kernels. It is divided into Subslices, which in turn, have multiple EUs, or Execution Units that are responsible for computations. The Unslice requests use of the EUs whenever the 3D or Media pipelines require general computations to be performed. For this end, the 3D and Media pipelines send messages to the Global Thread Dispatcher to request thread initiation. It is the job of the Global Thread Dispatcher to assign requested computations to hardware threads and to allocate register space in the EUs. A. Intel GPU Slice Architecture Slices are arrangements of subslices. The GPU used in this work contains 3 subslices of 8 EUs each, totaling 24 EUs. In addition to the subslices, a slice also contains a banked L3 cache and respective Shared Local Memory [1]. The Slice general architecture is shown in Figure 1, where the subslices and EUs are also visible, as well as the L3 cache. The L3 data cache present in the GPU, not to be confused with the CPU’s L3 Cache, which is referred to as the LLC in regards to the GPU (functioning as an L4 cache, if counting 1
-
Upload
khangminh22 -
Category
Documents
-
view
0 -
download
0
Transcript of Performance Analysis of Intel Gen9.5 Integrated GPU ...

Performance Analysis of Intel Gen9.5 IntegratedGPU Architecture
Helder Duarte
Abstract—CPUs have since the last years come equippedwith integrated GPUs. Such coupling has the potential to offerperformance improvements if said GPUs are used as accelerators.However, integrated GPUs can hardly reach the performancelevels obtained with discrete GPUs due to having lower corecounts. Nevertheless, their proximity to the CPU allows forsharing of data with less overhead. Furthermore, the advantagesof sharing the same memory hierarchy and the lower powerconsumption at the cost of performance, allows for high energyefficiency gains. This thesis aims to characterize the Intel GPUmicro-architecture and to benchmark its performance upper-bounds to study the limits of its energy efficiency.
Through exposing the Intel GPU’s performance counters,greater insights can be gleamed about how to extract peakperformance from the architecture and how to best exploit theshared memory hierarchy.
I. INTRODUCTION
The emergence of General Purpose Graphics ProcessingUnit (GPGPU) computing followed the trend when GPUsshifted from mere fixed function accelerators limited to matrixalgebra workloads, to more programmable processors capableof addressing the demand for more general purpose compu-tation to the graphics pipeline. In turn, and coupled with theincreasing parallel capabilities of GPUs, the first efforts toaddress the GPU’s parallel performance started surging. Thesefirst attempts were set back by having to rely on graphicslibraries and working with shaders, instead of abstracting andgeneralizing the type of data being worked with. This sparkedthe effort to develop programming environments targetingthe GPU while allowing the programmer to abstract awayfrom the conventional graphical programming environment.The most commonly used GPGPU computing environments inuse today are Compute Unified Device Architecture (CUDA),targeting NVidia’s GPUs and OpenCL, a standard for hetero-geneous computing targeting different brands of GPU, FieldProgrammable Gate Arrays (FPGA) and Central ProcessingUnit (CPU) manufacturers.
With the ability to perform general purpose computing onthe massively parallel processors that are GPUs, these startedto be integrated into supercomputing servers, being mainlyused for scientific computing and simulation. Nevertheless,these novel workloads for GPUs started to raise concerns overpower consumption, and so this became increasingly moreimportant as time passed.
By this point, manufacturers started to group GPU andCPU in the same die, opening up feasibility for heterogeneoussystems. These integrated GPUs, with their proximity to theCPU hold greater energy efficiency potential than their discrete
counterparts, at the expense of lower theoretical performanceroofs. Notwithstanding, integrated GPUs have now taken flightand research work in their feasibility is in demand.
The paper is organized as follows. Section II introduces theIntel integrated GPU architecture, focusing on the GPGPUhierarchy. In Section III, the performance counters are intro-duced. Section IV describes the developed tool that is used toread the performance counters. Section V explains the IntelGEN assembly syntax. Section VI goes into detail about theOpenCL kernels and the benchmarking of the architecture.Section VIII draws conclusions regarding the results andinsights gained from the previous section. Finally, Section VIIbriefly describes related works.
II. INTEL INTEGRATED GPU ARCHITECTURE
The Intel Gen9.5 graphics architecture follows closely afterGen9 with a myriad of light improvements, the most notablebeing the switch to 14 nm process fabrication technology,providing lower power consumption than its predecessor. Thearchitecture is divided into 3 main components, the Slice, theUnslice and the Display components (subdomains). This thesisfocuses on the Slice since it is where GPGPU computationstake place. The Unslice is where the 3D and Media pipelinesare located, while the Display manages the transfer of pixelsto the screen.
The Slice contains the general purpose computation unitsthat take care of all the calculations requested by the otherpipelines and by GPGPU kernels. It is divided into Subslices,which in turn, have multiple EUs, or Execution Units thatare responsible for computations. The Unslice requests useof the EUs whenever the 3D or Media pipelines requiregeneral computations to be performed. For this end, the 3Dand Media pipelines send messages to the Global ThreadDispatcher to request thread initiation. It is the job of theGlobal Thread Dispatcher to assign requested computationsto hardware threads and to allocate register space in the EUs.
A. Intel GPU Slice Architecture
Slices are arrangements of subslices. The GPU used in thiswork contains 3 subslices of 8 EUs each, totaling 24 EUs.In addition to the subslices, a slice also contains a bankedL3 cache and respective Shared Local Memory [1]. The Slicegeneral architecture is shown in Figure 1, where the subslicesand EUs are also visible, as well as the L3 cache.
The L3 data cache present in the GPU, not to be confusedwith the CPU’s L3 Cache, which is referred to as the LLC inregards to the GPU (functioning as an L4 cache, if counting
1

Fig. 1: Architectural overview of the Slice [1]. Fig. 2: Architectural overview of the Execution Unit [1].
with the Sampler caches), has a capacity of 768 KB per slice,with cachelines of 64 B. Each subslice has its own L3 partition,and these partitions are aggregated together and function as asingle cache for the slice. For configurations with a highernumber of slices, all the L3 partitions of each subslice in eachslice are also aggregated together to form a unique, GPU wideL3 cache. All Samplers and Data Port units have their ownindividual interface to the L3 cache, capable of supportingread and write bandwidths of 64 B per cycle. Thus, this islinearly expanded by the amount of subslices in the GPU. Fora GPU with 3 subslices in a single slice, as is the case, the totaltheoretical bandwidth is 64 B/cy × 3 Subslices = 192 B/cy.However, not all workloads will be able to reach this upper-bound, for which careful partitioning of the problem sizethroughout the slices is required. Data to and from the L3can only be transferred in 64 B wide packets, i.e., a cacheline.Therefore a read instruction from a thread in a EU of a singleprecision floating point value (4 B) always translates into a64 B data traffic. The OpenCL JIT compiler is known tooptimize this procedure, grouping data fetches to avoid wastedbandwidth [1].
The SLM is situated in the L3 cache and serves as aprogrammer managed scratchpad memory for sharing dataacross different EUs located in the same subslice. Thereare many workloads that take advantage of sharing of databetween threads, namely 2D image processing and FDTDcomputation (in essence any workload that is not massivelyparallel and exhibits constraints at the border). Each subslicehas access to 64 KB of SLM. As SLM resides in the L3,access times do not benefit from lower latency. However, dueto it being more highly banked, it allows full throughput evenfor access patterns that are not 64 B aligned or for data notcontiguously adjacent in memory. Contrary to the L3 cache,SLM is not coherent with other memory structures.
B. Intel GPU Sublice Architecture
A subslice aggregates a number of EUs which are responsi-ble for computations. As previously mentioned, the subslices
contain 8 EUS in the GPU used in this work. Besides the EUs,a subslice is composed of a Local Thread Dispatcher (LTD),an Instruction Cache, the Data Port unit and a Sampler unit.Their general architecture is shown in Figure 1, where a slicewith 3 subslices is shown.
The LTD is responsible for sharing the workload throughoutthe EUs in the subslice. It works in tandem with the GTDlocated in the Unslice in order to provide optimal threadcoverage. The LTD does not communicate with the GTD. Asa result, the LTD attempts to assure a uniform distribution ofthe threads given by the GTD to the EUs.
The Sampler is composed of L1 and L2 read-only cachesand it is used solely for texture and image surfaces, there-fore not being exposed by common GPGPU frameworks. Italso provides fixed function hardware for conversion betweenaddress and image coordinates, various clamping modes com-monly seen in image processing algorithms, such as mirror,wrap, border and clamp, as well as sampling filtering modessuch as point, bilinear, trilinear and anisotropic. There opera-tions are not commonly used in GPGPU, thus they are reservedfor 3D workloads. The Sampler supports a read throughputfrom the L3 cache of 64 B per cycle.
The Data Port unit is connected to the L3 fabric in theslice and it is responsible for serving memory load and storerequest. It supports read and write throughputs of 64 B percycle. Hence, all memory requests from the EUs have to passthrough the Data Port unit [1].
C. Intel GPu Execution Unit Architecture
The EUs are composed of a register file of 128 generalpurpose 256 bit registers per thread. These compose theGeneral Register File (GRF). A set of architecture-specificregisters are also present in each EU, called the ArchitecturalRegister File (ARF). These registers mainly serve for resourcemanagement such as keeping track of the instruction pointerper thread and managing dependencies. They are mainly usedby the hardware and driver. Each EU contains four distinctfunctional units: the Send unit, the Branch unit and two
2
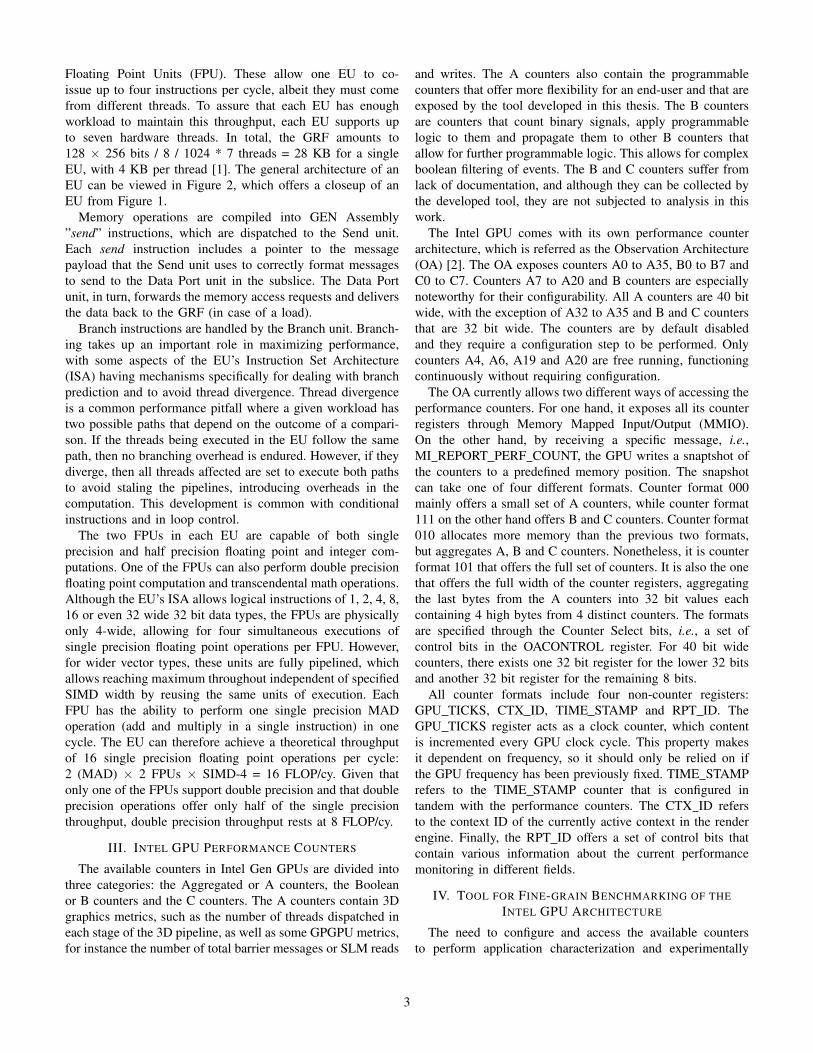
Floating Point Units (FPU). These allow one EU to co-issue up to four instructions per cycle, albeit they must comefrom different threads. To assure that each EU has enoughworkload to maintain this throughput, each EU supports upto seven hardware threads. In total, the GRF amounts to128 × 256 bits / 8 / 1024 * 7 threads = 28 KB for a singleEU, with 4 KB per thread [1]. The general architecture of anEU can be viewed in Figure 2, which offers a closeup of anEU from Figure 1.
Memory operations are compiled into GEN Assembly”send” instructions, which are dispatched to the Send unit.Each send instruction includes a pointer to the messagepayload that the Send unit uses to correctly format messagesto send to the Data Port unit in the subslice. The Data Portunit, in turn, forwards the memory access requests and deliversthe data back to the GRF (in case of a load).
Branch instructions are handled by the Branch unit. Branch-ing takes up an important role in maximizing performance,with some aspects of the EU’s Instruction Set Architecture(ISA) having mechanisms specifically for dealing with branchprediction and to avoid thread divergence. Thread divergenceis a common performance pitfall where a given workload hastwo possible paths that depend on the outcome of a compari-son. If the threads being executed in the EU follow the samepath, then no branching overhead is endured. However, if theydiverge, then all threads affected are set to execute both pathsto avoid staling the pipelines, introducing overheads in thecomputation. This development is common with conditionalinstructions and in loop control.
The two FPUs in each EU are capable of both singleprecision and half precision floating point and integer com-putations. One of the FPUs can also perform double precisionfloating point computation and transcendental math operations.Although the EU’s ISA allows logical instructions of 1, 2, 4, 8,16 or even 32 wide 32 bit data types, the FPUs are physicallyonly 4-wide, allowing for four simultaneous executions ofsingle precision floating point operations per FPU. However,for wider vector types, these units are fully pipelined, whichallows reaching maximum throughout independent of specifiedSIMD width by reusing the same units of execution. EachFPU has the ability to perform one single precision MADoperation (add and multiply in a single instruction) in onecycle. The EU can therefore achieve a theoretical throughputof 16 single precision floating point operations per cycle:2 (MAD) × 2 FPUs × SIMD-4 = 16 FLOP/cy. Given thatonly one of the FPUs support double precision and that doubleprecision operations offer only half of the single precisionthroughput, double precision throughput rests at 8 FLOP/cy.
III. INTEL GPU PERFORMANCE COUNTERS
The available counters in Intel Gen GPUs are divided intothree categories: the Aggregated or A counters, the Booleanor B counters and the C counters. The A counters contain 3Dgraphics metrics, such as the number of threads dispatched ineach stage of the 3D pipeline, as well as some GPGPU metrics,for instance the number of total barrier messages or SLM reads
and writes. The A counters also contain the programmablecounters that offer more flexibility for an end-user and that areexposed by the tool developed in this thesis. The B countersare counters that count binary signals, apply programmablelogic to them and propagate them to other B counters thatallow for further programmable logic. This allows for complexboolean filtering of events. The B and C counters suffer fromlack of documentation, and although they can be collected bythe developed tool, they are not subjected to analysis in thiswork.
The Intel GPU comes with its own performance counterarchitecture, which is referred as the Observation Architecture(OA) [2]. The OA exposes counters A0 to A35, B0 to B7 andC0 to C7. Counters A7 to A20 and B counters are especiallynoteworthy for their configurability. All A counters are 40 bitwide, with the exception of A32 to A35 and B and C countersthat are 32 bit wide. The counters are by default disabledand they require a configuration step to be performed. Onlycounters A4, A6, A19 and A20 are free running, functioningcontinuously without requiring configuration.
The OA currently allows two different ways of accessing theperformance counters. For one hand, it exposes all its counterregisters through Memory Mapped Input/Output (MMIO).On the other hand, by receiving a specific message, i.e.,MI REPORT PERF COUNT, the GPU writes a snaptshot ofthe counters to a predefined memory position. The snapshotcan take one of four different formats. Counter format 000mainly offers a small set of A counters, while counter format111 on the other hand offers B and C counters. Counter format010 allocates more memory than the previous two formats,but aggregates A, B and C counters. Nonetheless, it is counterformat 101 that offers the full set of counters. It is also the onethat offers the full width of the counter registers, aggregatingthe last bytes from the A counters into 32 bit values eachcontaining 4 high bytes from 4 distinct counters. The formatsare specified through the Counter Select bits, i.e., a set ofcontrol bits in the OACONTROL register. For 40 bit widecounters, there exists one 32 bit register for the lower 32 bitsand another 32 bit register for the remaining 8 bits.
All counter formats include four non-counter registers:GPU TICKS, CTX ID, TIME STAMP and RPT ID. TheGPU TICKS register acts as a clock counter, which contentis incremented every GPU clock cycle. This property makesit dependent on frequency, so it should only be relied on ifthe GPU frequency has been previously fixed. TIME STAMPrefers to the TIME STAMP counter that is configured intandem with the performance counters. The CTX ID refersto the context ID of the currently active context in the renderengine. Finally, the RPT ID offers a set of control bits thatcontain various information about the current performancemonitoring in different fields.
IV. TOOL FOR FINE-GRAIN BENCHMARKING OF THEINTEL GPU ARCHITECTURE
The need to configure and access the available countersto perform application characterization and experimentally
3

evaluate the upper-bound capabilities of an Intel integratedGPU architecture, led to the development of a tool with theintent of aggregating the launching of a set of specificallydeveloped OpenCL benchmarks and the configuration andreading of the counters. The developed tool relies on a setof API structures inherited from Intel GPU Tools [3] in orderto provide th elow-level access to the necessary registers toconfigure the counters through MMIO and sending commandsto the GPU using the Message Interface. The tool also makesuse of PAPI to acquire energy consumption (and consequentlypower) through the RAPL interface.
Although the tool is developed mainly for the Gen9.5 micro-architecture, given the similarities across different Intel GenGPU architectures, in particular Gen9.5 and Gen9, the tool ex-poses counter acquisition framework, which is general enoughto be used even for different Intel GPU micro-architectures.Furthermore, future micro-architectures can be supported ifno significant changes to the counter configuration are made.A common trope of subsequent micro-architectures is thechanging of register addresses, which can be solved withpatches that update the hard coded register addresses to makethe tool compatible.
A set of OpenCL kernels come integrated with the tool.These kernels are divided in groups according to what micro-architectural aspect of the GPU they aim to exploit. They canbe used for evaluation of floating point performance, memorybandwidth or power/energy consumption upper-bounds for agiven Intel GPU architecture. The tool’s general layout ispresented in Figure 3. It starts by parsing the arguments anddecoding the type of kernel to run. The type of kernel isimportant for memory initialization and correct argument setupfor the launching of the OpenCL kernel. Subsequently, as isthe case for all OpenCL applications, device and platformidentification takes place, as well as the compilation of thekernel itself.
Kernel parameters such as SIMD length and floating pointprecision are taken directly from the kernel’s name. In orderto correctly identify kernel parameters, memory allocatedvariable names are given a high degree of verbosity, as can beseen in Algorithm 1, which indicates the process of memoryinitialization. The greater verbosity facilitates debugging. Thesame treatment is done to GPU buffer creation. For a givenmemory region to be available to the GPU using OpenCLwithout using shared virtual memory space, one has to createand write buffer objects using the API calls clCreateBuffer()and clEnqueueWriteBuffer(), respectively. These API calls arecommon in every OpenCL application, as is clSetKernelArg()to specify the kernel arguments.
The OpenCL preliminary code, i.e., device and platformidentification, context creation and kernel compilation, isdone via the API calls clGetPlatformIDs(), clGetDeviceIDs(),clCreateContext() and either clCreateProgramWithBinary() orclCreateProgramWithSource(), depending on which is avail-able, the source or the pre-compiled binaries.These are essen-tial for every OpenCL application and denote the commonworkflow of building OpenCL programs.
Algorithm 1 Memory initialization.
1: if scalar ∈ kernel name ∧ sp ∈ kernel name then2: allocate scalar sp A3: allocate scalar sp B4: else if vect2 ∈ kernel name∧ sp ∈ kernel name then5: allocate vect2 sp A6: allocate vect2 sp B7: else if vect4 ∈ kernel name∧ sp ∈ kernel name then8: (...)9: end if
One of the arguments to the tool selects counter accessprocedure. There are two distinct access types, the mmioand the rpc type. The RPC type makes use of sending anMI REPORT PERF COUNT message to the GPU to instructit to write the counters in a previously allocated memory bufferaccessible by both the GPU and the CPU. The other methodemploys the use of Intel GPU Tools’ MMIO API to read theregisters of the counters through MMIO. Regardless of theaccess type, the Intel GPU Tools’ MMIO API is still neededto write to the specific registers pertaining to the counterconfiguration. The option to select the type of counter accessmode delivers flexibility to the end-user. The rpc method ismore direct in that it communicates with the graphics driver,while mmio interacts with an API before reaching the driver.No performance impacted overheads were detected with eitheraccess method.
The process of sending a message to the GPU is handled bythe driver, and Intel GPU Tools provides an interface for easymessage submission. The following are C macros provided byIntel GPU Tools to send messages to the GPU:
• BEGIN BATCH• OUT BATCH• OUT RELOC• ADVANCE BATCH
BEGIN BATCH sets up a batch (allocates a structure),while OUT BATCH sends a double word into the batch.OUT RELOC sends relocations into the batch, a necessaryprocedure for batches to be submitted to the validationlist, which is a list of buffer objects kept by the driver.ADVANCE BATCH issues the message created in thebatch by the previous macros into the GPU, completingthe command submission sequence. The issue of anMI REPORT PERF COUNT message entails the codein Listing 1. Of note is the creation of a batch withthree double words and one relocation. One of the doublewords required is the actual message ID of the messageto be sent. Intel GPU Tools provides a list of macroswith most of the available messages. There exist twodifferent message IDs for MI REPORT PERF COUNT,the GEN6 MI REPORT PERF COUNT andGEN8 MI REPORT PERF COUNT. Caution is advisedto issue the one corresponding to the architecturein play. For Gen8 and subsequent architectures,
4

Argumentlist
Allocationmemorybuffers
OpenCL platformand device
identification
If MMIO
If RPC Configure Counters throughMI_REPORT_PERF_COUNT
and setup PAPI
Configure Counters throughMMIO and setup PAPI
Read countersstart PAPI
Runkernel
Read countersstop PAPI
Calculate mediansfor power
Read and dumpcounters to file
Start
End
Fig. 3: Developed tool general layout.
GEN8 MI REPORT PERF COUNT is used, whileGEN6 MI REPORT PERF COUNT is used forprevious architectures that support the OA unit. Thefirst OUT BATCH contains the message ID of anMI REPORT PERF COUNT message in the form ofthe macro GEN8 MI REPORT PERF COUNT. TheOUT RELLOC call specifies the target buffer and theread and write domains. These are information pertainingto the driver and go out of scope of this thesis. The lastOUT BATCH takes as argument a pointer to the memorylocation where the counters will be written to. Finally,ADVANCE BATCH terminates the command submissionand sends the batch with the message to the GPU.
Listing 1: Submission of MI REPORT PERF COUNT.BEGIN BATCH( 3 , 1 ) ;OUT BATCH(GEN8 MI REPORT PERF COUNT ) ;OUT RELLOC( ds t bo ,
I915 GEM DOMAIN INSTRUCTION ,I915 GEM DOMAIN INSTRUCTION , d s t o f f s e t ) ;OUT BATCH( r e p o r t i d ) ;ADVANCE BATCH ( ) ;
The MMIO API used by Intel GPU Tools exploits theaperture in the graphics card’s onboard memory. This has beenbeen mapped via a Base Address Register (BAR) to allowdirect access from the CPU. The BAR can be retrieved viathe PCI configuration space. The PCI configuration space isa set of registers that are mapped to memory locations, i.e.,a certain set of memory addresses are used to access theseregisters via the CPU. The GPU is regarded as a PCI device,so it has its own place in the PCI configuration space. PCIdevices are addressed via Bus, Device and Function, knownas the BDF or B/D/F. The Intel Integrated GPU is typicallylocated in bus 0, device 2, function 0. By reading the PCIconfiguration space of BDF 0:2.0, one can retrieve the BARthat is to be added to the GPU’s MMIO registers’ addressesin order to access them.
The next step resides in the actual readings and kernellaunch. The counters are read before and after the launchingof the kernel. The difference between the two readings givesthe correct values for the kernel. If the kernel is a powermeasurement kernel and the argument ”–power-smoothing” isreceived, the tool will repeat this procedure a certain numberof times to allow the power readings to stabilize. For kernelsother than the power ones, this process would be necessaryfor the power readings to be trustworthy, for RAPL onlyupdates every 50 ms [4]. This process repeats the kernel launchuntil the total time of kernel computation surpasses than 50ms, in order to provide correct power values. However, thisprocedure is not necessary for power kernels since these havebeen coded specifically to take enough time to have severalRAPL increments. The feasibility of this option relates to thefact that power readings are sensible and prone to noise, soby relaunching the kernels several times and calculating themedian of all the readings eliminates noise and offers morerepeatable results.
The final process rests with the reporting of the countervalues, power, and various useful timing data. Timing datacan be used to identify faulty kernel launches and errors inthe power readings. Several timing sources are used due tothe different clock domains where readings are being done.The counters themselves adheres to the GPU clock frequencywhile the power readings are done in the CPU side.
V. INTEL GEN ASSEMBLY
In order to fully grasp what was being executed on theGPU, it was necessary to decode the exact instructions pro-duced by the OpenCL JIT compiler. The Eclipse plugin fromIntel OpenCL SDK allowed the visualization of the OpenCLkernels’ GEN Assembly.
The ISA of the Execution Units differ greatly from theCPU’s x86 ISA. A GEN instruction follows the form[(pred)] opcode (exec-size | exec-offset) dst src0 [src1] [src2]where pred reports the Predicate Enable bits of the instruction;exec-size corresponds to the SIMD width of the instruction,
5

r1.0
Registers
Bytes
r0r1r2r3r4r5r6 r7r8r9
031
256 bits
r0.0
r2.0
:b:w:dw
Region 1Region 2
Fig. 4: Register File layout.
i.e., the number of data elements processed by the instruc-tion, which are called channels; , exec-offset to the ChannelSelect bits of the instruction that, together with the PredicateEnable bits, possess key roles in lowering branch predictionoverheads; dst to the destination operand and src{0-2} to thesource operands. Sources 1 and 2 are optional. The channelselect bits select which channels are active when reading theARF, while the predicate bits enables or disables specificchannels in a single instruction. Together they are used todisable channels functioning as a commit stage by not allowingspecific channels to write their results to the GRF. This ismostly used when the effective data width is less than that ofthe functional units (available FPUs are 4-way SIMD) or asa branch control mechanism, disabling channels that divergefrom the rest of the workflow.
Source and destination operands conform to a register regionsyntax that follows the form:
RegNum . SubRegNum < VertStride; Width, HorzStride > :typewhere RegNum correspond to the region number, SubRegNumto the subregion number, VertStride to the vertical stride,which is the distance between two rows, in units of the datatype, Width to the width, that corresponds to the number ofunits of the data type to be fetched per row, HorzStride tothe horizontal stride, which is the distance between units ofthe data type in the same row, and type to the data type. Theregion and subregion numbers together define the origin ofthe data, while data type will provide the size of each unit ofdata. Figure 4 contains the general layout of the GRF. In thetop rigt corner of the image there are expressed the possiblesubregion distributions according to the data type. For a byte(:b) data type, a subregion is one byte wide, for a word datatype (:w) , a subregion is 2 bytes wide, for a double word(:dw) or float data type (:f) a subregion is 4 bytes wide. Thissubregion dependency on the data type offers a high degreeof flexibility in register addressing. The rest of the figureprovides two full examples of register addressing via regions1 and 2. Region 1 is obtained via the following addressing:r5.1<16;8,2>:w . The region number is 5, meaning addressing
starts in register 5. The type being word means the addressingunit is 2 bytes, therefore, subregion 0 corresponds to the 0thand first bytes, subregion 1 to the second and third bytes,and so on. An horizontal stride of 2 means to target everysecond unit in the register. A width of 8 means 8 units ina row, and a vertical stride of 16 will make the addressingfetch the second row, reaching into r6, for the subregion thatis 16 units apart from the first subregion will be in the nextrow. The second example, region 2, comes from the followingregister addressing: r8.0<1;8,2>:w . By following the samelogic as in region 1, with the region number being 8 andsubregion number being 0, addressing starts in register 8 inth every first unit. Units are words, therefore, the first twobytes of the register compose subregion 0. With the horizontalstride being 2, every second unit will be fetched, up until 8,the width. The vertical stride being 1, which is less that thehorizontal stride, means that, unlike the first example, wherethe rows were spaced 16 units, so the fetch spilled into thenext register, in this example the fetched units will be theinterleaved units not yet touched in the same row, since thesubregion 1 unit apart from the i-th subregion will be subregion(i+1)-th, which stands on the same row. The register addressingis, therefore, extremely flexible, allowing for complex datafetching patterns.
VI. MICRO-BENCHMARKS AND EXPERIMENTALEVALUATION
The micro-benchmarks consist of simple OpenCL kernelsdesigned to fully exploit the capabilities of the architecture. Inorder to do so, and taking into account its SIMD capabilities,each benchmark has five different versions explicitly specify-ing the SIMD data type being exercised. These versions arescalar, vect2, vect4, vect8 and vect16. There are also versionsfor each operation available, i.e., ADD, SUB, MUL, DIV andMAD. With a total of 5 SIMD types and 5 operations eachkernel has 5 × 5 = 25 versions.
All benchmarks were run on the same platform, an IntelCore i7-7500U with 8 GB DDR4 DRAM. The CPU is madeup of 2 cores and 4 threads through hyperthreading, and has a
6

stock frequency of 2.7 GHz. To run the results the hardwareprefetch, hyperthreading and turbo boost were turned off, andthe GPU frequency set to 1050 MHz. These are summarizedin Tables I and II.
TABLE I: iGPU hardware features.
Features HD Graphics 620
EUs 24Threads / EU 7
SIMD FPU / EU 2Max Frequency 1050 MHz
Slices 1Subslices 3L3 Cache 768 KB
L3 Cacheline 64 BSLM / Subslice 64 KB
TABLE II: CPU hardware features.
Features i7-7500U (KBL)
Cores 2Threads 4
Max Frequency 3.50 GHzL1 Data Cache 32 KB
L2 Cache 256 KBL3 Cache 4 MB
Cacheline (all levels) 64 BDRAM 8192 MB
The FPU benchmark kernels are divided into 4 types:single instruction, loop, loop with unroll and loop with privatememory. The single instruction kernels are mostly used toobserve overheads and to debug OpenCL related events. Theloop and loop with unroll were the first attempts at achievinghigh performance. The loop with unroll variant differs from theloop one by having an explicit unrolling of 64 instructions. Theautomatic unrolling employed by the OpenCL JIT compilervaries in depth across SIMD lengths, raging from 32, 64 and128. The loop with private memory achieves the best per-formance out of all FLOP type kernels. Contrary to the othertypes, the use of private memory, i.e., GRF, minimizes not onlythe memory operations but also the data packing/unpackingand address calculation, allowing for higher throughput ofcompute instructions and reducing the impact of memorylatency.
The peak floating point performance of the architecture,given its characteristics presented earlier in Table I, can becalculated via the following equation,
FPmax = EU × FPU/EU × FLOP/cycle/FPU × f, (1)
where EU stands for the total number of EUs (24 for thecurrent configuration), FPU/EU stands for the number of FPUunits in each EU (2 in this case), FLOP/cycle/FPU standsfor the floating point operations per cycle per FPU, whichis reported to be 4 [1] and f to the operating frequency inHertz (1050 MHz), which amounts to 201.6 GFLOP/s fornormal floating point operations. For MAD operations, thisis two-fold given the architecture’s ability to execute a MADoperation in one cycle, corresponding to 403.6 GFLOP/s.
0
50
100
150
200
250
300
350
400
1 4 16 64 256 1024 4096
SP
DP
Perfo
rman
ce [G
FLO
P/s]
Number of Work Groups
SIMD Comparison - MAD SP+DP (Priv 8192 kernel)
scalar
vect2
vect4
vect8
vect16
Fig. 5: Performance comparison of the mad operation acrossdifferent SIMD data types.
As can be seen in Figure 5, the usage of SIMD data typeshas an impact in the overall performance, although their impactis lessened as the number of work groups rises, converging to98% of the maximum theoretical performance for the kernelswith private memory. Their impact is therefore only perceivedwith a low number of threads.
EU
EU
EU
EU
EU
EU
EU
EU
Sampler DataPort
Subslice
EU
EU
EU
EU
EU
EU
EU
EU
Sampler DataPort
Subslice
EU
EU
EU
EU
EU
EU
EU
EU
Sampler DataPort
Subslice
Slice
WG WG WG
Fig. 6: Work group to subslice matching with the number ofwork groups being a multiple of 3.
EU
EU
EU
EU
EU
EU
EU
EU
Sampler DataPort
Subslice
EU
EU
EU
EU
EU
EU
EU
EU
Sampler DataPort
Subslice
EU
EU
EU
EU
EU
EU
EU
EU
Sampler DataPort
Subslice
Slice
WG WG WGWG
Fig. 7: Work group to subslice matching with the number ofwork groups not being a multiple of 3.
Memory benchmarks are constructed much the same wayas the FLOP benchmarks, only lacking the compute operation.Contrary to what is observed in the FLOP benchmarks, theSIMD data types heavily influence the attainable bandwidthfor the memory kernels. Figure 8 shows the bandwidth ob-
7

tained with the various SIMD data types. Due to overheadsin the address calculation and data packing/unpacking, higherSIMD data types such as vect16 and vect8 fail to deliveracceptable performance, with vect16 falling behind scalar. Thebest performant of the SIMD data types is vect4 reaching closeto the theoretical maximum bandwidth.
0
50
100
150
200
1 4 16 64 256 1024 4096
Band
wid
th [G
B/s]
Number of Work Groups
Vector Comparison - Bandwidth
scalar
vect2
vect4
vect8
vect16
Fig. 8: Attainable bandwidth with the standard memory kernelfor different SIMD lengths.
The same serrated effect perceived in the flop kernels arevisible in the bandwidth curves. The peaks occur at work groupsizes multiples of the number of subslices.
Power measuring in the tool is supported through PAPI,the Performance API. PAPI is used to read the RAPL systemregisters. RAPL is a system implemented in recent Intelprocessor architectures to provide energy readings. RAPL doesnot directly measure energy consumption, instead it supportsa predictive model that outputs energy consumption based onother activity metrics collected internally [5].
RAPL allows reading energy consumption from threeplanes: Package, Power Plane 0 (PP0) and DRAM. ThePackage plane corresponds to the entire processor and includesPP0 and DRAM. PP0 corresponds to the cores. Measures forthe iGPU were calculated from the other planes using thefollowing equation:
PiGPU = PPKG − PPP0 − PDRAM . (2)
The power kernels mainly consist of modified FLOP ker-nels. They have an inner loop that makes up the workload, andan outer loop that functions as a coarse way of maintainingsimilar execution times between SIMD lengths. The outer loopis required to provide enough execution time for an update ofthe RAPL counters. In order to better control the durationof the kernels, the number of iterations of the outer loop isdependent on the SIMD length. With the rise of the SIMDlength, there comes associated a rise of the data set size,which corresponds to a rise in the execution time for the samenumber of total threads. By lowering the outer loop iterationsin accordance to the SIMD length, the execution time remainsroughly independent of the SIMD length.
As mentioned previously, the power benchmarks have aperformance curve similar to the FPU benchmarks, due tothe similarities between their algorithms. This same trend is
0
5
10
15
20
1 2 4 8 16 32
Powe
r [W
]
Number of Work Groups
Power Comparison - SP MAD
scalar
vect2
vect4
vect8
vect16
Fig. 9: Comparison of the different timers available.
noticed in the power curves, with maximum power beingdisplayed for work groups of a size multiple of the numberof subslices. Figure 9 illustrates this phenomenon. Accordingto Figures 10 and 10, vect2 is the most power hungry SIMDlength, with vect4 drawing the least amount of power. Forsingle precision, the difference in power across the differentSIMD lengths is less pronounced than for double precision,even though they share the same tendencies.
11
11
11
12
12
12
scalar vect2 vect4 vect8 vect16
Powe
r [W
]
Number of Work Groups
Power - MAD SP (Power kernel)
11.477 11.496
11.408 11.419 11.441
Fig. 10: Maximum power values achieved by the differentSIMD lengths for single precision.
11
11
11
12
12
12
scalar vect2 vect4 vect8 vect16
Powe
r [W
]
Number of Work Groups
Power - MAD DP (Power kernel)
11.593
11.83111.761
11.68511.734
Fig. 11: Maximum power values achieved by the differentSIMD lengths for double precision.
Proper use of the GPU as an accelerator rely not only onthe performance gains of offloading computation to the GPU,but on energy efficiency as well. This becomes increasingly
8

important on battery powered platforms such as smartphones.Thus, if a workload does not benefit of a reduction in com-putation time when offloaded to the GPU, but of a powersavings instead, then the offloading is viable for the purposeof preserving battery power. In this regard, a study on thedifferent SIMD data types’ energy efficiency was conducted.
Folowing after the performance and power analyses, theenergy efficiency curves retain the serrated curve. For lowwork group usage, vect16 demonstrates the highest energyefficiency only due to the higher number of computationsperformed. When the GPU is fully exercised, Figures 13 and14 show the other SIMD lengths reaching higher efficiencythan vect16. As with power and performance, the highestefficiency occurs at work group numbers multiple of thenumber of subslices.
Figure 12 shows the maximum energy efficiency attainedby each SIMD length. vect4 achieves the highest energyefficiency, which is expected due to the FPUs physically being4-wide. vect16, on the other hand, possesses the least energyefficiency of the SIMD data types, followed by vect2.
When compared to CPU, the GPU achieves far higherenergy efficiency values.
0
10
20
30
40
50
1 2 4 8 16 32
SP
DP
Ener
gy E
ffici
ency
[GFL
OPS
/W]
Number of Work Groups
Energy Efficiency - MAD SP+DP (Power kernel)
scalar
vect2
vect4
vect8
vect16
Fig. 12: Energy efficiency of the different SIMD data typesunder the operation mad.
34
34
35
36
36
scalar vect2 vect4 vect8 vect16
Perfo
rman
ce [G
FLO
P/s]
Number of Work Groups
Energy Efficiency - MAD SP (Priv kernel)
34.881
34.718
35.285
35.076
34.585
Fig. 13: Energy efficiency of the different SIMD data typesunder the operation mad for single precision.
VII. RELATED WORK
Research works on integrated GPUs are very scarse, andthey have been highly in favor of exploring the micro-
8
9
10
scalar vect2 vect4 vect8 vect16
Ener
gy E
ffici
ency
[GFL
OPS
/W]
Number of Work Groups
Energy Efficiency - MAD DP (Power kernel)
9.045
8.775 8.835 8.841
8.513
Fig. 14: Energy efficiency of the different SIMD data typesunder the operation mad for double precision.
architectures and developing models or simulators, as pre-sented in [6]. Other studies, such as [7] and [8], adopt machinelearning techniques to estimate performance and propose suchmodels as a high level substitute for lengthy architecturalsimulators, laying claim to the speed of the prediction. Fast andaccurate predictions are paramount during the design phase forarchitects, a fact that sparks interest in the research of suchmodels.
There have been some efforts in parallelizing specific sort-ing algorithms thought to take advantage of the parallelizationpotential of GPUs. These tend to be harder to implement thantheir CPU counterparts due to constraints on data sharing inGPUs. However, there have been success cases in achievingbetter performance than the CPU algorithms. One study inparticular, [9], makes use of the locality of the integratedGPU, i.e. being on the same die as the processor and nothaving to go through PICe interfaces to move the data betweenCPU and GPU, to avoid the higher latencies involved whenaccelerating problems using discrete GPUs. This techniquehas major weight in the usefulness of integrated GPUs versusdiscrete GPUs, as is discussed in [10].
Another type of research interest lies in the CPU and GPUcollaboration and the heterogeneity of such systems. In [11],the difference in memory access patterns between CPU andGPU is shown, proposing that top level caches (L1 and L2)have a lessened impact in maximizing performance in GPUworkloads, contrasting with the CPU, where the presence ofa cache hierarchy is critical for performance. This happensdue to the highly bursty nature of GPU memory accesses andlow data reuse, benefiting more from a highly banked memorysystem than a latency hiding cache hierarchy.
There are few works that directly target Intel integratedGPUs. Of mention is the work proposed in [12], that evaluatesthe performance of work-group broadcast in Intel’s iGPUs.Being a very architecture dependent workload, the broadcastimplementation suffers from slight variations on work-groupsize.
These works tend to rely in state of the art simulators to testnew algorithms or to micro-benchmark a given architecture.Works that study integrated GPUs and use real hardware are
9

surprisingly quite rare. Hence, the research work condictedin this thesis aims to bridge the gap between the existingliterature in discrete GPUs and the lessened amount of researchwork in integrated GPUs and by performing extensive perfor-mance evaluation and benchmark real hardware (as opposedto using simulators).
VIII. CONCLUSIONS
In order to evaluate the benefits of integrated GPUs along-side the better performant discrete GPUs, a micro-architecturalcharacterization was performed on the Intel Gen GPU ar-chitecture in this thesis. Furthermore, the development of asoftware tool capable of exposing the GPU’s performancecounters was conducted. This work laid the foundation foran in-depth benchmarking aiming to exploit the architecture’supper-bounds. In turn, a study that hinged on performance andenergy efficiency gleamed several insights in how to employthe GPU in energy efficient domains. From the other side ofthe spectrum, ways to efficiently program performance criticalworkloads on integrated GPUs arose.
The main contribution of this thesis are the tool that canbe used to aid further research and the insights broughtby the performance and energy efficiency analysis. The 35GFLOPS/W of the Intel GPU surpasses that of the CPU andrivals current discrete GPUs. The experimental results openthe door to further research in better workload distribution inheterogeneous systems in order to maximize energy efficiency.
Future work falls on performing energy efficiency analysesfor other integrated GPUs and of energy aware schedulingin heterogeneous systems. By knowing beforehand the mostenergy efficient SIMD data type, compilers can gain a newdimension besides performance and executable space in whichto explore. New models can be proposed that offer a biggerfocus in energy aware computing.
REFERENCES
[1] S. Junkins, The Compute Architecture of Intel ProcessorGraphics Gen9. Intel, August 2015.
[2] Intel, Intel Open Source HD Graphics and Intel IrisPlus Graphics Programmer’s Reference Manual, January2017.
[3] “Intel GPU Tools.”[4] Intel, Intel 64 and IA-32 Architectures Software Devel-
oper’s Manual, October 2017.[5] S. Pandruvada, “Running Average Power Limit – RAPL
— 01.org,” 2014.[6] P. Gera, H. Kim, H. Kim, S. Hong, V. George, and C.-k.
C. K. Luk, “Performance Characterisation and Simula-tion of Intel’s Integrated GPU Architecture,” pp. 139–148, 2018.
[7] G. Lupescu, E. I. Slusanschi, and N. Tapus, “HALWPE:Hardware-Assisted Light Weight Performance Estima-tion for GPUs,” Proceedings of the International Con-ference on Parallel Processing Workshops, pp. 39–44,2017.
[8] G. Wu, J. L. Greathouse, A. Lyashevsky, N. Jayasena,and D. Chiou, “GPGPU performance and power esti-mation using machine learning,” 2015 IEEE 21st In-ternational Symposium on High Performance ComputerArchitecture (HPCA), pp. 564–576, 2015.
[9] G. Lupescu, E. I. Slusanschi, and N. Tapus, “Usingthe Integrated GPU to Improve CPU Sort Performance,”Proceedings of the International Conference on ParallelProcessing Workshops, pp. 39–44, 2017.
[10] V. Garcıa, J. Gomez-Luna, T. Grass, A. Rico,E. Ayguade, and A. J. Pena, “Evaluating the Effectof Last-Level Cache Sharing on Integrated GPU-CPUSystems with Heterogeneous Applications,” Proceedingsof the 2016 IEEE International Symposium on WorkloadCharacterization, IISWC 2016, pp. 168–177, 2016.
[11] J. Hestness, S. W. Keckler, and D. A. Wood, “A Compar-ative Analysis of Microarchitecture Effects on CPU andGPU Memory System Behavior,” IISWC 2014 - IEEEInternational Symposium on Workload Characterization,pp. 150–160, 2014.
[12] G. Lupescu, E. I. Slusanschi, and N. Tapus, “Analysis ofthread workgroup broadcast for Intel GPUs,” 2016 Inter-national Conference on High Performance Computing &Simulation (HPCS), pp. 1019–1024, 2016.
10