Perfluoroalkyl substances in Daling River adjacent to fluorine industrial parks: implication from...
9
1 23 Bulletin of Environmental Contamination and Toxicology ISSN 0007-4861 Volume 94 Number 1 Bull Environ Contam Toxicol (2015) 94:34-40 DOI 10.1007/s00128-014-1419-y Perfluoroalkyl Substances in Daling River Adjacent to Fluorine Industrial Parks: Implication from Industrial Emission Jing Meng, Tieyu Wang, Pei Wang, Zhaoyun Zhu, Qifeng Li & Yonglong Lu
-
Upload
independent -
Category
Documents
-
view
3 -
download
0
Transcript of Perfluoroalkyl substances in Daling River adjacent to fluorine industrial parks: implication from...
1 23
Bulletin of EnvironmentalContamination and Toxicology ISSN 0007-4861Volume 94Number 1 Bull Environ Contam Toxicol (2015)94:34-40DOI 10.1007/s00128-014-1419-y
Perfluoroalkyl Substances in Daling RiverAdjacent to Fluorine Industrial Parks:Implication from Industrial Emission
Jing Meng, Tieyu Wang, Pei Wang,Zhaoyun Zhu, Qifeng Li & Yonglong Lu
1 23
Your article is protected by copyright and all
rights are held exclusively by Springer Science
+Business Media New York. This e-offprint is
for personal use only and shall not be self-
archived in electronic repositories. If you wish
to self-archive your article, please use the
accepted manuscript version for posting on
your own website. You may further deposit
the accepted manuscript version in any
repository, provided it is only made publicly
available 12 months after official publication
or later and provided acknowledgement is
given to the original source of publication
and a link is inserted to the published article
on Springer's website. The link must be
accompanied by the following text: "The final
publication is available at link.springer.com”.
Perfluoroalkyl Substances in Daling River Adjacent to FluorineIndustrial Parks: Implication from Industrial Emission
Jing Meng • Tieyu Wang • Pei Wang •
Zhaoyun Zhu • Qifeng Li • Yonglong Lu
Received: 13 May 2014 / Accepted: 3 November 2014 / Published online: 25 November 2014
� Springer Science+Business Media New York 2014
Abstract The pollution level and source of perfluoroalkyl
substances (PFASs) in mainstream and tributary of Daling
River in northeast China were investigated in present study.
Concentrations of PFASs in surface water and sediment
ranged from 4.6 to 3,410 ng/L and from 0.08 to 2.6 ng/g
dry weight, respectively. The lowest levels of PFASs were
found in vicinity of a drinking water source located in
upstream of Daling River. Xihe tributary, which is adjacent
to two local fluorine industrial parks, contained the highest
level of PFASs. Short-chain PFASs, including perfluorob-
utanoic acid and perfluorobutane sulfonate, were of higher
levels due to their emerging as alternative products for
perfluorooctane sulfonate. High level of perfluorooctanoic
acid was also found in Daling River. Based on these
results, it can be concluded that the relatively severe pol-
lutions of Xihe tributary were caused by long-term devel-
opment of the two local fluorine industry parks.
Keywords PFASs � Historical deposition � Sediment
core � Partition � Fluorine industrial park
Perfluoroalkyl substances (PFASs) have been widely used in
both industrial and domestic products since 1950s (OECD
2002). Several PFASs are toxic bioaccumulative organic
pollutants. In 2009, perfluorooctane sulfonate (PFOS) and
related compounds were listed under Stockholm convention
on persistent organic pollutants and called for restriction on
manufacture and application worldwide (UNEP 2009).
China began large-scale production of PFOS since 2003 and
the total output of PFOS is about 230 t/a in past several years
(Xie et al. 2013). In recent years, the fluoropolymer industry
has been using C4 PFASs, including fluorobutanesulfonate
(PFBS) and perfluorobutanoic acid (PFBA), to replace PFOS
and perfluorooctanoic acid (PFOA). All these PFASs have
been widespread with the industrial wastes (Oliaei et al.
2013; Wang et al. 2013).
Fluorine industrial enterprises in China are mainly located
in Liaoning, Zhejiang, Jiangsu and Shandong provinces
(Chen et al. 2009). Daling River is the largest river in west
Liaoning Province and flows into Liaodong Bay of Bohai
Sea. Two local fluorine industrial parks are located next to
Daling River, producing and applying PFASs. Previous
studies showed that the river has been contaminated with
PFASs (Bao et al. 2011; Liu et al. 2009; Wang et al. 2013).
The local fluorine chemical industry has been under long-
term development and caused the pollution of Daling River.
However, the studies related to pollution history of PFASs in
the river are still scarce. Vertical profile of residues in sedi-
ment core has been used as historical records of the pollution
and related anthropogenic activities. The objectives of this
study were to evaluate the pollution level of PFASs in Daling
River, assess environmental fate and potential sources for
regional urban and industrial development. This investiga-
tion will provide scientific information for future fluorine
industry management and water remediation.
Materials and Methods
The sampling sites cover Xihe tributary and mainstream of
Daling River. Seven surface water samples and corresponding
J. Meng � T. Wang (&) � P. Wang � Z. Zhu � Q. Li � Y. Lu
State Key Lab of Urban and Regional Ecology, Research Center
for Eco-Environmental Sciences, Chinese Academy of Sciences,
Beijing 100085, China
e-mail: [email protected]
J. Meng � P. Wang � Z. Zhu � Q. Li
University of Chinese Academy of Sciences, Beijing 100049,
China
123
Bull Environ Contam Toxicol (2015) 94:34–40
DOI 10.1007/s00128-014-1419-y
Author's personal copy
sediment cores were collected from this watershed in October
2011. Sediment cores were collected using a Beeker sediment
sampler at*3 m off the riverbanks. The sampler was cleaned
with methanol and Milli-Q water before each sampling. Each
sediment core was sliced into 2 cm intervals to the depth of
30 cm sections and 105 sub-samples were prepared totally,
and then stored in polypropylene (PP) bottles to transport to
the laboratory. Subsequently the samples were freeze-dried,
passed through a 2 mm mesh sieve, and stored at 4�C in pre-
cleaned glass jars before used. Corresponding surface water
samples (1.5 L) were collected 20–30 cm below water sur-
face with PP bottles. All of the, 105 sediments and 7 surface
water samples were analyzed for PFASs in laboratory.
Water sample was extracted with a solid phase extrac-
tion (SPE) cartridge as previously reported with minor
modification and optimization (Wang et al. 2011). The
cartridge was preconditioned with 4 mL of 0.1 % ammonia
in methanol, 4 mL methanol and 4 mL Milli-Q water. Five
hundred milliliter water sample was loaded into the car-
tridge. The cartridge was washed with 20 mL Milli-Q
water, 4 mL of 25 mM sodium acetate, allowed to run dry,
and eluted with 4 mL methanol and 4 mL of 0.1 %
ammonia in methanol. The eluents were collected, com-
bined, and concentrated to 1 mL under a gentle stream of
high purity nitrogen and then filtered through a 0.2 lm
nylon filter into a 1.5 mL auto-sampler vial fitted with PP
cap for HPLC analysis. Sediment samples were extracted
as the previously reported (Wang et al. 2011). Briefly,
2 mL Milli-Q water was added to 2.5 g sediment. Each
sample was spiked with 1 mL of 0.5 M tetrabutylammo-
nium hydrogensulfate (TBAHS) and 2 mL of 25 mM
sodium acetate under vortexing. Subsequently, the sedi-
ment was extracted with 5 mL of methyl tert-butyl ether
(MTBE) and the supernatant was collected. The extraction
was repeated twice, and the sediment was then washed with
15 mL MTBE. The supernatants were combined, dried
under a gentle stream of high purity nitrogen and redis-
solved in 1 mL methanol. The 1 mL elution was trans-
ferred to 50 mL PP tube, brought to 50 mL with Milli-Q
water and extracted with the SPE cartridge as described
above for the water sample.
All PFASs were analyzed using an Agilent HP 1200 high
performance liquid chromatography system equipped with
an Applied Biosystems SCIEX 3000 tandem mass spec-
trometer (HPLC–MS/MS). MS was operated in negative
electrospray ionization (ESI) mode. The analytes were
separated on C18 analytical column using methanol as a
mobile phase and 2 mM ammonium acetate as an ionization
aid. Chromatograms were recorded with MS detection in
multiple reaction monitoring (MRM) mode and at least two
transitions of per-analyte were monitored when possible.
The optimal settings for collision energies and declustering
potential were determined for the transitions of each analyte.
Field blanks (n = 3) and transport blanks (n = 3) were
included during field sampling. Procedural blanks (n = 7)
were prepared to check for potential contamination. All
blanks were below the limit of detection (LOD), where
LOD was defined as three times of signal-to-noise ratio
(S/N). The limit of quantification (LOQ) was set as five
times of S/N. Matrixes spiked with a standard solution
were analyzed to determine the recovery of each target
PFAS. All the matrix spike recoveries (MSRs) ranged from
86 % ± 4 % to 113 % ± 5 % for water samples and ran-
ged from 86 % ± 6 % to 119 % ± 4 % for sediment. The
LODs, LOQs and MSRs for all target PFASs were sum-
marized (Table 1). All concentrations lower than the LOQs
were reported as half of the LOQs, and those lower than
LODs were reported as zero.
Results and Discussion
Thirteen PFASs were detected in surface water and corre-
sponding sediments in seven sampling sites (Table 2). The
concentrations of PFASs in the surface water of Daling
River ranged from 4.6 to 3,410 ng/L. It is clear that con-
centrations of PFASs from Daling River, especially at site
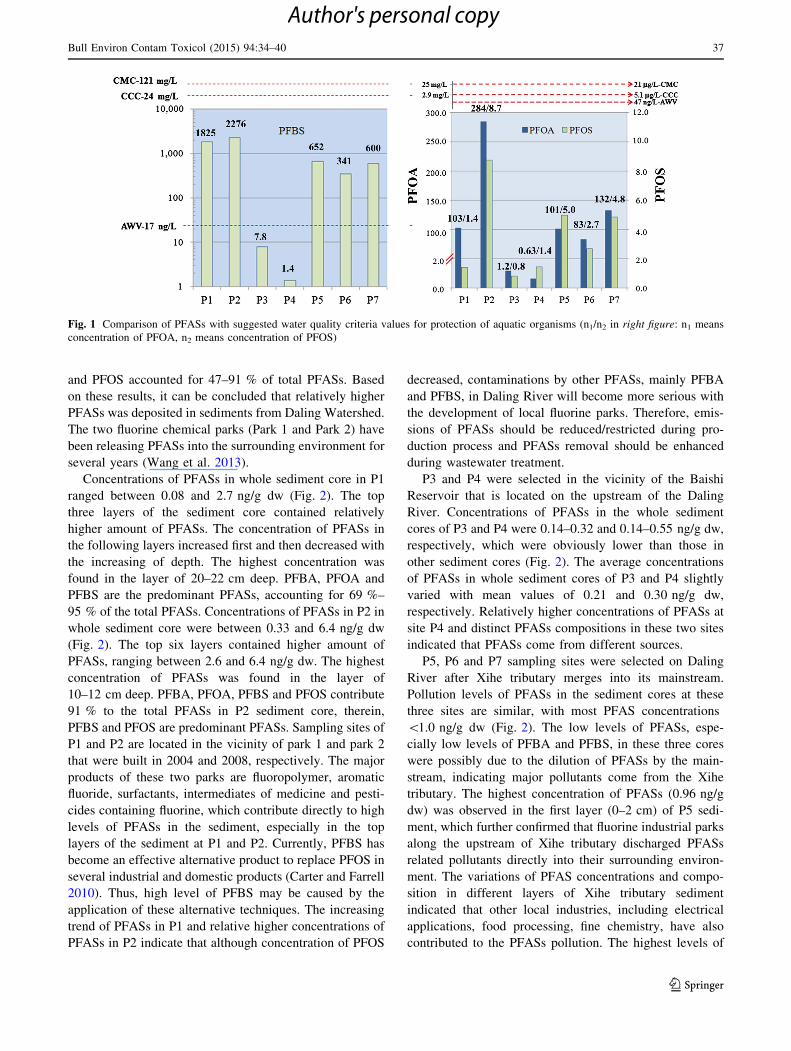
P2, were at high levels. PFBA and PFBS were the pre-
dominant PFASs with concentrations in ranges of
1.1–960 ng/L and 1.4–2,280 ng/L, respectively. Concentra-
tions of short-chain PFASs, such as PFBA and PFBS, from
Daling River were higher than the corresponding PFASs
from other Chinese rivers, such as Liaohe River (PFBS, not
detected, abbreviated as nd), Haihe River (PFBS
0.41–1.79 ng/L), Pearl River (PFBS \0.03–3.4 ng/L) and
Yangtze River (PFBS\0.005–2.1 ng/L) (So et al. 2007; Pan
et al. 2011; Yang et al. 2011). The concentration of PFOA
ranged between 0.63 and 280 ng/L. The level of PFOS
contamination was relatively low in the surface water, with
concentrations in the range of 0.80–8.7 ng/L. According to
water quality criteria, the contaminations of PFOA, PFBS
and PFOS in the surface water of Daling River are all under
the related criteria maximum concentration (CMC) and
criteria continuous concentration (CCC) for the protection of
aquatic organisms (Fig. 1) (Giesy et al. 2010). Thus, the
PFASs in the surface water may not induce the acute or
chronic toxicity to aquatic organisms. However, concentra-
tions of PFBS in five water samples were higher than the
Avian Wildlife Values (AWV) (17 ng/L), indicating that
PFBS has caused potential adverse effects on some wildlife
at the top of food chain, such as birds. The concentrations of
PFOS in all seven sampling sites were lower than the AWV
(47 ng/L) and may not lead to harmful effects.
PFASs were detected in seven surface sediments with
concentrations ranging between 0.08 and 2.6 ng/g dry
weight (dw). The concentrations of most PFASs in surface
Bull Environ Contam Toxicol (2015) 94:34–40 35
123
Author's personal copy
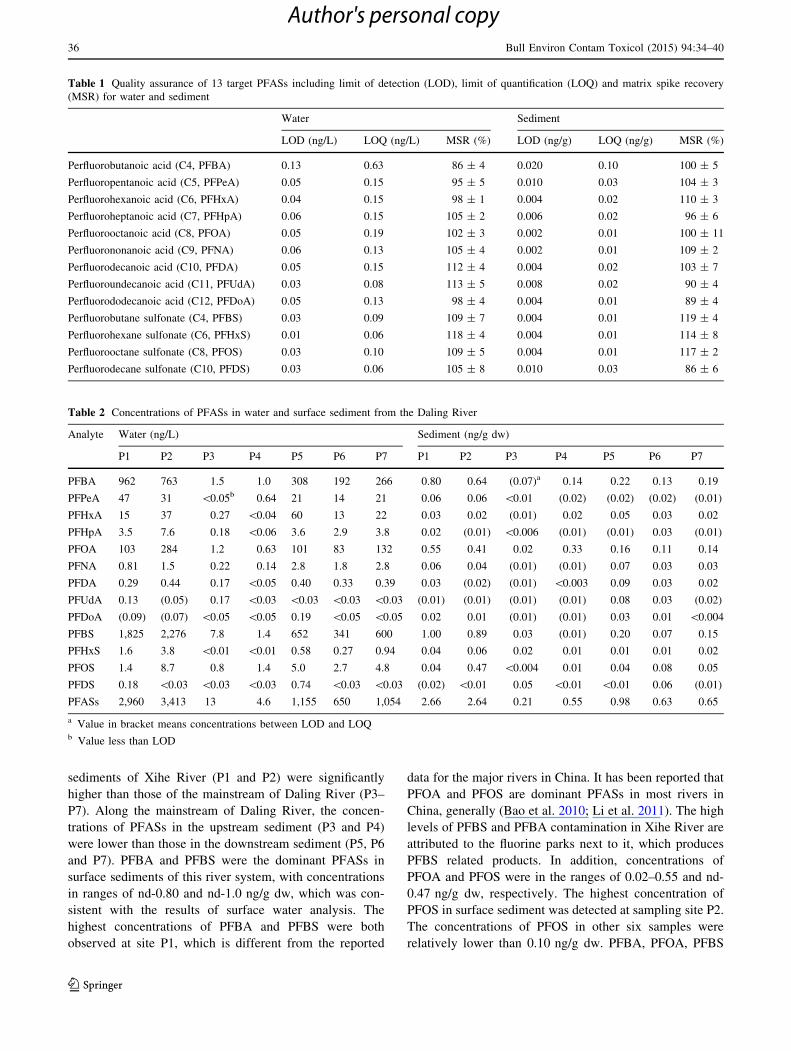
sediments of Xihe River (P1 and P2) were significantly
higher than those of the mainstream of Daling River (P3–
P7). Along the mainstream of Daling River, the concen-
trations of PFASs in the upstream sediment (P3 and P4)
were lower than those in the downstream sediment (P5, P6
and P7). PFBA and PFBS were the dominant PFASs in
surface sediments of this river system, with concentrations
in ranges of nd-0.80 and nd-1.0 ng/g dw, which was con-
sistent with the results of surface water analysis. The
highest concentrations of PFBA and PFBS were both
observed at site P1, which is different from the reported
data for the major rivers in China. It has been reported that
PFOA and PFOS are dominant PFASs in most rivers in
China, generally (Bao et al. 2010; Li et al. 2011). The high
levels of PFBS and PFBA contamination in Xihe River are
attributed to the fluorine parks next to it, which produces
PFBS related products. In addition, concentrations of
PFOA and PFOS were in the ranges of 0.02–0.55 and nd-
0.47 ng/g dw, respectively. The highest concentration of
PFOS in surface sediment was detected at sampling site P2.
The concentrations of PFOS in other six samples were
relatively lower than 0.10 ng/g dw. PFBA, PFOA, PFBS
Table 1 Quality assurance of 13 target PFASs including limit of detection (LOD), limit of quantification (LOQ) and matrix spike recovery
(MSR) for water and sediment
Water Sediment
LOD (ng/L) LOQ (ng/L) MSR (%) LOD (ng/g) LOQ (ng/g) MSR (%)
Perfluorobutanoic acid (C4, PFBA) 0.13 0.63 86 ± 4 0.020 0.10 100 ± 5
Perfluoropentanoic acid (C5, PFPeA) 0.05 0.15 95 ± 5 0.010 0.03 104 ± 3
Perfluorohexanoic acid (C6, PFHxA) 0.04 0.15 98 ± 1 0.004 0.02 110 ± 3
Perfluoroheptanoic acid (C7, PFHpA) 0.06 0.15 105 ± 2 0.006 0.02 96 ± 6
Perfluorooctanoic acid (C8, PFOA) 0.05 0.19 102 ± 3 0.002 0.01 100 ± 11
Perfluorononanoic acid (C9, PFNA) 0.06 0.13 105 ± 4 0.002 0.01 109 ± 2
Perfluorodecanoic acid (C10, PFDA) 0.05 0.15 112 ± 4 0.004 0.02 103 ± 7
Perfluoroundecanoic acid (C11, PFUdA) 0.03 0.08 113 ± 5 0.008 0.02 90 ± 4
Perfluorododecanoic acid (C12, PFDoA) 0.05 0.13 98 ± 4 0.004 0.01 89 ± 4
Perfluorobutane sulfonate (C4, PFBS) 0.03 0.09 109 ± 7 0.004 0.01 119 ± 4
Perfluorohexane sulfonate (C6, PFHxS) 0.01 0.06 118 ± 4 0.004 0.01 114 ± 8
Perfluorooctane sulfonate (C8, PFOS) 0.03 0.10 109 ± 5 0.004 0.01 117 ± 2
Perfluorodecane sulfonate (C10, PFDS) 0.03 0.06 105 ± 8 0.010 0.03 86 ± 6
Table 2 Concentrations of PFASs in water and surface sediment from the Daling River
Analyte Water (ng/L) Sediment (ng/g dw)
P1 P2 P3 P4 P5 P6 P7 P1 P2 P3 P4 P5 P6 P7
PFBA 962 763 1.5 1.0 308 192 266 0.80 0.64 (0.07)a 0.14 0.22 0.13 0.19
PFPeA 47 31 \0.05b 0.64 21 14 21 0.06 0.06 \0.01 (0.02) (0.02) (0.02) (0.01)
PFHxA 15 37 0.27 \0.04 60 13 22 0.03 0.02 (0.01) 0.02 0.05 0.03 0.02
PFHpA 3.5 7.6 0.18 \0.06 3.6 2.9 3.8 0.02 (0.01) \0.006 (0.01) (0.01) 0.03 (0.01)
PFOA 103 284 1.2 0.63 101 83 132 0.55 0.41 0.02 0.33 0.16 0.11 0.14
PFNA 0.81 1.5 0.22 0.14 2.8 1.8 2.8 0.06 0.04 (0.01) (0.01) 0.07 0.03 0.03
PFDA 0.29 0.44 0.17 \0.05 0.40 0.33 0.39 0.03 (0.02) (0.01) \0.003 0.09 0.03 0.02
PFUdA 0.13 (0.05) 0.17 \0.03 \0.03 \0.03 \0.03 (0.01) (0.01) (0.01) (0.01) 0.08 0.03 (0.02)
PFDoA (0.09) (0.07) \0.05 \0.05 0.19 \0.05 \0.05 0.02 0.01 (0.01) (0.01) 0.03 0.01 \0.004
PFBS 1,825 2,276 7.8 1.4 652 341 600 1.00 0.89 0.03 (0.01) 0.20 0.07 0.15
PFHxS 1.6 3.8 \0.01 \0.01 0.58 0.27 0.94 0.04 0.06 0.02 0.01 0.01 0.01 0.02
PFOS 1.4 8.7 0.8 1.4 5.0 2.7 4.8 0.04 0.47 \0.004 0.01 0.04 0.08 0.05
PFDS 0.18 \0.03 \0.03 \0.03 0.74 \0.03 \0.03 (0.02) \0.01 0.05 \0.01 \0.01 0.06 (0.01)
PFASs 2,960 3,413 13 4.6 1,155 650 1,054 2.66 2.64 0.21 0.55 0.98 0.63 0.65
a Value in bracket means concentrations between LOD and LOQb Value less than LOD
36 Bull Environ Contam Toxicol (2015) 94:34–40
123
Author's personal copy
and PFOS accounted for 47–91 % of total PFASs. Based
on these results, it can be concluded that relatively higher
PFASs was deposited in sediments from Daling Watershed.
The two fluorine chemical parks (Park 1 and Park 2) have
been releasing PFASs into the surrounding environment for
several years (Wang et al. 2013).
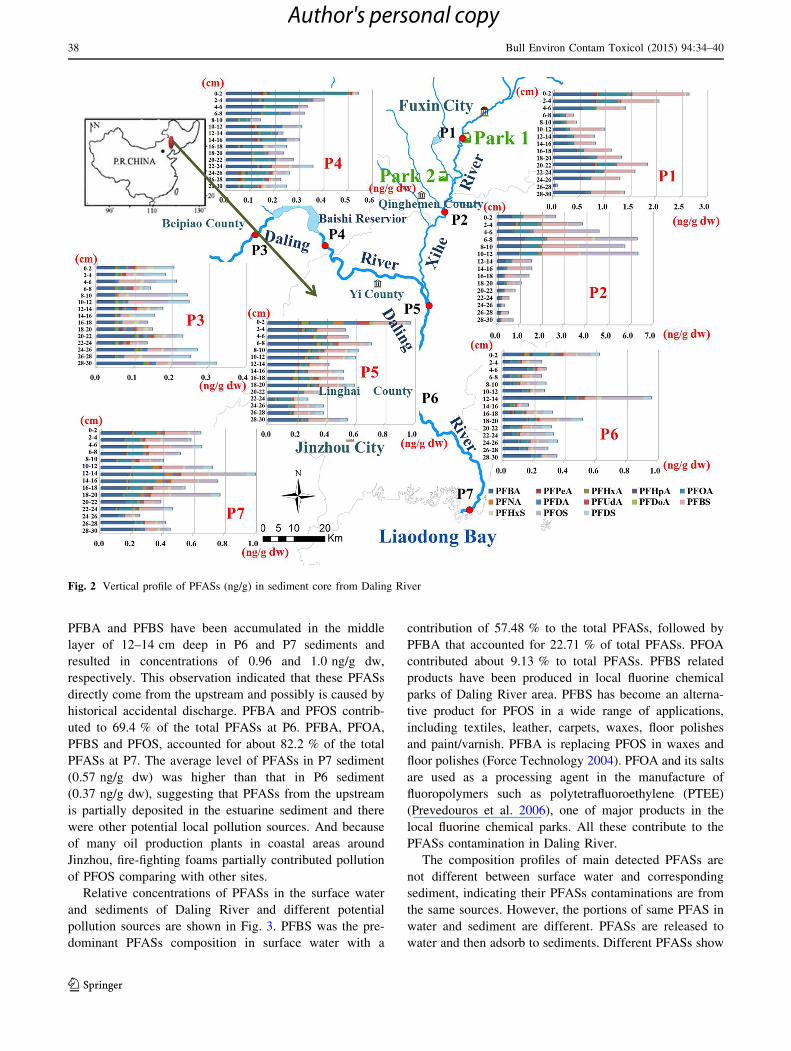
Concentrations of PFASs in whole sediment core in P1
ranged between 0.08 and 2.7 ng/g dw (Fig. 2). The top
three layers of the sediment core contained relatively
higher amount of PFASs. The concentration of PFASs in
the following layers increased first and then decreased with
the increasing of depth. The highest concentration was
found in the layer of 20–22 cm deep. PFBA, PFOA and
PFBS are the predominant PFASs, accounting for 69 %–
95 % of the total PFASs. Concentrations of PFASs in P2 in
whole sediment core were between 0.33 and 6.4 ng/g dw
(Fig. 2). The top six layers contained higher amount of
PFASs, ranging between 2.6 and 6.4 ng/g dw. The highest
concentration of PFASs was found in the layer of
10–12 cm deep. PFBA, PFOA, PFBS and PFOS contribute
91 % to the total PFASs in P2 sediment core, therein,
PFBS and PFOS are predominant PFASs. Sampling sites of
P1 and P2 are located in the vicinity of park 1 and park 2
that were built in 2004 and 2008, respectively. The major
products of these two parks are fluoropolymer, aromatic
fluoride, surfactants, intermediates of medicine and pesti-
cides containing fluorine, which contribute directly to high
levels of PFASs in the sediment, especially in the top
layers of the sediment at P1 and P2. Currently, PFBS has
become an effective alternative product to replace PFOS in
several industrial and domestic products (Carter and Farrell
2010). Thus, high level of PFBS may be caused by the
application of these alternative techniques. The increasing
trend of PFASs in P1 and relative higher concentrations of
PFASs in P2 indicate that although concentration of PFOS
decreased, contaminations by other PFASs, mainly PFBA
and PFBS, in Daling River will become more serious with
the development of local fluorine parks. Therefore, emis-
sions of PFASs should be reduced/restricted during pro-
duction process and PFASs removal should be enhanced
during wastewater treatment.
P3 and P4 were selected in the vicinity of the Baishi
Reservoir that is located on the upstream of the Daling
River. Concentrations of PFASs in the whole sediment
cores of P3 and P4 were 0.14–0.32 and 0.14–0.55 ng/g dw,
respectively, which were obviously lower than those in
other sediment cores (Fig. 2). The average concentrations
of PFASs in whole sediment cores of P3 and P4 slightly
varied with mean values of 0.21 and 0.30 ng/g dw,
respectively. Relatively higher concentrations of PFASs at
site P4 and distinct PFASs compositions in these two sites
indicated that PFASs come from different sources.
P5, P6 and P7 sampling sites were selected on Daling
River after Xihe tributary merges into its mainstream.
Pollution levels of PFASs in the sediment cores at these
three sites are similar, with most PFAS concentrations
\1.0 ng/g dw (Fig. 2). The low levels of PFASs, espe-
cially low levels of PFBA and PFBS, in these three cores
were possibly due to the dilution of PFASs by the main-
stream, indicating major pollutants come from the Xihe
tributary. The highest concentration of PFASs (0.96 ng/g
dw) was observed in the first layer (0–2 cm) of P5 sedi-
ment, which further confirmed that fluorine industrial parks
along the upstream of Xihe tributary discharged PFASs
related pollutants directly into their surrounding environ-
ment. The variations of PFAS concentrations and compo-
sition in different layers of Xihe tributary sediment
indicated that other local industries, including electrical
applications, food processing, fine chemistry, have also
contributed to the PFASs pollution. The highest levels of
Fig. 1 Comparison of PFASs with suggested water quality criteria values for protection of aquatic organisms (n1/n2 in right figure: n1 means
concentration of PFOA, n2 means concentration of PFOS)
Bull Environ Contam Toxicol (2015) 94:34–40 37
123
Author's personal copy
PFBA and PFBS have been accumulated in the middle
layer of 12–14 cm deep in P6 and P7 sediments and
resulted in concentrations of 0.96 and 1.0 ng/g dw,
respectively. This observation indicated that these PFASs
directly come from the upstream and possibly is caused by
historical accidental discharge. PFBA and PFOS contrib-
uted to 69.4 % of the total PFASs at P6. PFBA, PFOA,
PFBS and PFOS, accounted for about 82.2 % of the total
PFASs at P7. The average level of PFASs in P7 sediment
(0.57 ng/g dw) was higher than that in P6 sediment
(0.37 ng/g dw), suggesting that PFASs from the upstream
is partially deposited in the estuarine sediment and there
were other potential local pollution sources. And because
of many oil production plants in coastal areas around
Jinzhou, fire-fighting foams partially contributed pollution
of PFOS comparing with other sites.
Relative concentrations of PFASs in the surface water
and sediments of Daling River and different potential
pollution sources are shown in Fig. 3. PFBS was the pre-
dominant PFASs composition in surface water with a
contribution of 57.48 % to the total PFASs, followed by
PFBA that accounted for 22.71 % of total PFASs. PFOA
contributed about 9.13 % to total PFASs. PFBS related
products have been produced in local fluorine chemical
parks of Daling River area. PFBS has become an alterna-
tive product for PFOS in a wide range of applications,
including textiles, leather, carpets, waxes, floor polishes
and paint/varnish. PFBA is replacing PFOS in waxes and
floor polishes (Force Technology 2004). PFOA and its salts
are used as a processing agent in the manufacture of
fluoropolymers such as polytetrafluoroethylene (PTEE)
(Prevedouros et al. 2006), one of major products in the
local fluorine chemical parks. All these contribute to the
PFASs contamination in Daling River.
The composition profiles of main detected PFASs are
not different between surface water and corresponding
sediment, indicating their PFASs contaminations are from
the same sources. However, the portions of same PFAS in
water and sediment are different. PFASs are released to
water and then adsorb to sediments. Different PFASs show
Fig. 2 Vertical profile of PFASs (ng/g) in sediment core from Daling River
38 Bull Environ Contam Toxicol (2015) 94:34–40
123
Author's personal copy
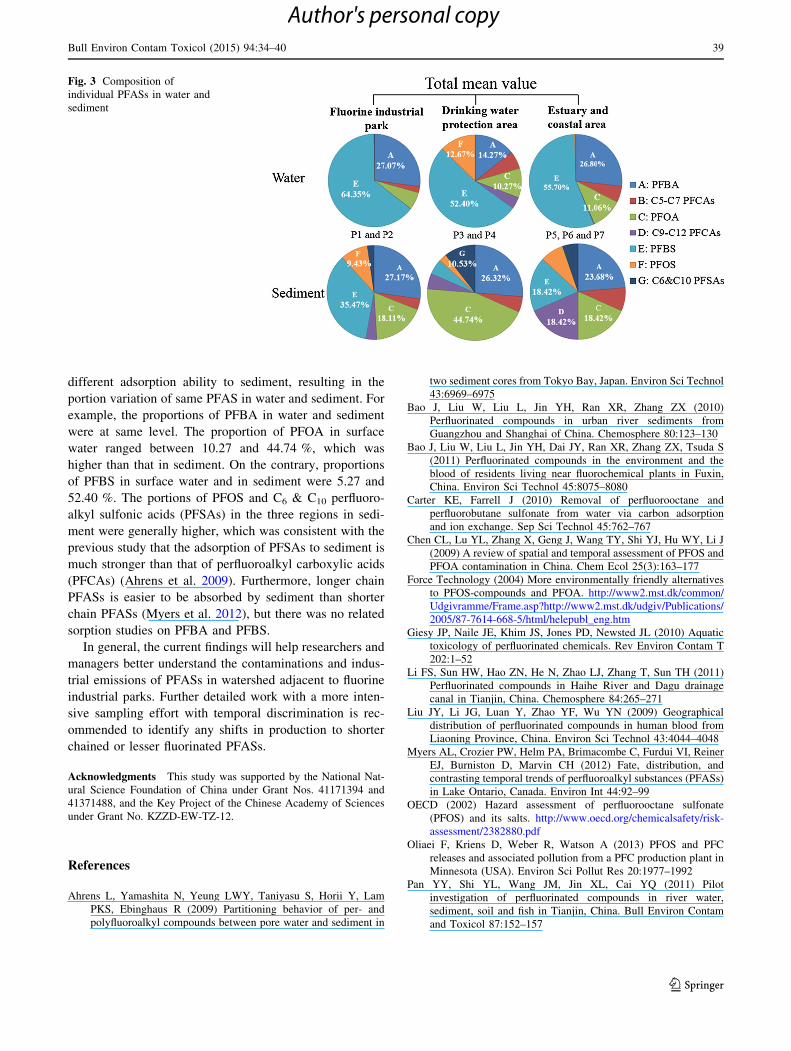
different adsorption ability to sediment, resulting in the
portion variation of same PFAS in water and sediment. For
example, the proportions of PFBA in water and sediment
were at same level. The proportion of PFOA in surface
water ranged between 10.27 and 44.74 %, which was
higher than that in sediment. On the contrary, proportions
of PFBS in surface water and in sediment were 5.27 and
52.40 %. The portions of PFOS and C6 & C10 perfluoro-
alkyl sulfonic acids (PFSAs) in the three regions in sedi-
ment were generally higher, which was consistent with the
previous study that the adsorption of PFSAs to sediment is
much stronger than that of perfluoroalkyl carboxylic acids
(PFCAs) (Ahrens et al. 2009). Furthermore, longer chain
PFASs is easier to be absorbed by sediment than shorter
chain PFASs (Myers et al. 2012), but there was no related
sorption studies on PFBA and PFBS.
In general, the current findings will help researchers and
managers better understand the contaminations and indus-
trial emissions of PFASs in watershed adjacent to fluorine
industrial parks. Further detailed work with a more inten-
sive sampling effort with temporal discrimination is rec-
ommended to identify any shifts in production to shorter
chained or lesser fluorinated PFASs.
Acknowledgments This study was supported by the National Nat-
ural Science Foundation of China under Grant Nos. 41171394 and
41371488, and the Key Project of the Chinese Academy of Sciences
under Grant No. KZZD-EW-TZ-12.
References
Ahrens L, Yamashita N, Yeung LWY, Taniyasu S, Horii Y, Lam
PKS, Ebinghaus R (2009) Partitioning behavior of per- and
polyfluoroalkyl compounds between pore water and sediment in
two sediment cores from Tokyo Bay, Japan. Environ Sci Technol
43:6969–6975
Bao J, Liu W, Liu L, Jin YH, Ran XR, Zhang ZX (2010)
Perfluorinated compounds in urban river sediments from
Guangzhou and Shanghai of China. Chemosphere 80:123–130
Bao J, Liu W, Liu L, Jin YH, Dai JY, Ran XR, Zhang ZX, Tsuda S
(2011) Perfluorinated compounds in the environment and the
blood of residents living near fluorochemical plants in Fuxin,
China. Environ Sci Technol 45:8075–8080
Carter KE, Farrell J (2010) Removal of perfluorooctane and
perfluorobutane sulfonate from water via carbon adsorption
and ion exchange. Sep Sci Technol 45:762–767
Chen CL, Lu YL, Zhang X, Geng J, Wang TY, Shi YJ, Hu WY, Li J
(2009) A review of spatial and temporal assessment of PFOS and
PFOA contamination in China. Chem Ecol 25(3):163–177
Force Technology (2004) More environmentally friendly alternatives
to PFOS-compounds and PFOA. http://www2.mst.dk/common/
Udgivramme/Frame.asp?http://www2.mst.dk/udgiv/Publications/
2005/87-7614-668-5/html/helepubl_eng.htm
Giesy JP, Naile JE, Khim JS, Jones PD, Newsted JL (2010) Aquatic
toxicology of perfluorinated chemicals. Rev Environ Contam T
202:1–52
Li FS, Sun HW, Hao ZN, He N, Zhao LJ, Zhang T, Sun TH (2011)
Perfluorinated compounds in Haihe River and Dagu drainage
canal in Tianjin, China. Chemosphere 84:265–271
Liu JY, Li JG, Luan Y, Zhao YF, Wu YN (2009) Geographical
distribution of perfluorinated compounds in human blood from
Liaoning Province, China. Environ Sci Technol 43:4044–4048
Myers AL, Crozier PW, Helm PA, Brimacombe C, Furdui VI, Reiner
EJ, Burniston D, Marvin CH (2012) Fate, distribution, and
contrasting temporal trends of perfluoroalkyl substances (PFASs)
in Lake Ontario, Canada. Environ Int 44:92–99
OECD (2002) Hazard assessment of perfluorooctane sulfonate
(PFOS) and its salts. http://www.oecd.org/chemicalsafety/risk-
assessment/2382880.pdf
Oliaei F, Kriens D, Weber R, Watson A (2013) PFOS and PFC
releases and associated pollution from a PFC production plant in
Minnesota (USA). Environ Sci Pollut Res 20:1977–1992
Pan YY, Shi YL, Wang JM, Jin XL, Cai YQ (2011) Pilot
investigation of perfluorinated compounds in river water,
sediment, soil and fish in Tianjin, China. Bull Environ Contam
and Toxicol 87:152–157
Fig. 3 Composition of
individual PFASs in water and
sediment
Bull Environ Contam Toxicol (2015) 94:34–40 39
123
Author's personal copy
Prevedouros K, Cousins IT, Buck RC, Korzeniowski SH (2006)
Sources, fate and transport of perfluorocarboxylates. Environ Sci
Technol 40:32–44
So MK, Miyake Y, Yeung WY, Ho YM, Taniyasu S, Rostkowski P,
Yamashita N, Zhou BS, Shi XJ, Wang JX, Giesy JP, Yu H, Lam
PKS (2007) Perfluorinated compounds in the Pearl River and
Yangtze River of China. Chemosphere 68:2085–2095
UNEP (2009) Stockholm convention on persistent organic pollutants
(POPs). http://chm.pops.int/Portals/0/Repository/convention_text/
UNEP-POPS-COP-CONVTEXT-FULL.English.PDF
Wang TY, Lu YL, Chen CL, Naile JE, Khim JS, Park J, Luo W, Jiao
WT, Hu WY, Giesy JP (2011) Perfluorinated compounds in
estuarine and coastal areas of north Bohai Sea, China. Mar Pollut
Bull 62:1905–1914
Wang P, Wang TY, Giesy JP, Lu YL (2013) Perfluorinated
compounds in soils from Liaodong Bay with concentrated
fluorine industry parks in China. Chemosphere 91:751–757
Xie SW, Wang TY, Liu SJ, Jones KC, Sweetman AJ, Lu YL (2013)
Industrial source identification and emission estimation of
perfluorooctane sulfonate in China. Environ Int 52:1–8
Yang LP, Zhu LY, Liu ZT (2011) Occurrence and partition of
perfluorinated compounds in water and sediment from Liao
River and Taihu Lake, China. Chemosphere 83:806–814
40 Bull Environ Contam Toxicol (2015) 94:34–40
123
Author's personal copy