Perfluorinated compounds in surface waters from Northern China: Comparison to level of...
10
Perfluorinated compounds in surface waters from Northern China: Comparison to level of industrialization Tieyu Wang a , Jong Seong Khim b , Chunli Chen a , Jonathan E. Naile c , Yonglong Lu a, ⁎, Kurunthachalam Kannan d , Jinsoon Park b , Wei Luo a , Wentao Jiao a , Wenyou Hu a , John P. Giesy c,e,f a State Key Lab of Urban and Regional Ecology, Research Center for Eco-Environmental Sciences, Chinese Academy of Sciences, Beijing 100085, China b Division of Environmental Science and Ecological Engineering, Korea University, Seoul 136-713, Republic of Korea c Toxicology Centre and Department of Veterinary Biomedical Sciences, University of Saskatchewan, Saskatoon, Saskatchewan, Canada d Wadsworth Center, New York State Department of Health and Department of Environmental Health Sciences, School of Public Health, State University of New York, Empire State Plaza, Albany, NY 12201-0509, USA e Department of Zoology and Center for Integrative Toxicology, Michigan State University, East Lansing 48824, MI, USA f Zoology Department, College of Science, King Saud University, P. O. Box 2455, Riyadh 11451, Saudi Arabia abstract article info Available online 4 May 2011 Keywords: PFCs Surface water Occurrence Sources Mass flow Risk assessment Inclusion of Perfluorooctane Sulfonate (PFOS) in the Stockholm Convention because of its exemptions, has resulted in increased annual production of PFOS-containing chemicals in China to accommodate domestic and overseas demands. Accordingly, concern about environmental contamination with perfluorinated compounds (PFCs), such as PFOS, has arisen. However, little information is available on the status and trends in the distribution, sources or risk of PFCs in aquatic environments of China. In the present study, forty two surface water samples collected from five regions with different levels of industrialization were monitored for concentrations of PFCs by use of solid phase extraction and LC/MS/MS. Mean concentrations (maximum concentration) of PFOA and PFOS, which were the dominant PFCs, were 1.2 (2.3) and 0.16 (0.52) ng/l for Guanting, 1.2 (1.8) and 0.32 (1.1) ng/l for Hohhot, 2.7 (15) and 0.93 (5.7) ng/l for Shanxi, 6.8 (12) and 2.6 (11) ng/l for Tianjin, 27 (82) and 4.7 (31) ng/l for Liaoning, respectively. The greatest concentrations of PFCs (121 ng/l), PFOA (82 ng/l) and PFOS (31 ng/l) were observed in Liaoning, which might originate from tributaries of the Liaohe River, the most polluted watershed in Northeast China. While, concentrations of PFCs in the Guanting and Hohhot regions were 3 to 20 fold less than those from Tianjin and Liaoning. This result is consistent with little contribution of PFCs being released from agricultural and non-industrial activities. The magnitudes of mass flow for PFOA and PFOS in decreasing order were: Guanting b Hohhot b Tianjin b Liaoning b Shanxi and Guanting b Hohhot b Shanxi b Tianjin b Liaoning. The larger mass flows of PFOS were accompanied by relatively larger magnitudes of PFOA. Concentrations of both PFOA and PFOS in waters from all regions were less than suggested allowable concentrations. However, the relatively greater concentrations of PFCs in Tianjin and Liaoning suggest that further studies characterizing their sources and potential risk to both humans and wildlife are needed. © 2011 Elsevier Ltd. All rights reserved. 1. Introduction Perfluorinated compounds (PFCs) have been manufactured since the 1950s, and their unique properties, such as surface activity, thermal and acid resistance, and water and oil repellency have made them useful in a number of applications and products (Giesy et al., 2010). PFCs have been used as surfactants and surface protectors in carpets, leather, paper, food containers, fabric, and upholstery and as performance chemicals in products such as fire-fighting foams, floor polishes, and shampoos (Giesy and Kannan, 2001; Giesy and Kannan, 2002). The high energy carbon–fluorine bond renders PFCs resistant to hydrolysis, photolysis, microbial degradation, and metabolism by vertebrates (Giesy and Kannan, 2001). Concern about PFCs is growing because they are globally distributed, environmentally persistent, bioaccumulative, and potentially harmful. Giesy and Kannan were the first to report the global distribution of these surfactants when they quantified perfluorooctane sulfonate (PFOS), perfluorooctanoate (PFOA) and perfluorooctane sulfonamide (FOSA) in extracts of blood plasma and liver samples from marine mammals, birds, fish, as well as human blood (Giesy and Kannan, 2001, 2002). Subsequent studies found PFCs in air (Barber et al., 2007; Chaemfa et al., 2010; Dreyer, 2009); water (Ahrens et al., 2009; Boulanger et al., 2004; Hansen et al., 2002; Saito et al., 2003; So et al., 2004; Yamashita et al., 2004; Yamashita et al., 2005); sediment (Becker et al., 2008; Higgins et al., 2005; Kumar et al., 2009; Naile et al., 2010), and wildlife (Delinsky et al., 2010; Giesy and Kannan, 2001, 2002; Giesy et al., Environment International 42 (2012) 37–46 ⁎ Corresponding author. Tel.: + 86 10 62849466; fax: + 86 10 62918177. E-mail address: [email protected] (Y. Lu). 0160-4120/$ – see front matter © 2011 Elsevier Ltd. All rights reserved. doi:10.1016/j.envint.2011.03.023 Contents lists available at ScienceDirect Environment International journal homepage: www.elsevier.com/locate/envint
Transcript of Perfluorinated compounds in surface waters from Northern China: Comparison to level of...
Environment International 42 (2012) 37–46
Contents lists available at ScienceDirect
Environment International
j ourna l homepage: www.e lsev ie r.com/ locate /env int
Perfluorinated compounds in surface waters from Northern China: Comparison tolevel of industrialization
Tieyu Wang a, Jong Seong Khim b, Chunli Chen a, Jonathan E. Naile c, Yonglong Lu a,⁎,Kurunthachalam Kannan d, Jinsoon Park b, Wei Luo a, Wentao Jiao a, Wenyou Hu a, John P. Giesy c,e,f
a State Key Lab of Urban and Regional Ecology, Research Center for Eco-Environmental Sciences, Chinese Academy of Sciences, Beijing 100085, Chinab Division of Environmental Science and Ecological Engineering, Korea University, Seoul 136-713, Republic of Koreac Toxicology Centre and Department of Veterinary Biomedical Sciences, University of Saskatchewan, Saskatoon, Saskatchewan, Canadad Wadsworth Center, New York State Department of Health and Department of Environmental Health Sciences, School of Public Health, State University of New York,Empire State Plaza, Albany, NY 12201-0509, USAe Department of Zoology and Center for Integrative Toxicology, Michigan State University, East Lansing 48824, MI, USAf Zoology Department, College of Science, King Saud University, P. O. Box 2455, Riyadh 11451, Saudi Arabia
⁎ Corresponding author. Tel.: +86 10 62849466; fax:E-mail address: [email protected] (Y. Lu).
0160-4120/$ – see front matter © 2011 Elsevier Ltd. Aldoi:10.1016/j.envint.2011.03.023
a b s t r a c t
a r t i c l e i n f oAvailable online 4 May 2011
Keywords:PFCsSurface waterOccurrenceSourcesMass flowRisk assessment
Inclusion of Perfluorooctane Sulfonate (PFOS) in the StockholmConvention because of its exemptions, has resultedin increased annual production of PFOS-containing chemicals in China to accommodate domestic and overseasdemands. Accordingly, concern about environmental contamination with perfluorinated compounds (PFCs), suchas PFOS, has arisen. However, little information is available on the status and trends in the distribution, sources orrisk of PFCs in aquatic environments of China. In the present study, forty two surfacewater samples collected fromfive regions with different levels of industrialization were monitored for concentrations of PFCs by use of solidphase extraction and LC/MS/MS. Mean concentrations (maximum concentration) of PFOA and PFOS, which werethedominant PFCs,were1.2 (2.3) and0.16 (0.52)ng/l forGuanting, 1.2 (1.8) and0.32 (1.1)ng/l forHohhot, 2.7 (15)and 0.93 (5.7)ng/l for Shanxi, 6.8 (12) and 2.6 (11)ng/l for Tianjin, 27 (82) and 4.7 (31)ng/l for Liaoning,respectively. The greatest concentrations of PFCs (121 ng/l), PFOA (82 ng/l) and PFOS (31 ng/l) were observed inLiaoning, which might originate from tributaries of the Liaohe River, the most polluted watershed in NortheastChina. While, concentrations of PFCs in the Guanting and Hohhot regions were 3 to 20 fold less than those fromTianjin and Liaoning. This result is consistent with little contribution of PFCs being released from agricultural andnon-industrial activities. The magnitudes of mass flow for PFOA and PFOS in decreasing order were:GuantingbHohhotbTianjinbLiaoningbShanxi and GuantingbHohhotbShanxibTianjinbLiaoning. The largermass flows of PFOS were accompanied by relatively larger magnitudes of PFOA. Concentrations of both PFOAand PFOS in waters from all regions were less than suggested allowable concentrations. However, the relativelygreater concentrations of PFCs in Tianjin and Liaoning suggest that further studies characterizing their sources andpotential risk to both humans and wildlife are needed.
+86 10 62918177.
l rights reserved.
© 2011 Elsevier Ltd. All rights reserved.
1. Introduction
Perfluorinated compounds (PFCs) have been manufactured sincethe 1950s, and their unique properties, such as surface activity,thermal and acid resistance, and water and oil repellency have madethem useful in a number of applications and products (Giesy et al.,2010). PFCs have been used as surfactants and surface protectors incarpets, leather, paper, food containers, fabric, and upholstery and asperformance chemicals in products such as fire-fighting foams, floorpolishes, and shampoos (Giesy and Kannan, 2001; Giesy and Kannan,2002). The high energy carbon–fluorine bond renders PFCs resistant
to hydrolysis, photolysis, microbial degradation, and metabolism byvertebrates (Giesy and Kannan, 2001). Concern about PFCs is growingbecause they are globally distributed, environmentally persistent,bioaccumulative, and potentially harmful. Giesy and Kannan were thefirst to report the global distribution of these surfactants when theyquantified perfluorooctane sulfonate (PFOS), perfluorooctanoate(PFOA) and perfluorooctane sulfonamide (FOSA) in extracts ofblood plasma and liver samples from marine mammals, birds, fish,as well as human blood (Giesy and Kannan, 2001, 2002). Subsequentstudies found PFCs in air (Barber et al., 2007; Chaemfa et al., 2010;Dreyer, 2009); water (Ahrens et al., 2009; Boulanger et al., 2004;Hansen et al., 2002; Saito et al., 2003; So et al., 2004; Yamashita et al.,2004; Yamashita et al., 2005); sediment (Becker et al., 2008; Higginset al., 2005; Kumar et al., 2009; Naile et al., 2010), and wildlife(Delinsky et al., 2010; Giesy and Kannan, 2001, 2002; Giesy et al.,
38 T. Wang et al. / Environment International 42 (2012) 37–46
2006; Houde et al., 2006; Nakata et al., 2006; Shi et al., 2010; Taniyasuet al., 2003).
Among PFCs, PFOS and PFOA have received a great deal of attentionin recent years. PFOS and PFOA are the terminal degradation products ofseveral precursors, and these two are the major PFCs that have beenfrequently detected in environmental samples, and often occur at thegreatest concentrations. PFOS was recently listed as a “persistentorganic pollutant”, under the Stockholm Convention, but manyexemptions were made, which allow for continued production anduse of somePFCs, especially in China (Wanget al., 2009). Relatively largeamounts of PFCs are manufactured and used in China, especially by thetextile, leather and paper industries (Chen et al., 2009). China begunlarge-scale production of PFOS in 2003with total production of less than50 t before 2004 (Ministry of Environmental Protection of China, 2008).Since 2005 annual production of PFOS-containing chemicals has grownrapidly due to the sharp increase in domestic demand as well asoverseas demands resulting from the restrictions on production of PFOSin other countries since (Bao et al., 2009).
Given their water solubility and negligible vapor pressure whendissolved inwater,most PFCs can accumulate in aquatic systems and arereadily transported by hydrological processes (Taniyasu et al., 2003;Yamashita et al., 2005).Water and sediments are considered final sinksof PFCs and aquatic systems are an important medium for theirtransport (Hansen et al., 2002). The Yellow River system, Haihe Riversystem, and Liaohe River system are the most important water sourcesin Northern China. The Haihe River system is the largest catchment inNorthernChinawith its tributaries spanning fromBeijing to Tianjin, twolarge municipalities of China. The Yellow River is the second longestriver in China following the Yangtze River, with a total length of5464 km and meandering across 9 provinces (including Shanxi andInner Mongolia). The Liaohe River system, which is located inNortheastern China, especially in Liaoning province, encompasses anumber of densely industrialized zones, and is recognized as one of themost contaminated rivers in China (Zhanget al., 2006). These three riversystems eventually empty into the Bohai Sea. The rapid economicdevelopment in this region has brought, and continues to bring aboutincreasing amounts ofmunicipal, industrial and agriculturalwastes intothe Bohai Sea. The environmental quality in the estuarine and nearbycoastal areas has deteriorated by intense industrial and urban activities,and the Bohai Sea is currently oneof themost polluted seas in China (Huet al., 2010; Luo et al., 2010; Naile et al., 2010; Wang et al., 2005b).
Some studies have been conducted on the occurrence anddistribution of PFCs in Chinese environments since 2004 (Bao et al.,2009; Bao et al., 2010; Chen et al., 2009; Chen et al., 2011; Ju et al., 2008;Liu et al., 2009;Mak et al., 2009; Pan et al., 2010; So et al., 2007; So et al.,2004). However, previous surveys are limited in their scopes and thematrices considered, and relatively few studied sources, distribution,transportation, and potential adverse effects in aquatic environments.
The present study was conducted as a systematic investigation totrace sources and fates of toxic substances in various environmentalmedia from adjacent riverine and estuarine areas including the BohaiSea of China and the West Sea of Korea. The objectives of the presentstudy were to determine concentrations, distribution, and transporta-tion of PFCs in aquatic systems inNorthern China to identify sources andpotential risks, and thus provide information for future managementand remediation efforts on watersheds in Northern China.
2. Materials and methods
2.1. Standards and reagents
PFOA [1,2,3,413C] (N98%, Wellington Laboratories, Guelph, Ontario,Canada) and PFOS [18O2] (RTI International, N.C., USA) were used asinternal standards. The external standard used for all matrix spikes wasa mixture of 12 PFCs (N98%, Wellington Laboratories) includingperfluorobutane sulfonate (PFBS), perfluorohexane sulfonate (PFHxS),
PFOS, perfluorodecane sulfonate (PFDS), perfluorobutyric acid (PFBA),perfluorohexanoic acid (PFHxA), perfluoroheptanoic acid (PFHpA),PFOA, perfluorononanoic acid (PFNA), perfluorodecanoic acid (PFDA),perfluoroundecanoic acid (PFUnA), and perfluorododecanoic acid(PFDoA).HPLCgrademethanol and ammoniumacetatewerepurchasedfrom J.T. Baker (Phillipsburg, NJ, USA). Analytical grade sodiumthiosulfate was purchased from EMD Chemicals (Gibbstown, NJ, USA).Nano-pure water was obtained from aMilli-Q gradient A-10 (Millipore,Bedford, MA, USA).
2.2. Water sample collection
Five sub-regions located in Guanting Reservoir, the largest sourceof water for Beijing, Hohhot, Shanxi, Tianjin and Liaoning along theYellow River, Haihe River, and Liaohe River in Northern China, wereincluded in the study area (Fig. 1). Levels of industrialization weredetermined by use of a comprehensive index that included GDP percapita, non-agricultural product, non-agricultural employment, andthe degree of urbanization, informationization and dependence onforeign trade (Cui, 2003). Magnitudes of the index of industrializationwere as follows: GuantingbHohhotbShanxibTianjinbLiaoning. Fortytwo surface water samples were collected from above mentionedregions including 7 from Guanting Reservoir (G), 8 from Hohhot inInner Mongolia (H), 9 from Shanxi province (S), 8 from Tianjin BohaiBay (T), and 10 from Liaoning province (L) (Fig. 1). Global positioningsystem (GPS) was used to locate sampling sites. Information onsampling sites was summarized in Table 1.
One liter of surfacewater was collected from each sampling stationby dipping a clean, methanol-rinsed 1 l polypropylene (PP) bottle justunder the surface of water and the container was rinsed 5 times bywater from the specific location before sample collection. Residualchlorine in each water sample was reduced by adding 200 μl of200 mg/ml of sodium thiosulfate solution using a disposable PPsyringe. Sample duplicates and field blanks were collected daily andkept at least 20% of the samples in duplicate, thus were analyzed alongwith laboratory and procedural blanks. All samples were stored on icefor transport to the laboratory and frozen at −20 °C until analyses.
2.3. Extraction and cleanup
Water samples were extracted using Oasis HLB solid phaseextraction cartridges (0.2 g, 6 cm3) (Waters Corp., Milford, MA) aspreviously reported (Naile et al., 2010; So et al., 2004). Cartridgeswere preconditioned by elution with 10 ml of 100% methanolfollowed by 10 ml of nano-pure water at a rate of 2 drops a second.Five hundred milliliters of water was spiked with 500 μl of 5 ng/mlinternal standard (isotopically labeled PFOS and PFOA, PFOS [18O2]and PFOA [1,2,3,413C]) and then loaded onto the cartridge, at a rate of1 drop per second. Cartridges were then washed with 5 ml of 40%methanol in water and allowed to run dry. Eluents were discarded.Target compounds were eluted with 10 ml of methanol at a rate of 1drop per second and collected in a 15 ml PP tube. The eluate was thenreduced to 1 ml under a gentle stream of nitrogen, and filtered using adisposable PP syringe, which had been fitted with a disposable nylonmembrane Millex filter unit (pore diameter 0.2 μm, Whatman,Maidstone, United Kingdom). Samples were stored and analyzed inPP auto-sampler vials fitted with PP septa (Canadian Life Science,Peterborough, ON, Canada).
2.4. Instrumental analysis
An HP 1200 high performance liquid chromatography system(HPLC) by Agilent Technologies was used for separation of all targetanalytes. The HPLC was fitted with a Thermo Scientific Betasil C18(100×2.1 mm, 5 μm particle size) analytical column, and a guardcolumn was used for separation of background from analytes in
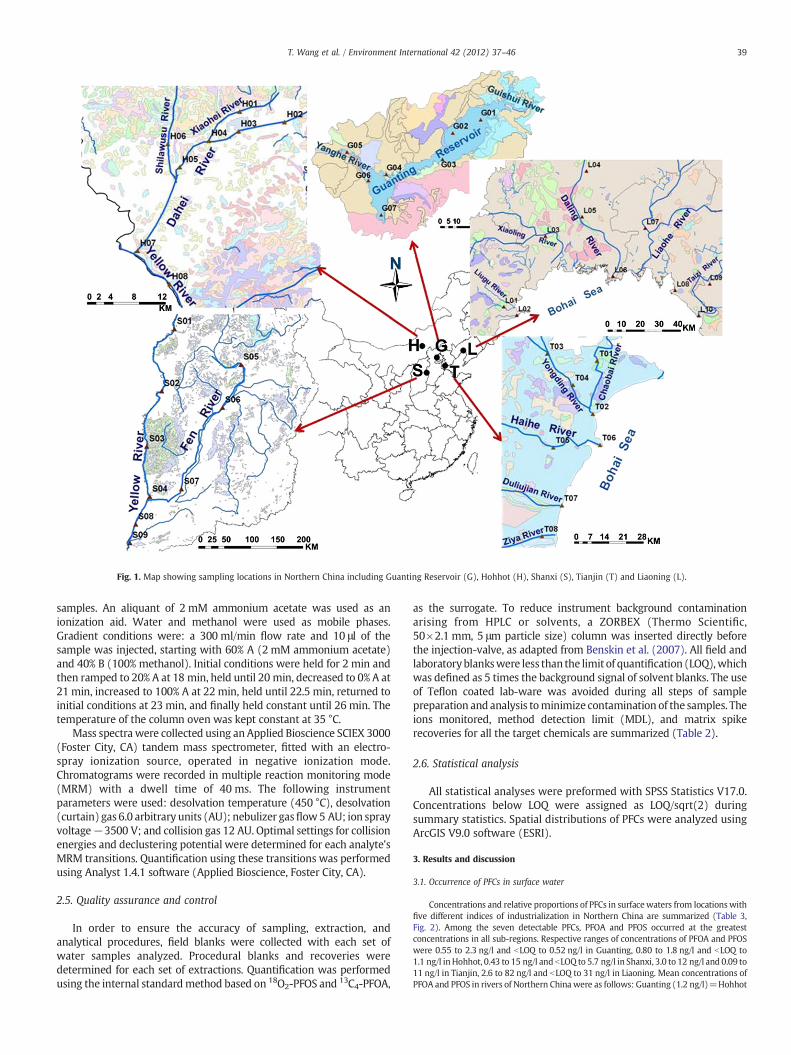
Fig. 1. Map showing sampling locations in Northern China including Guanting Reservoir (G), Hohhot (H), Shanxi (S), Tianjin (T) and Liaoning (L).
39T. Wang et al. / Environment International 42 (2012) 37–46
samples. An aliquant of 2 mM ammonium acetate was used as anionization aid. Water and methanol were used as mobile phases.Gradient conditions were: a 300 ml/min flow rate and 10 μl of thesample was injected, starting with 60% A (2 mM ammonium acetate)and 40% B (100% methanol). Initial conditions were held for 2 min andthen ramped to 20% A at 18 min, held until 20 min, decreased to 0% A at21 min, increased to 100% A at 22 min, held until 22.5 min, returned toinitial conditions at 23 min, and finally held constant until 26 min. Thetemperature of the column oven was kept constant at 35 °C.
Mass spectra were collected using anApplied Bioscience SCIEX 3000(Foster City, CA) tandem mass spectrometer, fitted with an electro-spray ionization source, operated in negative ionization mode.Chromatograms were recorded in multiple reaction monitoring mode(MRM) with a dwell time of 40 ms. The following instrumentparameters were used: desolvation temperature (450 °C), desolvation(curtain) gas 6.0 arbitrary units (AU); nebulizer gasflow5 AU; ion sprayvoltage−3500 V; and collision gas 12 AU. Optimal settings for collisionenergies and declustering potential were determined for each analyte'sMRM transitions. Quantification using these transitions was performedusing Analyst 1.4.1 software (Applied Bioscience, Foster City, CA).
2.5. Quality assurance and control
In order to ensure the accuracy of sampling, extraction, andanalytical procedures, field blanks were collected with each set ofwater samples analyzed. Procedural blanks and recoveries weredetermined for each set of extractions. Quantification was performedusing the internal standardmethod based on 18O2-PFOS and 13C4-PFOA,
as the surrogate. To reduce instrument background contaminationarising from HPLC or solvents, a ZORBEX (Thermo Scientific,50×2.1 mm, 5 μm particle size) column was inserted directly beforethe injection-valve, as adapted from Benskin et al. (2007). All field andlaboratoryblankswere less than the limit of quantification (LOQ),whichwas defined as 5 times the background signal of solvent blanks. The useof Teflon coated lab-ware was avoided during all steps of samplepreparation and analysis tominimize contamination of the samples. Theions monitored, method detection limit (MDL), and matrix spikerecoveries for all the target chemicals are summarized (Table 2).
2.6. Statistical analysis
All statistical analyses were preformed with SPSS Statistics V17.0.Concentrations below LOQ were assigned as LOQ/sqrt(2) duringsummary statistics. Spatial distributions of PFCs were analyzed usingArcGIS V9.0 software (ESRI).
3. Results and discussion
3.1. Occurrence of PFCs in surface water
Concentrations and relative proportions of PFCs in surfacewaters from locationswithfive different indices of industrialization in Northern China are summarized (Table 3,Fig. 2). Among the seven detectable PFCs, PFOA and PFOS occurred at the greatestconcentrations in all sub-regions. Respective ranges of concentrations of PFOA and PFOSwere 0.55 to 2.3 ng/l and bLOQ to 0.52 ng/l in Guanting, 0.80 to 1.8 ng/l and bLOQ to1.1 ng/l inHohhot, 0.43 to 15 ng/l and bLOQ to 5.7 ng/l in Shanxi, 3.0 to 12 ng/l and 0.09 to11 ng/l in Tianjin, 2.6 to 82 ng/l and bLOQ to 31 ng/l in Liaoning. Mean concentrations ofPFOA and PFOS in rivers of Northern China were as follows: Guanting (1.2 ng/l)=Hohhot
Table 1Sampling information including location, flow rate and detailed description.
Code Province or city Riverine Flow ratea (m3/d) Characteristics Sampling date
G01 Yanqing Guishui River 773000 Natural park and touristic 05/2007G02 Huailai Guanting Lake 383600 Orchard and town 05/2007G03 Agriculture and touristic 05/2007G04 Water treatment pool 05/2007G05 Yanghe River 2898600 River mouth, agriculture 05/2007G06 Sanggan River 1932400 River mouth, agriculture 05/2007G07 Dam and bridge 05/2007H01 Hohhot Xiaohei River 191800 Midstream, agriculture 08/2006H02 Dahei River 1175100 Upstream, near a industrial 08/2006H03 Midstream, agriculture 08/2006H04 River mouth, urban and industrial 08/2006H05 Midstream, agriculture 08/2006H06 Shilawusu River 164400 Downstream, industrial 08/2006H07 Yellow River 69863000 River mouth, sewage drainage 08/2006H08 Downstream, agriculture 08/2006S01 Lishi Yellow River 92301400 Upstream, agriculture 04/2008S02 Midstream, agriculture 04/2008S03 Midstream, Touristic 04/2008S04 River mouth, agriculture 04/2008S05 Taiyuan Fen River 4027400 Upstream, urban and industrial 04/2008S06 Midstream, agriculture and urban 04/2008S07 Linfen Downstream, sewage drainage 04/2008S08 Yuncheng Yellow River 92301400 Downstream, agriculture 04/2008S09 Downstream, urban and industrial 04/2008T01 Tianjin Chaobai River 3616400 Downstream, industrial 05/2007T02 River mouth, coastal, industrial 05/2007T03 Yongding River 5062900 Midstream, industrial 05/2007T04 Downstream, industrial 05/2007T05 Haihe River 7232800 Downstream, sewage treatment plant 05/2007T06 River mouth, coastal, harbor 05/2007T07 Duliujian River 2411000 River mouth, sewage drainage 05/2007T08 Ziya River 3888000 Downstream, agriculture 05/2007L01 Huludao Liugu River 792000 Downstream, industrial 05/2008L02 River mouth, harbor 05/2008L03 Jinzhou Xiaoling River 2155200 Downstream, pre-industrial 05/2008L04 Daling River 3780800 Midstream, oil plant 05/2008L05 Midstream, chemical industry 05/2008L06 River mouth, sewage drainage 05/2008L07 Panjin Liaohe River 4843800 Midstream, industrial 05/2008L08 River mouth and coastal, harbor 05/2008L09 Yingkou Taizi River 2421900 Downstream, industrial 05/2008L10 River mouth, coastal, industrial 05/2008
a Data obtained from website of the Ministry of Water Resources of China.
40 T. Wang et al. / Environment International 42 (2012) 37–46
(1.2 ng/l)bShanxi (2.7 ng/l)bTianjin (6.8 ng/l)bLiaoning (27 ng/l), and Guanting(0.16 ng/l)bHohhot (0.32 ng/l)bShanxi (0.93 ng/l)bTianjin (2.6 ng/l)bLiaoning (4.7 ng/l). Concentrations of PFOS and PFOA in surface waters were directly proportional to themagnitude of the index of industrialization.
Although PFOS and PFOA were the dominant PFCs found in waters during thepresent study, PFHpA, PFDA, PFDoA, and PFHxS were also detected in approximately60% of samples at concentrations greater than the respective LOQ, but concentrationsof these PFCs were less than those of PFOA and most concentrations of PFOS, exceptfor the concentration of PFHpA in Liaoning (5.9 ng/l). Concentrations of PFHpA, PFDA,
Table 2Limit of quantification (LOQ), method detection limit (MDL) and matrix spike recovery (M
Analyte Acronym LOQ (ng/l)
Perfluorobutane sulfonate PFBS 0.5Perfluorohexane sulfonate PFHxS 0.1Perfluorooctane sulfonate PFOS 0.1Perfluorodecane sulfonate PFDS 0.1Perfluorobutanoic acid PFBA 1.0Perfluorohexanoic acid PFHxA 0.5Perfluoroheptanoic acid PFHpA 0.5Perfluorooctanoic acid PFOA 0.5Perfluorononanoic acid PFNA 1.0Perfluorodecanoic acid PFDA 0.1Perfluoroundecanoic acid PFUnA 1.0Perfluorododecanoic acid PFDoA 1.0
a The MDL was defined as the amount of chemical which could be detected in a given amb Number of samples detected and % — occurrence in parenthesis given.
PFDoA and PFHxS were comparable in Guanting and Hohhot, but less than those inShanxi, Tianjin and Liaoning. The greatest concentrations of these PFCs wereobserved in Liaoning with maximum concentrations of PFHpA (35 ng/l), PFDA(5.7 ng/l), PFDoA (0.24 ng/l) and PFHxS (2.3 ng/l). This indicates that other PFCs, notjust PFOS and PFOA, should be considered in future monitoring and risk assessment.However, it should be noted that the reported concentrations of waterborne PFCswere based on a single survey, thus temporal variations could not be addressed at thistime. Further studies should investigate the monthly or seasonal variations in PFCconcentrations.
SR) of target compounds.
MDLa (ng/l) MSR (%) Detected ratiob (%)
1.0 94±40 0(0)0.2 137±15 13(31)0.2 101±22 29(69)0.2 101±21 0(0)2.0 120±19 0(0)1.0 85±58 0(0)1.0 103±16 26(62)1.0 88±25 42(100)2.0 132±23 5(12)0.2 93±13 26(62)2.0 112±22 0(0)2.0 77±17 24(24)
ount of sample after the entire method was preformed.
Table 3Concentrations (ng/l) of PFCs in waters from Northern China (the values in bracket indicate the standard errors and ranges).
Location Guanting Hohhot Shanxi Tianjin Liaoning
Sample size 7 8 9 8 10
PFOS 0.16 (0.08, nd–0.52) 0.32 (0.12, nd–1.1) 0.93 (0.64, nd–5.7) 2.6 (1.2, 0.09–11) 4.7 (3.0, nd–31)PFOA 1.2 (0.23, 0.55–2.3) 1.2 (0.12, 0.80–1.8) 2.7 (1.5, 0.43–15) 6.8 (1.1, 3.0–12) 27 (10, 2.6–82)PFHpA 0.06 (0.04, nd–0.22) 0.04 (0.02, nd–0.11) 0.32 (0.12, nd–0.96) 0.87 (0.26, 0.37–2.6) 5.9 (3.3, 0.34–35)PFNA 0.02 (0.01, nd–0.06) 0.02 (0.02, nd–0.14) nd 1.1 (0.61, nd–4.9) 0.14 (0.13, nd–1.4)PFDA 0.10 (0.03, 0.04–0.23) 0.07 (0.02, 0.03–0.18) 0.07 (0.01, 0.03–0.13) 1.1 (0.51, 0.06–3.8) 0.68 (0.56, nd–5.7)PFDoA 0.11 (0.04, nd–0.29) 0.21 (0.01, 0.16–0.27) 0.06 (0.02, nd–0.14) 0.10 (0.02 0.05–0.20) 0.03 (0.02, nd–0.24)PFHxS 0.03 (0.03, nd–0.19) 0.02 (0.01, nd–0.08) 0.78 (0.63, nd–5.8) 0.01 (0.01, nd–0.06) 0.90 (0.28, nd–2.3)∑PFCs 1.7 (0.36, 0.75–3.1) 1.8 (0.15, 1.1–2.5) 4.8 (1.8, 0.55–16) 13 (2.7, 4.4–25) 39 (12, 3.2–121)
nd: less than limit of quantification.
41T. Wang et al. / Environment International 42 (2012) 37–46
Since PFOA and PFOSwere the dominant PFCs found in water samples accounting forover 70% of the total concentrations of PFCs in all study areas and detected in most of thesamples at concentrations greater than the LOQ (Table 2), the subsequent discussion willbe focused on PFOA and PFOS. When compared to values for other regions of China,concentrations of PFOA in waters from Guanting and Hohhot were comparable to or lessthan those fromWuhan, Nanjing, Yichang, Dongguan and Hong Kong, but less than thosefromShanghai andDalian. Concentrations of PFOA inShanxi and Tianjinwere greater thanthose from most Chinese cities, but still less than those from Shanghai (260 ng/l).Moreover, the concentration of PFOA in Shanghai was higher than those from Liaoning,which showed the highest concentration of PFOA (82 ng/l) (Table 4, see thereinreferences). Concentrations of PFOS in waters in Guanting and Hohhot were comparableto those from Chongqing, Yichang, Nanjing, and Dalian. Concentrations of PFOS in Shanxiand Tianjin were similar to those from Beijing, Shenyang, Wuhan, Hong Kong and PearlRiver Delta. However, even the greatest concentration of PFOS in Liaoning (31 ng/l) wasless than those from Dongguan (99 ng/l), which has several electronic industries such asprinted circuit boards and electroplating that could be local sources of PFOS.
A comparison of the results obtained in the present study with those of previousstudies conducted in adjacent areas is presented (Table 4). In general, concentrationsdetermined in this study were greater than those found in offshore waters of Japan andoceanic samples from the Western Pacific Ocean, Central to Eastern Pacific Ocean andNorth Atlantic Ocean (Yamashita et al., 2005). Concentrations of PFOA in Shanxi andTianjin were comparable to or less than those detected in coastal waters of Korea(Yamashita et al., 2005), Kyoto River in Japan (Senthilkumar et al., 2007), and CooumRiver in India (Yeung et al., 2009), but much less than those from the Yodo River basin(Lein et al., 2008). In the present study, the maximum concentration of PFOA (82 ng/l),which was measured in Liaoning, was comparable to those observed in coastal areas ofKorea (Naile et al., 2010) including Gyeonggi Bay (Rostkowski et al., 2006), and theChao Phraya River in Thailand (Kunacheva et al., 2009), but less than the greatest
Fig. 2. Total concentrations of PFCs and relative com
concentrations of PFOA (2600 ng/l) measured in the Yodo River Basin (Lein et al.,2008), which is one of the most polluted areas in Japan. Concentrations of PFOS inShanxi, Tianjin and Liaoningwere comparable to or less than those reported from SouthKorea, Japan, India and Thailand. The maximum concentration of PFOS (31 ng/l) wasmeasured in Liaoning, which was much less than the greatest concentrations of PFOSmeasured in the Yodo River Basin (123 ng/l), Kyoto (110 ng/l) in Japan, and the Koreancoast (450 and 730 ng/l) including Gyeonggi Bay (651 ng/l) in Korea (Table 4, seereferences therein).
3.2. Spatial distribution of PFCs in surface water
Spatial patterns of PFOA and PFOS as well as total PFC concentrations in surfacewaters from five industrial regions in Northern China were plotted using ArcGissoftware (ESRI) (Fig. 3). The greatest concentration of PFCs (3.1 ng/l) was found atlocation G02 in Guanting Reservoir, with the highest values of PFOA (2.3 ng/l) andsecond highest value of PFOS (0.34 ng/l). That sample was collected from a riveradjacent to the Beixinpu region, which has intensive agricultural activities (orchard andfacility agriculture) with significant pesticide consumption every year (Wang et al.,2007). Greater concentrations of HCH, DDT and heavy metals were observed in soilsthroughout the Guanting area as well (Luo et al., 2007; Wang et al., 2005a), whichsuggests local sources of pollution from agricultural run-off. Meanwhile, this catchmentarea is the major water source for Beijing and is considered unpolluted with industrialchemicals. Concentrations of PFOA and PFOS in Guanting Reservoir water are generallyless than those from Shanxi, Tianjin and Liaoning.
The Liaoning region had the greatest total PFC concentrations (121 ng/l) and PFOAat L06 (82 ng/l), as well as greatest PFOS at L09 (31 ng/l), where one of the largestchemical industrial areas of China has been since the 1960s. There still exist many oilrefining plants, chemical plants, and smelting plants in this region. In the present study,
positions in surface waters of Northern China.
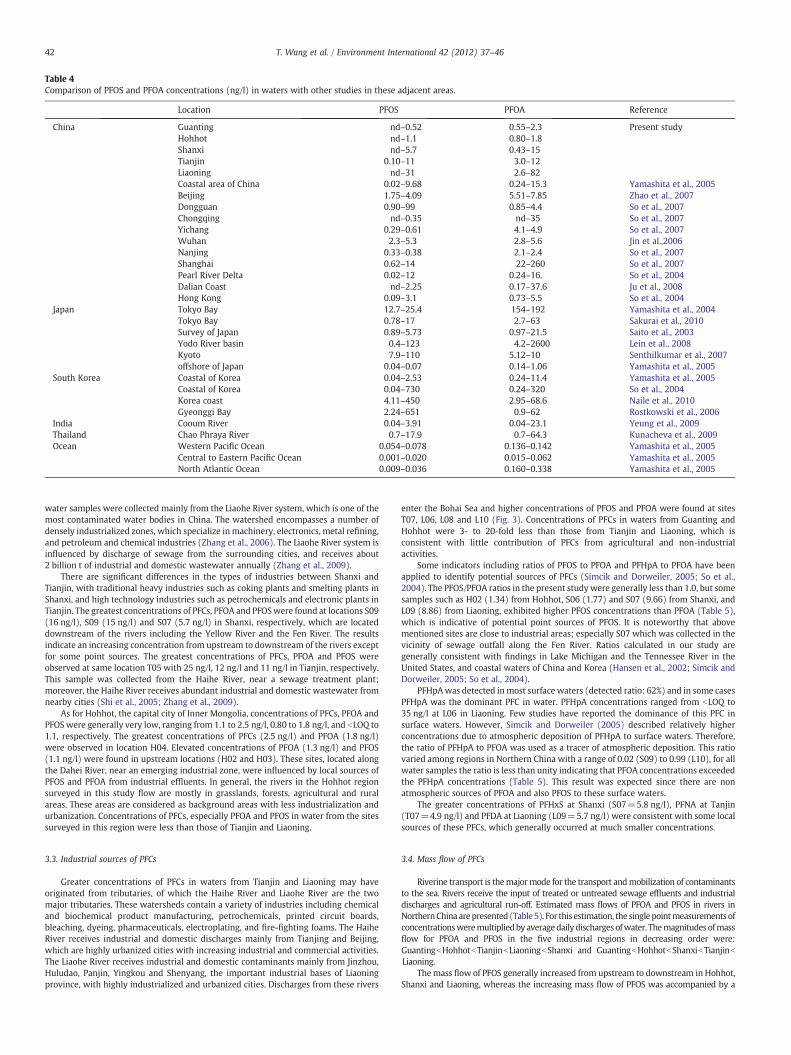
Table 4Comparison of PFOS and PFOA concentrations (ng/l) in waters with other studies in these adjacent areas.
Location PFOS PFOA Reference
China Guanting nd–0.52 0.55–2.3 Present studyHohhot nd–1.1 0.80–1.8Shanxi nd–5.7 0.43–15Tianjin 0.10–11 3.0–12Liaoning nd–31 2.6–82Coastal area of China 0.02–9.68 0.24–15.3 Yamashita et al., 2005Beijing 1.75–4.09 5.51–7.85 Zhao et al., 2007Dongguan 0.90–99 0.85–4.4 So et al., 2007Chongqing nd–0.35 nd–35 So et al., 2007Yichang 0.29–0.61 4.1–4.9 So et al., 2007Wuhan 2.3–5.3 2.8–5.6 Jin et al.,2006Nanjing 0.33–0.38 2.1–2.4 So et al., 2007Shanghai 0.62–14 22–260 So et al., 2007Pearl River Delta 0.02–12 0.24–16. So et al., 2004Dalian Coast nd–2.25 0.17–37.6 Ju et al., 2008Hong Kong 0.09–3.1 0.73–5.5 So et al., 2004
Japan Tokyo Bay 12.7–25.4 154–192 Yamashita et al., 2004Tokyo Bay 0.78–17 2.7–63 Sakurai et al., 2010Survey of Japan 0.89–5.73 0.97–21.5 Saito et al., 2003Yodo River basin 0.4–123 4.2–2600 Lein et al., 2008Kyoto 7.9–110 5.12–10 Senthilkumar et al., 2007offshore of Japan 0.04–0.07 0.14–1.06 Yamashita et al., 2005
South Korea Coastal of Korea 0.04–2.53 0.24–11.4 Yamashita et al., 2005Coastal of Korea 0.04–730 0.24–320 So et al., 2004Korea coast 4.11–450 2.95–68.6 Naile et al., 2010Gyeonggi Bay 2.24–651 0.9–62 Rostkowski et al., 2006
India Cooum River 0.04–3.91 0.04–23.1 Yeung et al., 2009Thailand Chao Phraya River 0.7–17.9 0.7–64.3 Kunacheva et al., 2009Ocean Western Pacific Ocean 0.054–0.078 0.136–0.142 Yamashita et al., 2005
Central to Eastern Pacific Ocean 0.001–0.020 0.015–0.062 Yamashita et al., 2005North Atlantic Ocean 0.009–0.036 0.160–0.338 Yamashita et al., 2005
42 T. Wang et al. / Environment International 42 (2012) 37–46
water samples were collected mainly from the Liaohe River system, which is one of themost contaminated water bodies in China. The watershed encompasses a number ofdensely industrialized zones, which specialize in machinery, electronics, metal refining,and petroleum and chemical industries (Zhang et al., 2006). The Liaohe River system isinfluenced by discharge of sewage from the surrounding cities, and receives about2 billion t of industrial and domestic wastewater annually (Zhang et al., 2009).
There are significant differences in the types of industries between Shanxi andTianjin, with traditional heavy industries such as coking plants and smelting plants inShanxi, and high technology industries such as petrochemicals and electronic plants inTianjin. The greatest concentrations of PFCs, PFOA and PFOSwere found at locations S09(16 ng/l), S09 (15 ng/l) and S07 (5.7 ng/l) in Shanxi, respectively, which are locateddownstream of the rivers including the Yellow River and the Fen River. The resultsindicate an increasing concentration from upstream to downstream of the rivers exceptfor some point sources. The greatest concentrations of PFCs, PFOA and PFOS wereobserved at same location T05 with 25 ng/l, 12 ng/l and 11 ng/l in Tianjin, respectively.This sample was collected from the Haihe River, near a sewage treatment plant;moreover, the Haihe River receives abundant industrial and domestic wastewater fromnearby cities (Shi et al., 2005; Zhang et al., 2009).
As for Hohhot, the capital city of Inner Mongolia, concentrations of PFCs, PFOA andPFOS were generally very low, ranging from 1.1 to 2.5 ng/l, 0.80 to 1.8 ng/l, and bLOQ to1.1, respectively. The greatest concentrations of PFCs (2.5 ng/l) and PFOA (1.8 ng/l)were observed in location H04. Elevated concentrations of PFOA (1.3 ng/l) and PFOS(1.1 ng/l) were found in upstream locations (H02 and H03). These sites, located alongthe Dahei River, near an emerging industrial zone, were influenced by local sources ofPFOS and PFOA from industrial effluents. In general, the rivers in the Hohhot regionsurveyed in this study flow are mostly in grasslands, forests, agricultural and ruralareas. These areas are considered as background areas with less industrialization andurbanization. Concentrations of PFCs, especially PFOA and PFOS in water from the sitessurveyed in this region were less than those of Tianjin and Liaoning.
3.3. Industrial sources of PFCs
Greater concentrations of PFCs in waters from Tianjin and Liaoning may haveoriginated from tributaries, of which the Haihe River and Liaohe River are the twomajor tributaries. These watersheds contain a variety of industries including chemicaland biochemical product manufacturing, petrochemicals, printed circuit boards,bleaching, dyeing, pharmaceuticals, electroplating, and fire-fighting foams. The HaiheRiver receives industrial and domestic discharges mainly from Tianjing and Beijing,which are highly urbanized cities with increasing industrial and commercial activities.The Liaohe River receives industrial and domestic contaminants mainly from Jinzhou,Huludao, Panjin, Yingkou and Shenyang, the important industrial bases of Liaoningprovince, with highly industrialized and urbanized cities. Discharges from these rivers
enter the Bohai Sea and higher concentrations of PFOS and PFOA were found at sitesT07, L06, L08 and L10 (Fig. 3). Concentrations of PFCs in waters from Guanting andHohhot were 3- to 20-fold less than those from Tianjin and Liaoning, which isconsistent with little contribution of PFCs from agricultural and non-industrialactivities.
Some indicators including ratios of PFOS to PFOA and PFHpA to PFOA have beenapplied to identify potential sources of PFCs (Simcik and Dorweiler, 2005; So et al.,2004). The PFOS/PFOA ratios in the present study were generally less than 1.0, but somesamples such as H02 (1.34) from Hohhot, S06 (1.77) and S07 (9.66) from Shanxi, andL09 (8.86) from Liaoning, exhibited higher PFOS concentrations than PFOA (Table 5),which is indicative of potential point sources of PFOS. It is noteworthy that abovementioned sites are close to industrial areas; especially S07 which was collected in thevicinity of sewage outfall along the Fen River. Ratios calculated in our study aregenerally consistent with findings in Lake Michigan and the Tennessee River in theUnited States, and coastal waters of China and Korea (Hansen et al., 2002; Simcik andDorweiler, 2005; So et al., 2004).
PFHpAwas detected inmost surface waters (detected ratio: 62%) and in some casesPFHpA was the dominant PFC in water. PFHpA concentrations ranged from bLOQ to35 ng/l at L06 in Liaoning. Few studies have reported the dominance of this PFC insurface waters. However, Simcik and Dorweiler (2005) described relatively higherconcentrations due to atmospheric deposition of PFHpA to surface waters. Therefore,the ratio of PFHpA to PFOA was used as a tracer of atmospheric deposition. This ratiovaried among regions in Northern China with a range of 0.02 (S09) to 0.99 (L10), for allwater samples the ratio is less than unity indicating that PFOA concentrations exceededthe PFHpA concentrations (Table 5). This result was expected since there are nonatmospheric sources of PFOA and also PFOS to these surface waters.
The greater concentrations of PFHxS at Shanxi (S07=5.8 ng/l), PFNA at Tanjin(T07=4.9 ng/l) and PFDA at Liaoning (L09=5.7 ng/l) were consistent with some localsources of these PFCs, which generally occurred at much smaller concentrations.
3.4. Mass flow of PFCs
Riverine transport is themajormode for the transport andmobilization of contaminantsto the sea. Rivers receive the input of treated or untreated sewage effluents and industrialdischarges and agricultural run-off. Estimated mass flows of PFOA and PFOS in rivers inNorthernChina arepresented (Table5). For this estimation, the singlepointmeasurementsofconcentrationsweremultipliedby averagedailydischarges ofwater. Themagnitudes ofmassflow for PFOA and PFOS in the five industrial regions in decreasing order were:GuantingbHohhotbTianjinbLiaoningbShanxi and GuantingbHohhotbShanxibTianjinbLiaoning.
Themass flow of PFOS generally increased from upstream to downstream in Hohhot,Shanxi and Liaoning, whereas the increasing mass flow of PFOS was accompanied by a
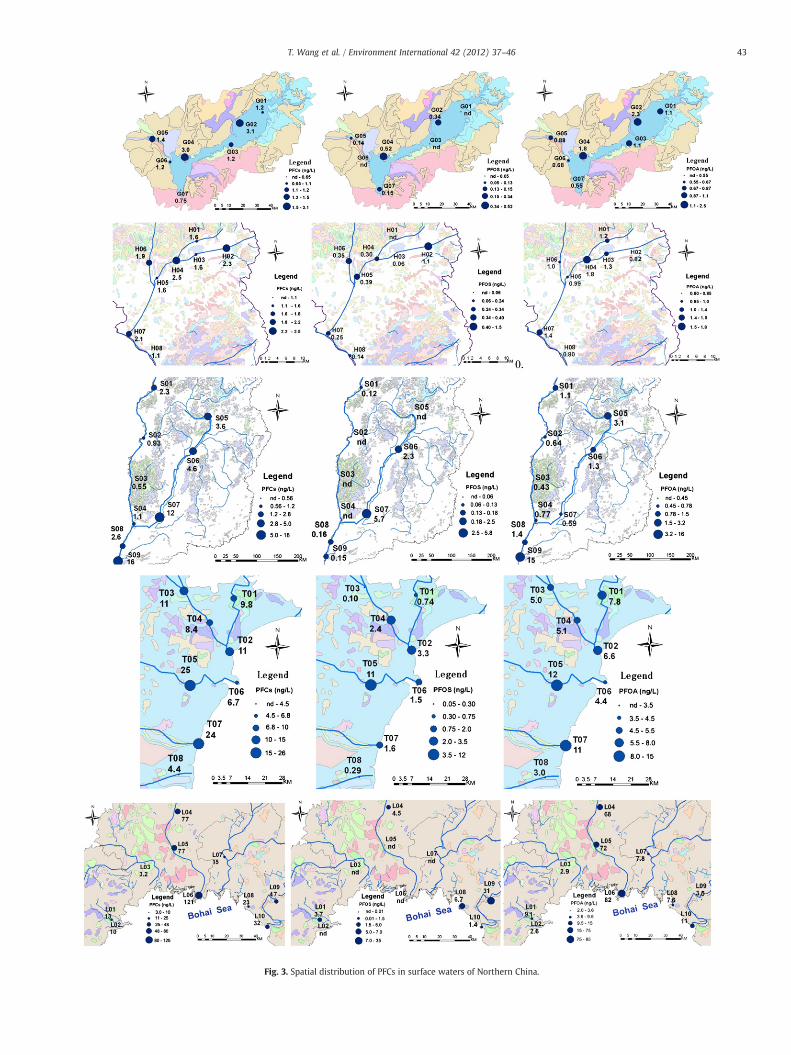
Fig. 3. Spatial distribution of PFCs in surface waters of Northern China.
43T. Wang et al. / Environment International 42 (2012) 37–46
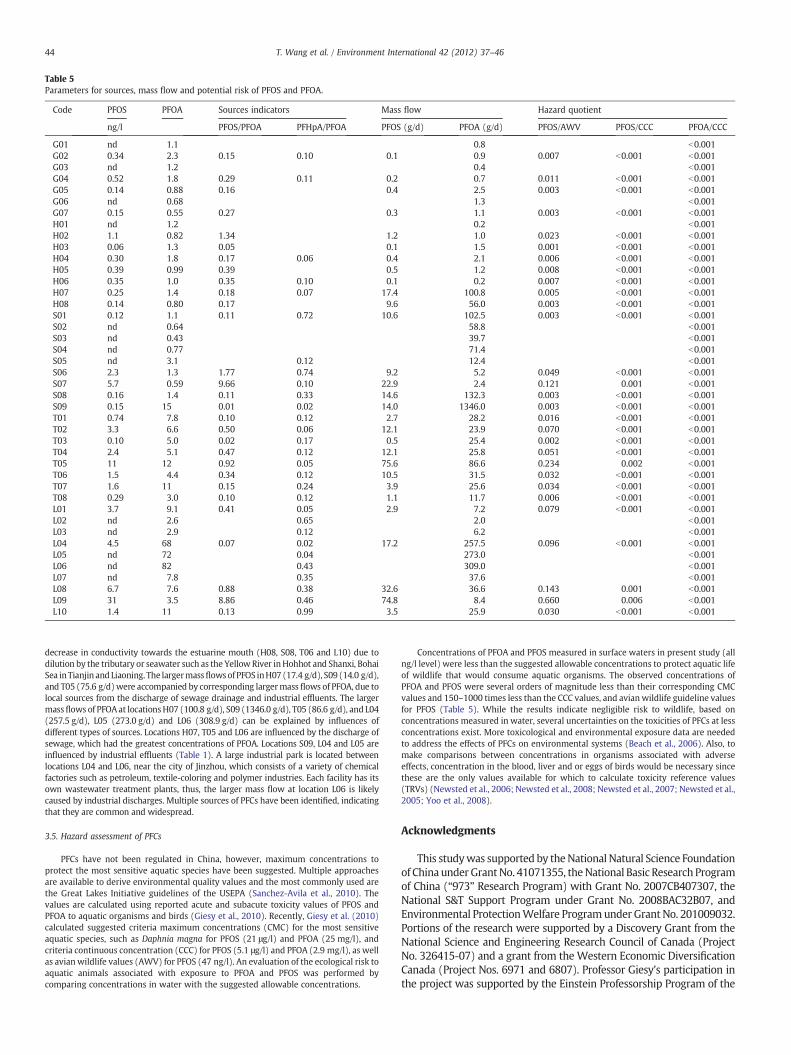
Table 5Parameters for sources, mass flow and potential risk of PFOS and PFOA.
Code PFOS PFOA Sources indicators Mass flow Hazard quotient
ng/l PFOS/PFOA PFHpA/PFOA PFOS (g/d) PFOA (g/d) PFOS/AWV PFOS/CCC PFOA/CCC
G01 nd 1.1 0.8 b0.001G02 0.34 2.3 0.15 0.10 0.1 0.9 0.007 b0.001 b0.001G03 nd 1.2 0.4 b0.001G04 0.52 1.8 0.29 0.11 0.2 0.7 0.011 b0.001 b0.001G05 0.14 0.88 0.16 0.4 2.5 0.003 b0.001 b0.001G06 nd 0.68 1.3 b0.001G07 0.15 0.55 0.27 0.3 1.1 0.003 b0.001 b0.001H01 nd 1.2 0.2 b0.001H02 1.1 0.82 1.34 1.2 1.0 0.023 b0.001 b0.001H03 0.06 1.3 0.05 0.1 1.5 0.001 b0.001 b0.001H04 0.30 1.8 0.17 0.06 0.4 2.1 0.006 b0.001 b0.001H05 0.39 0.99 0.39 0.5 1.2 0.008 b0.001 b0.001H06 0.35 1.0 0.35 0.10 0.1 0.2 0.007 b0.001 b0.001H07 0.25 1.4 0.18 0.07 17.4 100.8 0.005 b0.001 b0.001H08 0.14 0.80 0.17 9.6 56.0 0.003 b0.001 b0.001S01 0.12 1.1 0.11 0.72 10.6 102.5 0.003 b0.001 b0.001S02 nd 0.64 58.8 b0.001S03 nd 0.43 39.7 b0.001S04 nd 0.77 71.4 b0.001S05 nd 3.1 0.12 12.4 b0.001S06 2.3 1.3 1.77 0.74 9.2 5.2 0.049 b0.001 b0.001S07 5.7 0.59 9.66 0.10 22.9 2.4 0.121 0.001 b0.001S08 0.16 1.4 0.11 0.33 14.6 132.3 0.003 b0.001 b0.001S09 0.15 15 0.01 0.02 14.0 1346.0 0.003 b0.001 b0.001T01 0.74 7.8 0.10 0.12 2.7 28.2 0.016 b0.001 b0.001T02 3.3 6.6 0.50 0.06 12.1 23.9 0.070 b0.001 b0.001T03 0.10 5.0 0.02 0.17 0.5 25.4 0.002 b0.001 b0.001T04 2.4 5.1 0.47 0.12 12.1 25.8 0.051 b0.001 b0.001T05 11 12 0.92 0.05 75.6 86.6 0.234 0.002 b0.001T06 1.5 4.4 0.34 0.12 10.5 31.5 0.032 b0.001 b0.001T07 1.6 11 0.15 0.24 3.9 25.6 0.034 b0.001 b0.001T08 0.29 3.0 0.10 0.12 1.1 11.7 0.006 b0.001 b0.001L01 3.7 9.1 0.41 0.05 2.9 7.2 0.079 b0.001 b0.001L02 nd 2.6 0.65 2.0 b0.001L03 nd 2.9 0.12 6.2 b0.001L04 4.5 68 0.07 0.02 17.2 257.5 0.096 b0.001 b0.001L05 nd 72 0.04 273.0 b0.001L06 nd 82 0.43 309.0 b0.001L07 nd 7.8 0.35 37.6 b0.001L08 6.7 7.6 0.88 0.38 32.6 36.6 0.143 0.001 b0.001L09 31 3.5 8.86 0.46 74.8 8.4 0.660 0.006 b0.001L10 1.4 11 0.13 0.99 3.5 25.9 0.030 b0.001 b0.001
44 T. Wang et al. / Environment International 42 (2012) 37–46
decrease in conductivity towards the estuarine mouth (H08, S08, T06 and L10) due todilution by the tributary or seawater such as the YellowRiver inHohhot and Shanxi, BohaiSea inTianjin and Liaoning. The largermassflowsofPFOS inH07 (17.4 g/d), S09 (14.0 g/d),and T05 (75.6 g/d)were accompanied by corresponding largermass flows of PFOA, due tolocal sources from the discharge of sewage drainage and industrial effluents. The largermassflows of PFOAat locationsH07 (100.8 g/d), S09 (1346.0 g/d), T05 (86.6 g/d), and L04(257.5 g/d), L05 (273.0 g/d) and L06 (308.9 g/d) can be explained by influences ofdifferent types of sources. Locations H07, T05 and L06 are influenced by the discharge ofsewage, which had the greatest concentrations of PFOA. Locations S09, L04 and L05 areinfluenced by industrial effluents (Table 1). A large industrial park is located betweenlocations L04 and L06, near the city of Jinzhou, which consists of a variety of chemicalfactories such as petroleum, textile-coloring and polymer industries. Each facility has itsown wastewater treatment plants, thus, the larger mass flow at location L06 is likelycaused by industrial discharges. Multiple sources of PFCs have been identified, indicatingthat they are common and widespread.
3.5. Hazard assessment of PFCs
PFCs have not been regulated in China, however, maximum concentrations toprotect the most sensitive aquatic species have been suggested. Multiple approachesare available to derive environmental quality values and the most commonly used arethe Great Lakes Initiative guidelines of the USEPA (Sanchez-Avila et al., 2010). Thevalues are calculated using reported acute and subacute toxicity values of PFOS andPFOA to aquatic organisms and birds (Giesy et al., 2010). Recently, Giesy et al. (2010)calculated suggested criteria maximum concentrations (CMC) for the most sensitiveaquatic species, such as Daphnia magna for PFOS (21 μg/l) and PFOA (25 mg/l), andcriteria continuous concentration (CCC) for PFOS (5.1 μg/l) and PFOA (2.9 mg/l), as wellas avian wildlife values (AWV) for PFOS (47 ng/l). An evaluation of the ecological risk toaquatic animals associated with exposure to PFOA and PFOS was performed bycomparing concentrations in water with the suggested allowable concentrations.
Concentrations of PFOA and PFOS measured in surface waters in present study (allng/l level) were less than the suggested allowable concentrations to protect aquatic lifeof wildlife that would consume aquatic organisms. The observed concentrations ofPFOA and PFOS were several orders of magnitude less than their corresponding CMCvalues and 150–1000 times less than the CCC values, and avian wildlife guideline valuesfor PFOS (Table 5). While the results indicate negligible risk to wildlife, based onconcentrations measured in water, several uncertainties on the toxicities of PFCs at lessconcentrations exist. More toxicological and environmental exposure data are neededto address the effects of PFCs on environmental systems (Beach et al., 2006). Also, tomake comparisons between concentrations in organisms associated with adverseeffects, concentration in the blood, liver and or eggs of birds would be necessary sincethese are the only values available for which to calculate toxicity reference values(TRVs) (Newsted et al., 2006; Newsted et al., 2008; Newsted et al., 2007; Newsted et al.,2005; Yoo et al., 2008).
Acknowledgments
This studywas supported by theNational Natural Science Foundationof China under GrantNo. 41071355, theNational Basic Research Programof China (“973” Research Program) with Grant No. 2007CB407307, theNational S&T Support Program under Grant No. 2008BAC32B07, andEnvironmental ProtectionWelfare Programunder Grant No. 201009032.Portions of the research were supported by a Discovery Grant from theNational Science and Engineering Research Council of Canada (ProjectNo. 326415-07) and a grant from the Western Economic DiversificationCanada (Project Nos. 6971 and 6807). Professor Giesy's participation inthe project was supported by the Einstein Professorship Program of the
45T. Wang et al. / Environment International 42 (2012) 37–46
Chinese Academy of Sciences. This work was also supported, in part, bythe National Research Foundation (NRF) of Korea Grants funded by theKorean Government (MEST) (Nos. 2009-0067768 and 2010-0015275).Finally, we thank the editors and reviewers for their valuable commentsand suggestions.
References
Ahrens L, Felizeter S, Sturm R, Xie ZY, Ebinghaus R. Polyfluorinated compounds in wastewater treatment plant effluents and surface waters along the River Elbe, Germany.Mar Pollut Bull 2009;58:1326–33.
Bao J, Jin YH, LiuW, Ran XR, Zhang ZX. Perfluorinated compounds in sediments from theDaliao River system of northeast China. Chemosphere 2009;77:652–7.
Bao J, Liu W, Liu L, Jin YH, Ran XR, Zhang ZX. Perfluorinated compounds in urban riversediments from Guangzhou and Shanghai of China. Chemosphere 2010;80:123–30.
Barber JL, Berger, Urs, Chaemfa, Chakra, Huber, Sandra, Jahnke, Annika, Temme,Christian, Jones, Kevin C. Analysis of per- and polyfluorinated alkyl substances in airsamples from Northwest Europe. J Environ Monit 2007;9:530–41.
Beach SA, Newsted JL, Coady K, Giesy JP. Ecotoxicological evaluation of perfluoroocta-nesulfonate (PFOS). Rev Environ Contam Toxicol 2006;186:133–74.
Becker AM, Gerstmann S, Frank H. Perfluorooctanoic acid and perfluorooctanesulfonate in the sediment of the Roter Main river, Bayreuth, Germany. EnvironPollut 2008;156:818–20.
Benskin JP, Bataineh M, Martin JW. Simultaneous characterization of perfluoroalkylcarboxylate, sulfonate, and sulfonamide isomers by liquid chromatography–tandem mass spectrometry. Anal Chem 2007;79:6455–64.
Boulanger B, Vargo J, Schnoor JL, Hornbuckle KC. Detection of perfluorooctanesurfactants in Great Lakes water. Environ Sci Technol 2004;38:4064–70.
Chaemfa C, Barber JL, Huber S, Breivik K, Jones KC. Screening for PFOS and PFOA inEuropean air using passive samplers. J Environ Monit 2010;12:1100–9.
Chen CL, Lu YL, Zhang X, Geng J, Wang TY, Shi YJ, et al. A review of spatial andtemporal assessment of PFOS and PFOA contamination in China. Chem Ecol2009;25:163–77.
Chen CL, Wang TY, Khim JS, Luo W, Jiao WT, Lu YL, et al. Perfluorinated compounds inwater and sediment from coastal regions of northern Bohai Sea, China. Chem Ecol2011;27:165–76.
Cui XY. Analyzing and calculating indicators of industrialization in China. Econ Assess2003;6:12–6.
Delinsky AD, Strynar MJ, McCann PJ, Varns JL, McMillan L, Nakayama SF, et al.Geographical distribution of perfluorinated compounds in fish from Minnesotalakes and rivers. Environ Sci Technol 2010;44:2549–54.
Dreyer AaE R. Polyfluorinated compounds in ambient air from ship- and land-basedmeasurements in northern Germany. Atmosphere. Environment 2009;43:1527–35.
Giesy JP, Kannan K. Global distribution of perfluorooctane sulfonate in wildlife. EnvironSci Technol 2001;35:1339–42.
Giesy JP, Kannan K. Perfluorochemical surfactants in the environment. Environ SciTechnol 2002;36:146A–52A.
Giesy JP, Mabury SA, Martin JW, Kannan K, Jones PD, Newsted JL, et al. Perfluorinatedcompounds in the Great Lakes. Handb Environ Chem 2006:391–438.
Giesy JP, Naile JE, Khim JS, Jones PD, Newsted JL. Aquatic toxicology of perfluorinatedchemicals. Rev Environ Contam Toxicol 2010;202:1-52.
Hansen KJ, Johnson HO, Eldridge JS, Butenhoff JL, Dick LA. Quantitative characterizationof trace levels of PFOS and PFOA in the Tennessee River. Environ Sci Technol2002;36:1681–5.
Higgins CP, Field JA, Criddle CS, Luthy RG. Quantitative determination of perfluor-ochemicals in sediments and domestic sludge. Environ Sci Technol 2005;39:3946–56.
Houde M, Bujas TAD, Small J, Wells RS, Fair PA, Bossart GD, et al. Biomagnification ofperfluoroalkyl compounds in the bottlenose dolphin (Tursiops truncatus) food web.Environ Sci Technol 2006;40:4138–44.
HuWY,Wang TY, Khim JS, LuoW, JiaoWT, Lu YL, et al. HCH and DDT in sediments frommarine and adjacent riverine areas of North Bohai Sea, China. Arch Environ ContamToxicol 2010;59:71–9.
Jin YH, Ding M, Di C, Wang L, Dong GH, Shu WQ, Zhang YH. Monitoring the status ofPFOS and PFOA pollution in Sanxia reservoir area of the Yangtze river and surfacewater of Wuhan. Ecol Environ 2006;15:486–9.
Ju XD, Jin YH, Sasaki K, Saito N. Perfluorinated surfactants in surface, subsurface waterand microlayer from Dalian Coastal waters in China. Environ Sci Technol 2008;42:3538–42.
Kumar KS, Zushi Y, Masunaga S, Gilligan M, Pride C, Sajwan KS. Perfluorinated organiccontaminants in sediment and aquatic wildlife, including sharks, from Georgia,USA. Mar Pollut Bull 2009;58:621–9.
Kunacheva C, Boontanon SK, Fujii S, Tanaka S, Musirat C, Artsalee C, et al. Contaminationof perfluorinated compounds (PFCs) in Chao Phraya River and Bangpakong River,Thailand. Water Sci Technol 2009;60:975–82.
Lein NPH, Fujii S, Tanaka S, Nozoe M, Tanaka H. Contamination of perfluorooctanesulfonate (PFOS) and perfluorooctanoate (PFOA) in surface water of the Yodo Riverbasin (Japan). Desalination 2008;226:338–47.
Liu W, Jin YH, Quan X, Sasaki K, Saito N, Nakayama SF, et al. Perfluorosulfonates andperfluorocarboxylates in snow and rain in Dalian, China. Environ Int 2009;35:737–42.
Luo W, Wang TY, Lu YL, Giesy JP, Shi YJ, Zheng YM, et al. Landscape ecology of theGuanting Reservoir, Beijing, China: multivariate and geostatistical analyses ofmetals in soils. Environ Pollut 2007;146:567–76.
Luo W, Lu Y, Wang T, Hu W, Jiao W, Naile J, et al. Ecological risk assessment of arsenicand metals in sediments of coastal areas of northern Bohai and Yellow Seas, China.Ambio J Hum Environ 2010;39:367–75.
Mak YL, Taniyasu S, Yeung LWY, Lu GH, Jin L, Yang YL, et al. Perfluorinated compoundsin tap water from China and several other countries. Environ Sci Technol 2009;43:4824–9.
Ministry of Environmental Protection of China. Preliminary information on riskmanagement evaluation of PFOS in China. http://chm.pops.int/Portals/0/Repository/UNEP-POPS-POPRC-DRME-08-CHI-SCCP.English.PDF 2008.
Naile JE, Khim JS, Wang TY, Chen CL, Luo W, Kwon BO, et al. Perfluorinated compoundsin water, sediment, soil and biota from estuarine and coastal areas of Korea.Environ Pollut 2010;158:1237–44.
Nakata H, Kannan K, Nasu T, Cho HS, Sinclair E, Takemura A. Perfluorinatedcontaminants in sediments and aquatic organisms collected from shallow waterand tidal flat areas of the Ariake Sea, Japan: environmental fate of perfluorooctanesulfonate in aquatic ecosystems. Environ Sci Technol 2006;40:4916–21.
Newsted JL, Jones PD, Coady K, Giesy JP. Avian toxicity reference values forperfluorooctane sulfonate. Environ Sci Technol 2005;39:9357–62.
Newsted JL, Beach SA, Gallagher SP, Giesy JP. Pharmacokinetics and acute lethality ofperfluorooctanesulfonate (PFOS) to juvenile mallard and northern bobwhite. ArchEnviron Contam Toxicol 2006;50:411–20.
Newsted JL, Coady KK, Beach SA, Butenhoff JL, Gallagher S, Giesy JP. Effects ofperfluorooctane sulfonate on mallard and northern bobwhite quail exposedchronically via the diet. Environ Toxicol Pharmacol 2007;23:1–9.
Newsted JL, Beach SA, Gallagher SP, Giesy JP. Acute and chronic effects ofperfluorobutane sulfonate (PFBS) on the mallard and northern bobwhite quail.Arch Environ Contam Toxicol 2008;54:535–45.
Pan YY, Shi YL, Wang YW, Cai YQ, Jiang GB. Investigation of perfluorinated compounds(PFCs) in mollusks from coastal waters in the Bohai Sea of China. J Environ Monit2010;12:508–13.
Rostkowski P, Yamashita N, So IMK, Taniyasu S, Lam PKS, Falandysz J, et al.Perfluorinated compounds in streams of the Shihwa industrial zone and LakeShihwa, South Korea. Environ Toxicol Chem 2006;25:2374–80.
Saito N, Sasaki K, Nakatome K, Harada K, Yoshinaga T, Koizumi A. Perfluorooctanesulfonate concentrations in surface water in Japan. Arch Environ Contam Toxicol2003;45:149–58.
Sakurai T, Serizawa S, Isobe T, Kobayashi J, Kodama K, Kume G, Lee JH, Maki H, ImaizumiY, Suzuki N, Horiguchi T, Morita M, Shiraishi H. Spatial, Phase, And TemporalDistributions of Perfluorooctane Sulfonate (PFOS) and Perfluorooctanoate (PFOA)in Tokyo Bay, Japan. Environ Sci Technol 2010;44:4110–5.
Sanchez-Avila J, Meyer J, Lacorte S. Spatial distribution and sources of perfluorochem-icals in the NW Mediterranean coastal waters (Catalonia, Spain). Environ Pollut2010;158:2833–40.
Senthilkumar K, Ohi E, Sajwan K, Takasuga T, Kannan K. Perfluorinated compounds inriver water, river sediment, market fish, and wildlife samples from Japan. B EnvironContam Toxicol 2007;79:427–31.
Shi HB, Liang LN, Jiang GB, Jin XL. The speciation and bioavailability of mercury insediments of Haihe River, China. Environ Int 2005;31:357–65.
Shi YL, Pan YY, Yang RQ, Wang YW, Cai YQ. Occurrence of perfluorinated compounds infish from Qinghai–Tibetan Plateau. Environ Int 2010;36:46–50.
Simcik MF, Dorweiler KJ. Ratio of perfluorochemical concentrations as a tracer ofatmospheric deposition to surface waters. Environ Sci Technol 2005;39:8678–83.
So MK, Taniyasu S, Yamashita N, Giesy JP, Zheng J, Fang Z, et al. Perfluorinatedcompounds in coastal waters of Hong Kong, South China, and Korea. Environ SciTechnol 2004;38:4056–63.
So MK, Miyake Y, Yeung WY, Ho YM, Taniyasu S, Rostkowski P, et al. Perfluorinatedcompounds in the Pearl River and Yangtze River of China. Chemosphere 2007;68:2085–95.
Taniyasu S, Kannan K, Horii Y, Hanari N, Yamashita N. A survey of perfluorooctanesulfonate and related perfluorinated organic compounds in water, fish, birds, andhumans from Japan. Environ Sci Technol 2003;37:2634–9.
Wang TY, Lu YL, Shi YJ, Zhang H. Spatial distribution of organochlorine pesticideresidues in soils surrounding Guanting Reservoir, People's Republic of China. BEnviron Contam Toxicol 2005a;74:623–30.
Wang TY, Yonglong L, Hong Z, Yajuan S. Contamination of persistent organic pollutants(POPs) and relevant management in China. Environ Int 2005b;31:813–21.
Wang TY, Lu YL, Shi YJ, Giesy JP, Luo W. Organochlorine pesticides in soils aroundGuanting Reservoir, China. Environ Geochem Health 2007;29:491–501.
Wang T, Wang YW, Liao CY, Cai YQ, Jiang GB. Perspectives on the inclusion ofperfluorooctane sulfonate into the Stockholm Convention on persistent organicpollutants. Environ Sci Technol 2009;43:5171–5.
Yamashita N, Kannan K, Taniyasu S, Horii Y, Okazawa T, Petrick G, et al. Analysis ofperfluorinated acids at parts-per-quadrillion levels in seawater using liquidchromatography–tandem mass spectrometry. Environ Sci Technol 2004;38:5522–8.
Yamashita N, Kannan K, Taniyasu S, Horii Y, Petrick G, Gamo T. A global survey ofperfluorinated acids in oceans. Mar Pollut Bull 2005;51:658–68.
Yeung LWY, Yamashita N, Taniyasu S, Lam PKS, Sinha RK, Borole DV, et al. A survey ofperfluorinated compounds in surface water and biota including dolphins fromthe Ganges River and in other waterbodies in India. Chemosphere 2009;76:55–62.
Yoo H, Kannan K, Kim SK, Lee KT, Newsted JL, Giesy JP. Perfluoroalkyl acids in the eggyolk of birds from Lake Shihwa, Korea. Environ Sci Technol 2008;42:5821–7.

46 T. Wang et al. / Environment International 42 (2012) 37–46
Zhang ZH, Zhu MY, Wang ZL, Wang J. Monitoring and managing pollution load in BohaiSea, PR China. Ocean Coastal Manag 2006;49:706–16.
Zhang P, Song JM, Yuan HM. Persistent organic pollutant residues in the sediments andmollusks from the Bohai Sea coastal areas, North China: an overview. Environ Int2009;35:632–46.
Zhao X, Li J, Shi Y, Cai Y, Mou S, Jiang G. Determination of perfluorinated compounds inwastewater and river water samples by mixed hemimicelle-based solid-phaseextraction before liquid chromatography-electrospray tandem mass spectrometrydetection. J Chromatogr A 2007;1154:52–9.