infrastructure planning for industrialization in haridwar city a ...
173
INFRASTRUCTURE PLANNING FOR INDUSTRIALIZATION IN HARIDWAR CITY A DISSERTATION Submitted in partial fulfillment of the Requirements for the award of the degree of MASTER OF URBAN AND RURAL PLANNING By ASHISH K. KAUSHIK DEPARTMENT OF ARCHITECTURE & PLANNING INDIAN INSTITUTE OF TECHNOLOGY, ROORKEE ROORKEE - 247 667 (INDIA) JUNE 2007
-
Upload
khangminh22 -
Category
Documents
-
view
2 -
download
0
Transcript of infrastructure planning for industrialization in haridwar city a ...

INFRASTRUCTURE PLANNING FOR INDUSTRIALIZATION IN HARIDWAR CITY
A DISSERTATION Submitted in partial fulfillment of the
Requirements for the award of the degree of
MASTER OF URBAN AND RURAL PLANNING
By ASHISH K. KAUSHIK
DEPARTMENT OF ARCHITECTURE & PLANNING INDIAN INSTITUTE OF TECHNOLOGY, ROORKEE
ROORKEE - 247 667 (INDIA) JUNE 2007

ACKNOWLEDGEMENT
With a profound sense of gratitude I express my ineptness and sincere thanks to my guide and
philosopher Professor Raj esh Chandra, Department of Architecture and Planning, Indian
Institute of Technology, Roorkee for initiating the project and providing the most valuable
and attentive guidance throughout the project work.
Also, I extend my thanks to Mr. Rakesh Joshi (B.E. Civil), for providing me the necessary
support to assess the secondary data as described in the D.P.R. prepared by the GHK
International in the context of Jwaharlal Nehru National Urban Renewal Mission for
Haridwar city.
I would also like to thank Mr. Satpal Brahmchari (Chairman, Haridwar Nagar Palika
Parishad) to support me with the records and statistical data regarding the functioning of
HNNP.
Dedicating this dissertation to my parents I thank my wife and children for their valuable
moral support all the time throughout the project. Their invaluable blessings and good wishes
proved to be the catalyst in boosting up the quality of this dissertation.
Last, but not the least, a special bouquet of thanks to all friends who have contributed to this
work directly or indirectly.
Ar. shish K. Kauhsik
M.U.R.P.
Roorkee.

CANDIDATE'S DECLARATION
I hereby certify that the work which is being presented in this dissertation entitled
"INFRASTRUCTURE PLANNING FOR INDUSTRIALIZATION IN HARIDWAR CITY"
in partial fulfillment of the requirement of the award of the degree of "MASTER OF URBAN
AND RURAL PLANNING" submitted in the department of Architecture and Planning,
Indian Institute of Technology, Roorkee, is an authentic record of my own work (except for a
few instances and statements used to describe the government policies and quotes and
secondary data which is obtained from various government and non government offices and
persons referenced in this dissertation) carried out during the period of Six months from
January 2006 to June 2007 under the strict supervision of Professor Rajesh Chandra
(Department of Architecture and Planning, I.I.T., Roorkee, India).
The matter embodied in this dissertation has not been submitted by me for the award of any
other degree.
Dated 29th June, 2007 Ar. shish K. Kaushik
This is to certify that the above statement by the candidate is true to the best of my
knowledge and belief
Professor Rajesh Chandra
Department of Architecture and Planning
I.I.T. Roorkee, India. PIN 247667

Contents:
Chapter 1: Industries in Haridwar 1...20
1.1 Introduction
1.1.1 Fiscal incentives to the industries in Uttrakhand
Development of industrial infrastructure
1.1.2 Haridwar city background
1.1.3 Regional linkages
1.1.4 Historical background of Haridwar
1.2 Industries in past
1.2.1 Tourism
1.2.2 Bharat Heavy Electricals Limited (BHEL)
1.2.3 B.H.E.L. ancillary estate
1.2.4 Haridwar industrial area
1.2.5 Bhadrabad industrial area
1.2.6 Integrated industrial estate ( IIE) & industrial infrastructure development
centre (IIDC)
1.3 Potentials of industrial developments in Haridwar
1.3.1 Factors affecting the potentials of new developments of new industries in
Haridwar
1.3.2 Availability of alternative sites
1.3.3 Legal frameworks
1.4 Need for infrastructure planning
1.4.1 The pressure on urban infrastructure
1.5 Need to study
1.5.1 Understanding the trends and potentials
1.5.2 Data projections

Chapter 2: Aims and Objectives
2.0 Aims and objectives
2.1 Aims
2.2 Objectives
2.2.1 Private sector involvement
2.2.2 Reforming land policies
2.2.3 Gap analysis between analysis and supply
2.2.4 Ensuring prolonged industrialization
2.2.5 Identification of growth pillars and support pillars
21...30
Chapter 3: Scope, Limitations and Assumptions 31...36
3.0 Scope, Limitations and assumptions.
3.1 Scope
3.1.1.1 Gap analysis
3.1.2 Strategy formulation
3.1.3 Ecological sustainability
3.2 Limitations
3.2.1 The geographical area
3.2.2 Extents of industrial area
3.2.3 Infrastructural services and facilities
3.2.4 Strategy for development
3.3 Assumptions
Chapter 4: Literature review 37...48
4.1 Office memorandum

4.1.1 Fiscal incentives
4.1.2. Development of industrial infrastructure
4.1.3 Other incentives
4.1.4 Thrust sector industries
4.1.5 Constitution of the nodal development agency ( SIDCUL)
4.1.6 Opportunities of employment generation in Uttrakhand
4.2 Uttrakhand at a glance
4.3 The pressure on urban infrastructure
4.3.1 The demand side management
4.3.2 Alternative planning philosophy
Chapter 5: Case study of Ludhiana
5.1 Ludhiana — An Introduction
5.1.1 Area and Population
5.1.2 Location
5.1.3 Connectivity
5.1.4 Historic background
5.1.5 Climatic conditions
5.1.6 Demographic profile
5.1.7 Peripheral area status
5.2 Status of infrastructural facilities
5.2.1 Water supply
5.2.2 Road network
5.2.3 Sewer, MSW services
5.3 Planning issues in Ludhiana city
5.4 Demographic, economic and land use patterns
49...68

5.4.1 Demographic profile
5.4.2 Population density
5.4.3 Slum population
5.4.4 Literacy and school going children
5.4.5 Economic base
5.4.6 Proposed land use
5.5 Infrastructural status and proposals
5.5.1 Water supply
5.5.2 Sewerage
5.5.3 Solid waste management
5.5.4 City roads and traffic conditions
5.5.4.1 Road network and hierarchy
5.5.4.2 Major issues
5.5.5 City public transport
5.5.5.1 Issues regarding public transportation system
5.5.5.2 Other modes of public transport
5.5.6 Inter city public transport
5.5.7 Freight transport
5.5.8 Bridges, flyovers, ROB's & RUB's
5.5.9 Issues regarding roads and transportation
Chapter 6: Methodology 69...72
6.1Methodology

Chapter 7: Infrastructure Planning for
Industrialization in Haridwar Urban Agglomeration 73...128
7.1 Introduction
7.1.1 Physical growth and environmental aspects
7.1.2 Water supply
7.1.3 Sewerage
7.1.4 Storm water drainage
7.1.5 Solid waste management
7.1.6 Roads and transportation
7.1.7 Urban poor
7.1.8 Institution and governance
7.1.9 Municipal finance, HNPP finance and para-statals
7.2 Estimated cost of various infrastructural services
7.3 Demographic profile
7.3.1 Decadal population growth
7.3.2 Household size and numbers
7.3.3 Sex ratio
7.3.4 Literacy
7.3.5 Employment
7.3.6 Income and expenditures
7.3.7 Migration
7.4 Urban poverty profile
7.4.1 Poverty and vulnerability
7.4.2 Urban poverty profile of Haridwar
7.4.3 Household profile

7.4.4 Situation analysis
7.4.4.1 Water supply
7.4.4.2 Sanitation and sewerage
7.4.4.3 Solid waste management
7.4.4.4 Storm water drainage
7.4.4.5 Approach roads and street lights
7.4.4.6 Priorities
7.4.4.7 Health and hygiene
7.4.4.8 Key urban social issues
7.5 Economic development
7.5.1 Economic base of the city
7.5.2 Economic growth potential
7.6 Efforts for planned developments
7.7 Review of master plan 2001
7.8 Housing
7.9 Future growth of Haridwar
7.9.1 Physical constrains
.9.2 Directions for future growth
7.9.3 Key issues related to future growth
7.10 Environmental quality
7.10.1 Water quality
7.10.2 Air quality
7.10.3 Key environmental management issues
7.11 Municipal infrastructure
7.11.1 Water supply
7.11.1.1 Water sources and generation of water

7.11.1.2 Treatment of water
7.11.1.3 Distribution system
7.11.1.4 Unaccounted for water
7.11.1.5 Per capita water supply
7.11.1.6 Water quality
7.11.1.7 Operation and maintenance
7.11.1.8 Summary of present status of water supply system of Haridwar.
7.11.1.9 Key issues
7.12 Sewerage and sanitation
7.12.1 Coverage area of sewerage network
7.12.2 Treatment and disposal of sewage
7.13 Storm water drainage
7.13.1 Rainfall
7.13.2 Drainage system
7.13.3 Drainage characteristics & problems
7.13.4 Issues and problems of drainage
7.13.5 Situation analysis
7.13.6 Key issues
7.14 Solid waste management
7.14.1 Municipal solid waste generation
7.14.2 Waste composition and characteristics
7.14.3 Collection, storage and transportation
7.14.4 Waster disposal
7.14.5 Key issues
7.15 Roads and transport

7.15.1 Road network, junction and traffic management- Existing situation of road
network
7.15.2 Junctions existing situation
7.15.3 Existing situation of traffic flow congestion and management
7.15.4 Transport system's characteristics
7.15.5 Existing situation of public transportation system
7.15.6 Key issues
Chapter 8: "SWOT" analysis
8.1 Introduction
8.2 SWOT analysis
8.2.1 City level SWOTR analysis
8.2.1.1 Strengths
8.2.1.2 Weakness
8.2.1.3 Opportunities
8.2.1.4 Threats
129...136
Chapter 9: Strategies for development
9.1 Economic development
9.1.1 Economic development strategies
9.2 Physical growth and urban environment
9.3 Water supply
9.3.1 Vision
9.3.2 Strategies
9.4 Sewerage
9.4.1 Vision
137...162

9.4.2 Strategies
9.4.3 Action plan for Haridwar sewerage system
9.5 Storm water drainage
9.5.1 Vision
9.5.2 Strategies
9.6 Solid waste management
9.6.1 Vision
9.6.2 Strategies
9.7 Roads and transport
9.7.1 Vision
9.7.2 Strategies
9.7.3 Pedestrian facilities
9.7.4 Off street parking
9.7.5 Public transport system for Haridwar city
9.8 Power — Energy
9.8.1 Vision
9.8.2 Strategy
9.8.3 Distribution reforms and energy efficiency
9.9 Housing
9.9.1 Vision
9.9.2 Strategy

Chapter 1: HARID WAR AN INTRODUCTION

1.1 Introduction:
The Hon'ble Prime Minister, during the visit to Uttrakhand from 29th to 31st March, 2002,
had, inter-alia made an announcement that "Tax and Central Excise" concessions to attract
investments in the industrial sector will be worked out
for the Special Category States including Uttrakhand.
The industries eligible for such incentives will be
environment friendly with potentials for local
employment generation and use of local resources.'
Figure 1 Satellite image of Uttrakhand In pursuance of the above announcement, discussion on Strategy and Action Plan for
Development of Industries and generation of employment in the states of Uttrakhand and
Himachal Pradesh were held with the various related Ministries/agencies on the issue, of
infrastructure, development, financial concessions and to provide easy market access, The
new initiatives would provide the required incentives as well as an enabling environment for
industrial development, improve availability of capital and increase market access to provide
a fillip to the private investment in the state.
Accordingly, it has been decided to provide the following package of incentives for the states
of Uttrakhand and Himachal Pradesh.
1.1.1 Fiscal Incentives to new Industrial Units and to existing units on their substantial
expansion:
(I). New industrial units and existing industrial units on their substantial expansion as
defined, set up in Growth Centres, Industrial Infrastructure Development Centres (IIDCs),
Industrial Estates, Export Processing Zones, Theme Parks (Food Processing Parks, Software
Infrastructure Planning For Industrialization in Haridwar. 1

Technology Parks, etc.) as stated in and other areas as notified from time to time by the
Central Government, are entitled to :
(a) 100% (hundred percent) outright excise duty exemption for a period of 10 years from the
date of commencement of commercial production.
(b) 100% income tax exemption for initial period of five years and thereafter 30% for
companies and 25% for other than companies for a further period of five years for the entire
states of Uttrakhand and Himachal Pradesh from the date of commencement of commercial
production.
(II) All New industries in the notified location would be eligible for capital investment
subsidy @ 15% of their investment in plant & machinery, subject to a ceiling of Rs.30 lakh.
The existing units will also be entitled to this subsidy on their substantial expansion, as
defined.
(III). Thrust Sector Industries as mentioned in Armexure-II are entitled to similar concessions
as mentioned in pera 3(1) & (II) above in the entire state of Uttrakhand and Himachal Pradesh
without any area restrictions.
1.1.2 Development of Industrial Infrastructure:
(i) The funding pattern under the Growth Centre Scheme currently envisaging a Central
assistance of Rs.10 crores per centre is raised to Rs.15 crores per centre.
(ii) The financing pattern of Integrated Infrastructure Development Centres (IIDC) between
Government of India and SIDBI will change from 2:3 to 4:1, and the GOI funds would be in
the nature of a grant, so as to provide the required infrastructural support.
2 Infrastructure Planning For Industrialization in Haridwar.

As a result of these benefits, Uttrakhand has attracted a large no of industrial houses
for investment in industrial sector. To cope up with the increasing requirement the State
Industrial Development Corporation of Uttrakhand Limited (SIDCUL) was constituted to
regulate the industrial developments in a meticulous planned manner. Since then,
S.I.D.C.U.L. is working as a nodal agency regarding the provision of necessary amenities for
industrial development in Uttrakhand. SIDCUL was constituted with prime objectives of
acquisition and allotment of land to the industries through planned development
(development of Industrial Estates, Growth centres, Theme parks, I.I.D.C.s etc.) and secondly
to channelise the fiscal benefits and subsidies to the industries as per the office memorandum
No. (10)/2001-NER government of India, Ministry of Commerce and Industry (Department
of Industrial Policy and Promotion) dated 7th Jan 2003, bearing the subject: "New Industrial
Policy and other Concessions for the state of Uttrakhand and the state of Himachal Pradesh".
With the rapid growth of industries, and subsequently of the urban population in Haridwar,
there has been a continuous accretion in size of urban centres both demographically and
spatially. Provision of necessary infrastructure has however, not kept pace with increasing
size of the city. As a result, burgeoning urban residential areas and upcoming industrial
developments are putting strain on already secant infrastructure leading to a point of collapse.
It is evident that the government alone, with limited budgetary resources, would not be in a
position to make up with the galloping backlog in urban infrastructure services, which are
also required to be improved, augmented and upgraded to meet the emerging needs of urban
areas.
With liberalization of economic policies, globalization of market economics, technological
advancements, de-centralization of planning and development functions, revitalization of
Infrastructure•Planning For Industrialization in Haridwar. 3

municipal agencies the role of private sector participation in development process would be
of vital importance.
Thus, at a glance, one can easily realize the need of ever increasing efforts in the small city of
Haridwar, where a large number of floating populations causes tremendous pressure on all
services. This study is a step in the direction of understanding the problems and their possible
solution regarding the conditions of physical Infrastructure in Haridwar City.
1.1.3 Haridwar City: Background
Haridwar had always been a religious centre and one
of the most sacred pilgrims as per the Hindu
Mythology. It is an established centre for Sanskrit
language and Hindu religion. The temples and Ghats
along the river Ganges are main attraction for
Figure 2 Har-Ki-Pauri
pilgrims and tourists.
The city is presently functioning as a centre of trade and commerce, services and educational
facilities in regional context. In recent years, since 2004, Haridwar has been undergoing a fast
paced industrial development as a consequence of the declaration of the fiscal benefits as
mentioned earlier. Soon the city is likely to be predominantly characterized as the regional
industrial hub, with tremendous potential for employment generation which in turn is likely
to invite a huge in-migration from nearby and distant places.
At present, Haridwar Urban Agglomeration (HUA) covers on area of 20119 Ha. with a
permanent population of 220767 (Males: 119534, Females 101533) with a sex ratio of 924
females per 1000 males. The overall literacy rate is 80.88% (males: 86.51%, Females:
4 Infrastructure Planning For Industrialization in Haridwar.

74.26%). The employment situation is quite alarming with a total of 59867 people working
(Males: 52298, Females: 5569).
The city has been growing at an annual rate of 2.9 %. It is situated on 29° 58' N longitudes
and 78°40' E latitude with an altitude of + 534 m from mean sea level.
1.1.4 Regional Linkages:
Airways: The nearest airport is at village Jolly-Grant (Doiwala) which is 48 km. on
Rishikesh-Dehradun Road. At present only chartered air-crafts operate in light passenger
capacities. The exercise to increase the passenger and aircraft capacities has been undertaken
by state government. The airport will soon start functionary for domestic regular flights by
the end of 2010.
Railways: Haridwar is well connected to almost all major cities in India v.i.z., Delhi,
Mumbai, Howrah, Lucknow, Agra etc.
Road Network: Roads provide most important mode of communication with other parts of
country, contributing to almost 80% of the total movement of goods and people. Some
important distances are — Rishikesh 24 km, Dehradun — 58 km, Devpryag- 94 km., Badrinath
— 324 km., Mathura- 344 km. Delhi — 200 km., Agra — 350 km.
1.1.5 Historical Background of Haridwar
Since time immemorial, Haridwar has been known as Mayapuri / Kapila / Gangesdwar /
Harihar region etc. The present area of Haridwar is just a fraction of what it has been
described as Mayapuri in Skand Purana which was bounded by Neela Parvat in East,
Vasheya River in West, Nagtirth in South and Ratna Stambh in North.
Infrastructure Planning For Industrialization in Haridwar. 5

Haridwar is known to be the worship place for priest Kapil. As per the descriptions in
puranas, when Holy Ganges reached the plains of Haridwar after descending from heaven, to
escape the wrath of any of the seven maharishis among Kashyap, Vashishtha, Yani,
Vishwamitra, Kamdagni, Bhardwaj and Gautam, it distributed its flow into seven streams so
that to flow through all the ashrams. Thus the place is still known as Saptrishi Ashram.
King Shewta also worshiped Lord Brahma at the same place and there after the king was
rewarded as whosoever will take a dip in Holy Ganges at this place will have the blessings of
Brahma, Vishnu and Mahesh all together. This place is presently known as Brahmakund or
popularly as Har-Ki-Pauri.
Around 3000 B.C. Pandava brothers owned a place known as Bhimgowda. King Ashoka also
ruled Haridwar which is evident by the presence of Ashoka Stambh.
Brathari, brother of King Vikramaditya, also worshiped here and, as a monument, king
Vikramaditya constructed the kund and the holy steps (stairs). Thereafter this place was
called Har-Ki-Pauri.
During the regime of king Harshvardhana the Chinese explorer Hawain- Sang visited India
for around 15 years and described Haridwar as Myun city which meant for present days
Mayapuri.
The Maha-Kumbh, celebrated every twelve years, has a great significance as per Hindu
Mythology.
Haridwar gained to glory during the regime of king `Akbar' when King Mansingh, friend and
minister in Akbar's ruling, laid the foundation of present days Haridwar.
6 Infrastructure Planning For Industrialization in Haridwar.

Figure 3 Industrial building, B.Ii.E.L
After descending 133 miles from Gangotri, Ganges finds the first plains in Haridwar. The
holy water of Ganges is being utilized for irrigation and other purposes since 1836 in
Haridwar.
1.2 INDUSTRIES IN PAST:
1.2.1 TOURISM: As an important pilgrimage, Haridwar has a developed economy due to
tourist and pilgrims. Needless to say, Haridwar sufficed its economy through trade &
commerce and educational services as an obvious outcome of spiritual and religious sanctity.
Tourism as an industry has always been the backbone of economy at micro level.
Also for major religious activities like Kumbh Mela, Ardh Kumbh Mela etc., The city attracts
a huge fund of the order of Rs. 400 crores from central government and other financial
institutes for the management of such events which is utilized for the provision of temporary
infrastructural facilities and services to cater to the needs of large number of floating
population.
1.2.2 BHARAT HEAVY INDUSTRIES LIMITED (B.H.E.L.)
The second five year plan emphasized the establishment of heavy industries throughout the
country to trigger the national economy and to improve upon the employment generation. As
a consequence Bharat Heavy Industries Limited
(B.H.E.L.) was established during (1964-1965) and
started the production by the end of 1965. Since then
B.H.E.L. is functioning successfully with a strong
work force of around 14000 employees.
Infrastructure Planning For Industrialization in Haridwar. 7
•
B.H.E.L. had been a key instrument is providing necessary infrastructure to its employees in
physical and social terms. Almost one lakh population depends upon the infrastructural
services provided by B.H.E.L.
B.H.E.L. has its own mechanism i.e., B.H.E.L. Estate department to manage and maintain the
entire infrastructure in township and is not thus included in the municipal limits and is not
covered under the master plan prepared by the state town-planning development authorities.
1.2.3 B.H.E.L. Ancillary Estate
An ancillary estate with a provision of involvement of small and medium sized industries to
function as ancillaries to B.H.E.L. was established along with B.H.E.L. itself. Though, hardly
any ancillary unit was established in this estate, so later on, the plots/land was sold/ handed
over to private operators to run industries independently. Presently some odd 35 small and
mid sized units operate in Ancillary Estate contributing marginally to the economy and
employment of the urban agglomeration.
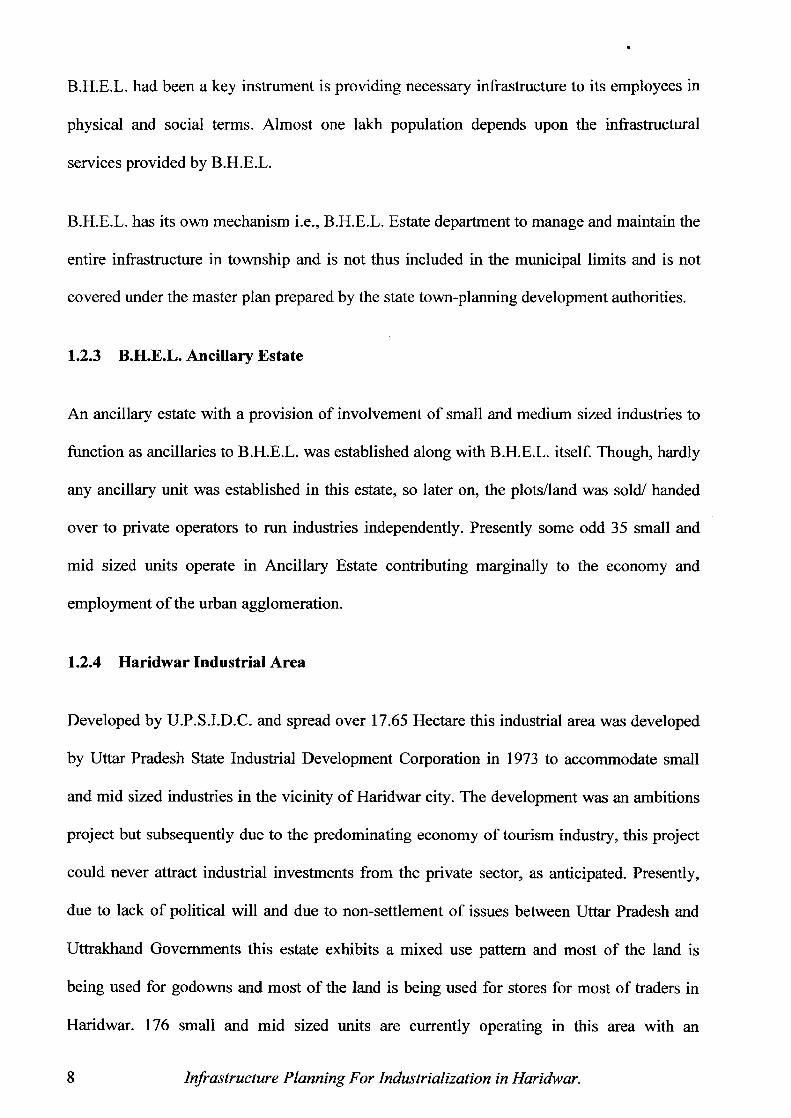
1.2.4 Haridwar Industrial Area
Developed by U.P.S.I.D.C. and spread over 17.65 Hectare this industrial area was developed
by Uttar Pradesh State Industrial Development Corporation in 1973 to accommodate small
and mid sized industries in the vicinity of Haridwar city. The development was an ambitions
project but subsequently due to the predominating economy of tourism industry, this project
could never attract industrial investments from the private sector, as anticipated. Presently,
due to lack of political will and due to non-settlement of issues between Uttar Pradesh and
Uttrakhand Governments this estate exhibits a mixed use pattern and most of the land is
being used for godowns and most of the land is being used for stores for most of traders in
Haridwar. 176 small and mid sized units are currently operating in this area with an
8 Infrastructure Planning For Industrialization in Haridwar.

occupancy rate of 19.76% which is sarcastically low. Lack of infrastructure services in
another major drawback which discourage the private sector investment in this area.
Surprisingly, the land prices (market value) are much higher in this industrial estate as
compared to other parts due to the real estate activities and non-permitted uses.
1.2.5 Bhadrabad Industrial Area:
Another ambitions project regarding the development of Bhadrabad Industrial area was taken
up by U.P.S.I.D.C. in 1981 in collaboration with B.H.E.L., The 10.29 Ha of land was made
available on lease to UPSIDC from the BHEL for the establishment of industrial area to
attract the investment from privates sector industries and to generate economic momentum
through employment generation at micro level. Initially this industrial area could gain a very
low intensity of development, however in last few years, due to state Government's initiation
and fiscal benefits this industrial area has gained a high paced and intense development by
virtue of its vicinity of the dominating industrial estate I.I.E. & I.I.D.C. developed by
SIDCUL.
1.2.6 Integrated Industrial Estate (I.I.E.) & Industrial Infrastructure Development
Centre (II.D.C.)
As a consequence of the announcements made by the Honorable Prime Minister of India
during his visit to Uttrakhand between 29th to 31st March 2002, regarding Tax and central
excise concessions", the department of Industrial policy and promotion, Ministry of
Commerce and Industry, Government India detailed out the subject vide info office
memorandum No. 1 (10) / 2001 NER dated 7th Jan 2003.
This provided a base to attract large investment in industrial sector in the special category
state of Uttrakhand. Thus to channelise the investment and to regulate the development in
meticulously planned manner, Uttrakhand government constituted the State Industrial
Infrastructure Planning For Industrialization in Haridwar. 9

Development Corporation of Uttrakhand Limited (S.D.C.U.L.) to address the issue under
single window system.
S.I.D.C.U.L. a Government of Uttrakhand enterprise was incorporated as a limited company
in the year 2002 with an authorized share capital of Rs. 50.00 cr. and Rs. 20.00 crores as paid
up capital through government of Uttrakhand in order to promote industrial development in
the state, provide financial assistance in the shape of debt, equity, venture capital, develop
infrastructure, and assist private initiatives in industries and infrastructure and implement
manage projects and provides specialized financial consultancy and construction and all such
other activities to promote industries and develop industrial infrastructure in the state of
Uttrakhand directly or through special purpose vehicles, joint ventures, assisted companies
etc. Besides the state government, SIDCUL has equity participation from L.I.C., ICICI and
SIDBI. Other banks are also in the process of participating in its equity. They have led to a
high degree of professionalism and autonomy in the functioning of Corporation. The spate of
concessions available of industrial investment has lead to move One thousand E.O.I.'S with
S.I.D.C.U.L. which entail an investment of around Rs. 20,00,0.00 Cr.
10 Infrastructure Planning For Industrialization in Haridwar.

kvsnos mos*"
WU COURSE
Figure 4 Layout plan HE & IIDC, Haridwar.
SIDUCL undertook the development of Integrated Industrial Estate (I.I.E.) and Industrial
Infrastructure Development Centre (I.I.D.C.) in close proximity to the district headquarters
on 2034 Acres of land provided by B.H.E.L. on lease to the state government.
Initially, 1427 Acres of land was acquired to accommodate 750 industrial plots ranging from
200 sq.m. to 4000 sq. m. plot size category, but as the demand grew more substantially and
big industrial houses also took interest in establishing their industrial units. Another 607
Acres in second phase were acquired for the purchase. The project gained tremendous
success and has achieved an occupancy rate of 96.6 % as on date. The government initiatives
are in process to achieve 100% occupancy by March 2010. At present 541 industrial units
have commenced / completed the construction activities for their premises on final 552 plots.
Nearly 200 units have already entered the production phase with a work force of
approximately 3700 employees. Infrastructure Planning For Industrialization in Haridwar. 11

HE Haridwar at a Glance
Name of Industrial Estate Integrated Industrial Estate, Haridwar
Location Located just 3 Km from Delhi-Haridwar National Highway. 225 Km from National Capital Delhi and 52 Km from State Capital Dehradun.
Total Area 2034 Acres
Industrial Land Rate Rs.1500 / sq mts.
Connectivity
Nearest Rail Yard: 5 Kms Nearest National Highway:3 Kms Nearest Domestic Airport: Jolly Grant 48 Kms Nearest International Airport: Delhi 225 Kms
Water Supply MLD)
Tube Wells: 4 No. Under Ground Storage Tank: 1 No. (Capacity 6
Over Head Tank: 1 No. (Capacity 0.5 ML) Length of Rising Main: 1.05 Km Length of Distribution Line : 46 Kms
Power Supply
Electric Sub Stations 220 KV (1 No.) 33 KV (4 No.) 11 KV (as required)
Financial Incentives
100% Central Excise exemption for 10 years 100% Income Tax exemption for first 5 years and 30 % for next 5 Years CST @1% for 5 years Capital Investment Subsidy @15% with a max. of Rs 30 Lakhs
Proposed Industries
Cosmetics & Allied Plastic & Allied Apparel & Allied Agro Food & Allied Pharma Products Electrical, Electronic & Allied Institutional, Commercial & Allied
Proposed Facilities Hotel, Bank, School, Hospital, Petrol Pump & Golf course etc.
Present Status Allotment Complete Table 1 Data on I.I.E. Haridwar. Source: Official web site of SIDCUL (www.sidcul. corn)
12 Infrastructure Planning For Industrialization in Haridwar.

Besides these planned and partially developed Industrial areas recently concentration of
industries are being observed the fringes of Hardware city where land prices are relatively
low. These concentrations are observed on Hardwar- Laksar Road, Sarai Road, village
Jagjitpur etc.
1.3 Potentials of Industrial Developments in Haridwar
Since the demand for industrial development is at present, much more than the present
supply, the need for establfshing new industrial estates is being observed. At present,
SIDCUL is not able to cope with some odd 370 E.O.I.s from large industrial houses all across
the country to establish their industrial units at Haridwar. In fact Haridwar attracts more
attention as compared to other industrial destinations in Uttrakhand by virtue of its better
connectivity & vicinity to Uttar Pradesh and also due to its religious sanctity.
The preferential sites for industrial development are identified as:-
(a) Hardwar Laksar road, mainly agriculture in nature this area exhibits tremendous potential
for industrial developments. However the land and other political matters need to be
addressed in due time so as to ensure the timely disbursement of fiscal benefits to the
industries.
(b) Rural hinterland of village Sarai, Sitapur etc. but again with constraints as mentioned
above.
(c) Expansion of I.I.E. at village Roshnabad, but the key factor will be the control of land
prices which has already gained the skyrocketing heights in past five years.
1.3.1 Factors affecting the potential development of new industrial areas
Time Factor: As per the directions of the government of India the only these industrial are
eligible to obtain fiscal benefits and subsidies which start the commercial production on and
before 31 March 2010.
Land cost: Due to the implicit speculation and lack of state government's will power the
land prices in the vicinity of the IIE have increased nearly 25 timesithin a short time period of
Infrastructure Planning For Industrialization in Haridwar. 13

5 years. Officially the land rate is Rs. 1000.00 per Sq. m. while the market price is estimated
at Rs. 5500 per Sq. m. of the industrial sectors in I.I.E.
Thus the whole process of acquisition of land, development of land, provisions of
infrastructure, construction of the industrial buildings and commercial production shall be
completed within a tight time frame of almost three years.
During past few years due to the implicit speculation in real estate business and due to lack of
political willpower the land prices have increased many times. This needs a big amount as
capital investment into land which in turn serves as a draw back for small and medium size
industries.
1.3.2 Availability of Alternative Industrial Sites.
Besides Haridwar, S.I.D.C.U.L. has developed other industrial estate I.I.D.C.s and Growth
Centers and Theme Parks at various locations in Uttrakhand. These are:
a) Integrated Industrial Estate at Pantnagar.
b) I.T. Park at Dehradun.
c) I.I.D.C. at Dehradun.
d) I.I.D.C. at Pantnagar.
e) Growth Center at Kotdwar.
f) I.I.E. at Sitarganj.
Also many industrial areas have been developed with involvement of private sector
enterprises. These are:
i) Devbhoomi Industrial Estate, Bantakhedi, Roorkee.
ii) M/s Narayan Nagar Industrial Estate, Hempur Ismile, Kundeswary, Shivpur,
Kashipur.
iii) M/s Bheem Nagar Industrial Estate, Patti Bazar, Kashipur.
iv) M/s Omega Industrial Estate, Dabhora, Ahetamali, Kashipur.
v) Raipur Co- operative Industrial Area, Raipur, Bhagwanpur, Roorkee.
14 Infrastructure Planning For Industrialization in Haridwar.

vi) M/s Mool Chand Industrial Estate Pvt. Ltd.
vii) M/s Gangespur Kashipur Industrial Area, Kashipur.
viii) M/s Raipur Bhagwanpur Industrial Area, Bhagwanpur, Roorkee.
ix) M/s Sara Industrial Estate Ltd., Shankarpur, Hukumatpur, Dehradun.
(Joint venture between IEL and SIDCUL)
x) M/s Sheel Chandra Industrial Estate, Village Kotha Lalpur, U.S. Nagar.
xi) M/s Kumar Industrial Co- operative Industrial Estate, Village Matkuta, Tehsil Kichha,
U.S. Nagar.
xii) M/s Kharmasi Industrial Estate, Kharmasi, Kashipur.
xiii) M/s Lakeshri Industrial Area, Lakeshri, Bhagwanpur, Roorkee.
xiv) M/s AIS Industrial Estate, Village Khasipur Kasaeli and Lathardeva Hoondth
Roorkee.
xv) M/s Nand Nagar Industrial Estate, Village Mahuakheragunj, Kashipur, U.S. Nagar.
xvi) M/s K.I.E. Infrastructure and Projects Pvt. Ltd., Village Mudiyaktti Mangabore,
Roorkee.
xvii) M/s Uttam Industrial Park, Village Mudlyaki-Kulchandi, Khendi, Dahiyaki
Mangalore, Roorkee,
xviii) M/s Gold Plus Industrial Estate, Village Tharola, Manglore, Roorkee.
xix) M/s Balaji Industrial Estate, Village Mahuakhedagunj, Kahipur, U.S. Nagar .
xx) M/s Saleempur Rajputan Industrial Estate, Villate Sunehra /Saleem Rajputan,
Roorkee, Haridwar.
xxi) M/§ Jai Prakash Associates Ltd., Village Nalhedi, Dehradun.
xxii) M/s Birla Tyres Industrial Estate, Village Khedi Mubarakpur, Laksar.
xxiii) M/s IDEB Industrial Estate, Village Mahuakhedagunj, Kahipur, U.S. Nagar.
xxiv) M/s Ram Raj Industrial Estate, Village Vikrampur, Bazpur, U.S. Nagar.
xxv) M/s J & G Vikrampur Industrial Estate, Village Vikrampur, Bazpur U.S. Nagar.
Infrastructure Planning For Industrialization in Haridwar. 15

xxvi) M/s Dhanlaxmi Industrial Estate, Village Nandhedi, Jaspur, U.S. Nagar.
xxvii) M/s Shri Developers Industrial Estate, Village Mahuakhedegeny Kashippur, U.S.
Nagar.
xxviii) M/s Buland Builtmart Industrial Estate. Village, Khedi Mubarakpur, Laksar.
(xxx) M/s Uttar Industrial Estate, Village Muhuakhedaganj, Kashipur, U.S.Nagar.
Due to availability of land at these locations, S.I.D.C.U.L. somehow, is struggling to divert
new industrial establishment in these places but since most of these are not the preferred
locations due to either lack of infrastructure facilities and services or accessibility, most of
these industrial areas are not able to attain even 30% occupancy.
1.3.3 Legal framework
Many industrial setups have emerged out of the non ear marked industrial areas due to lower
land prices or accessibility options but these units are facing a challenge because of the
cumbersome legal framework regarding the change of land use and / or permission from
authorities as, till date, no development authority is operative in these areas to check the
intensity of development and infrastructure requirements.
Such industries start the procedure of obtaining legal permission and fiscal benefits after
acquiring the land at relatively low prices and sometimes even after establishing the entire
setup. The infrastructure facilities remains absent is such areas even if these units obtain the
legal permissions.
1.4 Need for infrastructure planning.
Infrastructure planning is an integral and fundamental component land use planning and fir
the preparation of planning schemes. Better coordination and integration of infrastructure and
land use is the backbone of driving forces behind any urban development Infrastructure
planning must be carried out in a way that advances the purpose of land use planning which
is to seek & achieve ecological sustainability. This is described as a balance, which integrates
protecting ecological processes and natural systems, economic development and maintaining
16 Infrastructure Planning For Industrialization in Haridwar.

the well being of people and communities. Infrastructure planning aims at supplying
infrastructure in a coordinated, efficient and orderly way including encouraging urban and
industrial growth in areas where adequate infrastructure exists or can be provided efficiently.
Knowledge of the existing infrastructure networks servicing in the area, including the
capacities and thresholds for augmentation is an integral component to the planning process.
Balancing competing outcomes is also integral to the planning process and must be carried
out in consultation with state government/local governance. And in a way that respects the
different jurisdictional responsibilities that exist. Land use planning and infrastructure
planning are intricately inter-woven activities. Decision about the allocation of land for urban
land use purposes need to be informed by the infrastructure costs and consequences of these
decisions
1.4.1 The pressure on urban infrastructure
The style of urban infrastructure provision that encourages more efficient pattern of resource
consumption is the basis of development of sustainable urban agglomerations. Conventional
approach to urban infrastructure management was based on the premise "Facilitating
Infrastructure supply". The increased awareness towards environment and sustainable society
coupled with a need to make our cities worth living, demand side interface in the precision
and management of urban infrastructure is thus required. The demand side interface broadly
has two aspects :-
(a) Managing the existing demand.
(b) Channeling/monitoring the ever increasing demand.
The process of economic development and resulting urbanization get momentum which in
turn creates demand for urban services and infrastructure facilities. The gap between demand
and supply of essential urban services and infrastructure deteriorates the physical
environment and quality of life in urban areas.
Infrastructure Planning For Industrialization in Haridwar. 17

This process of urbanization has created a huge gap between demand and supply of urban
service and infrastructure. For instance :-
(i) The ninth plan working group on housing has estimated on investment, required for
housing in urban areas at Rs. 526000 Crores.
(ii) The India Infrastructure report - 1996, estimates the annual investment need for urban
water supply, sanitation and roads at about Rs. 28035 Crores for the next ten years.
(iii) The Central Public Health Engineering Organization (CPHEEO) has estimated the
requirement of funds for 100% coverage of urban population under safe water supply
and sanitation services by the year 2021 at Rs. 172905 Crores.
(iv) Estimates by Rail India Technical and Economic Services (RITES) indicate that the
amount required for urban transport infrastructure placement in cities with population
100,000 or more during the next 20 year would be of the order of Rs. 207000 crores.
Such a big quantum of requisite investment for supply of urban infrastructure cannot be
allocated within the budgetary resources of the Central and State Governments. Therefore,
private sector participation is envisaged.. Also, the demand side interference to solve the
problem of quality and availability of urban services and infrastructure need to be given
priority.
Both Demand and supply side should be given due considerations. As the planning so for has
been supply oriented, need is to make it balanced by giving weight to demand side of the
problem. On demand side account should be taken of existing as well as ever increasing
demand.
Managing the existing demand asks for popper under taking of postmodern consumerism and
chalking out the policy and intervention instruments accordingly.
Management of ever increasing demand is to be through monitoring and channeling the
migration process. Such monitoring has to be in the broader context of regional planning.
18 Infrastructure Planning For Industrialization in Haridwar.

Regional planning should address two aspects: Macro planning and integration &
compatibility of various micro plans.
The guiding principle for planning should be sustainability aimed at balanced development in
the economy.
1.5 Need to Study:
Infrastructure, as stated earlier, is the backbone of any urbanization and when it
is accounted for developments it comes at tremendous cost. State government has
been fundamental organization till date to cope up with the planning and funding
of the infrastructure services and facilities in India but till date the planning and
implementation of infrastructure has not been efficiently co-related. This leads
to either lack of the services due to limited budgetary resources of the
government and/or deterioration in the quality of services in absence of proper
implementation and maintenance.
Thus, an effort in this direction is required to study the present trends and
planning & to consider alternative planning philosophy to make an efficient and
optimums use of the multimillion investments in infrastructure.
1.5.1 Understanding the trends and potentials
A sincere approach is required to understand the requirements of infrastructure
planning for industrialization in Haridwar city for many reasons, some of them
are:
i) To determine the trends and potentials of development and industrialization so
as to ensure the optimum and efficient use of limited resources without making a
compromise with the sensitive ecological balance of the region.
Infrastructure Planning For Industrialization in Haridwar. 19

ii) To access the future requirements of infrastructural services and facilities so
as to ensure the well being of the inhabitants and visitors.
iii) To be able to plan and implement policies and strategies for the development
of industrial sector vis-à-vis required infrastructure.
iv) To eliminate the possibilities of collapse of the infrastructural facilities and
services before it is too late.
1.5.2 Data projections
Precise quantification of the existing and potential future requirement is key
instrument is accessing the quantity of the additionally required infrastructural
facilities and services. Also, it needs the exact determinant and identification of
the prominent land use in each specific pocket of the development area under
consideration so as to ensure the most efficient distribution of the services and
facilities.
Also, the infrastructure shall be designed and planned to cater to the peak loads
during the toughest periods of use. This is defined as the quality of
infrastructural services which, in turn, maintain the quality of life. The planning
and development exercises should always confirm to the fragile ecological
balance of the region.
20 Infrastructure Planning For Industrialization in Haridwar.

Chapter 2: AIMS AND OBJECTIVES
Infrastructure Planning For Industrialization in Haridwar. 21

2.0 AIMS AND OBJECTIVES
2.1 AIMS
i) To study and analyze the existing infrastructure facilities with respect to their
provisions, efficiency and management in context of rapid industrialization so as
to access future requirements.
ii) To identify the "growth pillars" and support "pillars" for industrialization and
analyze the government initiatives in order to make optimum utilization of the
same.
iii) To ensure the attention towards demand as well as supply side of adequate
quantity and appropriate quality of infrastructure service and facilities in a
sustainable manner.
iv) To ensure and safe guard the interests of the industrialists for continued
functioning of the industries even often the period of fixed benefits and
subsidies is over.
v) To ensure the development of industrial sector in such a manner so as to
maintain the fragile ecological balance of the region.
2.1 OBJECTIVES:
2.1.1 Private sector involvement
To enhance the development of infrastructural facilities and services by public
and private sector investment on Build-Operate Transfer (B.O.T.) basis.
• Since the investments in supplying the infrastructure are huge, state and
central governments shall deploy a clear and constant mechanism to evaluate the
cost of the infrastructure and also the policies of involving private sector
Infrastructure Planning For Industrialization in Haridwar. 23

investments shall be very transparent and clear in content and intensions. The
private investors/developers may be inspired to make long term investments for
developing the infrastructure facilities and services and shall be allowed to
charge the cost and subsequent interests and profits in the form of levis, octroi
etc., from the users for a stipulated time frame at convenient tariffs. Priority
infrastructure planning may be the guiding principle of provide a clear,
transparent and certain basis for the calculation of infrastructure charges.
2.2.2 Reforming land policies
To check and regulate the development of unplanned industrial areas by
reforming the land policies while maintaining the individuality and autonomy of
land owners.
• Most of the unplanned development of the industries is observed in
predominating agricultural land use areas. The industrialists purchased the
agricultural land from the farmers and pay the complete price of the land to
obtain the rights of land ownership. Initially, the farmers get a good amount for
the land but since it is commonly observed that instead of investing the money in
alternative mode of occupations, most of the farmers have spent the entire money
in his families materialistic interests like constructing/upgrading his residential
building, purchasing luxury vehicles, for the marriages of their children etc., and
are now on the verge of poverty or sooner are likely to be on the verge of
poverty.
This phenomenon could easily be checked by enforcing specially designed land
policies. For instance, instead of paying up the complete price of the land, a
memorandum of understanding could be enforced by law, between the farmer and
the industrialist ensuring that the farmer gets a genuine fixed amount on regular
24 Infrastructure Planning For Industrialization in Haridwar.

basis as rent or, royalty for developments on his piece of land for a stipulated
time while the rights of ownership shall remain in favour of the industrialist.
This will provide the farmer an opportunity to meet out the requirements of his
family and also a comfortable livelihood for a stipulated time period. Meanwhile
the farmer may, also arrange for alternative occupational pursuits.
2.2.3 Gap analysis between demand and supply
Analysis of the existing gap between demand and supply of the infrastructure
services and facilities and assessment of the future requirements and derivation
of the control mechanism by continuous monitoring of the ever-increasing
demand.
Conventional approach to urban infrastructure management is based on the
premise "Facilitating Infrastructure Supply". The increased awareness towards
environment and a sustainable society coupled with a need to make our cities
worth living, demand side interference in the provision and management of urban
infrastructure is strongly advocated.
Demand side interference broadly has to aspects.
Managing the existing demand, &
Channeling/monitoring the ever increase demand covers the issues of
regional planning, i.e., micro as well as macro planning covers the intricacies of
rural-urban interaction.
2.2.4 Ensuring prolonged industrialization
To prepare ground for the continued functioning of industries even after the
period of fiscal benefits is over.
Infrastructure Planning For Industrialization in Haridwar. 25

• There is an immediate requirement to anticipate and upgrade the levels of
technical skills to ensure that the local youth has a competitive edge.
• This has been observed that while allotment of land and development of
industrial activities is already initiated; infrastructure development has not kept
pace. The requirement of electric power is much higher than expected and
availability and the establishment of power grids are taking longer time on the
ground than on paper.
• Harnessing human resources to the desired technical skills levels and to
prepare the grounds for more employment opportunities in private sector along
with the availability of cheap, continuous and surplus power shall be the key to
inspire industries to continue functioning even often the period of fiscal benefits
is over.
2.2.5 Identification of "Growth pillars" and "support pillars"
Identification of infrastructural elements which act as the 'growth pillars' for
industrial development in a sustainable manner.
a) Roads
b) Transportation
c) Energy and Power
d) e) Urban development
0 Roads:
Vision:
•Provide high speed barrier free connectivity with rest of the country.
•Provide adequate and efficient connectivity to all the demand drivers (Tourism,
Industries, Agriculture and Urban centres) 26 Infrastructure Planning For Industrialization in Haridwar.

•Provide connectivity to all villages/habitants through roads and bridges.
•Provide 100% all weather roads.
Strategy for development:
• Identification of core network and all future developments to be linked to the
core network to ensure economics of scale in terms of traffic counts.
• Work in confirmation and co-ordination with government for development of
high speed corridors especially N.H. 58.
• Minimize transaction cost and delay in transportation through integrated check
posts and bye passes along core network.
• Explore spectrum of private participation construction, maintenance and
management corridors through B.O.T. and other options.
b) Transport:
Vision:
• Provide adequate transport services on important transport routes.
• Increase the share of railways in cargo passenger transportation.
Strategy for development:
• Remove legal restrictions in roads transport, to free private sector response to
the tourism and industrial demands.
• Railways to be positioned as an important alternative to reduce transportation
cost for industrial and tourism development.
c) Energy:
Infrastructure Planning For Industrialization in Haridwar. 27

Vision:
• Provide affordable and quality power to all through harnessing the surplus
hydro potential of the state.
• Power to every village and household on demand.
Strategy for development:
• Follow a 'consumption driven' strategy through promotion of power intensive
industries resulting in increased growth and employment opportunities.
• Remote villages to be connected by non-conventional sources of energy.
d) Urban infrastructure:
Vision:
• Living standards, productivity and sustainability of entire urban agglomeration
to be enhanced with emphasis on preservation of the heritage character and
environmental health.
Strategy for development:
• Increased responsibility on urban local bodies with concurrent measures to
strengthen their capacities and functional efficiency.
• Upgradation of the core arterial network of the cities to at least 10km.
• Provisions of safe and assured supply of drinking water to all towns.
• Development of underground sewerage system and treatment plants.
• Development of an integrated municipal solid waste collection and disposal
system involving the local communities.
28 Infrastructure Planning For Industrialization in Haridwar.

• Implement traffic management measures in key towns.
Maintaining ecological balance at minimum possible compromise through the
instrument of encouraging non-polluting and environment friendly industries
while discouraging the potentially polluting industries.
Central and State governments has been very cautions regarding the ecological
aspect of the region while announcing the industrial policy and fiscal benefits.
The various manufacturing industries have been categorized as per the emission
norms and has declared a negative list comprising of highly polluting
manufacture process which shall under any condition not be permitted to operate
manufacturing facilities throughout the entire state.
Infrastructure Planning For Industrialization in Haridwar. 29

30 Infrastructure Planning For Industrialization in Haridwar.

Chapter 3: SCOPE, LIMITATIONS AND ASSUMPTIONS
Infrastructure Planning For Industrialization in Haridwar. 31

32 Infrastructure Planning For Industrialization in Haridwar.

3.0 SCOPE, LIMITATIONS AND ASSUMPTIONS
3.1 Scope
3.1.1 Gap analysis
The scope of this dissertation is study and analysis of the current scenario of
physical infrastructure which act as 'growth pillars' for the development of
industries in terms of quality and quantity, and to analyze the gap between the
supply and demand equations, and to project the future requirements of
infrastructure services and facilities for the planning period i.e., up till 2025.
3.1.2 Strategy formation.
This dissertation aims at evolving the strategies for the induction of optimum
infrastructural services and facilities in phased manner so as to maintain
sustainability in financial terms.
3.1.3 Ecological sustainability.
This dissertation, aims at suggesting the use of natural processes to support the
ecological sustainability of infrastructural services.
3.2 Limitations
The study is limited to the following extents:
3.2.1 The geographical area
The geographical area under consideration is limited to the area covered by the
Haridwar Development Authority and further is called as the Development Area.
The development area measures 20119 Hectare on ground.
Infrastructure Planning For Industrialization in Haridwar. 33

Figure 5 Development Area: Haridwar.
3.2.2 Extents of Industrial developments
Extant of Industrial developments for the purpose of this dissertation is limited
to the following aspects
i) Existing quantity and sizes (small, medium or large).
ii) Future projections for a period of 10 years in terms of expansion of existing
industries and establishment of new industrial units.
iii) Opportunities of employment in terms of skilled and unskilled work force.
3.2.3 Infrastructural services and facilities.
Although all of the infrastructural services and facilities are essential for the
well being of inhabitants of the urban agglomerations but, the scope of this study
34 Infrastructure Planning For Industrialization in Haridwar.

is limited to the physical and social infrastructural services and facilities which
are identified as.
i) Growth pillars for industrialization, namely
a) Roads.
b) Transportation.
c) Power-Energy.
d) Skilled/trained human resource.
ii) "Support Pillars" for industrialization, namely.
a) Water Supply System.
b) Storm water disposal system.
c) Sewage disposal.
d) Solid waste management.
e) Housing.
3.2.4 Strategy for development
The scope of this dissertation is to evolve a strategy regarding the supply of
infrastructure to the optimum required levels i.e., a strategy to induct limited
quantity of services and facilities in concurrence with the industrial
development. The dissertation projects phase wise expected development in
industrial arenas and simultaneous induction of infrastructural services.
3.3 Assumptions
The dissertation is based on the following assumptions:
i) No jurisdictional orders are implemented against the development activities in
the planning period i.e., till 2025 which is the stipulated time period under the
Infrastructure Planning For Industrialization in Haridwar. 35

scope of this dissertation on any account viz. Public interest litigations regarding
issues of environment and/or special economic zones.
ii) The surplus hydro-electric power potentials of the state shall be available for
the development area under consideration and is not hampered due to any reason
what-so-ever.
iii) None other states or central government announces similar of better fiscal
incentives for industries, which in turn acts as catalyst for industries to shift the
production/manufacturing units.
iv) Political stability is much desired in the state throughout the stipulated time
period so as the government, and ministries can provide adequate support and
interest in development activities through the vehicles of local governance and
various development agencies working in the region.
v) The surplus electric power potentials of the state are available to the
industries and household uses without any prejudice and compulsion. The power
is main ingredient to make industries able to sustain themselves.
v) The policy of the state government to have a reservation of 70% regarding
employment in the private sector industries for the local youth is enforced and is
implemented properly. This helps in regulating and monitoring the unwanted
migration from other places. The projections regarding the future population and
infrastructure requirements are based on this assumption.
36 Infrastructure Planning For Industrialization in Haridwar.

Chapter 4: LITERATURE REVIEW
Infrastructure Planning For Industrialization in Haridwar. 37

38 Infrastructure Planning For Industrialization in Haridwar.

4.0 Literature Review:
4.1 Office memorandum:
"Published by Department of Industrial Policy and Promotion, Ministry of
Commerce and Industry, Government of India, New Delhi, bearing No. 1 (10) /
2001-NER, published on 7th Jan. 2003.
Sub: - New industrial policy and other concessions for the state of Uttrakhand
and Himachal Pradesh.
4.1.1 Fiscal incentives:
i) Declaration by Hon'ble Prime Minister regarding 'Tax and Central Excise
Concessions' to attract investments in industrial sector for the special category
including Uttrakhand.
ii) Fiscal incentives to new industrial units and to existing units on their
substantial expansion:
1. New industrial units and existing industrial units on their substantial
expansion, as defined, set up in Growth Centres, Industrial Infrastructure
Development Centres (11 DC), Industrial Estates, Export Processing Zones,
Theme Parks (Food processing parks, Software Technology Parks etc.,) as stated
and other areas as notified from time to time by the central government are
entitled to :
a) 100% (hundred percent) outright excise duty exemption for a period of 10
years from the date of commencement of commercial production.
b) 100% (hundred percent) income tax exemption for an initial period of five
years and thereafter 30% for companies and 25% for other than companies for a
Infrastructure Planning For Industrialization in Haridwar. 39

further period of five years for the entire states of Uttrakhand and Himachal
Pradesh from the date of commencement of commercial production.
2. All new industries in the notified locations would be eligible for capital
investment subsidy @15% of their investment in plant and machinery, subject to
a ceiling of Rs. 30.00 lakh. The existing units will also be entitled to this
subsidy on their substantial expansion, as defined.
3. Thrust sector industries as mentioned in Annexure-II are entitled to similar
concessions as mentioned above in the entire states of Uttrakhand and Himachal
Pradesh without any area restrictions.
4.1.2 Development of Industrial Infrastructure:
i) The funding pattern under Growth Centre Scheme currently envisaging a
central assistance of Rs. 10.00 Cr. per centre is raised to Rs. 15.0 Cr. per centre.
ii) The financing pattern of Integrated Infrastructure Development Centre
(I.I.D.C.) between Government of India and S.I.D.B.I. will change from 2:3 to
4:1 and Government. of India funds would be in the nature of grant, so as to
provide the required infrastructural support.
4.1.3 Other Incentives:
i) Deen Dayal Hathkargha Protsahan Yojna and other incentives of Ministry of
Textiles: The funding pattern between Government of India and both the states
would be changed from 50:50 to 90:10 under this scheme. Ministry would extend
its package of incentives, as notified for North-Eastern states to the states of
Uttrakhand and Himachal Pradesh also.
40 Infrastructure Planning For Industrialization in Haridwar.

ii) Ministry of food processing industries would include Uttrakhand in difficult
areas category. The state of Himachal Pradesh is already included in difficult
areas category.
iii) Pradhan Mantri Rojgar Yojna (PMRY) : Ministry of Agro and Rural
Industries would provide for states of Uttrakhand and Himachal Pradesh
relaxation under PMRY with respect to age (i.e., 18-40 years from 18-35 years)
and subsidy (@ 15% of the project cost subjected to a ceiling of Rs. 15,000/- per
entrepreneur)
4.1.4 Thrust sector industries
This official document clearly identifies the industries eligible to be established
in the states of Uttrakhand and Himachal Pradesh and has laid absolutely clear
guidelines for the state government to permit only non-polluting, environment
friendly manufacturing units.
The thrust sector industries have been clearly identified.
4.1.5 Constitution of nodal development agency (SIDCUL)
This document prepared the base for state government to invite the investments
in the state from various industrial sectors with a lucrative offer of fiscal
benefits. Also, this serve as the basis for the constitution of a nodal agency
namely State Industrial Development Corporation of Uttrakhand Limited.
(S.I.D.C.U.L.) to look after the issues and planning for the development of
Industrial sector in Uttrakhand.
4.1.6 Opportunities of employment
This document also identifies the potential and permissible locations for the
industrial establishments through out the state for efficient distribution of Infrastructure Planning For Industrialization in Haridwar. 41

industries so as to ascertain the benefits of the opportunities of employment
generation gets evenly distributed.
42 Infrastructure Planning For Industrialization in Haridwar.

4.2 Uttrakhand at a glance
This vision document published by the Government of Uttrakhand includes the
vision of the state government regarding the comprehensive development of the
state in almost all possible sectors namely, infrastructure development, power
and energy, tourism, industries, irrigation, ecology, etc., This document includes
carefully carved out interviews of the key persons responsible for the
development activities in the state. This included the interviews with - (i) Mr.
N.D. Tiwari (as Chief Minister of Uttrakhand), (ii) Mr. R.S. Tolia (as Chief
Secretary of Uttrakhand), (iii) Mr. S.S. Sandhu (as Secretary PWD Uttrakhand),
(iv) Mr. M.M. Ramachandran (as Additional Chief Secretary & Infrastructure
Development Commissioner), (v) Mr. N.N. Prasad (as Tourism Secretary of
Uttrakhand), (vi) Dr. Shekhar Raha (Director, Rai University, Dehradun Campus)
All of the above mentioned interviews focus on the multidimensional
development of the industrial and infrastructural sectors to boost the process of
industrialization, tourism and other allied activities.
This white paper explains the conducive government environment and initiatives
regarding the vision and strategies adopted and being adopted in the state
focusing on the sustainable development of industrial sector.
The detailed vision, strategies and initiatives underway are explained for the
development of infrastructure like Roads, Transportation, Civil aviation, Energy,
Information Technology, Urban Infrastructure, Horticulture & Floriculture,
Biotechnology, Medicines & Medicinal Plants, Medical & Health Care, Forest
Products (Herbs and Spices), Agro and food processing industries, Tourism etc.
Infrastructure Planning For Industrialization in Haridwar. 43

Also, this document clearly identifies the infrastructural services and facilities
which act as "Growth Pillars" & "Support Pillars" for processing
industrialization in the state of Uttrakhand.
The document serves as an eye-opener for investors to participate in the
development process with specifically carved out memorandum of understanding
with the state government on long term basis. This is important packet of
information regarding the guiding principles of the state government and its
policies oriented towards the private sector investments regarding the sustainable
development of industries, infrastructure and tourism in the state.
44 Infrastructure Planning For Industrialization in Haridwar.

4.3 The Pressure on Urban Infrastructure.
Need to revamp the planning philosophy.
Research paper by J.P. Singh & S.N. Jena
4.3.1 Demand side management
In this research paper, the authors have analyzed the present scenario in the
context of the pressure on urban infrastructure. The authors have identified that
the style of urban infrastructure provision that encourages more efficient pattern
of resource consumption is the basis of for development of sustainable cities.
The salient features of urban infrastructure planning, according of the authors,
are:
i) Conventional approach to urban infrastructure management is based on the
principle of constant induction in the quantity of infrastructural facilities &
services i.e., "Facilitating Infrastructure Supply"
ii) Evidently, the pressure on urban infrastructure is increasing due to increase in
demand as a result of on going urbanization.
iii) Instead of continuously augmenting the supply side of infrastructure
management, authors have strongly recommended the demand side interference
of the planning agencies.
iv) The demand side interference has two aspects:
a) The existing demand:
Consumption patterns and life styles of a particular society shape the nature of
demand, may it be higher or lesser, depending upon the degree of consumption.
The availability of 'quality consumption' gets concentrated in hands of certain Infrastructure Planning For Industrialization in Haridwar. 45

social and spatial groups within the city because the ability to access availability
is dependent on wealth, location & skill of consumers.
The phenomenon of consumerism and inequitable distribution has two
implications. First, it creates pressure on existing networks and ultimately,
reflects as the 'mismanaged demand' for urban infrastructure. Second, urban
planning, due to philosophical foundation underlying it, becomes fragmented,
pragmatically tuned to economic and political constraints and oriented towards
stability rather than being committed to change through comprehensive plans.
The outcome has been a disorganized approach that has led to a collage of highly
differentiated spaces & settings.
b) The ever increasing demand:
The authors have used the example of establishing satellite cities to ease off the
pressure on big urban centres but, instead, it has been realized that the problem
of infrastructure management is actually shifted from one place to another and is
not completely solved. This is due to the phenomenon of ever increasing
demand.
The need is to consider the process of urbanization holistically in the light of the
extent and nature of rural-urban interactions in the context of comprehensive
regional planning.
Authors have identified the two facets of the ever increasing demand. First, the
reproductive behaviors of the present urban masses & second, due to the
multifold increase in the urban population and thus demand is directly
proportional to the migration from rural to urban areas. Such unwanted migration
is the result of diverse nature and type of economic activities and opportunities
in rural, semi-urban and urban areas. Monitoring of such migration asks for 46 Infrastructure Planning For Industrialization in Haridwar.

diversification and decentralization of economics activities as a part of regional
planning.
4.3.2 Alternative planning philosophy
Authors has suggested an Alternative Planning Philosophy guiding that both
supply and demand side should be given due considerations. As the planning so
far has been supply oriented, need is to make it balanced by giving due weight to
the demand aspect of the problem. On the demand side care should be taken of
existing as well as ever increasing demand.
The guiding principle of above alternate philosophy should be sustainability
aimed at balanced development in the economy.
Infrastructure Planning For Industrialization in Haridwar. 47

48 Infrastructure Planning For Industrialization in Haridwar.

Chapter 5 : CASE STUDY OF LUDHIANA CITY, PUNJAB.
Infrastructure Planning For Industrialization in Haridwar. 49

6.)r- gs-1 (--)0°0,5
50 Infrastructure Planning For Industrialization in Haridwar.

PUNJAB
Cap mei* KI Compare Isfebaie Prt.
5.0 Case Study of Ludhiana
Ludhiana has undergone the similar phase of rapid industrialization as Haridwar
is presently facing. Both the cities have similar climatic and geological
constrains and features. However both the
cities differ in size and population but
exhibit similar grounds for
industrialization. Thus Ludhiana is
considered as the suitable case study area
to learn lessons regarding the infrastructure
planning for industrialization in
Haridwar. Figure 6 Panaromic view of Ludhiana, Ghantaghar
5.1 Ludhiana - An introduction:
5.1.1 Area & population
Ludhiana is the largest city in Punjab, both in terms of area and population. The
AUPAU
-*ASH DISIRICTS OF
Figure 7 Political map of Punjab showing district Ludhiana
city is spread over an area of 159.37
sq. km. and accommodates
approximately 14.00 lakh population.
(2001 census) The city is famous for
hosiery goods, woolen garments,
leather items, machines and tools,
dyes, cycle parts, sewing machines,
motor parts etc.
Infrastructure Planning For Industrialization in Haridwar. 51

To Phdlaor NANV% \ ■11.01
JALANDHAR anal I ),111 ■ItI'l It ar,
Figure 8 Ludhiana connectivity by roads and railways
%ow_ °Airmail
9.1hwan Khae I I.N.V.Ut um
11120/1.1
To Mop -*— Hoe rigChuisig:)
,ueoo,ana O
0 Sawaddy EthanohreO Puma
Ch."' Rattan 41,a^f•■•
,Motu
Mum,
71114. meet
ach Pawal• 0 JO. Saha,
Sammie
Kharnanon
•• /....t,—
/,,,, il(.,1411Nt11111
Model Gam
/*dhow
Di111:NA 'Monde..
/
s %•.1.1d. )(To ph.°
ddor mien°
SA Masi • OiA
Kobe&
Mean
Khanna
oot000F
Jagraon ."•,..= • 1
5.1.2 Location
The city is located in Ludhiana district, which is most centrally located amongst
the 19 districts of Punjab. It falls in Malwa region. Geographically the district
lies between north latitude 30° 34' and 31° 01' & East longitude 75° 18' and 76°
20'. Attitude varies between 330 m. to 273 m. from MSL.
5.1.3 Connectivity
The city is very well
connected in terms of roads
and rail tracks. NH-1
popularity known as Grand
Trunk road passes through the
city which connects it to Delhi
and other important cities of Punjab. NH-95 Ludhiana lies on main broad gauge
railway line and is identified as major junction. Nearest airports are at
Chandigarh and Amritsar for passenger and cargo for domestic and international
flights.
5.1.4 Historical background
The origin of the city can be traced back to 1481 A.D. during the regime of
Lodhi dynasty at Delhi (1451-1526 A.D.). During the regime of Maharaja Ranjit
Singh, Ludhiana became an important British Cantonment in 1805. At the time of
independence, i.e., by 1947, there were hardly any industries worth naming in
Ludhiana. Ludhiana has witnessed enormous industrial growth in last 15 years
52 Infrastructure Planning For Industrialization in Haridwar.

due to significant improvement in law and order situation, (post militancy
period). A large number of industries have been established in small, medium
and heavy scales.
5.1.5 Climatic Conditions
• Temperature
•Wind flow
•Rainfall
Max. 45°C to 46°C during summers
Min. 10°C during winters
South-west monsoon winds in summers.
Western & North-western during winters.
Total rainfall during the year is 600-700 cm. 70% of total
rainfall occurs between July to September. 16% in December to March, and
remaining months experience 14% rainfall.
5.1.6 Demographic profile
a) Area
b) Population
c) Rural population
d) Urban population
e) Males (no.)
f) Females (no.)
g) Literates
h) % of literacy
i) Sex ratio
j) Population density
= 159.37 sq. km.
= 14.0 Lakh (2001 census)
= 2.95 Lakh (People)
= 11.05 Lakh (People)
= 7.69 Lakh (Persons)
= 6.31 Lakh (Persons)
= 13.33 Lakh (Persons)
= 95.21 %
= 820 (females per 1000 males)
= 8784.5 (Per sq.km.)
5.1.7 Peripheral area status
Infrastructure Planning For Industrialization in Haridwar. 53

Dehlork
.til• ,surd '1 0
Tc Onuri
a'llomurstVotwo: sVnts Faiegarl. Se
0 '' ',doors, Kho• • LUDHIANA..,,,„ ,,,,,,,,,,,,,, . c.... ® ,..., Onond•••
,/ 0 Swoothly - ...." hook.-. p..,2 o , :::71," R2acloao I 1"""'"
1 I o.....2, ..". Saw.. o ' .4graon
CILlx■ '....r." 0., Rao, 11 KolOo
FIROZPUR RUPNAOAR
FATEROACH
SANCIRION
So•le Conmahl C Coentrofe iel PVI LIO
• All villages have been connected with pucca roads and some of the old villages
have been incorporated in the limits of Municipal Corporation of Ludhiana.
LUDHIANA Road Network
Punjab JALANDHAR
• The culture of farm houses/outhouses
in peripheral areas has developed. On the
main approach connecting the main seven
roads, marriage places have been developed
up to a distance of 15 Km. from the
periphery of Ludhiana city.
A NAWANSMAMR
HOSHIARPUR
Figure 9 Road network, Punjab
• Sewerage system is already short of the requirements.
• Water supply system is none uniformly distributed.
• Road network consumes only 9 % of open areas.
• There is no master plan for peripheral area. Thus unplanned growth of the peripheral
area is destined to cause impact on the infrastructure in near future.
5.2 Status of infrastructure facilities.
5.2.1 Water supply
The Municipal Corporation of Ludhiana (MCL) is supplying more than 220 1pcd chlorinated,
potable water to 85% of residents. Elevated storage system with 61 overhead storage
reservoirs is inadequate in quantity and efficiency because of lowering of water table.
Inclusion of additional area is a cause of concern and thus water supply system cannot be left
dependent of underground water reserves. Additional arrangements for potable water have to
be done possibly through Bhakra canal at a distance of 17 Km. from the city.
Deficits:
• 15% water supply.
• Unequal and non-uniform distribution of potable water.
• Mechanical / Electrical break down.
54 Infrastructure Planning For Industrialization in Haridwar.

• Inadequate water storage capacities.
• Lack of water quality testing labs.
Solutions:
• 100% coverage of water supply lines.
• Demand side management by reusing waste water in toilets / Flushes / Cisterns /
Gardening etc.
• 100% capacity of overhead storage reservoirs.
• Establishing water quality testing labs.
• Effective monitoring, control & coordination and standby mechanical / electrical
systems.
5.2.2 Road network
The road network is rated amongst top 10 cities in the country by the C.I.I. during the year
2003. Most of the roads are constructed by various agencies including PWD / National
Highway Authority of India / PUDA / PSIEC / Improvement trust / Industry department,
Hosiery and Knitwear who have constructed most of the major & minor roads in the city and
have transferred to MCL. Only a 20.5 km. long national highway bypass road is maintained
by NHAI.
Deficits:
• Inadequate roads, mixed traffic behavior.
• Lack of advance planning.
• Lack of inter-institutional coordination.
Solutions:
• Segregation of traffic — provision of traffic separators of time barrier for heavy traffic
entering the city.
• Regular maintenance
• Inter — institutional agreements.
Infrastructure Planning For Industrialization in Haridwar. 55
• Formation of road planning, design and monitoring units.
5.2.3 Sewer, MSW services
Deficits:
• 67% abadies covered with sewerage system.
• Inadequate design — disposal of solid waste.
• Only 11% of abadies are covered with storm water sewer.
• Inadequate pumping through temporary pumping stallions.
Solutions:
• Adoption of storm water sewer and MSW policy.
• Completion of sewer system by laying alternation lines.
• Pumping and treatment of sewerage
• Requirement of STP and vermin composting plants of adequate capacities.
5.3 Planning issues in Ludhiana City
The city faces multifaceted problems which are basically due to heavy influx of population
especially of migratory labour and also due to lack of enforcement at the local governance
level. The major problems are —
i) Unplanned and haphazard growth of the city.
ii) Mixed traffic conditions on city roads and faulty road geometry. Encroachment by
vendors, khokhas & hoardings etc.
iii) Faulty traffic management and lack of enforcements causes accidents and
environmental pollutions.
iv) Mixed land use in old parts of the city.
v) Lack of civic infrastructure like potable water supply and sewerage system.
vi) Lack of open spaces, park & playgrounds in old city areas.
vii) Lack of properly earmarked commercial area due to which mushrooming of shops
in residential area has occurred.
56 Infrastructure Planning For Industrialization in Haridwar.

viii) Discharge of untreated effluents into Buddha Nala is causing pollution of
underground water.
5.4 Demographic, Economic and Land use pattern
5.4.1 Demographic profile
Ludhiana city had a population of only 30000 in 1947. The city population profile indicates
that during the decades of 1961-1971 and 1971-1981, it registered a growth of 51% while
during 1981-1991 the growth in population touched 67%. However, during the period of
1991-2001 the growth rate came down to 37.8%. In December 2005 the city population was
estimated as 16.65 Lakh (Statistical Abstract of Punjab - 2005).
Year Population (lace)
Decadal Growth Rate (%) Compound Annual Growth Rate (%) CAGR
1901 0.49 1911 0.50 2_04 0.2 1921 0.52 4.0 0.39 1931 1.0 9.2 6.77 1941 1.12 12.0 1.11 1951 2.0 78.57 5.9
1961 02.51 25.5 2.29 1971 04.01 59.76 4.796 1981 08.06 51.12 4.215 1991 10.42 67.00 5.261 2001 13.95 37.84' 3.261
Dec. 2005 (projected) 18.85 19.35" 3.60
2011 (projected) 20.66 48.10 4.349 2021 (projected) 32.96 59.53 4.812
Note:
- Lower decadal growth rate for the period of 1991-2001 is due to the migration of sizeable population to other areas due to adverse law and order situation (Terrorism)
*" - 4% years
Table 2 : Decadal Population Growth of Ludhiana
5.4.2 Population density
One out of every six urban dwellers (16.92%) living in the state of Punjab, resides in
Ludhiana with an overall density of 8755 persons per Sq. Km.
5.4.3 Slum Population
There are, in all, 200 slums in the city with a population of 233,400. Around 57 slums have
been upgraded with provisions of essential infrastructure facilities including water supply,
sewerage, street lights, metalled roads etc.
5.4.4 Literacy and school going children
Infrastructure Planning For Industrialization in Haridwar. 57

District Literacy rate 2001 Literacy rate 1991
Total Rural Urban Total
Ludhiana 76.54% 72.88% 79.42% 67.34%
Table 3 : Literacy status of Ludhiana
School going population: -
Rural: 78.32%
Urban: 81.58%
5.4.5 Economic Base
The economy of the city is based on various areas of manufacturing industry including
cycles, sewing machines, textiles, leather goods and other industries including real estate like
shopping malls, and other commercial
establishments, financial and other banking
services, public services and places of
religious importance etc.
Trends of industrialization in Ludhiana:-
• Increasing no. of industrial units and
expansion of existing units.
• Increasing trend of employment.
• Increase in fixed investment.
• Increase in production.
S. No. Land as Area In acres %age
1 Residential 37970 50.08
2 Commercial 2393 3.16
3 Industrial 23027 30.36
4 Recreational 202 0.26
5 Traffic & transportation excluding roads 3770 7.60
6 Dines 3e2 0.48
7 Government 2829 3.78
8 Puttic and semi public 2373 3.13
9 Reserved area for permanently prohiiited for building operation.
900 1.18
Total urban itable area 75826 (62.37%) 100
Area under agricultural and water bodies 45754 (37.63%)
Grand total area of planning area 121590 (100.00%)
Table 4 : Present land use pattern of Ludhiana
5.4. Land use and spatial growth: -
5.4.6 Proposed land use
Presently, Ludhiana Municipal Corporation is spread over an area of 159.37 sq. km. (39364
Acres) keeping in view the projected population of the city up to 2021 it's planning
58 Infrastructure Planning For Industrialization in Haridwar.

requirements and planning standards, it is assumed that the city will grow to an extended
limit of 75826 Acres.
• Total area proposed under urbanization = 75826 Acres.
• Projected population (year 2021) = 32.96 Lakh.
• Projected average density = 107 person per Ha.
5.5 Infrastructural status and proposals
5.5.1 Water supply
Water supply system exists in the city of Ludhiana since October 1908. The city is
completely dependent on ground water for supply of drinking water. There were 24 wells dug
on the outer area of old city (presently known as rose garden) for domestic supply, water used
to be drawn from these 24 wells (called Khus). The pumping was done with the help of steam
boiler to fill two Mild Steel tanks (50000 gallon each). Both the steel water tanks are located
in the old city area, one in Dressi ground and other in Mochpura Bazar.
Presently, water supply operation and maintenance is one of the basic services being provided
by the MCL. However, Punjab Water Supply and Sewerage Board (PWSSB) is among para-
statals executing agencies Proposed area shown thus MEM Already cov.,.ashow n on behalf of the MCL.
Responsibility of PWSSB is
limited to the installation of
tube wells: construction of
reservoirs and planning,
design and executing
(laying of main lines and branch lines). Figure 10 : Coverage area under water supply
To Aoson
For water supply, the corporation has divided the whole city into 'Declared areas' and
`Undeclared' areas: Infrastructure Planning For Industrialization in Haridwar. 59

The corporation supplies water to 'Declared area' only which is almost 100% of the city
limits while the Un-declared area have their own private water system.
Gap analysis: The newly developed areas, S
El Tube...mils
4-1;-.
RN OHSR
which are not covered under MCL water ;: - Shallow T/Wells
,..r.4
.!..
i.
: .. ii... .
supply system and are dependent on
. . • _. I a. .1 ..........: ..Z...1. ..-'..1,1 .:
. Ronk& P:,... .• • ; ... ......'.. personal bore wells / tube wells. This area • . • ,..... CAA • ' II - la
. ' ;';.i.' , ....I i:r."*".
# . .. :4• ; ....t • .." • ..
• . Jci .. *. • ...:-1.4— „„,---,
is around 15% of the total MCL area, II. ••, . . • • , • ,,.. .. .. ,, . . . - • •
housing approximately 2.8 Lakh
population. Huge funds are required to fully
cover these areas under water supply Figure I 1 : Present and proposed water supply system
schemes. Gap analysis is done to understand the kind of infrastructure needed to upgrade
these areas. This Gap analysis is based on the project report by Punjab Water Supply and
Sewerage Board (PWSSB).
Table 5 : Water supply status and length of pipe lines
Year Population (nos.) Water supply (MLD) Pipe length (km) Coverage Deficiency (in %) Supply Deficiency Coverage Deficiency
2001 13,95,053 70 280 -26.80 1200 454 2002 14,78,000 75 — — 1327 424 2003 15,17.000 80 — — 1467 330 2004 15,50,759 79 — — 1476 362 2005 16,01,469 80 — — 1482 416 2006 18,65,000 (including 12% floating
population) 85 415 - 62 1600 464
2011 20.60,000 (floating population not included)
85 500 - 23 2100 500
Year - 2006 Current coverage Additional requirement
Area (sq.km) 0 23.91 Population 15,85,000 2,80,000 Total Water supply 415 MLD 62 MLD Per capita water supply per day > 250 litres 5.19
5.5.2 Sewerage
Provision and disposal of domestic sewerage facilities in Ludhiana is primarily done by
MCL. However it is not responsible for disposal facilities related to industries and industrial
establishment. The industrial area relies upon the conventional methods of septic tanks and
60 Infrastructure Planning For Industrialization in Haridwar.

Gap analysis:-
(a) Sewage treatment plants:-
Total waste water generated, by the city N
is 432 MLD, while there is an absolute Te Jult,tdit:t I s
la Jullundttar
•
• Sewerage Treatmnet Plants Disposal Poets Temp.
•
soaks pits in absence of the comprehensive sewerage system. The sewerage system provided
by MCL is underground; however it doesn't cover the entire municipal limits.
The present sewerage system covers about 67% of the area under MCL limits accounting to
90.84 sq. km. This reflects major deficiency in terms of provision of services.
The total quantity of waste water generated in the city is 432 MLD (90% of water supply).
Approximately, 57% of population is covered under sewerage network.
Presently, no sewerage treatment plant is existent in the city. Three new permanent disposal
& treatment plants are under construction and are likely to start operation soon.
.° lack of treatment / disposal plants. Three
t 4. • ..". • . new STP's are likely to be operational / • . -- -1,:.:. ■ Isemttnal I 'exal
Ci4P• I■t, . ' '. .
with the total capacity of 311 MLD. ...att.. '
,N. AO..., tot*, U.., C4...7 „. ..... i ..... PQ,7,
Potent
At. .
..■ la.. , 4.11. 1.11111,. Ca, ... ,
G.S.PUa , IOW. On ...flan
i o ■ s, ,,- Even after all the three STP's become t. —
, ''' " Jet.
ri,:' " ..."%n'Z''...
ol" toit4 1 5..... i
to"' Wm nd to "-twit
---■.,_. ,_....14.1:7'. ,
operational, there will be a huge gap to 1 aVr:se* Canal --/ 1' /
treat about to be constructed and Figure 12 : Sewerage system and proposed treatment plants
installed to meet out the full collection capacities.
• au.a Joan. tam gill'''.';;Tr• ri„. •
• Nire wit • • . • ,
Infrastructure Planning For Industrialization in Haridwar. 61

Zone Current Current Water supply 415 MLD Additional water supply (undeclared areas) 62 MLD
Current Waste water generated 432 MLD Domestic (@ 80% of water supply) 332 MW Industries 60 MLD Hotels, Hospitals 40 MLD Additional Waste water that will be generated 50 MLD Total waste water 482 MLD
Treatment facility being installed 311 MLD GAP 171 MLD
Table 6 Gap analysis of sewerage treatment capacities
(b) Sewerage network:-
Sewerage network is spread only
over 57% of the city area, thus 43%
of area need immediate attention.
Many related issues like pollution in Table 7 : Lengths of sewer pipe lines
Buddha Nala, ground water contamination, health hazards, and epidemic out breaks, air
pollution around Buddha Nala are arising due to lack of sewerage network.
5.5.3 Solid waste management
Solid waste arising from human activities is one of the major environmental problems
causing extensive pollution and threat to human health. The problems regarding management
of solid waste, both domestic and industrial, have by now, taken on acute shape, size &
nature in large metropolis. Due to limited disposal facilities the solid waste are dumped in a
hazardous manner in various parts of Ludhiana city causing not only environmental hazards.
The National Conservation Strategy and Policy Statement on environment and Development
has laid stress on adopting stringent measures for prevention and control of pollution due to
indiscriminate disposal of solid waste on land and into water resources.
Various types of solid waste generated at Ludhiana can be categorized in three groups: 62 Infrastructure Planning For Industrialization in Haridwar.
Year .2006 Current coverage Additional requirement
Area (sq.km) 90.8 68.61 Pipe length-Main sewer(km) 141 110 Pipe length • distribulion network (km) 1200 900

• Municipal Solid Waste (MSW)
• Hospital Solid Waste (HSW)
• Industrial Solid Waste (ISW)
MCL adopts a 'House to house' collection system. In this system the waste generated at
individual premises is segregated, manually, and is stored in standardized containers.
The solid waste is presently being dumped at
• Jainpur landfill site: Completely filled up and needs closure.
• Jamalpur & Noorpur land fill sites: Both land fill sites are operational but are not
lined and needs scientific methods of disposal techniques.
5.5.4 City Roads and Traffic Conditions
Ludhiana gained the status of the Only Metropolis in Punjab in 1999. The intensity of traffic
is increasing with its demographic and economic growth. The increase in number of
personalized vehicles has been phenomenal due to reported increase in per capita income and
also due to the prevailing consumer culture of the society.
5.5.4.1 Road network and hierarchy
The present road network coves 12.72 sq. km. of the city area which amounts to about 8% of
the total municipal area. Total road length is 1356 km. and the equivalent road length is 3390
km. The city has roads ranging from 6 m width to 35m width.
The existing road network of Ludhiana is radial in pattern converging into the heart of the
city. There is a circular link road on which six regional roads meet at different points.
About 31% of the
road length has ROW
more than 30m.
Table 8 : Connecting roads staus
Infrastructure Planning For Industrialization in Haridwar. 63
S. No. Name of the road Connecting to Length (m)
Carnage way (m)
Right of Way (m)
National Highway 1.
2.
Grand Trunk Road (NH-1)
NH-95
North — Jalandhar, South — Delhi Chandigarh and Firozpur
20.5
22
20
20
25-60
30-60
State Highway 1 Gill Road Sangrur and
Mansa 7.35 20 65

MAP SHOWING ROAD WIDTH 60 mt 40 mt 30 mt
5.5.4.2 Major issues
Major issues regarding traffic and road
network:-
(i) Congestion at all main chowks and
j unctions.
(ii) Inconvenience to local traffic and
concurrent traffic jams.
(iii) Inadequate road network.
Figure 13 : Road map of Ludhiana (iv) Threat to two wheelers and pedestrians.
(v) Delay in commuting (increased time of travel).
(vi) Vehicular breakdown and trucks etc. parked on road side.
(vii) Fatal accidents on entry points.
(viii) Inadequate parking facilities.
5.5.5 City public transport
Effective public transport is the need of every metropolitan city. The concept of public
transport is quite old in the city but has generally not met with any reasonable success so far.
5.5.5.1 Issues regarding public transportation system:
• City transport plays only on identified routes, and hence does not cater to all people.
• Increasing no. of privately owned vehicles on road.
• Lower speed limits and traffic congestion.
• Increasing levels of pollution in air due to heavy volumes of traffic.
5.5.5.2 Other modes of city transport
• Auto Rikshaws
• Cycle Rikshaws
• Taxies, etc.
64 Infrastructure Planning For Industrialization in Haridwar.

5.5.6 Inter city public transport
State transport: The bus terminal has a total area of 14.66 Acres and buses move to all
directions of Punjab and major cities including Delhi, Jammu, Amritsar, Chandigarh,
Sangrur, Ferozpur etc. Apart from the bus terminal oriented traffic, local traffic of the city
from different areas also move in the areas where traffic density is very high. Total of 3060
buses (heavy traffic) enter the city through densely populated area per day.
5.5.7 Freight transport
Railways provide the main freight transport for which a special railway yard exist at
Dhandari Kalan which is also called the dry port because of freight to other places. Next
major transport for freight purpose is trucks, which gets Loaded and unloaded at
Transport Nagar within city limits near
Samrala Chowk.
5.5.8 Bridges, Flyovers, Elevated
roads, ROB's & ROB's
Bridges over Buddha Nala and Sidhwan
Canal: There are only two water bodies
passing through the congested areas of
the city Approximately 16 km. stretch of Figure 14 : Bridges, Flyovers, Elevated roads, ROB's & RUB's
both passes through the city and have a varying width of 60ft — 80ft. Both sides of canal and
Buddha Nala are congested housing 25% of population on the outer side. Presently there are
14 bridges on Sidhwan canal. However, due to tremendous increase in population in the city,
there is an immediate need to establish more no. of connecting points as people often have to
travel long distances to reach their destinations across the water bodies.
5.5.9 Issues regarding roads & transportation
Ludhiana, being the geographically centrally placed city in Punjab and situated on either side
of Amritsar - Delhi Grant Trunk Road (NH-1), faces tremendous traffic pressure. City roads
Infrastructure Planning For Industrialization in Haridwar. 65
are presently, being overused. Resultantly, these are omnipresent traffic congestion, frequent
blockages of traffic on NH-1 and on all the six major junctions, which causes undesired delay
and extension in time of travel. The major issues are:
• Increased distances of communication due to lack of non-uniformly distributed
bridges and culverts on Buddha Nala and Sidhwan Canal.
• Traffic congestion mainly due heavy volumes of traffic in-efficient design of main
junctions and lack of civic & traffic sense and awareness in public.
• Increasing fatal road accidents due to improper/faulty junction designs.
5.6 Inferences drawn from case study
Ludhiana has undergone the spontaneous phase of rapid industrialization as Haridwar
presently is witnessing. Though there is a considerable difference between the geographic
and demographic sizes between the two cities, but the presence of similar civic infrastructure
and local governance there are many good reasons to learn lessons from the case study of
Ludhiana and to ascertain better results in case of Haridwar by close analysis of issues raised
in Ludhiana and the possible solutions.
The major shortcomings in case of Ludhiana may be summarized as:-
i) Lack of compressive planning and strategy regarding the development of industrial
sector and subsequent growth of the city. In fact the case study clearly reflects of the fact that
planning process is following the development in Ludhiana, whereas ideally, the growth must
follow the planning.
ii) The situation gets even gloomier due to lack of mutual co-ordination between the
various agencies involved in the development and implementation of planning in Ludhiana.
Hence, an immediate attention is much required to address the co-ordination. Also, it is much
desired to clearly identify the role of the various development agencies in terms of nature of
works and spatial distribution of work areas so as to avoid the overlapping of responsibilities
in some areas and to cover-up the complete city area including its fringes.
66 Infrastructure Planning For Industrialization in Haridwar.

iii) While it is important to fill the gap between the demand and supply of the
infrastructure facilities by 'Facilitating infrastructure supply; it is equally important to have
demand side interference by managing the existing demand as well as by continuous
monitoring /channeling the ever-increasing demand of infrastructure. This has to be
considered in a broader sense of regional planning in terms of rural-urban interaction.
iv) Ludhiana, unlike Haridwar, has invited almost all kind of Industries i.e. in scale and
nature and has not prioritized the environment friendly, non-polluting manufacturing. Thus a
strict policy addressing the issues of pollution of all kinds is the need of the hour. In fact,
residents of Ludhiana spontaneously claim the pollution, especially air and ground water
pollution, to be the first issue to be addressed.
Cautions are required at Haridwar as geographically, it is located at the foothills of sensitive
Himalayan ecological system. Although, state and control governments have taken the
initiatives by permitting only the non-polluting manufacturing units but efforts are required to
manage the infrastructure related to sewerage disposal solid waste management, storm water
disposal etc., to be done in the most judicious manner which allows minimum possible
disturbances to the fragile ecosystem of Himalayas.
v) Apart from the provisions of infrastructure facilities and services, it is also required to
educate the local un-employed youth with required skills and technology so as to harness the
maximum possible human resource. This will have multi dimensional benefits. First, it will
help in solving the evils of unemployment in the city and secondly this is certainly going to
check out the migration from various other locations to the city in search of employment.
And this fact is universally acknowledged that less population means less demand for
infrastructure which in turn means lower levels of investments and better levels of quality of
life in the city.
vi) Public awareness and induction of civic senses into the masses by propaganda and
publicity shall be put in place to educate people of the city to make optimum use of available
Infrastructure Planning For Industrialization in Haridwar. 67

resources like water supply, electric power, segregating solid waste into bio-degradable and
non-bio degradable wastes, disposing domestic waste in proper manner etc. which in turn
helps phenomenally in improving the indices of quality of life.
Use of alternative technologies in power sector, reuse of waste water into toilets / flush /
cistern etc. may serve as key instruments to manage the demand side interference of
infrastructure.
68 Infrastructure Planning For Industrialization in Haridwar.

Chapter 6: METHODOLOGY
Infrastructure Planning For Industrialization in Haridwar. 69

70 Infrastructure Planning For Industrialization in Haridwar.

6.0 Methodology
(i) General observation of the growth of industrial development (Signs of change in
geographical areas, nature of development, land prices, economic growth and increase in
infrastructural demands especially regarding traffic conditions, power and water supply as
these are identified as the primary indices of growth.
(ii) Identification of root-cause i.e., industrial development due to lucrative fiscal
incentives.
(iii) Collection of data regarding various elements like geographic, demographic,
economic aspects, through, secondary sources. The varying patterns of these indicators of
development provide the basis for planning of the urban scopes.
(iv) Preliminary analysis of the changes in geographic, demographic and economic
subjects prepare the ground to ascertain the need of studying the existing conditions with
relevance to the pre-recorded data (available with district level statistical agencies) and thus
enable one to project you future (stipulated time frame) with the constraints of socio-cultural
setup and prevailing government policies.
(v) After establishing the need of planning exercise, careful case studies of similar nature
shall prove to be an important tool to access the behavior of development, in demographic,
economic and spatial context. Also the impact on infrastructure facilities and services need
due attention.
(vi) The inferences drawn by the careful case studies shall be used as effective tools while
ascertaining the study of area under consideration. The grey areas identified in case study
need special attention while planning for the area under consideration.
(vii) Collection of data for area under consideration in terms of existing situations, with
reference to demography, quality & quantity existing infrastructure through secondary
sources is required. Sample surveys shall be conducted in specific locations to verify the
secondary data. Assimilation and analysis of the secondary data is the nest step towards
Infrastructure Planning For Industrialization in Haridwar. 71

establishing the relation between the existing and projected demands with the gap between
present supplies and future supply planning schemes.
(vii) The identification of data gaps will lead to the required field study-surveys, interviews
to complete the information base, which in turn leads to the final analysis, descriptive,
statistical and graphic.
The analysis plus the cause-effect relationship in the form of network diagrams and complex
time frame matrix will provide material for the base of planning.
The area of study comprises of Haridwar municipal limits, B.H.E.L. Township, with
upcoming industrial area I.I.E. & I.I. D.C. at village: Roshanabad & UPSIDC Industrial area
at Bahadrabad.
72 Infrastructure Planning For Industrialization in Haridwar.

Chapter 7: Haridwar — Infrastructure Planning for
Industrialization.
Infrastructure Planning For Industrialization in Haridwar. 73

74 Infrastructure Planning For Industrialization in Haridwar.

7.0 Haridwar — Infrastructure Planning for Industrialization.
7.1 Introduction
Haridwar is a unique city in many respects. The old city area, which is home to many
spiritual societies and Ashrams, has little land to grow. On the other hand, industrial
development in Integrated Industrial Estate and IIDC is likely to attract large number of
people to the city. The unparalleled influx of several million visitors during Kumbh Mela to
the city creates tremendous pressure to the city and its infrastructure. The demands and
challenges of development and preservation of its rich cultural and spiritual heritage and
natural environment require to be met concurrently.
The sectoral key issues are:
7.1.1 Physical Growth and Environmental HARIDWAR
DEHRADUN
Aspects: UTTAR PRADESH
There are major issues of: 31,aran,
he
(a) Restricted physical growth of town, due Root*
to hills, reserved forests and water bodies. NeuDelnekl
s VI) Ch.,.
Figure 15 : Connectivity map of Haridwar. (b) Ribbon development along the main corridor of town, within the municipal boundary.
(c) High density development in old Areas without proper infrastructure.
(d) Unauthorized constructions on undeveloped open land and fringe areas: supply of
serviced land is limited.
(e) Lack of affordable housing.
(f) Growth of slums and squatter settlements along the river and canal.
(g) Lack of clarity on status of land ownership.
(h) Pollution due to increased vehicular traffic.
(i) Pollution of the Holy River Ganges, and
RoshAes,
PAURI
Infrastructure Planning For Industrialization in Haridwar. 75

(j) Land slide and soil erosion from Mansa Devi Hill Degradation of riverside and lack of
public open spaces, sports and recreational facilities are leading to an unsustainable situation.
7.1.2 Water Supply
Lack of adequate supply, unequal distribution of water, low pressures, old dilapidated
pipelines, uncontrolled zoning and unsatisfactory operation and maintenance requires
thorough reorganization and upgradation of this sector.
7.1.3 Sewerage
Inadequate coverage of area under sewerage system and unserviced new areas require
immediate intervention and a careful planning with adoption of appropriate technology to
take care of environmental concerns.
7.1.4 Storm water Drainage
Although the natural topography of the city helps in gravity drainage, internal collector drains
are lacking; besides, major natural drainage courses require attention, as they are often
choked with silt and mud coming with run-off from hills.
7.1.5 Solid Waste Management
The city has not met its mandatory obligations and is burdened with an inefficient collection
system, environmentally unsound disposal practices and uncontrolled dumping at a site by a
rivulet. It thus requires immediate and sustained effort to upgrade to an acceptable level.
7.1.6 Roads and Transport
This sector perhaps is the most troubled one; with annual growth of tourists reaching an
unprecedented rate of 20% (2004-05) and over 16% growth rate (2005-06) of registered
vehicles, congestion and lack of parking spaces during Melas and festival season make the
citizens lives very difficult. The extremely narrow roads in the core city area, inadequate
traffic management throughout the city and a general lack of proper road hierarchy requires a
sustained effort over a period of time to reorganize the road sector. Public transport, which is
76 Infrastructure Planning For Industrialization in Haridwar.

in a rudimentary state, also requires large scale investment to support economic activity
commensurate with the growth potential.
7.1.7 Urban Poor
The city has about 20 main slums and about another 29 minor poverty pockets or slums,
accommodating about 47% of total population. Approximately, 7.6% of the poor are families
Below Poverty Line (BPL).
7.1.8 Institution and Governance: Haridwar Nagar Palika Parishad (HNPP) has very few
functions in the municipal domain. Unlike city corporations elsewhere in India, HNPP has
very limited role to play in the city's planning, development and infrastructure provision. In
fact, solid waste management is the main function of HNPP. Conventional municipal
functions such as water supply, sewerage, roads, etc. are in the hands of either para-statals or
state agencies. Haridwar needs a strong municipal political executive as the key driver of
change management.
7.1.9 Municipal Finance of HNPP and Finance of para-statals: HNPP, UJS, and HDA are
the three most important agencies responsible for the urban finance in Haridwar. HNPP's
revenue receipts (own) mainly comprises of Property / House tax, rentals and advertisement.
UJS's revenue receipts are mainly water tax and water charges. HDA's revenue receipts
mainly arise out of state government grants, followed by non-tax receipts and house tax
receipts. Its revenue expenditure is due to establishment, operation and maintenance (O&M),
interest and debt servicing as also due to refund of deposits. Capital expenditure has not been
significant and mainly comprises of development expenditure, grants expenditure, assets,
loan repayments and various refunds.
7.2 Estimates of various infrastructural works
Based on situation analysis, strategy to achieve vision and continued monitoring, projects
have been identified, and costs estimated. The city needs a total investment of Rs. 4,446
crores. This investment, phasing over the next 20 years or so, needs an utmost careful
Infrastructure Planning For Industrialization in Haridwar. 77

allocation of funds under various heads and works. The component-wise summary of the
required investments is given in the Table below. It is seen that 63.3% of the total identified
investment is proposed in the roads, traffic and transport sector followed by 20.7% in urban
renewal, 5% for basic services to urban poor, 4.1% is for Drainage, 2.6% for water supply
sector, 1.5% for sewerage, and 1.7% for solid waste management.
S. No. Projects Total Cost (Rs. Crores)
1. Water Supply 120.2
2. Sewerage & Sanitation 68.6
3. Storm Water Drainage 188.3
4. Solid Waste Management 78.5
5. Roads and Transport 2,919.3
6. Street Lights 18.0
7. Urban Poor / Slums 231.2
8. Urban Renewal and Redevelopment 954.2
9. Heritage and Tourism 31.6
Total 4,609.9
Source: DPR prepared by GHK International, UK under the scheme of JNNURMfor Haridwar.
7.3 Demographic Profile
Haridwar: Development Area (Total Land Area = 20119 Hectare.)
Haridwar is the second largest city of Uttrakhand after Dehradoon, both geographically and
demographically. Haridwar houses the district headquarters and also serves as the gateway to
the prestigious Chardham Yatra to Badrinath, Kedarnath, Gangotri & Yamunotri. Therefore
the permanent as well as the floating population of the city play a vital role while planning
for the infrastructure for the Development Area: Haridwar.
78 Infrastructure Planning For Industrialization in Haridwar.
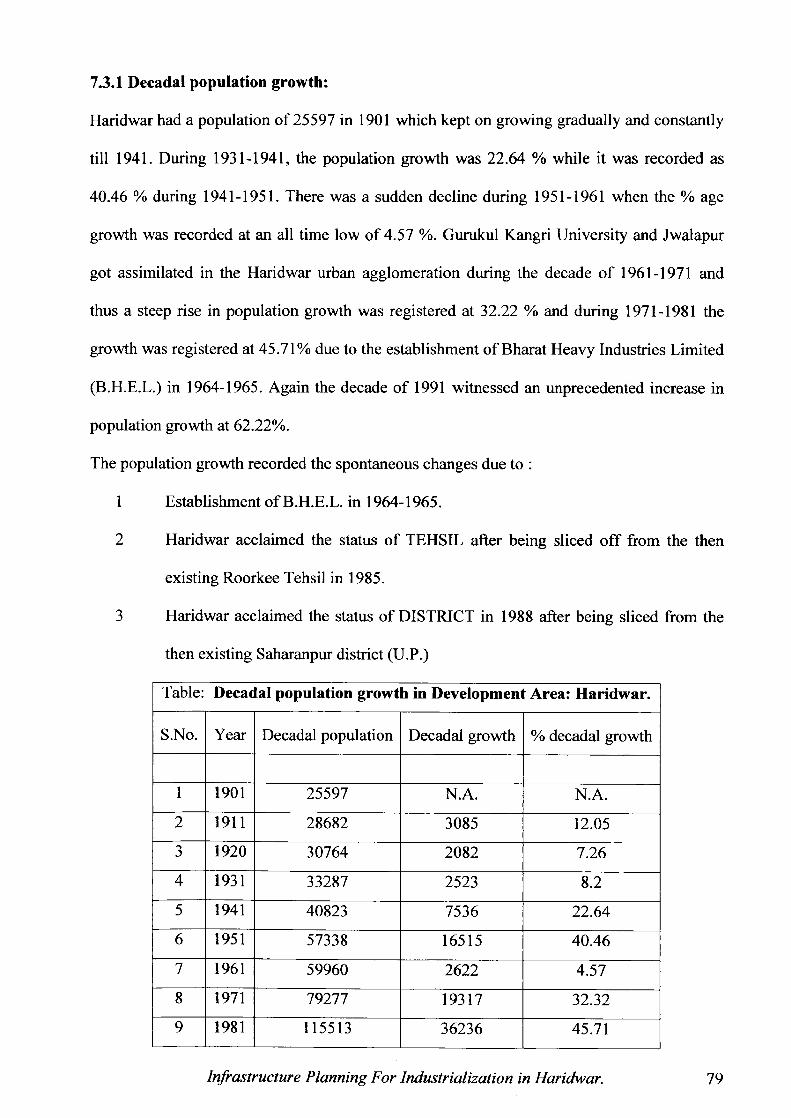
7.3.1 Decadal population growth:
Haridwar had a population of 25597 in 1901 which kept on growing gradually and constantly
till 1941. During 1931-1941, the population growth was 22.64 % while it was recorded as
40.46 % during 1941-1951. There was a sudden decline during 1951-1961 when the % age
growth was recorded at an all time low of 4.57 %. Gurukul Kangri University and Jwalapur
got assimilated in the Haridwar urban agglomeration during the decade of 1961-1971 and
thus a steep rise in population growth was registered at 32.22 % and during 1971-1981 the
growth was registered at 45.71% due to the establishment of Bharat Heavy Industries Limited
(B.H.E.L.) in 1964-1965. Again the decade of 1991 witnessed an unprecedented increase in
population growth at 62.22%.
The population growth recorded the spontaneous changes due to :
1 Establishment of B.H.E.L. in 1964-1965.
2 Haridwar acclaimed the status of TEHSIL after being sliced off from the then
existing Roorkee Tehsil in 1985.
3 Haridwar acclaimed the status of DISTRICT in 1988 after being sliced from the
then existing Saharanpur district (U.P.)
Table: Decadal population growth in Development Area: Haridwar.
S.No. Year Decadal population Decadal growth % decadal growth
1 1901 25597 N.A. N.A. 2 1911 28682 3085 12.05 3 1920 30764 2082 7.26 4 1931 33287 2523 8.2 5 1941 40823 7536 22.64 6 1951 57338 16515 40.46
7 1961 59960 2622 4.57 8 1971 79277 19317 32.32 9 1981 115513 36236 45.71
Infrastructure Planning For Industrialization in Haridwar. 79

10 1991 187392 71879 62.22
11 2001 220767 33375 17.81
Table 9 : Decadal population growth in Haridwar. Source: Draft Master Plan for Haridwar - 2025
Haridwar hosts about 8 million religious tourists every year. For projection of population (the
permanent population) of this town, the tourist arrival per season is not relevant. However, its
impact on the sector activities like trade, hospitality services, transportation etc. can not be
overlooked. The giant public sector unit BHEL (population 90,000 in its colony), a large
industrial estate ( Integrated Industrial Estate) housing some 541 small and mid sized
industries together employing 18000 workers have their impact on the tertiary sector of the
economy of the town. In private sector also, some large industrial units are functioning in the
fringes of Haridwar, which have impact on the economy of the town; and many more units
which are in the offing, will also indirectly strengthen the economy of this town. As the
economy grows, the rate of in-migration of workers will grow concomitantly, which will
reflect on the growth of population.
In this background it may be presumed that Haridwar's population growth rate will gradually
increase in the next couple of decades and then taper off to finally stabilize at the natural
growth rate of 2.5 % per annum. As stated earlier, throughout the year, Haridwar hosts large
number of religious tourists. As per official record the tourist arrivals in Haridwar in the years
2003, 2004, and 2005, was 5.5 million, 6.3
350
300
200
percentage increase of tourist arrival in 250
2004 over 2003 was 14 %, and that in 2005 150
100 over 2004 was 20 %. Taking the number of
50
0 2001 2005 2010 2015 2020 2021 tourist arrival of the year 2005 (7.5 million)
Year
Figure 16 : Population projection
Haridwar: Projected population
million and 7.5 million respectively. The
80 Infrastructure Planning For Industrialization in Haridwar.
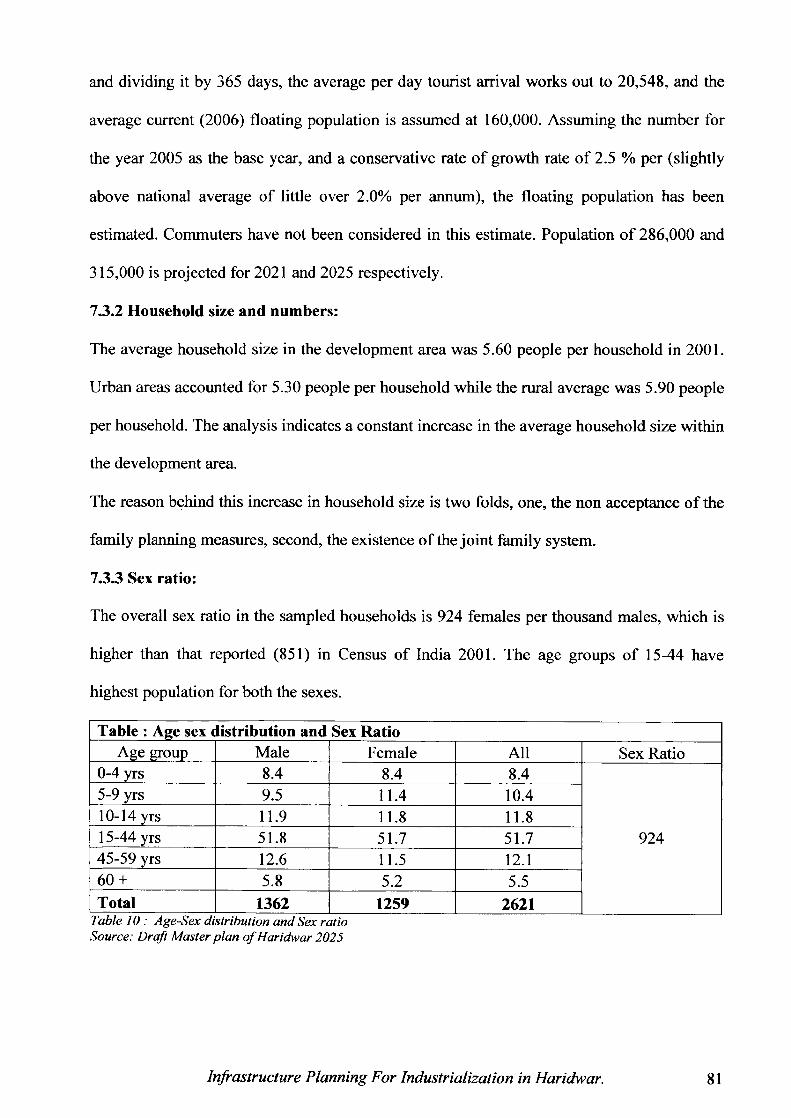
and dividing it by 365 days, the average per day tourist arrival works out to 20,548, and the
average current (2006) floating population is assumed at 160,000. Assuming the number for
the year 2005 as the base year, and a conservative rate of growth rate of 2.5 % per (slightly
above national average of little over 2.0% per annum), the floating population has been
estimated. Commuters have not been considered in this estimate. Population of 286,000 and
315,000 is projected for 2021 and 2025 respectively.
7.3.2 Household size and numbers:
The average household size in the development area was 5.60 people per household in 2001.
Urban areas accounted for 5.30 people per household while the rural average was 5.90 people
per household. The analysis indicates a constant increase in the average household size within
the development area.
The reason behind this increase in household size is two folds, one, the non acceptance of the
family planning measures, second, the existence of the joint family system.
7.3.3 Sex ratio:
The overall sex ratio in the sampled households is 924 females per thousand males, which is
higher than that reported (851) in Census of India 2001. The age groups of 15-44 have
highest population for both the sexes.
Table : Age sex distribution and Sex Ratio Age group Male Female All Sex Ratio
0-4 yrs 8.4 8.4 8.4
924
5-9 yrs 9.5 11.4 10.4 10-14 yrs 11.9 11.8 11.8 15-44 yrs 51.8 51.7 51.7 45-59 yrs 12.6 11.5 12.1 60 + 5.8 5.2 5.5 Total 1362 1259 2621
Table 10 : Age-Sex distribution and Sex ratio Source: Draft Master plan of Haridwar 2025
Infrastructure Planning For Industrialization in Haridwar. 81

60.0
50.0
40.0
30.0
20.0
10.0
0.0
Age-Sex Distribution
Oto4 5 to9 10tc) 14 15to44 45 to59 59
Ago Gr coup
III Mats Ferrol e
Table 11 : Age Sex Distribution of population in Development Area: Haridwar.
7.3.4 Literacy
Literacy, being an important indicator of social development, affects the demographic
characteristics and participation in labour force. As per Census of India 2001 literacy rate in
urban Haridwar is 84.3 % for males and 72.3 % for females, the corresponding numbers for
the state-average being 87.1 % and 72.3 % respectively. The literacy rate of Haridwar is
relatively low. The survey results show there are 78.7 percent literate males and 66.3 percent
females. Overall literacy is 72.9 percent in the town. This data shows a gender gap of 12.4 %.
Table : Literacy status of Population Age 7 Years and above Males Females Total
Illiterate Literate Illiterate Literate Illiterate Literate 21.3 78.7 33.7 66.3 27.1 72.9
Source: DPR prepared by GHK International, UK under the JNNURM, Haridwar. Table 12 : Literacy status of Haridwar
7.3.5 Employment
Data on employment shows that 42 percent of the workers are in service, 10 percent are self
employed, 0.5 percent is unemployed. Of all 44 percent are students, 2.8 percent are
housewives, 0.1 percent are farmer, 0.7 percent are retired.
Table :%age distribution of occupation by age (in years)
Category Age group (in Years)
< 18 18-24 25-44 45-59 60 + Total Service 2.5 36.5 67.6 76.7 63.3 41.7
82 Infrastructure Planning For Industrialization in Haridwar.

Employed 0.2 7.8 18.3 16.3 20.6 10.3 Self Employed 0 0.5 0.2 1.6 1.5 0.5
Students 96.9 54.5 7.8 0 0 44 Housewives 0.2 0.5 5.7 4.9 2.9 2.8
Farmers 0 0 0 0.5 0 0.1 Retired 0 0 0.2 0 11.8 0.7
Source: DPRprepared by GHK International, UK under the JNNURM, Haridwar. Table 13 : % distribution of occupation by age
7.3.6 Income and Expenditure
Mean per capita income of the families is Rs.2372 and mean household income is Rs.7144.
There is a considerable proportion of population in the lower expenditure group and it is
evident that they spend more than their income. Families in the middle income groups have
maximum savings in the sample.
Table : Data on Income (% population) Per Capita Income Rs. %age Mean Income
1 co 1-1
Ckit -la *ma C..) i. cu 0.•
Below poverty line Up to 562 47.2
Rs. 1289.7
Poor 563-1999 34.6
Lower Middle 2000-3499 9.1
Upper Middle 3500-5999 6
High 6000 + 3.1
"tz
4 7, ci4 El
a) ©
`g cr.: .-
Up to 2999 53.2
Rs. 7144.40
3000-5999 20.4 6000-9999 8.4
10000-14999 6.4 15000 + 11.5
Source: DPR prepared by GHK International, UK under the JNNURM, Haridwar. Table 14 : Data on Income
Table : Data on Expenditure and Saving Description Rs. % age
Household Income
Up to 2999 54 3000-5999 21.1 6000-9999 8.7
10000-14999 8 15000 + 8.2
Mean Expanses Rs. 6375.7 Infrastructure Planning For Industrialization in Haridwar. 83

Household savings
Up to 2999
6.9 3000-5999
25.9 6000-9999
31 10000-14999
14.7 15000 + 21.6
Mean Savings Rs.4362.8 Source: DPR prepared by GHK International, UK under the JNNURM, Haridwar.
Table 15 : Data on expenditure and savings
Table shows the distribution of population by household composition and form of tenure and
possession. Majority in each income group have freehold title of their land and having their
own pucca house with electricity. All the high income group families own land, and have
pucca house with electricity. On an average 20 percent of all the families in the slums stays
with some other family; in other income groups this value ranges between 7 and 15. Seventy
seven percent of the households have legal electric connection in the BPL group; among poor
and lower-middle group, connection increases from 92 to 100 percent.
Around 36 and 89 percent of the BPL and poor households respectively use gas as fuel for
preparing food. This increase with higher income and in upper-middle and high income
groups 100 percent families has gas connection. Kerosene is used in almost all the groups,
except two higher groups all others use wood as fuel; 50 percent of BPL families use wood.
Table : Distribution of Population by Household composition and possession
Characteristics of Household (% age)
Income Group
B.P.L. Poor Lower Middle
Upper Middle High
Land Ownership Freehold Title 74.6 79.5 95.1 96.3 100 Lease 8 9 2.4 0 0 Patta 0.5 0 0 0 0 Joint Patta 0 0 0 0 0 No legal rights 1.9 1.3 0 0 0 Other Legal rights 1.9 10.3 2.4 3.7 0 House Ownership Own 85 89.1 97.6 96.3 100 Rented 15 10.1 2.4 3.7 0 Mean rent per month Rs.409.7 Rs.484.90 Rs.80000 Rs.600
84 Infrastructure Planning For Industrialization in Haridwar.

Type of construction Kutcha 28.2 17.9 2.4 0 0 Semi Pucca 25.4 10.3 0 0 0 Pucca 46.5 71.8 97.6 100 100 Access to Electricity Yes 75.6 88.5 100 96.3 100 No 24.4 11.5 0 3.7 0 Electric meter Yes 77 92 97.6 100 100 No 23 8 2.4 0 0 Fuel used Gas 35.7 68.6 97.6 100 100 Kerosene 14.1 14.1 0 7.4 14.3 Wood 50.2 17.9 2.4 0 0
Source: DPR prepared by GHK International, UK under the JNNURM, Haridwar. Table 16 : Distribution of Population by Household composition and possession
7.3.7 Migration
Most of the families are residing in the town for about 12 years and about a quarter of the
migrated families have moved in from another city. While tracing the migration pattern
within last 5 years it was found that majority (79.5 percent) of the families are in the town for
more than that period. More than 80 percent of the BPL and poor families are residing in the
town for more than 5 years. Of all the households, 2.8 percent moved from another part of the
town, 1.3 percent migrated from another town and 0.4 percent came from rural area. This
contradicts the notion that poor settlements are created by migration from rural areas.
Table : Migration of various income groups in last 5 years ( Household % age)
Migration period Income groups
Total BPL Poor Lower Middle
Upper Middle High
All moved in last 5 years 25 9 12 2 2 0
From another part of the town 20 11.1 25 0 50 0
From another town 24 22.2 25 50 0 0 From rural area 8 11.1 8.3 0 0 0 Not specified 8 0 16.7 0 0 0
Source: DPR prepared by GHK International, UK under the .INNURM, Haridwar. Table 17 : Migration of population in Haridwar
Infrastructure Planning For Industrialization in Haridwar. 85

7.4 Urban Poverty Profile
7.4.1 Poverty and Vulnerability
It is important to examine poverty with reference to its various dimensions including asset
ownership. Interventions need to be worked out to reduce urban poverty especially the
vulnerability of the poor and to enhance their assets in terms of- labour, human capital,
housing, social capital and so on.
7.4.2 Urban Poverty Profile of Haridwar
This section presents an overview of the urban poverty in Haridwar. No recent studies are
available about the extent of poverty levels in the town. According to information available
from the NPP and the District Urban Development Agency (DUDA) the town has 20 main
slums scattered across the town. In addition to these slums there are a few smaller slums,
which add up to a total 49 slums. The slum population is about 47 percent of the total
population of the town.
Table: List of Slums in Haridwar
S.No. Name of Slum Areas
1 Gosai Gali, Bhim Goda
2 Basant Gali, Balmiki Basti, Kharkahri
3 Mukhiya Gali, Bhupat wala
4 BhramPuri- above lalta rau bridge
5 New Basti, Bhimgoda, Balmiki basti
6 Ghosiyan, Jawalapur
7 Lodha Mandi jawalapur
8 Pul Jatwada, jawalapur
9 Kadachh, Jawalapur
10 Tiwidi, BHEL Road
11 Lodha Mandi, Industrial Area
86 Infrastructure Planning For Industrialization in Haridwar.

12 Kumhar Gadha, Kankhal
13 Latowali, Purbiya Mandi, kankhal
14 Ravidas Basti, Kankhal Harijan Basti
15 Teliyan Kanjran, Sharifnagar, Jawalapur
16 Kashipura, Jogiya Mandi
17 Dev Nagar Basti, Hanuman Gadi Kankhal
18 Uttam Nagar Basti, Bhupatwala
19 Mayapur Balmiki Basti, Near Garage and Tank No. 6
20 Bairagi Camp, Chhawni
Source- Document of Haridwar Nagar Palika Parishad /DUDA (2006)
7.4.3 Household Profile
Slum population in Haridwar is 86,848. Average household size for slum households is 7.10.
The slums on encroached land and on the hill slope are generally worse in comparison to
other slums. Of the below poverty line (BPL) population, 15 percent households and 10
percent of the poor do not have any legal rights of the land. In the absence of ownership of
land and clear policy to address their problems, the poor suffer from many inadequacies in
terms of access to basic services and infrastructure. Land availability is a major constraint in
the slums. On an average 20 percent of all the families in the slums stays with some other
family.
7.4.4 Situation Analysis
The status of service delivery and service coverage is summarized in the following sections.
7.4.4.1 Water Supply
Majority (81%) of all the households have connection for r-
water supply. Of the BPL households, 70 percent and 87
percent of the poor have house connection. The number of
Infrastructure Planning For Industrialization 7

house connection increases with higher income. In the two upper income groups all have
house connection. Water supply problem exists in many slums as the supply is very irregular
in some localities.
Table: Source of Drinking Water (% of Households)
Source of Drinking Water
Table : Source of drinking water (household % age)
Source of drinking water BPL Poor Lower Middle
Upper Middle High
House connection 69.5 86.5 97.6 100 100 public stand post 25.4 10.9 2.4 0 0 Neighbor's house 3.3 1.9 0 0 0 Municipal tanker 0.9 0 0 0 0 Private vendor 0 0 0 0 0 Tube well / hand pump 0.9 0.6 0 0 0
Source: DPR prepared by GHK International, UK under the JNNURM, Haridwar. Table 18 : Source of drinking water 7.4.4.2 Sanitation and Sewerage
Almost 77 percent of the households have a latrine in the house. Only 3.6 percent BPL
families and 3.8 percent of the poor families have pit latrines. Rest has sanitary latrines.
Those who do not have a latrine in the house go for open defecation. Seventy seven percent
of all households have sewer connection. Cleaning and maintenance of latrines are mostly
done by the respective family.
Table : Data on sanitation and sewerage disposal
Characteristics BPL Poor Lower middle
Upper middle High
Defection sites for males Latrine in household 64.8 83.3 97.6 100 100 Neighbor's house 0.5 0.6 0 0 0 Public toilets 0.5 0.6 0 0 0 Pay and use toilets 0.5 0 0 0 0 Open defection 33.8 15.4 2.4 0 0 Defection sites for females Latrine in household 64.8 83.3 97.6 100 100 Neighbor's house 0.5 0.6 0 0 0 Public toilets 0.5 0.6 0 0 0 Pay and use toilets 0.5 0 0 0 0 Open defection 33.8 15.4 2.4 0 0 88 Infrastructure Planning For Industrialization in Haridwar.

Defection sites for children Latrine in household 64.8 82.7 97.6 100 100 Neighbor's house 0.5 0.6 0 0 0 Public toilets 0.5 0.6 0 0 0 Pay and use toilets 0.5 0 0 0 0 Open defection 33.8 15.4 2.4 0 0 Not specified 0 0.6 0 0 0 Water in latrines Yes 70.9 85.3 97.6 96.3 100 No 29.1 14.7 2.4 3.7 0 Latrine discharges Sewer 88 93.3 97.5 88.9 100 Drain 6 5.2 2.5 11.1 0 River 0 0 0 0 0 Open land 0 1.5 0 0 0 Septic tank / Soak pit 6 0 0 0 0
Note :- Data show household in % age Source : Nagar Palika document, 2003
Table 19 : Data on sanitation and sewerage disposal
Sewer line is absent in many areas, people have septic tank or soak pit with their latrines.
7.4.4.3 Solid Waste Management
Sweeping and Solid Waste Management (SWM) are done by HNP. The service is irregular
and overall primary collection is poor (43 percent of population dispose garbage in the open).
Many appoint private scavengers for cleaning against a monthly payment. Covered waste
bins are required in the localities. The drains and streets in slums are either irregularly
cleaned or not cleaned at all.
Only about 16 percent segregate solid waste at source, this number is higher with higher
income groups. Municipal collection is not uniform in the town. All in high income group
have appointed private worker for solid waste collection and they pay for this monthly.
Burning waste is practiced in the locality. Burning is mainly done by the NPP workers. 4
percent of the households sell old news paper, plastic, glass, bottles, etc. and 33 percent
dispose them with other wastes.
Infrastructure Planning For Industrialization in Haridwar. 89
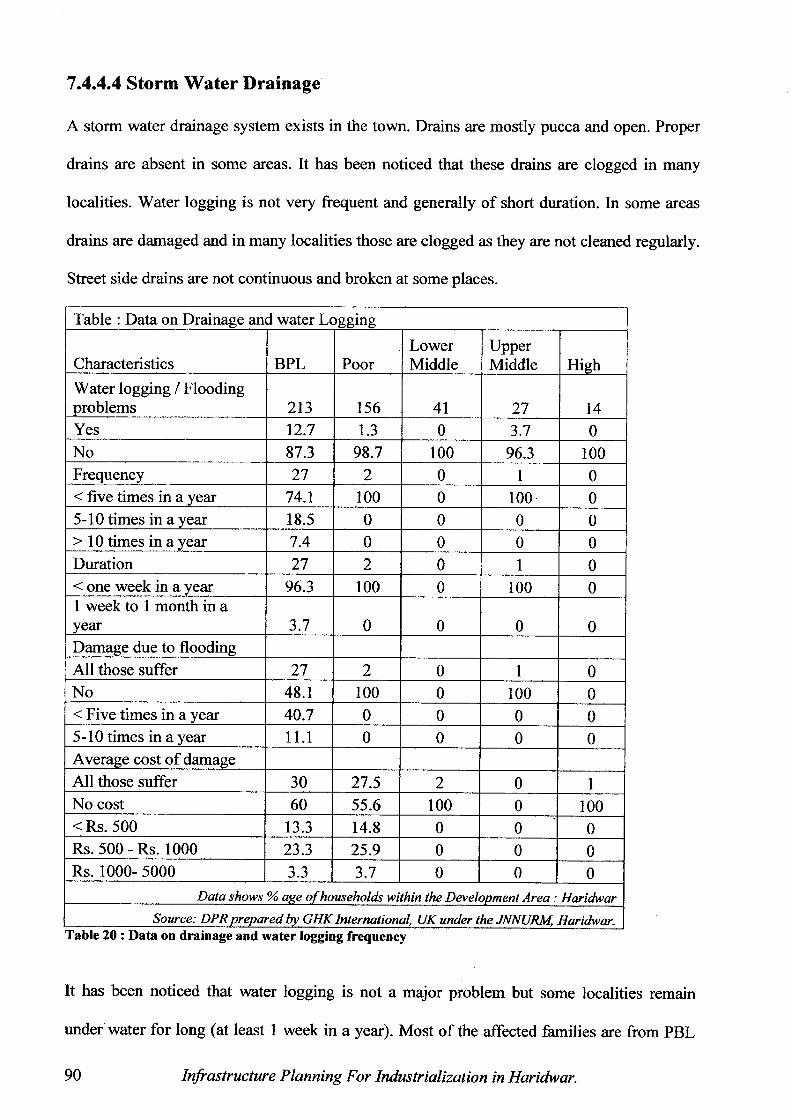
7.4.4.4 Storm Water Drainage
A storm water drainage system exists in the town. Drains are mostly pueca and open. Proper
drains are absent in some areas. It has been noticed that these drains are clogged in many
localities. Water logging is not very frequent and generally of short duration. In some areas
drains are damaged and in many localities those are clogged as they are not cleaned regularly.
Street side drains are not continuous and broken at some places.
Table : Data on Drainage and water Logging
Characteristics BPL Poor Lower Middle
Upper Middle High
Water logging / Flooding problems 213 156 41 27 14 Yes 12.7 1.3 0 3.7 0 No 87.3 98.7 100 96.3 100 Frequency 27 2 0 1 0 < five times in a year 74.1 100 0 100 0 5-10 times in a year 18.5 0 0 0 0 > 10 times in a year 7.4 0 0 0 0 Duration 27 2 0 1 0 < one week in a year 96.3 100 0 100 0 1 week to 1 month in a year 3.7 0 0 0 0 Damage due to flooding All those suffer 27 2 0 1 0 No 48.1 100 0 100 0 < Five times in a year 40.7 0 0 0 0 5-10 times in a year 11.1 0 0 0 0 Average cost of damage All those suffer 30 27.5 2 0 1 No cost 60 55.6 100 0 100 < Rs. 500 13.3 14.8 0 0 0 Rs. 500 - Rs. 1000 23.3 25.9 0 0 0 Rs. 1000- 5000 3.3 3.7 0 0 0
Data shows % age of households within the Development Area : Haridwar Source: DPR prepared by GIN International, UK under the JNNURM, Haridwar.
Table 20 : Data on drainage and water logging frequency
It has been noticed that water logging is not a major problem but some localities remain
under water for long (at least 1 week in a year). Most of the affected families are from PBL
90 Infrastructure Planning For Industrialization in Haridwar.

households, but they do not suffer any major damage due to flooding and water logging.
7.4.4.5 Approach Road and Street Light
Ten percent of city dwellers do not have paved approach road. Most of other colonies have
proper approach road. Streets are in bad condition in the old city areas and street lights are
inadequate and many are not well maintained. Light bulbs are non-functional often.
7.4.4.6 Priorities
74.5 percent households have express that their first priority is water supply. Second priority
of 56.3 percent is sanitation and 43.2 percent placed drainage in their second priority. Solid
waste collection is of fourth priority to some (33.5%) families.
Table . Priority in order of importance to quality of life
S.No. Services Priority
1 Priority
2 Priority
3 Priority
4 Priority
5 Priority
6 1 Water supply 74.5 2 Sanitation 56.3 3 Drainage 43.2
4 Solid waste collection 33.5
5 Roads / street lighting 38.6
6
Proximity to public transportation system 70.7
Source . DPR prepared by GHK International, UK under the J1VNURM, Haridwar. Table 21 : Priority of infrastructural services
Some (38.6%) of the families put emphasis on roads and street lighting as their 5th priority.
They felt that the streetlights is important for residents especially women. A large number
(70%) has considered proximity to public transport as their 6th priority.
7.4.4.7 Health and Hygiene
It has been found that hygienic practices of citizens are good. Use of soap is high, 91-100
percent of the people, who go for open defecation uses footwear. Reported cases of diarrhea
and ARI are very rare.
Infrastructure Planning For Industrialization in Haridwar. 91

Table : Data on mortality in the year 2006 ( "/0 age households) Upper Middle High Characteristics BPL Poor
Lower Middle
Death in last year Children under 5 years of age 0.5 0 0 0 0 Others 0.5 0.6 0 0 0 No 99.1 99.4 100 100 100 Probable cause of death Households having death cases Road accidents 50 T.B. 50 Gastric 100
Average cost of treatment for the family per month Nothing 6.1 7.7 0 7.4 7.1 Less than Rs. 50 14.6 15.4 12.2 7.4 0 Rs. 50 -100 31.5 21.8 4.9 3.7 0 Rs. 100-200 10.3 22.4 7.3 3.7 0 More than Rs. 200 37.1 32.1 75.6 77.8 92.9 Not specified 0.5 0.6 0 0 0
Source: Document of the Nagar Palika Parishag Haridwar. Table 22 : Data on mortality in 2006 due to bad sanitation conditions
Total reported death occurred in the last year was 3, the causes are presented below. A death
due to TB was reported from the BPL group and a case of death due to gastric problem was
from poor group.
7.4.4.8 Key Urban Social Issues.
The key issues identified during community consultation and by situation analysis are:
• Drinking water supply in the development area is not adequate.
• Practice of open defecation exists in some old areas.
• Absence of sewer in many areas.
• Solid waste is poorly managed in most of the old areas.
• Drains are mostly open and as a result often blocked as solid waste is dumped in them.
92 Infrastructure Planning For Industrialization in Haridwar.

• Community infrastructure is not sufficient
The specific needs in the old city areas are:
• Providing sufficient, timely and uniform supply of potable water.
• Installing public stand post.
• Laying of new sewer connection or connecting independent latrines to existing sewer line.
• Initiating solid waste management, especially segregation at source.
• Construction of side drains.
• Paving approach roads.
• Maintenance of street lights.
• Organizing residents in the participatory process
• Involvement of Community Based Organizations (CB0s)/Non-Government Organizations
(NGOs) in the whole process.
• Utilization of existing community centres as base offices of community based complaint
redress system.
• Establishing a community development cell in the NPP and deploying an officer, who could
be a link between the NPP and the base offices.
• Launching awareness program.
• Securing land tenure to the residents and providing low cost housing. EWS housing
schemes should be targeted at registered slum dwellers. In-situ upgradation should be given
priority within such schemes.
• Convergence of various poverty alleviation programs.
7.5 Economic Development.
7.5.1 Economic Base of City
Haridwar is the hub of religious tourism in the State of Uttrakhand. Among several religious
tourist destinations in this State, Haridwar attracts largest number of visitors, the impact of
which on the service sector is quite significant, particularly in the small trade, hotel business,
Infrastructure Planning For Industrialization in Haridwar. 93

transport and such other activities. Haridwar is also growing as the industrial hub of the State.
The public sector unit BHEL, although having its own colony of 90,000 persons, has indirect
impact on the economy of the town. Besides, a number of medium and large scale industrial
units are already operating within and in the fringe areas of the town and many others are in
the offing. An Integrated Industrial Estate is also operational in the area.
It can be conjectured that the dominant sector of the economy of Haridwar is the tertiary
sector. This is substantiated by the fact that in most of the years since 1996-97, tertiary
sector's contribution to the NSDP of Uttrakhand was the highest (43% in 2003-04), and that
of the secondary sector the lowest. With the growth of tourist population, which has already
recorded as 7.5 million (2005), the tertiary sector will continue to grow, particularly the
activities like transport and storage, communication; trade, hotel and restaurant; real estate
and bus services. Besides being a tourist hub, Haridwar, in relative terms, is the most
industrialized area of Uttrakhand. 21,742 workers are engaged in industrial units in the
Haridwar development area; 14,000 are employed by the BHEL and its ancillary units alone.
Outside the city limit, there are 19 functioning industrial units together employing 2600
workers.
Table : Industries and workforce relationship in the Development Area : Haridwar
Type of units
Within Urban Areas
Outside Urban Areas
- Total No.
No. of workers
No. of Industrial
units No. of
workers
No. of Industrial
units No. of
workers
No. of Industrial
units Pharmaceuticals and chemicals 1841 47 310 17 2151 64 Engineering and automotives 3107 53 117 3 3224 56 Electricals (including BHEL) 15552 21
' 621 37 16173 58
Food Processing 2761 23 215 11 2976 34 Iron and Steel 321 7 175 4 496 11 Plastics 111 8 23 3 134 11
94 Infrastructure Planning For Industrialization in Haridwar.

Others 1704 51 541 12 2245 63 Total 25397 210 2002 87 27399 297
Source: Government of Uttrakhand Directorate of Industries, (Directory) 2007. Table 23 : Industries and workforce relationship
Haridwar's economic structure is quite complex. The relative impact of the incredibly high
number of religious tourist arrivals on the economy of the city on the one hand, and relatively
heavy concentration of industries on the other, accentuate the complexity. In the absence of
data, sector-wise contribution of Haridwar city to the NSDP can not be assessed. It can only
be conjectured that notwithstanding relatively more concentration of industries in this city, its
tertiary sector is still a major player in it's over all economy. This contention is based on the
fact that given the huge tourist arrivals; there are strong service sector activities like transport,
hotel, eating places, small trade etc. in this city.
7.5.2 Economic Growth potential
As it stands now, Haridwar is one of the focal areas for industrial development and growth in
Uttrakhand. As the New Industrial Policy is implemented, Haridwar will experience an
accelerated growth in secondary sector. The present pattern of concentration of industrial
units indicates that Haridwar is a preferred destination for industrial investments in
Uttrakhand. Being closer to the National Capital Region and having very good rail and road
connectivity, Haridwar offers locational advantage for industries. It is understood that
Haridwar is the focus area of the State for industrial development. A large Industrial Estate is
already in operation in this area and a few are planned to be located here. There is lot of
optimism about faster rate of industrialization of Haridwar.
Infrastructure Planning For Industrialization in Haridwar. 95

60.00
50.00
40.00
30.00
20.00
10.00
0.00 2002 2003 2004 2005 2006 2007
❑ Primary sector Agricultural and manufacturing)
o Secondary sector (Trade and commerce)
❑ Tertiary sector ( Services like hotels and transportation and tourism )
Figure 17 : Workforce %age in various sectors of economy.
Haridwar is already showing the sign of restructuring its economic base, and emerging as an
urban center with industrial base. Some 500 industries have already signed on to set up their
units in two integrated industrial estates (I.I.E.$) in Haridwar, envisaging an investment of Rs.
4000 crores. In addition to the public sector unit of BHEL, a number of medium and large
scale industrial units are already operating within and in the fringe areas of the town and
many others are in the offing. In consonance with the growth of the secondary (industrial)
sector, the tertiary sector will also grow, may be at a much faster rate. Growth of these two
sectors together will create more employment opportunities in this town in the mid and long
term periods with their impact on the growth of population, both in terms of natural growth
and in-migration. As in the case of Dehradun, the impact of two factors viz. large investments
in industries which are expected to be made in the coming years; the planned infrastructure
and institutional improvement with financial assistance of the ADB and the Infrastructure
Development Fund; and the proposed overall development of the town under the Jawaharlal
Nehru Urban Renewal Mission will widen employment opportunities both in secondary and
tertiary sectors.
96 Infrastructure Planning For Industrialization in Haridwar.

7.6 Efforts for Planned Development
The sudden increase in population from 57,338 in 1951 to 145,946 in 1981 due to
establishment of BHEL led to rapid and unplanned growth of Haridwar town resulting in
infrastructure deficiencies. In order to ensure planned and controlled growth of Haridwar
town and the neighboring rural areas, the first master plan of Haridwar was prepared by the
Town and Country Planning Division Office (located at Meerut). The first Master Plan
prepared for the time horizon of 1985- 2001, still continues to be the legal document. A new
Master Plan for 2025 is under preparation by the Town and Country Planning Department,
Uttrakhand and the draft plan has been published inviting objections and suggestions from
the public.
Review of Master Plan 2001
The Master Plan 2001 was prepared for a projected population of 3.06 lakh which included
2.13 lakh population in Haridwar NPP area, 71,440 rural population and 21,370 migrants.
The Master Plan covers all the sectors such as housing, commerce, industries, public utilities,
transport, government offices, and tourism.
The issues and the proposed initiatives outlined in the Master Plan. The key reasons for
unplanned growth of town as identified in the Master Plan are as follows:
• Linear development as a result of mountains in the north and river Ganges in the south.
• Unauthorized housing construction on un-developed land within the municipal boundary.
• Lack of recreational facilities and open spaces.
• Mixed land use in core congested city areas.
• Heterogeneous traffic (including hand carts) on main roads, lack of proper parking areas,
narrow roads, unplanned traffic junctions, etc causing severe traffic problems and danger to
pedestrians.
Infrastructure Planning For Industrialization in Haridwar. 97

Table: Issues and proposals of the Master Plan 2001 for Haridwar Urban Agglomeration.
Component Issues Identified in Master Plan
2001
Proposals in Master Plan 2001
Residential Lack of adequate housing led to
encroachments on open undeveloped
areas. High density housing areas —
very small houses, inadequate and
deteriorating services, congested
narrow streets, lack of open and green
spaces, mixed land use. In 1981, there
was a shortfall of 998 houses.
Additional housing need of 42,084
units was estimated for 2001. It was
estimated that 40% of population
will fall in the EWS category, 30% in
LIG, 25% in M1G and 5% in 1-HG
category.
Industrial Industrial development took place at a
slow to medium pace till 1981.
Industrial development was mainly
proposed in the following
categories:-
Agriculture based, timber,
pharmaceuticals and BI-1EL related.
275 ha was proposed for small and
medium sized industries for
projected 20,600 workers, but 147.5
ha of land was proposed for
industries in proposed land use for
2001.
Roads and
Transportation
Heterogeneous traffic, commercial
establishments along main roads,
narrow streets, encroachments, lack
of parking for trucks, wholesale
markets along national highway.
Location of bus stand in the city
centre led to traffic congestion.
Transport Nagar was proposed.
Shifting of the existing bus stand to
outer city area was proposed. Road
widening was proposed from Jatwara
Pull to Dudadhari Temple, Tulsi
Chowk to Shiv Mufti, Byepass to
Pawandham, Hill byepass, Jwalapur
Overhead Bridge to Ranipur Road,
Shankaracharya to Damkothi. New
roads — Bridge between Dam Kothi
and Singhdwar and road to connect
Kankhal with BHEL
Recreational
Facilities,
Lack of parks and recreational
facilities for residents. Large area had
462.5 ha. of land was proposed for
parks, gardens and open spaces in the
98 Infrastructure Planning For Industrialization in Haridwar.

Parks and Open Spaces
to be kept open for Kumbh and Ardh Kumbh Melas.
master plan against the estimated need for 540 Ha for parks and recreational facilities.
Tourism Inadequate transport facilities, traffic management mechanisms and proper sanitation facilities during religious fairs as primary concerns
Open area of 575 ha was delineated for Kumbh Mela in the Master Plan.
Table 24 : Issues and proposals in Master Plan 2001
7.8 Housing
Haridwar Development Authority, private developers and religious trusts are the primary
institutions providing housing in Haridwar. The religious trusts build ashrams and
dharamshalas to provide temporary housing for the devotees for a few days extended to a few
months. The devotees coming to Haridwar constitute a considerable proportion of floating
population.
Table: Household size and number within Development Area: Haridwar.
Year No. of households Total no, of households
Size of Household Average size of household Urban Rural Urban Rural
1981 22771 9682 32453 5.07 5.78 5.42 1991 36430 14184 50614 5.14 5.81 5.48 2001 41693 19163 60856 5.30 5.90 5.60
*2011 60000 30000 90000 5.00 5.50 5.25 *2021 83000 44600 127600 4.80 5.00 4.90 *2025 105111 54583 159694 4.50 5.80 4.60
* Projected household size and numbers. Table 25 : Household analysis in development area
Housing Board has not become fully functional in the new state, however, there are a few
housing colonies/units in Haridwar which were developed by the Housing Board before
2000. HDA has developed eight housing schemes since 1986, which covers an area of 51.15
acres (20 ha). About 1,519 housing units were developed by the HDA. Additional
requirement of 40,084 housing units was proposed in the Master Plan 2001 against which
HDA has been able to construct 1,519 housing units.
Infrastructure Planning For Industrialization in Haridwar. 99

Table : Housings planned by Haridwar development Authority Area in Acres Year S.No. Name of project
No. of Housing units
1 Shivlok I 205 5.45 1988-1999 2 Shivlok II 263 4.56 1990-1991 3 Shivlok III 191 6.95 1993-1994 4 Rishikesh Colony 174 4.08 1988-1989 5 Harilok Colony 552 19.05 1996-1997 6 Shymlok Colony 93 8.81 1999-2000 7 Shivlok III Extention 38 3.25 1999-2000 8 Gyatrilok 3 2.25 1999-2000 9 Indralok Colony 551 21.51 2005-2007
Total 2070 75.91 Source : Haridwar Development Authority (H.D.A.)
Table 26 : Housings planned by Haridwar development Authority
During the preparation of Master Plan 2001 it was observed that due to shortage of housing,
there was high incidence of unauthorized construction activities on undeveloped land. This
issue still remains critical.
Table: Status of available housing stock in Development Area: Haridwar. S.No. Description % age households
1 Ownership status
Privately owned 79 Rented 17
Government / Public buildings 4
2 Age of the buildings more than 50 years 13
10 - 50 years 63 Less than 10 years 24
3 Condition of the buildings Fairly good 90
Good 9 Dilapidated 1
4 No. of stories G+ 1 73 G + 2 26
G + 3 and above 1
5 Available facilities
Water supply 97 Electric power 96
Kitchen 84 Bathing facilities 90
Lavatory 94 Telephone 58
Source: Haridwar development Authority (H.D.A.) Table 27 : Status of available housing stock in Development Area: Haridwar
100 Infrastructure Planning For Industrialization in Haridwar.

There is a clear need to increase the supply of affordable housing for all. Land should also be
made available for private developers with strict enforcement of norm of 20-25% housing for
EWS in the housing project. Overall, the housing situation today presents a complex picture
in Haridwar. Discussions with stakeholders indicated that there are many houses which are
not physically occupied. On the other side citizens expressed that there are lack of housing
availability. This creates a false scarcity of housing in Haridwar. Recently HDA has received
some 250,000 applications against about 550 plots for their upcoming Indralok housing
scheme. One of the reasons for this kind of situation could be the fact that increasingly people
in the northern region wish to buy their second residence/summer homes in Haridwar.
Housing Department with the help of T&CP is in the process of preparing Housing Policy for
the State.
7.9 Future Growth of Haridwar
In the context of increasing urban population and industrial development around Haridwar, it
is deemed necessary to expand the boundaries of Haridwar NPP to include the fringe areas.
The issue of expanding the present municipal boundary of Haridwar NPP and upgrading it to
Haridwar Nagar Nigam (Municipal Corporation) is under consideration by the GoU.
7.9.1 Physical Constraints
Haridwar has Shivalik mountain range in the north and northeast and river Ganges in the
south which restricts its growth in these directions. The reserved forests along Najibabad
Road restrict development along this corridor.
7.9.2 Directions of Future Growth
Since the last few decades, Haridwar is experiencing physical
growth mainly towards the west due to suitable terrain. Future
growth is also expected to be in the same direction along
Infrastructure Planning For Industrialization in Haridwar. 101

Roorkee road, Laksar road and towards Roshnabad. Development of HE by SIDCUL in
Roshnabad is likely to trigger rapid urban growth in this area to support the industrial
development. HDA has proposed Harilok Phase II and Indralok housing schemes on Roorkee
Road and near BHEL area respectively. Areas along Roorkee road are expected to have
higher rate of growth in future. Area along Laksar road is having scattered development on
agricultural fields. This is a potential direction of growth but future development must be
regulated to preserve the rich agricultural belt.
7.9.3 Key Issues relating to Physical Growth and Built Environment
• Topography: Physical urban growth is constrained by Shivalik in the north and north-east
and river Ganges in south and this has resulted in linear growth of town. Growth is also
restricted along Najibabad Highway due to reserved forests and water bodies.
• Ribbon Development: Linear growth has resulted in ribbon development along the main
corridor of town, the Delhi-Niti Pass highway, known as DN Road/ Upper Road within the
municipal boundary. DN road has high density commercial development creating traffic
congestion during religious fairs and festivals. Increasing number of tourists every year has
further accentuated the need for additional flyovers, dedicated pedestrian ways, widening of
existing roads, development of parking places, etc.
• High Density Development in Old Areas without Proper Infrastructure:
High density development in Kankhal and Jwalapur are putting more pressure on existing
network of services.
• Unauthorized Constructions on Undeveloped Land and Fringe Areas:
Supply of serviced land is limited and this has led to unauthorized development on
undeveloped land and fringe areas. Main roads in the town also have encroachment which
has reduced the clear road width available for movement of traffic. The ghat areas have also
been encroached by commercial establishments.
102 Infrastructure Planning For Industrialization in Haridwar.

• Lack of Affordable Housing: The issue of lack of availability of affordable housing is the
false scarcity of housing created due to the general trend of people from the northern regions
to buy their second residence in Haridwar. There is need to provide serviced land and access
to affordable housing for all.
• Slums and Squatters: Growth of slums and squatter settlements along the river and canals
is contributing to water polluting in Ganges. This needs to be controlled on priority basis.
• Land Ownership: Lack of clarity on status of land ownership and its use is an issue in
Haridwar for future development.
• Undeveloped Open Spaces: Open spaces measuring upto 575 ha is earmarked for Kumbh
and Ardh Kumbh Mela which are used for camping, parking, exhibition and other community
facilities. These open areas should be developed with parking, community facilities and
landscaping which will increase the scenic beauty of the town, serve as tourist attractions and
at the same time prevent encroachment in these areas.
• Large Scale Industrial Development by SIDCUL: Integrated Industrial Estate (IIE)
proposed on 2034 acres of land is being developed by SIDCUL located at a distance of about
7 km. from Haridwar. IIE is likely to put pressure on the existing infrastructure services.
7.10 Environmental Quality
7.10.1 Water Quality
The recent characteristics of water quality of river Ganges is furnished in Table below.
Uttrakhand Environment Protection and Pollution Control Board (UEPPCB) under the
"Monitoring of National Aquatic Resources (MINARS)" Program have been monitoring the
water quality of river Ganges on a monthly basis at 11 stations in Haridwar.
Table: Characteristics of the Water Quality of River Ganges at Haridwar.
Month Temp.°C pH DO mg/1
BOD mg/1
Fecal coliform
MPL/100m1
Total coliform
MPL/100m1 Apr-05 21 7.5 6.8 - 21 1600 May-05 22 7.5 6 - 17 1600 Jun-05 20 7.5 6.4 - 17 1600
Infrastructure Planning For Industrialization in Haridwar. 103

Jul-05 22 7.5 7 - 23 1600 Aug-05 22 7.5 6.9 - - 1600 Sep-05 23 7.5 7.2 - 17 1600 Oct-05 20 7.5 7 4.4 17 1600 Nov-05 20 7.5 7.4 4.1 17 1600 Dec-05 13 7.5 6.1 4.2 23 1600 Jan-06 13 7.5 7 4.1 17 1600 Feb-06 20 7.5 6.9 - 17 1600 Mar-06 22 7.5 6.5 - 23 1600
Source : Uttrakhand Environment Protection and Control Board (UEPPCB) Table 28 : Characteristics of the Water Quality of River Ganges at Haridwar
A study of Table above clearly shows that the stretch of the river Ganges at Haridwar
satisfies the criteria for Class C for most of the year but does not fulfill the requirement for
Class B. The critical parameter is "Total Coliform". The high level of coliform is attributed to
mass bathing by thousand and lakhs of pilgrims in Haridwar. The desired River Water
Quality at Haridwar is at least Class B. Apart from mass bathing pollution is also contributed
by several nallas discharging into the river. Although most of the 19-odd nallas have been
intercepted and dry weather flows diverted to sewers in various phases of the "Ganges Action
Plan", a few nallas still remain to be intercepted and diverted to stop any wastewater reaching
the rivers.
7.10.2 Air Quality
There has been increasing motorized vehicular traffic, particularly during holy seasons and
dates, contributing to air pollutants. Although recent data were not available, it is generally
believed that there is deterioration of air quality due to such activity.
7.10.3 Key Environmental Management Issues
Based on the above situation analysis, major environmental concerns and management issues
of the city is summarized as under:
• Pollution Due To Increased Vehicular Traffic: There is a significant increase in vehicular
traffic in the city during the last few years. This includes public, private and other vehicles.
104 Infrastructure Planning For Industrialization in Haridwar.

Total number of vehicles on road has increased from 118,713 to 137,016 during last one year.
Emission from these vehicles contributes significantly to the air pollution of the city.
• Pollution of the Holy River Ganges: The River is polluted due to various manmade
activities. These include discharge of untreated wastewater into the river, waste disposal from
the cremation grounds close to the bank of the river, bathing and washing and disposal of
solid wastes, and pollution from upland catchments. Recently UEPPCB and Ganges Pollution
Control Unit, a section of the Uttrakhand Jal Nigam has taken initiatives to divert 19 drains to
the existing Sewage treatment Plant and augment the capacity of the plant. These drains
otherwise is discharging wastewater into the river. Thousand of pilgrims come to Haridwar
for having holy bath at the river Ganges. The River Water Quality at Haridwar should
conform at least to Class B criteria.
• Collection, Transportation and Safe Disposal of Solid waste: The city has failed to
comply "Municipal Solid Wastes (Management & Handling) Rules, 2000" under the
umbrella act "The Environment (Protection) Act, 1986".
• Monitoring of Air and Noise Levels: No monitoring is done on a routine basis with
respect to the quality of air and level of noise pollution for the city. Under the National
Ambient Air Quality Monitoring Program, regular monitoring of air quality of the city is
necessary. Regular monitoring of the noise level is also required to regulate the noise level as
per Noise Pollution (Regulation and Control) Rules, 2000.
• Land Slide from Mansa Devi Hill: Land slides of the Mansa Devi Hill takes place at a
regular intervals, mainly during rainy seasons. Huge quantity of boulders and soil from the
hill get deposited near the congested town area. Some of the silt finds its way into the River
Ganges upstream of Har-Ki-Pauri.
Infrastructure Planning For Industrialization in Haridwar. 105

7.11 Municipal Infrastructure
7.11.1 Water Supply
Piped water supply was first introduced in Haridwar in 1927 with a tube well at Teebdi,
which is now lying defunct. Since then the town has expanded significantly and the water
supply system has been augmented and reorganized in manifolds. The water supply of
Haridwar is operated and maintained by Uttrakhand Jal Sansthan (UJS), an institution
working under Department of Drinking Water, Government of Uttrakhand (GoU), which also
undertakes some of the low budget works. Large capital works and overall planning are
carried out by another institution, Uttrakhand Pai Jal Nigam (UPJN), also working under
Department of Drinking Water. Although a municipal function, the Haridwar Nagar Palika
Parishad (NPP) is not involved in the planning, design, construction, operation, maintenance
and service delivery of this important Urban service. This section deals with the analysis of
current situation of water supply, its problems, key issues and the likely scenario of water
supply with respect to water demand, resources, system requirements and related aspects.
7.11.1.1 Water Sources and Generation of Water
Haridwar is situated on the bank of river Ganges, the largest perennial river of India. The
town therefore enjoys water of this river as source infiltrated through soil and collected in
large diameter wells. However, availability of this water is limited to the areas close to the
river. For the areas little away from the river the infiltration becomes ineffective due to
increase in the width of natural soil media in between and ground water is proved to be the
most techno-economically suitable source. Both these sources are in abundance in Haridwar.
Situated by the side of a large river, and recipient of plenty of rainfall, the region possesses
large potential for ground water recharge. Presently about 60 mld of water is abstracted from
these sources through 44 wells of different kind as shown in the following Table.
106 Infrastructure Planning For Industrialization in Haridwar.

Table : Present availability of water from various sources
S .No . Name of the source Nos.
Approximate quantity of available (mid)
1 Infiltration wells 16 25
2 Tube wells (200m.m. - 300 m.m. dia.) 23 32
3 Mini tube wells (150 m.m. dia) 2 2 4 Open wells 3 1
Total 44 60 Source : Uttrakhand Pai Jal Sansthan
Table 29 : availability of water from various sources
7.11.1.2 Treatment of Water
The quality of water from the sources is quite good and does not need sedimentation or
filtration. As such, it is directly pumped to the distribution system after disinfection by liquid
sodium hypo chloride or gaseous chlorine.
7.11.7.3 Distribution System
For ease of operation and rational distribution of water, Haridwar town has been divided into
six water supply zones on the basis of area, population, nature of requirement and ground
elevations. The zones and the areas served are given in Table
Table: Zones and Areas Served
S. No. Zone Area served
1 A Bhopat wala
2 B Bhim goda & Har-Ki-Pauri area
3 C Mayapur
4 D Kankhal
5 E 1 Jwalapur (part-I)
6 E2 Jwalapur (part-II)
Har-Ki-Pauri area is a surplus water supply zone by virtue of it being low lying and also due
to the special care taken for its religious importance. Availability of water in this zone is
Infrastructure Planning For Industrialization in Haridwar. 107

almost 24 hours. Parts of Jwalapur, Kankhal and Bhopatwala areas are comparatively scarcity
zones where water supply is restricted to 1 to 4 hours daily.
There are 12 Over Head Tanks (OHT)/Clear Water Reservoirs (CWR). Out of which 11 OHT
serve the area within the municipal limits. One CWR is not functioning for want of feeder
main. The combined storage capacity of these OHT and CWRs is 14,030 kl against a total
supply of 60 mld i.e. about 23% of the total supply which is insufficient. The locations of the
storage tanks also need to be examined during detailed engineering stage to achieve
appropriate hydraulic efficiency of the distribution network. In the absence of pipeline
network map, exact length of distribution network in the town can not be assessed correctly,
however, as discussed with Jal Sansthan, Jal Nigam and HNPP it is reported to be more than
200 tuns in addition to 8 km of feeder mains from infiltration wells, tube wells, mini tube
wells and open wells. In several cases the distribution lines are buried under the road arising
out of road widening programs. The old and dilapidated pipes in the old city area also give
rise to frequent problems in service. Repairing of these pipelines also poses various problems
to the traffic system of the town. Some pipelines have been laid along the sewers in such a
manner that at many points they are crossing the manholes. Even some house connections
have been provided through these manholes. At many places there is potential danger that
leaking joints of pipelines may suck sewage water and get polluted. These pipelines are
needed to be shifted immediately.
There are about 24,000 domestic water connections in Haridwar. In addition there are 2,389
commercial connections and 450 community public stand posts. To strengthen the water
supply system, 105 India mark-II hand pumps have been provided by Jal Sansthan (81),
DUDA (20) and NPP (4). The actual number of households in Haridwar municipal area is
being updated by Haridwar NPP. However, it is estimated that there are about 32,000
households with an average household size townwide of 5.8, slightly above the 2001 census
figure of 5.4. The socio-economic survey revealed that about 47% of the town population
108 Infrastructure Planning For Industrialization in Haridwar.

(86,500) lives in slums. Households belonging to the economically weaker section use stand
post supply in a ratio of about 20 houses per stand post.
Table : Source of drinking water (household % age)
Source of drinking water BPL Poor Lower Middle
Upper Middle High
House connection 69.5 86.5 97.6 100 100 public stand post 25.4 10.9 2.4 0 0 Neighbour's house 3.3 1.9 0 0 0 Municipal tanker 0.9 0 0 0 0 Private vendor 0 0 0 0 0 Tubewell / hand pump 0.9 0.6 0 0 0
Source : DPR prepared by GHK International, UK under the JNNURM, Haridwar. Table 30 : Source of drinking water (household % age
Accordingly, the present piped water supply coverage to the population of Haridwar can be
presumed to be about 85%. The balance population meets their requirement from the tube
wells with hand pumps and additional community stand posts. The level of service in
Haridwar town water supply in respect of quantity, supply hours and pressure can be well
identified in three distinct characters. About 42% of town area demarcated under Zone A, B
and C enjoys 24 hrs supply, in surplus quantity (> 135 1pcd), while 30% of the area
demarcated under Zone E2 and some parts of the foothill situated at higher altitude including
the industrial area faces scarcity in supply both in terms of quantity and pressure. The supply
hours in these areas are also intermittent, 1-4 hrs a day. In the remaining area demarcated
under Zone D and El the supply is reasonably normal although is slightly less than 135 1pcd
in workable pressure with 4-6 hrs of supply a day.
7.11.1.4 Unaccounted for Water
No proper investigation and study have been conducted to determine a reasonable figure of
unaccounted for water (UFW) in Haridwar water supply system. The UPJN/UJS generally
agree that line and production losses of water are about 30%. The actual UFW may however
be more. Some of the major reasons for high UFW are:
• Undetected leakages due to construction of metalled roads over the pipeline.
Infrastructure Planning For Industrialization in Haridwar. 109
• Open zone boundaries allowing water to flow free from high pressure zones to low pressure
zones resulting in some areas getting water supply for long hours beyond supply period
developing a tendency of wastage and misuse of water.
• Some of the existing pipelines in old city area have outlived its utility leading to frequent
breakdown and leakages.
• General leakage from joints and valves in the distribution system.
• Production losses due to reduction in efficiencies of old aging equipment and filter beds in
the water works.
• Unauthorized tapping and connections.
• Wastage through the stand posts by removal of taps.
• Non recording of connections and consumption
7.11.1.5 Per Capita Water Supply
Considering 30% UFW the total quantity of water reaching to 344,000 population of the town
(including a floating population of about 160,000) is about 42 mld. The average per capita
supply rate may therefore be assumed as 122 liter/day which is slightly below the norm of
135 1pcd prescribed by the Central Public Health and Environmental Engineering
Organization (CPHEEO), Government of India to support an effective sewerage system.
7.11.1.6 Water Quality
There is sometimes deterioration in the quality of water due to malfunctioning of the
treatment plants. Many of the old pipes buried under the road in the course of their widening
develop leakages and remain undetected. It results in sucking back the outside water/sewage
when supply is closed, consequently polluting the water.
7.11.1.7 Operation and Maintenance
• Uttrakhand Jal Sansthan is responsible for operation and maintenance of water supply
system in Haridwar. During the study field visits detailed discussion were held with
110 Infrastructure Planning For Industrialization in Haridwar.

consumers (primarily citizen of Haridwar Nagar Palika Parishad area) and the officials of
both UJS and UPJN. The findings related to Operation & Maintenance are:
• Lack of standby power generation system to make up frequent interruptions in power supply.
• Low efficiency of old pumping machineries requiring replacement.
• Lack of adequate data base of transmission & distribution system. Drawing / map of
distribution system, which is the basic information needed are not available.
• Many rising mains are tapped and used as distribution main leading to large scale drop in
pressure, wastage of energy and disruption in supply.
• The UFW is high, resulting in large revenue losses.
• Low water tariff and absence of metering contribute to large scale wastage; UJS has little or
no means to control such wastage.
• Zones are generally interconnected with each other, resulting in uncontrolled transfer of
water from zones in higher ground elevation to those in lower ground deviation.
7.11.1.8 Summary of present status of water supply system of Haridwar
Table summarizes the present status of water supply system in Haridwar.
Table : Present status of water supply in Haridwar S.No. Description Quantity
1 Total permanent population in Municipal area (Permanent Population = 184000 + Floating population = 160000) 344000
2 Estimated no of households 32200 3 Total no. of domestic connections 24000 4 Total no. of commercial connections 2389 5 Total no of stand posts 450 6 Total length of pipeline 168 k.m. 7 Total no. of storage tanks (OHT/CWR) 12 8 Total capacity of storage tanks (OHT/CWR) 14030 kl. 9 Total no. of wells ( Infiltration well , Tube well & open wells) 44
10 Total water production capacity 60 mld 11 Estimated line and production losses 30% 12 Total water available 42 mld
13 Average rate of per capita water supply day !V? 122 lit. per
able 31 _ . water supply Har idwar ar
Infrastructure Planning For Industrialization in Haridwar. 111

7.11.1.9 Key Issues
Based on the above situation analysis, the following emerge as the key issues facing water
supply system in Haridwar:
• Lack of adequate data base and maps on transmission & distribution system network.
• With open zones water freely travels to other zones.
• Unequal distribution of water resulting in acute shortage in certain areas.
• Lack of pressure in the scarcity areas.
• Deterioration in quality of water at times.
• Inefficient network hydraulics with respect to tapping, pumping and balancing storage
tanks.
• In the intermittent supply system the tendency of the consumer is to keep the taps open
throughout the supply increasing the peak factor and raising the chances of wastage of water
• The old and dilapidated network develops leakages most of which are buried under roads
and remain undetected. This result in sucking back the outside water when supply is closed,
consequently polluting the water supply
• Lack of standby power generation system at head-works as interruptions in power supply is
frequent.
• Low efficiency of old pumping plants
• Many feeder mains are tapped and used as distribution main leading to drop in pressure,
wastage of energy and disruption in supply.
• Abnormal growth in high density areas raising water demand with which the existing
diameters of pipeline cannot cope.
• The water tariff recovered is many much lower than its cost of production.
112 Infrastructure Planning For Industrialization in Haridwar.

7.12 Sewerage & Sanitation
7.12.1 Coverage of Sewerage Network
Sewerage system was introduced in Haridwar in 1938. Since then it has been extended to
various parts of the town. At present, more than 80% of the population is covered with
sewerage system. Presently, one 18 MLD and another 8 MLD STP are taking care of
treatment of collected sewage. The city is located at an altitude of 292.7 meters above the
Mean Sea Level. The spread of Haridwar from foothills is generally levelled with 3-7 meters
of undulation. The area at the foothills on the bank is excessively populated with
Dharamshala, Hotels and Shops etc. The soil here is generally sand mixed with boulders and
rocks.
Based on the topography of the town and the need of STP's, city is divided into 3 zones:
Zone I: Bhopatwala zone (lies on the northern side of Haridwar).
Zone II: Haridwar, New Haridwar and Kankhal.
Zone III: B.H.E.L. & Jwalapur Zone
7.12.2 Service Levels of Sewerage Systems
Service levels for sewerage collection and treatment are satisfactory. Out of the total 33 mld
sewage generated by 184,000 permanent population and 160,000 floating population almost
80% collected by sewerage system and 20% at drain interceptions. Present capacity of
sewage treatment is 26 mld with a gap in treatment capacity of 7 mid.
Table : Service levels of sewerage system Description Units Remarks Water supply 51.3 mld Actual water reached to consumers 36 mld 30 % distribution losses
Sewerage generated 33 mld 15 % infilteration and 80 % water consumption
Sewerage collected 33 mld 80 % sewerage and rest 20% intercep-ted at drains and diverted to STP
Gap in treatment capacities 7 mld Existing 26 mld treatment capacity
Source : Nagar Palika Parishad, Haridwar. e : Service levels of sewerage system
Infrastructure Planning For Industrialization in Haridwar. 113

It excludes special occasions such as Kumbh, Kanwar and other exigencies.
7.12.3 Treatment and Disposal of Sewage
The first sewage treatment plant was constructed under Ganges Action Plan Phase 1 in 1992
at Kankhal area of Haridwar. The capacity of STP is 18 mid and it is based on the Activated
Sludge Process. Recently, a new STP of 8 mid was constructed based on Karnal Technology
(Agro Forestry) to treat sewage from Jwalapur area of Haridwar. Presently, total sewage
generated is 33 mid, out of which 7 mid is left untreated under normal conditions. But in
special occasions the sewage generation increases to 40-45 mid. Due to relatively flat
topography and prohibition of discharge of treated sewage at the upstream of Har Ki Patti
(Important Religious Bathing Place), the town needs excessive pumping of sewage. There are
about 15 working sewage pumping stations for lifting and carrying sewage to downstream for
treatment and irrigation. New sewerage schemes for augmenting 18 mid STP to 45 mid and
construction of new 9 mid STP at Bhopatwala were already approved by the Government of
India and will be implemented through NRCD. After the implementation of these schemes
the total capacity will be enhanced from 26 mid to 62m1d. These schemes will cater to the
need of sewage treatment until 2023 as per analysis of URIN.
However, additional funds are needed for the implementation of:
• New sewerage schemes to increase the sewerage coverage to 100 %.
• Capacity augmentation of rising mains,
• Modification and augmentation of 8 mld STP and
• Rehabilitation of 18 mld STP and Sewage Pumping stations.
7.12.4 Key Issues
• There is no mapping information available on the existing sewerage i.e., length and
diameters and profile of the existing sewerage system. Therefore, a GIS and CAD software
assisted database of the existing system is needed. The mapping database built on GIS based
114 Infrastructure Planning For Industrialization in Haridwar.

town map prepared by the GoU would be very useful in implementing proposed schemes for
sewerage.
• At present, sewer clogging is observed in some areas, the most common reason is the
dumping of municipal solid waste in manhole chambers, therefore a comprehensive solid
waste management plari should be prepared for the prevention of entering municipal solid
waste in the sewer line. Another reason for sewer clogging is the deposition of silt into the
sewers. During rains eroded heavy silt came from near by hills. A plan for the prevention of
silt should be undertaken on the priority basis.
• Community should be encouraged to pay and use category of public conveniences. with
community involvement in the maintenance of the sewerage system. It is observed that
currently sewerage is not covered by way of user charges; only sewerage service charges are
collected as part of property tax.
7.13 Storm Water Drainage
7.13.1 Rainfall
Haridwar receives an average annual rainfall of about 2300 mm. The maximum rainfall
occurs in July and August amounting to around 1200 mm.
7.13.2 Drainage System
Practically the whole town, wherever roads or brick paved lanes/paths exist, have some kind
of side drains leading to storm water drains, except in slums or some parts of peripheral areas.
Most of the drains need cleaning, remodeling and repairs. In addition to this, there are lanes
and roads in the town which are still kutcha. The total length of kutcha roads is about 28 km.
There is a total of 214 km of roads maintained by HNPP and about 45 km roads maintained
by PWD.
7.13.3 Drainage Characteristics and Problems:
Most of the area of Haridwar City is situated on the right bank of River Ganges while the
Ganges Canal divides the city in two parts. Shivalik hill ranges in the north have restricted
Infrastructure Planning For Industrialization in Haridwar. 115

the growth of the town in that direction. Naturally the slope of the ground is from hills
towards the river i.e. from north to south which is also the main direction of flow of storm
water drains. All these drains have varying quantities of deposits - silt, gravel and boulders.
Soil erosion from the hill slides on the northern side, particularly Mansa Devi hill causes
these deposits during rains. Due to steep slopes and large catchmeiit areas, run off is high
causing water logging and back flow in many areas. Old Ranipur turning is one of the worst
affected areas. The drain below Mansa Devi Temple has large silt chambers. The section is
large at the head but suddenly reduces to a smaller section as it enters the main market.
Natural drains have been encroached upon at many places. Gully pits are broken and side
drains are connected to sewers which itself need cleaning. The storm drains carry, as in most
towns, illicit sewage in the form of dry weather flow draining into the R. Ganges. About 19
such nallas have been intercepted and dry weather flows diverted to sewers.
7.13.4 Issues and problems of storm water drainage.
The main problems of this natural drainage system are man made. These are listed below.
• Dumping of garbage and all kind of solid waste in to the drains.
• Unauthorised cutting of slopes near the foot hills for construction of houses, creating a
danger to the stability of the hills (back of Bhimgoda)
• Obstruction to the natural flow by encroaching sides of the drains by construction of houses.
Diversion of one drains into another as in the case of the drain across Rishikesh road.
• Non-cleaning of the drains as can be seen at Bhimgoda colony near the kund Bhopatwala
and RTO. Crossing Nala which are heavily silted
7.13.5 Situation Analysis
To accommodate increased storm water run-off due to growing urbanization, some parts of
these drains were lined with stone or brick masonry. It is observed that the main drainage
channels are heavily silted because garbage is routinely thrown into these channels often
packed-in polythene bags. Thi-s -causes a formidable problem as the polythene slows down the
116 Infrastructure Planning For Industrialization in Haridwar.

disintegration of the degradable material packed inside. Most of the main drains are in a bad
shape at present and need repairs, reconstruction and other works in nearly 60 percent of their
lengths.
Although large part of the town is well drained, there are certain localized problems of
insufficient drainage and water logging during heavy rains. Some of the spots prone to
flooding and water logging are as follows:
1. Chandra Charya Chowk (Ranipur turn).
2. Old Ranipur Area.
3. Bhimgoda Nai Basti.
4. Along Rishikesh road.
5. Laton wali.
6. Nath Nagar before Railway station Jwalapur.
Considerable length of drains in commercial areas has been encroached upon by the
construction of shops, or the other building covering the drains completely at some points.
The minimum that can be done to facilitate cleaning and maintenance of such drains is to
provide bigger sized manholes 900mm.dia at 30 m Intervals, besides lining and
reconstruction in necessary stretches.
7.13.7 Key Issues
• Due to faster growth of population and rapid increase in the land prices, habitation has
extended to the low lying areas which do not have proper drainage outlets.
• Dumping of garbage, particularly plastics, causes serious reduction in waterways of main
drainage channels
• Encroachments by poor as well as other sections of society have resulted not only in
constriction of waterway but also have led to problems of access for repair & maintenance
activities.
• In the old city areas, space for construction of roadside drains is a major problem
Infrastructure Planning For Industrialization in Haridwar. 117
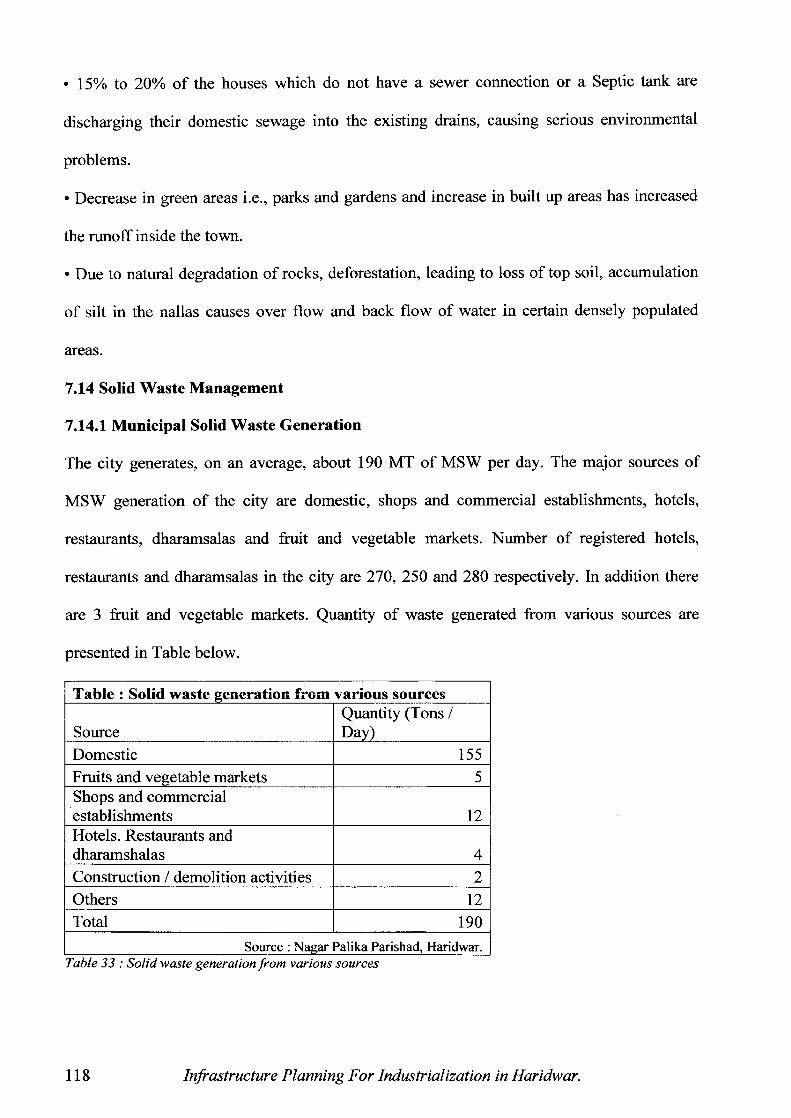
• 15% to 20% of the houses which do not have a sewer connection or a Septic tank are
discharging their domestic sewage into the existing drains, causing serious environmental
problems.
• Decrease in green areas i.e., parks and gardens and increase in built up areas has increased
the runoff inside the town.
• Due to natural degradation of rocks, deforestation, leading to loss of top soil, accumulation
of silt in the nallas causes over flow and back flow of water in certain densely populated
areas.
7.14 Solid Waste Management
7.14.1 Municipal Solid Waste Generation
The city generates, on an average, about 190 MT of MSW per day. The major sources of
MSW generation of the city are domestic, shops and commercial establishments, hotels,
restaurants, dharamsalas and fruit and vegetable markets. Number of registered hotels,
restaurants and dharamsalas in the city are 270, 250 and 280 respectively. In addition there
are 3 fruit and vegetable markets. Quantity of waste generated from various sources are
presented in Table below.
Table : Solid waste generation from various sources
Source Quantity (Tons / Day)
Domestic 155 Fruits and vegetable markets 5 Shops and commercial establishments 12 Hotels. Restaurants and dharamshalas 4 Construction / demolition activities 2 Others 12 Total 190
Source : Nagar Palika Parishad, Haridwar. Table 33 : Solid waste generation from various sources
118 Infrastructure Planning For Industrialization in Haridwar.

7.14.2 Waste Composition and Characteristics
The MSW of the city mainly comprises of organic, inert and recyclable wastes such as paper,
plastics, glass etc. No data is available to determine the composition and characteristics of the
MSW for the city.
7.14.3 Collection, Storage and Transportation
There is practically no primary collection system in the city except in few localities where the
Mohalla Swachhata Samities (MSS) recently have started door-to-door primary collection by
engaging private sweepers. Waste is mostly collected through community bins/containers and
road sweeping. HNPP sweepers and sanitary workers engaged by the MSS sweep the streets.
They accumulate the collected waste into small heaps and subsequently loaded manually or
mechanically onto the community containers/bins or directly loaded onto the solid waste
transportation vehicles for onward transportation to the disposal site. The present collection
and transportation system involves multiple handling of solid waste. About 60 open handcarts
and 20 cycle-rickshaws are used for collection of waste including wastes generated from
street sweeping and cleaning of drains. Both long and short brooms are used for street
sweeping. Recently, the MSS, comprising of a group of residents, has been formed to engage
private sweepers for door-to-door primary collection of waste from the area and to keep the
area clean. About 55 such MSS have been formed to cover different areas of the city. All
MSS are not functional. Some of them are functioning satisfactorily whereas others
performance is irregular and unsatisfactory.
A private agency called "Dry Waste Recycling & Resource Centre, Haridwar" is presently
segregating recyclable wastes from the various waste collection points by organizing the rag
pickers for further process. Private agencies called "Signet" and "Pahal BMW" are involved
in collection of bio-medical wastes from various hospitals and other medical establishments
Infrastructure Planning For Industrialization in Haridwar. 119

of the city and transports it to the Bharat Heavy Electrical Ltd (BHEL) complex situated at
the outskirt of the city for incineration.
Secondary storage of solid waste is done by means of community containers and bins having
capacities of 0.5 m3, 1m3 and 4.5 m3. 220 such containers and bins are placed at different
locations (also called collection points) of the city for secondary storage of solid waste.
Although most of these containers and bins are of closed type but these are often left open
attracting animals.
In addition to the above mentioned containers and bins, there are about 15 numbers of open
collection points and 2 Dhalaos (Constructed enclosures) located in different locations of the
city.
7.14.4 Waste Disposal
At present HNPP disposes the solid waste of the city to two sites - one located at Jwalapur,
about 7 km from the city and the other by the side of the National Highway-74 at a distance
of about 8km from the city. In both the sites, waste disposal is done by uncontrolled
dumping. HNPP owns about 14.50 hectare of land at Sarai Village, located at a distance of
about 12 km from the city for future solid waste disposal.
7.14.5 Key Issues
The major issue of the SWM is non-compliance of the Municipal Solid Waste (Management
& Handling) Rules, 2000 by the HNPP. HNPP has failed to comply with the rules in all
aspects of SWM i.e. Collection, Storage, Transportation, Processing, Disposal of MSW of the
city and Institutional Reform. Other important issues along with the deficiencies in the
present SWM system are enumerated as follows:
• Solid waste quantification and characterization: HNPP has not conducted any city wide
study for determining the composition and characteristics of the solid waste. Proper
quantification of waste is an important factor for assessment of equipment, vehicles and
120 Infrastructure Planning For Industrialization in Haridwar.

manpower. Representative characterization of the city waste is essential for determining
appropriate waste processing and disposal methods.
• Segregation of waste at source: At present, there is no segregation of waste at source.
Source segregation of waste reduces the waste load at the disposal site. This also reduces the
cost of transportation of solid waste considerably.
• Primary Collection of waste: Present collection system is irregular, ineffective and
inefficient. A significant part of the waste is left unattended. This waste not only degrades the
environment but also block storm water drains.
• Community and Private Participation: Although HNPP has initiated community
involvement and private participation by forming MSS for primary collection of waste, a lot
of improvement is necessary in the level of services. The Mahalla Swachhata Samities are in
the inception stage. The long term sustainability of MSS needs to be ensured.
• Improvement in SW Transportation system: The present SW transportation system lacks the
following:
❑Proper routing of vehicles for transportation of waste to the disposal site.
❑ Waste Transfer Station to minimize time and distance of travel of the solid waste transport
vehicles. This will reduce cost of transportation and increase efficiency of the vehicles.
❑ Inadequate and upgraded vehicle and equipment
❑ Modern record keeping and communication facilities
• Safe Disposal of Waste: The present state of solid waste disposal is poor and unsatisfactory.
A major part of the solid waste generated is disposed into open lands, streets, surface drains,
river etc and sometimes burnt in open causing health hazards, public nuisance and
degradation of environment and aesthetics. The existing disposal site at Jwalapur has been
abandoned. The other solid waste disposal site located by the side of NH-74 is the only site
where HNPP is presently disposing the solid waste of the city by open dumping.
Infrastructure Planning For Industrialization in Haridwar. 121

• The HNPP owned land identified at Sarai Village as proposed solid waste disposal site is
located away from the city limit. The present access road to the site is narrow and not suitable
for movement of heavy solid waste transportation vehicles. Widening of the access road is
therefore, essential.
There is no alternative route that leads to the site from the city. Necessary environmental
approval is required for this site before its final selection as a solid waste disposal site. No
environmentally approved site has so far been selected as future solid waste disposal site.
• Health and Hygiene of Sanitary Workers: Under the present SWM activities manual
handling of waste is involved starting from collection up to the disposal of waste. During the
process, the sanitary workers are exposed to the waste. No protective measures have been
taken for safety, health and hygiene of these workers who are vulnerable to the health
hazards.
• Public Awareness: No major initiatives have been taken so far by the HNPP to educate
people on the ill-effects of haphazard disposal of solid waste.
7.15 Roads and Transport
7.15.1 Road network, Junctions and Traffic Management
Existing situation — Road Network
The city is connected by road to other parts of the state with Delhi — Niti pass road, Rishikesh
road, Nazibabad road and NH- 58 forming the major travel corridors. This city is also
connected by rail with other parts of the country. Haridwar city comprises of 246 km of roads
of which 214.10 km are maintained by HNPP and 31.90 km (including 13 km of National
Highway) are maintained by PWD. The traffic carrying capacities of city roads are low due to
limited widths, intense land use and encroachments.
There are about 1686 no. of roads in 25 wards under Nagar Palika Parishad.
122 Infrastructure Planning For Industrialization in Haridwar.

As may be observed from the above table and figure that more than 60% road under HNPP is
concrete roads, whereas 13% roads are .kutcha. The core networks of the roads within city
consist of following main roads, which are under the maintenance of PWD.
7.15.2 Junctions
It has been observed that junctions has not been designed properly, i.e.
• No proper channelization for free left turn.
• Lack of footpath on approaches of the junctions.
• No planned pedestrian zebra crossing.
• Haphazard parking on the approaches of the junction.
• Lack of proper signalization system toensure smooth traffic movement.
On the basis of field observations, discussion with Traffic Police personnel, HNPP and PWD,
following junctions have short-comings:
1. Chandi ghat junction( on NH 58)
2. Shankaracharya chowk
3. Tulsi chowk
4. Deshrakchak T- junction
5. Ranipur Morh Chowk
Table: length of various category roads
Type of road Length (km)
Kutcha road 28.41
Kharanja road 1.44
Cement concrete 133.11
Black top 21.54
Black top (with BM/SDC) 29.60
Total 214.10
Infrastructure Planning For Industrialization in Haridwar. 123

7.15.3 Existing Situation - Traffic Flow, Congestion and Management
Following parameters which are observed causing congestion of traffic.
• Inadequate width of the road.
• Encroachments.
• Street hawkers.
• Unplanned on-street parking.
• Heterogeneity of traffic.
• Pedestrian flow.
• Improper turning of traffic.
• Lack of median on important roads.
• More no. of median gaps on upper roads.
• Lack of traffic signage, road markings, guard rails etc.,
• Lack of enforcement of traffic rules.
Mostly all roads have 2-way traffic movement barring a few exemptions. There is a large
tempo attraction in the Upper road area due to the presence of commercial establishments at
Har-Ki-Pauri,. The tempos stop wherever passengers board/alight, thereby causing
congestion and delay to other vehicles. It has been observed that areas like Har-Ki-Pauri have
heavy pedestrian traffic due to pilgrims from various parts of the country. During mela
periods in the city, a special management for pedestrians and traffic is enforced by the
authority.
On the basis of observation, discussion with Traffic Police personnel, HNPP and PWD
Engineers, following stretches have above short-comings:
• Hill bypass road (Pul Jatwara to Laltarao).
• Delhi — Niti pass road (From near Pul Jatwara to Dudhadhari junction via Har-Ki-Pauri)
124 Infrastructure Planning For Industrialization in Haridwar.

Around the Jwalapur area, the traffic condition is poor. Most of the roads within the area have
less than single lane, and also encroached by the local shop keepers, hawkers, haphazard on-
street parking by mainly two- wheelers and cycles.
7.15.4 Transport System Characteristics
Existing situation - Registered motor vehicles in the city (2006). The no. of registered motor
vehicles in the city for the year 2005 and 2006 are given in Table below.
Table : No. of vehicles registered in Development Area : Haridwar. Category of Categoriy wise
S.No. Vehicles No. of vehicles %age of vehicles Total %age Heavy Vehicles Multi Axle
1 Trucks 1 0.01 0.001 2 Trucks 822 12.30 0.923
1 3 Mini Trucks 217 3.25 0.244 4 Buses 189 2.83 0.212 5 Tractors 5310 79.43 5.959 6 Tankers 49 0.73 0.055 7 Others 97 1.45 0.108
Total Heavy Vehicles 6685 100.00 7.502 Light Vehicles
1 Cars 4807 5.83 5.395 2 Jeep 405 0.49 0.455 3 Taxi 414 0.50 0.465 4 Maxi Cab 177 0.21 0.198 5 Ambulances 21 0.03 0.024
2 6 Omni Bus / Van 64 0.08 0.072 7 Motor Cycles 35763 43.39 40.138 8 Scooters 28877 35.05 32.41
Auto Rikshaw / 9 Vikram 1653 2.01 1.855 to Mopeds 10130 12.29 11.369 ii Trollies 91 0.11 0.103 12 Others 12 0.01 92.498
Total Light Vehicles 82414 100.00 100 Grand Total no. of Vehicles 89099
Table %/ Vehicles w. ■.. . : reps ere in eve opment Area
Infrastructure Planning For Industrialization in Haridwar. 125

There are about 1.37 lakh registered motor vehicles in Haridwar city in the year 2005-2006. It
is observed from the above figure that Cars and motorized two-wheelers constitute more than
7% and 85% of the total vehicles respectively in the city. During the year 2005-2006, the
growth of vehicles is around 15.5%.
7.15.5 Existing Situation — Public Transport system
Uttrakhand Transport Corporation buses mainly serve long distance inter-city trips and
medium distance shuttle services from the old bus terminal. Insufficient and lack of Public
Transport has led to operation of Intermediate Public Transport (Pvt. Vehicles) which operate
from different parts in the city. IPT consists of 930 Tempos / Vikrams and 746 Auto
rickshaws. Tempos/Vikrams operate on a fixed route and fixed fare basis (by RTO) for short
distance intra-city trips within the city, while auto rickshaws operate on free route pattern
without any fixed rate. Minibuses and tempos do not have proper terminal facilities or
amenities for passengers. The city also lacks designated stops for public transport operation.
Besides these, 706 taxis and maxis operate within the city for intra and inter city trips.
7.15.6 Key Issues
• Absence of road hierarchy and traffic carrying corridors. Most of the internal city roads are
1-2 lanes. Rapid growth in vehicles and population (both permanent as well as floating) have
resulted in exceedence of the carrying capacity on the road network.
• Lack of enforcement measures has further deteriorated the situation. Encroachment on
streets by shop owners and vendors further reduce the width of carriageway.
• Hindrance to pedestrian movement because of absence of foot paths.
• Ineffective traffic control and management measures.
• Absence of adequate parking lots leading to haphazard on-street parking reducing road
capacity thereby causing traffic congestion.
• The mode split of two-wheelers is about 85% of the total motorised vehicles on the roads.
Corresponding vehicle density is 557 vehicles per km of the road which is very high.
126 Infrastructure Planning For Industrialization in Haridwar.

• Lack of public transport system in the city has resulted in improper operation of
Intermediate Public Transport vehicles causing traffic congestion and pollution.
• Inadequate Road Infrastructure and Safety Issues.
• Absence of pedestrian footpaths.
Infrastructure Planning For Industrialization in Haridwar. 127

Chapter 9: CITY "SWOT" ANALYSIS
Infrastructure Planning For Industrialization in Haridwar. 129

8.0 City "SWOT" Analysis
8.1 Introduction
Haridwar, in its journey through the last two centuries, has evolved from a small settlement
of saints and hermits on the bank of a sacred river to a bustling town with a complex mix of
activities ranging from hardcore industrial and economic activities to the practice and
propagation of yoga, meditation and ayurveda. This complexity is further heightened by an
unparalleled influx of pilgrims, with no less momentum and magnitude of a storm surge in an
Ocean of humanity. This happens every year with unfailing punctuality. Haridwar is thus
unique, so much so, that every six years, the city is practically besieged, if not overrun, by
tens of millions of pilgrims, who are purely outsiders to the city. This periodicity acts like a
natural phenomenon, forcing the residents to simply bear it.
Given this dynamic behaviour of rising and falling tides of visitors, the city struggles to
remain in working order. Notwithstanding, the citizens like to live, work and prosper in this
unique city. The city, in order to remain home to its growing number of citizens certainly
needs a vision. Clearly, before proceeding to prepare the vision, it is imperative to examine
the strength, weakness, opportunities and threats of the city and various elements of
infrastructure and urban services that support the city.
8.2 SWOT Analysis
Based on the existing situational analysis, City's strengths, weaknesses, opportunities and
threats have been assessed. Th SWOT analysis of Haridwar city is presented below:
8.2.1 City Level SWOT Analysis
STRENGTHS
* One of the seven sacred cities of India.
* One of the four locations in India for Kumbh Mela
* Gateway to Chardham, the four main pilgrimage centres in the North,
* Surrounded by scenic beauty
Infrastructure Planning For Industrialization in Haridwar. 131

* Proximity to Delhi
* Well connected by rail and road
* Industrial development in close proximity
WEAKNESSES
* Lack of developable land
* Lack of better tourism infrastructure
* Inability to tap tourism potential other than pilgrimage
* Poor connectivity by Air
* Difficult to balance the interests of various groups for redevelopment activities
* Increased pressure on existing infrastructure services
OPPORTUNITIES
* Rapid industrial development close to the city area
* Emerging destination for ayurvedic treatment, yoga and spiritual pursuits
* Strategic location for tapping tourism potential other than pilgrimage such as eco tourism
and adventure tourism
* Open spaces for development of tourist attractions
THREATS
* Ecologically sensitive areas Soil erosion from Bilwa Parvat
* Disaster prone area
* Increasing water pollution in Ganges
* Increased possibilities of accidents and health hazards due to massive crowd during
occasions such as Kumbh Mela.
Table: Analysis o Haridwar.
the Strengths & Weaknesses, regarding planning Issues in Development Area:
Sectors Physical Growth and Urban Environment
Strengths BI-IEL and Integrated Industrial Estate developed by SIDCUL contributing to urban growth
Weaknesses Physical growth constraints of hills, forests and water bodies Ribbon development along Delhi-
132 Infrastructure Planning For Industrialization in Haridwar.

Scenic beauty of surrounding hills, mountains, river and green areas Better connectivity with other important cities Good weather and religious character of the place attracts people Good potential for development of eco tourism and adventure tourism acitivities on Najibabad Road
Niti Pass leading to traffic congestion Rapid and unplanned development in the last two decades Deterioration of infrastructure services in congested city areas Encroachments in the old city areas and Ghats Lack of developed land for affordable housing Scattered development in peri urban areas without proper infrastructure facilities
Water Supply Good quality water available from tubewells and infiltration wells. Savings in treatment cost — tubewells and infiltration wells provide clean water. Water supply Master Plan already prepared
Huge Unaccounted for water Water charges too low considering the higher cost of production Some of the tube wells and Pumping plants are old need replacement. Zones being open — cause unequal distribution. No stand by Power Supply
Sewerage More than 80 % Sewerage collection. Highly aware and sensitive public on River Ganges Pollution.
Highly skilled and promising staff for effective maintenance of sewage pumping stations and STP.
Only 60 % sewage is treated. Clogging of sewer lines due to solid waste. No revenue from this sector
Drainage Adequate natural gradients available for achieving self cleansing velocities for open and under ground drainage Good soil strength to provide foundation for rectangular drains
Local habits of discharging wastewater into drains dumping garbage into drains uncontrolled encroachment of waterways, even on slopes of rivers
Solid Waste Management
Support available from GoU Desire of citizens for a clean city
Non availability of suitable disposal site in close proximity to city Little segregation at source Poor primary collection Indiscriminate dumping of waste in Stormwater river, drains and nallas Inability of civic authorities to handle SWM during fairs and festivals Lack of awareness and motivation
Infrastructure Planning For Industrialization in Haridwar. 133

Roads, Parking and Public Transportation
Availability of construction material such as ballast, boulders, sand, etc from river beds Road construction activity from funds available for Kumbh and Ardh Kumbh Mela
Very high cost of land Removal of encroachments from roadside Non availability of labour Very high floating population
Governance and Institutional
Initiative of the state to bring about reforms in the present institutional structure to improve urban governance
Civic administration is thrown out of gear during religious fairs and festivals especially during Kumbh Mela Major municipal functions have not been devolved to HNPP Multiplicity of development authorities Lack of coordination among authorities Poor Institutional capacity
Table 35 : Strengths and weakness analysis
Table: Analysis of the Opportunities and Threats regarding planning Issues in Development Area : Haridwar. Sectors Opportunities Threats Physical Growth and Urban Environment
preparation by TCPD Suitable terrain and better accessibility towards west for future development Opportunity to enforce development controls to ensure environmental friendly urban growth
Unauthorized construction on parks & open spaces, Kumbh Mela areas Conversion of rich agriculture land including orchards for developmental purposes in peri urban areas Soil erosion from Bilwa Parvat (Mansa Devi Parvat) Disaster prone area Unplanned growth could lead to degradation of eco-system
Water Supply Stakeholders have shown a willingness to pay more for better services State Govt., Institutions and Individuals have shown a strong commitment to improve the town during vision exercise
Water tariff revision may face some opposition from Commercial Consumers and individuals. Tampering with the sanctioned connection by some consumers.
134 Infrastructure Planning For Industrialization in Haridwar.

Sewerage Better Environment for residents and tourists. Re-use of treated sewage and sludge for agriculture Use of biogas from STP as a fuel for Dual-Fuel Generating sets.
Complete dependence on grant from GoU for 0 & M expenditure
Drainage Willingness of the stakeholders to bring about positive change in the system and ready to bear some of its responsibility
Opposition from encroachers, and industrial and commercial quarters The present momentum getting lost due to undue delay in implementation
Solid Waste Management
Scope for segregation of bio degradable waste Scope for decentralization of waste collection and treatment Collect and treat organic waste from the decentralized fruit and vegetable markets and slaughter houses
Present disposal of waste along Najibabad Road in close proximity to reserved forests Widespread use of polythene Sudden swell of pilgrims during religious occasions disrupts the solid waste management
Roads, Parking and Public Transportation
GoU is focused about need for providing improved and adequate facilities Interest to introduce MRTS
Removal of encroachment from Roadside Public resistance towards acquisition of land for construction of bypass and off street parking
Governance and Institutional
New Municipal drafted by GoU is expected to empower the ULBs in conformity with the provisions of 74th CAA Uttrakhand being a new and a special category state, lot of scope for innovative approaches for
streamlining development process
Gradual narrowing of the role of Haridwar NPP due to increasing number of parastatal bodies and special committees like Mela Committee Capacity building of all the government organizations if inadequate would result in non implementation of several reforms Continuation of centralized approach
able 36 : Opportunities and Threats analysis
Infrastructure Planning For Industrialization in Haridwar. 135

Chapter 9: STRATEGIES FOR DEVELOPMENT
Infrastructure Planning For Industrialization in Haridwar. 137

9.0 Strategies for Development
9.1 Economic Development
Haridwar will emerge as a unique city with rapid economic growth and promotion of
pilgrimage by restoring its cultural heritage. The impact of two factors viz. large investments
in industries which are expected to be made in the coming years; the planned infrastructure
and institutional improvement with financial assistance of the ADB and the Infrastructure
Development Fund will widen employment opportunities both in secondary and tertiary
sectors. Consequently, an economic development strategy for the city ought to be in place.
This must be balanced against: (i) the need for conservation and enhancement of the existing
cultural, historic and religious assets of the town, and (ii) the expressed desire of citizens to
retain 'clean and green' new city areas.
9.1.1 Economic Development Strategy
The city economic development strategy may include:
• Acquire and develop land for creating industrial estates, for meeting the demand of
individual industries, and for housing complexes in tune with the Physical Growth Initiatives
and zoning control.
• Provide for uninterrupted power supply.
• Install an earth station at Haridwar.
• Promote public-private partnership in the development of infrastructure.
• Provide a truck terminal, perhaps in joint venture with private sector, and promote shopping
complexes.
• Upgrade connectivity, road, rail, other communication.
• Create warehousing facilities.
• Prepare and activate Disaster Management System to be in readiness at all times.
• Develop satellite townships and relocate Government Offices away from hustle bustle of
old religious overcrowded city areas.
Infrastructure Planning For Industrialization in Haridwar. I39

• Upgrade infrastructure for pilgrims and high end tourists.
9.2 Physical Growth and Urban Environment
To restore the character of each area and maintain a balance between various activities areas,
the growing city of Haridwar should be perceived as different zones for future development.
The present city area is identified and classified in two zones for future development:
I. Areas of historical significance -
• Old Town Area of Haridwar — primarily religious/spiritual in character — Temples,
Dharamshalas, Gurukul Kangri, Kankhal, Har-Ki-Pauri and other Ghats
II. New City areas -
• Newly developed area — residential, commercial, institutional and support services
• Fringe areas — Upcoming townships due to industrialisation
The vision, strategies and action plans related to urban physical growth and urban
environment are presented in Table below.
Table : Physical Growth Environmental as ects Vision and Goals Issues Strategies Vision: Physical urban growth Old Town To promote is constrained by Area around Har-Ki-Pauri to be declared as a "Special
ecologically Shivalik mountain Zone" and should have controlled development. In the sustainable and range in the North and long term, this zone should have only public transport planned Northeast and river and pedestrian ways which entails provision of proper development for Ganges in the South. parking areas at suitable nodes. citizens and the Ribbon development Conservation/ preservation of heritage buildings tourists along the main corridor Remove encroachments from heritage precincts Goals: of town creating traffic Identify and develop norms for ecologically fragile areas To restore the congestion and preparation of natural disaster mitigation plan historical Mixed land use in old Widening of Upper road as well as development of character of the areas alternate routes to Har-Ki-Pauri. old town Deteriorating Strict enforcement of development controls to restrict To integrate environmental quality construction activities in old town areas development in in old areas Revision of byelaws to include appropriate controls and the peri urban Encroachments along architectural guidelines for built structures to enhance areas roads and on ghats aesthetics To preserve and Slums and squatter Improve old congested areas of Jwalapur and Kankhal conserve the environmental and
settlements along the
river and canal
New town areas
Urban Growth Directions
140 Infrastructure Planning For Industrialization in Haridwar.

ecologically sensitive areas
Acute congestion in Jwalapur due to unorganized growth Unauthorised construction on undeveloped land Lack of affordable housing. Encroachments on undeveloped open spaces Lack of recreational facilities. Increased pressure due to large scale
industrial development by SIDCUL in
Roshanabad
Promote Growth in areas with good connectivity, availability of land for expansion and suitable terrain for development. Future development should be promoted towards west Future development on Laksar road should be regulated to preserve the rich agricultural fields Restrict development on Najibabad Road. Eco-tourism based activities should be encouraged on. Najibabad Road Strict enforcement of development controls to preserve hills, forests and rivers Housing and Built Environment Provision of affordable housing and serviced land for residential development Revision of byelaws to promote inclusive and adequate
built infrastructure in the new city areas. Promote architecture which respects the status of
Haridwar town and is compatible with the surroundings while effectively meeting the demand for future growth Prepare land management policy to check encroachments and unauthorised construction especially on open spaces Preserve and enhance the green areas, parks, gardens, river-side plantation and Islands Identified open spaces to be developed with parking, community facilities and landscaping Industrialisation
Master Plan should include land use provisions and
zoning regulation for environment friendly industrial development Strict enforcement of zoning regulations to ensure
planned development particularly in respect of location of industrial units
Environment Pollution due to increased vehicular traffic Pollution of the the River Ganges Monitoring of air and noise pollution Collection, Transportation and Safe Disposal of Solid waste
Provide adequate provisions for parks, green belts and plantation of trees at the planning stage for development of an area. Protection of environmental resources such as forest, land and water body Plantation of appropriate tree species on the existing roadsides and conducting regular tree census Adequate protective measures to prevent landslide from the Mama Devi Hill. Framing bye laws to incorporate environment protection at city level.
City greening by involvement of private sector, NGOs
Infrastructure Planning For Industrialization in Haridwar. 141

Land Slide from Mansa Devi Hill
and citizens groups The new master plan should address Environmental aspects e.g., river pollution, prevention of soil erosion from the surrounding hills and natural hazards Necessary measures to make it mandatory for use of alternative fuels ( i.e. CNG)and improve traffic management system of the city Compliance of the MSW (Management & Handling) Rules, 2000 including identification and selection of alternative landfill sites and composting for safe disposal of MSW of the city. Wider coverage of the city by sewerage network and house connections and providing treatment facilities of the sewage for its safe disposal. Proper maintenance of the existing sewers and water supply pipelines to ensure minimum leakage.
Table 37 : Physical Growth Environmental aspects
9.3 Water Supply
9.3.1 Vision
The vision of this sector is "a clean and green city with integrated services for residents and
floating Population and improved basic services in slums"
9.3.2 Strategies
In order to prepare a strategy to achieve the sector vision it may be advisable to refer to the
National and State Policies on water. The National Policy emphasizes on:
• Drinking water must get the top most priority on water allocation.
• Adequate Safe drinking water must be provided to the entire population.
• Need to ensure that water charges must cover at least the operation & maintenance cost part
of the capital cost subsequently.
• Private Sector participation in planning and management should be encouraged where ever
feasible.
The strategies to achieve the vision of assured, good quality water supply to all citizens of
Haridwar are:
142 Infrastructure Planning For Industrialization in Haridwar.

Nita
> /11
0X —
SCI V
OX
ON
IISIX
a
INK
< M
011
— %V
OX
CIAS
OdOl
d

1. Create computerized database of entire system built on GIS based mapping done by GoU
and update continuously.
2. Reduce UFW in a progressive manner to achieve 15% UFW over the short term
3. Provide additional sourceworks to satisfy the demand of population.
4. Replace old and dilapidated piplines including those that have come under roads due to
road widening
5. Separate Zones to achieve control on distribution parameters and achieve equitable
distribution
6. Achieve assured quality of supplied water by introducing routine water quality monitoring
and disseminate information at municipal ward level; Enhance testing capability
7. Achieve Least Cost of production and distribution to consumers
8. Achieve at least 50% cost recovery over short term and maximum / full recovery over
medium to long term.
9.4 Sewerage
9.4.1 Vision
The sector vision states that "Haridwar will be a Clean and Green City and Pollution free".
The GoU is aware of this sector goal to have a pollution free sewerage system in the whole of
the town.
9.4.2 Strategies
The strategies to achieve this vision are as follows:
• 100 % treatment of sewage.
• Sludge reuse for agriculture, horticulture, and ornamental purposes such as recreational
parks.
• New technologies such as intermittent cyclic or sequencing batch reactor activated sludge
process are needed to achieve high effluent quality, low land requirement, no odor, vector or
nuisance and competitive operation and maintenance cost.
Infrastructure Planning For Industrialization in Haridwar. 143

9.4.3 Action Plan for Haridwar Sewerage System
To cater to the current service gap as well as needs of the estimated population by 2025,
following actions are required.
• Creation of Database of the existing sewerage system by GIS & sewer design software
based mapping
• An additional 74.4 Km of sewerage network is proposed to be put in place in the by 2011-
2012
• Rehabilitation of existing sewage pumping stations and 18 mld STP.
• Capacity augmentation and rehabilitation of rising mains
• Modification of 8 mld STP to 12 mld Sequencing Batch Reactor process
Other action plans and initiatives may be taken up concurrently. They are as follows:
• Prevention of entering municipal solid waste and silt in the sewer line.
• Keep sewer at reasonable distance from water line to avoid contamination.
• Improve and ensure access to sanitary services for the urban poor and slum dwellers.
• SCADA control system for sewage pumping station operations.
• Encourage pay and use category of public conveniences with community involvement in the
maintenance of the same
• Cost recovery on service through the introduction of sewerage charges directly or in the
form of tax or introduction of sewerage surcharge in the water bills from local residents,
hotels and Dharamshalas. This however needs political will.
9.5 Storm Water Drainage
9.5.1 Vision
The sector vision states that "Haridwar will emerge as a fast growing urban centre of the
new state". Provision of Integrated Services for residents and floating population is the
mainstay of this sector vision. The GoU is aware of this sector goal to have a problem free
storm water drainage system in the whole of the town.
144 Infrastructure Planning For Industrialization in Haridwar.

..■•■•■••


9.5.2 Strategies
The strategies proposed to achieve the above sectoral vision are as follows:
• Strict control against Dumping of Garbage in the drains.
• Awareness Campaign to educate the masses.
• Regular Cleaning and maintenance of drains.
• Banning the use of plastic bags (as achieved in other tourist towns).
• Discontinue the practice of connecting the Toilet outlets to the drains.
• Implementation of the comprehensive plan for Remodeling of the drainage system, starting
from the tail ends and not from head or middle as is the adopted strategy some times
• The practice of Diversion of surface drains in to sewers should be stopped.
9.6 Solid Waste Management
9.6.1 Vision
The sector vision states that "Haridwar will be a Clean and Green City and Pollution free".
Solid waste management is one of the most crucial elements to achieve the vision. The sector
vision and strategies are presented in Table.
9.6.2 Strategies
Table : Vision and Strategies for the Solid Waste Management Vision Key Isuues Strategies One of the Non-compliance of the Prepare a comprehensive Solid Waste Management most 'Clean & Municipal Solid Waste Master Plan Green' Cities of (Management & Handling) Conduct long term campaign for waste segregation the Country Rules, 2000 and minimization at the household level
No proper citywide solid Improve t the primary waste collection by extension waste of quantification and door-to-door waste collection system including the Characterization slums. No Segregation of waste at Improve present solid waste transportation system by Source efficient route planning and waste handling
outsource part of the transportation activities to Primary Collection of waste is private almost absent agencies. Less involvement of community Identify, select and develop alternative disposal and private agencies sites to fulfill long term needs and safe waste disposal Improvement in SW Decentralize SWM Circle office.
Infrastructure Planning For Industrialization in Haridwar. 145

Transportation system Set up separate cell in DNN for exclusive SWM Safe Disposal of Waste purpose. Health and Hygiene of
Train and upgrade the knowledge and skill of the
Sanitary DNN Workers staff.
Frame bye-laws to comply with the MSW (Handling Lack of Public Awareness
Management) Rules, 2000 and empower the DNN to strictly implement the same Provide protective clothing to the workers
Table 38 : Vision and Strategies for the Solid Waste Management
9.7 Roads and Transport
9.7.1 Vision
Efficient, Safe and Eco friendly Transport system.
The vision of the Roads and Transport sector for Haridwar city is to provide the citizens and
tourists with a safe and comfortable transport system that is sustainable and environment
friendly and to significantly improve the share and quality of public transport service that
would improve the quality of life.
9.7.2 Strategies
Arising from the above sectoral vision, the following strategies are adopted:
• Ensure free flow of traffic through junction improvement, and providing sufficient off-street
parking for both city traffic as well as floating traffic.
• To provide alternate routes, elevated roads, water ways and widened bridges for
decongesting the traffic on the major traffic corridors in the city.
• To provide better and affordable public transport system.
• To improve the facilities for pedestrians and thus public safety. Intersections must be
designed and operated for simplicity and uniformity. The design must keep the capabilities
and limitations of drivers, pedestrians, and vehicles using intersections. It should be based on
knowledge of what a driver will do rather than what he should do. All the traffic informations
on road signs and markings should be considered in the design stage prior to taking up
construction work. Any locations having merging diverging or crossing maneuvers of two 146 Infrastructure Planning For Industrialization in Haridwar.

hi a

vehicles are a potential conflict point. The main objective of the intersection design should be
minimizing conflict points. The improvements measures normally include:
• Proper channelisation for the free left turn
• Footpath on approaches of the junctions
• Planned pedestrian zebra crossing
• Shifting of electric poles and cutting of trees (where absolutely necessary)
• Land acquisition/removing structures
• No parking on the approaches of the junction for at least 50m.
9.7.3 Pedestrian Facilities
Pedestrians are most vulnerable road users in cities. It is therefore necessary to provide better
facilities for pedestrian movement in areas where pedestrian movement is predominant.
Pedestrian facilities in terms of providing footpaths free of encroachment, pedestrian guard
rails along footpaths in order to segregate them from the traffic on the road.
9.7.4 Off Street Parking
The phenomenal growth of vehicles has led to increased demand for parking. Being a
religious city, there is a sudden increase of floating population on weekend and during Melas
and hence there is sudden huge demand of parking to accommodate them. The problem has
been further aggravated by the absence of adequate off-street parking facility in the proximity
of traffic.
9.7.5 Public Transport System for Haridwar City
Presently Intermediate Public Transport (IPT) system of the city is providing services except
for a small share by city buses for short and medium distance trips. With the expansion of the
city and increasing of its population, it becomes difficult for IPT alone to meet the demand.
There is a need to gradually eliminate the IPT mode and replace them with the better public
transport systems; better quality buses which are affordable and also sufficient to meet the
Infrastructure Planning For Industrialization in Haridwar. 147

city's travel demand. Minimum infrastructure such as bus bays, bus stands, terminals etc
should be provided.
9.8 Power - Energy
It is a matter of concern that the annual per capita consumption, at about 350 kWh is among
the lowest in the world and there are widespread shortages of power in almost all parts of the
country. A large number of villages have no access to electricity at all. Households, farmers,
commercial establishments, industries etc. are confronted with frequent power cuts, both
scheduled and unscheduled. Power cuts, erratic voltage levels and wide fluctuations in the
frequency are common. The consumers are resorting to captive power supply arrangements.
To mitigate the acute shortage of power in the country, we are faced with the challenge to
enhance end-use efficiency and manage the power demands of the country for sustainable
and environment-friendly development.
The total energy shortage today is roughly 8 per cent of the total demand and the peak
shortage is roughly 13 per cent of peak demand.
Table: Existing electric substations in Development Area Haridwar.
S.No. Existing 33 / 11 K.V. electric substation
in Development Area: Haridwar.
No. of Electric sub
stations Capacity (M.V.A.)
1 33 / 11 K.V.A. substation, Laljiwala 1 2 x 5 = 10
2 33 / 11 K.V.A. substation, Bhoopatwala 1 3 + 5 = 8
3 33 / 11 K.V.A. substation, industrial
Area, Haridwar 1 2 x 5= 10
4 33 / 11 K.V.A. substation, Mayapur. 1 1 x 5 = 5
5 33 / 11 K.V.A. substation, Kankhal 1 3 + 5 = 8
6 33 / 11 K.V.A. substation, Shivalik
Nagar 1 1 x 3 = 3
7 33 / 11 K.V.A. substation, Roshnabad 1 1 x 3= 3
8 33 / 11 K.V.A. substation, Jwalapur 1 1 x 3 = 3
148 Infrastructure. Planning For Industrialization in Haridwar.


Total 8
50 M.V.A Source: Office of Executive Engineer, Electricity Distribution Division, Haridwar.
Note :- An additional 132 K.v. substation is working in the boundaries of the Development Area : Haridwar but its coverage area is restricted to the industrial unit of Bharat Heavy Electricals Limited (B.H.E.L) for
industrial uses and supplies electriciy to the B.H.e.L. township. Table 39 : Existing electric substations in Development Area Haridwar
The major reasons for inadequate, erratic and unreliable power supply are:
1. Inadequate power generation capacity
2. Lack of optimum utilization of the existing generation capacity
3. Inadequate inter-regional transmission links
4. Inadequate and ageing sub-transmission & distribution network
5. Large scale theft and skewed tariff structure
6. Slow pace of power reforms
7. Inefficient use of electricity by the end consumer
9.8.1 Vision:
1. To provide 'Power for all by 2012'
2. To provide reliable and quality power at an economic price
3. To achieve economically and environmentally sustainable power development
4. To promote general awareness to achieve consensus on power reforms
A comprehensive and integrated strategy is required after realistic assessment of our strengths
and challenges facing the power sector. The strategy must integrate the supply side
imperatives with demand side management, short and medium term measures with long-term
action plans and operational measures with institutional and structural changes
The captive power capacity in the state is estimated at about 2,000 MW. One of the options
available to increase generation in the short term is to enable surplus captive power capacity
to flow into the Grid. Accordingly, a comprehensive captive power generation policy needs
to be adopted with facilities for purchase of power and wheeling of surplus power from
captive generating plants.
Infrastructure Planning For Industrialization in Haridwar. 149
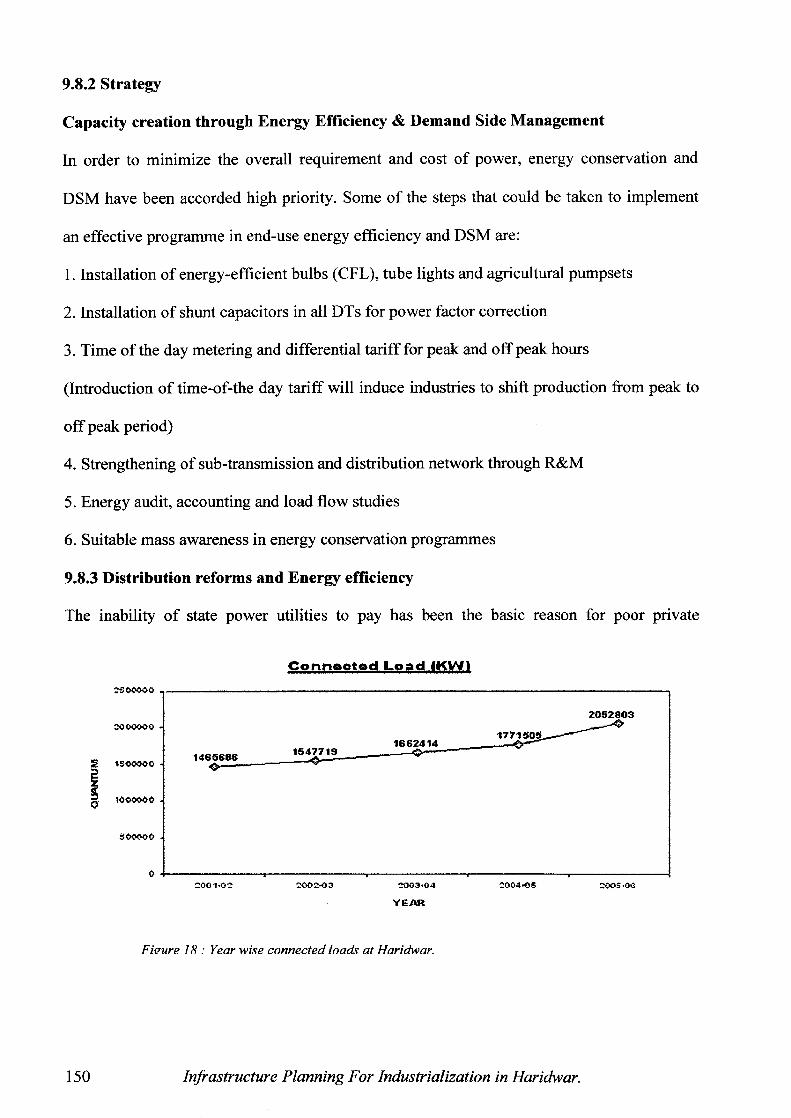
2001.02 2002.03 2003.04 2004.05 2005.06
2
2500000
2000000 -
1500000 -
1000000 -
`300000 -
0
9.8.2 Strategy
Capacity creation through Energy Efficiency & Demand Side Management
In order to minimize the overall requirement and cost of power, energy conservation and
DSM have been accorded high priority. Some of the steps that could be taken to implement
an effective programme in end-use energy efficiency and DSM are:
1. Installation of energy-efficient bulbs (CFL), tube lights and agricultural pumpsets
2. Installation of shunt capacitors in all DTs for power factor correction
3. Time of the day metering and differential tariff for peak and off peak hours
(Introduction of time-of-the day tariff will induce industries to shift production from peak to
off peak period)
4. Strengthening of sub-transmission and distribution network through R&M
5. Energy audit, accounting and load flow studies
6. Suitable mass awareness in energy conservation programmes
9.8.3 Distribution reforms and Energy efficiency
The inability of state power utilities to pay has been the basic reason for poor private
Connootod Load IKWI
YEAR
Figure 18 : Year wise connected loads at Haridwar.
150 Infrastructure Planning For Industrialization in Haridwar.

Enter ay C OinestinnintiOn MU)
200102 20024:0 2060-04 2004-06 200/-06 Y0A0t
40 00
5600
3000
ZS 00
:000
16 00
10 00
00
EtTlaVali027 • NataIran
HARIDWAR 7' •
is*
p y4- 1 4:%";
• • 4- tt..A‘;.,_ e *,
Boo.. A..
g2D215171.1 1. R - Ricook D. o- Dag 3. 11 - /DM 0
11■141.0. .1
-----
-t: 4,4,74,, tun
: • •
investment, both domestic and foreign, in spite of liberalization of policies at Central
Government level. Till the health of the state utilities improves, major investment from the
private sector cannot be expected. The poor financial health of state utilities seriously affects
their ability to invest in new generation capacity, to upgrade their T & D network and to
undertake system improvement.
Distribution is the weakest link in the chain of power supply. Hence distribution reforms have
been identified as the key area of focus in the power sector reform process. Huge T&D losses
are a major cause of concern. A closer examination reveals that actual losses including theft
and wrong classification could be in the range of 40-45%.
Distribution reforms
and Energy efficiency
are inter-linked
processes. In order to
reduce the T&D
losses, and thereby Figure 19 : Year wise electric consumption at Haridwar
improving energy efficiency, the following measures have to be taken in right earnest:
1. 100% metering and AMR-
Installation of meters at all the
transformation stages and in
the premises of consumers,
with the provision for accurate
meter reading, will help to
operate on the concept of "cost
and profit centre".
2. Static (electronic) meters: Figure 20 : Power grid map of Haridwar.
Infrastructure Planning For Industrialization in Haridwar. 151

2006 Figure 21 : Sector wise nower comsumntion at Haridwar.
Installation of static meters on all 11 KV out-going feeders and distribution transformers
(DTs)
3. Effective Management Information System (MIS): Both feeder and DT static meters will
record active energy, power factor and load information. The data recorded in the static
meters can be down loaded to a computer network and software packages will be effectively
utilized to process the data for meaningful management of the distribution system. An
effective MIS ensures effective flow of information to facilitate quick decision-making and to
improve the operation and management of the distribution system.
4. Total energy accounting: The energy received in each 11 kV sub-station and 11 kV out-
going feeders; energy billed and T&D losses at each of the distribution transformer shall be
accurately accounted for. The implementation of energy audit and accounting system, with
billing unit at subdivision level as the nodal point, the problem of commercial losses can be
solved. This will help fix proper
responsibility at the sub-
divisional, divisional, circle and
zonal levels.
5. Installation of capacitor banks
& network reconfiguration:
Installation of capacitors at all
levels; reconfiguration of feeder
lines & distribution transformers in such a way as to reduce the length of LT lines (to reduce
technical and commercial losses) and make the system less LT oriented.
6. High Voltage Distribution System & re-conductoring: Installation of smaller size energy
efficient distribution transformers so that each transformer supplies power to 10 to 15
households only; re-conductoring of over loaded sections.
152 Infrastructure Planning For Industrialization in Haridwar.

7. Development of digital mapping of the entire distribution system and load flow studies for
better energy management.
9.9 Housing
9.9.1 Vision
"Affordable and accessible houses for all"
It was observed that due to shortage of housing, there was high incidence of unauthorized
construction activities on undeveloped land. This issue still remains critical. There is a clear
need to increase the supply of affordable housing for all. Land should also be made available
for private developers with strict enforcement of norm of 20-25% housing for EWS in the
housing project.
9.9.2 Strategy
There is a critical need of housing stock within the Development area: Haridwar as the
concentration of the industrial developments is likely to be followed by the sudden influx of
the migrating population which id estimated to be 35000 people by 2010.
The existing residential areas, namely Shivalik Nagar, Bhadrabad, Villages Rawli Mandood,
Roshnabad etc., are facing a tremendous pressure on the existing infrastructure like water
supply, Sewerage system. Roads and transportation system etc.,
Table: Status of available housing stock in Development Area: Haridwar.
S.No. Description % age
households
1 Ownership status
Privately owned 79 Rented 17
Government / Public buildings 4
2 Age of the buildings more than 50 years 13
10 - 50 years 63 Less than 10 years 24
3 Condition of the buildings Fairly good 90 Good 9
Infrastructure Planning For Industrialization in Haridwar. 153

Dilapidated 1
4 No. of stories G+ 1 73 G + 2 26
G + 3 and above 1
5 Available facilities
Water supply 97 Electric power 96
Kitchen 84 Bathing facilities 90
Lavatory 94 Telephone 58
Source: Haridwar development Authority ( HD.A.) Table 40 : Status of available housing stock at Haridwar
Table : Data on housing status on Urban areas of Haridwar (Existing and projected)
Urban areas
Year No. of
families
Available no. of
Houses Deficiency (No.
of Houses) Available houses
per family 1981 22771 21773 998 0.96 1991 36430 36430 0 1 2001 40620 38952 1668 0.96
*2011 60000 60000 0 1 *2021 83958 83958 0 1 *2025 105111 105111 0 1
Source: Census handbook departmental projections Table 41 : Data on Housing in Urban areas
Careful selection and distribution of the residential sectors, comfortably augmented
infrastructure and financial management coupled with the efficient operation and
maintenance shall be the key to successful planning.
The following points must be considered:
a) Accessibility: Easy and hassle free movement patterns from the source to the
destination.
b) Scope for future expansions: The design and site selection should be done so that
it allows the future expansions of the residential sectors and also it accommodated
the various economic classes of the society.
154 Infrastructure Planning For Industrialization in Haridwar.


Table : Data on housing status on Rural areas of Haridwar (Existing and projected)
Urban areas
Year No. of
families
Available no. of
Houses Deficiency (No.
of Houses) Available houses
per family 1981 9682 9484 198 0.96 1991 14184 14184 0 1 2001 19163 19081 82 0.96
*2011 30000 30000 0 1 *2021 44600 44600 0 1 *2025 54889 54889 0 1
Source: Census handbook departmental projections Table 42 : Data on housing status in rural areas
It is estimated that nearly 160000 houses will be required in the Development area: Haridwar
covering an area of approximately 1280 Hectare of land for R-3 residential zone
requirements. This big piece of land shall be and will be arranged by acquiring the
Agricultural land only, since there is no other place available to capture in the vicinity of the
industries.
Infrastructure Planning For Industrialization in Haridwar. 155
156 Infrastructure Planning For Industrialization in Haridwar.

Table 1 Data on I.I.E. Haridwar. 12 Table 43 : Decadal population growth of Ludhiana... ... . 57 Table 3 : Literacy status of Ludhiana 58 Table 44 : Present land use pattern
Table 5 : Water supply status and length of pipe lines 60 Table 6 Gap analysis of sewerage treatment capacities 62 Table 7 Lenghts of sewerpipe lines . . . .62 Table 8 Cost details of various projects... .................. ......... ............ ..................... .............. ....78 Table 9 : Decadal population growth in Haridwar. 80 Table 10 : Age-Sex distribution and Sex ratio 81 Table 11: Age Sex Distribution of population in Development Area: Haridwar 82 Table 12 : Literacy status of Haridwar 82 Table 13 : % distribution of occupation by age 83 Table 14 : Data on Income 83 Table 15 : Data on expenditure and savings 84 Table 16 : Distribution of Population by Household composition and possession 85 Table 17 : Migration of population in Haridwar 85 Table 18 : Source of drinking water 88 Table 19 : Data on sanitation and sewerage disposal 89 Table 20 : Data on drainage and water logging frequency 90 Table 21 : Priority of infrastructural services 91 Table 22 : Data on mortality in 2006 due to bad sanitation conditions 92 Table 23 : Industries and workforce relationship 95 Table 24 : Issues and proposals in Master Plan 2001 99 Table 25 : Household analysis in development area 99 Table 26 : Housings planned by Haridwar development Authority 100 Table 27 : Status of available housing stock in Development Area: Haridwar 100 Table 28 : Characteristics of the Water Quality of River Ganges at Haridwar 104 Table 29 : availability of water from various sources 107 Table 30 : Source of drinking water (household % age 109 Table 31 : status of water supply in Haridwar 111 Table 32 : Service levels of sewerage system 113 Table 33 : Solid waste generation from various sources 118 Table 34 : Vehicles registered in Development Area 125 Table 35 : Strengths and weakness analysis 134 Table 36 : Opportunities and Threats analysis 135 Table 37 : Physical Growth Environmental aspects 142 Table 38 : Vision and Strategies for the Solid Waste Management 146 Table 39 : Existing electric substations in Development Area Haridwar 149 Table 40 : Status of available housing stock at Haridwar 154 Table 41 : Data on Housing in Urban areas 154 Table 42 : Data on housing status in rural areas 155
Infrastructure Planning For Industrialization in Haridwar. 157

BIBLIOGRAPHY:
BOOKS
• GRISS NEILS S. (1986) Urban Water Infrastructure, Publishers — Wieley-Inter
Sciences (U.K.)
• GARG S.K. (1994) Irrigation Engineering and hydraulic Structures, Publishers
Khanna publishers (New delhi)
• SUBRAMANYA K. (1986) Engineering Hydrology, Publishers- Khanna publishers
(New Delhi)
O RAJORA RAJESH (1998) Water Conservation and Harvesting- Integrated Watershed
Management, Publishers- Rawat Publishers (New Delhi)
REPORTS
O UTTRANCHAL AND UTTARPRADESH AT A GLANCE — 2005, District
Statistical Overview (June 2005), Publishers- Jagran Research Center (Kanpur, U.P.,
India)
O DRAFT MASTER PLAN FOR HARIDWAR 2025- ( Town and Country Planning
Department, Govt. OfUttrakhand), Publishers- AVI Printers (Dehradoon Uttrakhand)
O C.D.P. HARIDWAR (Under JNNURM) (2006) (Unpublished) Prepared by GHK
International U.K.
• BANSAL RAJEEV (2001) Physical Infrastructure Development Strategy For
Haridwar City, Thesis (Unpublished) Department Of Architecture and Planning,
Indian Institute of Technology, Roorkee.
O HAMID AHMED (1990) URBAN FRINGE DEVELOPMENT, Thesis
(Unpublished), department of Urban Design, school of Planning and Architecture,
New Delhi.
Infrastructure Planning For Industrialization in Haridwar. 159

• UTTRANCHAL AT A GLANCE Official report on Vision and Strategies on
Comprehensive development of Uttrakhand
(Source: ww.uttranchal.nic)
PAPERS
• MANAGING URBAN DRAINAGE SYSTEM, Research Paper,
By — Secon B.S.
(Source: International Conference on Planning for 2 1 st Century)
• THE URBAN MANAGEMENT PROGRAM AND INTEGRATED URBAN
INFRASTRUCTURE DEVELOPMENT, Research Paper,
By — Enmiel A. Weigelin
(Source: S.D.R.)
• URBAN INFRASTRUCTURE DEVELOPMENT- ISSUES AND OPTIONS
By- D.S. Meshram and M.L.Chotani
(Source: 47th NTPC Congress, Bhubaneswar)
• COMPREHENSIVE DEVELOPMENT PLAN OF LUDHIANA-2021
Under the JNNURM, prepared by the Punjab urban development Authority
• OFFICE MEMORANDUM, Published by the Ministry of Commerce and Industry,
Government of India.
• THE PRESSURE ON URBAN INFRASTRUCTURE- Need to revamp the Planning
Philosophy, Research Paper
By- J.P.Singh and S.N.Jena
(Source: Vision R.I. research Links)
• IPA INFRASTRUCTURE GUIDELINES 1/04- Priority infrastructure plans, (Oct
2004),
Department of Local Government, Planning, Sports and Recreation, Brisbane,
Queensland. (Source: www.ipa.q1d.gov.au)
Infrastructure Planning For Industrialization in Haridwar. 161