HOUSING CARRYING CAPACITY APPROACH AS THE BASIC OF INFRASTRUCTURE PLANNING IN BOGOR CITY
20
International Conference 21 - 22 October 2013 ITB, Bandung 1 HOUSING CARRYING CAPACITY APPROACH AS THE BASIC OF INFRASTRUCTURE PLANNING IN BOGOR CITY Handini PRADHITASARI 1 , Fernando SITUNGKIR 2 , Kartika Haridjono TJOKRONEGORO 3 Abstract Basically, infrastructure and transportation planning always considering the basic needs and regional economic development. In recent years, the economic growth in big cities has given the spillover effects to their surroundings. In the urban constellation of Jabodetabekjur, Jakarta is the core city, which is supported by its neighbor cities, including Bogor. The most distinctive impact of Jakarta and Bogor economic developing corridor is population growth, especially urban community or commuter. This has been implied in the housing needs as well as its supporting facilities. Nevertheless, the growing population is limited by the land capacity. The availability of land for the sake of housing, roads and other infrastructures has to be basic consideration for planning. Thus, we need to figure the real carrying capacity in order to sustaining the urban land for years. In Bogor City Spatial Plan (RTRW Kota Bogor), it is stated the build area for housing and its facilities in a term called carrying capacity, in this paper examines the carrying capacity for housing needs. The planned area for housing (carrying capacity) is 52% of the total area. This will be used as a threshold for the population projection. Therefore, Bogor City is trying to provide the housing people’s need as well as to achieve its vision as a service and trade city with environmental orientation. This paper examines thecarrying capacity as a tool for housing planning in order to achieve the optimal level of service and controlling the city’s development. Keywords: carrying capacity, housing, population, projection, service 1. Introduction Rapid population growth in the city of Jakarta was no longer able to be accomodated by the availability of land for housing, so that the land for housing becomes very limited at the very expensive rate. At particular point, this condition will lead the urbans to look forward such a proper place to live outside Jakarta. Jakarta as the main core of economic activities attract demand from its surrounding in form of 1,2,3 Graduate Student in Infrastructure and Transportation System, Planning Department Bandung Institute of Technology, Indonesia, [email protected], [email protected], [email protected]
Transcript of HOUSING CARRYING CAPACITY APPROACH AS THE BASIC OF INFRASTRUCTURE PLANNING IN BOGOR CITY
I n t e r n a t i o n a l C o n f e r e n c e 2 1 - 2 2 O c t o b e r 2 0 1 3 I TB , B a n d u n g
1
HOUSING CARRYING CAPACITY APPROACH AS THE BASIC OF
INFRASTRUCTURE PLANNING IN BOGOR CITY
Handini PRADHITASARI1, Fernando SITUNGKIR
2, Kartika Haridjono
TJOKRONEGORO3
Abstract
Basically, infrastructure and transportation planning always considering the basic
needs and regional economic development. In recent years, the economic growth in
big cities has given the spillover effects to their surroundings. In the urban
constellation of Jabodetabekjur, Jakarta is the core city, which is supported by its
neighbor cities, including Bogor. The most distinctive impact of Jakarta and Bogor
economic developing corridor is population growth, especially urban community or
commuter. This has been implied in the housing needs as well as its supporting
facilities. Nevertheless, the growing population is limited by the land capacity. The
availability of land for the sake of housing, roads and other infrastructures has to be
basic consideration for planning. Thus, we need to figure the real carrying capacity in
order to sustaining the urban land for years. In Bogor City Spatial Plan (RTRW Kota
Bogor), it is stated the build area for housing and its facilities in a term called
carrying capacity, in this paper examines the carrying capacity for housing needs.
The planned area for housing (carrying capacity) is 52% of the total area. This will
be used as a threshold for the population projection. Therefore, Bogor City is trying
to provide the housing people’s need as well as to achieve its vision as a service and
trade city with environmental orientation. This paper examines thecarrying capacity
as a tool for housing planning in order to achieve the optimal level of service and
controlling the city’s development.
Keywords: carrying capacity, housing, population, projection, service
1. Introduction
Rapid population growth in the city of Jakarta was no longer able to be accomodated
by the availability of land for housing, so that the land for housing becomes very
limited at the very expensive rate. At particular point, this condition will lead the
urbans to look forward such a proper place to live outside Jakarta. Jakarta as the
main core of economic activities attract demand from its surrounding in form of
1,2,3
Graduate Student in Infrastructure and Transportation System, Planning Department Bandung
Institute of Technology, Indonesia, [email protected], [email protected],

I n t e r n a t i o n a l C o n f e r e n c e 2 1 - 2 2 O c t o b e r 2 0 1 3 I TB , B a n d u n g
2
worker as well as land. Eventually, the movement from Jakarta to its surrounding has
created a phenomenon called suburbanization. It is simply defined as the outward
growth of urban development which may engulf surrounding towns into a larger
urban agglomeration.
The commuters’ movement from the fringe area to the urban center (esp. center
business district/CBD) in big cities was triggered by some factors, such as housing
development along the hinterland, and the attractiveness of the CBDs which lead to
agglomeration. This is implied to the urban internal structure (Bryant in Rohjan,
2003). In the term of transportation, comuting phenomenon is occured because of the
spatial mismatch. Miharja (2005) described spatial mismatch as a spatial structure
character related to the locational connection between workplace and livingplace
which caused a big trip volume. In the case of Metropolitan Jabodetabek, Jakarta is
the development and economic core, and surounded by satelite cities. One of the
most correlated city to Jakarta is Bogor. Bogor has a very distinguished role as a
satelite city or buffer area.
Bogor city has been developed as a buffer area for Jakarta which lead the city to the
more challenges. The city itself has a limited land for housing, industries, services,
and other social – economic activities. But because of its well connected access to
Jakarta (by highway and railway), this city keeps attracting more people to come.
Rapid population along with the economic growth implies to the high demand of the
basic infrastructure and its supporting facilities, including housing. Housing plays a
central role in urban planning, since land use for housing has the largest proportion in
urban area. Thus, land availability for the residential use is one of the most critical
element in urban planning. Moreover, this element could be used as a threshold to
determine the portion of city’s build up area and development planning.
In recent years, Bogor City has a tremendous changes in terms of transportation,
economy and spatial aspects. As a trading city, where trade and activities related has
a strategic development position, Bogor City has to strengthened its infrastructure
services to coupe with overflowing demand. Demands from both internal growth and
Jakarta’s spillover need to be fullfilled as well as to preserved the environment. The
city of Bogor also has an important role in stabilizing the surrounding environment
and to preserve its natural resources. On a national scale, the city is also chosen as a
pilot project developing the Green City Program (P2KH) of the Ministry of Public
Works to create action plans green city. Moreover, in the international forum, Bogor
city was declared to be green city (Al Khaer) by the Moeslem Nations.
Those facts implied that the city is faced with so much burdensome factors that
pushing it to the limit, while there is an implicit task from the national government as
well as international forum to keep its area preserved. Therefore, the physical
development of Bogor City has to be maintained as balance as possible along with
the environmental preservation efforts by using the carrying capacity element. Bogor
spatial plan (RTRW Kota Bogor) has stated that the build area for housing and its
facilities is 52% of the total area. This proportion will be used as a threshold for the

I n t e r n a t i o n a l C o n f e r e n c e 2 1 - 2 2 O c t o b e r 2 0 1 3 I TB , B a n d u n g
3
population projection and to determine whether the area has met their limits. Later,
we will use this population projection to distribute population density and estimate
the housing needs and its supply throughout the Bogor City.
The phenomenon of economic and social problem in Bogor City indicates the lack of
clear awareness on the carrying capacity. In the face of capital-led mechanism in the
city development realm, which focuses in commercial and trading fulfillment,
carrying capacity approach is crucial to clearly draw the limit of urban development.
This paper discusses the development of land carrying capacity approach as the
potential tool to control urban development level in order to maintain acceptable
housing and infrastructure level of service.
2. Literature Review
2.1 Suburbanization
Suburbanization can be defined as the outward growth of urban development which
may engulf surrounding village and towns into a larger urban agglomeration
(coolgeography.co.uk). According to the Ptáček and Szczyrba (2007),
suburbanization is understood as a spatial overspill of a city beyond its limit into the
open landscape and new activities. The location of new activities is focused in the
territory of metropolitan area outside of the compactly built-up area. Suburbanization
is a very complex and conditioned process and to the most visible changes on the
face of cities. It has two main functional forms: residential and commercial
suburbanization and also two main morphological forms: regulated suburbanization
(smart growth) and unregulated suburbanization (urban sprawl).
Jakarta is the most suburbanized mega – city in South East Asia (Murakami, et al,
2003). Since the 1990s, the population of Jakarta’s suburbs has surpassed that of its
metropolitan core (Hudalah & Firman, 2012). Similar to other Asian mega cities,
Jakarta peripheral zones have been pushed by urbanization much beyond their
previous extents and have spilled into rural village or towns surrounding the cities.
Large scale development has become a major feature of Jakarta’s suburbanization.
Past studies conducted on Jakarta’s suburbanization generally restricted their scope
of analysis to land development lying within the formal boundaries of the Jakarta
Metropolitan Area (Jabodetabek), consists of Jakarta as the metropolitan core,
surrounded by its inner suburbs including kotas (municipalities) and kabupatens
(districts) adjacent to Jakarta, which are also called Bodetabek. The total area of
Jabodetabek is 5.897,52 km2.

I n t e r n a t i o n a l C o n f e r e n c e 2 1 - 2 2 O c t o b e r 2 0 1 3 I TB , B a n d u n g
4
Figure 1 Jakarta Metropolitan Region
Source : Modified from Hudalah, 2012 and Murakami 2003
The growth has been rapid over the past several decades, causing rural – to – urban
conversion of large areas surrounding the cities, uncontrolled development, housing
shortages, and expansion of squatter settlements (Murakami, et.al, 2003). The
process shows that the innermost zone of each city was the most populous, as it
continues to be the center of maximum socio-economic activity. This zone became a
magnet for people from outside the metropolitan area (Cadwaller, 1001; Morril, 1992
in Murakami, et al (2003). Later, the urbanization process of innermost zone helped
to expand the urban areas and increase the diversity of land use on the fringes of the
metropolitan areas.
2.2 Population Projection and Carrying Capacity
Expansion of urban areas to the fringes of the city also influenced the distribution of
population density. Therefore, we need to project the population trend in terms of
growth and distribution. Projection is not a prediction or forecast, but is an indication
of future demographic change buit on assumptions about future patterns in fertility
(births), mortality (Deaths), and migration (BPS, BAPPENAS and UNFPA, 2005).
The population projection is very useful to planning. Besides controling the
population density, projection is oriented to provide citizen services and improving
economic condition. Eventually, is aimed to meet an ideal condition, when level of
service of the infrastructure and transportation is sufficient to the communities.
To get into the balance condition, there is a need to determine an optimal scale which
is obtained through infrastructure planning. In analyzing optimization scale, the most
fundamental thing to do is determining carrying capacity element. Carrying capacity
I n t e r n a t i o n a l C o n f e r e n c e 2 1 - 2 2 O c t o b e r 2 0 1 3 I TB , B a n d u n g
5
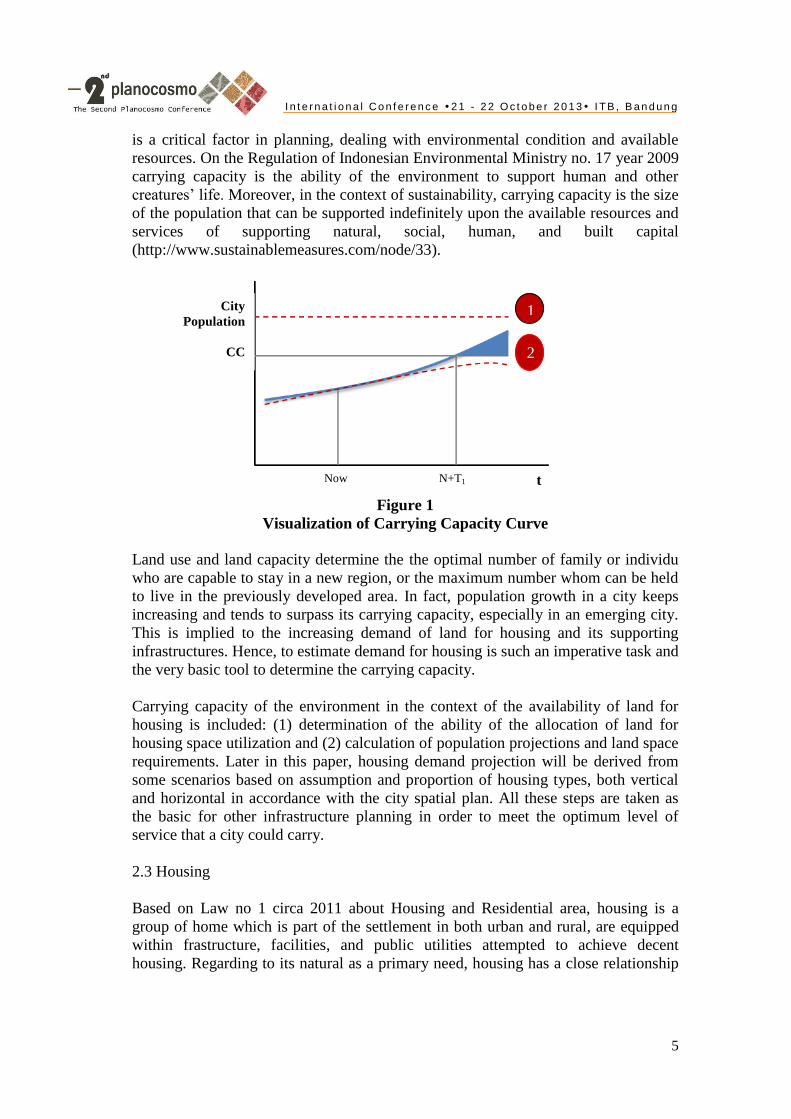
is a critical factor in planning, dealing with environmental condition and available
resources. On the Regulation of Indonesian Environmental Ministry no. 17 year 2009
carrying capacity is the ability of the environment to support human and other
creatures’ life. Moreover, in the context of sustainability, carrying capacity is the size
of the population that can be supported indefinitely upon the available resources and
services of supporting natural, social, human, and built capital
(http://www.sustainablemeasures.com/node/33).
Figure 1
Visualization of Carrying Capacity Curve
Land use and land capacity determine the the optimal number of family or individu
who are capable to stay in a new region, or the maximum number whom can be held
to live in the previously developed area. In fact, population growth in a city keeps
increasing and tends to surpass its carrying capacity, especially in an emerging city.
This is implied to the increasing demand of land for housing and its supporting
infrastructures. Hence, to estimate demand for housing is such an imperative task and
the very basic tool to determine the carrying capacity.
Carrying capacity of the environment in the context of the availability of land for
housing is included: (1) determination of the ability of the allocation of land for
housing space utilization and (2) calculation of population projections and land space
requirements. Later in this paper, housing demand projection will be derived from
some scenarios based on assumption and proportion of housing types, both vertical
and horizontal in accordance with the city spatial plan. All these steps are taken as
the basic for other infrastructure planning in order to meet the optimum level of
service that a city could carry.
2.3 Housing
Based on Law no 1 circa 2011 about Housing and Residential area, housing is a
group of home which is part of the settlement in both urban and rural, are equipped
within frastructure, facilities, and public utilities attempted to achieve decent
housing. Regarding to its natural as a primary need, housing has a close relationship
City
Population
CC
1
2
Now N+T1 t
I n t e r n a t i o n a l C o n f e r e n c e 2 1 - 2 2 O c t o b e r 2 0 1 3 I TB , B a n d u n g
6
with the development of a city. According to Sumantri (1986) Several housing
factors may influence development city, in terms of its physical condition,
environmental, and locational.
Housing needs could be seen by the potential demand and effective demand.
Potential demand means the demanded house based on the number of population
who needs it, regardless their affordability. Meanwhile, effective demand is the
magnitude of the housing potential demand considering their affordability. followed
by a review of the needs of his people, which can be reflected in the amount of
income allocated to housing sector (Danial, 1988). Furthermore, scopes of housing
needs are the quantity and type of house (related to price, size, location and facilities)
The existing housing needs is heavily influenced by factors, including: Housing
Construction to meet the housing demand from households which has yet a home at
this time, and the improvement for sub-standard house. Meanwhile, future housing
needs is affected by the number of population, migration, household size, housing
production and obsolences.
The Regulation of Ministry of Public Housing no. 12 circa 2012 about
Implementation of the Housing and Settlement Areas with Balanced Residential
Arrangement has regulated residential development based on the principle of benefit,
fair, equitable, togetherness, self-confidence, affordability and environmental
sustainability. Using a standard ratio of 1: 2: 3, which is considered to be
proportional, where the construction of luxury housing units type 1 have followed the
construction of medium housing units type 2 and 3 units are simple types. Location
of residential areas has to be in line with land use plans which has been settled in the
Regional Spatial Plan local or other spatial planning documents established by the
local regulation.
3. Methodology
3.1. Population Projection Analysis
There are several methods and formulation order to project the number of population
in a certain area. Each method is implied regarding to time and causal factor, such as
economic condition, social and culture matter. Due to the characteristic and
population trend, it is revealed that Bogor City has an exponential trend, which is
tend to increase and slowly remained constant into the asymptote. The asymptote is
the indicator for which we desired the population has no longer grow (diminishing)
due to limit of carrying capacity. Carrying capacity is a measurement to determine
whether a city or region could carry its burden, regarding to is land and water
availability. Hence, the population projection is conducted by using the double
exponential method. Double exponential method was chosen because its approach to
project population aggregately during the desired time period.
The mathematical formulation of double exponential projection is:

I n t e r n a t i o n a l C o n f e r e n c e 2 1 - 2 2 O c t o b e r 2 0 1 3 I TB , B a n d u n g
7
………………………………………………………………………….(1)
…………………………………………………………………………...…(2)
……………………………...………………………….(3)
Where:
Pn = number of population in projected year (estimated year)
P≈ = threshold for a accepted number of population
a, b = coefficient
t = time
This method allow us to carry out the threshold or limit of the accepted population in
the area, this is what we called carrying capacity. In population projection, threshold
is determined by the supply of land availability for housing combined with housing
development scenario which stated in Bogor City Spatial.
Along with the double exponential method, this research also using a linear
arithmetic method to predict population acceleration in negative way. This method is
going to be implied in the overcapacity area, which population has surpass the
threshold or its carrying capacity. After we determine the population projection
through its carrying capacity, the next step is to analyze the housing needs using the
basic needs standard.
Table 1. Bogor City Housing Scenario Based on Spatial Plan in 2011-2031 Scenario Proportion of Horizontal
Housing Type
Proportion of vertical
Housing Type
District
1 100% 0 All district
100m2 house 60%
200m2 house 30%
400m2 house 10%
2 90% 10% All district
100m2 house 60%
200m2 house 30%
400m2 house 10%
Assumed that a vertical
house has a density of 400
person/hectare
3 80% 20% All district
100m2 house 60%
200m2 house 30%
400m2 house 10%
Assumed that a vertical
house has a density of 400
person/hectare
4 80% 20% North Bogor,
Central Bogor and
Tanah Sareal
90% 10% South Bogor, East
Bogor
100m2 house 60%
200m2 house 30%
400m2 house 10%
Assumed that vertical
house has a density of 400
persons/hectare
Source : Bogor City Spatial Plan in 2011-2031
I n t e r n a t i o n a l C o n f e r e n c e 2 1 - 2 2 O c t o b e r 2 0 1 3 I TB , B a n d u n g
8
3.2. Analysis of Supply and Demand of Housing
This analysis is relies on the fact that housing is an important element to be fulfilled
as a basic needs for the citizen. Generally, the method that is used to analyze demand
in housing and settlement of Bogor City is descriptive comparative by comparing the
land demand and supply considering the environmental carrying capacity, and
minimum service standard.
4. Area Description
4.1. Physical Aspect and Topography
Geographically, the city of Bogor lies at the 190 m - 330 m above sea level. Bogor
city is located in the center of Bogor regency and located very close to the State
Capital with a distance about 60km. It is a strategic potential for economic growth
and development and services, the national center for industry, commerce, transport,
communications, and tourism. Bogor City has an area of 11,850 hectares.
Administrative Bogor consists of 6 districts, 31 sub districts and 37 villages, 210 sub
villages, 623 RW, 2712 RT and surrounded by a region Bogor Regency is as follows:
(1) North Side adjacent with Kemang District, Bojong Gede, and Talbot District, (2)
East Side adjacent with Talbot District and Ciawi District (3) West Side adjacent
with Darmaga District and Ciomas District (4) South Side adjacent with Cijeruk
District and Caringin District
Climatic conditions in the Bogor City average temperature of each month 26 'C with
a minimum temperature of 21.8' C with the highest temperature of 30.4 'C. Humidity
70%, the average rainfall per year is about 3500-4000 mm with the heaviest rainfall
in December and January. Bogor city tilt ranged between 0-15% and a small sloped
area between 15-30%. The type of soil in nearly all regions are reddish brown with
Lotosil effective soil depth of more than 90 cm with soil texture is smooth and is
rather sensitive to erosion. For more complete can be seen in Table 4.3.
Table 2. Slope Land Bogor City No. District Slope Land ( HA )
0 - 2 % 2 - 15 % 15 - 25 % 15 - 40 % More than 40 %
1 South Bogor 169,1 1.418,40 1.053,89 350,37 89,24
2 East Bogor 182,30 722,62 56,03 44,25 9,80
3 North Bogor 137,85 1.565,65 - 68,00 0,50
4 Central Bogor 125,44 560,47 - 117,54 9,55
5 West Bogor 618,40 2.502,14 - 153,81 10,65
6 Tanah Sereal 530,85 1.321,91 - 31,24 -
TOTAL 1.763,94 6.993,95 1.109,92 765,21 119,74 Sumber: Bogor City in Number 2011
I n t e r n a t i o n a l C o n f e r e n c e 2 1 - 2 2 O c t o b e r 2 0 1 3 I TB , B a n d u n g
9
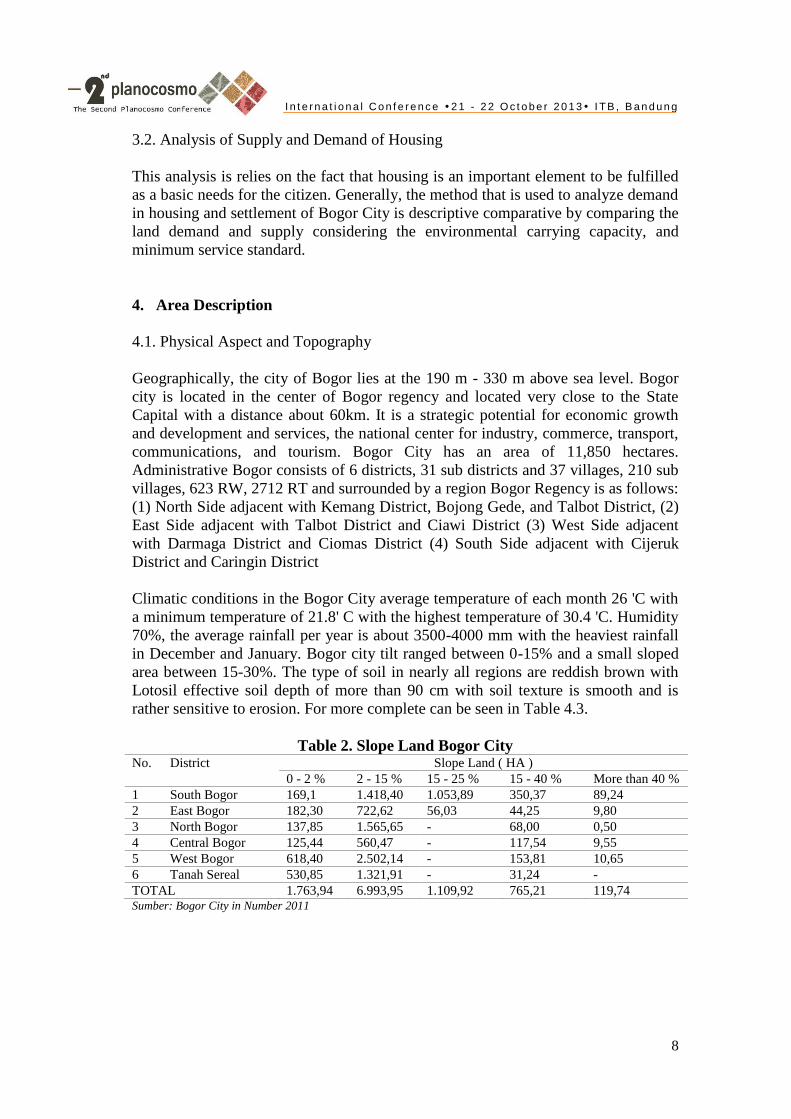
Figure 3 Administration Map of Bogor City
Source: http://www.kotabogor.go.id

I n t e r n a t i o n a l C o n f e r e n c e 2 1 - 2 2 O c t o b e r 2 0 1 3 I TB , B a n d u n g
10
Bogor city divides its area into what so called under sub-district level to order and
arrange the spatial planning, namely Urban Zone Sub-Division (Sub Bagian Wilayah
Kota). The Urban Zone Sub-Division is a part of zonation unit of city that classified
based on the similarity of its function, such as the similarity of land use, the presence
of its own central, feasibility of access, the boundaries either physically or
administratively. There are 9 Urban Zone Sub-Divisions in Bogor City, include
Mekarwangi, Bubulak, Menteng, South Tanah Baru, Pamoyanan, Genteng, North
Tanah Baru, Cibogor, and Katulampa.
Table 4. Area of Sub Division Zone in Bogor City
No
Sub-Division Zone
(BWK) Area (Ha) Proportion
1 Mekarwangi 1.501 12,56%
2 Bubulak 1.688 14,12%
3 Menteng 1.688 14,12%
4 Tanah Baru Utara 802 6,71%
5 Cobogor 801 6,70%
6 Tanah Baru Selatan 1.305 10,92%
7 Katulampa 1.445 12,09%
8 Pamoyanan 1.217 10,18%
9 Genteng 1.508 12,61%
Bogor City 11.955 100,00% Source : Bogor City Spatial Plan in 2011-2031
Bogor City has a tremendous changes, especially regarding to the city quality. In an
independent report, it is stated that the urban quality of Bogor has been depleted. The
diminishing quality of the city was shown by three indicators; transportation,
economy and spatial aspects. Like other emerging city in Indonesia, Bogor City also
faced some spatial issues dealing with land use changes. This implies as the
consequences of policy to determine Bogor as a trading and services city. Therefore,
carrying capacity measurement has to be settled to direct the demands to the
underdeveloped area and to control or reduce development in the the overcapacity
area to keep the city’s level of service.
5. Analysis
5.1. Estimation of Carrying Capacity of Bogor City
In determining the limit of Bogor City population, this study mostly refers to The
Spatial Plan of The City of Bogor in 2011-2031. The Spatial Plan allocates 80% of
the land into the built area while the others are allocated into the green open space
area. The 80% of the area with approximation of 9.48 Ha, are also allocated into the
residential, non-residential area and transportation space following the proportion of
65%, 20%, and 15%. These proportions are assumed based on the city plan and the
I n t e r n a t i o n a l C o n f e r e n c e 2 1 - 2 2 O c t o b e r 2 0 1 3 I TB , B a n d u n g
11
expected future condition. Based on those assumptions, the proportion of land
development can be given following in the table below.
Table 3. Estimation of Carrying Capacity of Land Space in Bogor City No Sub-
District
Area
(km2)
Green
Open
Space
Built
Area
Allocation on Built Area (80%)
Total Residential Non-residential Transportation
20% 80% 65% 20% 15%
1 South Bogor 3081 616 2464.8 1602.12 492.96 369.72
2 East Bogor 1015 203 812 527.80 162.40 121.80
3 North Bogor 1772 354 1417.6 921.44 283.52 212.64
4 Central
Bogor
813 163 650.4 422.76 130.08 97.56
5 West Bogor 3285 657 2628 1708.20 525.60 394.20
6 Tanah
Sareal
1884 377 1506.2 979.68 301.44 226.08
Total 11850 2370 9480 6162 1896 1422
Percentage of Total Area 20 80 52 16 12
Based on the estimation of carrying capacity that are showed by table above, the
development of residential area should be planned not to be more than 6,164 Ha or
equal to 52% of total area of Bogor City, so the other remaining land can be allocated
into non-residential function, such as industry, commercial and service, and
transportation. Beside of that, it is important to persistently keep the green open
spaces remain at 20% of total city area or equal to 2,730 Ha like stated in Law no. 26
circa 2007 about The Spatial Plan. Later, this 52% of land are called the carrying
capacity for residential area.
In this study, the residential carrying capacity are acquired by subtracting the planned
residential area with the existing built residential area. The difference of these both
will be used as the reference to estimate the population that are going to be carried by
the remaining land of Bogor City which are developed to be the residential area. As
the existing built residential area of Bogor City are 4,155.79 Ha, the remaining area
that can be used to develop residential area, or this remaining land later can be
viewed as the existing carrying capacity if there are no land use shifting happened
until 2031, are 2,008.21 Ha.
After estimating the amount of remaining land available to be developed into
residential area, it is important to estimate the demands that will fill these land. To
estimate these demands, this study use the population projection methods from 2011
to 2031. The demands in this case are the sum of population that later are assumed as
the starting point to estimate the amount of future house by using the assumption of
family size of Bogor City while one house is lived by one family only. As explained
in previous section, this study uses 4 scenarios to develop the residential area on each
sub-district based on the housing type, either horizontal or vertical type.
In developing the residential area based on Bogor City carrying capacity, the
scenario 4 is then chosen based on its combination of large proportion of vertical and

I n t e r n a t i o n a l C o n f e r e n c e 2 1 - 2 2 O c t o b e r 2 0 1 3 I TB , B a n d u n g
12
horizontal housing type. The horizontal housing that are going to be developed are
80% of the remaining area following the proportion of 1:2:3 with 1 for the large-size
house (400 m2), 2 for the medium-size house (200 m
2), and 3 for the small-size house
(100 m2). Meanwhile, the vertical housing are 20% of the same remaining area, so
then the calculation of each housing area are now determined in this table below.
Table 4. The Estimation of Carrying Capacity of Bogor City Based on Housing
Development Housing CC 6164 Ha
Existing 5400 Ha
Remaining 764 Ha
Large
House
Medium
House
Small
House
Total
80% Horizontal
(Ha)
Ha 102 204 306 611
m2 1,018,667 2,037,333 3,056,000 6,112,000
611.2 Ha unit 2.547 10,187 30,560 43,293
person 12,733 50,933 152,800 216,467
20% Vertical
(Ha) 152.8
1 Ha = 400
persons
61,120 persons
Initial CC horizontal + vertical
Existing
Population
967,398.00
Actual CC 1,244,987,67
From the table above, it is known that the size of population can be carried by Bogor
City capacity are 1,244,985 persons. Further in this study, the result of the population
limitation can be used as we conduct the population projection analysis to acquire the
condition about the population amount over the carrying capacity. The modified
exponential and double exponential analysis are used in this study to project the
population.
5.2 The Case of Population Projection over the Carrying Capacity
Before discussing the population projection of each sub-district to their carrying
capacity, it is important to know the population projection of Bogor City to its
carrying capacity. By using the double exponential analysis, we can estimate the total
population of Bogor City in 2013 to 2033. The assumptions are used to use this
methods are: (1) the increasing of Bogor City population happens in one certain time
and (2) there is a carrying capacity that limits the increasing of population. By using
this assumption and applying the methods, it is known that in 2033 the population is
1,178,311 persons. By comparing these numbers to Bogor City carrying capacity, we
can conclude that the population of Bogor City in 2030 are still allowed to be carried
by the city.

I n t e r n a t i o n a l C o n f e r e n c e 2 1 - 2 2 O c t o b e r 2 0 1 3 I TB , B a n d u n g
13
Figure 4. Projected Population of Bogor City
In this section, some cases of comparing the population projection to carrying
capacity will be presented in order to gain the insight of what the planner should be
doing about it. First of all, the insight about the general conditions of population
projection are needed to know the population description of Bogor City. By using the
scenario 4, the carrying capacity of each sub-district can be presented in the
following table below.
Table 5. Carrying Capacity of Sub-Districts in Bogor City Sub-District Planned Population
Carrying Capacity
(in persons)
Total of
Population in
2011 (in persons)
Actual Carrying
Capacity (in
persons)
Predicted
Population in
2033 (in persons)
80% of Horizontal and 20% of Vertical Housing
North Bogor -63133 173732 186170 185501
Central Bogor -23091 103830 85415 87841
Tanah Sareal -39757 195742 197937 197937
90% of Horizontal and 10% of Vertical Housing
South Bogor 235336 184336 323696 225335
East Bogor -11002 96617 106638 105315
West Bogor 203084 214826 345129 267780
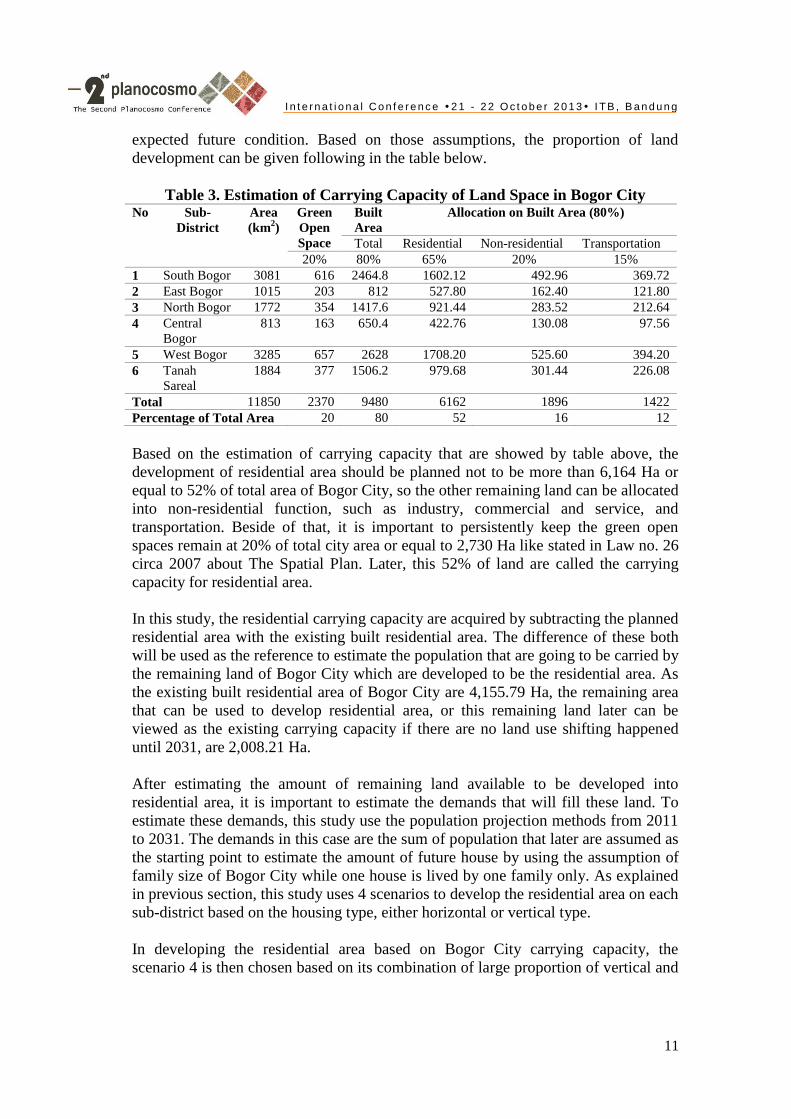
From table above, we can classify the sub-districts into three group: (1) sub-districts
whose population are carrying capacity, (2) sub-districts whose population are
balance with carrying capacity, and (3) sub districts whose population are over
carrying capacity. The members of group 1 are North Bogor, South Bogor, East
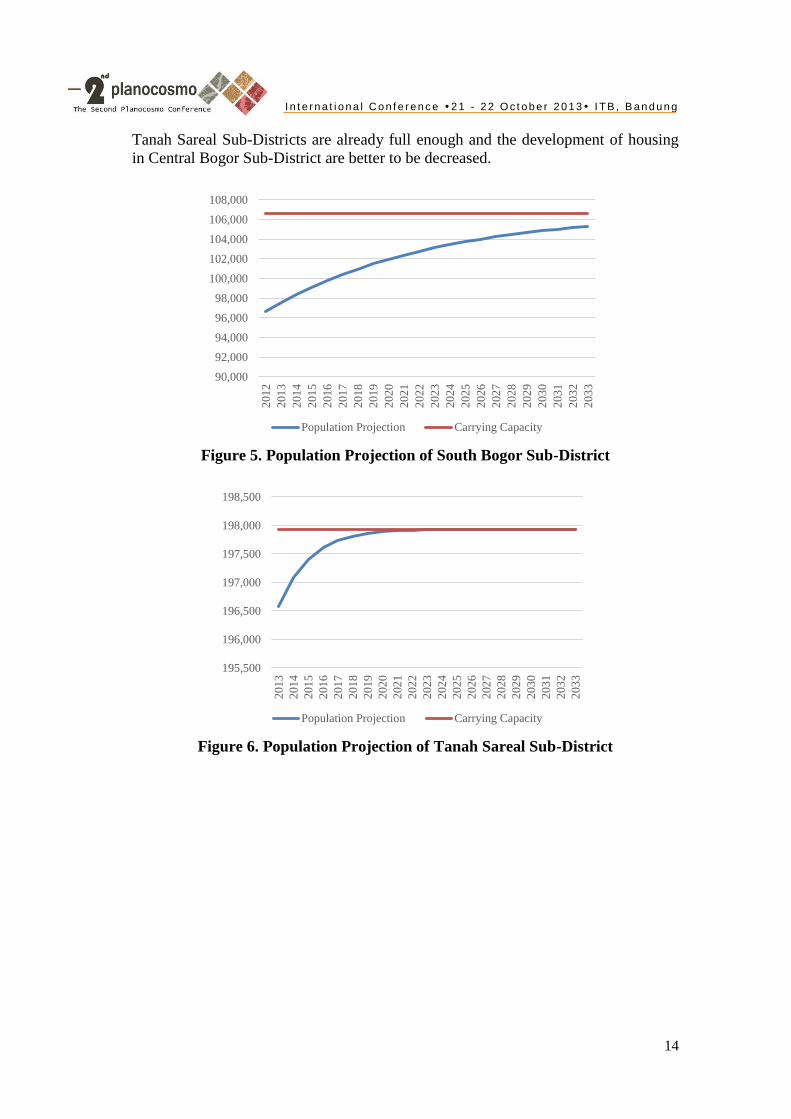
Bogor, and East Bogor Sub-District. The member of group 2 is Tanah Sareal Sub-
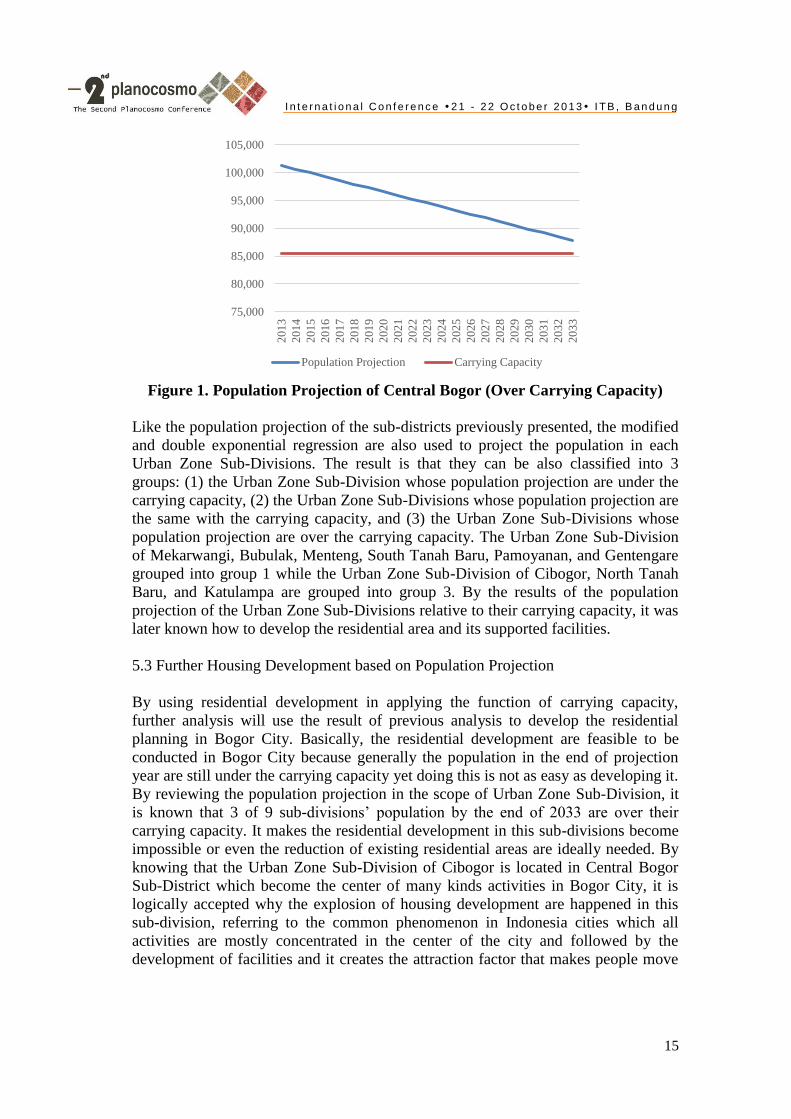
District, and the member of group 3 is Central Bogor Sub-District. As the sub-
districts whose population are under carrying capacity, North Bogor, South Bogor,
East Bogor, and West Bogor Sub-District are allowed to develop housing like the
plan which is explained in previous table, while the development of housing in
0
200,000
400,000
600,000
800,000
1,000,000
1,200,000
1,400,000
201
2
201
3
201
4
201
5
201
6
201
7
201
8
201
9
202
0
202
1
202
2
202
3
202
4
202
5
202
6
202
7
202
8
202
9
203
0
203
1
203
2
203
3
Population Projection Carrying Capacity
I n t e r n a t i o n a l C o n f e r e n c e 2 1 - 2 2 O c t o b e r 2 0 1 3 I TB , B a n d u n g
14
Tanah Sareal Sub-Districts are already full enough and the development of housing
in Central Bogor Sub-District are better to be decreased.
Figure 5. Population Projection of South Bogor Sub-District
Figure 6. Population Projection of Tanah Sareal Sub-District
90,000
92,000
94,000
96,000
98,000
100,000
102,000
104,000
106,000
108,000
201
2
201
3
201
4
201
5
201
6
201
7
201
8
201
9
202
0
202
1
202
2
202
3
202
4
202
5
202
6
202
7
202
8
202
9
203
0
203
1
203
2
203
3
Population Projection Carrying Capacity
195,500
196,000
196,500
197,000
197,500
198,000
198,500
201
3
201
4
201
5
201
6
201
7
201
8
201
9
202
0
202
1
202
2
202
3
202
4
202
5
202
6
202
7
202
8
202
9
203
0
203
1
203
2
203
3
Population Projection Carrying Capacity
I n t e r n a t i o n a l C o n f e r e n c e 2 1 - 2 2 O c t o b e r 2 0 1 3 I TB , B a n d u n g
15
Figure 1. Population Projection of Central Bogor (Over Carrying Capacity)
Like the population projection of the sub-districts previously presented, the modified
and double exponential regression are also used to project the population in each
Urban Zone Sub-Divisions. The result is that they can be also classified into 3
groups: (1) the Urban Zone Sub-Division whose population projection are under the
carrying capacity, (2) the Urban Zone Sub-Divisions whose population projection are
the same with the carrying capacity, and (3) the Urban Zone Sub-Divisions whose
population projection are over the carrying capacity. The Urban Zone Sub-Division
of Mekarwangi, Bubulak, Menteng, South Tanah Baru, Pamoyanan, and Gentengare
grouped into group 1 while the Urban Zone Sub-Division of Cibogor, North Tanah
Baru, and Katulampa are grouped into group 3. By the results of the population
projection of the Urban Zone Sub-Divisions relative to their carrying capacity, it was
later known how to develop the residential area and its supported facilities.
5.3 Further Housing Development based on Population Projection
By using residential development in applying the function of carrying capacity,
further analysis will use the result of previous analysis to develop the residential
planning in Bogor City. Basically, the residential development are feasible to be
conducted in Bogor City because generally the population in the end of projection
year are still under the carrying capacity yet doing this is not as easy as developing it.
By reviewing the population projection in the scope of Urban Zone Sub-Division, it
is known that 3 of 9 sub-divisions’ population by the end of 2033 are over their
carrying capacity. It makes the residential development in this sub-divisions become
impossible or even the reduction of existing residential areas are ideally needed. By
knowing that the Urban Zone Sub-Division of Cibogor is located in Central Bogor
Sub-District which become the center of many kinds activities in Bogor City, it is
logically accepted why the explosion of housing development are happened in this
sub-division, referring to the common phenomenon in Indonesia cities which all
activities are mostly concentrated in the center of the city and followed by the
development of facilities and it creates the attraction factor that makes people move
75,000
80,000
85,000
90,000
95,000
100,000
105,000
201
3
201
4
201
5
201
6
201
7
201
8
201
9
202
0
202
1
202
2
202
3
202
4
202
5
202
6
202
7
202
8
202
9
203
0
203
1
203
2
203
3
Population Projection Carrying Capacity
I n t e r n a t i o n a l C o n f e r e n c e 2 1 - 2 2 O c t o b e r 2 0 1 3 I TB , B a n d u n g
16
towards the center and later built their home there, either the well managed
residential area or the uncontrolled poor managed residential area.
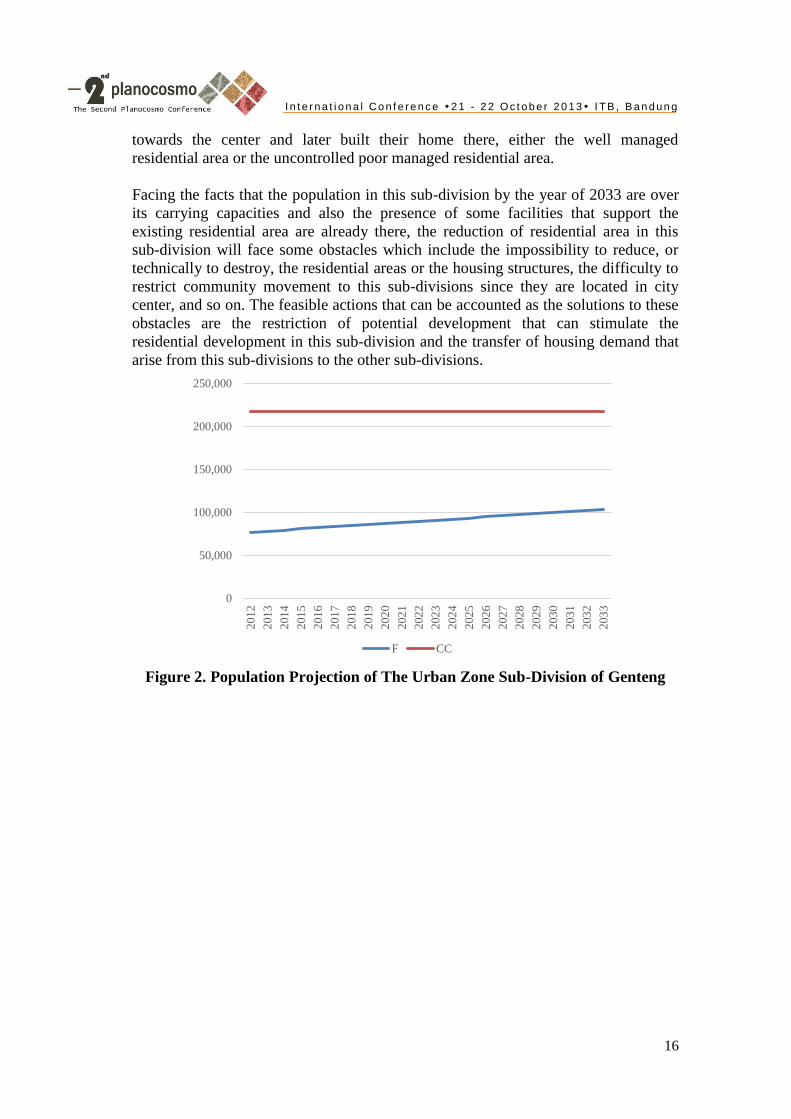
Facing the facts that the population in this sub-division by the year of 2033 are over
its carrying capacities and also the presence of some facilities that support the
existing residential area are already there, the reduction of residential area in this
sub-division will face some obstacles which include the impossibility to reduce, or
technically to destroy, the residential areas or the housing structures, the difficulty to
restrict community movement to this sub-divisions since they are located in city
center, and so on. The feasible actions that can be accounted as the solutions to these
obstacles are the restriction of potential development that can stimulate the
residential development in this sub-division and the transfer of housing demand that
arise from this sub-divisions to the other sub-divisions.
Figure 2. Population Projection of The Urban Zone Sub-Division of Genteng
0
50,000
100,000
150,000
200,000
250,000
201
2
201
3
201
4
201
5
201
6
201
7
201
8
201
9
202
0
202
1
202
2
202
3
202
4
202
5
202
6
202
7
202
8
202
9
203
0
203
1
203
2
203
3
F CC

I n t e r n a t i o n a l C o n f e r e n c e 2 1 - 2 2 O c t o b e r 2 0 1 3 I TB , B a n d u n g
17
Figure 3. Population projection of The Urban Zone Sub-Division of Bubulak
Figure 4. Population Projection of The Urban Zone Sub-Divison of Pamoyanan
The residential development area used in this study use the comparison 1:2:3 of
house size. The result of housing demand projection shows that in 2033, the demand
of housing are approximately 895 units for house type 1, 1,789 units for house type
2, and 2,684 units for house type 3. These numbers are including the excess demands
for housing in the Urban Zone Sub-Division of Cibogor, while the housing
development in Urban Zone Sub-Division of North Tanah Baru and Katulampa are
not conducted. By knowing that there are 3 sub-divisions that have so much
0
50,000
100,000
150,000
200,000
250,000
201
2
201
3
201
4
201
5
201
6
201
7
201
8
201
9
202
0
202
1
202
2
202
3
202
4
202
5
202
6
202
7
202
8
202
9
203
0
203
1
203
2
203
3
F CC
0
20,000
40,000
60,000
80,000
100,000
120,000
140,000
160,000
180,000
200,000
201
2
201
3
201
4
201
5
201
6
201
7
201
8
201
9
202
0
202
1
202
2
202
3
202
4
202
5
202
6
202
7
202
8
202
9
203
0
203
1
203
2
203
3
F CC
I n t e r n a t i o n a l C o n f e r e n c e 2 1 - 2 2 O c t o b e r 2 0 1 3 I TB , B a n d u n g
18
remaining space for population growth (Genteng, Bubulak, and Pamoyanan), it is a
possibility then to do the population growth potential transfer to these sub-divisions.
Doing such transfer are basically possible but there are some conditions to be done
first, such as the restriction of any development that can generate the population
attraction into the city center and transfer this attraction into the 3 sub-divisions. The
transfer of the attraction can be applied by dispersing the city activities, especially to
these 3 sub-divisions along with the development of its supporting facilities.
6. Conclusion
Population growth is a major consideration that influence the decision making in
urban planning, later as the effect of activities developments. Infrastructure planning
as the supporting system to the urban planning are needed because it has an ability to
develop the infrastructure in terms of what, where, and when, it can support urban
activities. As the population continuously grow, the urban planning will someday
face the new challenge that is the overpopulation. Overpopulation in this case refers
to the conditions when the population of the city are excesses it capacity. Later, in
this study, the overpopulation becomes a new concern to develop a new perspective
in infrastructure planning. The proposal of carrying capacity in infrastructure
planning comes as a result of the further consideration to overpopulation problem.
By comparing the population projection of sub-districts and urban zone sub-divisions
of Bogor City, this study conclude that there are some impossible population
projection that later become a consideration on further infrastructure development.
The population projection in 2033 of Sub-District of Central Bogor shows that it will
face the overpopulation, while the others still have spaces to be developed. The same
things are also happened at the scope of urban zone sub-divison where 3 of 9 of sub-
divisions are facing the overpopulation relative to its carrying capacity in 2033. As
this study use the housing development as the tools to determine the carrying
capacity, restriction of housing development in the overpopulated area are needed to
control its number. Potential solution are founded when there are 3 subdivisions have
many remaining space that can accommodate the excess population. Transfer of
population by transfer the activities from the city center along with its supporting
infrastructures are proposed in this study in order to accommodate the population
growth and provide the house for them to live in.
Acknowledgement
First and foremost, the writers wish to thank all the rest of committee who supported
this study, especially Bapak Miming Miharja and Ibu Harkunti Pertiwi Rahayu for
being the part of this study. Also thank you to all the fellow participants of Class
Infrastructures Planning Studio of 2013 who have been amazing help throughout
undertaking activity of data collection in Bogor city. This study is a part of the main
project of Class Infrastructure Planning Studio of 2013 titled “Infrastructure and
Transportation Planning of Bogor City in 2013-2033”, which was financed by
Bandung Institute of Technology.
I n t e r n a t i o n a l C o n f e r e n c e 2 1 - 2 2 O c t o b e r 2 0 1 3 I TB , B a n d u n g
19
References
Danial dkk, 1988, Kemiskinan dan Perumahan di Bandar:Peranan Pemerintah dan
Penyelesaian, Amazon.com, viewed 27 september 2013.
Hudalah, D., J. Woltjer, T. Firman & D. Viantari (2012) Contesting the centrality of
Jakarta: Have industrial centres promoted deconcentration? Paper presented at
the32nd International geographical Congress, Cologne, 26-30 August 2012.
Hudalah, D. &T. Firman (2012) Beyond property: Industrial estates and post-
suburban transformation in Jakarta Metropolitan Region. Cities 29(1) 40–48.
Miharja, Miming. 2005. Eksplorasi Empirik terhadap Fenomena Spatial
Mismatch sebagai Penyebab Masalah Transportasi di Wilayah Bandung Raya.
KK Rekayasa Sistem Wilayah dan Kota. Departemen Teknik Planologi. Institut
Teknologi Bandung.
Murakami, A. et al (2005) Trends in urbanization and patterns of land use in the
Asian mega cities Jakarta, Bangkok, and Metro Manila. Landscape and Urban
Planning 70: 251–259.
Ptáček, P and Szczyrba, Z. (2007). Current Suburbanisation Trends in The Czech
Republic And Spatial Transformation Of Retail. Revija za geografijo 1-2, 2007, 55-
65
Regulation of Ministry of Housing Affair No. 12 Year 2012 in Implementation of
Housing and Residential Area with Balanced Settlement
Regulation of Indonesian Environmental Ministry no. 17 year 2009 in Guidelines on
the Determination of Environmental Carrying Capacity in Regional Spatial Planning
Rohjan, J. 2003. Investigasi Model Ridesharing Program untuk Kawasan
Perumahan di Kawasan Pinggiran Kota Bandung. Tesis Program Magister
Transportasi. Institut Teknologi Bandung.
Republic of Indonesia, Law No. 1 Year 2011 in Housing and Residential Area
Regional Planning and Development Agency. 2012. Bogor City Spatial Plan 2011 -
2031. Bappeda Kota bogor
Statistic Central Agency, Bogor City in Figure 2011
Sumatri, P. S. 1986, Kebijakan Pembangunan Perumahan dalam Skala Besar, Prisma
15(5), Bandung.

I n t e r n a t i o n a l C o n f e r e n c e 2 1 - 2 2 O c t o b e r 2 0 1 3 I TB , B a n d u n g
20
http://www.coolgeography.co.uk/Alevel/AQA/Year%2013/World%20Cities/Suburba
nisation/Suburbanisation.htm accessed Saturday, 5th of October 2013
http://www.kotabogor.go.id