Vocational education, industrialization and provincial divide in Italy, 1861-1914
356
THE ECONOMIC HISTORY SOCIETY Annual Conference University of Wolverhampton (Telford) 27 – 29 March 2015 Programme including New Researchers’ Papers & Abstracts of the other Academic Papers Interior view of Coalbrookdale Co. Ltd. foundry fitting shop showing construction of high pressure pumping engine in foreground, with overhead travelling crane visible in middle distance and at top of image, c.1900-10 Image courtesy of the Ironbridge Gorge Museum Trust
Transcript of Vocational education, industrialization and provincial divide in Italy, 1861-1914

The economic hisTory socieTyAnnual Conference
University of Wolverhampton (Telford)27 – 29 March 2015Programme including
New Researchers’ Papers &
Abstracts of the other Academic Papers
Interior view of Coalbrookdale Co. Ltd. foundry fitting shop showing construction of high pressure pumping engine in foreground, with overhead travelling crane visible in middle distance and at top of image, c.1900-10Image courtesy of the Ironbridge Gorge Museum Trust

THE ECONOMIC HISTORY SOCIETY
Annual Conference
University of Wolverhampton (Telford)
27 – 29 March 2015
Programme including
New Researchers’ Papers &
Abstracts of the other Academic Papers


Contents
i
Page no. Contents i Welcome to the University of Wolverhampton, Telford Campus vii Summary conference programme viii Brief guide to conference arrangements x How to reach the University of Wolverhampton, Telford Campus xii Campus Map xiii NEW RESEARCHERS’ SESSIONS I/A MEDIEVAL AND EARLY MODERN MARKET TRADE Jordan Claridge Supplying without specializing: landlords, peasants and work-
horses in medieval England 1Pinar Ceylan Integration and disintegration in the Ottoman wheat markets; trends
and causes, 1660-1840 8Daisy Gibbs Experiencing the French liberalization experiment in Tours, 1763-
75 13I/B LABOUR AND LIVING STANDARDS Frances Richardson Making a living on the Welsh farm: the changing nature of by-
employment in Caernarvonshire, 1750-1900 18Joseph Harley Material lives of the English poor from the late seventeenth to the
early nineteenth centuries 23Charles Read Who ate Ireland’s food during the famine? 29I/C MONEY SUPPLY AND CREDIT Nuno Palma Annual coin supply estimates for England, 1279-1790 36Paul Kosmetatos The Bank of England as Lender of Last Resort during the 1772-3
credit crisis 43Xun Yan The big problem of small change in late Imperial China: silver
inflow, rural deflation, and how it was solved by new copper minting technology, 1890-1910 50
I/D WORKING AND LIVING IN THE UNITED STATES Cornelius Christian Lynchings, labour, and cotton in the US South 56Vellore Arthi “The dust was long in settling”: human capital and the lasting
impact of the American Dust Bowl 61Alexandra López Cermeño
ICT revolution: localization of service sector employees in the long run 72
I/E BUSINESS AND RETAILING William Quinn Squeezing the bears: cornering risk and limits on arbitrage during
the British Bicycle Mania, 1896-98 78Thomas Buckley Weighing the scale: store size and the productivity of retail firms,
1950-73 85Jessica Gray Conservation and retailing: a forgotten commercial narrative? 91I/F EDUCATION, INDUSTRY AND INVESTMENT Pei Gao Risen from chaos: what drove the spread of mass schooling in
China through the early twentieth century? 96Ian Webster Did the turnpike trust financial model fail local savers? 105I/G FISCAL POLICY Olga Christodoulaki Did Greece genuinely introduce either of the Gold, or Gold
Exchange Standards, in 1910? 110Andrea Papadia Sovereign defaults during the Great Depression: new data, new
evidence 116Sara Torregrosa-Hetland Evasion and progressivity in the Spanish income tax, 1970-2001 122II/A EARLY MODERN MANUFACTURING Mara Caden The question of mints and manufactures in British America, 1670-

Contents
ii
1730 128Rachael Morton Controlling quality, producers and their products: regulation and
reputation in the English metal-ware trade, c.1760-74 132Karolina Hutkova The English East India Company’s market for lemons: the
organizational failure of the system of filature silk production in Bengal, 1774-1812 137
II/B LONG DISTANCE TRADE IN THE 19TH AND 20TH
CENTURIES Michael Aldous The business of information: brokers and auctioneers in the
nineteenth-century Anglo-Indian trade 144Alexis Wegerich A different trajectory of market integration? Evidence from bunker
coal markets, 1840-1960 150Léo Charles Are partners too distant? French difficulties on new long distance
markets, 1850-1913 157II/C ECONOMIC LIVES IN 20TH-CENTURY ASIA Atiyab Sultan The macabre and Micawberish economic lives of Punjabi
cultivators, 1900-47 165Sumiyo Nishizaki After empire comes home: economic experiences of Japanese
civilian repatriates to Hiroshima, 1945-56 170Carmen Gruber Virtues and vices: female workers in the Japanese labour model 177II/D INDUSTRY IN THE 20TH
CENTURY Miguel Morin Electricity and the jobless recovery from the Great Depression 182Salvatore Romeo Italian State-owned steel industry in the European Common Market,
1956-95 184Maria Cecilia Lara Martinez
Productivity performance of manufacturing in Uruguay from a comparative perspective 191
II/E ECONOMIC REGULATION Alan de Bromhead Women voters and trade protectionism in the interwar years 199Simon Mee Central banking independence, historical narratives and the Bank
deutscher Länder, 1948-57 204
Bernardo Wjuniski ‘Guiding the invisible hand’: market equilibrium and multiple exchange rates in Brazil, 1953-61 210
II/F SOCIAL STATUS, CONFLICT AND PATRONAGE Cédric Chambru Winter is coming: weather variations and social disorder in France,
1661-1789 218Chiara Martinelli Vocational education, industrialization and provincial divide in
Italy, 1861-1914 226Tosh Warwick Utilizing business archives to explore industrialist patronage:
Middlesbrough’s steel magnates and the British Steel Collection, 1880-1934 233
Academic Sessions – I/A FINANCIAL CRISES George Chouliarakis et al.
The effect of fiscal policy on output in times of crisis and prosperity: historical evidence from Greece, 1846-1939 243
Jaime Reis Bagehot for ‘followers’: how did the Portuguese Lender of Last Resort manage the post-World War I crisis? 244
Albrecht Ritschl What do financial panics do? Narrative VAR evidence from the Great Contraction, 1929-33 246
I/B LONG TERM CHANGES IN INCOME EQUALITY Guido Alfani & Wouter Ryckbosh
Was there a ‘Little Convergence’ in inequality? Low countries and Italy compared, c.1500-1900 247
Héctor García Montero
Economic inequality in England from the middle ages to the eve of the industrial revolution 248
Mats Olsson & Wealth inequality in Sweden, 1700-1900 249

Contents
iii
Patrick Svensson I/C OCCUPATIONAL STRUCTURE, POPULATION GEOGRAPHY AND TECHNOLOGICAL CHANGE Keith Sugden The impact of the mechanization of cotton manufacture upon male
and female employment; a case study of Manchester c.1780-1840 250
Mohamed Saleh Occupational structure in Egypt, 1848-1996 251Gijs Kessler & Timur Valetov
Occupational change and industrialization: from Russia to the Soviet Union, 1897-1959 251
Mark Casson et al. Railways and local population growth: a case study of the Birmingham region 253
I/D FAMINE, LIVING STANDARDS AND INSTITUTIONS Gregg Huff & Gillian Huff
The Great Famine in Vietnam, 1944-45 255
Leigh Gardner & Jutta Bolt
De-compressing history? Pre-colonial institutions and local government finance in British Colonial Africa 256
Andrew Seltzer & Jeff Borland
The impact of locally-set minimum wages on labour markets: the case of the 1896 Victorian Factories and Shops Act 256
I/E THE BRITISH ATLANTIC ECONOMY Emma Hart On the waterfront: wharfside spaces and economic culture in
Britain’s Atlantic world 258Adrian Leonard From local to transatlantic: insuring trade in the Caribbean 259Sheryllynne Haggerty What’s in a price? The raw cotton market in Liverpool and the
Anglo-American War 261I/F PRODUCTION AND EXCHANGE IN EARLY MODERN EUROPE Carlos Álvarez-Nogal et al.
Agricultural output and productivity in Spain, 1400-1800: new evidence from tithes 262
Christiaan van Bochove
Making payments within the Dutch Republic 263
Kristina Lilja Clothes as medium of exchange 264I/G AGRICULTURAL CRISIS AND LAND REFORM IN SPAIN Ramon Ramon-Muñoz et al.
Well-being and the late nineteenth century agrarian crisis: anthropometric evidence from rural Catalonia 265
James Simpson & Juan Carmona
Too many workers or not enough land? Why land reform failed in Spain in the 1930s 266
Jordi Domenech & Francisco Herreros
Land, politics, conflict and lethal violence: evidence from the 1930s 267
II/A SHAREHOLDERS AND FIRMS IN THE UK DURING THE LATE 19TH AND EARLY 20TH
CENTURIES Janette Rutterford et al.
Investor trust in the UK, 1870-1930 269
Graeme Acheson et al.
Rentier capitalism and the equity market: shareholders in Victorian public companies 269
Lyndon Moore et al. The vicar, the widow, or the gentleman: who gets allocated IPO shares? 270
II/B GEOGRAPHY, BORDERS AND INSTITUTIONS: RE-INTERPRETING ITALY’S REGIONAL DIVIDE Carlo Ciccarelli & Stefano Fachin
Industrial growth and spatial spillovers in nineteenth-century Italy 271
Emanuele Felice
Regional income inequality in Italy in the long run, 1871-2001: patterns and determinants 272
Anna Missiaia The industrial geography of Italy: provinces, regions and border effects, 1871-1911 273
II/C POSTWAR BRITAIN Peter Scott & ‘Stop-go’ economics and the decline of Britain’s consumer durables

Contents
iv
James Walker industries, 1945-64 275Jim Tomlinson De-industrialization not decline: Britain since the 1950s 275Adrian Williamson Privatisation and the postwar settlement 276II/D STRUCTURAL CHANGE IN THE GLOBAL ECONOMY Jason Begley et al. Convergence in the pre-1914 Atlantic economy: what really
happened to wages in the Irish economy? 278Aurèlia Mañé-Estrada & Paul Warde
Revisiting the birth of the world oil industry: the case of the Anglo-Maikop Corporation before WWI 279
Jonas Lungberg International price competition and productivity, 1850-1940 280II/E EARLY MODERN INDUSTRY James Bowen Cottagers and squatters in an early industrializing region: evidence
from the Ironbridge Gorge district, Shropshire 282Karin Dannehl Foundry ware distribution from the Darby ironworks in
Coalbrookdale/Shropshire: a review of early eighteenth-century production, supply and management challenges 283
Tim Barmby The lead mine workings at Tyndrum: new evidence on late eighteenth-century earnings 284
Judy Stephenson Industrial organization in London building trades, 1660-1750 284II/F ESTATE MANAGEMENT AND THE LATE MEDIEVAL ECONOMY Catherine Casson Location, location, location? Property speculation and the rental
market in medieval Gloucester 286Philip Slavin The Spörer Minimum and the Agrarian Crisis of 1436-39 287Alex Brown Institutional memory and estate management in the English
countryside 288II/G IDEOLOGY AND PRAGMATISM IN ECONOMIC HISTORY Chris Grocott Compromising liberty: Friedrich Hayek’s ‘The Road to Serfdom’
in practice 289Declan O’Reilly Of morals and money: IG Farben, Interhandel and GAF, ideology
and pragmatism in the Kennedy Administration’s settlement with the Union Bank of Switzerland, 1963-65 290
Avner Offer Economic theory and social democracy: The Nobel Prize in Economics 290
III/A SPENDING AND FINANCING WAR Stéphanie Collet & Eric Golson
Neutral Central Bank financing costs in the Great War 292
Jari Eloranta Pro Bono Publico? Demand for military spending between the World Wars 292
Nicholas Zammit Picking favourites: comparing the wartime contributions amongst the British Dominions 293
III/B HISTORY & POLICY ROUND TABLE: THOMAS PIKETTY ON CAPITAL AND INEQUALITY Invited panel to include: Martin Daunton, Avner Offer, Jim Tomlinson and Keith Tribe 294III/C WORKING IN THE INDUSTRIAL REVOLUTION Andy Burn A job for life? Working lives and the historical record in early
industrial Newcastle upon Tyne 295
Steven Toms ‘Cold, calculating political economy’: hours of labour, fixed costs, the rate of profit in the Factory Act Debates, 1832-47 296
Joyce Burnette Absenteeism in a nineteenth-century textile firm 298III/D INSTITUTIONS AND DIVERGENCE Hanhui Guan & Qian Dai
Why the Civil Service exam system replaced the hereditary system in Tang China: land equalization, social mobility, and bureaucracy system transformation 300
Alexander Klein & Was Domar right? The Second Serfdom, the land-labour ratio, and

Contents
v
Sheilagh Ogilvie urbanization in eighteenth-century Bohemia 300Stephen Broadberry Accounting for the Great Divergence 301III/E WOMEN’S COMMITTEE SESSION: EMOTIONS AND THE ECONOMY IN EARLY MODERN EUROPE Merridee Bailey Rethinking emotions and the economy: the relationship between
economic values and emotions in late medieval and early modern London 303
Dorothee Sturkenboom
Commerce and emotions in the Dutch Republic: reading the mind of the early modern merchant 303
Anne Laurence Marriage and the market in eighteenth-century England 304III/F FINANCIAL FLOWS IN MEDIEVAL AND RENAISSANCE ITALY Marie Ito Grain flows and the Florentine grain market, 1250-1330 305Roman Zaoral The circulation of gold in late medieval Italy in the light of coin
hoards 305Tony Moore Financial flows in the medieval Mediterranean from the libri di
cambio of Francesco di Marco Datini of Prato, 1388-1403 305Ioanna Iordanou The charity of the poor: some insights from the Maritime Folk of
late Renaissance Venice 306III/G EUROPEAN ECONOMY IN THE 20TH
CENTURY Simon Mollan & Philip Garnett
Connections and comparisons between British banking and international mining firms, 1900-78 – preliminary findings 308
Tobias Jopp Did the Central and Allied Powers form credible alliances in World War I? 308
Samuel Williamson & Enrico Berkes
Fifty years of revisions in the official estimates of GDP for the UK and their impact on the interpretation of postwar economic performance 309
IV/A DYNAMICS OF SOCIAL AND HUMAN CAPITAL IN FINANCE Catherine Schenk Gentlemen and players: regulation and self-regulation in
international banking in the 1970s 310Gerarda Westerhuis New beliefs at the top: mapping the changing backgrounds of Dutch
bankers, 1950-2007 310Eiji Hotori Japanese financial elites for banking supervision in the Ministry of
Finance, 1927-98 311Mikael Wendschlag The ‘regime context’ of banking supervisors’ competence: the
Swedish case over the twentieth century 312IV/B INEQUALITY AND LIVING STANDARDS Jonas Helgertz & Martin Dribe
Long-term class and income mobility in Sweden: a three generation approach 313
Michael Pammer Income inequality in Imperial Austria, 1911 313Eric Schneider Foetal health stagnation: have health conditions in utero improved
in the US and western and northern Europe over the past 150 years?
314
Alexander Moradi et al.
African living standards under the French Empire: evidence from recruits to the Tirailleurs Sénégalais 316
IV/C WORK AND MARRIAGE Beatrice Moring Were all widows poor-widows? Family and work or poverty and
isolation 317Maria Stanfors Was there a marriage premium among workers in the late
nineteenth-century manufacturing industry? 317Michael Wyrwich Sources of spatial differences in labour force participation of
women: historical evidence for Germany 318Pamela Schievenin Women, work, and identity in postwar Italy: the case of Emilia-
Romagna, 1945-70 319

Contents
vi
IV/D HOW THE GRAIN MARKET FUNCTIONED: LOCAL, NATIONAL AND INTERNATIONAL EVIDENCE Liam Brunt & Edmund Cannon
The economics of grain storage in England, 1663-1846 320
Martin Uebele et al. The economics of grain storage in England, 1663-1846 320Giovanni Federico et al.
European goods market integration in the very long run: from the Black Death to the First World War 322
Vincent Geloso & Paul Sharp
Globalisation and empire: market integration and international trade between Canada, the United States and Britain, 1750-1870 322
IV/E BRITAIN AND CARIBBEAN SLAVERY Nick Draper The British state and slave-owners: George Baillie, merchant of
London and St Vincent, and the Exchequer loans of the 1790s 324Chris Evans Metals in the Atlantic slave trade, their European origins and
African impacts 325Ahmed Reid The British West Indian economy after the American Revolution
326David Ryden The Society of West India Planters and Merchants in the Age of
Emancipation, c.1816-35 326IV/F URBAN DISAMENITIES Jeremy Boulton & Romola Davenport
Standards of living and urban mortality in the first phases of British industrialization, 1750-1850 328
Walker Hanlon The impact of industrial pollution on city growth: lessons from the ‘Dark Satanic Mills’ 328
Jessica Bean et al. The impact of commuting and mass transport on the London labour market: evidence from the New Survey of London Life and Labour 329
Marguerite Dupree et al.
The costs of infection control in British hospitals, c.1870-1970 330
IV/G NEW DIRECTIONS IN IRISH ECONOMIC AND SOCIAL HISTORY Seán Lucey Institutionalisation and Ireland’s past: policy implications and the
role of historians 331Matthias Blum et al. Will someone please think of the children: the long-run impact of
the Great Famine on physical and cognitive wellbeing in Ireland 331Richard Grossman et al.
Long-run patterns and shifts in wealth: insights from Irish share prices since 1825 332
Economic History Society Annual Conference 2015: call for Academic papers 333 Economic History Society Annual Conference 2015: call for New Researchers’ Papers 335

Welcome
vii
Welcome to the University of Wolverhampton, Telford The roots of this institution of higher education lie in the growth of Mechanics Institutes that provided vocational and general education for working men in the nineteenth century. In Wolverhampton the Free Library (1870) developed technical, scientific, commercial and general classes while a School of Art, established in 1851, developed into the Municipal School for Art in new buildings by 1885. By 1903, there were courses in coach building, house painting and pattern making. By 1905 ‘student scholarships’ were being offered to ‘prized’ students. The Deanery House in Wulfruna Street was bought in 1912 and the foundation stone of the major new buildings in Wulfruna Street was laid by Prince George in 1931.
Thus the ‘Wolverhampton and Staffordshire Technical College’ was born. The annual report in 1933 notes that the college “makes ample provision for the general education of young men and women not privileged to obtain their higher education by residence at a University”. A total of 2,921 students were recorded on the annual statement for 1938/9 to government. One third of those students were women. The 1950s saw the first computer arrive in the college. For 1956-7 the annual report records that the college, in competition with eight other colleges, was offered the gift of an Electronic Digital Computer. A number of local firms donated money to cover the cost of maintenance and operation.
By the late 1950s student numbers had reached 6,236. This included trainee teachers and parallel developments at Wulfrun College set the foundations for the creation of the Faculty of Education in 1977. By 1964, with the further expansion of Higher Education, the college began to provide BA degrees with options in English, Geography, History, Music, and Economics amongst others; a degree in Computer Technology was added a year later.
The college became a Polytechnic in 1969 and its five faculties were: Applied Science, Art and Design, Arts, Engineering and Social Sciences. During the seventies, Wolverhampton was attracting students from Iran, Malaysia and Nigeria, many studying on engineering, business and computing courses. Around the same time, academic delivery overseas began to flourish, with the Faculty of Art and Design entering into academic exchange programmes with Alfred University, New York, and the Faculty of Education undertaking consultancy work in Egypt.
Mergers with Teacher Training Colleges, in Wolverhampton and Dudley in the 1970s, and in Walsall in 1989, played a part in the institution’s expansion, and in 1992, with a new campus in Telford under construction, it was granted University status. By 2008 the University had some 23,000 students on four campuses and in 2013 the University of Wolverhampton celebrated a landmark year – its 21st anniversary. At present four faculties offer courses in over 70 different subjects and over 4,000 students graduate from Wolverhampton each year.
Alas, you are unlikely to experience the joys or indeed the downsides of a multi-campus university whilst attending this year’s EHS conference. Except for a Saturday escape to Ironbridge, the conference will take place at Telford Campus, with its short distances, modern facilities and peaceful views. Do not expect to find old buildings – though Priorslee Hall, adjacent to the bar, would qualify – instead, resolve to spend some time before or after the conference visiting Ironbridge and the Gorge, home to the foundry works of the three Abrahams of the Darby family – and much more besides.
We hope you will enjoy your stay and, of course, we hope you will enjoy this year’s conference! Karin Dannehl (Local Organizer) Maureen Galbraith (Administrative Secretary, Economic History Society)

Conference Programme
viii
Summary Conference Programme (See Contents for details of each session)
Friday 27 March
0915-1045 EHS Publications Committee Meeting Cherry SC2161045-1345 EHS Council Meeting Aspen SC2091200-1700 Registration Foyer, SA building
1400-1530 New Researchers’ Session I I/A Medieval and Early Modern Market Trade Ash SA063 I/B Labour and Living Standards Birch SA064 I/C Money Supply and Credit Cedar SA067 I/D Working and Living in the United States Beech SC207 I/E Business and Retailing Hawthorn SC208 I/F Education, Industry and Investment Juniper SC213 I/G Fiscal Policy SB115 1530-1600 New Researchers’ Poster Session Dining Room/Classroom SA053 1530-1600 Tea Thomas Telford Dining Room, SA building
1600-1730 New Researchers’ Session II II/A Early Modern Manufacturing Ash SA063 II/B Long Distance Trade in the 19th and 20th Centuries Birch SA064 II/C Economic Lives in 20th-Century Asia Cedar SA067 II/D Industry in the 20th Century Beech SC207 II/E Economic Regulation Hawthorn SC208 II/F Social Status, Conflict and Patronage Juniper SC213 1730-1830 Open meeting for women in economic history Birch SA0641815-1900 Council reception for new researchers & 1st time delegates SB1151900-2015 Dinner Dining Room2030-2130 Plenary Lecture: Barrie Trinder
Reflections on the industrial revolution in Shropshire LT, SA102
2135-2145 Meeting of new researcher prize committee Cedar SA067Bar available until late Priorslee Lounge
Saturday 28 March
0800-0900 Breakfast Dining Room 0900-1045 Academic Session I I/A Financial Crises Ash SA063 I/B Long Term Changes in Income Inequality Birch SA064 I/C Occupational Structure, Population Geog. & Technological Change Cedar SA067 I/D Famine, Living Standards and Institutions Classroom SA052 I/E The British Atlantic Economy Beech SC207 I/F Production and Exchange in Early Modern Europe Hawthorn SC208 I/G Agricultural Crisis and Land Reform in Spain Juniper SC213 1045-1115 New Researchers’ Poster Session Dining Room/Classroom SA053 1045-1115 Coffee Dining Room

Conference programme
ix
1115-1300 Academic Session II II/A Shareholders and Firms in the UK, late 19th and 20th centuries Ash SA063 II/B Geographies, Borders and Institutions: Italy’s Regional Divide Birch SA064 II/C Postwar Britain Beech SC207 II/D Structural Change in the Global Economy Cedar SA067 II/E Early Modern Industry Classroom SA052 II/F Estate Management and the Late Medieval Economy Juniper SC213 II/G Ideology and Pragmatism in Economic History Hawthorn SC208
1300-1400 Lunch Dining Room
1415-1600 Academic Session III III/A Spending and Financing War Ash SA063 III/B History & Policy Roundtable: Thomas Piketty on Capital & Inequality Beech SC207 III/C Working in the Industrial Revolution Birch SA064 III/D Institutions and Divergence Cedar SA067 III/E Emotions & the Economy in Early Modern Europe* Classroom SA052 III/F Financial Flows in Medieval and Renaissance Italy Juniper SC213 III/G European Economy in the 20th Century Hawthorn SC208 *Women’s Committee Session
1600-1615 New Researchers’ Poster Session Dining Room/Classroom SA053
1600-1615 Tea Dining Room
1615-1715 Economic History Society AGM Beech SC207 1800 Coach transfer to Ironbridge Gorge Museum** 1830-1945 Conference Reception The Museum of Iron
(Kindly sponsored by the University of Wolverhampton) 2000-2200 Conference Dinner Enginuity 2230 Coach transfer to University of Wolverhampton (Telford Campus) **Only for those delegates who have booked, and paid for, the conference dinner
Bar available until late Priorslee Lounge
Sunday 29 March
0800-0900 Breakfast Dining Room 0930-1130 Academic Session IV IV/A Dynamics of Social and Human Capital in Finance Ash SA063 IV/B Inequality and Living Standards Birch SA064 IV/C Work and Marriage Cedar SA067 IV/D How the Grain Market Functioned Classroom SA052 IV/E Britain and Caribbean Slavery Beech SC207 IV/F Urban Disamenities Juniper SC213 IV/G New Directions in Irish Economic & Social History Hawthorn SC208 1130-1200 New Researchers’ Poster Session Dining Room/Classroom SA053 1130-1200 Coffee Dining Room
1200-1315 Tawney Lecture: Professor Martin Daunton
Contesting Reconstruction: remaking the global economic order after 1945
LT SA102
1315-1415 Lunch Dining Hall1315-1515 Careers and Publishing Session for New Researchers*** Beech SC207
***A sandwich lunch will be provided for attendees.

Guide to conference arrangements
x
Brief guide to conference arrangements The conference will take place at the University of Wolverhampton’s Telford Campus, a modern 23-acre semi-rural site, where the Grade I listed, eighteenth-century mansion, Priorslee Hall, can be found. Telford is a large new town, located in the Midlands, approximately 30 miles west of Birmingham. The campus is a 10-minute bus or taxi ride away or 15-20 minute walk from the town.
The nearest shop and ATM (cash machine) are a 5-minute walk from the campus. A vending machine, which offers hot and cold drinks and cold snacks, is located on campus.
Conference accommodation on campus
Ensuite accommodation will be provided in student accommodation located in close proximity to the conference venues. A toiletry pack will be provided in delegate bedrooms. A campus map can be found at: http://www.wlv.ac.uk/media/wlv/pdf/maps/uow_telford_campus.pdf
On arrival, residential delegates should check in at Main Reception in the SA Building where keys will be available from 13:00 onwards; reception is open 24/7; a luggage storage facility will be available for delegates arriving before that time. Check out time is 10:00. Registration
Registration will take place between 12:00 and 17:00 in the foyer of the SA Building. The registration desk will be staffed for the duration of the conference. Car parking
Delegates may park, free of charge, in any of the car parks on the campus.
Book displays
Publishers’ and booksellers’ displays will be located in Classroom SA053 adjacent to the Thomas Telford Dining Room where teas/coffees will be served. Meals and Morning Tea/Afternoon Coffee
All meals, with the exception of the Saturday conference dinner, will be served in the Thomas Telford Dining Room. Teas/coffees will also be served there.
Saturday Conference Reception and Dinner
The Saturday evening conference reception and dinner will be hosted in the ‘Museum of Iron’ and ‘Enginuity’ at the Ironbridge Gorge Museum. Coaches will be arranged to transport delegates (who must have pre-booked and paid for dinner) to and from the campus. Bar
The delegate bar will be in Priorslee Lounge & Bar on the campus. Meeting rooms for New Researchers, Academic Sessions etc
All meeting rooms for academic, plenary and new researcher sessions will be located in the SA and SC buildings. The conference will, for the first time, host new researcher poster sessions, which are scheduled alongside tea/coffee breaks.

Guide to conference arrangements
xi
Internet Access
Wi-Fi is available throughout the campus, including in delegate bedrooms.
Social Media
Social media is increasingly used to share thoughts and ideas about and during academic conferences. As for the 2014 conference, the Public Engagement Committee would like to encourage the use of the following hashtag in the days before and during the annual conference in Telford: #EHS2015 Caveats: Unless expressly invited by the presenter, commentary online throughout the presentation is discouraged by the Society. Tweeters are asked to confine commentary until the period for questions and/or breaks.
Useful Contacts
Telford reception: Tel: +44 (0) 1902 323 900 Karen Skillen Tel: +44 (0) 1902 321 533 Email: [email protected] Maureen Galbraith Tel: +44 (0)141 330 4662 Email: [email protected] Local Taxis
Central Taxis Tel: +44 (0) 1952 501 050 Email: [email protected] Diamond Cars Tel: +44 (0) 1952 222 222 Email: [email protected] Royal Cars Tel: +44 (0) 1952 299 299 Email: [email protected]

How to reach the University of Wolverhampton (Telford)
xii
How to reach the University of Wolverhampton (Telford) Comprehensive information on travelling to the University of Wolverhampton’s Telford campus can be found by following the links at: http://www.wlv.ac.uk/about-us/contacts-and-maps/all-maps-and-directions/map-and-directions-for-telford-innovation-campus/ By road
Approaching from the east (including Birmingham and Wolverhampton), leave the M54 at Junction 4 and take the A4640 (previously the B5060) Castle Farm Way. At the first roundabout, turn left onto the A5 Telford Way (also known as St George’s bypass), then at the Priorslee roundabout take the second exit on to Shifnal Road. The campus entrance is a short drive on the left-hand side.
Coming from the west (including Shrewsbury and Wales), leave the M54 at Junction 5 and take the A5 Rampart Way. Go straight over the interchange on to the A5 Telford Way, cross over the motorway, and at the Priorslee roundabout take the Shifnal Road turning. By Rail
The nearest railway station to the campus is Telford Central. Direct trains run from Birmingham (30-35 minutes), Wolverhampton (15-25 minutes) and stations on the Shrewsbury line. There is a regular service from London Euston to Wolverhampton (1 hour 50 minutes). There is a taxi service to the campus from the railway station. Detailed travel information and timetables can be found at: http://www.nationalrail.co.uk/default.aspx By Bus
There is no direct bus service to the Campus. By Air
The campus is 45 miles from Birmingham Airport. There is a direct train service from Birmingham International Airport to Telford (journey time approximately 1 hour). London Heathrow has many more flights. Information on bus transfers to Telford can be found on the National Express website (www.nationalexpress.com/).

How to reach the University of Wolverhampton (Telford)
xiii
An interactive map can be found at: http://www2.wlv.ac.uk/interactive-map/telford/
University shuttle bus stop
S Staff parking
R Resident parking
P Public parking
Disabled parking available
R
R
P
P
P
P
S
RSG
RSH
RSF
RSE
RSD
RSC
RSB
RSA
RSI
RSJ
RSK
RSL
RSM
RSN
Sports Field
TennisCourt
Shifnal Road
Telford Campus
Map correct as of 14 June 2013, to report any issues please email [email protected]
SE
SH
SA
SB
SC
SC
MainReception
SA BuildingMain Reception | GO Deli | Teaching Rooms | ThomasTelford Dining Room | Conference Rooms | LearningCentre | Lecture Theatre | Campus Operations | BusinessCentre | Innovation First
SB BuildingCentre for International Development and Training |nTails | Incubation Unit | Visualisation Centre
SC BuildingSchool of Technology (STECH) | Teaching Rooms | ITFutures | Conference Facilities
SE: e-Innovation Centre
SH: Priorslee HallPriorslee Hall Conference Centre | Priorslee Lounge andbar


NEW RESEARCHER PAPERS


New Researchers - Session I / A
1
Supplying without specializing: landlords, peasants and work-horses in medieval England
Jordan Claridge, University of Cambridge
([email protected]) Supervisor: Professor Mark Bailey
This paper aims to shed light on a significant question in the history of medieval English economic development: where did the agrarian economy of medieval England acquire its work-horses? The diffusion of horse-power is recognized to have been a major factor in the development of the medieval English economy, increasing labour productivity in farming and the efficiency of overland transport.1 While the horse trade of early modern England is well-documented,2 for the medieval period, we still know very little about where, or how, medieval landlords – the great medieval agriculturalists – obtained their horses.3 The infrastructures through which these animals were produced and distributed have remained poorly understood.
A central question is where work-horses might have come from geographically. The relatively low prices fetched for farm horses4 would seem to mitigate against transportation over any great distance, as the costs of transport alone could be prohibitive. Therefore, work-horses must have been largely procured domestically. But who was producing them? Why did individuals or institutions choose (or choose not) to produce horses for market consumption? We know much about the changing market orientation of demesne farming in this period,5 and how geographical constraints could influence the shape and scope of agrarian enterprises.6 Whether peasant or landlord, the decisions about what products to produce would have been carefully considered and tailored to the strengths and weaknesses of available land as well as environmental conditions and the prevailing state of the market, both on a national scale and locally.
There are few medieval sources that directly document the horse trade in medieval England. In the absence of such evidence, a disparate array of material must be assembled in an effort to ‘peer around corners’ in locating the source of these essential engines of economic development. To accomplish this, this paper will analyse both the seigniorial and peasant sectors of medieval England using a national sample of over three hundred manorial accounts to explore the role of seigniorial demesnes (the home farms of lords) in supplying work-horses before going on to examine the peasantry, through the use of extant tax records. The seigniorial sector
Map 1 shows the coverage of the national sample of manorial accounts from c.1300 used for this study,7 while figures 1 and 2 show how demesnes in this sample acquired working horses.
1 See: Langdon, ‘The Economics of Horses and Oxen’, 31-40; Langdon, ‘Horse Hauling’, 37-66. 2 Thirsk, Horses in early modern England; Edwards, The Horse Trade of Tudor and Stewart England. 3 Campbell, English Seigniorial Agriculture, 126, n.45; Langdon, Horses, Oxen, 272-3, 287-8. 4 In large part due to dietary proscriptions of horse meat. See: Claridge, ‘England’s Sacred Beast?, 31-36. 5 Campbell, Seigniorial Agriculture; Stone, Decision Making; Slavin, Bread and Ale. 6 For example: Bailey, A Marginal Economy? 7 A sample of manorial accounts was chosen concentrated on the years around 1300, effectively encompassing
the entire decades of the 1290s and the 1300s. Only one account per manor was taken, normally that closest to the year 1300, to ensure that no ‘double counting’ occurred within the sample. The end result was a sample of 322 accounts, and hence manors, which form the basis of this examination of seigniorial involvement in the horse trade.

New Researchers - Session I / A
2
Map 1: National sample and regional distribution of manorial accounts
The coverage of the sampled manors across the country is uneven, being heavily
skewed to the south and east of the country with notable ‘empty’ areas such as the forest area of the Weald south of London, the extreme southwest (Devon and Cornwall), and the northern and western areas of the country generally. However, this distribution correlates broadly with the distribution of population and levels of relative economic development at that time, so the sample can be taken to be reasonably representative of the English economy as a whole. See: Campbell, ‘Benchmarking medieval economic development’, 896-948 (including corrigendum), esp. table 14, col. C (p.926).

New Researchers - Session I / A
3
Figure 1 illustrates that demesnes in the sample added a total of 448 new horses and shows a clear hierarchy of horse acquisition methods. Purchases were the major method of procurement by a significant margin, meaning that the market for horses was both well-established and easily accessible to demesne managers by 1300. This is seemingly a banal point, but one that underlines unequivocally the importance of a horse market in supplying English demesnes around 1300, as, significantly, demesnes did not breed a sufficient number of animals to sustain their own demand, let alone supply the market. Breeding was in fact a tertiary form of horse procurement for demesnes behind purchase and feudal perquisites like heriots (death dues) and the seizure of ‘stray’ horses.
While the national sample shows a clear hierarchy of horse acquisition methods, their profile varied considerably from region to region. East Anglia and the Thames Basin stand

New Researchers - Session I / A
4
out as the most prolific regions for demesne horse purchases, as over 70 per cent of new work-horses in both regions were purchased. Purchasing was somewhat less dominant in the South and South-west where only 48.9 per cent of horses were purchased, and was weakest in the Midlands, as only 36.9 per cent of new horses in the region were acquired via the market. The tendency of demesnes in East Anglia and the Thames Basin to purchase horses over other means of acquisition is closely linked to high levels of commercialization in these areas and also the degree to which demesnes in these regions shifted from oxen to horses as draught animals around the year 1300.8 Horse breeding was especially unimportant here, as the commercial force of London as well as the high market density of East Anglia meant that farmers would have been compelled to specialize in the production of other goods which would benefit most from close market proximity.9 The peasant sector
If demesnes were clearly not supplying the market for work-horses, the peasant sector must be examined as a potential source of these animals. Some anecdotal references suggest that peasants were engaged in horse breeding, rearing and marketing. For example, in 1310-11, the demesne of Fletchampstead in Warwickshire bought two young horses from a peasant of the same manor.10 Demesne purchases of stock from the local community were a seemingly common occurrence, as Framlingham castle and the demesne of Loudham also acquired livestock from local individuals.11 A thirteenth-century parable also tells a story about a peasant woman who planned to use the profits from a range of different activities to eventually purchase and raise a young horse,12 reinforcing the idea that horse rearing was a widely-accepted peasant activity in the medieval world. Just how common was peasant horse rearing? Where did this kind of activity fit within the household and family economies of medieval peasants? To address this question more systematically, a case study using tax records from the 1283 lay subsidy in Blackbourne Hundred, which enumerate peasant livestock, is laid out below. The distribution of peasant horses, along with that of our demesne sample is given in table 1. Table 1: Composition of horse ownership on demesne sample c.1300 and 1283 Blackbourne
Hundred
Demesne Sample
%
Blackbourne Hundred
%
Plough Horses 1450 56.3% 358 28.0% Young Horses 403 15.6% 184 14.4% Cart-horses 397 15.4% 4 0.3% Mares 249 9.7% 641 50.2% Equi 66 2.6% 88 6.9% Veredes 0 0.0% 2 0.2% Rouncies 5 0.2% Mill Horses 4 0.2% Stallions 2 0.1% Total 2576 100.0% 1277 100.0%
Sources: National Manorial Account Sample; Powell, A Suffolk Hundred in the Year 1283
While the types of horses owned by demesnes and peasants are broadly similar; where they differ is in the relative proportions of horse types. Demenses owned almost twice the 8 Langdon, Horses, Oxen, 100-111, esp. 102-3 and 108-9; 205. 9 Hatcher and Bailey Modelling the Middle Ages, 132-3. 10 [I]n ii pullo empto de quodam hominum de homagium. TNA: SC6 1040/21. 11 Bailey, Medieval Suffolk, 172. 12 The Exempla or Illustrative Stories from the Sermones vulgares of Jacques de Vitry, 154-5.

New Researchers - Session I / A
5
number of plough-horses compared to peasants, while peasant mares outnumber those of the demesne by 5:1. This suggests that Blackbourne peasants largely chose to own mares over male plough horses. This is significant, as such a high proportion of female horses would have allowed the peasant sector to breed significantly more horses than demesnes.
What breeding capacity can be projected from this large proportion of female horses? In 1283, the peasants of Blackbourne Hundred owned 638 female horses, and, in theory, this would also be the total number of viable brood mares, but medieval horse breeding was often hampered by sterility in female horses.13 If we make a modest assumption that half of these female horses were fertile, then that leaves a viable group of 319 mares. The author of the anonymous Husbandry treatise suggested that the gestation period of mares was forty-nine weeks,14 so mares could have conceivably been bred every year, but one foal per year may have been unsustainable in the long term, especially if these female horses were regularly required for draught purposes. It is perhaps, then, most sensible to assume a breeding rate of one foal every three years, mirroring the development cycle of the demesne.15 This would have allowed peasants to replace maturing horses with newborn foals while limiting the work and responsibility of maintaining and rearing to one young horse at a time. If we take the 319 mares available for breeding and project that they were bred every three years (319/3), this would result in 106 new foals bred by Blackbourne Hundred peasants every year.
This conservative projection would have created a significant surplus of peasant work-horses. The Blackbourne lay subsidy enumerated 184 peasant-owned foals, and, therefore, using the same three-year development cycle, sixty-one (184 foals/3 years) foals would have needed to be replaced each year (assuming that one-third of all young horses were reaching maturity in any given year). The projection of 106 new foals exceeds this by forty-five animals, or 74 per cent. If this figure is taken as a reasonable minimum projection of peasant horse breeding potential, the figure of 106 foals per year would have been sufficient to create a surplus of horses that could have not only maintained the horse stocks of the Blackbourne peasantry, but, paralleling the anecdotal evidence above, also supplied local demesnes and the wider market as well. This reveals the breeding potential of Blackbourne peasants as a whole, but the subsidy material can provide further insight into how horse breeding was organized within the heterogeneous group of Blackbourne peasants. Figure 3 illustrates the relationship between total taxable wealth against the value and number of horses owned. The number of horses owned by each individual, which ranged from one to twelve animals, is represented by the size of the bubble plotted at each coordinate. The majority of peasant horses in the sample were low-value animals with owners of relatively humble means. 682 of the horse owners in the sample (84.2 per cent) had total moveable property valued at less than 100s. and 10s. or less invested in horses.
In figure 4 peasants taxed in the 1283 subsidy are divided into quartiles according to total taxable wealth. Here, profiles of horse ownership for each segment become clear. The most striking aspect of this analysis is the different proportions of mares owned by peasants in the four quartiles. Compared to other types of horses, proportions of mares were highest in the first quartile (least wealthy peasants) and less plentiful in each successive quartile. Mares accounted for over two-thirds of all horses in the first quartile, but comprised 57 per cent for the second quartile, 51 per cent for the third and only 39 per cent for the wealthiest Blackbourne peasants. The poorest peasants had a tangible preference for mares over other types of horses, while wealthier peasants owned a greater number of male plough horses.
13 Stone, Decision Making, 114. 14 Oschinsky, Walter of Henley, 427. 15 Demesnes almost universally graduated young horses to the ranks of working stock at the end of their third
year.

New Researchers - Session I / A
6
Traction requirements significantly informed peasant decisions about horse
ownership. With the lay subsidy data broken down village-by-village, a remarkable polarization in terms of horse type emerges. Peasants in the villages of Wordwell, Honington, Ingham, Fakenham Magna and Culford, all of which lay within the Breckland region of East Anglia, characterized by small proportions of arable land and vast tracts of low-grade heathland pasture,16 had an extremely strong tendency to own mares over other types of horse, with female horses accounting for three-quarters or more of all peasant horses in these villages. On the opposite side of the spectrum, the proportions of mares were much lower in villages like Norton and Ashfield Parva, where mares comprised only 24.0 and 12.9 per cent
16 Bailey, Marginal Economy, 35-6.

New Researchers - Session I / A
7
of peasant horses. These vills lay on heavier loams at the other end of the hundred, where tracts of heath and pasture were much smaller. This polarization implies that female horses, and therefore the vast majority of breeding capacity, were concentrated in specific villages. Peasant-bred horses likely flowed from these places to other localities and perhaps even to more distant markets.
The differences in soil type and pasture had two significant implications for horse breeding and rearing. First, ploughing on the Breckland’s light soils would have been less onerous than on the loams, which did not require the strength premium of male plough horses and could be accomplished with mares. Second, the vast heathlands with extensive common rights to graze horses provided ample and excellent pasture ground to rear horses. Indeed, peasant ownership and grazing of sheep on these heaths was much more tightly regulated than was the case for horses, and this would have encouraged the peasantry to focus upon equids.17 Mares could cope with ploughing the light and easily-tilled soils at the heart of the Breckland and young horses could be reared on the surrounding heaths. The by-product of soil type and available heaths was the ability for these communities to act as horse-breeding hubs.
This paper has illustrated that the seigniorial sector did not produce enough horses to meet their own needs, let alone supply the market. It also suggests that the peasantry had significant capacity for creating horse surpluses that likely supplied animals to a market patronized by both demesnes and other peasants alike. However, peasant horse breeding was not concentrated in the upper echelons of the peasantry, but was rather spread throughout the ranks of individuals. Taking the evidence on face value, horse breeding and rearing on peasant farms was not a strong specialism, but was rather an adjunct to a regime of mixed farming, that is, in concert with the cultivation of crops. In the pre Black Death period, most peasant holdings were relatively small, perhaps less than fifteen acres on average.18 In East Anglia, where our lay subsidy sample is derived, the average peasant worked an even smaller parcel of land, averaging less than five acres in size.19 The small size of these holdings likely discouraged any kind of specialization in horse breeding among the peasantry, but this did not deter all breeding activity. With the small average size of holdings, most peasant farms would not have the need or the means to employ more than one or two horses, so any extra animals were likely to have been sold on to neighbours. The capital investment in owning a horse was relatively low; the decision to invest likely was chiefly due to productivity gains that horses provided as draught animals, but the distribution of mares and foals suggests that breeding capacity was a secondary factor in peasant horse ownership, especially on more modest holdings. The breeding of horses does not seem to have been a specialist endeavour, but rather an ancillary activity, with households engaging in horse breeding as a way to maintain their own stocks, but also to supplement family income through the sale of surplus animals. In this respect, peasant horse breeding might be seen as similar to brewing, in terms of a supplemental economic activity defined by low capital requirements and modest profits.20 For a full-length version of the paper with full references, please email Jordan Claridge at the address above.
17 Ibid., 65-85; Bailey, ‘Sand into Gold’,41-55. 18 See Kominsky, Studies in the Agrarian History of England in the Thirteenth Century, 216, 223; Postan,
Medieval Economy and Society, 143-5. 19 Campbell, ‘Population Change and the Genesis of Commonfileds on a Norfolk Manor’; Miller and Hatcher,
Medieval England, 144. 20 See: Benett, Ale, Beer and Brewsters, 21.

New Researchers - Session I / A
8
Integration and disintegration in the Ottoman wheat markets: trends and causes, 1660-1840
Pinar Ceylan, London School of Economics
([email protected]) Supervisor: Dr Patrick Wallis
A wide-ranging corpus of literature on market efficiency and market integration has emerged within recent decades, as focus has shifted to institutions and markets in explaining long-term economic growth. Whether there was a discrepancy between the Western and the non-Western worlds in terms of the extent of market development, and whether it led to divergence in economic performances across different parts of the world are highly relevant questions. Despite this, the non-Western world has attracted scant attention within this literature, militating against any sound assessment and comparison. This paper aims at providing insights from the Ottoman Empire by drawing the general trends and discussing causes of integration and disintegration in the wheat markets from 1660 to 1840.
The seventeenth century, in the Ottoman Empire, like many parts of the world, was marked by ‘crisis and recovery’. This century was a period of political difficulties, social unrest and economic turmoil for the Empire. In the first half of the seventeenth century, a series of rebellions known as ‘Celalis’ swept the countryside, destroying the relatively well-developed Ottoman urban networks supported by the “precocious imperial centralization” of fifteenth and sixteenth centuries (Faroqhi, 1997). The period under study begins with the late seventeenth century, in which the economic and social life in the Ottoman realm showed signs of recovery, with re-settlements to depopulated regions, an increase in agricultural production, growth in certain sectors of the economy, and the unification of monetary zones. The extent of the recovery remains unknown, but it can be assumed that it was restricted by the long wars on the European frontier and fiscal difficulties resulting thereof.
The first half of the eighteenth century was an era of relative peace, stability, and economic expansion. Emergence of new trade nodes in the Ottoman urban network, maintenance of security of the trade routes by the local elites, and spread of commercial agriculture should have contributed to the integration of the domestic markets. This period however, came to an end with the decades of war, fiscal difficulty, inflation, and rising insecurity in the countryside in the 1760s (Faroqhi, 1997). Declining tax revenues, together with increasing exigencies of warfare, provoked state interference in markets. This intervention often took the form of price ceilings, trade regulations, internal tariffs and state’s command over resources (Quataert, 1997). Despite the frequent debasements and high inflation of the early 1800s, the Ottoman economy experienced a second wave of expansion towards the mid-nineteenth century, as it increasingly integrated into the world economy. Was the period of economic expansion that lasted from late seventeenth to eighteenth centuries accompanied by increasingly integrated commodity markets? How did the picture change with the economic retraction and increased state interference in the later part of the century? What was the role of administrative decentralization and of wars on the market integration process? These are the questions to be explored in this study.
The price data employed in this study comes from both primary and secondary sources. Wheat price series for Manisa and Ayntab are constructed based on inheritance inventories that are available in court registers. Wheat prices for five additional cities, Istanbul, Edirne, Konya, Cairo, and Bursa are included from secondary sources. Istanbul, Edirne, and Konya prices are taken from Pamuk’s (2000) study, which rely mainly on waqf account books.21 Cairo and Bursa wheat prices are coming from Raymond (1973) and Ozturk (1994), both based on court registers. 21 I provided a comparison between the waqf account books prices and inventory prices in a yet unpublished

New Researchers - Session I / A
9
In measuring the degree of market integration, historians employ a variety of methodologies. Here, converging prices rather than measures of market efficiency are taken as the most crucial indicator of integrating commodity markets. Convergence (or divergence) in prices is estimated by looking at the trends in bilateral (city pair) relative prices. Absolute values of log-linear pairwise price relatives are aggregated through a fixed effects panel regression model employing 18 dummy variables for each decade between 1660 and1840. This method is preferred as it allows controlling for the cross-sectional differences, such as distance, market size, etc. across city pairs. I computed 15 city pairwise relative prices from seven markets (Istanbul, Manisa, Ayntab, Edirne, Bursa, Konya, and Cairo).
Figure 1: Pairwise relative prices in seven Ottoman cities
Sources: Istanbul. Konya, Edirne from Pamuk (2000); Cairo from Raymond (1973); Bursa from Ozturk (1994); Manisa and Ayntab from inheritance inventories available in the court registers.
The results are presented in figure 1. It is assumed that as relative prices move towards
1, markets integrate and as the price relatives move away from 1 markets disintegrate. The findings suggest that the Ottoman wheat markets did not experience long-term integration in the period 1660-1840. Yet, three episodes of integration and disintegration can be identified. After climbing in the last decades of the seventeenth century, the relative prices steadily declined until the end of the 1750s and catch the initial level of 1.3. From this point onwards, prices continuously diverged until the end of the period.
The story of market integration is in tandem with the ups and downs of the overall economy. The period of expansion in the first half of the eighteenth century is also one of market integration and the period of retraction in the later part of the century is one of disintegration. Yet, at this point of research it is difficult to say, which one is the chicken and which one is the egg. Looking at short-term trends in price dispersion might be deceptive, when commenting on the gains of integrating markets. For integrating markets to foster growth through efficiency, allocation and scale effects, sufficient time is required for the structural changes in the economy. Therefore, only steady and long-term integration processes
article. I demonstrated that these two series are moving together and are very close to each other, despite the fact that waqf prices were slightly higher than inventory prices. Therefore, it can be safely assumed that the price data employed in this study is coherent, although it is extracted from different sources.
New Researchers - Session I / A
10
are noteworthy in terms of the link between market integration and growth. In the short term, it is more probable that the causality ran from growth to market integration. Increase in marketable surplus might have caused integration through allowing higher trade volumes, or during periods of economic retraction, state interference in markets imposed by declining state revenues might have distorted the market mechanism and thus, resulted in price divergence.
A second interesting point is the overlap between the Ottoman administrative decentralization and the episode of integration in the first half of the eighteenth century. The seventeenth and eighteenth centuries witnessed the rise of provincial elites who held the local power and who operated autonomously of control from the capital. Almost in all parts of the Empire, the central state became visibly less important. However, recent studies argue that eighteenth century Ottoman decentralization should be seen as an ‘alternative strategy to modern state’ rather than a decline of the state power. Provincial elites were not rebelling against the central authority in seeking local power. Until the Russo-Ottoman war of 1768-74, the relationship between the provincial elites and the centre was one of mutual recognition and interest; and it depended on negotiation and balance of power (Salzmann, 1993). In line with this revisionist argument, the results of this study suggest that the life term tax-farming system and decentralization of administrative power generated dynamics of integration during most of the eighteenth century. Provincial elites played an important role in the rising domestic markets, through creating greater safety and stability in their region, making local investments, retaining the local surplus (rather than sending it to the centre), and acting as agents in trade, international and domestic.
The second part of this paper discusses the dynamics of, and impediments to, the integration of Ottoman domestic markets. In explaining changes in price differentials I use the Fixed Effects Panel Regression with Vector Decomposition (FEVD), which is a fixed effects linear regression model developed by Plumper and Troeger. The model allows the employment of time invariant and rarely changing variables that differ across groups as well as time-varying variables. (Log) pairwise relative prices are regressed against variables indicating distance between city pairs, market size, involvement of sea transportation, asymmetrical shocks, security of trade routes, etc. PRijt= β0 + β1DISTANCEij + β2SIZEij + β3 SEAij + β4 CAPITALij + β5PLAGUE (1) + β6DROUGHT + β7UPRISING + β8DEBR + β9TARIFF + β10 BANDITRY + β11 WARS + u
As many studies on market integration, this study assumes that the size of the two comparing markets is positively associated with the intensity of trade and negatively associated with the price gaps – and vice versa for distance. DISTANCE is air distance in 1000 km between the city pairs and SIZE is a categorical variable for the total population size of the comparing markets. CAPITAL is a dummy variable indicating Istanbul being one of the city pairs. Provisioning the capital was a major concern for the Ottoman statesmen. Trade relations of the city were facilitated by the state policies. Therefore, the pairwise markets that involve Istanbul are expected to be better integrated compared to the other pairs. The SEA variable indicates the involvement of sea transportation between two markets. It is incorporated in the model, in order to control for the differences in the costs of sea and land transportation.
WARS is a dummy variable for war years. Wars disrupted commerce during the times of fighting, making it dangerous to move goods across and sometimes within the borders. But they also exercised an indirect impact on trade, as the exigencies of warfare provoked the Ottoman state’s intervention in markets. Price relatives are expected be higher in war years. Resulting in asymmetrical fluctuations in local prices and causing disturbances in flow of goods, external sporadic shocks lead to price divergence without permanently altering the shipping costs. DROUGHT, PLAGUE and UPRISING are dummy variables for years of drought, plague epidemic and urban unrest, which were the most important shocks that could

New Researchers - Session I / A
11
affect prices and trade. Under the conditions of the limited communications technology, the adjustment to the changes in the silver or gold content of the money was not immediate. DEBR indicates debasement rates. Debasements should have resulted in discrepancies at the local money markets, which in turn created profitable price differentials across regional commodity markets. The evolution of internal tariffs is central to any investigation on market integration. However, the research on Ottoman tariff zones is very poor, making the construction of a proxy difficult. A time dummy (TARIFF) for the 1760-93 period is utilized. During this period, the internal tariff zones expanded and new ones are established. Additionally, a new tax on grain trade was imposed in 1760.
In exploring dynamics of market integration, most of the recent studies focus on the immediate causes of trading costs and often neglect the political conditions underlying the rise of efficient and integrated markets. In this paper, the level of banditry is employed as a political variable. Level of banditry is a function of the state’s ability to maintain physical security. At the same time, it is an immediate cause of price divergence, since the probability of loss due to predation is reflected in a price mark-up equivalent to a hidden tax on trade (Anderson & Marcouiller, 1999). BANDITRY indicates the number of years per decade, in which bandit activity is reported in the Anatolian court registers. It is taken as a proxy for the level of banditry. When the level of insecurity significantly rose in a region, the central state continuously sent orders to the provinces and the inhabitants submitted recurring petitions, year after year. In these situations, the control of the brigands by the state was not immediate and usually took several years. The variable constructed here gives us a measure of proliferation of bandit activity rather than individual incidents, and this is what we are interested in here.
Results
The results from the FEVD regression are reported in table 1. The outcome suggests that trade costs increased with distance, banditry, wars, debasements, and tariffs. Banditry, drought and distance are significant at 1 per cent level. Debasement rates and wars are significant at 5 per cent level and positively associated with relative prices, as expected. The coefficient of the capital dummy is again significant at 5 per cent and negative. Trade with the capital city is estimated to have incurred lower costs compared to the trade between other city pairs. Extreme climatic conditions on the other hand, led to convergence of prices across local markets, as the negative and highly significant coefficient of drought suggests. The provisionist policies of the Ottoman state might explain the situation. When an essential foodstuff was scarce in a local market to a degree to influence the ordinary life, inter-regional and international trade was encouraged and in these cases customs regulations did not apply. The coefficient of the market size variable is falsely positively correlated with the relative prices, due to the small sample size. Istanbul and Cairo are the two big cities in the sample. The coefficient is distorted by the wide price gap between Cairo and the other towns. The results provide further motivation to investigate the links between political factors and the rise of efficient and integrated markets.

New Researchers - Session I / A
12
Table 1: Determinants of relative wheat prices
Notes: Table reports FEVD estimates. Robust standard errors are in parentheses: significantly different from 0 at *** 1%, **5% and *10% level.
References
Anderson, J. E. and Marcouiller, D. (1999). Trade, insecurity, and home bias: an empirical investigation. National bureau of economic research working paper no 7000.
Faroqhi, S. (1997). Crisis and Change. In: İnalcık, Halil, Donald Quataert (Eds.), An Economic and Social History of the Ottoman Empire Volume II: 1600-1914 (Cambridge).
Mustafa Ö. (1994). Bursa’da Hububat Fiyatları (1775-1840). Paper presented at the 11th Turkish History Congress, Ankara.
Pamuk, S. (2000). İstanbul ve diğer kentlerde 500 yıllık fiyatlar ve ücretler, 1469-1998: 500 years of prices and wages in Istanbul and other cities (Ankara).
Quataert, D. (2005). The Ottoman Empire, 1700-1922 (Vol. 34) (Cambridge). Raymond, A. (1999). Artisans et commercants au Caire au XVIIIe siecle. Vol. 2 (Paris). Salzmann, A. (1993). An Ancien Regime Revisited: ‘Privatization’ and Political Economy in
the Eighteenth-Century Ottoman Empire. Politics and Society, 21, 393-393.
Dependent variable Logged pairwise relative price relativesIndependent variables Coefficient
DISTANCE
0.21*** (0.01)
WARS
0.054** (0.03)
BANDITRY
0.024*** (0.01)
DROUGHT
-0.069*** (0.03)
PLAGUE
-0.031 (0.03)
DEBR
0.273** (0.13)
UPRISING
0.008 (0.03)
TARIFF
0.055* (0.03)
CAPITAL
-0.13** (0.05)
SEA
-0.002 (0.03)
SIZE
0.05** (0.017)
N 623 R2 0.17

New Researchers - Session I / A
13
Experiencing the French liberalization experiment in Tours, 1763-75
Daisy Gibbs, University College London
([email protected]) Supervisor: Professor Julian Hoppit
My thesis addresses the issue of economic identity in Britain and France in the eighteenth century by examining the regulation of and attitudes towards the grain trade. It does not deal with the cliometrics of the trade, as have other historians and economists such as Labrousse and Bateman.22 Rather, the focus is upon changing mentalities at a time of dynamic economic growth and development. My work is chiefly concerned with national belonging and citizenship, and therefore echoes that of other historians who have examined the role of other commodities in forming or defining national identities, for instance Anderson’s treatment of print literature, or Morieux’s depiction of the shared economic interests which bridged the English channel.23
Attempting a novel approach to economic integration, this paper specifically looks at contemporary attitudes to the deregulation of the grain trade in the administrative region of Tours in north-west France, which took place after 1763. This pivotal moment saw a mercantilist conception of the nation on the part of central government collide with consumer expectations about the market, intervention, and responsibility. In a sense then, the paper deals with Thompson’s moral economy, as the so-called libéralisation removed many ancient laws which had restricted the operations of grain merchants, causing indignation and outcry.24
However, moving beyond this, the paper attempts to present a balance of history from other perspectives as well as from below, in order to generate an understanding of the forces of local allegiance and community bonds which stood against national economic integration. For, prior to 1763, it had been possible for local authorities to place tolls and even embargoes on grain leaving their jurisdiction. By 1764, however, merchants were allowed to transport grain wherever they pleased, even abroad. From its conception in Physiocratic doctrine, deregulation was politicized as a national enterprise for the public good, based in the hope that France would be united in its enjoyment of the benefits of an international export trade in grain. However, food riots became increasingly commonplace across France. In Tours no riots are known to have occurred between 1750 and 1765, but in the next fifteen years there were more than forty, mostly occurring along lines of transportation where grain was visibly on the move.
Many of the original laws were reimposed in 1772. However, the freedom of internal trade was preserved and the reinstatement of marketplace legislation did not spell the end of the troubles in Tours. This paper examines the most serious of the Tours riots which took place in 1774, by examining first the events of the riot itself, and then the reaction of local and central authorities and the punishment of the participants. It then turns to the apparent causes of the riot by investigating grain price and climate data. Finally it contrasts the grievances of the crowd with the rationale of the merchants and government.
Ultimately this paper concludes that national economic integration and the commercialization of the grain market was impeded by conscious rejection on the part of individuals and communities because of their concern, in emergencies, for local survival and 22 E. Labrousse, Esquisse du mouvement des prix et des revenus en France au XVIIIe siècle (Paris, 1933), I,
pp.1-5; Victoria N. Bateman, ‘The evolution of markets in early modern Europe, 1350–1800’, The Economic History Review, 64 (2011), pp.447-471.
23 B. Anderson, Imagined communities (London, 2006), p.67; R. Morieux, Une mer pour deux royaumes (Rennes, 2008), p.333.
24 E.P. Thompson, ‘The Moral Economy of the English Crowd in the Eighteenth Century’, Past and Present, 50 (February 1971), pp.76-136.

New Researchers - Session I / A
14
their unwillingness to participate in an unstable national economy. This, it will be argued, also had implications for experiences of nationality and patriotism, as the riots were construed by some authorities as being unpatriotic and in contempt of the national good, which, to them, required a national grain trade.
The riot in question took place over four days, from Saturday 19 to Tuesday 22 February 1774. Notwithstanding its urban setting and participants, this riot did not break with the pattern of unrest which had been established in the region over the past decade, as most of the events took place at various points on the riverbank.25 It began at Vallièrres, south-east of Tours town centre. According to the police commissioner who did not arrive on the scene until late the next day, 1,200 people had descended with ‘considerable prejudice’ on the port and pillaged three boats loaded with grain. The officer was informed that these had been forced to moor the night before by a crowd armed with pistols and sticks.26
Later that day, en route downriver to Nantes, the haulier, Pierre Touchet, complained that he was menaced by a large crowd of men and women on the left bank of the Loire near the levee by St Cyr, west of Tours centre. At the nearby church of Saint-Anne, the bells sounded.27 A woman told the officer, when he arrived, that they had not intended to pillage the grain on this boat, but that the crowd ‘could not bear to see it ferried any further’.28 They had, she implied, been forced to commit a crime to prevent a travesty. Ultimately the officers, blaming a lack of reinforcements, were forced to retreat under a hail of stones thrown by the now 2,000 strong crowd.29 The next day rioters spirited the grain away to the port of l’Ecouerie and sold it illicitly.30
Meanwhile some of the women from St Cyr made their way over the bridge towards St Avertin on the river Cher to the south of Tours. Here again the bells began to toll, bringing people from their homes to join the mob. Two more boats were pillaged, but only one man was arrested whilst absconding with a sack of grain.31 Meanwhile, the attacks on boats continued throughout the next day, with a largely male crowd attacking the boats of René le Duc. 82 barrels of flour and some wine were appropriated.32 Likewise Phillipe Marchau lost 60 barrels at Saint Symphorien on the right bank33 and Andres Badiu lost 100, whilst the rest of his merchandise suffered heavy damage.34
The crowd seemed to be convinced of the legitimacy of its actions. On the morning of 22 February, around 3,000 men and women armed with sticks and stones amassed at the prison of the maréchaussée, or constabulary, intending to free one of their number who had been arrested. They forced the church door and once again the bells rang out.35 It was the boldness of this assault on authority, and not the frustrated attacks on the boats, which finally gave the officers carte-blanche to quash the riot, rather than merely to intervene.36 Thirty sword-bearing chevaliers on horseback dispersed the crowd by firing four rounds of blanks, making 21 arrests.37
The majority of these arrests were of men, and of these, six were artisans; six worked on vineyards; two were day labourers; one was a mariner and one was himself in the haulage 25 Archives Départementales (AD) Indre-et-Loire 175B 78: Letter to the Procureur du Roi from the Provost
General of the General Constabulary of Touraine, Anjou and Maine regarding the riots, 22 Feb. 1774. 26 AD Indre-et-Loire: Process Verbal by the Commissioner of Police at Tours, 20 Feb. 1774. 27 AD Indre-et-Loire 175B 78: Letter to the Procureur du Roi from the Provost General. 28 AD Indre-et-Loire 175B 78: Testimony of Pierre Touchet, 20 Feb. 1774. 29 AD Indre-et-Loire 175B 78: Letter to the Procureur du Roi from the Provost General. 30 AD Indre-et-Loire 175B 78: Second testimony of Pierre Touchet. 31 AD Indre-et-Loire 175B 78: Letter to the Procureur du Roi from the Provost General. 32 AD Indre-et-Loire 175B 78: Testimony of René le Duc, 21 Feb. 1774. 33 AD Indre-et-Loire 175B 78: Testimony of Phillipe Marchau, 21 Feb. 1774. 34 AD Indre-et-Loire 175B 78: Testimony of Andres Badiu, 21 Feb. 1774. 35 AD Indre-et-Loire 175B 78: Letter to the Procureur du Roi from the Provost General. 36 B. Maillard, ‘Une émeute de subsistances à Tours au XVIIIe siècle’, Annales de Bretagne et des pays de
l’Ouest, 92 (1985), p.30. 37 AD Indre-et-Loire 175B 78: Letter to the Procureur du Roi from the Provost General.

New Researchers - Session I / A
15
business. No occupations were given for the five women, but we know that one was married to an absent sailor; one was the wife of one of the aforementioned artisans; two lived with their widowed mothers and one lived with her grandmother.38 Two of the women were released without sentencing, which took place soon after the riot, on 1 March 1774. The others were variously sentenced: to death; to life on the galleys; to flogging and an hour in the stocks plus three years banishment; just to an hour in the stocks; and to public admonition.39 The women were handed the lighter sentences. However, Maillard has shown that after further questioning, many of the sentences were reduced owing to a sort of plea bargaining, which meant that, in the end, three ringleaders were hanged and two sent to the galleys for nine years.40 This implies that the authorities were simply keen to be rid of those whom they saw as troublemakers, rather than in making a big example. In fact, they also offered an amnesty to rioters who had fled to the woods for fear of arrest.41 Overall, they seem to have approached the matter of dealing with the riots with some ambivalence.
Nevertheless, as a group, the people of Tours received some censure. In this special case, the merchants themselves (mostly from Tours, but with several also from Orleans), convinced that they were in the right, were not prepared to cut their losses. In letters to the local government they insisted on the fact that the grain they had lost had been purchased legitimately at market42 and sued central government through the head officer at Tours for compensation.43
This the government granted. It took a few weeks, but finally on the 23 March 1774 the Conseil d’État, or supreme court, issued a ruling naming each of the concerned merchants individually and announcing that the officials of Tours, who had already apparently recovered some of the stolen supplies and ‘liquidated’ them, were to repay just over 7,000 livres (about 18 per cent of the total damages). This was to be equally distributed between the merchants.44 The rest, the court ruled, stood to be paid back by the inhabitants of Tours and several of the surrounding parishes in equal parts regardless of status. Ironically the merchants were helped by the recently reinstated regulation of the market, as each shipment had its own certificate detailing the amount of grain and other goods that it was carrying, and hence exactly the value which needed to be extracted from the community in reparations.45
Evidence of reparations paid to merchants as victims of riots is very rare, and it would seem that it hardly ever happened in this period, in France or indeed Britain, with the Gordon Riots as an exception. It seems that in the Tours case, the merchants garnered sympathy for their cause from both the senior authorities at the constabulary and central government, which approved their conduct and censured that of the crowd. These merchants, the ruling pointed out, were in the right, because they ‘conducted the grain trade in the manner permitted’.46
At the same time, however, the fact that junior officers had been seizing back what supplies they could and then selling them within Tours, suggests sympathy for the crowd’s plight and for their initiative to stop those supplies from going any further than Tours. Meanwhile, it seems that unofficial liquidations were also taking place, as local priests recorded the anonymous return of sums of money from members of the community in response to the demand for compensation.47
38 AD Indre-et-Loire 175B 78: Interrogations, 24-28 Feb. 1774. 39 AD Indre-et-Loire 175B 78: Condemnations, 1 March 1774. 40 Maillard, ‘Une émeute’, p.31. 41 ibid. 42 AD Indre-et-Loire 175B 78: Letter to the Provost General at Tours from Charles Lassailly & Son, undated. 43 AD Indre-et-Loire 175B 78: Extract from the registers of the Conseil d’État, 23 March 1774, p.1. 44 ibid, p.4. 45 AD Indre-et-Loire C98, fol. 40: Letter from Terray to Du Cluzel, 21 June 1774. 46 AD Indre-et-Loire 175B 78: Extract from the registers of the Conseil d’État, 23 March 1774, p.3. 47 AD Indre-et-Loire 175B 78: Undated letter addressed to the Provost General.

New Researchers - Session I / A
16
Clearly there was some concern for local survival, and weather and price data from the time show that this was perhaps justified. Figure 1 indicates that rainfall around this time had been copious, possibly marring the season’s harvest.
Figure 1: Seasonally adjusted rainfall, according to Parisian meteorological observations, and riots in Tours
Source: M.E. Renou, ‘Études sur le Climat de Paris,’ Annales du Bureau central météorologique de France, (Paris, 1885), vol.1, p.272. I have seasonally adjusted this data according to the method described by C.H. Feinstein and M. Thomas in ‘Making History Count’ (Cambridge, 2002), pp.28-30.
Meanwhile, according to figure 2, the average price of grain in the region was growing increasingly unpredictable from year to year, surely rendering life unstable for anybody reliant thereon.
Figure 2: Grain prices and riots in Tours
Source: AN F20 105: ‘Prix commun du froment dans les 32 généralités et la Ville de Paris’, reproduced in E. Labrousse, Esquisse, pp.106-113. See also p.16, n31.
From the sheer value (some 40,000 livres) of the compensation payments, it is clear that significant quantities of grain were being transported through Tours. For those struggling to pay the high prices demanded at their local market, the rate of the movement of this grain must have been perceived of as unsustainable.
The merchants, on the other hand, had their own defence. Charles Lassailly & Son wrote angrily to inform the Provost General at Tours that their grain had been purchased legally at Orleans and was destined to feed lower Brittany via Nantes. They were keen to

New Researchers - Session I / A
17
point out that their shipment was meant to aid another struggling French region.48 Drawing on the notion of patriotism or at least of shared suffering, the merchants attempted to justify their actions in the face of the angry populace of Tours.
During the earlier period of deregulation of the trade, others had taken recourse to this notion, distinguishing foreign from domestic demand. One officer had written indignantly of the riotous poor under his jurisdiction, whose antics suggested to him that ‘the populace is not interested in the general good of the state, because they … interrupt the course of trade’.49 His sentiments are similar to some of those expressed at a Parisian administrative assembly of 1768, where, for example, the Councillor of the First Chamber claimed that ‘no good citizen would be vexed to eat bread at a slightly higher price in circumstances where this little price increase ... will prevent another province peopled with fellow citizens from languishing in the horrors of famine’.50
The people of Tours, however, were not especially concerned with the ‘general good of the state’ or of their compatriots. Their only concern was the security of their own locale. It seems that the spectre of Nantes loomed large, because it represented an integrated maritime economy, in which the people of Tours were only willing to partake within tight limits when grain was in obvious abundance. Their vision of the appropriate extent of the economy was limited, and, judging by the ambivalence which characterized the responses of the authorities, this was not a popular perception only.
However, the deregulation of the grain trade in France had been heralded as an initiative of great national importance. French policy makers, considering the issue only on a national level, tried to force an ultimately inappropriate policy on an immature economy by using patriotic rhetoric and chauvinistic deterrents. Because of the instability which the policy seemed to cause, common people and their local authorities opposed the new rights accorded to merchants. However, the way in which the changes had been politicized and defended made this resistance into a feat of anti-patriotism, or localism, where perhaps otherwise it could only have been construed as anti-capitalism or recourse to the moral economy of the marketplace.
48 AD Indre-et-Loire 175B 78: Letter to the Provost General at Tours from Charles Lassailly & Son, undated. 49 Bibliothèque Nationale de France, Joly de Fleury Papers, 1134, fol. 99: Letter to the Lieutenant General from
an officer at Soissons, 20 July 1766. 50 Archives Nationales K1022: Minutes of the General Assembly of Police, 25 Nov. 1768.

New Researchers - Session I / B
18
Making a living on the Welsh farm: the changing nature of by-employment in Caernarvonshire, 1750-1900
Frances Richardson, University of Oxford
([email protected]) Supervisor: Dr Kate Tiller
In peasant societies without significant market integration, the main aim of household production was for direct consumption. As markets developed, more local goods and services were provided by specialists, often from the market town. But there was an intermediate stage of economic development in Britain, where farming was combined with another occupation, producing either for the local market, or increasingly, during the seventeenth and eighteenth centuries, for national and international markets – the special case of proto-industrialization. This research investigates the extent and nature of by-employment or multiple occupations in the north Wales hundred of Nantconwy, Caernarvonshire, over the period 1750-1900. It finds that many households undertook multiple occupations throughout this period, but that the nature of by-employment changed significantly, influenced by the extent of subsistence farming and the impact of broader economic and technological change.
Previous investigations of by-employment have mainly focused on the early modern period. This study probes the nature of by-employment at a later date in a sparsely populated area, using theories on by-employment, proto-industrialization and the adaptive family economy to explore a number of questions.51 How widespread was by-employment and was income derived from it used for subsistence or to enjoy a higher living standard? Did by-employment serve a traditional local market, or represent proto-industrial production for national markets? How was work allocated within the household? And did by-employment decline as economic development brought greater specialization?
Nantconwy was dominated by pastoral farming transitional between a peasant and a capitalist economy. In the mid-eighteenth century, most tenant farms grew corn and potatoes for their own subsistence, but relied on profits from the national trade in store cattle to pay the rent, and income from dairying for household expenses. Population had not reached the critical mass required to support many rural craftsmen, and most specialized goods and services were bought from the local market town of Llanrwst in Denbighshire.
Of 147 Nantconwy probate inventories for the period 1750-1800 containing evidence of farming, 61 per cent were sufficient detailed to give evidence of by-employment or production that could be used either for household consumption or for sale. The study supplements inventory data using nominal record linkage between landholding and occupational data, including records of estate work, quarrying employment and alehouse recognances.52 The median size of farm at this period was 93 acres, though 23 per cent of holdings were under 20 acres. In only three inventories was farming the deceased’s secondary occupation: two fullers and a slater. There has been some debate as to whether dairying should be regarded as by-employment or part of farming.53 Dairying involved considerable female work in making butter and cheese for the market, but since 91 per cent of Nantconwy
51 M. Overton, J. Whittle, D. Dean and A. Hann, Production and Consumption in English Households, 1600-
1750 (London, 2004); F. F. Mendels, 'Proto-industrialization: the first phase of the industrialization process', Journal of Economic History 32 (1972), pp.241-261; R. Wall, 'Work, welfare and the family: an illustration of the adaptive family economy', in L. Bonfield, R. Smith and K. Wrightson (eds.), The World We Have Gained (Oxford, 1986), pp.261-294.
52 National Library of Wales, Bangor Diocese inventories. It has been argued reliance on inventories over-estimates the extent of by-employment: S. A. J. Keibek & L. Shaw-Taylor, ‘Early modern rural by-employments: a re-examination of the probate inventory evidence’, Agricultural History Review 61 (2013), pp.241-281.
53 Ibid., p.262.

New Researchers - Session I / B
19
inventoried households were involved in dairying, its inclusion does not help investigate whether by-employment raised wealth levels. Nevertheless, 56 per cent of the detailed inventories contained clear evidence of other types of by-employment, and a further six per cent had possible evidence.
Table 1: Evidence of by-employed farmers from Nantconwy inventories, 1750-1800
Evidence of possible by-employment % inventories
Dairying 91%
Spinning/knitting 57%
Brewing 10%
Other: drover, carrier, fuller, slater, miner 11%
By-employed households in Nantconwy do not appear to have been wealthier than others: the median value of inventories with firm evidence of by-employment, excluding dairying, was £63, compared to £75 for those with no clear evidence. This was because the majority were involved in spinning and stocking knitting, which were carried out across the social spectrum. Other by-employments such as inn-keeping, fulling, droving and carrying, were more likely to be associated with wealthier households.
Figure 1: Gross Nantconwy inventory values 1750-1800
Most Nantconwy parishes were part of a stocking knitting district stretching from Bala
to Llanrwst, the principal stocking markets in north Wales.54 Hand knitting for a national market was ‘the common employment of the neighbourhood, for both sexes and all ages’.55 £300 of stockings were sold at Llanrwst’s weekly market around 1800, with around 2,400 people in the area involved in the industry – a high proportion of the local population.56 A proficient knitter earned only about one shilling a week, compared to an agricultural labourer’s wage of eight shillings. The chief advantage was that knitting could be done while engaged in other everyday activities or when travelling to market, and income was greater if the wool was grown on the farm or gleaned.57
Spinning wheels were mentioned in 52 per cent of detailed inventories and spindles in a further 5 per cent. Substantial yeoman families were involved in spinning and knitting: larger farms possessed two or three spinning wheels and stocking presses. Looms do not
54 W. Davies, General View of the Agriculture and Domestic Economy of North Wales (London, 1810), p.403. 55 J. Evans, Letters Written during a Tour through North Wales (London, 1804), pp .67-8. 56 T. Pennant, Tours in Wales (London, 1810), p.211. 57 Davies, North Wales, p.404.

New Researchers - Session I / B
20
appear in any Nantconwy farmers’ inventories, because home-spun yarn was sent to a weaver for making into cloth. Most parishes supported a number of weavers, but they were generally landless and showed up regularly in charity and casual poor relief lists. Fulling was by contrast typically combined with farming. Although the fulling mills were leased from the landowner, the fuller owned the fulling equipment and furnace, which passed from father to son, while farm stock was typically left to the widow, showing the likely division of labour within the family.58
Involvement in the national store cattle trade enabled some substantial farmers to supplement their income though droving, buying cattle in the markets or directly from farms to form droves worth up to £400.59 A number of Nantconwy farmers are known to have acted as drovers up to the mid-nineteenth century. Only one, who tenanted a 955 acre upland farm, was specifically named in the inventory sample as a drover, though it is likely that several other wealthy farmers who died owing regular amounts to a number of people were drovers who bought on credit. Other farmers or farmers’ sons acted as jobbers, buying cattle and sheep locally and driving them to collecting points, or driving cattle to England.60
The most lucrative by-employment in Nantconwy was inn-keeping. Commercial beer production had not yet penetrated rural north Wales, where it remained common into the nineteenth century for inn-keeping to be combined with farming. Brewing and running the inn were typically undertaken by the womenfolk of the family, while the husband looked after the farm.61 In Nantconwy, brewing ale was confined to the principle farmhouses, with brewing equipment only mentioned in 12 per cent of inventories. In most cases, this was purely for home use: only a quarter of farms listing brewing equipment were licensed in 1778. There were nine licenced alehouses in Nantconwy, all associated with farms at the centre of the parish near the church.62
The Napoleonic Wars affected by-employment in Nantconwy in a number of ways. Rapidly rising food prices and under-employment led to an expansion in subsistence farming, as farms were sub-divided and some seventy smallholdings were encroached from the wastes. Farm rents increased significantly, but in the postwar agricultural depression many farmers had difficulty in paying the rent. The stocking industry was now in decline, the preserve of the poor rather than a worthwhile by-employment for better-off farm families, and by 1830, sales of stockings in Bala were only a fifth of the level a generation before.63 In 1851, only 16 Nantconwy widows and spinsters were attempting to earn a living by knitting, supplemented in most cases by poor relief.
The Wars also brought an increase in tourism to Snowdonia, as English tourists were unable to follow the traditional European Grand Tour. This, and the rapid growth of turnpike roads, brought a new class of farmer-innkeeper to Nantconwy. Lord Penrhyn replaced the old Capel Curig Farm alehouse with the commodious Capel Curig Inn, and installed a former butler, Joseph Griffith, as landlord.64 But an inn catering for the quality trade was unable to find adequate supplies in the local area, and Griffith took over two sizeable local farms to keep cattle, sheep, pigs, and poultry. On his death in 1810, Griffith was worth a net £1,756 – nearly three times the wealth recorded in any other Nantconwy inventory throughout the period. A number of other farm alehouses developed into inns, especially after David Cox made Bettws y coed famous as a haunt for artists, fishermen and tourists in the 1840s, but most of the new hotels and guesthouses were not involved in farming. 58 E. Hyde-Hall, A Description of Caernarvonshire (1809-11) (Caernarfon, 1952), pp.135-8. 59 R. J. Moore-Colyer, The Welsh Cattle Drovers (Cardiff c1976 ), p.76. 60 R. T. Jenkins, ‘A Drover's Account Book’, Transactions of the Caernarvonshire Historical Society 6 (1945),
pp.46-57, p.51, 54. 61 Evans, North Wales, p.55. 62 Gwynedd Archives XQS/1779/80/127 & 128, ‘Recognizances of innkeepers, Nantconwy’ (1778-80). 63 A. H. Dodd, The Industrial Revolution in North Wales (Cardiff, 1951), p.279. 64 Rev. W. Bingley, A Tour round North Wales (London, 1800), p.319.

New Researchers - Session I / B
21
Carrying was another important form of by-employment for Nantconwy farmers. When horses replaced oxen for field work in the eighteenth century, they were required to pay for their keep by outside work, each carrying two 80 pound packs to the mill or market.65 Panniers and pack saddles were listed in six farmers’ inventories, possible evidence that they provided carrier services such as transporting lead ore from the Gwydir mines to the River Conwy. In the early nineteenth century, the Gwydir estate often employed tenants to undertake cartage connected with its extensive forestry operations. In the period 1818-24, 42 farms supplied labour for periods varying from a few days to half a year, which was often offset against rents. Other forestry tasks performed by farmers and their sons or servants included barking oak trees for use in tanning, planting, thinning plantations and making new roads.66
But it was the take-off in the slate industry after 1830 that significantly increased demand for carriers, to the extent that for some farmers, carting slates proved more lucrative than agriculture. Before the introduction of tram-roads, a team of horses was needed for every four quarrymen. One Festiniog quarry alone employed 82 carters from 1823-30 to carry slates to quays on the River Dwyryd, enabling local farmers to earn up to £168 a year. Nantconwy farmers were unwilling to carry slates from the Penmachno quarries to the Dwyryd quays over the 500 meter pass of Bwlch Carreg y Fran; they insisted instead on carting to the River Conwy at twice the cost.67 Income from carting was severely reduced by the advent of railways: Penmachno quarries become linked to the Festiniog to Porthmadog railway built in 1832, and Dolwyddelan quarries gained rail access in the 1860s, though elsewhere in Nantconwy, farmers were still able to supplement their income by carting slates throughout the nineteenth century.
By 1841, the vast majority of Nantconwy land occupiers still regarded farming as their primary occupation. 86 per cent of farmers with over eight acres, and even some of smallholders with less than eight acres, gave their occupation in the census as farmer, though this did not preclude by-employment: small farmers frequently worked in the quarries while their wife and children ran the farm.68 The most common occupations of other farm occupiers were as agricultural labourers, quarrymen, miners and masons. There was no significant difference in the size of farm held by those who described themselves as farmers, or with another occupation. Nearly a third of smallholders also described themselves as farmers, though this group were more likely to be by-employed, the most common occupations again being as agricultural labourers, quarrymen, masons or miners. Table 2: Occupations of land occupiers in tithe commutation records traced in 1841 census69 Occupation Farms 8 acres and above Smallholdings under 8 acres Farmer 220 10 Agricultural labourer 8 9 Quarryman/mason/miner 8 5 Drover 4 0 Craft 3 4 Professional/managerial 4 0 Other 10 5 Total 257 33
By the mid-nineteenth century, a number of factors resulted in further change to the
nature of by-employment. The repeal of the Corn Laws brought reliable supplies of cheap 65 O. G. Jones, Gweithiau Gethin, (Llanrwst 1884), p.32. 66 GA XD38/265, ‘Cartage Book, Gwydir’, (1818-1824). 67 M. J. T. Lewis & M. C. Williams, Pioneers of Ffestiniog Slate (Blaenau Ffestiniog, 1987), p.18. 68 PP.1822 XV, p.451. 69 National Archives IR18/14097, 14112, 14117, 14152, 14158 (1841-2).

New Researchers - Session I / B
22
corn to remote areas of rural Wales, which persuaded many farmers to give up cultivating crops for family subsistence.70 The potato blight, which struck Wales a year after Ireland, also dealt a severe blow to the subsistence smallholder economy. Railways began to penetrate into rural Wales from the 1840s, encouraging a major expansion of sheep farming to serve national markets and improving the profitability of mountain farms. At the same time, the role of the long distance drover declined, as railways captured the majority of livestock flows by 1865 and the trade became dominated by capitalist dealers with access to large-scale credit.71
By the second half of the nineteenth century, by-employment amongst farmers was clearly in decline, but there was an increase in by-employed smallholders and people with another primary occupation who supplemented their income through small-scale agriculture. The subsistence smallholder had virtually died out by 1861, and most were by-employed as quarrymen or masons. This was typical of the general pattern in Caernarvonshire as described somewhat patronisingly by the Penrhyn agent to the Welsh Land Commission: “Most of the small holders on the Penrhyn estate are quarrymen in receipt of good wages, who keep one, two or three cows on their land … their holdings are as it were a luxury, while they depend on their quarry wages for their living”.72 The Capel Curig Inn sub-let cow-keep to several of its employees and service providers to meet this increasing demand.73 In 1861, 21 per cent of Gwydir estate holdings with cowhouses were occupied by people whose primary occupation was not farming and a further 6 per cent by dual-occupation farmers. Interestingly, it was the better off members of rural society who were most likely to keep cows - shopkeepers, innkeepers and people in clerical and managerial occupations, followed by craftsmen, quarrymen, lead miners and single women. Labourers were least likely to rent a property with a cow house, but might of course have access to cow-keep and potato ground on their farmer’s land.74
The conclusions of this study are that during the period 1750-1800, spinning and knitting were undertaken across the social spectrum, suggesting that this widespread proto-industrial by-employment both supported subsistence for the poor and enabled better-off farming families to enjoy an enhanced standard of living. There was also clear evidence of entrepreneurial by-employment. The increase in the number of smallholdings during and shortly after the Napoleonic Wars created a new pool of subsistence farmers likely to be by-employed, and as the nineteenth century progressed, smallholdings increasingly become secondary to another main occupation. At the same time, demand for smallholdings or cow keep grew as non-farming families sought to diversify their family economy and to enjoy a higher standard of living. Throughout the period, by-employment was an important part of the family economy, with the womenfolk actively involved in dairying, spinning and knitting or in running the farm or inn while the menfolk were engaged in other activities, even though the nature of those other activities changed over time in response to wider economic circumstances.
70 Report of Royal Commission on Land in Wales and Monmouthshire (1896), Minute 10,817. 71 Moore-Colyer, Welsh Cattle Drovers, pp.108, 118-9. 72 Royal Commission Land Report, p.340. 73 NLW MS 16/49, ‘Bob Owen’s rent book’ (c1850). 74 GA XD/131/61, ‘Valuation of farm buildings and cottages, Gwydir estate’, (1861).

New Researchers - Session I / B
23
Material lives of the English poor from the late seventeenth to the early nineteenth centuries
Joseph Harley, University of Leicester
([email protected]) Supervisors: Professors Peter King & Rosemary Sweet
The history of consumption and material culture over the past thirty years has developed into an important cornerstone of eighteenth and nineteenth century British history. We now know that by the early eighteenth century the middle and upper classes increasingly owned a greater variety and quantity of material goods, and have a greater understanding of how these goods shaped and changed their lives.75 However, whilst this literature has grown apace very little research has been conducted on the material lives of the poor, besides the odd case study and the literature on the clothing of the poor.76 This is a significant historiographical gap, considering the substantial size of the population in poverty over the eighteenth and nineteenth centuries.77 This gap in the literature has often been acknowledged by historians, yet very little research has been undertaken to address it. Based on my PhD research, this paper is therefore one of the first major studies to assess the poor’s material wealth. It is also the first study to take a regional perspective and assess how the material lives of the poor varied over differing parts of England.
This paper employs nearly 350 pauper inventories collected from Dorset, Kent and Norfolk to study the material lives of the poor. Pauper inventories are very difficult to locate and define, and have rarely been used by historians to date.78 As a result it is necessary to briefly assess them as an historical source. Pauper inventories were mostly made by overseers’ of the poor to record the household possessions of paupers on parish relief during the Old Poor Law. They were made to list the goods that a pauper owned at one period in time, with the aim of later taking the goods for the parish’s benefit when they died. The goods would then be sold, given to other paupers, or used within the parish workhouse. Pauper inventories tended to be made of older parishioners and those more vulnerable to poverty, such as the widowed and women, but they were also sometimes made of men and younger parishioners. Parish-related records contain a number of different types of inventories, including those made for debt and arrears of rent, as well as pauper inventories. Moreover, many of these differing types of inventories were made of people who were not paupers. Consequently, in order to find this sample of 350 pauper inventories I had to track the relief patterns of people in over 1,000 different types of inventories collected from Dorset, Kent and Norfolk and categorize each inventory individually.79 This monotonous and difficult research has significant benefits, as pauper inventories can be quantified over time to empirically assess the types of goods that paupers owned and assess whether the material lives of the poor improved from the late seventeenth century to the 1830s. The research also has wider implications on other major historiographical topics, such as industrialization, the standard of
75 For some of the most notable publications, see: Shammas (1990), Weatherill (1996), Estabrook (1998),
Overton et al. (2004), and French (2007). 76 King (1997) and Styles (2007). 77 It is difficult to put a specific figure on this; however writers such as Wales (1984), King (2000), and Dyson
(2006) have found that around half of the population in some areas were pauperized at some point in their lives.
78 Only two studies have used pauper inventories to assess the material wealth of the poor: Cornford (1970-3) and King (1997).
79 Adrian Green attempted to use pauper inventories in his study on the Norfolk poor, but failed to check and categorize the inventories using wider parish sources. As a result, around one-third of his sample was of people who were not paupers and it included a number of inventories that were not pauper inventories. Green (2011). This shows how important it is to check every inventory that one finds.

New Researchers - Session I / B
24
living debate, the nature of poverty, and the diet of the poor. Unfortunately, due to spatial limits I have had to be very selective on which material goods I analyse, meaning that items such as linen and fire irons are neglected and the analysis is often brief. Nevertheless, in this paper I will argue that the poor’s material lives improved over the eighteenth century and especially after 1770. In brief, the poor in Kent tended to own a greater variety and quantity of material goods than the poor in Dorset and Norfolk, stemming from their proximity to London and the commercial nature of the county. Paupers in Dorset on the other hand, were less well connected to other areas and often tended to be more ‘traditional’ in the types of goods that they owned until the late eighteenth century.
Before the seventeenth century it was not uncommon for people to sleep on the floor, on a straw pallet, or on top of a chest or table.80 This form of sleeping had largely disappeared by the late seventeenth century, with 98 per cent of the pauper inventories from Dorset, Kent and Norfolk listing at least one bed. Table 1 records the percentage of inventories which note mattresses. Unfortunately, the majority of pauper inventories do not specify which type of mattress that the pauper owned, yet despite this the results strongly suggest that the level of domestic comfort in the poor’s homes was improving, following an increase of 20 per cent in pauper ownership of feather beds. This is an important finding as beds were central to people’s lives and were the location where people spent a significant proportion of their lives either sleeping, talking, or having sex, for instance.81 Beds also had a significant financial value to paupers. In nearly every pauper inventory, beds tended to be the most valuable item that people owned at an average value of £1 3s. 8d each. The average number of beds that people owned was also increasing, from an average of 1.4 beds per household before 1770 to 1.8 beds after 1770.
Table 1: % of pauper inventories which record beds and mattresses in Dorset, Kent and Norfolk, c.1679-1834
c.1679-1769 1770-c.1834 All years Feather 15 35 20 Flock 8 7 8 Straw 3 7 4 Any type/unspecified 97 100 98 Sample size 265 81 349
The ownership of storage units has wider implications concerning pauper material
wealth, as it implies that paupers owned a number of possessions that needed storing. Boxes, including chests, coffers, trunks, arks and hutches, were owned by the majority of paupers around the country and so were the most important storage units that the poor possessed throughout the period (table 2). However, after 1770 there was a small drop in pauper ownership of boxes and a significant increase in their ownership of chests of drawers. Chests of drawers were a much more sophisticated manner in which to store goods as they allowed greater ease of access and used less floor space than boxes did. They were also a much more fashionable item with which to furnish the home. There were however significant regional differences in the ownership of chests of drawers. In Dorset, only one pauper inventory from the entire period recorded a set of chests of drawers, whilst around two-fifths of pauper inventories from Kent and Norfolk recorded chests of drawers from 1770. Chests of drawers were most common in Kent and Norfolk because the counties were better connected to London, where chests of drawers were produced in the greatest quantities and where the fashions for ‘new’ goods often started.82 This meant that chests of drawers were owned by
80 Emmison (1961, p.2) and Wright (2004, p.18). 81 Gowing (2014). 82 Overton et al. (2004, pp.95-7), Earle (1989, pp.23, 27 and 290-301), and Weatherill (1996, pp.44 and 47-51).

New Researchers - Session I / B
25
greater numbers of the middle classes in Kent and Norfolk,83 and thus meant that there were probably a greater number of cheaper and second-hand units available to the poor in these areas. This would have further encouraged the poor to acquire chests of drawers over other storage units. The poor in Dorset on the other hand were located further away from the areas where chests of drawers were produced in significant quantities, meaning that only the richest middle-class quartile in the county tended to own them.84
Table 2: % of pauper inventories which record select storage units, c.1679-1834
c.1679-1769 1770-c.1834 All years
Box, trunk, coffer etc.
Dorset (n=60) 84 73 80 Kent (n=60) 92 91 92 Norfolk (n=229) 79 62 77 All (n=349) 82 73 80
Chest of drawers
Dorset 3 0 2 Kent 13 41 23 Norfolk 13 43 18 All 12 31 16
Sample size - 265 81 349
Historians have written huge volumes of work on the poor’s consumption of food.85 Recently, Craig Muldrew reignited the debate by arguing against historiographical consensus to suggest that the labouring population ate well and had better food than historians have previously suggested.86 This paper opens up a new methodological avenue to the subject by assessing the cooking utensils that were recorded in the inventories of paupers. By doing this it is possible to assess how food was prepared and cooked, and thus imply whether the quality of food that the poor ate improved over the period.
The first four items in table 3 are linked to cooking liquid-based foods such as porridge, soup, and stews; and the final four items in the table are linked to grilling, roasting, toasting, and frying food. The table only shows a small sample of items related to cooking, yet throughout the period around four-fifths of pauper inventories contained at least one item related to cooking liquid-based foods, and around half of inventories listed items related to grilling, roasting, toasting, and frying food.87 This suggests that little had changed in the cooking techniques of the poor over the period. It also shows that the consumption of food cooked in diverse manners was possible in many households, but that this type of cooking probably remained infrequent compared to cooking meals in a single pot of some sort. A number of meals that the poor ate were probably made up of simple dry ingredients such as bread;88 however these results demonstrate that when the poor cooked a meal it was predominantly liquid-based. This means that the majority of meals in pauper households would have been very repetitive and often monotonous. There was an increase in pauper ownership of items related to salt, pepper, mustard, nutmeg, sugar, and vinegar by the late eighteenth century, which suggests that the poor could at least increasingly season and spice their food to make it more flavoursome.89 However, the growth in ownership of these items 83 Overton et al. (2004, p.91) and French (2007, pp.160-1 and 189-96). 84 French (2007, pp.160-1 and 189-96). 85 Two of the most notable are: Shammas (1990) and Fogel (1993). 86 Muldrew (2011). 87 Around a tenth of pauper inventories unfortunately did not list cooking-related items so these figures are a
slight underrepresentation. 88 Davies (1795) and Eden (1797). 89 It is important to note that salt, vinegar, and sugar were also used in the preservation of food and sugar was
also used to flavour drinks such as tea. Nevertheless, these commodities at least offered cooks the

New Researchers - Session I / B
26
was largely restricted to Kent and to a lesser extent Norfolk. Very few of these items were found in Dorset homes. Overall, although this form of analysis through pauper inventories reveals little about ingredients, it demonstrates that the food of the poor was generally static, probably resulting in monotonous and rudimentary meals.
Table 3: % of pauper inventories which record select cooking utensils in Dorset, Kent and Norfolk, c.1679-1834
All years: c.1679-1834 Boiler 9
Cooking pot 48 Kettle 27 Skillet 33
Saucepan 5 Gridiron 27
Frying pan 37 Spit 18
Sample size 349
The consumption of ‘luxury’ goods has received the most attention from historians, as it was from the consumption of these items that middle- and upper-class homes, lives and social practices changed most.90 Table 4 shows the percentage of pauper inventories which contain select items that can be broadly labelled ‘luxuries’.91 The results demonstrate that before 1770 the majority of paupers tended to not own any luxuries. Pauper homes would have simply been made up of basic items such as furniture, cooking goods, and work-related items. However, after 1770 paupers increasingly owned luxury goods, following an increase in their ownership of clocks and looking glasses, for instance. This meant that paupers were able to increasingly decorate their homes and that paupers were increasingly consuming market-produced goods. From 1770, 67 per cent of pauper inventories recorded at least one tea-related item, demonstrating that tea had become a mass-consumed commodity among the poor by the late eighteenth century. Some paupers, mostly in Kent, also owned a range of tea items, such as tea chests, tea tables, and tea caddies in addition to tea kettles and tea pots, suggesting that a proportion of the poor drank tea using some of the same social rituals and ceremonies as the middle classes did when they drank tea.92
opportunity to flavour and season dishes.
90 For example: Peck (2005). 91 For a fuller assessment of luxury items and how to define them, see the work of Maxine Berg. Especially:
Berg & Eger (2003). Of course, the term has a number of flaws, however there is little space to critique them here.
92 There is a sizeable literature on middle-class tea drinking. For example, see: Vickery (2009, pp.273-6).

New Researchers - Session I / B
27
Table 4: % of pauper inventories which record select ‘luxury’ items, c.1679-1834
c.1679-1769 1770-c.1834 All years
Book
Dorset (n=60) 3 14 7 Kent (n=60) 3 18 8 Norfolk (n=229) 4 0 3 All (n=349) 3 9 5
Clock
Dorset 0 9 3 Kent 11 50 25 Norfolk 0 11 2 All 2 21 6
Gold, Silver or Jewellery
Dorset 0 0 0 Kent 3 5 3 Norfolk 0 0 0 All <1 1 1
Looking glass
Dorset 16 32 22 Kent 13 45 25 Norfolk 13 38 17 All 14 38 19
Pictures/ prints
Dorset 3 5 3 Kent 5 18 10 Norfolk 1 5 2 All 2 9 3
Tea-related items
Dorset 11 59 28 Kent 8 73 32 Norfolk 6 68 16 All 6 67 21
Sample size - 265 81 349
Despite this increase in the poor’s ownership of some types of luxuries, it is important to not overstate these findings. There were distinct regional differences with the poor in Kent owning the greatest numbers of luxury goods; whereas the poor in Dorset and Norfolk tended to own these goods in smaller numbers. This meant that there was not universal improvement in the material lives of the poor over the eighteenth and nineteenth centuries, and that engagement with the market depended upon location as well as economic factors such as personal wealth. There were also a number of goods that remained out of the reach of the poor, such as gold and silver items, and several goods which were owned by only a minority of paupers, such as books, pictures, and prints. Of course, a number of the poor probably sold off some of their possessions to purchase basic necessities such as food before the inventory was made of their household goods.93 Nevertheless, these results collectively demonstrate that a significant number of the poor were lacking in material wealth at least at some point in their lives, if not most of their lives. Finally, when pauper inventories are compared to middle-class probate inventories, the material gains of paupers appears meagre in comparison. The middle classes in Kent for instance started to own clocks and looking glasses around 100 years before paupers from Kent did.94
93 On pawning, see: Lemire (2005) and Tomkins (2006). 94 Overton et al. (2004, p.111).

New Researchers - Session I / B
28
Although the material wealth of the poor can be viewed as deprived compared to the middle classes, it would be wrong to conclude that the poor’s material lives were insignificant. This paper has only been able to assess a limited number of items, but collectively the results from the pauper inventories demonstrate that the material lives of the poor improved over the period, following an increase in the poor’s ownership of feather beds, luxury goods, and better-quality furniture. These changes improved the home lives of the poor and also led to a number of significant transformations in their domestic practices. Paupers for instance were able to further decorate their homes by the late eighteenth century and make it more comfortable than their ancestors ever could.

New Researchers - Session I / B
29
Who ate Ireland’s food during the famine?
Charles Read, University of Cambridge ([email protected])
Supervisor: Professors Martin Daunton & Eugenio Biagini Introduction
Few issues in Irish history are as contentious as the question of whether the trade policies of the governments of Sir Robert Peel and Lord John Russell affected the availability of food supplies to the poor in Ireland during the Great Famine of 1845-53. The argument that the free-trade policies pursued by these governments encouraged food exports to Britain during the crisis, and in doing so raised food prices in Ireland, has formed an important part of the case made by Irish nationalists that the British made the famine worse.
Historians have more recently moved towards the opinion that, as Cecil Woodham Smith stated it, ‘the problem in Ireland was not lack of food which was plentiful, but the price of it, which was beyond the reach of the poor’.95 Christine Kinealy, who originally emphasized the scale of exports from Ireland during the crisis, while failing to note that greater quantity of imports of Indian corn, now agrees that ‘plenty of food and fuel was available in the country throughout the Famine’.96 But this leaves a great conundrum. If food was indeed plentiful in Ireland during the famine, why did the price of it rise so high? No economist or economic historian has yet undertaken quantitative analysis in order to answer this question. Although Cormac Ó Gráda has suggested that external prices may have been a factor, he has not investigated this hunch in any further detail.97
This paper analyses market data collected from the famine period in order to provide some answers to the question of why the original intentions of the government in pursuing free trade policies were not borne out in economic reality. Peel intended that repeal of the Corn Laws and the introduction of free trade without controls on the import and export of foodstuffs would lower food prices due to a flood of cheap imports from America.98 However, no economist or historian has yet sought to test to what extent this fundamental assumption Peel and his successors in government made actually worked out in practice.
For this paper, new monthly price data have been collected from locations around Ireland. For wheat, this has been added to data for six international cities to assess how Irish prices were being influenced. Using an Augmented Engle-Granger (AEG) test to test for co-movement and a Granger Causality test, it is found that New York was in fact a price taker and not a price maker, suggesting that the main assumption behind Peel and Russell’s trade policies was incorrect. Rather than causing a flood of cheap American imports to Ireland between 1846 and 1848, free trade instead caused a surge in exports – to France. I
Wheat prices have been gathered for Belfast, Dublin and Waterford, the main Irish ports, and for cities elsewhere in the world with which trade was carried out in this period, where reliable data are available. Correlation between price series are analysed in order to see where the peak in 1847 prices came from and what effect this had on Ireland.
95 C. Woodham Smith, The Great Hunger (London, 1991) p.165. 96 C. Kinealy, The Great Irish Famine: Impact, Ideology and Rebellion (New York, 2002) p.217. 97 C. Ó Gráda, ‘Markets and Famines in Pre-Industrial Europe’, Journal of Interdisciplinary History 36 (2005)
p.166. 98 R. Peel, Tamworth Election Speech (London, 1841) p.12; R. Peel, Memoirs by the Right Honourable Sir
Robert Peel, Earl Stanhope and E. Cardwell (eds.) (London, 1857) Vol. II, p.166; Hansard, 27 March 1846, Vol. 85 c. 239.

New Researchers - Session I / B
30
Figure 1: Wheat prices in various cities, shillings per barrel
The basic data are shown in figure 1. Prices for Dublin have been obtained from the
official tables in the Dublin Gazette; prices for Waterford and Belfast are from local

New Researchers - Session I / B
31
newspaper market reports.99 London figures have been extracted from the official corn returns for Middlesex published in the London Gazette.100 Prices for Paris come from a standard collection of wheat price statistics and for Berlin from the original official statistics.101 Figures for Glasgow, Liverpool and New York are taken from databases provided by David Jacks.102 By eye, Paris seems to be the leader of the surge in prices, but this can be misleading and statistical analysis is necessary in this case to make sense of the data.
It is not advisable to test the data for correlation using an ordinary least squares method (OLS) because the series are non stationary. An Augmented Engle-Granger (AEG) test for co-integration is the most convenient way to proceed. The method suits the aim of examining data over the range of both the short and long term. The calculations are carried out in software (Gretl ver. 1.9.13) in order to make the calculations manageable.
The results are given in figure 2 and the attached diagram, displaying the information in a graphical form. The best co-integration is one with a value of less than 1 per cent (the percentage representing the uncertainty) and relationships with more than 10 per cent uncertainty are discounted. A dependant variable is one which follows the variations of another and the arrows in the diagram point to the dependant variable and so indicate the direction of the apparent ‘transfer’ of prices.
II
Looking at the results, one of the most obvious conclusions which can be drawn – and one that would have been a surprise to Peel and Wood – is that, in the short term, it was not the low prices in places such as New York which drove low prices in Britain and Ireland, as they had hoped. On the contrary, many towns and cities in the United Kingdom had dependant relationships with Paris and ‘acquired’ high prices from it.
This, at first, seems counter-intuitive because price influence ‘flows’ in the opposite direction of goods traded. However, it is logical, because prices were often altered due to anticipation by merchants, keen to charge the most they could on the basis of transferred information in the market reports of newspapers. Merchants in the country of origin would follow the reported prices in the country in which they wished to sell and if they were successful and there was a tendency to raise prices in their home country. There is no equivalent ‘force’ which would drive the transfer of low prices, as consumers would tend to be persuaded by the same price information from abroad and increases would be limited only by a refusal to pay. However, because the demand for staple foodstuffs was so inelastic, particularly as there were few alternative sources available in the 1840s, this would have been unlikely to have occurred. Over the long term, influences normally work in both directions to cause market integration and two prices will both move together, but in this case, in the short run, high-price countries will have a greater influence than low-price countries. In short, the latter moves towards the former.
Most relationships with New York were those which would have transferred a high price there, and a limited increase in price could be seen in that city, reflecting those of the countries they wished to supply or supplied. Dublin and Belfast had dependant relationships with Paris and would therefore have been influenced by the very high wheat prices which arose in France from the beginning of 1847, confounding Peel’s expectations. The peak in prices in France anticipates that in most other European countries by one month, time enough
99 Dublin Gazette; Waterford Mail; Belfast Chronicle. 100 London Gazette. 101 E. Labrousse, R. Romano and F-G. Dreyfus, Le Prix Du Froment en France, 1726-1913 (Paris, 1970) pp.196-
7; Amtsblatt der Königlichen Regierung zu Potsdam und der Stadt Berlin (Berlin, 1840–1849). 102 D. Jacks, databases from ‘Intra- and International Commodity Market Integration in the Atlantic Economy,
1800-1913’, Explorations in Economic History 42 (2005) pp.381-413 and D. Jacks, ‘What Drove Nineteenth Century Commodity Market Integration?’, Explorations in Economic History 43 (2006) pp.383-412.

New Researchers - Session I / B
32
for prices to be communicated, if not for trading to transfer the increase. France had removed tariff barriers to the import of wheat as Peel did for Britain, but banned exports as well.
Figure 2: Results of augmented Engle-Granger analysis for wheat prices in Irish and international towns. A diagrammatic version of the results is presented below
Note: take the 5% certainty arrow between Paris and Dublin: the head points at Dublin which means Dublin is the dependant variable and moves towards the Paris prices. In effect, the high Paris prices are transferred to Dublin.

New Researchers - Session I / B
33
Relationship '>' = causes
Number of lags F value p-value Conclusion
Paris > Dublin 12 3.3249 3.36e-37 causation 1% Dublin > Paris 12 1.8356 7.24e-75 No causation Paris > Dublin 10 3.0465 9.04e-40 causation 5% Dublin > Paris 10 2.0975 1.77e-80 No causation Paris > Dublin 8 3.6848 1.55e-44 causation 1% Dublin > Paris 8 1.9374 1.96e-86 No causation Paris > Dublin 6 4.1706 1.75e-48 causation 1% Dublin > Paris 6 1.4733 1.24e-89 No causation Paris > Dublin 4* 5.8801 1.62e-53 causation 1% Dublin > Paris 4* 1.3329 2.26e-95 no causation Paris > Dublin 2 10.086 1.50e-58 causation (much
less than 1%) Dublin > Paris 2 3.4153 3.06e-98 causation 1% *best result according to the Akaike criterion. Critical F values to reject null hypothesis: 1% >3.32; 5% >2.37. Figure 3: Results of a Granger Causality test for the Paris and Dublin data. A diagrammatic
representation of the results is presented below.
GLASGOW
BELFAST
NEW YORK
LIVERPOOL
DUBLIN
LONDONWATERFORD
PARIS
BERLIN
1%
5%
Points in direction ofcausation
much <1%
Causation in both directions
As the Paris results are the most important conclusion, these have been checked out using a better test of causality: a Granger Causality Test as carried out by the VAR function F tests in Gretl software. The recommendations of Hiro Toda and Taku Yamamoto have been followed for using this method with non-stationary series.103 103 H. Toda and T. Yamamoto, ‘Statistical inference in vector auto regressions with possibly integrated
processes’, Journal of Econometrics, 66 (1995) pp.225-250.

New Researchers - Session I / B
34
It can be seen from figure 3 that the results confirm a strong influence of Paris on Dublin, and a much weaker influence of Dublin on Paris. The results for a lag of four months should be noted as most reliable according to the Toda-Yamamoto method. The results confirm broadly the Engle-Granger test results and give a more detailed analysis of what is happening. The diagram in figure 3 also shows the results of the same test carried out between all the cities analysed. In particular, the persistence of Paris’ influence on Ireland and other cities in general is very striking. The influence of London and other British cities on Irish prices, by comparison, is limited. III
It should be remembered that even this test only indicates ‘Granger causality’ – linear prediction and time-lagged statistical dependence – and qualitative evidence of causation therefore needs to be identified in addition. Comments in the market reports of contemporary newspapers clearly show that contemporaries also believed there to be a link. In Britain a lack of connection between supply conditions in the United Kingdom and wheat prices was noted in the Spectator:
Prices stand at an enormous height, but there is no certainty that those rates are inevitable. A good breadth of land appears to be sown; the reports of the crops are good; the rises in the corn-markets have outstripped in suddenness any known change in the circumstances of the supply, domestic or foreign. The alarm appears to be in great part fictitious.104
In particular, the Freeman’s Journal in Dublin started to give regular updates on the
progress of the French corn market. On 8 August 1846, it reported a ‘deficient harvest’, by 31 August prices had risen ‘from 50c to 1f the hectolitre’.105 On 5 September it was noted that English wheat was being exported to France and by the 9 September expectations were expressed that Irish prices were high because France and Belgium were ‘purchasers in bond at the several leading English ports’.106 On 10 October it noted ‘it is to be kept in view that in France, Holland, and even Belgium, prices of grain are fully as high as in Great Britain’.107 Much of the imported food from America was actually going towards satisfying French demand rather than Irish: ‘we are told of large importations taking place into Liverpool – but are not great portions thereof taken off under bond for the French markets or going into English consumption?’108 Throughout the winter season food prices in Ireland continued to rise, which was regularly blamed by the Freeman’s Journal’s market reports on continued high demand from France. ‘The rise in the price of grain throughout France continues’, the Freeman’s Journal noted on 8 January, and it voiced fears that this would increase Irish food prices even further.109
There is also evidence that there were significant exports of wheat from the United Kingdom to France in 1847. French trade records record a total import from ‘Angleterre’ (meaning the entire United Kingdom including Ireland) of 616,500 hectolitres, or 1,663,645 bushels, compared to less than 100 in a normal year.110
An especially bad wheat harvest in France is probably responsible for the surge in French demand for wheat imports. The Cork Examiner of 2 November 1846 reported devastating floods in France, which had made the effects of a poor harvest there worse, the
104 The Spectator, 22 May 1847, p.13. 105 Freeman’s Journal, 8 August 1846; 31 August 1846. 106 Freeman’s Journal, 5 September 1846; 9 September 1846. 107 Freeman’s Journal, 10 October 1846. 108 Freeman’s Journal, 2 December 1846. 109 Freeman’s Journal, 8 January 1847. 110 Tableau décennal du commerce de la France avec ses colonies et les puissances étrangères 1847/56 (Paris,
1856) p.136.

New Researchers - Session I / B
35
effects of which were pushing up prices in Ireland.111 The Cork Examiner of 22 March 1847 reported that the price of Irish wheat arriving at Liverpool and London was set by demand from France and the Belfast News-Letter of 20 April 1847 confirmed that ‘in the Irish grain markets ... there is a continued demand for France’.112
Therefore there was a link between Irish and French wheat prices caused by price setting and potential trade, irrespective of how much Irish wheat was actually sent to France. But this also contributed to higher prices for foodstuffs eaten by the poor in Ireland. Figure 4 shows how closely the prices of Indian corn – the main replacement food for the lost potato crops after 1846 – followed those of wheat during the famine period, at around half the level. Irish merchants, it appears, tried to fix Indian corn prices against wheat. Prices for Indian corn therefore surged in Ireland between 1846 and 1848 alongside those for wheat.
Figure 4: Comparison of Indian corn and wheat prices in the Waterford market
0
10
20
30
40
50
60
05/1846
07/1846
09/1846
11/1846
01/1847
03/1847
05/1847
07/1847
09/1847
11/1847
01/1848
03/1848
05/1848
07/1848
09/1848
11/1848
01/1849
03/1849
05/1849
07/1849
09/1849
11/1849
01/1850
03/1850
05/1850
07/1850
09/1850
11/1850
Price (shilling/barrel)
0
0.5
1
1.5
2
2.5
3
Indian corn Wheat Indian Corn/Wheat (Ratio)
Conclusion
In reality, during the famine, markets in Dublin and other parts of Ireland became a major price-taker from Paris. That suggests that the responsibility for high food prices in Ireland came not from domestic demand, or from other parts of the United Kingdom, but because of imported price rises that caused a large amount of wheat to be exported from Britain and Ireland to the French market. The variations in wheat prices influenced those of Indian corn, which as a newly-introduced good, were mainly determined by ratio-price setting with wheat.
The quantitative evidence therefore suggests that Peel’s open-port policy, expecting a flood of cheap food from America, was a failure. A more interventionist approach, perhaps involving policies such as banning food exports from the United Kingdom, or raising food prices in Ireland by means of fiscal transfers to a point which made imports to Ireland profitable, could well have been more successful in dealing with the food crisis during the famine than free trade.
111 Cork Examiner, 2 November 1846. 112 Cork Examiner, 8 March 1847; Belfast News-Letter, 20 April 1847.

New Researchers - Session I / C
36
Annual coin supply estimates for England, 1279-1790113
Nuno Palma, London School of Economics ([email protected])
Supervisor: Dr Joan Rosés Note: all figures and tables can be found in the appendix at the end of this paper.
1. Introduction
In this paper I provide the first annual time series of coin supply estimates for over five hundred years of English history. I present three alternative sets of estimates, and I argue that one of them, which I call the baseline point estimate, is, for most practical purposes, the best. Given the space restrictions I concentrate on carefully setting out the details for the data construction, rather than on analysis, but the hope is that these new estimates – the longest such continuous series ever assembled, for any country – will eventually open new vistas to help us understand the complex interaction between the real and the monetary sides of the English economy, at both business-cycle and long-run frequencies.
I focus on measuring the value of government-provided, legal-tender coin supply only. I do not consider broader forms of money such as banknotes, bills of exchange or private tokens. Notice, however, that these were not as liquid or widely accepted as coin, and it is important not to exaggerate their early importance as a share of the total means of payment: as late as 1790 the monetary base was composed of £44 million of commodity-based coin but only £12 million in notes – £8 million Bank of England notes and £4 million for all other (Capie 2004; see also O’Brien & Palma 2014).
2. Estimation methodologies
I suggest three estimation methods. All three rely on information about the value of the coin stock known for certain periods, as put forward by monetary historians. When the type changed (1279), or when the hammered coins were demonetized (1696), all the previous coinage still in circulation was called in and we know the total stock quite precisely. In other periods, only earlier coins of good weight would have yielded a profit on recoinage, but painstaking work by monetary historians has led to several secure values for the stocks at several points in time (table 1, first column). 2.1. Indirect method estimates Coin supply can be calculated by writing the equation of exchange as:
Where M stands here for coin supply, PY is nominal GDP, and V is the velocity of circulation of coin.114 Nominal GDP is available from Broadberry et al. (2014). In order to arrive to a series for V, I proceed as follows. For the years in table 1, I simply write the equation as V=PY/M and apply the figures for M known from the first column of table 1. I then linearly interpolate between those Vs, which leads to a series that will map into a series for M. (Notice there is no circularity in the construction.) The resulting estimates for V are shown in figure 1.
I call the resulting estimates the ‘indirect estimates’ and they are shown in the solid black line of figure 2. One disadvantage of the indirect method is that it relies on a linear interpolation of velocity between the observed benchmarks. So when calculating the annual estimate, the
113 I am thankful to Martin Allen, Jim Bolton, Steve Broadberry, Forrest Capie, Alejandra Irigoin, Pilar Nogues-
Marco, Patrick K. O’Brien, Ulrich Pfister, and especially Nick Mayhew, Albrecht Ritschl and Joan R. Rosés, for helpful comments and discussions. The usual disclaimer applies.
114 It is possible to define M as coin supply rather than M2 as long as the definition of V is consistent with it.

New Researchers - Session I / C
37
numerator – nominal GDP – does change in accordance to the ‘truth’, but the volatility of the denominator between benchmarks is underestimated, and hence the estimates for the value of coin supply are more volatile than they should be. A second disadvantage is that by relying on income data for its construction, the indirect estimates for coin supply cannot be used in econometric applications which aim to explain variations in income itself. The indirect method does have the advantage that ‘on average and in the long run’, it should be approximately right, since velocity only changes slowly under long horizons (Bordo & Jonung 2004). 2.2. Direct estimates A: the naïve direct method Mint output data provides useful information about the flows for the in-between years between the stocks in table 2.115 However, simply summing up mint output over time leads to numbers which overestimate the amount of coin in circulation. This is mainly because using that method coin melted down but subsequently again minted is double-counted. Further, much coin was carried abroad in the context of war, diplomatic payments, or trade, and this means that total coin supply at each given moment differed from the accumulated sum of mint output.
Changes to the value of coin supply are given by:
Where is a flow variable corresponding to the change in the value of coin supply ( , stands for net mint output for that year, is the change in hoarding, and is a residual. I now discuss each variable in detail.
is expressed in net terms because gross mint output overstates the annual change in the money stock in years of recoinage or those of net outflows of specie.116 Hence:
Because I estimate the value of coin supply (assumed to be circulating by tale) I do not need to consider clipping or melting down. However, one limitation to the estimation of from mint output data by using the Tower records (reproduced in Challis 1992) is that these only cover the Royal mint, but until 1553 other mints were in operation in several English towns.117 I have applied a partial correction for this by using the additional information in Munro (1983, p.127-37), but it must be recognized that much variation in provincial mint output remains unaccounted for at an annual level. However, notice that this will not lead to systematic biases over the long run since the stocks in table 2 above have already corrected for this by using estimates adjusted to the output of provincial mints (Allen 2001, 2012).
The presence of , the change in hoarding, is required because the proportion of precious metals which finds its way into the monetary base changes as agents change how much is held in plate (Mayhew 2012).118 For instance, much of the value of currency melted down for hoarding purposes can be inferred from the Goldsmiths’ company data (Mayhew 2012), as it had the monopoly over hallmarking – of silverware and jewellery as well as gold, despite the name of the company.
115 All stocks are end-of-period stocks (and appropriately annualized, when necessary, to the year in which the
majority of the period refers to). 116 As Glassman & Redish (1985, p.32) notice when discussing the French case, ‘Balance of payments surpluses were
recorded in mint output, at least when settled in coin taken to French mints. Balance of payments deficits, however, caused specie exports not recorded in mint output’.
117 Regional mints opened during some exceptional periods of the early modern period such as the Civil War when a Royalist mint was briefly set up and the Great Recoinage; Challis (1992) includes supplementary information for these periods, which I include in my calculation.
118 Notice that precious metals melted to be used as plate leave circulation but not those hoarded as coin; when savings increase and people are hoarding currency the circulating fraction of money supply decreases but in an aggregate model this simply corresponds to a decrease in velocity.
New Researchers - Session I / C
38
Finally, is a ‘wastage’ residual that includes coin melted down or exported. Since for some years we know the value of the stock of coin in circulation (table 1), it is possible to calculate the annual residual as ‘whatever it needs to be’ in the intervening period between benchmarks so that the estimated C at the next period for which we observe it matches the predicted value, after and have been accounted for.119 I call this the ‘direct method A’. The resulting annual estimates are shown in the broken gray line of figure 2. 2.3. Direct estimates B: the baseline direct method Direct estimates A implicitly assume that recalls were uniformly distributed between the known stocks. This was not the case: recalls were often concentrated in time – usually in the context of full or partial recoinages – and ignoring this would lead to misleading estimates, with predicted but spurious peaks of coin supply, due to double-counting, at the time of re-coinages, such as the 1690s and the 1770s (figure 3).
The estimates can be further improved upon by paying close attention to each of the ‘suspect’ periods which can be identified both from the narrative literature and from informal comparison with the indirect estimates of section 2.1., and making appropriate adjustments as necessary.120 I now discuss a few periods for which I have done so to improve the credibility of the resulting estimates.
The great recoinage of 1697-8. The great recoinage was caused by a number of factors including the need to substitute the badly worn out coinage. The intellectual debate surrounding the recoinage has been studied in detail and does not need to be repeated here (see for instance, Horsefield 1960, p.256 or Sargent & Velde 2002). It is, however, important to understand that because the Locke-Newton position prevailed vis-à-vis that of Lowdes, the money supply may have fallen by up to 40 per cent. According to Craig (2010/1953, p.193), about £9.6 million in face value was retrieved for recoinage, £4.7 million of which was accepted in face value, being that the rest was only accepted by weight. According to Clancy (1999, p.15): “The vast majority, in the region of 10 million, of the old currency was withdrawn over the course of several years and what remained unaccounted for was in any case demonetized in January 1698 … 6.8 million was produced to replace the hammered money, which meant that the resulting silver circulation was reduced by 38 per cent”.
Hence I input that in the 1696 and 1697 years the residual has to be Clancy’s 10 million (divided evenly between 1696 and 1697), and otherwise I follow the usual methodology as in the previous subsection. This leads to an important – and much more historically realistic – result when compared with the direct A (naïve) estimates. (The practical difference is illustrated in figure 4.) Hence my direct B (baseline) estimates indicate that the value of the coin stock fell in real terms from 12.4 million in 1695 to 10.2 in 1696 and 9.0 in 1697. Then, it restarted growing.
The 1733-4 recoinage. Challis (1992, p.439) mentions a partial gold recoinage in these years of “more than 15,500 lb of old hammered coins”, which were withdrawn and recoined; cross-checking with the totals in table 63, p.432, we can see that one lb corresponds to about 46.725 pounds; hence an average of about £362 thousands per year will have been recoined in those two years. These are the additional outflows I assume for those two years in the baseline estimates. (In addition to the 207 thousands estimated residually.)
The 1773-7 recoinage. Once the quality of coinage began to be threatened, a gold recoinage took place in the 1770s. Challis (1992, p.440) suggests the £16.5m in gold minted then represented about 75 per cent of the total gold currency. Also according to the same source, the recoinage took four years to complete, 1773-7. I hence assume an additional outflow of £4.125m per year over this period in the baseline estimates. Adding the regular residual then increases the total to £4.397m over these four years. 119 Hence notice that while this residual is unobserved at an annual level, the information contained in stocks which we
observe force it to be ‘correct on average’ between these. 120 Since velocity only changes very slowly at best over the long run, a prolonged deviation of the direct estimates
from the indirect is a red flag.

New Researchers - Session I / C
39
3. Conclusion The baseline estimates are shown in the solid grey line of figure 2 (direct method B). Comparison with the broken grey line, corresponding to the naïve direct method (A) suggests considerable improvement. Comparison with the indirect method estimates in black suggests a smoother, more historically realistic path, which further has the advantage of being independent of any income data in its construction.
I have resisted the temptation to extend the methodology in order to link my estimates to those of Capie & Webber (1985), which start in 1870, because the nineteenth century poses difficulties that come out of the scope of this essay. But I believe this can be done in the future. References
Allen, M. (2001). The volume of the English currency, 1158-1470. Economic History Review 54, pp.595-611.
Allen, M. (2011). Silver production and the money supply in England and Wales, 1086-1500. Economic History Review 64 (1).
Allen, M. (2012). Mints and Money in Medieval England. Cambridge University Press. Bordo, M. and L. Jonung (1987). The Long-Run Behavior of the Velocity of Circulation: the
International Evidence. Cambridge University Press. Broadberry, S., B. Campbell, A. Klein, M. Overton, and B. van Leeuwen (2014). British
Economic Growth, 1270-1870. Cambridge University Press Cameron, R. (1967). England, 1750-1844, in Cameron, R. (ed.), Banking in the Early Stages of
Industrialization: A Study in Comparative Economic History, New York: Oxford University Press, 15-59.
Capie, Forrest (2004). Money and economic development in England. In: Exceptionalim and industrialization, edited by Leandro Prados de la Escosura. Cambridge University Press.
Capie, F. and A. Webber (1983). Total coin and coin in circulation in the United Kingdom, 1868-1914. Journal of Money, Credit and Banking 15, 1: 24-39.
Capie, F. and A. Webber (1985). A Monetary History of the United Kingdom: 1870-1982. Routledge.
Chow, Gregory and A. Lin (1971). Best Linear Unbiased Interpolation, Distribution, and Extrapolation of Time Series by Related Series. The Review of Economics and Statistics, Vol. 53, No. 4, pp.372-375.
Challis, C. E. (1992). Lord Hastings to the great silver recoinage 1464-1699. In: New History of the Royal Mint, ed. C. Challis. University of Cambridge Press.
Clancy, Kevin (1999). The recoinage and exchange of 1816-17. PhD dissertation, University of Leeds.
Craig (2010/1953). The Royal Mint. Cambridge University Press. Glassman, Debra and Angela Redish (1985). New Estimates of the Money Stock in France, 1493-
1680. The Journal of Economic History 45 (1): 31-46. Horsefield, John Keith (1960). British Monetary Experiments, 1650-1710. Harvard University
Press. Mayhew, N. (2012). Silver in England 1600-1800: Coinage Outputs and Bullion Exports from the
Records of the London Tower Mint and the London Company of Goldsmiths. In Money in the Preindustrial World, edited by John Munro, Pickering and Chatto.
Mayhew, N. (2013). Prices in England 1170-1750. Past and Present (2013) 219 (1): 3-39. Munro, John (1983). Bullion Flows and Monetary Contraction in late-Medieval England and the
Low Countries. In: Richards (ed.), Precious metals in the later medieval and early modern worlds. Carolina Academic Press.
O’Brien, Patrick K. and Palma, Nuno (2015). The Bank of England, Warfare, and the State. Unpublished manuscript.
Sargent and Velde (2002). The Big Problem of Small Change. Princeton University Press.

New Researchers - Session I / C
40
Appendix: Tables and figures
Table 1: Benchmarks for the value of English nominal coin supply and implied velocity, 1270-1790
Year
Coin stock value
(preferred estimate)
Implied V of coin stock
Year
Coin stock value
(preferred estimate)
Implied V of coin stock
1279 0.6 6.09 1548 1.76 3.97 1282 0.835 5.49 1549 1.92 4.35 1290 1.0 3.31 1551 2.02 5.71 1299 1.1 4.37 1560 1.71 6.89 1310 1.5 3.85 1561 1.45 8.82 1319 1.5 2.68 1600 3.5 6.65 1331 1.2 3.16 1643 10 3.91 1351 0.6 5.98 1670 12 3.90 1377 1.92 2.27 1688 10 5.14 1422 1.285 2.06 1700 10.75 7.07 1470 0.9 4.53 1750 18 5.06 1526 1.4 3.5 1790 44 3.88 1546 1.45 5.98
Sources: For 1279-1470, Allen (2011, 2012); From 1526 to 1700, Mayhew (2013, p.26), where 1551 corresponds to an average of the two available estimates for that year; for 1700, Mayhew (2013, p.29). For 1688-1750, these are the estimates of Cameron (1967), endorsed by Mayhew (2013, p.30).
Figure 1: Benchmark velocity estimate used in the indirect method
Sources: see text.

New Researchers - Session I / C
41
Figure 2: English nominal money supply 1279-1790
Sources: my calculation based on a series of sources; see text for details.
Figure 3: Gross mint output at constant prices of 1700
The peaks in the 1690s and 1770s correspond to re-coinages; see Horsefield (1960, p.51-2). Source: Challis (1992); the GDP deflator is from Broadberry et al. (2014).

New Researchers - Session I / C
42
Figure 4: Recalls correction made for the Great Recoinage period

New Researchers - Session I / C
43
The Bank of England as Lender of Last Resort during the 1772-3 credit crisis
Paul Kosmetatos, University of Cambridge
([email protected]) Supervisor: Dr D’Maris Coffman
On 9 June 1772, the London banker Alexander Fordyce absconded after being caught wrong-footed in his speculations in East India stock. His flight and surrender the following September was the first act of a multifaceted financial crisis which lasted for about a year. The initial distress in London peaked on 22 June with a series of bank runs, when ‘a universal bankruptcy was expected, and the stoppage of every banker looked for’.121 The impact in Scotland was even more spectacular when the ambitious and experimental Ayr Bank (Douglas, Heron & Co.) also stopped payment on 24 June with over £1.2 million in liabilities.122 A second phase of the crisis centred on Amsterdam in the winter of 1772-3, with the collapse of the bank of Clifford & Sons among others.123
The 1772-3 crisis has been identified as one of the earliest purely financial crises, in which government policy or European war played no significant role.124 It has furthermore long been associated with Adam Smith’s monetary analysis in Book II of the Wealth of Nations, where the failure of the Ayr Bank is used to demonstrate the pitfalls of a poorly constructed paper money system.125 It displayed a wide geographical reach, affecting in apparent sequence England, Scotland, the Netherlands and the British colonies in North America, suggesting the presence of systemic risk in eighteenth-century finance. Contemporaries were aware of the danger of financial contagion, using the very word on at least one occasion,126 and identifed the systemically important players whose failure might exacerbate it.
At the outbreak of the crisis, the Bank of England intervened by increasing bills discounts, advancing credits to selected bankers, and facilitating private sector rescues of others. This rapid and decisive response has suggested to some that it may have been acting as de facto Lender of Last Resort (LLR) to the financial system, some thirty years before the first theoretical articulation of the concept.127 This view as it applies to Scotland has been challenged from the side of the ‘Free Banking’ theory, which argues that the country’s banking system before 1844 operated wholly free from the interference of a privileged bank,
121 Scots Magazine XXXIV (1772): 304-18. 122 S. G. Checkland, Scottish banking: a history, 1695-1973 (Glasgow 1975): 124-35, Henry Hamilton, ‘The
failure of the Ayr Bank, 1772’, Economic History Review, 8 (1956): 405-17, Charles Munn The Scottish provincial banking companies, 1747-1864 (Edinburgh 1981): 36-9, Richard Saville, Bank of Scotland: a history, 1695-1995 (Edinburgh 1995): 156-66.
123 Charles Wilson, Anglo-Dutch commerce & finance in the Eighteenth Century (Cambridge 1941): 169-88. 124 Julian Hoppit, ‘Financial crises in 18th Century England’, Economic History Review, 39 (1986): 39-58. 125 Adam Smith, An inquiry into the nature and causes of the wealth of nations (Oxford 1976): II.ii.73-7, S. G.
Checkland, ‘Adam Smith and the bankers’, in A. S. Skinner and T. Wilson, eds., Essays on Adam Smith (Oxford 1975), Hugh Rockoff, ‘Parallel Journeys: Adam Smith and Milton Friedman on the Regulation of Banking”, Journal of Cultural Economy, 4, 3 (2011): 255-83.
126 Public Advertiser, 8 July 1772. 127 Charles Kindleberger, Manias, panics, and crashes: a history of financial crises (New York, 2000): 162,
Michael Lovell ‘The Role of the Bank of England as lender of last resort in the crises of the Eighteenth Century’, Explorations in Entrepreneurial History, 10 (1957): 8-21, Jacob Price, ‘The Bank of England’s discount activity and the merchants of London, 1694-1773’, in I. Blanchard, A. Goodman, and J. Newman (eds.), Industry and Finance in Early Modern History; Essays presented to George Hammersley on the occasion of his 74th birthday (Stuttgart 1992): 92-114, Henry Thornton, An enquiry into the nature and effects of the paper credit of Great Britain (1802).

New Researchers - Session I / C
44
including its role as LLR in a crisis.128 This often vigorous debate has been based on a small number of secondary works rather than on primary sources.129 This paper aims to correct this as far as 1772 is concerned.
At the centre of the Bank’s actions was the classical LLR operation of ‘lending to the market’ by greatly increasing the volume of its bills of exhange discounts (figure 1). The peak in discounting activity in June 1772 was very pronounced at twice the level of the equivalent response during the 1763 and 1778 crises. On the peak date of 25 June alone, three days after the London bank runs, the Bank discounted nearly as much as the busiest week in 1763. Its bullion reserves accordingly fell to the point of a large stock of Spanish silver pieces apparently having to be pressed into service.130
The Bank moreover provided emergency liquidity to specific firms (table 1). £160,000 of long term loans were supplied for the benefit of the Scottish trading house of William Alexander & Sons, who were connected with such central players of the crisis as the London private bank of Glyn & Hallifax and the Ayr Bank. This assistance took the form of an undertaking to discount bills drawn by Alexanders’ on the London banks of Walpole and Ellison, and Walpole, Clarke and Bourne. Thus in effect the Bank rescued the latter rather than Alexanders’. This loan is notable for having been secured on mortgages, which contravened the Bank’s normal lending practice, and for being the one occasion when it eventually lost money when Alexanders’ could not after all escape bankruptcy.131 A further £263,000 were advanced in short-term loans to ten bankers, £200,000 of which during the critical 23-24 June period. It is unknown whether any collateral was offered in return for these, but it is plainly evident from the ledgers that these were conventional loans rather than bills discounts. The Bank was finally prepared to help the ailing Ayr Bank by offering to double the size of its discount facility to £300,000.132 The Ayr Bank directors declined this offer, instead opting to issue life annuities in the open market.133 If this abortive loan is included, the Bank was prepared to lend over £570,000 in addition to increasing discounts, of which £423,250 were actually disbursed.
The Bank also advanced £1.5 million to the East India Company as part of the Regulating Act of 1773, which helped tidy over the latter’s insecure finances at the price of some loss of independence,134 and facilitated the private sector rescue of Glyn & Hallifax which had also suspended payments on 22 June.135 An account under the names of John Woodhouse (a known associate of Sir Richard Glyn), James Calvert, and Peter Hodson, disbursed £89,138 between 8 July and 6 August (figure 2). Excepting two block payments for a total of £38,681, the other 502 payments were all below £1,000, with daily totals averaging between £2,000 and 4,000. The regular denominations, moderate payment sizes, and names of
128 Lawrence White, Free Banking in Britain: Theory, experience, and debate, 1800-1845(Cambridge 1984),
‘Scottish banking and the Legal Restrictions Theory: a closer look’, Journal of Money, Credit, and Banking, 22, 4 (1990): 526-36, ‘Free banking in Scotland: reply to a dissenting view’, Cato Journal, 10, 3 (1991): 809-19, Sheila Dow and John Smithin, ‘Free banking in Scotland, 1695-1845’, Scottish Journal of Political Economy, 39, 4 (1992): 374-90, Murray Rothbard ‘The myth of free banking in Scotland’, Review of Austrian Economics 2 (1988): 229-45, Larry Sechrest ‘White’s free-banking thesis: a case of mistaken identity”, Review of Austrian Economics, 2 (1988): 247-57’ and ‘Free banking in Scotland: a dissenting view’, Cato Journal, 10, 3 (1991): 799-808, Tyler Cowen and Randall Kroszner, ‘Scottish banking before 1845: a model for Laiisez-Faire?’, Journal of Money, Credit, and Banking, 21, 2 (1989): 221-31.
129 Charles Munn, ‘Comment on Chapter 2’, in F. Capie and G. E. Wood (eds), Unregulated banking: chaos or order? (London 1991): 63-7.
130 Bank of England Archives (BOE) ADM 7/21, fos 17, 19. 131 National Archives of Scotland (NAS) CS181/6942, CS222/278. 132 BOE G4/21, fo. 260. 133 Paul Kosmetatos, ‘The winding-up of the Ayr Bank, 1772-1827’, Financial History Review, 21, 2 (2014):
165-190. 134 BOE G4/21, fo 359. 135 The National Archives (TNA) B4/21.

New Researchers - Session I / C
45
beneficiaries (which included several known City bankers) give a strong impression that this was a bridge facility set up to satisfy maturing bills of exchange. Glyn & Hallifax fully settled this account with two block payments on 6-8 August and resumed payment, after which the commission of bankruptcy was superseded.
It is thus indisputable that, though it did not quite use all the instruments in Walter Bagehot’s quote about the 1825-6 crisis, in 1772-3 the Bank also came close to lending money “by every possible means and in modes [it] had never adopted before”.136 What is not as straightforward is how much this represented the conscious policy of a LLR, and whether its chief motivation was the preservation of the financial system from contagion. According to the Free Banking thesis, the Bank’s actions did not conform to the LLR prescription by being ad hoc and not pre-announced. Specifically, it is disputed that there was ever an implicit assumption that the Bank was to serve as a ‘backstop’ of Scottish credit, while the terms of the proposed Ayr Bank rescue are held up as much too strict for it to be a true LLR action.137
There survives little documentary evidence, such as resolutions by the Court of Directors or internal correspondence, that directly illustrates the Bank’s decision making. This is as true of discounting policy, as it is of the authorization of the targeted direct loans.138 The sole exception concerns the abortive Ayr Bank loan which was explicitly authorized on 18 June 1772. The rejection of this offer by the Ayr Bank is hard to comprehend. The terms, which included mortgages on estates to the value of £150,000 and the personal bonds of the most prominent backers of the project, were certainly thought of as very severe by some,139 but were in fact much less so compared to those achieved by the open market fundraising it opted for instead. Rather than the maximum legal interest of 5 per cent per annum that would have been due to the Bank of England, the Ayr Bank paid up to 14 per cent per annum for its annuities, as the latter were not subject to usury laws. Moreover, the personal security of its most prominent backers was still required to issue them, so it is hard to understand why this was less onerous than the Bank’s terms.140 It is anyway inconsistent to view the loan’s severe terms as an argument against the Bank’s posited LLR role, when one of the requirements of the classical prescription is exactly to only lend money at high or penalty rates to prevent moral hazard.141
Scottish credit was furthermore dependent on the health of the London money markets. The convertibility of Scottish paper money to specie had always been more a fiction than a rigid rule, as what backed the various banknote issues had been a mixture of a little bullion and rather more London bills of exchange. Not only had the various bank runs in Edinburgh drained the monetary system from what little hard cash was available, but the disruption to the London bills of exchange market damaged what was arguably its senior component. By rescuing the London bills market and supporting the one instrument that was both liquid and abundant, the Bank of England really did act as the backstop of Scottish credit.
The absence of internal Bank debate may well signify that its practices were already developed enough to be implemented quickly and without controversy, and that intervention was not considered a novelty, nor especially contentious. This is supported by the tone 136 Walter Bagehot, Lombard Street, a description of the money market (1873): 51-2. 137 Lawrence White, ‘Banking without a Central Bank: Scotland before 1844 as a ‘Free Banking’ system’, in F.
Capie and G. E. Wood (eds), Unregulated banking: chaos or order? (London 1991): 53-6. 138 The only change in official discounting policy occured in 13 May 1773, i.e. a year after the crisis (BOE
G29/1, fo. 6). 139 Adam Smith, The Correspondence of Adam Smith (Oxford 1976), David Hume to Adam Smith, [October
1772]: 165. 140 Committee of Inquiry appointed by the Proprietors, The precipitation and fall of Mess. Douglas, Heron, and
Company, late bankers in Air with the causes of their distress and ruin, investigated and considered (1778), Appendix VIII: 93-6.
141 Thomas Humphrey and Robert Keleher, ‘The Lender of Last Resort: A Historical Perspective’, Cato Journal, 4 (1984): 275-318.

New Researchers - Session I / C
46
discerned in press commentary and the correspondence among insiders. The Bank was widely assumed to be ‘the stronghold of public credit, which it [behoved it] well to fortify amidst the present shocks’.142 This conviction extended even to unfriendly commentary, particularly over the choice of beneficiaries for its emergency largesse. Some of these, like Archibald Stewart who was the ‘Douglas’ of Douglas Heron & Co., or the two Walpole firms, can be characterized as insiders, and some, like the East India Company’s Chairman in 1772 and notorious speculator Sir George Colebrooke, even undeserving ones. Colebrooke’s ‘systemically important’ status was assumed by many,143 but he had been rescued even as he was endeavouring to corner the world commodity markets,144 while his insider trading in India stock had been a minor scandal since 1771.145 One of Fordyce’s partners later complained that by its ‘uncustomary interposition’ during the crisis the Bank of England had interfered with the fair market in shares to save a small number of well-connected players:
The Bank Directors … ventured to advance immense sums to Sir George [Colebrooke] and other bankers … Sir George had against me £110,000 India Stock, which by the Bank supporting him did not come to market … Had not [he] and several other Bankers been supported I would have recovered my fortune … [He] and a few friends were saved at our expense.146
That said, the favouritism argument can only be taken so far. Despite all the aid he received or his apparent clout, Colebrooke could only fend off bankruptcy till 1778.147 The Ayr Bank, too, was eventually wound up, albeit in a more orderly fashion. The likeliest interpretation remains that the Bank did what was required to save systemically important players while contagion was still a danger, but left them to fend for themselves when the crisis was in the past. In any event, even hostile commentary did not extend to doubting the Bank’s unique role. If anything, insiders like George Home, the Ayr Bank’s factor and manager after 1773, were convinced it hadn’t gone far enough in June 1772:
The Bank of England, who alone could stem the torrent by a liberal discount, withheld even the usual supplies which increased the evil. They saw their error when too late, and found millions insufficient to remedy what a few hundred thousands would have prevented.148
The evidence presented above disproves this, but such attitudes are illustrative of contemporary conviction that the Bank was not only uniquely placed to cushion the financial system from crisis, but that it was expected to do so. By contrast, the government was not thought of as an appropriate agent of intervention, and certainly less so than those individuals who might be involved in the distressed companies. Such private sector intervention did take place in 1772-3,149 but it was the comparative scale of the Bank of England’s actions and the universal acknowledgement of its unique position and resources that put it in a league of its own.
142 Bingley’s Journal, 20-27 June 1772. 143 William Bodham Donne (ed.), The correspondence of King George the Third with Lord North from 1768 to
1783 (London 1867), I, 154, 1 January 1773, The King to Lord North: 121, NAS GD44/43/88/46, Charles Gordon to the Duke of Gordon, 31 March 1773.
144 Lucy Sutherland, ‘Sir George Colebrooke’s world corner in alum, 1771-73’, Economic History: A Supplement to the Economic Journal III (1934): 237-58.
145 General Evening Post, 17-19 December 1771, Public Advertiser, 24 January 1772. 146 British Library Add 38208, fos 176-7, William James to Charles Jenkinson, 14 September 1775 147 TNA B6/5, fos 126, 212. 148 NAS GD267/22/7/57, George Home to Patrick Home, 29 June 1772. Emphasis added. 149 Royal Bank of Scotland Archives RB/12/11, fo. 75, NAS GD267/3/3/1, George Home to Patrick Home, 11
January 1773.

New Researchers - Session I / C
47
Figure 1: Weekly histogram of average daily volume of bills discounted by the Bank of England, 1771-3 (amounts in pounds sterling)
Source: BOE ADM7/20.

New Researchers - Session I / C
48
Table 1: Bank of England targeted emergency liquidity (amounts in pounds sterling)
Recipient Date of
LoanLoan
AmountDate of
Repayment Repayment
amount
Robert Ladbroke & Co. 23/6/1772 30,000 11/7/1772 10,000
25/7/1772 10,000
30/7/1772 10,000
Charles Asgill & Co 23/6/1772 25,000 1/7/1772 25,000
Joseph Chaplin Hankey, Esq 23/6/1772 10,000 19/8/1772 10,000
Boldero, Kendall & Co 23/6/1772 9,000 16/2/1773 9,000
Snow, Denne & Co. 23/6/1772 50,750 21/8/1772 50,750
John Robert & HenryDrummond 23/6/1772 40,000 21/8/1772 30,000
24/6/1772 30,000 24/12/1772 40,000
Archibald Stewart & Co. 23/6/1772 8,500 1/7/1772 8,500
George Shergold 7/6/1772 20,000 8/9/1772 20,000
Dorrien, Rucker & Co. 8/9/1772 20,000 11/11/1772 2,000
13/1/1773 3,000
3/2/1773 15,000
Sir George Colebrooke 16/10/1772 20,000 20/4/1773 20,000
Total short‐dated advances 263,250
(of which made only on June 23‐24 1772 203,250)
Assistance to William Alexander & Sons 160,000
Total direct loans made 423,250
Proposed augmentation of Ayr Bank discount facility (not concluded)
150,000
Bank's readiness for committing directly 573,250
Government's East India Company commitment through Regulating Act
1,400,000
(less) Bank's rolling pre‐crisis East India Company loan, now suspended (average)
(400,000)
Total direct public injection of capital 1772‐3 1,423,250
Sources: BOE ADM7/20 fos. 691‐4

New Researchers - Session I / C
49
Figure 2: Daily debit activity of Bank of England joint account of John Woodhouse, James Calvert and Peter Hodson
Sources: BOE C98/2766 fos 5985-93 & 6758-61, RBS GM/136.
New Researchers - Session I / C
50
The big problem of small change in late Imperial China: silver inflow, rural deflation, and how it was solved by new
copper minting technology, 1890-1910
Xun Yan, London School of Economics ([email protected])
Supervisors: Dr Debin Ma & Professor Albrecht Ritschl Introduction
Silver tael had been the major currency for China’s overseas trade until the mid-1930s, although China was not a silver producing country and its silver supply relied on overseas supply. Therefore one focus on Chinese economic history is the relationship between silver (its international price and supply) and China’s economic condition (economic growth and trade). Whether silver inflow/outflow leads to economic boom/depression is an ongoing debate.150 Theoretically cheap silver (a low price of silver in the international market which normally also leads to a silver inflow) would indicate a favourable term of trade for China while expensive silver would discourage exports.151 However, a glimpse of trade statistics contradicts the idealized scenario: since the 1870s many European countries adopted the gold standard and demonetized silver; the price of silver dropped drastically, but Chinese exports did not benefit from this price drop (figures 1 and 2). On the contrary China experienced a growing trade deficit since the 1880s.152
This situation could only be explained when copper cash – the other half of the bimetallic system – is taken into account. Chinese goods were initially quoted in copper cash and then exchanged into silver at the point of export with a floating exchange rate. In fact while China experienced a drastic inflow of silver in late nineteenth century, its vast rural area was suffering from a shortage of copper cash. This paper looks into historical archives and identifies a monetary shortage situation despite an inflow of silver; it considers the newly established provincial mints as a response to the money shortage instead of a purely economic pursue; it then argues with a simplified statistic test that the new copper coinage by steam engine solved the shortage problem.
I. Cheap silver and copper cash shortage
This bizarre trade deficit should be attributed to China’s particular bimetallic system composed of uncoined silver and coined copper cash. The Chinese monetary system differed from the bimetallic system in medieval Europe in several aspects: the supply of money, the exchange rate between the two metallic monies, and the function of the monies. Unlike the free minting practice in Europe, the Chinese state mints monopolized copper mining and the minting of copper cash. The state did not however mint silver and the supply of silver was determined by the market. Therefore copper cash circulated by tale while silver circulated by weight.153 Because of the huge difference in terms of value, these two metallic monies served 150 For analysis with historical events see William S. Atwell, 'Notes on Silver, Foreign Trade, and the Late Ming
Economy', Late Imperial China (Ch'ing-shih wen-t'i) 3, no. 8 (1977). Mio Kishimoto-Nakayama, "The Kangxi Depression and Early Qing Local Markets," Modern China 10, no. 2 (1984). For more recent debate see papers of Von Glahn, Irigoin, Kishimoto and Lin in Asian Historical Economics Conference (Hitotsubashi University, Japan, 2012).
151 Milton Friedman, 'Franklin D. Roosevelt, Silver, and China', The Journal of Political Economy 100, no. 1 (1992): 62-83.
152 C. F. Remer, 'International Trade between Gold and Silver Countries: China, 1885-1913', The Quarterly Journal of Economics 40, no. 4 (1926).
153 Standard copper cash bared no face value; they were of uniformed size and counted by numbers. Each copper cash is counted as 1 wen. Silver circulated in many forms (as foreign silver dollars or simply in bullion), and was measured by ghost units such as ‘haikwan liang’ (customs tael).

New Researchers - Session I / C
51
distinct functions: silver was used for wholesale transaction and long-distance trade, while copper cash dominated retail activities and the rural market. It was only in trade and commercial centres that copper cash were treated as a form of subsidiary money. Despite the state attempt to fix the silver-copper exchange ratio (at 1 tael = 1000 wen), the actual exchange rate between the two monies fluctuated according to the market and varied from place to place. The discrepancy in exchange ratio did not impose too much of a problem as the domestic market was not well integrated.
Because of its low face value and the high cost of minting, the insufficient supply of copper cash had been a long-standing issue similar to the situation in medieval Europe. In the nineteenth century, the state copper mine was almost depleted and the state mints had to rely on imported copper for copper cash coinage, further raising the cost of minting. Towards the end of the century, imported copper metal became even more expensive due to the decreasing purchasing power of silver. Mint production was virtually suspended in spite of a growing market demand with the expansion of trade and economy. With the changes in relative price of the two metals in international market, copper cash became increasingly an ‘undervalued money’. As a result large quantities of good copper cash was melted to make utensils or exported. Copper cash that remained in circulation were often spurious coins, impeding trade and exchange. The phenomenon of the ‘dearness’ (in terms of their silver prices) and then ‘scarcity’ of cash was omnipresent from commercial centres along the coast to trade points in the remotest area.
Although a money with small value, copper cash served much more than a form of subsidiary money. While silver helped enlarge the whole money stock in China and facilitated long-distance trade, it was copper cash that appeared to be a full functioning currency. Copper cash was almost the only accepted currency in rural areas. And in urban areas, it was still the only money used in real daily transactions. An imperial customs officer made such an observation in 1899: ‘copper cash is the real coin of the country: the entire trade is conducted in it. The farmer will take nothing else for his produce. Produce is bought, goods are sold, and prices are quoted in cash’.154 The shortage of copper cash in China therefore exhibits a big trouble. Merchants found that copper cash was much more expensive and scarce in numbers: much fewer cash could be exchanged for one tael of silver; therefore more silver was needed in order to exchange for copper cash and to purchase rural produces, making export business less profitable. In rural area, the scarcity of copper cash would further discourage agricultural output and thus lower potential export capacity. II. New coinages as remedies
The late nineteenth century was an era of decentralization: after a series of domestic insurgences, the central government relied almost solely on regional military forces; and in return regional governors also gained more fiscal discretion including a greater liberty in operating their own mints which were part of the state mint system.
Several policy remedies were pushed forward and they were mainly local initiatives. The first reaction of many provincial governors was to ban the export of copper cash to other provinces. It was the most straightforward way which was costless and involved less bargaining with the central government. However, the restriction on the free flow of copper cash blocked trade and interregional business, and created more regional disequilibrium.155 Acknowledging the failure of banning, provincial governors all started reviving their own provincial mints. This ‘new wave of minting’ started with a revival of debased copper cash coinage (too expensive and stopped quickly), followed by the introduction of silver subsidiary dollars, and finally the introduction of new types of copper coins.
154 Imperial Maritime Customs, Returns of Trade and Trade Reports. Shanghai: Statistical Dept. of the
Inspectorate General (1899): 88. Hereafter referred to as ‘RTTR’. 155 Ho, 'From Cheap Silver and Copper Famine to Depreciation of the Copper Coinage', 412-3.

New Researchers - Session I / C
52
In 1889, the first silver mint equipped with brand new steam engine machines was established in Guangdong Province under the propaganda of ‘get back the right to seigniorage (from foreign silver dollar providers)’. In 1890 it started to mint silver dollars as well as silver subsidiary coins of 10, 20 and 50 cents. It was the first time that the state authority manufactured its own silver coins. Other provinces followed suit after 1896 and by 1900 there was at least one silver mint in every province. These silver mints concentrated on producing silver subsidiary coins which contained contain proportionately less silver content compared to silver dollars.156 The silver subsidiary coinage was welcomed in some cities but not all of them.157 And it was not a recognized means of exchange in rural area. Due to a serious over-issue and uneven qualities of small silver coins from different mints, small silver coins depreciated quickly and circulated at a discount. The silver coinage of most mints was suspended in 1901 by imperial mandate.
The new copper coinage started in 1900 and was again initiated in Guangdong. The new copper coinage was very different from the traditional one and was regarded as a great technological and institutional advancement. The traditional copper cash were cast in moulds; they are round coins with a square hole in the middle and they don’t bear denominations. The new copper coins had no square holes; they were struck with machine and had different denominations.158 With lower copper contents and much higher denomination compared to copper cash, the new copper coin was an official debasement. However, it did not invite counterfeiting as debasements usually did in history because of the introduction of new minting technology. Because of their standardized quality greatly facilitated exchange, these coins were readily accepted by the market at their face value. The new coinage was adopted in other provinces within a decade.
III. Why did the new copper coinage, not the silver one, solve the shortage problem?
Many historians tend to criticize the local minting activities of that period: these regional mint innovations were allegedly profit-driven and they only aggravated the already chaotic monetary system of the country. Provinces adopted the new coinage at different times, making regional markets more fragmented. The quality of the new coins varied from province to province, potentially leading to competitive depreciation. The drive for profit lured over issue of the coins and provoked inflation. However, archives on court debate suggest that the new coinages were really local attempts to meet local market needs instead of being purely profit-driven. The inconsistent provincial initiatives might not be ideal but still necessary given the fact that the central government was neither willing nor capable of conducting any reform. Contemporary records further demonstrate that compared to silver subsidiary coinage, the new copper coinage was a success which mitigated the money shortage problem.
There are several reasons for the failure of silver subsidiary coins and the success of new copper coins. First, small silver coins are still too big for small daily transactions. It could not be taken as the unit of account, and it could hardly replace the function of copper cash in rural markets. Moreover, the state did not prohibit the use of silver bullion or foreign silver dollars to promote the use of domestic silver dollars and its subsidiaries. Domestic silver coins were soon taken by their intrinsic value and circulated at a discount. On the contrary, although the new copper coins were also a debased money, they were accepted at their face value because of the market demand, and they circulated with copper cash in rural areas. As it is debased the government was able to provide sufficient copper coins; and thanks to the steam engine technology, this debasement did not invite counterfeiting. Therefore these 156 The fineness of most silver cents was around 0.800 while the finesse of a silver dollar is usually 0.900.
Selected Archive in Modern Chinese Monetary History, Vol. I., 825-6. 157 It was observed in Chungking in 1897 that ‘the use of subsidiary silver coins would tend to relieve the present
dearth of cash’ (RTTR 1897: 71); while in Soochow they ‘[did] not fill the place of copper cash for general use’ and were considered ‘a drug in the market here’. (RTTR 1899: 351).
158 Denominations include 2, 5, 10, and 20 wen.

New Researchers - Session I / C
53
two coinages had distinct institutional impacts on the market: while the silver coinage merely increased liquidity in the silver sector and therefore aggravated the problem of ‘cheap silver’, new copper coins were the first accepted token money in modern Chinese history.
This paper argues that the adoption of steam engine technology for copper coinage would act as a positive shock to the economy, while the silver coinage did not. As the timing of adopting the new coinage technology varied from province to province, a generalized differences-in-differences (DID) estimation can be used to test the impact of the institutional shocks on regional economy before and after the introduction of the new coinages:
(1)
(2) In equation (1), Git is log grain price,159 Silvermintit is a dummy variable equal to 1 if
silver subsidiary coins officially circulated in prefecture i at time t. Xi*trendt is a set of prefecture-specific characteristics interacted with time fixed effects. Xi is a set of controls including size of the prefecture, land tax of each prefecture in 1820, population in 1820, 1851, 1880 and 1910, as well as the approximate acreage of wheat and rice. I also include in the equation a dummy on whether this prefecture belongs to a wheat-(or rice-) producing province (I use a dummy of wheat producing area when wheat price is the dependent variable and another dummy for rice producing area when the dependent variable is rice price). Standard errors are clustered at prefecture level. The coefficient of interest is β1. In equation (2) I replace Silvermintit with Coppermintit (date of introducing copper coins in prefecture i at time t) to estimate the impact of new copper coinage.
Estimation results (tables 1 and 2) show that the introduction of silver mints had a positive effect on the pricing of both wheat and rice, while with the introduction of copper coinage there is a general drop in the commodity price quoted in silver. This suggests that the silver coinage indeed induced inflation. Estimation results on copper coinage also suggest that with the increase in copper coin supply, silver-copper exchange rate adjusted (i.e. increased), while commodity prices quoted in copper remained stable, resulting in a drop in grain prices quoted in silver. Therefore the consequence of copper coinage is deeper monetizing instead of inflating, which would encourage output and also long-distance trade. Concluding remarks
This paper also points out the peculiar features of the Chinese bimetallic system and emphasizes the importance of copper sector in the treatment of Chinese monetary issues.
With DID estimation on grain prices the paper demonstrates that, contrary to the conventional judgement, regional mints were purely profit driven and added to the monetary chaos, the introduction of new coinage with steam engine technology helped ease rural monetary stringency without necessarily generating inflation, and thereby encourage output and trade.
The research also echoes theories on commodity money that coins with smaller denomination are better to be token coins in order to prevent a chronic shortage of them, and that the steam engine technology ensured the provision of token coins without inviting private counterfeiting.
159 The grain price information is extracted from monthly local government report, all prices were local market
price. They should originally be quoted in copper price but in government reports the prices were all converted into a silver price. Two sets of grain prices, rice and wheat, are tested. They are both monthly data at prefecture level from 1880 to 1910. Prefecture is the administrative unit above counties and below provinces. There were in total 18 provinces and around 240 prefectures.

New Researchers - Session I / C
54
Figure 1: Annual London silver price
Figure 2: China’s foreign trade

New Researchers - Session I / C
55
Table 1: Impact of silver coinage on grain prices
Dependent variables Wheat Rice
(1) (2) (3) (4) (5) (6) Silvermints 0.050** 0.144*** 0.144*** 0.097*** 0.160*** 0.160*** (0.028) (0.033) (0.033) (0.022) (0.027) (0.027) Prefecture and time FE Y Y Y Y Y Y Main produce dummy a Y Y Y Y Controls*Time FE Y Y Observations 60418 32682 32682 64864 43940 43940 R-squared 0.706 0.679 0.679 0.794 0.811 0.811
Table 2: Impact of copper coinage on grain prices
Dependent variables Wheat Rice
(1) (2) (3) (4) (5) (6)
Coppermints -0.129*** -0.140*** -0.558*** -0.286*** -0.303*** -0.343***
(0.040) (0.041) (0.069) (0.039) (0.040) (0.046)
Prefecture and time FE Y Y Y Y Y Y
Main produce dummy a Y Y Y Y
Controls*Time FE Y Y
Observations 60418 59478 32682 64864 63741 43940
R-squared 0.709 0.710 0.720 0.807 0.809 0.824

New Researchers - Session I / D
56
Lynchings, labour and cotton in the US South160
Cornelius Christian, University of Oxford ([email protected])
Supervisors: Dr Paul Collier & Dr James Fenske Note: a full-length copy of the paper can be found at: https://sites.google.com/site/corneliuseconomics/home In this paper, I examine lynchings of African Americans in the US South from 1882-1930, and find evidence that lynchings prevented black workers from fully participating in the labour market. Using the fact that world cotton prices are exogenous from a single county’s perspective, I find that cotton price shocks strongly predict lynchings. All this is indicative that greater numbers of lynchings served, at least in part, as a way of controlling black workers.
Using these observations as a guide, I claim that lynchings had labour market effects that benefited white workers. During years of low cotton prices, wages are low. When whites lynch blacks, this causes other blacks to migrate out of a county, thus reducing labour supply and increasing wages. I show in my data that lynchings predict greater black out-migration, and higher state-level agricultural wages. A one standard deviation increase in lynchings within a county leads to 6.5-8 per cent more black out-migration, and a 1.2 per cent increase in state-level wages. To understand these results, I analyse a simple model in which white workers can lynch blacks during low cotton price shocks, reducing labour supply and increasing wages.
I. Data and empirical strategy
Table 1: Summary statistics Variable N Mean Std. Dev. Min Max Lynchings 13,475 0.18 0.86 0 24 Cotton × ln(Price) 13,475 4.20 1.71 0 6.04 Mississippi River × ln(price) 13,475 0.42 1.38 0 6.04 1880 Black Proportion × ln(price) 13,475 1.84 1.10 0.03 5.51 White lynchings 13,475 0.02 0.23 0 11 Executions 13,475 0.12 0.59 0 16 California lynchings 4,032 0.08 0.55 0 15
A. Data
Lynchings: Lynchings data are from Tolnay & Beck (1995), who identified lynchings in 10 southern states: Alabama, Arkansas, Florida, Georgia, Kentucky, Louisiana, Mississippi, North Carolina, South Carolina, and Tennessee. There are 2,805 lynchings in their dataset, and data is collected at the county level, from 1882-1930. Cotton: World cotton price data are from Blattman, Hwang, & Williamson (2007), and are time series data. Cross-sectional data on which counties produced cotton are from the dicennial US Censuses from 1880 to 1930.
160 I am particularly grateful to my advisors Paul Collier and James Fenske for their help and suggestions.
Samuel Bowles and Herbert Emery helped with their extensive comments. I would also like to thank Hoyt Bleakley, Damian Clarke, Joseph Ferrie, Leander Heldring, Anke Hoeffler, Lakshmi Iyer, Suresh Naidu, Simon Quinn, Climent Quintana-Domeque, Christopher Roth, Valeria Rueda, Leonard Wantchekon, James Wisson, Gavin Wright; and participants at the Canadian Economics Association Conference, Centre for the Study of African Economies Conference, Northeast Universities Development Consortium Conference, and Oxford Gorman Workshop for advice and discussions. I am grateful to Elwood M. Beck, Leah Boustan, Dave Donaldson, Richard Hornbeck, Suresh Naidu, and Stewart Tolnay for use of their data. Any errors are my own.

New Researchers - Session I / D
57
Controls: I include a dummy for counties along the Mississippi river, interacted with the lagged cotton price index. The Mississippi River control is included because counties along the river have more fertile soil, ideal for growing cotton. I also include the 1880 black proportion and 1880 black proportion squared, each interacted with the lagged cotton price index. This is to account for the fact that the African American proportion of the population will account for more lynchings. Data on legal executions are from Espy & Smykla (2004).
To account for county boundary changes during this period, I use the Atlas of Historical County Boundaries Project, and then merge counties to their smallest consistent unit, forming multi-county units in many cases. Migration: I acquire micro-level migration data from Boustan et al. (2012), which describes whether an African American migrated from their county of origin between 1920 and 1930. The authors acquired these data from US Census microdata for this period. As controls, I include data on Rosenwald schools from Aaronson & Mazumder (2011). State-level agricultural wages: Data on state-level agricultural wages are from Naidu (2010), who acquires his data from the US Department of Agriculture’s ‘Crops and Markets’ reports from 1866 to 1930.
B. Empirical strategy
I first test whether adverse cotton price shocks are related to lynchings. My main specification is:
Lynchingi,t = βShocki,t + δi + ηt + i,t (1)
Here, Lynchingi,t is the number of lynchings of African Americans in county i in year t.
Shocki,t is a lagged value of Cottonj × ln Pricej . Here, Cottonj is an indicator for whether the county produces cotton from 1882-1930, and is not time varying.
County and time fixed effects are δi and ηt respectively, which I use to control for omitted heterogeneity at the level of counties and years. I show that this is robust to the inclusion of county-specific trends. For my identification strategy, I exploit the fact that world commodity prices are exogenous from a single county’s perspective. My unit of observation is a county-year.
What I am interested in, then, is whether a cotton price shock affects lynchings within a cotton-producing county.
Table 2: OLS results for the effect of cotton shocks on lynchings Dependent variable:(1) (2) (3) (4) (5) (6) Cotton shock -0.082*** -0.071*** -0.048 -0.057*** -0.082** -0.071***
(-2.92) (-3.12) (-1.62) (-2.79) (-1.96) (-2.63) Time FE Yes Yes Yes Yes Yes Yes County FE Yes Yes Yes Yes Yes Yes Controls No Yes No Yes No Yes County time trends No No Yes Yes No No Double clustering No No No No Yes Yes Observations 13,475 13,475 13,475 13,475 13,475 13,475 Counties 275 275 275 275 275 275
Note: t statistics are in parentheses, and standard errors are clustered by county. Controls are the lagged cotton price interacted with: 1880 black proportion of the population, 1880 black proportion squared, and Mississippi River county dummy. * p < 0.
II. Results A. Main results
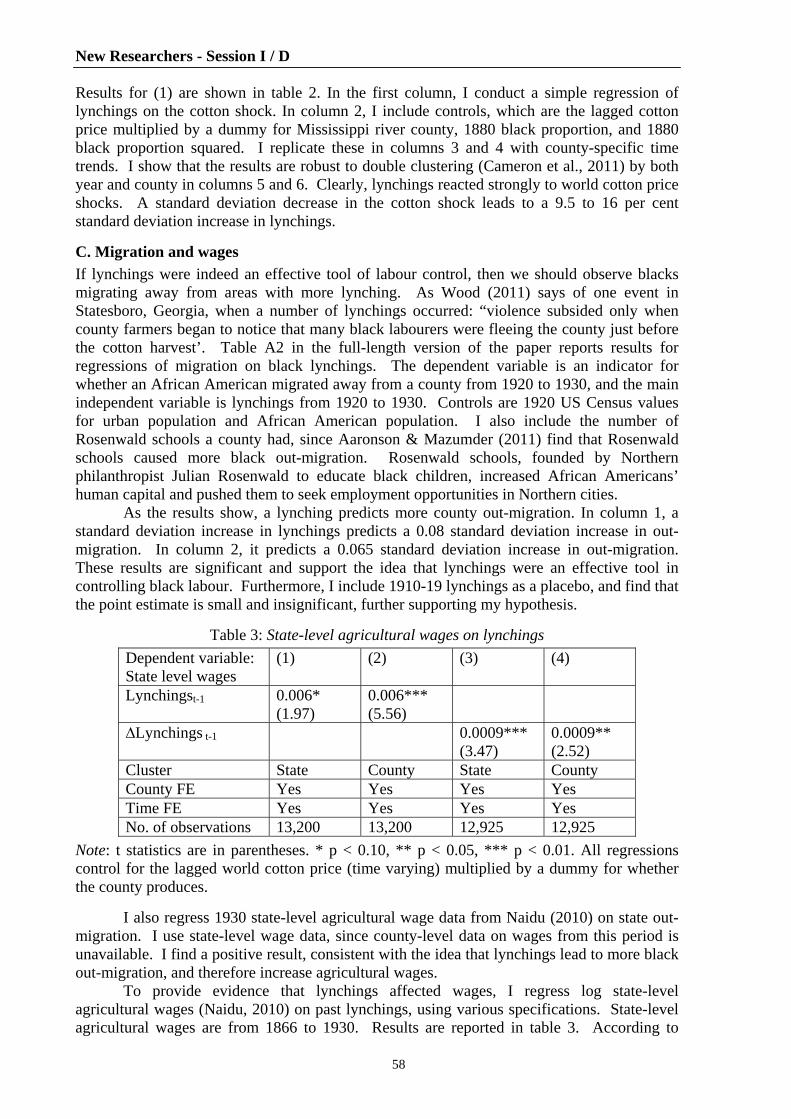
New Researchers - Session I / D
58
Results for (1) are shown in table 2. In the first column, I conduct a simple regression of lynchings on the cotton shock. In column 2, I include controls, which are the lagged cotton price multiplied by a dummy for Mississippi river county, 1880 black proportion, and 1880 black proportion squared. I replicate these in columns 3 and 4 with county-specific time trends. I show that the results are robust to double clustering (Cameron et al., 2011) by both year and county in columns 5 and 6. Clearly, lynchings reacted strongly to world cotton price shocks. A standard deviation decrease in the cotton shock leads to a 9.5 to 16 per cent standard deviation increase in lynchings. C. Migration and wages
If lynchings were indeed an effective tool of labour control, then we should observe blacks migrating away from areas with more lynching. As Wood (2011) says of one event in Statesboro, Georgia, when a number of lynchings occurred: “violence subsided only when county farmers began to notice that many black labourers were fleeing the county just before the cotton harvest’. Table A2 in the full-length version of the paper reports results for regressions of migration on black lynchings. The dependent variable is an indicator for whether an African American migrated away from a county from 1920 to 1930, and the main independent variable is lynchings from 1920 to 1930. Controls are 1920 US Census values for urban population and African American population. I also include the number of Rosenwald schools a county had, since Aaronson & Mazumder (2011) find that Rosenwald schools caused more black out-migration. Rosenwald schools, founded by Northern philanthropist Julian Rosenwald to educate black children, increased African Americans’ human capital and pushed them to seek employment opportunities in Northern cities.
As the results show, a lynching predicts more county out-migration. In column 1, a standard deviation increase in lynchings predicts a 0.08 standard deviation increase in out-migration. In column 2, it predicts a 0.065 standard deviation increase in out-migration. These results are significant and support the idea that lynchings were an effective tool in controlling black labour. Furthermore, I include 1910-19 lynchings as a placebo, and find that the point estimate is small and insignificant, further supporting my hypothesis.
Table 3: State-level agricultural wages on lynchings Dependent variable: State level wages
(1) (2) (3) (4)
Lynchingst-1 0.006* (1.97)
0.006*** (5.56)
∆Lynchings t-1 0.0009*** (3.47)
0.0009** (2.52)
Cluster State County State County County FE Yes Yes Yes Yes Time FE Yes Yes Yes Yes No. of observations 13,200 13,200 12,925 12,925
Note: t statistics are in parentheses. * p < 0.10, ** p < 0.05, *** p < 0.01. All regressions control for the lagged world cotton price (time varying) multiplied by a dummy for whether the county produces.
I also regress 1930 state-level agricultural wage data from Naidu (2010) on state out-migration. I use state-level wage data, since county-level data on wages from this period is unavailable. I find a positive result, consistent with the idea that lynchings lead to more black out-migration, and therefore increase agricultural wages.
To provide evidence that lynchings affected wages, I regress log state-level agricultural wages (Naidu, 2010) on past lynchings, using various specifications. State-level agricultural wages are from 1866 to 1930. Results are reported in table 3. According to

New Researchers - Session I / D
59
columns (1) and (2), a standard deviation increase in lynchings within a county predicts a 0.013 standard deviation increase in state-level agricultural wages. In columns (3) and (4), a standard deviation increase in the change in lynchings predicts a 0.002 standard deviation increase in wages. These results are not large, as I would expect; a lynching within a county will have limited state-level effects.
In sum, lynchings predict out-migration, and out-migration appears to predict wage increases. Furthermore, lynchings predict an increase in agricultural wages. This is all consistent with a labour market mechanism in which whites lynch blacks, which has the effect of raising wages. III. Conclusions
This paper adds to a growing literature on the economics of persecution, and the way that past events and institutions persist through time. The empirical literature has so far not demonstrated that labour market concerns can motivate persecution. In this study, I argue that lynchings of African Americans in the US South were a response by whites to suppress blacks’ participation in the labour market.
I have shown that lynchings were a response to cotton price shocks, and that these effects were stronger in counties with more black farm workers and railroads. The shock’s effect was also stronger in counties with slavery in 1860. Tests using white-on-white lynchings and legal executions of African Americans suggest that this was not merely due to general feelings of frustration. I provide an explanation for these results: during times of low labour demand, due to low cotton prices, whites lynch blacks to drive them away from the labour market. Indeed, blacks appear to migrate after a lynching takes place, as my results show.
These results suggest that violent events, like lynchings, can be motivated by labour market concerns. They further indicate that economic shocks can lead to racist violence. Finally, the evidence seems to support Miguel et al.’s (2004) policy suggestion, that income insurance during hard times may reduce violence. The government can invest in public works programmes or provide its citizens with better access to savings to prevent violent conflict. References
Aaronson, Daniel and Bhashkar Mazumder. ‘The Impact of Rosenwald Schools on Black Achievement’. Journal of Political Economy, October 2011, 119 (5), pp.821-888.
Blattman, Christopher, Jason Hwang, and Jeffrey G. Williamson. ‘Winners and losers in the commodity lottery: the impact of terms of trade growth and volatility in the Periphery 1870-1939’. Journal of Development Economics, January 2007, 82, pp.156-179.
Boustan, Leah, Matthew E. Kahn, and Paul W. Rhode. ‘Moving to Higher Ground: Migration Response to Natural Disasters in the Early Twentieth Century’. American Economic Review: Papers and Proceedings, May 2012, 102 (3), pp.238-244.
Cameron, Colin, Jonah Gelbach, and Douglas L. Miller. ‘Robust Inference with Multiway clustering’. Journal of Business and Economic Statistics, 2011, 29 (2), pp.238-249.
Holmes, William F. ‘Whitecapping: Agrarian violence in Mississippi, 1902-1906’. Journal of Southern History, May 1969, 35 (2), pp.165-185.
Hornbeck, Richard and Suresh Naidu. ‘When the Levee Breaks: Black Migration and Economic Development in the American South’. American Economic Review, forthcoming.
Jha, Saumitra. ‘Trade, Institutions, and Ethnic Tolerance: Evidence from South Asia’. American Political Science Review, November 2013, 107 (4), pp.806-832.
King, Ryan D., Steven F. Messner, and Robert D. Baller. ‘Contemporary Hate Crimes, Law Enforcement, and the Legacy of Racial Violence’. American Sociological Review, April 2009, 74 (2), pp.291-315.
Markovitz, Jonathan. Legacies of Lynching: Racial Violence and Memory. University of Minnesota Press, 2004.

New Researchers - Session I / D
60
McAdam, Doug. Freedom Summer. Oxford University Press, 1990. Miguel, Edward, Shanker Satyanath, and Ernest Sergenti. ‘Economic Shocks and Civil
Conflict: An Instrumental Variables Approach’, Journal of Political Economy, August 2004, 112 (4), pp.725-753.
Messner, Steven F., Robert D. Baller, and Matthew P. Zevenbergen. ‘The Legacy of Lynching and Southern Homicide’. American Sociological Review, August 2005, 70 (4), pp.633-655.
Naidu, Suresh. ‘Recruitment Restrictions and Labor Markets: Evidence from the Post-Bellum U.S. South’. Journal of Labor Economics, April 2010, 28 (2), pp.413-445.
Naidu, Suresh. Suffrage, Schooling, and Sorting in the Post-Bellum U.S. South. 2012 Working Paper.
Nunn, Nathan. ‘The Long Term Effects of Africa’s Slave Trades’. Quarterly Journal of Economics, February 2008, 123 (1), pp.139-176.
Nunn, Nathan and Leonard Wantchekon. ‘The Slave Trade and the Origins of Mistrust in Africa’. American Economic Review, December 2011, 101 (7), pp.
3221-325 Ruggles, Steven, J. Trent Alexander, Katie Genadek, Ronald Goeken, Matthew B. Schroeder,
and Matthew Sobek. 2010. Integrated Public Use Microdata Series. Tolnay, Stewart E., and E.M. Beck. A Festival of Violence: An Analysis of Southern
Lynchings, 1882-1930. University of Illinois Press, Urbana, 1995.

New Researchers - Session I / D
61
“The dust was long in settling”: human capital and the lasting impact of the American Dust Bowl
Vellore Arthi, University of Oxford
([email protected]) Supervisors: Professor Jane Humphries & Dr James Fenske
Note: A full-length draft can be accessed at www.vellorearthi.com/research/ The Dust Bowl, an ecological event characterized by drought, accelerated soil erosion, and severe dust storms, represents one of the most devastating environmental catastrophes in American history. During this crisis, which lasted throughout the 1930s, a series of dust storms ravaged the Great Plains, destroying land, property, and agricultural livelihoods; disrupting public services; and causing injury to health and nutrition (Worster 1979; Hornbeck 2012). Despite recent literature indicating such early-life shocks can radically change the course of human capability formation, and thus shape adult outcomes (Barker & Osmond 1986; Heckman 2007; Almond & Currie 2011), these long-run human costs have been little studied, meaning we may currently underestimate the full toll of this seminal event in American history.
In this paper, I analyse the long-term consequences of the Dust Bowl for the human capital of the children who lived through it. I exploit exogenous variation in the severity of this environmental shock across space – proxied by Dust Bowl soil erosion – to explain variation in adult wellbeing. I test for the degree to which the Dust Bowl scarred human capital in the long run, the mechanisms by which scarring occurred, and the way human capital investments responded to the shock.
I find that childhood Dust Bowl exposure has statistically significant and economically meaningful adverse impacts on later-life outcomes, for instance, increasing disability and reducing fertility and college completion. Furthermore, I find that these adverse impacts are more severe for those born in agriculture-dependent states. Similarly, its effects on health and poverty are strongest amongst those exposed in utero, while those for secondary education are strongest for those exposed in late childhood. Lastly, results imply that post-shock investment compensated for rather than reinforced child endowments.
BACKGROUND
America’s Dust Bowl
During the period 1930-40, poor rainfall and strong winds precipitated a series of massive dust storms across the US Great Plains, in many regions blowing away over 75 per cent of the original topsoil (Hansen & Libecap 2004; Hornbeck 2012). Storms wrought permanent damage, destroying agricultural productivity, decimating crops, and suffocating livestock (SCS 1935; Lord 1938; Cunfer 2005). Accordingly, yields were low and recovery was slow (Hornbeck 2012).
The Dust Bowl was not just an environmental crisis, but a human tragedy as well (Egan 2006). Economic hardship was widespread: meagre harvests meant low incomes, nutritional deprivation, and foreclosure (Worster 1979). More directly, dust exposure led to respiratory illnesses, eye infections, and influenza (SCS 1935; Burns et al. 2012). Financial hardships prompted taxpayers to slash school budgets, while dust storms lowered attendance (Egan 2006; Burns et al. 2012). What was once home became “as nearly a literal hell on earth as can be imagined”. (Lord 1938). Human capability formation
Current research indicates that stress, deprivation, and early-life income/health shocks can have long-term adverse impacts on wellbeing (Barker & Osmond 1986; Heckman 2007;

New Researchers - Session I / D
62
Almond & Currie 2011). Human capital development may be impaired directly through childhood illness, and indirectly, through poor prenatal conditions or poverty in early life. Poor early-life circumstances in turn hamper the successful development of capabilities like cognitive/non-cognitive skills, metabolism, and immunity, and have been implicated in conditions from heart disease to schizophrenia (Cutler et al. 2007; Heckman 2007).161 In turn, low human capital stocks negatively impact other outcomes such as income and employment (Heckman 2007; Bhalotra & Venkataramani 2012). Given the Dust Bowl’s documented destruction, survivors are likely to suffer just such adverse effects. Cross-disciplinary contributions
Firstly, I fill a gap in the historical literature. Although the Dust Bowl’s impact on land and agricultural recovery has been well studied (Hansen & Libecap 2004; Hornbeck 2012), only one paper, which using different data and methods found intuitive but insignificant Dust Bowl effects, has attempted to quantify the disaster’s long-term human costs (Cutler et al. 2007).162 By quantifying these later-life impacts, I more fully account for the event’s human toll.
Secondly, I broaden the range of early-life shocks studied. Rather than the sharp shocks typically analysed, the Dust Bowl represents prolonged stress more like famine (Ó Gráda 2011). Individuals may have responded/adjusted to this shock even while the event was ongoing, adding to the realism and complexity of events studied. Furthermore, the Dust Bowl was an agrarian economic shock resulting from environmental catastrophe. For contrast, much research focuses on directly health-targeting shocks/interventions; fewer still track the effect of short-term physiological changes and subsequent investments on adult outcomes (Bhalotra & Venkataramani 2012). I, however, show that incomes acted through childhood health and education to produce permanent damage to adult wellbeing.
Lastly, I clarify the technology of capability formation by disentangling shock-related insults from the effects of investments made to ameliorate/reinforce them. Thus, I provide empirical support for theories of capability formation (Becker & Tomes 1976; Heckman 2007). IDENTIFICATION STRATEGY & DATA
I use a differences-in-differences strategy to identify the treatment impact of Dust Bowl exposure, with a baseline regression as follows, estimated separately by gender, by OLS:
hibst represents the later-life human capital outcome of interest for individuals born in year b in state s and observed in year t.
treatedb×erosions is the chief variable of interest, and refers to whether or not an individual was a child (aged -1-12) at any time during the Dust Bowl, and whether they were born into a state that experienced high levels of Dust Bowl erosion (defined as the proportion of the 1930 state population living in high-erosion counties, e.g. the probability an individual born in the state was born into a high-erosion county). It may thus be interpreted as the reduced-form effect of childhood Dust Bowl exposure on adult outcomes, with β1 describing the causal effect of treatment relative to those unexposed. Since census data does not allow the identification of possible out-migrants during childhood, treatedb×erosions represents an intent-to-treat estimate.
161 See overview of famine and foetal programming literature in Ó Gráda (2011). 162 Their smaller sample size may account for the effects’ statistical insignificance: the IPUMS data used here
consist of 4 million+ observations, while Cutler et al.’s (2007) HRS dataset consists of under 60,000. For in-depth comparison of these studies, see the full-length paper.

New Researchers - Session I / D
63
xibst is a vector of controls, while γs, θs, λb, and ηt, represent state trends and birth state-, birth year-, and census year-fixed effects, respectively. Standard errors are clustered at the birth state and birth year levels.
County-level erosion for 15 Great Plains states comes from the Soil Conservation Service’s 1948 cumulative erosion map (Hornbeck 2012). Since exposure severity in human terms depends on intra-state population distribution, I weight erosion by 1930 county population (Hornbeck 2012) as described above. Erosion is constructed at the state level so as to correspond to individual outcomes. 163
To account for possible measurement error due to the absence of pre-1930 erosion maps, I substitute data on the percentage change in farm values between 1930-40 (Hornbeck 2012) for erosions, since 1930 farm values proxy pre-Dust Bowl land quality. I also substitute SPI-constructed cumulative 1930-40 drought magnitudes for erosions (NOAA 2013).
Individual-level data on later-life health, educational, and socioeconomic outcomes for individuals born 1900-59, inclusive, come from the 5 per cent samples of the 1980-2000 US Censuses (Ruggles et al. 2010). SUMMARY OF KEY RESULTS
Table 1 lists β1 from equation [1] for each later-life outcome. I find that children exposed to the Dust Bowl experienced permanent human capital damage on a scale both statistically and economically significant, with magnitudes similar to those found in studies such as Bhalotra & Venkataramani (2012) and Almond & Currie (2011).
Notably, results reveal long-term harm to postsecondary schooling, poverty, and disability outcomes. Focusing on columns (1) and (2), exposed women experience a 1.17 per cent lower probability of completing college, and a 0.47 per cent higher probability of poverty versus their unexposed counterparts. Poverty effects for men are roughly twice as large as for women, with both receiving roughly $15 more in welfare payments. Furthermore, exposed men (women) have a 1.1 (0.94-1.45) per cent greater chance of various disabilities. Exposed women also experience 3.71 per cent greater likelihoods of high school completion. Positive effects on high school completion may seem counterintuitive. However, increases in secondary schooling rates reflect the drop in the opportunity cost of schooling as farms, and thus, the need for child farm labour, collapsed. These results stand in contrast to college completion rates, which fall amongst the exposed, likely because child cognitive ability was a barrier (Heckman 2007).
Mechanisms
Tables 2-6 report the Dust Bowl’s pathways of impact on later-life outcomes. First, I use farm-population-weighted erosion to test whether individuals born in agriculture-dependent states experienced worse effects of exposure – i.e., whether the income channel mattered. I also use interactions to test whether farm-state-born individuals experienced worse effects than those in non-agricultural states due to differential returns to investment. Second, I disaggregate shock timing to test whether the presence/severity of adverse effects is linked to the developmental stage at which children were exposed, allowing me to identify critical periods in capability formation and to disentangle direct (e.g. respiratory illness, school absence) from indirect (e.g. poor nutrition due to low incomes, developmental complications stemming from maternal ill-health) effects. Lastly, I test whether New Deal spending ameliorates adverse effects.
Agriculture
In table 2, I test for the Dust Bowl’s impact on agriculture-dependent states. I find that agriculture-dependence exacerbates the adverse effects of the Dust Bowl, with significant
163 Censuses list birth state but do not include granular nativity information such as birth county/city.

New Researchers - Session I / D
64
adverse outcomes both more numerous and up to three times worse than those discussed above.
Columns (1) and (3) present β1 for regressions in which erosions is farm- rather than overall-population-weighted, while columns (2) and (4) report coefficients for regressions interacting a binary agriculture-dependence variable with treatedb×erosions.
Although a number of interpretations of these adverse effects are possible (discussed in the full-length paper), here I interpret them, per Bhalotra & Venkataramani (2012), as a poorer compensatory investment response to farm than non-farm children, the former of whom faced lower returns due to the collapse of their chief industry, farming. Developmental stage
To pinpoint the effect of the age at which the Dust Bowl shock occurs, I estimate equation [1], substituting for the original binary treatedb term the proportion of a given age band spent during the Dust Bowl. Duration-weighted measures of exposure are constructed for the -1-0 (in utero/neonatal), 1-3 (infancy), 4-6 (early childhood), 7-9 (prime school age), and 10-2 (early adolescence) developmental stages.
β1 is reported in tables 3 (men) and 4 (women). I find that age at exposure matters, both to the severity and significance of adverse effects. For men, poverty, disability, and age at marriage outcomes are worst amongst those exposed in utero and in infancy. Insults dampen as the age of exposure rises, consistent with theory (Heckman 2007; Almond & Currie 2011). These findings imply that congenital health defects (more so than poor labour market readiness due to school-going-age shocks) are responsible for poor socioeconomic outcomes, and that interventions in earlier developmental stages disproportionately influence many outcomes.
Secondary schooling presents an exception to the infant-exposure pattern. Those exposed at/after school-age enjoy higher high school completion rates than the unexposed. The timing of impact for this outcome, together with the farm-dependence results, suggest that secondary schooling rates may have risen as the destruction of agriculture reduced chances for child labour, decreasing the opportunity cost of schooling.
Patterns for women are similar, with fertility outcomes also negatively affected. That fertility reduction is greatest before puberty, and occurs in the absence of age-at-marriage/labour force participation increases, suggests early damage to reproductive health. This fertility decline is remarkable in light of the postwar ‘baby boom’ experienced by these women’s unexposed counterparts.
Across sexes, the preponderance of adverse effects for health-related outcomes in early childhood suggest that the predominant pathway of impact is through subverted capability formation, while the positive effects observed for secondary schooling in later childhood implicate labour markets and public service access.
Public spending responses
In attributing any recovery experienced by exposed children to household investments, I may be ignoring the role of state relief expenditure. I thus test for the effect of New Deal spending on Dust Bowl impacts, interacting state-level per capita public spending over the period, as above (Fishback et al. 2003).
Results are reported in tables 5 (men) and 6 (women). Public expenditure is found effective in attenuating the Dust Bowl’s adverse effects, compensating for early-life insults, particularly to health/disability and schooling. Robustness
Results are robust to the removal of trends; alternate means of clustering and of defining Dust Bowl timing and severity; controls for veteran status (to account for G.I. Bill effects) and

New Researchers - Session I / D
65
drought (to account for other dimensions of exposure) (not reported); and Bonferroni correction for multiple comparisons.
Lastly, the period coincides with three major phenomena that could be said to have confounded the effects here attributed to Dust Bowl exposure: the Great Depression, which could have affected childhood incomes independently; out-migration from the Great Plains, which could have affected treatment duration and sample selection; and selection into (fertility) or out of (mortality) the sample. Following extensive testing of each possible threat to inference, I find my results are robust to these phenomena – either by methodological design, or following suitable controls. For detailed methods/discussion, see the full-length paper. CONCLUSION
Together, these findings suggest that the Dust Bowl produced its greatest adverse impacts not through the direct health hazards of dust inhalation, but rather, through decreases in agricultural incomes. Thus, the event acted primarily as an economic shock. Many adverse outcomes appear to have been transmitted ‘indirectly’ and early in the life-course – that is, through developmental complications in utero likely stemming from poor maternal health and nutrition brought about by a combination of maternal dust exposure and material deprivation (Barker & Osmond 1986; Heckman 2007; Almond & Currie 2011). The shock’s timing further illuminates the developmental pathways affected, as exemplified by the contrast in how and when secondary vs postsecondary educational outcomes are shaped.
Tests of investment responses suggest that following the collapse of farming, agricultural households faced both credit constraints (which New Deal spending helped alleviate) and low returns to human capital investments. Results indicate greater scope for insult-compensation (i.e. higher inter-temporal elasticities of substitution) than generally assumed, and are consistent with a multi-stage CES model of human capability formation (presented as a conceptual framework in the full-length paper), in which investments in one period may reinforce or compensate for endowments in a previous one (Heckman 2007).
These results also offer policy-relevant findings, for example, substantiating the hypothesis that college-readiness is largely determined prenatally and suggesting that postsecondary interventions should be targeted accordingly (Heckman 2007).
References
Almond, D., and J. Currie, ‘Human Capital Development Before Age Five’, in Handbook of Labor Economics, Vol.4B, Amsterdam: North-Holland, 2011.
Barker, D.J.P., and C. Osmond. ‘Infant Mortality, Childhood Nutrition, and Ischaemic Heart Disease in England and Wales’, The Lancet, 321(1986).
Becker, G., and N. Tomes, ‘Child Endowments and the Quantity and Quality of Children’, JPE, 84.4(1976).
Bhalotra, S., and A. Venkataramani, ‘Shadows of the Captain of the Men of Death: Early Life Health Interventions, Human Capital Investments, and Institutions’, Manuscript, (2012).
Burns, K., D. Duncan, and J. Dunfey, The Dust Bowl, 2012. Cunfer, G., On the Great Plains: Agriculture and Environment, College Station: Texas A&M Press, 2005. Cutler, D., G. Miller, and D. Norton, ‘Evidence on Early-Life Income and Late-Life Health
from America's Dust Bowl Era’, PNAS, 104(2007). Egan, T., The Long Darkness, Stroud: Tempus, 2006. Fishback, P., S. Kantor, and J. Wallis, ‘Can the New Deal’s Three R’s Be Rehabilitated? A
Program-by-Program, County-by-County Analysis’, EEH, 40:3(2003). Hansen, Z., and G. Libecap, ‘Small Farms, Externalities, and the Dust Bowl of the 1930s’,
JPE, 112.3(2004).

New Researchers - Session I / D
66
Heckman, J., ‘The Economics, Technology, and Neuroscience of Human Capability Formation’, PNAS, 104.33(2007).
Hornbeck, R., ‘The Enduring Impact of the American Dust Bowl: Short- and Long-Run Adjustments to Environmental Catastrophe’, AER, 102:4(2012).
Lord, R., To Hold This Soil, Washington, D.C.: USGPO, 1938. National Oceanic and Atmospheric Administration, ‘Annual Climatological Summary Data
Extracts’, Accessed 27 September 2013 at <http://www.ncdc.noaa.gov/>. Ó Gráda, C., ‘Fetal Origins, Childhood Development, and Famine: A Bibliography and
Literature Review’, UCD CER Working Papers WP11/28(2011). Ruggles, S.J., T. Alexander, K.Genadek, R.Goeken, M.Schroeder, and M.Sobek, IPUMS:
v5.0, Minneapolis: Minnesota Population Center, 2010. Soil Conservation Service, Soil Erosion: A Critical Problem in American Agriculture, Washington, DC: USGPO, 1935. Worster, D., Dust Bowl: The Southern Plains in the 1930s, New York: Oxford University
Press, 1979.

New Researchers - Session I / D
67
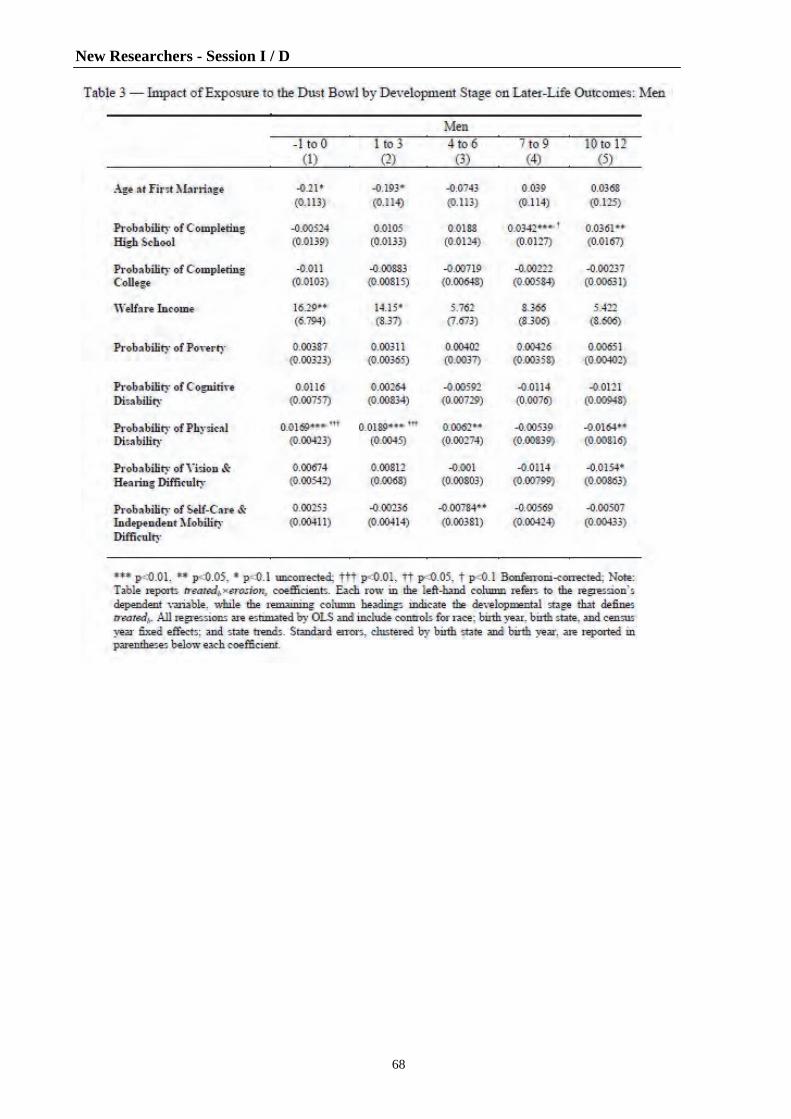
New Researchers - Session I / D
68

New Researchers - Session I / D
69
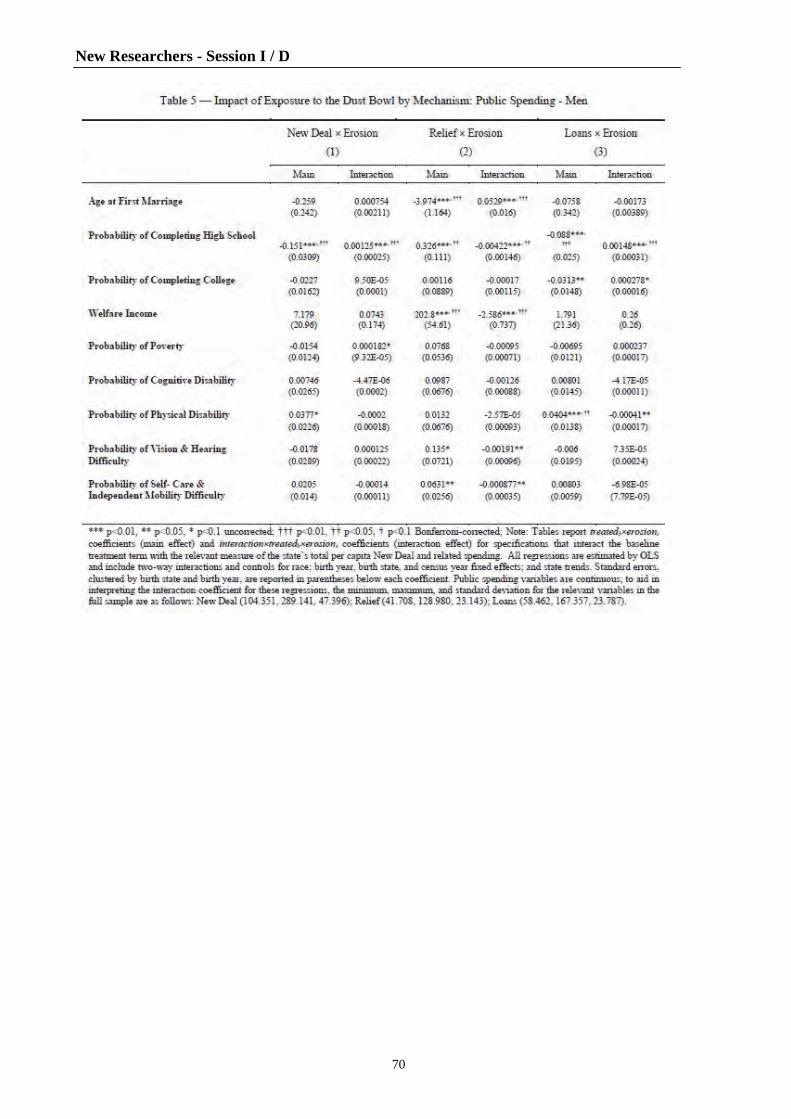
New Researchers - Session I / D
70

New Researchers - Session I / D
71

New Researchers - Session I / D
72
ICT revolution: localization of service sector employees in the long run
Alexandra López Cermeño, Universidad Carlos III de Madrid
([email protected]) Supervisor: Dr Juan Rosés
During the twentieth century, the United States of America embraced changes in technology that resulted in a substantial reallocation of economic activities. In particular, the diffusion of railways, telephones and the most recent ICT’s revolution drove the reallocation of many economic activities from the Manufacturing Belt to alternative regions.164 One of the key ingredients of this shift in the location of economic activities is the gradual change in the production bundle from manufacturing to the service economy.
As part of a broader research, this paper analyses the causes for industrial location of employees during the period 1890-2010 across USA counties, with careful consideration of the service sector. My contribution can be summarized in three findings: firstly, I find that Knowledge Intensive Business Services (KIBS) are localized in densely populated metropolitan areas; US Census Decennial data show that, since 1980, KIBS are more localized than some traditionally clustered manufacturing industries. Secondly, I find that the reason for this disproportion is related to the development of new technologies that have provided Increasing Returns of Scale (IRS) to the production function of services. Lastly, I find that market potential is a strong cause of the localization of any economic activity, but its effect doubles for knowledge intensive industries.
The academic debate on localization is based on the study of manufacturing. While some authors defend constant returns-to-scale arguments – the Heckscher-Ohlin model (H-O) – others base their arguments on New Economic Geography (NEG) that moves away from perfect competition and supports Increasing Returns to Scale (IRS). In the last decades, several authors have demonstrated that these two approaches are not exclusive and, hence, should be considered together in the analysis of industrial activities. However, the relative importance of HO and IRS may vary across industries.165
This paper supports that improvements in technology during the twentieth century reduced transaction costs for goods and services and, thus, fostered the reallocation of economic activity. Under this premise, I present a new long-term series of concentration by industry using counties as a geographic unit of analysis. The use of a smaller scale aims to correct the bias towards H-O evidence found by scholars that use bigger units. Finally, I test a model of localization that considers both endowments and increasing returns and I find support for the mixed model of localization with different weights across industries.
Economic historians have pointed out that the relative size of the service industry has increased through the last century in most developed economies.166 Sobek (2006) shows that the allocation of employees across sectors changed radically in this period. The US gainful force increased from 24 in 1890 to 122 million in 2010 and the distribution of workers across sectors changed drastically: service employment became the most important share of the economy to the detriment of agriculture initially and manufacturing from 1970. Hence, during the last century, the aggregate economy of the United States specialized in the production of services. However, not all counties behaved likewise: production and industrial structure of
164 For more information check ‘American Rust’ in Moretti (2012). 165 The conclusions of the debate can be summarized if one checks Kim (1995), Crafts & Klein (2010) and
Rosés (2003), among others. 166 Sobek (2006), Historical Statistics of the United States, Vol. 2.

New Researchers - Session I / D
73
counties varied over time and, even more essentially, migrations varied cross-county population growth by moving workers towards metropolitan areas.167
Consequently, manufacturing and agricultural employees are disproportionately allocated in comparison to service sector workers, who are not only increasing but also spreading through the US geography.168 Figure 1 shows Locational Concentration Gini Indexes by sector from 1890 to 2010. These concentration coefficients reinforce the argument posed by Dumais et al. (1997) that creation and expansion of industries tend to reduce industrial concentration while closure tends to increase it. In this sense, growth of the service economy makes it omnipresent and its concentration coefficient must be relatively smaller. Nevertheless, assessing regional concentration in finer detail, it is evident that professional services or higher education industries behave differently than their aggregate sector: production of these services increases more than proportionately, however, they become even more concentrated than some manufacturing industries.169
Figure 1: Long-term locational Gini Coefficients by industries
Source: own calculations.
The previous description of specialization and concentration patterns comes from the analysis of different dimensions of inequality in distributions of employment. Particularly, specialization analyses industries by county, while concentration analyses counties holding industries constant. However, the proper analysis of the causes of agglomeration economies needs a more complete set of information that can be derived from the previous summary indicators. Specifically, the variable of interest shows industrial disproportion across county, which is well represented by Hoover’s Localization Index (HLI). This indicator yields an observation per county and sector.170 The distribution of this variable is diverse across 167 For more reference on migrations check Wallis (1989). 168 Specialization and concentration do not necessarily move in the same direction if a two-goods, two-regions
symmetric model is not considered. This text shows that absolute specialization for the period is constant and average relative specialization increased while concentration increased for aggregate sectors but behaved heterogeneously for smaller industries. Check Aiginger & Davies (2004).
169 Ellison & Glaeser (1997) show that finer industry definitions double concentration indicators; readers could think that the growth of Professional Services over Manufacturing is a matter of scale; however, this has been calculated with individual manufacturing industries leading to the same result (Printing and Publishing, Food and kindred products).
170 Hoover’s Index of Localization (HLI) is each point that builds the Locational Lorenz Curve relative to Locational Gini Coefficients, its value range from 0 to infinity, where 1 represents perfect proportion. It is computed as the share of county j participation in industry j’s national over the share of total industry of the county in national production.

New Researchers - Session I / D
74
industries: those related to immobile factors – like mining or fishing – show extreme disproportions (very high maximums). Sectors like elementary schooling or public administration show a minimum Hoover’s Index greater than zero – no matter how small the county is, there is some supply. HLIs for service industries tend to be less extreme in their disproportion than for manufacturing and agriculture.
Ciarli et al. (2008) explained that the key to the agglomeration of services is how knowledge intensive they are. They define Knowledge Intensive Business Services (KIBS) as those services commonly provided to intermediate demand (consultancy, research, marketing … ). During the twentieth century knowledge intensive employees were relatively spread across states, but at the end of the period the sector concentrated in highly urbanized counties. Particularly, big cities such as New York, Chicago or San Francisco show very high HLIs for KIBS during the whole period. This concentration attracted further industries to re-locate and fostered metropolitan growth. Levels of concentration in less crowded neighbouring counties increased, but this effect faded away with distance.
This evolution seems to contradict the dynamics suggested by Dumais et al. (1997), where growth of an industry tends to spread it. The local agglomeration of knowledge intensive firms suggests that externalities explain these dynamics better than factor endowments: growth of KIBS may only happen in areas where demand (businesses) is guaranteed. However, ‘the death of distance’ argument explains that companies in New York State can provide services to industries in Nevada at a similar cost as to local customers.171 However, externalities are far more complex than a pure demand effect. Marshall (1890) and Jacobs (1969) explained that closeness to the market implied inter and intra-industry linkages, a greater pool of labour, and knowledge spillovers, that all lead to a lower cost of production. Further, services were characterized by being produced and consumed simultaneously, however technology has allowed knowledge intensive services to become storable, thus marginal costs of KIBS are small. These characteristics make agglomeration economies compensate for the greater costs of being in a crowded market (higher rents, greater competition … ).
Despite the lack of consensus among academics, the general approach to determine the causes of localization involves testing the significance of coefficients in a model that includes both resources and scale variables. Using this framework, authors have reached mixed conclusions based on different specifications. Commonly, the choice of the model tends to bias results. One of the key issues towards the biased nature of results is the unit of analysis, which tends to overlook the local nature of IRS. In this sense, this database is supposed to grasp both effects by using counties instead of nations, regions or states. I consider a model based in the framework explained by Davies & Weinstein (1999) or Rosés (2003), who explain industrial production in terms of endowments and market potential.
In particular: (1)
Where, industrial disproportion (HLI) is explained by two components. The first
element of the equation, , represents a function of the relative endowments of the county including land, capital stock and labour with different skills, i.e. the Heckscher-Ohlin effect.172 The other part of the equation is Market Potential (MP). As proposed by Harris (1954), MP is equal to the sum of the rest of the regions’ size measured by GDP and weighed by bilateral transport costs or distances; market potential for each county of the United States has been derived based on Crafts (2005) and Martinez-Galarraga et al. (2010).173 171 Venables (2001). 172 Data on initial endowments have been obtained from US Census of Agriculture, US Department of
Agriculture for arable-land area, Decennial US Census for occupational data by skills, and Yamarik (2012) and Tamura et al. (2004, 2007) for Capital Stock.
173 There is no consensus naming this variable, while Crafts & Klein (2010) call it ‘market potential’ other

New Researchers - Session I / D
75
Following Rosés (2003), I perform an initial assessment of the effect of factor endowments on the disproportion of employment by sectors. Pooled regression results show that Hoover’s Indexes of Localization by sector are, indeed, determined by differences across counties. Table 1 presents results of regressions of factor endowment proportions on HLIs. In some cases, single factor variables were not significant but interaction variables of complementary factors (professional employees and capital stock, for example) proved significant at 1 per cent. Coefficients show evidence in favour of Rybcynski theorem: counties abundant in a factor tend to specialize in production of industries intensive in that factor (Kim, 1999). In other words, industries concentrate where their intensive factor is abundant. Note, however, that both the size of coefficients and the explanatory power (R-sq.) of the regression are much higher for the primary sector. This result suggests that relative factor abundance is more relevant for the location of agriculture while other variables may explain allocation of services. Another reason behind the poor fit of this regression is that the pooling of data neglects that production functions are changing radically through time. Because the Year variable is significant for all sectors, I provide the yearly estimations for the service industry in tables 2 and 3.
Table 1: Robust estimates of Hecksher-Ohlin determinants of localization Dependent Variable HLI Primary
Sector HLI Secondary
Sector HLI Tertiary
Sector HLI
KIBS HLI Personal
Services Constant -74.26
(1.89)0.81 (0.01)
1.99 (0.14)
9.01 (0.22)
1.93 (0.177)
Capital Stock -4.95 (2.69)
0.96 (0.27)
-2.51 (0.29)
Land -3.29 (0.17)
-2.22 (0.11)
-1.21 (0.12)
-0.72 (0.14)
Professionals 22.08 (6.69)
-4.62 (1.23)
-3.00 (0.53)
2.67 (0.72)
Clerical 40.71 (3.73)
-3.31 (0.58)
-5.61 (0.37)
-0.204 (0.39)
Artisans -92.24 (8.75)
12.96 (0.72)
3.25 (0.59)
1.70 (0.94)
Unskilled 11.17 (1.19)
-4.69 0.41
-2.46 (0.57)
-0.20 (0.393)
Unskilled*Land 469.65 (21.79)
Artisans*Capital 8.64 (5.35)
Professionals*Capital 27.15 (8.61)
Clerical*Capital -36.70 (7.54)
Professionals*Clerical
13.88 (5.59)
Year 0.397 (0.001)
0.007 (0.001)
-0.001 (0.0010)
-0.004 (0.001)
-0.001 (0.0001)
F-Test (Chi2) 4265.99 628,14 969.09 2072.27 364.63 R-sq. within 0.281 0.003 0.024 0.159 0.032 R-sq. between 0.173 0.147 0.192 0.092 0.045 R-sq. overall 0.233 0.052 0.071 0.139 0.040 N 12,302 11,772 12,316 12,254 9,229
authors referred to a similar concept as ‘intrinsic demand’ (Rosés, 2003), ‘scale’ (Kim, 1995) or ‘home market effect’ (Krugman, 1980) among others. Sources for the derivation of Market Potential involve Maddison Database (2010) for GDPs, US Census Bureau and CEPII for coordinates of regional centroids, Internal Revenue Service and Bureau of Economic Analysis for yearly GDPs by state.

New Researchers - Session I / D
76
Notes: Significant coefficients at 1% in bold, standard errors reported in brackets below coefficients. Random effects proved appropriate after Breusch-Pagan and Hausman tests provide evidence against fixed effects and OLS.
Yearly OLS robust regressions (table 2) results show improvements from the pooled
calculations. The results for this regression for the year 1950 are not presented because coefficients appear insignificant. Notice that coefficients vary through time for most variables in the service sector. These outcomes suggest that production functions of services have changed over the century. For example, the effect of capital stock on the HLI of knowledge intensive sectors is greater in 1930 than in 1980. In 2010, the effect of capital is only relevant through its interaction with highly-skilled workers. Time variations of factors of production effects on HLI hold for most elements in the regression.
Additionally, note that the fit of the regressions has improved substantially after considering the yearly variation. While this is true for any sector, it is critical for KIBS and services, that were poorly fit in the pooled regression. Moreover, the inconsistency of the year 1950 results may worsen results on the pooled regression. Table 2: OLS robust estimates of yearly H-O determinants on Hoover’s index of localization
Dependent Variable Tertiary Sector KIBS 1930 1980 2010 1930 1980 2010
Constant 0.903 (0.009)
0.963 (0.013)
0.736 (0.008)
0.847 (0.008)
0.618 (0.018)
0.510 (0.019)
Capital Stock 10.107 (0.559)
6.136 (1.307) 36.151
(1.134) 14.613 (1.771)
Land 1.692 (0.168)
-6.398 (0.317)
-2.989 (0.163)
2.014 (0.145)
-3.621 (0.327)
-5.099 (0.374)
Clerical -6.105 (0.544)
-10.95 (1.006)
-4.639 (0.664)
7.672 (1.164)
Artisans 11.627 (1.078)
17.879 (2.309) 3.913
(0.637)-9.274 (2.529)
-9.611 (1.533)
Unskilled -14.991 (0.563)
23.185 (2.124)
-1.465 (0.886) -20.187
(0.471) -14.936 (1.938)
-6.669 (1.546)
Professionals -1.996 (0.764)
-32.167 (1.968)
5.318 (1.839)
Professionals*Capital 11.476 (3.756)
-283.153 (21.243)
20.798 (11.978)
97.743 (17.698)
Professionals*Clerical -18.446 (2.679)
94.301 (10.54)
-64.757 (8.003)
F-Statistic 203.31 180.9 100.00 674.20 42.45 43.88 Adj-Sq. 0.283 0.261 0.137 0.605 0.102 0.079 N 3,079 3,061 3,132 3,079 2,930 3,014 Notes: Significant coefficients at 1% in bold, standard errors reported in brackets below coefficients.
Table 3 presents the regressions of locational indexes of services using the complete
model specification explained in equation (1). The first outcome of this regression is that the effect of Market Potential is relevant and significant for all sectors, although the table only reports the results for services. The effect of Market Potential on localization is positive and its size doubles in the case of KIBS. Second, including Market Potential in the equation reduces the relative importance of factor endowments and increases the fit of the regression model. Note that size of the coefficient of Market Potential seems to decrease with time, however this is an effect of the value of market potential itself, increasing exponentially across time.

New Researchers - Session I / D
77
Table 3: OLS robust estimates of yearly determinants of Hoover’s index of localization
Dependent Variable Tertiary Sector KIBS 1930 1980 2010 1930 1980 2010
Constant 0.865 (0.011)
0.857 (0.018)
0.676 (0.008)
0.833 (0.009)
0.492 (0.019)
0.338 (0.015)
Capital Stock 9.848 (0.556)
-18.557 (1.757)
36.096 (0.643)
7.736 (1.742)
Land 2.107 (0.18)
-5.124 (0.355)
-2.154 (0.840)
2.176 (0.151)
-1.213 (0.345)
-2.579 (0.401)
Clerical -5.544 (0.545)
-4.371 (1.124)
-4.72 (0.663)
7.255 (1.112)
Artisans 9.508 (1.111)
20.637 (1.757)
2.793 (0.840)
3.520 (0.644)
-13.209 (1.649)
-7.698 (1.494)
Unskilled -14.286 (0.567)
27.792 (1.735)
-0.871 (0.862)
-19.885 (0.477)
-14.719 (1.853)
-6.005 (1.485)
Professionals -0.945 (0.772)
-17.237 (1.502) 5.922
(1.759)
Professionals*Capital -285.79 (21.207)
36.729 (11.493)
33.253 (17.591)
Professionals*Clerical -14.811 (2.615)
97.424 (10.549)
-30.013 (4.513)
Market Potential *
9.52 (1.34)
0.199 (0.163)
0.482 (0.035)
4.28 (1.12)
2.48 (0.150)
0.900 (0.006)
F-Statistic 184.21 183.19 119.88 594.36 71.85 85.47 Adj-Sq. 0.2941 0.296 0.186 0.607 0.179 0.140 N 3,079 3,038 3,132 3,079 2,930 3,014 Notes: Significant coefficients at 1% in bold, standard errors reported in brackets below coefficients.
This preliminary analysis only allows provisional conclusions. It is clear that the size
and value of the service economy makes it as important to analyse as manufacturing. Although the US economy has specialized in the service sector, these workers have spread through the country. However, subsectors like KIBS have become even more localized than manufacturing. Earliest regression analysis suggests that, although both variables are significant, the effect of H-O seems more important for resource-intensive sectors while the localization of knowledge intensive services is defined by externalities.

New Researchers - Session I / E
78
Squeezing the bears: cornering risk and limits on arbitrage during the British Bicycle Mania, 1896-98
William Quinn, Queen’s University Belfast
([email protected]) Supervisor: Professor John Turner
Can limits to arbitrage explain asset-price reversals? Previous literature suggests that short-sale constraints played some role in recent episodes, but the mechanisms identified do not generally apply to historical markets.174 This paper proposes that, during the British Bicycle Mania of 1896-98, short-sales were instead constrained by the threat of being ‘cornered’, and thereby undergoing heavy losses.
Three strands of evidence are presented in support of this hypothesis. Firstly, during the seven-month period surrounding the asset price reversal, there were three high-profile episodes in which short-sellers were cornered and suffered severe losses. The scale of losses was substantial enough that a rational investor would short-sell less to account for this possibility. Secondly, in the overall cycle share market, cornering news which imposed losses on short-sellers was followed by a period of more positive returns, and news which had the opposite effect was followed by more negative returns. Finally, cross-sectional regression analysis finds that recently-established firms, which were most vulnerable to a corner, experienced disproportionately negative returns during the market crash. This is the case even when controlling for measures of firm performance, suggesting that these companies had been overvalued relative to other cycle firms.
This paper contributes to the literature in four ways. Firstly, it provides a new hand-collected dataset on the cycle mania, including a daily cycle share index, data on each firm’s fundamentals, and a daily blue-chip index. Secondly, it provides a new framework for evaluating the short-sale constraints hypothesis in historical asset-price reversals, applied to an episode on which there is little previous research. Thirdly, the uncovering of several major cornering incidents provides a new example of the link between market structure and price manipulation in early capital markets. Finally, the study provides a rare insight into the nature of short-selling in an early regional stock exchange. Historical context
Between 1890 and 1896, a succession of major technological innovations vastly increased British demand for bicycles (Harrison, 1969). British industry, particularly in Birmingham and Coventry, responded by rapidly expanding production. New cycle production firms were founded, existing cycle firms greatly expanded their operations, and many engineering firms shifted to the production of bicycles (Millward, 1989). By 1897 there was a severe oversupply, abetted by an exponential increase in the number of bicycles imported from the US (Harrison, 1969). The bicycle industry promptly entered recession, and the number of Birmingham-based cycle firms fell by 54 per cent between 1896 and 1900 (Millward, 1989).
Figure 1 shows an index of cycle share prices between 1895 and 1898, alongside the companies’ average subsequent dividend.175 An initial run-up in prices in spring 1896 is followed by a fall in line with dividends for the remainder of 1896. However, share prices partially recover between January and March 1897, despite dividends continuing to rise. This rise also coincides in a threefold increase in the number of listed cycle companies, which would be expected to reduce profits through increased competition.
174 See, for example, Ofek & Richardson (2003); Haruvy & Noussair (2006). 175 Share prices are taken from Birmingham Daily Post, Birmingham Daily Mail and Financial Times. Dividend
data is obtained from Stock Exchange Yearbooks (1896-1900).

New Researchers - Session I / E
79
Figure 1: Cycle share index vs. subsequent reported dividends, 1895-98
The high price of cycle shares was also noted by sections of the financial press.176 This
poses a financial puzzle: if informed investors were aware that cycle shares were overvalued, why were they not heavily short-sold? This paper argues that this puzzle may be partially explained by cornering risk. The following section outlines the events of the three corners that occurred between November 1896 and July 1897.
The Bagot Tyre Corner
The Bagot Pneumatic Tyre Company was established in September 1896 with a nominal capital of 200,000 £1 shares, only 20,000 of which were subscribed. Following allotment, Mr T. Hewitt Myring, the promoter, immediately issued orders to buy and sell stock on the market at £1.25. Between 7,000 and 10,000 were bought on the market, while Mr Myring struck a deal with the holders of another 7,500 to pool their shares for six months. By January, only 1,766 shares were among the general public.177 Shareholder records suggest that 8,203 shares had been short-sold, so in order to fulfil their contracts, short-sellers had to buy directly from the pooling operation.178 As figure 2 shows, the pooling operation charged extortionate prices.179
176 Financial Times, ‘The Cycle Outlook’, 01/05/1897. 177 The Times, ‘Queen’s Bench Division: Jackson and Others v. Hamlyn’, 10/08/1897 178 ‘Summary of Capital and Shares’, The Bagot Pneumatic Tyre Company Limited, BT31 Files, National
Archives. 179 Share prices are those listed in Financial Times.

New Researchers - Session I / E
80
Figure 2: Bagot’s pneumatic tyre share price(s), October 1896-March 1897
The total losses, assuming the reported share price was accurate, amounted to £28,398,
on shares with a par value of £8,203. Media coverage suggests that short-sellers struggled to buy shares even at the quoted price, however, so the true losses were probably even greater.180
This incident also led to a High Court case, in which a short-seller was charged £2,100 for 100 shares, and responded by refusing to pay his brokers. After a three-day trial, the judge ruled in favour of the brokers, sympathising with the view that ‘there is nothing wrong about cornering the market’. 181 This contrasts with today’s stock markets, where cornering is generally illegal. The James Cycle Company Corner
The James Cycle Company was registered in May 1897 with a nominal capital of £50,000, issued in shares of £1 each. The firm was very successful in the long-term, but was heavily short-sold immediately after establishment. The corner was engineered by the company director, Mr James, and brought about ‘in much the same way’ as the Bagot Tyre corner of the previous year.182
Figure 3 shows the company’s share price, as reported in the Financial Times. As in the case of Bagot Tyre, there is a sudden rise in price in July 1897, the result of short-sellers attempting to close their positions. On 23 July, the cornered short-sellers applied to the Birmingham Stock Exchange for a special settlement, and trading in the shares was suspended. They did not reappear on the market until December, when prices ranged between £6 and £6 10s per share.
180 The Times, ‘Queen’s Bench Division: Jackson and Others v. Hamlyn’. 06/08/1897 181 The Times, ‘Queen’s Bench Division: Jackson and Others v. Hamlyn’. 11/08/1897 182 Birmingham Daily Post, 21/12/1897

New Researchers - Session I / E
81
Figure 3: Price of James Cycle Ltd. shares(s), June 1897-January 1898
The ‘special settlement’ was eventually made on 10 January 1898 and decreed that
short-sellers must fulfil their contracts and find the shares from somewhere, but within an indefinite timeframe. Thus ensued a stand-off, with the short-sellers refusing to offer more than £3 per share but Mr James refusing to accept less than £8 per share. This ended in July 1898 when the short-sellers managed to buy shares from elsewhere at £4 each. They were, in total, 1,150 shares short, so assuming the shares were short-sold at the opening-day price of £1 5s, the total loss was £3,162 10s.183 For perspective, the nominal value of the short-sold shares was £1,150. If the corner had been entirely successful, the losses at £8 per share would have amounted to £7,762 10s. This reaffirms the severe tail-end risk involved in short-selling a stock where there is some risk of being cornered. The Tubes (America) Corner
Tubes (America) Limited was a company floated in the UK in order to acquire three American tube companies. The nominal capital was £350,000 in shares of £1 each, 203,163 of which were put forward for public subscription. The company was heavily undersubscribed, however, and instead of abandoning the project the directors decided to take on the remaining shares themselves.184 Since under-subscription suggested that shares were overvalued at par, several brokers proceeded to short-sell. Shares of this company, however, were held by a small network of investors: over half were in the hands of American directors, who were locked in for twelve months, with many more in the hands of close associates and the company’s promoters. Orders were placed to buy and, in the words of Cycling Magazine, “the unsuspecting ‘bears’ fell into the trap”.
Figure 4 shows the company’s share price as reported in the Financial Times for July 1897, the only month in which the firm was listed. In an effort to close their positions, short-sellers placed bids at up to £5 per £1 share, but after twelve days these offers were still unsuccessful.
183 Cycling Magazine, ‘Financial’, 23/07/1898 184 Cycling Magazine, ‘Financial, 05/03/1897
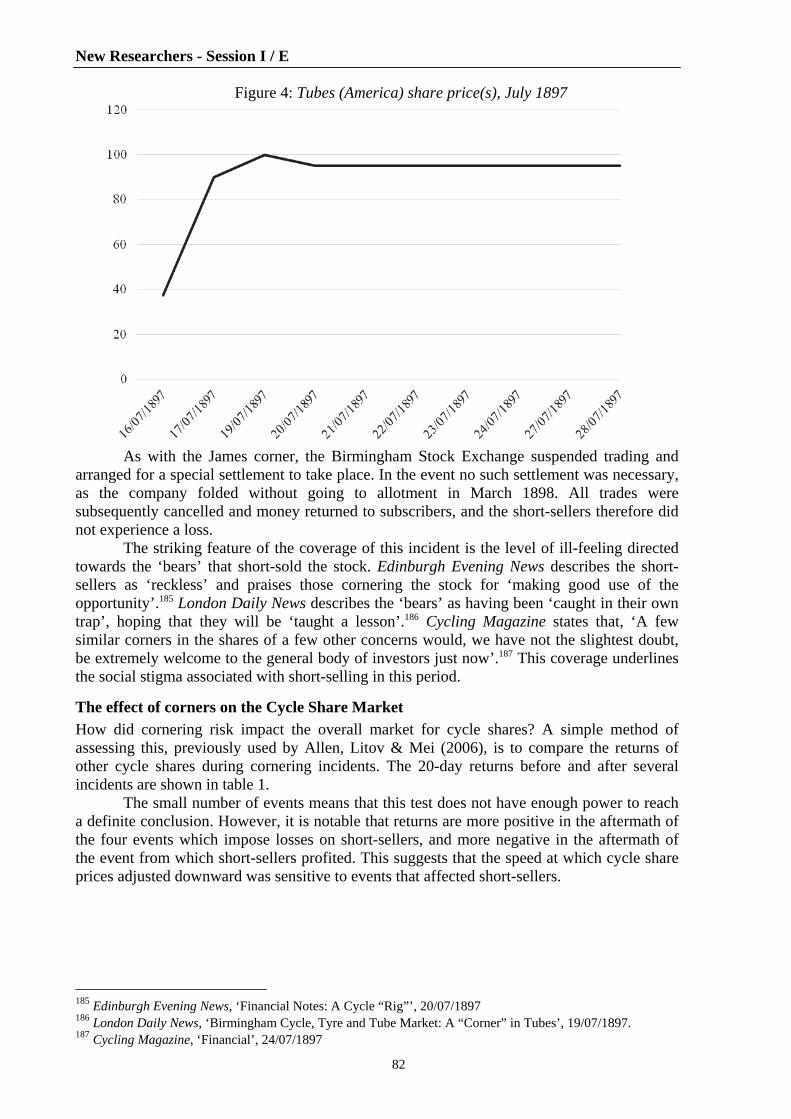
New Researchers - Session I / E
82
Figure 4: Tubes (America) share price(s), July 1897
As with the James corner, the Birmingham Stock Exchange suspended trading and
arranged for a special settlement to take place. In the event no such settlement was necessary, as the company folded without going to allotment in March 1898. All trades were subsequently cancelled and money returned to subscribers, and the short-sellers therefore did not experience a loss.
The striking feature of the coverage of this incident is the level of ill-feeling directed towards the ‘bears’ that short-sold the stock. Edinburgh Evening News describes the short-sellers as ‘reckless’ and praises those cornering the stock for ‘making good use of the opportunity’.185 London Daily News describes the ‘bears’ as having been ‘caught in their own trap’, hoping that they will be ‘taught a lesson’.186 Cycling Magazine states that, ‘A few similar corners in the shares of a few other concerns would, we have not the slightest doubt, be extremely welcome to the general body of investors just now’.187 This coverage underlines the social stigma associated with short-selling in this period. The effect of corners on the Cycle Share Market
How did cornering risk impact the overall market for cycle shares? A simple method of assessing this, previously used by Allen, Litov & Mei (2006), is to compare the returns of other cycle shares during cornering incidents. The 20-day returns before and after several incidents are shown in table 1.
The small number of events means that this test does not have enough power to reach a definite conclusion. However, it is notable that returns are more positive in the aftermath of the four events which impose losses on short-sellers, and more negative in the aftermath of the event from which short-sellers profited. This suggests that the speed at which cycle share prices adjusted downward was sensitive to events that affected short-sellers.
185 Edinburgh Evening News, ‘Financial Notes: A Cycle “Rig”’, 20/07/1897 186 London Daily News, ‘Birmingham Cycle, Tyre and Tube Market: A “Corner” in Tubes’, 19/07/1897. 187 Cycling Magazine, ‘Financial’, 24/07/1897

New Researchers - Session I / E
83
Table 1: Returns on cycle shares during major cornering events
Date Incident Return for 20 Days
Before (%)
Return for 20 Days
After (%)
Difference in Returns
(%) 27/11/1896 Bagot Tyre Cornered -3.21 0.00 3.21 11/01/1897 Bagot Tyre Settlement- 325-450% losses 3.38 8.82 5.44 15/07/1897 James Cycle and Tubes (America) Cornered -10.03 -3.64 6.40 22/02/1898 Tubes (America) Settlement- No losses -5.45 -10.40 -4.95 12/07/1898 James Cycle Settlement- 300% losses -6.66 -4.59 2.07
An alternative test for the effect of cornering risk is to use a cross-sectional regression of cycle share returns during the crash of 1897. Following Lamont (2004), assets for which short-sales are constrained are expected to experience disproportionately negative returns in the medium and long term. A recent establishment date is used as a proxy for cornering risk. These firms were more vulnerable to being cornered because shareholder records had not yet been published, and it was thus unclear how many shares were in the hands of the general public. At the extreme of the Bagot Tyre corner, this led to investors being short more shares than were freely available. It is for this reason that all three corners occurred in companies that had been established within the previous three months.
The dependent variable is the returns in the period following March 1897, when the aggregate value of cycle firms was at its peak. Since recent establishment could be correlated with measures of performance, these are included in the regression as control variables. Summary stats of these variables are included in table 2.
Table 2: Summary statistics for regression variables
Dependent Variables Mean Std. Dev.
Min Max Obs
Two-Month Returns -0.171 0.143 -0.764 0.137 88 Four-Month Returns -0.324 0.162 -0.791 0.000 89 Six-Month Returns -0.358 0.178 -0.775 0.020 89
Corner Vulnerability Proxy Mean Std. Dev.
Min Max Obs
Established in 1897 0.213 0.412 0 1 89
Control Variables Mean Std. Dev.
Min Max Obs
Log Subscribed Capital 4.436 1.061 0.961 8.422 89 Discounted Three-Year Dividend Payments 9.641 10.955 0 57.381 89 Bankruptcy Dummy 0.337 0.475 0 1 89 Accounts paid up to Oct-Mar Dummy 0.112 0.318 0 1 89 Pre-1900 Disband Dummy 0.438 0.499 0 1 89 Beta for 1897 -0.067 1.363 -4.452 4.290 89
Table 3 shows the results of an OLS regression of six-month returns on all explanatory
variables. Returns on companies established in 1897 on average experienced returns 9.5 percentage points lower than all other cycle companies, even when controlling for firm fundamentals. This suggests the existence of a substantial premium on a recent establishment date in March 1897. Regressions using two and four-month returns provide similar results.
These results are consistent with the hypothesis that traders were reluctant to short-sell recently-established firms due to cornering risk. There is unlikely to have been a news event in April or May of 1897 that disproportionately affected new companies, and did so in a way which was not reflected in future dividends or bankruptcy risk. An alternative might be that, immediately after establishment, the directors of new companies temporarily propped up the

New Researchers - Session I / E
84
share price in order to attract further subscriptions. But this action would greatly increase cornering risk, and therefore serve to reinforce the original hypothesis.
Table 3: Six-month cycle share returns after March 1897
Established in 1897 -0.095** (0.041)
Log Subscribed Capital -0.015 (0.016)
Three-Year Dividends 0.005*** (0.002)
Bankruptcy Dummy -0.064* (0.036)
Accounts paid up to Oct-Mar Dummy -0.076 (0.054)
Pre-1900 Disband Dummy -0.070** (0.035)
Beta for 1897 0.017
(0.012) Adjusted R2 0.243 n 89 Standard errors in parenthesis. *, ** and *** denotes significance at 10%, 5% and 1% respectively.
Conclusion
This paper argues that the risk of being cornered constituted a short-sale constraint that exacerbated an asset-price reversal in bicycle shares in 1896-98. Although only three corners occurred, the losses experienced were so substantial that it still represented a significant source of additional risk. High-profile cornering incidents, in which short-sellers usually made extremely heavy losses, were typically followed by periods of relative buoyancy in the cycle share market. This was particularly true for recently established companies, which would have been most vulnerable to a corner.
These results suggest the need to reconsider the role played by short-sale constraints in historical asset-price reversal. The lack of regulation in early regional stock markets allowed investors to make unlimited naked short-sales, but also did nothing to ease the risks involved in doing so. Short-selling therefore came to be seen as inherently dangerous, best left to specialist ‘bears’, who were then subject to social disapproval. Arbitrage opportunities were thus limited, and this is reflected in equity prices during the cycle mania. References
Allen, F., Litov, L. and Mei, J. ‘Large investors, price manipulation, and limits to arbitrage: an anatomy of market corners’, Review of Finance 10 (2006): 645–693.
Harrison, A.E., ‘The Competitiveness of the British Cycle Industry, 1890-1914’, Economic History Review 22, no. 2 (1969): 287-303
Haruvy, Ernan, and Charles N. Noussair. ‘The effect of short selling on bubbles and crashes in experimental spot asset markets’, The Journal of Finance 61, no. 3 (2006): 1119-1157.
Lamont, Owen. “Go down fighting: Short sellers vs. firms.” National Bureau of Economic Research, Working paper no. w10659, 2004.
Millward, Andrew, ‘The Cycle Industry in Birmingham 1890-1920’, in Barbara Tilson (ed.), Made in Birmingham: Design and Industry, 1889-1989 (Warwickshire, 1989), 165-178.
Ofek, Eli, and Matthew Richardson. ‘Dotcom mania: The rise and fall of internet stock prices’, The Journal of Finance 58, no. 3 (2003): 1113-1138.

New Researchers - Session I / E
85
Weighing the scale: store size and the productivity of retail firms, 1950-73
Thomas Buckley, University of Reading
([email protected]) Supervisors: Professors Peter Scott & James Walker
Introduction
The productivity of retail firms is influenced by factors at the firm and store level. This paper focuses on the store level. It examines the relationship between physical store size and the productivity of retail firms that operated a chain of stores principally selling non-food products, during the golden age of productivity growth between 1950 and 1973. Using store level data collected from the corporate archives of a retail firm operating in the United States, J.C. Penney, and two retail firms operating in the United Kingdom, Marks & Spencer and the John Lewis Partnership in four benchmark years, this paper seeks to answer the question, ‘did retail firms that operated physically larger stores have higher productivity than retail firms that operated physically smaller stores?’ The conclusion presented here is that the relationship between store size and productivity was an important but complex one. I The first significant investigation into the productivity of the post-1945 retail industry in Great Britain and North America concluded that store size exercised a significant, but inconsistent, influence upon retail productivity.188 Conventionally, however, studies of manufacturing industries have given greater prominence to the relationship between plant size and productivity while relatively less attention has been devoted to store size as a driver of technical economies in retailing. Chandler, for example, highlighted the cost advantage large plants operating at ‘minimum efficient scale’ in capital-intensive industries had over smaller plants in his examination of the ‘modern industrial enterprise’. The modern industrial enterprise, Chandler famously argued, was made possible by the tripartite investment in Production, Marketing and Management. Of these, “the critical entrepreneurial act was not the invention – or even the initial commercialization – of a new or greatly improved product or process. Instead it was the construction of a plant of the optimal size required to exploit fully the economies of scale or those of scope, or both”.189
Lazonick190 complimented Chandler’s analysis arguing Britain lacked the managerial structures capable of planning and coordinating the organization of work, and that British manufacturers could not, and did not want to, imitate American success in developing and utilizing new mass production technologies. Consequently Britain ceded international leadership to the United States as British manufactures continued to rely on the skills and efforts of shop-floor workers, rather than on the interaction of managerial coordination and effort-saving technology. Lazonick was, however, eruditely countered by Broadberry,191 who following Piore & Sabel,192 distinguished between different production techniques and the influence resource endowment had on the choice between ‘mass production’ and ‘flexible production’. Broadberry quantitatively demonstrated that comparative labour productivity levels between Great Britain and the United States had remained stationary since the mid-nineteenth century.
188 Hall, Knapp & Winstein, (1961) p.150. 189 Chandler, (1990) p.26. 190 Lazonick, (1990). 191 Broadberry, (1997). 192 Piore & Sabel, (1984).

New Researchers - Session I / E
86
Broadberry’s subsequent examination of productivity in the services sector, however, accepted a Chandler-Lazonick thesis of a British labour force incapable or unwilling to ‘industrialize’ and embrace new methods of production. For Broadberry the relative productivity decline of Great Britain is explained by the failure of British services to move from customized low volume/high margin business organized by networks to standardized high volume/low margin business organized by hierarchy, a transition that lead to sustained services sector productivity growth.193
This failure of Britain’s services sector has not been accepted unreservedly though. Scott & Walker sought to qualify the application of the Chandler-Lazonick thesis to British services by using the example of interwar, department store retailing in the United Kingdom and the United States. Scott and Walker’s findings that the productivity difference between the United States and the United Kingdom was not as severe as Broadberry proposed, casts doubt on the validity of the Chandler-Lazonick thesis to explain productivity performance in the services sector.194 The present paper explores the issues surrounding this debate further by investigating the relationship between productivity and the physical size of stores. II Table 1 presents descriptive statistics for a constant sample of Marks & Spencer stores between 1953/54 and 1969/70, a constant sample of John Lewis Partnership department stores between 1953/54 and 1969/70, and a constant sample of J.C. Penney stores between 1955 and 1970. Table 1: Store size descriptive statistics of sales floor in sq. ft. for a constant sample of Marks
& Spencer stores, John Lewis Partnership department stores: 1953/54-1969/70, and J.C. Penney stores: 1955-70
Sources: Marks & Spencer company archive: E9/1/3/6, E9/1/3/7. John Lewis Partnership archive collection: 4186/t, 3218/a. J.C. Penney Company records, DeGolyer Library, Southern Methodist University: Box 219-223.
Table 1 shows an increase of less than 1 per cent in the median sized J.C. Penney store over the decade between 1955 and 1965, and no change in either the largest or smallest Penney store. In contrast, the median sized store of both Marks & Spencer and the John Lewis Partnership increased by 33.86 per cent and 28.84 per cent respectively over a similar period. Between 1965 and 1970, moreover the median sized J.C. Penney store decreased by 2.57 per cent from 8,252 sq. ft. to 8,040, sq. ft. The key explanation for this development in the size of J.C. Penney stores was the ‘hometown store’ image, which was an important part of Penney’s
193 Broadberry, (2006). 194 Scott & Walker, (2012).

New Researchers - Session I / E
87
retailing system.195 Founded in 1902, in Kemmerer Wyoming, J.C. Penney started trading as a ‘junior department store’. Along with other retailers who sought to compete in this market, such as Belk Bros. (founded 1888) and W.T. Grant (founded 1906), Penney adopted variety store policies but operated on department store principles; selling many lines of goods under one roof but restricting their offer to soft goods and emphasizing a low price without instituting a specific price limit.196 It was only in 1962 that Penney launched a programme of opening large stores in major markets in the United States with the first of these stores opening in late 1963.197
Just as a ‘hometown store’ image was an important element of Penney’s retail system and the demand it sought to satisfy, so too can the large median and maximum sized department stores of the John Lewis Partnership be explained as fundamental elements of its retail system; locating stores in densely populated cities, offering a wide variety of goods and services to satisfy all their customers’ wants under one roof. III Table 2 presents the operating results for the constant sample of Marks & Spencer, John Lewis Partnership department stores, and J.C. Penney stores.
Table 2: Operating results for a constant sample of Marks & Spencer stores, John Lewis Partnership department stores: 1953/54-1969/70, and J.C. Penney stores: 1955-70
Sources: Marks & Spencer Company Archive, E9/1/1/17 E9/1/1/18, E9/1/1/19. John Lewis Partnership and J.C. Penny: As table 1.
A striking feature of the J.C. Penney operating results is the fall in nominal sales from $177,664,900 in 1955 to $174,862,100 in 1960. It should be noted, however, this phenomenon is only restricted to this constant sample of stores. Between 1955 and 1960 nominal sales for all J.C. Penney stores increased. A second striking feature of the Penney data is the growth in operating profit margin between 1960 and 1965 which increased from 8.72 per cent to 16.39 per cent, before increasing again, by more than 2 per cent, to 18.53 per cent in 1970.
In contrast to J.C. Penney, neither Marks & Spencer nor the John Lewis Partnership’s department stores experienced such a rise in operating profit margin over an equivalent period. Marks & Spencer’s operating profit margin actually fell from 13.88 per cent in 1960/61 to 11.80 per cent in 1965/66, before growing to 12.12 per cent in 1969/70. The
195 Curry, (1993) p.308. 196 McNair & May, (1976) p.15. 197 J.C. Penney Annual Report 1967, p 7. Box 318: J.C. Penney Company records, DeGolyer Library, Southern
Methodist University.

New Researchers - Session I / E
88
Partnership’s department stores, display a more consistent trend, rising from 6.65 per cent in 1953/54 to 8.04 per cent in 1960/61 and increasing incrementally thereafter.
Aside from 1960 therefore, when nominal sales fell, in each of the benchmark years J.C. Penney stores recorded the highest operating profit margins. Prima facie this suggests Penney had the greatest operating efficiency despite operating the smallest median sized store. However, both Penney’s total expense ratio, and their staff cost relative to sales were higher than those of Marks & Spencer in each of the benchmark years, while Marks & Spencer consistently recorded a lower gross margin. This suggests J.C. Penney had no significant cost advantage over Marks & Spencer. While the John Lewis Partnership’s department stores had higher total expenses and staff cost relative to sales than both Marks & Spencer and J.C. Penney, this may be explained as a consequence of a different marketing strategy designed to attract a different type of demand. The next section thus explores the differences in the productivity of three retailers in more detail, and examines the relationship between physical store size and each retailer’s productivity. IV Total Factor Productivity estimates for each of the retailers in each benchmark year are displayed in table 3, column 1. TFP is estimated using the formula where labour productivity, capital productivity and = the share of staff costs to total expenses. Following Basker,198 labour productivity is measured as the ratio of sales to staff cost. Capital Productivity is measured as sales per square-foot.
Table 3: Total factor productivity indices for Marks & Spencer, John Lewis Partnership department stores, and J.C. Penney, 1960: 1960/61 = 100
**Correlation significant at 0.01 level (1-tailed). *Correlation significant at 0.05 level (1-tailed).
Table 3 displays the Pearson Correlation Co-efficient relating store size with total factor productivity in column 2 and the coefficient of determination (R2) for the relationship between store size and total factor productivity in column 3. In each benchmark year, the size of Marks & Spencer’s stores are shown to have had a weak-moderate positive relationship with total factor productivity, significant at the 0.01 level. This corresponds with total factor productivity growth in each benchmark year. In contrast a more inconsistent relationship between store size and total factor productivity exists for the John Lewis Partnership’s department stores. In the first benchmark year, 1953/54, there was no significant relationship between total factor productivity and store size. In each of the subsequent benchmark years, however, there was a moderate-strong positive relationship between store size and total factor productivity. In two of these years, 1960/61 and 1969/70 the relationship was significant at
198 Basker, (2012).

New Researchers - Session I / E
89
the 0.01 level. In the other year, 1965/66, the relationship between total factor productivity and store size was not as strong as in either 1960/61 or 1969/70, and was significant only at the 0.05 level.
In the two years when the total factor productivity of J.C. Penney stores was highest, in 1960 and 1970, there was no significant relationship between store size and total factor productivity. Conversely in the two years when there was a significant relationship between store size and total factor productivity, albeit a weak one, total factor productivity estimates were at their lowest. This suggests that as Penney store size increased, the productivity of these stores did not increase proportionately. This poses an enigma given the high operating profit margins generated by Penney stores in 1965 and 1970 evident from table 2. The enigma is best explained with reference to two specific stores.
In 1960 Kerrville city, Texas had a population of 8,900.199 By 1970 the population of Kerrville was 12,700, an increase of approximately 43 per cent. In each benchmark year, the Penney store in Kerrville had a sales floor area of 5,682 sq. ft. In 1960 the operating profit margin of the Kerrville store was 10.81 per cent: a decrease from its 1955 operating profit margin of 12.23 per cent, but still more than 2 per cent above the operating profit margin for the constant sample of Penney stores. In 1965 Kerrville’s operating profit margin was 16.28 per cent marginally below the operating profit margin for the constant sample. In 1970, however, Kerrville’s operating profit margin was 22.80 per cent more than 4.25 per cent greater than that of the constant sample. For the two years when there was a significant, but weak, relationship between store size and productivity, 1955 and 1965, the Kerrville store’s productivity was 90.0 and 73.2, compared with estimates of 99.2 and 90.8 for the constant sample. 200 In 1970, when no correlation between store size and productivity existed, Kerrville’s productivity was 115.5 compared to an estimate for the constant sample of 109.4. Throughout the entire period the major competition for the Penney store in Kerrville constituted two department stores: Schreiner Co. and C.R. Anthony.
In 1960 the city of Orlando, Florida had a population of 88,100. By 1970 this had grown by 12 per cent to 99,000. Between 1955 and 1965 the J.C. Penney Orlando store had a sales floor area of 39,160 sq. ft. By 1970 this had decreased (paralleling the general trend of the constant sample) to 35,390 sq. ft. The 1955 operating profit margin of the Orlando store was 10.58 per cent, marginally above that of the constant sample but around 2 per cent lower than the operating profit margin of the Kerrville store for the corresponding year. In 1955 when the correlation between store size and productivity was significant at the 0.05 level, the Orlando store’s productivity was 87.3,201 well below the productivity estimate of 99.2 for the constant sample. Similarly, in 1965 when a significant correlation existed between store size and productivity at 0.01 level, the J.C. Penney Orlando store’s productivity was 58.7, significantly lower than the estimate of 90.8 for the constant sample. Similarly in 1965 the Orlando store’s operating profit margin was 8.42 per cent, significantly below the operating profit margin of both the Kerrville store and the constant sample. In 1970, the Orlando store’s operating profit margin was 14.70 per cent approximately 4 per cent lower than the operating profit margin of the constant sample and more than 8 per cent lower than the operating profit margin of the Kerrville store.
The crucial difference between the Orlando store and the Kerrville store was the degree of competition. Between 1960 and 1965, the Orlando store competed against four department stores (one of which was Sears), a Belk’s and a W.T. Grant. By 1970 this competition increased to include two Sear’s stores and two K-Marts. The enigma of how Penney stores could generate high operating profit margins even though a larger size of store
199 All data referenced for the Kerrville and Orlando stores are derived from their respective store data sheets,
Boxes 219-223, J.C. Penney company records, DeGolyer Library, Southern Methodist University. 200 1960 JCP constant sample = 100. 201 1960 JCP constant sample = 100.

New Researchers - Session I / E
90
did not necessarily correlate with higher productivity can be explained by the fact that in smaller markets Penney stores faced less competition. This allowed them to generate higher profit margins without necessarily achieving higher levels of productivity. In larger markets with increased competition and more consumer choice, Penney’s position and competitive advantage was partially diminished. As these stores failed to compensate for their weaker position by not achieving higher levels of productivity, their overall performance deteriorated. IV This paper has investigated the relationship between store size and the productivity of retail firms. It has shown that in at least two of four benchmark years there was a significant association between total factor productivity and physical store size for each retailer. Although it has limitations, this paper’s finding, that the relationship between store size and retail productivity is important, but complicated, is consistent with, and supports the validity of Hall, Knapp & Winsten’s conclusion. In order to better understand retail productivity therefore it is imperative to investigate the complexity of the relationship, rather than being content to accept the Chandler-Lazonick thesis that has doubtful explanatory power. References
Basker, E., ‘Raising the Barcode Scanner: Technology and Productivity in the Retail Sector.’ American Economic Journal: Applied Economics, 4, (2012), pp.1-27.
Broadberry, S.N., The Productivity Race. British Manufacturing in International Perspective, 1850-1990 (Cambridge, 1997).
Broadberry, S.N., Market Services and the Productivity Race, 1850-2000: British Performance in International Perspective (Cambridge, 2006).
Chandler, A.D., Jr., Scale and Scope, The Dynamics of Industrial Capitalism (Cambridge, Mass., 1990).
Curry, M.E., Creating an American Institution: The Merchandising Genius of J.C. Penney (New York, 1993).
Hall, Knapp and Winstein., Distribution in Great Britain and North America: A Study in Structure and Productivity (Oxford, 1961).
Lazonick, W., Competitive Advantage on the Shop Floor (Cambridge, Mass., 1990). McNair, M. and May, E., The Evolution of Retail Institutions in the United States (Cambridge
Mass., 1976). Piore, M.J. and Sabel, C.F., The Second Industrial Divide: Possibilities for Prosperity (New
York: 1984). Scott, P. and Walker, J., ‘The British “Failure” that Never Was? Anglo-American
Productivity Differences in Large-Scale Retailing between the Wars - Evidence from the Department Store Sector’, Economic History Review, 65, (2012) pp.277-303.

New Researchers - Session I / E
91
Conservation and retailing: a forgotten commercial narrative
Jessica Gray, University of Leeds
([email protected]) Supervisor: Professor Richard C Whiting
The British town centre had long been the battlefield for a mosaic of competing agendas, which sought to construct the urban landscape in their own image. This was starkly evident in the 1970s and 1980s as the excesses of the 1960s gave renewed buoyancy to a conservation movement which sought to stem the perceived flow of architectural destruction and homogenization. Individuals had come to doubt the much vaunted benefits of modernism as an efficient and progressive form within the urban landscape, capable of eradicating the social ills of previous centuries.202 The codification of conservation efforts within national legislation further validated the claims of a burgeoning conservation and environmental agenda. The interplay between the demands of commercial retailing and conservation did much to shape urban areas between the late sixties and early nineties. Such a dynamic has received relatively little scholarly attention, since academic focus has concentrated on efforts to chart the changing character of the conservation movement.203 This paper seeks to redress this by exploring the store development efforts of Marks & Spencer and the extent to which these were shaped and influenced by wider attitudes towards the environment and conservation. A commercial response
Retailers were not absent from the growing dialogue surrounding conservation. Marks & Spencer engaged with such trends and undertook a variety of store development projects which contained elements of conservation. A number of its store projects embraced aspects of existing local architectural and environmental features. This was evident in Marks & Spencer’s Exeter development (1981) and its Oxford (1978) store project. Efforts to assimilate stores into the existing architectural and environmental aesthetic of central areas were a recurrent promotional motif within company literature. This was evident with Marks & Spencer’s Yeovil store development. Upon its opening in 1975 the company stated, ‘the two-floor store is situated in a very old part of Yeovil … with this in mind the architects designed a store which blends in with its surroundings’.204 Marks & Spencer also remarked that ‘this move also happily coincides with the fact that 1975 is European Architectural Heritage Year’.205 The company, by making reference to the existence of the campaign, sought to align themselves with it and was keen to be seen to do so. Retailers were eager to present themselves as allies of conservation and whilst such endeavours were arguably governed by commercial calculations, the actions of retailers were not antithetical to broader conservation efforts. Consultation and collaboration
A factor which increasingly appeared to encourage the conservation efforts of retailers was the burgeoning cohort of outside organizations concerned with the environment and conservation. When Marks & Spencer came to draw up plans for a new store in Ayr in 1974, it joined forces with the Town Council and the Royal Commission for Fine Arts. Marks &
202 Simon Gunn, ‘The Rise and Fall of British Urban Modernism: Planning Bradford, circa 1945–1970’, The
Journal of British Studies, 49 (2010), 849 - 869 (p.864). 203 Miles Glendinning, The Conservation Movement: A History of Architectural Preservation (Oxon: Rutledge,
2013); John Pendlebury, Conservation in the Age of Consensus (Oxon: Rutledge, 2009). 204 MSCA, St Michael News, ‘New Stores with style’, 2 (April, 1975), p.6. 205 Ibid, p.6.
New Researchers - Session I / E
92
Spencer stated that the aim of such a partnership was to ‘retain the character of the town centre’.206 The decision taken by Marks & Spencer to bring in outside advice showed an awareness of the crucial, and at times delicate, role retailing played within an historic area. Marks & Spencer were keen to promote not only the new store but also the extent to which it was intended to complement, not dominate, the local landscape. Such a collaboration and approach can be viewed as a pragmatic move on the part of Marks & Spencer, designed to ensure planning approval for its development in the area. Nevertheless, the commercial benefits of such a confluence of interests does not negate the environmental benefits, nor the impact it had in establishing a precedent for further collaboration between commercial retailers and outside organizations. Commercial branding
The store as conduit for a retailers’ commercial identity relied on a uniform architectural character, irrespective of place. Clifford Guy observed in 1994 that ‘Woolworth and Marks & Spencer both developed characteristic architectural styles to facilitate immediate recognition, irrespective of location’.207 The tendency for retailers to develop a cohesive architectural thumb print on the urban form precipitated fears that such a commercial strategy would wreak havoc on the sensitive environmental and architectural profiles of various high streets. Nevertheless, the design of retail stores was much more sensitive and amenable to changing tastes and attitudes than is often acknowledged. Additionally, there was an element of status to be derived from projects which courted local and national press attention. The willingness of retailers like Marks & Spencer and Sainsbury’s to undertake store development projects which sought to utilize the idiosyncrasies of the urban landscape illustrated their growing commercial dominance at this time. Both companies had enviable brand recognition amongst the general public. Such a presence arguably allowed them the freedom to undertake more varied projects. A.E. Kirby and A.M. Kent noted in the case of Sainsbury’s, that the company’s store ‘buildings became part of the company’s strategy … to reinforce the market leadership and brand strengths of the retailer’.208 Sainsbury’s store development in the 1980s marked a deliberate move by the retailer to further substantiate an air of commercial dominance in the food sector and ‘resulted in a portfolio of landmark stores’.209 The first of these was in Canterbury in 1984. Kirby and Kent noted that Canterbury was ‘a significant historical city’ and the store’s ‘architecture was designed to echo the spire of the medieval cathedral’.210 Sainsbury’s decision to architecturally confer upon the store a link between it and the grandeur and presence of the cathedral emphasized a belief in the value of conserving existing architectural motifs from the surrounding environment into the commercial aesthetic of the retail store. Store development projects which conserved local heritage made a clear commercial statement. In this regard conservation was not simply an imposition which was tolerated by retailers but rather a commercial tool, which enabled retailers to navigate the complex demands of modern day retailing and the growing calls for greater sensitivity towards environments.
Whilst the continued investment in, and expansion of, retailing provision, threatened to undermine the visual amenities and historical heritage of an area, it was increasingly realised that without it, the plight of the urban environment was all the more stark. The fortunes of the architectural and environmental quality of central areas, was directly linked to
206 MSCA, St Michael News, ‘Ayr Store Opens’, 7 (Dec., 1974), p.3. 207 Clifford Guy, The Retail Development Process: location, property and planning (London: Routledge, 1994),
p.115. 208 A.E. Kirby and A.M. Kent, ‘Architecture as brand: store design and brand identity’, Journal of Product &
Brand Management, 19:6 (2010), 432 - 439 (p.433). 209 Ibid, p.433. 210 Ibid, p.433.

New Researchers - Session I / E
93
the economic security provided by a strong retailing presence.211 It was the middle ground between economic prosperity, and the physical and cultural value of urban centres, which was increasingly sought and negotiated during the 1970s and 1980s. The compact and overdeveloped nature of many central areas ensured that retailers had to meet the urban landscape on its own terms. An exploration of the following case studies illustrates the extent to which the relationship between retailers and conservation was characterized by negotiation between a variety of actors. Case studies: Rickmansworth and Twickenham
Marks & Spencer’s planning applications for stores in Rickmansworth (1989) and Twickenham (1990) emphasized the issues involved in reconciling commercial and environmental imperatives. The reaction to, and the outcome of, the two planning proposals illustrated the broad spectrum of opinion with regard to retail developments at this time and the degree to which environmental and conservation considerations played a role in determining the success or failure of such schemes.
Marks & Spencer’s proposal for a neighbourhood food store in central Rickmansworth received significant opposition from local people. A key feature of the company’s application was its efforts to ensure the development was sensitive to the established surroundings. In a Marks & Spencer news bulletin in July 1989 it was stated that the proposed store ‘will be sympathetic to the immediate environment with landscaping and screening by trees’.212 That the company deemed it beneficial to release a press statement, clearly stating the environmental merits of the proposal, emphasized the degree to which such considerations were increasingly believed by retailers to be attaining greater importance within the store development process. Nevertheless, despite the company’s claim that the proposal would be environmentally sensitive, this was not deemed to be the case by all concerned. Richard Myers, the Director of Environmental Services at the Three Rivers District Council, contended that ‘there should be a greater recognition of the character and architectural detail of existing buildings in the locality’.213 Such a sentiment was also echoed by other organizations and resulted in amendments being made to the store design. Subsequently, it was clear that the aesthetics of the retail store were very much a product of negotiation and despite Marks & Spencer’s assertion to be in harmony with the local landscape, this was something which required finessing in the eyes of planners and local organizations.
Despite the importance attached to the environmental aspects of the Rickmansworth scheme by some, popular opinion focused on the suitability of Marks & Spencer themselves to fulfil the shopping needs of the everyday family. Concern was voiced in relation to the range and price of products offered by the company and this appeared to override the potential benefits of the company’s efforts to ensure the scheme was environmentally sensitive. Councillor Richard Struck lamented, ‘what on earth is the use of the “better environmental and aesthetic features” … if it does not meet the basic needs of the residents of Rickmansworth’.214 Consequently, the environmental aspects of the design were secondary to the economic effects of the store on the household economy. The latter had a direct impact on the standard of living of local residents, whereas the environment remained a peripheral consideration. In this regard Marks & Spencer and local planners appeared out of touch with local opinion. Despite popular misgivings regarding the scheme, the council voted to grant 211 English Heritage, Retail Development in Historic Areas (London: Allies and Morrison Urban Practitioners,
2005), p.5. 212 MSCA, Rickmansworth Store, S392/27/19, ‘news from Marks & Spencer’, Public Affairs Group (July, 1989). 213 Three Rivers District Council, 8/731/90, Planning Document - Retail food store and associated car parking,
correspondence from Richard Myers Director of Environmental Services to Messrs Debenham, Tewson & Chinnocks, ‘Retail Store for Marks & Spencer, High Street, Rickmansworth’ (27 Nov.1990).
214 MSCA, Rickmansworth Store, S392/27/20, document compiled by Ray Sewell of Raymond Sewell Chartered Surveyors (1989), Copy of an article, Councillor Richard Struck, ‘Meeting the needs of the residents’ Watford Observer (11 Aug. 1989), [n.p.] col. 1.

New Researchers - Session I / E
94
planning approval to the Marks & Spencer scheme in February 1991. The objections raised by locals were not land use planning issues and as such were not central to the council’s planning considerations. Furthermore, Marks & Spencer’s proposal for the site was not too far removed from its existing land use designation; as such although the scheme was within the Rickmansworth conservation area it was accepted, in contrast to the company’s Twickenham proposal.
In 1990 Marks & Spencer proposed to open a neighbourhood food store in Twickenham. The site was on the River Thames Embankment and inside the Twickenham Riverside conservation area. Unlike the company’s exploits in Rickmansworth, the protected status of the Twickenham site was a central concern, and a fundamental reason, as to why the scheme was rejected by the Department of the Environment in 1991. The council and Marks & Spencer outlined that the site had remained unused for a number of years and they asserted that the existing site ‘was sad, tired and neglected, and detrimental to the conservation area’; having acknowledged that the site was a ‘highly sensitive location’ they argued that ‘the existing buildings had little architectural value’.215 As such they proclaimed, ‘the development would bring about major improvements to the physical fabric and environment of this part of the town’.216 However, the support proffered by the council was seen by some to be highly subjective due to its own financial investment in the site and its ability to objectively rule on the planning issues was called into question. This, coupled with the location of the site on the embankment, led to ardent calls to the Secretary of State for the Environment to call the planning application in.
Secretary of State Chris Patten called in the application in 1990 and the subsequent inquiry was held in February 1991. During the course of the inspector’s investigation the issue which generated the greatest condemnation was the fact that the site sat on the embankment within a conservation area. A number of locals claimed that whilst they would welcome the arrival of Marks & Spencer into the area they were steadfastly opposed to the retailer developing on this site, due to its environmental significance. One Twickenham resident wrote to the Richmond and Twickenham Times lambasting the scheme as ‘a cynical and short sighted project that takes no account … of the council’s own promises to protect and enhance the environment’.217 There was a clear perception that, despite Marks & Spencer’s and the council’s protestations to the contrary, the scheme was environmentally damaging and that this was a key concern amongst local residents. Professor Sir John Hale, who was well known in the local area and active in environmental issues, contended that ‘the site was part of the riverscape and river frontage, not part of the town centre waiting to be tied into it by commercial development’.218 Hale’s observation clearly spoke to fears regarding urban sprawl at this time and a growing desire within society to protect what they perceived as areas yet untouched by the demands of urban living. It was this perceived overdevelopment of the site which residents sought to resist. There was also a desire to maintain a degree of separation between the commercial locus of the Twickenham high street and the river bank itself. Many thought that rather than achieve this, the Marks & Spencer development would bring the high street onto the doorstep of the river and thus weaken its isolated identity, as a conservation area of environmental value.
The overall design of the proposed Twickenham store was deemed unsatisfactory. This was a recurring complaint throughout the inquiry and within the press material concerning the application. The Borough of Twickenham Local History Society described it
215 London Borough of Richmond upon Thames, 90/1213, Stephen Marks, Inspector’s Report: Twickenham
Swimming Pool, The Embankment, Twickenham Application by Marks & Spencer PLC (1991), pp.12, 19, 21.
216 Ibid, p.18. 217 MSCA, Proposed Twickenham Store, S392/35/7, Copy of letters from Richmond and Twickenham Times,
Letter from Sheila Hale, Twickenham (Friday 26 October 1990), col. 1. 218 Marks, Inspector’s Report, p.47.

New Researchers - Session I / E
95
as ‘a development of inappropriate and mediocre design of a scale too large towards the river’ and ‘not suitably landscaped into the area’.219 Thus, contrary to the Rickmansworth site the physical attributes of the proposed store in Twickenham received considerable attention from the public. This was arguably due to the perceived gravitas of the environment in which it was intended to be placed. The inspector presiding over the inquiry stated in his concluding remarks that he ‘saw the design as boring, poorly related in its parts, alien to its situation and quite unacceptable in this important location’.220 He further acknowledged that in his view the scheme would have a ‘serious effect on the character and appearance of the conservation area’.221 It was primarily on the basis of these two observations that the inspector deemed it necessary to refuse planning permission. Conservation and retailing: a pragmatic relationship
In light of Marks & Spencer’s planning efforts it is evident that its store development was shaped by ad hoc negotiations influenced by the many idiosyncrasies of local and national interests and landscapes. Retailers were far from committed conservationists. However, the pragmatism required of retailers to function within a rapidly changing urban landscape ensured that conservation was a force which could not be ignored.
219 Ibid, p.44. 220 Ibid, p.57. 221 Ibid, p.61.

New Researchers - Session I / F
96
Risen from chaos: what drove the spread of mass schooling in China through the early twentieth century?
Pei Gao, London School of Economics
[email protected] Supervisor: Dr Chris Minns & Dr Debin Ma
1. Introduction
Mass schooling is one of the most pervasive social policies beginning in the early nineteenth century. As a feature of an institutionalized model for development around the globe, this system spread quickly from Europe to latecomers. In China, the attempt to provide mass schooling began relatively late, at the turn of the twentieth century; and the introduction of such a concept was only a part of a greater agenda – establishing a modern and west-inspired education system.
With a growing literature on determinants of education expansion (Beltran Tapia, 2013; Chaudhary, 2009; Gallego, 2010; Go & Park, 2012; Goldin & Katz, 2008; Lindert, 2004; Musacchio, Fritscher, & Viarengo, 2014), what makes China’s historical path exceptionally interesting? First, the case of China enriches literature by increasing our understanding of what drives the rise of education in societies with much different economic and political conditions from the developed world. Second, it is a challenge to empirically detangle effects from supply and demand of schooling; but with a distinctively new education system being promoted from scratch, the suddenly substantial change in education quality and quantity in China can be treated as an exogenous supply shock.
This paper is motivated by two puzzling observations. The modern education system in China emerged from a time of political turmoil. However, amid all the chaos and uncertainty, the diffusion of education was successful: primary enrolment ratio soared within four decades from nearly zero to 40 per cent. How could such success in providing public goods take place through such a trying period? Plus, the regional frontrunners in terms of economic prosperity did not outperform in primary schooling; implying that economic factors may fail to be the main predicator when it came to mass schooling development.
To look into the determinants of the rise of mass schooling in China through the initial stage of its development, this paper focuses on primary education only222. Through extensive archival work, I collected rich information covering more than one thousand Chinese counties. Our main finding is that local gentry was the main interest group who supported modern education expansion because of both their long-lasting public obligatory responsibility towards local affairs, and their private interests of viewing the education sector as their potential income source. Equally importantly, the story of roving bandits was applicable in the context of China. We find that political instability largely reduced the positive effect of local gentry. The finding of this paper is exceptionally important. First, it makes an interesting contrast with the early stages of the development of mass education in Europe, where the landholding elites were seen as the main interest group blocking the provision of education to the people down the ranks. Furthermore, it links historical legacy in traditional education and modern schooling together, which has been neglected by previous studies in the field of Chinese education history. Moreover, it sheds light on the growing
222 There are three reasons for choosing primary schools. First, mass education in China only covered primary
schooling through this period. Second, most of the education that the Chinese population had was through attending primary schools. Lastly, primary schooling proved to have the most positive effect on the early stage of industrialization (Psacharopoulos, 1981; Psacharopoulos & Patrions, 2004). In a nutshell, both the stage of education progress and the level of economic development of China through the early 20th century determine the predominant importance of primary education.

New Researchers - Session I / F
97
literature stressing the importance of informal institutions enforced by social groups in providing public goods in non-democratic societies. 2. The new primary education system
The modern educational movements in China that took place at the turn of the twentieth century contained two crucial components. First, the new system intended to substantially increase the quantity of education by publicly providing schooling to the masses. The other was curriculum reform – the transition from Confucian teaching to modern education content. For the primary schooling system specifically, one principal change lay in the dominance of public schools223 over private ones; and the other was its highly decentralized design – all the decision-making authorities were concentrated in the hands of local government.
Table 1: Primary schools by property right
Year Public (%)
Private (%) national provincial
local County Sub-county
1916 0.03 74.07 25.93 1930 0.01 0.61 26.45 48.49 24.44 1933 0.01 0.62 17.26 64.12 17.6 1940 0.01 0.16 47.49 45.47 6.87 1946 0.02 0.14 94.1 5.75
3. What could explain the rise of mass schooling in China?
With minimum contribution from central and provincial governments, how did such successful diffusion of public primary education took place? 3.1 Is prosperity of economy the main driving force?
Our immediate guess was economic prosperity. Even though measures of economic development are not available at unit of county; we have a clue as to where those rich regions were located – places with better market access and institutional set-up (Jia, 2014; Ma, 2008).
Graph 1: The ‘open and rich’ regions vs the rest of China
223 ‘Public school’ in this paper refers to a school which is publicly provided, but not necessarily fully relying on
public funding. Education provision has a slightly broader frame of reference, and its tasks include capital investment, hiring teachers, selecting the curriculum etc. Education funding, on the other hand, concentrates only on the source of funding (Goldin, 2015).

New Researchers - Session I / F
98
An unexpected result has arisen. Compared to its counterparts, the ‘rich & open’ group showed no advantages but worse outcomes in education development, both measured by school accessibility and enrolment rates; while they possessed significantly higher population density.
Table 2: Statistic summary for primary schooling level by group
3.2 Interest groups in modern primary education
Our second guess was a political-economy explanation that the development of local education was an outcome determined by interest groups’ preferences. Drawing on historical micro studies, in the local politics arena, the gentry class was the one that rigorously encouraged modern primary education, both because of their long-lasting elitism responsibility and their private interests (Bastid, 1988; Borthwick, 1983; Chauncey, 1992; A. McDonald, 1978; Qinchu, 1936; Wen, 2002).
3.2.1 Unwilling and incapable county government
According to state regulations, all the educational decisions about primary schooling were delegated to county government. No incentive structure
The local political environment in early twentieth-century China failed to meet necessary condition to deliver functioning governance. First, Olson sketches the pattern where greater government accountability emerges in places with higher political stability (Olson, 1993). In China, the average time for county magistrate in office was exceptionally short throughout this period. With such high frequency of reshuffle, local authorities had very little incentive to provide public goods, such as education, which generates no short-term benefits. Furthermore, even if there was enough time for local officials to put anything into practice, their incentive to do so would be limited too. On the one hand, they faced no pressure from local elections; on the other hand, weakly visible supervision was presented from top-down. More importantly, the reward mechanism in politics placed far more importance on political conformity than on governing performance.
Table 3: County magistrate’s turnover Local Magistrates Average length in office
<0.3 0.3-0.5 0.5-1 1-1.5 1.5-2 >2 1911-1917 0.59 9.7 64.71 12.94 7.06 4.9 1917-1932 0 3.07 55.36 26.3 3.97 7.33

New Researchers - Session I / F
99
Non-obligatory efforts in tax revenue collection
Local government was officially equipped with little fiscal capacity to finance primary education. In order to collect enough financial resources, they had to resort to informal, if not illegal, practices – levying profiling surcharges on its residents for local projects. Such local fiscal liberty laid down the ground for local exploitation. Strikingly, predatory behaviour toward the inhabitants was less than expected; and referring to the education sector specifically, based on these new levies, respectful performances were delivered.
Facing no institutional checks and incentives, why did local government pay non-obligatory efforts, not for corruption, but for local public good provision? 3.2.2 The role behind the curtain: local gentry
With local government had no capacity and incentive, gentry stepped in to ensure the continuation of local civil administration. The real decision makers through such a trying period were local gentry.
The so called gentry class224 in China obtained their high prestige via success in the civil service examination; who approximately comprised the top 1-2 per cent of the Chinese population (Chang, 1962). They had been serving the enormously important function in ruling local communities in China for a very long time. Gentry were far from a homogenous group who enjoyed similar social prestige and sources of income. Instead, its membership could be divided into two tiers. The top tier was high degree holders who were qualified for official appointment. The lower tier were the degree holders who had only passed the licensing examination, which was not eligible for office-holding (Ho, 1962). Without a post in the public sector, lower degree holders were the ones who stayed behind in their home localities. According to social norms, they were often provided opportunities to manage local affairs.
Graph 2: The structure of gentry
The role of gentry in the primary education sector was enlarged through the early
twentieth century. First, gentry’s function was endorsed by the state. In the Education Act of 1904, it is specifically notes that ‘Local officials may charge gentry members … with responsibility for educational affairs. Furthermore, gentry’s private interests of earning a living in primary education sector became more and more critical. Given the tight link 224 ‘Gentry’ has a distinctive meaning compared to its meaning in the European context. Gentry in Europe are
associated with land-holdings and aristocracy, both of which are inheritable. Instead, in China, gentry refer to people who obtain their status through success in the Examination, which cannot be inherited.

New Researchers - Session I / F
100
between gentry’s status and the Civil Service Examination, the discontinuity of the exam in 1905 had a devastating effect on local gentry. New elites who came from modern education backgrounds gained more advantages for lucrative posts in managing public affairs; to some extent, the local primary education sector therefore constituted the gentry’s last resort in local job market. 4. Data and empirical results This section empirically unveils the driving forces of mass schooling from two perspectives. Firstly, did the strength of local gentry contribute to mass education development? Second, to what extent did the political turmoil mitigate or enlarge local gentry’s effects?
Graph 3: Geographic data coverage (China proper) & sample counties 4.1 Data
Less systematic records survived and lack of census data impose more challenges on studies targeting China. Based on extensive archival work, I assembled a county-level dataset covering the majority of provinces in China Proper. We would like to examine two key variables. Firstly, to measure the strength of the local gentry, we use the regional quota for the lower degree holders. As an institutional means of regulating the power of the gentry, the number of successful candidates for the lowest level of the exam was determined by a quota system. Second, dispersion of political stability across counties is our other concern. Here we use the frequency of the county magistrate’s turnover as an indicator. Additionally, we also collect a variety of potential indicators for economic prosperity at the unit of county.
Table 4: Summary statistics for main variables Variables Ob mean s.d
schooling variables
primary enrolment ratio_07 1141 1.91% 0.034
primary school density (over 1000 people) _07 1141 0.143 0.3053
primary school density by area _07 1141 0.198 0.446
primary enrolment ratio_16 1128 9.30% 0.0887
primary school density (over 1000 people) _16 1128 0.489 0.478
primary school density by area _16 1128 0.807 1.159
primary expenditure per capita_16 1128 0.085 0.238
Student-teacher ratio_16 1128 31.42 102.58
primary enrolment ratio_33 787 22.65% 0.177
primary school density (over 1000 people) _33 787 0.899 0.812
primary school density by area _33 787 1.32 1.18 primary expenditure per capita_33 787 0.38 0.69
Size of gentry Quota density of Imperial Civil Examination 1066 0.00013 0.00012
Accumulated Jinshi number 1499 14.22 27.4 Political Stability Magistrate turnover_16 592 1.22 0.701
Magistarte turnover_33 592 1.13 0.806

New Researchers - Session I / F
101
*Selective Data Source.225 Collection of Chinese County gazetteers Imperially Established Institutes and Laws of the Great Qing Dynasty The first statistic reports on Education in 1907 The first/ second/ third education yearbooks of China through Republican China Provincial level Treasury Reports for Shandong, Hunan, Zhili, Shandong and Guangdong provinces CHGIS (2007), Harvard Yenching Institute FAO (2012), Global Agro-ecological Zones Stauffer (1922), The Christian occupation of China 4.2 Correlation between the local gentry and modern schooling development
Because of data limitation, the local gentry’s number is cross-sectional information by definition. Therefore, we will first simply examine a cross-sectional correlation as follows:
Here, i represents county; Schooling is a set of variables capturing education development level; G is the variable of interest – strength of local gentry (Shengyuan quota density); stands for a few economic and geographic controls we include, and is the error term. One potential problem is that the quota number for the lower tier of gentry was not randomly assigned; in fact, the figure was associated with the size of the county and its economic importance (Chang, 1955). To deal with potential endogenous issues, we exploit the sudden increase in quota through the Taiping Rebellion as an Instrumental Variable, because the magnitude of increase in quota figures was not correlated with the original quota number either its economic development level. The quotas across counties remained very stable until the 1850s. More quotas were granted to disruptive counties duo to the rebellion as an incentive to abstract local taxes; or extra quotas were allocated as awards to the hometown of magistrate who successfully organized military force against rebellions during this chaotic period.
Table 5 presents the estimation results, and columns 1-6 show first-stage results, with and without controls. Columns 7-12 present the IV estimation results. By applying IV strategy, the magnitude of the effect of quota density is slightly smaller than the results from simple reduced-form regressions. One standard deviation change in the density of lower
225 Constrained by this paper’s length, only a list of selective data sources were presented here.

New Researchers - Session I / F
102
degree holders will cause 18.9 per cent, 18.86 per cent and 14.84 per cent change of the mean of the primary schooling enrolment ratios in 1906, 1916 and 1933.
Additionally, the findings provide some clues on the ambiguous relationship between educational development and economic prosperity. Regions with booming modern industry clearly have advantages in terms of schooling development. However, the urbanization level seems to be negatively correlated with primary schooling, which may imply that the higher inequality level in big cities discouraged public goods provision. Geographic controls show some interesting results as well, the father away from the regional political centre, say prefecture seat, the worse primary education development was.
Table 5: Estimation results from IV
4.3 The mitigating impact of political instability This section examines whether the relationships between the strength of local gentry and schooling development would be different for politically stable and chaotic regions. As county gazetteers only documented magistrate turnover after 1911, also not all the counties preserved their records well; therefore, the sample shrinks after adding this factor into our consideration.
Here, is the new variable we added in, which refers to political stability (average tenure for county magistrate), G still represents the strength of local gentry in the Qing dynasty; then we add in their interaction term.
One potential problem of this regression is that regions exposed to an unstable political environment will also easily lead to less developed economies, which could severely bias our estimation. As most of the regional warfare occurred along provincial boundaries,

New Researchers - Session I / F
103
resulting in an unstable political environment, we exploit a dummy variable which indicates a county weather located along provincial border lines as an IV for political instability.
The findings show that the interaction term between political instability and quota density is negative, implying that the higher frequency of magistrate turnover mitigated the positive effect of local the gentry. One year more for a magistrate in office enlarged the effect of quota density by 22.3 per cent for 1916. Similarly, the effect was 16.8 per cent in 1933.
Table 6: Simple OLS and IV Results
1916 1933
OLS IV OLS IV
political instability 0.0118 0.00901 0.049 0.0415 0.0216 0.058
(0.0118)* (0.0052)* (0.13)*** (0.034)* (0.03 (0.00012)***
Local gentry 189.51 208.35 202.6 216.58 387.9 346
(83.5)*** (52.14)*** (105)* (123.5)*** (136)*** (163)*
Political stability*gentry
‐25.8 ‐33.38 ‐36.4 ‐36.9 ‐53.6 ‐48.9
(15.6)* (11.79)*** (18.53)** (16.8)** (32.1)* (41.2)
population density ‐9.96E‐04 ‐6.11E‐04 ‐6.42E‐04 ‐4.34E‐04 ‐6.11E‐04 ‐6.42E‐04
(2.04E‐04)*** (2.08E‐04)*** (2.76e‐04)*** (8.42e‐04)*** (2.08E‐03)*** (2.76e‐03)***
modern industry 0.02 ‐0.032 0.126 0.14 0.15 0.126
(0.0012)* ‐0.028 (0.72)* (0.081)* ‐0.24 (0.07)*
openness
21.5 37 32 89 82 78
(27.8) (30) (33) (57) (56) (85)
controls YES YES YES YES YES YES
FE province NO YES NO NO YES NO
observations 581 581 581 462 462 462
R‐squred 0.27 0.42 0.41 0.18 0.32 0.34
Due to the constraints on this paper’s length, results using other schooling outcomes as dependent variables and many robustness checks will not be presented here.
4.4 Possible influencing mechanisms of local gentry
To unravel why and how the local gentry contributed to mass schooling expansion, hundreds of county government balance sheets on educational finance have been collected. We find that the two main financial channels of primary schools were both closely associated with the strength of the local gentry.
First, the revenues from surcharges which accounted for 60 per cent of the county budget for primary education. As discussed, levying surcharges on residences for local use was not a state-endorsed governing behaviour; instead, it was entirely locally initiated and dominated by the local gentry’s decisions. The other mechanism was one inherited revenues generating tool-endowed school land. Under the tradtional education system, endowed school lands were owned by academies where potential examination candidates attended, which implies that regions with higher quotas for lower degree holders presumably would have more endowed school land.

New Researchers - Session I / F
104
Table 7: The revenue source for primary education All Hubei Shandong Henan Zhili Jiangsu
Various surcharges 63.7 41.49 70.4 76.7 59.62 70.29 on land tax 40.61 21.94 62.3 51.8 26.43
Endowed school land 17.8 43.51 12.9 16.33 8.53 8.19
5. Conclusion
Given the political turmoil throughout early twentieth-century China, mass education quickly spread across China mainly contributed to by public provision, which provides us a good testing ground for investigating the determinants of schooling provision. Our main results show that economic factors possess little explanatory power in determining educational outcomes; in contrast, regional political stability and the strength of local elites account most for the variation in schooling level. To be more precise, the strength of the local gentry contributed to the rise of primary schooling, whereas political instability mitigated the gentry’s positive effect.

New Researchers - Session I / F
105
Did the turnpike trust financial model fail local savers?
Ian Webster, Sheffield Hallam University ([email protected]) Supervisor: Dr Nicola Verdon
The essential element of the turnpike trust financial model was that trusts borrowed money to finance capital investment, and repaid the loans with interest out of future toll income. In 1822 trust debts totalled £4.3 million and had grown to £8.5 million by 1834. By 1850, trust debt had fallen marginally to £8.1 million, of which £1.6 million was arrears of unpaid interest. This paper will show that between 1850 and 1883, lenders failed to recover £5.1 million of their loans and the interest due to them. On this basis, the trust financial model failed in its basic requirement to repay loans and, in particular, failed to repay the significant group of local people who were risk-averse savers rather than investors.
The view that turnpike trusts were often in poor financial health is not new. The Webbs wrote in The Kings Highway that most were ‘falling … deeper and deeper into insolvency’.226 In addition, William Albert in 1972 showed that around 60 per cent of trusts in both 1821 and 1837 were in an ‘adverse financial condition’.227 Neither the Webbs nor Albert sought to quantify the scale and impact of trust financial problems. Theory, methodology and sources
Parliament granted individual trusts the right to levy tolls for 21 years in order to repay loans raised to improve the condition of the roads. Allowing a year for road construction, a trust then had 20 years to repay the debt. The trust should therefore have either been paying 5 per cent of its debt off every year, or putting 5 per cent aside so that lenders could be repaid in full at the end of 21 years. In addition, the vast majority of trusts borrowed at 5 per cent, so should have been paying 5 per cent interest a year to their lenders.228 Turnpike trusts therefore had annual debt service obligations equivalent to about 10 per cent of their outstanding debt. This paper is concerned with the question of how the trust financial model worked in practice.
Between 1834 and 1883, over 1,100 turnpike trusts were required to make annual returns to Parliament. These returns listed the outstanding debt, loans raised, loans repaid, and the interest paid to lenders for each trust.229 From these returns it is possible to calculate how much trusts should have paid lenders, and compare the totals with the sums the returns say that trusts actually paid. The difference between the sums due and the sums actually paid was the loss to lenders. These returns, and the occasional returns from the 1820s, can also be used to identify the causes of the underlying problem. A subsidiary analysis of a sample of trust mortgage registers gives a breakdown of the addresses and professional status of lenders.230 This data will help to answer the question of whether lenders to trusts should be seen as savers or investors, and give an idea of the number of lenders, and the average amounts lent. Results
There are six elements to this section. First, it uses the annual returns for 1850 to demonstrate the scale of turnpike trust debt problems. Second, it examines the action the government then took to regulate turnpike trusts. Third, it uses the annual returns for each year up to 1883 to calculate the losses to lenders to trusts. Fourth, it uses the sample of mortgage registers to show who the lenders to trusts were, and to distinguish between investors and savers. Fifth, it
226 S. & B. Webb, English Local Government Volume 5, The King’s Highway (London, 1913) p.220. 227 William Albert, The Turnpike Road System in England 1663-1840, (London, 1972) app.D. 228 British Parliamentary Papers 1852-53 (1573) Income and Expenditure of Turnpike Trusts 1850, col. 28. 229 All in British Parliamentary Papers. Generally with the title ‘Income and Expenditure of Turnpike Trusts’. 230 41 turnpike trust registers examined in local record offices in Wakefield, Bradford, Sheffield, Warwick,
Preston, Leicester, Chester and Matlock.
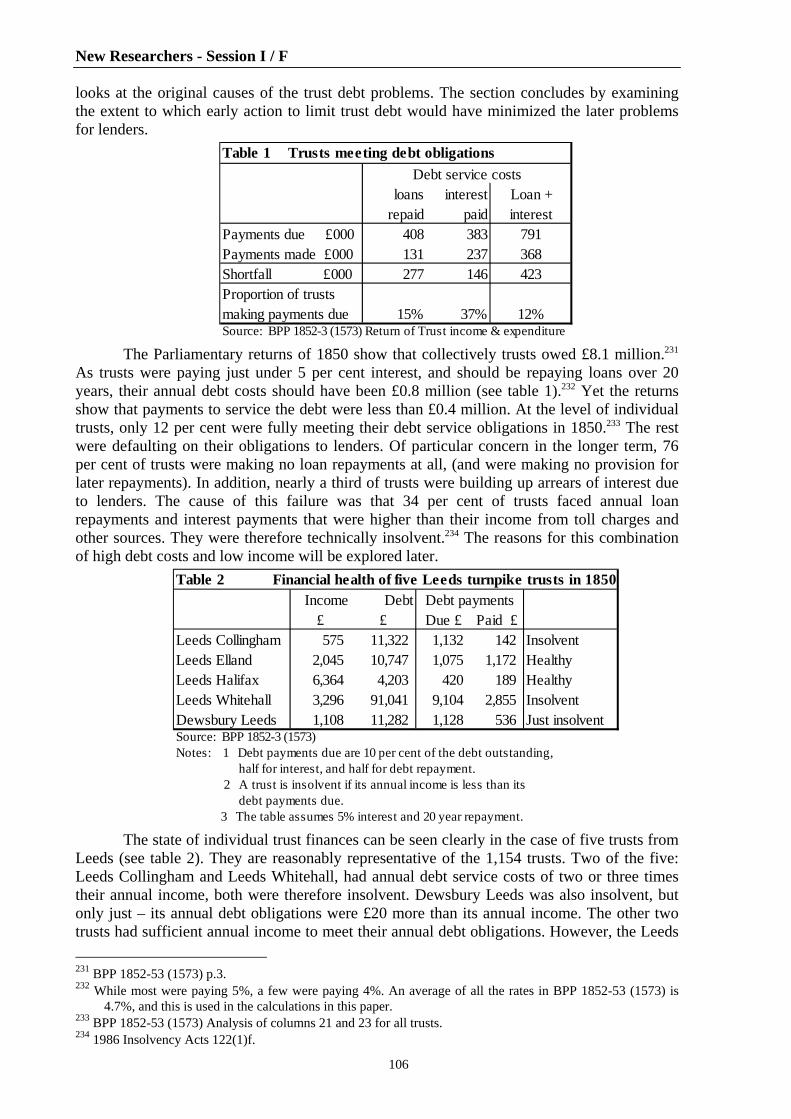
New Researchers - Session I / F
106
looks at the original causes of the trust debt problems. The section concludes by examining the extent to which early action to limit trust debt would have minimized the later problems for lenders.
Table 1 Trusts meeting debt obligations
loans interest Loan +repaid paid interest
Payments due £000 408 383 791Payments made £000 131 237 368Shortfall £000 277 146 423Proportion of trustsmaking payments due 15% 37% 12%Source: BPP 1852-3 (1573) Return of Trust income & expenditure
Debt service costs
The Parliamentary returns of 1850 show that collectively trusts owed £8.1 million.231 As trusts were paying just under 5 per cent interest, and should be repaying loans over 20 years, their annual debt costs should have been £0.8 million (see table 1).232 Yet the returns show that payments to service the debt were less than £0.4 million. At the level of individual trusts, only 12 per cent were fully meeting their debt service obligations in 1850.233 The rest were defaulting on their obligations to lenders. Of particular concern in the longer term, 76 per cent of trusts were making no loan repayments at all, (and were making no provision for later repayments). In addition, nearly a third of trusts were building up arrears of interest due to lenders. The cause of this failure was that 34 per cent of trusts faced annual loan repayments and interest payments that were higher than their income from toll charges and other sources. They were therefore technically insolvent.234 The reasons for this combination of high debt costs and low income will be explored later.
Table 2 Financial health of five Leeds turnpike trusts in 1850Income Debt
£ £ Due £ Paid £Leeds Collingham 575 11,322 1,132 142 InsolventLeeds Elland 2,045 10,747 1,075 1,172 HealthyLeeds Halifax 6,364 4,203 420 189 HealthyLeeds Whitehall 3,296 91,041 9,104 2,855 InsolventDewsbury Leeds 1,108 11,282 1,128 536 Just insolventSource: BPP 1852-3 (1573)Notes: 1 Debt payments due are 10 per cent of the debt outstanding, half for interest, and half for debt repayment. 2 A trust is insolvent if its annual income is less than its debt payments due. 3 The table assumes 5% interest and 20 year repayment.
Debt payments
The state of individual trust finances can be seen clearly in the case of five trusts from Leeds (see table 2). They are reasonably representative of the 1,154 trusts. Two of the five: Leeds Collingham and Leeds Whitehall, had annual debt service costs of two or three times their annual income, both were therefore insolvent. Dewsbury Leeds was also insolvent, but only just – its annual debt obligations were £20 more than its annual income. The other two trusts had sufficient annual income to meet their annual debt obligations. However, the Leeds 231 BPP 1852-53 (1573) p.3. 232 While most were paying 5%, a few were paying 4%. An average of all the rates in BPP 1852-53 (1573) is
4.7%, and this is used in the calculations in this paper. 233 BPP 1852-53 (1573) Analysis of columns 21 and 23 for all trusts. 234 1986 Insolvency Acts 122(1)f.

New Researchers - Session I / F
107
Halifax trust chose to pay only half their debt obligations, and to spend the unpaid sums on road improvements. Only the Leeds Eland trust met their debt obligations in full.
Eventually, in 1849 the government did insist that trusts set aside a sum equal to 5 per cent of any new loans in order to repay lenders.235 A further Act in 1850 applied this principle to all existing loans.236 In both cases, once £200 had been set aside, lenders were invited to take part in a reverse auction, with the lender willing to accept the lowest pence in the pound repayment being repaid. Any money left over was then repaid to the next lowest bidder. This process was repeated every year in which at least £200 had been set aside. A third Act in 1851 allowed trusts to write off all interest that had remained unpaid for 10 years, and allowed trusts to negotiate lower interest rates on existing debt.237 These three Acts produced immediate action, and most trusts used all three measures to reduce their liabilities. Between 1852 and 1859, eight annual Acts detailed how much trusts wrote off.238 They show that 71 trusts wrote off nearly £0.4 million of debt, 60 wrote off unpaid interest of £0.8 million, and 70 reduced interest rates payable to lenders, resulting in a loss to lenders of £0.6 million of future interest payments.239 Trusts continued to reduce their debt burdens in these ways during the 1860s, 1870s, and 1880s.
Table 3 Losses incurred by trust lenders, 1850-83At start of decade Total
Trust Mortgage Unpaid loans not Interest Losesnumbers debt o/s interest repaid given up to lenders
£m £m £m £m £m1850s 1,154 6.5 0.8 0.4 0.6 1.81860s 1,101 4.8 0.5 0.4 0.6 1.51870s 936 2.7 0.3 1.2 0.3 1.8up to 1883 113 0.3
Totals 1.6 2.0 1.6 5.1Loss 100% 31% 45% 38%
Source: Annual turnpike trust returns to Parliament, 1852 to 1884.
During the decade
Table 3 shows the impact of these write offs up to 1883 when virtually all turnpike
trust debt had been repaid or written off. The whole of the £1.6 million arrears of interest in 1850 was written off, as was £2 million or 31 per cent of the 1850 mortgage debt of £6.5 million. The reductions in interest rates payable meant that lenders’ entitlements to interest were reduced by £1.5 million over the 33 years to 1883, equivalent to a 45 per cent reduction. In total, lenders therefore lost £5.1 million, or 38 per cent of the sums they might have expected to receive from trusts. After allowing for the losses of unpaid interest and the loans that were not repaid, lenders to turnpike trusts received average returns on their loans of just 0.25 per cent a year between 1850 and 1883.240
A review of 41 turnpike trust mortgage registers shows that 85 per cent of trust borrowing came from individuals, and 98 per cent of these individuals were identifiably local, lending an average of £100 each.241 There were therefore probably up to 65,000 lenders to turnpike trusts, and the losses probably affected around 25,000 of these lenders.242 Turnpike 235 Turnpike Trust Continuation Act, 12 and 13 Victoria c87. 236 Turnpike Trust Continuance Act (No.2), 13 and 14 Victoria c79. 237 Relief of Turnpike Trust Debt Act, 14 and 15 Victoria c38. 238 Turnpike Trust Arrangement Acts for each year. 239 BPP 1852-59 Annual returns of turnpike trust income and expenditure. 240 They should have been paid £5.4m interest. Write offs totalled £5.1m, so the net return to lenders was £0.3m. 241 Mortgage register details/periods. About two years average earnings, so perhaps equivalent to £50,000 at
2014 prices. Most of the other 15% came from loans from the Public Works Loan Board. BPP 1851 (512) PWLB return to Parliament of loans made.
242 £6.5m divided by £100 = 65,000 lenders. Applying the 38% losses to 65,000 gives 24,700 losers.

New Researchers - Session I / F
108
trust mortgage registers often give the social class of the lender, and it is possible to summarize the many social groupings used in mortgage registers into just two groups. Table 4 calls the 73 per cent described as ‘lords’, ‘baronets’, and ‘gentlemen’, ‘merchants’, ‘manufacturers, ‘bankers’, ‘farmers’, ‘yeomen’, and ‘tradesmen’ as investors. Dan Bogart argues that these investors can be expected to have lent money to the turnpike trust in the expectation of it increasing the value of their land or business.243 The 27 per cent described as ‘women’, ‘churchmen’, ‘professionals’, and ‘estates controlled by executors’, are grouped together as ‘savers’. The savers can be expected to have lent money to the trust simply to earn interest on the sum loaned, while not risking the capital. A similar analysis of lenders to canal companies shows a very similar division, with 30 per cent of mortgage loans coming from savers.244 In contrast, only 12 per cent of canal shareholders were from those groups defined here as savers. The conclusion is that the vast majority of lenders to turnpike trusts were local and that more than a quarter of them were risk-averse savers rather than investors willing to take a risk.
Table 4 Investors and savers in turnpikes and canalsInvestors Savers
Turnpike trust lenders 73% 27%Canal shareholders 88% 12%Canal mortgagees 70% 30%Source: J. R. Ward, The Finance of Canal Building , and analysis of mortgage registers of 41 trusts.
The causes of turnpike trusts’ inability to repay their lenders were evident in the return made to Parliament and published in 1824. Table 5 shows that in 1822/3 24 per cent of trusts were technically insolvent, and only 4 per cent of trusts were fully repaying loans (or making provision to do so) and paying all the interest due. Between 1822 and 1834, trust debt had increased by £4 million to finance road improvements. This debt increase brought with it annual debt service costs of £0.8 million, yet income rose by just £130,000 a year.245 The result was that the proportion of technically insolvent trusts had increased to 28 per cent by 1834, (see table 5). The conclusion must be that before 1834 trusts were borrowing far more than they could afford to repay, and their investments in road improvements were not producing sufficient extra income to meet the debt costs. This behaviour was particularly egregious in the 1820’s boom in trust borrowing, but the 1824 returns suggest that borrowing too much was also a problem before the 1820s.
Between 1834 and 1850, trust income had fallen by £350,000 a year, but trusts responded to this by reducing their improvement and repairs spending by £500,000 a year.246 As a result, their total outstanding debt fell slightly by 1851. However, the major growth in debt before 1834 caused the proportion of insolvent trusts to rise to 34 per cent, (see table 5).
243 Dan Bogart, ‘Turnpike Trusts and Property Income: New Evidence of the Effects of Transport Improvements
and Legislation in Eighteenth Century England’, Economic History Review, 62, no. 1 (2009), pp.128-152. 244 J.R. Ward The Finance of Canal Building in Eighteenth Century England, (Oxford, Oxford University Press,
1974) Analysis of sources of finance for each canal. 245 BPP 1824 (470) and BPP 1836 (2). 246 BPP 1836 (2) and BPP 1852-53 (1573).

New Researchers - Session I / F
109
Table 5 Trend in Trusts' inability to meet debt obligations1822/3 1834 1850
Proportion of trustsmaking payments due
Interest 34% 32% 37%Principal 7% 9% 15%Both 4% 4% 12%
Proportion of truststechnically insolvent 24% 28% 34%Sources: BPP 1824 (470), BPP 1836 (2) and BPP1852-53 (1573).
Two steps could have reduced the impact of the growing debt and insolvency problem. First, trusts should have made better financial decisions in the 1820s, and invested less in improvement schemes with a poor return, perhaps halving their 1822-34 borrowing. They should also have used their rising income to repay more debt and pay all of the interest due to lenders. These steps would have reduced their 1834 debt by £3 million.247 Second, the government could have acted as a regulator and restricted trust borrowing, based on the evidence of the early 1820’s returns. To achieve this, Parliament could have insisted that each trust Act included a clause making provision to repay 5 per cent of their loans every year. Parliament could also have prohibited trusts where debt was more than three times income from engaging in new borrowing.248 These two actions would also have reduced 1834 debt levels by £3 million. The results of either set of actions would have been materially lower post-1850 losses for lenders.249 Conclusions
The turnpike trust financial model clearly failed because it was not able to fully repay lenders. Initially this was a legislative failure because the Parliamentary Acts establishing each trust placed no limit on borrowing. Nor did the Acts explicitly specify that loans should be repaid over the 21 years that tolls could be levied for. Second, far too many trusts borrowed far more than they could repay, particularly in the 1820s. This problem was exacerbated by the post-1834 fall in toll income, but this was not, by itself, a cause of the problem. The third cause of the failure was that after the problem of rising debt levels became clear in the early 1820s, it took the government nearly thirty years to correct the initial legislative failure.
The result was that lenders lost £5.1 million, and received a return of just 0.25 per cent instead of the 5 per cent most expected. With hindsight, lending to a single turnpike trust was not a wise move for those interested only in earning interest on their savings. They would have been much better to invest in government stock, and earn a safe 3-3.5 per cent with little risk of a default. The failure of the turnpike trust financial model was less of a problem for landowners and commercial interest who invested in trusts in the hope of seeing the value of their land and businesses grow. For savers, who just wanted a safe return on their savings, there were no compensating gains.
247 £2m less borrowing, £0.5m more debt repayment, and £0.5m less arrears of interest. 248 BPP 1833 (703) Select Committee on Turnpike Roads, p.iv. And BPP 1836 (547) Select Committee on
Turnpike Roads, p.vi. 249 5% debt repayment for the years 1822-1834 would have seen £2.5m repaid rather than the £1m actually
repaid. And if the 45% of trusts where debt exceeded three times income, could not borrow, then borrowing would have been £1.5m lower, £3m lower in total.

New Researchers - Session I / G
110
Did Greece genuinely introduce either of the Gold, or Gold Exchange, Standards in 1910?
Olga Christodoulaki, London School of Economics
([email protected]) Supervisors: Professors Max-Stephan Schulze & Albrecht Ritschl
These days 1910 is usually cited by contemporary economic historians and economists as the year that Greece adopted either the gold standard or the gold exchange standard, depending on their view. By contrast, before the 1980s it was generally believed that the Greek currency had remained inconvertible throughout the period from September 1885 when the gold standard was suspended until May 1928 when the gold exchange standard was de jure introduced.
What was the monetary arrangement in Greece in 1910 that has prompted scholars to argue more recently that Greece adopted a clearly defined monetary rule during that year even though there is no agreement amongst them on which rule Greece in fact introduced? Furthermore, why is there a discrepancy between the way that monetary change in Greece in 1910 is seen in recent economic history literature and the way it was considered by scholars and policy makers at the time? I
Article 30 of the Law of Control which was introduced in 1898, encouraged monetary discipline in Greece as it strictly prohibited the National Bank from using the printing press to support lending to the government without the consent of the International Financial Commission (IFC), until the debt in banknotes from the forced circulation had been fully paid off.250 Article 30, however, incorporated an escape clause which allowed for an increase in the number of banknotes in circulation under the condition that this was for the ‘needs of trade’. This escape clause was used in 1910 to introduce article eight of the ΓΧΜΒ Law which outlined the prerequisites for an increase in the money supply without the Law of Control being violated.
On 19 March 1910 (Julian calendar) two laws were enacted by the Greek government: the ΓΧΜΑ Law which dealt with coinage and the ΓΧΜΒ Law (the Law), the primary purpose of which was to authorize the floatation of a loan on the international financial markets.251 Articles one to seven of this law dealt with the flotation of a loan of up to 150 million gold drachmae on the international financial markets whilst article 10 proposed the restructuring of the government loans denominated in gold and placed under the jurisdiction of the IFC.
The ΓΧΜΒ Law, however, is remembered and still discussed for its article eight which introduced the most important monetary reform in Greece between the suspension of convertibility in 1885 and de jure stabilization of the drachma in 1928. Article eight of the ΓΧΜΒ Law is also often called the Valaorites Law as it was the brainchild of Ioannis Valaorites, the sub-governor of the National Bank, the bank of issue at the time in Greece. Ioannis Valaorites drafted the article and the Minister of Finance agreed to add it to the ΓΧΜΒ Law whilst the IFC did not raise any objections.
Article eight of the ΓΧΜΒ Law authorized the National Bank to increase for its own account, the banknotes in circulation beyond the limit that its issuing privilege allowed on condition that these freshly printed notes were used to buy gold and foreign exchange at a 250 House of Commons, UK, Greece No 1: Greek Law of Control (1898), pp.14-15. 251 See National Bank of Greece, Volume B. Includes the text of laws, decrees, agreements, regulations etc. that
deal with the National Bank. Annex B, 1901-1913, pp.233-240. In fact, the ΓΧΜΒ Law was entitled ‘About a loan up to 240,000,000 gold drachmae, about ending forced circulation and about changing the terms validated by the ΒΦΙΘ Law of 26th February 1898 of the International Control, relating to gold loans under their jurisdiction’.

New Researchers - Session I / G
111
price that was not above par. The National Bank was then obliged to sell the gold at par plus one per thousand as a commission. Foreign exchange was to be sold at the equivalent of the parity of the drachma with the French franc, this time with half a per cent added as profit. When gold or foreign exchange was sold then the equivalent value in banknotes had to be withdrawn from circulation. The Law also provided that an agreement between the National Bank and the government validated by a royal decree, was necessary to determine the limit up to which banknotes could be issued by the National Bank whilst still abiding by the principles of this Law. Subsequent agreements could authorize a further increase in the upper limit of the banknotes issued under the principles stated in article eight. In addition, this article allowed the use of gold coins as a medium of exchange.
The parity that the ΓΧΜΒ Law refers to was the parity of the drachma set in 1868 when Greece joined the Latin Monetary Union, that is to say that one paper drachma equalled one gold drachma which in turn was equal to one French franc. This parity had been reached towards the end of 1909 after a long period where the Greek currency had at first depreciated severely between 1886 and 1901 and then appreciated again.
It should be noted that the ΓΧΜΒ Law did not restrict the buying and selling of foreign exchange to the foreign exchange of countries on the gold standard as has been argued.252 The Law refers only to foreign exchange in general a practice followed in all the subsequent agreements between the government and the National Bank authorizing the latter to increase the banknotes in circulation under the principles of article eight of the ΓΧΜΒ Law. This monetary development in 1910 was not a conscious act on the part of the Greek monetary policy authorities to adopt for the country a monetary standard, let alone the gold exchange standard. Its aim was to curb the appreciation of the drachma and at the same time to increase liquidity, in particular during the period of the harvest.
Article nine of the ΓΧΜΒ Law allowed for an increase in the nominal capital of a prospective loan then being authorized under this law from 150 million gold drachmae to 240 million gold drachmae under the terms specified in its previous articles. The proceeds of this part of the loan would be assigned exclusively to the repayment of the debt on forced banknotes to the bank of issue. This article of the ΓΧΜΒ Law also stated that the date of the suspension of inconvertibility would be determined by a royal decree after the National Bank had been consulted. Needless to say, this part of the loan was never issued and inconvertibility remained by law. Ultimately, the nominal capital of the loan that was floated, the Bonds Loan of 1910 as it is known, did not exceed 110 million gold drachmae.
By the end of 1912, Greece was embroiled in the First Balkan War and policy makers had become complacent over the monetary arrangement in Greece. There was no talk of introducing de jure convertibility which would most probably have entailed the repayment of the government debt in forced circulation to the bank of issue.253 For its part the National Bank, a private institution, enjoyed the benefits of the ΓΧΜΒ Law without the ‘golden fetters’.
The Valaorites Law operated as it was designed to do until 1915 though gold parity of the drachma was maintained until 1919. In 1915 for the first time, the National Bank used book credits to issue banknotes under the ΓΧΜΒ Law, a practice that was repeated again and again during the Great War.
252 K. Kostis, ‘A History of the National Bank of Greece, 1914-1940’, p.88; A.C. Tuncer, ‘Fiscal autonomy,
monetary regime and sovereign risk: foreign borrowing and international financial control in the Ottoman Empire, Greece and Egypt during the classical gold standard era’, 2011, Ph.D.Thesis, LSE, p.151.
253 Valaorites even hinted in one of his reports when he served as the governor of the National Bank that convertibility could be endorsed by law without the government having repaid its debt in forced circulation to the bank of issue. See National Bank of Greece, Annual Report for 1910, p.ιβ΄.

New Researchers - Session I / G
112
II
In March 1910 there were in circulation banknotes from the two issuing banks, the National Bank and the Ionian Bank, as well as those of the forced circulation which were governed by the 1898 Law of Control. (See figure 2.) The Valaorites Law gave the National Bank the right to issue banknotes up to a certain amount specified by a royal decree on condition that these freshly printed banknotes were fully covered by gold and foreign exchange. In September 1910 for the first time, the National Bank was authorized to issue banknotes of up to ten million drachmae. As table A1 in appendix shows, two more agreements between the National Bank and the government followed in short order. By the end of September 1910, nearly 6 per cent of the banknotes in circulation were banknotes that had been issued in response to the Valaorites Law whilst by the end of December of that same year this amount had risen to 17 per cent. (See figures 1 and 2.)
Figure 1: % of banknotes of the ΓΧΜΒ Law in total banknotes in circulation, 1910-14
Source: Own calculations using the Annual Reports of the National Bank, 1910-14.
The National Bank resorted to this right of issue repeatedly prior to the outbreak of the
First World War as the appended table A1 demonstrates. As a result, the banknotes issued following the passage of the Valaorites Law as a percentage of those in circulation, increased considerably. This was even more the case since the National Bank kept banknotes issued out of its own privilege as cash reserves as figure 2 indicates. For example, by the end of 1912 half of the banknotes in circulation were banknotes that had been issued under the ΓΧΜΒ Law. (See figures 1 and 2.) In January 1914, nearly 74 per cent of the value of the banknotes in circulation owed their origin to the Valaorites Law. This was the highest share of banknotes in circulation under the principles of the 1910 Law as a percentage of the total of the money supply prior to the outbreak of the Great War.

New Researchers - Session I / G
113
Figure 2: Categories of banknotes in circulation, 1910-14 Amount of banknotes in circulation of each different category (,000 omitted)
Percentage of each category in the total banknotes in circulation
Source: Own calculations using the Annual Reports of the National Bank, 1910-14.
III
‘From 1885 until [the late 1920s] the Greek monetary system had been based on forced circulation of the paper drachma.254 From 1910 until 1919 the Greek paper drachma was at par with the gold drachma (equal to 0.29034 grams of pure gold), whilst at the same time it continued to be inconvertible by law. The operation of the ΓΧΜΒ Law helped to maintain real parity.’255 Thus begins a document entitled ‘A treatise on the stabilization of the drachma’ possibly written in late 1926. The document goes on to say that since 1885 legal inconvertibility had been maintained, a measure not lifted even during the period from 1910 to 1919 when the drachma remained at par. This in a nutshell, is how the monetary conditions that prevailed in Greece between 1910 and 1919 are described in archival material as well as in literature published before the 1980s.256 254 At the time ‘forced circulation’ was often used as a term meaning ‘inconvertibility’. 255 Emmanuel Tsouderos Archive, Bank of Greece, File 107/3: A treatise on the stabilisation of the drachma
(undated, unsigned), p.1. 256 See Emmanuel Tsouderos Archive, Bank of Greece, File:103/2, p.27; File:104/1, p.1; File:107/3, p.1;

New Researchers - Session I / G
114
Ioannis Valaorites, the father of the ΓΧΜΒ Law, asserted that although the drachma remained by law inconvertible, in practice inconvertibility did not exist since the National Bank provided gold and foreign exchange at par, adding that this was possible because of article eight of this Law .257 He further commented that because of the ΓΧΜΒ Law the suspension of inconvertibility, which might have meant considerable cost for the government, was no longer imperative. Valaorites, however, recognized that with article eight of the ΓΧΜΒ Law in place the country only partially enjoyed the benefits of a system devoid of ‘forced circulation’.258
Before the 1980s the stability of the exchange rate of the drachma between 1910 and 1914 was admired. In addition, the fact that the drachma had remained at par during the Great War is praised. The monetary developments in Greece in 1910 were not thought to be linked either to the gold standard or to the gold exchange standard. A notable dissenter from this view was Xenophon Zolotas who in the late 1920s, the heyday of the gold exchange standard, whilst maintaining that the drachma had remained inconvertible between 1910 and 1919, argued that a new monetary system, that of the gold exchange standard, prevailed in Greece during that period.259 A further reference in the 1920s relating the ΓΧΜΒ Law to the gold exchange standard was made in the report on economic conditions in Greece prepared by the League of Nations in the late spring of 1927 as Greece was about to endorse a stabilization programme under its aegis.260
Writing in the early 1920s Andreades showed great perception when he observed that the fact that the parity of the drachma had been sustained between 1910 and 1919 could lead to the conclusion that inconvertibility had been suspended during that period. He further added that the enactment of the ΓΧΜΑ Law also in 1910, which dealt with coinage, could reinforce this view.261 These observations from the 1920s pre-empted claims in recent economic history literature that focus on monetary changes in Greece in 1910.
At the time certain characteristics defined the gold standard and the gold exchange standard and were prerequisites for a country to adopt either of these monetary systems. The idiosyncratic nature of examples like the monetary arrangement in Greece in 1910 will be lost to history if research does not take them into account. Acknowledging such discrepancies and examining them will increase our understanding of how the international financial system functioned at the time and how certain countries, in this case Greece, were incorporated into that system.
File:107/8; File:107/16; File:127/7, p.2; Financial Times, 14th April 1915, Company Meeting Reports, Ionian Bank; Bank of Greece, The first fifty years of the Bank of Greece, 1978, p.25, for instance.
257 National Bank, Annual report for 1910, pp.θ’- ιβ’; Annual report for 1912, pp.ζ’- η’. 258 National Bank, Annual report for 1910, p.ιβ’. 259 X. Zolotas, ‘Monetary and foreign exchange issues in Greece, 1910-1927, 1928’, p.7, pp.79-80 and, p.180. 260 Emmanuel Tsouderos Archive, Bank of Greece, Documents for the history of the Bank of Greece, League of
Nations Report, Note 3, The National Bank of Greece: I. Introduction, p.9. 261 A. Andreades, Works, Vol. II, 1939, p.526.

New Researchers - Session I / G
115
Appendix
Table A1: Evolution of the ΓΧΜΒ Law, 1910-14
1 2 3 4
1910
14th September 1910 10,000,000 10,000,000 7,500,000 5.86 %
14th October 1910 5,000,000 15,000,000 14,209,000 11.26 %
18th November 1910 10,000,000 25,000,000 14,984,000 11.99 %
1911
1st August 1911 10,000,000 35,000,000 25,000,000 20.13 %
1912
3rd July 1912 20,000,000 55,000,000 35,000,000 27.54 %
21st September 1912 20,000,000 75,000,000 56,500,000 32.37 %
24th October 1912 25,000,000 100,000,000 75,000,000 40.57 %
10th November 1912 25,000,000 125,000,000 90,000,000 40.10 %
1913
6th May 1913 25,000,000 150,000,000 128,234,000 63.16 %
30th September 1913 25,000,000 175,000,000 149,804,000 63.70 %
1914
30th January 1914 25,000,000 200,000,000 168,540,000 73.18 % Notes: 1 The first column of the table above shows the date when a royal decree authorized an increase in the banknotes issued under the ΓΧΜΒ Law. 2 The second column, (headed 1) shows the number of banknotes that could be issued according to the royal decree. 3 The third column, (headed 2) indicates the upper legal limit of banknotes that the National Bank was permitted to circulate under the ΓΧΜΒ Law. 4 The fourth column, (headed 3) shows the number of banknotes issued under the ΓΧΜΒ Law that were in circulation at the end of the month given in the first column. 5 The fifth column (headed 4) shows banknotes issued under the ΓΧΜΒ Law as a percentage of the total of banknotes in circulation. Sources: Historical Archives of the National Bank of Greece, Athens: Α1, Σ18: Monetary Issues, File 34, Documents: No 1, No 2, No 3, No 5, No 6, No 7, No 8, No 9, and, No 13; File 161, Documents: No 3, No 4, and No 5. National Bank of Greece, Annual Report for 1910, pp.ια΄ & η΄; Annual Report for 1911, p.ια΄; Annual Report for 1912, p.ιδ΄; Annual Report for 1913, p.ιε΄; Annual Report for 1914, p.η΄.

New Researchers - Session I / G
116
Sovereign defaults during the Great Depression: new data, new evidence
Andrea Papadia, London School of Economics
([email protected]) Supervisors: Professor Albrecht Ritschl & Dr Olivier Accominotti
The debt crisis of the early 1930s was a key event of the Great Depression and contributed to shaping post-WWII finance. I focus on two aspects of this episode: the maturity structure of countries’ debts and local borrowing by presenting a new dataset for over 20 countries constructed from original sources. While many authors have highlighted the large share of short-term debt in the interwar era, this has not been quantitatively linked to the sovereign defaults. To the best of my knowledge, I am the first to investigate the magnitude and impact of local debt for a wide range of countries. This is surprising given that some local authorities borrowed massively and that, in many cases, defaults began at the local level, then expanding to the national level.
Through the use of the new data and panel data methods, I provide quantitative evidence for the suggestion in the historiography that the unusually high level of short-term debt of the interwar era was decisive in the 1930’s crisis. Contrary to common knowledge, and the assumptions of almost all theoretical models, I furthermore show that, once country characteristics are controlled for, higher debt-to-GDP ratios and higher economy-wide reliance on foreign credit led to a lower, rather than higher, incidence of default. The interwar debt crisis: opportunism or ‘bad luck’?
Recent research has highlighted the macroeconomic relevance of the interwar debt crisis. Ritschl & Sarferaz (2014) provide evidence that the German default aggravated the Great Depression in the US, while Accominotti (2012) shows that it sped up the UK’s exit from gold. Given that most defaults were concentrated in the early 1930s, their compound impact is likely to have had large effects on creditor nations.
The importance of the defaults is not restricted to their impact on the Great Depression. The wariness of free capital mobility created by the financial crisis induced policy makers – in a classic trilemma framework – to forgo the free movement of capital rather than either fixed exchange rates or an independent monetary policy after WWII (Obstfeld & Taylor, 1998). In the USA, the defaults were seen as a failure of banks to manage their conflicts of interest and this was used as a key justification for the 1933 Glass-Steagall Act (Carosso, 1970; Benston, 1990).
The narrative around the time of the debt crisis was that the economic slump revealed the international lending of the 1920s as misguided and excessive, leading to defaults in Latin America and Europe (Harris, 1935; Madden et al., 1937; Lewis, 1938). Indeed, US Congress investigations confirmed the distorted incentives, partial or false information and unorthodox practices of some key actors (Flandreau et al., 2010).
Other research has stressed the ‘bad luck’ element of the defaults. Diaz-Alejandro (1983) and Fishlow (1986) identified the magnitude of the Great Depression shock as the main driver of default. Flandreau et al. (2010) take their finding that distortions in international financial markets were not as pervasive as previously thought as evidence that ‘bad luck’ played the leading role in the defaults. A partial challenge to this view is represented by Eichengreen & Portes (1986) who found that both economic shocks and policy choices mattered: terms of trade deterioration and the foreign debt to export ratio were related to default, but so was the degree of fiscal adjustment following the onset of the Great Depression.

New Researchers - Session I / G
117
New data on public debt
Reinhart & Rogoff (2009) and Abbas et al. (2010) provide historical series on public debt, but these have major shortcomings for the pre-WWII era due to issues of cross-country comparability originating from the different accounting standards used by countries. For the interwar period, they rely on data collected in a United Nations (1948) volume, which is also my starting point. The working version of this paper provides details of the limits of the UN data on a country by country basis. Whenever possible, the comparability of the data was improved by including or excluding certain items, but the overall picture remains imperfect. On the positive side, the different reporting techniques used reflect the perception of the public debt held by statistical offices and, presumably, countries’ authorities. In a study of default decisions, this should be the key variable of interest.
Figure 1: Short term debt as a share of total debt, 1927-36262
Data transcribed from the volume illustrate that default was more common in countries
with larger shares of short-term debt (figure 1). Below, I show that this correlation holds even after controlling for a wide range of economic and political variables.
Figure 2: Average share of central and local debt over total debt, 1927-36263
262 Unweighted average. Defaulters: Bulgaria, Czechoslovakia, Germany, Greece, Poland, Argentina, Bolivia,
Brazil, Colombia, Peru. Non-defaulters: Belgium, Denmark, Finland, United Kingdom, Ireland, Netherlands, Norway, Switzerland, Venezuela, Japan, Canada, New Zealand.
263 Unweighted average. Countries included: Belgium, Bulgaria, Denmark, Finland, Germany, United Kingdom, Ireland, Italy, Netherlands, Norway, Poland, Sweden, Switzerland, Argentina, Brazil, Colombia, Uruguay, Australia, Japan, Canada, New Zealand.

New Researchers - Session I / G
118
Cross-country comparability issues are, however, dwarfed by the failure to consider local public debt. By using a variety of original sources detailed in the working version of this paper, I show that sub-sovereign debt constituted around 25 per cent of total public debt on average (figure 2). Its exclusion thus leads to a severe underreporting of public debt levels.264
My local debt estimates also reveal that the comparative debt burden picture is distorted by the omission of local debt due to vast cross-country heterogeneity (figure 3). Countries with federal structures – such as Brazil and Germany – borrowed massively at the local level. In more centralized and less sizeable countries – like Belgium and Bulgaria – local borrowing was almost insignificant. Given that all public debt, whether national or local, is serviced through resources generated by the country's economy, both the underreporting and the bias in relative debt burdens are problems for any study investigating sovereign defaults.
In the econometric analysis, I also rely on data collected by other researchers, as well as additional newly transcribed data. The working paper version documents the sources and discusses data reliability in detail.
Figure 3: Average share of local debt over total debt, 1927-36
Empirical strategy
I study the determinants of default size – defined as the share of the principal of public-sector foreign Dollar bonds in default – by regressing it on a series of control variables. I treat Dollar bonds separately from others given that distinct bondholders categories were often treated differently (Eichengreen & Portes, 1988).265
I employ panel data techniques to account for unobserved time-invarying cross-country heterogeneity (e.g. creditworthiness, institutional quality, default history), which is likely to have been a key driver of defaults (Reinhart et al., 2003). By relying on the time-series variation of variables rather than their cross-sectional levels, panel data methods also minimize the impact of the cross-country comparability issues of the data discussed above.
To account for endogeneity, I control for state-dependence (i.e. default status) and employ internal instruments for the lagged explanatory variables, represented by further lags of the explanatory variables themselves. I run the dynamic Arellano-Bond (1991) generalized method of moments (GMM) estimator and carry out standard tests (Sargan and Arellano-
264 The principal sources for the local debt data are the Yearbooks of the German Statistical Office (Statistiches
Reichsamt, 1936-39/40). For certain countries, these are integrated by publications of the Institute for International Finance, the Corporation of Foreign Bondholders and, most importantly, Moody's (1933-37), which are also used to estimate default size.
265 Data collection on sterling bond defaults is currently under way and these will be included in the analysis as soon as possible.

New Researchers - Session I / G
119
Bond), which confirm its validity. The model includes country fixed-effects, time fixed-effects and a vector of controls :
[1] I test three sets of channels. The first relates the severity of the economic slump to the
incidence of default. The second investigates the influence of economic and political characteristics of countries (e.g. trade openness, financial fragility, reliance on borrowing). The third, examines whether the fiscal and monetary policies enacted had any effect on the default outcome.
Findings
Column 1 in table 1 contains the baseline specification, column two adds economy-wide (public and private) US-originating debt over GDP, column 3 controls for default expectations by including bond yields and column four breaks down public debt into central and local.
Table 1: Arellano-Bond GMM estimation of the determinants of default size, 1927-36 default size 1 2 3 4 L.defaultsize 0.692*** 0.668*** 0.663*** 0.628*** (0.0756) (0.0800) (0.0826) (0.0837) L.total public debt/GDP -0.177*** -0.235*** -0.135** (0.0676) (0.0680) (0.0684) L.short term debt/total debt 0.318*** 0.435*** 0.404** 0.364** (0.106) (0.101) (0.158) (0.158) L.trade/trade 1929 0.0182*** 0.0176*** -0.000738 0.0159* (0.00601) (0.00674) (0.00599) (0.00861) L.total US debt/GDP -0.863*** (0.259) L.bond yield -0.0216 (0.0153) L.central gov debt/GDP -0.255 (0.173) L.local gov debt/GDP 0.200 (0.378) Constant -0.235 2.015 4.660 0.0471 (3.495) (3.518) (3.859) (4.103) Observations 169 145 129 148 Number of countries 23 20 20 21 Robust standard errors in parentheses. Time fixed-effects included in all specifications. L.=lagged. Insignificant controls not shown in the table: L.on gold, L.polity score, L.trade/GDP, L.GDP percapita, L.foreign debt/total debt, L.%change in deficit w/r 1929, L.%change in reserve ratio, L.banking crisis, L.GDP change over 1929. *** p<0.01, ** p<0.05, * p<0.1
Columns one to three indicate that the total public debt-to-GDP ratio is negatively
associated with default size, while the result disappears in column four where central and local public debt are entered separately in the equation. This surprising result might be attributed to reverse causality: more creditworthy countries were able to borrow more, leading to a negative correlation between the debt-to-GDP ratio and default size. By controlling for country fixed-effects, however, I rule out this possibility, at least if creditworthiness is time-invarying (or slow moving). An alternative and more plausible explanation is that countries with higher debt-to-GDP ratios were those whose public sector relied more on borrowing. Countries with higher debt burdens would benefit more from default, but would also be more adversely affected by being excluded from financial markets. Column two adds a further layer
New Researchers - Session I / G
120
to this interpretation: the economy-wide dependence on US-originating credit also led to a lower incidence of default, giving further support to the idea that credit dependence discouraged countries from damaging their access to financial markets through default.
I also find that the share of short-term debt is positively related to default. This result fits well with economic intuition and the Great Depression context. Difficulties in rolling over short-term debts are considered a key driver of default (Erce, 2012). Liquidity dried up on international financial markets in 1930 after the 1924-28 surge, piling up pressure on debtor countries, which had borrowed short-term on a large scale (Feinstein & Watson 1995). Indeed, the first item to be tackled in the German debt crisis was the short-term debt, which was suspended through the 1931 Standstill Agreement (James, 1986; Ritschl, 2013). South American countries – the other big defaulters of the interwar era – also relied heavily on short-term debt (Jorgensen & Sachs 1988).
A result that might be difficult to reconcile with economic intuition is the fact that, in columns one and two, countries that saw a smaller deterioration in their trade compared to 1929 were more likely to default. The result, however, is not robust and disappears with the inclusion of further controls in columns three and four. Finally, I show that, contrary to previous findings (Eichengreen & Portes, 1986) and consistently with Eichengreen's (1992) later argument that policy responses to the Great Depression were either misguided – in core countries – or extremely limited – in the periphery, neither monetary nor fiscal policy played a role in the defaults.
Robustness
The results presented above are robust to different measures of economic contraction, trade deterioration and the inclusion of higher order polynomials of the debt-to-GDP ratio to account for nonlinearities. In the working version of the paper, I also present the results of cross-sectional estimations similar to those used by Eichengreen & Portes (1986), as well as the Blundell-Bond (1995) GMM estimator and the dynamic Tobit random-effects model suggested by Wooldridge (2005). These models rely on additional assumptions, which are not likely to be satisfied in this application and should be taken with caution. In any case, each of the main results of the Arellano-Bond estimation is confirmed by at least one of the two models. Conclusion
The new data presented not only provides a more historically accurate picture of public debt burdens in the interwar era, but also turn out be a decisive element in explaining the defaults. The differences between the results of this paper and those of previous work are stark. However, as Eichengreen & Portes (1986), I show that mono-causal interpretations of the 1930’s debt crisis, which assign the key role to either `bad luck` or opportunism should be ruled-out. The interwar debt crisis was a complex event in which exogenous shocks and discretionary choices both mattered. References
Abbas, A. S. M., N. Belhocine, A. A. El Ganainy, and M. A. Horton (2010): ‘A Historical Public Debt Database’, IMF Working Paper, 10-245.
Accominotti, O. (2012): ‘London Merchant Banks, the Central European Panic, and the Sterling Crisis of 1931’, Journal of Economic History, 72(1), 1-43.
Arellano, M., and S. Bond (1991): ‘Some Tests of Specification for Panel Data: Monte Carlo Evidence and an Application to Employment Equations’, Review of Economic Studies, 58(2), 277-97.
Benston, G. J. (1990): The Separation of Commercial and Investment Banking: The Glass-Steagall Act Revisited and Reconsidered - a retrospective of the Pecora Commission's conclusions. Oxford University Press.

New Researchers - Session I / G
121
Blundell, R., and S. Bond (1995): ‘Initial Conditions and Moment Restrictions in Dynamic Panel Data Models’, Journal of Econometrics, 87(1), 115-43.
Carosso, V. (1970): Investment Banking in America. Harvard University Press. Diaz-Alejandro, C. (1983): ‘Stories of the 1930s for the 1980s’, in Financial Policies and the
World Capital Market, Pedro Aspe Armella, Rudiger Dornbusch, and Maurice Obstfeld (eds). University of Chicago Press.
Eichengreen, B. (1992): Golden Fetters: The Gold Standard and the Great Depression, 1919-1939. Oxford University Press.
Eichengreen, B., and R. Portes (1986): ‘Debt and Default in the 1930s: Causes and Consequences’, European Economic Review, 30(3), 599-640.
(1988): ‘Foreign Lending in the Interwar Years: the Bondholders' Perspective’, University of California Berkeley, Department of Economics Working Paper, 8886.
Erce, A. (2012): ‘Selective Sovereign Defaults’, Federal Reserve of Dallas Working Paper, 127.
Feinstein, C. H., and K. Watson (1995): ‘Private International Capital Flows in Europe in the Interwar Period’, in Banking, Currency, and Finance in Europe between the Wars, Charles H. Feinstein (ed). Oxford University Press.
Fishlow, A. (1986): ‘Lessons from the Past: Capital markets during the 19th Century and the Interwar Period’, in The Politics of International Debt, Miles Kahler (ed). Cornell University Press.
Flandreau, M., N. Gaillard, and U. Panizza (2010): ‘Conflicts of Interest, Reputation, and the Interwar Debt Crisis: Banksters or Bad Luck’, CEPR Discussion Paper, 7705.
Harris, C. R. S. (1935): Germany's Foreign Indebtedness. Oxford University Press. James, H. (1986): The German Slump: Politics and Economics. Clarendon Press. Jorgensen, E., and J. Sachs (1988): ‘Default and Renegotiation of Latin American Foreign
Bonds in the Interwar Period’, NBER Working Papers, 2636. Lewis, C. (1938): America's Stake in International Investments. The Brookings Institution. Madden, J. T., M. Nadler, and H. C. Sullivan (1937): America's Experience as a Creditor
Nation. Prentice-Hall. Moody's (1931-37): Investment Manual: Government and Foreign. Moody’s Investors
Service. Obstfeld, M., and A. M. Taylor (1998): ‘The Great Depression as a Watershed: International Capital Mobility over the Long Run’, in The Defining Moment: The Great Depression and the
American Economy in the Twentieth Century, Micheal D. Bordo, Claudia Goldin and Eugene N. White (eds). University of Chicago Press.
Reinhart, C. M., and K. S. Rogoff (2009): This Time is Different: Eight Centuries of Financial Folly. Princeton University Press.
Reinhart, C. M., K. S. Rogoff, and M. A. Savastano (2003): ‘Debt Intolerance’, Brookings Papers on Economic Activity, 1, 1-74.
Ritschl, A. (2013): ‘Reparations, Deficits, and Debt Default: the Great Depression in Germany’, in The Great Depression of the 1930s, Nicholas Crafts and Peter Fearon (eds). Oxford University Press.
Ritschl, A., and S. Sarferaz (2014): ‘Currency vs. Banking in the Financial Crisis of 1931’, International Economic Review, 55(2), 349-73.
Statistisches Reichsamt (1936-39/40): Statistisches Jahrbuch für das Deutsche Reich. Puttkammer & Mühlbrecht.
United Nations (1948): Public Debt 1914-1946. Lake Success, New York. Wooldridge, J. M. (2005): ‘Simple Solutions to the Initial Conditions Problem in Dynamic,
Nonlinear Panel Data Models with Unobserved Heterogeneity’, Journal of Applied Econometrics, 20(1), 39-54.

New Researchers - Session I / G
122
Evasion and progressivity in the Spanish income tax, 1970-2001
Sara Torregrosa-Hetland, University of Barcelona
([email protected]) Supervisors: Professors Alfonso Herranz-Loncán and Alejandro Esteller-Moré
Several studies have attempted to estimate the level of tax evasion in different countries, but analyses of its distribution and impact on progressivity are rare. This paper intends to fill part of this gap. I estimate under-assessment of incomes in the personal income tax during the years following its introduction in Spain, under the hypothesis that it was more acute among high income individuals. Incentives and abilities to evade differed across income sources and levels, ultimately meaning that the progressivity of the tax would have been negatively affected (and upward-biased when estimated from reported data).
Tax evasion has for a long time been a relevant issue in the country. During the seventies, several studies had been revealing high levels of fraud in the Spanish tax system in general, and in the precedents of the modern personal income tax in particular. Recent contributions still showed significant evasion (Esteller, 2011). Today, the country usually scores high in studies about the shadow economy in the developed world: in 2009, the value for Spain would be around 20 per cent of GDP, ranking third in a 21-country OECD sample, only after Greece and Italy (Schneider, 2009).
Transition to democracy brought about a comprehensive reform in public finances, the introduction of the modern personal income tax being one of its cornerstones (1979). However, resistances were hard, and the evasion problem seems not to have been adequately solved. A high percentage of individuals neglected filing a return, and those who did reported incomes well below their real value on average. The Spanish economist, Fuentes Quintana, a central promoter of the reforms, was very critical in arguing that persistent evasion made PIT unfair and inefficient. It was not until the second half of the eighties that governments started to seem more determined to fight fraud through administrative and legal developments. Were they successful?
Tax evasion reduces public revenues and causes horizontal inequity, potentially eroding the legitimacy of the system. It can also affect vertical equity in a very significant manner; this last issue is the focus here. Higher income individuals evading more was the result in the deterrence model literature (Allingham & Sandmo, 1972, and subsequent related works). The same insight also arises from the differences across income sources, given the existence of withholding at source and third-party reporting in some of them (Kleven et al., 2011): historically, wages and salaries have been better controlled, as opposed to self-employment and capital incomes.
The ideal data to study the distribution of fraud would be audited tax returns, which have been used in the US, normally finding the rate of under-reporting to increase with income (e.g. Johns & Slemrod, 2010). These are, however, not easily available in most countries. Alternative procedures have therefore been developed.
I combine two different methods, using data from tax returns, national accounts and household budget surveys (HBSs). The first estimation is a discrepancy analysis, both in macro and micro terms, following Fiorio and d’Amuri (2005) and Matsaganis et al. (2010). The second alternative uses a ‘propensity to consume’ approach with tax return data, as was first suggested by Feldman & Slemrod (2007). I introduce a methodological innovation appropriate for a non-US context: because the estimation is based on the relationship between reported incomes and deducted donations, the regression is performed using a restricted sample (those who itemized donations in a given year). Therefore, the results of a baseline estimation may be biased where this behaviour is not widely extended, and a two-step

New Researchers - Session I / G
123
procedure ‘à la Heckman’ might provide better results. This is the first time such an approach is taken in the tax evasion literature.
Concealing of income for tax purposes arises in at least three distinct ways, all considered in the paper: non-filing, legal under-valuation and under-reporting by taxpayers. Non-filing was very extensive in Spain during these years, but since there is practically no information on these individuals, their incomes are only obtained as a residual after accounting for the under-assessment of incomes by those who did file a return. Regarding filers, I will deal jointly with (legal) under-valuation and (illegal) under-reporting, since they are for the most not possible to disentangle in the data. In that sense, the estimates are not fully coincidental with a legal definition of fraud, but with the extent to which incomes escape from taxation in different ways (the degree of non-generality of the income tax). The issue of legal under-valuation arises notably for imputed incomes of owner-occupied housing (based on the cadastral value of the dwellings, well under market values for the period) and for self-employment activities under a certain threshold, which have the option to be assessed ‘objectively’ instead of following individual accounting.
The first discrepancy approach, shown in figure 1, compares reported incomes with the magnitudes from national accounts (obtaining the joint effect of non-filing and under-reporting). The ratios were very low in 1971, corresponding to the old tax, and higher for the following analysed years. Evasion discrepancy amounted to only 22-25 per cent in wages, but was up to around 70 per cent in other yields, with the most significant improvement in the behaviour of self-employment incomes.
Figure 1: Compliance ratios by income source
Sources: author’s calculations with tax data from Dirección General de Tributos (1980) and IEF; and HBSs and national accounts from INE.
Capital incomes display the most deceiving results, but these are considerably driven
by the previously mentioned legal under-valuation of imputed incomes from housing (see the disaggregation in 1990). In that sense, their evolution is in part due to a composition effect.
In what follows, I focus on filers, and compare the distribution of incomes reported to the tax administration to that in the surveys, taken as more accurate (under the assumption that in these, given their anonymity, there is no fraud incentive to conceal income). The exercise poses several challenges: first, income data in HBSs are known to be also widely under-assessed, therefore, a previous adjustment to the magnitudes in the national accounts is required (Torregrosa, 2013). On the other hand, data in them are given in net terms, so gross revenues can only be obtained after imputation of the tax paid (Torregrosa, in press). Finally, we need to approximate effective filers from the total obligated population in the survey. To do this, the HBSs have been re-weighted by region and main source of income.

New Researchers - Session I / G
124
There are two possible ways to proceed. Fiorio & d’Amuri (2005) directly calculate means by income decile in both datasets and obtain the ratios accordingly. This procedure could be flawed in the presence of significant re-ranking (taxpayers getting ordered differently because of their reporting behaviour, to the extent of changing quantile). Matsaganis et al. (2010) therefore propose calculating averages by income source and region, and obtaining ratios by income level after simulating ‘real’ incomes in the tax database with the resulting scaling-up factors. This avoids the re-ranking problem, but assumes that differences in compliance across income levels are only due to composition.
Figures 2 and 3 show the results of both methods: very similar for the total tax base and wages (with near full compliance in these); while for capital and self-employment differences are significant (lacking an estimate of the extent of re-ranking, we can consider that reality lies somewhere in the middle). The graphs suggest that the higher evasion found among top income taxpayers was predominantly an effect of the changing composition of total incomes (the same presumably explains the flat or positive slope found for capital incomes: again, fixed versus mobile assets). There is a slight improvement between both years, and the reporting behaviour seems more homogeneous across income levels in 1990. In any case, even though equity would also be deteriorated if the lowest deciles under-reported the most, the fact that it is the top that specially escaped taxation could make fraud more worrisome. The leaking of around a third of the incomes at the upper level was a vast obstacle for the revenue capacity of this tax – and the fiscal system in general.
Figure 2: Estimated compliance ratios à la Fiorio & d’Amuri
Figure 3: Estimated compliance ratios à la Matsaganis et al.

New Researchers - Session I / G
125
The econometric exercise to which I now turn allows obtaining an independent estimate for the ratios of under-reporting by income source. I follow Feldman and Slemrod (2007) and Domínguez et al. (2013) in regressing the charitable donations made by the taxpayers on several control variables and the composition of their income, with the basic assumption that composition should have no effect on giving inclinations. Taking labour as the base category (other rates are calculated in relation to it), we can estimate the following relationship:
lnDONATIONSi = + ln(Li + k2MCi + k3FCi + k4SEi + k5Ni + k6Oi) + βXi + δλi + ui [1]
where Xi is a vector of taxpayer characteristics including age, marital status, number of dependants, region of residence, and others. L stands for labour income, while MC represents income from moveable capital, FC income from fixed capital, SE from self-employment, N negative incomes of all kinds and O other incomes (mostly irregular ones). The coefficients of interest are the k, 1/k being the compliance rate for each component.
The variable λi was not included in previous estimations of this kind, generally applied to US data, where giving-deducting behaviour has traditionally been quite extended. In the Spanish context, however, an equation without it could be affected by sample selection bias. I therefore apply a two-stage Heckman estimation, where λi is the inverse mills ratio obtained from a Probit explaining the ‘donating or not’ behaviour, run over all observations. The exclusion restrictions applied are city size and regional dummies.
I implement this methodology on the data for 1982 and 2001. Coefficients are not shown here for space reasons, but they are generally not at odds with other studies of charitable donations. The significance of λi in the two-step estimation shows that there is indeed a sample selection problem, causing the one-step results to be biased. In table 1, I display the estimated compliance ratios.
Taking labour as fully compliant, all other yields would only be reported at near 50 per cent of their real value in 1982. Nineteen years later, compliance had gone up only slightly in moveable capital incomes, while improving specially for fixed capital and self-employment activities. In the case of fixed capital, the increase can be attributed to regulatory changes such as the removal of the first home from the legal tax base in 1998, and the introduction of a retention mechanism for rental incomes in the same year.
Table 1: Compliance ratios à la Feldman-Slemrod 1982 2001 1-step 2-step 1-step 2-step
Moveable capital 14% 44%*** 56%*** 38%*** Fixed capital 13% 41%** 74%* 56%*
Self-employment 14%* 46%*** - - SE Direct - - 85%** 72%*
SE Objective - - 95% 85% SE Agrarian - - 83% 78%
Source: author’s calculations with the coefficients from equation 1. Self-employment activities are separated in 2001 according to the valuation procedure. *** Different from 1 at p<0.01, ** p<0.05, * p<0.1.
These results have to be compared to those of Domínguez et al. (2013), whose work is
closely replicated in the 1-step procedure. They calculated for 2008 a rate of compliance of 60 per cent for moveable capital, 70 per cent for fixed capital, and 65-78 per cent for self-employment activities under direct and objective assessment respectively. These levels are near the ones I get for 2001, so a lot of the improvement would have taken place in the last

New Researchers - Session I / G
126
decades of the twentieth century. Under-reporting seems to have undergone a significant reduction, especially in the case of self-employment, but it has not yet been eradicated.
Figure 4 places the Spanish experience in an international perspective. My estimates of total tax base under-reporting are higher than many other available, which generally correspond to more developed countries or later periods, but our case appears quite close to the US in the beginning of the eighties, or Italy and Chile in the nineties. Evasion rates for self-employment incomes (among filers) are always higher, and more homogeneous. This suggests that a significant part of the difference between countries could be due to the business structure, via the percentage of incomes that are monitored through withholding and third-party reporting.
It is easy to see that the distributional pattern of under-reporting should have an impact on the progressivity of the tax. A back-of-the-envelope calculation allows us to estimate it, assigning to each individual the k obtained for each income source (i.e., attributing to all recipients of each kind of income the average behaviour). The implications can be seen in table 2: fraud made the tax less progressive than it was on paper, around one-third for the redistribution and progressivity indices in 1982, and 20 and 10 per cent respectively in 2001. This can be thought of as a lower bound, given that the discrepancy analysis pointed towards rates of under-reporting increasing with income within income source for some cases.
Figure 4: A comparison of personal income tax evasion estimates
Source: several authors (see full paper). The data for Denmark in the ‘self-employment’ graph refer to all self-reported income, as opposed to that subject to third-party reporting.
Table 2: Impact of under-reporting on progressivity estimations
1982 2001 Original Corrected Diff. Original Corrected Diff. Pre-tax Gini 0.3296 0.3653 11% 0.3747 0.3939 5% Post-tax Gini 0.3035 0.3515 16% 0.3254 0.3552 9% Average tax rate 0.1169 0.0967 -17% 0.1537 0.1372 -11% Reynolds-Smolensky 0.0261 0.0138 -47% 0.0494 0.0387 -22% Kakwani 0.2029 0.1367 -33% 0.2777 0.2502 -10% Av. tax rate top 10% 15.89 11.84 -25% 29.30 23.64 -19% Av. tax rate top 1% 23.04 13.03 -43% 31.04 23.71 -24% Source: author’s calculations. The ‘corrected’ scenario shows the behaviour of the tax if evasion was distributed as hypothesized, while the ‘original’ is the estimate readily obtained from the data (affected by under-reporting). Reynolds-Smolensky is a redistribution index (difference between the Ginis of pre-tax and post-tax incomes) and Kakwani is a progressivity indicator (difference between pre-tax Gini and concentration of tax payments).

New Researchers - Session I / G
127
Undermined progressivity of PIT, which was – and is – the only real progressive tax
with some weight in the system, calls into question the image of the ensemble of taxation and the joint tax-and-transfer scheme. Evasion has proven pervasive in the country, and as a consequence the principle that all citizens should contribute to public finances according to their economic capacities was not followed throughout the twentieth century. The introduction of the personal income tax was deeply flawed because of lack of administrative capacity or political will to enforce compliance.
The good news, however, is that efforts to reduce evasion have slowly reaped some rewards, specially with regards to self-employment incomes. A lot is left to be done, but at least we know where the big tax gaps are. References
Allingham, M.G. and Sandmo, A. (1972): ‘Income tax evasion: a theoretical analysis’, Journal of Public Economics, 1, 323-338.
Domínguez, F., López-Laborda, J., and Rodrigo, F. (2013): ‘El hueco que deja el diablo: Una estimación del fraude en el IRPF con microdatos tributarios’, WP FUNCAS 728.
Esteller, A. (2011): ‘Is the tax administration just a money machine? Empirical evidence on redistributive politics’, Economics of Governance, 12, 275-299.
Feldman, N.E. and Slemrod, J. (2007): ‘Estimating tax noncompliance with evidence from unaudited tax returns’, The Economic Journal, 117, 327-352.
Fiorio, C.V. and d’Amuri, F. (2005): ‘Workers’ tax evasion in Italy’, Giornale degli Economisti e Annali di Economia, 64 (2/3), 241-264.
Johns, A. and Slemrod, J. (2010): ‘The distribution of income tax noncompliance’, National Tax Journal, 63, 397-418.
Kleven, H.J., Knudsen, M.B., Kreiner, C.Th., Pedersen, S., and Saez, E. (2011): ‘Unwilling or unable to cheat? Evidence from a tax audit experiment in Denmark’, Econometrica, 79(3), 651-692.
Matsaganis, M., Benedek, D., Flevotomou, M., Orsolya, L., Mantovani, D., and Nienadowska, S. (2010): ‘Distributional implications of income tax evasion in Greece, Hungary and Italy’, MPRA Paper 21465.
Schneider, F. (2009): ‘The size of the shadow economy in 21 OECD countries (in % of ‘official’ GDP) using the MIMIC and currency demand approach: from 1989/90 to 2009’, University of Linz.
Torregrosa, S. (2013): ‘Sticky income inequality in the Spanish transition (1973-1990)’, University of Barcelona.
Torregrosa, S. (in press): ‘Did democracy bring redistribution? Insights from the Spanish tax system (1960-1990)’, European Review of Economic History, forthcoming.

New Researchers - Session II / A
128
The question of mints and manufactures in British America, 1670-1730
Mara Caden, Yale University
([email protected]) Supervisor: Professor Steven Pincus
It was the turn of the eighteenth century when John Tysack, a London merchant and engineer, presented a proposal to the Board of Trade for mints in the American colonies. The proposal, on behalf of ‘proprietors and inhabitants’ of the Carolinas, the Bahamas, Pennsylvania, East and West New Jersey, New York, and New England, described the dearth of good money that the inhabitants of these colonies had at their disposal. These plantations lacked the staple commodities, like tobacco, that other colonies could use in return for English imports. The only money that circulated in their countries was Spanish money: pieces of eight, coins, and bullion, which had no set value and which had too large of denominations to be useful for most everyday transactions. The Spanish silver made a hopeless and confusing mode of payment for local and overseas goods. Mints in the colonies, these inhabitants proposed, could be used to coin the abundant Spanish silver into English money, and to make small and convenient change out of less valuable metals. These American mints would increase the colonies’ consumption of English goods, stimulate industries in the colonies, make trade more convenient and predictable.266 But the mints in the American dominions were not to be.267
Why did this proposal fail? Indeed, why did every attempt to set up a colonial mint fail? In this paper I will argue that the officers of the Mint routinely obstructed the foundation of colonial mints in order to enforce a currency standard that they deemed essential to the economic and military security of the kingdom. The coins that the proposed mints outside of England would produce tended to be lighter in weight, or debased, compared with England’s own silver money, which was a way to ensure that those currencies stayed in the places where they were produced. When the Mint officers gave their opinions on colonial mints, they repeatedly referred back to a proposal to open a mint in Ireland in 1662, and their opposition to that project, where they wrote that preserving the standard of the coins was vital to the security of the king, and that altering the standards in one kingdom or dominion would do damage to all the rest. The officers of the Mint sought not only to preserve a standard product, but also to standardize the process of making money. During the Great Recoinage of the 1696-9, when new mints opened in five English provincial towns, the officers of the Mint struggled to impose these production standards. Across seas and oceans, managing monetary production to their standard was unimaginable.
This paper reframes our understanding of colonial underdevelopment in Britain’s empire. The standard story of the eighteenth century British Empire in the Atlantic tells us that a mercantilist Britain subordinated the interests of its colonies to those of the metropole and adhered to a maxim of manufacture at home and raw material production in the colonies. However, this story is troubled by the diversity of opinions in Britain and across the Atlantic over the proper role of the colonies, and by the many people on both sides of the Atlantic who sought to promote colonial manufacturing. But rather than a consistent programme of mercantilism, the monetary scene marked off parts of the empire as dependent peripheries and restricted industrial development to the metropole. The denial of mints to Ireland and the American colonies doomed these parts of the empire to chronic coin shortages and hindered manufacturing and internal trade there.
266 Memorial relating to the state of the Coin in the Plantations, Presented to the Board by Mr. John Tysack, 5
July 1700, The National Archives, CO 3/323 f. 204. 267 Journals of the Board of Trade, 5 July 1700, TNA CO 391/13, pp.96, 110-1.

New Researchers - Session II / A
129
The death of John Tysack’s proposal for mints across Britain’s colonies in 1700 was not the first time that the administrators of the English state had denied mints to the kingdoms and dominions overseas. Coin shortages plagued Britain in the seventeenth and eighteenth centuries, and money was nowhere as scarce as in its overseas colonies. Colonial economies routinely imported more than they exported, so any coin that circulated in Caribbean and North American colonies quickly flowed out to pay for goods shipped from Britain. Colonial governors, assemblies, and courts sought to erect mints as a solution to this shortage of coin. In 1652, during the Interregnum, the Massachusetts General Court set up a mint in Boston, where they coined silver money for the next thirty years.268 In 1668, the Barbados Assembly sent an address to Charles II, asking for permission to open a mint, which they proposed as a solution to their problems of planters’ unpaid debts to the Royal African Company and other merchants.269 In 1670, the Jamaica governor Thomas Modyford made a series of proposals for the speedy settling of Jamaica to Henry Bennett, Secretary of State for the Southern Department, including the declaration that Jamaica should have a mint to coin its own money.270 Seven years later, the then-governor of Jamaica, the Earl of Carlisle, repeated the argument to the Committee for Trade and Plantations.271 In 1686, the governor of the Dominion of New England Edmund Andros made the case to the Treasury commissioners and the Council of Trade that they ought to continue or re-establish the Massachusetts mint, and in 1691, after the Glorious Revolution, Massachusetts governor Sir William Phips again proposed the re-opening of the Boston mint to the Privy Council.272 In 1700, the governor of New York the Earl of Bellomont sent a series of William Penn’s recommendations to the Board of Trade, including the proposal for a mint in New York to support trade and business in the colonies.273
But despite the revolutions and political transformations that Britain experienced through the seventeenth century and into the eighteenth, the answer remained the same. Courts and councils referred the proposals, again and again, to the officers of the Mint – politicians, administrators, and philosophers, such as Thomas Neale, Henry Slingsby, and Isaac Newton – and the officers of the Mint warned everybody of government that consulted them not to allow mints overseas. Even when the king and the Council of Trade were convinced of the wisdom of a colonial mint, the officers of the Mint dissuaded them. Indeed, in 1678, Jamaica came close to receiving a mint when Charles II granted the Earl of Carlisle’s request and gave him the authority to establish a mint in Jamaica to make gold and silver coins and set whatever value on those coins as he thought best suited the interests of the island. But when the Council of Trade sought the opinion of the officers of the Mint, Henry Slingsby, Master of the Mint, sent a cautionary opinion back to them, warning that a Jamaican mint would be ‘of a high and dangerous consequence to … his Majesty’s kingdom, as well as to all the rest of his dominions’.
The Mint master’s biggest objection to the Jamaican mint was its ability to alter the standard of the money it produced. The royal order from Charles II had left it completely up to the governor and the Jamaica Assembly to determine the weight of the Jamaican coins, the value ascribed to them, and the fineness, or purity, of the silver they produced. Slingsby used the same language that the Mint Officers had used in 1662 when they opposed the Irish mint: ‘the preserving of one certain standard in weight and fineness’, he wrote, ‘of your Majesty’s gold and silver coins, in all your Majesty’s kingdoms and dominions, is very much for the 268 Copies of the Orders for the Mint at Boston, TNA CO 1/60 ff. 264-5. 269 Journal of the Barbados Assembly, 17 Nov. 1670, TNA CO 31/2, pp.6-14. 270 Thomas Modyford, Propositions for the speedy settling of Jamaica, 20 Sep. 1670, TNA CO 1/25 ff. 147-53. 271 Memorial of the Earl of Carlisle to the Lords of Trade and Plantations, received 10 Nov. 1677, TNA CO 1/41
f. 236. 272 Reasons for a Mint in New England, read 13 Oct. 1686, TNA CO 1/60 f. 266; Officers of the Mint, Report
Concerning the Erecting a Mint in New England, 19 June 1691, Mint 12/6 ff. 3-4. 273 Governor the Earl of Bellomont to the Board of Trade, 17 Oct. 1700, TNA CO 5/1045.
New Researchers - Session II / A
130
security and advantage of your Majesty … [T]he altering and debasing of the said standards … cannot be practised or allowed in any one of your Majesty’s kingdoms without eminent prejudice to all the rest, or without entrenching upon the honor, justice, and interest of your Majesty’. Noting the wisdom and pertinence of this earlier decision, Slingsby wrote to the Council of Trade, ‘By this your Lordships may see how dangerous and dishonorable a thing it was then esteemed to permit the standards of his Majesty’s gold and silver moneys to be altered or debased in denomination or value’.274
Slingsby expressed unequivocal opposition to any proposal that would debase English currency in the colonies, and he used the Mint officers’ 1662 decision on the Irish mint to make his case. He did, however, leave open the possibility of a mint in Jamaica. Describing the type of Jamaican mint he would support, Slingsby wrote that if the governor the Earl of Carlisle could raise enough money to provide ‘all necessary houses, offices, and buildings for a mint, and for the making and setting up of all tools and engines for coining, … [and] for the salaries of the useful officers and for repairs of the houses, offices, and buildings of the said mint’, so that a Jamaican mint would replicate the entire hierarchy and production process of the London mint, using the same machinery, allocating tasks to the corresponding officers, and producing money of exactly the same standard as in England, that he would provide his guidance in helping to set it up ‘according to the standards, rules, and orders of His Majesty’s Mint in England’.275 Short of an almost exact replica of the London mint, a Jamaican mint posed too great a threat to the currency of England.
This was enough to give pause to the Council of Trade. The councilors laid that original 1662 opinion on the Irish mint before the king. Charles II was persuaded not to allow Carlisle to alter the standards of the currency in the Jamaican mint after all, and he charged the Council of Trade with passing the bad news on to him.276
Carlisle, Governor of Jamaica, could not accept this compromise. If Jamaica were to produce money the way the officers of the Mint suggested they should, all the money they produced would swiftly flow off the island, negating the whole purpose of the proposed mint. ‘Should our coin be of the same standard in weight and fineness to the King’s coin in England’, Carlisle wrote to the Council of Trade, ‘we should never keep any money in the island, which is our present distress’.277 New England, he noted, had found a solution to this problem: the silver money they coined in Boston was of a lighter weight than English money, but it still passed at a higher value than its weight suggested, ‘which’, Carlisle noted, ‘fills them full of money’.278 Jamaica’s governor wanted only the same privilege that New England enjoyed: the privilege of making money at a lighter weight so that it would be deemed less valuable outside that jurisdiction, to ensure that it kept circulating within the colony. There was no compromise that could suit all parties, and the Jamaica mint never became a reality.
New England’s own practice of coining light money came under sharp scrutiny several years later. When James II vacated the original charters of New England colonies and established the unified Dominion of New England in 1686, Massachusetts lost the ability to coin their own money, which they had been doing since 1652. The Lords of the Treasury and the Council of Trade debated a proposal they had received to continue or re-establish the mint in New England, and sent it to the officers of the Mint for their opinion. The officers of the Mint – Thomas Neale, Charles Duncombe, and James Hoare, and Phillip Lloyd – scrutinized copies of the Massachusetts General Court orders that established the Boston mint and regulated the production and circulation of Massachusetts coins between 1652 and 1669. The Mint officers also examined the Massachusetts coins themselves. They found that although
274 Henry Slingsby, Report on a Mint in Jamaica, 7 Feb. 1679, TNA CO 1/43 f. 24r. 275 Henry Slingsby, Report on a Mint in Jamaica, 7 Feb. 1679, TNA CO 1/43 f. 24v. 276 TNA CO 138/2 p.257-60. 277 The Earl of Carlisle to the Council of Trade, 20 June 1679, TNA CO 1/43 f. 136. 278 Ibid.

New Researchers - Session II / A
131
the silver in the coins was of standard fineness, the coins themselves were indeed lighter than English coins – a Massachusetts shilling, they found, was about 21 grains lighter than an English shilling.279
Just as Slingsby had done, the Mint officers reminded the Treasury and Trade commissioners of the report on the Irish mint of 1662, and quoted that familiar maxim once again: ‘The preserving of one certain standard for weight and fineness of his Majesty’s silver coins in all his Majesty’s kingdoms and dominions is very much for the security and advantage of his Majesty. And the altering thereof … cannot well be done in any one of his Majesty’s said dominions without eminent prejudice to the rest’. In light of the Mint officers’ opinions, James II and his Privy Council decided that re-establishing a mint in New England was not in the interest of the King, and the mint at Boston was never again allowed to make money.280
After the Revolution of 1688, regardless of who held office, the officers of the Mint remained constant in their opposition to such proposals, and their influence on imperial monetary policy remained virtually absolute. Over the course of the 1690s, the Treasury Office received multiple proposals to erect yet more mints. In 1691, William Phips, who would become the governor of Massachusetts, petitioned the Treasury Office for permission to begin coining money in New England. Throughout the 1690s and into the next century, the Treasury received repeated proposals from the Commissioners of the Revenue of Ireland, the Chancellor of Ireland, and the Lords Justices of Ireland for an Irish mint that would coin small denominations of money out of silver. These proposals virtually always included coining money that was lighter than standard to discourage those coins from being exported from the places where they would be made.
Each time one of these proposals crossed the desks of the Treasury officials, the reaction of the Mint officers was the same: they referred back to each of their earlier opinions on overseas mints, echoed the familiar language about preserving the standard, and deemed the proposed mints ‘of a high and dangerous consequence’ to the kingdom of England and the rest of the dominions. Preserving one standard across all the kingdoms and dominions, they insisted, was crucial to the security and advantage of the king and queen and their subjects.281
The Mint officers acted as manufacturers protecting production standards and competing with producers overseas. Restricting minting to the Tower of London ensured that they maintained control over the standards and process of production and helped ensure that their raw materials – precious metals – did not flow to mints across the water. Because they held technical expertise, councils, boards, and parliaments deferred to them on decisions about colonial mints. As a result, Ireland and the American colonies suffered chronic coin shortages that hindered manufacturing and internal trade. Only when American colonies created circulating paper currencies later in the eighteenth century would they begin to break the relationship of economic dependency.
279 TNA CO 1/60 ff. 256-63. On the personnel changes among the officers of the mint and Henry Slingsby’s
forced retirement in 1680, when John Buckworth, Charles Duncombe, and James Hoare were appointed to exercise his office jointly (Thomas Neale replaced John Buckworth in 1686), see C. E. Challis, ‘Lord Hastings to the Great Silver Recoinage, 1464-1699’, in C. E. Challis, ed., A New History of the Royal Mint (Cambridge: Cambridge University Press, 1992), pp.354-57.
280 TNA CO 1/60, ff. 260, 271. 281 Record book containing entries of memorials, proceedings, proclamation, proposals, reports etc. concerning
the coinage of moneys for Ireland, TNA Mint 12/6.

New Researchers - Session II / A
132
Controlling quality, producers and their products: regulation and reputation in the English metal-ware trade,
c.1760-74
Rachael Morton, University of Warwick ([email protected])
Supervisor: Professor Giorgio Riello Debates about product quality, historically and historiographically, can be divided into three key areas: the control of people, products and processes. However, there is another important factor, reputation, which is intertwined with these three areas. There has been a considerable literature about reputation that is centred on commerce and branding. Yet, these debates can also throw light on manufacturing, and can help unravel the complexity of the relationships between producers, the public, and regulatory bodies such as the guilds and state.
Reputations were a pervasive force in the metal-ware trades in London and Birmingham in the mid-eighteenth century, influencing nearly all aspects of the trade. Not only did guild and state regulations attempt to control the reputation of the trade, but different groups of producers manipulated popular opinion to influence the priorities of the regulatory bodies. Historiography has tended to separate discussions about London and its guilds from research about the emerging trades in Birmingham. By bringing these two areas together, it becomes clear that whilst Birmingham adopted the cultures of quality and trust and the practices of marking metal goods found in London, a power-struggle also emerged between these competing regions. As the reputation of Birmingham metal goods shifted from ‘brummagem’ as a marker of poor-quality to ‘Birmingham’ as a marker of excellent quality, producers in London and the guilds associated with the metal trade attempted to control the production and circulation of goods made of a variety of metals, such as silver and pewter. This is particular clear from the debates surrounding the petition for new Assay Offices in Birmingham and Sheffield before their establishment in 1773.
The circulation of producers and products was often fraught with tension because of the desire of the state, guilds and individual manufacturers to enforce a range of regulations in an attempt to improve the consistency and quality of the metal trade. The numerous guilds associated with the metal-trade in London had many methods with which they attempted to regulate the trade, from their charters, ordinances and bills in parliament, to country searches.282 However, few of these methods were effective in places as far afield as Birmingham, and searches frequently reported numerous frauds and abuses.283 The London guilds were particularly concerned with the distinction between different metals, which became an increasing problem in the eighteenth century with the emergence of new materials and innovations, particularly in the expanding centres of production in Birmingham and Sheffield. By 1770, Matthew Boulton boasted that, unlike in London, manufacturers in Birmingham and Sheffield had the tools and the skills to make metal-ware in ‘Bath metal, white metal, pinchbeck metal, steel, & c’.284 It has been argued that it is because they developed outside of guild control that the metal trades in Birmingham and Sheffield were so successful.285 However, the relationship between producers in London and Birmingham was
282 S.R. Epstein and Prak Maarten, eds. Guilds, Innovation and the European Economy, 1400-1800 (Cambridge:
Cambridge University Press, 2008). 283 Guildhall Library (GL), MS 07104/26, Worshipful Company of Pewterers, Rough Court Minutes 1768-1771,
16 March 1769. 284 Birmingham City Archives (BCA), MS 3782/12/89/10, Considerations upon the Petition of the Workers in
Silver in the Towns of Birmingham & Sheffield, 3-4. 285 Peter Jones, Industrial Enlightenment: Science, Technology and Culture in Birmingham and the West
Midlands, 1760-1820 (Manchester: Manchester University Press, 2008), 39; Maxine Berg, ed. Markets and

New Researchers - Session II / A
133
more complex than this initial sense of opposition suggests, and allowed for an exchange of regulations, ideas and ideals. Before long, a number of vocal individuals in Birmingham and Sheffield began petitioning for more powers and self-regulation, which for the silver trade included a new Assay Office.
Many of the debates appear to have been directed by a pervasive fear of regional competition. One of the main arguments of the London Goldsmiths was that the national metal-ware trade was not successful enough for there to be a spread of producers across the country, and that the poorer producers in London would suffer.286 The petitioners for a new Assay Office were equally self-interested. They pointed out the ineffectiveness of the regulation of the guilds, by ‘a judge chosen and paid by the very people upon whose works he is to pass sentence’.287 They further criticized the monopolization of the guild system, and its London-centric focus, by arguing that ‘at no time does it appear to have been the intention of the legislature to oblige workmen in gold and silver to live in any particular spots, or to lay restraints on their industry, much less to grant a few towns a monopoly of the trade in these Metals’.288 In fact, Matthew Boulton suggested that greater competition actively improved product quality and the national trade, that ‘it can deprive the other Towns of no part of their trade, except by working better than they do and cheaper; and against losses of business by these means the proper securities are not privileges, but excellence in design and workmanship, and moderate prices’.289 Philippe Minard has suggested that product diversification placed ‘the economy of quality in doubt’, and signalled a shift of importance from quality to price.290 However, the language used in this campaign shows that whilst price and value were elements of the debate around the emerging competition of the Birmingham trade, quality remained a significant focus of regulators and producers alike.
The petition for the new Assay Office signalled a shift in attitude towards the conduct of the national metal trade. The new argument in support of competition emerged in stark contrast to the earlier prevention of competition by the guilds in London. As just one example of a wider policy across the guilds, bylaw 36 of the Worshipful Company of Pewterers banned advertising and the ‘boasting of ware and prusing other customers’, with the threat of a 40s. fine.291 At times, they also tightly restricted the use of marks in an attempt to prevent the advertising of a producer’s location, or the quality of workmanship. From the seventeenth century marks were being used by producers across the country in increasingly creative, albeit at times fraudulent, ways to capitalize on the popular associations with certain places of production or marks of quality. The forging of the marks that described the place of production suggests which places held the reputation for the production of best quality metal-ware. In the seventeenth century, many regional producers deceitfully put ‘London made’ onto their metal goods, but by the late eighteenth century, London producers were found to be fraudulently marking their goods with ‘Birmingham’. As such, the guilds struggled to maintain control over the regulation of the national trade, or to restore the exclusivity and trust in these marks. Therefore, the debates surrounding the new Assay Office in 1773 were part of a national discussion about competition and regulation. The guilds in London, and the regional producers in Birmingham and Sheffield, were manipulating the boundaries of regulatory control and the power and reputation that came with holding such a monopoly.
Manufacture in Early Industrial Europe (London: Routledge, 1991), 174.
286 BCA, MS 3782/12/89/4, Case of the Goldsmiths, Silversmiths, and Plate Workers of the City of London, 2-3. 287 BCA, MS 3782/12/89/13, Reply of the Petitioners from Birmingham and Sheffield to the Cast of the
Goldsmiths, Silversmiths and Plateworkers of the City of London, 2. 288 BCA, MS 3782/12/89/23, Memorial Relative to Assaying and Marking Wrought Plate at Birmingham, &c.,
2-3. 289 Ibid. 290 Philippe Minard, ‘Facing Uncertainty: Markets, Norms and Conventions in the Eighteenth Century’, in
Regulating the British Economy, 1660-1850, ed. Perry Gauci (London: Ashgate, 2011), 190. 291 GL, MS 07116, Worshipful Company of Pewterers, Transcripts of Charter and Bye-Laws, 1702, 84-85.

New Researchers - Session II / A
134
The London workers attempted to maintain their monopoly of the metal trade through their claims of quality production, and their control of regulation. As the conflicts between competing powers in London, Birmingham and Sheffield grew more heated, they became entangled with attempts at manipulating the reputations of the producers and their products. The London Goldsmiths wanted to be viewed as reliable producers, in opposition to the untrustworthy and poor quality regional manufacturers, who they described as ‘very ignorant’ and ‘very dishonest’, as individual producers often had other professions outside the metal-trade.292 The London producers evoked the language of nationhood, claiming to work ‘for the honour and riches of the realm’ that ‘so highly concern his majesty’s subjects’.293 Furthermore, debates about product quality and value rarely occurred without a reference to the trust and ‘established credit’ of the individual and the collective guild. It was argued by the London Goldsmiths that this contributed to the ‘elegance utility and true intrinsic value’ of the metal-ware.294 The Birmingham petitioners used similar language by emphasizing their trust, respectability and honour. Their petitions claimed that introduction of the ‘Guardians of the Standard’ would benefit the trade on a local and a national level.
This reputation had a direct impact upon the success of the trade, and the value assigned to different products. When asked if London metal-ware was better quality or more valuable than its regional equivalents, one silversmith from London suggested that Birmingham and Sheffield metal-ware was cheaper because of its slightness, whereas London metal goods had a greater value.295 This suggests that there were some material differences between the metal-ware that was produced in Birmingham and Sheffield, and that produced in London. Nevertheless, most producers lacked the ability to identify the location of production without an identifying mark. Moreover, it was even more difficult to determine if a particular mark was authentic or fraudulent. One producer, when ‘asked if he could tell whether a piece of plate with the London mark on it was of Sheffield or London manufactury? He said, not for a certainty’.296 Again, this highlights the increasing difficulties of regulation in an expanding marketplace with a wider movement of people and products. Because of the nature of metal-ware and the way in which it was difficult to visibly assess the quality of the material, producers and regulatory bodies relied upon the assay process, searches and, most of all, reputation, to maintain a successful trade. Reputation and quality were inextricably linked.
The reputations of particular producers and areas often had an extensive impact. The court records of the guilds reveal a general leniency towards individuals in London who produced poor-quality work, and a preference for repentance rather than punishment. Nevertheless, outside the court, the record of producers with ‘defective ware’ became a ‘black list of London workmen … who have had plate broke’.297 Such a negative reputation had an impact on the trade on an individual and a local level. William Abdy, for instance, had to leave Sheffield because ‘during the time of my apprenticeship my master committed a fraud upon the publick which fraud was, he plated the knifes hasts and sold them for silver – the consequence of which was a general stagnation of trade in that business’.298 Reputation may have been even more crucial outside London, where the guilds’ control was less effective. Not only could a bad reputation harm the trade, but the positive reputations of certain individuals were also used to support the campaign for new Assay Offices. Boulton and Garbett
292 Parliamentary Papers Online, Report from the Committee Appointed to Enquire into the Manner of
Conducting the Several Assay Offices. 1773. 10. 293 BCA, MS 3782/12/89/3, Case of the Wardens and Assistants of the Company or Mystery of Goldsmiths of the
City of London, 1773, 1. 294 BCA, MS 3782/12/88/11, Copy of Petition of Goldsmiths of London against Sheffield & Birmingham Assay
Office Petitions, 2. 295 BCA, MS 3782/12/88/15, Committee of Sheffield Assay Petitioners, 12. 296 BCA, MS 3782/12/89/12, Copy Report on Sheffield and Birmingham Assay Office Petitions, 18-19. 297 BCA, MS 3782/12/88/40, Letter, 8 May 1773, 2. 298 BCA, MS 3782/14, Minutes of Sheffield Assay Petition, 24 Feb 1773, 2-3.

New Researchers - Session II / A
135
encouraged the campaign to seek the advice of ‘respectable characters who will like to have it seen that they patronize Sheffield’.299 This demonstrates that reputations were used in practical and tactical ways, as a tool to protect or advance the metal-ware trade. Moreover, it suggests that communities of trust were important in Birmingham, and across the country, even before the nineteenth century, as shown in Carnevali’s study of the Birmingham jewellery trade.300
There were also attempts to damage reputations in order to influence the regulation of the trade. Mr Thomas Cliff, who previously worked in Birmingham but was now a journeyman in London, was asked to ‘go to the Goldsmiths Hall and tell the Gentlemen there that … [he] had been paid with bad Money at Mr Boltons factory’, and he’d be rewarded with five guineas. According to the witnesses, they aimed ‘to fill his councils’ mouth to be a blot on Mr Boulton’s character to hinder them from getting the Assay Office at Birmingham’.301 There were therefore attempts on both side of the debate to manipulate reputation through persuasive means or plotting sabotage. Different groups of producers used reputation to influence the priorities and the decisions of the regulatory bodies.
Producers in London, Birmingham and Sheffield therefore aimed to manipulate the reputations of the different areas, people and products. In doing so, they utilized various networks of knowledge, and communicated and restricted information at different times to preserve the ‘mystery’ of the trade or convey new messages about quality. Many producers in the eighteenth century became skilled at parliamentary lobbying, and increasingly used print to circulate knowledge of the metal trade to parliament, other producers and the wider public.302 This included a range of ephemera, such as trade-cards, advertisements and hand-bills. In opposition to the London Goldsmiths’ criticisms, a hand-bill was created to reassure the public that frauds were not being committed in Birmingham, and convey messages about their reputation and respectability. It stated that ‘we have the pleasure to assure our readers that some noblemen & gentlemen of the most eminent rank in Staffordshire & Warwickshire are so perfectly convinced that such practices were never known in this neighbourhood’.303 Again, the aim was not just to convey messages about the reputation of, and trust in, the products, but also the people and the processes.
The reputations of producers spread outside the trade, and visitors from across the country and across Europe began touring Soho manufactory, where Matthew Boulton made his metal toys, and were ‘very desirous to see the manufactures of it in the highest perfection’.304 The communication of this knowledge also spread orally, through the working relationships of producers in the metal-trade. In Birmingham, this later developed into the ‘Lunar Society’.305 However, there was also a wider knowledge of the reputations of individual producers and their particular marks. Matthew Boulton wrote in his diary of a ‘Mr Creswick a good filemaker in Sheffield his mark is R & Sceptor ovvr at Attercliff near Sheffield Rennell Cole is got of wch they turn toys’.306 The Birmingham and Sheffield producers had succeeded in breaking the monopoly of the London Goldsmiths, and developing the trade across England. Birmingham-ware had become synonymous with good quality metal-ware.
299 BCA, MS 3782/12/88/37, Letter, 3 May 1773, 1-2. 300 Francesca Carnevali. ‘Golden Opportunities: Jewelry Making in Birmingham between Mass Production and
Speciality’, Enterprise and Society, 4 (2003): 272-298. 301 The Goldsmiths’ Company Library, G.II.2.5, Committee on the Assay Office, 1773, 5. 302 Eric Robinson, ‘Matthew Boulton and the Art of Parliamentary Lobbying’, The Historical Journal, 7/2
(1964): 209-229. 303 BCA, MS 3782/12/88/40, Letter, 3. 304 BCA, MS 3782/12/23, Letter from Mr Falconer, 29 June 1769, 1-2. 305 Jenny Uglow, The Lunar Men (London: Faber and Faber, 2002). 306 BCA, MS 3782/12/107/4, Diary 1769, 2.

New Researchers - Session II / A
136
The mid-eighteenth century therefore experienced a transformation in the regulation and the distribution of the metal trade across England. By looking at the London metal trade and the guilds alongside the emergence of Birmingham and Sheffield as innovative centres of production, it has been shown that the regulation of people, products and processes influenced, and was in turn influenced by, reputation. Not only did producers want to improve the trade materially, they also wanted to maintain or gain control of the networks of power, and the reputations of trust, respectability and good quality metal-ware. New dialogues also emerged about the benefits of competition, both on a local and a national level. Therefore, it was increasingly difficult for the trade to continue as a ‘mystery’, and reputation was strategically manipulated. Producers could therefore influence the regulation of their trade through their reputation, as shown by the creation of the new Assay Office.

New Researchers - Session II / A
137
The English East India Company’s ‘market for lemons’: the organizational failure of the system of filature silk
production in Bengal, 1774-1812
Karolina Hutkova, University of Warwick ([email protected])
Supervisor: Professor Giorgio Riello George Akerlof’s paper on ‘market for lemons’ presented a compelling argument about the economic costs of dishonesty under the condition of uncertainty about quality. The market for lemons model has been since applied to the market with used cars, health insurance, employment of minorities, later to the market for physicians and other qualified professionals, and markets for hazardous products etc.307 This paper considers the case of the eighteenth-century British market for Bengal raw silk. Bengal raw silk attracted the interest of the European trading companies since the seventeenth century. However, this trade was hindered by the low quality of the silk which did not find widespread use by the European silk weaving industry. Driven by the demand for raw silk in Britain, in 1769 the English East India Company (EEIC) decided to adopt the Piedmontese system of silk reeling in Bengal.308 Yet, this technology transfer did not bring the desired quality improvement. This paper argues that the institutional framework of silk production in Bengal precluded quality improvements, exacerbated principal-agent problems, and coupled with asymmetries of information, ultimately led to the creation of a ‘market for lemons’.
The market for lemons is a type of market failure caused by information asymmetry between buyers and sellers. As buyers cannot distinguish between good- and bad-quality goods, both are sold at the same price reflecting an average quality.309 In the case of Bengal raw silk, a ‘market for lemons’ emerged because of the asymmetry of information between buyers and sellers concerning the quality of raw silk. Buyers of the Bengal raw silk could not easily obtain information about the quality of the silk in a particular bale.310 In 1780, for instance, the EEIC’s servants in London found that ‘fine and perfect silk reels over or is put upon coarse and inferior silk which makes it expensive and difficult to work and skeins are three times too large also’.311 Such practices had serious consequences for the EEIC’s trade in Bengal raw silk.
Continuing problems with the quality of raw silk show that the EEIC’s adoption of the Piedmontese reeling system did not produce the hoped for results. The quality of silk was not uniform – it differed among filatures, among bales, and within bales. To be fair the share of Bengal raw silk on total imports of raw silk into Britain increased from less than 30 per cent 307 George Akerlof, ‘The Market for ‘Lemons’: Quality Uncertainty and the Market Mechanism’, The Quarterly
Journal of Economics 84(3), 1970, pp.488-500. These examples are studied by Hayne E. Leland, ‘Quacks, Lemons, and Licensing: A Theory of Minimum Quality Standards’, Journal of Political Economy 87 (6), 1979, pp.1328-46.
308 The Piedmontese system was considered the most advanced reeling system in Europe. It required however the building of sophisticated reeling machines. Reeling therefore had to be done in filatures, factory-like establishments, characterized by the supervision of reelers, by inflexible discipline and managerial hierarchy. In order to promote quality reelers were paid time wages. Roberto Davini, ‘The History of Bengali Raw Silk as Interplay between the Company Bahadur, the Bengali Local Economy and Society, and the Universal Italian Model, c.1750 – c.1830’, Commodities of Empire Working Paper 6 (2008), pp.6-7, 15; Claudio Zanier, ‘Pre-Modern European Silk Technology and East Asia: Who Imported What?’, in Debin Ma (ed.) Textiles in the Pacific, 1500-1900. The Pacific World: Lands, Peoples and History of the Pacific, 1500-1900 (Aldershot: Variorum, 2005), pp.128, 142, 146-9.
309 Akerlof, ‘Market for ‘Lemons’, pp.488-9. 310 Raw silk was commonly sold in bales. 311 IOR/E/1/66 ff. 422-424v: ’Letters 212-213 James Wiss in London to Peter Michell, India Office Records and
Private Papers’, p.422.

New Researchers - Session II / A
138
prior to 1775 to 46 per cent on average during the period 1773-92 (table 1). However, available data indicates that imports surpassed sales within Britain (figure 1). By the 1790s the market was severely overstocked: in February 1794, the EEIC reported that 700,000 sm. lbs. of Bengal raw silk were to be found in the Company’s warehouses and that another 105,000 sm. lbs. were in the hands of intermediary buyers.312
Table 1 Share of Bengal raw silk on total imports of raw silk into Britain, 1773-92
Year Total Imports of Raw Silk (sm. lbs.)
Quantity of Bengal Raw Silk as % of Total
1773 542,467 2691774 713,873 29.9 1775 662,272 31.5 1776 1,298,035 39.7 1777 1,178,114 47.8 1778 1,012,836 59.5 1779 1,103,819 66.8 1780 445,617 52.8 1781 1,701,058 46.2 1782 373,313 20.8 1783 1,122,802 544 1784 1,587,103 724 1785 694,453 46.7 1786 569,812 44.4 1787 752,624 23.7 1788 790,276 38.7 1789 856,648 49.9 1790 757,758 42.3 1791 909,433 41.1 1792 889,318 42.7 Mean 898,082 46.8
Median 823,462 43.6 Source: Goldsmiths´ Library [G.L.], 1795 fol. 16280, Reports of the Committee of Warehouses, pp.6-10.
312 These 700,000 sm. lbs. of unsold raw silk far exceeded the 540,000 sm. lbs. considered by the Company as
adequate to satisfy the demand. Goldsmiths´ Library [G.L.], 1795 fol. 16280, Reports of the Committee of Warehouses, pp.18-9.

New Researchers - Session II / A
139
Figure 1: Bengal raw silk imported into Britain and sold in Britain by the EEIC, 1773-1806
Source: Compiled from [G.L.], 1795 fol. 16280, Reports of the Committee of Warehouses, p.6; L/PARL/2/55: ‘Annex to the Fourth Report‘, pp.218, 232.
The demand for Bengal raw silk and its price on the British market was contingent on its reputation, on manufacturer’s experience with the silk, and on the availability of information about the quality of the material. Both low-quality and non-uniformity of quality reduced demand for Bengal silk. According to a survey conducted by the EEIC in the 1790s, among ribbon manufacturers only the finest of the silk was suitable to be used in their trade and they called for further improvements of the quality of Bengal raw silk.313 Low-quality limited the use of Bengal raw silk in weaving and the non-uniformity of the threads made buyers ‘suspicious’ and wary of being deceived.314 It was not uncommon for silk of high quality to be reeled over coarse silk in one bale. Buyers could not distinguish between bales containing high-quality silk and ‘lemons’. Dishonesty and misrepresentations of quality were not so widespread as to drive the market out of existence.315 The negative implications of quality uncertainty were pointed out by one of the many EEIC’s silk specialists: ‘such a reception as is complained of may be productive of the worst consequences to the interest of the Company for if the appearance of the silk is so little to be expended upon from inspection, the buyers will grow so very suspicious that at the sales such silk as in reality might be worth 25 [s. per gr. lbs] will not be bid more than 20 for, if this only for fear of being deceived’.316
This paper argues that the problem with the non-uniformity of the quality of the Bengal raw silk was essentially engendered in the institutional framework of filature silk production in Bengal. New institutional economics has brought attention to the essential role that institutions have in facilitating exchange and economic development. However, when it
313 Goldsmiths´ Library [G.L.], 1796 fol. 16654, Considerations on the Attempt of the East-India Company to
Become Manufacturers in Great Britain (London: n.p., 1796), pp.17-33. 314 IOR/E/1/66 ff. 422-424v: ’Letters 212-213 James Wiss in London to Peter Michell’, 10th May 1780, p.422. 315 Akerlof, ‘Market for Lemons’, p.495. 316 IOR/E/1/66 ff. 422-424v: ’Letters 212-213 James Wiss in London to Peter Michell, p.422.

New Researchers - Session II / A
140
comes to early modern production the role of institutions is seldom taken into account. I rely on organizational theory in order to show how the institutional framework of filature production prevented quality improvements and led to fraud.
From an organizational point of view, the essential innovation of the Piedmontese system was the introduction of hierarchy.317 The Piedmontese system of silk reeling meant a transition from a putting-out to a factory system and it strengthened the level of control of merchant-entrepreneurs over the production process.318 Several studies show that the organization of production was important to the success of the Piedmontese in silk production.319 In the eighteenth century, the Piedmontese system was implemented in several places, not just in Bengal but also in the French Midi, in Portugal and Hungary, though, often without long-term success.320 In none of these cases was the role of institutions taken into consideration during the technology transfer. Attention was paid solely to technological aspects.
Differences in the quality of the Bengal silk exported to London had their roots in the agency system of silk production. The implementation of the Piedmontese system only partly solved agency problems by integrating production within one unit of production. However any firm needs governance and organization. Williamson describes the ‘rules of the game’ at the firm level as private ordering, ‘which entails efforts by the immediate parties to a transaction to align incentives and to craft governance structures that are better attuned to their exchange needs’.321 Two essential domains of private ordering are incentive alignment and contract implementation.322 In both of these domains the EEIC failed. The Company was unable to align the incentives of the Court in London with the incentives of Board of Trade in Bengal or those of the Bengalese reelers, nor was it able to create a governance structure that would mitigate the agency problems that emerged with the implementation of the Piedmontese system.
Due to geographical distance, the Court in London did not have effectual control over the process of silk reeling (figure 2). In contrast to the typical eighteenth-century merchant-entrepreneur: the Court owned several filatures; the distance between the Court and the filatures was immense; and the distance between individual filatures was equally vast. Hence, the Court had to delegate its authority and control over silk production to the Board of Trade in Bengal. Consequently, the Court could only give directions to the Board but could not enforce their implementation.
317 The term hierarchy and factory is sometimes used interchangeably in the literature on the organization of
work. See for instance Oliver E. Williamson, ‘The Organization of Work: A Comparative Institutional Assessment’, Journal of Economic Behaviour & Organization 1(1), 1980, pp.5-38.
318 Merchant-entrepreneurs in Piedmont had control over the process even before the filature system was implemented, and the new organization enabled them to increase this control. Davini, ‘History of Bengali Raw Silk’, p.6.
319 Davini, ‘History of Bengali Raw Silk’, p.15; Zanier, Pre-Modern European Silk Technology’, p.131; Mauro Ambrosoli, ‘The Market for Textile Industry in Eighteenth Century Piedmont: Quality Control and Economic Policy’, Rivista di Storia Economica 16 (3), 2000, pp.344-55.
320 Davini, ‘History of Bengali Raw Silk’, p.5. 321 Oliver E. Williamson, ‘The Theory of the Firm as Governance Structure: From Choice to Contract’, Journal
of Economic Perspectives 16 (3), 2002, p.172. 322 Ibid., p.173.

New Researchers - Session II / A
141
Figure 2: Hierarchical structure of the filatures silk production in Bengal The Structure of hierarchy in theory The structure of hierarchy in practice
Delegating control over silk production might not have had such serious consequences for quality of raw silk if the actors involved in silk production had incentives to favour quality. In the case of filature silk production, the Court in London relied on the same system of contracts and management practices used for controlling those servants whose task was procuring export goods for Europe. I argue that in this case the combination of access to private trade and the threat of dismissal were not sufficient to ensure that the servants in Bengal privileged the production of high-quality silk.323 Unlike the procurement of goods for export, in which the Court was able to monitor whether orders were fulfilled and goods arrived in Europe, monitoring compliance in silk production was more difficult as the quality of the filature silk was the only reliable indicator.
323 Santhi Hejeebu, ‘Contract Enforcement in the English East India Company’, Journal of Economic History, 65
(2), 2005, pp.498-500.
Hierarchy
Board of Trade in Bengal
Directors of Silk Filatures
Overseers and reelers
Delegation of authority and control over
filatures
Orders and guidelines
Control
Control
Court in London Court in London
Board of Trade in Bengal
Directors of Silk Filatures
Overseers and reelers

New Researchers - Session II / A
142
Figure 3: Incentives of servants and reelers employed in filature silk production
The Court in London was unable to discern whether the production of low-quality silk derived from difficulties in implementing foreign technologies, or whether it was caused by the lack of familiarity of the Bengal servants with silk production. This made the very choice of incentives difficult to define on the part of the EEIC. Douglas W. Allen underlines how presenting agents with the right incentives was essential for achieving goals by the British Crown in the pre-modern era when measuring performance and monitoring results was impossible.324 Figure 3 shows the incentives received by the Board of Trade in Bengal, by the directors of filatures, by reelers, and by the foreign silk specialists. With the exception of foreign silk specialists, all these incentives were mostly incompatible with production of high-quality silk. Both the Board of Trade and directors of filatures lacked the ability to enforce quality of production as well as incentives to focus on quality. Similarly, reelers were paid piece rates and, improperly supervised, thus focused on quantity rather than quality.325 324 Douglas W. Allen, The Institutional Revolution: Measurement and the Economic Emergence of the Modern
World (London: University of Chicago Press, 2012), pp.20, 109-140, 217-27. 325 IOR/E/1/66 ff. 422-424v : ‘Letters 212-213 James Wiss in London to Peter Michell’, 10 May 1780, p.422.
Directors of filatures No special rewards for production of high quality silk, lack of effort of the Board to monitor performance, lack of knowledge of silk production
Lack of ability and effort to enforce production of high-quality filature silk
Board of Trade No financial reward for production of high quality filature silk, lack of ability of the Court to monitor performance, lack of knowledge of silk production
Lack of effort to enforce production of high-quality filature silk
Foreign silk specialists Focus on quality improvement
Remuneration (£400 to £1,000), gratuity, subsistence of family back in Europe, dependence on EEIC for travel back to Europe
Reelers Piece wage, lack of supervision, alternative sources of income
Focus on quantity of production
Incentives Outcomes Actors
New Researchers - Session II / A
143
Meanwhile, the Court was unaware of the incompatibility of incentives with the goal of producing high-quality silk. Letters sent from London show that the Court understood the lack of knowledge of the best practices in Bengal as a reason for the production of raw silk of quality inadequate for the European market. Therefore, convinced that its servants in Bengal needed instructions on the best methods of silk production, the Court kept sending guidelines about best practices. These instructions were prepared by silk specialists employed by the Company in London. They were extremely detailed and concerned all aspects of silk reeling. Abiding to these rules was supposed to guarantee high quality.326 Such expectations would have been valid if the guidelines were implemented. However, since the Court did not attempt to innovate management practices, it did not possess the appropriate tools to secure compliance.
The neglect of the institutional framework of silk production made the EEIC’s venture a failure. In spite of having detailed knowledge about the inefficient practices as well as the methods for their rectification, the Court was unable to implement change. The Court focused solely on promoting the transfer of the Piedmontese reeling technology and failed to create a governance structure that would align the incentives of its servants with the Company’s goal of producing high-quality raw silk. Meanwhile, agency problems were at the heart of the production of non-uniform quality silk. The Board of Trade in Bengal, the directors of filatures, and the reelers received incentives inconsistent with production of high-quality raw silk. Without incentives or effectual supervision, both Bengalese silk reelers and the Company servants were prone to neglect their duties. Geographical distance and asymmetry of information prevented effective monitoring of servants by the Court. In such circumstances, the EEIC could not guarantee its buyers that the Bengal silk would meet the required quality standards.
326 IOR/E/4/625, Mr. Wiss Superintendent of Silk Trade, 9th September, 1777, p.198.

New Researchers - Session II / B
144
The business of information: brokers and auctioneers in the nineteenth-century Anglo-Indian trade
Michael Aldous, London School of Economics
[email protected] Supervisors: Dr Gerben Bakker & Professor Tirthankar Roy
Trading firms entering the Anglo-Indian trade after the rescinding of the East India Company’s monopoly in 1813 faced several significant challenges inherent in early modern long distance trade. Market coordination was difficult, exacerbated by volatility in the supply and demand of key export products. Information asymmetries were high due to the distance between buyers and sellers, increasing the potential for market failure. Yet, the firms operating in these markets were able to overcome these challenges; by 1860 the Asian trade expanded from less than 7 per cent of British exports and 16 per cent of imports under the monopoly, to 25 over cent of exports and provided 23 per cent of imports.327
This paper identifies the role played by brokers and auctioneers in resolving these fundamental problems of exchange.328 It focuses on the mechanisms by which information asymmetries between buyers and sellers were lowered through these market intermediaries. The paper shows how these firms developed efficient information sharing mechanisms through the production of detailed market statistics, disseminated in the form of reports and circulars, which improved coordination.
The paper briefly discusses the literature on market intermediaries, highlighting their role in information aggregation and sharing. This is followed by a description of the market for Bengal indigo and, drawing on a dataset constructed from Calcutta and London commercial registers, trends in the number of brokers and auctioneers operating in this market are established. Sources from broking firms are used to investigate the composition of the circulars and reports. Finally the paper draws on Akerlof’s theory of asymmetric information and Arrow’s information paradox to analyse the role and effectiveness of these firms.329 The role of market intermediaries
Research has revealed the important role played by various types of intermediaries in improving the efficiency of market exchange. Actors such as eighteenth century Parisian notaries matched and screened lenders and borrowers, lowering transaction costs in credit markets.330 Auctioneers in the Dutch republic solved ‘problems of price-fixing, classification and the distribution of goods’.331 Intermediaries in the coffee trade closed the gap between the conditions of supply and demand in geographically and temporally distant markets, improving coordination.332
Sleeswijk found that auctioneers in the eighteenth century wine trade were important as it was a highly diversified product, in which classification of quality was a major 327 Statistics taken from Chapman, Merchant Enterprise in Britain: From the Industrial Revolution to World
War I (Cambridge University Press, 2004), 8. 328 Greif, ‘The fundamental problem of exchange: A research agenda in Historical Institutional Analysis’,
European Review of Economic History, (2000). 329 Akerlof, ‘The Market for “Lemons”: Quality Uncertainty and the Market Mechanism’, Quarterly Journal of
Economics (1970). Arrow, ‘Economic Welfare and the Allocation of Resources for Invention, in the Rate and Direction of Inventive Activity’, NBER 609 (1962).
330 Hoffman, Postel-Vinay, Rosenthal, Priceless markets: the political economy of credit in Paris, 1660-1870 (University of Chicago Press, 2000).
331 Sleeswijk, ‘Hearing, seeing, tasting and bidding: Information at the Dutch auction of commodities in the 18th century’, in eds., Muller & Ojala, Information flows, New approaches in the historical study of business information (SKS Finnish Literature Society, Helsinki, 2007), 171.
332 Van Driel, ‘The role of middlemen in the international coffee trade since 1870: The Dutch case’, Business History, (2003).
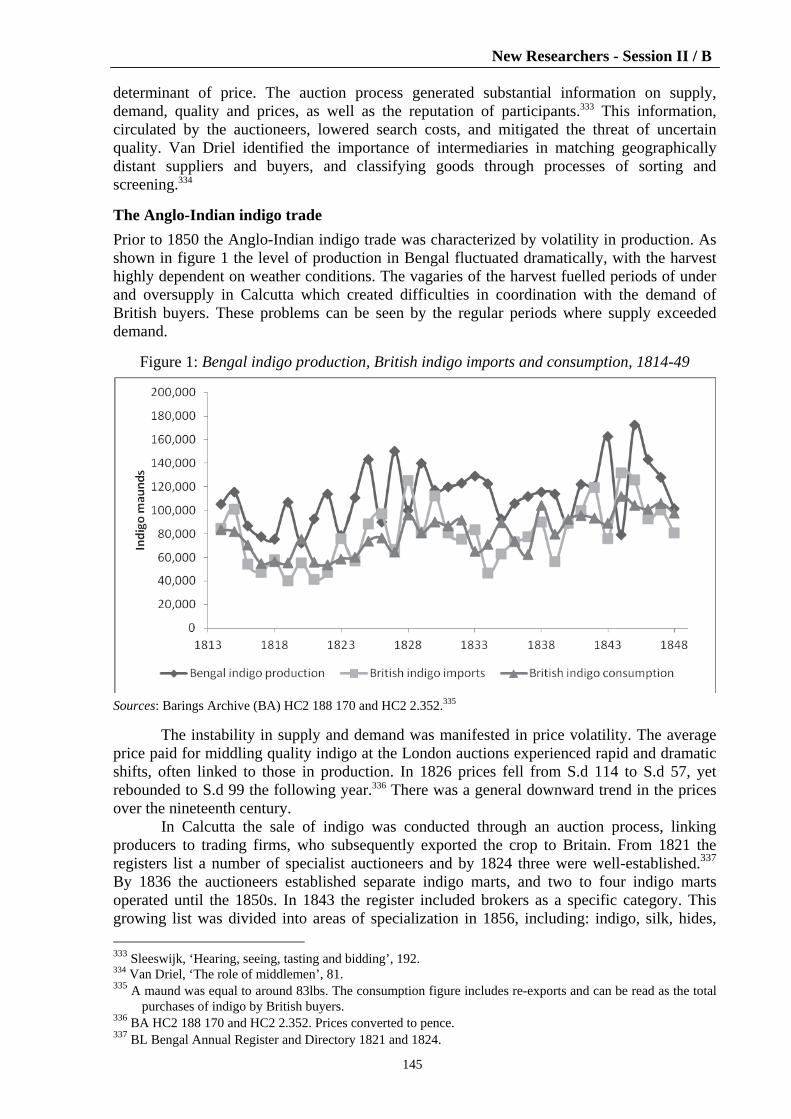
New Researchers - Session II / B
145
determinant of price. The auction process generated substantial information on supply, demand, quality and prices, as well as the reputation of participants.333 This information, circulated by the auctioneers, lowered search costs, and mitigated the threat of uncertain quality. Van Driel identified the importance of intermediaries in matching geographically distant suppliers and buyers, and classifying goods through processes of sorting and screening.334 The Anglo-Indian indigo trade
Prior to 1850 the Anglo-Indian indigo trade was characterized by volatility in production. As shown in figure 1 the level of production in Bengal fluctuated dramatically, with the harvest highly dependent on weather conditions. The vagaries of the harvest fuelled periods of under and oversupply in Calcutta which created difficulties in coordination with the demand of British buyers. These problems can be seen by the regular periods where supply exceeded demand.
Figure 1: Bengal indigo production, British indigo imports and consumption, 1814-49
Sources: Barings Archive (BA) HC2 188 170 and HC2 2.352.335
The instability in supply and demand was manifested in price volatility. The average price paid for middling quality indigo at the London auctions experienced rapid and dramatic shifts, often linked to those in production. In 1826 prices fell from S.d 114 to S.d 57, yet rebounded to S.d 99 the following year.336 There was a general downward trend in the prices over the nineteenth century.
In Calcutta the sale of indigo was conducted through an auction process, linking producers to trading firms, who subsequently exported the crop to Britain. From 1821 the registers list a number of specialist auctioneers and by 1824 three were well-established.337 By 1836 the auctioneers established separate indigo marts, and two to four indigo marts operated until the 1850s. In 1843 the register included brokers as a specific category. This growing list was divided into areas of specialization in 1856, including: indigo, silk, hides, 333 Sleeswijk, ‘Hearing, seeing, tasting and bidding’, 192. 334 Van Driel, ‘The role of middlemen’, 81. 335 A maund was equal to around 83lbs. The consumption figure includes re-exports and can be read as the total
purchases of indigo by British buyers. 336 BA HC2 188 170 and HC2 2.352. Prices converted to pence. 337 BL Bengal Annual Register and Directory 1821 and 1824.

New Researchers - Session II / B
146
bills and shares, freight and ships, produce and house. Table 1 reveals both the rapidly growing number of brokers in the 1850s. In the case of indigo the term broker and auctioneer appear to have been somewhat interchangeable, with firms operating as both brokers and indigo marts.338
Table 1: The number of brokers and auctioneers in Calcutta, 1821-68
Year Auctioneers Indigo Marts Total Brokers Indigo Brokers Bill and Share Brokers 1821 3 1831 3 1838 3 3 1843 3 3 6 4 1848 2 2 10 5 1854 5 4 41 7 10 1858 7 68 7 24 1863 9 70 9 19 1868 7 82 5 38
Source: British Library (BL) Selected editions of the Bengal Annual Register and Directory.
The auction process was repeated when the indigo reached Britain, and was sold to wholesalers. By 1817 there were well over a thousand auctioneers and brokers recorded in London, including eight indigo brokers. These numbers increased, so that by 1841 there were sixteen indigo brokers and six indigo merchants. There were a further twenty five India brokers and forty seven colonial brokers also dealing with colonial export products. In 1869 there were seventeen indigo brokers, eleven indigo merchants, with a hundred and nineteen colonial brokers.339
Alongside the coordination of buyers and sellers one of the major tasks undertaken by the brokers was determining the indigo’s grade of quality. Quality was determined by the colour and fixedness of the dye. To help this process the auctions were held early in the morning when the light was best for inspecting the colour.340 Four main grades were used, from ordinary to fine, separated by good and middling.341 The differentiation between the grades had a significant effect on price, with a mean average of 50 pence per pound difference between the fine blue and low consigning quality.342
There is no record of the activities of indigo brokers in London, but those in the tea sector are well described. William Thompson and Co. organized a range of activities including the shipping and insurance of the batches from Calcutta and their storage in London. Acting for sellers they tested the quality of the tea and based on this assessment set a guide price for the various batches which were published in a catalogue distributed to interested buyers.343 Brokers acting for the buyers also tested the quality, and undertook the purchasing through the regular auctions.344 It is likely that indigo brokers provided similar services, coordinating with buyers in Britain.
338 William Moran and Co. was listed as an indigo mart, broker for indigo, silk, bills and shares. 339 BL, Johnstone London Commercial Guide and street directory 1817, Post Office London Directory of 1841,
1869. 340 Roy, ‘Trading firms in colonial India’, Business History Review, 88, (2014). 341 Alternatively the definition was done by colour, from the least to most valuable: copper, violet, purple, and
blue. 342 1833 Report from the Parliamentary Select Committee on Manufactures, Commerce, and Shipping; George
Larpent’s evidence, quoting London auction prices from 1816 to 1833. 343 London Metropolitan Archive (LMA) MS8803/1 Flyer for the sale of Assam tea by the Agents W. Thompson
June 9th 1863. 344 The London tea auctions at Mincing lane ran continuously from 1706 until 1998.

New Researchers - Session II / B
147
Role of the circulars
Through these activities the brokers and auctioneers generated a wide range of information on the products, producers and buyers they interacted with. Using this information the firms began to produce reports that listed prices and market forecasts.345 Brokers such as Thomas and Co. released regular ‘Prices current’ bulletins, which reported the conditions of supply and prices of export products.346 These communiqués evolved to include increasingly detailed and specialized information. Indigo brokers William Moran and Co. produced regular newsletters on the sector which included discussion on the growing season, levels of production, and the prices achieved at the Calcutta auctions.347 These were coupled with similar reports from British brokers who tracked supply and demand with analysis of the London auctions.348
The circulars and periodicals made use of increasingly sophisticated statistics to identify trends. The reports included tables that presented average prices, the level of supply and consumption per year over multiple years.349 Mean averages and three to five year moving averages were increasingly used. To better reveal the factors that shaped indigo prices, concepts such as ‘excess of supply over consumption’ were developed. This sought to account for stocks in Europe as a component in determining changes in price.350
The circulars sought to overcome a lack of information, but also problems with inaccurate and misleading information. A report by Presgrave and Co. in 1831 was presaged by the statement, ‘so much has been said by anonymous writers, and whose views are not clearly very understood … that we thought it advisable to lay a statement before the public which by its authenticity may satisfy the minds of those whose fortunes are at stake in this important article of Bengal produce’.351 This appears to have been an endemic problem, twenty years later Edwards and Mattie began one of their reports, ‘a most erroneous statement having been lately published’.352 Importance and effectiveness of the brokers and auctioneers
The market for indigo was characterized by the volatility of production, and the diversified nature of the product. Buyers had to ascertain the likely level of supply and judge the quality to make an informed buying decision. Swings in the price caused by the level of production or changes in demand affected the decisions of actors throughout the chain. Information with certain characteristics was required to mitigate these threats; it should be accurate and preferably aggregated, from a trustworthy source, generated frequently and distributed widely. Why were the brokers and auctioneers particularly well placed to fulfil this need?
To answer this question the paper considers two strands of theory. First, Akerlof proposed that markets for products with quality uncertainty generate high information asymmetries, and participants seek mechanisms to signal the quality of the product or the trustworthiness of the seller.353 Indigo sellers had a clear incentive to lower information asymmetries to ensure that they could efficiently sell higher quality indigo, whilst buyers sought signals to avoid being bilked with a lower quality product.
Second, Arrow identified a paradox arising when a buyer required information of a product to determine its value, but once such information was given it effectively transferred
345 BA HC2 188 Indigo report written by Presgrave and Co. 1st September 1831. 346 BA HC6 31 Thomas, Marten and Co. Prices current, 8th December 1851 Calcutta. 347 BA HC6 31 Indigo Circular from William Moran and Co Calcutta 7th August 1852. 348 BA HC2 432 Straith and Co. 1st July 1854. BA HC 2.432 E.I Mocatta Juniors Brokers July 25th 1854. 349 Ibid, both used decadal summaries. 350 BA HC2 364 A report written by John Richmond of London 1st November 1850. 351 BA HC2 188 Indigo indigo report written by Presgrave and Co. 1st September 1831. 352 BA HC2 364 A report written by John Richmond of London 1st November 1850. 353 Akerlof, ‘The Market for “Lemons”’.

New Researchers - Session II / B
148
its value for nothing.354 Bakker used the theory to analyse the emergence of news networks, showing how they overcame the difficulties in protecting the value of their product, information.355 Using mechanisms like subscriptions to guarantee purchases through prepayment, the firms were able to invest in information gathering and frequently publish the results. Drawing on these theories and the characteristics of the indigo market a comparison of mechanisms for information distribution can be made. A summary is shown in table 2.
Daily newspapers such as the Bengal Hurkaru, and periodicals like the Asiatic Annual register, provided a range of commercial information.356 A similar offer was available in Britain through newspapers such as The Times and The Economist. They offered a frequent service, but were constrained by a variable capacity to obtain accurate and aggregated information, reliant on the quality of their reporters. Better quality papers would be more trusted, but still needed to sell their product, restricting the distribution to purchasers and subscribers.
The desire for accurate and aggregated information saw the creation of autonomous organizations to provide it. The Calcutta Chamber of Commerce was founded in 1833 on the premise of securing, ‘correct knowledge of the stock in first hands of the principal articles of our imports from Britain’. 357 The chamber aggregated information from its members, and circulated the reports to participating firms. Members paid an annual fee resolving Arrow’s paradox. Although distribution was ostensibly limited to members, the independent nature of the chamber gave its information credibility, such that its reports were widely republished.358 Yet, the frequency of reports was relatively low.
Brokers and auctioneers, acted for, and liaised with, the full range of actors in the market. They were optimally positioned to access and aggregate accurate information. Conversely the size of their networks ensured they were able to frequently distribute the information widely.359 Due to their role these firms were able to overcome challenges faced by other organizations. First, as auctioneers they were tasked with defining the rules and regulations of exchange, ensuring that transactions were fulfilled. As Brokers they acted as quality assessors and assurers. This imbued the firms with a degree of neutrality and trustworthiness. Second, the production and dissemination of information was not a direct source of revenue, so they could freely distribute the circulars to a wide range of customers.
Table 2: Information characteristics and capabilities of difference providers
Accuracy Aggregation Trust Frequency Breadth Chambers of commerce High High High Low Medium Newspapers & periodicals Variable Medium Variable High Variable Brokers and auctioneers High High High Medium High
Conclusion
Firms such as William Moran and Co. were uniquely placed to gather extensive information on products such as indigo, in their role as auctioneers and brokers. Their position in the
354 Arrow, ‘Economic Welfare’, identified mechanisms such as intellectual property rights which protected the
sellers from having their product appropriated. 355 Bakker, ‘Trading Facts: Arrow’s Fundamental Paradox and the Origins of Global News Networks’, in Putnis,
Kaul and Wilke eds., International Communication and Global News Networks: Historical Perspectives (Hampton Press, 2011).
356 BL MFM.MC1149 Bengal Hurkaru. 357 Tyson, Bengal Chamber of Commerce and industry 1853 – 1953 a centenary survey (Bengal Chamber of
Commerce, 1953). 358 For example, the East India indigo commission, 1861, contains many statistics collected by the Bengal indigo
planters association. 359 Circulars were found in the archives for various firms including: Baring Brothers, Gisborne and Co., and the
Assam Company.

New Researchers - Session II / B
149
market widened the scope of the information collated and capacity for distribution. Buyers, sellers and investors were able to obtain accurate information from the increasing number of these trusted sources. The constrictions on trade due to volatility in prices caused by difficulties in market coordination, which had restricted investment and participation in the years prior to 1850, were reduced as information asymmetries were lowered and market coordination was improved by the widely distributed circulars. The brokers’ and auctioneers’ capacity to generate more accurate, aggregated information, and their position as trusted intermediaries made them an integral part of the growing colonial market.

New Researchers - Session II / B
150
A different trajectory of market integration? Evidence from bunker coal markets, 1840-1960
Alexis Wegerich, University of Oxford
([email protected]) Supervisor: Professor Kevin O’Rourke
This paper examines global price convergence in coal over a 120-year long period relying on new evidence from the market for Welsh bunker coals. Market integration studies have shown price convergence during the long nineteenth century (Jacks 2005), the limited evidence available hints at disintegration during the interwar period (Hynes, Jacks & O’Rourke, 2012), and price convergence post-World War II (Federico & Persson, 2007). Based on this literature a rather uniform level of prices was achieved in this first era of globalization pre-World War I. In contrast, Wright (1990), amongst others, has argued that geographical advantages had not been eliminated by trade at the time as the market integration literature would suggest. I will argue in this paper that the focus of market integration studies on agricultural commodities, mostly grain, with very different bulk-to-value ratios as compared to coal, might explain this contradiction. For a commodity with a high bulk-to-value ratio such as coal transportation costs account for a much higher share in sales prices and thus integration patterns may have been very different. My results indeed show that price gaps for Welsh coal were still significant before World War I and prices did not diverge in the interwar period. As such, these findings suggest a more commodity-specific view of market integration and also have implications for the debate on the persistence of comparative geographic advantages. Historical background: the market for bunker coals
The market for bunker coals – used to fuel ship’s steam engines – offers a great framework to make price comparisons since Welsh coal, and thus a homogenous quality, was available on a global scale. With the rise of steam shipping in the 1830s a global network of coaling stations was required since steam ships needed to refuel on their long-distances trips. As an early adopter of steam technology, the Royal Navy conducted coal trials and Welsh steam coal turned out as the most suitable. It has a high calorific value, generates steam quickly and, due to its compactness, it uses less storage space than other qualities. Subsequently Welsh coal gained the reputation as the preferred bunker coal and achieved market dominance.
Steam ship technology improved significantly over the nineteenth century with the application of iron body hulls, the compound engine and steam turbines in the 1900s. The tonnage of steamships in the British Merchant Navy surpassed sailing ships in the 1870s. Nevertheless, the shift from sail to steam was rather gradual and in bulk trades, such as coal, sailing ships were used until the 1890s. The export demand for British bunker reflects this trend by increasing tenfold from 2.2 million in 1869 to 21 million tons in 1913, before embarking on a long-run decline beginning in the 1920s.
Towards the end of the nineteenth century, improvements of engines, meaning that coal quality mattered less, coincided with the rise of coal production in other countries such as India and Australia. The competitive position of Welsh coal came under pressure and Wales lost Asian markets to these competitors in closer proximity. However, until the 1960s Welsh coal continued to be supplied to Latin America, southern Europe and northern Africa. The final blow to Welsh coal was the conversion to oil, and once again the Royal Navy led the trend commissioning the first ships in 1915. The last coal-fired ships built in the 1930s remained in service due to the relatively long life of ships until the early 1960s. Data
This paper relies on a novel dataset of Welsh coal prices retrieved from printed primary, and partially archival, sources. Prices from most of the sources have never been studied

New Researchers - Session II / B
151
systematically. The dataset consists of 2,550 annual price quotations of Welsh coal for the period 1840 to 1960. The sources also yield a further +3,000 prices for other types such as Westphalian coal, which are not included in this paper. Per available year prices for around 30 ports are available. Prices are usually classified as f.o.b. (freight on board) at the coaling station. Thus, it includes all costs associated with shipping the coal from a Welsh port, most likely Cardiff, to the respective coaling station, plus the costs occurring at the coaling station and for loading the coal onto the buyer’s ship. Sources are reports by the Royal Navy to the House of Commons and the US-American Office of Naval Intelligence, business records of the coal merchant business Wilson, Sons Company Limited, British consular and commercial reports in shipping and coal trade journals. Due to space constraints, this short version of the paper only lists major sources and for which years they were used, the number of extracted price quotations and to how many ports those are referring to.
Table 1: Overview sources for price data
Theoretical foundation and methodological approach
Over time market integration should show declining transaction costs and absolute price convergence. Annual price gaps are calculated by subtracting the price at Cardiff, the major coal exporting port of Wales, from the price charged at the importing harbour. The difference is divided by the Cardiff price. The smaller the percentage price gap, the better integrated the markets or, at least, the lower are trade costs. Next to its appealing simplicity, this way trade costs are deflated by the coal price at Cardiff, the cost of the traded commodity.
The following OLS-panel regression combines the percentage price gaps for all ports and years in the dependent variable. The shipping distances serve as the explanatory variable and should aggregate the state of price convergence in one single coefficient. The distance variable is interacted with year dummies. This way, the shipping distance serves as a proxy for the transaction costs between the ports, documenting the ‘shrinking’ of distance over time.

New Researchers - Session II / B
152
Three sets of shipping distances have been constructed to incorporate the effects of the
opening of the Suez Canal (1869) and the Panama Canal (1914). This short version of the paper only contains the specified regression, though the results are robust to including port and/or year fixed effects. Results: descriptive analysis
The following maps illustrate the breadth of the Welsh coal trading network as well as the integration levels at five different points in time from 1840-5 to 1950. The colours indicate the percentage price gap divided into eight brackets; thus by how many per cent the price at the importing coaling station exceeds the price at Cardiff.
Map 1: Prices for Welsh coal relative to the price at Cardiff, 1840-45
Map 2: 1869
During the period 1840-5 (map 1) price quotations are available for all continents bar Australia. Immediately, two fundamental observations emerge. Absolute price gaps are very large and Welsh coals cost at least double the price at foreign ports. Secondly, prices increase with increasing distance to Cardiff. Prices gaps are very wide even for short distances

New Researchers - Session II / B
153
reaching up to 100 per cent for ports of the British Isles. The price difference to Gibraltar is 126 per cent while the prices double up to Malta, Bermuda and by a small margin Recife with an average price gap of 199 per cent. The price gaps to the West Indies and the West African coast, except Loando, fall into the range 200 to 250 per cent. Finally, very large price gaps apply to the long-range routes to Callao (305 per cent) and Singapore (472 per cent). Map 2 of 1869 does not look too different from 1840-5 though price differences seem to have widened overall: of the seventeen cases with price quotations for both periods, prices were higher in twelve cases in 1869 and only lower in five cases. Thus, certainly no trend towards price convergence is discernible over the mid-nineteenth century.
Map 3: 1912
Map 3 represents the situation in the Welsh coal market at the height of the international economy prior to World War I. The high number of available prices, 45 in total, illustrates the scope of the Welsh bunker coal at the time, whilst only excluding North America and Australia. Overall, price gaps have narrowed considerably as compared to 1869. However, price differences remain highly significant, and have by no means vanished: even for the Mediterranean price gaps amount, for instance, to 27 per cent for Gibraltar and to 58 per cent for Trieste. The largest price gaps can be found in South America such as Recife with 174 per cent and to Mauritius with 116 per cent.
Map 4: 1932

New Researchers - Session II / B
154
Map 5: 1950
By 1932 (map 4) any protectionist movements following the Great Depression must have been in full swing, and should thus reveal whether prices diverged as compared to the pre-World War I period. The data shows a shrinking trade network since Mauritius and Port Said are the only remaining stations in the Indian Ocean. The colouring of the remaining ports appears similar. Of the 36 cities contained in 1912 and 1932, price gaps have widened in 26 cases and improved in ten cases. However, since the vast majority of ports stay in the same colour brackets, these price changes appear to be rather modest. Costs associated with distance seem to have remained the most important determinants since the introduction of, or changes in, tariff levels should have disturbed the correlation between distance and price differences. Finally, darker colours in map 5 of 1950 indicate that price gaps widened as compared with 1932, and thus were also greater than experienced in the early twentieth century. For instance, the price gap to Buenos Aires widened from 110 to 300 per cent and price gaps in the Mediterranean now frequently reach up to 100 per cent and more, whereas they had previously been below 50 per cent. In 1950 coal price differences between the exporter, Great Britain, and importing countries had reached the lowest level of integration since the late nineteenth century. Results: econometric evidence
The panel regression (pooled OLS) allows us to identify the timing of relative price trends more accurately than the maps. The model explains 78 per cent of the variation in the price gaps and thus confirms the importance of transportation costs on price differences; other factors such as protectionist policies should not be correlated with distance from Great Britain. The highly significant year*distance interaction terms are plotted in figure 1 within their 90 per cent confidence intervals.

New Researchers - Session II / B
155
Figure 1: Interaction coefficient distance*year, 1840-1960
The minimum and maximum of the 1840s quite accurately determine a corridor for the price movements of the late 1860s until 1870. Coal prices seemed to have increased by at least 40 per cent with 1,000nm shipping distance, and increases of 70 per cent per 1,000nm in boom years were not uncommon. In consequence, this period was shaped by high and trendless fluctuations. Prices converged dramatically after 1870 and can be quantified in two ways: First, the average coefficient 1866-70 is 0.56, for the period 1896-1900 0.32 and thus declined by 43 per cent. Second, the minimum in the nineteenth century was 0.39 in 1842 in contrast to 0.15 in 1900, a drop by 60 per cent. Based on these calculations, percentage price gaps roughly halved during the nineteenth century.
After distortions throughout World War I, prices seemed to have re-integrated fairly swiftly and the minimum of 0.11 reached in 1926 strongly implies that prices have converged even further than pre-World War I. Apart from the price hike in 1927, most probably caused by a disproportionate effect of the strike in Welsh mines on foreign prices, coefficients, and thus price gaps, continued to decline from a level of 0.28 (1928) to 0.20 (1937). While the latter value is very close to the 1913-level, coefficients were on average slightly higher during the 1930s than in the first years of the twentieth century. The developments post-World War II are reminiscent of the post-World War I period, since the coefficient plunges to 0.24 in 1948 before it increases again to circa 0.44. A rather stable level persisted from 1953-57 albeit coefficients were twice as large as during the 1930s. The early 1950s and especially 1959-60 show maximum extreme values with coefficients reaching records levels. While only a rather short period of years post-World War II is covered and the sample size is comparatively small, the available evidence suggests that coal prices diverged even further than during the late nineteenth century.
Validation of findings
A comparison with the evidence on causes of market integration, most importantly transportation costs, should allow us to validate my findings and to put them into context. Harley constructed a coal freight index which should track price developments closely. He finds that freight rates were fluctuating significantly without clear trend from 1838 to the mid-

New Researchers - Session II / B
156
1860s, and then declined rapidly until the early 1890s by 45 per cent. Both the timing as well as the size of price drops Harley finds fit well with my results, even though his index seems to start decreasing a few years earlier. This similarity raises confidence in my results, but also confirms that price differences were to a very significant extent composed, and driven, by freight rate developments. A similar cross-check can be made using Mohammed’s and Williamson’s freight index for the post-World War I period. Their freight rate index reaches the pre-World War I level already in the 1920s, staying at a rather stable level, which again is in line with my findings. After World War II two hikes in freight rates can be observed though much smaller in scale than the price divergence my data show, and thus seem not to be fully explained by freight rate developments.
Since Hynes et al. (2012) attribute their results of market disintegration post-1929 to raising protectionism, a comparison of tariff rates pre-World War I and post-1929 should reveal whether tariff rates for coal in this market were indeed different as my results suggest. The average tariff rate charged by Argentina, Brazil, Egypt, France, Italy, Portugal, Spain, Greece and Turkey in 1912 was 4 per cent as compared to 7.81 per cent in 1932. Thus, the increase appears to be comparatively small. One can only speculate that either importing countries were cautious to keep coal prices rather low and therefore refrained from greater tariff rates, or that the stability of the coal price, in contrast to falling prices for many other commodities, helped in that it did not trigger specific tariffs (most tariffs were not ad valorem) to increase as a percentage share of the sales prices.
Conclusion
The global market for Welsh bunker coal indeed followed a different trajectory of market integration. Prices did not converge in the period 1840-70 before they joined the common trend of dramatically falling trade costs that roughly halved until the early twentieth century. Also the volatility of the percentage price differences and thus import prices declined markedly. Nevertheless, even in this period of comparatively high market integration, in 1912 price gaps increased by 19 per cent per shipping distance of 1,000nm. Prices certainly had not integrated to a degree that import dependence did not matter anymore. Slightly further improvements materialized in the interwar period, but arguably the greatest distinction of this market is that prices rather converged than diverged following the Great Depression. The increases in coal tariffs were only slight, and clearly insufficient to overrule the effect of other more stable elements constituting transaction costs, such as freight rates. The available evidence until 1960 indicates that the state of market integration post-World War II was actually the worst experienced since the late nineteenth century.
References
Federico, G., 'The First European Grain Invasion: A Study on the Integration of the European Market 1750-1870', EUI Working Paper, (2008), 1-116.
Federico, G. and Persson, K., 'Market Integration and Convergence in the World Wheat Market, 1800-2000', The New Comparative Economic History: Essays in Honor of Jeffrey G.Williamson, (2007), 87-113.
Harley, C., 'Coal Exports and British Shipping, 1850–1913', Explorations in Economic History, Vol. 26, No. 3, (1989), 311-38.
Hynes, W., Jacks, D., O'Rourke, K., 'Commodity Market Disintegration in the Interwar Period', European Review of Economic History, Vol. 16, No. 2, (2012), 119-43.
Jacks, D., 'Intra-and International Commodity Market Integration in the Atlantic Economy, 1800–1913', Explorations in Economic History, Vol. 42, No. 3, (2005), 381-413.
Mohammed, S. and Williamson, J., 'Freight Rates and Productivity Gains in British Tramp Shipping 1869–1950', Explorations in Economic History, Vol. 41, No. 2, (2004), 172-203.
Wright, G., 'The Origins of American Industrial Success, 1879-1940', The American Economic Review, Vol. 80, No. 4, (1990), 651-68.
New Researchers - Session II / B
157
Are partners too distant? French difficulties on new long distance markets, 1850-1913
Léo Charles, GREThA UMR CNRS 5113, Université de Bordeaux
([email protected]) Supervisors: Professors Bernard Blancheton & Stéphane Becuwe
1. Introduction
First globalization is well known as a period of an impressive growth of international trade partly due to the decline of trade cost (Jacks et al., 2011). As a consequence, new countries emerged on the international market and new, distant opportunities appeared for the European industrialized countries.
At the same time, French international trade stopped its development, especially its export capacity during the Belle Epoque (Bairoch, 1993). This is particularly true for the export capacity to new emerging markets like Latin America or Asia.
Observations hint at a failure of French export trade to achieve market diversification during the ‘second industrialization’. However, only partial evidence has been gathered. The paper aims to examine the whole record for the entire period with an approach encompassing all of France’s trading partners. Our study uses a comprehensive annual database by country for France’s foreign trade over the period 1850-1913.
The main goal of the paper is to measure the influence of distance on bilateral export and import flows using an original database and a standard gravity model approach. By extension we highlight French international trade market diversification. 2. Original database and key data
Our strategy has consisted of building an original, disaggregated database for France’s foreign trade recorded annually between 1850 and 1913. Our main source is the ‘General Table of French trade with its overseas colonies’; General Table of trade and navigation after 1896. Annual inflows from 41 countries and annual outflows to 63 destinations have been extracted from these statistical yearbooks.360
We used in our gravity model data on GDP and population from the Maddison Project Database. As GDP is expressed in 1990 constant dollars, we convert export and import values into constant dollars using the USD/FRF exchange rates from Global Financial Data and the US consumer price index from the Handbook of Labor Statistics. For data on distance, we use the GeoDist database from CEPII (Mayer & Zignago, 2011) which takes into account distance between the biggest cities of each country in terms of population.
Finally, the database used for the estimation of gravity models includes 32 countries as we suffer from a lack of GDP data for some countries in our sample. However, our final database still represents an average of 92.6 per cent (81.7 per cent) of total French export (import) flows over the period.
We split our sample into two groups depending on the distance from France (lower or higher than the average distance). Close countries (SD) include 16 European countries and 4 African countries (Algeria, Egypt, Morocco and Tunisia). There are 12 distant countries (LD). To carry out our empirical investigation we divided LD countries into three groups (Latin America, the USA, and Asia Pacific (including Australia). 3. Econometric framework: gravity model specifications
Since its transposition to the analysis of bilateral trade by Tinbergen (1962), the gravity model has been extensively used to explain and predict flows of such trade. In this paper, we focus
360 The database is available upon request to the author.
New Researchers - Session II / B
158
on French bilateral exports and imports. This is the reason why we include the size of the economies of partner countries only.
Our baseline models for exports (1) and imports (2) are specified as follows:
ijtijjtjtijt DNYX lnlnlnln 210 (1)
ijtijjtjtijt DNYM lnlnlnln 210 (2)
Where Xijt is the volume of French exports to partner j in year t, Mijt is the volume of French imports from partner j, Yjt and Njt are respectively the partner’s GDP and population in year t and Dij is the distance between France and its partner j. The term εijt is composed of a bilateral individual effect µij and an error term wijt with the usual standard properties (εijt = µij + wijt). We also estimate those baseline models by performing further regressions including area dummies for Europe, Africa, Latin America, Asia Pacific and USA.
Our main research question is how sensitive French bilateral trade (exports and imports) is to its geographical distance from its partners throughout the period 1850-1913. Based on statistical analysis, we suggest that at the end of the period, France exported relatively less to distant countries and imported relatively more from those same countries. In other words, we would expect the influence of geographical distance on French exports (imports) to have decreased (increased) over the period. To test those hypotheses, we draw on the methodology provided by Brun et al. (2005). More precisely, we include a time-trend and an interaction term between this time-trend and the distance variable. The influence of distance on bilateral trade is thus assumed to change over time.
ijtijijjtjtijt DtDtNYX ln.lnlnlnln 210210 (3)
ijtijijjtjtijt DtDtNYM ln.lnlnlnln 210210 (4)
To deepen our analysis, two additional regressions are carried out. First, we include area dummies (Europe, Africa, Latin America, Asia Pacific and USA) in the previous models and interaction terms between those area dummies and the time-trend. Second, we use the same methodology as above and include an interaction term between the time-trend and partner’s GDP, for both the export and import equations. The underlying idea is to determine whether the influence of partners’ economic size changed over the period, given that the most dynamic countries in terms of GDP growth rates at the end of the period were mainly distant markets (Latin America, USA).
As the fixed-effects model was unsuitable because of the presence of time-invariant covariates (distance, area dummies), we use a random effects model (RE) estimated through GLS and in which individual effects are assumed to be randomly distributed. This model suffers from the possible correlation between individual effects and some explanatory variables. We also developed an alternative to the RE model following Egger (2002, 2005). Indeed, he recommends using the Hausman-Taylor (HT) estimator (Hausman & Taylor, 1981), a method which allows one to estimate time-invariant covariates and to address endogeneity issues (and particularly the non-zero correlation between explanatory variables and individual effects). The HT estimator is an instrumental variable approach that uses instruments that are internal to the model to eliminate the correlation between endogenous explanatory variables and the unobserved individual effects. In our gravity models, the time-invariant exogenous variables are distance and area dummies whereas the time-varying exogenous variables are France’s population, partner’s population, the time-trend and interactions terms between distance and the time trend and between area dummies and the time-trend. These exogenous variables are used to instrument the remaining variables that are considered as endogenous (France’s GDP, partner’s GDP, and the interaction term between

New Researchers - Session II / B
159
the time trend and partner’s GDP). The consistency of the HT approach is controlled by a Sargan-Hansen test of over-identification that tests the null hypothesis of instruments validity. We also implement a Hausman test that compares the HT estimator and the GLS estimator. The null hypothesis is that GLS estimator is preferred to HT estimation. 4. Results 4.1 Results for imports
Table 1 reports RE and HT estimates for French imports. The explanatory power of estimates is satisfactory with R-squared for the random effects models systematically greater than 0.5. It is worth noting that the Sargan-Hansen test confirms the validity of instruments for all HT estimates. For baseline models (regressions 1 and 2), the Hausman test indicates that HT estimates are to be preferred to RE estimates. The opposite is true for regressions with interaction terms (regressions 3 to 5).
Results for GDP are fully in line with the literature on gravity models for imports. The effect of partner’s GDP on French imports is significant and positive with elasticity values ranging from 0.390 to 1.120, depending on the regression. The influence of population is more uncertain. When significant (regression 1 for HT estimates and regression 2), partner’s population has a positive impact on French imports. In baseline models (regressions 1 and 2), we do not observe any significant impact of the distance variable. However, the distance becomes significant and negative when the time-trend and the interaction term between distance and time-trend are introduced into the gravity model (regression 3). Moreover, this interaction term is significant (at the 1 per cent level) and shows a positive sign. The negative effect of distance on imports therefore diminishes over time. The distance is less of an impediment to imports from distant countries at the end of the period. This main result is fully in line with the classic literature on international trade during the first globalization since in gravity models, distance appears to be a proxy for transaction costs. Yet, according to Jacks et al. (2011) trade costs were declining over the period, promoting international trade and thus imports from distant countries.
Regression 4 includes interaction terms between area dummies and the time-trend. The interaction variable is significant and positive for Asia Pacific indicating that the increase of imports from this area is accelerating over time.
Finally, note that the interaction term between time-trend and partner’s GDP is negative and significant at the 1 per cent level (regression 5). This means that the positive influence of partner’s GDP was decreasing over the period and suggests that France imported relatively less from the most dynamic countries at the end of the period.

New Researchers - Session II / B
160
Table 1.a: Gravity model estimates for French imports, 1850-1913

New Researchers - Session II / B
161
Table 1.b: Gravity model estimates for French imports, 1850-1913

New Researchers - Session II / B
162
Table 2.a: Gravity model estimates for French exports, 1850-1913

New Researchers - Session II / B
163
Table 2.b: Gravity model estimates for French exports, 1850-1913
4.2 Results for exports
Regression estimates for French exports are presented in table 2. The quality of adjustment is better than for imports with R-squared greater than 0.7 for regressions 2 to 5. The Sargan-Hansen test shows that instruments are valid in the HT procedure. Results for the Hausman tests show that RE estimates are to be preferred for regressions 1, 2, 4 and 5 while HT estimates are to be preferred for regression 3.
Broadly speaking, results for GDP and population are consistent with the literature. The effect of GDP is significant and positive. Coefficient estimates range from 0.488 to 1.333. We also note a significant and negative impact of partner’s population on bilateral exports. The distance variable also has its expected negative impact and is significant in all regressions with the exception of HT estimates for the baseline model (regression 1). The negative influence of distance on bilateral exports is more evident for RE estimates with coefficients that are significant at the 1 per cent level (compared to the 5 or 10 per cent level for HT estimates). When significant, coefficient estimates for the distance variable are quite volatile insofar as they range from -0.557 to -2.353.
The inclusion of an interaction between the time-trend and the distance variable (regression 3) gives additional information on the effect of distance. For the HT model (i.e. the preferred model for regression 3), the distance is significant (at the 10 per cent level) and

New Researchers - Session II / B
164
negatively associated with French exports. Furthermore, the negative sign for the coefficient on the interaction term between time-trend and distance (significant at the 1 per cent level) means that the negative impact of distance on exports from France strengthens over time. This conclusion is strictly opposite to that described above for imports and suggests that at the end of the period the distance appears to be more of an obstacle to exports to distant countries than to imports from them. It means that despite the fall in transaction costs, France still had difficulty in reaching distant markets.
Regression 4 refines this result by introducing area dummies and interaction terms between the time-trend and area dummies as control variables. The French exports to Latin American countries and the USA are increasing but the increase appears to be less dynamic at the end of the period as evidenced by the negative and significant sign on the interaction terms between time-trend and these two area dummies (significant at the 1 per cent level).
Regression 5 introduces an interaction term between partner’s GDP and the time-trend. If partner’s GDP is a significant positive determinant of French exports, the fact remains that the GDP effect is reduced over time (negative coefficient on the interaction term), indicating that fewer French exports are destined at the end of the period to the most dynamic countries in terms of growth rate.
5. Conclusion
This paper uses an original database and a standard gravity model approach to test the influence of distance on French international trade. As expected, distance has a globally negative impact on trade. As far as imports are concerned the negative impact decreases over time, however, for exports the negative impact strengthens. It seems that France did not take advantage of the globalization that was occurring at the end of the period as it did not intensify its exports to emerging countries that were enjoying rapid economic growth (USA, Japan or Argentina). Finally, French exporters fail to establish themselves on distant emerging market whereas these countries obtain new market shares in France. References
Bairoch, P. (1993), ‘La France dans le contexte international: politique commerciale et commerce extérieur 1890-1990’. In Le commerce extérieur français de Méline à nos jours, Paris, CHEFF, pp.3-33.
Brun, J.F., Carrère, C., Guillaumont, P. and De Melo, J. (2005), ‘Has distance died? Evidence from a panel gravity model’, The World Bank Economic Review, 19(1), pp.99-119.
Egger, P. H. (2002), ‘An econometric view on the estimation of gravity models and the calculation of trade potentials’, The World Economy, 29(2), pp.297-312.
Egger, P. H. (2005), ‘Alternative techniques for estimation of cross-section gravity models’, Review of International Economics, 13(5), pp.881-891.
Hausman, J.A. and Taylor, W.E. (1981), ‘Panel data and unobservable individual effects’, Econometrica, 49, pp.1377-1398.
Jacks, D.S., Meissner, C.M. and Novy, D. (2011), ‘Trade Booms, Trade Busts and Trade Costs’, Journal of International Economics, 83(2), pp.185-201.
Mayer, T. and Zignago, S. (2011), ‘Notes on CEPII distances measures the Geodist database’, CEPII Working Paper, n°15.
Martinez-Zarzoso, I. and Nowak-Lehmann, F. (2003), ‘Augmented gravity model: An empirical application to Mercosur-European Union trade flows’, Journal of Applied Economics, 6(2), pp.291-316.
Tinbergen, J. (1962), Shaping the world economy: Suggestions for international economic policy, New York, The Twentieth Century Fund.

New Researchers - Session II / C
165
The macabre and Micawberish: economic lives of Punjabi cultivators, 1900-47
Atiyab Sultan, University of Cambridge
([email protected]) Supervisor: Professor Christopher Alan Bayly
The spectre of landless, indebted peasants loomed large on the administrative and policy horizon in early twentieth-century Punjab. Conquered in 1849 at the tail-end of imperial expansion in the sub-continent, the province of Punjab soon became the premier site for colonial attempts at social and economic engineering in India. The many advances including the building of the world’s largest canal irrigation network, expansion of railways and communications infrastructure, rapid gains in agricultural productivity and a wholehearted attempt at administrative reform, were blemished by increasing reports of an impoverished peasantry in the late nineteenth century. Millions of poor peasants had become landless after failing to repay usurious moneylenders for loans on which the land was the collateral. As senior officials refused to take action against what they believed was a natural phase of economic development, several junior, district-level officers who were not so enamoured of the doctrine of laissez faire became convinced that remedial legislation was necessary. The most dramatic expression of this was the publication of a book titled Mussulmans and the Moneylenders by S.S. Thorburn, a district officer stationed in the Dera Ismail Khan district of the province, in 1884. Having earlier had his concerns swept aside by his superiors, Thorburn travelled to London to have his case heard and published his statistical findings on indebtedness and large-scale land transfers in the Punjab. After a further fifteen years passed in wrangling and cross-talk against a backdrop of peasant riots, the Punjab Alienation of Land Act was passed in 1900. This Act prohibited the outright transfer of land from agricultural castes to non-agricultural castes and was therefore intended to check the power of the generally urban moneylenders.
This paper studies economic lives of cultivators in the Punjab after 1900, focusing on the provision of cooperative credit in particular. It is drawn from a longer chapter on household income and consumption in the Punjab. It soon became apparent that the Alienation of Land Act was not a panacea as landlords started lending out larger sums themselves, thereby supplementing their own land holdings when the indebted peasant defaulted so the condition of the poorer peasants remained precarious. This scenario provided the perfect opportunity for the youthful enthusiasm of particular colonial officials to be translated into innovative policy cures including the introduction of cooperation. However, the cooperative movement met an inglorious fate despite the passionate exertions of these officers. In some ways, it reflected the larger failure of ‘developmental policy’ in the Punjab which had arguably caused the scourge of indebtedness in the region in the first instance. Indeed the existing literature on the Punjab is a reverberating tome of accounts of the malign state structure benefiting the parasitic landed elite, military officials and the colonial coffers.361 However, there is value in plucking the eye of cooperation from this malfunctioning leviathan and examining this failed exercise in closer detail, because of the intimate way cooperation touched the everyday economic lives of individuals in the Punjab. This also allows one to think beyond the meta-narrative of ‘institutional and state-level weaknesses’ to examine a tangible example of attempted redress and reform. What are often ossified as institutional weaknesses are instead analysed for their precise role in altering incentives and decision-making on an individual level, the specificity allowing one to pierce the often vague nature of the discourse on ‘institutions’.
361 A vivid account of this is in Imran Ali’s seminal Punjab under Imperialism. (Princeton, 1988).

New Researchers - Session II / C
166
Cooperative credit and financial behaviour
Large-scale peasant indebtedness was not unique to the Punjab and the worst peasant riots and disturbances in this regard were arguably seen in the south of India in the late nineteenth and early twentieth centuries. Cooperation as a tool of economic reform was also first used in the south. In the Punjab, the Cooperative Credit Societies Act was passed in 1904 and later the passionate efforts of several colonial officers, most notably Malcolm Darling, C.F. Strickland and Henry Calvert, allowed the rapid growth of the cooperative movement in the province. At the time, the Punjab was divided into five divisions, each administered by a commissioner and these divisions were further divided into 29 districts, under the control of a district commissioner. The opening of the first cooperative societies in the Punjab drew mixed responses from British officials. Furthermore, no financial assistance from the government was given to any society and it was expected that they be self-financed from the beginning. Despite these humble and unpromising beginnings, by 1906 the number of registered societies had increased to 151 and by 1907, 328 societies were declared to be in full working order. Figure 1 shows the large increase in the number of cooperative societies and their members during the first twenty-five years of their operation. By 1913, some of the Native states including Bhawalpur, Poonch and Kashmir, showed interest in starting cooperative societies there.
Figure 1a: Growth in the number of cooperative societies in the Punjab, 1906-38
Figure 1b: Growth in the number of members of cooperative societies in the Punjab, 1906-38

New Researchers - Session II / C
167
The increase in numbers was accompanied by a diversification in the objectives of the
cooperatives that soon expanded from being purely financial institutions giving loans to the peasants, to cultivating a more holistic vision of ‘economic development’ in the province or what was referred to as ‘material and moral progress’. As early as 1910, the cooperatives had started trading goods like agricultural machinery, wood, cattle and other merchandise. At Panjawar in Hoshiarpur district, the societies were used to prevent land erosion and in Jullundur, they served to start a scholarship for a secondary school. In some districts they became the panchayats, informal village institutions for settling petty disputes.362 By 1919, many commodities were being sold through cooperatives specifically designated Supply and Distribution societies. The goods sold included salt, cloth, oil, seed and foodstuffs. In Gurdaspur, a poultry society was started in the same year which was deemed a success after it sent 1,000 eggs in a month to a supply society ‘and though they have had to travel 52 miles in an ekka only two have arrived broken and not more than six were bad’.363 Two years later, in 1921, societies had been established for diverse groups and purposes including tongawallas, cattle and sheep breeding, mare insurance, day school, ladies knitting and post office.364
Proponents of the movement saw it is a key means of revolutionizing the village economy and pointed towards the productive uses of the debt incurred by proprietors through the cooperatives. Between 1919 and 1929, cultivators used the loans for constructing over 27,000 masonry wells and bringing 750,000 acres of virgin land under cultivation.365 Perhaps the biggest testimonial in favour of cooperatives was their impact on reducing indebtedness. A survey in 1919 on the working of 140 societies in fourteen districts founds that out of 6,740 members, 28 per cent were entirely free of debt, having paid off Rs 17 lakhs of debt, leaving behind Rs 11 lakhs.366 The undoing of the movement-institutional practices
Despite the salutary effect of many efforts undertaken in the name of cooperation in the Punjab, even its most ardent supporters would not call the experiment a success. In 1947 when the British left India, the movement reached less than a tenth of the population of the Punjab and seemed to have had little lasting impact on reducing indebtedness. The year 1947 also signalled the partition of the Punjab with the eastern declared part of India and the western half of Pakistan. The two countries embarked on divergent policies in their respective halves. Indian Punjab quickly underwent large-scale land reforms and was divided into several smaller provinces whereas in Pakistan, the Punjab emerged as the preponderant province, home to the feudal, military and bureaucratic elites that would dominate Pakistani politics. In both cases, the cooperative effort slowly petered out but the rot had started even in the colonial era. This section explores some of the everyday practices and institutional distortions evident in the operations of the movement while the next section explores some deeper political and ideological causes underlying the failure.
One of the most important reasons for the limited impact of cooperation was the paucity of staff and resources. In 1907, the regular staff of the registrar included a personal assistant and a clerk only, though it was ‘suggested’ that three inspectors should be recruited from naib-tehsildars and clerks. By 1909, the staff had increased to three trained inspectors and two experienced clerks. The staff were to be given low salaries even though this meant that it would be impossible to find qualified people to provide assistance forcing the registrar
362 Remarks by R. Humphreys, Secretary to the Government, Punjab in: Notes on the working of cooperative
credit societies in the Punjab for the year ending 31st July 1910. 363 Report for 1919, p.15. 364 Report for 1921, p.6. 365 The Cooperative Movement in the Punjab by Ata Ullah, p.49. 366 Report for 1919, p.21.

New Researchers - Session II / C
168
to look for volunteers who might be willing to help the government.367 By 1913, the obsession with reducing operational costs was showing results and the annual cost to government of running a society had declined from a paltry Rs 51 per year in 1905 to a miniscule Rs11-12, most of the reduction achieved by charging the costs of administration to the members. Even this cost seemed onerous however as the financial commissioner in his remarks on the reported noted that ‘Though it is satisfactory to find the societies beginning to undertake some part of the burden, still I think they ought to contribute considerably more than they do’.368 These economies were won at the cost of foregoing regular inspections and many societies existed without having been examined by an official even once. By 1916, the impact of this was felt in the rising liquidation of societies with 104 societies ceasing operations in 1915-16. The primary reason cited was the lack of staff, some societies having persisted for 3-4 years without a single visit by an inspector – others had never been inspected at all. In the Jullundur and Hoshiarpur districts, there were only two inspectors for 900 societies in 1916.369
Limited monitoring allowed corrupt practices within the societies, as the more unscrupulous saw opportunities for rent-seeking. As early as 1916, the case of a retired Tahsildar was reported who founded a society and proceeded to lend to himself all the assets of the society to purchase land in his name. At the same time, a growing tendency among some society heads to give loans to their family members and friends emerged, with the infrequent inspections allowing such practices to go largely unreported.370 In 1936, 359 cases of dishonesty were reported371 and in the following year, a liquidator in Multan was accused of 19 different cases of embezzlement.372
An important failing was the unwillingness to hold the land revenue demand responsible for indebtedness. The colonial narrative on indebtedness in the Punjab squarely blamed the extravagant and illiterate peasant for his inability to stay afloat in a monetized economy. This denial was in the face of financial evidence that contradicted the official position. Cooperative societies for instance were tasked with noting the purpose for which a borrower was taking a loan. For most of the period between 1905 and 1938, payment of land revenue is cited as the reason in 20-25 per cent of the cases, while marriages, funerals and other ceremonies account for no more than 6-8 per cent of the loans. 25-30 per cent of the loans were for repayment of existing debt, while cattle and agricultural implements form the remainder. Officials went so far as to discount the reported statistics with the financial commissioner remarking in 1914 that what was cited as a loan for the payment of land revenue (21 per cent in the previous year) was ‘in rural parlance an expression used to cover many other purposes which the borrower does not care to define more precisely’.373
The cooperative effort was also pervaded with ambiguity and ambivalence. Officers had varying conceptions of what cooperation meant and could do, some seeing it as an unnecessary encumbrance on government, some viewing it as a cost-free means of reducing indebtedness and the more passionate officers viewing cooperation as transforming the very habits and lifestyles of peasants. Aside from this spectrum of definitions, there was an anxiety that successful cooperation might lead to a burgeoning support for socialism, or in the years leading up to the First World War, to support for the Caliphate in Turkey. Members of the movement were predominantly Muslim in the initial years of the movement, a fact which fuelled these fears. Equally important was the concern that cooperation might breed forms of collective action that may challenge the status quo e.g. during the Akali movement of the
367 Report for 1909, p.11. 368 Report for 1913, p.1. 369 Report for 1916, p.3. 370 Report for 1916, p.3. 371 Report for 1936, p.47. 372 Report for 1937, p.51. 373 Report for 1914, p.2.

New Researchers - Session II / C
169
1920s, a rural movement organized by the Sikhs in the Punjab, officials cancelled a society they feared was helping the agitators, sending five of its eleven members to jail.374 Conclusion
An analysis of the institutional design and workings of the cooperative movement crystallizes many of the issues pervading developmental policy in colonial Punjab. Cooperation also allows the examination of how institutional changes impact everyday financial behaviour. I argue that despite the loaded rhetoric which imbued cooperation with transformational properties, including the cultivation of ‘thrift and good character’ among Punjabi peasants, the movement was poorly financed by the government, opposed at the highest levels, starved of resources and used as a ‘palatable’ form of communism to accommodate and absorb socialist sentiments before being ultimately neglected and left to collapse.
More importantly, the movement echoes the conflict between various tiers of bureaucratic machinery over the meaning and purpose of economic reform in the province and provides valuable insights into what is meant by institutional failure. It links to recent interest in the subject of examining institutions not as the veritable manifestations of the policy documents that propose them, but as dim reflections of the blueprint. In doing so, I engage with scholarship that holds weak and extractive colonial institutions as responsible for the long-run underdevelopment of post-colonial economies. Institutional failure must not be understood purely in terms of the consequences it produces e.g. corruption, continued malaise, ineffectiveness, etc but the weaknesses of institutional design may be studied in light of the policy debates that predate its operationalization and cast a shadow over implementation. The policy prescription that emerges then is less a statement of institutional overhaul or the pessimistic observance that colonial institutions are ubiquitously extractive and everlasting, but more a recommendation for pest-control in tackling specific distortions built into an institutional mechanism. Institutions are neither almighty nor eternal, but merely the sum-total of individual choices that may be revised and improved upon. Institutional perpetuity is therefore a case of the dynamic espousal and continued support for specific unsavoury practices, laws and lacunae.
The limited success of the cooperative movement in the Punjab is indicative of the larger failure of developmental policies in the region under colonial rule. Despite the rich rhetoric, which referred to the brotherhood of men, social equality, inculcating better farming and living habits, etc, the movement remained peripheral and marginal in its impact. There were several reasons for this but perhaps the most significant ones sprang from the official machinery itself where there was a plethora of meanings attached to the word cooperation and what the movement entailed. A central question was whether it was a philanthropic device or a financial institution. Many officials were vehemently opposed to the idea of engaging with the peasant at such a deep and intimate level, considering it an unnecessary millstone for the government. Others were passionate about the movement but with both types of officials manning the administration at various levels, schemes were started and then abandoned when left in the hands of a less passionate officer. A major impediment was the cultural stereotyping involved which looked upon the peasant as inherently wasteful and incapable of redemption. Ultimately the movement failed to alleviate indebtedness in a real sense in the province. Nevertheless, the exercise can still yield useful insights on the working of institutions and the capacity and constraints on institutional reform.
374 Report for 1924, p.4.

New Researchers - Session II / C
170
After empire comes home: economic experiences of Japanese civilian repatriates to Hiroshima, 1945-56
Sumiyo Nishizaki, London School of Economics
([email protected]) Supervisor: Professor Janet Hunter
The economic impact of large influxes of population is a complex topic that has been much debated. This research contributes to those debates by examining one of the most significant, but least researched, examples of postwar migration – the repatriation of more than six million (including three million civilians and demobilized soldiers each) to Japan after World War II. One pervasive image of Japanese civilian repatriates is that of the immigrant farmer of Manchuria who settled as a part of Japan’s Manchurian policies and had difficult repatriation experiences under the hostility of local people. However, many returned from other regions as well, including Korea and Sakhalin, and repatriates consisted of not only farmers but also colonial government officials, employees of public and private corporations, small business owners, teachers, and priests, amongst others. This paper specifically focuses on approximately 110,000 civilian repatriates living in Hiroshima prefecture in 1956 and their occupational changes during this time of economic transition.
Figure 1 Number of repatriates by regions, 1945-95 (in thousands)375
Existing literature and research questions
Although there are many books and essays about Japan’s postwar returnees, the majority focus on their difficult experiences during the journey home following the surrender, or the social problems they faced. The few academic research papers on the returnees’ postwar occupations include a short ten page essay by Konosuke Odaka.376 However, this is a brief 375 Ministry of Health and Welfare, 'Hikiage to Engo Sanjunen No Ayumi (a Thirty Year History of the
Repatriation Programs)', (Tokyo: Ministry of Health and Welfare, 1977), 690. The map was created by the author.
376 Konosuke Odaka, 'Hikiagesha to Senso Chokugo No Rodo Ryoku ( the Japanese Labor Force Immediately

New Researchers - Session II / C
171
essay based on the 1950 National Census377 and the 1950 Records of Repatriation Programmes,378 and offers only limited analysis. In English, Lori Watt’s When Empire Comes Home (2009)379 explores repatriation experiences and the discrimination postwar returnees faced. However, she focuses only on farmers who returned from Manchuria and not on their postwar jobs.
Several other works on Japanese civilian repatriates have limited information on specific groups’ postwar occupational transitions, including telecom engineers repatriated from Manchuria and merchants from Dalian. However, these authors’ main interests lie in people’s wartime activities or the repatriation process itself and they give limited analyses on repatriates’ postwar lives. In general, repatriates’ occupational transitions have yet to be studied systematically. Further research will therefore bring new insights into the three million civilian returnees’ occupational transitions in postwar Japan. This presentation seeks to address the following questions:
How were the civilian returnees absorbed into the postwar economy in Hiroshima? Did the postwar situation in Hiroshima, specifically the destruction of Hiroshima city,
affect the repatriates’ settlement?
Source materials
As a core source material, this research uses a national survey into the repatriates’ postwar lives (Zaigai Jijitsu Chōsahyō)380 conducted by the government in 1956. The questions for each family member included name, sex, date of birth, the dates of emigration and repatriation, and whether or not he/she received public aid in 1956. In addition, the household head was required to include the length of his/her overseas residence, four addresses (an address in Japan where the family was registered,381 a foreign address at the end of the war, the first address after repatriation and the one at the time of the survey in 1956), and wartime and postwar occupations and employers.
I have collected the survey responses for four prefectures, but this paper specifically focuses on Hiroshima, a longstanding source of Japanese migrants, in order to fully analyse the postwar experiences of both colonial settlers to Taiwan, Korea and Manchuria, and those who migrated as a part of national policies (including employees of public corporations such as the South Manchuria Railway) especially after the 1930s. In addition, the destruction after the atomic bomb attack imposed significant challenges for the reconstruction of the Hiroshima city region, and this paper will analyse how this situation affected the resettlement of repatriates in the region and how repatriates themselves, as well as the government, responded. In order to track Hiroshima repatriates’ occupational transitions, this paper examines the profiles of 600 randomly selected households repatriated to Hiroshima, out of 18,396 people who participated in the 1956 survey.
after the Second World War ) ,"Tokyo Daigaku Shakai Kagaku Kenkyu 48(1) (1996).
377 Statistics Bureau of Japan, Population Census of 1950, 8 vols. (Tokyo: Bureau of Statistics, 1954). 378 Ministry of Health and Welfare, 'Hikiage Engo No Kiroku (Records of Repatriation Programs)', (Tokyo:
Ministry of Health and Welfare, 1950). 379 Lori Watt, When Empire Comes Home : Repatriation and Reintegration in Postwar Japan, Harvard East
Asian Monographs (Cambridge, MA: Harvard University Asia Center, 2009). 380 Ministry of Health and Welfare, 'Zaigai Jijitsu Chōsahyō (Japanese Government Survey into Repatriates’
Post-War Lives)', (1956). 381 In Japan, each family is required to register with a local government office in their hometown. The
information reported includes each family member’s name, date of birth and relationship with the household head.

New Researchers - Session II / C
172
Hiroshima prefecture
Hiroshima prefecture is located in western Japan. The prefecture historically has had a large population,382 partly due to a prevalence of a Buddhist faction Jodo shinshu which prohibited abortion, a traditional means to control population, in pre-modern Japan.
Figure 2: Location of Hiroshima383
Population pressure led to continuing emigration to other regions, mostly in the form
of temporary workers. After the Meiji Restoration in 1868, the destination of Hiroshima migrants expanded to include foreign countries, first Hawaii and then Taiwan and Korea after Japan colonized them in 1895 and 1910. Within the prefecture, two military bases were located in Hiroshima and Kure cities and military industries occupied important places in the prefecture. Civilian repatriates in Hiroshima prefecture
According to the Hiroshima city government, it is estimated that the atomic attack in the city of Hiroshima on 15th August 1945 killed approximately 140,000, roughly 40 per cent of the city’s population.384 The destruction together with the demilitarization of industries in Hiroshima and Kure cities created significant problems, which could have made the influx of repatriates particularly challenging. According to Koseitokei geppo,385 the repatriate population in the prefecture in November 1949 was 113,899. In Hiroshima prefecture, about 65 per cent responded in the 1956 national survey that they had first settled at the address where their families had been registered (honsekichi) or in the same town or village. The figure for those whose family was registered in Hiroshima city is lower at 57 per cent, which indicates their loss of families or housing. However, still more than half returned to Hiroshima city after the repatriation. Many who had no place to settle first lived in repatriate accommodation or temporary barracks and engaged in black market activities to support their lives. 382 According to the Statistics Bureau of Japan, for example, 0.9 million people were registered in Hiroshima
prefecture in 1872, which was the largest figure among all prefectures. 383 Encyclopedia Britannica, Britannica Kids (Http://Kids.Britannica.Com) (Chicago: Encyclopedia Britannica,
2014). http://kids.britannica.com/elementary/art-138999/Hiroshima-western-Japan-designated-a-UNESCO-World-Heritage-site-in. Accessed on 16 Dec 2014.
384 Hiroshima City, Genbaku to Heiwa (the Atomic Bomb and Peace) (Hiroshima: Hiroshima City, 2014). http://www.city.hiroshima.lg.jp/www/contents/0000000000000/1111638957650/. Accessed on 15 Dec 2014.
385 Ministry of Health and Welfare, "Monthly Bulletin of the Welfare Statistics (Kosei Tokei Geppo)," (Tokyo: Ministry of Health and Welfare, April 1947 to November 1949). This is a monthly report published by the Ministry of Health and Welfare.

New Researchers - Session II / C
173
While Hiroshima prefecture suffered destruction, its wartime experience and subsequent postwar problems were not unique. For example, many other urban cities in Japan suffered tremendous damage from American air raids during the latter stage of the war, and wartime industries had to be dissolved or converted to civilian businesses. Moreover, as with many other prefectures, Hiroshima prefecture consisted of not only urban cities but also much wider agricultural regions where an excess population could retreat. In terms of civilian repatriates’ wartime experiences, in addition to a large number of colonial settlers, Hiroshima prefecture also had a significant number of former colonial public servants and employees of wartime public corporations as shown in figure 4 who tended to possess relatively higher education levels.
Figure 3: Population in each sector in 1950 (%)386 Japan Hiroshima prefecture Tokyo
Agriculture 48.3 48.0 6.4 Industry 21.9 22.2 37.1 Services 29.8 29.8 56.5
Figure 4: Wartime sectors of Hiroshima repatriates (%)387
Agriculture, forestry and fishery 8.5 Manufacturing 14.1
Mining 1.8 Construction 5.5
Transport, communication, utilities 21.7 Finance and real estate 2.1 Retail and wholesale 16.5
Services 14.1 Public services 14.8
Others 1.0 Total 100.0
Whilst it is evident that for many repatriates the postwar transition was not entirely
smooth, the evidence presented in this research suggests that repatriates’ postwar resettlement was facilitated by a) employment in family farming or postwar reclamation, b) the government’s employment policies (employment at government offices and qualification-based employment such as teachers and doctors by allowing transfer of foreign licences to postwar Japan) or c) the transferability of repatriates’ skills or previous experiences, especially in the case of wartime public servants, and employees of major public and private corporations such as those from the South Manchurian Railway.
According to the Population Census of 1950, Japan was still an agrarian country, with approximately half of the entire working age Japanese population (those older than 14 years old) in the primary sector. As figure 5 shows, the number for repatriates working in the primary sector across Japan was much smaller, at 32.8 per cent. As previously mentioned, many repatriates first settled in their hometowns. It is not clear how many were actually engaged in family agriculture in the early postwar period; however, according to the 1956 survey, 7.5 per cent of repatriates in Hiroshima prefecture were still in family farming. Together with another 1.9 per cent who were in the postwar reclamation which was implemented by the government to absorb displaced people and to increase food production,
386 Office of the Prime Minister, 'Summary of the Results of 1955 Population Census of Japan', ed. Bureau of
Statistic (Tokyo1960), 532-3. 387 Ministry of Health and Welfare, 'Zaigai Jijitsu Chōsahyō (Japanese Government Survey into Repatriates’
Post-War Lives)'. The table was created by the author.
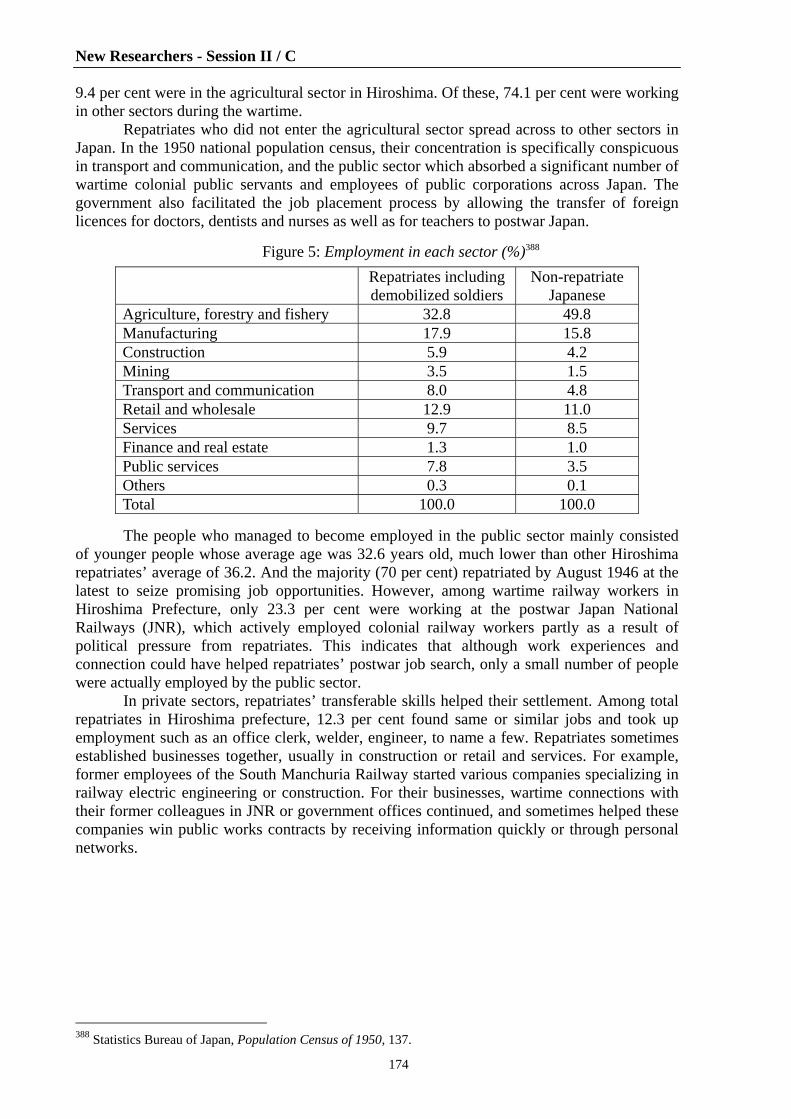
New Researchers - Session II / C
174
9.4 per cent were in the agricultural sector in Hiroshima. Of these, 74.1 per cent were working in other sectors during the wartime.
Repatriates who did not enter the agricultural sector spread across to other sectors in Japan. In the 1950 national population census, their concentration is specifically conspicuous in transport and communication, and the public sector which absorbed a significant number of wartime colonial public servants and employees of public corporations across Japan. The government also facilitated the job placement process by allowing the transfer of foreign licences for doctors, dentists and nurses as well as for teachers to postwar Japan.
Figure 5: Employment in each sector (%)388
Repatriates including demobilized soldiers
Non-repatriate Japanese
Agriculture, forestry and fishery 32.8 49.8 Manufacturing 17.9 15.8 Construction 5.9 4.2 Mining 3.5 1.5 Transport and communication 8.0 4.8 Retail and wholesale 12.9 11.0 Services 9.7 8.5 Finance and real estate 1.3 1.0 Public services 7.8 3.5 Others 0.3 0.1 Total 100.0 100.0
The people who managed to become employed in the public sector mainly consisted
of younger people whose average age was 32.6 years old, much lower than other Hiroshima repatriates’ average of 36.2. And the majority (70 per cent) repatriated by August 1946 at the latest to seize promising job opportunities. However, among wartime railway workers in Hiroshima Prefecture, only 23.3 per cent were working at the postwar Japan National Railways (JNR), which actively employed colonial railway workers partly as a result of political pressure from repatriates. This indicates that although work experiences and connection could have helped repatriates’ postwar job search, only a small number of people were actually employed by the public sector.
In private sectors, repatriates’ transferable skills helped their settlement. Among total repatriates in Hiroshima prefecture, 12.3 per cent found same or similar jobs and took up employment such as an office clerk, welder, engineer, to name a few. Repatriates sometimes established businesses together, usually in construction or retail and services. For example, former employees of the South Manchuria Railway started various companies specializing in railway electric engineering or construction. For their businesses, wartime connections with their former colleagues in JNR or government offices continued, and sometimes helped these companies win public works contracts by receiving information quickly or through personal networks.
388 Statistics Bureau of Japan, Population Census of 1950, 137.

New Researchers - Session II / C
175
Figure 6: Repatriates’ postwar job experiences389
The findings in this research indicate that approximately 59 per cent of repatriates’ job
placement was supported by the above mentioned three factors: family farming or reclamation (9 per cent), the government’s direct and indirect employment policies (23 per cent), and repatriates’ transferable experiences and skills in the private sector (27 per cent). Another 41 per cent, however, had to find employment in new sectors or ended up being day labourers or unemployed. These people, perhaps usually less-skilled or less-connected, found employment in various sectors, but the largest number of people (47.5 per cent) entered retail and services where entry barriers were usually low, or construction businesses which flourished in the reconstruction and economic growth after the mid-1950s. This was true not only in Hiroshima, but also throughout Japan. Hiroshima prefecture’s industrial production dramatically started to grow in 1951 in the economic boom partly brought by American military procurement orders during the Korean War.390 The wage levels in Hiroshima city were 16.3 per cent higher than those in rural areas in the prefecture,391 which attracted workers from agricultural villages.
The employment of repatriates was not necessarily determined by market forces, and much of their skills and expertise might not have been allocated in the most efficient manner in the postwar economy. It can be argued that this type of relatively smooth transition helped to bring political and economic stability, which became a foundation of Japan’s rapid recovery and subsequent economic growth after the mid-1950s, but the inefficient allocation of workers and redundant labour in agriculture and the public sector, including in government corporations, and small businesses in construction, retail and services, led to the emergence of interest groups that have sought political protection by the Japanese government throughout the postwar period.
389 Ministry of Health and Welfare, "Zaigai Jijitsu Chōsahyō (Japanese Government Survey into Repatriates’
Post-War Lives)." The graph is created by the author. 390 Hiroshima City, Hiroshima Shin Shi: Keizai Hen (History of Hiroshima City: Economy) (Hiroshima City,
1984), 312-13. 391 Hiroshima ken tokei kyokai (Hiroshima Prefecture Statistical Association), Hiroshimaken Shokushubetu
Minkan Kyuyo Jittai Chosa Hokoku (Report on Wages in Hiroshima Prefecture) (Hiroshima ken tokei kyokai (Hiroshima Prefecture Statistical Association) 1952), 6.

New Researchers - Session II / C
176
Bibliography Encyclopedia Britannica. Britannica Kids (Http://Kids.Britannica.Com). Chicago:
Encyclopedia Britannica, 2014. doi:http://kids.britannica.com/elementary/art-138999/Hiroshima-western-Japan-designated-a-UNESCO-World-Heritage-site-in
Hiroshima City. Genbaku to Heiwa (the Atomic Bomb and Peace). Hiroshima: Hiroshima City, 2014.
http://www.city.hiroshima.lg.jp/www/contents/0000000000000/1111638957650/ ———. Hiroshima Shin Shi: Keizai Hen (History of Hiroshima City: Economy). Hiroshima
City, 1984. Hiroshima ken tokei kyokai (Hiroshima Prefecture Statistical Association). Hiroshimaken
Shokushubetu Minkan Kyuyo Jittai Chosa Hokoku (Report on Wages in Hiroshima Prefecture). Hiroshima ken tokei kyokai (Hiroshima Prefecture Statistical Association) 1952.
Ministry of Health and Welfare. 'Hikiage Engo No Kiroku (Records of Repatriation Programs)'. Tokyo: Ministry of Health and Welfare, 1950.
———.'Hikiage to Engo Sanjunen No Ayumi (a Thirty Year History of the Repatriation Programs)'. Tokyo: Ministry of Health and Welfare, 1977.
———.'Monthly Bulletin of the Welfare Statistics (Kosei Tokei Geppo)'. Tokyo: Ministry of Health and Welfare, April 1947 to November 1949.
———.'Zaigai Jijitsu Chōsahyō (Japanese Government Survey into Repatriates’ Post-War Lives)'. 1956.
Odaka, Konosuke. 'Hikiagesha to Senso Chokugo No Rodo Ryoku (the Japanese Labor Force Immediately after the Second World War'. Tokyo Daigaku Shakai Kagaku Kenkyu 48(1) ( July 1996): 135-44.
Office of the Prime Minister. 'Summary of the Results of 1955 Population Census of Japan'. edited by Bureau of Statistic. Tokyo, 1960.
Statistics Bureau of Japan. Population Census of 1950 [in In Japanese, with some prefaces and table headings in English.]. 8 vols Tokyo: Bureau of Statistics, 1954.
Watt, Lori. When Empire Comes Home : Repatriation and Reintegration in Postwar Japan. Harvard East Asian Monographs. Cambridge, MA: Harvard University Asia Center, 2009.

New Researchers - Session II / C
177
Virtues and vices: female workers in the Japanese labour model
Carmen Gruber, Vienna University of Economics and Business
([email protected]) Supervisor: Professor Peter Berger
Introduction
The principal themes of this paper are an examination of the Japanese labour system, with a particular focus on the historical role of women as well as the importance of women in the postwar system. Postwar labour institutions in Japan such as so-called lifetime employment and seniority wages arose out of historical conditions and within a particular historical framework. Although Japan had a period of rapid economic growth and remains one of the world’s largest economies, it has also more recently seen decades of stagnation and increasing criticism for the underutilization of its female labour force.
The female labour force participation rate in Japan has come under increasing scrutiny in recent years, with the Global Gender Gap Report 2011 explicitly stating that Japan makes ‘… inefficient use of the female talent available in the country’.392 This was echoed by a special report on women working in The Economist that calculates a boost to GDP of 16 per cent in Japan from eliminating the remaining gap between male and female employment rates.393
Indeed, the participation rate of women in the Japanese labour force has been fairly consistently low in the postwar period. The Japanese Statistics Bureau reports a labour force participation rate of Japanese women over the age of 15 of 48.5 per cent in 2009.394 Even more noteworthy in the case of Japan is the amazing consistency of this relatively low female labour force participation rate over the past decades: from a rate of 48.6 per cent in 1950, it increased slightly to around 50 per cent in the 1960s, and then fell back down to around 48 per cent where it has hovered since the 1980s.395 This makes Japan a fairly unique member in the club of developed countries, not only due to the low participation rate of females in the labour force, but for the notable lack of change in these numbers through both a period of high economic growth and a period of economic stagnation. Additionally, this corresponds to a period of time in which women in other developed countries substantially increased their labour force participation rates. This paper explores why female labour force participation rates in Japan have remained low. Methodology
This study locates itself primarily within qualitative research methods, though it does also make use of publicly available statistics and labour data collected by various Japanese and international agencies. The primary sources for this data are the Statistics Bureau of Japan, which is housed within the Ministry of Internal Affairs and Communications; employment and labour statistics compiled by the Ministry of Health, Labour, and Welfare in Japan; reports published by the Japan Labour Institute for Policy and Training on Japanese working life and labour laws; statistics and data from both the International Labour Organization and World Bank; and available Global Gender Gap Reports produced every year since 2006 by the World Economic Forum.
392 Global Gender Gap Report 2011. World Economic Forum. p.26. 393 The Economist,‘Women at work: closing the gap’, Nov. 26, 2011. 394 Compare with 68% in China, 58% in United States, 55% in United Kingdom, and 53% in Germany in the
same year. Taken from World Bank data: http://data.worldbank.org/indicator/SL.TLF.CACT.FE.ZS. 395 Statistics Bureau, Japanese Ministry of Internal Affairs and Communications, Chapter 19 Labour and Wages,
Table 19-1: http://www.stat.go.jp/english/data/chouki/19.htm

New Researchers - Session II / C
178
A core portion of the research and analysis presented in this study is based on a series of interviews conducted in Japan with working people over the course of several weeks in early 2014. Fourteen on-site interviews were conducted with Japanese workers in the Kanto and Kansai regions of Japan, which serve to augment the statistical data and introduce Japanese perspectives. Interviewees were found through personal contacts built up over the past nine years, and are neither random nor representative. However, given the time frame as well as the importance of built-up trust and personal relationships in Japanese culture, this was determined to be the best and most feasible method of introducing contemporary Japanese perceptions of the labour and employment market into the research. The interviews were conducted over a period of six weeks, and were all conducted personally by the author. The fact that the author is not Japanese naturally created some methodological problems, which could be partially mitigated by trust built up over years as well as conducting interviews in Japanese rather than English when desired. Nonetheless, the author’s ‘outsider’ status could not be fully overcome. The interviews were subsequently coded and analysed according to the precepts of grounded theory. Historical role of women
While Japan is often characterized as a rather traditional society in terms of male and female societal roles, it is by no means clear what exactly this means. The historical image of the Japanese woman is often associated with that of the geisha or the tea-house girl, both of which existed, but have come to dominate the narrative of Japanese women as submissive and subservient. In fact, despite the patriarchal structures of Japanese society, the status of women in the past was no worse than elsewhere, and in some cases may even be regarded as having been somewhat better; in any case, it was certainly much more varied than the geisha stereotype would suggest.
In contrast to recent criticism regarding the underutilization of women in the modern labour force and lack of female representation in positions of power in Japan, historical records in some cases show rather the opposite reaction to the status of women in Japan’s past. One such case comes from reports that Chinese visitors to Japan during the Heian period (794 AD - 1185 AD) were dismayed at the prominence of women in Japanese society, which seemingly failed to conform to Confucian beliefs of women as subservient to men.396
To some extent, the Japanese shift toward industrialization and the participation of female workers in this process is similar, if later, to that seen in Western Europe and North America. As Kathleen Uno points out, although Japanese village mothers a century ago ‘ … toiled at domestic tasks such as cooking, cleaning, and child care, they also spent long hours cultivating fields and practicing sidelines such as silk reeling’.397 Some evidence of this can be found in old Japanese scrolls, such as those by Kizaki Moritaka depicting everyday scenes in and around the town of Karatsu in today’s Saga prefecture in the 1770s. One such scroll of various activities being carried out near Karatsu depicts both men and women working together to bleach and hang cloth in the Choda River.398 While only women are shown inside the house folding cloth, the outdoor work of washing, drying, and preparing the cloth appears to be done by men and women alike. Scenes in the same region from what is thought to be the first manual for Japanese paper-making, painted in 1784, similarly depict men and women working alongside each other and in some cases engaging in the same tasks.399 A scroll from the modern-day prefecture of Niigata illustrating various activities associated with the mining of gold and silver in 1800, painted by Kano Yusen, also indicates the involvement of 396 Morris, Ivan, The world of the shining price: court life in ancient Japan, Kodansha, 1994. 397 Uno, Kathleen, ‘Women and changes in the household division of labour’, p.18. In: Gail Lee Bernstein, ed.
Recreating Japanese women: 1600-1945, University of California Press, 1991. 398 Cloth-bleaching by water and etc. in Hizen-no-kuni, National Archive of Japan Digital Archive, Scrolls, call
no. 176-009, vol. 8. 399 Papermaking in Hizen-no-kuni, National Archive of Japan Digital Archive, Scrolls, call no. 176-0091, vol. 7.

New Researchers - Session II / C
179
women.400 It is known that Japanese women worked in coal mines from the middle of the nineteenth century, and likely already earlier on a more primitive basis,401 so their presence in and around gold and silver mines is not surprising. Young women also made up the overwhelming majority of textile factory workers in the late nineteenth and early twentieth centuries; their presence in the production of coal and cotton – both of which are seen as important drivers of industrialization402 – put Japanese women at the centre of Japan’s early industrial movement. Role of women in the postwar period
The postwar labour system in Japan has been characterized by lifetime employment, seniority wages, and job rotations. Although lifetime employment only covers about 20 per cent of Japanese workers, this is partially because women and the elderly are almost by definition excluded. These postwar institutions were built around a breadwinner model, and the tacit job guarantee also required long working hours, attending after-work commitments, and job rotations to other, possibly distant, branches of the company. Such a system did not easily accommodate family and household tasks; female labour force participation rates in the postwar period have therefore been characterized by a uniquely M-shaped labour curve, in which women dropped out of the labour force after marriage or childbirth and returned only after the children were raised.
Female workers could therefore be conceptualized as a peripheral labour force that provides the flexibility needed to maintain a stable core workforce, especially in times of significant tension or slack in the labour market. Susan Houseman and Katharine Abraham view women as a buffer in the Japanese economy and to the male workforce, with women bearing a greater share of employment adjustment relative to men in Japan.403 As a result, women have been found disproportionately in part-time, temporary, or ‘non-regular’ work
400 Illustration of work performed in gold and silver mines, National Archive of Japan Digital Archive, Scrolls,
call no. 183-0854. 401 Regine Mathias, ‘Female labour in the Japanese coal-mining industry’, p.98-100. In: Janet Hunter, ed.
Japanese Women working, Routledge, 1993. 402 See Pomeranz, Kenneth, The great divergence, Princeton University Press, 2000. 403 Houseman, Susan and Katharine Abraham, ‘Female workers as a buffer in the Japanese economy’, p.50.

New Researchers - Session II / C
180
which affords them flexibility but also limits upward mobility, since career-track employment and promotion in Japan are closely tied to working hours and job tenure. Thus, taking any kind of leave to have a child or leaving work before others to take care of a child or family member effectively precludes a worker from promotion. Up through the end of the 1980s, when economic growth was rapid, this system worked reasonably well from a purely economic standpoint – men committed themselves to the companies, companies committed themselves to male workers, and women took up the slack in the labour market and took over household tasks. However, since the onset of economic stagnation, the ability of firms to provide job security has become more tenuous; despite this, institutional rigidities have not loosened significantly. Rather, Hiroshi Ono and others have shown that lifetime employment has consolidated itself around an elderly, male core of regular workers.404 Current outlook
Given the state of the Japanese economy, why haven’t women moved in greater numbers into the Japanese labour market, and why have they not seen the kind of upward mobility evident in other countries? What accounts for the persistence of labour rigidities in the Japanese workplace? A series of interviews with Japanese workers highlights the obstacles and pressures faced by both men and women in the Japanese labour force.
Interview respondents pointed on one hand to long working hours and to the difficulty of taking leave if one wants to advance one’s career:
But it doesn’t mean that not-known companies have shorter working time. Every company has long time … 405 It never happens [leaving work on time]…I think he or she, in general he, will have another present on the next day… like an extra job…yeah I think so, because that’s what I got. I said I have to go… I left the office at 6 but the next day around half past 5 or quarter to 6, my boss, he called me and said ‘hey, um, can you do this, this, and this for me?’ That means you can’t say no.406 Hmmm, the system of paternity leave does exist in Japan, but it’s almost a legend. If someone takes it, he will be in the newspaper… well companies are encouraging it on paper, but their faces say no. 407 We can take leave theoretically, but in reality companies say ‘Why? You have a wife! We’re busy!’408 They set a tone that the company has a childcare leave system but that it is difficult that you take advantage of that system. This tone lets her think that she should quit.409 If an ordinary housewife wants to work, child daycare centres are limited and the cost is high. What do they work for?410
Although only a small sample of interview responses, these comments highlight some
of the main issues brought up by most interviewees. Japanese companies continue to require long working hours from employees, and leaving ‘early’ (at 5 or 6pm) results in extra work or lost opportunities for promotion. This dovetails with Japanese conceptions of hard work, as illustrated by the following analogy:
404 Ono, Hiroshi, ‘Lifetime employment in Japan: concepts and measurements’, p.35. 405 MO Interview, 14 Feb. 2014, p.7. 406 SS Interview, 11 Feb. 2014, p.6. 407 MO Interview, 14 Feb. 2014, p.2. 408 MK Interview, 1 Feb. 2014, p.13. 409 HN Interview, 9 Feb. 2014, p.9. 410 RS Interview, 22 Feb. 2014, pp.8-9.

New Researchers - Session II / C
181
I was in badminton club in university and ... 4 times a week everybody has to come to the gymnasium. And if a person doesn’t come to the gymnasium, even if she’s contributing to the team, even if she wins, people will think she is not working.411
Kumiko Nemoto also points to long working hours as being at the core of Japan’s
masculine working culture.412 Additional obstacles are the difficulty in taking childcare leave, especially for men
despite being legally entitled to take such leave. Laws regulating equal employment and childcare leave were introduced in 1986 and 1991 respectively, but with little punishment for non-compliance. Nonetheless, men are pressured out of taking childcare leave, with wives expected to take up this task, though they too may face pressure. There appears to be a substantial disconnect between official policy and actual reality with regards to childcare leave. Additionally, even in the event that women want to return to work after a leave of absence, a lack of childcare facilities makes this difficult. Conclusion
Rather than greater labour market integration of women into the Japanese labour market over the past decades, both labour statistics and on-site interviews with Japanese workers indicate that there has been increasing segmentation between and amongst female workers. Thus, despite more women remaining in the labour force over the past years, which has led to a flattening of the distinctly M-shaped Japanese female labour curve, this has not been accomplished by structural reforms in employment practices but rather through intra-female segmentation into career-oriented and family-oriented women. The proportion of women who drop out of the labour force after the birth of their first child has actually increased rather than decreased over time413; the increase in women remaining in the labour force reflects rather that a growing number of women are forgoing marriage and children altogether. As such, structural barriers to female employment in Japan have not been broken down. Instead, women must choose to either adopt masculine work norms of long hours, job rotations, and limited leave from work or to drop out of the regular workforce either entirely or into non-regular work with its attendant instability, depressed wages, and lack of upward mobility. Although lifetime employment has only ever covered something like a quarter of Japan’s working population, the system remains intact for a specific group of core workers, and the working norms upon which the system is based continue to permeate employment expectations in Japan. Although female workers have played and continue to play an important role in the Japanese labour force, large structural impediments such as long working hours, difficulty of taking childcare leave, lack of kindergartens, and socio-cultural gender norms discourage women from greater labour force participation and impede upward mobility. This imposes not only a drag on the Japanese economy but also has disquieting implications for Japan’s demographic decline, since women are effectively forced into a binary decision of either career or family.
411 MO Interview, 14 Feb. 2014, p.9. 412 Nemoto, Kumiko, ‘Long working hours and the corporate gender divide in Japan’. p.520-4. In: Gender,
Work, and Organization, 20(5), pp.512-527, 2013. 413 MHLW, ‘Equal Employment and Child Welfare’, p.173. http://www.mhlw.go.jp/english/wp/wp-
hw6/dl/07e.pdf

New Researchers - Session II / D
182
Electricity and the jobless recovery from the Great Depression
Miguel Morin, University of Cambridge
([email protected]) Supervisor: Professor Ricardo Reis
The weak recovery from the Great Depression in the United States remains a puzzle: in the words of Kehoe et al. (2008), “a satisfactory theory of the US Great Depression ... needs to explain why hours ... stayed so depressed [after 1933] even though productivity recovered.” Explaining the joint dynamics of employment, output, and productivity in the recovery from the Great Depression is crucial to our understanding of the economy during bad times, which has implications for policy. For example, Cole et al. (2004) suggested that the cartelization policies of the National Industrial Recovery Act kept wages high above trend and may have delayed the recovery of employment. Alternatively, Reinhart et al. (2009, page 270) emphasize that the recovery from a global financial crisis such as the Great Depression is weaker than a regional crisis because “for a country to be ‘pulled’ out of a post-crisis slump is far more difficult when the rest of the world is similarly affected than when exports offer a stimulus”. These explanations have different implications for policy-making in difficult times.
This paper takes an alternative route and asks whether the adoption of electricity can explain the jobless recovery from the Great Depression. It builds on a previous paper (Morin, 2014), that used geography as an instrument for electricity adoption and found that, in reaction to cheaper electricity prices, firms reduced employment and the labour share of income and increased productivity and capital intensity. Rather than the medium-term implications, this paper looks at the cyclicality of employment and productivity changes, especially over the period 1933-35. The baseline results are that the adoption of electricity can account for both facts of low job creation and high productivity growth during the recovery from the Great Depression.
The identification strategy follows from Morin (2014) and consists of two parts. First, it uses natural variation in the price of electricity depending on the power source – hydro power or coal power. Hydroelectric power was highly efficient from the beginning and extracted 90 per cent of the potential energy of falling water, leaving no margin for technological improvement. States like California have cheap electricity but the price of electricity is constant. Coal power was relatively inefficient and extracted 25 per cent of the thermal energy of coal, leaving a wide margin for technological progress. States like New Jersey have expensive electricity but the price of electricity is falling. A state’s initial loading on the coal technology is an instrument for changes in the price of electricity.
The second part of the identification strategy consists of choosing the concrete industry to provide measurements of labour market outcomes. Given the natural variation in electricity prices, it could still be a problem if plants chose endogenously to locate in regions with cheaper electricity prices. The concrete industry provides a close approximation to the ideal random assignment of plants across regions. It is a local industry selling a non-traded good (Syverson, 2004): downstream of the cement industry, it produces heavy products with high transport costs or a limited time to reach its destination (e.g., ready-mix concrete has to be delivered in a few hours before it hardens). Accordingly, concrete is among the most spatially dispersed industries. The non-traded quality of concrete products ensure that this industry locates near its customers, as opposed to industries selling traded goods and able to choose their location. Concrete plants locate in New Jersey or California to be close to their customers, after which they react to the change in the price of electricity in each state. The location decision of concrete plants is orthogonal to the geography of the price of electricity, rules out geographical sorting, and strengthens the validity of the instrument. The concrete
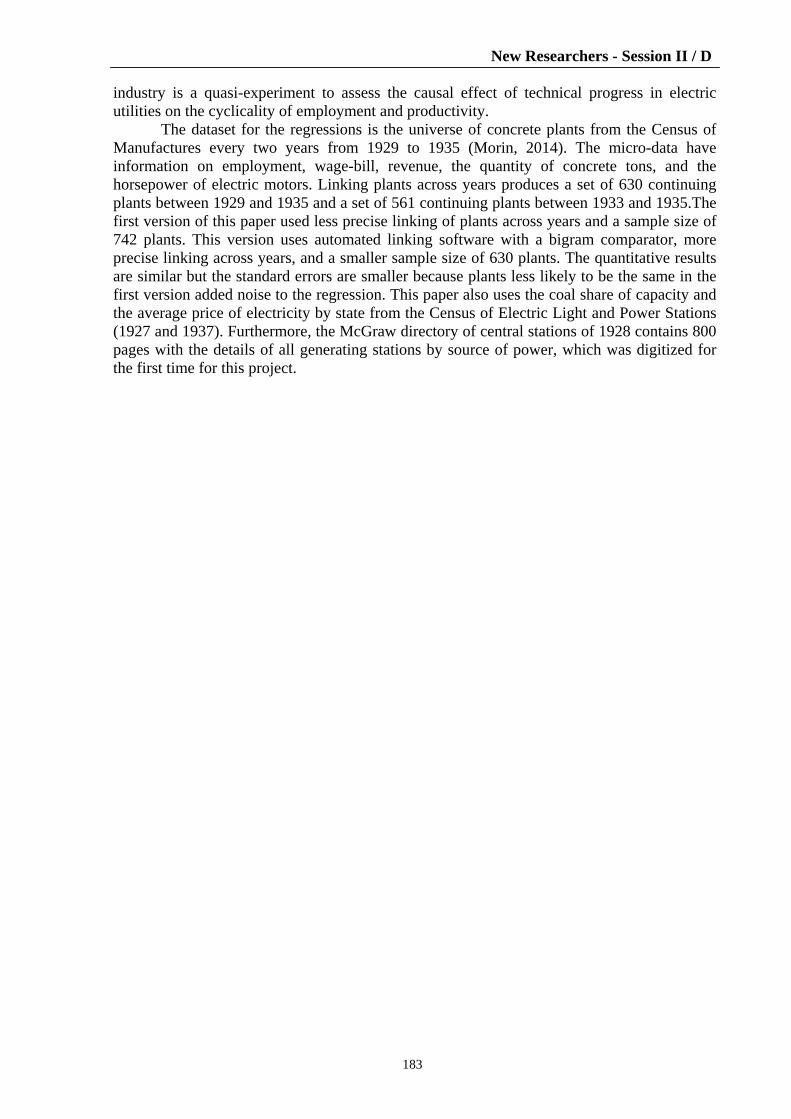
New Researchers - Session II / D
183
industry is a quasi-experiment to assess the causal effect of technical progress in electric utilities on the cyclicality of employment and productivity.
The dataset for the regressions is the universe of concrete plants from the Census of Manufactures every two years from 1929 to 1935 (Morin, 2014). The micro-data have information on employment, wage-bill, revenue, the quantity of concrete tons, and the horsepower of electric motors. Linking plants across years produces a set of 630 continuing plants between 1929 and 1935 and a set of 561 continuing plants between 1933 and 1935.The first version of this paper used less precise linking of plants across years and a sample size of 742 plants. This version uses automated linking software with a bigram comparator, more precise linking across years, and a smaller sample size of 630 plants. The quantitative results are similar but the standard errors are smaller because plants less likely to be the same in the first version added noise to the regression. This paper also uses the coal share of capacity and the average price of electricity by state from the Census of Electric Light and Power Stations (1927 and 1937). Furthermore, the McGraw directory of central stations of 1928 contains 800 pages with the details of all generating stations by source of power, which was digitized for the first time for this project.

New Researchers - Session II / D
184
Italian state-owned steel industry in the European Common Market, 1956-95
Salvatore Romeo, IIHS Italian Institute for Historical Studies
([email protected], [email protected]) Supervisor: Professor Roberto Ricciuti
The steel industry has had a central role in global economic history since the beginning of the industrial revolution: its development in late comer countries often required state intervention.
This is also the case of Italy, which promoted modern steel production initially through protectionism, and later through direct state intervention. In fact Italian steel industry was reorganized in the 30s within the Iri group, by creating a subsidiary holding, Finsider, to which many firms were transferred (Bonelli, 1982). In the postwar its president, Oscar Sinigaglia, launched a plan to reorganize the group through a functional division of work between its plants and its firms (Ranieri, 1993).
This work analyses the period started in 1951 by the constitution of the European Community of Coal and Steel (ECCS), whose first members were Belgium, France, Germany, Italy, Luxembourg and Holland414 (Mioche, 2004; Ranieri & Tosi, 2004; Spierenburg, 1993).
Here we examine how the Italian steel industry handled the challenge posed by the European Common Market (ECM). With respect to the previous literature on this topic (Balconi, 1991) we focus on the interactions between the industrial strategies and the international context.
We consider two fundamental periods: the first one starts with the constitution of ECCS and ends with the explosion of the first oil crisis (1951-74); the second one goes from the spread of the crisis to definitive privatization of state-owned companies. Economic development and rise of Finsider
As a late comer economy, for a long time Italy was characterized by an increase of internal steel consumption more rapid than the rest of ECCS countries (table 1).
Table 1: Trend p.a. of steel consumption in EEC 1952-57 1958-63 1964-70 1971-74Germany 8.0% 4.9% 4.4% 2.1%
France 6.8% 4.0% 5.6% 4.6%Italy 8.4% 17.0% 11.5% 8.6%
Holland 7.1% 4.9% 5.3% 2.4%Be-Lux 3.7% 7.6% 5.4% 5.6%
UK 3.7% 1.3% 0.5% 1.0%EEC 6.6% 5.2% 4.3% 3.9%
Source: Eurostat, 1984
However, its steel sector was less developed than in the other countries and this situation led the communitarian steel producers to identify a good end market in Italy, and maintained a high pressure on it. Consequently, the Italian steel industry, and the state-owned one in particular, had to face with this competition, by increasing the capacity and improving the productivity of its plants.
This led to two great investment plans. The first one was elaborated at the end of the 1950s. At that time European steel consumption was at its peak and the ECCS High Authority was concerned about an eventual supply scarcity and by the threat to economic growth. An 414 Because of the relative backwardness of its steel industry, Italy was granted a transitional period, until 1958,
to permit it to gradually open its market.

New Researchers - Session II / D
185
ample debate on the creation of a new integral cycle plant emerged in Italy at that time. The Italian government put pressure on Finsider so that the company achieved that aim, in alternative with a project promoted by some private competitors led by Fiat. Nevertheless, the management of Finsider was reluctant: its priority at that time was to improve the existent plants to face out the definitive liberalization of the market.
The discussion crossed also a political element at the core of the Italian debate in that time: the industrialization of the Mezzogiorno. The new plant was considered a fundamental step in the development policy for the poorest area of Italy.
The debate continued until 1959, when the government finally decided to realize the new plant. It was located in Taranto, a Southern town that was in downturn. (Romeo, 2011).
The new unit, specialized in flat products, would have permitted Finsider to consolidate its supremacy in the most dynamic market segment, removing definitively the private players’ competition and facing out the foreign ones. But, on the other hand, it would have been a difficult industrial challenge, because the steel consumption was still concentrated in the North. Then, Finsider’s management promoted an integration between Taranto and a new strip mill, to be built in Novi Ligure, Piedmont (Marchesi, 1964). This scheme would have become the main axis for both the Finsider's productive organization and the whole Italian steel industry.
There followed a general business reorganization. Ilva, Cornigliano and Siac merged to create Italsider, since then one of the biggest steel firms in Europe, to which the building of the new plants was entrusted.
The Taranto plant, had since then a central role in the Italian steel industry, especially from containing the communitarian import, that grew very rapidly between the 1950s and 1960s (table 1).
Graph 1: Import of steel products in Italy 1960-69 (index 1960=100)
Source: Eurostat, 1984
In particular, the new steel plant allowed the group to increase its market shares in the
flat products segment (graph 2).
Graph 2: Finsider market shares in the flat products 1963-69 (thousands of tons)
Sources: Eurostat, 1984; Asiri, Finsider, Attività e risultati economici, anni vari

New Researchers - Session II / D
186
The second great investment campaign was launched at the end of the 1960s. In fact market analysis suggested an increasing trend in steel consumption in the following years. Finsider’s management was afraid to repeat the experience of the early 1960s. So tried to prevent that trend.
In particular, the managers had to decide how to expand the productive capacity of flat products. Two alternatives were identified: the conversion of the Piombino plant or the ‘doubling’ of the Taranto one. This last option was selected to obtain the state financial incentives for the underdeveloped South of Italy, despite the technicians considered the first like the best one. Moreover a new integral cycle plant in Gioia Tauro (Reggio Calabria) was projected, to satisfy the demand of flat products in the long period (Ranieri & Romeo, 2015).
However this complex plan was elaborated in a phase of slow consumption growth. The trends emerged in that moment characterized the EEC steel market permanently.
The EEC players intensified the competition to face out the decrease of the use rates of their capacity, but this caused a significant pressure on prices. This dynamic particularly affected the Italian steel industry.
The conjuncture tensions had significant consequences on the accounts of Finsider. The investments, financed almost entirely through new debts, determined the outburst of amortizations and then of finance charges. Meanwhile, the very intense Trade Union actions caused a sharp increase in labour cost.
Briefly, the general and unitary costs exceeded the revenues, pressed by the consumption trend and by the growing competition. The losses registered in 1970-2 were only partially compensated by the profits gained in 1973-4. Consequently, Finsider faced the crisis in a very fragile position. Between 1969 and 1974, debts more than doubled, and the debt and equity ratio grew from 77 per cent to 87 per cent.
Global crisis and fall of the state-owned steel industry
The analysis on the second period focuses on the explosion of these tensions. Steel consumption in the EEC collapsed in 1974-5, and again in 1980-3. This dynamic exacerbated the competition within the communitarian steel market and determined the fall of the prices. On the other hand, the recovery was not uniform among the European countries: Italy showed again a more rapid trend (table 2).
Table 2: Trend p.a. of steel consumption in EEC 1975-94 1975-80 1981-85 1986-90 1991-94
Germany 1.6% -4.3% 1.6% -1.8%France 1.2% -7.2% 2.8% -1.7%
Italy 11.7% -2.5% 4.2% -0.2%Holland 0.8% 1.2% 2.4% 4.3%Be-Lux 3.0% 0.1% 1.9% 0.7%
UK -6.2% -3.2% 2.7% 4.0%EEC 1.6% -0.8% 3.0% -0.1%
Source: Eurostat, 1984, 1990, 1995
Consequently, the pressures on the Italian steel market increased significantly and the imports too (table 3).

New Researchers - Session II / D
187
Table 3: Trend p.a. of steel imports in EEC countries 1975-94 1975-80 1981-85 1986-90 1991-94 Germany 4.8% -0.1% 4.6% 3.2%
France 5.0% -1.7% 4.6% 4.0% Italy 16.0% 5.9% 10.6% 3.0%
Holland 1.1% 4.8% 3.8% 6.6% Be-Lux 3.4% 5.1% 8.0% 6.0%
UK 6.4% 3.6% 4.4% 8.9% Source: Eurostat, 1984, 1990 1995
The pressure was particularly intense in the second part of the 70s, stimulated by an
exceptional consumption growth (table 4).
Table 4: Imports of steel products in Italy 1975-79 (millions of ton)
Import/Consumption Import from EEC/Consumption1975 24% 12.6% 1976 30.8% 14.2% 1977 31.1% 16% 1978 28% 16.1% 1979 34.1% 17.2% Source: Eurostat, 1984
Finsider was unable both to take advantage from this trend and to expand exports
(graph 3).
Graph 3: Finsider in the crisis
Source: Eurostat, 1984
This was related to its inability to adapt to the new market trends and their high
instability. In Italy these circumstance were exacerbated by the traders’ speculative behaviour. Consequently, there were very significant problems for the biggest plants, which had to combine high productive levels, homogeneous qualities and operational continuity to achieve economies of scale. An improvement of the trade organization and a greater coordination between this function and the production were necessary to reduce the bottlenecks. But Finsider firms were not able to adopt this operative model. Moreover, a technological delay interested the adoption of the continuous casting.
The poor performances of the most important plants and the intense dynamic of labour cost – caused by the interaction between inflation rate and the indexing of wages – determined

New Researchers - Session II / D
188
a decrease of the operating margins, that made it more and more complicated to balance the high levels of amortizations and finance charges.
The consequent losses were faced up with new debts, that increased the finance charges, exacerbating the losses themselves. This vicious circle determined the growth of debts, that mounted to the equity.
The European Commission (EC) decided to face out the crisis with extraordinary instruments (Many & Wright, 1987). In 1980 the ‘manifest crisis’ situation was declared and in the following months the first two ‘aid codes’ were promulgated. They established that European firms could receive government aid, conditional to the adoption of a cut in productive capacity until the end of 1985.415 The overcapacity level was estimated clearly in 1983 with the document on the ‘General Objectives Steel 1985’.
Finsider arrived at this date in a dramatic condition. The company was damaged not only by the competition within the steel market, but also by the modifications of the macroeconomic framework. In 1979 Italy joined to the European Monetary System (EMS); as consequence, it experienced a real appreciation of the Lira with respect to the stronger currencies of the area (Graziani, 2010). At the same time, the Bank of Italy – following the new policy of the Federal Reserve – increased interest rates (Marinelli, 2011). Consequently, the exchange rate appreciation reduced the competitiveness of Italian productions, as so the revenues. At the same time, the increasing interest rates determined an exacerbation of the debt spiral. The following huge losses were financed by the Italian government, but in this way the company exposed itself to the hard intervention of the EC.416
The cuts in capacity imposed amounted to 3.8 millions of tons/year of steel. The most significant closure was the strip mill of Cornigliano, while the capacity of the new strip mill of Bagnoli was limited to 1,2 millions ton/year (against the 2 millions of ton/year technically available).
So Taranto remained the only unit completely operative in the coils segment. A restructuring plan started with the advice of a group of technicians of Nippon Steel, to bring the plant productivity at the level of the European competitors (Masi, 1987). Employment was reduced, increasing computerization and automation. The restructuring was effective: Finsider increased its market share during the recovery of the late 1980s. Nevertheless, competitors further improved their performances in that period, making dumping on the prices. Consequently, the greater penetration of Finsider was balanced by significant pressure on the revenues. Two other elements affected this trend: inadequate trade organization and a limited vertical integration.
The operative results of Finsider were insufficient to balance the increasing expenses generated by the interaction between high interest rates and debts that state aid was not able to reduce. Thus in 1987 Iri decided to liquidate Finsider, but it was compelled to a new negotiation with the EC, who imposed a first plan of privatization (including the Cornigliano plant, sold to the Riva group) and new closures (the most important of which concerned the Bagnoli plant). The residual activities were assigned to a new state-owned company, Ilva, whose debts were reduced by transferring a part of them (7,500 billion Lira) at Iri.
Meanwhile the EC decided to overtake the regime of market regulation, starting a rapid liberalization.417 So Ilva had to compete directly against stronger players without any protection.
The new management tried to improve the operative performances through large investments,418 but in the early 1990s there was a new decline in steel consumption, while the 415 European Commission, 1980 and 1981. 416 Between 1980 and 1986 Finsider received almost 9.000 billion Lira of State aids, against almost 8,800 billion
Lira of losses. 417 The ‘third aid code’, promulgated in 1985, limited the State financings to research support and at charges
related to the closure of the plants. European Commission, 1985. 418 The expenses to improve the trade organization amounted to almost 1.000 billion Lira in 1990-1.

New Researchers - Session II / D
189
financial consequences of the German reunification caused the exit of some countries from the EMS, Italy included; a new increase of interest rates followed (Graziani, 2010).
So the vicious circle that brought to collapse Finsider reemerged.419 In 1991-2 the financial situation of Ilva became more and more dramatic and imposed a new rebalancing. So the privatization of the state-owned companies, including Ilva, became one of the priorities of the Italian economic policy (De Cecco, 2000). Then between 1992 and 1996 the company was fragmented and its sections were sold to several private players (Dringoli, 2000).
The privatization definitively close the experience of the Italian state-owned steel industry; meanwhile, a great industrial company was dismembered while in the rest of EEC great concentration processes emerged.420 References Affinito M., De Cecco M. & Dringoli A. (eds.) (2000), Le privatizzazioni nell’industria
manifatturiera italiana, Roma. Balconi M. (1991), La siderurgia italiana (1945-90), tra controllo pubblico e incentivi al
mercato, Bologna. Bonelli F. (1982), Acciaio per l’industrializzazione, Torino. Brancaccio E. & Romeo S. (2014), Piatto d’acciaio, in ‘Limes - rivista italiana di
geopolitica’, n. 3, Roma, pp.229-238. European Commission (1980), Decision n. 257/80/ECCS, in ‘Official Journal of the European
Communities’, n. L 29/5, 6/2/1980, Bruxelles. − (1981), Decision n. 2320/81/ECCS, in ‘Official Journal of the European Communities’, n. L
228/14, 18/8/1981, Bruxelles. − (1985), Decision n. 1018/85/ECCS, in ‘Official Journal of the European Communities ‘, n.
L 110/5, 23/04/1985, Bruxelles. De Cecco M. (2000), La politica italiana delle privatizzazioni, in Affinito, De Cecco &
Dringoli. Masi A. (1987), Nuova Italsider-Taranto and the Steel Crisis: Problems, Innovations and
Prospects, in Meny & Wright (eds.). Dringoli A. (2000), Le privatizzazioni del settore siderurgico, in Affinito, De Cecco &
Dringoli. Eurostat (1976-1996), Iron and steel yearbook, Luxemburg − (1984), Iron and steel 1952-82,
Luxemburg. Graziani A. (2000), Lo sviluppo dell’economia italiana: dalla ricostruzione alla moneta
europea, Torino. Marchesi M. (1964), L’organizzazione del lavoro portuale e l’industria siderurgica, «Notizie
IRI», n. 54, marzo, pp.113-119. Marinelli M. L. (2011), L’indipendenza della Banca d’Italia dal Governo negli anni Ottanta:
cause interne e internazionali, in ‘Studi e Note di Economia’, Anno XVI, n. 2-2011, Siena, pp.133-170.
Meny Y. & Wright V. (eds.) (1987), The politics of steel: Western Europe and the steel industry in the crisis years, (1974-1984), Berlin.
Mioche P. (2004), Les cinquante annèes de l’Europe du charbon et de l’acier, Luxembourg Ranieri R. (1993), La grande siderurgia in Italia, in G. L. Osti, L’industria di Stato fra ascesa
e degrado, Bologna. Ranieri R. & Tosi L. (2004), Introduzione, in Iid. (eds.), La comunità europea del carbone e
dell’acciaio 1952-2002, Padova, pp.IX-XLVIII. Ranieri R. & Romeo S. (2015), La siderurgia Iri dal piano Sinigaglia alla privatizzazione, in
Storia dell’Iri, vol. 5, pp.6-200, Roma-Bari.
419 In 1991 the losses were 400 billion Lira, while the debt and equity ratio was 2.1. 420 For the consequences of those choices on the present v. Brancaccio & Romeo, 2014.

New Researchers - Session II / D
190
Romeo (2011), Il quarto centro siderurgico fra politiche di sviluppo e strategie industriali, in ‘Imprese e Storia’, n. 41-42, pp.249-271.
Spierenburg D. (1993), Histoire de la Haute autorité de la Communauté européenne du charbon et de l’acier: une expérience supranationale, Bruxelles.

New Researchers - Session II / D
191
Productivity performance of manufacturing in Uruguay from a comparative perspective
María Cecilia Lara Martínez, University of Groningen
([email protected]) Supervisor: Professor Herman de Jong
This paper presents a comparison between productivity levels in manufacturing in Uruguay and those in the United States, based on the industry of origin approach. It is well established in the literature that productivity plays an important role in explaining economic performance in the short run, and even more so in the long run. From a macroeconomic perspective, labour productivity is the main basis of economic growth and is measured by Gross Domestic Product (GDP) per worker. Therefore, to address the question of productivity implies studying economic growth. We have chosen to focus on manufacturing productivity because this sector is so important for generating higher economic returns in the productive structure.
Comparisons among countries of productivity performance at industry levels can reveal gaps between a country’s labour productivity and that of the leaders, and this makes it possible to explore differences in technology, capital intensity, capital quality, human capital, economies of scale, and intangibles such as management techniques. This kind of study is relevant in Uruguay, which had a period of industrialization until the 1950s and then, from the 1970s onwards, a process of deindustrialization as its economy fell further and further behind the developed countries. Manufacturing in Uruguay and the United States
For the benchmark year (1988) in Uruguay the major branches are food, beverages, and tobacco (32 per cent of the sector); textiles, wearing apparel, and leather (19 per cent); and chemicals, oil refining, rubber, and plastic (25 per cent); but in the United States these branches have less weight in manufacturing as a whole (11 per cent, 5 per cent, and 17 per cent respectively). In the United States, machinery, electrical, and transport equipment is one of the most important industries in terms of value added (30 per cent), and this is very different from Uruguay’s manufacturing profile (see table 1). The conclusions about the output, employment and labour productivity should be relativized according to these structural differences.
Table 1
Uruguay United States
Food, beverage, tobacco 32% 12%
Textiles, wearing apparel, leather 19% 5%
Chemicals, petroleum, rubber, plastic 25% 17%
Basic metals & products 4% 11%
Machinery, electrical machinery, transport equipment 9% 30%Others 11% 26%Total manufacturing 100% 100%Source: elaborated by the author, based on INE and Census Bureau
Distribution of value added, Uruguay and United States, 1988
In the United States the trend over the period was for employment in the manufacturing sector to decrease while the physical volume in the sector increased. Labour

New Researchers - Session II / D
192
productivity in the United States grew steadily from 1978-97, and this growth quickened in the 1990s. Meanwhile in Uruguay, employment and physical volume in the manufacturing sector started to decrease from 1980-83. Then during 1984-90 these two indicators evolved in the same way so labour productivity remained constant over the period. In the 1990s, however, employment started to fall while physical volume remained stable, with some small changes, so labour productivity in the country’s manufacturing sector increased over the decade. To sum up, output, employment, and labour productivity in Uruguay and the United States evolved differently, and this should be taken into account when we analyse and compare labour productivity in the two countries. Methodology
When making cross-country comparisons of productivity levels, we have to correct gross value of product and value added for differences in relative prices between the countries. Therefore a major difficulty is to find a suitable conversion factor to express output in a common monetary unit. There are three main ways of solving this problem. The easiest method is the exchange rate. The second alternative is known as ‘the expenditure approach’. This method consists of using purchasing power parities (PPPs) to establish the conversion rate to be applied. In order to overcome the problems that arise from using these two approaches, a third approach called ‘industry of origin’ has emerged. Researchers at the University of Groningen developed this method in 1983, and it has been used in the International Comparison of Output and Productivity (ICOP) project to analyse many lower income countries such as Mexico, Brazil, India, and South Korea. There are studies of countries in Europe, Asia and America, but Uruguay has not yet been researched. Using the industry of origin approach
In this paper we apply the industry of origin approach, where producer product ratios are used as conversion factors called ‘unit value ratio’ (UVR). These are obtained by taking the ratio of values and quantities of items as reported in production statistics and matching them across two countries, in this case Uruguay and the United States. We made the calculations for 1988 and extrapolated the results back to 1978 and forward to 1997 in order to cover the period 1978-97.
The main source of information is the censuses. The United States census of manufactures (1987) is surveyed by the Census Bureau of the US Department of Commerce. This information is available in publications about the 1992 Census of Manufactures, which gives final figures for approximately 459 industries by groups of companies. The Uruguayan Census of Manufactures (1988) is surveyed by the National Statistics Institute (INE in Spanish). Some 25,042 units (with a total of 220,992 manufacturing sector employees) were studied.
The procedure for making international comparisons with the industry of origin approach is to estimate the quantities produced in the two countries while maintaining prices in both countries fixed. These are calculated by dividing the gross value of output by the quantities of each good produced. In order to compare similar products, this procedure is carried out at the most disaggregated level possible, and from this we move to a more aggregated level (industry, branch, total manufacturing sector). For each binary comparison, we distinguish the maximum possible number of industries in each branch that produces similar products in the two countries. The UVR used in this paper, which is based on van Ark (1993), is a Fisher index, which is a geometric average of the Paasche and Laspeyres indexes. The Fisher index satisfies the country reversal test (i.e. changing the denominator and numerator does not alter the results) and the factor reversal test (i.e. a Fisher price index times a Fisher quantity index gives a Fisher value index). After unit value ratios have been obtained they are used to calculate productivity binary comparisons. In order to cover the period 1978 to 1997 it is necessary to extrapolate forwards and backwards using national time series on

New Researchers - Session II / D
193
output and labour input. We extrapolate the results for six major groups of manufacturing branches and for manufacturing as a whole. Some empirical results
The coverage ratio measured as matched output in terms of census output between Uruguay and the United States is 22 per cent for the manufacturing sector and covers 113 matched items. This coverage ratio is similar to other cases in which a developing country is compared to the United States (Pilat, 1991; van Ark, 1991; van Ark & Maddison, 1988). In food, beverages, and tobacco the coverage ratio is at its highest figure, a geometric average of 35 per cent. In the binary comparison with the United States, the final UVR (Fisher) for total manufacturing is 330 (see table 2, last row). If we interpret the overall UVR as a converter for average manufacturing production costs at the other country’s prices, a relatively low UVR compared to the exchange rate indicates Uruguayan manufacturing products that are more price-competitive. This advantage pertains when relative price levels are below 100.
The exchange rate in 1988 is 358 new Uruguayan pesos per dollar. In the manufacturing sector as a whole, the relative price level is 92. This means that Uruguay is more competitive than the United States in terms of prices (see table 2).
In a comparison of major manufacturing branches, Uruguay is much more price competitive than the United States in food, beverages, and tobacco; and in textiles, wearing apparel, and leather products. This is consistent with the fact that the Uruguayan economy is specialized in agricultural natural resources, a sphere in which the country has comparative advantages (see table 2). However, as expected, when we analyse productivity ratios, the gap always remains favourable to the United States. This means that in terms of productivity the United States performs better than Uruguay.
Table 2
Major branches
Uruguay USA Geometric
averageUruguay USA Uruguay USA Fisher
Food and beverages and tobacco 28 45% 28% 35% 232 275 232 296 262 73
Textiles, wearing apparel and leather products 26 19% 26% 22% 278 356 275 355 312 87
Chemicals, petroleum refining, rubber and plastic products 15 41% 22% 30% 415 426 431 425 428 120Basic metals and metal products 12 3% 9% 5% 69 580 281 402 336 94Machinery, electrical machinery and transport equipment 3 33% 11% 19% 380 372 341 380 360 101
Other industries 29 11% 6% 8% 407 673 281 402 336 94
Total manufacturing 113 32% 15% 22% 281 402 280 389 330 92Source: elaborated by the author, based on INE and Census Bureau
Number of UVRs, coverage ratio, initial UVR, final UVR and ratio final UVR to exchange rate, Uruguay and the United States. Benchmark year 1988
Number of UVRs
(matched items)
Coverage ratio (% of matched sales) Initial UVR Final UVR Final UVR Fisher/
exchange rate (=358)
Table 3 shows the comparative levels for the benchmark between Uruguay and the United States of value added, hours worked, number of employees, and value added per employee using UVR. The figures also take account of the small size of the Uruguayan manufacturing sector compared to the United States, and the ratio of value added per employee measures how big the gap between the two countries is.

New Researchers - Session II / D
194
Table 3
Uruguay USA Uruguay USA Uruguay USA Uruguay USAFood and beverages and tobacco
692 145,587 76 2,121 53,978 1,511,300 12,822 96,332 13.31
Textiles, wearing apparel and leather products
439 63,264 70 2,943 46,796 1,862,600 9,382 33,965 27.62
Chemicals, petroleum refining, rubber and plastic products
267 209,754 27 2,463 19,641 1,805,200 13,617 116,194 11.72
Basic metals and metal products
77 136,378 13 3,442 8,985 2,213,400 8,547 61,615 13.87
Machinery, electrical machinery and transport equipment
158 376,119 20 7,252 13,466 5,295,100 11,752 71,031 16.55
Other industries 218 330,714 40 6,861 28,528 5,231,300 7,629 63,218 12.07
Total manufacturing 1,787 1,261,815 245 25,082 171,394 17,918,900 10,424 70,418 14.80
Value added, persons engaged, annual hours worked and comparative productivity levels in total manufacturing and six major branches, Uruguay and the United States. Benchmark year 1988
Source: elaborated by the author, based on INE and Census Bureau
Value added by manufactures (millions
US$) using UVR
Hours worked (millions)
All employees Value added per employee (US$) using
UVRs
Ratio productivity employee (US=100)
using UVR
Another binary comparison that can be taken into account is the net result of relative productivity and relative remuneration, expressed by the concept of unit labour cost. Unit labour costs (ULC) measure the average cost of labour per unit of output and are calculated as the ratio of total labour costs to real output. The relative productivity is measured as the labour productivity in Uruguay related to the United States, and the relative remuneration is measured as the wage per employee in Uruguay related to the United States. The unit labour cost divides the relative remuneration to the relative productivity.
This comparison enables us to see that although wage per employee in the United States in total manufacturing is around four times the rate in Uruguay, this ratio is less than the ratio between the two countries of value added per employee. In total manufacturing, the unit labour cost in Uruguay is 79.9 per cent higher than in the United States.
The relatively low levels of labour productivity are not aligned with low levels of labour compensation in Uruguay as it occurs in other countries like Brazil and Mexico (Mulder et al. 2002). Uruguay’s price competitiveness should not be attributed to the labour factor (see table 4). It is probable that factor inputs from the country’s primary sector are influencing the results for price competitiveness. This could be studied in a future analysis of manufacturing sector competitiveness considering these initial results.

New Researchers - Session II / D
195
Table 4
Food and beverages and tobacco
208.3 27.7 13.3
Textiles, wearing apparel and leather products
111.9 30.9 27.6
Chemicals, petroleum refining, rubber and plastic products
325.1 38.1 11.7
Basic metals and metal products
154.4 21.4 13.9
Machinery, electrical machinery and transport equipment
160.8 26.6 16.5
Other industries 223.7 27.0 12.1Total manufacturing 179.9 26.6 14.8Source: elaborated by the author, based on INE and Census Bureau
Unit labour costs
(US=100)
Relative levels of unit labour cost in Uruguay (USA=100). Benchmark 1988
Labour productivity (US=100)
Wage per employee (US=100)
The extrapolation of benchmark comparisons
This study in levels reveals that behind the improvement in labour productivity in Uruguay in the 1990s, there are only poor results in terms of comparative levels. From 1978 to 1981, value added per employee tended to improve in Uruguay compared to the United States. In 1982 this rate started to fall and it remained stable at around 16 until 1989. At the beginning of the 1990s, Uruguayan value added per employee compared to the United States remained low. After 1994 this ratio improved and reached 21 per cent in 1997, but this improvement could still be considered low in terms of productivity performance (see table 5).
The manufacturing branch with the highest labour productivity was textiles, apparel, leather, and leather products, which had levels of over 40 per cent, but the overall trend during the period was for Uruguay to lag further behind the United States.
One of the most important industries in Uruguay (in terms of value added as a percentage of total manufacturing) comprises food, beverages, and tobacco. This major branch improved as of 1995 and reached higher levels than in the 1970s.
In the branch comprising chemicals, oil refining, rubber, and plastic products, Uruguay narrowed the gap with the United States from 1978 to 1980 but then lost ground during the 1980s and 1990s, partly because of stagnant productivity in Uruguay and better results in the United States. In 1995 to 1997 labour productivity in Uruguay recovered and again narrowed the gap with the United States, but remained six percentage points below its baseline levels (13.8 per cent in 1997 as against 20 per cent in 1979).

New Researchers - Session II / D
196
Table 5
Food and beverages
and tobacco
Textiles, wearing
apparel and leather
products
Chemicals, petroleum
refining, rubber and plastic products
Basic metals and metal products
Machinery, electrical
machinery and transport
equipment
Other industries
Total
1978 16.65 39.82 17.65 16.62 13.30 14.12 17.291979 17.83 40.28 20.10 12.18 18.49 16.73 19.401980 17.28 43.99 19.72 11.54 24.44 15.69 20.351981 18.64 42.56 15.55 14.18 17.89 15.74 19.841982 16.89 46.04 16.44 13.35 18.56 14.69 20.141983 14.65 44.00 12.93 13.34 15.40 13.98 18.511984 13.77 39.85 14.13 14.02 26.10 17.74 18.361985 12.52 32.50 12.70 13.93 24.99 13.74 16.461986 12.70 32.03 13.64 14.37 23.55 14.65 16.571987 12.55 30.58 11.75 15.64 21.24 13.88 15.631988 13.31 27.62 11.72 13.87 16.55 12.07 14.801989 13.92 26.97 11.35 9.68 18.22 11.85 14.681990 14.04 24.49 12.50 10.36 19.14 11.71 14.851991 14.62 25.96 13.08 9.82 18.34 12.87 15.281992 16.25 26.30 12.78 9.49 20.07 13.37 16.261993 16.67 28.00 9.99 8.42 18.94 14.16 15.731994 16.51 30.16 9.51 9.46 25.02 16.29 16.851995 15.59 29.21 13.95 7.09 20.04 16.35 18.001996 19.79 33.11 14.59 7.60 22.21 18.52 20.391997 21.91 32.77 13.85 8.34 24.82 21.19 21.25
Value added per employee in manufacturing in Uruguay (USA=100), 1978-1997
Source: elaborated by the author, based on INE and BCU for Uruguay; Census Bureau, BEA and BLS for US.
Comparisons with other economies
Comparisons with other countries that belong to the ICOP (International Comparisons of Output and Productivity) strengthens the assessment that Uruguay performed poorly in terms of labour productivity, not only compared to developed countries but also compared to developing countries such as Brazil, Mexico, Korea and Taiwan.
Besides, labour productivity in Latin American countries was lagging behind Asian countries during 1970 and 2000. Taylor (1998) examines the poor performance of Latin American economies compared to the Asia-Pacific region, and suggests that the latter enjoyed much higher factor accumulation (physical and human capital), and less distortions in the markets than the Latin American region.
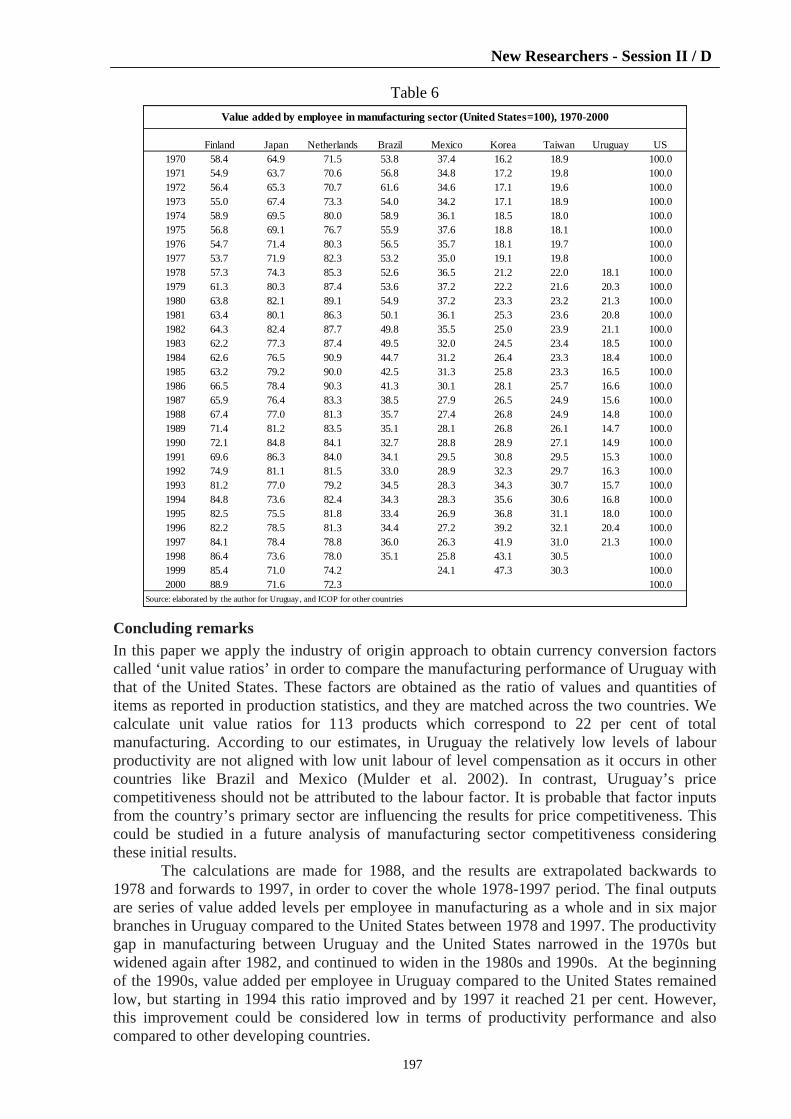
New Researchers - Session II / D
197
Table 6
Finland Japan Netherlands Brazil Mexico Korea Taiwan Uruguay US1970 58.4 64.9 71.5 53.8 37.4 16.2 18.9 100.01971 54.9 63.7 70.6 56.8 34.8 17.2 19.8 100.01972 56.4 65.3 70.7 61.6 34.6 17.1 19.6 100.01973 55.0 67.4 73.3 54.0 34.2 17.1 18.9 100.01974 58.9 69.5 80.0 58.9 36.1 18.5 18.0 100.01975 56.8 69.1 76.7 55.9 37.6 18.8 18.1 100.01976 54.7 71.4 80.3 56.5 35.7 18.1 19.7 100.01977 53.7 71.9 82.3 53.2 35.0 19.1 19.8 100.01978 57.3 74.3 85.3 52.6 36.5 21.2 22.0 18.1 100.01979 61.3 80.3 87.4 53.6 37.2 22.2 21.6 20.3 100.01980 63.8 82.1 89.1 54.9 37.2 23.3 23.2 21.3 100.01981 63.4 80.1 86.3 50.1 36.1 25.3 23.6 20.8 100.01982 64.3 82.4 87.7 49.8 35.5 25.0 23.9 21.1 100.01983 62.2 77.3 87.4 49.5 32.0 24.5 23.4 18.5 100.01984 62.6 76.5 90.9 44.7 31.2 26.4 23.3 18.4 100.01985 63.2 79.2 90.0 42.5 31.3 25.8 23.3 16.5 100.01986 66.5 78.4 90.3 41.3 30.1 28.1 25.7 16.6 100.01987 65.9 76.4 83.3 38.5 27.9 26.5 24.9 15.6 100.01988 67.4 77.0 81.3 35.7 27.4 26.8 24.9 14.8 100.01989 71.4 81.2 83.5 35.1 28.1 26.8 26.1 14.7 100.01990 72.1 84.8 84.1 32.7 28.8 28.9 27.1 14.9 100.01991 69.6 86.3 84.0 34.1 29.5 30.8 29.5 15.3 100.01992 74.9 81.1 81.5 33.0 28.9 32.3 29.7 16.3 100.01993 81.2 77.0 79.2 34.5 28.3 34.3 30.7 15.7 100.01994 84.8 73.6 82.4 34.3 28.3 35.6 30.6 16.8 100.01995 82.5 75.5 81.8 33.4 26.9 36.8 31.1 18.0 100.01996 82.2 78.5 81.3 34.4 27.2 39.2 32.1 20.4 100.01997 84.1 78.4 78.8 36.0 26.3 41.9 31.0 21.3 100.01998 86.4 73.6 78.0 35.1 25.8 43.1 30.5 100.01999 85.4 71.0 74.2 24.1 47.3 30.3 100.02000 88.9 71.6 72.3 100.0
Source: elaborated by the author for Uruguay, and ICOP for other countries
Value added by employee in manufacturing sector (United States=100), 1970-2000
Concluding remarks
In this paper we apply the industry of origin approach to obtain currency conversion factors called ‘unit value ratios’ in order to compare the manufacturing performance of Uruguay with that of the United States. These factors are obtained as the ratio of values and quantities of items as reported in production statistics, and they are matched across the two countries. We calculate unit value ratios for 113 products which correspond to 22 per cent of total manufacturing. According to our estimates, in Uruguay the relatively low levels of labour productivity are not aligned with low unit labour of level compensation as it occurs in other countries like Brazil and Mexico (Mulder et al. 2002). In contrast, Uruguay’s price competitiveness should not be attributed to the labour factor. It is probable that factor inputs from the country’s primary sector are influencing the results for price competitiveness. This could be studied in a future analysis of manufacturing sector competitiveness considering these initial results.
The calculations are made for 1988, and the results are extrapolated backwards to 1978 and forwards to 1997, in order to cover the whole 1978-1997 period. The final outputs are series of value added levels per employee in manufacturing as a whole and in six major branches in Uruguay compared to the United States between 1978 and 1997. The productivity gap in manufacturing between Uruguay and the United States narrowed in the 1970s but widened again after 1982, and continued to widen in the 1980s and 1990s. At the beginning of the 1990s, value added per employee in Uruguay compared to the United States remained low, but starting in 1994 this ratio improved and by 1997 it reached 21 per cent. However, this improvement could be considered low in terms of productivity performance and also compared to other developing countries.

New Researchers - Session II / D
198
Regarding the future agenda, this methodology can be applied for other economic sectors such agricultural; for other benchmarks or for comparing with other countries. In other words, I intend to give an original method which can be useful for producing more studies in Uruguay. Besides, this paper has not studied factors that could explain the gap between Uruguay and the United States, such as investment levels, use of capital intensity, technology, human capital, which could be addressed in future work. Finally, it would be an interesting contribution for our discipline to analyse the differentials of manufacturing productivity in a historical perspective at labour factor, capital, and total factor productivity, in order to advance in growth accounting estimations. References
Ark, Bart van (1991) ‘Manufacturing Productivity in India, A Level Comparison in an International Perspective’. IDPAD Occasional papers and reprints IDPAD 1991-5, New Delhi/ De Hague.
Ark, Bart van (1993) ‘International Comparisons of Output and Productivity’. Monograph Series Nº 1, Groningen Growth and Development Centre, Groningen.
Ark, Bart van and Angus Maddison (1988) ‘Comparisons of real output in manufacturing’. International economic department. World Bank.
Ark, Bart van; and Timmer, Marcel (2001) ‘The ICOP Manufacturing Database: International Comparisons of Productivity Levels’. Groningen Growth and Development Centre, Groningen.
Banco Central del Uruguay. Statistics. Freudenberg, Michael and Ünal-Kesenci, Deniz (1994). ‘French and German productivity
levels in manufacturing: a comparison based on the industry-of-origin method’. CEPII. Working Paper No 94-10, September.
ICOP Project. Groningen, Netherlands. Instituto Nacional de Estadística. Statistics, Uruguay. Mulder, Nanno; Montout, Sylvie and Peres Lopes, Luis (2002) ‘Brazil and Mexico's
Manufacturing Performance in International Perspective, 1970-98’. Research memorandum 52. Groningen Growth and Development Centre, Groningen.
Pilat, Dirk (1991) ‘Productivity Growth in South Korean Manufacturing, A Comparative Perspective, 1953-1988’. Research memorandum 435. Groningen Growth and Development Centre, Groningen.
Taylor, Alan (1998) ‘On the Costs of Inward-Looking Development: Price Distortions, Growth, and Divergence in Latin America’ in The Journal of Economic History, vol. 58, no. 1, pp.1-28, Cambridge University Press.
United States Census Bureau. Statistics. United States Bureau of Economic Analysis. Statistics. United States Bureau of Labour Statistics. Statistics.

New Researchers - Session II / E
199
Women voters and trade protectionism in the interwar years
Alan de Bromhead, Queen’s University Belfast
([email protected]) Supervisor: Professor Kevin O’Rourke
Introduction
A dramatic increase in trade protection was one of the prominent features of the breakdown of the international economic system that took place during the interwar years. Average tariff rates for industrialized countries increased by 11 per cent in the period 1923 to 1926, by 13 per cent between 1927 and 1931 and by 18 per cent between 1932 and 1939.421 Needless to say, tariff policy is always a highly political issue. Calls for increased protection of home producers, either from special interests or from those who argued that higher tariffs were in the best interests of the public in order to maintain employment, became increasingly loud. Even in Britain, where the doctrine of Free Trade had been most firmly established in the nineteenth century, the advocates of protectionism were becoming ever more vocal.
In order to understand the rise of protectionism during this period it is important to recognize the great changes to the political environment that followed the First World War. The extension of the franchise to millions of new voters in many countries represented one of the most significant developments. This major change in democratic politics could have had an impact on the political economy of trade policy as new voters, with preferences arguably different to those of the former electorate, cast their ballots for the first time. But in which direction would these changes to the franchise influence policy? Would the new voters be more inclined towards trade protection or free trade? This paper argues that extensions of the franchise to men and women influenced tariff policy in opposite directions. The granting of voting rights to previously disenfranchised men, largely working class, had a negative effect on tariff rates. Perhaps the most novel finding of the analysis is the impact of the enfranchisement of women on the politics of trade policy. Survey evidence from the period suggests that women were more likely to express a preference for trade protection, as they do today. Furthermore, the cross-country evidence presented in this paper indicates that where women were entitled to vote tariff rates were, on average, higher.
Women’s attitudes to free trade: Fortune Magazine public opinion poll analysis
Uncovering women’s attitudes towards free trade and protectionism during the interwar years is a difficult task due to the dearth of individual level information available. Many modern studies of women’s attitudes towards trade and protectionism have utilized public opinion surveys with the general conclusion that women are more likely than men to favour protectionism, or at least are less likely to support free trade.422 Nevertheless a valuable source relating to women’s attitudes to trade policy in this period does exist in the form of a Fortune Magazine public opinion survey from the United States in 1939. The market research firm of Elmo Roper completed its first public opinion survey in the United States for Fortune Magazine in July 1935, while the first question dealing directly with opinions on free trade was included in their survey of almost 5,000 individuals in September 1939.423 Through a probit analysis of these data, differing attitudes towards trade policy can be revealed. The survey question of interest asks “Do you believe that a high tariff to keep out foreign goods in
421 H. James, The End of Globalization: Lessons from the Great Depression (2002) p.108. 422 Inter alia B.A. Blonigen, 'Revisiting the Evidence on Trade Policy Preferences', Journal of International
Economics, Vol. 85 (No. 1, 2011) 129-35., A.M. Mayda and D. Rodrik, 'Why are some People (and Countries) More Protectionist than Others?', European Economic Review, Vol. 49 (No. 6, 2005)1393-430.
423 G.R. Walden, Polling and Survey Research Methods, 1935-1979: An Annotated Bibliography (1996) p.27.

New Researchers - Session II / E
200
competition with American goods is good policy or bad policy?” The survey data allow for the isolation of a gender effect, while controlling for a number of other factors such as age (over 40 years old or not), occupation and political inclination, in the form of a variable capturing whether or not the respondent intended to vote for President Franklin D. Roosevelt in the next election.
The results of the analysis of the question can be seen in table 1.424 The first column gives the marginal effects of the dummy variable indicating a female respondent based on a probit regression model, with the following columns giving the marginal effects from probit regressions including each of the control variables added in turn. The marginal effects indicate that women are around 7 percentage points more likely than men to believe that a high tariff ‘is good policy’, with this result robust and highly significant across all specifications.
Furthermore, this gap is of a very similar size to the effect identified in modern surveys.425 Neither age nor voting intention has a significant effect. Attitudes to tariff policy also differ according to occupation. Those individuals classified as ‘waged’ are more likely to look on tariffs favourably relative to the omitted category, ‘Professional’, while ‘salaried executives’ are less likely to favour trade protection than professionals. Additionally, an independent effect is also evident of being a ‘housekeeper’ (housewife) – the category into which 85 per cent of women in the sample fall – with those in this category being 6 percentage points more likely to favour tariffs than the reference category. Using the Clarify package for Stata to calculate predicted values suggests that, based on the specification in column four, female housekeepers were around 12 percentage points more likely to agree that a high tariff was a ‘good thing’ than men.426 The fact that the female dummy variable remains positive and statistically significant indicates that differences between the tariff policy preferences of men and women are not driven by occupation alone.
Cross-country panel data description
Having uncovered evidence of a gender gap in trade policy preferences during the interwar period, the next step is to test various hypotheses using a macroeconomic panel data approach. The sample consists of data from 30 countries covering the period 1919-39. The dependent variable under examination is the natural log of the average tariff rate, calculated as the total customs revenue divided by the value of total imports. The variable Franchise is the proportion of the population with the right to vote in national elections. Whether or not a country had extended the vote to women is captured by the dummy variable Female Vote. The variable Polity is the Polity score scaled to be between zero and one and represents the ‘intensive’ or ‘institutional’ measure of democracy. Although it is necessary to consider democracy along the ‘intensive’ dimension – the degree of openness and contestability of the political institutions – this is not sufficient, as it fails to capture changes resulting from increases in the extent of democracy – or the ‘extensive’ dimension.
If the conclusion of the analysis of the interwar US public opinion survey is correct, then a positive relationship might be expected to exist between tariff rates and the granting of voting rights to women. Whereas tariff rates are expected to increase with this measure of the extent of democracy, the opposite effect might be expected for the ‘institutional’ measure of democracy (Polity), in line with the majority of studies that link increasing democratization to declining trade protection. As countries’ governmental institutions become more democratic, it is suggested, the societal benefits of free trade induce the citizenry to push policy makers
424 Additional survey results as well as a more in depth analysis of the cross-country panel data can be found in
the working paper version available at https://sites.google.com/site/alanedebromhead. 425 Mayda and Rodrik, Why are some People (and Countries) More Protectionist than Others? 1393-430. 426 M. Tomz, J. Wittenberg and G. King, 'CLARIFY: Software for Interpreting and Presenting Statistical
Results', Journal of Statistical Software, Vol. 8 (No. 1, 2003)1-30.

New Researchers - Session II / E
201
towards reducing barriers to trade.427 In addition, the extension of voting rights to previously disenfranchised men, particularly in labour abundant countries, may be associated with lower tariff rates as previously disenfranchised men tended to be working class and would therefore be hit harder by a regressive tariff. In order to control for unobserved heterogeneity that is likely to cause problems for the analysis, a fixed effects approach is undertaken.
427 B. Eichengreen and D. LeBlang, 'Democracy and Globalization', Economics & Politics, Vol. 20 (No. 3, 2008)
pp.289-334.

New Researchers - Session II / E
202
The results of the regression analysis can be seen in table 2. The first column examines the effect of the variable Female Vote in isolation, while also controlling for unobserved heterogeneity at the county level. The coefficient on Female Vote implies that the women’s voting rights are associated with a 100[exp(0.468) -1] = 60 per cent higher tariff rates, all else held constant.428 As an illustration, if the average (unweighted) tariff rate for the sample in 1920 is taken as a reference point, then the extension of the franchise to women implies tariff rates would rise from 8.4 per cent to 13.4 per cent. Clearly, this is a large effect.
Column two adds the ‘intensive’ measure of democracy in the form of the Polity score. The coefficient is negative and significant, indicating a negative relationship between ‘institutional’ democracy and average tariff rates. This is what is predicted by the majority of studies exploring the link between democracy and trade; that more open and transparent political institutions foster trade openness. Most importantly the coefficient on the female vote variable remains positive and significant; indicating that extending the vote to women and increasing the openness of democratic institutions influenced tariffs in different directions. Specifically this suggests that a one standard deviation increase in Polity score lowers the tariff rate by 100[exp (0.314*-1.10) = 29 per cent. Columns three, four, and five introduce the variable capturing the proportion of the population entitled to vote, (log) Franchise. Column three includes only country fixed effects, column four shows a pooled OLS model while column five includes both country and year fixed effects, and is as such the most restrictive model.
The inclusion of the franchise variable, alongside the dummy variable indicating whether or not the vote had been given to women, will help to separate the two different aspects of the franchise; male and female and does indeed produce interesting results. In columns three and four, both the Polity variable and the Female Vote dummy variable have the same signs as in the previous regressions and remain statistically significant. Taking column five, the most restrictive model, the franchise variable however is negative and statistically significant, indicating that holding all else constant, a 10 per cent increase in the proportion of the population entitled to vote is associated with a 7 per cent decrease in the tariff rate. This effect is consistent with the view that men gaining the vote were more likely to be ordinary workers, or from lower down the income distribution, and would therefore have been more inclined to support lower tariffs due to the disproportionate impact of tariffs on their real wages. Of most significance is that the effects of granting voting rights to women and extending the vote to men appear to run in opposite directions.
Most important of all, the signs of the coefficients on the political variables that are the principal focus of this analysis, Female Vote, Franchise and Polity, are consistent across the various specifications while remaining statistically significant in almost all cases. Even after controlling for many other determinants of trade policy, the opposite effects of the two measures of the extent of democracy are evident, lending support to the idea that extending the franchise to women may have had a different impact to that of increased voting rights for working class men.429 Indeed it would appear that tariff rates would have been considerably lower had the franchise only been extended to men. Also clear is that more democratic political institutions, as measured by the Polity score, are associated with lower tariffs. This adds an interesting element to the debate over the relationship between democracy and trade policy during the interwar years, which may perhaps extend to the relationship in other periods also.
429 Not reported here for sake of brevity. See full paper.

New Researchers - Session II / E
203
Concluding remarks
The extensions of voting rights that occurred after the First World War represented a dramatic change in the political landscape. Policies that received support from the electorate of the nineteenth century could no longer be assured of the same support from the enlarged electorate of the post- First World War years. Modern public opinion surveys show women to have more protectionist attitudes than men. If this is true today it is quite conceivable that this gap also existed in the interwar years. Although widely held at the time, the notion that women only cared about the price of consumer goods and would therefore naturally favour free trade, has been found to be unconvincing. In fact, the survey evidence available for the period suggests the opposite conclusion; that women were more protectionist that men, as they appear to be today. If this is indeed the case, then where women had the means to express their preferences at the ballot box, they may have influenced the political economy of trade policy formation. Evidence presented in this paper detects such an effect. Even after controlling for many other determining factors, the impact of the granting of votes to women comes through strongly in the cross-country analyses. Although the extension of the franchise to previously disenfranchised working-class men appears to have had a negative effect on tariffs, where women were able to vote tariffs tended to be higher. Uncovering this effect suggests an important factor that conceivably contributed to higher levels of trade protection during the interwar years. The reason why women appear to have been more protectionist than men however is not revealed in this analysis. It is likely that the gender gap in trade policy preferences is due to differences that are not controlled for in conventional survey analysis, such as differences in risk aversion between men and women. A full exploration of these explanations is reserved for future research.

New Researchers - Session II / E
204
Central banking independence, historical narratives and the Bank deutscher Länder, 1948-57
Simon Mee, University of Oxford
([email protected]) Supervisors: Professors Kevin O’Rourke & Paul Betts
Introduction There was no West German consensus for central banking independence when the Federal Republic of Germany was established in 1949. Far from it, the issue was a controversial one. It often sparked heated public debates. This paper is a tale of two cities. It examines how the Frankfurt-based Bank deutscher Länder defended its central banking independence from the Bonn government in the public sphere.430 In particular, the paper examines how historical narratives of Germany’s two inflationary episodes were used by the central bank in the media amid efforts to influence the debate surrounding the upcoming Bundesbank Law. The law was a crucial piece of legislation that would determine the future structure and institutions of the Bank deutscher Länder’s successor: the Deutsche Bundesbank. The paper concludes by stressing that central banking independence was not defended by success in the field of economics alone. It was guarded in the public sphere, too. The troubled legacy of central banking independence Central banking independence is lauded in present-day Germany. But this was not the case at the foundation of the Federal Republic. In the late 1940s, Germans looked back on three turbulent decades of monetary history. The country had experienced two inflations and one deflation within a single generation. The first inflation occurred in 1922-3, when a hyperinflation induced by government spending devastated the Weimar Republic. The second inflation was a different creature. It occurred during and after the Third Reich and Second World War. It was a ‘repressed’ inflation, characterized by price controls, empty shelves and a flourishing black market. Both inflationary episodes ended with the same result: Germany’s currency had become worthless as a means of exchange. Germany’s deflation, which marked the twilight years of the Weimar Republic, had devastating consequences. The deflation aggravated mass unemployment, helping to radicalize an electorate that was becoming increasingly disillusioned with democracy. Mass unemployment turned the National Socialists from a fringe party into an electoral force.431
Throughout this all stood Germany’s central bank, the interwar Reichsbank. The Reichsbank was independent of government instruction from 1922 until 1937. These dates are important. It means the interwar Reichsbank was independent at the height of the hyperinflation and the depths of deflation. The origins of the Reichsbank’s central banking independence were not German; rather, they were foreign. The Reichsbank was made independent in May 1922 at the behest of the Allied powers, who made it a key condition should Germany receive a moratorium on its reparations burden – the enormous sum of money imposed on the country following its defeat in the First World War.432 In the late 1920s, under the leadership of Hjalmar Schacht, the independent Reichsbank became a controversial political actor.433 And during the Great Depression, too, it pursued restrictive
430 For the sake of clarity, the public sphere is defined as an array of media platforms which served to foster
public debate: that is, regional and national newspapers, journals, radio and television. 431 Feldman (1996), p.854. 432 Holtfrerich (1988), p.115. 433 Müller (1973), pp.44-51.

New Researchers - Session II / E
205
monetary policies that helped worsen economic conditions.434 Taken as a whole, the interwar record of central banking independence was a troubled one. The Bank deutscher Länder: a ‘child of the occupation’
The Bank deutscher Länder, established in 1948, was a by-product of its time. It was founded over a year before the establishment of the Federal Republic. Germany’s territory was divided among the four Allied military powers – America, Britain, France and the Soviet Union – following its defeat in the war. Each authority administered its own ‘zone’. By 1948, America, France and Britain had joined their zones to form a western bloc. The creation of the Bank deutscher Länder was ultimately a compromise stemming from American and British negotiations.435 German opinions were not heeded. As such, the new central bank was seen as a ‘child of the occupation’, a product of military law.436
The Bank deutscher Länder was set up to help oversee the currency reform of 1948, which introduced the deutschmark. It was a federal institution, with its key decision-making body, the central bank council, comprised primarily of men appointed by the various state governments. The Allied powers maintained a veto over the central bank council’s decisions. But the Allies decided that the Bank deutscher Länder should itself be independent from German political authorities.437 It was the second time that the impetus for central banking independence came from abroad. Adenauer: reclaiming sovereignty
The Bank deutscher Länder was seen as a provisional institution. A foreign creature operating on occupation law, it did not fit into the vision of a new republic. The West German state sought to reclaim sovereignty in areas of political and economic importance following its creation. Its constitution, the Basic Law, stated that the German parliament was to pass legislation establishing a federal bank, or Bundesbank, to replace the functions of the Bank deutscher Länder. In 1949 it was assumed by many politicians, including the chancellor Konrad Adenauer, that it was only a matter of time before the central bank was placed under the government’s thumb.438 As the economic historian Volker Hentschel notes, ‘Politicians of all parties were of the view that the complete independence of the Bank deutscher Länder was a mistake of occupation policy in need of correcting’.439 Even Ludwig Erhard, the new economics minister, acknowledged the primacy of the state in the formation of economy policy.440 Where politicians differed was over the extent to which the federal government should be able to influence monetary policy. The fight for central banking independence, 1949-51
Supporters of central banking independence pointed to the lessons of the Weimar Republic’s abysmal hyperinflation. Opponents, on the other hand, stressed the independent Reichsbank’s dismal record during the Great Depression. At the dawn of the new republic, it remained to be seen which side would triumph. The Bank deutscher Länder, for its part, did not stand in the corner of this public discussion. Rather, it stepped into the fray. And it used lessons taken from Germany’s monetary history to support its efforts.
The Bank deutscher was led in this respect by Wilhelm Vocke, chairman of the directorate, the body which ran the central bank’s day-to-day operations. A former Reichsbanker – he entered the monetary authority in 1918 and left in 1939 – Vocke was an
434 James (1999), pp.29-31. 435 Dickhaus (1996), pp.49-53. 436 Emminger (1986), p.20. 437 Wandel (1980), p.69. 438 Buchheim (2001), pp.17-21. 439 Hentschel (1988), p.10. 440 Ludwig Erhard to Fritz Schäffer, 12 Oct. 1950, Bundesarchiv Koblenz [BAK], B102/5706.

New Researchers - Session II / E
206
avid supporter of central banking independence. His very first speech before the entire central bank council stressed the need for its defence.441 Following its establishment, West Germany was in desperate need of capital to help rebuild its shattered infrastructure; Vocke argued that to remove the central bank’s independence vis-à-vis the Bonn government was to enable the government to embark on reckless spending programmes, endangering the currency.
An internal central bank taskforce was set up to monitor the political debate surrounding the Bundesbank Law.442 In September 1949 the central bank began to lobby the federal government behind the scenes for the maintenance of the central bank’s independence.443 Such efforts were unlikely to succeed, as one internal Bank deutscher Länder report lamented.444 This fear was confirmed when the finance minister, Fritz Schäffer, proposed the first draft of the Bundesbank Law to the federal cabinet in March 1950. Schäffer was an opponent of central banking independence. His draft proposed the establishment of an arbitration committee, comprised of government and central bank officials, to oversee disputes between Bonn and Frankfurt concerning monetary policy. The second draft, which appeared later that month, strengthened the government’s grip, giving Bonn an effective veto on central banking decisions. In 1950 Schäffer grounded his arguments with reference to the independent Reichsbank’s controversial actions during the Great Depression.445
The Bank deutscher Länder efforts at persuading the government behind the scenes had failed. The monetary authority fired back with a counter-draft of the Bundesbank Law, and explicitly stressed the need for central banking independence ‘in light of two inflations triggered by the state occurring within a single generation’.446 By now the central bank also took to the public sphere. The Bank deutscher Länder’s communication channel was surprisingly centralized. Interaction with the media was controlled by Vocke’s directorate.447 The central bank began a campaign via the media to win public opinion over to the benefits of central banking independence. The Bank deutscher Länder’s press chief during the 1950s treated ‘public opinion’ and ‘the press’ as synonymous terms.448 Initially, the central bank pursued this campaign behind the scenes. The monetary authority was helped in this respect by Volkmar Muthesius, whose publication Die Zeitschrift für das gesamte Kreditwesen the central bank helped finance.449 An established journalist, Muthesius used his network of contacts to organize a number of confidential meetings with leading newspapers on behalf of the central bank.450 These meetings took place in Frankfurt, Munich, Hamburg and Stuttgart. In the Frankfurt meeting, which a Bank deutscher Länder official also attended, the need for central banking independence was stressed to the general agreement of the journalists present; this need for independence was grounded in light of Germany’s history of inflations.451 It was agreed that the central bank’s cause be supported by the newspapers in question. Muthesius also organized a number of pro-central banking independence articles to be published in newspapers around Germany.
The Bank deutscher Länder also took to the public sphere directly. Vocke was cautious, however. He timed his interventions at moments when he felt there was little choice
441 Central bank council minutes, 1 Jun. 1948, Deutsche Bundesbank Historisches Archiv [DBHA], B330/2/3. 442 Central bank council minutes, 30-31 Aug. 1949, DBHA, B330/17/1. 443 See, for instance, Wilhelm Vocke to Konrad Adenauer, 31 Oct. 1949, DBHA, B330/2011. 444 Friedrich Wilhelm von Schelling to Wilhelm Vocke, 24 Oct. 1949, DBHA, B330/2011. 445 ‘Begründung – Entwurf. Gesetz über die Währungs- und Notenbank des Bundes (Bundesbankgesetz)’, Nov.
1950, BAK, B102/5648 II. 446 Central bank council minutes, 31 Mar. and 4-5 April, 1950, DBHA, B330/25/1. 447 Wilhelm Vocke to all Bank deutscher Länder departments, 2 Aug. 1948, DBHA, B330/3356. 448 Viktor von der Lippe to Wilhelm Vocke, 15 Feb. 1956, DBHA, B330/2032 I. 449 Muthesius (1973), p.128; Volkmar Muthesius to Victor Wrede, 12 Jun. 1948, DBHA, B330/3356. 450 Volkmar Muthesius to Victor Wrede, 9 Mar. 1950, DBHA, B330/3357. 451 ‘Diskussionsthesen für die Aussprache am 11. April 1950’, 11 Apr. 1950, DBHA, B330/3357; and Viktor
von der Lippe to Victor Wrede, 12 Apr. 1950, DBHA, B330/3357.

New Researchers - Session II / E
207
but to act.452 ‘[L]et me state a fact’, Vocke said before an audience of bankers on 12 May 1950. ‘An independent central bank, one free from politics, is the best guarantee of the currency, especially here in Germany, where the currency stands or falls with the central bank and its management … The time when you have to destroy the independence of the central bank is when you wish, as Hitler did, to start an inflation. No sensible person wants to do that now’.453 Other central bank speeches in support of independence followed.
The emergence of the Korean War and West Germany’s first balance of payments crisis in late 1950 heightened the public debate. But the dispute itself came to a sudden halt with the surprise Allied decision in March 1951 to return monetary sovereignty back to the German state. It was expected that the German state would come up with legislation quickly to allow this to happen. But there was still no consensus concerning the Bundesbank Law. As such, a temporary piece of legislation, the Transition Law, was passed in mid-1951. The Transition Law removed the Allied veto and the Bank deutscher Länder remained effectively independent from German control. The fight for central banking independence, 1956-7
The Bank deutscher Länder began to enjoy an increased public profile as time went on. The central bank gradually shed its image in the West German media as a product of Allied occupation law. Instead, it began to be seen as a German institution. In part, this was due to the fact that it now operated under West German law. However, the legitimacy of the monetary authority’s structure and institutions was also buoyed in light of strong economic growth and the deutschmark’s ascension to one of the most trusted currencies on the continent.
Overall Frankfurt enjoyed good relations with Bonn during the period 1952 to mid-1955. This was not to last, however. Inflationary forces began to assert themselves and the central bank felt compelled to increase the interest rate on several occasions to ward off the threat. This earned the anger of the chancellor. In an unprecedented speech in May 1956, Adenauer launched a public attack on the central bank’s independence. ‘The central bank council, gentlemen, is completely sovereign from the federal government. It is of course accountable to itself, but here we have an institution that is responsible to no one, not even parliament, not even a government’. The discount rate hike, Adenauer famously said, was like a ‘guillotine’ falling down on the West German people.454
It was one of Adenauer’s few political mistakes. Public opinion had shifted markedly towards the central bank: the Bank deutscher Länder had the strong support of the mainstream press. News articles and commentary pieces flowed in support of the monetary authority’s policy.455 Der Spiegel depicted Vocke on the front page with the title ‘chancellor of the deutschmark’.456 The central bank’s triumph emerged at the expense of the chancellor’s standing. Adenauer damaged the solidarity of his cabinet just a year before the next election. Vocke, too, emerged from the ‘guillotine’ affair stronger and more confident. Speaking before an audience in Hamburg, Vocke discussed the indispensability of central banking independence for the economy’s health:
[T]he remembrance of the experiences which the German nation has passed through in the currency field has been terrible and is still alive in our memories. If it is desired to produce a new bank law, then such a law must have only one aim, viz. the preservation of
452 Viktor von der Lippe to Willy Wenzke, 30 Sep. 1954, DBHA, B330/2052. 453 Wilhelm Vocke, ‘Sound money for savers’ speech, 12 May 1950, Deutsche Bundesbank Pressearchiv
[DBPA], no. 1242, pp.5-6. 454 Deutsche Bundesbank (1986), p.154. 455 See, for instance, ‘Ein Lob der Unabhängigkeit’, Die Zeit, 5 Jul. 1956. 456 ‘Die Weiche wird gestellt’, Der Spiegel, 6 Jun. 1956.

New Researchers - Session II / E
208
what we have achieved in the currency field, the reinforcement and maintenance of confidence in the currency and of confidence in the central bank.457
Shortly after the affair, Vocke was interviewed by the tabloid newspaper Bild Zeitung,
another indication of his popularity, and a collection of Vocke’s speeches was released in the months following the clash with Adenauer by a publishing house linked to Muthesius.458
The chancellor backed down; but he continued his efforts to limit the monetary authority’s independence behind the scenes. Adenauer was now an isolated figure, however. Key figures in his government, such as Erhard, as well as the media, were against the idea of a government veto on central banking policy. A compromise was reached. The Bundesbank Law was eventually passed in July 1957. The legislation stated that the central bank was independent of government instruction, but that it was to support the general economic policy of the government. Bonn increased its influence via a different route, too: the government could now appoint the central bank’s directorate. Nevertheless, a sizeable degree of independence remained. Conclusion
The Bank deutscher Länder, ‘a child of the occupation’, helped to defend its independence vis-à-vis Bonn by means of a press policy that aimed to win the support of the West German people. Historical narratives of Germany’s two inflations played a crucial role in this endeavour. And they did so despite the mixed record of interwar central banking independence. Today historians and journalists often remark on the German aversion to inflation, an attitude frequently attributed to the so-called ‘national trauma’ of the Weimar hyperinflation.459 The lessons of the hyperinflation, too, were often used to justify the Bundesbank’s independence. This paper has demonstrated that there was no West German consensus for central banking independence in the early postwar years, however. By contrast, it was the subject of public debate. Historical narratives of 1922-3 and the second inflation entered the public discussion primarily due to a clash of interests between Frankfurt and Bonn. These narratives remained thereafter because an increasingly powerful institution, the Bundesbank, had a strong interest in propounding them. The memory of the hyperinflation has survived so well in Germany in part because it proved to be a useful one. This paper, then, provides a clue as to why the Weimar inflation is remembered to this day in Germany, while other ‘traumas’ of Weimar, such as mass unemployment, are largely forgotten. Bibliography Primary sources
Bundesarchiv Koblenz (BAK), Koblenz Erhard, L. to Fritz Schäffer, 12 Oct. 1950, BAK, B102/5706. Deutsche Bundesbank Historisches Archiv (DBHA), Frankfurt ‘Begründung – Entwurf. Gesetz über die Währungs- und Notenbank des Bundes
(Bundesbankgesetz)’, Nov. 1950, BAK, B102/5648 II. Central bank council minutes, 1 Jun. 1948, DBHA, B330/2/3. Central bank council minutes, 30-31 Aug. 1949, DBHA, B330/17/1. Central bank council minutes, 31 Mar. and 4-5 April, 1950, DBHA, B330/25/1. ‘Diskussionsthesen für die Aussprache am 11. April 1950’, 11 Apr. 1950, DBHA, B330/3357. von der Lippe, V. to Victor Wrede, 12 Apr. 1950, DBHA, B330/3357. von der Lippe, V. to Willy Wenzke, 30 Sep. 1954, DBHA, B330/2052.
457 Wilhelm Vocke, ‘Hundredth anniversary of the Vereinsbank at Hamburg’ speech, 11 Aug. 1956, DBPA, no.
1244, p.4. 458 ‘Er hält die Mark an der Kette‘, Bild Zeitung, 4 Jun. 1956; Vocke (1956). 459 See, for instance, Kennedy (1998), p.2.

New Researchers - Session II / E
209
von der Lippe, V. to Wilhelm Vocke, 15 Feb. 1956, DBHA, B330/2032 I. Muthesius, V. to Victor Wrede, 12 Jun. 1948, DBHA, B330/3356. Muthesius, V. to Victor Wrede, 9 Mar. 1950, DBHA, B330/3357. von Schelling, F. W. to Wilhelm Vocke, 24 Oct. 1949, DBHA, B330/2011. Vocke, W. to all departments in the Bank deutscher Länder, 2 Aug. 1948, DBHA, B330/3356. Vocke, W. to Konrad Adenauer, 31 Oct. 1949, DBHA, B330/2011. Deutsche Bundesbank Pressearchiv (DBPA), Frankfurt Vocke, W., ‘Sound money for savers’ speech, 12 May 1950, DBPA, no. 1242. Vocke, W., ‘Hundredth anniversary of the Vereinsbank at Hamburg’ speech, 11 Aug. 1956,
DBPA, no. 1244. Secondary sources
Buchheim, Christoph. 2001. ‘Die Unabhängigkeit der Bundesbank. Folge eines amerikanischen Oktrois?’, Vierteljahrshefte für Zeitgeschichte, Vol. 49, No. 1.
Deutsche Bundesbank (ed.). 1986. Geheimrat Wilhelm Vocke, Hüter der Währung, Zum hundertsten Geburtstag am 9. Februar 1986, (Frankfurt am Main).
Dickhaus, Monika. 1996. Die Bundesbank im westeuropäischen Wiederaufbau: die internationale Währungspolitik der Bundesrepublik Deutschland 1948 bis 1958, (Munich).
Emminger, Otmar. 1986. D-Mark, Dollar, Währungskrisen: Erinnerungen eines ehemaligen Bundesbankpräsidenten, (Stuttgart).
Feldman, Gerald. 1996. The great disorder: politics, inflation and society in the German inflation 1914-1924, (Oxford).
Hentschel, Volker. 1988. ‘Die Entstehung des Bundesbankgesetzes 1949-1957. Politische Konflikte: Teil I’, Bankhistorisches Archiv, Vol. 14.
Holtfrerich, Carl-Ludwig. 1988. ‘Relations between monetary authorities and governmental institutions: the case of Germany from the 19th century to the present’, in Gianni Toniolo, (ed.), Central banks’ independence in historical perspective, (Berlin).
James, Harold. 1999. ‘The Reichsbank 1876-1945’, in Deutsche Bundesbank, (ed.), Fifty years of the Deutsche Mark: central bank and the currency in Germany since 1948, (Oxford).
Kennedy, Ellen. 1998. ‘The Bundesbank’, German Issues, Vol. 19. Müller, Helmut. 1973. Die Zentralbank – eine Nebenregierung: Reichsbankpräsident
Hjalmar Schacht als Politiker der Weimarer Republik, (Opladen). Muthesius, Volkmar. 1973. Augenzeuge von drei Inflationen. Errinerungen und Gedanken
eines Wirtschaftspublizisten, (Frankfurt am Main). Vocke, Wilhelm. 1956. Gesundes Geld, (Frankfurt). Wandel, Eckhard. 1980. Die Entstehung der Bank deutscher Länder und die
Währungsreform, (Frankfurt).

New Researchers - Session II / E
210
‘Guiding the invisible hand’460: market equilibrium and multiple exchange rates in Brazil, 1953-61
Bernardo Stuhlberger Wjuniski, London School of Economics
([email protected]) Supervisor: Dr Alejandra Irigoin
Capital controls have been a constant topic for economic historians since the emergence of the Bretton-Woods (BW) system in 1944. Specifically during the 1950s, the shortage of dollar liquidity and the lack of currency convertibility made capital controls with the use of parallel or multiple exchange rates (MER) largely common in Europe and Latin America (Bordo, 1993; Reinhardt & Rogoff, 2002). These controls were generally not welcome by the IMF, which was only in favour of restrictions to capital account transactions, and are also largely seen partly as cause for balance of payments crisis and large currency devaluations in some of these experiences (Magud at all, 2011; Konig, 196; Edwards, 1999).
This paper revisits this assumption questioning whether capital controls are not the cause but mostly a symptom of the large currency misbalance of Bretton-Woods. It focuses on an example of capital controls in the form of MER which was effective to help markets in balancing the economy. This was the unique case of MER in Brazil between 1953 and 1961, when a centralized system of foreign exchange auctions successfully managed to stabilize the balance of payments and reach macroeconomic equilibrium, with decent growth rates, inflation under control and without the emerge of a black market for the exchange rate.
Historians see it as a successful case, but the mechanics behind its effectiveness were never revealed.461 By performing two simple econometric tests – random walk and granger causality – this paper argues that the Brazilian MER system was effective because officials were responsive to market demand despite using a centralized system for foreign currency distribution. While there are no records of the exact intentions of policy makers, these exercises suggest a pragmatic response to changes in market fluctuations and a centralized regime which was replicating a market clearing process. By ‘guiding the invisible hand’ this use of capital controls complemented markets and was effective for the needs of that period. Peak and decline of Brazil’s MER system
In 1945 the Brazilian currency (Cruzeiro) was fixed at its 1939 (prewar) level to keep inflation under control and based on the belief that exports (mostly coffee) were inelastic to currency depreciation. But this overvaluation and the shortage of global dollar liquidity originated large problems to stabilize the balance of payment, which remained under pressure for eight years even with some attempts to restrict imports with ineffective quantitative controls (Lago, 1982). In 1952 the current account deficit peaked at U$ 600 million (2.7 per cent of GDP) nearing a balance of payments crisis.
In October 1953, the Brazilian monetary authority (Sumoc) created the multiple exchange rates regime targeting to correct this disequilibrium. It replaced the pegged official currency by auctions of foreign exchange for imports, which were distributed in categories according to their level of priority. To regulate outflows, Banco do Brasil, the operator of the system, established the quantities of dollars to be auctioned daily in each category in regional marketplaces (Vianna, 1987). With fixed quantities, bidders then defined the price of foreign exchange. The rationale was to rank sectors and differentiate their import prices and the higher the category, the smaller the volume of foreign exchange offered, inducing a selective
460 The title echoes the book by Love, Joseph and Nils Jacobsen. 1988. ‘Guiding the invisible hand: economic
liberalism and the state in Latin American history’. New York: Praeger. 461 Kafka (1956), Huddle (1964), Baer (2009). Figueiredo Filho (2005), Lago (1982), Vianna (1987),
Sochazewski, (1980), and Caputo (2007).

New Researchers - Session II / E
211
depreciation of the exchange rate for each category. Category 1 included the most essential sectors such as food, chemistry, agricultural equipment and medicine. Category 2 production inputs, electrical material and medical equipment. Category 3 all industrial equipment, capital goods and vehicles. Category 4 all non-essential equipment and Category 5 all remaining sectors. Chart 1 shows the average monthly exchange rate for each category.
Chart 1: Multiple exchange rates (Cr$ per U$)
-50
50
150
250
350
450
550
650
Jan-
51
Jul-5
1
Jan-
52
Jul-5
2
Jan-
53
Jul-5
3
Jan-
54
Jul-5
4
Jan-
55
Jul-5
5
Jan-
56
Jul-5
6
Jan-
57
Jul-5
7
Jan-
58
Jul-5
8
Jan-
59
Jul-5
9
Jan-
60
Jul-6
0
Pre-MER 1 2 3 4 5 Special-New General-NewCr$ per US$
Source: Annual Reports of Banco do Brasil (1951-1961)
The devaluation reached in all categories was impressive. In extreme cases, the exchange rate reached 1700 per cent of depreciation, with the official Cr$ 18.5 rate being kept as the reported parity to the IMF (Vianna, 1987). With all foreign exchange centralized and auctioned, the immediate result of the new system was effective to reduce imports and the current account and balance of payments quickly stabilized. And all of these happened without the emergence of a black market or a major spike in inflation which remained around 15-20 per cent as shown in chart 2, which shows the current and the balance of payments recovering rapidly between 1953 and 1955.

New Researchers - Session II / E
212
Chart 2: Balance of payments (U$ million) and inflation (%)
(700.0)
(600.0)
(500.0)
(400.0)
(300.0)
(200.0)
(100.0)
-
100.0
200.0
300.0
1946 1947 1948 1949 1950 1951 1952 1953 1954 1955 1956 1957 1958 1959 1960 19610.0%
5.0%
10.0%
15.0%
20.0%
25.0%
30.0%
35.0%
40.0%
45.0%
Current Account Balance of Payments Inflation Source: Estatisticas Historicas do Brasil - Instrituto Brasileiro de Geografia e Estatistica (IBGE)
In 1956 there was a change in the Brazilian government (Juscelino Kubistchek assumed the Presidency) which brought about significant modifications to economic policies in an effort to accelerate growth and substitute imported manufactures. This was the trigger for the auction system to slowly start to decline. The government reformed it by reducing the number of categories from five to three, reintroducing ad valorem tariffs and creating a large number of exemptions for imports to take place outside the MER system. The objective was to reduce restrictions to foreign exchange liquidity and to further stimulate industrialization through additional differentiation; but these changes also rapidly led to a deterioration of the macroeconomic equilibrium (Sochczewski, 1980). By replacing the quantitative restrictions of the MER with import tariffs and exemptions, the new system severely distorted the controls of outflows; imports rose quickly and the dollar shortage reappeared. At the same time, to fund infrastructure investments monetary expansion also surged at an annual growth rate of 15 per cent y/y in 1955 to 60 per cent y/y in 1958 in the monetary base (Lago, 1982). 462
These populist policies further pressured imports and inflation, and the balance of payments deteriorated to a deficit of almost $500 million dollars (2.3 per cent of GDP) by 1960, forcing the cash out of reserves and the end of the MER regime in 1961. According to the policy maker responsible for ending the system, Mr Bulhoes (1990, pg 131), there was no other option at that time other than letting the currency depreciate and fight its inflationary impacts with monetary control. A gradual depreciation of the exchange rate had been ruled out.
462 And to fund the construction of the new capital of the country, Brasilia.

New Researchers - Session II / E
213
Responsive allocation of foreign exchange
But while Mr Bulhoes did not have an option in 1961, did previous policy makers know why the original system was working so well before? The singularity of the first phase of the system was how the discretionary distribution of foreign exchange resulted in a balanced economy. Authorities had to reconcile demands for liquidity in each category while managing restrictions on the access to foreign exchange to the economyc as a whole. In a way, they were almost replicating a market clearing process. To test the role of the government – in the absence of explicit records in these regards – a double econometric experiment helps to test the government responsiveness.
First, a random walk exercise on the quantities of foreign exchange allocated to each category should test whether there was no exogenous distribution of foreign exchange, an indication that good macroeconomic results were probably just pure luck; or the existence of some exogenous choices, an indication officials were looking at markets. In so doing I use the series of effectively auctioned foreign exchange in each of the five categories between 1953 and 1957, compelled in a new database463. The data is presented below in charts 3 and 4.
Chart 3: auctioned foreign exchange, 1953-57 (U$ 1.000)
0
5000
10000
15000
20000
25000
30000
35000
40000
45000
Oct
-53
Apr
-54
Oct
-54
Apr
-55
Oct
-55
Apr
-56
Oct
-56
Apr
-57
Cat 1 Cat 2 Cat 3 Cat 4 Cat 5
Source: Sumoc Annual Bulletins, 1953-1961. IBGE National Statistic
463 Banco do Brasil and Sumoc only reports the quantities effectively purchased by category for the years between 1953 and
1955. To obtain the remaining distribution between 1955 and 1957, we collected import data and aggregated them for each of the five categories. A few gaps in the series were interpolated.

New Researchers - Session II / E
214
Chart 4: auctioned foreign exchange, 1953-57 (% of total)
0%
20%
40%
60%
80%
100%O
ct-5
3
Jan-
54
Apr
-54
Jul-5
4
Oct
-54
Jan-
55
Apr
-55
Jul-5
5
Oct
-55
Jan-
56
Apr
-56
Jul-5
6
Oct
-56
Jan-
57
Apr
-57
Jul-5
7
Cat 1 Cat 2 Cat 3 Cat 4 Cat 5
Source: Sumoc Annual Bulletins, 1953-1961. IBGE National Statistic
Both charts insinuate that officials did follow some form of pattern of allocation over time, maintaining similar relative shares for each category. But the distribution also varied a lot, mostly between the three main categories which included the most essential (such as food or chemicals) and capital goods. If this variation can be considered not random, then there are indications that the distribution between categories was an exogenous choice. The simple random walk equation is Yt = Yt-1 + Et and the standard test is the ADF (Augmented Dickey-Fuller) (Enders, 2004). I opted for an ADF with a random walk function including intercept and only one lag. The results are presented below in table 1.
Table 1: Random walk test - ADF T‐Statistic P‐value Rejects Random Walk?
Caterory 1 ‐3.24 0.0238 Yes
Caterory 2 ‐4.3 0.0013 Yes
Caterory 3 ‐3.698 0.0073 Yes
Caterory 4 ‐2.852 0.059 Yes*
Caterory 5 ‐4.571 0.0006 Yes * Only at 10% confidence
The table shows that the null hypothesis of existence of a random walk is rejected in
all tests. This is consistent with changes in the allocation of foreign exchange over time, indicating that officials were making an exogenous decision on this distribution.
The second test gives further evidence that this non-random allocation was indeed a response to market demand. Since there is no direct qualitative evidence of how officials were allocating between categories, this helps to show if there are indications they were responding to market fluctuations. I perform two Granger causality tests. In the first one, I use one interesting characteristic of the available new database: the separation between a) the quantities of foreign exchange offered in the MER system and b) the quantities effectively purchased by markets. The difference between the quantities offered and auctioned is a good indicator of the size of the market demand. A huge gap means there was over allocation of foreign exchange, while a very small gap indicates a more adequate distribution. If officials

New Researchers - Session II / E
215
were being responsive to market demand the volume of currency effectively auctioned should help to predict – Granger cause – the gap in the following period, an indication that the result at a specific moment helped to determine the new offers in the following one. Chart 5 presents the results of this test.
Chart 5: auctioned foreign exchange and gap between auctioned and offered foreign exchange (U$ million), 1953-61
$-
$50,000
$100,000
$150,000
$200,000
$250,000
Oct
-53
Apr-
54
Oct
-54
Apr-
55
Oct
-55
Apr-
56
Oct
-56
Apr-
57
Oct
-57
Apr-
58
Oct
-58
Apr-
59
Oct
-59
Apr-
60
Oct
-60
Auctioned Currency Gap Source: Sumoc Annual Bulletins, 1953-1961
Chart 5 shows the changes in the pattern between auctioned foreign exchange and the gap. In the beginning of the series, the gap was much larger, including a peak in 1954 which is not related to any specific policy changes. In time, the gap fell rapidly while the amount of auctioned currency shows a smoother downward trend. And this learning process apparently took place even before the policy changes in 1957, which reduced the amount of foreign exchange in the system. This suggests policy makers were looking at the results of the auctions to gradually offer more accurate quantities and reduce the gap over time. The test results are presented in table 2.
Table 2: Granger causality test 1 F‐Statistic P‐value Granger Cause?
GAP Auctioned Currency 0.7 0.4 No
Auctioned Currency GAP 3.41 0.0681 Yes*
Offered Currency Auctioned Currency 0.7 0.4 No
Auctioned Currency Offered Currency 0.1 0.749 No
Direction of Causality
granger cause
* Only at 10% confidence
As expected, the granger causality is only statically significant when the auctioned
currency is tested to granger cause the gap. This indicates that the currency effectively auctioned helps to predict the gap in the following period.
An additional test helps to confirm that officials were responding to markets; it follows the same concept but focuses on exchange rate prices. There is available price data for free market exchange rates. While all trade operations went through the auctions, there was a free floating exchange rate market only for service and capital account operations in place before the auctions. It was a very small part of the economy since the capital account was mostly closed, but this market clearing was free from any control over foreign exchange

New Researchers - Session II / E
216
supply. A granger causality between the free market price of exchange rate and that of the weighted average auctions based on the quantities allocated in each sector can test whether officials responded to the free market rate to distribute foreign exchange and thus if they controlled the pace of depreciation in the auctions rate. The two series are presented in chart 6.
Chart 6: Free market rate and weighted auctions rate, 1953-57 (Cr$)
0
20
40
60
80
100
120
140
160
180
Oct
-53
Dec
-53
Feb-
54
Apr-
54
Jun-
54
Aug-
54
Oct
-54
Dec
-54
Feb-
55
Apr-
55
Jun-
55
Aug-
55
Oct
-55
Dec
-55
Feb-
56
Apr-
56
Jun-
56
Aug-
56
Oct
-56
Dec
-56
Feb-
57
Apr-
57
Jun-
57
Aug-
57
Auctions Exchange Rate Free Market Exchange Rate
Source: Sumoc Annual Bulletins, 1953-1961; Banco do Brasil Anual Repots, 1953-1961
The two series follow different trends. While the free market exchange rate depreciated in a more stable path over time, the weighted auctions rate had a more volatile course, reflects the variation in the distribution of foreign exchange discussed above. The test result is presented in table 3.
Table 3: Granger causality test 2 F‐Statistic P‐value Granger Cause?
Market Auctions 4.17 0.047 Yes
Auctions Market 0.03 0.85 Nogranger cause
Direction of Causality
The test shows that only the market exchange rate granger causes the auctions rate. This confirms that while these were two separate markets, it seems that officials were observing the free market rate to determine how much to distribute and this control the path of depreciation in the auctions rate. Conclusions
This paper concludes that the responsiveness from Brazilian officials to market demand helps to explain the effectiveness of the Brazilian MER system between 1953 and 1957. The distribution of foreign exchange was not random and there is an econometric indication – that this was a response to results of the previous auctions and to the free market rate to determine the distribution of foreign exchange in the following periods without causing noticeable major macroeconomic disequilibria.
It contributes to the literature on capital controls and Bretton-Woods (Bordo, 1993; Reinhardt & Rogoff, 2002; Magud at all, 2011, Konig, 1968) and contests the general assumption that capital controls were part and parcel of the balance of payments difficulties. It reveals the mechanics of a unique and effective use of exchange controls during Bretton-Woods. Brazilian officials were ‘guiding the invisible hand’ to help markets balancing the

New Researchers - Session II / E
217
economy, an outstanding result in a time when most similar experiences failed to reach macroeconomic stability. References Primary Sources
Annual Reports of Banco do Brasil (1951-1961) Monthly Bulletins of Sumoc (1955-1961) Contas Nacionais - Series Historicas - IBGE Secondary Literature
Baer, Werner. (2009). A Economia Brasileira. 4th Edition. São Paulo: Nobel. Bordo, Michael D. (1993). ‘The Bretton Woods International Monetary System: A Historical
Overview’, in Bordo, M & Eichengreen, B (eds) (1993) A Retrospective on the Bretton Woods System: Lessons for International Monetary Reform. Chicago: University of Chicago Press.
Bulhoes, Otavio Gouveia de (1990) Otavio Gouveia de Bulhoes: Depoimento. Memoria do Banco Central: Programa de Historia Oral do CPDOC/FGV. Brasilia: Banco Central.
Caputo, Ana Claudia (2007) ‘Desenvolvimento Economico Brasileiro e o Investimento Direto Estrangeiro: Uma Analise da Instrucao 113 da Sumoc’, Master dissertation presented to Universidade Federal Fluminense. Niteroi.
Edwards, Sebastian (1989) ‘Exchange Controls, Devaluations and Real Exchange Rates: The Latin American Experience’. Economic Development and Cultural Change, vol. 37, no. 3, pp.457-494.
Ender, Walter (2004) Applied Econometric Time Series, 2nd Edition. New Jersey: John Wiley & Sons.
Figueiredo, João Sidney (2005) Políticas Monetária, Cambial e Bancária no Brasil sob a gestão do Conselho da Sumoc, de 1945 a 1955. Master Dissertation presented for Universidade Federal Fluminense (UFF). Niteroi.
Hurddle, Donald (1964) ‘Balanço de pagamentos e contrôle de câmbio no brasil. diretrizes políticas e história, 1946-1954’, Revista Brasileira de Economia, 1963, vol. 18, issue 1, pages 5-40. Rio de Janeiro.
Kafta, Alexandre (1956) ‘The Brazilian Exchange Rate Auction System’, The Review of Economics and Statistics Vol. 38, N. 3, pp.308-322
Konig, Wolfgang (1968) ‘Multiple Exchange Rate Policies in Latin America’, Journal of Inter-American Studies, Vol 10, N. 1 pp.35-52.
Lago, Pedro Aranha Correa (1982) A Sumoc como Embrião do Banco Central: Sua Influência na Condução da Política Econômica, 1945-1965. Master dissertation presented to Pontificia Universidade Catolica do Rio de Janeiro (PUC-Rj). Rio de Janeiro.
Love, Joseph & Nils Jacobsen (1988) Guiding the invisible hand: economic liberalism and the state in Latin American history. New York: Praeger.
Magud, Nicolas E, Reinhart, Carmen M. & Rogoff, Kenneth S. ‘Capital Controls: Myth And Reality - A Portfolio Balance Approach’, NBER Working Paper 16805. Cambridge.
Reinhart, Carmen M. & Rogoff, Kenneth S (2002) ‘The Modern History of Exchange Rate Arrangements: a Reinterpretation’, NBER Working Paper 8963. Cambridge.
Sochaczewski, A.C (1980) ‘Financial and Economic Development of Brazil, 1952-1968’, Doctoral Thesis, London School of Economic and Political Science.
Vianna, Sergio Besserman (1987) A Politica Economica do Segundo Governo Vargas. 11 Premio BNDES de Economia. Rio de Janeiro.

New Researchers – Session II / F
218
Winter is coming: weather variations and social disorder in France, 1661 – 1789
Cédric Chambru, University of Geneva
([email protected]) Supervisors: Professors Michael Huberman & Salvatore di Falco
Abstract
I use a new database gathering 8,528 episodes of conflict in France over two centuries to investigate the historical relationship between the variability in weather and the onset of conflicts. Using panel logit estimates with cantonal and year fixed effect, I establish strong causal connections between weather variability and conflict. I claim that disaggregation matters, as the effects vary depending on the season and the type of conflict considered. Negative temperature variations foster the onset of conflict, but this effect is driven by subsistence conflict. I show that the effect of weather variability on the intensity of conflict is small, but increases significantly when only extreme variations (‘weather shocks’) are considered. Introduction
Recent research has documented the link between weather fluctuations and the onset of civil conflicts. For example, Hsiang et al. (2013), proceed to a meta-analysis of 'the 60 most rigorous quantitative studies' on the topic, and show that one standard deviation change in weather variable leads to a 14 per cent rise in the risk of intergroup conflict. I contribute to this line of research by investigating the relationship between weather variability and social conflict in France at the cantonal level between 1661 and 1789.
I refer to weather variations rather than to climate change, because I aim at studying the impact of short-term temporal variations whose variability can be very high (Dell et al., 2014). Henceforth, I use the term weather as a generic term for temperature proxies only.464
I use a definition of conflict that is wider than the usual threshold of 1,000 battle-deaths during each year of the war (Sarkees & Wayman, 2010)465 or that of the minimum of 25 persons killed in battle-related incidences within a calendar year (Gleditsch et al., 2002).466 For my purposes, the minimum criterion to include an event in the database is the participation of at least four individuals, from at least two different families, deploying a verbal or physical violence against property, persons or authorities.
I link a dataset gathering more than 8,500 episodes of conflict (Nicolas, 2002) and high-resolution temperature data (Luterbacher et al., 2005). Using panel logit estimation with time and cantonal fixed effects, I establish strong causal connections between weather variability and conflict in France between 1661 and 1789. The results are nonetheless mixed, and the effect depends on the season considered and the type of conflict. Lower temperatures increase the probability of conflict. I show that this effect is for subsistence-related conflict. Interestingly, positive deviations during the growing season of wheat have a positive and large effect on subsistence conflict as well. I suggest that the income channel can be at stake to explain this relationship. Warmer temperatures also affect positively protest against the authority, which could confirm the existence of a psychological channel in the climate-conflict nexus (Burke et al. 2014).
My work contributes to the literature on the historical link between weather fluctuations and conflict. In China, weather shocks and deviations from long-term means had a positive and significant impact on the onset of all kinds of conflicts: nomadic invasions, 464 Due to space restrictions, I do not focus on rainfall deviations. 465 http://www.correlatesofwar.org/ 466 http://www.pcr.uu.se/research/ucdp/

New Researchers - Session II / F
219
peasant revolts, and civil wars. Different mechanisms, including the introduction of sweet potatoes (Jia, 2014), and the expansion of Confucian norms (Kung & Ma, 2014), were able to mitigate the effect of weather variability. Surprisingly, Europe is nearly absent from this strand of literature. Exceptionally, Mehlum et al. (2006) study the effect of incomes shocks on property and violent crime in Bavaria in the nineteenth century. They show that weather shocks result in higher rye prices, i.e. an increase in poverty, resulting in more property crime.
Within the literature, my research is also closely related to French historiography. The spontaneity and the universality of the peasant uprisings are characteristics of the marxist analysis (Porchnev, 1963). An alternative interpretation posits that the causes of protest were not restricted to the struggle against the feudal order, but had multiple origins (Bercé, 1974; Ladurie, 1974). This paper seeks to revive this debate by testing for the impact of weather variations on the likelihood of all kinds of conflicts in France during the seventeenth and eighteenth centuries.467
The remainder of the paper is organized as follows. Section 2 presents the historical background. Section 3 depicts the data sources and the dataset construction. Section 4 specifies the empirical strategy and quantifies the effect of weather variations on the onset of conflict. Section 5 gives concluding remarks.
Historical background Administrative organization Since the early seventeenth century, the French state was becoming more centralized. With the Edict of May 1635, the mission of Intendants became permanent and evolved from a role of inspection to administration. They were held responsible for transmitting information on the situation in their Généralités.468 They had power in the sphere of finance, justice, and police. Fiscal organization The fiscal capacity of the state also evolved during the period undergoing increasing standardization of laws and regulations (Johnson & Koyama, 2014). There were two main kind of taxation: direct taxes and indirect taxes. The most important source of revenues was a direct tax: the Taille from which nobility and clergy were exempted. The main indirect tax was the Gabelle: a tax on salt. The French Revolution, and in particular the night of 4 August 1789 during which deputies abolished feudal privileges, symbolizes the end of the Ancien Regime. Social organization In 1789, the clergy and the nobility numbered about 150,000 and 350,000 people, or about 2 per cent of the population. The Third Estate gathers in a deeply heterogeneous group 98 per cent of the population.469
A defining feature of French society are differences in family structure, repartition of ownership, cultivation methods and types, even at a very local level. For instance in Alsace, oats represented 30-40 per cent of the harvest in the north-western area in 1700, while other localities did not cultivate it at all. Wheat was cultivated everywhere but areas closer to cities tended to sow larger quantities to supply customers able to afford white bread (Juillard,
467 Ladurie (2009) claims that ‘the idea of a weather mono-causality of the French Revolution would be absurd.
The challenge is to examine, so to speak, the ecological-climatic context, which is just one factor among many others: cultural, political, economic, demographic, etc.’.
468 In 1789, there were 33 Généralités. 469 According to my own calculations, 87.07% of the population lived in villages of less than or equal to 2,000
inhabitants in 1793 (unpublished data from project Géopeuple). About 10% of the Third Estate was city workers, and another 2%, or 500,000 people, belonged to the bourgeoisie.

New Researchers – Session II / F
220
1953).470 These differences had impacts on the methods of cultivation. Gaps appeared between regions using two-year, and triennial rotations. Broadly speaking, the north of France tended to used two-year rotation while the south used mainly three-year. Gaps in practices also existed: enclosures were widespread in the west, and open-field in the north and the Parisian Basin where fertile land left almost no space for breeding. On the contrary, more mountainous areas in which grazing was abundant relied mostly on livestock breeding and the forest to survive (Terrier, 1998).
Ownership of the land was also subject of large differences. Within the Generality of Paris in 1717, clergy owned from zero to 35 per cent of arable lands, nobility from zero up to 77 per cent in Coye, and people paying the Taille up to 100 per cent in Precy (Meuvret, 1977). This resulted in differences in exploitation of lands: leasing, sharecropping, and direct exploitation. In the north and the east, leasing was principally in used. The second was predominately used in the Midi, the Provence, the Languedoc, and in the western and central regions (Terrier, 1998).
I argue that these differences justify my decision to focus on the study of conflict at the very local level, the canton, rather than at larger administrative units, such as Généralités.
Data Climatic data
I employ temperature data reconstructed using instrumental techniques derived from paleoclimatology (Luterbacher et al., 2005). The dataset presents seasonal time resolution of data for the last 500 years at a grid resolution of 0.5° longitude x 0.5° latitude.471
My main measure of weather variability considers spring and summer, the growing season of the most cultivated staples in France, wheat. I also take into account temperature in the winter season. For each canton, I construct three weather anomaly variables using the following formula:
Where Wit is the value of weather variable in canton i at time t. is the long-term mean (1500-1600) of the weather variable in canton i. is the standard deviation of the long-term mean of the weather variable in canton i. I also construct a measure of ‘weather shock’ to capture only large weather variations, i.e. larger than two standard deviations from the long-term mean. GIS data
The project Géopeuple472 seeks to reconstruct the cantonal limits of France in 1793. The database has not been released yet, so I use the Database of Global Administrative Areas (GADM)473 to get the limits of the French canton. When a city is divided between several cantons, I merge cantons into a single unit, because the conflict data are not precise enough to attribute the event to a sub-part of the city. Overall, I obtain 3,208 cantons. Conflict data
I employ a dataset that records as extensively as possible social conflicts in France from 1661 to 14 July 1789.474 It consists of more than 8,500 episodes of conflict (figure 1). As a 470 Such diversity is also found between regions at the national level. See Terrier (1998). 471 Roughly 2,027 square kilometres at the latitude of Paris. 472 http://geopeuple.ign.fr 473 http://www.gadm.org/ 474 Bouton (2000) lists 1,265 food riots between 1661 and April 1789, and then 1,012 additional food riots until
30 June 1793. In comparison, Nicolas (2002) gathers 1,497 episodes of food riots between 1661 and 14 July 1789.
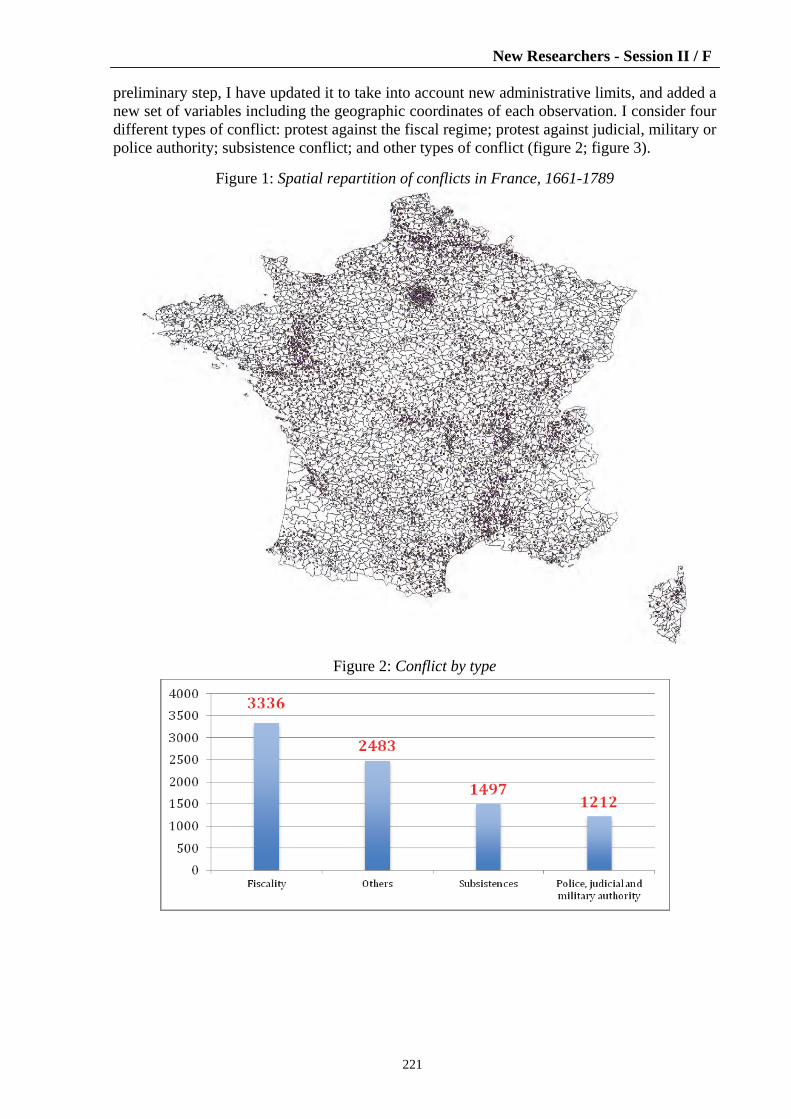
New Researchers - Session II / F
221
preliminary step, I have updated it to take into account new administrative limits, and added a new set of variables including the geographic coordinates of each observation. I consider four different types of conflict: protest against the fiscal regime; protest against judicial, military or police authority; subsistence conflict; and other types of conflict (figure 2; figure 3).
Figure 1: Spatial repartition of conflicts in France, 1661-1789
Figure 2: Conflict by type

New Researchers – Session II / F
222
Figure 3: Number of conflicts per year in France and prices of wheat in Paris, 1661-1789
Empirical strategy and results
I exploit year-to-year fluctuations in seasonal temperature to identify the causal effect of weather variations on different types of conflict. I use a panel logit model in which the dependent variable is social conflict, and the main independent variables are the measures of weather anomalies. The baseline specification can be summarized as follows:
Where is a dummy variable indicating whether there is a revolt of type j in canton i in year t. and denotes the anomaly variables in canton i in year t-1 and in year t.
captures the interaction of a set of control variables specific to canton i with a linear time trend475. and respectively refer to year and cantonal fixed-effects.
I find evidences of a strong relationship between weather variations and the onset of conflict in France between 1661 and 1789 (table 1). I find mixed results depending on the season and the type of conflict. Warmer winter in the past year reduces the incidence of conflict, while negative variations during the year promote the likelihood of conflict. In particular, the last effect is driven by subsistence conflict (table 2). The large and significant coefficient for the Positive Winter t variable seems to indicate that the income channel could be at stake (Miguel et al. 2004). Positive deviations during the growing season of wheat have a positive and large effect on subsistence conflict. High temperature (drought) is likely to reduce the yields of the harvest (Ladurie, 2006), and thus to encourage food-related conflict. However, the lack of time disaggregation makes it difficult to draw any conclusion on the driving motives, since the coefficient for past years is non-significant.476 Warmer temperatures also have a positive effect on the onset of conflict directly against the judicial, police or military authority. This result is consistent with previous findings in the literature, which document a relationship between high temperature and more violent behaviour (Blakeslee & Fishman, 2014; Burke et al. 2014).
475 Control variables are ruggedness and the agricultural suitability for cultivating wheat (FAO’s Global Agro-
Ecological Zones). http://www.fao.org/nr/gaez/en/ 476 I will tackle this seasonal issue in more detail in future work.

New Researchers - Session II / F
223

New Researchers – Session II / F
224
I use an OLS estimate to test for the effect of weather variations on the intensity of conflict. The baseline specification can be summarized as follows:
Where is a continuous variable capturing the intensity of conflict given the
number of participants in canton i in year t.477 The independent variables are the same as in equation (2).
Table 3 presents the results of the relationship between temperature variability and the intensity of conflict. Positive variations in winter have a small but significant effect on the number of participants, while negative variations reduced the intensity of conflict. These results are consistent with Ladurie & Rousseau (2009) who argue that in colder winters individuals can be incapacitated and incapable of undertaking any actions. Column 4 seems to confirm this hypothesis, as the effect of negative temperature on intensity is larger when only extreme deviations are considered.
Conclusion
To the best of my knowledge, this article is the first systematic study of the weather impact on conflict in France. I document a strong causal relationship, but results also call for further research. The effect of weather variability is mixed depending on the season considered and the type of conflict studied. The relationship seems to be mainly driven by subsistence conflict. Whilst the income channel might be behind the climate-conflict nexus, I suggest that other factors can be also at stake.
477 For a more precise definition of that variable, see Nicolas (2002).

New Researchers - Session II / F
225
References Bercé, Y. M., Histoire Des Croquants : Étude Des Soulèvements Populaires Au XVIIe Siècle
Dans Le Sud-Ouest de La France (Droz, 1974). Blakeslee, D. and Fishman R., ‘Weather Shocks, Crime, and Agriculture: Evidence from
India’, Working paper (2014). Bouton, C., ‘Les Mouvements de Subsistance et Le Problème de L’économie Morale Sous
l’Ancien Régime et La Révolution Française’, Annales Historiques de La Révolution Française 319, no. 1 (2000), pp.71–100.
Burke, M., Hsiang, S. M. and M. and Miguel, E., ‘Climate and Conflict’, National Bureau of Economic Research Working Paper Series, no. 20598 (October 2014).
Dell, M., Jones, B. F., and Olken, B. A., ‘What Do We Learn from the Weather? The New Climate-Economy Literature’, Journal of Economic Literature (forthcoming).
Hsiang, S. M., Burke, M., and Miguel, E., ‘Quantifying the Influence of Climate on Human Conflict’, Science 341, no. 6151 (2013), 12353-67.
Jia, R., ‘Weather Shocks, Sweet Potatoes and Peasant Revolts in Historical China’, The Economic Journal, no. 124 (2014), pp.92-118.
Johnson, N. D., and Koyama, M., ‘Tax Farming and the Origins of State Capacity in England and France’, Explorations in Economic History 51, no. 0 (2014), pp.1–20.
Juillard, E., La Vie Rurale Dans La Plaine de Basse-Alsace. Essai de Géographie Sociale, (Editions F. X. Le Roux, 1953).
Kung, J. K., and Ma., C., ‘Can cultural norms reduce conflicts? Confucianism and peasant rebellions in Qing China’, Journal of Development Economics, Volume 111 (November 2014), pp.132-149.
Ladurie, E. L. R., Histoire Humaine et Comparée Du Climat Tome 2: Disettes et Révolutions 1740-1860 (Fayard, 2006).
———, ‘Révoltes et Contestations Rurales en France de 1675 À 1788’, Annales. Économies, Sociétés, Civilisations 29, no. 1 (1974), pp.6–22.
Ladurie, E. L. R., and Rousseau, D., ‘Impact du Climat sur la Mortalité en France, de 1680 à l’Époque Actuelle,’ La Météorologie, no. 24 (2009), pp.43-53.
Luterbacher, J., Dietrich, D., Xoplaki, E., Grosjean, M., and Wanner, H., ‘European Seasonal and Annual Temperature Variability, Trends, and Extremes Since 1500’, Science 303, no. 5663 (2004), pp.1499–1503.
Mehlum, H., Miguel, E., and Torvik, R., ‘Poverty and Crime in 19th Century Germany’, Journal of Urban Economics 59, no. 3 (2006), pp.370–88.
Meuvret, J., Le Problème Des Subsistances à L’époque Louis XIV: III. Le Commerce Des Grains et La Conjoncture (Editions de l’EHESS, 1988).
Miguel, E., Satyanath, S, .and Sergenti, E., ‘Economic Shocks and Civil Conflict: An Instrumental Variables Approach’, Journal of Political Economy 112, no. 4 (2004), pp.725–53.
Nicolas, J., La Rébellion Française. Mouvements Populaire et Conscience Sociale (1661-1789) (Le Seuil, 2002).
Porchnev, B., Les soulèvements populaires en France de 1623 à 1648 (S.E.V.P.E.N., 1963). Sarkees, M. R. and Wayman, F. W., Resort to War: A Data Guide to Inter-State, Extra-State,
Intra-State, and Non-State Wars, 1816-2007 (Cq Pr, 2010). Gleditsch, N. P., Wallensteen, P., Eriksson, M., Sollenberg, M., and Strand, H., ‘Armed
conflict 1946-2001: A new dataset’, Journal of peace research 39, no.5 (2002), pp.615-637. Terrier, D., Histoire Économique de la France d’Ancien Régime (Hachette, 1998).

New Researchers – Session II / F
226
Vocational education, industrialization and provincial divide in Italy, 1861-1914
Chiara Martinelli, University of Firenze
([email protected]) Supervisor: Professor Renato Giannetti
During the so-called ‘Italian liberal age’, 1861-1913, politicians and teachers maintained factory workers were going to benefit from industrial and artistic industrial schools. In 1869, the Minister of Agriculture, Industry and Commerce, Marco Minghetti, declared vocational schools were able to train factory workers.478 In 1909, the Royal Commission of Secondary Education enforced Minghetti’s remarks.479
Lacking information in vocational schools prevents scholars from tackling the research. The unavailability of reliable datasets affected researches on human capital and industrialization and it influenced works about the Italian regional gap. Ciccarelli & Fenoaltea analysed neo-classical proxies (2011) and highlighted southern provinces fell behind northern ones only after 1881. However, as Felice (2012) stated, in 1861 northern Italy overcame southern Italy in terms of human and social capital stock: the convergence occurred from the last years of the nineteenth century.
The paper presents and discusses new national and provincial datasets about vocational enrolment rate in Italy during the liberal age and sets them back into post-elementary schools framework. Using reports published by the Minister of Agriculture, Industry and Commerce (hereafter MAIC), it rejected politician’s claims about vocational education. Besides, it highlighted the evolution of the Italian regional gap in vocational education. The actual range of post-elementary education: some attempts to measure it
Vocational education was not ruled until 1908. In 1859 Law Casati established three kinds of post-elementary schools: the ginnasio-liceo (it was similar to Prussian Gymnasium and lasted eight years), the scuola tecnica and the istituto tecnico (they were similar to Prussian Realschulen and lasted seven years) and the scuola normale to train prospective primary school teachers. Only the ginnasio-liceo allowed students to attend University. The scuola tecnica and istituto tecnico were conceived as manual training schools, but a scholastic reform in 1876 changed them into general high schools.
In 1878 the Minister of Agriculture, Industry and Commerce Benedetto Cairoli sent an official letter to local administrations prompting them to establish vocational schools. He divided vocational schools in two three-year courses: the scuola di arti e mestieri (Industrial School) for prospective factory workers and the scuola di arte applicata all’industria (Artistic Industrial School) for artisans. The two newly founded institutions could be day, evening or Sunday schools. The scuola di arte applicata all’industria and the scuola di arti e mestieri were supervised by MAIC while the other post-elementary schools were managed by the Minister of Public Education. Institutes were held by local administrations, private citizens and mutual aid societies. The government started to centralize vocational schools after the Cocco-Ortu Law (1907).
Vocational education was not the most attended post-elementary school. Figure 1 presents a timeline for vocational enrolment in Italy between 1872 and 1913 and contrasts it with enrolment in the other schools. Vocational schools enrolment is retrieved from MAIC’s censuses; data about the other schools is given by the Annuario Statistico Italiano. Only industrial and artistic industrial schools subsidized by MAIC can be computed in the timeline:
478 Seconda sessione delle Camere di Commercio (1869), p.4. 479 Commissione Rale per l’ordinamento degli studi secondari in Italia (1909), p.454.

New Researchers - Session II / F
227
un-subsidized vocational schools were not listed by ministerial reports until the first years of the twentieth century.
Analysing the timeline for vocational enrolment, one problematic issue arises. If an economic explanation is adopted, it is difficult to understand why vocational pupils’ enrolment jacked up between the periods 1879-82 and 1907-14. Economic stagnation affected both periods, therefore it is impossible to link the increase in vocational schools enrolment with an increase in demand for workers.
Political events seem to explain the timeline for vocational schools better than economic events. As figure 1 indicates, the first relevant increase occurred after Cairoli sent his official letter, i.e. between 1879 and 1882. From 1882, lacking in industrial development and political initiatives plummeted the enrolment tax. The latter dropped between 1890 and 1892, when MAIC and local administrations reduced funding in vocational schools because of a huge economic crisis. From 1900, students’ enrolment rose again; the main increase is recorded from 1907 and 1913, i.e. after the Cocco-Ortu Law.
In the nineteenth century the most attended school was the ginnasio-liceo but its enrolment rate declined after 1896. During the first 15 years of the twentieth century, ginnasio-liceo timeline contrasted with overall growth in post-elementary enrolment: it was absorbed by the scuole and the istituti tecnici. Also enrolment in vocational schools increased, but it remained far behind the timeline of scuola and istituto tecnico.
Figure 1: Enrolment rates in Italian post-elementary schools, 1861-1914
What was the actual range of post-elementary education? Some attempts are necessary for dividing post-elementary students by Italian population. However, one problematic issue arises from the operation. Firstly, grade retention was common and it was not rare for a student to be held back once or twice during his school career. Such a problem altered students’ age and it makes difficult to understand which was high school students' appropriate age span.
Two attempts are made for solving the problem: figure 2 divides post-elementary students by the number of 10 to 20 year-old population, figure 3 by the number of 10 to 15 year-old population. As data is retrieved from censuses of Italian population, figures observe three benchmark years (1881; 1901; 1911).
Both figures highlighted that post-elementary schools were attended by a narrow elite. In 1881 they were 2.27 per cent of the 10 to 20 year-old population and 3.74 per cent of the 10 to 15 year-old population. Students increased throughout the decades, but percentages

New Researchers – Session II / F
228
remained well below 10 per cent: in 1911 they were 4.52 per cent of the 10 to 20 year-old population and 7.68 per cent of the 10 to 15 year-old population. In 1911 the istituto tecnico and the scuola tecnica, which were the most chosen schools among middle and high school students, was attended by 2.65 per cent of the 10 to 15 year-old population.
Compared to foreign countries, Italian secondary school attendance was astonishingly low: Cvcerk & Zajnek (2013) stated secondary education in Austro-Hungarian Empire was attended by 20 per cent of the 10 to 18 year-old population in 1911. As Goldin (1998) has found out, in 1901 20 per cent of the 14 to 17 year-old USA population attended high school.
Despite politician’s claims, industrial and artistic industrial schools were not chosen by the majority of post-elementary students: in 1911 only 0.99 per cent of the 10 to 15 year-old Italian population was trained in a vocational school.
Figure 2: % of post-elementary students among 10 to 20-year-old population
Figure 3: % of post-elementary students among 10 to 15-year-old population

New Researchers - Session II / F
229
Regional gap in vocational education
National data shows vocational education was reserved for a small amount of students. Considering regional disaggregation of data, regional distribution in industrial and artistic industrial schools might be influenced by Italian geographical imbalances. As the other proxies (i.e. literacy and social capital), a gap in vocational education might occur between northern and southern provinces. How vocational attendance varied across Italian regions? Figures 4-5 describe variations in regional enrolment percentage. Data about population is retrieved from the censuses of Italian population published in 1871, 1881, 1901 and 1911. Regional enrolment rate is calculated from MAIC’s student censuses and observe four benchmark years (1871, 1881, 1901, 1911). As for national datasets, figure 4 divides pupils by 10 to 20 year-old population and figure 5 divides them by 10 to 15 year-old population.
Geographical unit of observation are Italian regions in 1871. Therefore, Aosta Valley is included in Piedmont and Molise into Abruzzo. Udine and its provinces are included in Veneto. Italian regioni are similar to English counties and their size varied widely. During the liberal period, they were not an administrative entity but a mere statistical unit of observation.
Outcomes split Italy into three macro-regions: northern Italy (Piedmont, Lombardy, Liguria and Veneto), central Italy (Tuscany, Umbria, Marche, Lazio) and southern Italy (Abruzzi, Campania, Apulia, Calabria, Sicily and Sardinia). A) Northern Italy
Piedmont, Lombardy and Liguria were the most industrialized Italian macro-region: as recent findings point out, the ‘industrial triangle’ emerged only from 1881. However, in 1861 differences in human and social capital stock between northern and southern regions were relevant.
Until 1881 the whole country was marked by lacking development in industrial and artistic industrial schools. After 1881, the more vocational schools were established, the more regional disparities grew. Between the nineteenth and twentieth centuries, vocational enrolment in northern Italy grew more rapidly than the Italian one. In Piedmont and Veneto vocational students increased between 1881 and 1901; in Lombardy they increased between 1901 and 1911. Before the First World War, northern regions became the most developed Italian macro-region in terms of vocational human capital. The only exception was Liguria.
However, two negative aspects cast a shadow over such a finding. Firstly, it is necessary to remember vocational enrolment percentages were low also in northern regions. In 1911 vocational pupils were the 1.33 per cent of the 10 to 15 year-old regional population in Lombardy and 1.08 per cent in Veneto.
Secondly, during the first years of the twentieth century, industrialization and vocational education in Piedmont and Liguria were not correlated. In Piedmont, between 1901 and 1911, the vocational enrolment percentage decreased from 1.35 per cent to 1.09 per cent. Albeit Genoa was one of the most industrialized Italian towns, industrial and artistic industrial schools were more rare in Liguria than in the other northern regions. Besides, the enrolment percentage in Liguria declined between 1901 and 1911, as it occurred in Piedmont in the same years. Development of mechanical factories in Genua was not linked to vocational schools, albeit this kind of industrial production seems to require highly-specialized human capital. B) Central Italy
Concerning vocational human capital, Central Italy was midway between North and South but it was not so homogenous as the latter. Indeed distribution in industrial and artistic industrial schools was featured by huge disparities among each region. Throughout the decades, Tuscany was the strongest gainer and in 1911 its vocational enrolment percentage became the fourth highest among Italian regions. Enrolment percentage arose also in Emilia and Marche, but it remained far behind Tuscany’s figures. In Umbria, lacking development in industrial

New Researchers – Session II / F
230
and artistic industrial school determined a situation more similar to the Southern one than to the Northern.
Lazio and Rome deserve special attention. During the nineteenth century the Papal States set in Rome a wide network of scuole notturne (night school) for improving apprentices and artisans’ technical skills.480 After annexation to the Italian kingdom (1871) investment for workers’ schools in Rome faded away. Over time, the scuole notturne lost importance: they could not meet apprentices’ demands, but neither local administration nor the Church tried to replace or to reform them. Their decline can explain the regional trend in vocational enrolment. Lazio achieved the highest enrolment percentage among Italian regions in 1881 and in 1901 it was overtaken only by Piedmont. After 1901, the vocational enrolment percentage in Lazio dropped from 0.7 per cent to 0.4 per cent and it was overtaken by Lombardy, Veneto and Tuscany. C) Southern Italy
As aforesaid, regional imbalances between southern and northern regions became evident only after 1881. Thereafter, southern regions were featured by persistent underdevelopment: Campania apart, throughout the liberal period vocational enrolment in Southern regions did not exceed 0.4 per cent of the 10 to 15 year-old regional population.
Campania and Naples trends in vocational enrolment mirrored those in Lazio and Rome. Thanks to its past as a capital, Naples was endowed with manifold vocational boarding schools which were established by the church: these schools were not listed in 1874 census as MAIC did not subsidized anyone of them until 1878. From Cairoli’s official letter of 1901, industrial and artistic industrial schools were spread by local administration and mutual aid societies. Schools were largely concentrated in Naples: indeed southern middle and high-class’ offspring were used to be trained in the former Bourbon capital. Concerning vocational enrolment, in 1901 Campania became the third most developed Italian region. However, during the first years of the twentieth century, vocational enrolment percentage decreased from 0.6 per cent to 0.3 per cent.
Figure 4: Regional % of vocational students between 10 to 20 year-old population (1871; 1881; 1901; 1911)
480 G. Rossi, L’istruzione professionale in Roma capitale. Le scuole professionali dei salesiani al Castro
Pretorio (1883-1930), LAS 1970.

New Researchers - Session II / F
231
Legend: Blank = enrolment percentage between 0 and 0.099% Light grey = enrolment percentage between 0.1% to 0.499% Dark grey = enrolment percentage between 0.5% and 0.99% Black = enrolment percentage over 1%
Conclusion
First findings concern an assessment about the role of vocational and post-elementary education in Italy throughout the liberal age. As aggregate data concerned, post-elementary and vocational schools were reserved for a narrow amount of students. Vocational enrolment rate was too faint for influencing the economic and industrial growth that occurred in Italy during the first years of the twentieth century. Moreover, trends in vocational enrolment were not linked to economic events, but to the scholastic policy. Vocational education was developed thanks to ministerial initiatives rather than industrial demand for skilled workers.
Regional-disaggregate data showed that a spatial gap emerged among Italian provinces. Throughout the liberal age, vocational schools were established in northern provinces, whilst the southern part of the country fell behind. This process occurred in the same years human capital in southern Italy started to catch up with human capital in northern Italy, as Felice observed. Development in the vocational enrolment gap followed regional imbalances in industrialization.
Thus, Italian vocational schools history epitomizes three issues. Firstly, local and central administrations ineptitude in devising a development strategy. Secondly, the existence of a deep regional inequality. Thirdly, a dramatic shortage in industrial, advanced human capital. The last outcome is extremely relevant because it shows that during the Second Industrial Revolution Italian economy did not have a relevant stock in advanced human capital.
Further paces are going to disaggregate regional data. Ciccarelli & Fenoaltea demonstrated that over time industrialization became a sub-regional phenomenon. If we want a dataset which can explain the relationships between industrialization and vocational education, it is necessary to disaggregate regional data into their provincial constituents: this is going to be the object of my presentation.
New Researchers – Session II / F
232
References
Ciccarelli C. and Fenoaltea S., ‘Through the magnifying glass: provincial aspects of industrial growth in post-Unification Italy’, Economic History Review, vol. 66(1), pages 57-85.
Cverck T. and Zajicek M., School, what is it good for? Useful Human Capital and the History of Public Education in Central Europe, NBER Working Paper n. 19690.
Felice E., Regional convergence in Italy, 1891–2001: testing human and social capital, «Cliometrica», 5 (2012), pg. 267-307.
Goldin C., America's Graduation from High School: The Evolution and Spread of Secondary Schooling in the Twentieth Century, «The Journal of Economic History», LVII (1998), n.2, pages. 345-74.
Other sources ‘Annali del Ministero di Agricoltura, Industria e Commercio’, 1870-9. ‘Annali di industria e commercio’, 1879-913. ‘Annuario Statistico Italiano’, 1878-915. Censimento della popolazione nel Regno d’Italia, (1871; 1881; 1901; 1911). L’insegnamento industriale, commerciale e professionale in alcuni stati esteri, Roma,
Berterio, 1903. Notizie per l’istruzione industriale, commerciale e agraria per l’anno 1903-4 (1905). Notizie sulle condizioni dell'insegnamento agrario, industriale e commerciale in Italia (1910).

New Researchers - Session II / F
233
Utilizing business archives to explore industrialist patronage: Middlesbrough’s steel magnates and the
British Steel Collection, 1880-1934
Tosh Warwick, University of Huddersfield / Middlesbrough Council* ([email protected])
Supervisor: Professor Barry Doyle Introduction
In his chapter on the ‘growth of the new community’ of Middlesbrough in his landmark Victorian Cities, Briggs (1963) contended that from the later nineteenth century period onwards, the will of the town’s ironmasters to engage in the life of the town had dwindled, with the second and subsequent generations of industrialists and managers. In line with notions of a ‘decline of the industrial spirit’ stressed by Wiener (1981) and emphasis in subsequent works exploring the role of Middlesbrough’s manufacturers by Hadfield (1979) and Stubley (1979) the town’s industrialists have been presented as having withdrawn from participation from 1880 up to the outbreak of the First World War. Yet, these arguments for elite withdrawal from the urban sphere have developed based upon a reduced representation and visibility of those magnates from municipal involvement as councillors and a perceived reduced participation in business activities with the rise of the general manager.
Urban history’s broadened exploration of elites over the past two decades in exploring the wider spheres of ‘urban governance’ that look beyond the narrower realms of ‘urban government’, leading to reassessments of the mechanisms of elite power and the continued role of the upper middle-classes in the locality (Doyle, 1997), thus reconsidering the extent of decline in governance and elite withdrawal (Trainor, 2000). Although the expansion of Middlesbrough’s urban elite reflected the rapid growth of the town and its diversification (Doyle, 2007), the continued involvement of Middlesbrough’s steel magnates and their manufacturing firms in supporting urban institutions, patronizing new initiatives and establishing new welfare and leisure provision, has until recently been under-explored. Following on from Boswell’s (1983) study of three steel firms in which he pointed to the increased responsibility within the firms of professionals and general managers alongside the endurance of elder statesmen Sir Arthur Dorman and Sir Hugh Bell, Turner (1997) has noted how the latter’s Bell Brothers’ played a key role in the development of the industrial village of Port Clarence. More recently James’s (2013) study of the Victorian and Edwardian Cleveland iron and steel industries has pointed to the continued presence of the elder statesmen within their firms, pointing to a reluctance to hand over management of their concerns. Budd (2011) in her survey of the development of Middlesbrough’s late nineteenth and early twentieth century sporting culture has highlighted how individual steel magnates and their companies supported the development of clubs and set-up new leisure facilities. Yasumoto’s study of the rise of the Victorian Ironopolis (2011) has also pointed to how Middlesbrough’s manufacturing families and businesses continued to support hospital provision, chiefly at the Middlesbrough-based North Riding Infirmary, established with the financial backing of the earlier ironmasters and most notably Bolckow Vaughan, the town’s first major iron manufacturers.
* The research presented here stems from an Arts and Humanities Research Council Collaborative Doctoral
Award Studentship at the University of Huddersfield, alongside a 90-day placement at Teesside Archives working as part of The British Steel Archive Project team.

New Researchers – Session II / F
234
The British Steel Collection
Despite the prominence of the iron and steel industries in the history and economy of Middlesbrough into the later twentieth century, the records of the area’s manufacturing firms and business associations have until this decade remained relatively inaccessible to researchers. Following the introduction of a new information management system by British Steel in the 1990s, the collection was deposited at Teesside Archives. With support from organizations including the Heritage Lottery Fund, Corus, the trade union Community and the AHRC, the material was able to be made accessible by The British Steel Archive Project, with the catalogue and collection opened to researchers in 2011.481 The Collection provides key information on the operation of iron and steel firms, providing a key insight into the mechanisms of power within the companies, the decision-making processes within the organizations and the companies’ responses to the economic and social conditions of the towns that housed their business interests. It is upon the benefits of utilizing the British Steel Collection alongside more familiar sources to shed new light on the role of the steel magnates in exercising both public and private industrialist patronage that this paper focuses.
Through analysis of records held within the British Steel Collection, it will be shown how both leading steel magnates, and the maligned second and third generations of industrialist families, played a crucial role in deciding which philanthropic appeals to support, the amounts to donate and individual action in securing land and premises for company-led welfare initiatives.
Responses to appeals
The minutes of the leading firms of Bell Brothers, Bolckow Vaughan and Dorman Long chronicle the annual subscriptions by the firms to those urban institutions established in Middlesbrough’s early decades, including hospitals, schools, and cultural institutions. Hospital provision was the major source of funding from the iron and steel firms in Middlesbrough, with the North Ormesby Hospital and the ironmaster-founded North Riding Infirmary the main benefactors from the iron and steel firms given their proximity to the industries along the banks of the River Tees. They performed a vital function in the hazardous environments of the works, dubbed by Lady Florence Bell in her social survey At the Works as ‘the constant possibility, of accident with which all these men [iron and steel workers] are practically face-to-face’.482
Hospitals received regular, annual payments from the leading iron and steel firms, with the manufacturers benefiting in gaining admission tickets to allow access to the hospital for workers in common with the practice in other towns and cities.483 Annual subscriptions in the region of around £100 to each of the two main hospitals were consistent from the major firms Bell Brothers’ and Dorman Long, although the amounts contributed were not equal in their percentage of contribution to each institution.484 The North Riding Infirmary’s funding was underpinned by a combination of ironmaster and company subscriptions alongside those from workers, whilst the rival North Ormesby Hospital was more dependent on workers’ contributions. Beyond annual subscriptions, the directors of the iron and steel firms responded to special appeals throughout the period in response to extension schemes and anniversaries, including the Mayor’s 1897 Diamond Jubilee Fund, raised on behalf of the medical institutions of the town. Dorman Long’s chairman, Arthur J Dorman, played a key role in deciding the amount of contributions to the Mayor’s scheme, the company’s directors 481 See the British Steel Collection website http://www.britishsteelcollection.org.uk/ for more details on the
British Steel Archive Project. 482 Bell, F. At the Works (1907), pp.100-101. 483 Bolckow Vaughan Directors’ Minute Book, No.13 1904-1908, TA, BS.BV/1/1/13, p.286; Bell Brothers
Minute Book, No.1, 1899-1913, TA, BS.BB/1/2/3; Gorsky, M. et al. Mutualism and health care: British hospital contributory schemes in the twentieth century (Manchester, 2006), p.31.
484 Bell Brothers Minute Book, No.2, 1915-1923, 90, TA, BS.BB/1/2/4
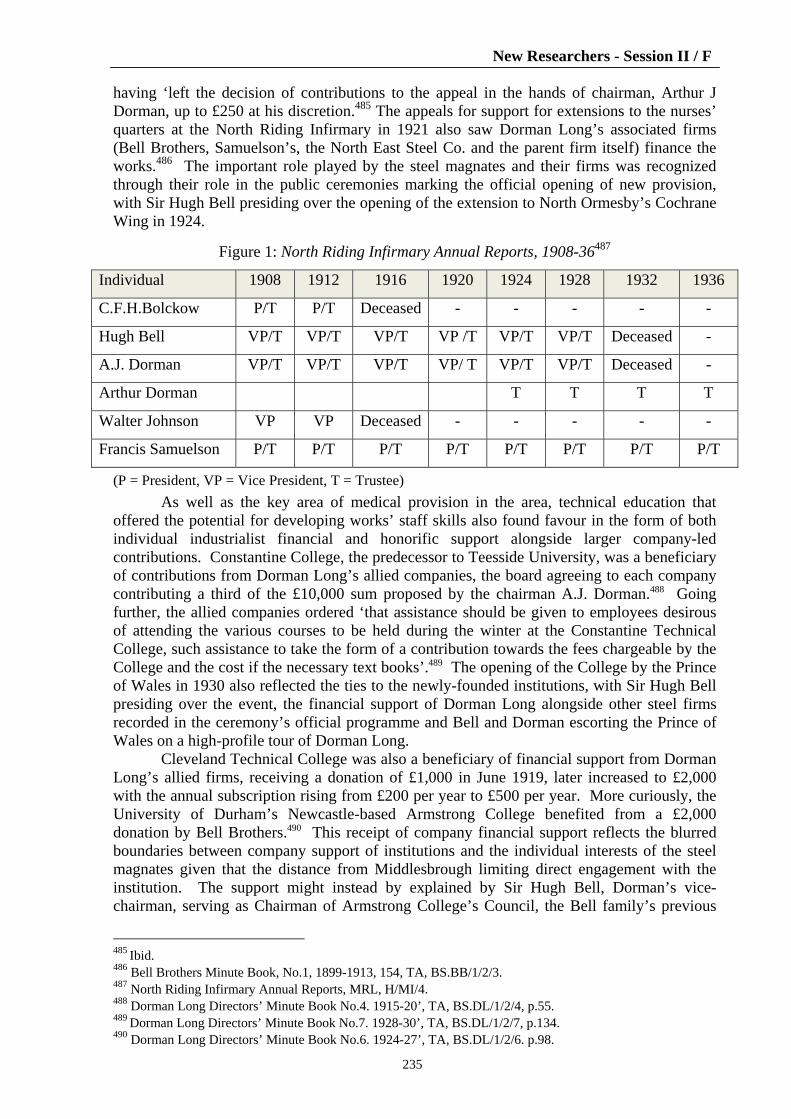
New Researchers - Session II / F
235
having ‘left the decision of contributions to the appeal in the hands of chairman, Arthur J Dorman, up to £250 at his discretion.485 The appeals for support for extensions to the nurses’ quarters at the North Riding Infirmary in 1921 also saw Dorman Long’s associated firms (Bell Brothers, Samuelson’s, the North East Steel Co. and the parent firm itself) finance the works.486 The important role played by the steel magnates and their firms was recognized through their role in the public ceremonies marking the official opening of new provision, with Sir Hugh Bell presiding over the opening of the extension to North Ormesby’s Cochrane Wing in 1924.
Figure 1: North Riding Infirmary Annual Reports, 1908-36487
Individual 1908 1912 1916 1920 1924 1928 1932 1936
C.F.H.Bolckow P/T P/T Deceased - - - - -
Hugh Bell VP/T VP/T VP/T VP /T VP/T VP/T Deceased -
A.J. Dorman VP/T VP/T VP/T VP/ T VP/T VP/T Deceased -
Arthur Dorman T T T T
Walter Johnson VP VP Deceased - - - - -
Francis Samuelson P/T P/T P/T P/T P/T P/T P/T P/T
(P = President, VP = Vice President, T = Trustee) As well as the key area of medical provision in the area, technical education that
offered the potential for developing works’ staff skills also found favour in the form of both individual industrialist financial and honorific support alongside larger company-led contributions. Constantine College, the predecessor to Teesside University, was a beneficiary of contributions from Dorman Long’s allied companies, the board agreeing to each company contributing a third of the £10,000 sum proposed by the chairman A.J. Dorman.488 Going further, the allied companies ordered ‘that assistance should be given to employees desirous of attending the various courses to be held during the winter at the Constantine Technical College, such assistance to take the form of a contribution towards the fees chargeable by the College and the cost if the necessary text books’.489 The opening of the College by the Prince of Wales in 1930 also reflected the ties to the newly-founded institutions, with Sir Hugh Bell presiding over the event, the financial support of Dorman Long alongside other steel firms recorded in the ceremony’s official programme and Bell and Dorman escorting the Prince of Wales on a high-profile tour of Dorman Long.
Cleveland Technical College was also a beneficiary of financial support from Dorman Long’s allied firms, receiving a donation of £1,000 in June 1919, later increased to £2,000 with the annual subscription rising from £200 per year to £500 per year. More curiously, the University of Durham’s Newcastle-based Armstrong College benefited from a £2,000 donation by Bell Brothers.490 This receipt of company financial support reflects the blurred boundaries between company support of institutions and the individual interests of the steel magnates given that the distance from Middlesbrough limiting direct engagement with the institution. The support might instead by explained by Sir Hugh Bell, Dorman’s vice-chairman, serving as Chairman of Armstrong College’s Council, the Bell family’s previous
485 Ibid. 486 Bell Brothers Minute Book, No.1, 1899-1913, 154, TA, BS.BB/1/2/3. 487 North Riding Infirmary Annual Reports, MRL, H/MI/4. 488 Dorman Long Directors’ Minute Book No.4. 1915-20’, TA, BS.DL/1/2/4, p.55. 489 Dorman Long Directors’ Minute Book No.7. 1928-30’, TA, BS.DL/1/2/7, p.134. 490 Dorman Long Directors’ Minute Book No.6. 1924-27’, TA, BS.DL/1/2/6. p.98.

New Researchers – Session II / F
236
operations in Walker-upon-Tyne and Bell’s father Sir Isaac Lowthian Bell tenure as Mayor of Newcastle in 1862. Company-led paternalism
Company support of welfare provision and the development of leisure provision were key arenas of industrialist patronage in late nineteenth and early twentieth century Middlesbrough. During the period 1880-1934, a number of company-led (or at least heavily backed) initiatives saw Middlesbrough’s leading manufacturers, both directly and indirectly, extend their influence in the town. Bell Brothers led the way with developments such as the opening of a Coffee Palace at Port Clarence opened in 1881 at a cost of £700. The opening of the workmen’s facility was hailed by the North Eastern Daily Gazette as a ‘red letter day in the history of Port Clarence’, embodying how ‘paternalistic services and gestures could reinforce the legitimacy of the employer’s economic power and promote more harmonious relations in the workplace’.491 In opening the new organization, Bell Brothers’ Chairman Sir Isaac Lowthian Bell declared how:
Employees were engaged in very hard work, and … they were entitled to some amount of recreation and amusement ... [The] firm had thought that if anything like help was to be given to them [the workers] it would come most appropriately from those who stood to them in the relation of employers.492
Hugh Bell followed in stating the Palace ‘afforded him considerate satisfaction to know that his firm had spent a sum of money in providing them with entertainment’, whilst a workmen’s representative returned ‘a hearty vote of thanks to Mr Bell ... [asking] his fellow workmen to give three cheers for that gentleman and his family’.493 The sense of noblesse oblige exhibited was further in evidence in the same firm’s patronage of education, with the June 1894 Bell Brothers’ Director’s meeting appointing ‘committees of management of the schools of the company’.494 This included key members of the Bell family including Hugh Bell (who coupled the role with his chairmanship of the Middlesbrough’s School Board) and his brother-in-law Walter Johnson, with responsibility including overseeing schools in the colliery village of Browney in Durham and at Clarence on the north bank of the Tees.495
Dorman Long’s establishment of the Dorman Long Athletic Club, opened in 1899, represented the first major company-led sporting facility. The important role played by Arthur J Dorman in establishing the Dorman Athletic Club in the last decade of the nineteenth century, and the personal interest of the Dorman family in developing subsequent company leisure provision into the twentieth century is apparent in Dorman Long’s minute books. The development of the Club was underpinned by keen interest in the scheme by Chairman Arthur Dorman, with the steel magnate presenting a detailed report on the development of an Athletic Club for workmen in the company’s employment, voting for financial contributions to the initiative and serving as president.496 The new athletic ground’s opening was reported in the local press, the Yorkshire Herald noting how ‘the name of Dorman, Long and Company had for many years been associated with Middlesbrough and with the charitable and religious institutions, many of which are indebted to Mr. and Mrs Dorman for kindly and generous assistance’.497 Dorman Long’s chairman shared ‘the pleasure which the matter had given and the hearty manner in which it had been received’ and ‘expressed his high appreciation of the
491 Trainor, Black Country Elites, p.145; North Eastern Daily Gazette, 6th December 1881. 492 NEDG, 6th December 1881. 493 Ibid. 494 Bell Brothers Directors’ Minute Book, No.2, 1886-1901, TA, BS.BB/1/2/2, 803. 495 Ibid. 496 Dorman Long Directors’ Minute Book, No.1, BS.DL/1/2/1, p.266. 497 Yorkshire Herald, 10th July 1899.

New Researchers - Session II / F
237
value of outdoor sport’, stating ‘it was only right that they [the company] should do something for the benefit of the men who had done so much for them’.498
Moving forward to 1918, the sons of the Dorman Long chairman followed in their father’s footsteps in driving forward the steel firm’s patronage of welfare and leisure provision, with it playing an important role in the development of Middlesbrough’s urban institutions and with it the well-being of the town’s iron and steelworkers. Mr Arthur Dorman was the leading force in carrying out investigations into the acquisition of premises for the establishment of a company Boys’ Club and helped ensure £2, 615 of the £6,150 of the costs was able to be written off against excess profits in 1918.499 In March 1920, Arthur Dorman alongside manager Lawrence Ennis led discussions with the Redcar Hospital Committee on acquiring suitable premises at Coatham near the firm’s new Dormanstown works.500 In the same year his brother Charles Dorman led the company’s pursuit of suitable convalescent facilities for its workers, with the director proposing the purchase of Cliff House at Marske to the board and inspecting the house, before Sir Arthur Dorman entered negotiations with Sir Alfred Pease, the property’s owner.501
The continued familial influence in patronage under the guise of company-level support of philanthropic initiatives is worthy of further elaboration before concluding this brief survey, drawing upon the example of the Lilian Dorman Girls’ Club. Established by Sir Arthur Dorman’s daughter and enduring difficult times amidst industrial hardship in the late 1920s, Dorman Long moved to offer additional support for the initiative. Not only did the elderly steel magnate make an extra donation of £100, whilst Dorman Long’s ‘managers, officials and workers’ were praised in the Girls’ Club’s annual report for ‘their great interest and practical help’, with Dorman Long’s contribution amounting to the second largest received behind the chairman’s personal patronage (figure 2).502
498 Northern Echo, 10th July 1899. 499 Dorman Long Minute Book, No.4, TA, BS.DL/1/2/4, p.103. 500 Ibid, p.257. 501 Ibid, p.293. 502 Lilian Dorman’s Girls’ Club Annual Report, 1927-28 , p3.

New Researchers – Session II / F
238
Figure 2: Annual subscriptions and donations to Lilian Dorman Girls’ Club
Conclusion
Although providing only a brief survey of industrialist patronage centred upon a small sample of newly accessible iron and steel companies’ records, the roles played by leading steel magnates and the second and third generations of industrial elite families in company-level patronage of hospitals, schools, colleges, boys and girls clubs and leisure provision have been highlighted.
Tentatively, the findings noted here highlight the overlapping, blurred boundaries between company patronage and individual interests and zeal. Crucially, indirect, less-visible elite philanthropic engagement exercised through company-led paternalism has been shown to be an important element of continued participation across generations in urban governance, in turn challenging the extent of elite withdrawal from the manufacturing town. Primary Sources
Bell Brothers Directors’ Minute Books, TA, BS.BB/1/2. Bell, F. At the Works (1907). Bolckow Vaughan Directors Minute Books, TA, BS.BV/1/2. Dorman Long Minute Books, TA, BS.DL/1/2. Lilian Dorman’s Girls’ Club Annual Report, 1927-28, MRL. North Eastern Daily Gazette. Northern Echo. North Riding Infirmary Annual Reports, MRL, H/MI/4. Yorkshire Herald.

New Researchers - Session II / F
239
Secondary sources
Boswell, J.S. Business Policies in the Making: Three Steel Companies Compared (London, 1983).
Briggs, A. Victorian Cities (London, 1963). Budd, ‘The Growth of an Urban Sporting Culture – Middlesbrough, c.1870-1914’,
unpublished PhD thesis, DeMontfort University, 2011. Doyle, B.M. ‘The structure of elite power in the early twentieth-century city: Norwich, 1900-
35’, Urban History, 24, 2, (1997), pp.179-199. Hadfield, D.W. ‘Political and Social Attitudes in Middlesbrough 1853-1889 with especial
reference to the role of the Middlesbrough ironmasters’, unpublished PhD thesis, Teesside Polytechnic, 1981.
James, S. ‘Growth and Transition in the Cleveland Iron and Steel Industry, 1850 to 1914’, unpublished PhD thesis, University of Durham, 2013.
Stubley, P. ‘The Churches and the Iron and Steel Industry in Middlesbrough, 1890-1914’, unpublished M.A. Thesis, Durham University, 1979.
Trainor, R.H. Black Country Elites: The Exercise of Authority in an Industrialized Area 1830-1900 (Oxford, 1993).
------------, ‘The “decline” of British urban governance since 1850: a reassessment’ in R.J. Morris & R.H. Trainor, (eds.), Urban Governance: Britain and Beyond Since 1750 (Aldershot, 2000).
Turner, J.J. ‘Introduction’, At the Works (Teesside Reprint, 1997).

240

241
Abstracts of Academic Papers

242

Academic Session I / A
243
I/A Financial Crises
George Chouliarakis, Tad Gwiazdowski (University of Manchester) & Sophia Lazaretou (Bank of Greece) The effect of fiscal policy on output in times of crisis and prosperity: historical evidence from
Greece, 1846-1939
Motivation
The effect of discretionary fiscal policy on output has long been a key issue in macroeconomics. And yet the state of our knowledge about the scope and effectiveness of fiscal policy, and the channels through which these effects are transmitted, remains largely incomplete. One especially important question that has yet to receive due attention is whether the effect of fiscal policy on output varies over the business cycle and across nominal exchange rate regimes. The goal of this paper is to address this question with the aid of history. Using a new historical dataset for nineteenth- and early twentieth-century Greece and a battery of non-linear estimation methods, the paper lends strong support to the view that the fiscal multiplier is state-dependent and regime-dependent, a finding that has so far eluded historical research. An important historical lesson of the paper is to warn against frontloaded fiscal consolidation during recessions. Methodology and data
The effects of fiscal policy on output have been the subject of study of a considerable volume of economic history research. In a seminal 1956 paper on US fiscal policy in the Great Depression, Cary Brown concluded that fiscal policy would have been a strong recovery tool if only it had been tried. The same conclusion was reached by Peppers (1973) and by Almunia, Benetrix, Eichengreen, O’ Rourke & Rua in their excellent 2010 cross-country study. On the other hand, Barro and Redlick (2011) and Crafts & Mills (2013) are more cautious. Barro & Redlick studied the effects of US fiscal policy on output over a long time period, and addressed the key problem of the identification of exogenous fiscal policy shocks by using defence spending and a ‘news’ variable on future defence spending as instruments for discretionary fiscal policy. Crafts & Mills applied a similar methodology to UK interwar data. Both studies found positive but moderate effects of fiscal policy on output due to crowding out. Yet neither the above important studies, nor other historical studies on this topic, consider the possibility that the effectiveness of discretionary fiscal policy varies between recessions and recoveries or across nominal exchange rate regimes. Our historical study takes a step towards filling this gap. In particular, our research follows Barro & Redlick (2011) and Crafts & Mills (2013) in addressing the problem of the identification of exogenous fiscal policy shocks by using data on defence spending. But, unlike them, we use a battery of methods, including Markov-Switching, Threshold Autoregression and Threshold Vector Autoregression, that enable us to systematically distinguish the effects of fiscal policy on output as the state of the economy varies between recessions and recoveries and as the economy switches between adherence to fixed exchange rate systems and floats.
New time series data from the turbulent nineteenth and early twentieth century history of the Greek economy provides an especially suitable ground for studying the state-dependence of the fiscal multiplier. The dataset stretches from 1846 to 1939 and covers the first century of the modern Greek state. This period contains a considerable number of military escalations, military incidents and wars and thus it is marked by significant variation in military build-ups. In retrospect, this variation in defence purchases offers unique information for the identification of exogenous fiscal shocks. This period also contains a large number of major economic and financial crises and no less than 14 switches between bimetallism or the gold standard and suspension of currency convertibility. The significant variation between phases of expansion and recession and between exchange rate regimes is

Academic Session I / A
244
key for the examination of the non-linear behaviour of the multiplier and constitutes one of the advantages of the dataset. Results
Our results lend strong support to the view that the fiscal multiplier is state-dependent and regime-dependent. More particularly, the results show that the effect of fiscal policy on output is relatively strong during recessions and when the economy operates under a currency peg but weak during expansions and under a floating exchange rate regime. The results are consistent with the Bordo & Rockoff view that, during the classical gold standard, a currency peg would allow capital-scarce peripheral economies, such as Greece, to access the international capital markets at a lower cost than otherwise reducing thus possible crowding out effects and increasing the size of the fiscal multiplier. The results also suggest that estimating the effect of discretionary fiscal policy while assuming away the state-dependence of the fiscal multiplier, as many historical studies have so far done, can be misleading. Finally, an important historical lesson of the study is to warn against frontloaded fiscal consolidation during recessions. References
Almunia, M., A. Benetrix, B. Eichengreen, K.O’Rourke and G. Rua (2010) ‘From Great Depression to Great Credit Crisis: Similarities, Differences and Lessons’, Economic Policy 25: 219-265.
Barro, R., and C. Redlick (2011) ‘Macroeconomic Effects from Government Purchases and Taxes’, Quarterly Journal of Economics 126: 51-102.
Bordo, M., and H. Rockoff (1996) ‘The Gold Standard as a Good Housekeeping Seal of Approval’, Journal of Economic History 56: 389-428.
Cary Brown, E. (1956) ‘Fiscal Policy in the Great Depression: A Reappraisal’, American Economic Review 46: 857-879.
Crafts, N., and T. Mills (2013) ‘Rearmament to the Rescue? New Estimates of the Impact of “Keynesian” Policies in 1930s Britain’, Journal of Economic History, 73:1077-1104.
Peppers, L. (1973) ‘Full Employment Surplus Analysis and Structural Change: the 1930s’, Explorations in Economic History 10: 197–210.
Jaime Reis (Universidade de Lisboa) Bagehot for ‘followers’: how did the Portuguese Lender of Last Resort manage the post-
World War I crisis? The Lender of Last Resort (LLR) function is a form of micro-management employed by central banks, usually in cooperation with or under the direction of governments, either to mitigate banking panics or to prevent them from occurring. The study of this function has generated a considerable literature and remains of great interest to economists, historians and policy makers. The events of the last three decades and the public and political concern over the behaviour of the world’s financial system have continually justified the study of this topic.
Although the historical study of the LLR has been well served, most of what is known illustrates the experience of two countries – the US and Great Britain – and two periods – the era of the classical gold standard and the crisis of 1929-31. A large number of other situations have been ignored or studied in less depth, for example the LLR in countries with less developed financial systems; the LLR during panic episodes which occurred under conditions of currency inconvertibility; the LLR in economies beleaguered by severe problems of public finance.
This paper contributes towards correcting these imbalances. It considers the employment of the LLR function in a little-studied country of the periphery – Portugal – during a significant period – the early post-World War I crisis years. The wealth of original primary material in the Bank of Portugal (BP)’s archive enables us to take this analysis

Academic Session I / A
245
beyond the scrutiny of official documents and statistics to which such studies have often been confined.
The paper has four parts. Following the introduction, the second part describes the Portuguese financial system as it emerged from the war, the political and economic domestic setting in which it operated, and the broader international environment. The third section uses a detailed account of the banking crises of the early 1920s, mainly from the internal perspective of the BP. The fourth section proposes an agenda for future research and concludes.
During the 1920-1 banking crisis, the BP acted self-consciously as a LLR and mobilized all the resources it could to save a number of threatened financial institutions. It was quite successful in that casualties were light and the financial system returned to normality in a fairly short time. At the same time, and although it was fully aware of the Bagehotian paradigm, its conduct as a LLR it honoured it far more in the breach than in the observance. To trace this divergence, we organize the analysis around the four basic tenets of the classic LLR doctrine, which the BP found pretty much impossible to accompany.
On the basis of Lombard Street, these were: i) lending freely and quickly; ii) lending at a very high rate; iii) making its readiness to lend freely clear in advance; iv) accommodate anyone with good collateral. In actual fact, rather than lend freely, the BP was parsimonious. Moreover, it failed to pursue a pro-active discount rate policy and therefore to allocate its assistance to beleaguered banks according to price. Instead, all too often it apportioned its assistance according to client need, the size of the banks in question and personal favour. Contradictorily, it was considerably more exigent regarding the quality of the collateral than anything which Bagehot may have had in mind.
The immediate post-Great War years in Portugal were not a favourable context in which to hone the skills of a LLR even if, as was the case, the proto-central bank had already lengthy and considerable experience of this role. Portugal’s financial market was in turmoil, its banks were deeply troubled and rampant inflation seriously affected the efficiency of markets. At the same time, the BP had shrunk, was weak and tied down by a paralysing regulatory mesh. It had yet to sort out the contradiction between its private and its public roles, assert its independence from the state and generate sufficient resources to be a proper LLR.
Select references
Bagehot, Walter (1873, 2006), Lombard Street: A Description of the Money Market (New York: Cosimo Books).
Bignon, Vincent, Flandreau, Marc and Ugolini, Stefano (2012), Bagehot for beginners: The making of lending of last resort operations in the mid-19th century’, Economic History Review 65, 580-608.
Buyst, Erik and Maes, Ivo (2008), ‘Central Banking in 19th Century Belgium: Was the NBB a Lender of Last Resort?’, Financial History Review, 15, 153-173.
Bordo, Michael D. (1990), ‘The Lender of Last Resort: Alternative Views and Historical Experience’, Federal Reserve Bank of Richmond Economic Quarterly, 73 (1), 18-29.
Capie, Forrest, Goodhart, Charles, Fischer, Stanley and Norbert Schnadt (1994), The Future of Central Banking. The Tercentenary Symposium of the Bank of England (Cambridge: Cambridge University Press).
Humphrey, Thomas and Robert E. Keleher (1983), ‘The Lender of Last Resort: An Historical Perspective’, The Cato Journal, 3 (2), pp.275-321.

Academic Session I / A
246
Albrecht Ritschl (London School of Economics) What do financial panics do? Narrative VAR evidence from the Great Contraction, 1929-33
Evaluation of monetary and banking policy for the Great Depression faces an identification problem presented by the Great Crash of October, 1929. To the extent that the convulsions on the New York stock market had their own direct effects on the US economy, attempts to assess the effects of policy may suffer from misspecification and omitted variable bias. This paper uses an event-based narrative approach to monetary policy VARs to identify the effects of the Great Crash separately from monetary policy shocks, measured where possible by announcements. In the spirit of the sign restriction approach, I identify the nature of these shocks by the signs of the impulse responses they generate. I find that the stock market crash of 1929 makes a substantial contribution to forecast error variance of output. This effect is greatly amplified by the monetary transmission mechanism, and is observationally equivalent to a major negative shock to monetary demand. The paper also finds that compared to this shock, monetary policy itself had only second order effects, comparable in size to those familiar from postwar evidence.

Academic Session I / B
247
I/B Long Term Changes in Income Inequality Guido Alfani (Bocconi University) & Wouter Ryckbosch (University of Antwerp) Was there a ‘Little Convergence’ in inequality? Low Countries and Italy compared, c.1500-1900 The question of how economic inequality changed over time has for decades provoked substantial research efforts. Nevertheless a complete picture of the tendencies in economic inequality throughout the pre-industrial period is still out of our grasp. This paper begins to resolve this problem by comparing long-term changes in inequality in central and northern Italy and in the Low Countries. Our research also relates to the debate on the so-called ‘Little Divergence’ in Europe during the centuries preceding the industrial revolution, i.e. the exceptional economic trajectory of North-Western Europe compared to the rest of the continent (and particularly to Italy, which until then was the most advanced part of the continent) from the beginning of the early modern period onwards. In both real wages and GDP per capita North-Western Europe diverged from Southern, Central and Eastern European areas well before the onset of the industrial revolution.
Our primary concern is to understand how the Little Divergence affected economic inequality within each region. Did inequality increase in the North-Western European societies that went through a phase of sustained economic growth during the early modern period? And can we find, on the contrary, a concomitant decline in inequality in the regions that were characterized by economic stagnation or decline? In a sense, this is a reformulation of the classic Kuznets hypothesis that was adapted for the pre-industrial period by Van Zanden (1995). In short: did economic growth in North-Western Europe cause inequality to rise during the pre-industrial period, while decline caused it to diminish? In order to test this effect of the Little Divergence upon the evolution of inequality in different regions, this paper presents and analyses new empirical data on economic inequality with a methodology recently introduced by Alfani (2014). Community-level data, newly collected from archival sources (tax records, like the Italian estimi or the Flemish huispenninghen) are aggregated to build time series of inequality measures representative of larger areas. The development of inequality in the Low Countries – more specifically Flanders, Brabant and Holland, which from the late sixteenth century belonged to two distinct states: the Spanish (and later Austrian) Low Countries and the Dutch Republic – is compared with that in central and northern Italy (Tuscany and Piedmont, constituting the core areas of the Florentine State and the Sabaudian State respectively). The series for Piedmont/Sabaudian State is presented below as an example (figure 1). The paper focuses on general tendencies and compares large areas with a common methodology, leaving to other studies an in-depth discussion of local (community-level) dynamics.
This is the first time since Van Zanden’s seminal 1995 article on the super-Kuznets curve, that a large-scale comparison of inequality across Europe has been attempted. As we find a continuous inequality growth in all the areas we study, we reject economic growth as a necessary causal factor for growing inequality in pre-industrial Europe. It might have been a sufficient cause – for instance in the case of the Dutch Republic – but it was most certainly not the only one. For other European regions, both in the North Sea area and in Italy, rival explanations can prove sufficient as well. Demographic growth and urbanization for instance, but also proletarianization processes appear to be crucial for understanding changes in inequality levels in some cases (Ryckbosch, 2014). A final potential explanation considered relates to the influence of the institutional and political context on inequality. The rise of a strong fiscal state in particular seems able to explain the growth of inequality in specific regions, for example in seventeenth-century Piedmont (Alfani, 2014). In this latter – institutional – context, we use the concepts of the ‘inequality possibility frontier’ and the ‘inequality extraction ratio’ introduced by Milanovic, Lindert & Williamson (2011) in order to better understand the implications of inequality growth.

Academic Session I / B
248
Figure 1: Inequality in Piedmont, 1300-1800 (Gini indexes of wealth concentration)
0,3
0,4
0,5
0,6
0,7
0,8
0,9
1
1300 1350 1400 1450 1500 1550 1600 1650 1700 1750 1800
Piedmont Cities Rural areas
Source: Alfani 2014
References
Alfani, G. (2010), ‘Wealth Inequalities and Population Dynamics in Northern Italy during the Early Modern Period’, Journal of Interdisciplinary History, XL (4), 513-549.
Alfani, G. (2014), Economic inequality in northwestern Italy: A long-term view (fourteenth to eighteenth centuries), Dondena Working Paper, n. 61, March 2014.
Milanovic, B., Lindert, P.H. and Williamson, J.G. (2011), ‘Pre-Industrial Inequality’, The Economic Journal, 121, 255-272.
Ryckbosch, W. (2014), Economic inequality and growth before the industrial revolution: a case study of the Low Countries (14th-19th Centuries), Dondena Working Paper n. 67.
Van Zanden, J.L. (1995), ‘Tracing the Beginning of the Kuznets Curve: Western Europe during the Early Modern Period’, Economic History Review, 48 (4), 643-664.
Héctor García Montero (Bocconi University) Economic inequality in England from the middle ages to the eve of the industrial revolution
During the last few years, the study of economic inequality in the past has been a particularly fruitful field of research for economic historians. In particular, two aspects are gaining prominence, which were until very recently almost neglected: wealth inequality and the pre-industrial inequality dynamics. Along these lines, although with a different pace according to the area, the big picture of the wealth inequality evolution from the middle ages to the modern world is being constructed.
Nevertheless, in this picture, the case of England has remained virtually unexplored. This is partly due to the fact that, in sharp contrast with much of Southern and Central Europe, the English fiscal system did not provide us with systematic and homogeneous sources through the centuries as was the case, for example, in central-northern Italy, southern France and eastern Spain throughout the late medieval and early modern period. However, the key importance of England in the general economic history of the European continent suggests the opportunity of using what is available to try and figure out whether it followed a path similar to that described by recent research for other parts of Europe, or if it has to be considered, also from this point of view, an exceptional case.
This work presents the first results of an ongoing project aimed at exploring the long-term (fourteenth-eighteenth centuries) trends in wealth inequality in England, connecting them to economic and demographic dynamics. We make use of fiscal sources such as the Lay Subsidies of the first half of the fourteenth century (mainly those of 1327 and 1332), the

Academic Session I / B
249
Tudor subsidies (in particular, those of 1524/25) and the hearth taxes of the second half of the seventeenth century. These sources include assessments of moveable properties and/or real estate at a national level and have wide social coverage (although with different exemptions in each case). Our database covers a wide and varied sample of counties and municipalities.
In addition, sources of a different kind, such as the Tudor military survey of 1522, the information supplied in some communities by the poor relief sources from the late sixteenth century, and the social tables elaborated for the late seventeenth and the eighteenth centuries are considered. Additionally, the city of Norwich, by means of its rich sources related to the poor relief, which adds up to the usual fiscal data, provides us with an excellent case of study for in-depth analysis of topics such as the dynamics of the top wealthy contributors, the evolution and the prevalence of poverty, and, for some benchmark years, the level of wealth measured with the Gini or similar indices. This case study can be considered a pilot study possibly to be extended to other urban communities for which similar sources are available.
The paper provides: first, an evaluation, based on an important mass of literature, of the potential – and the shortcomings – of the mentioned sources to study wealth inequality; secondly, it tries to establish first estimations of wealth inequality in England for some benchmark years by studying a sample of counties and municipalities; finally, it compares the mentioned results with those obtained in similar works recently published for other areas of Europe, setting out first hypothesis about the links between the English economic and population dynamics and the trend in economic inequality. Mats Olsson & Patrick Svensson (Lund University) Wealth inequality in Sweden, 1700-1900
A large number of empirical studies of wealth inequality have emerged recently with the explicit aim of generating knowledge on long-term patterns in equality. Although most attention has been directed to the development during the last hundred years, researchers have attempted to chart wealth inequality’s roots back through the nineteenth century. The figures before 1900 are however for most countries still highly uncertain, because the tax registers and other public compilations rarely stated the size of individuals’ wealth, and if they did, it is highly dubious whether they measured the same thing from time to another. Alternative sources proposed for use are probate inventories. The advantage of these is that they were conducted in a uniform way for a very long time. Of course there are also a number of problems associated with these sources; it is a laborious task to collect them from hand-written documents on micro level, people with few assets may be less represented, and there may be underestimations in order to facilitate the division of property among heirs. However, these are problems that can be dealt with methodologically. The aim of this paper is to examine the evolution of wealth inequality as reflected in probate inventories in Sweden from 1700 to 1900. We accentuate every fifty years and seek a representative sample of urban and rural areas in different parts of the country. In this way we are able to prolong the existing series for Sweden back in time almost 200 years encompassing the transition from the traditional pre-industrial society based on agriculture over the agricultural revolution to the emerging industrialization. This, in turn, will provide new empirical knowledge on inequality patterns, previously only assumed, and thereby explanations on the relationship between growth and inequality.

Academic Session I / C
250
I/C Occupational Structure, Population Geography and Technological Change
Keith Sugden (University of Cambridge) The impact of the mechanization of cotton manufacture upon male and female employment; a
case study of Manchester c.1780-1840
There is a well documented literature to describe the mechanization of cotton spinning and weaving in the county of Lancashire between the late eighteenth and second–quarter nineteenth centuries. This literature focuses upon a number of aspects. For example, the technical inventions, who did what and when, the contemporaneous literature describing the various machines, the number of spindles and looms at work in selected years, the national output statistics, and the Factory Inspectors’ Reports. Despite the breadth of the historiography, there remains insufficient, clear empirical evidence to pinpoint the date at which the mechanization of the two processes first significantly impacted the industry. This paper, the first part of a larger study, attempts to address this deficiency through the analysis of the occupations of single men, and more specifically through the timing of occupational change. Its aim is to plug the gap in knowledge between the initial demise of cotton hand spinning and the publication of the Factory Inspectors’ Reports in the 1830s.
Using the parish of Manchester as a case study, this paper analyses the marriage records of the church of St Mary, St Denis and St. George to track the temporal change in the number of bridegrooms who were either spinners or weavers. Manchester parish was selected for study for two reasons. One, the parish was at the vanguard of the cotton industry at this time. Two, post Hardwicke’s Marriage Act of 1753, marriages at the church were comprehensively recorded in the registers. Over the time period studied, more than 95 per cent of all St Mary, St Denis and St. George entries in the registers include the occupation of the bridegroom. Manchester parish was large, covering approximately 60 square miles. It contained two towns, Manchester and Salford, and many townships. By means of the imposition of double duty to those in the parish who married at another church, residents were financially encouraged to marry at St Mary, St Denis and St. George. So, these church registers are considered to be a fair representation of single men, bridegrooms, who resided within the parish. Their analysis shows a rapid rise in adult male cotton spinning in the 1780s. It suggests that the change in the ratio of adult male spinners to weavers, and the subsequent plateau of this ratio in the mid-1790s, is indicative of the demise of cotton hand spinning. By this time, the commercial practice of spinning by hand was likely effectively over in Manchester. Mule spinning was dominant and the transition from hand spinning-to jenny and water frame-to-mule was approaching completion. Mule spinning was a well-paid occupation, undertaken at this time largely by adult men. As these machines were introduced, women and children were displaced as spinners, but they continued to be employed as piecers and in other necessary, but ancillary, tasks.
The spinner/weaver ratios show another distinct change during the second and third decades of the nineteenth century. An upward trend is observed, at the time when power looms were first introduced into weaving and when automated mules became available. Adult males were displaced from the weaving trade as women were employed to operate the power looms. The introduction of mule spinning machines positively impacted the opportunity for adult male employment. Conversely, the introduction of power weaving looms had an adverse effect. The 1851 census indicates that males accounted for 76 per cent of all Manchester cotton spinners, approximately double the percentage who were weavers.
Further work to analyse the marriage registers of a number of other Lancashire textile towns, for example, those of Oldham St Mary, Wigan, Bolton le Moors, and of Blackburn St. Mary, has been carried out. It shows that whilst Manchester parish was at the forefront of the change in spinning, other parishes soon followed. Similar trends are observed, albeit at
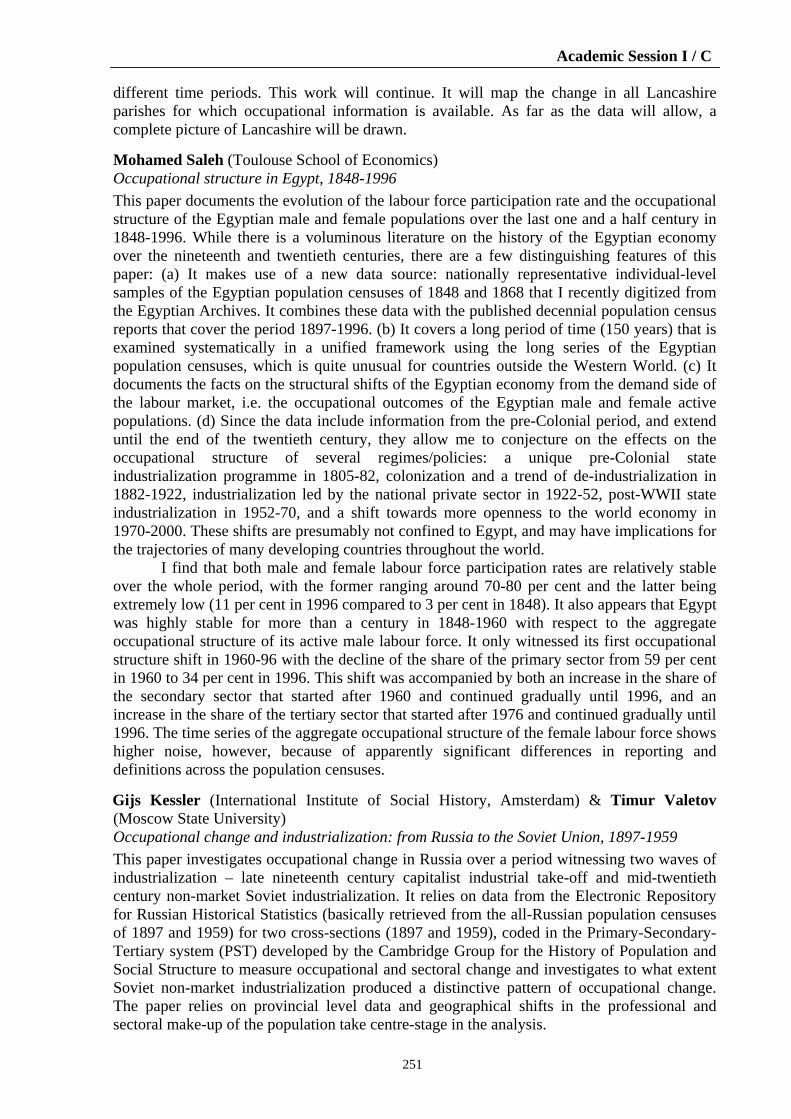
Academic Session I / C
251
different time periods. This work will continue. It will map the change in all Lancashire parishes for which occupational information is available. As far as the data will allow, a complete picture of Lancashire will be drawn. Mohamed Saleh (Toulouse School of Economics) Occupational structure in Egypt, 1848-1996
This paper documents the evolution of the labour force participation rate and the occupational structure of the Egyptian male and female populations over the last one and a half century in 1848-1996. While there is a voluminous literature on the history of the Egyptian economy over the nineteenth and twentieth centuries, there are a few distinguishing features of this paper: (a) It makes use of a new data source: nationally representative individual-level samples of the Egyptian population censuses of 1848 and 1868 that I recently digitized from the Egyptian Archives. It combines these data with the published decennial population census reports that cover the period 1897-1996. (b) It covers a long period of time (150 years) that is examined systematically in a unified framework using the long series of the Egyptian population censuses, which is quite unusual for countries outside the Western World. (c) It documents the facts on the structural shifts of the Egyptian economy from the demand side of the labour market, i.e. the occupational outcomes of the Egyptian male and female active populations. (d) Since the data include information from the pre-Colonial period, and extend until the end of the twentieth century, they allow me to conjecture on the effects on the occupational structure of several regimes/policies: a unique pre-Colonial state industrialization programme in 1805-82, colonization and a trend of de-industrialization in 1882-1922, industrialization led by the national private sector in 1922-52, post-WWII state industrialization in 1952-70, and a shift towards more openness to the world economy in 1970-2000. These shifts are presumably not confined to Egypt, and may have implications for the trajectories of many developing countries throughout the world.
I find that both male and female labour force participation rates are relatively stable over the whole period, with the former ranging around 70-80 per cent and the latter being extremely low (11 per cent in 1996 compared to 3 per cent in 1848). It also appears that Egypt was highly stable for more than a century in 1848-1960 with respect to the aggregate occupational structure of its active male labour force. It only witnessed its first occupational structure shift in 1960-96 with the decline of the share of the primary sector from 59 per cent in 1960 to 34 per cent in 1996. This shift was accompanied by both an increase in the share of the secondary sector that started after 1960 and continued gradually until 1996, and an increase in the share of the tertiary sector that started after 1976 and continued gradually until 1996. The time series of the aggregate occupational structure of the female labour force shows higher noise, however, because of apparently significant differences in reporting and definitions across the population censuses. Gijs Kessler (International Institute of Social History, Amsterdam) & Timur Valetov (Moscow State University) Occupational change and industrialization: from Russia to the Soviet Union, 1897-1959
This paper investigates occupational change in Russia over a period witnessing two waves of industrialization – late nineteenth century capitalist industrial take-off and mid-twentieth century non-market Soviet industrialization. It relies on data from the Electronic Repository for Russian Historical Statistics (basically retrieved from the all-Russian population censuses of 1897 and 1959) for two cross-sections (1897 and 1959), coded in the Primary-Secondary-Tertiary system (PST) developed by the Cambridge Group for the History of Population and Social Structure to measure occupational and sectoral change and investigates to what extent Soviet non-market industrialization produced a distinctive pattern of occupational change. The paper relies on provincial level data and geographical shifts in the professional and sectoral make-up of the population take centre-stage in the analysis.

Academic Session I / C
252
In this paper we measure occupational change in Russia between 1897 and 1959 using the PST classification.503 This is a purely pragmatic choice – the census data for 1897 are sectoral rather than occupational, and although for 1959 we could use HISCO,504 it would preclude a comparison over time. Using PST, however, we can compare sectoral shifts over time and still add on the occupational information for 1959.
The 1897 and 1959 population censuses allow us to identify 103 out of the full PST range of 130 ‘groups’. Neatly separated data are not available for all of these groups – some of them are indistinguishable from each other in either the 1897 or 1959 dataset, or both and are therefore listed as combined ‘groups’. However, we have a good opportunity to compare the occupational situation both at the national level and in regional distribution.
We reveal some important occupational changes over time. First, agriculture is by far the largest sector of employment both in 1897 and in 1959, even if its share is slashed notably over the sixty-year period under study. We are faced with some peculiarities of the 1897 population census which recorded many family members as dependants without any occupation, thus hiding the real occupational distribution, especially in agriculture.
If we consider in some more detail the rise of the other sectors, the main trends are (1) the rise of heavy industry, in particular metal-working and machine-building, (2) an increase of employment in transport and communication, in (3) various branches of construction, and (4) a significant increase of employment in services.
The increasing importance of heavy industry is a finding entirely in line with what we know of the priorities in Stalinist and Soviet industrial development, which aimed to build up an industrial basis for further autarkic economic development. Indeed, the shares of metal-working and machine-building are in fact perhaps smaller than one would have expected given the sustained development of heavy industry since at least 1929.
The main trend in regional distribution over time in this branch is the spread of employment in manufacturing from two industrial heartlands in European Russia, around Moscow and St. Petersburg, to other areas of the country in the East and North. This conforms well with what we know about Stalinist industrialization, which aimed for the exploitation of the mineral resources of the country’s Asian territories, building factories right along the main extraction sites.
A similar increase of employment took place in transport and communication, accounting for 2.3 per cent of the workforce in 1897 and 8.5 per cent in 1959. On the one hand this reflects general, worldwide increases in this sector, due to technological change and increased mobility. But in the Soviet case it is likely also a corollary to the industrial and agricultural development of many remote parts of the country starting from the 1930s on.
In 1897 employment in transport appears to have been spread rather evenly across the country, with the only outliers being the Far Eastern coastal province with 5-7 per cent of the workforce, and the coastal province of the North Caucasus (7-10 per cent), where some of the ports were located through which grain produced on the steppe hinterland of the Black Sea was exported to the world market. Internal river and rail transport does not appear to have been accompanied by any regional or local concentrations of employment in this sector. By 1959, however, a completely different picture has emerged – the Eastern and Northern territories of the country consistently show the highest percentages of the workforce employed in transport and communication, which is a vivid illustration of the deliberate infrastructural development effort in these remote and relatively thinly populated regions.
Most impressive, however, in terms of the numbers of people involved, is the rise of the service sector. To be sure, in the Soviet state-run economy this does not reflect the rise of a private service sector, but the expansion of the state one. The sector includes the ‘professions’ group i.e. doctors, teachers, engineers and scientists (all of whom were state-
503 http://www.geog.cam.ac.uk/research/projects/occupations/britain19c/pst.html [as retrieved on 15 Dec 2014]. 504 History of Work Information System: http://historyofwork.iisg.nl/ [as retrieved on 15 Dec 2014].

Academic Session I / C
253
employed in the 1959 Soviet Union), as well as the auxiliary workers assisting these qualified professionals etc. What is remarkable is that actual government service accounts for only a relatively modest share of the workforce (2.1 per cent), and does not show the sort of rapid increase one would have imagined considering the fundamentally different role of the state in all walks of life respective to 1897.
On the contrary, the data reveal the second set of occupational shifts – the demise of several groups which were important in 1897, but no longer so in 1959. These are, significantly, domestic service (generally included into the rising service sector), light industry and trade.
Conclusively, some of the changes found over time are entirely consistent with the transition from a capitalist to a socialist economy, in particular the decrease of trade in sectoral employment. Within manufacturing we observe a manifest shift in labour allocation from light to heavy industry, indicative of Soviet investment priorities and forcibly reduced consumption in the USSR. Mark Casson (University of Reading), Leigh Shaw-Taylor, Max Satchell & Tony Wrigley
(University of Cambridge) Railways and local population growth: a case study of the Birmingham region
Local historical case studies provide numerous instances of how the arrival of railway stimulated local industry and population, but there are other instances where the arrival of a railway seems to have had no effect. The connection between railways and local population growth can be examined through impact studies of either railway openings or railway closures. This paper focuses on railway openings in the nineteenth century, and adopts a statistical approach grounded in economic theory.
The paper builds on the authors’ previously published work, which involved a single-county study of Oxfordshire and a two-county study of Northamptonshire and Rutland. This paper involves a three-county study centred on Birmingham, including about 700 parishes in Staffordshire, Warwickshire and Worcestershire. Unlike the previous studies, this study encompasses a major industrial district that was already well-served by canals at the time the railways were built, as well as by two major rivers; it also involves a major coalfield.
Data sources include the Census of Population 1801-91 (decadal data, standardized using parish-based units with fixed boundaries), Ordnance Survey index maps, Cobb’s Railway Atlas, the BGS Geology of Britain Viewer and various gazetteers and trade directories.
Impacts are estimated using a simultaneous equation model, identified through lags, which give the model a recursive structure.The model analyses the interplay between railway building, station building and population growth, and takes account of both the impact of railways on population growth and the impact of population growth of railway construction. The model involves a wide variety of control variables, such as local access to turnpikes and waterways, local soils, and the presence of long-established markets.
The results confirm a statistically significant positive impact of railway construction on population growth; the impact of cross-country lines is double that of trunk lines and for local lines four times that of trunk lines. Station-building has a positive impact independently of railway building. The additional impact of a station is roughly the same as the impact of the railway alone.
The impact was greatest in the 1840s and 1860s; both times of substantial construction and of economic prosperity (1840-46 and 1860-66). Population growth was highest in the Birmingham – Dudley – Wolverhampton area. Railway hubs such as Stafford and Worcester grew relatively slowly. Early canals seem to have had a greater impact on population growth than later canals, while the impact of rivers and roads on population growth was quite small.
While these results are broadly consistent with previous studies, the distinctive nature of the Birmingham district nuances previous findings in an interesting way. In general it

Academic Session I / C
254
suggests that railways were a more important influence in population growth in industrial areas than in mainly rural areas. Their impact in mining and manufacturing areas appears to have been greater than their impact in agricultural areas.

Academic Session I / D
255
I/D Famine, Living Standards and Institutions Gregg Huff & Gillian Huff (University of Oxford) The Great Famine in Vietnam, 1944-45
This paper provides the first quantitative analysis of Vietnam’s 1944-45 great famine. Although the famine claimed the lives of a million or more Vietnamese in Tonkin and North Annam, explanations for it and attribution of responsibility remain unclear. We argue that famine, although made worse by wartime events, resulted from successive typhoons that struck coastal areas. Econometric analysis reveals the famine’s highly unequal impact: the landless and those lacking access to external labour markets had by far the greatest probability of dying. Famine led to widespread, violent popular action and, moreover, was central to the historical watershed of Vietnam’s August 1945 revolution.
The 1944-45 famine in World War II Vietnam continues to resonate. Remarkable enough is the scale of famine and famine-related deaths, estimated at between one million and two million. Even more, attention has focused on the proper attribution of blame for the famine. Candidates include the incompetence of the French colonial administration operative until a 9 March 1945 Japanese coup usurped the final vestiges of French power; callous behaviour by the Japanese military in reducing civilian rice availability and, after famine struck, being indifferent to it; and Allied insistence on an intense aerial bombing campaign that either destroyed or halted much of the transport which could have carried rice from Cochinchina in the south to famine-ravaged areas in Tonkin and North Annam.
The famine’s reverberations extend, moreover, to one of the great events in twentieth-century world history: famine and its traumatic social and political impact are generally considered to have been instrumental in the August 1945 revolution which brought the Viet Minh and Ho Chi Minh to power. Mass famine further discredited French and Japanese rule as well as the Japanese-sponsored nationalist government installed following the March coup. Although aided by good harvests, communist policies that helped to prevent a possible repeat of famine contributed to the new regime’s legitimacy.
What caused the famine?
A principal aim of this paper is to provide the first quantitative analysis of Vietnam’s great famine and to untangle causation. We argue that Vietnam’s famine was caused by a Food Availability Deficit. Famine would not have occurred, or at any rate would have been much less extreme, in the absence of three successive typhoons that hit the coastal provinces of northern Vietnam in the months just before the year’s second, and main, rice harvest on 3 November 1944. Nevertheless, a number of war-related events made the Vietnamese famine worse than it otherwise would have been. In Vietnam, the classically lethal famine combination of erratic weather and war operated.
Incidence of famine
Famine, even when as devastating as in Vietnam, where some 8 per cent of those in affected areas in Tonkin and North Annam died, is highly selective. To examine this selectivity, we employ a probit model which links, for hamlets in 23 provinces in the regions of Tonkin and North Annam, death to family size, location, land ownership and occupation. Rural dwellers without land and/or unable access external labour markets had by far the far greatest probability of dying during the famine and overwhelmingly accounted for its victims. Famine and revolution
Hunger in the countryside gave rise to a seemingly unending stream of famine victims who, clad only in straw matting or rags against a cold winter, were attempting to walk to cities. Many died by the roadside but others reached urban areas. At dawn, if a Hanoi resident ‘you’d gingerly push your door ajar to check if there was someone dead outside’.

Academic Session I / D
256
The famine, the greatest disaster in modern Vietnamese history, shaped Vietnam’s subsequent history. After famine struck, ‘the Viet Minh came out of hiding and mobilized the population to seize rice that both the French and Japanese had stored in case of food shortages’. The spectacle of mass death pointed to a need for basic change and brought about an acceptance of it. By the end of World War II, Ho Chi Minh and the Viet Minh enjoyed wide support. The campaign against famine enabled the Viet Minh to head ‘a genuine mass movement’. Famine was instrumental in Vietnam’s communist revolution and helped the Viet Minh to establish itself and prevail in the First Indochina War beginning in late 1946. Leigh Gardner (London School of Economics) & Jutta Bolt (University of Groningen) De-compressing history? Pre-colonial institutions and local government finance in British
Colonial Africa
This study contributes to a growing body of research which has sought to identify the link between pre-colonial institutions and post-independence development outcomes. This work has two aims. One has been to shift focus away from the period of colonial rule, which in sub-Saharan Africa lasted for less than a century with little investment from the colonizing powers. The other is to illustrate how Africans and indigenous institutions shaped colonial administrations. One challenge faced by this literature has been in identifying the mechanism for the continued influence of pre-colonial institutions despite the disruption of colonial rule. Reference is often made to the practice of ‘indirect rule’, but the structure of indirect rule varied widely across colonies. This paper uses new data on local government finance in British colonial Africa in combination with anthropological records to link the level of pre-colonial centralization to the structure of colonial rule. From the 1930s, British colonial governments began to decentralize fiscal responsibility for the provision of social services. The paper shows that the size, shape, and fiscal capacity of colonial local government units reflected the degree of centralization of pre-colonial institutions. Local governments’ degree of success in raising funds influenced their ability to invest in the local provision of education and healthcare, providing the foundation for post-independence economic development. Andrew Seltzer (Royal Holloway, University of London) & Jeff Borland (University of
Melbourne) The impact of locally-set minimum wages on labour markets: the case of the 1896 Victorian Factories
and Shops Act This paper will examine one of the first minimum wage laws passed in the world, namely the 1896 Factories and Shops Act passed by the colony (now Australian state) of Victoria. The act was the culmination of the colony’s long-standing activist programme of labour market intervention, begining in 1873 with the passage of the Victorian Factory Act, which banned the employment of young children, regulated the employment of women, and created a factory inspectorate. The 1896 law was meant, in large part, to preserve the industrial peace which had been threatened by the decisive defeat of a series of large strikes earlier in the decade. A key feature of the law was the creation of industry-specific wage boards comprising an equal number of representatives of industry and of workers (plus a neutral chair), that had the power to set occupation-specific wages for all workers in their industry. Originally, the law extended to only six industries. These industries were selected because they had a high level of female employment (clothing, shirt, boot, underclothing), had a high level of Chinese employment (furniture), or were important for public health (breadmaking). However, a 1900 amendment meant that all industries in the colony could be covered by minimum wage rates.
Between 1900 and 1913, the Victorian government published an annual list of minimum wages and employment for each industry covered by a wage board. In a few industries the wages board passed a single minimum wage covering all workers in the industry; however, in most industries there were separate minimum rates for men and women, and in many there were multiple minimum rates covering different occupations. Regardless of the number of minimum rates covering each industry, the records contain only the total

Academic Session I / D
257
number of male and female employees throughout in each year. This data will be used to examine whether increases in the minimum wage resulted in a reduction of overall employment or in gender-specific changes in the composition of employment. The approach used is a fairly standard panel regression of changes in employment (male, female, or total) on the change in the minimum wage rate with year and industry fixed effects. The minimum wage variable has been constructed in several different ways including 1) the nominal minimum rate in pounds per week, 2) the nominal minimum rate in pounds per hour (where standard or minimum hours are available from the government list), 2) the real minimum wage rate using several published and unpublished price deflators for Melbourne and Australia as a whole, and 3) the ratio of the minimum wage to the average wage of unskilled labour. The preliminary evidence suggests little if any employment effect of the law, in other words, increases in the minimum wage did not result in decreases in employment.

Academic Session I / E
258
I/E The British Atlantic Economy Emma Hart (University of St Andrews) On the waterfront: wharfside spaces and economic culture in Britain’s Atlantic world
In the past few years, early modern historians have begun to recognize the utility of space as an analytical tool. Identifying domestic, public, and sacred spaces as arenas of interaction, scholars have explored how natural and built environments are instrumental in our understanding of some of the major cultural and political developments of the era. While some aspects of economic history, such as the growth of empires and the creation of consumer societies, have benefited from spatial enquiries, economic historians have been relatively slow to embrace the broader possibilities of space as an analytical category. Theoretically-driven discussion of the capitalist landscape by social scientists has done little to persuade scholars who have traditionally favoured quantitative analysis that spaces and places are important beyond their role as novel sites of middling and elite consumption.
Using an exploration of the wharf in four British and British American cities in the eighteenth century, this paper argues that understanding the configuration of commercial space can be a vital tool for unearthing important contrasts in Atlantic economic culture. The paper will focus on the intersection of ownership, commercial function, built environment, and regulatory regimes that organized wharves in Glasgow, Newcastle, Philadelphia, and Charleston. Concentrating on the period between 1660 and 1783, I will compare patterns of ownership, usage, and authority, in the four cities. The general story that emerges is a familiar one to economic historians, namely the enlargement of wharves and the increase in commercial activity that accompanied the growth of Britain’s Atlantic trade. The main focus here, though, is the personnel and the spaces that structured this process. In Newcastle and Glasgow, local authorities viewed the wharf as a public space that was under their jurisdiction. When improvements were undertaken, they were very often accomplished through an act of parliament. If individuals pursued commercial activity for their own ends on the wharf, authorities rapidly intervened. Newcastle’s Common Council, for example, reacted strongly to merchants who stored wood on the wharves and butchers who sold meat directly to ships crews. Both groups of townsmen were ordered to retreat from the waterfront and back to the areas of the town officially reserved for their commercial activities.
In contrast, the organization of Philadelphia and Charleston’s wharves was driven by individual entrepreneurs, who developed the space to maximize their individual commercial advantage. The very nomenclature of the wharves reflected these differences, with American wharves often referred to in newspapers by the names of their owners. One such wharf was that owned by William Fishbourn, the one-time mayor of Philadelphia. When a fire destroyed Fishbourn’s wharf in the early eighteenth century, newspaper reports listed a range of maritime and other businesses that had been destroyed by the disaster. In both Charleston and Philadelphia the wharf was a gathering place for enslaved Africans, who when not working, could often be found socializing, much to the ire of the urban authorities. Yet, when corporate authorities sought to intervene in the organization and development of the wharf, they frequently had to battle individual property owners for the right to direct development.
Focusing on these contrasts in the type of commercial activities that took place on wharves, the nature of waterfront property-ownership, and the attitude of local government to the situation, my discussion will conclude by looking at such differences in relation to the economic culture of the historical actors involved. In particular, I will explore this issue in the context of practice theories that seek to explain how cultures can be a product of the interaction between individuals and societies over both space and time. Drawing especially on Giddens’ idea of ‘duality of structure’, I examine the processes by which early American wharf-users, through their day-to-day practices, and their response to the spatial and institutional setting in which they found themselves, forged distinctive cultures. By the middle of the eighteenth century, the early American urban wharf functioned as a marketing

Academic Session I / E
259
space, strongly shaped by the commercial ambitions of those who operated in it. As a result, those institutions that wished to claim a stake in its regulation had to enter into a process of negotiation with wharfside business and property owners. In Britain, on the other hand, the use of the wharf remained a matter for the city corporation, Parliament, and the Trinity House. It is only by focusing on the interaction of individuals and institutions across space as well as time that we can appreciate how the emergence of an Atlantic world brought about processes of differentiation, as well as of convergence, in Western economic cultures. Adrian Leonard (University of Cambridge) From local to transatlantic: insuring trade in the Caribbean505
A sophisticated network of risk transfer facilities and procedures had evolved across the Atlantic trading area by the mid-eighteenth century, to insure commercial vessels and cargoes. The customs and conventions of European, and particularly British, marine insurance practice were exported to the Americas. This paper looks at the underwriting activities of the Rhode Island merchant, Obediah Brown, whose unique insurance records reveal the breadth of North American mainland trade into the Caribbean and the broader Atlantic World, shedding light not only on the well recognized exchanges with British sugar islands, but also with the colonies of Britain’s belligerent rivals and Caribbean free trade zones. It further explores how insurance operated in wartime, supporting the vital trade between New England and the Caribbean.
The value of New England’s exports to the Caribbean approximately quadrupled between the 1750s and the early 1770s, to exceed £300,000 per year. The significant rise in these estimates is supported by a parallel increase in the number of clearances of vessels from Salem, Boston, and Rhode Island in the period leading up to the Revolutionary War. Insurance arrived at the mainland colonies in the same way it had reached London, with the merchants who traded there. Limited private underwriting was almost certainly occurring along in the commercial centres of the north eastern colonies at the turn of the century, but evidence which confirms that it occurred during the seventeenth century is scant. It is clear, however, that marine insurance practice developed in line with American trade to other British colonies and elsewhere. In Philadelphia in 1721 local demand for local insurance was sufficient to encourage John Copson to launch an insurance brokerage office. Others followed, and insurance offices garnered a role as mercantile places of association.
Among British North America’s fledging merchant-insurer community was Obadiah Brown (1712-62), a prominent merchant, ship owner, and manufacturer. In the 1750s Brown began trading directly from Providence to London, and expanded his core West Indies trade. He also began routinely to underwrite. His Marine Insurance Book contains a record of the risks he assumed between 1753 and 1762, the year of his death. The document illustrates what may be a typical insurance-risk portfolio for a local merchant-insurer of his time. It shows that Brown dabbled in underwriting, insuring primarily vessels involved in his own arena of commerce, the Caribbean trade, and especially to Surinam, Jamaica, and Hispaniola. It also reveals that many of the practices of marine insurance underwriting which had been developed in Italy and refined in London were employed in the American colonies by the mid-eighteenth century.
Pares declares that London merchants ‘played an important role in the trade between New England and the West Indies’ as ship owners and traders in goods on their own accounts. London merchant-insurers played a further role as the insurers of western Atlantic voyages. Yet, despite underwriting by resident merchant-insurers, such as Brown, London remained a chief source of marine insurance for much or most of the eighteenth century, at least for voyages beginning or ending in Europe. For example, on 7 February 1759 the London wine
505 Based on a chapter of the same name in Leonard, A.B. & Pretel, D. (eds.): The Caribbean and Atlantic World
Economy, Palgrave, 2015.

Academic Session I / E
260
merchant and prominent marine insurance underwriter William Braund insured the vessel Sally on her voyage from New York to the Leeward Islands at the rate of 15 per cent, and the following day the slaver Chesterfield from Liverpool to Guinea and the West Indies for 12 per cent. London’s marine insurance market was thus engaged seriously and directly in the provision of cover for merchants on both the eastern and western borders of the Atlantic world, for their transatlantic voyages and their regional trade.506
American independence released the nascent country from the proscription of corporate underwriting set out in the Bubble Act of 1720 (which was to remain in force in England until 1824). A number of marine insurance companies were formed shortly afterwards, as US merchants ‘energetically developed domestic sources of marine insurance’. Nonetheless, the private insurance market in Rhode Island appears to have been operational in 1794. That year Charles DeWolf (rendered in the policy D’Wolfe), who was a member of a prominent Rhode Island merchant family and brother of the better-known merchant, slaver, and later senator James DeWolf, insured his vessel Sally and its cargo with private underwriters for £600 ‘Lawful Money’ to cover a voyage from Havana to his home port of Bristol, Rhode Island.507
Whether policies were underwritten in London or the US, the mechanics of private underwriting were identical, and were based upon those invented by Italian merchants centuries earlier, and refined in London, as shown by Brown’s library. Knowledge of these practices quickly permeated the Atlantic world, and served to underpin its trade. Merchants of the highest standing actively participated in established and fledgling insurance markets, underpinning the trade of the Atlantic world, enabling the balancing of payments between regions, and maximizing traders’ investments in cargoes and ships. Merchant-insurers used the instrument to share the grave risks of Atlantic world commerce amongst themselves by establishing a shared and virtual pool of contingent capital which provided an important foundation upon which the integrated and expanding Atlantic world economy rested.
Selected sources
RIHS MSS 315, E445/44 Part 1, Reel 23, Obadiah Brown Papers, ‘Marine insurance book, 1753-1762’.
ECRO D/DRu B7, William Braund’s Journal of Risks, 1759-1765. NAS CS96/507 f. 16, Letterbook of Buchanan & Simson, letter to Fraser & Wharton, 30 Nov.
1759. Author’s collection: policy underwritten for Charles D’Wolfe, 29 Mar. 1794. ‘Report from the Select Committee on Marine Insurance (Sess. 1810), 5 March 1810’. House
of Commons, BPP (226) 1810 IV 247, reprinted 11 May 1824. The special report from the committee appointed to inquire ... London: House of Commons,
printed by Tonson, J., et al., 1720.
506 Pares, Yankees and Creoles, p.4. 507 Crothers, Commercial risk and capital, pp.615-616.

Academic Session I / E
261
Sheryllynne Haggerty (University of Nottingham) What’s in a price? The raw cotton market in Liverpool and the Anglo-American War
Developed from hundreds of printed Prices Current held at the John Carter Brown Library, Brown University, this paper investigates the raw cotton market in Liverpool between 1800 and 1820. This rare collection facilitates the production not only of a price series analysis of raw cotton prices in Liverpool over this period, but the textual information alongside the prices provides an insight into the concerns of the Liverpool merchants about that market. These documents discuss the impact of the French Wars, and the increasing tension between Great Britain and the United States which culminated in the Anglo-American War of 1812-14 on the raw cotton market, but also the role of harvests, financial failure, speculators, rumour and other news affecting the price of raw cotton.
During this period the cotton trade was still in its infancy having really only started on a large scale in the 1790s. Indeed, in 1795, the small nature of the cotton industry led the United States to agree to the Jay Treaty which gave Great Britain preferential trading rights with the United States. Seen at first as a betrayal by the Southern slaveholders, this relationship benefited them most by creating a ‘highly profitable transatlantic partnership based on cotton’.508 By 1800 however, the United States was a major exporter of cotton, and the port of Liverpool was the main recipient; that port’s cotton prices therefore make an excellent case study. The initial backdrop to this increase in trade was the French Revolutionary and Napoleonic Wars.509 There was a brief respite from 1801 to 1803, but Britain’s Orders in Council of 1805 brought in a strict blockade of continental Europe and Napoleon’s Milan and Berlin Decrees brought in the continental blockade which further affected cotton supply and demand between 1806 and 1813.510 By 1807 English actions against American shipping had caused major political tensions, exacerbated by the ‘Chesapeake’ affair in June of that year. This culminated in the American Embargo of 1807-9, and eventually the Anglo-American war of 1812-14.511
Despite the background of war, this paper argues that the price of raw cotton at this time comprised various elements. Whilst prices were lower overall during the Anglo-American conflict than before or after, the prices within this range fluctuated month by month, week by week, and sometimes even daily. The newness of this market means that it did not have a developed futures market – but we could argue for a nascent one. Importantly, however, the prices for cotton were constructed from far more than any present supply and demand – exacerbated by war or not. Expectations about present and future demand and supply around the world were clearly based on a wide variety of expectations – in turn shaped by harvests, political events, assumed knowledge, speculators, diplomatic expeditions, as well as hopes and fear. Rumours and speculators shaped the market as much as any perceived reality. Raw cotton prices in Liverpool were therefore shaped by the merchants’ cultural, social and political situation, as much as by any actual supply and demand.
508 Brian Schoen, Fragile Fabric of Union: Cotton, Federal Politics, and the Global Origins of the Civil War
(Baltimore, MA.: John Hopkins University Press, 2009), pp.37-39. 509 On the causes of the French Wars see Gunther E. Rothenburg, ‘The Origins, Causes, and Extension of the
Wars of the French Revolution and Napoleon’, Journal of Interdisciplinary History, 18:4, The Origin and Prevention of Major Wars (Spring, 1988), 771-93.
510 Schoen, Fragile Fabric, p.69. See also François Crouzet, ‘The Impact of the French Wars on the British Economy’, in François Crouzet, Britain, France and International Commerce: From Louis XIV to Victoria (Aldershot: Variorum, 1996), chapter V, pp.189-212, p.190.
511 Scott A. Silverstone, Divided Union: The Politics of War in the Early American Republic (Ithaca and London: Cornell University Press, 2004), chapter three, ‘The United States Confronts Great Britain and Spain, 1807-1815, pp.69-118, p.74; G. W. Daniels, ‘American Cotton Trade in Liverpool Under the Embargo and Non-Intercourse Act’, American Historical Review, 21:2 (Jan 1916), 276-87. See also Jeffrey A. Frankel, ‘The 1807-1809 Embargo Against Britain’, Journal of Economic History, 42:2 (1982), 291-308.

Academic Session I / F
262
I/F Production and Exchange in Early Modern Europe Carlos Álvarez-Nogal, Leandro Prados-de-la-Escosura & Carlos Santiago-Caballero (Universidad Carlos III de Madrid) Agricultural output and productivity in Spain, 1400-1800: new evidence from tithes
Lack of sources prevents direct estimates of agricultural output in early modern Spain. Recent estimates have been derived at national and regional levels using an indirect demand function approach. The consumption and output per head of food staples would have declined from mid-fifteenth to mid-seventeenth century – although still remained high in the early sixteenth century – and, then, stabilized at a low level – despite a recovery episode in the late seventeenth-early eighteenth century – followed by a sharp steady decline until the mid-nineteenth century (Álvarez-Nogal and Prados-de-la-Escosura 2013).
Agricultural output per economically active population, in turn, would have declined both at national level and across regions, with the exception of Catalonia. A moderate productivity fall seems to have occurred in Spain during the sixteenth century, followed by a return to the initial levels in 1700. The eighteenth century would have witnessed a more intense contraction in output per worker, only partially reversed in the first half of the nineteenth century. Two clear-cut phases appear to exist in the regional behaviour. Remarkable disparities are observable in the evolution of labour productivity across regions over the period 1530-1700. Regional variance, then, would decline in the early eighteenth century and, after a reversal in the second half of the century fall again in the early nineteenth century to recover to the 1750 levels (Álvarez-Nogal & Prados-de-la-Escosura 2007).
These findings are to some extent explicit conjectures based upon limited empirical evidence on real wage rates – as a proxy for disposable income per head – and relative prices for agricultural and non-agricultural goods that are used together with assumed values for income- and own price elasticities to estimate the consumption per head of agricultural food staples, from which agricultural output per head was inferred.
These quantitative conjectures need to be put to the test. Lacking the possibility of constructing detailed output estimates, tithes provide another approach that, although also indirect, requires a lower number of assumptions than those involved in the demand approach. So it is our purpose to present alternative estimates of agricultural output for the early modern period on the basis of tithes in order to test the hypotheses derived from demand approach.
In Spain, studies of the evolution of agricultural output (usually for the main crops) on the basis of tithes at regional and local level are abundant, most of them dating from the 1960s and 1970s, but an aggregate picture at national level or contrast between regions is missing. It could be argued that the effort required to unifying and analysing dozens of studies in different regions, at different times, and for different products has discouraged historians. Difficulties to interpreting the information provided by tithes have also led historians to avoid using data not collected personally by themselves. The richness of the available datasets and the implications for the knowledge of the agrarian and economic history of early modern Spain persuaded us to accept the challenge of, firstly, gathering all the available series of tithes, and, then, trying to homogenizing them in order to derive aggregate results both at regional and national level.
Our longest and almost continuous tithe series correspond to the kingdom of Seville, which cover the evolution of grain tithes between 1408 and the mid-nineteenth century. However, since it is generally accepted that the reliability of the tithes decreased significantly after the Napoleonic invasion, we set 1800 as the last year of our estimations.
Grain was, by far, the most important component of agricultural output in late medieval and early modern Spain, and although in some areas (the periphery, in particular) it lost some ground, it still kept its predominance in agriculture by 1800. Our grain production continuous series can be traced back to the mid-fifteenth century in New Castile or the Balearic Islands, and cover most from the mid- and late sixteenth century onwards.

Academic Session I / F
263
Furthermore, we have been able to find tithes for the main agricultural crops (cereals, must, olive oil but also livestock and fruit trees).
On the basis of tithes it can be shown that agricultural grain output experienced intense growth across all regions during the sixteenth century with peak levels reached around the 1570s-80s. The crisis of the seventeenth century was especially hard in the interior and lasted until the late seventeenth century, followed by a recovery in the first half of the eighteenth century and stagnation and sluggish growth during its last two decades. In the northern regions the seventeenth century crisis was milder and consisted mainly of a period of stagnation, partially a consequence of the positive effects of the introduction of alternative products such as maize. The eighteenth century was a period of intense output expansion. A similar pattern is found in the eastern coastal region, although here the seventeenth century crisis was evident and production fell until mid-century, when the trend changed to produce a rapid and accelerating growth. We observe that the evolution of other main products such as olive oil or wine (must) followed similar trends to those observed for grain.
All in all, our preliminary results tend not to contradict those findings derived from the indirect demand approach.
References
C. Álvarez-Nogal and L. Prados-de-la-Escosura, ‘The Rise and Fall of Spain, 1270-1850’, Economic History Review 66, 1, (2013), pp.1-37.
C. Álvarez-Nogal and L. Prados-de-la-Escosura, ‘The Decline of Spain (1500-1850): Conjectural Estimates’, European Review of Economic History 11, 3 (2007), pp.319-366.
Christiaan van Bochove (Radboud University Nijmegen) Making payments within the Dutch Republic
Payments systems are key for the long-run development of economies as they facilitate the exchange of goods and services. Remarkably, however, historians of pre-industrial Europe have typically focused on the more exotic world of foreign bills of exchange and international payments. Much less attention has been paid to how domestic payments were organized. England, with its bankers and inland bills of exchange, stands out in this respect, but little to no attention has been paid to that other highly-developed economy: the Dutch Republic. This is an important omission for the Republic was a leading financial centre, where, banking nevertheless developed during the late nineteenth century only.
This paper proposes to remedy this in two ways. First, it relies on the lost-and-found advertisements and price quotations in seventeenth and eighteenth-century newspapers to reconstruct the use and price of checks and inland bills of exchange. Second, it uses the ledgers of Vlaer & Kol, notaries and financial intermediaries in the town of Utrecht during the second half of the eighteenth century, to uncover the domestic payments infrastructure. Vlaer & Kol’s network connected them, and their own current account holders, to cashiers and the Exchange Bank in Amsterdam as well as related intermediaries in other towns (including the foreign financial centres of London and Paris). By zooming in on the transactions with their Amsterdam cashiers, this paper also intends to develop an understanding for the long and short-term fluctuations of the relative importance of the various payments instruments.
The availability and reliance on the financial instruments and intermediary networks that this paper documents, demonstrate that people in the Dutch Republic could in fact rely on a highly-developed domestic payments infrastructure. In this respect the Republic did thus not differ from England. The fact, moreover, that people only left very modest amounts in their current accounts with Vlaer & Kol has implications for the further development of banking as intermediaries held little money to build a lending business upon. This therefore provides one possible explanation for why banking only developed in the Netherlands during the late nineteenth century.

Academic Session I / F
264
Kristina Lilja (Uppsala University) & Pernilla Jonsson (Stockholm University) Clothes as medium of exchange
The aim is to study clothes/textiles as store of value and medium of exchange during the early industrialization in Sweden. The purpose is to problematize commodities as storage of values in relation to the development of credit markets and mechanization of production as well as the introduction of more breakable fabrics such as cotton.
Clothes have both an economic and immaterial value (Miller, 2008). Depending on different intrinsic properties and the proportion of agents specializing in different goods, an object is more or less likely to be used as a medium of exchange (Kiyotaki & Wright, 1989). In a society with a poorly developed credit market, clothes could serve as a store of value and medium of exchange. They are easy to store and transport without high transaction costs or loss of worth. However, people’s willingness to accept a certain commodity depends on beliefs about other traders’ willingness to accept them as a medium of exchange, or the existence of a second-hand market. Crucial in the evolution of a certain medium of exchange is that a learning process takes place over time (Lou, 2012).
In the eighteenth century clothes were highly valued. Production was trying and time-consuming. Clothes were mainly handmade. Even in the late nineteenth century, individuals in general had just a few garments. This meant that clothes were cared for and taken care of. Clothes and linens were often accumulated in young adulthood and were common as payment in kind (Lemire, 1988; Turnau, 1994; Harnesk, 1986). Clothes were also often stolen, because of their high worth (Styles, 1994; Lemire, 1997; Toplis, 2010).
When the value of clothing is relatively stable, it could be used as an economic asset, possible to realize in difficult times during an individual’s life cycle (Allerston, 2000). Previous research has also shown that consumption differed between social groups and was a gendered pursuit (e.g., Vickery, 2009; Ferris Motz & Browne, 1988). The value of wardrobes seems to have varied over time in relation to other assets (Ulväng, 2012).
How did the second-hand value of textiles/clothes develop over time, and how could this be explained? To what extent were textiles/clothes exchanged for money? What social groups used this possibility on the second-hand market, and how did this correspond to if these groups could enter the credit market?
By using cross-section data from auction protocols and pawnshops for 1837, 1860, 1885 and 1898 from the town of Västerås, Sweden, we show that textiles/clothes at the end of the nineteenth century were still used as an asset and sold when needed over the life cycle. The economic value of textiles/clothes remained high, thus providing the household an asset to be realized in times of economic difficulties. However, more ‘breakable’ fabrics and new raw materials in textiles altered the lifecycle of clothing, influencing the value of women’s wardrobes more than men’s. As the former were excluded from the formal credit market, this development definitely caused severe economic constraints for the lower social groups.

Academic Session I / G
265
I/G Agricultural Crisis and Land Reform in Spain Ramon Ramon-Muñoz (University of Barcelona), Josep-Maria Ramon-Muñoz (University
of Murcia) & Nikola Koepke (University of Barcelona) Well-being and the late nineteenth-century agrarian crisis: anthropometric evidence from
rural Catalonia
This paper is a new approach to explore the evolution of well-being during the years of the late nineteenth century agrarian depression, a well-researched topic in economic history (e.g. Tracy, 1963; Abel, 1973; Garrabou, 1988; O’Rourke & Williamson, 1999; Lains & Pinilla, 2010). The standard narrative of the topic links this crisis with the development of a global and more integrated economy during the second half of the nineteenth century. It argues that falling transport and other trade costs, and the growing agricultural output led to an increased competition, a drop in the prices of agricultural products, and, finally, a fall in European landowners’ income in the 1880s and the 1890s. But what happened to the biological standard of living as crucial aspect of well-being of the overall population?
Previous studies did analyse the farmers’ response to the crisis events. The existing literature on this topic has argued that the rise of agrarian tariff duties in late nineteenth-century Europe was strongly influenced by farmers’ demands for protection. Some scholars have also suggested that the late nineteenth century mass migration cannot be totally disentangled from the situation of agriculture in peripheral Europe. Other studies on rural change point out that the agrarian depression could have stimulated the modernization of the agriculture in the Old Continent.
However, the exact impact of the crisis still remains unclear. There is no doubt that it was fairly heterogonous: it varied across countries and regions, it did not affect all agrarian products in the same way, and it differed by social classes and groups (Garrabou, 1975, 1988). Thus, some economic historians have tended to stress the crisis’ negative impact, whereas others have suggested a less pessimistic view (e.g. Reis, 1988; Simpson, 2001; Federico, 2009).
So far the debate on the impact of the agrarian crisis, interesting as it might be, has usually tended to miss out on one important piece of the puzzle: the evolution of the non-material well-being of the rural population during the late nineteenth century as an essential part of the overall living standard (e.g. Komlos, 1985; Steckel, 1995).
Our paper aims to help fill this gap by focusing on the Iberian region of Catalonia, a relatively well-developed area in southern Europe and a region where the agrarian crisis seem to have taken place “… in all its force” (Garrabou & Pujol, 1988: 113). We use mean height data as proxy for net nutritional status and, thus, living standards. The dataset used in this paper is based on the information collected in the Recruitment Books of the western and more rural Catalan province of Lleida. We have data for 102 out of the 322 places located in this province in the late nineteenth century. In absolute numbers, this means that our current dataset includes approximately 18,000 individuals with almost 16,500 height measurements for young men enlisted during the recruitment period of 1898-1924, which corresponds to the birth cohorts of 1879 to 1903.
What do these data indicate about the biological living standard during the late nineteenth century agrarian depression in western Catalonia? Despite the drop in prices, the reduction of land use, or the fall in land rents the average height of the young males born during the last two decades of the nineteenth century did not decline. The econometric analysis confirms this impression of a missing detrimental effect of the agricultural crisis on the overall living standard: no statistical significant negative changes took place in the course of the period under study. Therefore, the currently available anthropometric evidence indicates that the agrarian crisis might have had a less negative impact on the overall well-being of the rural Catalan population than one might perhaps have expected.

Academic Session I / G
266
In addition, our current findings show remarkable differences in the biological living standards across individuals and territories. These differences, moreover, seem to have changed over time, suggesting that the impact of the crisis indeed was fairly heterogonous. Regarding height gap across individuals (and perhaps social groups), the difference in mean height across the draftees belonging to the first quartile of the height distribution and those placed in the third quartile was almost 10 centimetres, a huge difference that, however, lessened in the course of our study period: despite certain ups and downs, overall, the height inequality (as measured by the coefficient of variation) seems to have been lower in the late 1890s than in the years around 1880.
The current data also indicate statistically significant regional differences among the young males settled in the more mountainous part of the province and their contemporaries in the plain areas of Lleida. A further finding is that, in the long-run, a certain convergence took place, as the male mean height series from the mountains moved towards the height level in the plain.
In sum, our findings adumbrate that the human well-being of the (western) Catalan rural population did not develop negatively during the end of the nineteenth century, at least as the biological standard of living is concerned. Our future research will provide a further, deeper analysis based on an enlarged dataset that will allow us to understand even better how the late nineteenth century agricultural crisis actually affected the overall Catalan well-being. James Simpson & Juan Carmona (Universidad Carlos III de Madrid) Too many workers or not enough land? Why land reform failed in Spain in the 1930s
On the eve of the Second Republic there was a broad consensus among most contemporaries on both the Right and the Left that some form of land reform was necessary for the southern provinces of Spain. Rural poverty was widespread and while enormous estates were believed to be under-cultivated by their absentee owners, a significant number of workers were denied access to the land. Yet the attempts at land reform were slow and disappointing, and on 25 March 1936 over a hundred thousand peasants invaded farms in the region of Extremadura. By then Spanish society had become deeply divided and the failure to carry out a comprehensive land reform is often cited as a major cause of the outbreak of the Civil War a few months later. Using a large sample of farm level information collected by the Institute of Agrarian Reform (IRA) for those estates that were expropriated in Extremadura, this paper argues that the attempts at land reform were not only inefficient as a mechanism to raise farm output and productivity, but also failed to provide an adequate solution to the poverty facing many rural workers.
In the first instance, there was simply insufficient land available to be distributed. Agriculture in the 1930s was still the employer of last resort in the south, and the economic crisis appears to have caused the numbers looking for work in the sector to have increased significantly. Even a radical land reform, which left no landowner with more than 100 hectares of cereal land, would have given most families little more than a basic income, even assuming zero resettlement costs.
Economic theory suggests that land reform might have compensated for the physical limits to the farm area by encouraging settlers to increase output per hectare. Low income countries are labour abundant and capital scarce but large farmers prefer to use relatively little labour and large amounts of capital because of incentive problems. A land reform which breaks up estates and creates small farms that use family labour can increase production as farmers face much lower supervision costs than wage workers, and will therefore cultivate their land more intensely. Although it is true that large farmers face lower costs accessing capital markets, the inverse relationship between farm size and average annual output per

Academic Session I / G
267
hectare ‘swamps the positive relationship between farm size and average output per hour of work’ found on the large estates.512
Yet these benefits appear to have been limited in the Spanish case. Supporters of land reform were divided between those who wanted to alleviate rural poverty by maximizing the numbers of beneficiaries, and those who wished to raise output and efficiency. The state agronomists planned to make settlers self-sufficient by giving each enough land to fully use their draft animals and family labour, but this was rejected in favour of a policy to maximize the number of settlers, even though these would be forced to look for part-time work elsewhere to provide for more than basic subsistence needs. Agronomists and labour syndicates preferred that the estates be worked as collectives and not broken up, suggesting that they believed there were some returns to scale. Settlers by contrast, perhaps aware of the potential difficulties of working in groups of anything between 7 and 100 families, demanded to work the land individually. As a result, a hybrid situation developed whereby groups of workers were settled and carried out some tasks collectively, while plots were cultivated individually. Consequently the nature of agency problems and transaction costs were changed rather than reduced, and the possibilities of increasing output through labour intensive improvements limited to subsidence cereals and collecting wood for charcoal production. The organizational difficulties are reflected in the fact that settlements often struggled to meet their collective rental and capital repayment obligations. In addition, the IRA archive allows us to see how well individuals worked and contributed to the settlement, as agronomists were obliged to compile detailed reports on each worker following the occupation of the farms by Franco’s’ troops in 1936.
The evidence suggests that giving access to land to asset-poor workers helped re-distribute incomes, but that production increases were limited because of the weak incentives to using family labour given the nature of the settlement, and the high costs associated with accessing capital markets. Indeed it could be argued that Spanish agriculture by the 1930s had passed a threshold, and that it was no longer true that there was an inverse-relationship between farm size and land productivity, as significant increases in land or labour productivity required greater capital investments. Problems of moral hazard and transaction costs were behind the decision of the IRA to sometimes rent pastures rather than to advance capital to the settlers to stock the land themselves. Unsurprisingly, a common complaint of the Left was that land reform had simply changed workers’ dependence on private landowners to that of the IRA. Indeed, the very slow pace of settlements and their limited operational success divided rural society between landowners who feared future expropriations, and the Socialist FNTT syndicate which felt it was being by-passed by the process, and organized the massive land invasions in March 1936. Jordi Domenech (Universidad Carlos III de Madrid) & Francisco Herreros (Spanish
National Scientific Council, Madrid) Land, politics, conflict and lethal violence: evidence from the 1930s
In poor, agrarian societies, conflicts over land rights can cause polarization and violence. Using a new municipal dataset on agrarian structure, litigation, conflict, electoral results and lethal violence, this paper analyses the spatial dispersion of conflict and political mobilization in Catalonia during the Second Republic and the Civil War (1931-39). Several legislative changes in the regulation of tenancy and sharecropping contracts were passed in 1931 and 1933, leading to sharp conflicts between owners of land and tenants and sharecroppers, causing a clearcut political divide in Catalonia and a failed attempt of secession from Spain in October 1934. When the Civil War started in July 1936, violence was endemic behind frontlines. Was conflict over land property rights in a largely agrarian society directly linked
512 Michael Lipton, Land Reform in Developing Countries. Property rights and property wrongs (Abingdon:
Routledge, 2009). p.6.

Academic Session I / G
268
to revolution and lethal violence? We analyse the spatial variance in political mobilization and collective action before 1936, as well as the continuities between prewar grievances and killings of civilians between July and November 1936.

Academic Session II / A
269
II/A Shareholders and Firms in the UK during the late Nineteenth and early Twentieth Centuries
Janette Rutterford, Dimitris Sotiropoulos (Open University) & Carry van Lieshout (University of Nottingham)
Investor trust in the UK, 1870-1930
The paper examines the long run evolution of investor trust in the United Kingdom over seven decades between the 1870s and 1930s. During this period, limited liability companies became fundamental to the development of British industry, shareholding grew in response to the increased choice of companies for investment and the variety of share types available. Hitherto, the majority of relevant research has focused on ownership concentration and control by insiders. In addition, the studies that have examined individual shareholdings have either focused on individual companies and sectors or examined a range of sectors but typically at a particular point in time. This paper uses a very large sample of nearly 33,000 shareholders based on 223 sets of share records of 47 companies, a large and representative database of the investor population across sectors and time. It investigates the structure and the evolution of trust relationships between shareholders and the companies in which they invested. The paper also examines how investor trust was affected by corporate governance and corporate performance. The main findings highlight the importance of informal trust relationships for the development of capital markets and the critical role of London, as both economic and financial centre, on investor decision-making. The size of the firm, the size of individual shareholdings and the number of stock exchanges that the security was listed seem to have an influence on investor trust. On the other hand, investors were rather risk averse only in relation to debentures and saw high dividend yield as compensation for parting with local trust relationships only for particular sectors. Graeme Acheson (University of Stirling), Gareth Campbell & John Turner (Queen’s
University Belfast) Rentier capitalism and the equity market: shareholders in Victorian public companies
Incorporation law in the UK was liberalized in a series of acts between 1856 and 1862.513 This liberalization was followed by an expansion of the UK equity market as newly-established as well as existing business enterprises issued shares on the London and fledgling regional stock markets.514 Acheson et al. show that there was a substantial rise in the number of common equities traded on the London market after this liberalization – between 1862 and 1866, the number of listed common equity securities increased by over 30 per cent.515 This expansion of the equity market therefore created a greater range of investment possibilities for savers beyond safe but low-yielding Consols and railway securities.
Using data on 453 firm-years and over 172,000 shareholders, this paper examines who invested in equities during the substantial expansion of the British equity market in the second half of the nineteenth century. It also analyses whether there were clientele effects, where certain types of stocks and companies were more attractive to certain types of investors. Over the entire sample, we find that gentlemen capitalists and women rentiers provided circa 60 per cent of capital and constituted about 60 per cent of investors. We also find that there was a
513 The 1855 Limited Liability Act (18 & 19 Vict., c.113) was repealed, but re-enacted in 1856 (19 & 20 Vict.,
c.47). Limited liability was introduced in banking in 1858 (21 & 22 Vict. c.91). Finally, the 1862 Companies Act (25 & 26 Vict. c.89) was a consolidation of existing pieces of incorporation legislation.
514 See Cottrell, Industrial finance; Taylor, Creating capitalism and Shannon, ‘The limited companies’ on the liberalization of incorporation law and the subsequent growth in company formation. On the growth of the equity market, see Michie, London Stock Exchange, p.88-9. See Michie, Money, mania and markets and Thomas, The provincial stock exchanges on the formation and growth of Scottish and provincial stock exchanges in the nineteenth century.
515 Acheson et al., ‘Rule Britannia’.

Academic Session II / A
270
substantial growth in women investors over the century. In terms of clientele effects, we find that the upper classes exhibited a preference for foreign firms. However, businessmen and women had a preference for domestic and non-London-headquartered firms. Women investors also exhibited a preference for equities which paid a dividend and which were relatively safe. Contrastingly, businessmen were more likely to take risks and be speculators. Lyndon Moore, Sturla Fjesme & Neil Galpin (University of Melbourne) The vicar, the widow, or the gentleman: who gets allocated IPO shares?
Rock’s (1986) seminal paper derives that ‘informed’ investors will be allocated more shares in good (more underpriced) IPOs rather than bad IPOs, whereas ‘uninformed’ investors receive more shares in bad IPOs. Due to data limitations the literature typically characterizes institutional investors as ‘informed’ and retail investors as ‘uninformed’. We examine 554 IPOs in the UK from 1891 to 1911. We have data on the occupation and geographical location of all allocated shareholders for 141 of these IPOs. Shareholders who are both occupationally and geographically close to the firm receive larger allocations of good IPOs, and avoid bad IPOs. In contrast institutions receive smaller allocations of good IPOs.

Academic Session II / B
271
II/B Geography, Borders and Institutions: Re-interpreting Italy’s Regional Divide
Carlo Ciccarelli (Università di Roma Tor Vergata) & Stefano Fachin (Università di Roma
La Sapienza) Industrial growth and spatial spillovers in nineteenth-century Italy
The economic literature on the historical roots of the Italian regional divide, and the resulting unequal development of Northern and Southern regions, is sizeable. However the geographical disaggregation of the data examined is typically low: in most regions (NUTS 2 level). As a consequence, the geographical dynamics have not so far been adequately examined. The task to fill this gap in the literature may now be partially tackled using the recent estimates (Ciccarelli & Fenoaltea, 2010) of manufacturing value added at 1911 prices at the level of provinces (NUTS 3 Italy’s units; for the sake of comparison, this is the level of départments in France, kreise in Germany, and districts in England).
The present paper sheds new light on the geographical distribution of the growth of the manufacturing industry among Italy’s provinces from 1871 to 1911. It essentially innovates the existing literature by investigating the main determinants of industrial growth while accounting at the same time for spatial effects. Standard analysis based on descriptive statistics, spatial autocorrelation indices, and geographical maps, show that a considerable divergence process took place among Italian provinces, with Southern provinces falling behind Northern ones.
Estimation of a conditional convergence model (Rey & Montouri, 1993) augmented with human capital, social capital, and social overhead capital suggests that education, a cooperative culture, and spatial spillovers are able to explain, other things being equal, much of the geographic variability of value added growth in the manufacturing industry in nineteenth century Italy. In order to estimate the effect on industrial growth of social participation, human and social capital, and infrastructure endowment we collected data from historical sources ranging from population censuses, to official railways and electoral publications, to individual contributions of various scholars of the time. To increase the efficiency of our estimation procedure in some cases we resort to principal component analysis (PCA), a common way to reduce the dimensionality of the problem (for instance, it is used in a very similar set-up by Tabellini, 2010).
The human capital control used in the regression models is the first principal component emerging from PCA on the logs of (standardized) illiteracy rates, age heaping, number of pupils and number of teachers in primary school. With ‘age heaping’ data kindly provided by Brian A’Hearn.
The social capital controls includes two groups of variables: (i) social participation, and (ii) political participation. The social participation group include in turn the number of published newspapers and magazines (as in Helliwell & Putnam, 1995), and membership of mutual societies (both suitably standardized by the population size); the second group includes the number of voters (per 100 registered voters) in the local and national elections of mid-1860s and 1870. PCA suggests keeping these two groups separated, so we constructed a social participation variable as the simple average of the number of newspapers and magazines titles and membership of mutual societies, and a political participation variable as the simple average of the number of voters (per 100 registered voters) in the local and national elections of mid-1860s and 1870. (Although, one could legitimately argue that in the lack of universal suffrage electoral participation correlates weakly with social participation.) Social overhead capital control. A detailed quantitative analysis of social overhead capital in Italy’s regions (NUTS 2) from 1861 to 1913, including reference to historical sources, is given in Ciccarelli & Fenoaltea (2008). Here, dealing with provinces (NUTS 3 units), the quantitative information is inevitably more limited. We define infrastructure capital so as to

Academic Session II / B
272
include local and national roads, railroad extension, and the number of post offices (standardized by the population size). Following PCA results, the proposed regressions include the simple average of (standardized) roads and railways, and, as a separated variable, the number of post offices per 100,000 inhabitants.
Moran’s I spatial autocorrelation coefficient is particularly high for education, but also sizeable for industrial growth and post offices. The exception to the rule is instead represented by the political participation variable, as we failed to reject the null of no spatial autocorrelation.
To summarize, the estimation of a conditional convergence model (Rey & Montouri, 1993) augmented with human capital, social capital, and social overhead capital suggests that education, a cooperative culture, and spatial spillovers are able to explain much of the geographic variability of value added growth in the manufacturing industry in nineteenth century Italy. Our findings show that in the four decades here considered (1871 to 1911) the growth differential between the best and worst endowed provinces in terms of education and social capital can be estimated to be, other things being equal, respectively equal to about 30 and 20 per cent, while the corresponding differential granted by positive spatial spillovers is over 15 per cent. Emanuele Felice (Universitat Autònoma de Barcelona) Regional income inequality in Italy in the long run, 1871-2001: patterns and determinants
The paper presents up-to-date estimates of Italy’s regional GDP, with the present borders, in ten-year benchmarks from 1871 to 2001, and proposes a new interpretative hypothesis based on long-lasting socio-institutional differences.
In order to obtain a long-run picture of regional inequality in Italy, regional GDP figures for eight benchmark years, spanning from 1871 to 1951 at regular ten-year intervals (the only exception is 1938 instead of 1941), have been produced; these have been linked to the estimates from 1961 to 2001, in five more ten-year benchmarks, available from official sources. As a result, we can now observe the evolution of regional inequality in Italy from around the unification of the peninsula until the present day. For the benchmarks from 1871 to 1951, the estimate methodology is in line with that developed by Geary & Stark (2002): as a general rule, the national GDP has been allocated through regional employment, using differences in nominal wages as proxies for differences in productivity. In the case of Italy, however, it was possible to improve Geary & Stark’s method in two main respects. Firstly, for most industry in the liberal age (the benchmarks from 1871 to 1911) and for agriculture throughout the period (1871-1951), it was possible to use direct production data, by taking advantage of the works by Federico (2003) for agriculture and by Fenoaltea (2004) and Ciccarelli & Fenoaltea (2009a, 2014) for industry. Secondly, the level of sectoral decomposition is much higher here than in the work of Geary & Stark (who estimated three sectors: agriculture, industry and services), and this is partly due to the fact that the new Italy’s national GDP was also highly detailed and reliable (Rey, 1992, 2000; Baffigi, 2013).
Regional differences were relatively mild in the second half of the nineteenth century, but since then they have increased, at a slower pace in the last decades of the liberal age and with greater speed from the First World War to the Second World War. As a consequence, in terms of per capita GDP, Italy appeared to be divided into three thirds by the time regional inequality reached its peak, around 1951: the industrialized north-west, the regions of the north-east and centre close to the Italian average and the backward south. Some convergence of the south took place during the economic miracle, mostly thanks to the massive regional policy pursued by the Italian state, but it came to a halt in the 1970s and since then has never revived; at the same time, in the last decades, the convergence of the north-east and centre accelerated remarkably. As a result of these trends, by 2001, Italy was parted into two halves, the centre-north and southern Italy. The inverted U-shape of income inequality is confirmed: rising divergence until the mid-twentieth century, then convergence. However, the latter was

Academic Session II / B
273
limited to the centre-north. As a consequence of the falling back of the south, from 1871 to 2001 we record σ-divergence across Italy’s regions, i.e. an increase in dispersion, and sluggish β-convergence.
The timing and modality of the evolution of Italy’s regional inequality suggest that here geographical factors and the market size played a minor role. Against them are both the fact that most of the differences in GDP are due to employment rather than to productivity, and the observed GDP patterns of many regions; for instance, the worst-performing Italian region was Campania, by far the most favoured in the south in terms of market size. Rather, the gradual converging of regional GDPs towards two equilibria seems to follow the social and institutional imbalances of pre-unification Italy: at the time of unification, there was a socio-institutional divide − in the levels of human and social capital as well as in the nature and functioning of the political and economic institutions − which was transferred to the new state, in different forms, and since then it has not been overcome (indeed, it has even been reinforced). The paramount examples are organized crime in some southern regions regarding economic institutions and the widespread cronyism in the south concerning the working of political institutions; both go along with the renowned differences in social capital. This socio-institutional divide appears to be the ultimate determinant of Italy’s regional inequality.
References
Baffigi, A. (2013). National Accounts, 1861-2011. In: The Oxford Handbook of the Italian Economy Since Unification, ed. by G. Toniolo. Oxford: Oxford University Press, 157-186.
Ciccarelli, C., Fenoaltea, S. (2009). La produzione industriale delle regioni d’Italia, 1861-1913: una ricostruzione quantitativa. 1. Le industrie non manifatturiere. Rome: Bank of Italy.
Ciccarelli, C., Fenoaltea, S. (2014). La produzione industriale delle regioni d’Italia, 1861-1913: una ricostruzione quantitativa, vol. 2, Le industrie estrattivo-manifatturiere. Rome: Bank of Italy.
Federico, G. (2003). Le nuove stime della produzione agricola italiana, 1860-1910: primi risultati e implicazioni. Rivista di storia economica 19(3), 359-381.
Fenoaltea, S. (2004). Textile production in Italy’s regions. Rivista di Storia Economica 20(2), 145-174.
Geary, F., Stark, T. (2002). Examining Ireland’s Post-famine Economic Growth Performance. Economic Journal 112(482), 919-935.
Rey, G.M., ed., (1992). I conti economici dell’Italia, vol. 2, Una stima del valore aggiunto per il 1911. Rome-Bari: Laterza.
Rey, G.M., ed., (2000). I conti economici dell’Italia, vol. 3, Il valore aggiunto per gli anni 1891, 1938, 1951. Rome-Bari: Laterza.
Anna Missiaia (Lund University) The industrial geography of Italy: provinces, regions and border effects, 1871-1911
Italy has been characterized, throughout its history, by large regional differentials in the level of development. A large part of these differentials originates from the uneven industrialization of the Italian regions. This paper looks at the distribution of industrial employment in the period 1871-1911, which corresponds to the first industrialization of Italy. Using provincial industrial employment from four census years by Ciccarelli & Missiaia (2013), we first assess the degree of concentration of the industrial sectors and the degree of industrial specialization of the regions. To this end, we use standard measures from the Economic Geography literature: the Krugman index of specialization and concentration and the index proposed by Ellison & Glaeser (1997) to assess geographic concentration. The main result is that Italian regions and sectors in this period presented substantial levels of specialization and concentration, respectively. We also measure spatial autocorrelation through the Moran’s I index. Spatial autocorrelation tells us whether regions tend to have more similar industrial

Academic Session II / B
274
sectors when they are closer to each other. Spatial autocorrelation is similar to standard autocorrelation in econometrics, but it develops across space instead of time: it predicts that adjacent observations of the same variable will be more closely correlated than those further away. The result of low spatial autocorrelation at regional level suggests that Italian industrial sectors tended to cluster more within regions than across regions.
The paper then addresses the question whether, and to what extent, the change in the industrial employment at provincial level depended on the change in the industrial employment in the neighbouring provinces. In particular we test whether the industrial employment was affected differently by adjacent provinces belonging to the same region compared to those belonging to another region. The hypothesis here is that if regional borders matter, the effect of the change in employment in adjacent provinces that belong to the same regions will differ from that of adjacent provinces belonging to another region.
Following the methodology by Overman & Puga (2002), we sort, for each region, its neighbouring provinces in two groups: those belonging to the same region and those belonging to a different region. This procedure enables us to test whether the effect of proximity changes when the border between two provinces is not just a provincial border but also a regional one. Doing so, we test for the presence of regional border effects in the distribution of industrial employment across Italy. The same exercise is repeated using pre-unitary borders to define neighbours, in order to assess the persistence of pre-1861 institutions on the industrial geography of unified Italy.
The motivations for this paper are two-fold. From a methodological perspective, Italian regions are the standard unit of analysis for most existing works on disparities across the country. Studying the geographical patterns across regions can cast light on whether this unit of analysis is economically meaningful or not. From an historical perspective, this research is informative on the effect of regions as economic entities on the distribution of industries. Since regions originate from pre-unitary administrative units, this paper also tests the long-term effect of pre-unitary institutions.
The main result of the paper is that regional borders did matter in shaping the industrial geography of Italy. We find that the change in provincial industrial employment was positively affected by the change of the neighbouring provinces belonging to the same region but negatively from the change of the neighbouring provinces belonging to another region. This result is interpreted as a sign that neighbouring provinces in the same region tended to specialize in similar productions more compared to neighbouring provinces in different regions. This is coherent with the fairly high levels of regional specialization and industrial concentration observed through the proposed indices as well as the low level of spatial autocorrelation across regions. When the pre-unitary borders are used, the findings are confirmed, suggesting that these patterns originate from pre-1861 institutional arrangements. References
Ciccarelli, C. and A. Missiaia, 2013, ‘The Industrial Labor Force of Italy’s Provinces: Estimates from the Population Censuses’, 1871-1911, Rivista di Storia Economica, 2, 141-192.
Ellison, G. and E. Glaeser, 1997, ‘Geographic Concentration in U.S. Manufacturing Industries: A Dartboard Approach’, Journal of Political Economy, 105(5), 889-926.
Overman, H. and D. Puga, 2002, ‘Unemployment clusters across Europe’s regions and countries’, Economic Policy, 17(34), 115-148.

Academic Session II / C
275
II/C Postwar Britain Peter Scott & James Walker (University of Reading) ‘Stop-go’ economics and the decline of Britain’s consumer durables industries, 1945-64
During the 1950s and 1960s `stop-go’ policies of macroeconomic demand management were often identified as a key driver of Britain’s poor economic growth and productivity performance. However, while analyses largely based on qualitative sources have often supported this argument, those based on econometric analysis have generally rejected any clear relationship between the incidence of policy and the growth of GDP or manufacturing output.516 Such analyses typically focus on macroeconomic data, rather than examining the microeconomics of stop-go or its impact on particular sectors. However, one early econometric study noted that relative stability of aggregate manufacturing output could potentially conceal important cross-country differences in the instability of individual sectors. If high-growth sectors experienced much higher instability than their low-growth counterparts, stop-go might indeed have a damaging economic impact, although proponents of this argument would have to explain why the cyclical fluctuations of sectors differed in the UK according to their potential growth.517
As this paper shows, ‘stop-go’ measures were heavily focused on a relatively small sector of the economy – the consumer durables industries. Hire purchase (HP) regulations, together with purchase tax rates, were frequently varied in an attempt to influence consumer demand for these goods. Such changes had a devastating impact on productivity growth and new product development in the sectors concerned, as these industries were particularly reliant on mass production methods for efficient production. For example in televisions – a sector characterized by rapid technological change – several firms found that the restrictions prevented them from selling large proportions of their current model ranges before they became technologically obsolete.
Our research employs a combination of archival research – using the records of leading consumer durables firms, trade associations, government departments and the Bank of England – and econometric analysis of the impact of changes in HP restrictions and purchase tax rates on monthly national sales of certain key consumer durables. Preliminary findings indicate that changes in HP rates had a profound negative impact on consumer durables sectors, depressing long-term growth, investment, productivity, new model development, financial stability and (through creating a climate of periodic overtime, followed by short-time working or lay-offs), industrial relations. Jim Tomlinson (University of Glasgow) De-industrialization not decline: Britain since the 1950s
‘Deindustrialization is good for the UK’ (Samuel Brittan, Financial Times, 3/7/1980). The dominant narratives of postwar Britain offered by economic historians tend to revolve around issues of growth and alleged ‘decline’, with many recent versions adding a further, post-Thatcher, twist of a growth ‘renaissance’ and reversal of ‘decline’ since the 1980s. This paper argues that this growth/decline narrative is in many respects unhelpful for understanding the most important economic changes in postwar Britain, but the main purpose is to make the positive argument that a better ‘meta-narrative’ would focus on the process of de-industrialization and its effects. The claim is not that de-industrialization is a Casaubon-style ‘key to all mysteries’ for postwar Britain. But, it will be argued, starting with de- 516 For summaries of this literature, see Nicholas Woodward, The Managerment of the British Economy 1945-
2001, (Manchester: Manchester U.P., 2004), pp.80-83; Charles Bean and Nicholas Crafts, ‘British economic growth since 1945: relative economic decline … and renaissance,’ 131-172 in Nicholas Crafts and Gianni Toniolo, Economic Growth since 1945 (Cambridge: CUP, 1996).
517 Alan Whiting, ‘An international comparison of the instability of economic growth’, Three Banks Review, 109 (1976), 26-46, pp.41-42.

Academic Session II / C
276
industrialization can help us better understand major and diverse features of UK economic, social and also political development over approximately the last sixty years. The two issues focused on here are the impact of de-industrialization on major shifts in the distribution of economic welfare, especially changes in levels of economic insecurity, broadly defined; and profound changes in the social structure along a number of dimensions.
This is an interpretative paper, rather than one based on new archival research. It seeks to on the one hand to historicize the frameworks in which British post-1945 economic history has been discussed, and suggest why a more adequate framework is needed. Adrian Williamson (University of Cambridge) Privatization and the postwar settlement
The concept of the ‘postwar settlement’ dominates the literature on postwar British history. This supposed consensus apparently collapsed after 1979, as ‘primacy was given to inflation control rather than to full employment or state-financed welfare’.518 A pillar of this settlement was the ‘mixed’ economy, in that the state owned and ran large enterprises. This paper re-examines the historiographical consensus around the supposed settlement. It argues that the ‘mixed economy’ consensus was not as deeply rooted as often believed. Nor was privatization a creature simply of the post-1979 world.
Thus, in opposition from 1964 to 1970, the Conservatives championed competition. They studied the Nationalized Industries in detail. A Policy Group called for a reduced public sector. Enoch Powell described their reports as ‘exhilaratingly good’.519 Official policy was more cautious. The Party would restore a competitive framework for steel. It would pursue the ‘denationalization of Thomas Cooks and the State’s interests in some coach-building firms’, but there were ‘important obstacles in the way of total denationalization’.520 However, this apparent passivity did not represent acquiescence in the status quo. The Party had two schools: ‘commercializers’, who wanted to run the Nationalized Industries on more businesslike lines, and ‘hard-liners’ who sought to denationalize them.521 The former were in the majority, but a time might come when the arguments for commercialization and denationalization would merge.
Nonetheless, the 1970 Conservative Manifesto promised that a Tory government would ‘progressively reduce the involvement of the state in the nationalized industries’.522 The Heath government failed to develop a coherent policy for them. However, it did attempt to do so. The instincts of most Conservatives remained hostile to nationalization. This was unfinished Tory business.
Labour too was becoming impatient with the nationalized industries. Until 1967, they had enjoyed a relatively gentle financial regime.523 The Wilson government then introduced a requirement that capital investment would have to satisfy a ‘test rate of discount’ requirement of 8 per cent.524 In 1975, the new government asked NEDO to carry out a major study.525 The government subsequently announced a new financial approach to the nationalized industries generally. They were to produce a 5 per cent real return, in contrast to the -1 per cent actually achieved to 1976.526 This rate greatly exceeded that achieved by the private sector.527 The
518 Middlemas, Power, Competition and the State vol.3, p.42. 519 See e.g. 3rd draft Report, 12.6.68, and letter Powell to Ridley, 23.5.68, commenting on earlier draft, at CRD
3/17/10. 520 Conservative Political Centre, Masterbrief 21: Denationalisation (1968) pp.10-12. 521 CRD memo, 15.3.67, CRD 3/17/7. 522 A Better Tomorrow (London, 1970). 523 The Financial and Economic Obligations of the Nationalised Industries (1962), Cmnd. 1626. 524 Nationalised Industries: A Review of Economic and Financial Objectives (1967), Cmnd. 3437. 525 Study of UK Nationalised Industries, Background Paper, (1976). 526 The Nationalised Industries (1978), Cmnd: at pp.23, 36/37. 527 Ibid. p.36, App.1.

Academic Session II / C
277
nationalized industries were, in any event, contracting. Indeed, it was recognized within government that the prospects for much of the nationalized sector were bleak ‘since nearly all the nationalized industries are either too large or over-manned’.528 In 1976, the government had also sold part of its stake in BP as part of the package agreed during the IMF crisis. Ministers began to see the nationalized industries as sources, rather than recipients, of capital.
After 1974, the Conservatives returned to this unfinished business. Denationalization still seemed impractical. However, there were indications that opinion, both in the Party and generally, was moving in a quite different direction. The scale of the financial crisis in the 1970s made many people contend that the Nationalised Industries should operate more commercially. Internally, the Conservatives argued that they must become financially viable, with target rates of return.529 By 1978, this was government policy as well. Marketization was not the same as a change of ownership, but it did alter the relationship between the state and these industries.
Nicholas Ridley became chairman of the Nationalised Industries Policy Group. He had devised a denationalization programme in the 1960s. Ridley agreed with Joseph’s view that since 1945 the Tories had been ‘fighting, and continually losing, a rear-guard action to arrest’ the expansion of the public sector.530 He suggested that this long process of defeat could not be reversed by full frontal attack: ‘the key must be to make people want to get out of the public sector and into the private sector’.531 He chose members of the NIPG who shared his views, and it adopted this gradualist approach. Rather than announcing that a particular industry would be denationalized, leading to a storm of protest, he suggested a more oblique, but also more devastating, strategy. The Nationalized Industries would have a much more rigorous financial and managerial regime.532 This would make the public sector less inviting. Then there should be ‘a policy of preparing the industries for partial return to the private sector, more or less by stealth’.533 The industries to ‘edge back’ included Coal, British Airways, and BSC. The collective leadership broadly approved the policy of denationalization by stealth.534
Labour had devised a much more demanding financial regime for the nationalized industries. The previous Tory argument between ‘commercializers’ and ‘hard-liners’ was now moot. As Ridley pointed out, the 1978 White Paper contained ‘much of what we want in terms of running the Nationalised Industries. The only ground where we can take major issue … is about plans for restructuring and eventually denationalizing’.535 Labour had also shown the way on privatization by selling its stake in BP. Governments were struggling to pay their way. They reduced capital spending in consequence. Commercializing, or selling, the nationalized industries helped to bridge the funding gap.
528 Donoughue to Wilson re shipbuilding 26.7.74, DNGH 1/1/3 Part 1. 529 Redwood Paper, ‘Government and the Nationalised Industries’, August 1975, THCR 2/6/1/132. 530 ‘Public Expenditure and the Machinery of Government’, PG/11/75/15, Part I, RDWD 1/1. 531 Ibid. Part II. 532 Final Report of NIPG, 8.7.77, KJ 10/7, pp.1-14. 533 Ibid. p.15. 534 ERG Meeting 28, 14.7.77, CRD 4/4/28; Steering Committee Meeting 3.7.78, SC 16. 535 Ridley memo, 10.4.78, RDLY 2/4/21A, emphasis added.

Academic Session II / D
278
II/D Structural Change in the Global Economy Jason Begley, Frank Geary & Tom Stark (Coventry University) Convergence in the pre-1914 Atlantic economy: what really happened to wages in the Irish
economy?
Discussion of convergence in the Atlantic economy has focused on capital accumulation and technological change and, more recently, institutional change underpinned by standard neoclassical growth models that predict convergence either unconditional among economies with similar technology, savings rates, population growth and other fundamental characteristics, or conditional allowing for differences in these factors. In a challenge to this view, O’Rourke & Williamson have argued that concentration on capital accumulation and technology transfer (the spread of the industrial revolution) ignores the effects of global factor and commodity market integration: open-economy neoclassical trade theory, in short, has a lot more to tell us about convergence than closed-economy neoclassical growth theory (O’Rourke & Williamson, 1999).
Relying on a database of wages of urban unskilled labourers for 17 countries, they argue that the arbitrage effects of factor flows generated factor price convergence in the Atlantic economies. In the labour market, mass migration increased labour supply in the New World and decreased it in the Old with a resulting positive impact on wage catch up. Measured wage catch up was most marked in the labour-abundant European periphery where migration had the greatest negative impact on population: these regions caught up on both the European core and the regions of recent settlement. It is Ireland, Italy and the Scandinavian countries that drive much of this measured catch up.
O’Rourke & Williamsons’ series for both Irish and British wages is based on a small sample of the male labour force. For Ireland, the benchmark real wage comparison with Britain is for 1905 and consists of wages for skilled and unskilled construction and skilled and unskilled engineering workers. They conclude that real PPP-adjusted Irish wages were about 92 per cent of British in 1905 increasing from 57 per cent in 1881. This increase is based on wage indices for 1860 to 1913 that are a weighted average of labourers’ weekly wages in the Dublin and Cork building trades for Ireland and for Britain bricklayers’ labourers’ wages in ten cities. Consistent with their reliance on open-economy forces as the main driver of convergence they argue that Irish wage catch up is explained by emigration in a largely stagnating economy.
This paper seeks to build on this pioneering work by extending the sample of trades on which both the benchmark estimates and the wage indices are based. It presents estimates of the average wage for all wage earners and the resultant Irish wage bill. This enables an estimate of an (implied) British average wage and wage bill. The new estimates show that while there was significant wage catch up in a few occupations, in general both the pace and degree of catch up is overestimated by O’Rourke & Williamson’s sample of industries. The origins of this catch up are also examined. Consistent with earlier studies which emphasize modernization of the post-famine economy the evidence of this paper is consistent with the effects of traditional convergence forces such as TFP growth, capital accumulation and structural change operating at least alongside the effects of emigration. In short, Ireland’s late-nineteenth century performance is not just a classical tale of a negative labour supply shock but also a neo-classical one of capital accumulation and technological change. In the broader world of the Atlantic economy the Irish case suggests that, at least for the peripheral economies, while the role of emigration provides additional insight into the convergence process, catch up was driven by more than a static reallocation of labour resources between countries.

Academic Session II / D
279
Aurèlia Mañé-Estrada (Universities of Barcelona & East Anglia) & Paul Warde (University of East Anglia)
Revisiting the birth of the world oil industry: the case of the Anglo-Maikop Corporation before WWI
This paper revisits the birth of the World Oil Industry through the history of the Anglo-Maikop Company (AMC), one of few oil companies that successfully emerged from the Maikop oil rush in the Caucasus of 1910536. Before 1914, the AMC was a successful, integrated and modern oil consortium, which had developed effectively a fully-fledged regional fuel-oil market in southern Russia. However, the AMC disappeared amidst the upheaval of WWI and the Soviet Revolution and were soon forgotten. Therefore the goal of the paper is two-fold. First, its aim is to revive the forgotten story of the AMC that we have begun to reconstruct based on the archives of the company held at the London Metropolitan Archives 537 and, secondly, to interpret it in the framework of its spatial and historical milieu, the emergence of the modern oil industry.
The paper will explain how the AMC became a fully-fledged integrated fuel-oil company before WWI. The AMC was born and developed within the environment of the Russian Oil Industry (ROI) at the dawn of the twentieth century. At this time, the ROI could be considered one of the world’s most ‘modern’;538 yet by the 1920s, the leading companies and oilmen that created it were gone. Maybe, as Frank states, this was because their undertakings developed within ‘conceptual circles that no longer existed’, after WWI.539 We want to suggest, however, that the ROI was not simply a dead end, undone by the Bolsheviks, but a necessary transition point between the oil business of the nineteenth and twentieth centuries, and the emergence of the international industry.
From this point of view, we argue that success was due to the fact the AMC developed itself within the environment of the ROI, which had already in the late 1800s seen a transition from coal to fuel oil. This history of the AMC demonstrates the importance of the context that had already fostered a new energy ‘development block’, founded on a new petroleum outlet in fuel oil (mazout). From this point of view – as in many others – the years of WWI may be considered crucial in the shaping of the international oil industry. The war’s aftermath saw the carving out of the governance structures of an elitist wholesale industry. This required the destruction of an earlier retail network in the world oil trade, that was not strictly international but was nevertheless supraregional, where a large number of ‘independent’ (i.e. not state-sponsored) companies were operating. The situation after WWI was radically different, when only two of the former big players prevailed: Standard Oil and Royal Dutch Shell. The exporting territories within the old Russian and Austro–Hungarian empires declined, and were replaced by others within the borders of the former Ottoman empire. 536 We found other references to the “Maikop boom” in Jones, ‘The British Government’, p.651, note 14, Tolf,
The Russian Rockefellers, p.188, in the list of British Companies, provided by P. Ol’, Foreign Capital in Russia, and in Burdett Oil resources in Eastern Europe and the Caucasus, vol 1, p.viii, where it states that […] nevertheless, seemingly undaunted by events of the First World War, and uncertain future in the region, nearly 90 companies represented British Interests in Eastern petroleum in 1919, including Anglo-Maikop Corporation Ltd, Oil Black Sea OIlfield Ltd, Gorium Petroleum, Maikop Combine Ltd. and Spies Petroleum […]’. Further references about tha Maikop phenomenon may be found in Jones, The State and the Emergence of the British Oil Industry; in White ‘British business in Russian Asia since the 1860s’, and in Gurushina, British private capital exports to late imperial Russia.
537 The main archives of the company are located at the London Metropolitan Archives (hereafter LMA) under the generic name of ANGLO-MAIKOP GROUP, with the following references: Anglo-Maikop Corporation Ltd. (Mss 24054-62); Kuban Black Sea Oilfields Ltd. (Mss 24063-8); Kuban Refining Co. Ltd. (Mss 24069-74); Black Sea Amalgamated Oilfields Ltd. (Mss 24075-7); Levanovskoe Petroleum Co.Ltd. (Mss 24078-83); Maikop Combine Ltd. (Mss 24084-90); Maikop Midland Oilfields Ltd. (Mss 24091-6); Maikop Pipeline and Transport Co. Ltd. (Mss 24097-103); Maikop Refineries Ltd. (Mss 24104-9); Maikop Valley Oil Co. Ltd. (Mss 24110-15).
538 Tolf, The Russian Rockefellers and Jones ‘The Oil-Fuel Market’. 539 Frank, Oil Empire, p.249.

Academic Session II / D
280
Given this fact, the conclusions suggest that qualitatively the activity of the oil companies scattered across the Caucasus and South Russia were a kind of ‘missing link’ between the nineteenth-century oil market, orientated towards lighting, and the twentieth-century international industry. Finally, the paper will ponder the meaning of the oblivion of stories such as AMC in our understanding of the history of oil. References
Frank, A. F., Oil Empire. Visions of Prosperity in Austrian Galicia (Cambridge, 2007). Gurushina, N. British private capital exports to late imperial Russia, (Oxford, 1995). Jones, G. G., ‘The British Government and the Oil Companies 1912-1924: the Search for and
Oil Policy’. The Historical Journal, 20 (1977) pp 647-672. Jones, G. G., ‘The Oil-Fuel Market in Britain 1900-14: A Lost Cause Revisited’, Business
History, 20,2 (1978) pp.131-152. Jones, G. G., The state and the emergence of the British oil industry (London, 1981). Tolf, R., The Russian Rockefellers: The Saga of the Nobel Family and the Russian Oil
Industry (Standford, 1976). White, C., ‘British business in Asia since 1860’, in Davenport-Hines, R.P.T. and Jones G. G.
(Ed.), British business in Asia since 1860 Cambridge, 1989). Jonas Ljungberg (Lund University) International price competition and productivity, 1850-1940 The traditional view that the US and Germany caught-up with Britain due to successful adoption of the technologies of the second industrial revolution has been disputed by Broadberry (1997, 1998). Broadberry argued that not much changed between 1850 and 1990 in the relative productivity of manufacturing between the US and the UK, or Germany and the UK, respectively. Instead, catch-up is largely seen as a result of structural change in the US and Germany where reallocation of resources from agriculture to sectors with higher productivity levels for many years could draw on the much larger share, in the late nineteenth century, of employment in the agricultural sector.
This paper revisits the question whether Britain lagged behind due to a faster structural change or due to a more rapid rise of productivity in manufacturing in the up-coming countries. It does so by comparing prices for some technologically advanced products in Britain, Germany, and Sweden, from the mid-nineteenth century and through the interwar period: steamships, locomotives, and electrical motors. For Britain and Germany these price data are previously unpublished while most of the Swedish data are in Ljungberg (1990). For these products of the second industrial revolution, the price data indicate that Britain lost in competitiveness against Germany and Sweden, although differently for different products. Price data for technologically advanced products are very scarce and the paper goes into some detail how ‘the splicing method’ can be used for construction of price indexes from different historical records – and with results comparable with hedonic indexes where the availability of data allows construction of such.
With some rare exceptions in the literature, historical price series of technologically advanced products have mostly been constructed from input prices and not from market prices of products like locomotives, steamships, or electrical motors. These are the products studied in the present paper, with time series for the three countries mentioned. The selection of countries is motivated by Britain being the first industrialized nation whose technological leadership was challenged by up-coming Germany, besides the US for which comparable price data, however, is still missing. Sweden is relevant in the comparison since it was rapidly catching up from being a poor, peripheral country to number 4, as regards income level, in Europe by 1950 (Maddison). Moreover, it also signifies a case where structural change, along with productivity growth in agriculture, has been put forward as a rival to growth of manufacturing as an explanation of the success (Ljungberg & Schön 2013).

Academic Session II / D
281
The paper is also related to the discussion of whether prices of comparable tradeables differ between countries. The findings suggest that they may do so, and over periods extending over more than a decade. The textbook case does not allow such slow adjustments of prices in tradeable goods. However, friction is a phenomenon of real life and in an economic context this does mean that adjustments to change take time. With technological change production functions change and prices do not adapt immediately into an international equilibrium. The three products discussed in this paper are illustrations. In shipbuilding Britain had probably lost its price advantage before World War I but the situation in the market, boom or bust, very much determined the price of particular transactions. Technology also played a role and Swedish builders gained an advantage by being closer to the frontier in tank shipping. In locomotive manufacturing Britain had the leadership but had already lost this to Germany in the 1870s. However, protectionism and national favouritism constrained the levelling of international prices. In electrical engineering Britain, despite an early start, was left behind before World War I and prices for comparable electrical motors were far lower in Germany but also in Sweden. Even if structural change explains a lot of the catch-up of late-comers on Britain, it should not be forgotten that without a dynamic industry, driven by technological change, there had been less room for the reallocation of labour.
References S.N. Broadberry 1997, The Productivity Race. British Manufacturing in International
Perspective, 1850-1990, Cambridge: Cambridge University Press. S.N. Broadberry 1998, ‘How Did the United States and Germany Overtake Britain? A
Sectoral Analysis of Comparative Productivity Levels, 1870-1990’, Journal of Economic History, 58: 375-407.
J. Ljungberg, 1990, Priser och marknadskrafter i Sverige 1885-1969. En prishistorisk studie, Lund.
J. Ljungberg & L Schön 2013, ‘Domestic markets and international integration. Paths to industrialization in the Nordic countries’, Scandinavian Economic History Review, 61:101-21.

Academic Session II / E
282
II/E Early Modern Industry James Bowen (University of Liverpool) Cottagers and squatters in an early industrializing region: evidence from the Ironbridge
Gorge district, Shropshire
Despite work on the size of cottage holdings and rural housing, regional studies of cottage building and findings emerging from landscape studies, industrial archaeology and vernacular architecture, little has been written about cottagers and their association with common land. This paper, drawing on evidence from the Ironbridge Gorge district in Shropshire, will consider the following questions: Who were cottagers and squatters, how are they defined and what occupations were they employed in? Did the growth of cottage and squatter settlements in industrial areas cause tension between the incomers to parishes and the settled residents of communities which were experiencing a transition from a primarily rural, agricultural to industrial economy? What was the significance of lordship in promoting cottager and squatter settlement and to what extent was there competing rivalry for access to commons resources?
Cottage and squatter settlement generally took the form of isolated cottages with small, irregular enclosures or island encroachments, particularly in industrial or mining areas or marginal, upland hill commons where the mushrooming of cottages and irregular enclosure of waste frequently occurred. An important factor to be considered is the shift in the proportion of labour employed in agriculture and industrial activity. Lords, requiring labour for mining and industrial enterprises, actively encouraged settlement resulting in distinctive commons landscapes. During the period 1570-1700 it has been estimated that the parish of Broseley’s population increased eighteen times to nearly 2,000.540 In this instance, dramatic population increase appears to have provided the impetus for unrest. James Clifford, lord of Broseley manor, brought in colliers who dwelt in cottages upon the unenclosed common and wastes were attacked by freeholders and substantial tenants who were aggrieved by their loss of common rights.541 The development of early industry resulted in dramatic population growth and, in some instances conflict, such as, at Broseley where riots broke out in 1605-7 between cottagers and settled residents. Lordship appears to have been a major influence on events, with Roland Lacon of Willey, a prominent landowner who claimed to have a share in the lordship, instigating the attack on the cottages. Access to commons and wastes would have been physically restricted by the presence of cottagers, whose cottages had been built on them, and it is probable that some resources would no longer have been available. It is likely that cottagers would have been responsible for much enclosure in localities where there was an abundance of waste through encroachment and piecemeal enclosure. Significantly the statute which required cottages to be allocated four acres of land did not apply to industrial areas.542 The development of early industry in the sixteenth and seventeenth centuries also created increasing demand for commons resources in the locality which led to disputes between lords over boundaries and the contesting of rights, for instance to valuable minerals or sources of fuel. In legal cases a distinction was frequently made between cottages that were ‘ancient’ and ‘new.’ Cottagers and squatters were typically employed in non-agricultural activities as colliers, nailers, locksmiths, shoemakers, masons, carpenters, thatchers, glassmakers, tailors and blacksmiths. In industrializing parts of Shropshire, for example the East Shropshire Coalfield, the Stiperstones and the Clee Hills, and in England and Wales more generally, cottagers and squatters were likely to be colliers, miners and industrial or
540 A.P. Baggs, G.C. Baugh, D.C. Cox, J. McFall and P.A. Stamper, 'Broseley', in A History of the County of
Shropshire: Volume 10, Munslow Hundred (Part), the Liberty and Borough of Wenlock, ed. C.R.J. Currie (London, 1998), 257-293 http://www.british-history.ac.uk/vch/salop/vol10/pp257-293 [accessed 19 December 2014].
541 M. Wanklyn ‘Rural riots in seventeenth century Shropshire’, in A. Charlesworth (ed.), Rural Social Change and Conflicts Since 1500 (Hull, 1983), 12-13.
542 Act against the erecting and maintaining of cottages 31 Eliz I, c.7 (1589).

Academic Session II / E
283
transport workers. In his tour from Essex to Shropshire in 1776, the agricultural commentator Arthur Young (1741-1820) described the abundance of cottages in woodland near Coalbrookdale, ‘the inhabitants being employed in the vast works of various kinds carried on in the neighbourhood … potteries, pipe makers, colliers and iron works’.543 Surviving documents for the manors of Great and Little Dawley and Little Wenlock, for example particulars and lists of tenants and rents as well as maps, provide a snapshot as to the growth of cottages on waste built to house industrial workers with cottages housing multiple occupants.544 A survey of the Craven Estates dated 1769-72 includes a map of Dawley Parva recording the scale of woodland clearance and subsequent settlement, and further maps and indexes record the prevalence of cottages on Catherton Common and townships surrounding the Clee Hills.545 Reference will be made to Holywell Lane in Little Dawley which comprised thirty cottages constructed from the 1700s and was an example of the cottage or squatter communities that grew up in Shropshire and elsewhere in England and Wales during the industrial revolution.546 The examples will reveal distinctive patterns of cottage settlement reflecting the availability and landscape character of commons on which to settle and exploit the resources, the extent of manorial regulation, whether statute was enforced and the economy of a locality. Further factors include demographic trends, such as, the need to house a growing settled population, the deserving poor who were benevolently accepted in a paternalistic sense as a form of relief and those displaced with enclosure and engrossment, and the need to absorb an influx of migrants engaged in non-agricultural occupations. A squatter’s cottage has been reconstructed at the Ironbridge Gorge Museum at Blists Hill. Karin Dannehl (University of Wolverhampton) Foundry ware distribution from the Darby ironworks in Coalbrookdale/Shropshire: a review
of early eighteenth-century production, supply and management challenges
The Darbys’ iconic iron foundry in Coalbrookdale, Shropshire, started around the turn of the eighteenth century as a pot foundry supplying cast hollow ware. Pot-founder Darby had been challenged in the Court of Chancery over the rightfulness of his claim to a patent for casting iron pots in sand moulds but this proved to be not the only challenge to the famous dynasty of ironfounders. The young age of Darby’s children and the protracted disputes that arose when no will could be found, meant that the story of Coalbrookdale almost ended with Abraham Darby I’s death in 1717. This paper takes a look at a potentially critical period when the man left in charge of the works as manager was Richard Ford.
The two main documents analysed are Ford’s letter book, for the years 1732 to 1737, and the surviving ledger for a matching period, which document sales and customers on the books. They afford the historian of the early modern iron industry a glimpse of the challenges that enterprising industrialists would potentially face and the period of Ford’s management is of interest precisely because it shows a business under strain and in the process of finding new markets and dealing with fierce competition. Even though the Coalbrookdale example is in many ways unique, the detail that is available on the day to day work of production and distribution is strongly suggestive of the humdrum reality experienced by managers at the time more generally.
The aim is consequently to establish (1) what were the challenges Richard Ford faced as a manager of people and of an iron foundry? (2) What were the strategies Ford employed to overcome the challenges? And in terms of a reflection on historical methodology, (3) how may the historian come to an assessment of how well Ford succeeded in his efforts? The method employed are a close reading of Ford’s letter book in conjunction with a quantitative 543 A. Young, Tours in England and Wales, selected from the Annals of Agriculture (London, 1932), 145-150. 544 Henry E. Huntington Library, San Marino, California EL 6631-6638. 545 Shropshire Archives, Shrewsbury 6001/2481 Vol. 2. 546 K. Jones, M. Hunt, J. Malam and B. Trinder, ‘Holywell Lane: A Squatter Community in the Shropshire
Coalfield’, Industrial Archaeology Review, 6, 3, (1982), 163-185.

Academic Session II / E
284
analysis of the sales of foundry ware recorded in the ledger. The near-mythical standing of the Darbys in Coalbrookdale may persuade those looking back that the Darby ironworks were destined to succeed and belong to the ‘winners of history’. From the research to date it can be concluded that its early stages are of interest to historians of trade and industry not because of the unique and secret methods deployed at the Coalbrookdale works ensuring a direct route to success but rather because we have records that permit an insight into the day-to-day work of careful negotiation between demand, competition, production and management needs. And last but not least for the sheer numbers of pots and vessels that emanated from the Gorge. Tim Barmby (University of Aberdeen) The lead mine workings at Tyndrum: new evidence on late eighteenth-century earnings
The Scotch Mines Company held the lease of the lead mine at Tyndrum, in Perthshire between 1768 and 1792, see Payne (1967). Astonishingly, the records of these workings have survived for almost the entire period, from 1771 to 1787. The records are incredibly detailed, comprising a day by day account of the contracts made for the digging of levels, which were the passages into the mine, and the contracts for the extraction of galena (lead sulphide) ore. All of these contracts are by piece rate, and the records show with accuracy to the day when the work started and when it finished, and how much was paid out on each contract.
This represents a very rich data source which will allow the examination of a wide range of questions regarding the level of earnings for this group of workers for this period of time and also the productivity of workers. The data will allow the construction of a panel of earnings at the individual worker level, as we will be able to trace groups of workers and their output, both in terms of distance dug and ore raised, over time and the payments made for this work.
Interesting questions regarding the setting of the piece rates can examined; one hypothesis which is of interest is how closely the piece rates were set to reflect the difficulty of working; if this was done perfectly, then the expected earnings should be invariant to the rate, and miners should be indifferent between them. The paper examines the extent to which this is true by estimating the elasticity of output with respect to rate, and examining the extent to which this elasticity could be viewed as a constant, and examining the structure of the relationship.
There is also some evidence that the mines experienced some migration of workers mainly from the Northern Pennines at this time. As good records also exist for mine workings in areas of the Northern Pennines such as Allendale in the same period, then interregional comparisons and some idea of the regional distribution of earnings in this important extractive industry at the beginning of the industrial revolution will be possible.
References
Peter L Payne (1967) ‘Studies in Scottish Business History’, Frank Cass and Company. Judy Stephenson (London School of Economics) Industrial organization in London building trades, 1660-1750
When Douglas Knoop and G.P. Jones researched seventeenth-century London mason contractors in 1935 they highlighted the scale and scope of works and concluded ‘they were firms’.547 This paper takes their claim as a starting point and uses institutional account books and those of the contractors themselves to ask if they were firms, and if so, what kind or form of organization were they?
Two major developments affected the way building and construction were organized in seventeenth century London: the development of architectural surveying in late sixteenth and early seventeenth-century England; and the destruction of the City in the Great Fire. The 547 D.Knoop and G.P. Jones, The London Mason in the seventeenth century, Manchester University Press,Ars
Quatuor Coronatum,1935

Academic Session II / E
285
development of architectural surveying enabled increasing complexity in the function and aesthetics of the built environment, but also necessitated changes to the process of design and construction. The fire created demand for new construction and design on an unprecedented scale. Economic historians’ use of data from the construction trades has not taken organizational contexts or industrial structures into account. It is assumed that the artisanal model of production prevailed until the nineteenth century, and skills and technology were constant.
Although there is a great deal of literature on guilds and city and crown institutions in this period, beyond the well known work of Earle (1989), Schwarz, (1992), McKellar (1999), Riello (2008) and Grassby (1995), there is not an established body of literature on private businesses and how they financed, hired and organized their labour or affairs in London in this period, partially because the records are fragmentary.548 The traditional story is that guilds not firms controlled the market until the middle of the eighteenth century. Although there is established work about organizational form in eighteenth century manufacturing trades,549 generally decision making prior to 1800 is assigned entrepreneurs, not firms, and the organizational responses are seen as cultural and institutional.550
This paper examines cases of the contractors who carried out the building work on St Paul’s Cathedral, Greenwich Hospital, Westminster Bridge, and other public infrastructure projects. The approach is transaction cost influenced and indeed, I find organizations whose “… limit to the size of the firm is set where its costs of organising a transaction become equal to carrying it out through the market”.551 Work on these projects was contract based, and the cases examined show that the organization of production used elements not just of custom, but batch and bulk, production,552 and that the management of labour inputs through hierarchies, networks and markets was more than an act of entrepreneurship, it required management which understood the relative costs of each approach. Thus the organizational forms can be viewed within the framework of wider business history.553
The evidence shows that with large market and project expansion new institutions, services and markets emerged to cope with associated transaction costs. Contractors and subcontractors had complex and flexible organizational hierarchies that responded to these costs. The findings question existing knowledge of commercial forms and the costs of transacting in early modern London.
548 Earle, Peter. 1989. The making of the English middle class: business, society and family life in London, 1660-
1730. London: Methuen. Schwarz, L. D. 1992. London in the age of industrialisation : entrepreneurs, labour force, and living conditions, 1700-1850, Cambridge studies in population, economy, and society in past time. McKellar, E. The Birth of Modern London. Manchester, 1999. Grassby, Richard. The business community of seventeenth-century England, Cambridge ; New York : Cambridge University Press 1995; Giorgio Riello, Strategies and Boundaries: Subcontracting and the London Trades in the Long Eighteenth Century, Enterprise & Society, 9/2 (2008)
549 Maxine Berg, The Age of Manufactures, 1700-1820 Industry, Innovation, and Work in Britain, ed. Maxine Berg, 2nd ed. ed. (London, New York: Routledge, 1994).
550 Joel Mokyr, The Enlightened Economy : An Economic History of Britain, 1700-1850, The New Economic History of Britain (New Haven: Yale University Press, 2009). Page 357, 358
551 R. H. Coase, The Firm, the Market and the Law (Chicago London: University of Chicago Press, 1988). p.7. 552 Philip Scranton, Endless Novelty : Specialty Production and American Industrialization, 1865-1925
(Princeton, N.J.: Princeton University Press, 1997). 553 Naomi R. Lamoreaux, Daniel M. G. Raff, and Peter Temin, Beyond Markets and Hierarchies: Toward a New
Synthesis of American Business History, Beyond Markets and Hierarchies (Cambridge, Mass: Cambridge, Mass. National Bureau of Economic Research, 2002).

Academic Session II / F
286
II/F Estate Management and the Late Medieval Economy Catherine Casson (University of Manchester) Location, location, location? Property speculation and the rental market in medieval
Gloucester
Writing in the twelfth century the chronicler Gerald of Wales described the ‘vast superfluity of wealth and possessions’ acquired by the monks of the Augustinian Lanthony Priory, Gloucester in the course of their entrepreneurial activities, contrasting this unfavourably with the poverty of their motherhouse Llanthony Priory in Wales, which was ‘laudable’ and a location for ‘men of contemplation’. Much of this wealth, records show, came from the monk’s activities in the medieval Gloucester rental market. This opportunity was provided from a combination of their initial endowments of land and subsequent purchases and gifts.
The monks were not the only group to be involved in the Gloucester rental market, other religious and civic institutions also derived income from renting property. As with today, however, the medieval property market was not always on a smooth upward trajectory. In the mid-fifteenth century a recession in England meant that institutions, including local government, needed to look carefully at their accounts. In 1455 Robert Cole, a canon of Lanthony Priory, was appointed by the bailiffs of Gloucester to survey which properties in Gloucester had an obligation to pay chief rents to the civic authorities. Having allowed the collection of these rents to slip during periods of prosperity the civic authorities were anxious to re-establish their right to collect such payments. The roll detailed the history of properties which owed chief rent, probably with the intention of showing that there was a precedent to collect it. It also described the properties so that they could be identified by future rent collectors. Cole was a logical choice to complete this task as he was responsible for administering Lanthony priory’s own properties in Gloucester.
Based on the 1455 rental, this paper uses hedonic regression methods to test whether property rents in medieval Gloucester were influenced by classic economic factors such as the location and use of a property. Although medieval rentals have been extensively studied, few scholars have used them to analyse variations in the rents paid on individual properties within a town. It has been claimed that medieval rents did not reflect economic values or market forces, but were set according to social and political rather than economic criteria. This paper therefore investigates both ordinary commercial rents and burgage rents (landgable), and explores the relationship between the two.
Burgage rent may be defined as a payment made by a burgess to a lord in respect of a plot of land which they occupied within the burgh, and to which they had perpetual rights. In contrast to simple rents, the amount of burgage rent was fixed in perpetuity. We cannot always tell exactly when burgage rent was set but we know that in Gloucester it was paid from at least c.1100. By the time of the 1455 rental, revenue from burgage rent was collected by the civic authorities and used to meet their financial obligations to the crown. Ordinary rent was typically paid annually by an occupier to an owner, but in some cases a lessee (the holder of a long-term lease) might also be involved; if so, the rent recorded was normally the amount paid by the occupier to the lessee.
The paper finds significant relationships between urban rents and property characteristics that are similar to those found in modern studies. Both ordinary rent and burgage rent were influenced by the location and type of property; there is no evidence that burgage rent was less sensitive than ordinary rent to location and use. Central locations attracted higher rents and also higher landgable. In addition, locations on main streets attracted higher rents than on side streets, but not higher landgable. Inns carried high premia for both rent and landgable, and trade and professional use also carried a premium in both cases. Shops, corner properties and new builds did not command premia.
It appears therefore that, in the case of Gloucester at least, economic factors had a significant impact on both ordinary rent and burgage rent. In the case of ordinary rents the

Academic Session II / F
287
most straightforward explanation is that market forces were influencing urban land rents at the time of the survey. The results for burgage rent are difficult to explain except by taking the view that local lords were influenced by economic considerations at the time the town was planned and developed in the eleventh and twelfth centuries, and that property development was undertaken, at least in part for its revenue-raising potential. Philip Slavin (University of Kent) The Spörer Minimum and the Agrarian Crisis of 1436-39
Until now, the terms medieval ‘famine’ and ‘economic crisis’ have been associated with the Great European Famine of 1315-21. While there is no doubt that the Great Famine has been one of the harshest subsistence crises in the late two millennia, one has to account for yet another major episode of food shortage, caused by a short-term weather anomaly and crop failure: the crisis of 1436-9.
The main aim of the proposed paper is to study the nature and extent of the Agrarian Crisis of 1436-9, in a wider context of climatic change. After some 50 years of relatively mild weather (c.1350-1400), there was a pronounced shift into a colder climate phase, which can be regarded as the commencement of the Little Ice Age (LIA) (c.1420-1850). One of the dramatic manifestations of the LIA was the so-called Spörer Minimum, characterized by a long-term low solar irradiance and cold temperatures. Although traditionally the Spörer Minimum has been dated to c.1460-1550, there is now an increasing awareness that the climatic cooling began, in fact, some three decades earlier. The temperatures seem to have reached their lowest points between 1436 and 1438 and it is within this context that the crisis of 1436-9 has occurred.
The abnormally cold temperatures, coupled with very wet summers of 1436 and 1437, resulted in two back-to-back harvest failures, with crop yields standing, respectively, at 40 and 30 per cent below their average level. In addition, the inclement weather had a profound impact on animal health. This resulted in an outbreak of sheep panzootics, which claimed at least 30 per cent of ovine population in England. The immediate repercussion of the crisis was a short-term economic downturn. Just as in the case of the Great Famine of 1315-7, the crop failures caused grain prices to skyrocket and real wages to decline, making a noticeable impact on the living standards of the general populace.
In other words, the lowest point of the Spörer Minimum provided, at least in theory, all the ideal preconditions for a subsistence crisis. Contrary to all expectations, however, and unlike the catastrophe of 1315-7, the economic crisis and the depressed living standards did not imply famine. It appears that the single most important factor accounting for that was the favourable ratio between population levels and available resources. In other words, the demographic decline and stagnation of the first half of the fifteenth century on the one hand, and relatively high nominal wages on the other, ensured a degree of resilience to the crisis.
Despite its central place in late-medieval economy, the crisis of 1436-9 has hardly been studied. One obvious challenge is a relative paucity of manorial documents in the fifteenth century, when demesnes were being leased out to better-off tenants. Still, there were few ‘conservative’ lords, who chose to retain a direct control over their manors and run their ‘business as usual’, producing their annual manorial accounts. By analysing those accounts, the paper aims to fill that gap in our knowledge and understanding of that aspect of late-medieval crisis.

Academic Session II / F
288
Alex Brown (Durham University) Institutional memory and estate management in the English countryside
This paper explores how the institutional memory of different types of landowners was created by successive generations and the impact this had upon their estate management. In particular, this paper details how landowners used their own accounts, rentals and surveys to explore the previous development of their estates and how this affected their actions in responding to future challenges. Did the corporate nature of Durham Priory’s existence nurture a different kind of institutional memory to that of their counterparts, the Bishops of Durham? Did the former have an awareness of past practices because of the survival of elderly monks and did this institutional memory foster a more conservative environment which focused upon continuity? Or did it lead to a willingness to adapt and innovate their practices? Similarly, this paper will explore the laity’s memories of their own estates and how this influenced their estate management. It is widely recognized that the laity had more than just a life interest in their estates when compared to their ecclesiastical counterparts, but how did this affect the way they thought about their own histories and the way they responded to present challenges?
Although this paper will try to cover the English context more broadly, it will focus upon the north-east of England and, in particular, upon several key moments when landowners were faced with specific challenges which forced them to long back at their own estate histories. For example, in the 1430s, faced by declining income and mounting arrears, the Durham monks looked back at their own records and tabulated their spiritual income from 1293, 1348, 1350, 1392, 1430 and 1436, which showed a decline from £1,466 16s 4d to £353 by the 1430s. They gave four reasons for this, including the loss of Scottish parishes and the conversion of land to pasture, but there is surprisingly little recrimination for these past losses. By comparison, the Bishops of Durham often blamed their predecessors for their present predicaments (often with good cause!), with the likes of Bishop Cosin being particularly strident in his criticism of past incumbents of the office, even providing advice to his successors: ‘I desire my successors to take special notice hereof, and to wait till all the lives of these tenants leases become void’. The memory of major lay landowners could be just as long. On his death at the start of the seventeenth century, John Lord Lumley wrote a memoranda of all the manors he had sold, grouping them by ancient Lumley manors and those acquired by marriage from the Thorntons; a particularly interesting example of the longevity of estate memories given that this marriage had taken place in the 1470s.

Academic Session II / G
289
II/G Ideology and Pragmatism in Economic History Chris Grocott (University of Leicester) Compromising liberty: Friedrich Hayek’s The Road to Serfdom in practice
This paper examines a rare and unstudied piece of consultancy work undertaken in 1944 by Friedrich Hayek for the British Colonial Office and for the Government of Gibraltar. In later life, Hayek maintained that working for government was a corrupting influence on economists (and this was, in part, the reason for his alienation from Lionel Robbins from the 1950s onwards). We have very little evidence, therefore, from which to judge how Hayek would have implemented his political economy in practice. Nevertheless, by examining the reports which Hayek wrote after his visit to Gibraltar in August-September 1944 we can juxtapose proposals for the economic reorganization of Gibraltar against the ideas outlined in The Road to Serfdom published earlier in the same year.
In Hayek’s reports, he suggested that the reorganization of the state-regulated and rent restricted Gibraltar housing market in line with free market principles. By doing so, Hayek argued that the colony’s working class population would be forced to relocate into neighbouring Spain. Once there, they could take advantage of cheaper rents, opportunities for market gardening and opportunities to migrate further afield into Andalucía, should the search for work require it. Moreover, the removal of government planning in the housing market would also allow rents to rise in Gibraltar to the benefit of local landlords. Thus, so Hayek’s argument ran, market forces would bring prosperity to Gibraltarians, whilst at the same time avoiding a planned economy – the consequences of which he had just finished outlining in The Road to Serfdom (1944).
However, rather than freeing Gibraltarians from the evils of state planning, as identified in The Road to Serfdom, this proposal would have delivered them into the dictatorship of General Franco. Not only was Franco’s regime brutal, but it also practised autarkic economic policies virtually identical to those which Hayek maligned in The Road to Serfdom. Franco himself saw free market principles as a deceit by which the imperial powers had informally colonized countries such as Spain. And as a result, he worked hard from 1939 onwards to restrict foreign direct investment and to protect Spanish industry via heavy taxation on imports (the latter itself being a significant factor in sustaining the tobacco smuggling industry across the Gibraltar-Spain frontier).
In sum, Hayek’s proposals would have benefited Gibraltar’s landlords at the expense of the liberty of the majority of the civilian population (whether liberty be seen in a Hayekian sense – the liberty of the free market, or whether it be seen as the liberty from authoritarian and arbitrary government). Hayek’s proposals were rejected by the colonial authorities in Gibraltar, as well as by the Colonial Office in London. Gibraltar’s governor described Hayek’s proposals as ‘cynical’ whilst a Colonial Office official characterized Hayek’s attitude as ‘bloodless’. Moreover, for esoteric reasons relating to Hayek’s unwillingness to alter the report’s findings, the result of Hayek’s efforts was, in fact, to inaugurate a period of extending state planning in the entire Gibraltar economy from 1945 onwards. To draw out this analysis, this work analyses material from the Hoover Institution Archive in Stanford, The National Archives/Public Record Office in London, and the Gibraltar Government Archive in Gibraltar. It concludes that Hayek’s belief in free markets over-rode his concerns about liberty as outlined in The Road to Serfdom.

Academic Session II / G
290
Declan O’Reilly (University of East Anglia) Of morals and money: IG Farben, Interhandel and GAF, ideology and pragmatism in the
Kennedy Administration’s settlement with the Union Bank of Switzerland, 1963-65
The General Aniline & Film/ Interhandel legal case was one of the longest in US Department of Justice history. It began with the vesting of GAF Corp, the American subsidiary of IG Farben, Europe’s most important chemical business, in April 1942. Treasury agents seized control of a ‘German’ and therefore enemy company as a national security measure, only to discover that GAF was claimed by a Swiss (therefore neutral) company, Interhandel. It was finally settled amid great controversy by compensating Interhandel’s putative owners, the Union Bank of Switzerland, with $120 million, one third of the proceeds from what was then the largest private sale in Wall Street’s history. How did this happen, particularly as the US Government claimed for over 20 years that Interhandel was merely a financial cloak for German interests both before and after WW2?
What this paper addresses is the construction of the Justice Department’s institutional memory; an analysis of GAF/Interhandel, which stressed the continuity of German ambition for economic, political and finally military domination of Europe and the world. The US adduced considerable evidence for this theory linking the origins of the German chemical industry in the mid-nineteenth century with the violent creation of Bismarck’s Reich in 1871, through World War One and finally to Nazism in one grand and continuous conspiracy against peace.
The US had come to believe in a complex conspiracy explanation for IG Fabre’s relations with both its Swiss and American offshoots and for ideological reasons this explanation became the prism though which the US government understood the GAF problem for over 20 years. It was this that prevented the US from seeing GAF/Interhandel for what it really was question of money. Even under so pragmatic a regime as the Kennedy’s it was hard for the US to break out of these self imposed limitations; that they eventually settled with the new owners of Interhandel suggests that pragmatic politics rather than bureaucratic and institutional ideology, which had so bedevilled a simple case of property relations, made settlement possible. Avner Offer (University of Oxford) Economic theory and social democracy: The Nobel Prize in Economics
The notion of an efficiency/equity tradeoff pitted neo-liberals against Social-Democracy. It frames ‘equity’ as a matter of redistribution, but the problem addressed by social democracy was not equality but lifecycle downside insurance, i.e. providing for lifecycle contingencies. The two approaches involve different conceptions of time. The neo-liberal approach was to transfer resources over time by means of contracts in financial markets. Social democracy applied a system of social risk pooling, with lateral pay-as-you go transfers between the generations. Academic economics was inclined to support market solutions, and largely ignored the social democratic alternative, despite its virtues of analytical coherence and practical success. The Nobel Prize provides a high-quality sample of contemporary economics, with strong claims to scientific validity, but with what authority? In the interwar years, economics was a harmony theory which provided support for the low-tax status quo, in which agents acted in good faith, and markets made sure that everyone got what they deserved. Trade union and labour party agitation was a futile gesture against the invisible hand. After the Second World War, Social Democracy established a new high-tax status quo. Economics responded with a cluster of theories (game theory, public choice, asymmetric information, New Institutional Economics, principal-agent, etc.) which assumed bad faith, opportunism and cheating, in which many received what they did not deserve. Its programme for reform prioritized the elimination of ‘distortions’, defined as deviations from market equilibrium. But in moving away from optimality, economics became indeterminate, and could no longer credibly claim normative authority. It attempted to overcome this problem

Academic Session II / G
291
with ‘hybrid’ policies (like optimal taxation and privatization) which combined the assumption market optimality with individual opportunism. These theories were logically invalid and normatively indeterminate. As policy guidance they have not been a success; and they are associated increasingly with pervasive corruption. The paper combines research on the emergence of social democracy in Sweden and its relation to the origins of the Nobel Prize, an analysis of Nobel economics, its application to policy debates in Sweden and to the Washington Consensus more broadly. Social democracy and the market turn are seen as complementary strategies dealing effectively with downside risk for the former, and with economic opportunity for the latter. Both have worked in their respective spheres, and were less successful when they moved beyond it.

Academic Session III / A
292
III/A Spending and Financing War Stéphanie Collet (ESCP, Europe) & Eric Golson (Universities of Warwick/Oxford) Neutral Central Bank financing costs in the Great War
This paper analyses the threats against neutral countries during the Great War as assessed by neutral bond markets. The current historiography claims Switzerland and the Netherlands were under most threat of invasion during the First World War; this threat increased as the war continued and there was an increased need to open a second military Western front and increase the levels of economic warfare, which affected these two neutrals. For countries such as Norway, Sweden and Spain, the perceived threats were far less and remained largely unchanged during the war. In this paper we assess whether political threats, distance and Central Bank credibility affected five different neutrals’ sovereign debt yields and bond market spreads. Our results suggest distance from the fighting does not matter, but rather commitment to the gold standard is an important determinant of interest rates. The current historiography is therefore disputed with regard to risk faced by countries closer to the fighting than those further away. Jari Eloranta (Appalachian State University) Pro Bono Publico? Demand for military spending between the World Wars
The main goal of this paper is to explain the aggregate and individual country’s demand for military spending during the interwar period based on influences arising from the international ‘system’, alliances, and interactions between and within states. The answers provided in this paper suggest that military spending was an impure public good, implying a combination of both public and private benefits, in this period. The impurely public benefits at the various levels were linked to the actions of the domestic players, namely business coalitions, in a complex evaluation of the international factors and domestic ‘needs’.
At the level of the international ‘system’, this article will explore the impacts of systemic changes – namely, balance of power, the democratic peace argument, as well as systemic leadership (or the lack of it) – on the military spending levels. It seems that systemic forces – with the systemic analyses based on a 17-country system covering the key states in the international economy – indeed played an important role in determining the demand for military spending among the said states. Whereas often the exact impact of these forces is difficult to ascertain precisely, for example, the rise of autocratic nations seemed to increase military spending among these states. Yet, this concentration did not occur on the same lines in the 1930s compared to the immediate period following the First World War. Usually the systemic forces represented a destabilizing force in the international system.
Clearly the democracies as a whole also behaved different than the autocracies. They seemed to spend less for military purposes, and an increase in the level of democracy seemed to decrease the impulse to spend on defence. At the level of the system, the new authoritarian challengers represented a systemic threat in the 1930s, to which the democracies on the aggregate responded slowly. International security leadership, in turn, was not forthcoming from the League of Nations, which was unable to act as the guardian of the status quo sealed in Versailles. Typically the interwar states did not consider military spending as a public good in an alliance framework. In fact, it is here argued that alliances providing a pure public good in the form of deterrence were extremely rare, since the military technology did not provide such characteristics for the pre-NATO alliances. In general, the decision-making systems embodied by the various types of interwar democracies seemed to provide support for the idea of democratic peace even at the level of military spending. Moreover, the interwar democracies as a whole clearly spent less for military purposes than the authoritarian regimes, and it seems that the level of authoritarian rule was important in determining the level of military spending in relative terms. Finally, the leadership vacuum caused by the passive foreign (and economic) policy stance of the two leading democracies, the United States and

Academic Session III / A
293
the United Kingdom, destabilized the international system even further, thereby rendering disarmament almost impossible to achieve. These factors contributed to the strengthening of impurely public tendencies, especially within states, in the military spending decision-making of these European democracies.
Thus, it seems that the demand for military spending was certainly impurely public, which includes nested pure public characteristics, influenced by forces arising from the four explanatory levels discussed throughout this paper. Military spending also yielded joint products at the level of state and within state. Military expenditures were not an income-normal good at level of state, and in fact the level of economic development seemed to exert a downward pressure on the military spending of these states. Rising prices of ‘defence’ in general decreased their relative military spending. There were quite contradictory spillover effects felt by these states, yet they responded to increasing threats by increasing their military spending at a lag (usually one year). Nicholas Zammit (University of Cambridge) Picking favourites: comparing the wartime contributions amongst the British Dominions
Previous literature on the wartime involvement of various British Dominions in the twentieth century viewed their roles in isolation. By contrast, this work represents the first attempt to assess the relative economic costs to the British Dominions of World War One and Two. Economic and military contributions will be compared in order to determine their relative importance to the eventual Allied victory in each war. Specifically, investment in human and physical capital, the level of trade diversion, the reorganization of production, the impact on prices and wages and the accumulation of debts will be considered in each country. The goal will be to understand which of the British Dominions paid the biggest price for its loyalty to the empire, whether these costs could have been shifted to others and why this level of involvement was deemed necessary by each contributor. Essentially we will ask the question: did Britain spread the costs of war relatively evenly throughout its empire? Who gave the most and why?

Academic Session III / B
294
III/B History & Policy Roundtable: Thomas Piketty on Capital and Inequality
Invited panel, chaired by Professor Sir Richard Trainor, to include: Professors Martin Daunton, Avner Offer, Jim Tomlinson and Dr Keith Tribe. In looking at inequality, one of the most widely discussed and controversial issues of today, Capital in the 21st Century, by Thomas Piketty, has caused a stir among academics and the general public. His discussion of how the distribution of wealth has evolved over the long term draws on the work of economic historians and yet they have been slow to engage with his arguments. He poses important questions about ‘whether the dynamics of private capital accumulation inevitably lead to a concentration of wealth in ever fewer hands, as Karl Marx believed in the nineteenth century? Or do the balancing forces of growth, competition, and technological progress lead in later stages of development to reduced inequality and greater harmony among the classes’? He acknowledges that his answers to these questions are ‘imperfect and incomplete’ but is he less circumspect about the historical evidence and argument which underpin his case? In a roundtable discussion economic historians will present their verdicts on his analysis and stimulate efforts to ensure informed discussion of the important debates initiated by Piketty’s contribution.

Academic Session III / C
295
III/C Working in the Industrial Revolution Andy Burn (Durham University) A job for life? Working lives and the historical record in early industrial Newcastle upon
Tyne
Economic historians and economists accounting for development rightly emphasize structural changes in occupations, and in particular the shift towards secondary and tertiary ‘sectors’ of production, or between different levels of skill and human capital (e.g. the work of Colin Clark and Simon Kuznets, and recent work at CAMPOP and the IISH). Broad systems of classification must be developed to facilitate meta-analyses of occupations (recorded on essentially political or legal documents like parish registers, wills or militia lists), as well as comparisons between geographical areas. But there is a danger that by reducing occupation to a single coded tag we can oversimplify, or even misrepresent, the work that was actually being done. This begs important questions: how well do demographic sources of occupations really represent more occupationally or geographically mobile working populations? In what circumstances would occupations be systematically misrepresented on records? Were some jobs under-recorded because they were seen as low status? Perhaps most pertinent: were some groups of people more likely to change occupation than others; and at what stage of their working lives would they be more likely to choose, or be forced, to do this? How might this alter the broader occupational structures that lie behind our models?
The absence of contextual information on occupational sources makes such analysis problematic, and we will often require a close focus which can be sensitive to local economic conditions and linguistic quirks as well as to national and international trends. This paper considers the English coal capital of Newcastle upon Tyne in a period of intense economic transformation, which I characterize as industrialization, roughly 1560-1700. Analysis of Newcastle’s parish registers shows a dramatic shift in occupational structure over the seventeenth century as thousands of migrant workers made it perhaps the fastest-growing provincial town in England. Principally, these migrants shipped coal, labouriously shovelling 20 tons onto a small keel boat, sailing it six or seven miles out to a waiting coal ship at the river mouth, and then re-shovelling the coal to a porthole above their heads. Imperfect records mean we can only pick up this story part-way through, but the proportion of Newcastle’s fathers who worked shifting coal expanded from nearly 10 to nearly 30 per cent barely sixty years after 1600, in a period when population also doubled.
Tracing such a sharp shift in the overall pattern of occupations given by fathers at baptisms raises concerns about how well an individual title reflects the true nature of work, and about the impact of any time lag in the adoption of new terms. I will examine the extent to which working men sustained a number of simultaneous or sequential occupations by linking the fathers’ names and occupations recorded on c.30,000 baptisms between 1600 and 1710. These partially reconstituted families can then be considered alongside other named records, including hearth tax and probate records, which give a contextual idea of wealth or status. In all, just under 10 per cent of Newcastle workers made a significant change from one occupational group to another, but there are some important variations: in common with other towns (but seemingly not coal-mining districts, like Whickham in County Durham), labourers or industrial workers were less likely to be exclusively engaged in a single occupation than higher-status workers, and indeed they mixed the seasonal, volatile water-work with almost any Newcastle trade. This is explained in part by the coal trade’s rapacious demand for workers – many switched from other occupations into coal transport – but the linkage throws up a number of other surprising combinations that require further explanation.
Drilling down with a linked sample of the burials and children’s baptisms of Newcastle fathers, I will also focus on lifecycle patterns in employment, and in particular occupational changes between child-rearing age and death. Preliminary results suggest the sequences were far from consistent or uniform: there was no dominant ‘upwards’ career

Academic Session III / C
296
trajectory, or descent into old-age; the reality was much more mixed. Some patterns are clear: industrial workers were unsurprisingly likely to shift occupation to ease physical demands later in life, although they also frequently chose to describe themselves by the status term ‘yeoman’ in retirement. This case study of specializing and industrializing Newcastle will yield insight into how the experience of occupation, far from being a fixed, internalized ‘identity’, varied through lifetimes. The question of whether this experience was typical, or unique to Newcastle, demands further comparative work. Steven Toms (University of Leeds) ‘Cold, calculating political economy’: hours of labour, fixed costs, the rate of profit in the
Factory Act debates, 1832-47
One of the starkest features of the British industrial revolution, particularly in the textile industries, was the rapid transition to factory discipline as a means of enforcing long working hours. The ten-hour day, with associated better protection for children and female workers was the principal demand of the labour movement on the one hand, conflicting, on the other, with employer insistence on factory discipline and unregulated hours. The issue became the focus of a series of debates over factory legislation in the British parliament in the 1830s and 1840s, culminating in the Factory Act of 1847.
To resist the demands of the Ten Hours movement, led in parliament by Lord Ashley (later Lord Shaftesbury), some employers (led by Henry and Edmund Ashworth, John Pooley, Robert Hyde Greg, Hugh Hornby Birley and Holland Hoole), enlisted the ideological support of the newly emerging discipline of political economy. To fulfil their commission, its leading representatives, including George Poulett Scrope and Nassau Senior, attempted to rationalize the rate of profit and justify long working hours (Senior’s theory that all profit was made in the last hour of the working day). Senior’s theory was fundamentally flawed in that some costs were necessarily variable, but true insofar as some costs were fixed. The effect of his theory was therefore to focus attention on the extent and effects of fixed cost on profit. To elaborate their theories the economists used figures abstracted from the accounts of contemporary cotton-producing firms. Evidence based on these figures was also presented to parliamentary commissioners in an effort to influence legislation and in pamphlets and speeches to influence public opinion.
The paper uses evidence from the accounting records of firms whose owners used financial arguments in parliamentary debates for and against factory regulation. To assess the evidence, it considers the interrelationship between the hours of labour, fixed costs, and the rate of profit. It contrasts the financial figures used in the debates by the Ashleyites, the anti-regulation lobby, as published in contemporary pamphlets and given in evidence to parliamentary committees with actual figures contained in the business records of implicated firms. Further examples are used to generalize the underlying relationships between firms’ cost structures, the rate of profit and the length of the working day. These parameters are used to reframe the political debates, illustrating the effect on profit of carrying out the legislative programme of the Ten Hours movement in contrast with the status quo.
The comparative results are shown in the table below, based on the underlying records summarizing each political position (columns [1] and [2]) and data extracted from archival records, which is intended to represent an objective position (column [3]). The results differ because of differing assumptions about fixed costs. The opponents of regulation estimate high levels of fixed cost, which in turn seems to justify the requirement for a long working week in order to earn a reasonable rate of return. High fixed cost estimates also lead to a high elasticity of profit (measured by the operating leverage ratio), but even accepting this is an overestimate, the notion of a ‘reasonable rate of return’ might be in the order of 10 per cent, in view of the presence of some fixed costs and the pronounced nature of the trade cycle affecting the cotton trade. In contrast the pro-regulation lobby produced low estimates of fixed cost, resulting in lower operating leverage, and also estimate higher levels of profit. In

Academic Session III / C
297
some cases these were clearly overestimated. The corresponding figures computed from archival data suggest a middle range of outcomes for these variables.
The evidence suggests that opponents of regulation overstated fixed charges and their effects. They also emphasized the cost of wages per employee when comparing British firms with continental rivals. The paper demonstrates however, that unit labour costs in Britain were substantially (36 per cent) lower than continental Europe. The point made by the supporters of regulation about marginal increases in production cost that would not damage competitiveness was thus broadly correct. Restricting the working week to 58 hours would lead to a small (c.3.5 per cent) increase in unit costs with no change in technology. The strident opposition to regulation was nonetheless rationally motivated by the perceived risk of investment in fixed capital from the point of view of the mill owners.
The neutral position suggests that a working week of 58 hours would be consistent with a rate of profit over 10 per cent and that the working week could be set as low as 55 hours per week and still allow 10 per cent profit to be achieved. Even so, this would represent a cut of around 5 per cent in the rate of profit achievable under the same conditions with a 69-hour week.
The comparison of financial evidence casts new light on the lobbying positions on
either side of the debate, assessing the truth of competing claims. Fixed capital investment on the scale required by the capital intensive second phase of industrialization was a new phenomenon, and the associated risk provided their principle motivation for resisting legislation. In summary, the rate of profit was higher than the anti-regulation lobby cared to admit, even with carefully arranged and consistently pessimistic evidence. Nevertheless, regulation and the impact of fixed cost effects meant that the consequential cut in profit would be greater than the either pro or anti regulation lobby realised, even though the consequential rate of profit would not lead to the collapse of the industry in the face of foreign competition.

Academic Session III / C
298
Joyce Burnette (Wabash College) Absenteeism in a nineteenth-century textile firm
Our labour market measures usually assume continuous employment. Measures of turnover and tenure assume that a job starts, then the worker is continuously employed, and then the job ends. Little attention is paid to the time when workers are employed but not at work. The purpose of this paper is to document the extent of absenteeism in nineteenth-century manufacturing, to measure its temporal pattern, and to demonstrate what effect absenteeism had on the typical workers’ hours of work.
Absenteeism matters for a number of historical questions. First, the number of hours worked are obviously affected by failure to show up for work. Atack & Bateman (1992) conclude that the typical hours of work in US manufacturing was 10 hours in 1880. Costa (2000, p.156-7) claims that:
The length of the work day fell sharply between the 1880s, when the typical workers labored 10 hours a day, 6 days a week, and 1920, when his counterpart worked an 8-hour day, 6 days a week. By 1940 the typical work schedule wage 8 hours a day, 5 days a week. . . . This decline in work hours, unmeasured by such common indicators of well-being as income per capita, surely represents one of the larger increases in the standard of living during this century.
However, if the difference between actual and scheduled hours was large, then
nineteenth-century workers did not work as much as we think they did. For Britain there has been a great deal of interest in work intensity. Freudenberger &
Cummins (1976, pp.5-6) suggested that around 1750 the number of holidays observed was 40-50 days, in addition to Sundays. They suggested that factory workers of the industrial revolution worked 4,000 hours per year, rather than the 3000 worked by pre-industrial workers. DeVries (2008) hypothesized that an industrious revolution increased work intensity in the eighteenth century. Voth’s (2000, p.121-2) evidence supports this hypothesis; he estimates that in London the typical worker worked 208 days per year c.1750 and 306 days c.1830.
This paper exploits the wage accounts of the Pepperell Mfrg Co, an integrated cotton textile firm in Maine. Pepperell operated three different mills, each with separate rooms for carding, spinning, dressing, and weaving. The workforce was divided among the three mills and a ‘mixed payroll’ that covered the non-production workers. This paper examines everyone who worked in the Mill 3 weaving rooms in 1883, including weavers and overseers. There are 543 workers in my sample, though the highest number of workers present on any one day was only 199. Wage account books note not only the wage and total number of days worked, but also whether the individual worked a whole or half day, or not at all, on each date. The mill was closed on Sundays and six additional holidays, so there were 306 potential work days.
Conceptually absenteeism and turnover are distinct. A worker is absent if he or she is still employed at the firm but is not at work, while turnover occurs if a worker is no longer employed at the firm. It is difficult to distinguish between absenteeism and turnover at Pepperell because many workers were gone for weeks and then returned to work, and I don’t know if the worker or firm considered this a separation. I distinguish between turnover and absenteeism by assigning a maximum amount of time (2, 4, or 6 weeks) a worker can be away before the worker is considered to be separated from the firm. If the maximum absence is four weeks, then Pepperell workers were absent 9.7 per cent of potential work days. This is higher than modern absentee rates of 3 to 5 per cent, though the modern absence rates do not count the vacation days as absences. The relatively high number of absences suggests that the decline in hours worked per day since the mid-nineteenth century may overstate the decline in work intensity.

Academic Session III / C
299
We don’t know what workers were doing on the days they were not a work. A certain number of workers would have been ill. They may have been using the time for housework or leisure. It is also possible that they were doing other types of work. I try to find evidence about causes of absences by looking for patterns in absences. Absences were higher in the summer months, particularly for men, which is consistent with secondary employment in agriculture. Women had greater absences than men, which is consistent with absences for housework or family care, but there is little difference in absences across days of the week. Absences were particularly high before and after a holiday, suggesting that workers may have been using absences for leisure.
I also find that turnover was quite high. Few workers worked continuously over the year. Only 4.4 per cent of workers, accounting for 12.5 per cent of days worked, worked at least 288 days in the year. The average worker worked only 105 days during the year. Unfortunately this does not tell me the working year because I don’t know whether they took other employment when not at Pepperell. Many spells of employment were quite short, but workers did also return after relatively lengthy spells away. Overall employment was much more fluid than in today’s labour market.
References
Atack, Jeremy, and Fred Bateman, 1992, ‘How Long Was the Workday in 1880?’, Journal of Economic History, 52:129-160.
Costa, Dora, 2000, ‘The Wage and the Length of the Work Day: From the 1890s to 1991’, Journal of Labor Economics, 18:156–181.
DeVries, Jan, 2008, The Industrious Revolution: Consumer Behavior and the Household Economy, 1650 to the Present, Cambridge: Cambridge Univ. Press.
Freudenberger and Cummins, 1976, ‘Health, Work and Leisure before the Industrial Revolution’, Explorations in Economic History, 13:1–12.
Voth, Hans-Joachim, 2000, Time and Work in England, 1750-1830, Oxford: Clarendon Press.

Academic Session III / D
300
III/D Institutions and Divergence Hanhui Guan (Peking University) & Qian Dai (Wuhan University) Why the Civil Service exam system replaced the hereditary system in Tang China: land
equalization, social mobility, and bureaucracy system transformation
The Civil Service Exam System in Imperial China, which is the earliest Official Selection System in the world, and also is the foundation of the Civil Servant System of western countries, appeared in place of the Hereditary System in the Tang Dynasty (618-907A.D.). This paper seeks to find the economic driving force behind this political institution’s transformation. We find that the implementation of the Land Equalization policy could explain why the bureaucracy system transformation happened in Tang China. The long-term enforcement of Land Equalization policy eroded the economic base of aristocrat groups as well as their monopoly political power; therefore, social structure became more horizontal than in thearistocrat and hereditary systems. For this reason, the aristocrat groups had to share political power with elites selected from the populace by means of examination, which induced bureaucracy system transformation. Probit regression using a newly-constructed dataset from first-hand biographies provided solid empirical evidence for our conjectures, and IV estimation verifies that the relationship is causal. Our finding suggests that only if economic factor changed social structure thoroughly, could it lead to momentous political institution transition. Alexander Klein (University of Kent) & Sheilagh Ogilvie (University of Cambridge) Was Domar right? The Second Serfdom, the land-labour ration, and urbanization in
eighteenth-century Bohemia
The ‘second serfdom’ is widely regarded as one of the sources of the early modern Little Divergence, during which the economies of eastern and eastern-central Europe are seen as decisively falling behind those of the west. But what caused the second serfdom? One influential explanation, advanced by Domar (1970), is that high land-labour ratios (such as those in eastern Europe) motivated landlords to intensify coercion so as to solve problems of labour scarcity. A diametrically opposed ‘neo-Malthusian’ hypothesis, associated with the work of Postan (1973), Le Roy Ladurie (1977), and North & Thomas (1971), holds that high land-labour ratios (such as those that prevailed after the Black Death) motivated landlords to decrease coercion because peasants had better bargaining power. The empirical findings generated during the Brenner debate (Brenner (1976), Ashton & Philpin (1987)) suggested that labour scarcity was associated with a decline in serfdom in some societies but an intensification or even a new imposition of serfdom in others. To reconcile these findings, Acemoglu & Wolitzky (2011) proposed a theoretical model in which labour scarcity and serfs’ outside options, specifically via urbanization, exercised countervailing effects on intensity of coercion exercised by landlords.
Our paper investigates these questions quantitatively for an entire economy under the ‘second serfdom’. For Bohemia (the Czech Lands) in 1757, we have compiled a detailed dataset of some 11,800 villages and 500 towns using the Theresian Cadaster (Tereziánký katastr). This comprehensive tax register recorded all fiscally relevant information on each landholding and everything attached to it, including the characteristics of the householder currently occupying it. The register was organized into four sections covering each social stratum: clergy, landlords, towns, and peasants. Within each section, the cadaster recorded information on land (arable, forest, gardens, vineyards, hop-fields, and fallow or waste), livestock, industrial and commercial infrastructure (mills, breweries, taverns, sawmills, smithies, etc.), and non-agricultural occupations pursued by both peasants and townsmen.
Most important for the purposes of the present paper, the Theresian Cadaster recorded the amount of forced labour – so-called robota – supplied by the inhabitants of each village to the landlord. These forced labour services were subdivided into nine categories: service with

Academic Session III / D
301
human labour but no draft animals; service with one, two, three or four horses; and service with one, two, three or four oxen respectively. For each category of robota, the register recorded two pieces of information for every village: the number of serfs, and the number of days per week they had to render that type of forced labour. This allowed us to calculate a quantitative measure of the ‘second serfdom’: the total number of days per week the serfs in each village had to perform forced labour for their landlord.
With this as our dependent variable, we estimated a reduced-form relationship between the intensity of the second serfdom, factor endowments, and serfs’ outside opportunities. Our aim was to investigate both the debate between Domar and the neo-Malthusian about the effect of the land-labour ratio and the hypothesis proposed by Acemoglu & Wolitzky concerning the effect of urbanization on serfdom via the outside options of serfs. In general terms, our regression specification can be written as follows:
SecSerfi,j = α+β1(Domar Effect)i,j+β2(Outside Option Effect)i,j+β4X i,j + εi,j (1) where i denotes a village, j an estate, SecSerf the intensity of serfdom, vector Xi,j
includes village, estate, and region controls, and εi,j denotes an error term. We capture the intensity of the second serfdom in terms of the quantity of forced
labour supplied by the serfs in a village, the Domar effect in terms of the land-labour ratio, and the outside-option effect in terms of the density of urban population on the estate. We explore two possible channels through which the outside-option effect could operate, by breaking down the urban sector into two different types of town. We test the robustness of our findings using a wide range of different estimation strategies which control for village, estate, and regional characteristics.
We find that the second serfdom, as measured by the intensity of labour coercion, was indeed positively associated with the land-labour ratio, as postulated by Domar. We also find that the intensity of labour coercion showed a significant and non-trivial association with the urban sector, although the link is more complex than postulated in the literature. Labour coercion under the second serfdom was lower where urbanization was higher, as predicted by the Acemoglu-Wolitzky model, but only when the towns in question were large ones. Where urbanization was higher but towns were small, coerced labour burdens were actually heavier, a result we explain in terms of the concrete empirical interactions between towns of different types and the surrounding serf economy.
Our findings provide the first quantitative exploration of prevailing theories about what factors led serfdom to be stronger or weaker. We find that the intensity of labour coercion exerted by landlords over serfs was indeed positively associated with high land-labour ratios, but that the intensity of coercion was tempered by serfs’ outside options. Urbanization exerted both beneficial and harmful effects on serfs’ outside options, implying a more differentiated view of how the urban sector affected the rural economy in pre-modern Europe. Our quantitative analysis of an entire eastern-central European economy under the second serfdom sheds light not only on theoretical hypotheses concerning the determinants of serfdom, but also on wider sources of economic divergence between eastern and western Europe. Stephen Broadberry (London School of Economics) Accounting for the Great Divergence
As a result of recent work by economic historians, it is now possible, for a number of nations, to provide historical national accounts reaching back to the early years of the second millennium, that are derived from data collected at the time. Furthermore, for some of these economies, data are now available on an annual basis back to c.1300. This new work presents quite a different picture of the development of European and Asian nations from that surmised by Angus Maddison in his widely used book, ‘The World Economy: A Millennial Perspective’, where pre-1820 estimates of per capita GDP were based largely on conjecture and provided only for a small number of benchmark years. Medieval and early modern

Academic Session III / D
302
European and Asian nations were much more literate and numerate than is often thought, and left behind a wealth of data in documents such as government accounts, customs accounts, poll tax returns, parish registers, city records, trading company records, hospital and educational establishment records, manorial accounts, probate inventories, farm accounts, tithe files. With a national accounting framework and careful cross-checking, it is possible to reconstruct population and GDP back to the medieval period. The picture that emerges is of reversals of fortune within both Europe and Asia, as well as between the two continents. There was a European Little Divergence as Britain and Holland overtook Italy and Spain, and an Asian Little Divergence as Japan overtook China and India. The Great Divergence of productivity and living standards between Europe and Asia occurred because Japan grew more slowly than Britain and Holland, starting from a lower level. Thus the two continents diverged as reversals of fortune occurred within each continent.
Economic historians can now, therefore, account for the Great Divergence, using the word ‘accounting’ in the sense of measurement, by providing a quantitative picture of when and where the Great Divergence occurred. However, there is a second sense in which the word ‘accounting’ can be used, to provide an explanatory narrative. The framework adopted here to explain the divergence sees it as arising from the differential impact of shocks hitting economies with different structural features. The key shocks were the Black Death of the mid-fourteenth century and the new trade routes which opened up from Europe to Asia and the Americas at the end of the fifteenth century. These shocks had asymmetric effects on different economies because of a number of important structural factors that varied across nations: the extent of sectoral diversification, the nature of state institutions and the quantity and quality of labour. Comparative data on these factors are assembled to provide an explanatory account of the Great Divergence.

Academic Session III / E
303
III/E Women’s Committee Session: Emotions and the Economy in Early Modern Europe
Merridee Bailey (University of Adelaide) Rethinking emotions and the economy: the relationship between economic values and
emotions in late medieval and early modern London
Economic historians recognize economic systems are embedded in cultural practices. Historians of emotions also regard emotions as a significant constituent of culture. To develop a rounded picture of the economic culture of late medieval and early modern England, and to understand all of the characteristics that define culture, it is essential to consider the emotional and economic contexts in dialogue with each other. This paper is an attempt to bring together two historiographies on economic history and emotions history to show how each field can be enriched by more interaction with the other. London civic regulations, court cases and didactic material written about good commercial practice, form my case studies. The evidence from these sources indicates that for some merchants, articulating emotional beliefs about commercial reputations, trust, and fairness in dealings, helped them to make sense of their urbanized and hazardous commercial world. The implication that we can explore from this is that merchants saw emotions forming a legitimate part of economic practices and relationships. This paper will reflect on the implications of this for how we approach (or re-consider) late medieval and early modern mercantile history. Dorothee Sturkenboom Commerce and emotions in the Dutch Republic: reading the mind of the early modern
merchant
Economic scientists have often described market transactions as the pursuit of rational interests. Only a fairly recent change in paradigms has made it possible to recognize that economic behaviour is in large part emotional in nature, moved by the human desire for profit, commodities and riches. For early modern writers this view would have been nothing new. They were used to seeing economic life in terms of emotions, or rather in terms of ‘passions’, the usual word for emotional phenomena at the time. The Dutch Englishman Bernard Mandeville (1670-1733), godfather of the neo-liberal economists and libertarians, even believed that greed and other immoral passions were absolutely necessary to keep the wheels of the economy spinning. If the economy was driven by passions and desires, however, one had to wonder how the Dutch and the English, both nations known for their stolidity rather than their emotions, had come to dominate commerce worldwide. This paper explores how early modern contemporaries made sense of this apparent paradox. Focusing on the economic successes of the Dutch Republic in the seventeenth century, it presents its underlying psychology as conceived by both critics and defenders of Dutch commercial character. While the notion of a national phlegmatic temperament was hardly ever contested, interpretations on its key qualities and functioning differed. For some, the apparent lack of strong feelings was actually explained by the overpowering passion for profit that supposedly absorbed other (more manly and honourable) passions. For others, the phlegmatic temperament included virtues such as patience, prudence, reliability, and diligence, which made Dutch merchants so well suited for trade. The accommodating nature of Dutch businessmen, furthermore, gave their wives free reign to develop their own trading activities. To understand where these (largely stereotypical) readings of the mind of the Dutch merchant came from, this paper will argue that one has to go back in time and take ancient psychological and political theories into account as well as modern theories of emotion and identity. Using detailed text analysis and a mix of sources from the seventeenth and eighteenth centuries, ranging from travel journals to ethnological treatises and early psychological studies, this contribution offers an early modern Dutch perspective, complementary to the other papers in this session.

Academic Session III / E
304
Anne Laurence (Open University) Marriage and the market in eighteenth-century England
There has been much debate about the change in sensibility that gave rise to the love match as the norm of marriage and of the possible origins of this change in the eighteenth century. This study of prospective brides in the 1740s suggests that financial considerations were explicit in the case of a bride and implicit in the case of a groom, a case of asymmetric information.
Two sets of prospective brides were examined: the first was a list of over 1,000 marriageable women (in the sense of having no living husband) published in 1743 with an estimate of the wealth of each women – a fortune-hunters’ guide. The second is an analysis of the 400 announcements of marriages in the Burney newspapers for the same period, 65 per cent of which gave the supposed wealth of the bride but virtually never any indication of the wealth of the groom.
This study is a snapshot of women’s marriage negotiations in 1743 and the role of money in the choice of a partner.

Academic Session III / F
305
III/F Financial Flows in Medieval and Renaissance Italy Marie Ito (Georgetown University) Grain flows and the Florentine grain market, 1250-1330
This paper will consider the flows of grain into Florence from the mid-thirteenth century into the first third of the fourteenth. It will consider the mechanics of grain imports, volumes, traders, and the distribution mechanism within Florence, which, the paper will argue, evidenced elements of a modern exchange market. The paper will also argue that the import and distribution mechanism, a well-planned and for the most part a public-private venture, allowed large Florentine traders to shift the risks of their bulk business rapidly and efficiently to the consuming public, while meeting the demands of a growing immigrant population that was filling labour needs in emerging Florentine industries. The paper will also look at the political and economic culture underlying the grain business during this time, and it will argue that this business was driven by leading Florentine trading families who were also commencing leadership of the communal government, to the detriment of, and growing violence by, many traditional magnate families. The paper finally will argue that grain business was of systemic economic, social, and political importance to the Florentine commune during this period, not unlike the wool market of the same time. Roman Zaoral (Charles University) The circulation of gold in late medieval Italy in the light of coin hoards
The paper examines to what extent the evidence of written sources of merchant and church origin on the billon circulation in late medieval Italy corresponds with the evidence of coin hoards. Thirty-one published gold coin hoards from the territory of Italy consisting of more than 3000 specie are analysed with the efforts to specify a position of main gold coin types in circulation (fiorini d’oro, zecchini, genovini, and Hungarian florins). Another aim of the paper is to explain why decreasing supplies of billon in the second half of the fourteenth century had in Italy a smaller impact on the structure of money in circulation than in other European regions. Tony Moore (University of Reading) Financial flows in the medieval Mediterranean from the libri di cambio of Francesco di
Marco Datini of Prato, 1388-1403
A recent Leverhulme Trust-funded research project on the medieval foreign exchange (FX) market has compiled a new dataset of medieval foreign exchange rates as quoted in the voluminous correspondence of ‘the merchant of Prato’, Francesco di Marco Datini. At least according to modern economic theory, these market rates should incorporate all relevant information. In practice, it can be difficult to interpret the different influences on the rates without knowing more about the real economic activity underlying them. Unfortunately, it is very difficult to reconstruct reliable figures for aggregate trading and monetary flows in the middle ages.
This paper therefore aims to supplement and deepen our understanding of the medieval FX market through an analysis of actual FX transactions recorded in Datini’s archive. In total, the Datini archive contains some 600 account books and it would be a monumental task to analyse even a fraction of these. Instead we analyse a smaller number of account books that contain extracts of FX transactions. Details of more than 1,500 transactions have been extracted from the libri di cambio for Florence, covering the period between 1388 and 1403. The paper will present an overview of this source, investigating changes over time in the number and value of transactions and the cities with which Datini’s company in Florence was dealing. It will also examine the seasonality of these money flows and compare them against the seasonal patterns found in the exchange rate data.

Academic Session III / F
306
In addition, the paper will also present a more detailed analysis of one year, 1393. During this year, Datini’s Florentine company entered into 103 FX transactions with a value of 18,635 florins. The main flows were between Florence and Genoa (42 transactions for 7,926 florins) and Pisa (44 transactions for 6,361 florins). In order to reconstruct the money flows between Datini’s operations in the three cities, the Florentine transactions were collated against the surviving account books from Pisa and Genoa for the same period. First, this paper will reconstruct the balances of financial flows between the three cities, which may provide a ‘mirror image’ of trade flows between these places. Second, it will search for evidence of ‘dry exchange’ (i.e. exchange and rechange transactions between two cities) which, it has been argued, was used to disguise loans. Ioanna Iordanou (University of Warwick) The charity of the poor: some insights from the maritime folk of late Renaissance Venice
The shipbuilders and sailors of Renaissance Venice were one of the most distinct and homogenous popolani groups, as the Venetian commoners were called. Historiography to this point has primarily focused on their professional function – that is, building and manning the Venetian galleys – and civic role – for instance the infamous battagliole sui ponti, battles for sole possession of a bridge, conducted with sticks or bare fists. As this paper will show, the maritime popolani played a wider and more significant role in Venice that far exceeded their professional and civic function. Focusing on the last quarter of the sixteenth century – a period marked by the decline of Venetian shipbuilding and shipping and the recovery from a devastating plague that struck the city in 1575 – this paper will explore ways in which the Venetian maritime folk contributed to the economy and society of the Republic, aside from their professional service. Primarily, the paper will focus on the dotal and charitable donations of these groups within and beyond their family networks. In consequence, it will attempt to expand our understanding of the labouring classes beyond the workplace and the professional identity they developed in it.
According to Brian Pullan, in sixteenth-century Venice charity was the moral and civic obligation of the wealthy patricians and the authorities. In exchange for their philanthropy, the benefactors expected prayers for their soul. The distribution of alms was realized through Venice’s religious confraternities, the scuole grandi and the scuole piccole. Their efforts were complemented by the charitable activities of occupational confraternities. Particularly attentive to women, the terminally ill, and the aged, the authorities established several institutions for their benefit. The motives that instigated the various agents of charity were widely diverse. The nobility were drawn to the reputational and spiritual benefits of charity. Being shown to actively care for the poor increased their social status and chances of salvation. Venetian authorities were interested in social order and control. By backing such institutions, authorities directed philanthropy towards the ‘deserving poor’, condemning the potential idleness of the able-bodied.
The philanthropic pursuits of these agents of charity have been well documented; the charitable activity of the popolani, however, has been largely overlooked by historians. This is mainly because the popolani, especially those worse-off members of Venetian society, have been traditionally seen as recipients rather than providers of alms. In one of the first attempts to explore the philanthropy of the lower classes in the early modern period, this paper will present ‘charity from below’, to challenge the existing scholarly view that charity was the sole responsibility of the government and the nobility in late Renaissance Venice. Using the Venetian maritime popolani as a case study, the paper will show their conscious charitable practices towards those in need within and beyond their family circles, and reveal a hitherto unknown aspect of their contribution to the state. Placing particular attention on the institution of the dowry as a charitable bequest, the paper will further show that marriage was not merely a financial necessity for these groups, as hitherto contended. It was a cradle of social wellbeing through lasting companionships, rather than merely a means for financial security.

Academic Session III / F
307
As a final point, the paper will consider the effect of the 1575-77 plague on the charitable activity of the popolani. Dennis Romano claimed that the plague’s gruesome combination of poverty and contamination increased people’s social alertness and produced a new form of charity as an antidote to the ills of society. This, according to Romano, found expression in the charitable activity of the city’s scuole. This paper will pose the hypothesis that this new attitude must have affected the popolani, who were the plague’s most susceptible victims. In the specific case of the maritime popolani, their well-documented altruism (more than 50 per cent of the 225 testators studied bequeathed part of their property to non-immediate family members and un-related beneficiaries), expressed with genuine expressions of gratitude, compassion and sympathy that seem to emerge as a post-plague phenomenon, reaffirms their mutual sense of solidarity. Living in the same neighbourhoods, exercising similar trades, and developing a common sense of professional identity and pride, it is highly likely that misfortunes, such as the sudden loss of family members, were experienced collectively. This solidified their sense of community. Perhaps, it was this sense of community that can, in part, explain their heightened altruistic behaviour.
Overall, this paper will present the distinct socio-economic consciousness and activity developed by the maritime folk of Venice in a period that was marked by mounting inflation, stagnating salaries, and the overall decline of Venetian shipbuilding and shipping that led to economic adversity for these groups. The 1575-77 plague had a further toll on their financial means and immediate family members. As a conclusion and food for thought, this paper will pose some more fundamental questions. To what extent did the plague influence the emergence of more sentimental tendencies and, in consequence, more systematic charity and the tightening of solidarity amongst the popolani? What was the impact of their extra-professional contributions on the post-epidemic recovery of the Republic? And does a newly-found appreciation of the extra-professional contributions of the popolani challenge the scholarly understanding of the post-epidemic recovery of Venice as a primary result of systematic emigration and immigration programmes?

Academic Session III / G
308
III/G European Economy in the Twentieth Century Simon Mollan & Philip Garnett (University of York) Connections and comparisons between British banking and international mining firms, 1900-
78: preliminary findings
It remains unclear what the significance of connections between organizations is to their strategy and success. Do shared directorships constitute an important conduit for information exchange between organizations? What is the nature of the resulting network of inter-locking directorates, and is there a link between features of this network and the ultimate faith of the connected companies? This paper will present the preliminary findings of our research project to map and examine the relationship between networks of inter-locking directors and different sectors of the economy, in this case the banking and mining sectors. The dataset used here contains organizational and directorial data from the Stock Exchange Yearbook, and the Directory of Directors. In this paper we establish and discuss the methodology we have used for the collection and structuring of corporate (firm) level data. To facilitate the understanding of the relationships between the data, it is stored using the Neo4J graph database. We explain the value of graph databases to economic historians interested in organizations and economic activity.
Appropriate network analysis is then applied to detect communities of connected corporations. We discuss the meaning and significance of inter-corporate network structures formed by inter-locking directorates to parameterize what can and what cannot be investigated using data of this type, in particular to highlight the potential difference between network structure and network agency. Tobias Jopp (University of Regensburg) Did the Central and Allied Powers form credible alliances in World War I?
As is common knowledge, World War I was fought by a number of countries siding together under either the label Central Powers, or Allied Powers. In the light of how the political and economic relations between the belligerents developed over the nineteenth century and the run-up to the war, the alliances that de facto emerged in stages may not have been the most natural of all alliances as such. And as the several war aims conferences on both sides alone show, there was permanent need to bring down a variety of views to a common denominator. How did people at the time perceive the alliance dynamics? Did they see monolithic blocks? More formally, this paper aims at answering the question of whether the Central and Allied Powers did form credible alliances in the eyes of a particular group of people, namely those who invested on the capital market. To that end, the point of view of the Amsterdam capital market is adopted, which is a neutral view (or, the view of a neutral). Using a rich set of data on daily prices for the belligerents’ sovereign debt, the hypothesis is tested that the prices for the bonds of those belligerents that formed a credible alliance in investors’ eyes should show signs of co-integration and behaved, by tendency, as if the belligerents’ sovereign debts became indistinct. The test should especially show whether or not patterns of credibility were stable over the war. Methodologically the approach draws from the literature on (financial) market integration. The paper contributes in two ways: firstly, by exploring the implications of the credibility hypothesis for our understanding of contemporaries’ real-time perceptions on the course of World War I using a quantitative, for this purpose perhaps unusual, historical source; and, secondly, by exploring its implications for our understanding of the economics of alliances and the working of modern financial markets. In the latter context, one might, for example, think of a (in)credibility premium (not unlike that connected with Eurobonds).

Academic Session III / G
309
Enrico Berkes (Northwestern University) & Samuel H Williamson (University of Illinois, Chicago & MeasuringWorth)
Fifty years of revisions in the official estimates of GDP for the UK and their impact on the interpretation of postwar economic performance
The official GDP numbers for the UK are published annually by the Office of National Statistics in the United Kingdom National Accounts The Blue Book. For the most part these series start in 1948 and end in the previous year. As with most official numbers, there can be minor ‘corrections’ of the series from year to year. This paper will show that many times these corrections have not been minor and that they are in a sense, rewriting history.
For example, in the 2010 Blue Book it was reported that the United Kingdom’s real GDP from 1948 to 2010 has grown at an annualized rate of 2.43 per cent, and per capita real GDP grew at 2.06 per cent. In the 2011 Blue Book for that same period, real GDP was reported to have grown at a rate of 2.68 per cent and per capita real GDP grew at 2.31 per cent. Projecting backwards, that predicts that the 1948 pre capita GDP was 14 per cent lower than it had been predicted the year before.
Annual GDP estimates from the years 1952 and 1959-2013 have been gathered for this study and we have found that these kinds of changes have taken place throughout the post war period. For example, these different datasets report that the growth of output between 1958 and 1959 had 18 different values in a range between 2.66 per cent to 4.68 per cent. Quarterly data that span the period 1955Q1-2013Q4 for the vintages released from 1976 on have also been collected.
Clearly, it is not only an issue of growth figures. GDP is considered one of the most important macroeconomic indicators. Key policy decisions are based on GDP performance and behaviour. For example, one of the reasons why the UK did not join the European monetary union in 2001 was that its business cycles were believed to be more correlated with those of the US than with those of continental European countries. Therefore, communitarian monetary interventions aimed to smoothing the business cycle would have been at odds with the needs of the UK economy. Using more recent GDP vintages we show that this result is less clear-cut than what was thought in 2000. For example, using a two-consecutive change rule the Pearson’s contingency coefficient that measures the correlation of the business cycles of the US and the UK between 1960 and 1996 goes from 0.57 to 0.53 using 2000 and 2012 GDP vintages, respectively. By the same metric, the correlation with France’s business cycles is 0.63 using 2012 vintages.
In the light of these findings, we think that it is important for researchers in economics, and in particular those that, such as economic historians, analyse past events to be careful in the choice of their datasets: the vintage choice might change history.

Academic Session IV / A
310
IV/A Dynamics of Social and Human Capital in Finance Catherine Schenk (University of Glasgow) Gentlemen and players: regulation and self-regulation in international banking in the 1970s
The relationship between regulators and the regulated in financial services has attracted considerable public and academic attention in the wake of the most recent failures in supervisory oversight that prompted the 2007/8 global financial crisis. It seemed in retrospect that both internal governance structures and external supervision had failed to forestall a dangerous accumulation of mis-priced assets, creating a brittle and fragile global financial system. It has long been understood that the systemic macroeconomic importance of national banking systems makes a strong case for prudential supervision by an independent agency. State systems aimed at reducing the incidence of costly bank runs (through, for example, deposit insurance or lending of last resort) create moral hazard that may increase risky behaviour in the absence of external controls. But the importance of private information as a key bank asset and the complexity of many financial transactions complicate the ability to engage in transparent prudential supervision. In many financial markets a model of self-regulation through identifying industry standards or professional codes has therefore developed.
This paper explores how banks and banking organizations responded to challenges in the development of international banking in the 1970s. The focus is on the renewal of a self-regulatory organization in the form of the British Bankers’ Association and on the origins of the Basel Committee of central bankers. In particular, these two organizations intersected in the 1970s as the Bank of England sought to promote a ‘market led’ model of supervisory regulation. Using a range of new archive evidence (from the UK, USA and Europe) the paper reveals that these efforts were prompted by changes in the structure of the international banking market, in particular the acceleration of financial innovation, internationalization and liberalization of markets. Banks were additionally responding defensively to challenges from external regulators, mainly in Europe, to increase formal prudential supervision. In this way, collective action and identifying ‘market based’ regulation was used as a pre-emptive strategy to avoid ‘top down’ formalized regulation and controls. In London, this strategy found support from the Bank of England, which was reluctant to increase its responsibility in this area. The landscape or architecture of banking supervision, even on a national level is extraordinarily complex; encompassing firms, industry organizations, central banks, and specialist supervisory organizations, both international and global. Moreover there is considerable overlap and interaction among these levels. We shall see that there was considerable influence of professional associations such as the BBA, on the ‘top down’ identification of best practice from outside the market (in this case the Bank of England). Gerarda Westerhuis (Utrecht/Erasmus Universities) New beliefs at the top: mapping the changing backgrounds of Dutch bankers, 1950-2007
During the second half of the twentieth century Dutch banking changed from a highly segmented sector with numerous small and specialized banks into a very concentrated one dominated by three large banks with a diversified product portfolio and global operations. This consolidation and diversification should have reduced risk and increased performance. However, while overall performance improved, stability did not (De Jong & Westerhuis, 2010; Committee De Wit, 2009). The results have been plain for all to see.
To complement current insights of the 2007 financial crisis, this paper aims to get a better understanding of the forces behind the strategic and institutional changes in the banking sector by examining the transformation of the underlying belief systems. This is based on recent work on processes of economic change. Thus, North (2005) has argued that changes in institutions reflect shifts in the dominant beliefs of those establishing the rules of the game. Consequently, understanding institutional change requires knowing why and how individuals

Academic Session IV / A
311
change their conception of the world around them. Callon (1998, 2006) studied the interaction between economics and society and claims that new economic insights about, for example, markets could have a direct impact on current beliefs about those markets in a process, which he calls ‘performativity’. MacKenzie & Millo (2003, 2009) provide a good example by showing that option markets bloomed after the development of option pricing theory, because actors adopted the new models and the models became institutionalized.
The period under consideration saw a strong revival of a belief in the virtues of the free market, leading to a wave of deregulation (Friedman, 1962; Samuelson, 1965; Fama, 1970). It was accompanied by a related belief in business management skills as being suited for anything and everything (Ferraro, Pfeffer & Sutton, 2005; Kipping & Bjarnar, 1998). Uncertainty was believed to be measurable as risk, and risk itself was believed to be manageable (Smithson 1987, Duffhues 1990). The question therefore is how the changing beliefs about markets, management in general and risk management in particular affected the long-term development of the Dutch banking sector.
Being part of a larger project this papers examines the transformations in the belief systems of policy makers of the Central Bank and top bankers from the three largest banks in the Netherlands about the function of banking in general and risk and performance in particular. In order to understand the adoption of new beliefs by top bankers and how this influenced bank strategies and institutions, I focus in this paper on changes in the bankers’ background over time. Thus, I will use a prosopographic approach, studying the education and career paths of the policy makers and top bankers between 1950-2007.
The research is based on published documents (speeches, interviews, and press reports), unpublished sources (minutes of board meetings), as well as interviews with (former) board members. Eiji Hotori (Yokohama National University) Japanese financial elites for banking supervision in the Ministry of Finance, 1927-98
Human capital is the key element for bank examination since it affects effectiveness – the number, education & career, examination practice and principles of prudence. Yet, previous research in relation to Japanese financial elites basically targeted Ministers of Finance and Governors of the Bank of Japan. Japanese financial elites for banking supervision had not been explored. On tracing the history of the Japanese supervisory system, this paper focused on Japanese heads of the Financial Inspection Department in the Ministry of Finance. The transition of supervisory philosophy over time, the transformation of examination practices and the effect of the American Occupation reforms in 1949 were included. Also, the structure of the regulatory capture in the Japanese banking supervisory system was explored between 1965 and 1998.
This paper covered the 49 heads of the Financial Inspection Department from 1927 to 1998. The covered period was sectionalized into the following four periods: (1) 1927-42, (2) 1949-65, (3) 1965-81 and (4) 1981-98. The heads’ education, career, tenure and ‘amakudari’ (parachute) were identified quantitatively in each period by accessing various historical materials including the materials of the Ministry of Finance. In addition, four heads of the Financial Inspection Department who represented each period were detailed to complement the analysis.
The tentative conclusion of this paper is as follows: because of the American Occupation reforms in 1949, the personnel practices of the head of the Financial Inspection Department changed drastically. The expertness aspect rather than the generalist appeared to be required, and thus graduates in economics were appointed as well as the term of the head being prolonged. After leaving office, most of the former heads of the Financial Inspection Department over the period first entered public-sector financial institutions. After 1965, however, these practices disappeared relatively quickly. Graduates in law came to be appointed again, and the term of the head was shortened. Especially, the parachuting practice

Academic Session IV / A
312
changed over time as follows: in the period of 1965-81, half of the former heads of the Financial Inspection Department directly parachuted into private banks/financial institutions after leaving office. In the period 1981-98, half of the former heads of the Financial Inspection Department entered public-sector institutions which related to real estate industry.
Lastly, the link between the former heads of the Financial Inspection Department (parachutists) and the Japanese bubble economy in the late 1980s was examined for further research. Mikael Wendschlag (Uppsala University) The ‘regime context’ of banking supervisors’ competence: the Swedish case over the twentieth
century
This paper accounts for the Swedish banking supervisor’s human capital during the twentieth century and analyses this from the perspective of changing financial regulatory regimes during this period. It relates to the body of research concerned with the human capital in financial markets and organizations. A contribution of the paper is the emphasis being put analytically on the regime context in which the human capital has been gained and how the ‘value’ of the human capital may fall drastically if the regime changes.
The paper uses empirical data on the educational and working backgrounds of the staff of the Swedish Banking Inspection Board from its creation in 1907 to 1991 when it was merged with the Swedish Insurance Inspectorate to form the Swedish Financial Supervisory Agency. The ‘context’ of relevance here is that of the overall financial regulatory regime (Llewellyn, 2001) of the time as well as the occurrence of critical events, more particularly financial crises. In the Swedish case, and similar to many others, the early and late decades of the twentieth century were market or liberal regulatory regimes, while in the decades around the Second World War the regime can be defined as strict (Larsson, 1998). Financial crises occurred around the founding of the Swedish Bank Inspection Board in 1907-8; 1920-22; 1932; and then in 1990-3.
The paper concludes that the competence, especially in terms of prior crisis experience, of the Swedish banking supervisor was highest around the early 1930s when the Swedish banking sector fared better than in many other countries. Similarly, the small but competent supervisor seemed to succeed well in the 1907-8 banking crisis. However, during both the 1920’s and 1990’s crises, the supervisor’s human capital seem to have been less suitable to the context of the time. As the Swedish case will indicate, the human capital of the banking supervisors is an important indicator of supervisors’ competence. It is, however, important to note that it may be well suited for one particular context, but then become obsolete if the context, or conditions, changes.

Academic Session IV / B
313
IV/B Inequality and Living Standards Jonas Helgertz & Martin Dribe (Lund University) Long-term class and income mobility in Sweden: a three generation approach
Most research on social and economic mobility follows a two-generation approach, studying the correlations between the socioeconomic status of, for example, fathers and sons. In this paper we look at class and income mobility across three generations of males in Sweden in the period 1815-2010. Using longitudinal micro-level data from the Scanian Economic-Demographic Database, we identify 2,000 three-generation genealogies for which we have full information on social class and income attainment in prime working ages.Much of the economic research into social mobility derives its theoretical foundation from the highly influential model developed by Becker & Tomes (1986). Socioeconomic attainment of children is partly the result of parental investments in the human capital of their offspring.
Much less attention has been given to transmissions of status beyond two generations, and whether social mobility between two generations is maintained also in the third. This issue is of considerable relevance both for our understanding of societal openness and the stability of class structures.
There could be several reasons for the existence of a direct link between grandparents’ and grandchildren’s social class. Grandparents could transmit various resources directly to their grandchildren. These could be resources in the form of wealth or networks, which in turn could provide access to high-status education or occupations (see, e.g., Mare, 2011). It is probably to be expected that this kind of direct influence through wealth and high-status networks should be most strongly felt at the upper end of the status distribution, and thus that it could be a major explanation for a high degree socioeconomic persistence in the upper classes (see, e.g., Zimmerman, 1992; Lindahl et al. 2012). Increased longevity and improved health of older people, together with higher rates of union dissolution, also implies that the opportunity of direct influence from grandparents to grandchildren has increased, and the possible effect of this should also have grown over time (Bengtson, 2001). Here we should probably expect more of an effect across the entire socioeconomic distribution and not, as in the case of wealth or high-prestige networks, mainly in the upper classes. On the other hand, less intergenerational co-residence and increasing importance of long-range migration could be expected to work in the other direction, reducing the direct impact of grandparents on grandchildren.
Because there is also likely to be some randomness both in ability and luck, which could lead to mobility in both directions, we should probably expect the chances of the next generation to maintain the new position attained by the middle generation to be lower than for comparable individuals who did not move socially in the preceding generation. For example, if a father gains social status compared to the grandfather, we cannot expect the grandfather to have much to contribute directly to help the grandson maintain this position. In other words, social mobility between grandfather and father could be expected to generate mobility of the opposite direction between father and son, which would contribute to declining persistence of socioeconomic status across generation. Michael Pammer (Johannes Kepler University) Income inequality in Imperial Austria, 1911
The paper examines income inequality in the Western half of the Austro-Hungarian Empire in 1911. It aims at:
estimating regional and local levels of income; giving an estimate of income distribution; offering an explanation of the degree of inequality.
Units of analysis are the 400 districts and townships of Imperial Austria.

Academic Session IV / B
314
Existing estimates of income in Imperial Austria suggest this was an economy that
grew slowly and steadily from the early nineteenth century on. In part I, the present research aims at describing and explaining regional and local income differences.
Part II addresses income distribution in an economy with growing income and growing industrial and service sectors. The Austrian lands represent economies at extremely different levels of development. The north-eastern and the south-eastern lands were backward both in terms of income and of sectorial structure, whereas the central region around Vienna and other parts of the Alpine lands and the Czech lands enjoyed high productivity in all sectors. The relation between income distribution and the level of development is analysed with regard to regions at different levels of development at one point of time (not at the change of distribution in a longer time period).
Preliminary findings suggest that income distribution depended mostly on the level of income a region had attained in 1911: regions with higher income show lower degrees of inequality. The effect is extremely strong and robust. Other relevant factors are, among others, the sectorial structure, migration patterns and so on. These findings are in accordance with previous research on wealth distribution which suggest that the distribution of wealth in Austria tended to widen only up to 1890/1900, whereas in the last two decades before World War I the wealth distribution seems to have narrowed at least to some degree. This means that the more advanced regions of Imperial Austria had already arrived at an advanced stage while the backward regions showed still the signs of economies in their early phase of development.
The study relies on income tax data documented in detail in official publications. These tax statistics provide information on the sources of income (land, labour, capital, and so on) and on the number of tax payers in each of 18 tax classes (including the amount of tax paid). This information is provided for every district. In addition, we dispose of detailed information on the sectorial structure of districts, their demographic characteristics, and numerous data on special aspects of production, especially in the agricultural sector.
The personal income tax was newly introduced in 1896 and was meant to affect all sources of actual income and its equivalent. For instance, people who lived in their own homes had to pay tax on the fictitious rent that property would have yielded in the market. Subsistence income, important in a country with half the population still working in agriculture, was subject to taxation like any other income. Thus, income properly declared in the tax records, gives a good idea of actual material welfare. Eric Schneider (University of Sussex) Foetal health stagnation: have health conditions in utero improved in the US and western and
northern Europe over the past 150 years?
Between 1850 and the present many standard indicators of human health have improved dramatically around the world. Crude death, child mortality, infant mortality and stillbirth rates have fallen. Life expectancy and average adult height have increased. Western Europe and North America led these trends with the rest of the world following suit in the second half of the twentieth century. Given the tremendous improvement in human health over the past 150 years, one might assume that conditions for children in utero were also improving. However, there has not been a systematic study of multiple foetal health indicators to determine whether this was true.
This paper presents such an analysis. Examining several proxies for foetal health including birth weights, stillbirth rates and early neonatal mortality rates, it argues that there has been little change in foetal health conditions from the mid-nineteenth century to the present in North America and Western and Northern Europe. Birth weights have not improved dramatically (relative to other countries) over the past 150 years. This is true when looking at means of distributions, which have been compared extensively in the past (Goldin & Margo, 1989; Ward, 1993; Costa, 1998, 2004), but also when comparing birth weight

Academic Session IV / B
315
distributions in the mid- and late nineteenth century with birth weight distributions in 1985. In addition to birth weights, stillbirth rates and early neonatal mortality rates were stagnant from the 1860s or 1870s to the late 1930s when they began to decline (Woods, 2009). However, this decline in rates was caused mainly by improvements in obstetric care rather than improving conditions in utero. After the discovery of antibiotics in the late 1930s, doctors began conducting more risky and invasive surgeries to save at-risk foetuses because they could protect mothers against puerperal fever with antibiotics (Løkke, 2012). And even before the decline in these rates, there is some evidence to suggest that selection effects of stillbirths and possibly early neonatal mortality were more important than scarring effects. Thus, a decline in the stillbirth rate might have a negative or at least ambiguous effect on the health of survivors.
This evidence could point toward two conclusions. It is possible that substantial improvements in living standards, nutrition, medical technology and health infrastructure have had a relatively small influence on foetal health. Perhaps improvements in postnatal health did not translate onto prenatal health. On the other hand, the evidence may suggest that the indicators used to measure foetal health, indicators that are still widely used today, are not as useful as researchers might hope. Perhaps foetal health has improved over the past 150 years, but we do not currently have proxies that can capture this improvement. This would suggest looking for new ways to measure foetal health in the past and future.
These findings have important implications for contemporary biomedical and social science research. Research that has found a relationship between birth weight and later life mortality and morbidity risk along with human capital formation may provide useful information about cross-sectional (within cohort) relationships between these variables, but these relationships should not be ascribed across cohorts without careful consideration. Arora (2013) shows that cohort mortality risk age profiles from non-infectious diseases have improved since the mid-nineteenth century in Britain, but improving foetal health may not explain this cohort trend. Scarring from morbidity in infancy and early childhood might have been more important. In addition, these historical findings question the standards for birth weight by gestational age developed recently by the INTERGROWTH-21st group (Villar et al., 2014). If birth weights have remained remarkably stable over a period where health improved so dramatically, can the current pattern of foetal growth be considered as optimal?
References
Arora, Suchit, ‘Understanding Aging During the Epidemiologic Transition’, Research in Economic History, 29 (2013), pp.1-69.
Costa, Dora L., ‘Unequal at birth: A long-term comparison of income and birth weight’, Journal of Economic History, 58, no. 4 (1998), pp.987-1009.
Costa, Dora L., ‘Race and pregnancy outcomes in the twentieth century: a long-term comparison’, The Journal of Economic History, 64, no. 4 (2004), pp.1056-1086.
Goldin, Claudia, and Robert A. Margo, ‘The poor at birth: Birth weights and infant mortality at Philadelphia's Almshouse Hospital, 1848–1873’, Explorations in Economic History, 26, no. 3 (1989), pp.360-379.
Løkke, Anne, ‘The Antibiotic Transformation of Danish Obstetrics: The Hidden Links between the Decline in Perinatal Mortality and Maternal Mortality in the mid-Twentieth Century’, Annales de Démographie Historique, no. 123 (2012), pp.205-224.
Villar, J. et al., ‘International standards for newborn weight, length, and head circumference by gestational age and sex: the Newborn Cross-Sectional Study of the INTERGROWTH-21 Project’, Lancet, 384, no. 9946 (2014), pp.857-868.
Ward, W. Peter, Birth Weight and Economic Growth: Women’s Living Standards in the Industrializing West (Chicago, 1993).
Woods, Robert, Death Before Birth: Fetal Health and Mortality in Historical Perspective (Oxford, 2009).

Academic Session IV / B
316
Alexander Moradi (University of Sussex), Denis Cogneau & Léa Rouanet (Paris School of
Economics) African living standards under the French Empire: evidence from recruits to the Tirailleurs
Sénégalais
There is an enormous range of judgments about what changes the colonial period brought to the living conditions of African populations. For some, colonial rule disrupted or corrupted the former indigenous institutions and exploitative policies massively deprived the indigenous population in late nineteenth and early twentieth century. At the same time, however, Africa underwent a remarkable transformation: slavery came to an end, political stability was achieved, cultivation and commercialization of cash-crops expanded, trade increased, investments in railways and roads took place, a wage labour market developed and Western education spread. One can speculate what impact these changes had on human development. The factual account is essentially uncertain, for there is little quantitative evidence on how living standards evolved during this period.
Using data of more than 80,000 Africans recruited to the West African regiments of the Tirailleurs Sénégalais 1880-1960, we look at living standards of Africans under French rule.
Recruiting rules and enlistment patterns changed over time. In the very early time, former slaves and chiefs’ sons constituted the bulk of soldiers. During World War I, and with the employment of African soldiers in the European war theatre, enlistments raised substantially. In 1925, formal conscription was introduced and in the 1950s there was a build-up to higher skilled military personnel.
We use a battery of tests to study the representativeness of our sample. Firstly, we compare our sample with official draft commission data for the period 1920-49. We confirm that we have a representative sample of soldiers that were considered as fit for military service, and who were drafted by the French army either as volunteers (a minority), conscripts or reservists. Secondly, we scrutinize the more general selection into the military, either on observables (fitness, occupation, place of birth), or non observables (good shape, strength, etc.). In particular, we use the progressive transition from informal conscription, organized by chiefs, to organized conscription by French draft commissions, as well as the discontinuous changes in recruitment during the two World Wars. We compare height trends of Burkinabe soldiers born in the same district but who migrated to the Gold Coast and enlisted in the British colonial army. We also compare heights of army recruits with heights reported in the anthropological literature at that time.
We find that forest districts of birth of Côte d’Ivoire and (a bit less robustly) of Benin exhibit a modest positive height trend. In other areas, heights seem to have stagnated. This suggests a rather bleak development of African living standards under the French Empire.

Academic Session IV / C
317
IV/C Work and Marriage Beatrice Moring (Universities of Helsinki/Cambridge) Were all widows poor-widows? Family and work or poverty and isolation
In 2006 Lynn Abrams raised the question why despite of decades of research into the history of women the historical narrative still remains predominantly male. The actors in society are men with wives obscured in marriage and marginalized in widowhood. Measuring female success in ability to marry and remarry has also been criticized by Todd & Pelling, echoing the views of Hufton of why women are viewed as wives and household members, not as individuals. The tendency to see women as appendages to men has persisted. The fact that in the twenty-first century we find statements that ‘old women’ (as a group) lacked chances on the marriage market because they were ‘infertile’ and ‘sexually unattractive’, raise the question to what extent studies of women penetrate the field of history. The approach to women has also been affected by understanding the family as the conjugal couple. A widow with children lived in an ‘incomplete family’, ignoring the possibility of extensions and the notion of kin as family. While domestic ideology could obscure reality in the past our own approach should be more critical. Snell & Millar have demonstrated that female household heads in the past were a normal part of life.
Another issue that needs to be highlighted is the continuous association of female headship with poverty. Among the propertied classes female headship was not an unusual phenomenon. What distinguished these families was the frequent presence of kin and female clustering rather than the domestic ideal of the ‘normal family’. Such co-residence units negate the concept of female isolation and inability to cope when deprived of a male household head. They also demonstrate the presence of female agency questioned by certain scholars studying elites. In the eighteenth century many widows continued their husbands’ businesses and could hold positions in the local community or private enterprise. While working class widows more often suffered hardship in widowhood, this was linked to lack of capital, a problem for working class people in general, and low female wages. This situation did not, however, necessarily result in loneliness and isolation. Wall, Rose & Robin and Anderson have shown how widows could be part of economic arrangements including family collaboration, work and poor relief. Widows should not be seen as parasites on society, they created survival strategies of which poor relief only constituted one part.
The aim of this paper is, using data on household composition, economy and poor relief in a comparative perspective, to challenge the assumption that widows in the past were passive recipients of assistance. The intention is to demonstrate that widows showed remarkable ability to combine different strategies for supporting themselves. While they might figure prominently among people receiving poor relief, such assistance was only part of their livelihood. Even widows outside the labour market were often engaged in providing accommodation, food or childcare for other people. It is time to re-evaluate the input of women and widows in the past and their role in society both at the local and the national level. Maria Stanfors (Lund University) Was there a marriage premium among workers in the late nineteenth-century manufacturing
industry?
The wage premium married men receive is well-documented (e.g. Hill 1979; Korenman & Neumark 1991; Nakosteen & Zimmer 1997; Nakosteen et al. 2004; Richardsson 1997). Together with the family gap, it is an important contributor to the gender gap, and an obstacle to achieving gender equality in earnings. Family responsibilities obviously pull in opposite directions for men and women; helping wages and careers for men, while being detrimental for women. It is, however, not clear why married men earn more than otherwise comparable unmarried men (Akerlof 1998; Chun & Lee 2001; Ginther & Zavodny 2001; Loughran & Zissimopoulos; Krashinsky 2004; Nakosteen & Zimmer 1997; Nakosteen et al. 2004). Is the

Academic Session IV / C
318
marriage premium related to selection processes into marriage or to real productivity differences between married and unmarried? Or is it a result of employer preferences favouring breadwinners?
Many studies have been conducted in order to understand the marriage premium and its causes in contemporary contexts, but there are few studies on the phenomenon in historical contexts (e.g. Weber 1908). The male breadwinner norm was strong in the past and supposedly it was reflected in the higher earnings of married men in relation to other groups of workers (Goldin, 1990; Horrell & Humphries, 1995; Janssens, 1998). There are no formal tests of whether married men outearned single men, net of confounding factors, and therefore no solid explanation of why we observe a raw earnings advantage among the married. In this paper we add a historical component to research on the marriage premium by investigating whether there was a marriage premium among Swedish industrial workers, c.1900, for whom we have detailed data on earnings, working hours, occupations, and employers. We also seek explanations as to how and why marriage affected the earnings of industrial workers the way it did. Competing hypotheses of productivity, selection, and discrimination are tested by using a micro-dataset covering the entire workforce of three different industries (tobacco, printing, and mechanical engineering) in Sweden in 1898-1907. Wage equations are estimated utilizing individual characteristics, including productivity measures, and firm fixed effects.
Preliminary results show that when controlling for individual, job, and firm characteristics, there was a marriage premium for men of similar magnitude to premia found in more recent data, i.e. 0.07-0.10 log points. Married men were more productive than were single men, but they were also able to sort themselves across employers to find the best-paying ones. Some employers were obviously of the opinion that firms should pay extra for men’s families. The results are assessed against the backdrop of changing labour markets and gender roles a century later when caregiving affected both men’s and women’s earnings negatively. Michael Wyrwich (Friedrich Schiller University Jena) Sources of spatial differences in labour force participation of women: historical evidence for
Germany
One of the main labour market trends over the last decades is the increasing labour force participation of women (FLFP in the following) (e.g., Costa, 2000; Goldin, 2006, 2014). Despite its overall increase there are well-documented persistent spatial differences in female labour supply and with regard to the attitude towards women working outside of the home which can be attributed to differences in natural conditions and cultural and institutional development (e.g., Antecol, 2000; Fortin, 2005; Alesina et al., 2013). The present paper argues conceptually and shows empirically that Protestantism shaped the labour market and industry structure (rise of capitalism) in a way that created more employment opportunities for women much as natural conditions (plough-based agriculture) influenced the conditions for FLFP in the pre-industrial era (Alesina et al., 2013).
The theoretical pillars for the line of argumentation is the theory of Max Weber on the relationship between Protestantism and the rise of modern capitalism (Weber, 1904) and the more recent human capital theory of Protestantism (Becker & Woessmann, 2009). I argue that a high degree of industrialization in the early twentieth century is positively related to FLFP at this time since the local presence of industrialization-related industries provided employment opportunities for women.
The empirical analysis exploits rich historical census data for the early twentieth century for Germany. It is well known and also visible in these data that there are significant historically-grown regional differences in regard to the population shares of Protestant adherents as well as huge differences in the historical pattern of industrialization (e.g. Tipton, 1976), and as will be shown differences in FLFP. The findings reveal indeed that the local employment share in manufacturing and business-related services that is due to the spread of

Academic Session IV / C
319
Protestantism explains spatial differences in FLFP. A detailed empirical assessment shows that the prime mechanism explaining the positive relationship between industrialization and FLFP is abundance of employment opportunities in the clerical white collar ‘sector’ which was one of the most preferred occupations of women around this time (e.g., Goldin, 1984).
The paper addresses an important issue, namely, it tests the hypothesis that newly emerging forms of non-agricultural employment like in manufacturing and business-related service industries since the late nineteenth century were indeed conducive for the emergence of FLFP (e.g., Costa, 2000; Goldin, 2006) on the sub-national (regional) level. In this respect, the paper links the literature on the significance of Protestantism for industrialization and the rise of capitalism with the empirical pattern of rising FLFP. Pamela Schievenin (University of Glasgow) Women, work, and identity in postwar Italy: the case of Emilia-Romagna, 1945-70
Women in postwar Italy were presented with different interpretations regarding women’s work outside the house. The view promoted by the Catholic Church, which emphasized the maternal role of women and condemned female employment, appeared dominant. Yet, the Left supported women’s rights to work on a theoretical level, and both Left-wing and Catholic women’s organizations presented female employment as a valid choice and an integral part of a woman’s personality.
This paper investigates how women received and responded to these different discourses in the period spanning from the end of the Second World War to the explosion of second-wave feminism (1945-70). This period saw the transformation of Italy from a peasant and, in many respects, underdeveloped country into one of the major industrial nations, following a period of dramatic growth in the years 1958-63 (the so-called ‘Economic Miracle’). Notwithstanding these economic changes, the rate of Italian women in paid work remained low, when compared to the major Western European economies. This paper explores how women narrate their decision to work, while the dominant model proposed to them was a stay-at-home wife and mother, and the majority of Italian women were not recorded as economically active. It examines how women negotiated their individual choices and social expectations, and how they reformulated their identities as working women.
In particular, the paper examines differences in work experiences, and sense of self based on it, between working-class and middle-class women. The research draws on a series of oral history interviews with two groups of working women who are usually considered working class (manual factory workers) and middle class (school teachers).
The paper focuses on women living in Emilia-Romagna. This region has a strong socialist tradition and became the stronghold of the Communist Party in the postwar period. Moreover, Emilia-Romagna was characterized by widespread women’s political activism, a phenomenon which has been defined with the term ‘Emilian female model’ (Gagliani, 1993). This study is part of a wider project that compares Emilia-Romagna and the Veneto region, a traditionally Catholic area. It explores the hypothesis that deep-seated and long-lasting ‘regional gender cultures’ about female employment (Duncan, 2002) played an important role in how women experienced work in postwar Italy.
The study employs a life-story approach, identifying how the sense of self was constructed on the basis of everyday subjective experience. It explores how significant work experience was in shaping women’s gender and class identities and how these identities transmuted their life aspirations, choices and relations with other women and men. It offers fresh insights into lived experiences of class and social difference, and how this intersected with gender identities, during a dynamic period characterized by a strong social mobility, the birth of consumer society, and the expansion of the welfare state. While shedding light on the history of women’s work and women’s individual agency in postwar Italy, the paper aims to provide a more refined understanding of class identities and relations in this period, and to contribute to the debate on the use of social class as an analytical tool.

Academic Session IV / D
320
IV/D How the Grain Market Functioned: Local, National and International Evidence
Liam Brunt (Norwegian School of Economics) & Edmund Cannon (University of Bristol) The economics of grain storage in England, 1663-1846
Grain prices – especially wheat prices – are a key source for economic history up to 1914. They have been used to track changes in real wages, the standard of living, and market integration; they have been used to assess the effectiveness of government policy and regulation. But what exactly do these grain prices represent? Are they spot prices or futures prices? Average prices or ‘representative’ prices? Even if they are average market prices then we must ask, what grain came to market? At what time of year? Which markets? All these factors have a large effect on the nature of the prices that we observe and therefore what we can safely infer from them.
We use new data on the internal English grain trade to examine where, how and by whom grain was stored; we describe the changing pattern of storage. We use new data on the national and international grain trade to quantify likely storage losses. We examine how grain was traded – at what point in the year it was released from storage, how it was transported to market and by whom. We show that most grain was stored on farms and sold directly to millers, thus circumventing grain traders and regulated markets. Grain stocks were also the largest single component of circulating capital in the English economy; we consider who financed grain storage, and how. Storage was increasingly financed by country banks and speculators, thus linking the market for real assets (grain) ever more closely to the market for financial assets (bills and bonds). Martin Uebele (University of Groningen), Tim Grünebaum (University of Dortmund) &
Michael Kopsidis (IAMO Halle) King’s law and food storage in Saxony, c.1790-1830 This study investigates price elasticity of food demand, which for pre-modern societies is thought to be low at around -0.4, also known as ‘King’s Law’, and how private carry-over stocks impact it. In a second step we analyse the determinants of private carry-over stocks statistically in a multivariate dynamic setup. We exploit unique annual data for private food commodity stocks for c.100 Ämter (or counties) in Saxony in the years 1789-1830 combined with information on harvest size, seeds sown and grain prices.
Contrary to findings by Persson (1999) and Fogel (1989) we replicate King’s Law to the first digit after the comma. Consumption smoothing by storing food across harvests further drives down food price elasticity, but only to a very small extent, which is explained by the small total amounts of inter-annual food stocks, some 2 to 3 per cent of total consumption. This gives support to yet unconfirmed suggestions of carry-over stocks being negligible in pre-industrial times, which – given a low level of market integration – explains the frequent occurrence of food crises.
The vector-autoregressive analysis of the determinants of stock size changes yields two independent and comparably-sized influences on stock size changes, namely grain prices and harvest outcomes. The (negative) effect of the grain price documents the relevance of the commercial motive to accumulate stocks; a low price goes together with a high probability of a positive return on investment. The simultaneous existence of an independent effect of harvest size implies that non-commercial motives must have been present as well; independent of the prevailing price, bumper harvests facilitated stock accumulation because price-inelastic consumption left some grain unused.
In the following, we briefly document the methods used to obtain these results. King’s Law is estimated via two methods: One suggested by Fogel (1989):

Academic Session IV / D
321
, where is price elasticity of food demand, the standard deviation of detrended harvest quantities, the standard deviation of detrended prices, and the correlation coefficient of food and quantities.
The second is a pooled linear regression of quantity on price: , with being quantity, price, and estimation parameters, and an i.i.d. error term. We approximate food consumption by taking local harvests and making assumptions about the relation between production and consumption. Both methods yield virtually the same results: for rye, the major food staple, in the period 1789-1812, we find a price elasticity of -0.425 when not considering inter-annual storage, and -0.432 when taking it into account. For wheat, price elasticity was higher, consistent with it being rather a luxury product in Saxony.
For the vector-autoregression, we collect harvest quantities, prices, and storage in vector in this order.
where is the data vector for i products, j districts and in year t, are harvest quantities,
prices, seeds sown, and storage amounts. By choosing this Cholesky-ordering we account for the fact that harvests are
contemporaneously exogenous to prices, seeds sown and storage. The data are made stationary by taking natural logarithms and detrending them with a Hodrick-Prescott filter with a smoothing parameter of 100. As deterministic variables we included an intercept, and dummies for the crisis years 1790, 1804, 1816 and 1827, which were either war years or exceptional harvest failures. The estimator chosen was ordinary least squares, and we regress the data vector on its own first lag (a two-lag-model does not yield qualitatively different results).
We performed the analysis in different versions, aggregating the data either to each of the four available Kreise (districts with c.15-20 counties each), or to Saxony as a whole, and for the years before 1812 and after 1815 separately, or pooling it for the whole period. In the latter case we account for potential regime changes by dummies. The analysis was done by graphing responses of each variable to positive shocks to all other variables of two standard deviations.
The results are always qualitatively stable across the various setups: storage increased after shocks to harvests, and declined after shocks to prices. Additionally, prices reacted negatively to shocks in harvests, and harvests possible to seeds sown one year later, serving as a control for plausibility. Seeding amounts were however inelastic in prices and harvests contradicting Hoskins (1968, 1964).
We interpret the former as evidence for both the consumption-smoothing effect of food storage, and an additional market-induced mechanism working via prices. Thus, households behaved as rational investors. In the same vein, we find that storage reactions were quantitatively larger to harvest than to price shocks in the case of the food staple rye, but about same-sized in the case of the more commercial product wheat. Literature
Fogel, R. (1989), Second thoughts on the European escape from hunger: famines, price elasticities, entitlements, chronic malnutrition, and mortality rates, Vol. 1 of NBER working paper series on historical factors in long-run growth, National Bureau of Economic Research, Cambridge MA.
Hoskins, W. (1964), ‘Harvest fluctuations and English economic history, 1480–1619’, The Agricultural History Review 12(1), 28–46.
Hoskins, W. (1968), ‘Harvest fluctuations and English economic history, 1620–1759’, The Agricultural History Review 16(1), 15–31.

Academic Session IV / D
322
Persson, K. G. (1999), Grain Markets in Europe, 1500-1900: Integration and Deregulation, Cambridge: Cambridge University Press.
Giovanni Federico (University of Pisa), Oliver Volckart & Max-Stephan Schulze (London
School of Economics) European goods market integration in the very long run: from the Black Death to the First
World War
Drawing on a comprehensive new wheat price dataset, the largest compiled and analysed so far, we address two core questions: first, when and by how much did wheat prices converge? Second, to what extent, if any, did markets become more efficient over time?
The main argument of this paper, in contrast to previous work in the field, is that rapid price convergence was not only a feature characteristic of the nineteenth century but rather that Europe experienced another, far earlier period characterized by a pronounced decline in price differentials. The new evidence shows that price convergence in the late fifteenth and sixteenth centuries was as fast and more sustained than after the end of the Napoleonic Wars. However, unlike the experience in the nineteenth century, declining price differentials at the start of the early modern period were not associated with correspondingly strong improvements in market efficiency. The results thus illustrate the insights to be had from using truly long-run data, observations drawn from a large number of markets across most of Europe and the construction of comprehensive balanced samples. Vincent Geloso (London School of Economics) & Paul Sharp (University of Southern
Denmark) Globalisation and empire: market integration and international trade between Canada, the
United States and Britain, 1750-1870
Recent research has demonstrated that the history of the growth of the importance of the wheat trade between the United States and the United Kingdom – often considered to be the cornerstone of the late nineteenth century ‘first era of globalization’ – has a longer story behind it. Thus, Sharp & Weisdorf (2012) demonstrate that the American supply of wheat was important for many years prior to the onset of the French and Napoleonic Wars and the subsequent prohibitive tariffs on grains under the Corn Laws (Sharp, 2010). With the repeal of the Corn Laws in the 1840s, contemporaries saw the ‘invasion’ of cheap American grain as a new phenomenon, when in fact its origins went back to the eighteenth century, before the large improvements in transportation technology which are often held up as the reasons for the late nineteenth century globalization (O’Rourke & Williamson 1999). Their work echoes those of Jacks (2005; 2006) and O’Rourke & Findlay (2005) who pointed out that market integration was already happening between the core economies of Europe and the peripheral economies of the Atlantic world like the United States.
This paper adds another important supplier of the British market – Canada – to this narrative. Similar to the trade with the US, Canada experienced various shocks which impacted on her ability to trade with the UK. In some senses, however, Canada presents a mirror image of the American experience, since while the US gained independence in 1783, large parts of the former, i.e. New France, were incorporated into the British Empire in 1763 with the Treaty of Paris. Otherwise, the experiences of Canadian farmers wishing to export to Britain mirrored to a large extent that of Americans, with the exception of favourable tariff rates on colonial grains from 1822.
Another feature which is ignored by a focus on the British and American trade is the importance of intra-North American trade. The US and Britain are clearly geographically very distant, so a focus on these two countries alone might make it impossible to isolate the effects of distance from policy (and other shocks to trade). Thus, in this paper, we include price series for the British colonies of Lower and Upper Canada from 1750 to 1870. Given that the United States was physically very close to the Canadian colonies and that when political unity had

Academic Session IV / D
323
been achieved from 1760 to 1775, Canadian farmers exported appreciable amounts of wheat to the American colonies, this inclusion allows us to contribute to a better understanding of market integration before the mid-nineteenth century. Moreover, there is evidence of stronger integration between Canada and the US after the 1820s when the grain trade between the two countries was progressively liberalized, something which also holds between Canada and the UK.

Academic Session IV / E
324
IV/E Britain and Caribbean Slavery Nick Draper (University College London) The British state and slave-owners: George Baillie, merchant of London and St Vincent, and
the Exchequer loans of the 1790s
To date little systematic work has been done on the role of the British state in the Atlantic slave-economy. The role of the British state in many other forms of economic activity in the long eighteenth century has certainly been the subject of re-examination in recent years.554 At the same time, the Legacies of British Slave-ownership project has established the universe of British slave-owners at the end of slavery using the compensation records. But to date nothing has been done to connect these two streams of research and rethinking. The British state of course set and sustained the regulatory framework of colonial preference for sugar and other products of the Caribbean; it provided military and navy support on which the colonies depended both against external and internal threats; it owned enslaved people itself. But in addition it periodically intervened to provide financial support directly to slave-owners. The compensation paid to slave-owners was only the last of such significant financial engagements with slave-owners by the British state, in a pattern of crisis intervention spanning precisely the period of the rise and eventual triumph of abolitionism, from the bailing out of the Grenada and St Vincent slave-owners and merchants in the 1790s to the measures for ‘relief’ in the early 1830s: the latter made available up to £1 million in short-term government loans to slave-owners, £500,000 to Jamaica in the wake of the Baptist War and £500,000 to Barbados, St Vincent and St Lucia for hurricane relief, subsequently extended to include Trinidad and British Guiana.555
This paper examines the earliest of these episodes, of the Exchequer loans to Grenada and St Vincent slave-owners and merchants, through the lens of George Baillie (?1755-1809), a large-scale slave-factor and West India merchant focused on the Windward Islands in a period of rapid wealth-creation and destruction in the slave-economy. His partnerships and business connections linked London and Liverpool with the Caribbean, and he was one of the main beneficiaries of the heavy lending undertaken by the British government in the 1790s to bail out slave-owners and merchants at the time of insurrection in the Windward islands. Previous accounts of this lending have tended to take for granted the propensity of the government to provide funding.556 This paper uses the series of Interesting Letters written by Baillie to former partners after his business foundered in 1803 to re-explore the government support extended to slave-owners and merchants in the 1790s, and to reconstruct Baillie’s private and public trans-Atlantic networks (especially his credit networks). It aims to shed new light on the relationship between the British state and slavery, to raise questions about the meaning of the co-existence of large-scale state support for slave-owners with the culture of abolitionism, to demonstrate the extent to which ‘the market’ was embedded in the frameworks of the imperial state, and to add to the evidence for the inter-relationship between slavery and the development of credit networks.
554 E.g. Julian Hoppit, ‘Political Power and British Economic Life, 1650-1870’ in R. Floud et al. (eds.) The
Cambridge Economic History of Modern Britain vol. 1 (Cambridge: Cambridge University Press, 2014) pp.344-367; Perry Gauci (ed.) Regulating the British Economy 1660-1850 (Farnham, Surrey: Ashgate, 2011).
555 1831-32 (627) 3 Will. IV.--Sess. 1831-2. A bill for enabling His Majesty to direct the issue of exchequer bills, to a limited amount, for the purposes and in the manner therein mentioned.
556 Douglas J. Hamilton, Scotland, the Caribbean and the Atlantic world, 1750-1820 (Manchester: Manchester University Press, 2005) pp.182-185.

Academic Session IV / E
325
Chris Evans (University of South Wales) ‘Guinea rods’ and ‘voyage iron’: metals in the Atlantic slave trade, their European origins
and African impacts
There has been in recent decades a growing appreciation of how the Atlantic slave trade stimulated the production and circulation of goods that could be traded for enslaved peoples.557 The growth of the trade, in brief, brought about a corresponding growth in the supply of Indian cottons, the making of guns in Liège and Birmingham, the distilling of rum in New England, and so on.
What does not feature heavily in the literature is the supply of metals. Yet ‘voyage iron’, copper ‘guinea rods’, and brass manillas were indispensable trade goods for any slaving expedition. This paper will analyse the role of iron, copper and brass in the Atlantic slave system. It will demonstrate how African demand shaped product design and influenced technological choice in Britain (and northern Europe more widely). The success of the British copper industry, for example, was closely related to the rise of British slave trading in the early eighteenth century. Slave traders integrated backwards into the copper works that supplied them with ‘guinea rods’.558 By contrast, the slave trade seems to have done little for the British iron industry. Most ‘voyage iron’ was sourced in Sweden.559
The paper will also explore some implications of the outflow of metals from Europe to Africa. Most of what was traded in African slave marts falls under the heading of consumer goods (textiles, alcohol, and fancy wares) but iron and copper were producer goods. How, then, were they absorbed into different African societies?
The case of iron seems particularly difficult to account for. Iron is an abundant element and it can be found in most parts of Africa. Indeed, sub-Saharan Africa has a rich tradition of ferrous metallurgy, dating back to the first millennium BCE. It may be that European irons were technically superior to those of Africa or were markedly cheaper, but there is no evidence of a decline in indigenous smelting brought about by European import substitution.560 In fact, archaeological studies of smelting districts in West Africa suggest an expansion in the eighteenth and nineteenth centuries, not a decline.561 Moreover, the demand for European metals appears to have been heaviest in regions like the Cameroons that were home vibrant smelting and smithing sectors.
Does the influx of raw materials imply an ‘industrious revolution’ in pre-colonial Africa – that African artisans were using European raw materials to produce an expanding range of articles for local consumption? Perhaps the trade in metals suggest a new perspective on the political ‘terms of trade’ between Africa and Europe in the age of the Atlantic slave trade, one in which Europe acted as a ‘periphery’ supplying raw materials to an African manufacturing ‘core’?
557 David Richardson, ‘West African consumption patterns and their influence on the eighteenth-century slave
trade’, in Henry A. Gemery and Jan. S. Hogendorn (eds), The Uncommon Market: Essays in the Economic History of the Atlantic Slave Trade (1979), pp.303-330.
558 Chris Evans, Slave Wales: The Welsh and Atlantic Slavery 1660-1850 (2010). 559 Chris Evans and Göran Rydén, Baltic Iron in the Atlantic World in the Eighteenth Century (2007). 560 Candice L. Goucher, ‘Iron is iron ‘til it rust: trade and ecology in the decline of West African iron-smelting’,
Journal of African History, 22 (1981), 179-89; John Thornton, Africa and Africans in the Making of the Atlantic World, 1400-1800 (1998), pp.45-47.
561 Philip Lynton de Barros, ‘The effect of the slave trade on the Bassar ironworking society, Togo’, in Christopher R. DeCorse (ed.), West Africa during the Atlantic Slave Trade: Archaeological Perspectives (2001), pp.59-80; Jean-Pierre Warnier and Ian Fowler, ‘A nineteenth-century Ruhr in central Africa’, Africa, 49: 4 (1979), 329-51.

Academic Session IV / E
326
Ahmed Reid (City University of New York) The British West Indian economy after the American Revolution
My presentation tackles one of the most debated questions in the historiography of British West Indian slavery and abolition. It challenges the long-held views of Eric Williams in ‘Capitalism and Slavery’ who argued that the decline of the British West Indian economy after the American Revolution was the main reason why Britain abolished the slave trade in 1807. Using plantation papers and trade statistics, the paper revisits the trade between the mainland colonies and the British West Indian colonies from 1774 to 1807, and hence shows that its structure had not changed during the period under investigation. In other words, the volume and value of trade between the mainland and the Caribbean was the same in 1807 as it was in 1774. It also provides some robust figures on the wealth of Jamaica and other British West Indian colonies by outlining the productivity and increasing efficiency of their economies, and hence, shows that the decision to abolish slavery was, as Seymour Drescher suggested long ago but without the empirical economic evidence to support his contentions an economically bad decision. David Ryden (University of Houston-Downtown) The Society of West India Planters and Merchants in the Age of Emancipation, c.1816-35
The London Society of West India Planters and Merchants (the Society), later known as the West India Committee, was the chief political arm of the sugar planting interest during the age of British abolition and emancipation. My previous work focuses on this organization’s makeup and tactics during the decades leading to the abolition of the British slave trade through the end of the Napoleonic wars (1783-1815). This paper continues this line of research, through a quantitative analysis of the organization’s meeting minutes during the 1820s and early 1830s. Particular attention is paid to the Society’s organizational structure, political networks inside parliament, and relationship with the colonial assemblies and island agents.
Historians have long recognized the important role the Society played in delaying emancipation, but we know very little detail about this industry lobby. This paper presents, for the first time, a statistical view of this organization's structure in the 1820s as well as a rudimentary prosopographical description of its most active members. The data for this analysis comes from the Society's minute books that record 473 meetings spanning between 1816 and 1835. These gatherings included large ‘general’ meetings that sometimes attracted hundreds of attendees as well as the much more intimate meetings of the Standing Committee, the Acting Committee, and various subcommittees. The Society’s minute-book data are also enhanced by linking the most active members to the slave compensation commission database, which has been made widely available through the Slavery Legacies Project. Other scholars have used these records, which document the cash amount given to each slaveholder in exchange for Emancipation, to reveal the breadth of slave ownership in Great Britain well into the Victorian age. This paper, however, works backwards from 1834, using the compensation-claim data to identify the Society’s most active membership and their respective stake in the slave system.
This quantitative analysis of the Society’s minute books demonstrates that the calls for Emancipation breathed new life into the lobby and forced its reorganization. In response to Buxton’s parliamentary call (1823) to end slavery in the Empire, a formal Literary Committee was created in order to better manage print media. With a budget at its disposal, this propaganda committee published proslavery tracts and compensated friendly newspaper editors and authors. Further, the Society modified its constitution so that a new executive committee was formed in 1829. This ‘Acting Committee’ consisted of elected members who met, at the very least, on a weekly basis in order to coordinate a sustained lobbying effort to (1) promote slave-owner compensation and to (2) prevent the processing of foreign sugar for reexport. This study goes on to show that the core leadership was – as in the eighteenth

Academic Session IV / E
327
century – dominated by planters and merchants associated with the island of Jamaica. Over 85 per cent of meetings were chaired by members connected with this largest, but declining, sugar colony. Perhaps in an effort to compensate for this lopsided leadership, a separate subcommittee for investors associated with Berbice and Demerara was created in the 1820s.

Academic Session IV / F
328
IV/F Urban Disamenities Jeremy Boulton (Newcastle University) & Romola Davenport (University of Cambridge) Standards of living and urban mortality in the first phases of British industrialization, 1750-
1850
The malign contribution of northern industrial cities to the stagnation of national life expectancy over the period 1820-70 forms part of one of the most long-running debates in English economic history, regarding the impact of early industrialization on living standards. The pessimistic view argues that industrial cities experienced a worsening of mortality especially in the second quarter of the nineteenth century, and that this was due to the peculiar conditions of industrialization, including administrative breakdown and rising social inequalities. An alternative view is that any mortality rise that did occur was largely a function of population density and exogenous epidemiological change. The declining reliability of Anglican registration of vital events over the period 1750-1838 means that this debate has been conducted with very little data, regarding a period sometimes described with respect to urban areas as a demographic ‘dark age’. This paper will examine both the dramatic improvements in urban mortality after 1750, and the apparent reversals in the period 1820-50, using evidence from the pre-eminent manufacturing city of the nineteenth century, Manchester.
In 1750 Manchester was a town of less than 20,000 people; by 1850 it had grown to become Britain’s third largest city, with a population of c.250,000, its growth predicated on its role as the centre of the British cotton industry. Engels documented the living conditions of the poor in Manchester in the 1840s with devastating effect, and nineteenth-century Manchester came to epitomize some of the worst excesses of industrialization for the urban poor. The Registrar-General William Farr repeatedly drew attention to the contrast between life expectancies in mid-nineteenth century Manchester and London, and considered the excessive population densities of Manchester to be the main cause of its high mortality. We have analysed burial and cemetery records detailing age and cause of death for a substantial proportion of Manchester’s population and used counts of all extant baptism and burial records for residents of Manchester township to estimate infant and crude mortality rates. Our results indicate that infant mortality was moderate in Manchester in the late eighteenth century despite very high levels of overcrowding, and fell with the wide adoption of vaccination in the first decade of the nineteenth century. However infant mortality resurged in the 1820s together with rises in early childhood mortality. This pattern is also evident in other urban centres with very different growth rates and economic functions and we will compare evidence from different types of towns and cities within and outside Britain to test the ubiquity or otherwise of the trends identified for Manchester. Walker Hanlon (UCLA) The impact of industrial pollution on city growth: lessons from the ‘Dark Satanic Mills’
Growing industries create jobs and drive city growth, but may also generate pollution, an endogenous disamenity that drives workers and firms away. This study provides the first assessment of the impact of these positive and negative effects on long-run city growth by studying the impact of industrial coal use in British cities from 1851 to 1911. I begin by constructing a measure of industrial coal use in 25 British cities in each decade. I then show that industrial coal use was an important disamenity in these cities, with a substantial positive effect on mortality rates, particularly due to respiratory causes. Next, I introduce an approach that allows me to separate the negative impact of this endogenous disamenity on city size from the positive impact of industry employment growth. My approach suggests that for an industry using the average amount of coal per worker in a city, the disamenity reduces the positive effect of industry employment growth by at least 8 per cent. This more than offsets any positive local multipier effect from industry employment growth. Finally, I provide

Academic Session IV / F
329
evidence that this effect was generated in part by high-skilled workers and skill-intensive industries being driven away from more polluted cities. Jessica Bean (Denison University), Andrew Seltzer & Jonathan Wadsworth (RHUL) The impact of commuting and mass transport on the London labour market: evidence from
the New Survey of London Life and Labour
This paper makes use of the detailed information about the locations of home and workplace contained in the New Survey of London Life and Labour (NSLLL) household survey, as well as a series of historical London Underground and railway maps, to explore the impact of commuting and the availability of mass transport on the London labour market circa 1929-31. Preliminary results from the NSLLL data suggest a positive relationship between commuting distance and earnings. A long literature in urban economics suggests that the residential and workplace decision is typically made jointly, and thus there may be reverse causation in an OLS regression (e.g. greater income allows workers to choose to live closer to their workplace). We address this possible bias in two ways: first, by examining secondary workers within households (whose place of work would have been less likely to influence residential decisions) and secondly, by examining households where the head is currently residing in the borough of their birth (as it can be assumed that these individuals had higher psychic costs of moving). Our preliminary evidence suggests that the relationship between wages and commuting distance was stronger for secondary workers than for household heads. We also explore the geography of the London labour market by mapping the patterns and extent of commuting between London boroughs, and present evidence that the expanding Underground network was connecting parts of the city that had been relatively inaccessible to each other before, and thus improving the ability of workers to commute distances and in directions that had previously been more difficult, if not prohibitive.
In comparing the results of the NSLLL to Charles Booth’s street-level study of poverty 40 years previously, the authors of the survey concluded that in addition to declining, poverty had become more geographically dispersed within London. They identified this increased dispersion with a decline in the number of severe pockets of poverty located in areas that were effectively cut off from the rest of London by geographical barriers (such as railways, canals and the river, and large industrial premises). Underground maps from the 1890s and 1930s suggest that the availability of transportation was likely an important factor in the distribution of poverty – additions to the tube network between the two periods made crossing the city much more feasible than it had been in the earlier period. Using the locations of Underground as of 1929-30, we will also be able to assess an ‘ability to commute’ measure for households and workers within the NSLLL, based on the availability of stations both near the home and within reasonable commuting distances, and then link the ability to commute to various labour market outcomes and characteristics of the housing market.

Academic Session IV / F
330
Marguerite Dupree, Iain Hutchison (University of Glasgow), Claire Jones & Anne Marie Rafferty (King’s College London)
The costs of infection control in British hospitals, c.1870-1970 Health care-associated infection is a global health safety challenge, contributing to over 20,000 deaths in the UK annually (Griffiths, Renz, Hughes & Rafferty, 2009). Infection control is an important indicator of quality of care and refers to policies and procedures used to minimize the risk of spreading infections, especially in hospitals and healthcare facilities.
This paper arises from a Leverhulme-funded project, ‘From Microbes to Matrons: infection control in British hospitals, c.1870-1970’. The project is exploring infection control and prevention in British hospitals between c.1870 and 1970, in order to understand how rates of morbidity and mortality from hospital infection decreased before the introduction of antibiotics, rose due to resistance to drugs, and then fell again to a stable yet still significant rate. As part of the wider project examining the organization of hospitals and the ways in which infection control and prevention shaped practice, pedagogy and governance arrangements, this paper explores the costs of infection control.
Much research has focused upon the debates and controversies surrounding competing ideas of the causes of infection (Ayliffe & English, 2003). What is less well understood is the impact of adhering to different theories of clinical practice and hospital management in terms of the costs and workload associated with improved hospital hygiene. Waddington has commented on the general rise in costs generated by reforms in nursing, but has not examined the specific costs of improvements in hygienic or infection control practice (Waddington, 2000). Analysis of the archives of King’s College Hospital in the 1880s, for example, reveals that nursing was the single largest item of expenditure. When female domestic servants, male attendants, supplies (soap, plaster and lint) and washing are added in, the total accounts for more than 60 per cent of total hospital expenditure. Thus, nursing, plus the associated practices and materials needed to maintain hygiene, absorbed a significant proportion of hospital budgets at this time. This dimension has so far been little explored.
This paper examines the costs of the workforce and material culture associated with infection control, their impact on hospital finance, and in turn, ways in which hospital funding shaped methods of infection control. It uses case studies based on the archives of four hospitals, associated with Joseph Lister and Florence Nightingale, nineteenth-century pioneers of hospital infection control: King’s College and St Thomas’ Hospitals in London; and Glasgow and Edinburgh Royal Infirmaries in Scotland. References
Ayliffe, G. A. J. and M. English (2003) Hospital Infection from Miasmas to MRSA. Cambridge University Press: Cambridge
Griffiths, P., Renz, A., Hughes, J., and Rafferty, A.M. (2009) ‘Impact of organisation and management factors on infection control in hospitals: a scoping review’ Journal of Hospital Infection, 73 pp.1-14.
Waddington, K. (2000) Charity and the London Hospitals, 1850-1898. Royal Historical Society, Boydell Press.

Academic Session IV / G
331
IV/G New Directions in Irish Economic and Social History Seán Lucey (Queen’s University Belfast) Institutionalization and Ireland’s past: policy implications and the role of historians
In June 2014 it was reported that the remains of 800 babies – later unverified – were the ‘septic-tank’ of the Tuam Mother & Baby Home in County Galway. Issues relating to the conditions of women in these homes, infant mortality rates and burial practices were subsequently brought into focus. The ‘Tuam Mother & Baby Home’ story was reported at length worldwide and caused much damage to the Republic of Ireland’s (R.O.I.) international reputation. The government responded by establishing a statutory inquiry of investigation. This follows on from previous inquiries into the institutionalization of women and children in Ireland’s past including the 2013 McAleese Inquiry and the 2009 Ryan Commission. The United Nations Committee on Human Rights recently criticized the country’s response to allegations of historical and more recent institutional abuse of women and children. Such issues are also relevant to Northern Ireland, where the on-going Historical Institutional Abuse Inquiry was extended by twelve months in the summer of 2014. Ireland’s institutional past has been to the forefront of recent government policy in both the R.O.I. and N.I.; this has led to much media attention, campaigning by advocacy and victim groups, and reaction from religious and state bodies.
These issues are inherently historical and historians have a vital role in this area of policy formulation and public debate. This paper explores the difficulties historians face in engaging with such an emotive and, at , sensationalist topic. However, the paper also highlights how such inquiries provide avenues for historians to influence and formulate government policy. This paper is based on my own research on twentieth-century Irish welfare and my experience of engaging with government bodies and media outlets in relation to the 2014 ‘Mother and Baby Home; controversy. Matthias Blum, Christopher Colvin (Queen’s University Belfast) & Eoin McLaughlin
(University of St Andrews) Will someone please think of the children: the long-run impact of the Great Famine on
physical and cognitive wellbeing in Ireland
This paper aims to quantify the long-run impact of the Great Famine on Irish society using data available from prison registers. The research questions we seek to answer are twofold: what was the long-run physical impact of the Famine on the cohort born during the famine years (1845-52), and did exposure to famine as a child influence ability later in life? Our paper uses the individual-level social data recorded in prison registers to study the impact of Ireland’s mid-century social turmoil on the physical wellbeing (height and weight) and cognitive ability (literacy and numeracy) of prisoners.
The anthropometric studies of Robert Fogel, John Komlos, Richard Steckel and others show that poor nutrition in early childhood can have a significant impact on both physical wellbeing and cognitive ability. The Great Famine presents an incredible nutritional shock to Irish society, and led to a spike in the prison population as people turned to crime in order to survive. This paper intends to measure the long-term impact of this shock.
Prison registers offer a wealth of information on individuals, including their name, place of birth, occupation, crime, religion, height and other vital statistics. Used in order to classify and track prisoners in a period without birth registers or passports, the information in these registers is very valuable to quantitative social science historians wishing to examine the health and wellbeing of a vulnerable segment of Irish society. These registers are particularly useful in light of the fact that individual-level census records have been destroyed for most of the nineteenth century; prison registers, and sources like them, are all that is left.

Academic Session IV / G
332
Richard Grossman, Masami Imia (Wesleyan University), Ronan Lyons (Trinity College Dublin) & Kevin O’Rourke (University of Oxford)
Long-run patterns and shifts in wealth: insights from Irish share prices since 1825
The last two centuries of Irish economic history contain a number of country-specific exogenous shocks and dramatic changes in the policy environment, creating one of the more unique trajectories to development. These include the Great Famine of the 1840s, significant land redistribution in the generation after 1870, the War of Independence (1919-1921) and the subsequent Civil War (1922-23), a generation-long attempt at autarky starting in the early 1930s, a reversal back to openness that ultimately led to the ‘Celtic Tiger’ of the 1990s and the collapse of a credit-fuelled bubble after the onset of the Global Financial Crisis in 2007.
The value of equity capital is, in some sense, a measure of confidence in the future, and thus Ireland’s long track record of publicly traded equities offers an insight into private reactions to the impact of the various shocks and policy changes over the course of its economic history. This paper establishes a monthly index for Irish equity prices from 1825 until the present day, in both real and nominal terms.
In and of itself, the unified index is a useful addition to the stock of series underpinning Irish cliometrics, which was until recent years notoriously scant. The long-run nominal index sheds light on broader macroeconomic questions, such as the long-run return on equity capital and the equity premium puzzle. The long-run real index allows a comparison of Irish equities with assets in other countries, including debt, equities and real estate, and will enable cross-country studies of asset price comovement.
With such a high-frequency index, statistical methods can be employed to identify break-points and turning points in equity prices. This statistical approach is then compared with a narrative approach, where major turning points in Irish history are identified chronologically. This combination of approaches can be used to test a variety of theories regarding information and the behaviour of economic agents, as well as historical questions about when particular information was known by agents and reflected in market outcomes.

Economic History Society Annual Conference 2016
333
Economic History Society Annual Conference
1 – 3 April 2016 Robinson College, University of Cambridge
Call for Academic Papers The 2016 annual conference of the Economic History Society will be hosted by Robinson College, University of Cambridge, from 1 – 3 April.
The conference programme committee welcomes proposals on all aspects of economic and social history covering a wide range of periods and countries, and particularly welcomes papers of an interdisciplinary nature. Scholars are not expected to present a paper in more than one session (including as a co-author) and, when slots are limited, priority will be given to those who did not present in the academic sessions at the previous year’s conference. Those currently studying for, or who have recently completed, a PhD should submit a proposal to the New Researcher session; please contact Maureen Galbraith ([email protected]) for further information.
The committee invites proposals for individual papers, as well as for entire sessions of 1.5-2 hours duration; (no more than 4 papers will be accepted for any one session). Please note that the committee reserves the right to determine which papers will be presented in the session if it is accepted. If a session is not accepted, the committee may incorporate one, or more, of the proposed papers into other panels.
Proposals should please be submitted online via the Economic History Society website (www.ehs.org.uk). You will be asked to submit: For single paper submissions:
The title of the paper proposed. A short abstract of the paper proposed (300-500 words).* Up to five keywords to help the conference coordinating committee allocate papers
between sessions. Contact details (name, affiliation and e-mail address; including those of co-authors). A brief C.V. For sessions:
The title of the proposed session. The rationale for the session (up to 100 words). The titles of each paper proposed. A short abstract for each paper proposed (300-500 words).* Contact details for each speaker (name, affiliation and e-mail address; including those of
co-authors). A brief C.V. for each proposed speaker. * The abstract(s) should explain the background to the paper; the questions it addresses; the sources and methods it employs; and likely conclusions.
For full consideration, proposals must be received by 4 September 2015. Notices of acceptance will be sent to individual paper-givers by mid/late November 2015 when they will be asked to provide the following:
A revised abstract of the paper (750-1,000 words) for inclusion in the conference booklet (by 18 December 2015).
A brief non-technical summary of the paper (if requested) for the ‘Media Briefings’ section of the Society’s website (by 15 February 2016).

Economic History Society Annual Conference 2016
334
An electronic copy of the full paper, or a web address where the paper is available for consultation (by 2 March 2016).
It is the normal expectation that speakers who submit a proposal for a paper to the conference committee should be able to obtain independent financial support for their travel and conference attendance. However, a very limited support fund exists to assist overseas speakers who are unable to obtain funding from their own institution or from another source. Details of this fund and an application form can be obtained from the Society’s administrative secretary, Maureen Galbraith. The completed application form must be submitted by the September deadline as later applications for support will be considered only in exceptional circumstances.

Economic History Society Annual Conference 2016
335
Economic History Society Annual Conference
1– 3 April 2016 Robinson College, University of Cambridge
Call for New Researcher Papers
The 2016 annual conference of the Economic History Society will be hosted by Robinson College, University of Cambridge, from 1 – 3 April. The annual conference opens with papers presented by new researchers. They offer those completing (or who have recently completed) doctorates the opportunity to present their own work before professional colleagues and to benefit from informed comment. Speakers who have participated in a new researcher session at a previous Economic History Society annual conference should please submit a proposal to present a paper in the Academic Session. The session will be held on the afternoon of Friday, 1 April 2016. Those wishing to be considered for inclusion in the programme must submit an application via the Economic History Society website (www.ehs.org.uk) by 4 September 2015. This should provide:
Abstract title Abstract summary (max 500 words); this should include:
o Outline of the question to be asked o Summary of methods and sources o Probable conclusions o Research progress
Intended date for submission of the thesis A supporting statement from the supervisor must be emailed separately. Please note that proposals from researchers at an early stage of their work will not normally be accepted. Those selected for inclusion in the programme will be asked to submit a paper, 2,250-2,750 words in length, by 18 December 2015 for circulation in the conference booklet. Each new researcher will have the opportunity to speak for 20 minutes, followed by 10 minutes of discussion. Up to two prizes of £500 will be awarded for the best sole-authored paper(s) presented in the new researchers’ session.* The procedure for judging papers will be circulated to all participants. The Economic History Society is able to offer limited financial support to enable new researchers to attend the conference when this is not available from their institution. Any queries should please be directed to: Maureen Galbraith Economic History Society Department of Economic & Social History University of Glasgow Lilybank House, Bute Gardens Glasgow G12 8RT Scotland, UK E-mail: [email protected] * New researchers, who have achieved their PhD by 31 December in the year preceding the conference, will not be eligible for the New Researcher Prize.


The economic hisTory socieTyAnnual Conference
University of Wolverhampton (Telford)27 – 29 March 2015Programme including
New Researchers’ Papers &
Abstracts of the other Academic Papers
Interior view of Coalbrookdale Co. Ltd. foundry fitting shop showing construction of high pressure pumping engine in foreground, with overhead travelling crane visible in middle distance and at top of image, c.1900-10Image courtesy of the Ironbridge Gorge Museum Trust