per71.pdf - Perpustakaan Setneg
192
http://www.bps.go.id
-
Upload
khangminh22 -
Category
Documents
-
view
4 -
download
0
Transcript of per71.pdf - Perpustakaan Setneg

http
://w
ww
.bps
.go.
id

Perkembangan Beberapa Indikator Utama Sosial-Ekonomi IndonesiaTrends of Selected Socio-Economic Indicators of Indonesia
AgustusAugust 2016
http
://w
ww
.bps
.go.
id

PERKEMBANGAN BEBERAPA INDIKATOR UTAMA SOSIAL-EKONOMI INDONESIAAGUSTUS 2016TRENDS OF SELECTED SOCIO-ECONOMIC INDICATORSOF INDONESIAAUGUST 2016
ISSN: 2085-5664No. Publikasi/Publication Number: 03230.1603 Katalog/Catalog: 3101015Ukuran Buku/Book Size: 10.5 cm x 20 cm Jumlah Halaman/Total Pages: xxvi + 164
Naskah/Manuscript:Subdirektorat Layanan dan Promosi StatistikSubdirectorate of Statistical Promotion and Services
Gambar Kulit/Cover Design:Subdirektorat Layanan dan Promosi StatistikSubdirectorate of Statistical Promotion and Services
Diterbitkan oleh/Published by:©Badan Pusat Statistik, Jakarta-Indonesia BPS–Statistics Indonesia
Dilarang mengumumkan, mendistribusikan, mengomunikasikan, dan/atau menggandakan sebagian atau seluruh isi buku ini untuk tujuan komersial tanpa izin tertulis dari Badan Pusat StatistikProhibited to announce, distribute, communicate, and/or copy part or all of this book for commercial purposes without permission from BPS-Statistics Indonesia
Badan Pusat StatistikJl. Dr. Sutomo No. 6-8 Jakarata 10710Telepon: (021) 3810291-4, 3841195, 3842508Fax: (021) 3857046E-mail: [email protected]: http://www.bps.go.id
Publikasi ini dalam bentuk elektronik (PDF) bisa diakses di:This Publication (PDF) can be accessed from this link:http://www.bps.go.id/aboutus.php?65tahun=1
http
://w
ww
.bps
.go.
id
iiiPerkembangan Beberapa Indikator Utama Sosial-Ekonomi Indonesia, Agustus 2016
KATA PENGANTAR
Booklet triwulanan BPS ini dirancang secara khusus bagi para pelajar, mahasiswa, akademisi, pelaku bisnis, birokrat, dan masyarakat luas yang memerlukan data dan informasi statistik yang bersifat umum, ringkas, strategis, namun mencakup berbagai bidang yang cukup luas.
Data yang dicakup dalam booklet ini meliputi keadaan geografi, penduduk dan ketenagakerjaan, sosial, pengeluaran konsumsi, pertanian, industri manufaktur dan konstruksi, perdagangan luar negeri, pariwisata dan transportasi, keuangan dan harga-harga, serta pendapatan nasional dan regional. Untuk memudahkan pemahaman dan pemanfaatan data, disertakan pula penjelasan teknis dari setiap jenis statistik yang ditampilkan.
Semoga booklet ini bisa memberikan informasi berharga bagi pengguna data BPS, baik untuk aparat pemerintahan maupun publik. Booklet ini diharapkan bisa menjadi sumber informasi yang berguna untuk berbagai tujuan.
Terima kasih kami sampaikan kepada semua pihak yang telah memberikan dukungan dan bantuannya sehingga booklet Edisi Agustus 2016 ini dapat disajikan. Kritik dan saran akan sangat kami hargai untuk penyempurnaan booklet edisi berikutnya.
Jakarta, Agustus 2016Kepala Badan Pusat Statistik
Republik Indonesia
Dr. Suryamin, M.Sc.
http
://w
ww
.bps
.go.
id

Trends of Selected Socio-Economic Indicators of Indonesia, August 2016iv
PREFACE
This quarterly booklet is designed especially for students, academicians, businessmen, and other parties who need data and statistical information which is general, concise, and strategic, but still cover wide range of statistical areas.
The data within this edition includes geographical situation, population and labor, social affairs, consumption expenditures, agriculture, manufacturing and construction, foreign trade, tourism and transportation, finance and prices, and national and regional income. Technical notes for each statistics are also included in this publication to provide a better understanding in interpreting data for data users.
We hope this booklet can provide valuable information to BPS data users, both public and government officials. Hopefully, this publication will be a useful resource for any purpose.
Thanks for all parties who have dedicated their time and efforts in publishing this August 2016 edition booklet. Critics and comments for improvement of the next edition would be greatly appreciated.
Jakarta, August 2016 BPS-Statistics Indonesia
Dr. Suryamin, M.Sc.Chief Statistician
http
://w
ww
.bps
.go.
id
vPerkembangan Beberapa Indikator Utama Sosial-Ekonomi Indonesia, Agustus 2016
Daftar IsiContents
HalamanPage
Kata Pengantar............................................................................................................ iiiPreface……………………………………………………………………................................................. iv
Daftar IsiContents……………………..………………………….…................…….......................................... v
Daftar TabelList of Tables…………………….......................................................................................... vi
Penjelasan UmumExplanatory Notes....................................................................................................... xvi
Penjelasan Teknis Indikator Utama Sosial-Ekonomi Indonesia................................... xviiTechnical Explanation of Selected Socio-Economic Indicators of Indonesia…..….….....
Peta IndonesiaMap of Indonesia…………………..................................................................................... xxv
1. Keadaan GeografiGeographical Situation……………………………………………..…………............................. 1
2. Penduduk dan KetenagakerjaanPopulation and Employment ………………………………………....................................... 9
3. SosialSocial Affairs………………........................................................................................ 33
4. Pengeluaran KonsumsiConsumption Expenditure.................................................................................... 59
5. PertanianAgriculture............................................................................................................ 67
6. Industri Manufaktur dan KonstruksiManufacturing and Construction.......................................................................... 89
7. Perdagangan Luar NegeriForeign Trade…………………………………………...................................…………….……… 103
8. Pariwisata dan TransportasiTourism and Transportation ………………………….....................................……..…….... 115
9. Keuangan dan Harga-hargaFinance and Prices……...………..........................................………………………………….. 127
10. Pendapatan Nasional dan RegionalNational and Regional Income………………………........................................……........ 145
xxi
http
://w
ww
.bps
.go.
id

Trends of Selected Socio-Economic Indicators of Indonesia, August 2016vi
Daftar TabelList of Tables
HalamanPages
1. KEADAAN GEOGRAFI GEOGRAPHICAL SITUATION
Tabel 1.1 Luas Wilayah, Panjang Perbatasan, dan Panjang Garis Pantai, 2006 Table Mainland Area, Borderlines Length, and Coastline Length, 2006........... 3
Tabel 1.2 Luas Daratan dan Jumlah Pulau Menurut Provinsi, 2015 Table Total Area and Number of Islands by Province, 2015…………...............…. 4
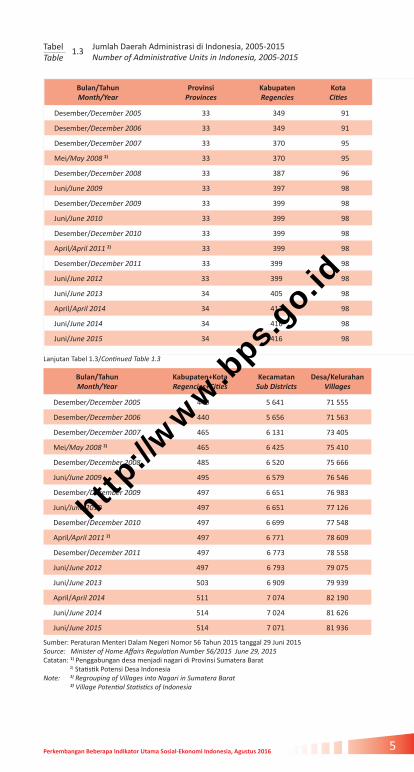
Tabel 1.3 Jumlah Daerah Administrasi di Indonesia, 2005-2015 Table Number of Administrative Units in Indonesia, 2005-2015…………….....…. 5
Tabel 1.4 Daerah Administrasi Menurut Provinsi di Indonesia, 2015 Number of Administrative Units by Province in Indonesia, 2015…….…... 6
Tabel 1.5 Banyaknya Wilayah Administrasi Pemerintahan Terendah Menurut Klasifikasi Pemerintahan, 2014
Number of the Lowest Governmental Administrative Regions by Governmental Classification, 2014.…………….............………………........ 7
2. PENDUDUK DAN KETENAGAKERJAAN POPULATION AND EMPLOYMENT
Tabel 2.1 Jumlah Penduduk Indonesia (ribu), 1930-2016 Table Number of Population in Indonesia (thousand), 1930-2016…………....... 11
Tabel 2.2 Penduduk Menurut Kelompok Umur dan Jenis Kelamin diTable Indonesia (ribu), 2016
Population by Age Group and Sex in Indonesia (thousand), 2016 .......... 12
Tabel 2.3 Penduduk Menurut Kelompok Umur dan Jenis Kelamin diTable Indonesia (ribu) , 2015
Population by Age Group and Sex in Indonesia (thousand), 2015 .......... 12
Tabel 2.4 Penduduk Menurut Provinsi 1971, 1980, 1990, 2000 dan 2010 (ribu)Table Population by Province 1971, 1980, 1990, 2000 and 2010 (thousand)……........................................................................……............ 13
Tabel 2.5 Jumlah Penduduk Menurut Provinsi, Jenis Kelamin, Rasio Jenis Kelamin, dan Laju Pertumbuhan Penduduk (ribu), 2010
Number of Population by Province, Sex, Sex Ratio, and Growth Rate of Population (thousand), 2010.............................................................. 14
Tabel 2.6 Penduduk Menurut Provinsi dan Jenis Kelamin (ribu), 2013 Population by Province and Sex (thousand), 2013................................... 15
Tabel 2.7 Penduduk Menurut Provinsi dan Jenis Kelamin (ribu), 2014 Population by Province and Sex (thousand), 2014................................... 16
Tabel 2.8 Penduduk Menurut Provinsi dan Jenis Kelamin (ribu), 2015 Population by Province and Sex (thousand),2015.................................... 17
Tabel 2.9 Penduduk Menurut Provinsi dan Jenis Kelamin (ribu), 2016 Population by Province and Sex (thousand), 2016................. .................. 18
Tabel 2.10 Persentase dan Kepadatan Penduduk Menurut Provinsi, 2010 dan 2015 Percentage and Population Density by Province, 2010 and 2015……....... 19
Table
Table
Table
Table
Table
Table
Table
http
://w
ww
.bps
.go.
id

viiPerkembangan Beberapa Indikator Utama Sosial-Ekonomi Indonesia, Agustus 2016
Tabel 2.11 Kabupaten/Kota dengan Jumlah Penduduk Paling Sedikit dan Paling Banyak di Tiap Provinsi, 2010
The Smallest and the Biggest Number of Population in Regencies/ Cities by Province, 2010…….......................................................…......….. 20
Tabel 2.12 Jumlah Rumah Tangga dan Rata-rata Banyaknya Anggota Rumah Tangga Menurut Provinsi, 2013, 2014 dan 2015
Number of Households and Average Household Size by Province, 2013, 2014 and 2015….……………………………………..............….... 21
Tabel 2.13 Perkiraan Penduduk Beberapa Negara (juta), 2012-2015 Estimated Population of Selected Countries (million), 2012-2015.......... 22
Tabel 2.14 Penduduk Usia 15 Tahun ke Atas Menurut Jenis Kegiatan Selama Seminggu yang Lalu (juta), 2014-2016 Population 15 Years of Age and Over by Type of Activity, During the Previous Week (million), 2014-2016……......................…….... 23
Tabel 2.15 Angkatan Kerja Menurut Golongan Umur dan Jenis Kelamin, 2015-2016 Economically Active Population by Age Group and Sex, 2015-2016….... 23
Tabel 2.16 Persentase Penduduk yang Bekerja Menurut Tingkat Pendidikan Tertinggi yang Ditamatkan, 2014-2016
Percentage of Population Worked by Educational Attainment, 2014-2016…………….................……….............…………….…………………......…... 24
Tabel 2.17 Pengangguran Terbuka Menurut Golongan Umur dan Jenis Kelamin, 2015-2016 Unemployment by Age Group and Sex, 2015-2016.................................... 24
Tabel 2.18 Pekerja Tak Penuh Menurut Golongan Umur dan Jenis Kelamin, 2015-2016 Worker Who Has Less Than Normal Working Hour by Age Group and Sex, 2015-2016............................................................ 25
Tabel 2.19 Penduduk Usia 15 Tahun ke Atas yang Bekerja Selama Seminggu yang Lalu Menurut Lapangan Pekerjaan Utama, 2015-2016 Population 15 Years of Age and Over Who Worked During the Previous Week by Main Industry, 2015-2016……….........………......…….. 25
Tabel 2.20 Penduduk Usia 15 Tahun ke Atas yang Bekerja Menurut Provinsi, 2014-2016 Population 15 Years of Age and Over Who are in Working by Province, 2014-2016….……………..…..............……………................................. 26
Tabel 2.21 Penduduk Usia 15 Tahun ke Atas yang Termasuk Pengangguran Terbuka Menurut Provinsi dan Jenis Kelamin, 2015-2016 Population 15 Years of Age and Over Who are in Unemployment by Province and Sex, 2015-2016...............……………………............................ 27
Tabel 2.22 Jumlah Pengangguran dan Tingkat Pengangguran Terbuka (TPT) Menurut Provinsi, 2014-2016 Number of Unemployment and Unemployment Rate by Province, 2014-2016………………………………………………………..................… 28
Tabel 2.23 Upah Minimum Provinsi (UMP) per Bulan (rupiah), 2014-2016 Minimum Wage per Month by Province (rupiahs), 2014-2016.................. 30
Tabel 2.24 Rata-rata Upah/Gaji/Pendapatan Buruh/Karyawan/Pegawai Sebulan Menurut Provinsi (rupiah), 2014-2016 Monthly Average of Wage/Salary/Income of Employee by Province (rupiahs), 2014-2016………….....…………….….............................. 31
Table
Table
Table
Table
Table
Table
Table
Table
Table
Table
Table
Table
Table
Table
http
://w
ww
.bps
.go.
id

Trends of Selected Socio-Economic Indicators of Indonesia, August 2016viii
3. SOSIAL SOCIAL AFFAIRS
Tabel 3.1 Persentase Wanita yang Pernah Kawin Menurut Umur Perkawinan Pertama, 2015 Percentage of Ever Married Women by Age of the First Marriage, 2015 .......................................................................................................... 35
Tabel 3.2 Persentase Perempuan Berumur 15-49 Tahun yang Pernah Kawin yang melahirkan anak dalam 2 tahun terakhir di Daerah Perkotaan dan Perdesaan menurut Provinsi dan Penolong Proses Kelahiran Terakhir, 2015 Percentage of Ever Married Female Aged 15-49 Years that
childbearing in the last 2 years in Urban and Rural Area by Province and Last Birth Attendant, 2015....………………………….........................…….… 36
Tabel 3.3 Persentase Perempuan Berumur 15-49 Tahun yang Pernah Kawin yang melahirkan anak dalam 2 tahun terakhir di Daerah Perkotaan menurut Provinsi dan Penolong Proses Kelahiran
Terakhir, 2015 Percentage of Ever Married Female Aged 15-49 Years that childbearing in the last 2 years in Urban Area by Province and
Last Birth Attendant, 2015.……...…………………………................................…… 38
Tabel 3.4 Persentase Perempuan Berumur 15-49 Tahun yang Pernah Kawin yang melahirkan anak dalam 2 tahun terakhir di Daerah Perdesaan menurut Provinsi dan Penolong Proses Kelahiran
Terakhir, 2015 Percentage of Ever Married Female Aged 15-49 Years that childbearing in the last 2 years in Rural Area by Province and
Last Birth Attendant, 2015.……...……………….....………................................… 40
Tabel 3.5 Angka Melek Huruf Penduduk Berusia 15 Tahun ke Atas Menurut Provinsi dan Jenis Kelamin (persen), 2014-2015 Adult Literacy Rate by Province and Sex (percent), 2014-2015…......…….… 42
Tabel 3.6 Rata-rata Lama Sekolah Penduduk Usia 15 Tahun ke Atas Menurut Provinsi dan Jenis Kelamin (tahun), 2014-2015 Mean Years of Schooling Population 15 Years of Age and Over by Province and Sex (years), 2014-2015..............................................….….. 43
Tabel 3.7 Angka Partisipasi Sekolah Menurut Provinsi dan Usia Sekolah (persen), 2014-2015 School Enrollment Ratio by Province and School Age (percent), 2014-2015……………................................................................. 44
Tabel 3.8 Estimasi Angka Harapan Hidup (tahun) Menurut Provinsi, 2011-2015
Live Expectancy at Birth (year) by Province, Result of Population 2011-2015............................................................................………….…….. 45
Tabel 3.9 Indeks Pembangunan Manusia Menurut Provinsi, 2011-2015 Human Development Index by Province, 2011-2015…….………...……....... 46
Tabel 3.10 Persentase Rumah Tangga dengan Sumber Air Minum Bersih yang Layak Menurut Provinsi, 2012-2015 Percentage of Households with Decent Clean Water as Source of Drinking Water by Province, 2012-2015......................……………………. 47
Tabel 3.11 Persentase Rumah Tangga Menurut Provinsi, Daerah Tempat dan Sumber Penerangan Utama. 2015 Percentage of Households by Province, Urban Rural Classification, and The Main Source of Lighting, 2015............................……………………. 48
Tabel 3.12 Persentase Rumah Tangga yang Memiliki Telepon dan Telepon Selular Menurut Provinsi, 2013-2015
Percentage of Households Possessing Telephone and Handphone by Province, 2013-2015....................................................……………………. 49
Table
Table
Table
Table
Table
Table
Table
Table
Table
Table
Table
Table
http
://w
ww
.bps
.go.
id

ixPerkembangan Beberapa Indikator Utama Sosial-Ekonomi Indonesia, Agustus 2016
Tabel 3.13 Persentase Rumah Tangga yang Memiliki Komputer/PC dan Laptop/Notebook Menurut Provinsi, 2013-2015 Percentage of Households Possessing Desktop and laptop/Notebook
Computer by Province, 2013-2015 ..................................……………………. 50
Tabel 3.14 Garis Kemiskinan, Jumlah, dan Persentase Penduduk Miskin, 1976-2016 Poverty Line, Number, and Percentage of Poor People, 1976-2016........ 51
Tabel 3.15 Jumlah dan Persentase Penduduk Miskin per Provinsi, 2014-2016 Number and Precentage of Poor People by Province,
2014-2016..........................................................................................….. 52
Tabel 3.16 Kabupaten/Kota dengan Persentase Penduduk Miskin Tertinggi dan Terendah di Tiap Provinsi, 2014 Regencies/Municipalities with Percentage of the Highest and the Lowest Percentage of Poor People in Each Province, 2014.................….. 53
Tabel 3.17 Garis Kemiskinan di Daerah Perkotaan Menurut Provinsi (rupiah/kapita/bulan), 2013-2016 Poverty Line in Urban Area by Province (rupiahs/capita/month), 2013-2016………………………..……………............... 54
Tabel 3.18 Garis Kemiskinan di Daerah Perdesaan Menurut Provinsi (rupiah/kapita/bulan), 2013-2016 Poverty Line in Rural Area by Province (rupiahs/capita/month), 2013-2016……………………………………................. 55
Tabel 3.19 Indeks Kedalaman Kemiskinan dan Indeks Keparahan Kemiskinan Menurut Daerah, 2000-2016 Poverty Gap Index and Poverty Severity Index by Region, 2000-2016………………………..................................................... 56
Tabel 3.20 Gini Ratio Menurut Provinsi, 2011-2015 Gini Ratio by Province, 2011-2015......................…………....……..…………... 57
4. PENGELUARAN KONSUMSI CONSUMPTION EXPENDITURE Tabel 4.1 Rata-rata Pengeluaran per Kapita Sebulan Menurut Kelompok Barang (rupiah), 2013-2015 Monthly Average Expenditure per Capita by Commodity Group (rupiahs), 2013-2015 …………………………….................................... 61
Tabel 4.2 Rata-rata Konsumsi per Kapita Seminggu Beberapa Macam Bahan Makanan Penting Indonesia (rupiah), 2013-2015 Weekly Average Consumption per Capita of Several Food Items in Indonesia (rupiahs), 2013-2015 ..………………..................................….. 62
Tabel 4.3 Rata-rata Pengeluaran per Kapita Sebulan Menurut Provinsi (rupiah), 2014-2015 Monthly Average Expenditure per Capita by Province (rupiahs),
2014-2015....................................................................................…….…. 63
Tabel 4.4 Rata-rata Konsumsi Protein (gram) per Kapita per Hari Menurut Provinsi dan Tipe Daerah, 2015
Average Daily per Capita Consumption of Protein (grams) by Province and Type of Area, 2015.....….…………………..............…………… 64
Tabel 4.5 Rata-rata Konsumsi Kalori (kkal) per Kapita per Hari Menurut Provinsi dan Tipe Daerah, 2015
Average Daily per Capita Consumption of Calories (kcal) by Province and Type of Area, 2015....................................................... 65
Table
Table
Table
Table
Table
Table
Table
Table
Table
Table
Table
Table
Table
http
://w
ww
.bps
.go.
id

Trends of Selected Socio-Economic Indicators of Indonesia, August 2016x
5. PERTANIAN AGRICULTURE Tabel 5.1 Perkembangan Luas Panen, Produktivitas, dan Produksi Padi Table Menurut Subround, 2013-2015 Harvested Area, Productivity, and Production of Paddy by Subround, 2013-2015...........…………………………………………………..……... 69
Tabel 5.2 Produksi Padi Menurut Provinsi (ton), 2012-2015 Table Production of Paddy by Province (tons), 2012-2015……………………..…….. 70
Tabel 5.3 Perkembangan Luas Panen, Produktivitas, dan Produksi JagungTable Menurut Subround, 2013-2015 Harvested Area, Productivity, and Production of Maize by Subround, 2013-2015...........……………….………………...…………...………... 71
Tabel 5.4 Produksi Jagung Menurut Provinsi (ton), 2012-2015 Table Production of Maize by Province (tons), 2012-2015…………………..……….. 72
Tabel 5.5 Perkembangan Luas Panen, Produktivitas, dan Produksi KedelaiTable Menurut Subround, 2013-2015 Harvested Area, Productivity, and Production of Soybean by Subround, 2013-2015……………………………………………………….…............ 73
Tabel 5.6 Produksi Kedelai Menurut Provinsi (ton), 2012-2015 Table Production of Soybean by Province (tons), 2012-2015…….…………..…..... 74
Tabel 5.7 Produksi Kelapa Sawit Menurut Provinsi (ton), 2013-2015 Production of Palm Oil by Province (tons), 2013-2015............................ 75
Tabel 5.8 Perkembangan Produksi Tanaman Sayuran Menurut Jenis Table Tanaman (ton), 2014-2015 Production and Growth of Vegetables Plant by Kind of Plant (tons), 2014-2015....................................…………………….…. 76
Tabel 5.9 Perkembangan Produksi Tanaman Buah-buahan Menurut Table Jenis Tanaman (ton), 2014-2015 Production and Growth of Fruit Plant by Kind of Plant (tons), 2014-2015….………................................……….…….... 77
Tabel 5.10 Perkembangan Produksi Tanaman Biofarmaka Menurut Table Jenis Tanaman (ton), 2014-2015 Production Growth of Medicinal Plant by Kind of Plant (tons), 2014-2015…………………..................................................................……….. 78
Tabel 5.11 Perkembangan Produksi Tanaman Hias Menurut Jenis Table Tanaman (tangkai), 2014-2015 Production Growth of Ornamental Plant by Kind of Plant (stalk), 2014-2015…………………..................................................................……….. 79
Tabel 5.12 Populasi Sapi Potong, Sapi Perah, dan Kerbau Menurut Table Provinsi, 2014-2015 Population of Beef Cattle. Dairy Cattle, and Buffalo by Province, 2014-2015...............................................................……….... 80Tabel 5.13 Produksi Daging Ternak Menurut Provinsi (ton), 2014-2015Table Meat Production by Province (tons), 2014-2015……..............………………. 81
Tabel 5.14 Produksi Ikan di Indonesia (ton), 1991-2014 Table Production of Fish in Indonesia (tons), 1991-2014...…………….....……….... 82
Tabel 5.15 Produksi Perikanan Tangkap di Indonesia (ton), 1991-2014Table Production of Fish Capture In Indonesia (tons), 1991-2014………............ 83
Tabel 5.16 Produksi Ikan Budidaya di Indonesia, 1991-2014 Production of Aquaculture Fisheries In Indonesia, 1991-2014…………..... 84
Tabel 5.17 Produksi Kayu Bulat Perusahaan Hak Pengusahaan Hutan (HPH) Menurut Provinsi (m3), 2010–2014
Production of Logs of Forest Concession Estate by Province (m3), 2010-2014..................................................................................………….. 87
Table
Table
http
://w
ww
.bps
.go.
id

xiPerkembangan Beberapa Indikator Utama Sosial-Ekonomi Indonesia, Agustus 2016
6. INDUSTRI MANUFAKTUR DAN KONSTRUKSI MANUFACTURING AND CONSTRUCTION
Tabel 6.1 Pertumbuhan Produksi Industri Manufaktur Besar dan Table Sedang Bulananan, 2012-2016 (2010=100) Monthly Production Growth of Large and Medium Manufacturing Industry, 2012-2016 (2010=100).........................……..... 91
Tabel 6.2 Indeks dan Pertumbuhan Produksi Industri Manufaktur Besar dan Table Sedang Triwulanan (2010=100), 2010-2015 Quaterly Production Indices and Growth of Large and Medium Manufacturing Industry (2010=100), 2010-2015……………..............……… 92
Tabel 6.3 Pertumbuhan Produksi Industri Manufaktur Besar dan Sedang Triwulanan Menurut KBLI 2 Dijit (persen), 2016 (2010=100) Quarterly Production Growth of Large and Medium Manufacturing Industry by 2 Digit ISIC (percent), 2016 (2010=100)................................ 93
Tabel 6.4 Pertumbuhan Produksi Industri Manufaktur Besar dan Sedang Table Tahunan Menurut KBLI 2 Dijit (persen), 2014-2015 Annually Production Growth of Large and Medium Manufacturing Industry by 2 Digit ISIC (percent), 2014-2015.....….................................. 94
Tabel 6.5 Pertumbuhan Produksi Industri Manufaktur Besar dan Sedang Table Triwulanan Tingkat Provinsi (persen), Triwulan I-Triwulan II 2016 Quarterly Production Growth of Large and Medium Manufacturing Industry by Province (percent),
Quarter I-Quarter II 2016........................................................................ 95
Tabel 6.6 Indeks dan Pertumbuhan Produksi Industri Manufaktur Mikro dan Table Kecil Triwulanan (2010=100), 2011-2015 Quaterly Production Indices and Growth of Micro and Small Manufacturing Industry (2010=100), 2011-2015……………...........……… 96
Tabel 6.7 Pertumbuhan Produksi Industri Manufaktur Mikro dan Kecil Table Tahunan Menurut KBLI 2 Dijit (persen), 2014-2015
Annually Production Growth of Micro and Small Manufacturing Industry by 2 Digit ISIC (percent), 2014-2015 ......................................... 97
Tabel 6.8 Pertumbuhan Produksi Industri Manufaktur Mikro dan Kecil Triwulanan (q to q) Menurut KBLI 2 Dijit (persen), Triwulan IV 2015-Triwulan I 2016 Quarterly Production Growth of Micro and Small Manufacturing Industry (q to q) by 2 Digit ISIC (percent), Quarter IV 2015-Quarter I 2016.............................................................. 98
Tabel 6.9 Pertumbuhan Produksi Industri Manufaktur Mikro dan Kecil Triwulanan (y on y) Menurut KBLI 2 Dijit (persen),
Triwulan I-Triwulan II 2016 Quarterly Production Growth of Micro and Small Manufacturing Industry Year on Year by 2 Digit ISIC (percent), Quarter I-Quarter II 2016 ....................................................................... 99Tabel 6.10 Pertumbuhan Produksi Industri Manufaktur Mikro dan Kecil Table Triwulanan Tingkat Provinsi (persen),
Triwulan IV 2015-Triwulan I 2016 Quarterly Production Growth of Micro and Small Manufacturing Industry by Province (percent),
Quarter IV 2015-Quarter I 2016.............................................................. 100
Tabel 6.11 Indeks Pekerja Tetap, Hari Orang, Balas Jasa, dan Upah serta Nilai Konstruksi yang Diselesaikan (2010=100),
TriwuIan I 2010-Triwulan I 2016 Indices of Permanen Workers, Mandays, Compesation, and Wages and Value of Construction Completed (2010=100)
Quarter I 2010-Quarter I 2016.............................................................. 101
Table
Table
Table
Table http
://w
ww
.bps
.go.
id

Trends of Selected Socio-Economic Indicators of Indonesia, August 2016xii
7. PERDAGANGAN LUAR NEGERI FOREIGN TRADE
Tabel 7.1 Neraca Perdagangan Barang Migas dan Non-migas (juta US$),Table Januari 2014-Juli 2016 Balance of Trade of Oil and Gas and Non-oil and Gas (million US$), January 2014-July 2016 ............................……..………..….. 105
Tabel 7.2 Nilai Ekspor Menurut Negara Tujuan Utama Table (Nilai FOB: juta US$), 2013-2016 Value of Exports by Major Country of Destination (FOB value: million US$), 2013-2016................………………....………......... 106
Tabel 7.3 Nilai Impor Menurut Negara Asal Utama Table (Nilai CIF: juta US$), 2013-2016 Value of Imports by Major Country of Origin (CIF value: million US$), 2013-2016 …………………………....……...........…….. 107
Tabel 7.4 Ekspor Migas dan Beberapa Produk Unggulan Non-migas, Table 2014-2016 Exports of Oil and Gas, and Main Product of Non-oil and Gas, 2014-2016..........................................................................................….. 108
Tabel 7.5 Impor Barang Modal dan Beberapa Komoditi, 2013-2016Table Imports of Capitals Goods and Commodities, 2013-2016....................... 109
Tabel 7.6 Ekspor Bulanan Beberapa Golongan Barang Non-migas (juta US$),Table Januari 2014-Juli 2016 Monthly Exports Value by Non-oil and Gas Commodity Group (million US$), January 2014-July 2016.................................................... 110
Tabel 7.7 Impor Bulanan Beberapa Golongan Barang (juta US$), Table Januari 2014-Juli 2016 Monthly Imports Value Commodity Group (million US$), January 2014-July 2016........................................................................... 111
Tabel 7.8 Ekspor-Impor Beras Triwulan I/2011-Triwulan II/2016 Table Export-Import Rice Quarter I/2011-Quarter II/2016............................... 112
Tabel 7.9 Ringkasan Ekspor Nonmigas Bulanan Indonesia (juta US$), Table Januari 2014-Juli 2016 Summary of Indonesian Monthly Non-oil and Gas Exports (million US$), January 2014-July 2016.................................................... 113
8. PARIWISATA DAN TRANSPORTASI TOURISM AND TRANSPORTATION
Tabel 8.1 Jumlah Wisatawan Mancanegara Menurut Kebangsaan, Jumlah Akomodasi, Kamar, Tempat Tidur, dan Tingkat Hunian Hotel, 2012-2015
Number of Foreign Tourist by Nationality, Number of Accommodations, Rooms, Beds, and Room Occupancy, 2012-2015....... 117
Tabel 8.2 Jumlah Wisatawan Mancanegara Menurut Pintu Masuk, Maret-Juni 2016
Number of Foreign Visitors Arrivals by Port of Entry, March-June 2016....................................................................…..…........ 118
Tabel 8.3 Tingkat Penghunian Kamar (TPK) Hotel Berbintang (persen) di 27 Provinsi di Indonesia (persen), Maret-Juni 2016 Room Occupancy Rate of Classified Hotel (percent) in 27 Province,
(percent), March-June 2016...............................…...……...................…... 119
Table
Table
Table
Table
http
://w
ww
.bps
.go.
id
xiiiPerkembangan Beberapa Indikator Utama Sosial-Ekonomi Indonesia, Agustus 2016
Tabel 8.4 Rata-rata Lama Menginap Tamu Asing dan Indonesia Pada Hotel Berbintang (hari) di 27 Provinsi di Indonesia, Maret-Juni 2016
Average Length of Stay of Foreign and Domestic Guests at Classified Hotels (days) in 27 Province, March-June 2016..................................... 120
Tabel 8.5 Tingkat Penghunian Kamar (TPK) Hotel Berbintang (persen) di Table 27 Provinsi Menurut Klasifikasi Bintang (persen),
Maret-Juni 2016 Room Occupancy Rate of Classified Hotels (percent) in 27 Provinces by Hotel Classification (percent), March-June 2016................................ 121
Tabel 8.6 Rata-rata Lama Menginap Tamu Asing dan Indonesia Pada Table Hotel Berbintang (hari) di 20 Provinsi Menurut Klasifikasi Bintang, September 2015-April 2016 Average Length of Stay of Foreign and Domestic Guests at Classified
Hotels (days) in 20 Province by Hotel Classification, September 2015-April 2016.......……..................................…..........…….... 121
Tabel 8.7 Banyaknya Usaha, Kamar, dan Tempat Tidur Dirinci Table Menurut Klasifikasi Akomodasi, 2015
Number of Establisments, Rooms, and Beds by Accommodation Classification, 2015…………………………......…………..……….........……..…...... 122
Tabel 8.8 Rata-rata Pekerja per Usaha dan per Kamar, Serta Rata-rata Tamu Table per Hari Pada Usaha Akomodasi Dirinci Menurut Klasifikasi Akomodasi, 2015 Average Workers per Establisments and per Room, and Average Guests per Day of Accommodation Establisments by Accommodation Classification, 2015……….…………………………….………. 122
Tabel 8.9 Jumlah Penumpang Dalam Negeri Menurut Jenis Angkutan Table (ribu orang), Januari 2014-Juni 2016 Number of Domestic Passengers by Mode of Transportation (thousand persons), January 2014-June 2016................................…….. 123
Tabel 8.10 Jumlah Barang Dalam Negeri yang Diangkut Menurut Jenis Angkutan (ribu ton), Januari 2014-Juli 2016Number of Domestic Cargo by Mode of Transportation
(thousand tons), January 2014-July 2016.. ................…..………......…..... 124
Tabel 8.11 Jumlah Sepeda Motor Menurut Provinsi (unit) 2013-2015Table Number of Motorcycles by Province (units), 2013-2015..........……..…..... 125
9. KEUANGAN DAN HARGA-HARGA FINANCE AND PRICES
Tabel 9.1 Ringkasan Anggaran Pendapatan dan Belanja Negara (triliun rupiah),Table 2013-2016 Summary of State National Budget (trillion rupiahs), 2013-2016......…….…………………………………………………............................. 129
Tabel 9.2 Uang Beredar dan Perubahan Faktor-faktor yangTable Mempengaruhinya (miliar rupiah), 2011-2016 Money Supply and Its Change of Affecting Factors (billion rupiahs), 2011-2016............................................................................................... 130
Tabel 9.3 Perkembangan Harga Rata-rata Valuta Asing dan Harga Emas Table di Pasaran Jakarta (rupiah), Januari 2014-Juli 2016 Average Prices of Foreign Currencies and Gold In Jakarta Market
(rupiahs), January 2014-July 2016...................................................…….. 131
Tabel 9.4 Indeks Harga Konsumen (IHK) dan Laju Inflasi Bulanan, Januari 2013-Juli 2016
Consumer Price Index (CPI) and Monthly Inflation Rate, January 2013-July 2016...……................................................................. 132
Table
Table
Table
http
://w
ww
.bps
.go.
id

Trends of Selected Socio-Economic Indicators of Indonesia, August 2016xiv
Tabel 9.5 Laju Inflasi Tahun ke Tahun Gabungan, Januari 2013-Juli 2016 Table Composite Inflation Rate of Year on Year, January 2013-July 2016..........................................…...…………………...….. 132
Tabel 9.6 Inflasi Gabungan 82 Kota Menurut Kelompok Pengeluaran, Table April-Juli 2016 Composite Inflation of 82 Cities by Group of Expenditure, April-July 2016.................................................................................….....133
Tabel 9.7 Laju Inflasi Beberapa Negara, Maret-Juni 2016Table Inflation Rate For Several Countries,
March-June 2016.................................................................................... 134
Tabel 9.8 Harga Konsumen Beberapa Komoditas Pangan Bulanan (rupiah), Juli 2015-Juli 2016
Monthly Consumer Prices of Several Foods Items (rupiahs), July 2015-July 2016................................................................................. 135
Tabel 9.9 Rata-rata Harga Gabah di Tingkat Penggilingan Menurut KelompokTable Kualitas (rupiah/kg), Januari 2014-Juli 2016 Average Price of Paddy at Huller Level by Quality Group (rupiahs/kg), January 2014-July 2016............….......………........................136
Tabel 9.10 Rata-rata Harga Gabah di Tingkat Petani Menurut KelompokTable Kualitas (rupiah/kg), Januari 2014-Juli 2016 Average Price of Paddy at Farmer Level by Quality Group (rupiahs/kg), January 2014-July 2016....................…….…....................... 137
Tabel 9.11 Indeks Harga Perdagangan Besar Bulanan (2010=100), Table Desember 2015-Juli 2016 Monthly Wholesale Price Indices (2010=100), Desember 2015-Juli 2016........................................................................ 138
Tabel 9.12 Indeks Harga Perdagangan Besar Konstruksi (2010=100), Table Desember 2015-Juli 2016 Wholesale Price Indices for Construction (2010=100), Desember 2015-Juli 2016........................................................................ 139
Tabel 9.13 Nilai Tukar Petani Nasional Bulanan Menurut Sub Sektor (2012=100), April-Juli 2016
Monthly Farmers Terms of Trade by Sub Sector (2012=100), April-July 2016......................................................................................... 140
Tabel 9.14 Nilai Tukar Petani Nasional Bulanan di 33 Provinsi (2012=100), April-Juli 2016 Monthly Farmers Terms of Trade in 33 Provinces (2012=100), April-July 2016........................................................……....... 142
Tabel 9.15 Indeks Tendensi Bisnis Menurut Sektor, Triwulan II 2016Tabel Business Tendency Indices by Sector, Quarter II 2016........................….. 143
Tabel 9.16 Indeks Tendensi Konsumen Menurut Variabel Table Pembentuknya, Triwulan II/2015-Triwulan II/2016 Consumer Tendency Indices by Main Variables, Quarter II/2015-Quarter II/2016....................…….………………………....... . 143
10. PENDAPATAN NASIONAL DAN REGIONAL NATIONAL AND REGIONAL INCOME
Tabel 10.1 Produk Domestik Bruto Triwulanan Atas Dasar Harga Berlaku Menurut Lapangan Usaha (triliun rupiah),
Triwulan III 2015-Triwulan II 2016 Quarterly Gross Domestic Product at Current Market Prices by Industrial Origin (trillion rupiahs), Quarter III 2015-Quarter II 2016...................................................…....... 147
Table
Table
Table
Table
http
://w
ww
.bps
.go.
id

xvPerkembangan Beberapa Indikator Utama Sosial-Ekonomi Indonesia, Agustus 2016
Tabel 10.2 Produk Domestik Bruto Triwulanan Atas Dasar Harga Konstan 2010 Menurut Lapangan Usaha (triliun rupiah), Triwulan III 2015-Triwulan II 2016 Quarterly Gross Domestic Product at 2010 Constant Market Prices by Industrial Origin (trillion rupiahs), Quarter III 2015-Quarter II 2016...........................................................… 148
Tabel 10.3 Produk Domestik Bruto Triwulanan Atas Dasar Harga Berlaku Menurut Pengeluaran (triliun rupiah), Triwulan III 2015-Triwulan II 2016
Quarterly Gross Domestic Product at Current Market Prices by Type of Expenditure (trillion rupiahs), Quarter III 2015-Quarter II 2016..................................................………… 149
Tabel 10.4 Produk Domestik Bruto Triwulanan Atas Dasar Harga Konstan 2010 Menurut Pengeluaran (triliun rupiah),Triwulan III 2015-Triwulan II 2016
Quarterly Gross Domestic Product at 2010 Constant Market Prices by Type of Expenditure (trillion rupiahs), Quarter III 2015-Quarter II 2016..........................................................… 149
Tabel 10.5 Produk Domestik Bruto Atas Dasar Harga Berlaku Menurut Lapangan Usaha (miliar rupiah), 2013-2015
Gross Domestic Product at Current Market Prices by Industrial Origin (billion rupiahs), 2013-2015…………….……………..……. 150
Tabel 10.6 Produk Domestik Bruto Atas Dasar Harga Konstan 2010 Menurut Lapangan Usaha (miliar rupiah), 2013-2015 Gross Domestic Product at 2010 Constant Market Prices by Industrial Origin (billion rupiahs), 2013-2015…………….…….......………. 151
Tabel 10.7 Produk Domestik Bruto Atas Dasar Harga Berlaku Menurut Jenis Pengeluaran (miliar rupiah), 2013-2015 Gross Domestic Product at Current Market Prices by Type of Expenditure (billion rupiahs), 2013-2015........………..…….…… 152
Tabel 10.8 Produk Domestik Bruto Atas Dasar Harga Konstan 2010 Menurut Jenis Pengeluaran (miliar rupiah), 2013-2015 Gross Domestic Product at 2000 Constant Market Prices by Type of Expenditure (billion rupiahs), 2013-2015................…..….…… 152
Tabel 10.9 Laju Pertumbuhan Produk Domestik Bruto Menurut Lapangan Usaha (persen), Triwulan II/2016
Growth Rate of Gross Domestic Product by Industrial Origin (percent), Quarter II/2016........................…………….. 153
Tabel 10.10 Laju Pertumbuhan Komponen-komponen Produk Domestik Bruto Menurut Pengeluaran (persen), Triwulan II/2016 Growth Rate of Gross Domestic Product
by Type of Expenditure (percent), Quarter II/2016 .........…...........…...…. 154
Tabel 10.11 Produk Domestik Bruto, Pertumbuhan Ekonomi, dan Produk Domestik Bruto per Kapita, 1990-2015 Gross Domestic Product, Economic Growth, and per Capita Gross Domestic Product, 1990-2015…………..…………….… 155
Tabel 10.12 Produk Domestik Regional Bruto dan Peranan PDRB Provinsi Terhadap 33 Provinsi Atas Dasar Harga Berlaku, 2014-2015
Gross Regional Domestic Product and Provincial GRDP Share to 33 Province at Current Market Prices, 2014-2015................... 156
Tabel 10.13 Produk Domestik Regional Bruto dan Laju Pertumbuhan PDRB Provinsi Atas Dasar Harga Konstan 2010, 2014-2015 Gross Regional Domestic Product and Provincial GRDP Growth Rate at Constant Market Prices 2010, 2014-2015..….………….. 157
Tabel 10.14 Kabupaten/Kota dengan Produk Domestik Regional Bruto per Kapita Tertinggi dan Terendah di Tiap Provinsi (juta rupiah),
2014
Regencies/Municipalities with the Highest and the Lowest Gross Regional Domestic Product per Capita in Each Province (million rupiah), 2014........………......................................................... 158
Table
Table
Table
Table
Table
Table
Table
Table
Table
Table
Table
Table
Table
http
://w
ww
.bps
.go.
id

Trends of Selected Socio-Economic Indicators of Indonesia, August 2016xvi
Penjelasan UmumExplanatory Notes
Tanda-tanda, satuan-satuan dan singkatan lainnya yang digunakan dalam booklet ini adalah sebagai berikut:Symbols, measurement units, and acronyms which are used in this booklet, are as follows:
1. TANDA-TANDA/SYMBOLS
Data belum tersedia/Data is not available yet : (kosong/empty)Data tidak tersedia/Data is not available : –Data dapat diabaikan/Data is negligible : 0Tanda decimal/Decimal point : ,Angka sementara/Preliminary figures : *Angka sangat sementara/Very preliminary figures : **Angka sangat sangat sementara/Excessively preliminary figures : ***Angka Revisi/Revised Figures : r
2. SATUAN/UNITS
barel/barrel ............................................................ : 158,99 liter/liters =1/6,2898 m3
hektar (ha)/hectare (ha) ......................................... : 10 000 m2
kilometer (km)/kilometres (km) ............................. : 1 000 meter/meters (m)kuintal/quintal ........................................................ : 100 kgliter (untuk beras)/litre (for rice) ............................ : 0,80 kgMMSCF ................................................................... : 1/35,3 m3
metrik ton (m.ton)/metric ton (m. ton) .................. : 0,98421 long ton = 1 000 kgons/ounce ............................................................... : 100 gram/gramston/ton ................................................................... : 1 000 kgSatuan lain: buah, tangkai, butir, kaleng, batang, pohon, pulsa, ton kilometer (ton-km), jam, menit, persen (%).Other units: unit, stalk, piece, tin, pieces, tree, pulse, ton-kilometres(ton-km), hour, minute, percent (%).
Perbedaan angka di belakang koma disebabkan oleh pembulatan angka.The difference in decimal numbers is caused by rounding.ht
tp://w
ww
.bps
.go.
id

xviiPerkembangan Beberapa Indikator Utama Sosial-Ekonomi Indonesia, Agustus 2016
Penjelasan Teknis Indikator Utama Sosial-Ekonomi Indonesia
Booklet ini disusun dengan cara memilih sejumlah data dan informasi statistik penting yang telah diterbitkan oleh Badan Pusat Statistik RI dalam Publikasi Statistik Indonesia, Indikator Ekonomi, dan publikasi lainnya.
Untuk memudahkan pemanfaatan booklet ini, data dan informasi statistik tersebut dibagi ke dalam 10 bidang atau topik, yang kemudian diikuti dengan penjelasan istilah teknis yang ada di masing-masing bidang tersebut. Secara rinci pembagian dan uraian teknis tersebut diberikan berikut ini.
1. Keadaan Geografi meliputi: luas wilayah/provinsi dan jumlah daerah administrasi.2. Penduduk dan Ketenagakerjaan: data penduduk meliputi: jumlah, kepadatan, umur,
laju pertumbuhan, sedang data ketenagakerjaan meliputi: jumlah angkatan kerja, pengangguran, dan upah/gaji.
3. Sosial meliputi: data kelahiran, harapan hidup, balita, perkawinan, pendidikan, IPM, sumber air minum dan kemiskinan.
4. Pengeluaran Konsumsi meliputi: pengeluaran untuk konsumsi makanan dan bukan makanan.
5. Pertanian meliputi: luas panen dan produksi pertanian tanaman pangan, hortikultura, peternakan, perikanan dan kehutanan.
6. Industri Manufaktur dan Konstruksi meliputi: indeks produksi industri manufaktur besar dan sedang, dan konstruksi.
7. Perdagangan Luar Negeri meliputi: data ekspor menurut negara tujuan, komoditi, migas dan non-migas; impor menurut negara asal serta neraca perdagangan barang.
8. Pariwisata dan Transportasi meliputi: jumlah wisatawan menurut negara tempat tinggal, lama menginap dan tingkat penghunian kamar hotel, sedangkan data transportasi meliputi jumlah penumpang dan barang.
9. Keuangan dan Harga-harga meliputi: APBN, moneter, valuta asing, Indeks Harga Konsumen, Inflasi, Indeks Harga Perdagangan Besar, Nilai Tukar Petani, Indeks Tendensi Bisnis dan Indeks Tendensi Konsumen.
10. Pendapatan Nasional dan Regional meliputi: Produk Domestik Bruto, Produk Domestik Regional Bruto, dan pendapatan nasional per kapita.
Beberapa istilah teknis yang digunakan dalam booklet ini:
• Daerah administrasi adalah wilayah administrasi yang sudah memiliki dasar hukum yang sah menurut Departemen Dalam Negeri.
• Desa tepi laut adalah desa/kelurahan termasuk nagari atau lainnya yang memiliki wilayah yang berbatasan langsung dengan garis pantai/laut (atau merupakan desa pulau).
• Desa bukan tepi laut adalah desa/kelurahan termasuk nagari atau lainnya yang tidak berbatasan langsung dengan laut atau tidak mempunyai pesisir.
• Penduduk Indonesia adalah semua orang yang berdomisili di wilayah teritorial Republik Indonesia.
• Kepadatan Penduduk adalah jumlah penduduk di suatu daerah dibagi dengan luas daratan daerah tersebut, biasanya dinyatakan sebagai penduduk per km2.
• Laju pertumbuhan penduduk adalah rata-rata tahunan laju perubahan jumlah penduduk di suatu daerah selama periode waktu tertentu.
• Rasio jenis kelamin adalah perbandingan antara banyaknya penduduk laki-laki dengan banyaknya penduduk perempuan pada suatu daerah dan waktu tertentu. Biasanya dinyatakan dengan banyaknya penduduk laki-laki untuk 100 penduduk perempuan.
http
://w
ww
.bps
.go.
id

Trends of Selected Socio-Economic Indicators of Indonesia, August 2016xviii
• Rumah Tangga adalah seseorang atau sekelompok orang yang biasanya tinggal bersama dalam suatu bangunan serta pengelolaan makan dari satu dapur. Satu rumah tangga dapat terdiri dari hanya satu anggota rumah tangga. Yang dimaksud makan dari satu dapur adalah jika pengurusan kebutuhan sehari-harinya dikelola bersama-sama menjadi satu.
• Anggota Rumah Tangga adalah semua orang yang biasanya bertempat tinggal di suatu rumah tangga, baik yang berada di rumah pada waktu pencacahan maupun yang sementara tidak ada.
• Angkatan Kerja adalah penduduk usia 15 tahun ke atas yang bekerja atau sementara tidak bekerja, dan yang sedang mencari pekerjaan.
• Bekerja adalah melakukan pekerjaan dengan maksud memperoleh atau membantu memperoleh pendapatan atau keuntungan dan lamanya bekerja paling sedikit 1 jam secara terus menerus dalam seminggu yang lalu (termasuk pekerja keluarga tanpa upah yang membantu dalam suatu usaha/kegiatan ekonomi).
• Tingkat Partisipasi Angkatan Kerja adalah perbandingan antara jumlah angkatan kerja dengan jumlah penduduk usia kerja.
• Tingkat Pengangguran Terbuka adalah perbandingan antara jumlah pencari kerja dengan jumlah angkatan kerja.
• Pekerja Tidak Penuh (dahulu disebut setengah pengangguran) adalah mereka yang bekerja di bawah jam kerja normal (kurang dari 35 jam seminggu).
• Setengah penganggur adalah mereka yang bekerja di bawah jam kerja normal (kurang dari 35 jam seminggu), dan masih mencari pekerjaan atau masih bersedia menerima pekerjaan (dahulu disebut setengah pengangguran terpaksa).
• Pekerja paruh waktu adalah mereka yang bekerja di bawah jam kerja normal (kurang dari 35 jam seminggu), tetapi tidak mencari pekerjaan atau tidak bersedia menerima pekerjaan lain (dahulu disebut setengah pengangguran sukarela).
• Upah buruh adalah pendapatan yang diterima buruh dalam bentuk uang, yang mencakup bukan hanya komponen upah/gaji pokok, tetapi juga lembur dan tunjangn-tunjangan yang diterima secara rutin/regular (tunjangan transport, uang makan dan tunjangan lainnya sejauh diterima dalam bentuk uang), tidak termasuk Tunjangan Hari Raya (THR), tunjangan bersifat tahunan, kuartalan, tunjangan-tunjangan lain yang bersifat tidak rutin dan tunjangan dalam bentuk natura.
• Angka Melek Huruf Dewasa adalah perbandingan antara jumlah penduduk usia 15 tahun ke atas yang dapat membaca dan menulis, dengan jumlah penduduk usia 15 tahun ke atas.
• Angka Partisipasi Sekolah (APS) adalah perbandingan antara jumlah penduduk kelompok usia sekolah (7-12 th; 13-15 th; 16-18 th) yang bersekolah terhadap seluruh penduduk kelompok usia sekolah (7-12 th; 13-15 th; 16-18 th). Bersekolah adalah mereka yang perlu mengikuti pendidikan di jalur formal (SD/MI, SMP/MTs, SMA/SMK/MA atau PT) maupun non formal (paket A setara SD, paket B setara SMP atau paket C setara SMA).
• Angka Harapan Hidup pada waktu lahir adalah perkiraan lama hidup rata-rata penduduk dengan asumsi tidak ada perubahan pola mortalitas menurut umur.
• IPM adalah indeks komposit dari gabungan 4 (empat) indikator yaitu angka harapan hidup, angka melek huruf, rata-rata lama sekolah dan pengeluaran per kapita.
• Angka Koefisien Gini adalah ukuran kemerataan pendapatan yang dihitung berdasarkan kelas pendapatan. Angka koefisien Gini terletak antara 0 (nol) dan 1 (satu). Nol mencerminkan kemerataan sempurna dan satu menggambarkan ketidakmerataan sempurna.
• Garis kemiskinan adalah besarnya nilai rupiah pengeluaran per kapita setiap bulan untuk memenuhi kebutuhan dasar minimum makanan dan nonmakanan yang dibutuhkan oleh seorang individu untuk tetap berada pada kehidupan yang layak.
• Penduduk miskin adalah penduduk yang memiliki rata-rata pengeluaran per kapita per bulan dibawah Garis kemiskinan.
• Luas panen adalah luas tanaman sayuran, buah-buahan, biofarmaka, dan tanaman hias yang diambil hasilnya/dipanen pada periode pelaporan.
• Produksi adalah hasil menurut bentuk produk dari setiap tanaman sayuran, buah-buahan, biofarmaka dan tanaman hias yang diambil berdasarkan luas yang dipanen pada bulan/triwulan laporan.
http
://w
ww
.bps
.go.
id

xixPerkembangan Beberapa Indikator Utama Sosial-Ekonomi Indonesia, Agustus 2016
• Tanaman sayuran tahunan adalah tanaman sumber vitamin, garam mineral dan lain-lain yang dikonsumsi dari bagian tanaman yang berupa daun dan atau buah yang berumur lebih dari satu tahun.
• Tanaman buah-buahan tahunan adalah tanaman sumber vitamin, garam mineral dan lain-lain yang dikonsumsi dari bagian tanaman yang berupa buah dan merupakan tanaman tahunan.
• Tanaman Biofarmaka adalah tanaman yang bermanfaat untuk obat-obatan, kosmetik dan kesehatan yang dikonsumsi atau digunakan dari bagian-bagian tanaman seperti daun, batang, buah, umbi (rimpang) ataupun akar.
• Klasifikasi Baku Lapangan Usaha Indonesia (KBLI) adalah klasifikasi lapangan usaha yang digunakan untuk mengelompokkan berbagai kegiatan ekonomi ke dalam lapangan usaha baik 2, 3 dan 5 digit
• (q to q) adalah pertumbuhan atas dasar harga konstan pada suatu triwulan dibandingkan dengan triwulan sebelumnya.
• (y on y) adalah pertumbuhan atas dasar harga konstan pada suatu triwulan dalam tahun tertentu dibandingkan dengan triwulan yang sama di tahun sebelumnya.
• Negara utama adalah Negara yang mempunyai nilai ekspor/impor terbesar.• Nilai FOB adalah nilai barang ekspor tanpa asuransi dan angkutan.• Nilai CIF adalah nilai barang impor termasuk asuransi dan angkutan.• Wisatawan mancanegara adalah setiap pengunjung yang mengunjungi suatu
Negara di luar tempat tinggalnya, didorong oleh satu atau beberapa keperluan tanpa bermaksud memperoleh penghasilan di tempat yang dikunjungi dan lamanya kunjungan tersebut tidak lebih dari satu tahun (12 bulan).
• Akomodasi adalah suatu usaha yang menggunakan suatu bangunan atau sebagian bangunan yang disediakan secara khusus, dan setiap orang dapat menginap, makan serta memperoleh pelayanan dan fasilitas lainnya dengan pembayaran. Akomodasi dibedakan antara hotel dan akomodasi lainnya. Ciri khusus dari hotel adalah mempunyai restoran yang berada di bawah manajemen hotel tersebut.
• Hotel berbintang yaitu hotel yang telah memenuhi persyaratan yang telah ditentukan seperti persyaratan fisik, bentuk pelayanan yang diberikan, kualifikasi tenaga kerja, jumlah kamar dan lainnya.
• Hotel tidak berbintang yaitu hotel yang tidak memenuhi persyaratan yang telah ditentukan.
• Tingkat Penghunian Kamar (TPK) hotel adalah persentase banyaknya malam kamar yang dihuni terhadap banyaknya malam kamar yang tersedia.
• Rata-rata lamanya tamu menginap adalah hasil bagi antara banyaknya malam tempat tidur yang terpakai dengan banyaknya tamu yang menginap di hotel dan akomodasi lainnya.
• Uang Beredar adalah uang yang beredar di luar Bank Indonesia, Bank-Bank Pencipta Uang Giral dan Kantor Bendahara Negara.
• (M1) Uang beredar dalam arti sempit adalah kewajiban sistem moneter yang terdiri atas uang kartal dan uang giral.
• (M2) Uang beredar dalam arti luas atau likuiditas perekonomian adalah kewajiban sistem moneter yang terdiri atas M1 dan uang kuasi.
• Uang Kartal terdiri atas uang kertas dan uang logam yang berlaku, tidak termasuk uang kas pada KPKN dan bank umum.
• Uang Giral terdiri atas rekening giro, kiriman uang, simpanan berjangka dan tabungan dalam rupiah yang sudah jatuh waktu, yang seluruhnya merupakan simpanan penduduk dalam rupiah pada sistem moneter.
• Uang Kuasi terdiri atas simpanan berjangka dan tabungan penduduk pada bank umum, baik dalam rupiah maupun valuta asing.
• Indeks Harga Konsumen adalah angka/indeks yang menunjukkan perbandingan relatif antara tingkat harga (konsumen/eceran) pada saat bulan survei dan harga tersebut pada bulan sebelumnya.
• Inflasi adalah indikator yang dapat memberikan informasi tentang dinamika perkembangan harga barang dan jasa yang dikonsumsi masyarakat.
http
://w
ww
.bps
.go.
id
Trends of Selected Socio-Economic Indicators of Indonesia, August 2016xx
• Indeks Harga Perdagangan Besar adalah angka indeks yang menggambarkan besarnya perubahan harga pada tingkat harga perdagangan besar/harga grosir dari komoditas-komoditas yang diperdagangkan di suatu negara/daerah. Komoditas tersebut merupakan produksi dalam negeri yang dipasarkan di dalam negeri ataupun diekspor dan komoditas yang diimpor.
• Nilai Tukar Petani adalah perbandingan antara indeks harga yang diterima petani dengan indeks harga yang dibayar petani yang dinyatakan dalam persentase.
• Indeks Tendensi Bisnis merupakan salah satu indikator yang dapat memberikan informasi dini mengenai keadaan bisnis dan perekonomian dalam jangka pendek. Dalam Survei Tendensi Bisnis yang ditanyakan adalah perkembangan dunia bisnis secara umum dalam tiga bulan bersangkutan dibanding tiga bulan sebelumnya dan prospeknya untuk tiga bulan mendatang.
• Indeks Tendensi Konsumen bertujuan untuk memperoleh gambaran mengenai situasi bisnis dan perekonomian secara umum menurut pendapat konsumen, yang didasarkan pada daya beli konsumen dan juga pada persepsi konsumen mengenai kondisi bisnis dan perekonomian.
• Produk Domestik Bruto adalah satu indikator penting untuk mengetahui kondisi ekonomi di suatu negara dalam suatu periode tertentu.
• Produk Domestik Bruto Perkapita adalah Produk Domestik Bruto dibagi dengan penduduk pertengahan tahun.
• Harga Berlaku adalah nilai tambah barang dan jasa yang dihitung menggunakan harga yang berlaku pada setiap tahun.
• Harga Konstan adalah nilai tambah barang dan jasa yang dihitung menggunakan harga yang berlaku pada satu tahun tertentu sebagai tahun dasar.
• Pengeluaran konsumsi rumah tangga mencakup berbagai pengeluaran konsumsi akhir rumah tangga atas barang dan jasa untuk memenuhi kebutuhan individu ataupun kelompok secara langsung. Pengeluaran rumah tangga di sini mencakup pembelian untuk makanan dan bukan makanan (barang dan jasa) di dalam negeri maupun di luar negeri. Termasuk pula di sini pengeluaran lembaga nirlaba yang tujuan usahanya adalah untuk melayani keperluan rumah tangga.
• Pengeluaran konsumsi pemerintah mencakup pengeluaran pemerintah untuk belanja pegawai, penyusutan maupun belanja barang (termasuk biaya perjalanan, pemeliharaan dan pengeluaran rutin lainnya), baik yang dilakukan oleh pemerintah pusat maupun pemerintah daerah.
• Pembentukan Modal Tetap Bruto mencakup pengadaan, pembuatan dan pembelian barang modal. Barang modal dimaksud adalah barangbarang yang digunakan untuk proses produksi, tahan lama atau yang mempunyai umur pemakaian lebih dari satu tahun seperti bangunan, mesinmesin dan alat angkutan. Termasuk pula di sini perbaikan besar (berat) yang sifatnya memperpanjang umur atau mengubah bentuk atau kapasitas barang modal tersebut. Pengeluaran barang modal untuk keperluan militer tidak dicakup di sini tetapi digolongkan sebagai konsumsi pemerintah.
• Ekspor barang dan jasa merupakan transaksi perdagangan barang dan jasa dari penduduk (residen) ke bukan penduduk (non-residen).
• Impor barang dan jasa adalah transaksi perdagangan dari bukan penduduk ke penduduk. Ekspor atau impor barang terjadi pada saat terjadi perubahan hak kepemilikan barang antara penduduk dengan bukan penduduk (dengan atau tanpa perpindahan fisik barang tersebut).
• Laju pertumbuhan Produk Domestik Bruto diperoleh dari perhitungan PDB atas dasar harga konstan. Diperoleh dengan cara mengurangi nilai PDB pada tahun ke-n terhadap nilai pada tahun ke n-1 (tahun sebelumnya), dibagi dengan nilai pada tahun ke n-1, kemudian dikalikan dengan 100 persen. Laju pertumbuhan menunjukkan perkembangan agregat pendapatan dari satu waktu tertentu terhadap waktu sebelumnya.
http
://w
ww
.bps
.go.
id

xxiPerkembangan Beberapa Indikator Utama Sosial-Ekonomi Indonesia, Agustus 2016
Technical Explanation of Selected Socio-Economic Indicators of Indonesia
This booklet is arranged by choosing some statistical data and information which have been published by Statistics Indonesia (Badan Pusat Statistik) in Statistical Yearbook of Indonesia, Economic Indicators, and other publications.
To help the users, the statistical data and information are grouped into 10 categories and then followed by technical explanation of the definitions and glossaries used in each category. The catagories are as followed.
1. Geographical Situation includes: number of administrative units, and total area province.
2. Population and Man Power: Data on population includes: population density, population by age group, population growth rate. Data on labor force includes: number of unemployment, wages/salaries, and minimum standard of living.
3. Social includes: birth rate, live expectancy, children under-five years, education, human development index, source of drinking water, and poverty.
4. Expenditures includes: food and non-food expenditures.5. Agriculture includes: harvested area and agricultural production of food crops,
horticulture, livestock, fishery and forestry.6. Manufacturing and Construction include: Production Indices of large and medium
manufacturing and construction.7. Foreign Trade includes: exports by country of destination, by commodities, oil and
non-oil exports, imports by country of origin, and balance of trade.8. Tourism and Transportation: Data on tourism include: number of tourist by country
of residence, length of stay, room occupancy rate; data on transportation includes: number of passengers and goods.
9. Finance and Prices include: government budget expenditure, monetary, foreign currencies, consumer price indices, inflation, wholesale price indices, farmer’s terms of trade, consumer tendency index and business tendency index.
10. National and Regional Income include: Gross Domestic Product, Gross Regional Domestic Product, and per capita national income.
Some concepts and definitions used in this booklet:
• Administrative area is an area, which legalized by Ministry of Home Affairs.• Village coastal/waterfront is the village including nagari or the other has area
immediately adjacent to the shoreline/sea (or a village of the island).• Non coastal village is the village including nagari, or other non-adjacen directly by
the sea or have no coast.• Indonesian population are all residents of the entire territory of Republic of
Indonesia.• Population density is average number of persons per square kilometer.• Population growth rate is the rate at which a population is increasing (or decreasing)
in a given year and expressed as a percentage of the base population.• Sex ratio is the ratio of the number of males to the number of females in a given area
and time, usually expressed as the number of males for every 100 females.
http
://w
ww
.bps
.go.
id
Trends of Selected Socio-Economic Indicators of Indonesia, August 2016xxii
• Household is a group of person who usually live together in a building or housing unit who make common provision for food and other essentials of living. One household could consist of only one household member. Common provision for food means one organizing daily needs for all of household members.
• Household Member is a person who usually lives in a household regardless of their location at the time of enumeration.
• Labor force or economically active is population aged 15 years and over who were working, or have a job but were temporarily absent from work, and those who were looking for work.
• The concept of working means activity intended to earn income by doing work or helping to do work at least one hour continuously during the reference week (including unpaid family worker/s for any economic activity).
• Labor force participation rate is labor force as a percentage of the working age population.
• Open unemployment rate is unemployment as a percentage of labor force.• Worker who has Less than normal working hours (it’s called underemployment) is
a person who worked under the normal working hours (less than 35 hours a week).• Underemployment is a person who worked under the normal working hours (less
than 35 hours a week), and is still looking for a job or available for work (it’s called involuntary underemployment).
• Part-time worker is a person who worked under the normal working hours (less than 35 hours a week), but he is not looking for a job or unavailable for work (it’s called voluntary underemployment).
• Wage/Salary is the income earned by labour covering not only all kinds ofrenumeration received regularly in monetary terms but also additional cash and other incentives (such as for transportation, lunch, and other incentives in cash) excluding regular bonuses, such as incentives for major religious festival days “Lebaran”, and other incentives at the end of the year, quarterly incentives and other incentives in the form of nature.
• Literacy Rate is proportion of population aged 15 years and over who are able to read and write in Roman alphabetical or others.
• School Enrollment is the ratio between the total population of school age group (7-12 year; 13-15 year; 16-18 year) who attending school with population of school age group (7-12 year; 13-15 year; 16-18 year). Attending school is someone who is currently attending primary, secondary or tertiary education package A, package B or package C.
• Life Expectancy is average number of years that a member of a “cohort” of births would be expected to live if the cohort were subject to the mortality conditions expressed by a particular set of “age-specific mortality rates”.
• Human Development Index (HDI) is a composite index of four indicators: life expectancy rate, literacy rate, average length of school participation, and per capita expenditures.
• Gini Index is the measure of income distribution calculated based on incomeclasses. Gini ratio lies between null (zero), expresses ‘perfect equality’ and one (1), which expresses ‘perfect inequality’.
• Poverty line is the value of per capita expenditure per month to provide basic food and non-food needs, needed by a person to stay in a proper living condition.
• Poor people is a person whose expenditure per capita per month is below the poverty line.
• Harvested area is area which vegetable, fruit, medicinal, and ornamental plant of crop harvested during the period of report.
• Production is the standard production quantity form of vegetable, fruit, medicinal and ornamental plant based on harvested area reported month/quarterly.
http
://w
ww
.bps
.go.
id

xxiiiPerkembangan Beberapa Indikator Utama Sosial-Ekonomi Indonesia, Agustus 2016
• Annual vegetable plants are plants which are the sources of vitamin, contained mineral salt, etc, consumed from the part of plant in the form of vegetable and more than one year of age.
• Annual fruit plants are plants which are the sources of vitamin, contained mineral salt, etc, consumed from the part of plant in the form of fruits and more than one year of age.
• Medicinal plants are plants which are usefull for medicine. It is consumed from parts of the plants such as leaf, flower, fruit, tubber and root.
• Klasifikasi Baku Lapangan Usaha Indonesia (KBLI) is classification of economic activities base on the International Standard Industrial Classification (ISIC) rev.3 that has been modified according to the local condition in Indonesia.
• (q to q) quarter to quarter is growth at constant prices on a quarter compared to the previous quarter.
• (y on y) year on year is growth at constant price on a quarter in a given year compared to same quarter a year earlier.
• Major country is country which recorded the biggest of export or import value.• Freight on Board (FOB) value is the value of exports commodity excluded insurance
and transportation costs.• Cost, Insurance and Fright (CIF) value is the value of imports commodity included
insurance and transportation costs.• A foreign visitor or foreign tourist is any person visiting a country other than his usual
place of residence for any reason other than for earning income in the country visited, and the length of stay is no more than one year (12 months).
• An accommodation is an establishment using a building or a part of a building, prepared commercially for any person to stay, eat and obtain service as well as other facilities.
• A classified hotel is an accommodation which meets specified standards regarding physical requirements, services provided, manpower qualifications, number of rooms available, etc.
• A non-classified hotel is an accommodation which has not met the requirements previously mentioned.
• Room Occupancy Rate is the number of roomnights occupied divided by the number of roomnights available, multiplied by 100 percent.
• Average length of stay is the number of bed-nights used divided by the number of guests staying at the accommodation.
• Money Supply is money that circulates outside of the Central Bank, Deposit Money Banks, and Government Payment office.
• (M1) The ”money supply” in specific term is liabilities of the monetary system consisting of currency and demand deposits.
• (M2) The ”money supply” in a broader term or “domestic liquidity”is liabilities of the monetary system consisting M1 and quasi money.
• Currency consists of legal bank notes and coins excluding cash in the government treasury offices and commercial banks.
• Demand deposit comprises current accounts, transfer,and matured time and savings deposits in rupiah, held by residents in the monetary system.
• Quasi money consists of time and savings deposits in rupiah and foreign currency held by residents in commercial banks.
• The Consumer Price Index is an index that shows relative ratio between price level (consumer/retail) on the survey’s month and price level on the previous month.
• Inflation is an indicator that gives information about fluctuation of general price level of goods and services consumed by people.
http
://w
ww
.bps
.go.
id

Trends of Selected Socio-Economic Indicators of Indonesia, August 2016xxiv
• The Wholesale Price Indices are indices that describe the change of price at the wholesale price level of the commodities sold in a country or region. Those commodities are produced domestically or imported and traded domestically or exported.
• The Farmer terms of Trade is computed as the ratio of the index of prices received by farmers (IT) and the index of prices paid by farmers (IB).
• Business Tendency Index is one indicator that can provide early information about the state of business and the economy in the short term. In the Business Tendency Survey in question is the development of the business world in general in the corresponding three months earlier than three months and the prospect of the next three months.
• Consumer Tendency Index aims to get a picture of a business situation and general economic consumer opinion, based on consumer purchasing power and also on perceptions about business conditions and the economy.
• Gross Domestic Product (GDP) is an important economic indicator to show the economic condition of a country at certain period in time. GDP is defined as the total value added of all production units in a certain country for a certain period (usually one year).
• Per Capita Gross Domestic Product is GDP divided by the total mid-year population.
• GDP at current prices shows the value added of goods and services at current prices for a certain year.
• GDP at constant prices shows the value added of goods and services calculated at fix prices of a base year.
• Household consumption expenditures consist of expenditures incurred by households, which are used for both individual or collective needs. Household consumptions are classified into food and non-food (goods and services) expenditures that may take place in domestic or abroad. Expenditures here include expenditures of Nonprofit institutions serving households.
• Government consumption expenditures consist of expenditures for the compensation of employees, capital consumption (depreciation) and intermediate consumption (including travel allowance, maintenance cost, and other routine expenditures) spent by either central or local government.
• Gross fixed capital formation consists of resident producers acquisitions, less disposals, of fixed assets during a given period plus certain addition to the value of non produced assets done by the productive activity of producer or institutional units. Fixed assets are tangible and intangible assets produced as outputs from processes of production that are used by themselves and repeatedly, or continuously in process of production for more than one year. The expenditure for military purposes are classified as government expenditure not as capital formation.
• Exports of goods and services consist of transactions of goods and services from residents to non-residents.
• Imports of goods and services consist of transaction of goods and services from non-residents to residents. Exports and imports of goods occur when there are changes in ownership of goods between residents and nonresidents (with or without physical movements of goods across frontiers).
• Growth rate of Gross Domestic Product (GDP) is derived from GDP at constant market prices. It is obtained by subtracting the value of GDP year n with the value of GDP year n-1, divided by the value of GDP year n-1 then multiplied by 100 percent. The growth rate of GDP explains the income growth during the given period.
http
://w
ww
.bps
.go.
id

xxvPerkembangan Beberapa Indikator Utama Sosial-Ekonomi Indonesia, Agustus 2016
11
12
1314
15 1716
18
31
3236
33
3435
5152
53
91
81
8271
75
72
7374
64
63
62
61
76
94
19
21
Peta
Indo
nesi
aM
ap o
f Ind
ones
ia
65
11 A
ceh
12 S
umat
era
Uta
ra13
Sum
ater
a Ba
rat
14 R
iau
15 Ja
mbi
16 S
umat
era
Sela
tan
17 B
engk
ulu
18 L
ampu
ng19
Kep
ulau
an B
angk
a Be
litun
g21
Kep
ulau
an R
iau
31 D
KI Ja
kart
a32
Jaw
a Ba
rat
33 Ja
wa
Teng
ah34
DI Y
ogya
kart
a35
Jaw
a Ti
mur
36 B
ante
n51
Bal
i52
Nus
a Te
ngga
ra B
arat
53 N
usa
Teng
gara
Tim
ur61
Kal
iman
tan
Bara
t62
Kal
iman
tan
Teng
ah63
Kal
iman
tan
Sela
tan
64 K
alim
anta
n Ti
mur
65 K
alim
anta
n U
tara
71 S
ulaw
esi u
tara
72 S
ulaw
esi T
enga
h73
Sul
awes
i Sel
atan
74 S
ulaw
esi T
engg
ara
75 G
oron
talo
76 S
ulaw
esi B
arat
81 M
aluk
u82
Mal
uku
Uta
ra91
Pap
ua B
arat
94 P
apua
http
://w
ww
.bps
.go.
id

http
://w
ww
.bps
.go.
id
1KEADAAN GEOGRAFI
GEOGRAPHICAL SITUATION
http://odesboges.blogspot.co.id/
http
://w
ww
.bps
.go.
id

http
://w
ww
.bps
.go.
id

3Perkembangan Beberapa Indikator Utama Sosial-Ekonomi Indonesia, Agustus 2016
Luas Wilayah, Panjang Perbatasan, dan Panjang Garis Pantai, 2006 Mainland Area, Borderlines Length, and Coastline Length, 2006
TabelTable
1.1
Sumber: Badan Informasi Geospasial Source: Geospatial Information Agency
Jenis Data/Type of Data Jumlah/Total
1. Luas Daratan/Land (km2) 1 910 931,32
2. Luas Pulau Besar/Big Islands (km2)
a. Bali-NTB-NTT 73 070,48
b. Jawa/Java 129 438,28
c. Kalimantan 544 150,07
d. Maluku-Papua 494 956,85
e. Sulawesi 188 522,36
f. Sumatera 480 793,28
3. Luas Laut/Sea (km2)
a. Laut Teritorial/Territorial Sea 284 210,90
b. Zone Ekonomi Eksklusif 2 981 211,00
Exclusive Economic Zone
c. Laut 12 Mil/12 Miles Sea 279 322,00
4. Panjang Perbatasan Dengan Negara Lain (km)
Borderlines With Other Countries (km)
a. Papua-Papua Nugini di Papua 820,00
Papua-Papua Nugini in Papua
b. Kalimantan-Malaysia di Kalimantan 2 004,00
Kalimantan-Malaysia in Kalimantan
c. NTT-Timor Leste di Timor 269,00
NTT-Timor Leste in Timor
5. Panjang Garis Pantai/Coastline Length (km) 104 000,00
http
://w
ww
.bps
.go.
id

Trends of Selected Socio-Economic Indicators of Indonesia, August 20164
Luas Daratan dan jumlah Pulau Menurut Provinsi, 2015Total Area and Number of Islands by Province, 2015
TabelTable
1.2
Sumber: Direktorat Jenderal Pemerintahan Umum, Kementerian Dalam NegeriSource: Directorate General of Regional Authority, Ministry of Home Affairs
Provinsi/ProvinceLuas Daratan (km2) 1)
Land Area (km2)
Persentase Terhadap Luas Indonesia Percentage to
Indonesia
Jumlah Pulau 2)
Number of Islands
Aceh 57 956,00 3,03 663
Sumatera Utara 72 981,23 3,82 419
Sumatera Barat 42 012,89 2,20 391
Riau 87 023,66 4,55 139
Jambi 50 058,16 2,62 19
Sumatera Selatan 91 592,43 4,79 53
Bengkulu 19 919,33 1,04 47
Lampung 34 623,80 1,81 188
Kepulauan Bangka Belitung 16 424,06 0,86 950
Kepulauan Riau 8 201,72 0,43 2 408
DKI Jakarta 664,01 0,03 218
Jawa Barat 35 377,76 1,85 131
Jawa Tengah 32 800,69 1,72 296
DI Yogyakarta 3 133,15 0,16 23
Jawa Timur 47 799,75 2,50 287
Banten 9 662,92 0,51 131
Bali 5 780,06 0,30 85
Nusa Tenggara Barat 18 572,32 0,97 864
Nusa Tenggara Timur 48 718,10 2,55 1 192
Kalimantan Barat 147 307,00 7,71 339
Kalimantan Tengah 153 564,50 8,04 32
Kalimantan Selatan 38 744,23 2,03 320
Kalimantan Timur 129 066,64 3) 6,75 370 4)
Kalimantan Utara 75 467,70 3) 3,95 -
Sulawesi Utara 13 851,64 0,72 668
Sulawesi Tengah 61 841,29 3,24 750
Sulawesi Selatan 46 717,48 2,44 295 5)
Sulawesi Tenggara 38 067,70 1,99 651
Gorontalo 11 257,07 0,59 136
Sulawesi Barat 16 787,18 0,88 -
Maluku 46 914,03 2,46 1 422
Maluku Utara 31 982,50 1,67 1 474
Papua Barat 99 671,63 5,21 1 945
Papua 319 036,05 16,67 598
Indonesia 1 913 578,68 100,00 17 504
Catatan: 1) Berdasarkan Peraturan Menteri Dalam Negeri No. 66 Tahun 2011 tanggal 28 Desember 2011 2) Berdasarkan informasi Kementerian Dalam Negeri Tahun 2004 3) Berdasarkan Undang-undang Republik Indonesia No. 20 Tahun 2012 tanggal 16 November 2012 4) Termasuk Kalimantan Utara 5) Termasuk Sulawesi Barat Note: 1) Based on Minister of Home Affairs Regulation No.66/2011, December 28, 2011 2) Based on information from Ministry of Home Affairs, 2004 3) Based on Republic of Indonesia’s Regulation No.20/2012, November 16, 2012 4) Including Kalimantan Utara 5) Including Sulawesi Barat
http
://w
ww
.bps
.go.
id
5Perkembangan Beberapa Indikator Utama Sosial-Ekonomi Indonesia, Agustus 2016
Jumlah Daerah Administrasi di Indonesia, 2005-2015Number of Administrative Units in Indonesia, 2005-2015
TabelTable
1.3
Lanjutan Tabel 1.3/Continued Table 1.3
Sumber: Peraturan Menteri Dalam Negeri Nomor 56 Tahun 2015 tanggal 29 Juni 2015Source: Minister of Home Affairs Regulation Number 56/2015 June 29, 2015 Catatan: 1) Penggabungan desa menjadi nagari di Provinsi Sumatera Barat
2) Statistik Potensi Desa IndonesiaNote: 1) Regrouping of Villages into Nagari in Sumatera Barat 2) Village Potential Statistics of Indonesia
Bulan/TahunMonth/Year
Kabupaten+KotaRegencies+Cities
KecamatanSub Districts
Desa/KelurahanVillages
Desember/December 2005 440 5 641 71 555
Desember/December 2006 440 5 656 71 563
Desember/December 2007 465 6 131 73 405
Mei/May 2008 2) 465 6 425 75 410
Desember/December 2008 485 6 520 75 666
Juni/June 2009 495 6 579 76 546
Desember/December 2009 497 6 651 76 983
Juni/June 2010 497 6 651 77 126
Desember/December 2010 497 6 699 77 548
April/April 2011 2) 497 6 771 78 609
Desember/December 2011 497 6 773 78 558
Juni/June 2012 497 6 793 79 075
Juni/June 2013 503 6 909 79 939
April/April 2014 511 7 074 82 190
Juni/June 2014 514 7 024 81 626
Juni/June 2015 514 7 071 81 936
Bulan/TahunMonth/Year
ProvinsiProvinces
KabupatenRegencies
KotaCities
Desember/December 2005 33 349 91
Desember/December 2006 33 349 91
Desember/December 2007 33 370 95
Mei/May 2008 2) 33 370 95
Desember/December 2008 33 387 96
Juni/June 2009 33 397 98
Desember/December 2009 33 399 98
Juni/June 2010 33 399 98
Desember/December 2010 33 399 98
April/April 2011 2) 33 399 98
Desember/December 2011 33 399 98
Juni/June 2012 33 399 98
Juni/June 2013 34 405 98
April/April 2014 34 413 98
Juni/June 2014 34 416 98
Juni/June 2015 34 416 98
http
://w
ww
.bps
.go.
id
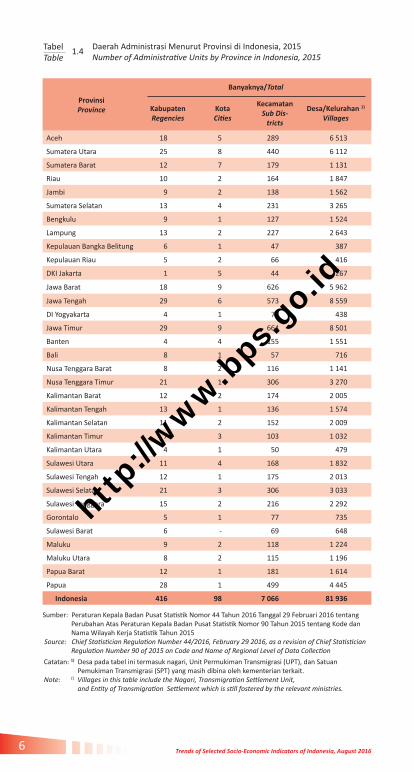
Trends of Selected Socio-Economic Indicators of Indonesia, August 20166
Daerah Administrasi Menurut Provinsi di Indonesia, 2015Number of Administrative Units by Province in Indonesia, 2015
TabelTable
1.4
Provinsi Province
Banyaknya/Total
Kabupaten Regencies
Kota Cities
KecamatanSub Dis-
tricts
Desa/Kelurahan 1)
Villages
Aceh 18 5 289 6 513
Sumatera Utara 25 8 440 6 112
Sumatera Barat 12 7 179 1 131
Riau 10 2 164 1 847
Jambi 9 2 138 1 562
Sumatera Selatan 13 4 231 3 265
Bengkulu 9 1 127 1 524
Lampung 13 2 227 2 643
Kepulauan Bangka Belitung 6 1 47 387
Kepulauan Riau 5 2 66 416
DKI Jakarta 1 5 44 267
Jawa Barat 18 9 626 5 962
Jawa Tengah 29 6 573 8 559
DI Yogyakarta 4 1 78 438
Jawa Timur 29 9 664 8 501
Banten 4 4 155 1 551
Bali 8 1 57 716
Nusa Tenggara Barat 8 2 116 1 141
Nusa Tenggara Timur 21 1 306 3 270
Kalimantan Barat 12 2 174 2 005
Kalimantan Tengah 13 1 136 1 574
Kalimantan Selatan 11 2 152 2 009
Kalimantan Timur 7 3 103 1 032
Kalimantan Utara 4 1 50 479
Sulawesi Utara 11 4 168 1 832
Sulawesi Tengah 12 1 175 2 013
Sulawesi Selatan 21 3 306 3 033
Sulawesi Tenggara 15 2 216 2 292
Gorontalo 5 1 77 735
Sulawesi Barat 6 - 69 648
Maluku 9 2 118 1 224
Maluku Utara 8 2 115 1 196
Papua Barat 12 1 181 1 614
Papua 28 1 499 4 445
Indonesia 416 98 7 066 81 936
Sumber: Peraturan Kepala Badan Pusat Statistik Nomor 44 Tahun 2016 Tanggal 29 Februari 2016 tentang Perubahan Atas Peraturan Kepala Badan Pusat Statistik Nomor 90 Tahun 2015 tentang Kode dan Nama Wilayah Kerja Statistik Tahun 2015 Source: Chief Statistician Regulation Number 44/2016, February 29 2016, as a revision of Chief Statistician Regulation Number 90 of 2015 on Code and Name of Regional Level of Data Collection
Catatan: 1) Desa pada tabel ini termasuk nagari, Unit Permukiman Transmigrasi (UPT), dan Satuan Pemukiman Transmigrasi (SPT) yang masih dibina oleh kementerian terkait.Note: 1) Villages in this table include the Nagari, Transmigration Settlement Unit, and Entity of Transmigration Settlement which is still fostered by the relevant ministries.
http
://w
ww
.bps
.go.
id
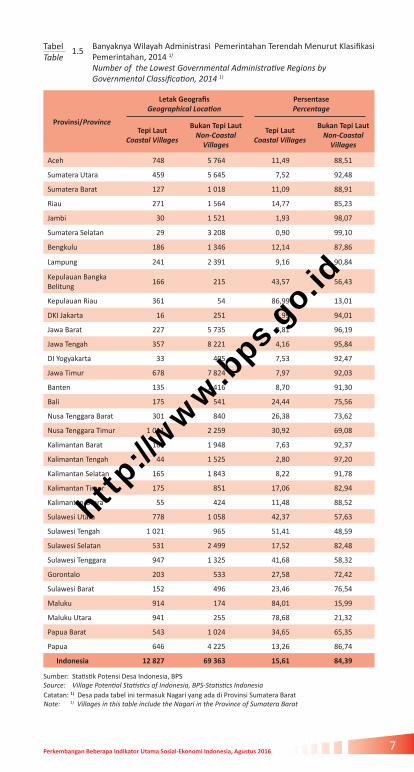
7Perkembangan Beberapa Indikator Utama Sosial-Ekonomi Indonesia, Agustus 2016
Banyaknya Wilayah Administrasi Pemerintahan Terendah Menurut Klasifikasi Pemerintahan, 2014 1)
Number of the Lowest Governmental Administrative Regions by Governmental Classification, 2014 1)
Sumber: Statistik Potensi Desa Indonesia, BPSSource: Village Potential Statistics of Indonesia, BPS-Statistics Indonesia
TabelTable
1.5
Provinsi/Province
Letak Geografis Geographical Location
PersentasePercentage
Tepi LautCoastal Villages
Bukan Tepi Laut Non-Coastal
Villages
Tepi Laut Coastal Villages
Bukan Tepi Laut Non-Coastal
Villages
Aceh 748 5 764 11,49 88,51
Sumatera Utara 459 5 645 7,52 92,48
Sumatera Barat 127 1 018 11,09 88,91
Riau 271 1 564 14,77 85,23
Jambi 30 1 521 1,93 98,07
Sumatera Selatan 29 3 208 0,90 99,10
Bengkulu 186 1 346 12,14 87,86
Lampung 241 2 391 9,16 90,84
Kepulauan Bangka Belitung
166 215 43,57 56,43
Kepulauan Riau 361 54 86,99 13,01
DKI Jakarta 16 251 5,99 94,01
Jawa Barat 227 5 735 3,81 96,19
Jawa Tengah 357 8 221 4,16 95,84
DI Yogyakarta 33 405 7,53 92,47
Jawa Timur 678 7 824 7,97 92,03
Banten 135 1 416 8,70 91,30
Bali 175 541 24,44 75,56
Nusa Tenggara Barat 301 840 26,38 73,62
Nusa Tenggara Timur 1 011 2 259 30,92 69,08
Kalimantan Barat 161 1 948 7,63 92,37
Kalimantan Tengah 44 1 525 2,80 97,20
Kalimantan Selatan 165 1 843 8,22 91,78
Kalimantan Timur 175 851 17,06 82,94
Kalimantan Utara 55 424 11,48 88,52
Sulawesi Utara 778 1 058 42,37 57,63
Sulawesi Tengah 1 021 965 51,41 48,59
Sulawesi Selatan 531 2 499 17,52 82,48
Sulawesi Tenggara 947 1 325 41,68 58,32
Gorontalo 203 533 27,58 72,42
Sulawesi Barat 152 496 23,46 76,54
Maluku 914 174 84,01 15,99
Maluku Utara 941 255 78,68 21,32
Papua Barat 543 1 024 34,65 65,35
Papua 646 4 225 13,26 86,74
Indonesia 12 827 69 363 15,61 84,39
Catatan: 1) Desa pada tabel ini termasuk Nagari yang ada di Provinsi Sumatera BaratNote: 1) Villages in this table include the Nagari in the Province of Sumatera Barat
http
://w
ww
.bps
.go.
id

http
://w
ww
.bps
.go.
id

PENDUDUK DAN KETENAGAKERJAAN
POPULATION AND EMPLOYMENT
2http://www.centroone.com/News/Detail/2015/12/2/5791/kurangi-pengangguran-gelar-bursa-kerja
http
://w
ww
.bps
.go.
id

http
://w
ww
.bps
.go.
id
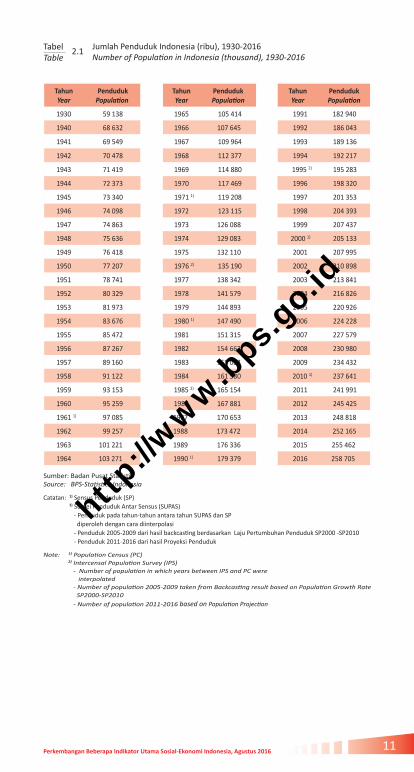
11Perkembangan Beberapa Indikator Utama Sosial-Ekonomi Indonesia, Agustus 2016
Tahun Year
Penduduk Population
Tahun Year
Penduduk Population
Tahun Year
Penduduk Population
1930 59 138 1965 105 414 1991 182 940
1940 68 632 1966 107 645 1992 186 043
1941 69 549 1967 109 964 1993 189 136
1942 70 478 1968 112 377 1994 192 217
1943 71 419 1969 114 880 1995 2) 195 283
1944 72 373 1970 117 469 1996 198 320
1945 73 340 1971 1) 119 208 1997 201 353
1946 74 098 1972 123 115 1998 204 393
1947 74 863 1973 126 088 1999 207 437
1948 75 636 1974 129 083 2000 1) 205 133
1949 76 418 1975 132 110 2001 207 995
1950 77 207 1976 2) 135 190 2002 210 898
1951 78 741 1977 138 342 2003 213 841
1952 80 329 1978 141 579 2004 216 826
1953 81 973 1979 144 893 2005 220 926
1954 83 676 1980 1) 147 490 2006 224 228
1955 85 472 1981 151 315 2007 227 579
1956 87 267 1982 154 662 2008 230 980
1957 89 160 1983 158 083 2009 234 432
1958 91 122 1984 161 580 2010 1) 237 641
1959 93 153 1985 2) 165 154 2011 241 991
1960 95 259 1986 167 881 2012 245 425
1961 1) 97 085 1987 170 653 2013 248 818
1962 99 257 1988 173 472 2014 252 165
1963 101 221 1989 176 336 2015 255 462
1964 103 271 1990 1) 179 379 2016 258 705
Jumlah Penduduk Indonesia (ribu), 1930-2016Number of Population in Indonesia (thousand), 1930-2016
TabelTable
2.1
Sumber: Badan Pusat Statistik Source: BPS-Statistics Indonesia
Catatan: 1) Sensus Penduduk (SP) 2) Survei Penduduk Antar Sensus (SUPAS) - Penduduk pada tahun-tahun antara tahun SUPAS dan SP diperoleh dengan cara diinterpolasi - Penduduk 2005-2009 dari hasil backcasting berdasarkan Laju Pertumbuhan Penduduk SP2000 -SP2010 - Penduduk 2011-2016 dari hasil Proyeksi Penduduk
Note: 1) Population Census (PC) 2) Intercensal Population Survey (IPS) - Number of population in which years between IPS and PC were interpolated - Number of population 2005-2009 taken from Backcasting result based on Population Growth Rate SP2000-SP2010
- Number of population 2011-2016 based on Population Projection
http
://w
ww
.bps
.go.
id

Trends of Selected Socio-Economic Indicators of Indonesia, August 201612
Penduduk Menurut Kelompok Umur dan Jenis Kelamin di Indonesia (ribu), 2016Population by Age Group and Sex in Indonesia (thousand), 2016
TabelTable
2.2
Penduduk Menurut Kelompok Umur dan Jenis Kelamin di Indonesia (ribu), 2015Population by Age Group and Sex in Indonesia (thousand), 2015
TabelTable
2.3
Sumber: Proyeksi Penduduk 2010-2035, BPSSource: Population Projection 2010-2035, Statistics Indonesia
Kelompok UmurAge Group
Laki-lakiMale
PerempuanFemale
Laki-laki+PerempuanMale+Female
0-4 12 221,4 11 738,7 23 960,1
5-9 12 069,5 11 490,0 23 559,5
10-14 11 571,9 11 005,2 22 577,1
15-19 11 335,7 10 825,3 22 161,0
20-24 10 911,7 10 657,3 21 569,0
25-29 10 513,3 10 398,1 20 911,4
30-34 10 210,3 10 286,7 20 497,0
35-39 9 931,1 10 005,4 19 936,5
40-44 9 347,0 9 262,3 18 609,3
45-49 8 353,0 8 304,0 16 657,0
50-54 7 064,2 7 114,8 14 179,0
55-59 5 737,3 5 719,8 11 457,1
60-64 4 247,3 4 150,5 8 397,8
65-69 2 780,8 2 962,0 5 742,8
70-74 1 817,9 2 145,6 3 963,5
75+ 1 876,3 2 650,6 4 526,9
Jumlah/Total 129 988,7 128 716,3 258 705,0
Kelompok UmurAge Group
Laki-lakiMale
PerempuanFemale
Laki-laki+PerempuanMale+Female
0-4 12 273,4 11 792,1 24 065,5
5-9 11 974,4 11 356,0 23 330,4
10-14 11 507,2 10 954,3 22 461,5
15-19 11 289,0 10 806,4 22 095,4
20-24 10 829,3 10 618,6 21 447,9
25-29 10 455,5 10 354,9 20 810,4
30-34 10 169,1 10 279,2 20 448,3
35-39 9 893,9 9 922,2 19 816,1
40-44 9 195,4 9 099,7 18 295,1
45-49 8 152,1 8 114,4 16 266,5
50-54 6 865,7 6 900,8 13 766,5
55-59 5 527,1 5 445,6 10 972,7
60-64 4 017,5 3 937,8 7 955,3
65-69 2 643,6 2 846,0 5 489,6
70-74 1 759,2 2 092,8 3 852,0
75+ 1 814,3 2 574,2 4 388,5
Jumlah/Total 128 366,7 127 095,0 255 461,7
Sumber: Proyeksi Penduduk 2010-2035, BPSSource: Population Projection 2010-2035, Statistics Indonesia
http
://w
ww
.bps
.go.
id

13Perkembangan Beberapa Indikator Utama Sosial-Ekonomi Indonesia, Agustus 2016
Penduduk Menurut Provinsi 1971, 1980, 1990, 2000 dan 2010 (ribu)Population by Province 1971, 1980, 1990, 2000 and 2010 (thousand)
2.4
Provinsi/Province 1971 1980 1990 2000 2010
Aceh 2.008,6 2 611,3 3 416,2 3 929,2 4 494.4
Sumatera Utara 6.621,8 8 360,9 10 256,0 11 642,5 12 982.2
Sumatera Barat 2.793,2 3 406,8 4 000,2 4 248,5 4 846.9
Riau 1.641,5 2 168,5 3 304,0 3 907,8 5 538.4
Jambi 1.006,1 1 446,0 2 020,6 2 407,2 3 092.3
Sumatera Selatan 3.440,6 4 629,8 6 313,1 6 210,8 7 450.4
Bengkulu 519,3 768,1 1 179,1 1 455,5 1 715.5
Lampung 2.777,0 4 624,8 6 017,6 6 730,7 7 608.4
Kepulauan Bangka Belitung 1) - - - 900,0 1 223.3
Kepulauan Riau 2) - - - 1 040,2 1 679.2
DKI Jakarta 4.579,3 6 503,4 8 259,3 8 361,1 9 607.8
Jawa Barat 21.623,5 27 453,5 35 384,3 35 724,1 43 053.7
Jawa Tengah 21.877,1 25 372,9 28 520,6 31 223,3 32 382.7
DI Yogyakarta 2.489,4 2 750,8 2 913,1 3 121,0 3 457.5
Jawa Timur 25.517,0 29 188,8 32 504,0 34 766,0 37 476.8
Banten 3) - - - 8 098,3 10 632.2
Bali 2.120,3 2 469,9 2 777,8 3 150,1 3 890.8
Nusa Tenggara Barat 2.203,5 2 724,7 3 369,6 4 008,6 4 500.2
Nusa Tenggara Timur 2.295,3 2 737,2 3 268,6 3 823,1 4 683.8
Kalimantan Barat 2.019,9 2 486,1 3 229,2 4 016,3 4 396.0
Kalimantan Tengah 701,9 954,4 1 396,5 1 855,5 2 212.1
Kalimantan Selatan 1.699,1 2 064,6 2 597,6 2 984,0 3 626.6
Kalimantan Timur 733,8 1 218,0 1 876,7 2 451,9 3 553.1
Sulawesi Utara 1.718,5 2 115,4 2 478,1 2 000,9 2 270.6
Sulawesi Tengah 913,7 1 289,6 1 711,3 2 176,0 2 635.0
Sulawesi Selatan 5.180,6 6 062,2 6 981,6 7 159,2 8 034.8
Sulawesi Tenggara 714,1 942,3 1 349,6 1 820,4 2 232.6
Gorontalo - - - 833,5 1 040.2
Sulawesi Barat 4) - - 891,6 1 158.6
Maluku 1.089,6 1 411,0 1 857,8 1 166,3 1 533.5
Maluku Utara 5) - - - 815,1 1 038.1
Papua Barat 6) - - - 529,7 760.4
Papua 923,4 1 173,9 1 648,7 1 684,1 2 833.4
Timor Timur - 555,4 747,8 - -
Indonesia 119 208,2 147 490,3 179 378,9 205 132,5 237 641.5
Sumber: Hasil Sensus Penduduk 1971, 1980, 1990 dan 2000, BPSSource: Based on 1971, 1980, 1990, and 2000 Population Census, BPS-Statistics Indonesia
Catatan/Note: 1) Merupakan pecahan dari provinsi Sumatera Selatan/Split from the Sumatera Selatan province 2) Merupakan pecahan dari provinsi Riau/Split from the Riau province 3) Merupakan pecahan dari provinsi Jawa Barat/Split from the Jawa Barat province 4) Merupakan pecahan dari provinsi Sulawesi Selatan/Split from the Sulawesi Selatan province 5) Merupakan pecahan dari provinsi Maluku/Split from the Maluku province 6) Merupakan pecahan dari provinsi Papua/Split from the Papua province
http
://w
ww
.bps
.go.
id
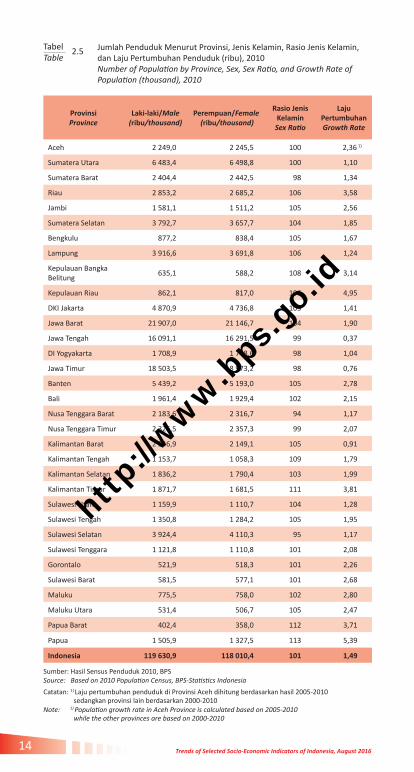
Trends of Selected Socio-Economic Indicators of Indonesia, August 201614
TabelTable
2.5
Sumber: Hasil Sensus Penduduk 2010, BPSSource: Based on 2010 Population Census, BPS-Statistics Indonesia
ProvinsiProvince
Laki-laki/Male(ribu/thousand)
Perempuan/Female
(ribu/thousand)
Rasio Jenis Kelamin
Sex Ratio
LajuPertumbuhanGrowth Rate
Aceh 2 249,0 2 245,5 100 2,36 1)
Sumatera Utara 6 483,4 6 498,8 100 1,10
Sumatera Barat 2 404,4 2 442,5 98 1,34
Riau 2 853,2 2 685,2 106 3,58
Jambi 1 581,1 1 511,2 105 2,56
Sumatera Selatan 3 792,7 3 657,7 104 1,85
Bengkulu 877,2 838,4 105 1,67
Lampung 3 916,6 3 691,8 106 1,24
Kepulauan Bangka Belitung
635,1 588,2 108 3,14
Kepulauan Riau 862,1 817,0 106 4,95
DKI Jakarta 4 870,9 4 736,8 103 1,41
Jawa Barat 21 907,0 21 146,7 104 1,90
Jawa Tengah 16 091,1 16 291,5 99 0,37
DI Yogyakarta 1 708,9 1 748,6 98 1,04
Jawa Timur 18 503,5 18 973,2 98 0,76
Banten 5 439,2 5 193,0 105 2,78
Bali 1 961,4 1 929,4 102 2,15
Nusa Tenggara Barat 2 183,6 2 316,7 94 1,17
Nusa Tenggara Timur 2 326,5 2 357,3 99 2,07
Kalimantan Barat 2 246,9 2 149,1 105 0,91
Kalimantan Tengah 1 153,7 1 058,3 109 1,79
Kalimantan Selatan 1 836,2 1 790,4 103 1,99
Kalimantan Timur 1 871,7 1 681,5 111 3,81
Sulawesi Utara 1 159,9 1 110,7 104 1,28
Sulawesi Tengah 1 350,8 1 284,2 105 1,95
Sulawesi Selatan 3 924,4 4 110,3 95 1,17
Sulawesi Tenggara 1 121,8 1 110,8 101 2,08
Gorontalo 521,9 518,3 101 2,26
Sulawesi Barat 581,5 577,1 101 2,68
Maluku 775,5 758,0 102 2,80
Maluku Utara 531,4 506,7 105 2,47
Papua Barat 402,4 358,0 112 3,71
Papua 1 505,9 1 327,5 113 5,39
Indonesia 119 630,9 118 010,4 101 1,49
Catatan: 1) Laju pertumbuhan penduduk di Provinsi Aceh dihitung berdasarkan hasil 2005-2010 sedangkan provinsi lain berdasarkan 2000-2010 Note: 1) Population growth rate in Aceh Province is calculated based on 2005-2010 while the other provinces are based on 2000-2010
Jumlah Penduduk Menurut Provinsi, Jenis Kelamin, Rasio Jenis Kelamin, dan Laju Pertumbuhan Penduduk (ribu), 2010Number of Population by Province, Sex, Sex Ratio, and Growth Rate of Population (thousand), 2010
http
://w
ww
.bps
.go.
id

15Perkembangan Beberapa Indikator Utama Sosial-Ekonomi Indonesia, Agustus 2016
TabelTable
2.6 Penduduk Menurut Provinsi dan Jenis Kelamin (ribu), 2013Population by Province and Sex (thousand), 2013
Sumber: Proyeksi Penduduk Indonesia 2010-2035, BPSSource: Population Projection 2010-2035, BPS-Statistics Indonesia
ProvinsiProvince
Laki-lakiMale
PerempuanFemale
Laki-laki+PerempuanMale+Female
Aceh 2 400,9 2 410,2 4 811,1
Sumatera Utara 6 779,6 6 810,7 13 590,3
Sumatera Barat 2 516,0 2 550,5 5 066,5
Riau 3 099,8 2 933,5 6 033,3
Jambi 1 677,1 1 609,0 3 286,1
Sumatera Selatan 3 978,7 3 850,0 7 828,7
Bengkulu 925,7 888,7 1 814,4
Lampung 4 070,9 3 861,2 7 932,1
Kepulauaan Bangka Belitung
682,6 632,5 1 315,1
Kepulauan Riau 952,1 909,3 1 861,4
DKI Jakarta 5 023,4 4 946,5 9 969,9
Jawa Barat 23 004,3 22 336,5 45 340,8
Jawa Tengah 16 499,3 16 765,0 33 264,3
DI Yogyakarta 1 775,9 1 819,0 3 594,9
Jawa Timur 18 925,1 19 438,1 38 363,2
Banten 5 844,2 5 608,3 11 452,5
Bali 2 042,0 2 014,3 4 056,3
Nusa Tenggara Barat 2 284,0 2 426,8 4 710,8
Nusa Tenggara Timur 2 455,1 2 498,9 4 954,0
Kalimantan Barat 2 366,3 2 275,1 4 641,4
Kalimantan Tengah 1 243,8 1 140,9 2 384,7
Kalimantan Selatan 1 951,6 1 902,9 3 854,5
Kalimantan Timur 2 034,7 1 836,1 3 870,8
Sulawesi Utara 1 204,3 1 156,1 2 360,4
Sulawesi Tengah 1 423,9 1 361,6 2 785,5
Sulawesi Selatan 4 071,4 4 270,6 8 342,0
Sulawesi Tenggara 1 203,5 1 193,2 2 396,7
Gorontalo 550,0 548,0 1 098,0
Sulawesi Barat 618,8 615,5 1 234,3
Maluku 821,6 806,8 1 628,4
Maluku Utara 569,3 545,6 1 114,9
Papua Barat 436,9 391,4 828,3
Papua 1 603,2 1 429,3 3 032,5
Indonesia 125 036,0 123 782,1 248 818,1
http
://w
ww
.bps
.go.
id

Trends of Selected Socio-Economic Indicators of Indonesia, August 201616
TabelTable
2.7 Penduduk Menurut Provinsi dan Jenis Kelamin (ribu), 2014Population by Province and Sex (thousand), 2014
Sumber: Proyeksi Penduduk Indonesia 2010-2035, BPSSource: Population Projection 2010-2035, BPS-Statistics Indonesia
ProvinsiProvince
Laki-lakiMale
PerempuanFemale
Laki-laki+PerempuanMale+Female
Aceh 2 449,4 2 457,4 4 906,8
Sumatera Utara 6 868,6 6 898,3 13 766,9
Sumatera Barat 2 550,4 2 581,5 5 131,9
Riau 3 178,4 3 010,0 6 188,4
Jambi 1 706,7 1 637,7 3 344,4
Sumatera Selatan 4 036,0 3 905,5 7 941,5
Bengkulu 941.1 903.7 1 844,8
Lampung 4 117,5 3 908,7 8 026,2
Kepulauaan Bangka Belitung
697.9 646 1 343,9
Kepulauan Riau 980.1 937.3 1 917,4
DKI Jakarta 5 069,9 5 005,4 10 075,3
Jawa Barat 23 345,3 22 684,3 46 029,6
Jawa Tengah 16 627,1 16 895,6 33 522,7
DI Yogyakarta 1 797,4 1 839,7 3 637,1
Jawa Timur 19 051,6 19 558,6 38 610,2
Banten 5 971,3 5 733,6 11 704,9
Bali 2 066,7 2 038,2 4 104,9
Nusa Tenggara Barat 2 315,2 2 458,6 4 773,8
Nusa Tenggara Timur 2 495,9 2 541,0 5 036,9
Kalimantan Barat 5 036,9 2 312,7 4 716,1
Kalimantan Tengah 1 273,3 1 166,6 2 439,9
Kalimantan Selatan 1 987,1 1 935,7 3 922,8
Kalimantan Timur 2 086,3 1 883,3 3 969,6
Sulawesi Utara 1 217,8 1 168,8 2 386,6
Sulawesi Tengah 1 446,9 1 384,4 2 831,3
Sulawesi Selatan 4 116,8 4 315,4 8 432,2
Sulawesi Tenggara 1 229,8 1 218,3 2 448,1
Gorontalo 558.8 556.8 1 115,6
Sulawesi Barat 630.9 627.2 1 258,1
Maluku 836.1 821.3 1 657,4
Maluku Utara 581.3 557.4 1 138,7
Papua Barat 448 401.8 849.8
Papua 1 632,2 1 458,8 3 091,0
Indonesia 126 715,2 125 449,6 252 164,8
http
://w
ww
.bps
.go.
id

17Perkembangan Beberapa Indikator Utama Sosial-Ekonomi Indonesia, Agustus 2016
TabelTable
2.8 Penduduk Menurut Provinsi dan Jenis Kelamin (ribu), 2015Population by Province and Sex (thousand), 2015
Sumber: Proyeksi Penduduk Indonesia 2010-2035, BPSSource: Population Projection 2010-2035, BPS-Statistics Indonesia
ProvinsiProvince
Laki-lakiMale
PerempuanFemale
Laki-laki+PerempuanMale+Female
Aceh 2 497,5 2 504,5 5 002,0
Sumatera Utara 6 954,6 6 983,2 13 937,8
Sumatera Barat 2 584,2 2 612,1 5 196,3
Riau 3 257,6 3 086,8 6 344,4
Jambi 1 736,0 1 666,0 3 402,1
Sumatera Selatan 4 092,2 3 960,1 8 052,3
Bengkulu 956,3 918,7 1 874,9
Lampung 4 162,4 3 954,8 8 117,3
Kepulauaan Bangka Belitung
713,2 659,6 1 372,8
Kepulauan Riau 1 008,0 965,1 1 973,0
DKI Jakarta 5 115,4 5 062,6 10 177,9
Jawa Barat 23 680,9 23 028,6 46 709,6
Jawa Tengah 16 750,9 17 023,2 33 774,1
DI Yogyakarta 1 818,8 1 860,4 3 679,2
Jawa Timur 19 172,6 19 675,0 38 847,6
Banten 6 097,2 5 858,1 11 955,2
Bali 2 091,0 2 061,8 4 152,8
Nusa Tenggara Barat 2 345,8 2 489,8 4 835,6
Nusa Tenggara Timur 2 536,9 2 583,2 5 120,1
Kalimantan Barat 2 439,9 2 349,7 4 789,6
Kalimantan Tengah 1 302,8 1 192,2 2 495,0
Kalimantan Selatan 2 022,0 1 967,8 3 989,8
Kalimantan Timur 1 820,1 1 649,7 3 469,8
Kalimantan Utara 318,0 280,8 598,8
Sulawesi Utara 1 230,8 1 181,3 2 412,1
Sulawesi Tengah 1 469,6 1 407,1 2 876,7
Sulawesi Selatan 4 161,0 4 359,3 8 520,3
Sulawesi Tenggara 1 256,1 1 243,5 2 499,5
Gorontalo 567,7 565,5 1 133,2
Sulawesi Barat 643,1 639,0 1 282,2
Maluku 850,6 835,8 1 686,5
Maluku Utara 593,2 569,1 1 162,3
Papua Barat 459,3 412,2 871,5
Papua 1 661,2 1 488,2 3 149,4
Indonesia 128 366,7 127 095,0 255 461,7
http
://w
ww
.bps
.go.
id

Trends of Selected Socio-Economic Indicators of Indonesia, August 201618
TabelTable
2.9 Penduduk Menurut Provinsi dan Jenis Kelamin (ribu), 2016Population by Province and Sex (thousand), 2016
ProvinsiProvince
Laki-lakiMale
PerempuanFemale
Laki-laki+PerempuanMale+Female
Aceh 2 545,1 2 551,1 5 096,2
Sumatera Utara 7 037,3 7 065,6 14 102,9
Sumatera Barat 2 617,2 2 642,3 5 259,5
Riau 3 336,9 3 164,1 6 501,0
Jambi 1 764,9 1 694,0 3 458,9
Sumatera Selatan 4 147,1 4 013,8 8 160,9
Bengkulu 971,3 933,5 1 904,8
Lampung 4 205,7 3 999,4 8 205,1
Kepulauaan Bangka Belitung
728,6 673,2 1 401,8
Kepulauan Riau 1 035,5 992,7 2 028,2
DKI Jakarta 5 159,7 5 117,9 10 277,6
Jawa Barat 24 011,3 23 368,1 47 379,4
Jawa Tengah 16 871,2 17 147,9 34 019,1
DI Yogyakarta 1 839,9 1 881,0 3 720,9
Jawa Timur 19 288,2 19 787,1 39 075,3
Banten 6 221,6 5 981,5 12 203,1
Bali 2 115,0 2 085,1 4 200,1
Nusa Tenggara Barat 2 375,8 2 520,4 4 896,2
Nusa Tenggara Timur 2 577,9 2 625,6 5 203,5
Kalimantan Barat 2 475,6 2 386,1 4 861,7
Kalimantan Tengah 1 332,3 1 217,9 2 550,2
Kalimantan Selatan 2 056,1 1 999,4 4 055,5
Kalimantan Timur 1 836 293 1 664 939 3 501 232
Kalimantan Utara 353 529 312 804 666 333
Sulawesi Utara 1 243,4 1 193,5 2 436,9
Sulawesi Tengah 1 492,1 1 429,6 2 921,7
Sulawesi Selatan 4 204,1 4 402,3 8 606,4
Sulawesi Tenggara 1 282,3 1 268,7 2 551,0
Gorontalo 576,5 574,3 1 150,8
Sulawesi Barat 655,5 651 1 306,5
Maluku 865,1 850,4 1 715,5
Maluku Utara 616,8 580,8 1 185,9
Papua Barat 470,6 422,8 893,4
Papua 1 689,9 1 517,5 3 207,4
Indonesia 129 988,7 128 716,3 258 705,0
Sumber: Proyeksi Penduduk Indonesia 2010 - 2035, BPSSource: Population Projection 2010-2035, BPS-Statistics Indonesia
http
://w
ww
.bps
.go.
id

19Perkembangan Beberapa Indikator Utama Sosial-Ekonomi Indonesia, Agustus 2016
Provinsi/Province
Persentase PendudukPercentage to Total Population
Kepadatan Penduduk1) per km2
Population Density per km2
2010 2015 2010 2015
Aceh 1,90 1,96 78 86
Sumatera Utara 5,46 5,46 179 191
Sumatera Barat 2,04 2,03 116 124
Riau 2,34 2,48 64 73
Jambi 1,30 1,33 62 68
Sumatera Selatan 3,14 3,15 82 88
Bengkulu 0,72 0,73 86 94
Lampung 3,20 3,18 220 234
Kepulauaan Bangka Belitung
0,52 0,54 75 84
Kepulauan Riau 0,71 0,77 206 241
DKI Jakarta 4,04 3,98 14 518 15328
Jawa Barat 18,12 18,28 1 222 1320
Jawa Tengah 13,60 13,22 989 1030
DI Yogyakarta 1,45 1,44 1 107 1174
Jawa Timur 15,75 15,21 786 813
Banten 4,48 4,68 1 106 1237
Bali 1,64 1,63 676 718
Nusa Tenggara Barat 1,89 1,89 243 260
Nusa Tenggara Timur 1,97 2,00 97 105
Kalimantan Barat 1,85 1,87 30 33
Kalimantan Tengah 0,93 0,98 14 16
Kalimantan Selatan 1,53 1,56 94 103
Kalimantan Timur 1,50 1,34 17 27
Kalimantan Utara - 0,25 - 9
Sulawesi Utara 0,95 0,94 164 174
Sulawesi Tengah 1,11 1,13 43 47
Sulawesi Selatan 3,38 3,34 173 182
Sulawesi Tenggara 0,94 0,98 59 66
Gorontalo 0,44 0,44 93 101
Sulawesi Barat 0,49 0,50 69 76
Maluku 0,65 0,66 33 36
Maluku Utara 0,44 0,45 33 36
Papua Barat 0,32 0,34 8 9
Papua 1,20 1,23 9 10
Indonesia 100,00 100,00 124 134
Persentase dan Kepadatan Penduduk Menurut Provinsi, 2010 dan 2015Percentage and Population Density by Province, 2010 and 2015
TabelTable
2.10
Sumber: Sensus Penduduk (SP) 2010 dan Proyeksi Penduduk Indonesia 2010–2035, BPSSource: 2010 Population Census and Indonesia Population Projection 2010–2035, BPS-Statistics Catatan: 1) Menggunakan luas wilayah yang sama untuk menghitung kepadatan penduduk Note: 1) Using the same total area (sq km) to calculate population density
http
://w
ww
.bps
.go.
id

Trends of Selected Socio-Economic Indicators of Indonesia, August 201620
Kabupaten/Kota dengan Jumlah Penduduk Paling Sedikit dan Paling Banyak di Tiap Provinsi, 2010The Smallest and the Biggest Number of Population in Regencies/ Cities by Province, 2010
TabelTable
2.11
Provinsi/ProvinceKabupaten/Kota Regencies/Cities
Paling Sedikit Smallest Number
Kabupaten/KotaRegencies/Cities
Paling Banyak Biggest Number
Aceh Kota Sabang 30 653 Kab. Aceh Utara 529 751
Sumatera Utara Kab. Pakpak Barat 40 505 Kota Medan 2 097 610
Sumatera Barat Kota Padang Panjang 47 008 Kota Padang 833 562
Riau Kab. Kep. Meranti 176 290 Kota Pekanbaru 897 767
Jambi Kota Sungai Penuh 82 293 Kota Jambi 531 857
Sumatera Selatan Kota Pagar Alam 126 181 Kota Palembang 1 455 284
Bengkulu Kab. Bengkulu Tengah 98 333 Kota Bengkulu 308 544
Lampung Kota Metro 145 471Kab. Lampung Tengah
1 170 717
Kepulauan Bangka Belitung
Kab. Belitung Timur 106 463 Kab. Bangka 277 204
Kepulauan Riau Kab. Kep. Anambas 37 411 Kota Batam 944 285
DKI Jakarta Kab. Kep. Seribu 21 082 Kota Jakarta Timur 2 693 896
Jawa Barat Kota Banjar 175 157 Kab. Bogor 4 771 932
Jawa Tengah Kota Magelang 118 227 Kab. Brebes 1 733 869
DI Yogyakarta Kota Yogyakarta 388 627 Kab. Sleman 1 093 110
Jawa Timur Kota Mojokerto 120 196 Kota Surabaya 2 765 487
Banten Kota Cilegon 374 559 Kab Tangerang 2 834 376
Bali Kab. Klungkung 170 543 Kota Denpasar 788 589
Nusa Tenggara Barat
Kab. Sumbawa Barat 114 951Kab. Lombok Timur
1 105 582
Nusa Tenggara Timur
Kab. Sumba Tengah 62 485Kab. Timor Tengah Selatan
441 155
Kalimantan Barat Kab. Kayong Utara 95 594 Kota Pontianak 554 764
Kalimantan Tengah Kab. Sukamara 44 952Kab. Kotawaringin Timur
374 175
Kalimantan Selatan
Kab. Balangan 112 430 Kota Banjarmasin 625 481
Kalimantan Timur Kab. Tana Tidung 15 202 Kota Samarinda 727 500
Sulawesi UtaraKab. Bolaang Mongondow Selatan
57 001 Kota Manado 410 481
Sulawesi Tengah Kab. Buol 132 330Kab. Parigi Moutong
413 588
Sulawesi Selatan Kab. Selayar 122 055 Kota Makassar 1 338 663
Sulawesi Tenggara Kab. Konawe Utara 51 533 Kab. Kolaka 315 232
Gorontalo Kab. Gorontalo Utara 104 133 Kab. Gorontalo 355 988
Sulawesi Barat Kab. Mamuju Utara 134 369Kab. Polewali Mandar
396 120
Maluku Kab. Buru Selatan 53 671Kab. Maluku Tengah
361 698
Maluku UtaraKab. Halmahera Tengah
42 815Kab. Halmahera Selatan
198 911
Papua Barat Kab. Tambrauw 6 144 Kota Sorong 190 625
Papua Kab. Supiori 15 874 Kota Jayapura 256 705
Sumber: Hasil Sensus Penduduk 2010, BPSSource: Based on 2010 Population Census, BPS-Statistics Indonesia
http
://w
ww
.bps
.go.
id

21Perkembangan Beberapa Indikator Utama Sosial-Ekonomi Indonesia, Agustus 2016
Jumlah Rumah Tangga dan Rata-rata Banyaknya Anggota Rumah TanggaMenurut Provinsi, 2013, 2014 dan 2015 Number of Households and Average Household Size by Province, 2013,2014 and 2015
TabelTable
2.12
Sumber: Statistik Indonesia, BPSSource: Statistical Yearbook of Indonesia, BPS-Statistics Indonesia
Provinsi/Province
Rumah Tangga (ribu) Households (thousand)
Rata-rata Anggota Rumah Tangga Average Household Size
2013 2014 2015 2013 2014 2015
Aceh 1 141,6 1 164,2 1 186,6 4,2 4,2 4,2
Sumatera Utara 3 180,0 3 218,1 3 257,2 4,3 4,3 4,3
Sumatera Barat 1 152,5 1 219,3 1 234,4 4,2 4,2 4,2
Riau 1 328,6 1 485,1 1 522,7 4,2 4,2 4,2
Jambi 770,8 832,9 847,1 4,0 4,0 4,0
Sumatera Selatan 1 905,7 1 932,3 1 959,1 4,1 4,1 4,1
Bengkulu 457,9 465,3 472,8 4,0 4,0 4,0
Lampung 2 016,9 2 038,1 2 060,5 3,9 3,9 3,9
Kepulauan Bangka Belitung
334,6 342,1 349,5 3,9 3,9 3,9
Kepulauan Riau 489,7 506,0 521,1 3,8 3,8 3,8
DKI Jakarta 2 604,6 2 632,3 2 659,2 3,8 3,8 3,8
Jawa Barat 12 104,3 12 244,2 12 415,4 3,7 3,8 3,8
Jawa Tengah 8 941,5 9 001,2 9 066,3 3,7 3,7 3,7
DI Yogyakarta 1 079,3 1 092,8 1 105,7 3,3 3,3 3,3
Jawa Timur 10 626,6 10 677,6 10 738,9 3,6 3,6 3,6
Banten 2 796,9 2 866,8 2 930,2 4,1 4,1 4,1
Bali 1 072,1 1 086,6 1 099,7 3,8 3,8 3,8
Nusa Tenggara Barat 1 311,2 1 327,2 1 344,0 3,6 3,6 3,6
Nusa Tenggara Timur 1 072,5 1 090,4 1 108,4 4,6 4,6 4,6
Kalimantan Barat 1 080,2 1 097,2 1 114,2 4,3 4,3 4,3
Kalimantan Tengah 617,5 632,4 646,8 3,9 3,9 3,9
Kalimantan Selatan 1 036,6 1 054,5 1 072,4 3,7 3,7 3,7
Kalimantan Timur 949,0 833,4 852,1 4,1 4,0 4,0
Kalimantan Utara - 139,1 144,5 - 4,4 4,4
Sulawesi Utara 604,9 611,0 617,3 3,9 3,9 3,9
Sulawesi Tengah 656,0 666,7 677,4 4,2 4,2 4,2
Sulawesi Selatan 1 918,7 1 937,0 1 956,6 4,3 4,4 4,4
Sulawesi Tenggara 539,0 550,9 562,5 4,4 4,4 4,4
Gorontalo 257,6 261,8 266,0 4,3 4,3 4,3
Sulawesi Barat 275,5 280,9 286,3 4,5 4,5 4,5
Maluku 336,3 343,1 349,3 4,8 4,8 4,8
Maluku Utara 230,3 235,2 240,1 4,8 4,8 4,8
Papua Barat 183,1 187,7 192,5 4,5 4,5 4,5
Papua 705,1 718,5 731,9 4,3 4,3 4,3
Indonesia 64 041,2 64 771,6 65 588,4 3,9 3,9 3,9
http
://w
ww
.bps
.go.
id

Trends of Selected Socio-Economic Indicators of Indonesia, August 201622
Perkiraan Penduduk Beberapa Negara (juta), 2012-2015Estimated Population of Selected Countries (million), 2012-2015
TabelTable
2.13
Negara/Country 2012 2013 2014 2015
Amerika Serikat/USA 314.8 317.1 319.4 321.8
Arab Saudi/Saudi Arabia 29.5 30.2 30.9 31.5
Australia 22.9 23.3 23.6 24
Bangladesh 155.3 157.2 159.1 161
Belanda/Netherlands 16.7 16.8 16.9 16.9
Belgia/Belgium 11.1 11.2 11.2 11.3
Brazil 202.4 204.3 206.1 207.8
Denmark 5.6 5.6 5.6 5.7
Federasi Rusia/Russian Federation 143.3 143.4 143.4 143.5
Filipina/Philippines 96 97.6 99.1 100.7
Finlandia/Finland 5.4 5.5 5.5 5.5
Hongkong/Hongkong SAR 7.1 7.2 7.2 7.3
India 1 263.6 1 279.5 1 295.3 1311.1
Indonesia 2) 245.4 248.8 252.2 255.5
Inggris/United Kingdom 63.6 64,0 64.3 64.7
Italia/Italy 59.7 59.8 59.8 59.8
Jepang/Japan 127.1 127 126.8 126.6
Jerman/Germany 80.5 80.6 80.6 80.7
Kamboja/Cambodia 14.8 15.1 15.3 15.6
Kanada/Canada 34.9 35.2 35.6 35.9
Kazakhstan 16.8 17.1 17.4 17.6
Korea Selatan/Korea, Rep. of 49.6 49.8 50.1 50.3
Kuwait 3.4 3.6 3.8 3.9
Malaysia 29 29.5 29.9 30.3
Meksiko/Mexico 122.1 123.7 125.4 127
Mesir/Egypt 85.7 87.6 89.6 91.5
Myanmar 52.5 53 53.4 53.9
Nigeria 168.2 172.8 177.5 182.2
Norwegia/Norway 5,0 5.1 5.1 5.2
Pakistan 177.4 181.2 185 188.9
Perancis/France 63.6 63.8 64.1 64.4
Singapura/Singapore 5.3 5.4 5.5 5.6
Srilanka 20.4 20.5 20.6 20.7
Swedia/Sweden 9.5 9.6 9.7 9.8
Thailand 67.2 67.5 67.7 68,0
Tiongkok/China 1 355.4 1 362.5 1 369.4 1 376,0
Venezuela 29.9 30.3 30.7 31.1
Vietnam 90.3 91.4 92.4 93.4
Sumber: Statistik Indonesia, BPS Source: Statistical Yearbook of Indonesia, BPS-Statistics Indonesia
http
://w
ww
.bps
.go.
id

23Perkembangan Beberapa Indikator Utama Sosial-Ekonomi Indonesia, Agustus 2016
Penduduk Usia 15 Tahun ke Atas Menurut Jenis Kegiatan Selama Seminggu yang Lalu (juta), 2014-2016 Population 15 Years of Age and Over by Type of Activity, During the Previous Week (million), 2014-2016
TabelTable
2.14
Sumber: Keadaan Angkatan Kerja di Indonesia, BPS Source: Labor Force Situation In Indonesia, BPS-Statistics Indonesia
Angkatan Kerja Menurut Golongan Umur dan Jenis Kelamin, 2015-2016 Economically Active Population by Age Group and Sex, 2015-2016
TabelTable 2.15
Sumber: Keadaan Angkatan Kerja di Indonesia, BPSSource: Labor Force Situation In Indonesia, BPS-Statistics Indonesia
Catatan: 1) Menggunakan penimbang hasil proyeksi penduduk 2010-2035Note: 1) weighted by the 2010-2035 population projection
Golongan UmurAge
Group
2015 2016
Februari/February Agustus/August Februari/February
Laki-lakiMale
Perempuan Female
Laki-lakiMale
Perempuan Female
Laki-lakiMale
Perempuan Female
15-19 3 111 613 2 015 531 3 595 987 2 464 264 3 765 553 2 363 268
20-24 7 614 527 4 958 800 8 760 736 5 522 398 8 968 191 5 803 095
25-29 9 181 940 5 565 984 9 907 527 5 366 091 10 009 051 5 789 255
30-34 9 497 799 5 734 378 9 877 728 5 386 801 9 902 409 5 736 008
35-39 9 479 620 6 064 470 9 686 694 5 488 411 9 672 620 6 180 753
40-44 8 880 404 5 938 303 9 028 612 5 495 059 9 114 439 5 896 614
45-49 7 807 750 5 232 504 7 985 779 4 924 170 8 124 126 5 474 355
50-54 6 437 393 4 529 363 6 535 930 4 141 726 6 686 878 4 622 725
55-59 4 797 171 3 254 345 4 941 272 3 043 555 5 068 250 3 325 177
60+ 6 616 546 4 128 380 6 490 327 3 736 954 6 826 406 4 342 696
Jumlah Total
73 424 763 47 422 058 76 810 592 45 569 429 78 137 923 49 533 946
Jenis Kegiatan Selama Seminggu yang Lalu
Type of Activity During the Previous week
2014 1) 2015 2016
Feb/Feb Ags/Aug Feb/Feb Ags/Aug Feb/Feb
Penduduk berumur 15 Tahun Ke Atas/Population 15 Years of Age and Over
181,17 182,99 184,60 186,10 187,60
Angkatan Kerja Economically Active
125,32 121,87 128,30 122,38 127,67
a. Bekerja/Working 118,17 114,63 120,85 114,82 120,65
b. Pengangguran Terbuka Unemployment
7,15 7,24 7,45 7,56 7,02
Bukan Angkatan KerjaNot Economically Active
55,85 61,12 56,30 63,72 59,93
Pekerja Tak Penuh Less than Normal Working Hour
36,97 35,77 35,68 34,31 36,32
a. Paruh Waktu Part-Time Worker
26,40 26,09 25,63 24,57 25,87
b. Setengah Penganggur Underemployment
10,57 9,68 10,04 9,74 10,45
http
://w
ww
.bps
.go.
id

Trends of Selected Socio-Economic Indicators of Indonesia, August 201624
Persentase Penduduk yang Bekerja Menurut Tingkat Pendidikan Tertinggi yang Ditamatkan, 2014-2016Percentage of Population Worked by Educational Attainment, 2014-2016
Pengangguran Terbuka Menurut Golongan Umur dan Jenis Kelamin, 2015-2016Unemployment by Age Group and Sex, 2015-2016
TabelTable
TabelTable
2.16
2.17
Sumber: Keadaan Angkatan Kerja di Indonesia, BPS Source: Labor Force Situation in Indonesia, BPS-Statistics Indonesia
Sumber: Keadaan Angkatan Kerja di Indonesia, BPS Source: Labor Force Situation in Indonesia, BPS-Statistics Indonesia
Catatan/Note: 1. a. Tidak/belum pernah sekolah/No schooling b. Tidak/belum tamat SD/ Did Not Complete/Not Yet Completed Primary School2. SD/Primary School3. SLTP/Junior High School4. a. SMTA Umum/Senior High School (General) b. SMTA Kejuruan/Senior High School (Vocational)5. a. Diploma I/II/III/Akademi/Diploma I/II/III/Academy b. Universitas/University
Angka yang tercetak miring adalah jumlah penduduk yang bekerjaFigures in italic denote total working population
Golongan UmurAge
Group
2015 2016
Februari/February Agustus/August Februari/February
Laki-lakiMale
Perempuan Female
Laki-lakiMale
Perempuan Female
Laki-lakiMale
Perempuan Female
15-19 928 660 577 839 1 085 448 800 372 739 779 515 431
20-24 1 507 278 947 106 1 663 977 1 046 155 1 474 554 1 001 335
25-29 806 347 565 763 810 921 433 489 869 081 371 946
30-34 409 405 246 335 364 416 212 398 341 898 175 578
35-39 237 125 149 484 227 189 132 637 262 883 137 911
40-44 137 277 141 002 133 971 94 368 161 880 100 253
45-49 155 836 196 782 127 008 74 357 149 191 75 217
50-54 120 935 86 156 103 648 44 494 172 887 59 293
55-59 130 438 31 620 95 338 42 552 93 398 40 081
60+ 53 940 25 439 48 088 19 996 155 602 125 974
Jumlah Total
4 487 241 2 967 526 4 660 004 2 900 818 4 421 153 2 603 019
Tingkat Pendidi-kan Tertinggi yang
DitamatkanEducational Attainment
2014 2015 2016
FebruariFebruary
Agustus August
FebruariFebruary
Agustus August
FebruariFebruary
1 18,53 18,32 19,09 16,84 16,54
2 28,27 28,75 26,09 27,42 26,92
3 17,83 17,75 17,77 18,03 17,80
4 25.23 25,39 26,15 26,69 27,39
5 1,14 9,79 10,89 11,01 11,34
Jumlah/Total100,00 100,00 100,00 100,00 100,00
118 169 922 114 628 026 120 846 821 114 819 199 120 647 697
http
://w
ww
.bps
.go.
id

25Perkembangan Beberapa Indikator Utama Sosial-Ekonomi Indonesia, Agustus 2016
Pekerja Tak Penuh Menurut Golongan Umur dan Jenis Kelamin, 2015-2016Worker Who Has Less Than Normal Working Hour by Age Group and Sex, 2015-2016
TabelTable 2.18
Penduduk Usia 15 Tahun ke Atas yang Bekerja Selama Seminggu yang Lalu Menurut Lapangan Pekerjaan Utama, 2015-2016 Population 15 Years of Age and Over Who Worked During the Previous Week by Main Industry, 2015-2016
TabelTable 2.19
Catatan/Note: 1. Pertanian, kehutanan, perburuan dan perikanan Agriculture, forestry, hunting and fisheries
2. Pertambangan dan penggalian/Mining and quarrying
3. Industri pengolahan/Manufacturing industry
4. Listrik, gas dan air/Electricity, gas and water
5. Bangunan/Construction
6. Perdagangan besar, eceran, rumah makan dan hotel Wholesale trade, retail trade, restaurant and hotel
7. Angkutan, pergudangan dan komunikasi Transportation, storage and communication
8. Keuangan, asuransi, usaha persewaan bangunan, tanah dan jasa perusahaan Financing, insurance, real estate, and business services
9. Jasa kemasyarakatan, sosial dan perorangan Community, social and personal services
Sumber: Keadaan Angkatan Kerja di Indonesia, BPSSource: Labor Force Situation In Indonesia, BPS-Statistics Indonesia
Golongan UmurAge
Group
2015 2016
Februari/February Agustus/August Februari/February
Laki-lakiMale
Perempuan Female
Laki-lakiMale
Perempuan Female
Laki-lakiMale
Perempuan Female
15-19 1 358 892 803 075 1 123 275 665 563 1 382 527 812 590
20-24 1 727 859 1 291 170 1 653 866 1 245 379 1 836 917 1 467 108
25-29 1 698 011 1 875 447 1 781 260 1 654 543 1 833 383 1 724 121
30-34 1 702 309 2 103 959 1 770 861 1 945 545 1 862 405 2 153 078
35-39 1 760 251 2 311 668 1 704 213 2 060 792 1 747 618 2 305 462
40-44 1 582 228 2 211 525 1 716 500 2 114 740 1 532 593 2 199 633
45-49 1 553 558 2 097 627 1 629 468 2 045 822 1 609 582 2 220 955
50-54 1 500 623 2 033 834 1 538 397 1 849 865 1 441 908 1 959 830
55-59 1 392 188 1 582 318 1 425 844 1 478 229 1 462 126 1 568 666
60+ 2 886 030 2 205 724 2 739 007 2 169 729 2 851 508 2 352 768
Jumlah Total
17 161 949 18 516 347 17 082 691 17 230 207 17 560 567 18 764 211
Pekerjaan UtamaMain
Industry
2015 2016
Februari/February Agustus/August Februari/February
Laki-lakiMale
Perempuan Female
Laki-lakiMale
Perempuan Female
Laki-lakiMale
Perempuan Female
1 24 270 246 15 852 570 24 218 153 13 530 075 24 230 218 14 060 893
2 1 285 554 135 363 1 188 837 131 629 1 187 882 123 952
3 9 622 114 6 760 642 9 118 729 6 136 370 9 351 630 6 623 456
4 270 275 41 559 264 815 23 882 353 692 50 132
5 7 535 703 178 681 8 010 671 197 415 7 501 099 206 198
6 12 758 433 13 888 735 12 646 253 13 040 089 13 429 664 15 065 772
7 4 840 225 351 956 4 771 938 334 879 4 854 682 337 809
8 2 582 800 1 061 081 2 315 083 951 455 2 414 049 1 067 549
9 10 259 413 9 151 471 9 616 109 8 322 817 10 393 854 9 395 166
Jumlah Total
73 424 763 47 422 058 72 150 588 42 668 611 73 716 770 46 930 927
Sumber: Keadaan Angkatan Kerja di Indonesia, BPSSource: Labor Force Situation In Indonesia, BPS-Statistics Indonesia
http
://w
ww
.bps
.go.
id
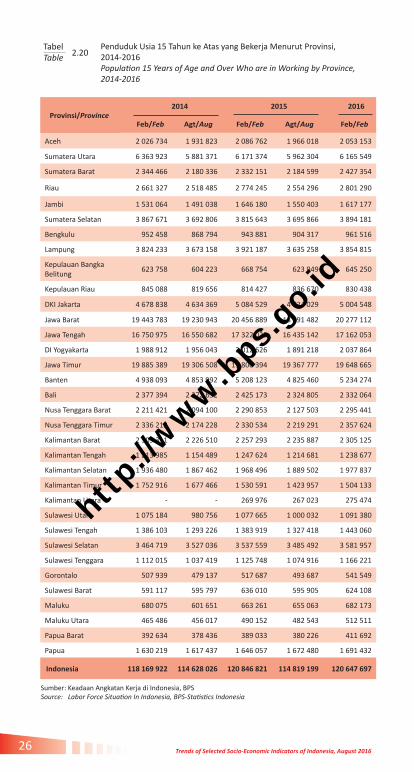
Trends of Selected Socio-Economic Indicators of Indonesia, August 201626
Penduduk Usia 15 Tahun ke Atas yang Bekerja Menurut Provinsi, 2014-2016Population 15 Years of Age and Over Who are in Working by Province,2014-2016
TabelTable 2.20
Sumber: Keadaan Angkatan Kerja di Indonesia, BPS Source: Labor Force Situation In Indonesia, BPS-Statistics Indonesia
Provinsi/Province 2014 2015 2016
Feb/Feb Agt/Aug Feb/Feb Agt/Aug Feb/Feb
Aceh 2 026 734 1 931 823 2 086 762 1 966 018 2 053 153
Sumatera Utara 6 363 923 5 881 371 6 171 374 5 962 304 6 165 549
Sumatera Barat 2 344 466 2 180 336 2 332 151 2 184 599 2 427 354
Riau 2 661 327 2 518 485 2 774 245 2 554 296 2 801 290
Jambi 1 531 064 1 491 038 1 646 180 1 550 403 1 617 177
Sumatera Selatan 3 867 671 3 692 806 3 815 643 3 695 866 3 894 181
Bengkulu 952 458 868 794 943 881 904 317 961 516
Lampung 3 824 233 3 673 158 3 921 187 3 635 258 3 854 815
Kepulauan Bangka Belitung
623 758 604 223 668 754 623 949 645 250
Kepulauan Riau 845 088 819 656 814 427 836 670 830 438
DKI Jakarta 4 678 838 4 634 369 5 084 529 4 724 029 5 004 548
Jawa Barat 19 443 783 19 230 943 20 456 889 18 791 482 20 277 112
Jawa Tengah 16 750 975 16 550 682 17 322 025 16 435 142 17 162 053
DI Yogyakarta 1 988 912 1 956 043 2 012 626 1 891 218 2 037 864
Jawa Timur 19 885 389 19 306 508 19 800 394 19 367 777 19 648 665
Banten 4 938 093 4 853 992 5 208 123 4 825 460 5 234 274
Bali 2 377 394 2 272 632 2 425 173 2 324 805 2 332 064
Nusa Tenggara Barat 2 211 421 2 094 100 2 290 853 2 127 503 2 295 441
Nusa Tenggara Timur 2 336 212 2 174 228 2 330 534 2 219 291 2 357 624
Kalimantan Barat 2 309 311 2 226 510 2 257 293 2 235 887 2 305 125
Kalimantan Tengah 1 213 985 1 154 489 1 247 624 1 214 681 1 238 677
Kalimantan Selatan 1 936 480 1 867 462 1 968 496 1 889 502 1 977 837
Kalimantan Timur 1 752 916 1 677 466 1 530 591 1 423 957 1 504 133
Kalimantan Utara - - 269 976 267 023 275 474
Sulawesi Utara 1 075 184 980 756 1 077 665 1 000 032 1 091 380
Sulawesi Tengah 1 386 103 1 293 226 1 383 919 1 327 418 1 443 060
Sulawesi Selatan 3 464 719 3 527 036 3 537 559 3 485 492 3 581 957
Sulawesi Tenggara 1 112 015 1 037 419 1 125 748 1 074 916 1 166 221
Gorontalo 507 939 479 137 517 687 493 687 541 549
Sulawesi Barat 591 117 595 797 636 010 595 905 624 108
Maluku 680 075 601 651 663 261 655 063 682 173
Maluku Utara 465 486 456 017 490 152 482 543 512 511
Papua Barat 392 634 378 436 389 033 380 226 411 692
Papua 1 630 219 1 617 437 1 646 057 1 672 480 1 691 432
Indonesia 118 169 922 114 628 026 120 846 821 114 819 199 120 647 697
http
://w
ww
.bps
.go.
id

27Perkembangan Beberapa Indikator Utama Sosial-Ekonomi Indonesia, Agustus 2016
Penduduk Usia 15 Tahun ke Atas yang Termasuk Pengangguran Terbuka Menurut Provinsi dan Jenis Kelamin, 2015-2016Population 15 Years of Age and Over Who are in Unemployment by Province and Sex, 2015-2016
TabelTable 2.21
Sumber: Keadaan Angkatan Kerja di Indonesia, BPSSource: Labor Force Situation In Indonesia, BPS-Statistics Indonesia
ProvinsiProvince
2015 2016
Februari/February Agustus/August Februari/February
Laki-lakiMale
Perem-puan
Female
Laki-lakiMale
Perem-puan
Female
Laki-lakiMale
Perem-puan
Female
Aceh 99 071 75 635 116 364 100 442 102 519 79 288
Sumatera Utara 213 840 207 392 234 638 194 156 224 013 203 951
Sumatera Barat 71 776 76 901 95 048 66 516 84 170 65 517
Riau 123 431 76 338 115 240 101 813 96 341 80 607
Jambi 29 699 16 538 42 428 27 921 44 574 34 499
Sumatera Selatan 136 327 65 892 143 413 95 508 121 610 37 915
Bengkulu 12 482 18 807 25 861 20 829 18 694 19 651
Lampung 68 997 70 512 112 096 84 754 108 018 75 481
Kepulauan Bangka Belitung
16 475 6 699 23 248 18 645 23 182 19 216
Kepulauan Riau 47 866 33 150 36 993 18 325 63 059 19 407
DKI Jakarta 258 465 205 440 239 696 128 494 217 737 88 488
Jawa Barat 1 198 336 677 588 1 178 424 616 450 1283 376 616 331
Jawa Tengah 538 558 432 059 572 764 291 019 491 298 261 167
DI Yogyakarta 61 622 23 832 41 961 38 284 41 145 17 856
Jawa Timur 554 385 337 630 548 954 357 950 464 585 384 742
Banten 332 781 156 102 335 517 173 866 313 373 138 685
Bali 18 856 14 755 29 236 17 974 43 426 6 976
Nusa Tenggara Barat 71 367 48 759 88 294 40 082 56 032 31 143
Nusa Tenggara Timur 33 048 42 062 41 835 46 611 45 014 42 685
Kalimantan Barat 80 058 33 139 81 193 40 144 65 913 44 837
Kalimantan Tengah 26 577 13 862 35 047 22 733 22 869 24 370
Kalimantan Selatan 62 316 37 637 60 496 37 252 50 322 24 072
Kalimantan Timur 73 146 45 101 74 850 40 684 108 364 37 880
Kalimantan Utara 8 077 8 516 10 579 5 500 8 086 3 142
Sulawesi Utara 48 199 54 403 53 129 46 111 45 452 47 196
Sulawesi Tengah 27 721 14 887 30 480 26 337 23 018 28 679
Sulawesi Selatan 149 417 68 894 128 262 92 374 124 335 68 634
Sulawesi Tenggara 21 530 20 748 29 341 33 788 24 465 21 354
Gorontalo 8 887 7 438 13 193 10 908 12 230 9 623
Sulawesi Barat 6 249 5 450 8 383 12 261 10 027 7 394
Maluku 19 890 27 905 36 081 36 115 27 809 23 355
Maluku Utara 16 165 12 665 16 114 14 944 5 772 12 438
Papua Barat 12 656 6 150 17 501 15 908 15 748 9 289
Papua 38 971 24 640 43 345 26 120 34 577 17 151
Indonesia 4 487 241 2 967 526 4 660 004 2 900 818 4 421 153 2 603 019
http
://w
ww
.bps
.go.
id
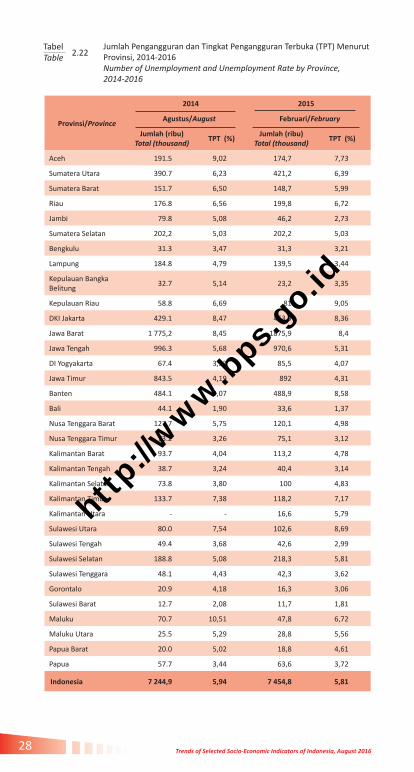
Trends of Selected Socio-Economic Indicators of Indonesia, August 201628
Jumlah Pengangguran dan Tingkat Pengangguran Terbuka (TPT) Menurut Provinsi, 2014-2016Number of Unemployment and Unemployment Rate by Province,2014-2016
TabelTable 2.22
Provinsi/Province
2014 2015
Agustus/August Februari/February
Jumlah (ribu)Total (thousand)
TPT (%)Jumlah (ribu)
Total (thousand)TPT (%)
Aceh 191.5 9,02 174,7 7,73
Sumatera Utara 390.7 6,23 421,2 6,39
Sumatera Barat 151.7 6,50 148,7 5,99
Riau 176.8 6,56 199,8 6,72
Jambi 79.8 5,08 46,2 2,73
Sumatera Selatan 202,2 5,03 202,2 5,03
Bengkulu 31.3 3,47 31,3 3,21
Lampung 184.8 4,79 139,5 3,44
Kepulauan Bangka Belitung
32.7 5,14 23,2 3,35
Kepulauan Riau 58.8 6,69 81 9,05
DKI Jakarta 429.1 8,47 463,9 8,36
Jawa Barat 1 775,2 8,45 1875,9 8,4
Jawa Tengah 996.3 5,68 970,6 5,31
DI Yogyakarta 67.4 3,33 85,5 4,07
Jawa Timur 843.5 4,19 892 4,31
Banten 484.1 9,07 488,9 8,58
Bali 44.1 1,90 33,6 1,37
Nusa Tenggara Barat 127.7 5,75 120,1 4,98
Nusa Tenggara Timur 73.2 3,26 75,1 3,12
Kalimantan Barat 93.7 4,04 113,2 4,78
Kalimantan Tengah 38.7 3,24 40,4 3,14
Kalimantan Selatan 73.8 3,80 100 4,83
Kalimantan Timur 133.7 7,38 118,2 7,17
Kalimantan Utara - - 16,6 5,79
Sulawesi Utara 80.0 7,54 102,6 8,69
Sulawesi Tengah 49.4 3,68 42,6 2,99
Sulawesi Selatan 188.8 5,08 218,3 5,81
Sulawesi Tenggara 48.1 4,43 42,3 3,62
Gorontalo 20.9 4,18 16,3 3,06
Sulawesi Barat 12.7 2,08 11,7 1,81
Maluku 70.7 10,51 47,8 6,72
Maluku Utara 25.5 5,29 28,8 5,56
Papua Barat 20.0 5,02 18,8 4,61
Papua 57.7 3,44 63,6 3,72
Indonesia 7 244,9 5,94 7 454,8 5,81
http
://w
ww
.bps
.go.
id

29Perkembangan Beberapa Indikator Utama Sosial-Ekonomi Indonesia, Agustus 2016
Provinsi/Province
2015 2016
Agustus/August Februari/February
Jumlah (ribu)Total (thousand)
TPT (%)Jumlah (ribu)
Total (thousand)TPT (%)
Aceh 216,8 9,93 181,8 8,13
Sumatera Utara 428,8 6,71 428,0 6,49
Sumatera Barat 161,6 6,89 149,7 5,81
Riau 217,1 7,83 176,9 5,94
Jambi 70,3 4,34 079,1 4,66
Sumatera Selatan 238,9 6,07 159,5 3,94
Bengkulu 46,7 4,91 038,3 3,84
Lampung 196,9 5,14 183,5 4,54
Kepulauan Bangka Belitung
41,9 6,29 042,4 6,17
Kepulauan Riau 55,3 6,2 082,5 9,03
DKI Jakarta 368,2 7,23 306,2 5,77
Jawa Barat 1794,9 8,72 1899,7 8,57
Jawa Tengah 863,8 4,99 752,5 4,20
DI Yogyakarta 80,2 4,07 059,0 2,81
Jawa Timur 906,9 4,47 849,3 4,14
Banten 509,4 9,55 452,1 7,95
Bali 47,2 1,99 050,4 2,12
Nusa Tenggara Barat 128,4 5,69 087,2 3,66
Nusa Tenggara Timur 88,4 3,83 087,7 3,59
Kalimantan Barat 121,3 5,15 110,8 4,58
Kalimantan Tengah 57,8 4,54 047,2 3,67
Kalimantan Selatan 97,7 4,92 074,4 3,63
Kalimantan Timur 115,5 7,5 146,2 8,86
Kalimantan Utara 16,1 5,68 011,2 3,92
Sulawesi Utara 99,2 9,03 092,6 7,82
Sulawesi Tengah 56,8 4,1 051,7 3,46
Sulawesi Selatan 220,6 5,95 193,0 5,11
Sulawesi Tenggara 63,1 5,55 045,8 3,78
Gorontalo 24,1 4,65 021,9 3,88
Sulawesi Barat 20,6 3,35 017,4 2,72
Maluku 72,2 9,93 051,2 6,98
Maluku Utara 31,1 6,05 018,2 3,43
Papua Barat 33,4 8,08 025,0 5,73
Papua 69,5 3,99 051,7 2,97
Indonesia 7 560,8 6,18 7 024,2 5,50
Source: Labor Force Situation In Indonesia, Monthly Report on Socio-Economic Data, BPS-Statistics Indonesia
Lanjutan Tabel 2.22/Continued Table 2.22
Sumber: Keadaan Angkatan Kerja di Indonesia, Laporan Bulanan Data Sosial Ekonomi, BPS
http
://w
ww
.bps
.go.
id
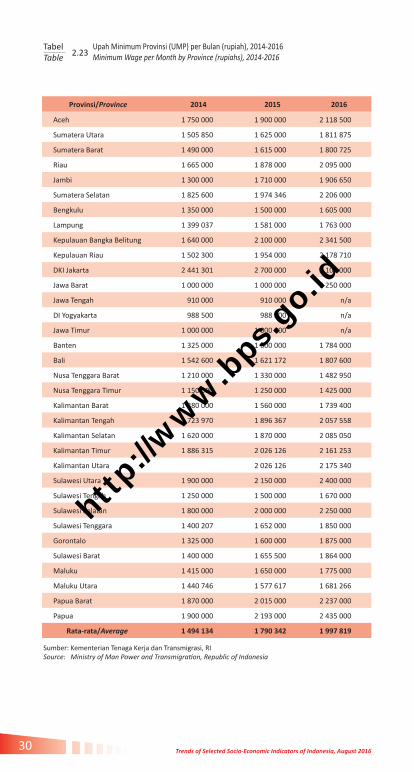
Trends of Selected Socio-Economic Indicators of Indonesia, August 201630
Provinsi/Province 2014 2015 2016
Aceh 1 750 000 1 900 000 2 118 500
Sumatera Utara 1 505 850 1 625 000 1 811 875
Sumatera Barat 1 490 000 1 615 000 1 800 725
Riau 1 665 000 1 878 000 2 095 000
Jambi 1 300 000 1 710 000 1 906 650
Sumatera Selatan 1 825 600 1 974 346 2 206 000
Bengkulu 1 350 000 1 500 000 1 605 000
Lampung 1 399 037 1 581 000 1 763 000
Kepulauan Bangka Belitung 1 640 000 2 100 000 2 341 500
Kepulauan Riau 1 502 300 1 954 000 2 178 710
DKI Jakarta 2 441 301 2 700 000 3 100 000
Jawa Barat 1 000 000 1 000 000 2 250 000
Jawa Tengah 910 000 910 000 n/a
DI Yogyakarta 988 500 988 500 n/a
Jawa Timur 1 000 000 1 000 000 n/a
Banten 1 325 000 1 600 000 1 784 000
Bali 1 542 600 1 621 172 1 807 600
Nusa Tenggara Barat 1 210 000 1 330 000 1 482 950
Nusa Tenggara Timur 1 150 000 1 250 000 1 425 000
Kalimantan Barat 1 380 000 1 560 000 1 739 400
Kalimantan Tengah 1 723 970 1 896 367 2 057 558
Kalimantan Selatan 1 620 000 1 870 000 2 085 050
Kalimantan Timur 1 886 315 2 026 126 2 161 253
Kalimantan Utara 2 026 126 2 175 340
Sulawesi Utara 1 900 000 2 150 000 2 400 000
Sulawesi Tengah 1 250 000 1 500 000 1 670 000
Sulawesi Selatan 1 800 000 2 000 000 2 250 000
Sulawesi Tenggara 1 400 207 1 652 000 1 850 000
Gorontalo 1 325 000 1 600 000 1 875 000
Sulawesi Barat 1 400 000 1 655 500 1 864 000
Maluku 1 415 000 1 650 000 1 775 000
Maluku Utara 1 440 746 1 577 617 1 681 266
Papua Barat 1 870 000 2 015 000 2 237 000
Papua 1 900 000 2 193 000 2 435 000
Rata-rata/Average 1 494 134 1 790 342 1 997 819
Upah Minimum Provinsi (UMP) per Bulan (rupiah), 2014-2016Minimum Wage per Month by Province (rupiahs), 2014-2016
TabelTable 2.23
Sumber: Kementerian Tenaga Kerja dan Transmigrasi, RI Source: Ministry of Man Power and Transmigration, Republic of Indonesia
http
://w
ww
.bps
.go.
id

31Perkembangan Beberapa Indikator Utama Sosial-Ekonomi Indonesia, Agustus 2016
Rata-rata Upah/Gaji/Pendapatan Buruh/Karyawan/Pegawai Sebulan Menurut Provinsi (rupiah), 2014-2016Monthly Average of Wage/Salary/Income of Employee by Province(rupiahs), 2014-2016
TabelTable 2.24
Sumber/Source: Keadaan Pekerja di Indonesia/Laborer Situation in Indonesia, BPS-Statistics Indonesia
Provinsi/Province 2014 1) 2015 2016
Feb/Feb Agt/Aug Feb/Feb Agt/Aug Feb/Feb
Aceh 1 731 183 1 753 751 1 744 567 1 778 391 1 918 693
Sumatera Utara 1 676 004 1 730 339 1 741 630 1 823 098 1 921 405
Sumatera Barat 1 881 098 1 861 014 1 899 477 1 956 370 2 013 917
Riau 2 134 079 2 089 740 2 099 410 2 175 996 2 307 730
Jambi 1 764 244 1 844 704 1 860 039 1 937 969 1 976 810
Sumatera Selatan 1 596 162 1 820 905 1 807 585 1 935 432 1 958 713
Bengkulu 1 867 602 1 888 086 1 931 307 2 014 786 2 048 409
Lampung 1 564 318 1 695 552 1 714 314 1 843 739 1 889 021
Kepulauan Bangka Belitung
1 933 808 1 963 690 1 956 133 2 079 250 2 214 195
Kepulauan Riau 2 744 863 3 371 942 3 411 132 3 454 228 3 503 427
DKI Jakarta 2 871 802 2 906 219 2 918 226 3 048 357 3 180 389
Jawa Barat 1 900 760 1 950 345 2 004 484 2 087 292 2 203 838
Jawa Tengah 1 378 134 1 408 241 1 454 952 1 565 697 1 703 709
DI Yogyakarta 1 690 938 1 724 646 1 745 684 1 822 676 2 057 444
Jawa Timur 1 490 826 1 574 956 1 612 501 1 676 543 1 785 555
Banten 2 366 672 2 396 002 2 392 637 2 545 044 2 647 970
Bali 1 883 179 1 908 186 1 930 920 1 999 473 2 251 544
Nusa Tenggara Barat 1 692 031 1 829 422 1 795 693 1 872 931 1 976 154
Nusa Tenggara Timur 1 784 355 1 808 374 1 845 059 1 894 673 1 972 860
Kalimantan Barat 1 831 499 1 954 650 1 978 910 2 070 443 2 104 459
Kalimantan Tengah 2 065 872 2 094 590 2 137 820 2 215 984 2 334 626
Kalimantan Selatan 2 149 149 2 160 629 2 184 686 2 238 112 2 255 275
Kalimantan Timur 2 823 438 2 819 213 2 825 155 2 955 113 3 180 944
Kalimantan Utara - - 2 559 358 2 704 530 2 764 629
Sulawesi Utara 2 077 495 2 150 512 2 179 352 2 279 713 2 457 069
Sulawesi Tengah 1 831 205 1 910 130 1 955 729 1 965 819 2 176 761
Sulawesi Selatan 1 887 418 1 978 161 2 021 331 2 067 582 2 200 159
Sulawesi Tenggara 2 017 945 2 026 599 2 063 540 2 209 883 2 390 548
Gorontalo 1 606 871 1 704 388 1 734 347 1 840 827 2 088 940
Sulawesi Barat 1 749 757 2 062 204 2 054 723 2 105 908 2 188 318
Maluku 2 036 042 2 328 409 2 279 362 2 425 067 2 516 875
Maluku Utara 2 061 758 2 204 898 2 215 427 2 237 840 2 313 507
Papua Barat 2 729 619 2 730 795 2 750 392 2 780 917 2 847 164
Papua 2 847 628 3 149 950 3 114 182 3 178 084 3 227 277
Indonesia 1 885 815 1 952 589 1 981 725 2 069 306 2 180 577
Catatan: 1) Menggunakan penimbang hasil proyeksi penduduk 2010-2035Note: 1) weighted by the 2010-2035 population projection
http
://w
ww
.bps
.go.
id

http
://w
ww
.bps
.go.
id
3SOSIAL
SOCIAL AFFAIRS
hhttp://dinkesos.babelprov.go.id/content/mengenal-jabatan-sosial-pekerja-sosial
http
://w
ww
.bps
.go.
id

http
://w
ww
.bps
.go.
id

35Perkembangan Beberapa Indikator Utama Sosial-Ekonomi Indonesia, Agustus 2016
Persentase Wanita yang Pernah Kawin Menurut Umur Perkawinan Pertama, 2015 Percentage of Ever Married Women by Age of The First Marriage, 2015
TabelTable 3.1
Sumber: Indikator Kesejahteraan Rakyat, BPS Source: Welfare Indicators, BPS-Statistics Indonesia
Provinsi/Province Umur (Tahun)/Age (Year)
<=16 17-18 19-20 21 +
Aceh 6,09 14,02 32,07 47,82
Sumatera Utara 3,27 10,07 19,75 66,91
Sumatera Barat 4,40 10,02 30,27 55,31
Riau 7,30 14,19 27,61 50,90
Jambi 11,21 21,49 39,77 27,53
Sumatera Selatan 8,87 15,76 46,24 29,13
Bengkulu 9,95 20,01 41,76 28,28
Lampung 8,45 20,59 42,31 28,65
Kepulauan Bangka Belitung 8,85 16,21 28,37 46,57
Kepulauan Riau 2,84 7,65 22,10 67,41
DKI Jakarta 3,77 8,31 17,72 70,21
Jawa Barat 10,75 29,96 34,93 24,36
Jawa Tengah 6,64 19,71 46,78 26,88
DI Yogyakarta 2,09 6,76 19,21 71,94
Jawa Timur 8,99 21,75 44,91 24,35
Banten 11,33 24,90 31,61 32,16
Bali 4,23 9,86 15,92 69,99
Nusa Tenggara Barat 8,68 17,00 31,63 42,69
Nusa Tenggara Timur 3,82 10,21 16,90 69,08
Kalimantan Barat 9,11 16,53 44,70 29,66
Kalimantan Tengah 13,48 23,11 37,49 25,92
Kalimantan Selatan 13,81 29,67 30,98 25,54
Kalimantan Timur 7,88 18,31 26,20 47,62
Kalimantan Utara 10,36 15,91 24,38 49,36
Sulawesi Utara 5,89 13,29 16,40 64,42
Sulawesi Tengah 10,67 16,23 44,18 28,92
Sulawesi Selatan 9,76 13,34 28,85 48,05
Sulawesi Tenggara 11,75 17,24 42,76 28,25
Gorontalo 9,03 16,25 23,82 50,89
Sulawesi Barat 13,35 18,48 42,08 26,09
Maluku 5,24 11,66 17,86 65,23
Maluku Utara 7,10 15,20 25,08 52,62
Papua Barat 9,26 16,13 21,18 53,43
Papua 7,59 17,69 26,07 48,65
Indonesia 8,24 19,78 35,71 36,26
http
://w
ww
.bps
.go.
id

Trends of Selected Socio-Economic Indicators of Indonesia, August 201636
TabelTable 3.2
ProvinsiProvince
Dokter KandunganObstetrician
Dokter UmumGeneral Practisioner
BidanMidwives
PerawatNurse
Aceh 21,49 1,37 72,10 0,20
Sumatera Utara 19,17 2,42 71,75 0,53
Sumatera Barat 25,85 2,39 67,45 0,39
Riau 23,00 1,78 63,72 0,40
Jambi 18,94 2,61 66,21 0,20
Sumatera Selatan 16,70 1,66 73,09 0,58
Bengkulu 23,80 0,76 69,46 0,81
Lampung 14,73 2,97 73,20 0,55
Kepulauan Bangka Belitung
25,82 2,45 68,19 1,10
Kepulauan Riau 39,96 2,79 54,88 0,00
DKI Jakarta 44,17 2,01 52,72 0,41
Jawa Barat 19,55 2,37 66,90 0,25
Jawa Tengah 28,08 1,41 68,27 0,87
DI Yogyakarta 56,28 0,72 41,06 1,43
Jawa Timur 28,85 1,76 64,94 0,67
Banten 20,75 2,08 62,36 0,34
Bali 52,15 3,99 43,19 0,47
Nusa Tenggara Barat 14,70 3,00 77,03 0,55
Nusa Tenggara Timur 10,63 2,58 58,67 1,54
Kalimantan Barat 14,88 0,41 65,21 0,81
Kalimantan Tengah 14,70 0,90 64,36 0,94
Kalimantan Selatan 19,14 0,99 71,74 0,70
Kalimantan Timur 27,84 2,34 63,48 1,04
Kalimantan Utara 25,05 1,01 68,85 0,47
Sulawesi Utara 33,34 3,49 49,83 2,45
Sulawesi Tengah 16,04 3,37 60,59 0,49
Sulawesi Selatan 20,35 2,60 67,87 0,15
Sulawesi Tenggara 10,94 2,65 64,56 0,14
Gorontalo 23,24 2,32 60,28 1,15
Sulawesi Barat 8,83 1,55 62,07 1,03
Maluku 11,20 1,99 45,19 1,49
Maluku Utara 16,20 1,92 46,02 1,46
Papua Barat 22,24 2,76 47,02 4,40
Papua 15,60 3,06 38,05 2,87
Indonesia 23,51 2,07 65,07 0,62
Sumber: Survei Sosial Ekonomi Nasional, BPS Source: National Socio-Economic Survey, BPS-Statistics Indonesia
Persentase Perempuan Berumur 15-49 Tahun yang Pernah Kawin yang melahirkan anak dalam 2 tahun terakhir di Daerah Perkotaan dan Perdesaan menurut Provinsi dan Penolong Proses Kelahiran Terakhir, 2015 Percentage of Ever Married Female Aged 15-49 Years that childbearing in the last 2 years in Urban and Rural Area by Province and Last Birth Attendant, 2015
http
://w
ww
.bps
.go.
id
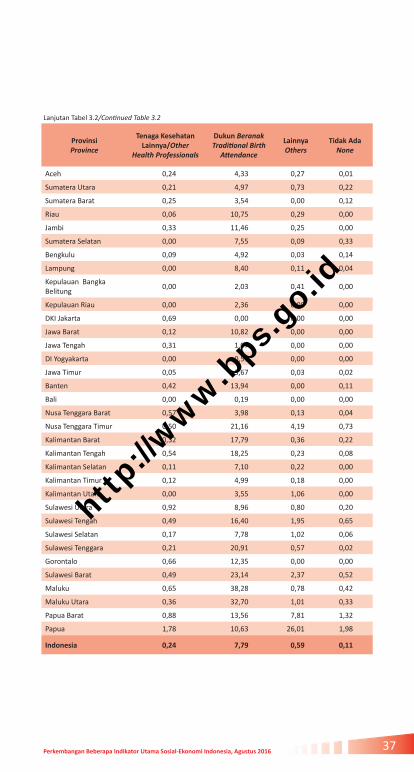
37Perkembangan Beberapa Indikator Utama Sosial-Ekonomi Indonesia, Agustus 2016
Lanjutan Tabel 3.2/Continued Table 3.2
ProvinsiProvince
Tenaga Kesehatan Lainnya/Other
Health Professionals
Dukun BeranakTraditional Birth
Attendance
Lainnya Others
Tidak Ada None
Aceh 0,24 4,33 0,27 0,01
Sumatera Utara 0,21 4,97 0,73 0,22
Sumatera Barat 0,25 3,54 0,00 0,12
Riau 0,06 10,75 0,29 0,00
Jambi 0,33 11,46 0,25 0,00
Sumatera Selatan 0,00 7,55 0,09 0,33
Bengkulu 0,09 4,92 0,03 0,14
Lampung 0,00 8,40 0,11 0,04
Kepulauan Bangka Belitung
0,00 2,03 0,41 0,00
Kepulauan Riau 0,00 2,36 0,00 0,00
DKI Jakarta 0,69 0,00 0,00 0,00
Jawa Barat 0,12 10,82 0,00 0,00
Jawa Tengah 0,31 1,07 0,00 0,00
DI Yogyakarta 0,00 0,51 0,00 0,00
Jawa Timur 0,05 3,67 0,03 0,02
Banten 0,42 13,94 0,00 0,11
Bali 0,00 0,19 0,00 0,00
Nusa Tenggara Barat 0,57 3,98 0,13 0,04
Nusa Tenggara Timur 0,50 21,16 4,19 0,73
Kalimantan Barat 0,32 17,79 0,36 0,22
Kalimantan Tengah 0,54 18,25 0,23 0,08
Kalimantan Selatan 0,11 7,10 0,22 0,00
Kalimantan Timur 0,12 4,99 0,18 0,00
Kalimantan Utara 0,00 3,55 1,06 0,00
Sulawesi Utara 0,92 8,96 0,80 0,20
Sulawesi Tengah 0,49 16,40 1,95 0,65
Sulawesi Selatan 0,17 7,78 1,02 0,06
Sulawesi Tenggara 0,21 20,91 0,57 0,02
Gorontalo 0,66 12,35 0,00 0,00
Sulawesi Barat 0,49 23,14 2,37 0,52
Maluku 0,65 38,28 0,78 0,42
Maluku Utara 0,36 32,70 1,01 0,33
Papua Barat 0,88 13,56 7,81 1,32
Papua 1,78 10,63 26,01 1,98
Indonesia 0,24 7,79 0,59 0,11
http
://w
ww
.bps
.go.
id
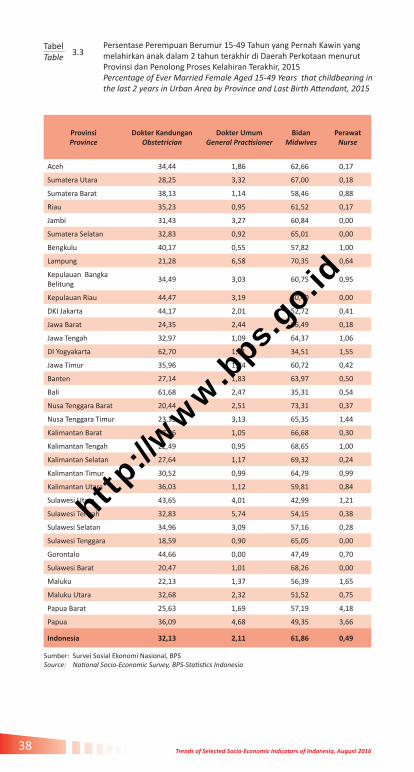
Trends of Selected Socio-Economic Indicators of Indonesia, August 201638
TabelTable 3.3
Persentase Perempuan Berumur 15-49 Tahun yang Pernah Kawin yang melahirkan anak dalam 2 tahun terakhir di Daerah Perkotaan menurut Provinsi dan Penolong Proses Kelahiran Terakhir, 2015 Percentage of Ever Married Female Aged 15-49 Years that childbearing in the last 2 years in Urban Area by Province and Last Birth Attendant, 2015
ProvinsiProvince
Dokter KandunganObstetrician
Dokter UmumGeneral Practisioner
BidanMidwives
PerawatNurse
Aceh 34,44 1,86 62,66 0,17
Sumatera Utara 28,25 3,32 67,00 0,18
Sumatera Barat 38,13 1,14 58,46 0,88
Riau 35,23 0,95 61,52 0,17
Jambi 31,43 3,27 60,84 0,00
Sumatera Selatan 32,83 0,92 65,01 0,00
Bengkulu 40,17 0,55 57,82 1,00
Lampung 21,28 6,58 70,35 0,64
Kepulauan Bangka Belitung
34,49 3,03 60,75 0,95
Kepulauan Riau 44,47 3,19 50,40 0,00
DKI Jakarta 44,17 2,01 52,72 0,41
Jawa Barat 24,35 2,44 66,49 0,18
Jawa Tengah 32,97 1,09 64,37 1,06
DI Yogyakarta 62,70 1,01 34,51 1,55
Jawa Timur 35,96 1,74 60,72 0,42
Banten 27,14 1,83 63,97 0,50
Bali 61,68 2,47 35,31 0,54
Nusa Tenggara Barat 20,44 2,51 73,31 0,37
Nusa Tenggara Timur 23,33 3,13 65,35 1,44
Kalimantan Barat 27,96 1,05 66,68 0,30
Kalimantan Tengah 22,49 0,95 68,65 1,00
Kalimantan Selatan 27,64 1,17 69,32 0,24
Kalimantan Timur 30,52 0,99 64,79 0,99
Kalimantan Utara 36,03 1,12 59,81 0,84
Sulawesi Utara 43,65 4,01 42,99 1,21
Sulawesi Tengah 32,83 5,74 54,15 0,38
Sulawesi Selatan 34,96 3,09 57,16 0,28
Sulawesi Tenggara 18,59 0,90 65,05 0,00
Gorontalo 44,66 0,00 47,49 0,70
Sulawesi Barat 20,47 1,01 68,26 0,00
Maluku 22,13 1,37 56,39 1,65
Maluku Utara 32,68 2,32 51,52 0,75
Papua Barat 25,63 1,69 57,19 4,18
Papua 36,09 4,68 49,35 3,66
Indonesia 32,13 2,11 61,86 0,49
Sumber: Survei Sosial Ekonomi Nasional, BPS Source: National Socio-Economic Survey, BPS-Statistics Indonesia
http
://w
ww
.bps
.go.
id

39Perkembangan Beberapa Indikator Utama Sosial-Ekonomi Indonesia, Agustus 2016
Lanjutan Tabel 3.3/Continued Table 3.3
ProvinsiProvince
Tenaga Kesehatan Lainnya/Other
Health Professionals
Dukun BeranakTraditional Birth
Attendance
Lainnya Others
Tidak Ada None
Aceh 0,00 0,68 0,20 0,00
Sumatera Utara 0,18 0,99 0,08 0,02
Sumatera Barat 0,57 0,81 0,00 0,00
Riau 0,00 1,42 0,71 0,00
Jambi 0,53 3,94 0,00 0,00
Sumatera Selatan 0,00 1,25 0,00 0,00
Bengkulu 0,00 0,45 0,00 0,00
Lampung 0,00 1,15 0,00 0,00
Kepulauan Bangka Belitung
0,00 0,00 0,78 0,00
Kepulauan Riau 0,00 1,93 0,00 0,00
DKI Jakarta 0,69 0,00 0,00 0,00
Jawa Barat 0,00 6,53 0,00 0,00
Jawa Tengah 0,25 0,25 0,00 0,00
DI Yogyakarta 0,00 0,22 0,00 0,00
Jawa Timur 0,04 1,08 0,00 0,04
Banten 0,62 5,95 0,00 0,00
Bali 0,00 0,00 0,00 0,00
Nusa Tenggara Barat 0,29 2,77 0,30 0,00
Nusa Tenggara Timur 0,45 5,89 0,41 0,00
Kalimantan Barat 0,37 3,65 0,00 0,00
Kalimantan Tengah 0,00 6,90 0,00 0,00
Kalimantan Selatan 0,00 1,63 0,00 0,00
Kalimantan Timur 0,00 2,45 0,27 0,00
Kalimantan Utara 0,00 1,66 0,55 0,00
Sulawesi Utara 0,04 6,35 1,75 0,00
Sulawesi Tengah 0,80 6,10 0,00 0,00
Sulawesi Selatan 0,08 4,36 0,00 0,07
Sulawesi Tenggara 0,00 14,99 0,47 0,00
Gorontalo 0,90 6,25 0,00 0,00
Sulawesi Barat 0,00 9,80 0,46 0,00
Maluku 0,00 17,14 1,31 0,00
Maluku Utara 0,00 12,71 0,02 0,00
Papua Barat 0,00 7,82 2,12 1,38
Papua 0,34 4,25 1,63 0,00
Indonesia 0,18 3,13 0,08 0,01
http
://w
ww
.bps
.go.
id

Trends of Selected Socio-Economic Indicators of Indonesia, August 201640
TabelTable 3.4
Persentase Perempuan Berumur 15-49 Tahun yang Pernah Kawin yang melahirkan anak dalam 2 tahun terakhir di Daerah Perdesaan menurut Provinsi dan Penolong Proses Kelahiran Terakhir, 2015 Percentage of Ever Married Female Aged 15-49 Years that childbearing in the last 2 years in Rural Area by Province and Last Birth Attendant, 2015
ProvinsiProvince
Dokter KandunganObstetrician
Dokter UmumGeneral Practisioner
BidanMidwives
PerawatNurse
Aceh 16,25 1,18 75,91 0,21
Sumatera Utara 10,69 1,58 76,18 0,86
Sumatera Barat 18,90 3,10 72,54 0,10
Riau 14,58 2,35 65,24 0,56
Jambi 13,34 2,31 68,62 0,30
Sumatera Selatan 7,97 2,05 77,47 0,89
Bengkulu 15,89 0,86 75,07 0,71
Lampung 12,04 1,49 74,37 0,51
Kepulauan Bangka Belitung
16,27 1,81 76,38 1,27
Kepulauan Riau 15,61 0,65 79,04 0,00
DKI Jakarta - - - -
Jawa Barat 10,06 2,23 67,70 0,38
Jawa Tengah 23,80 1,68 71,67 0,70
DI Yogyakarta 40,54 0,00 57,10 1,12
Jawa Timur 22,14 1,77 68,92 0,91
Banten 7,41 2,61 59,02 0,00
Bali 35,50 6,65 56,97 0,35
Nusa Tenggara Barat 10,42 3,37 79,80 0,68
Nusa Tenggara Timur 8,14 2,47 57,35 1,57
Kalimantan Barat 8,78 0,12 64,52 1,05
Kalimantan Tengah 9,78 0,87 61,65 0,89
Kalimantan Selatan 13,19 0,86 73,44 1,02
Kalimantan Timur 22,74 4,93 61,00 1,14
Kalimantan Utara 10,89 0,88 80,51 0,00
Sulawesi Utara 25,92 3,11 54,75 3,34
Sulawesi Tengah 11,12 2,68 62,48 0,53
Sulawesi Selatan 11,74 2,31 74,17 0,08
Sulawesi Tenggara 8,29 3,26 64,39 0,19
Gorontalo 12,68 3,47 66,58 1,38
Sulawesi Barat 6,17 1,67 60,65 1,27
Maluku 5,51 2,32 39,37 1,40
Maluku Utara 10,99 1,80 44,27 1,69
Papua Barat 20,47 3,32 41,71 4,52
Papua 4,77 2,21 32,09 2,46
Indonesia 14,88 2,04 68,28 0,74
Sumber: Survei Sosial Ekonomi Nasional, BPS Source: National Socio-Economic Survey, BPS-Statistics Indonesia
http
://w
ww
.bps
.go.
id
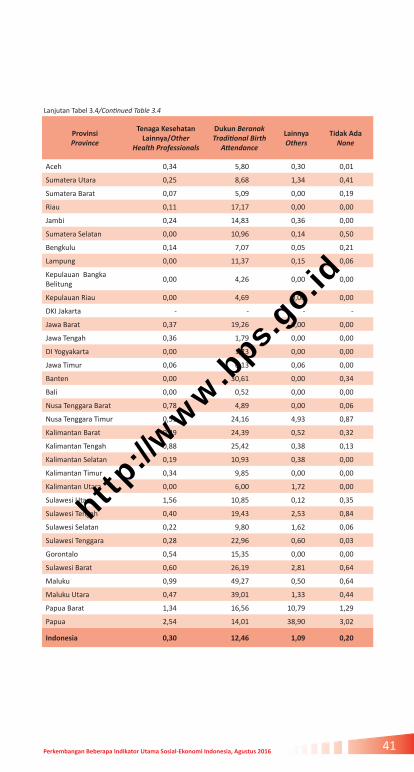
41Perkembangan Beberapa Indikator Utama Sosial-Ekonomi Indonesia, Agustus 2016
Lanjutan Tabel 3.4/Continued Table 3.4
ProvinsiProvince
Tenaga Kesehatan Lainnya/Other
Health Professionals
Dukun BeranakTraditional Birth
Attendance
Lainnya Others
Tidak Ada None
Aceh 0,34 5,80 0,30 0,01
Sumatera Utara 0,25 8,68 1,34 0,41
Sumatera Barat 0,07 5,09 0,00 0,19
Riau 0,11 17,17 0,00 0,00
Jambi 0,24 14,83 0,36 0,00
Sumatera Selatan 0,00 10,96 0,14 0,50
Bengkulu 0,14 7,07 0,05 0,21
Lampung 0,00 11,37 0,15 0,06
Kepulauan Bangka Belitung
0,00 4,26 0,00 0,00
Kepulauan Riau 0,00 4,69 0,00 0,00
DKI Jakarta - - - -
Jawa Barat 0,37 19,26 0,00 0,00
Jawa Tengah 0,36 1,79 0,00 0,00
DI Yogyakarta 0,00 1,23 0,00 0,00
Jawa Timur 0,06 6,13 0,06 0,00
Banten 0,00 30,61 0,00 0,34
Bali 0,00 0,52 0,00 0,00
Nusa Tenggara Barat 0,78 4,89 0,00 0,06
Nusa Tenggara Timur 0,51 24,16 4,93 0,87
Kalimantan Barat 0,29 24,39 0,52 0,32
Kalimantan Tengah 0,88 25,42 0,38 0,13
Kalimantan Selatan 0,19 10,93 0,38 0,00
Kalimantan Timur 0,34 9,85 0,00 0,00
Kalimantan Utara 0,00 6,00 1,72 0,00
Sulawesi Utara 1,56 10,85 0,12 0,35
Sulawesi Tengah 0,40 19,43 2,53 0,84
Sulawesi Selatan 0,22 9,80 1,62 0,06
Sulawesi Tenggara 0,28 22,96 0,60 0,03
Gorontalo 0,54 15,35 0,00 0,00
Sulawesi Barat 0,60 26,19 2,81 0,64
Maluku 0,99 49,27 0,50 0,64
Maluku Utara 0,47 39,01 1,33 0,44
Papua Barat 1,34 16,56 10,79 1,29
Papua 2,54 14,01 38,90 3,02
Indonesia 0,30 12,46 1,09 0,20
http
://w
ww
.bps
.go.
id

Trends of Selected Socio-Economic Indicators of Indonesia, August 201642
Angka Melek Huruf Penduduk Berusia 15 Tahun ke Atas Menurut Provinsi dan Jenis Kelamin (persen), 2014-2015 Adult Literacy Rate by Province and Sex (percent), 2014-2015
TabelTable 3.5
ProvinsiProvince
2014 2015
Laki-laki Male
Perempuan Female
Jumlah Total
Laki-laki Male
Perempuan Female
Jumlah Total
Aceh 99,14 97,38 98,25 98,75 96,53 97,63
Sumatera Utara 99,28 97,88 98,57 99,32 98,04 98,68
Sumatera Barat 98,94 97,95 98,44 99,29 97,85 98,56
Riau 99,28 98,18 98,75 99,55 98,16 98,87
Jambi 98,97 96,86 97,94 98,88 96,75 97,84
Sumatera Selatan 98,96 97,29 98,14 98,90 97,52 98,22
Bengkulu 99,13 95,85 97,52 98,94 96,27 97,63
Lampung 98,55 96,31 97,46 98,34 94,89 96,67
Kepulauan Bangka Belitung
98,65 96,47 97,60 98,41 96,78 97,63
Kepulauan Riau 99,38 98,24 98,83 99,03 98,53 98,79
DKI Jakarta 99,90 99,17 99,54 99,84 99,33 99,59
Jawa Barat 98,92 96,97 97,96 98,86 97,14 98,01
Jawa Tengah 97,17 91,83 94,45 96,36 90,01 93,12
DI Yogyakarta 99,48 94,36 96,87 97,35 91,78 94,50
Jawa Timur 96,06 90,43 93,18 94,94 88,17 91,47
Banten 99,13 96,63 97,90 98,57 96,14 97,37
Bali 97,23 89,85 93,54 96,57 88,94 92,77
Nusa Tenggara Barat 91,99 84,65 88,11 90,83 83,50 86,97
Nusa Tenggara Timur 94,26 91,42 92,80 92,84 90,12 91,45
Kalimantan Barat 96,85 89,98 93,47 95,41 89,10 92,32
Kalimantan Tengah 99,46 98,12 98,82 99,26 98,45 98,88
Kalimantan Selatan 99,32 97,05 98,19 99,23 97,17 98,21
Kalimantan Timur 99,19 97,92 98,59 99,20 98,12 98,69
Kalimantan Utara - - - 96,66 93,08 94,99
Sulawesi Utara 99,78 99,42 99,60 99,69 99,56 99,63
Sulawesi Tengah 97,99 96,11 97,08 98,24 96,41 97,34
Sulawesi Selatan 94,76 91,02 92,81 93,26 89,47 91,29
Sulawesi Tenggara 96,82 91,29 94,03 96,57 91,69 94,10
Gorontalo 97,16 98,63 97,90 98,02 98,45 98,24
Sulawesi Barat 95,80 91,95 93,86 94,44 90,88 92,64
Maluku 99,17 98,38 98,77 99,31 98,39 98,85
Maluku Utara 99,18 97,51 98,36 99,08 97,87 98,49
Papua Barat 98,72 94,49 96,75 98,07 95,50 96,88
Papua 76,84 64,27 70,92 75,59 65,47 70,83
Indonesia 97,63 94,13 95,88 97,11 93,34 95,22
Sumber: Diolah dari Survei Sosial Ekonomi Nasional (Susenas), BPS Source: Based on National Socio-Economic Survey, BPS-Statistics Indonesia
http
://w
ww
.bps
.go.
id

43Perkembangan Beberapa Indikator Utama Sosial-Ekonomi Indonesia, Agustus 2016
Rata-rata Lama Sekolah Penduduk Usia 15 Tahun ke Atas Menurut Provinsi dan Jenis Kelamin (tahun), 2014-2015 Mean Years of Schooling Population 15 Years of Age and Over by Province and Sex (years), 2014-2015
TabelTable 3.6
Provinsi/Province
2014 2015
Laki-lakiMale
Perempuan Female
Jumlah Total
Laki-laki Male
Perempuan Female
Jumlah Total
Aceh 9,50 8,98 9,24 9,54 9,11 9,32
Sumatera Utara 9,56 9,03 9,29 9,57 9,12 9,34
Sumatera Barat 8,66 8,61 8,63 8,80 8,89 8,85
Riau 9,06 8,64 8,86 9,06 8,72 8,89
Jambi 8,73 7,98 8,37 8,79 8,06 8,43
Sumatera Selatan 8,46 7,90 8,19 8,50 8,02 8,26
Bengkulu 8,93 8,47 8,70 8,99 8,48 8,74
Lampung 8,24 7,70 7,98 8,24 7,77 8,01
Kepulauan Bangka Belitung
8,04 7,47 7,76 7,97 7,69 7,83
Kepulauan Riau 9,93 9,61 9,77 9,99 9,70 9,85
DKI Jakarta 10,99 10,28 10,63 11,27 10,52 10,90
Jawa Barat 8,58 7,80 8,19 8,68 7,94 8,31
Jawa Tengah 7,92 7,11 7,51 7,99 7,16 7,57
DI Yogyakarta 9,91 9,01 9,45 10,11 9,10 9,59
Jawa Timur 8,13 7,11 7,61 8,19 7,25 7,71
Banten 9,07 8,17 8,63 9,16 8,22 8,70
Bali 9,37 7,88 8,62 9,55 8,05 8,80
Nusa Tenggara Barat 8,12 6,94 7,49 8,15 6,93 7,51
Nusa Tenggara Timur 7,52 7,19 7,35 7,59 7,22 7,40
Kalimantan Barat 7,75 7,02 7,39 7,73 7,07 7,41
Kalimantan Tengah 8,50 7,93 8,23 8,67 8,10 8,40
Kalimantan Selatan 8,38 7,67 8,03 8,54 7,73 8,14
Kalimantan Timur 9,67 8,91 9,31 9,83 9,17 9,52
Kalimantan Utara - - - 8,92 8,38 8,67
Sulawesi Utara 9,13 9,23 9,18 9,11 9,27 9,19
Sulawesi Tengah 8,46 8,14 8,31 8,53 8,17 8,35
Sulawesi Selatan 8,30 7,87 8,08 8,38 8,03 8,20
Sulawesi Tenggara 9,06 8,31 8,68 9,07 8,42 8,74
Gorontalo 7,26 7,87 7,57 7,21 7,95 7,58
Sulawesi Barat 7,69 7,15 7,42 7,59 7,38 7,49
Maluku 9,69 9,34 9,52 9,66 9,41 9,54
Maluku Utara 9,18 8,40 8,80 9,21 8,40 8,81
Papua Barat 9,85 8,78 9,35 9,73 9,17 9,47
Papua 6,98 5,44 6,25 7,04 5,40 6,27
Indonesia 8,61 7,85 8,23 8,69 7,96 8,32
Sumber: Diolah dari Survei Sosial Ekonomi Nasional (Susenas), BPS Source: Based on National Socio-Economic Survey, BPS-Statistics Indonesia
http
://w
ww
.bps
.go.
id

Trends of Selected Socio-Economic Indicators of Indonesia, August 201644
Angka Partisipasi Sekolah 1) Menurut Provinsi dan Usia Sekolah (persen), 2014-2015 School Enrollment Ratio 1) by Province and School Age (percent), 2014-2015
TabelTable 3.7
Provinsi/Province2014 2015
7-12 13-15 16-18 7-12 13-15 16-18
Aceh 99,84 97,38 80,89 99,90 97,71 81,43
Sumatera Utara 99,26 96,06 75,78 99,35 96,34 76,23
Sumatera Barat 99,27 95,84 81,97 99,44 95,98 82,53
Riau 98,67 94,36 75,30 98,79 94,48 75,57
Jambi 99,46 94,88 70,41 99,55 95,06 70,75
Sumatera Selatan 99,47 93,36 67,84 99,53 93,52 68,40
Bengkulu 99,45 96,71 77,92 99,65 96,83 78,16
Lampung 99,56 94,01 68,75 99,62 94,24 69,04
Kepulauan Bangka Belitung
99,16 91,53 65,78 99,22 91,82 66,17
Kepulauan Riau 99,12 98,56 81,57 99,34 98,67 81,84
DKI Jakarta 99,47 96,69 70,23 99,56 97,19 70,73
Jawa Barat 99,30 92,84 65,48 99,57 93,19 65,72
Jawa Tengah 99,51 94,85 67,54 99,56 95,30 67,66
DI Yogyakarta 99,94 99,48 86,44 99,89 99,68 86,78
Jawa Timur 99,38 96,36 70,25 99,45 96,53 70,44
Banten 99,29 94,87 66,25 99,41 95,29 66,73
Bali 99,36 97,23 81,59 99,41 97,41 81,69
Nusa Tenggara Barat 99,11 97,27 75,68 99,48 97,44 75,86
Nusa Tenggara Timur 97,99 94,26 73,96 98,13 94,39 74,25
Kalimantan Barat 98,18 91,76 66,48 98,27 91,91 66,83
Kalimantan Tengah 99,46 92,94 65,84 99,54 93,13 66,00
Kalimantan Selatan 99,24 91,83 67,18 99,43 91,91 67,49
Kalimantan Timur 99,46 97,89 80,50 99,63 97,92 80,68
Kalimantan Utara - - - 98,39 93,55 74,41
Sulawesi Utara 98,95 94,34 71,98 99,33 94,59 72,22
Sulawesi Tengah 97,71 91,23 73,64 98,02 91,80 73,80
Sulawesi Selatan 98,91 92,57 69,38 99,03 92,66 69,66
Sulawesi Tenggara 99,11 93,53 72,25 99,30 93,67 72,42
Gorontalo 98,40 90,47 68,69 98,69 90,75 69,03
Sulawesi Barat 97,91 89,26 66,97 98,00 89,84 67,14
Maluku 99,19 96,35 77,48 99,38 96,44 77,87
Maluku Utara 98,89 96,24 74,83 99,08 96,68 75,16
Papua Barat 96,65 96,28 79,87 96,74 96,58 79,99
Papua 80,69 78,07 61,63 81,04 78,14 61,96
Indonesia 98,92 94,44 70,31 99,09 94,72 70,61
Catatan: 1) Termasuk Paket A, Paket B dan Paket CNote: 1) Include Package A, Package B and Package C
Sumber: Diolah dari Survei Sosial Ekonomi Nasional (Susenas), BPS Source: Based on National Socio-Economic Survey, BPS-Statistics Indonesia
http
://w
ww
.bps
.go.
id
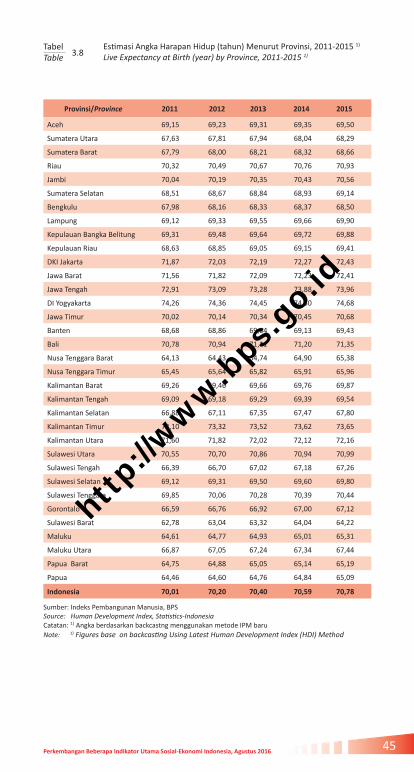
45Perkembangan Beberapa Indikator Utama Sosial-Ekonomi Indonesia, Agustus 2016
Estimasi Angka Harapan Hidup (tahun) Menurut Provinsi, 2011-2015 1) Live Expectancy at Birth (year) by Province, 2011-2015 1)
TabelTable 3.8
Provinsi/Province 2011 2012 2013 2014 2015
Aceh 69,15 69,23 69,31 69,35 69,50
Sumatera Utara 67,63 67,81 67,94 68,04 68,29
Sumatera Barat 67,79 68,00 68,21 68,32 68,66
Riau 70,32 70,49 70,67 70,76 70,93
Jambi 70,04 70,19 70,35 70,43 70,56
Sumatera Selatan 68,51 68,67 68,84 68,93 69,14
Bengkulu 67,98 68,16 68,33 68,37 68,50
Lampung 69,12 69,33 69,55 69,66 69,90
Kepulauan Bangka Belitung 69,31 69,48 69,64 69,72 69,88
Kepulauan Riau 68,63 68,85 69,05 69,15 69,41
DKI Jakarta 71,87 72,03 72,19 72,27 72,43
Jawa Barat 71,56 71,82 72,09 72,23 72,41
Jawa Tengah 72,91 73,09 73,28 73,88 73,96
DI Yogyakarta 74,26 74,36 74,45 74,50 74,68
Jawa Timur 70,02 70,14 70,34 70,45 70,68
Banten 68,68 68,86 69,04 69,13 69,43
Bali 70,78 70,94 71,11 71,20 71,35
Nusa Tenggara Barat 64,13 64,43 64,74 64,90 65,38
Nusa Tenggara Timur 65,45 65,64 65,82 65,91 65,96
Kalimantan Barat 69,26 69,46 69,66 69,76 69,87
Kalimantan Tengah 69,09 69,18 69,29 69,39 69,54
Kalimantan Selatan 66,88 67,11 67,35 67,47 67,80
Kalimantan Timur 73,10 73,32 73,52 73,62 73,65
Kalimantan Utara 71,60 71,82 72,02 72,12 72,16
Sulawesi Utara 70,55 70,70 70,86 70,94 70,99
Sulawesi Tengah 66,39 66,70 67,02 67,18 67,26
Sulawesi Selatan 69,12 69,31 69,50 69,60 69,80
Sulawesi Tenggara 69,85 70,06 70,28 70,39 70,44
Gorontalo 66,59 66,76 66,92 67,00 67,12
Sulawesi Barat 62,78 63,04 63,32 64,04 64,22
Maluku 64,61 64,77 64,93 65,01 65,31
Maluku Utara 66,87 67,05 67,24 67,34 67,44
Papua Barat 64,75 64,88 65,05 65,14 65,19
Papua 64,46 64,60 64,76 64,84 65,09
Indonesia 70,01 70,20 70,40 70,59 70,78
Sumber: Indeks Pembangunan Manusia, BPS Source: Human Development Index, Statistics-IndonesiaCatatan: 1) Angka berdasarkan backcastng menggunakan metode IPM baruNote: 1) Figures base on backcasting Using Latest Human Development Index (HDI) Method
http
://w
ww
.bps
.go.
id
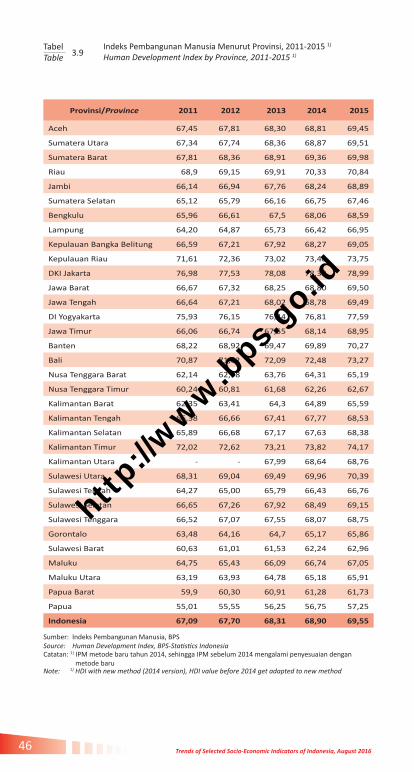
Trends of Selected Socio-Economic Indicators of Indonesia, August 201646
Indeks Pembangunan Manusia Menurut Provinsi, 2011-2015 1) Human Development Index by Province, 2011-2015 1)
TabelTable 3.9
Provinsi/Province 2011 2012 2013 2014 2015
Aceh 67,45 67,81 68,30 68,81 69,45
Sumatera Utara 67,34 67,74 68,36 68,87 69,51
Sumatera Barat 67,81 68,36 68,91 69,36 69,98
Riau 68,9 69,15 69,91 70,33 70,84
Jambi 66,14 66,94 67,76 68,24 68,89
Sumatera Selatan 65,12 65,79 66,16 66,75 67,46
Bengkulu 65,96 66,61 67,5 68,06 68,59
Lampung 64,20 64,87 65,73 66,42 66,95
Kepulauan Bangka Belitung 66,59 67,21 67,92 68,27 69,05
Kepulauan Riau 71,61 72,36 73,02 73,40 73,75
DKI Jakarta 76,98 77,53 78,08 78,39 78,99
Jawa Barat 66,67 67,32 68,25 68,80 69,50
Jawa Tengah 66,64 67,21 68,02 68,78 69,49
DI Yogyakarta 75,93 76,15 76,44 76,81 77,59
Jawa Timur 66,06 66,74 67,55 68,14 68,95
Banten 68,22 68,92 69,47 69,89 70,27
Bali 70,87 71,62 72,09 72,48 73,27
Nusa Tenggara Barat 62,14 62,98 63,76 64,31 65,19
Nusa Tenggara Timur 60,24 60,81 61,68 62,26 62,67
Kalimantan Barat 62,35 63,41 64,3 64,89 65,59
Kalimantan Tengah 66,38 66,66 67,41 67,77 68,53
Kalimantan Selatan 65,89 66,68 67,17 67,63 68,38
Kalimantan Timur 72,02 72,62 73,21 73,82 74,17
Kalimantan Utara - - 67,99 68,64 68,76
Sulawesi Utara 68,31 69,04 69,49 69,96 70,39
Sulawesi Tengah 64,27 65,00 65,79 66,43 66,76
Sulawesi Selatan 66,65 67,26 67,92 68,49 69,15
Sulawesi Tenggara 66,52 67,07 67,55 68,07 68,75
Gorontalo 63,48 64,16 64,7 65,17 65,86
Sulawesi Barat 60,63 61,01 61,53 62,24 62,96
Maluku 64,75 65,43 66,09 66,74 67,05
Maluku Utara 63,19 63,93 64,78 65,18 65,91
Papua Barat 59,9 60,30 60,91 61,28 61,73
Papua 55,01 55,55 56,25 56,75 57,25
Indonesia 67,09 67,70 68,31 68,90 69,55
Sumber: Indeks Pembangunan Manusia, BPS Source: Human Development Index, BPS-Statistics Indonesia Catatan: 1) IPM metode baru tahun 2014, sehingga IPM sebelum 2014 mengalami penyesuaian dengan metode baruNote: 1) HDI with new method (2014 version), HDI value before 2014 get adapted to new method
http
://w
ww
.bps
.go.
id
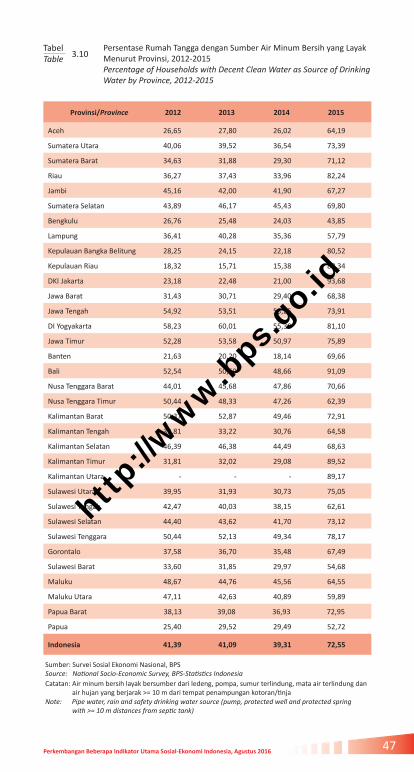
47Perkembangan Beberapa Indikator Utama Sosial-Ekonomi Indonesia, Agustus 2016
Provinsi/Province 2012 2013 2014 2015
Aceh 26,65 27,80 26,02 64,19
Sumatera Utara 40,06 39,52 36,54 73,39
Sumatera Barat 34,63 31,88 29,30 71,12
Riau 36,27 37,43 33,96 82,24
Jambi 45,16 42,00 41,90 67,27
Sumatera Selatan 43,89 46,17 45,43 69,80
Bengkulu 26,76 25,48 24,03 43,85
Lampung 36,41 40,28 35,36 57,79
Kepulauan Bangka Belitung 28,25 24,15 22,18 80,52
Kepulauan Riau 18,32 15,71 15,38 88,34
DKI Jakarta 23,18 22,48 21,00 93,68
Jawa Barat 31,43 30,71 29,40 68,38
Jawa Tengah 54,92 53,51 53,25 73,91
DI Yogyakarta 58,23 60,01 55,30 81,10
Jawa Timur 52,28 53,58 50,97 75,89
Banten 21,63 20,20 18,14 69,66
Bali 52,54 50,60 48,66 91,09
Nusa Tenggara Barat 44,01 45,68 47,86 70,66
Nusa Tenggara Timur 50,44 48,33 47,26 62,39
Kalimantan Barat 50,37 52,87 49,46 72,91
Kalimantan Tengah 33,81 33,22 30,76 64,58
Kalimantan Selatan 46,39 46,38 44,49 68,63
Kalimantan Timur 31,81 32,02 29,08 89,52
Kalimantan Utara - - - 89,17
Sulawesi Utara 39,95 31,93 30,73 75,05
Sulawesi Tengah 42,47 40,03 38,15 62,61
Sulawesi Selatan 44,40 43,62 41,70 73,12
Sulawesi Tenggara 50,44 52,13 49,34 78,17
Gorontalo 37,58 36,70 35,48 67,49
Sulawesi Barat 33,60 31,85 29,97 54,68
Maluku 48,67 44,76 45,56 64,55
Maluku Utara 47,11 42,63 40,89 59,89
Papua Barat 38,13 39,08 36,93 72,95
Papua 25,40 29,52 29,49 52,72
Indonesia 41,39 41,09 39,31 72,55
Persentase Rumah Tangga dengan Sumber Air Minum Bersih yang Layak Menurut Provinsi, 2012-2015 Percentage of Households with Decent Clean Water as Source of Drinking Water by Province, 2012-2015
TabelTable 3.10
Catatan: Air minum bersih layak bersumber dari ledeng, pompa, sumur terlindung, mata air terlindung dan air hujan yang berjarak >= 10 m dari tempat penampungan kotoran/tinja
Sumber: Survei Sosial Ekonomi Nasional, BPS Source: National Socio-Economic Survey, BPS-Statistics Indonesia
Note: Pipe water, rain and safety drinking water source (pump, protected well and protected spring with >= 10 m distances from septic tank)
http
://w
ww
.bps
.go.
id

Trends of Selected Socio-Economic Indicators of Indonesia, August 201648
Persentase Rumah Tangga Menurut Provinsi, Daerah Tempat Tinggal dan Sumber Penerangan Utama. 2015 Percentage of Households by Province, Urban Rural Classification, and The Main Source of Lighting, 2015
TabelTable 3.11
ProvinsiProvince
Perkotaan/Urban Perdesaan/Rural
Listrik PLNPublic (PLN)Electricity
Listrik Non PLN/Non-PLN
Electricity
Bukan Listrik/Non Electricity
Listrik PLNPublic (PLN)Electricity
Listrik Non PLN/Non-PLN
Electricity
Bukan Listrik/Non Electricity
Aceh 99.07 0.64 0,29 96,87 1,08 2,05
Sumatera Utara 98.97 0.70 0,32 89,77 4,30 5,93
Sumatera Barat 97.82 1.30 0,87 89,20 5,04 5,76
Riau 97.63 2.10 0,27 65,62 27,23 7,15
Jambi 97.02 1,66 1,32 83,45 9,86 6,69
Sumatera Selatan 98.72 1,18 0,10 86,36 9,83 3,82
Bengkulu 99.51 0,18 0,31 91,10 4,62 4,28
Lampung 98.02 1,59 0,39 89,13 8,94 1,93
Kepulauan Bangka Belitung
97.73 1,95 0,31 95,34 2,19 2,47
Kepulauan Riau 98.15 1,54 0,31 61,43 33,72 4,85
DKI Jakarta 99.40 0,54 0,06 - - -
Jawa Barat 99.41 0,53 0,06 98,47 1,16 0,37
Jawa Tengah 99.72 0,23 0,05 99,35 0,54 0,11
DI Yogyakarta 99.76 0,15 0,09 99,58 0,06 0,36
Jawa Timur 99.48 0,48 0,03 98,30 1,49 0,21
Banten 99.12 0,85 0,03 97,85 1,40 0,75
Bali 99.90 0,08 0,02 98,84 0,34 0,82
Nusa Tenggara Barat
99.35 0,47 0,18 96,60 1,91 1,49
Nusa Tenggara Timur
97.54 1,41 1,05 55,49 11,96 32,56
Kalimantan Barat 97.99 1,63 0,38 69,91 13,64 16,45
Kalimantan Tengah 97.52 1,73 0,76 67,80 21,20 11,00
Kalimantan Selatan 99.18 0,66 0,16 92,97 4,54 2,49
Kalimantan Timur 96.64 2,81 0,55 72,25 25,27 2,48
Kalimantan Utara 98.67 0,65 0,67 69,67 22,24 8,09
Sulawesi Utara 98.00 1,73 0,28 95,95 2,68 1,37
Sulawesi Tengah 99.05 0,46 0,49 79,75 10,33 9,92
Sulawesi Selatan 98.89 0,84 0,27 90.01 5,95 4,04
Sulawesi Tenggara 97.96 1,53 0,50 80.02 10,98 9.00
Gorontalo 98.61 0,85 0,54 83,33 5,88 10,79
Sulawesi Barat 96.63 2,08 1,29 61,86 27,83 10,32
Maluku 98.06 1,04 0,90 70,39 10,38 19,24
Maluku Utara 97.54 2,30 0,16 68,68 15,33 15,99
Papua Barat 98.72 1,06 0,22 62,72 19,84 17,45
Papua 94.00 3,08 2,92 21,25 17,58 61,17
Indonesia 99.13 0,70 0,17 89,72 5,51 4,77
Sumber: Statistik Kesejahteraan Rakyat, BPS Source: Welfare Statistics, BPS-Statistics Indonesia
http
://w
ww
.bps
.go.
id

49Perkembangan Beberapa Indikator Utama Sosial-Ekonomi Indonesia, Agustus 2016
Provinsi/Province Telepon/Telephone Telepon Selular/Handphone
2013 2014 2015 2013 2014 2015 1)
Aceh 3,35 2,90 0,62 83,53 85,32 51.50
Sumatera Utara 4,71 3,70 2,30 87,88 89,00 52.87
Sumatera Barat 5,24 5,06 2,85 87,80 89,19 57.04
Riau 3,66 3,60 2,47 94,48 95,27 62.10
Jambi 4,11 3,48 2,53 90,42 91,58 58.68
Sumatera Selatan 4,69 4,93 3,44 88,71 89,51 53.66
Bengkulu 4,82 4,34 2,61 88,54 89,59 55.86
Lampung 3,55 3,56 1,77 87,70 89,15 52.73
Kepulauan Bangka Belitung
3,92 3,60 2,53 91,92 91,12 61.81
Kepulauan Riau 7,86 7,01 4,16 97,90 97,64 74.17
DKI Jakarta 19,97 18,78 18,36 97,55 97,24 76.93
Jawa Barat 6,39 6,31 4,18 85,15 86,38 59.50
Jawa Tengah 5,34 4,67 3,48 84,07 85,52 54.97
DI Yogyakarta 8,47 7,94 6,99 88,73 88,79 64.79
Jawa Timur 5,67 4,92 3,70 83,35 85,52 55.29
Banten 7,85 7,84 5,40 89,53 91,05 60.49
Bali 10,53 9,88 8,34 91,09 91,22 63.77
Nusa Tenggara Barat 2,44 2,46 1,05 74,88 79,07 45.26
Nusa Tenggara Timur 2,70 2,60 1,33 69,20 72,05 36.65
Kalimantan Barat 4,13 3,72 2,15 84,49 86,88 51.89
Kalimantan Tengah 3,77 2,94 1,76 89,96 91,44 63.29
Kalimantan Selatan 4,67 3,85 2,43 91,30 90,89 62.74
Kalimantan Timur 7,82 7,28 6,67 95,71 96,27 74.43
Kalimantan Utara - - 3,38 - - 67.48
Sulawesi Utara 5,62 4,07 2,86 86,40 88,01 59.45
Sulawesi Tengah 3,76 3,30 1,87 81,65 81,32 50.64
Sulawesi Selatan 4,87 4,76 2,72 88,49 90,10 56.21
Sulawesi Tenggara 3,52 3,09 1,13 87,86 88,47 54.84
Gorontalo 2,38 2,31 1,03 85,06 85,98 51.34
Sulawesi Barat 1,75 2,58 0,58 78,34 80,31 42.56
Maluku 3,85 3,21 1,85 73,72 78,04 47.98
Maluku Utara 2,49 2,69 1,07 76,60 79,24 45.08
Papua Barat 3,29 1,89 1,22 67,83 75,53 55.44
Papua 2,37 1,71 1,18 41,85 43,09 32.04
Indonesia 6,00 5,54 4,01 85,55 86,95 56.92
Persentase Rumah Tangga yang Memiliki Telepon dan Telepon Selular Menurut Provinsi, 2013-2015Percentage of Households Possessing Telephone and Handphone by Province, 2013-2015
TabelTable 3.12
Sumber: Survei Sosial Ekonomi Nasional, BPS Source: National Socio-Economic Survey, BPS-Statistics Indonesia Catatan: 1) Berdasarkan statistik kesejahteraan rakyat tahun 2015, data kepemilikan telepon seluler disajikan per penduduk usia 5 tahun ke atas (bukan per rumah tangga) Note: 1) Based on Publication of Welfare Statistics 2015, the data of ownership of cellular phone is available per population over age 5(not per household)
http
://w
ww
.bps
.go.
id
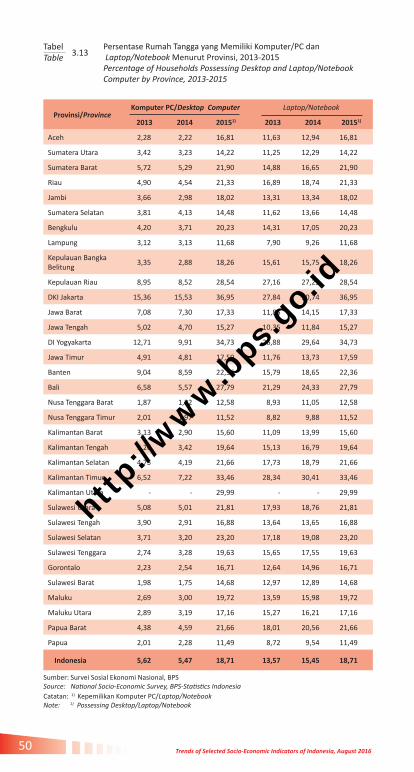
Trends of Selected Socio-Economic Indicators of Indonesia, August 201650
Provinsi/ProvinceKomputer PC/Desktop Computer Laptop/Notebook
2013 2014 20151) 2013 2014 20151)
Aceh 2,28 2,22 16,81 11,63 12,94 16,81
Sumatera Utara 3,42 3,23 14,22 11,25 12,29 14,22
Sumatera Barat 5,72 5,29 21,90 14,88 16,65 21,90
Riau 4,90 4,54 21,33 16,89 18,74 21,33
Jambi 3,66 2,98 18,02 13,31 13,34 18,02
Sumatera Selatan 3,81 4,13 14,48 11,62 13,66 14,48
Bengkulu 4,20 3,71 20,23 14,31 17,05 20,23
Lampung 3,12 3,13 11,68 7,90 9,26 11,68
Kepulauan Bangka Belitung
3,35 2,88 18,26 15,61 15,75 18,26
Kepulauan Riau 8,95 8,52 28,54 27,16 27,23 28,54
DKI Jakarta 15,36 15,53 36,95 27,84 30,74 36,95
Jawa Barat 7,08 7,30 17,33 11,86 14,15 17,33
Jawa Tengah 5,02 4,70 15,27 10,35 11,84 15,27
DI Yogyakarta 12,71 9,91 34,73 26,88 29,64 34,73
Jawa Timur 4,91 4,81 17,59 11,76 13,73 17,59
Banten 9,04 8,59 22,36 15,79 18,65 22,36
Bali 6,58 5,57 27,79 21,29 24,33 27,79
Nusa Tenggara Barat 1,87 1,82 12,58 8,93 11,05 12,58
Nusa Tenggara Timur 2,01 1,97 11,52 8,82 9,88 11,52
Kalimantan Barat 3,13 2,90 15,60 11,09 13,99 15,60
Kalimantan Tengah 3,26 3,42 19,64 15,13 16,79 19,64
Kalimantan Selatan 4,75 4,19 21,66 17,73 18,79 21,66
Kalimantan Timur 6,52 7,22 33,46 28,34 30,41 33,46
Kalimantan Utara - - 29,99 - - 29,99
Sulawesi Utara 5,08 5,01 21,81 17,93 18,76 21,81
Sulawesi Tengah 3,90 2,91 16,88 13,64 13,65 16,88
Sulawesi Selatan 3,71 3,20 23,20 17,18 19,08 23,20
Sulawesi Tenggara 2,74 3,28 19,63 15,65 17,55 19,63
Gorontalo 2,23 2,54 16,71 12,64 14,96 16,71
Sulawesi Barat 1,98 1,75 14,68 12,97 12,89 14,68
Maluku 2,69 3,00 19,72 13,59 15,98 19,72
Maluku Utara 2,89 3,19 17,16 15,27 16,21 17,16
Papua Barat 4,38 4,59 21,66 18,01 20,56 21,66
Papua 2,01 2,28 11,49 8,72 9,54 11,49
Indonesia 5,62 5,47 18,71 13,57 15,45 18,71
Persentase Rumah Tangga yang Memiliki Komputer/PC dan Laptop/Notebook Menurut Provinsi, 2013-2015Percentage of Households Possessing Desktop and Laptop/Notebook Computer by Province, 2013-2015
TabelTable 3.13
Sumber: Survei Sosial Ekonomi Nasional, BPS Source: National Socio-Economic Survey, BPS-Statistics Indonesia Catatan: 1) Kepemilikan Komputer PC/Laptop/Notebook Note: 1) Possessing Desktop/Laptop/Notebook
http
://w
ww
.bps
.go.
id

51Perkembangan Beberapa Indikator Utama Sosial-Ekonomi Indonesia, Agustus 2016
Sumber: Statistik Indonesia, Laporan Bulanan Data Sosial Ekonomi, BPS Source: Statistical Yearbook of Indonesia, Monthly Report on Socio-Economic Data, BPS-Statistics Indonesia Catatan: - Sejak Desember 1998 digunakan standar kemiskinan baru yang merupakan penyempurnaan
standar lama. Data tahun 1976-1996 menggunakan standar lama, angka tahun 1996-2015 menggunakan standar baru. - Referensi waktu untuk seluruh data adalah Februari, kecuali data tahun 1998 (Desember), tahun 2006-2010 (Maret) dan 2011-2015 (September). Data mulai tahun 1999 tanpa Timor Timur. 1) Maret
Note: - A new standard to measure poverty has been adopted since Desember 1998. Data 1976-1996 based on the old standard, the 1996-2015 figures based on the revised standard. - Time reference for all data is February, except for 1998 (December), 2006-2010 (March) and 2011-2015 (September). Started in 1999, data presented excluded East Timor 1) March
Garis Kemiskinan, Jumlah, dan Persentase Penduduk Miskin, 1976-2016 Poverty Line, Number, and Percentage of Poor People, 1976-2016
TabelTable 3.14
Tahun Year
Garis Kemiskinan (rupiah) Poverty Line (rupiahs)
Penduduk Miskin (juta) Poor People (million)
% Penduduk Miskin % Poor People
Kota Urban
Desa Rural
Kota Urban
Desa Rural
KotaUrban
Desa Rural
1976 4 522 2 849 10,00 44,20 38,80 40,40
1978 4 969 2 981 8,30 38,90 30,80 33,40
1980 6 831 4 449 9,50 32,80 29,00 28,40
1981 9 777 5 877 9,30 31,30 28,10 26,50
1984 13 731 7 746 9,30 25,70 23,10 21,20
1987 17 381 10 294 9,70 20,30 20,10 16,10
1990 20 614 13 295 9,40 17,80 16,80 14,30
1993 27 905 18 244 8,70 17,20 13,40 13,80
1996 38 246 27 413 7,20 15,30 9,70 12,30
1996 42 032 31 366 9,42 24,59 13,39 19,78
1998 96 959 72 780 17,60 31,90 21,92 25,72
1999 92 409 74 272 15,64 32,33 19,41 26,03
2000 91 632 73 648 12,30 26,40 14,60 22,38
2001 100 011 80 382 8,60 29,30 9,76 24,84
2002 130 499 96 512 13,30 25,10 14,46 21,10
2003 138 803 105 888 12,20 25,10 13,57 20,23
2004 143 455 108 725 11,40 24,80 12,13 20,11
2005 150 799 117 259 12,40 22,70 11,68 19,98
2006 174 290 130 584 14,49 24,81 13,47 21,81
2007 187 942 146 837 13,56 23,61 12,52 20,37
2008 204 896 161 831 12,77 22,19 11,65 18,93
2009 222 123 179 835 11,91 20,62 10,72 17,35
2010 232 989 192 354 11,10 19,93 9,87 16,56
2011 263 594 223 181 10,95 18,94 9,09 15,59
2012 277 382 240 441 10,51 18,08 8,60 14,70
2013 308 826 275 779 10,63 17,92 8,52 14,42
2014 326 853 296 681 10,36 17,37 8,16 13,76
2015 356 378 333 034 10,62 17,89 8,22 14,09
2016 1) 364 527 343 647 10,34 17,67 7,79 14,11
http
://w
ww
.bps
.go.
id

Trends of Selected Socio-Economic Indicators of Indonesia, August 201652
Provinsi/Province
Jumlah Penduduk Miskin (ribu) Number of Poor People (thousand)
Persentase Penduduk Miskin-Percentage of Poor People
2014 1) 2015 1) 2016 2) 2014 1) 2015 1 2016 2)
Aceh 837,42 859,41 848,44 16,98 17,11 16,73
Sumatera Utara 1 360,60 1 508,14 1455,95 9,85 10,79 10,35
Sumatera Barat 354,74 349,53 371,55 6,89 6,71 7,09
Riau 498,28 562,92 515,40 7,99 8,82 7,98
Jambi 281,75 311,57 289,81 8.39 9,12 8,41
Sumatera Selatan 1 085,80 1 112,53 1101,20 13,62 13,77 13,54
Bengkulu 316,50 322,83 328,61 17,09 17,16 17,32
Lampung 1 143,94 1 100,68 1169,60 14,21 13,53 14,29
Kepulauan Bangka Belitung
67,23 66,62 72,76 4,97 4,83 5,22
Kepulauan Riau 124,17 114,84 120,41 6,40 5,78 5,98
DKI Jakarta 412,79 368,67 384,30 4,09 3,61 3,75
Jawa Barat 4 238,96 4 485,66 4224,32 9,18 9,57 8,95
Jawa Tengah 4 561,82 4 505,78 4506,89 13,58 13,32 13,27
DI Yogyakarta 532,58 485,56 494,94 14,55 13,16 13,34
Jawa Timur 4 748,42 4 775,97 4703,30 12,28 12,28 12,05
Banten 649,19 690,66 658,11 5,51 5,75 5,42
Bali 195,96 218,79 178,18 4,76 5,25 4,25
Nusa Tenggara Barat 816,62 802,29 804,45 17,05 16,54 16,48
Nusa Tenggara Timur 991,88 1 160,53 1149,92 19,60 22,58 22,19
Kalimantan Barat 381,91 405,51 381,35 8,07 8,44 7,87
Kalimantan Tengah 148,82 148,13 143,49 6,07 5,91 5,66
Kalimantan Selatan 189,49 189,16 195,70 4,81 4,72 4,85
Kalimantan Timur 252,68 209,98 212,92 6,31 6,10 6,11
Kalimantan Utara - 40,93 41,12 - 6,32 6,23
Sulawesi Utara 197,56 217,14 202,82 8,26 8,98 8,34
Sulawesi Tengah 387,06 406,34 420,52 13,61 14,07 14,45
Sulawesi Selatan 806,35 864,52 807,03 9,54 10,12 9,40
Sulawesi Tenggara 314,09 345,02 326,87 12,77 13,74 12,88
Gorontalo 195,10 206,52 203,19 17,41 18,16 17,72
Sulawesi Barat 154,69 153,21 152,73 12.05 11,90 11,74
Maluku 307,02 327,77 327,72 18,44 19,36 19,18
Maluku Utara 84,79 72,64 74,67 7,41 6,22 6,33
Papua Barat 225,46 225,54 225,81 26,26 25,73 25,43
Papua 864,11 898,21 911,33 27,80 28,40 28,54
Indonesia 27 727,78 28 513,60 28 005,40 10,96 11,13 10,86
Jumlah dan Persentase Penduduk Miskin per Provinsi, 2014-2016 Number and Percentage of Poor People by Province, 2014-2016
TabelTable 3.15
Sumber: - Diolah dari Survei Sosial Ekonomi Nasional (Susenas) panel modul konsumsi, BPS - Laporan Bulanan Data Sosial Ekonomi, BPSSource: - Based on consumption module panel of National Socio-Economic Survey, BPS-Statistics Indonesia - Monthly Report on Socio-Economic Data, BPS-Statistics IndonesiaCatatan: 1) September 2) MaretNote: 1) September 2) March
http
://w
ww
.bps
.go.
id

53Perkembangan Beberapa Indikator Utama Sosial-Ekonomi Indonesia, Agustus 2016
Kabupaten/Kota dengan Persentase Penduduk Miskin Tertinggi dan Terendah di Tiap Provinsi, 2014 Regencies/Municipalities with Percentage of the Highest and the Lowest Poor People in Each Province, 2014
TabelTable 3.16
ProvinsiProvince
Kabupaten/Kota Regencies/
Municipalities
%Tertinggi Highest
Kabupaten/Kota Regencies/
Municipalities
%Terendah
Lowest
Aceh Kab. Aceh Barat 22.97 Kota Banda Aceh 7.78
Sumatera Utara Kab. Nias Barat 29.28 Kab. Deli Serdang 4.56
Sumatera Barat Kab. Kep. Mentawai 14.96 Kota Sawahlunto 2.25
Riau Kab. Kepulauan Meranti
33.85 Kota Pekan Baru 3.17
Jambi Kab. Tjg Jabung Timur 13.55 Kota Sungai Penuh 3.33
Sumatera Selatan Kab. Lahat 18.02 Kota Pagar Alam 8.90
Bengkulu Kab. Kaur 21.96 Bengkulu Tengah 8.22
Lampung Kab. Lampung Utara 23.32 Kab. Mesuji 6.57
Kepulauan Bangka Belitung
Kab. Belitung 7.36 Kab. Bangka Barat 3.15
Kepulauan Riau Kab. Lingga 14.75 Kab. Natuna 4.11
DKI Jakarta Kab. Kepulauan Seribu 11.56 Kota Jakarta Timur 3.43
Jawa Barat Kota Tasikmalaya 15.95 Kota Depok 2.32
Jawa Tengah Kab. Wonosobo 21.42 Kota Semarang 5.04
DI Yogyakarta Kab. Gunung Kidul 20.83 Kota Yogyakarta 8.67
Jawa Timur Kab. Sampang 25.80 Kota Batu 4.59
Banten Kab. Pandeglang 9.50 Kota Tangerang Selatan 1.68
Bali Kab. Karang Asem 7.30 Kota Denpasar 2.21
Nusa Tenggara Barat Kab. Lombok Utara 34.27 Kota Bima 9.74
Nusa Tenggara Timur Kab. Sumba Tengah 31.40 Kab. Flores Timur 7.83
Kalimantan Barat Kab. Landak 13.71 Kab. Sanggau 4.47
Kalimantan Tengah Kab. Barito Timur 8.55 Kota Palangka Raya 3.81
Kalimantan Selatan Kab. Hulu Sungai Utara 7.00 Kab. Banjar 2.87
Kalimantan Timur Kab. Kutai Timur 9.10 Kota Balikpapan 2.46
Kalimantan Utara Kab. Bulungan 11.87 Kota Tarakan 7.68
Sulawesi Utara Kab. Minahasa Tenggara 15.76 Kota Manado 4.81
Sulawesi Tengah Kab. Tojo Una-Una 18.95 Kota Palu 7.05
Sulawesi Selatan Kab. Pangkajene Kepulauan
16.38 Kota Makassar 4.48
Sulawesi Tenggara Kab. Buton Utara 16.35 Kota Kendari 5.56
Gorontalo Kab. Gorontalo 21.05 Kota Gorontalo 5.85
Sulawesi Barat Kab. Polewali Mandar 17.79 Kab. Mamuju Utara 4.65
Maluku Kab. Maluku Tenggara Barat
28.56 Kota Ambon 4.23
Maluku Utara Kab. Halmahera Tengah 16.88 Kota Ternate 3.16
Papua Barat Kab. Teluk Bintuni 38.92 Kab. Kaimana 17.65
Papua Kab. Deiyai 44.49 Kab. Merauke 10.20
Sumber: Survei Sosial Ekonomi Nasional, BPS Source: National Socio-Economic Survey, BPS-Statistics Indonesia
http
://w
ww
.bps
.go.
id
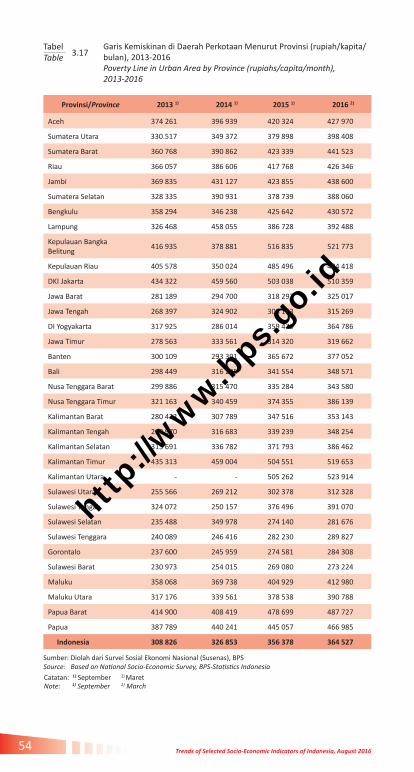
Trends of Selected Socio-Economic Indicators of Indonesia, August 201654
Garis Kemiskinan di Daerah Perkotaan Menurut Provinsi (rupiah/kapita/bulan), 2013-2016 Poverty Line in Urban Area by Province (rupiahs/capita/month), 2013-2016
TabelTable 3.17
Provinsi/Province 2013 1) 2014 1) 2015 1) 2016 2)
Aceh 374 261 396 939 420 324 427 970
Sumatera Utara 330.517 349 372 379 898 398 408
Sumatera Barat 360 768 390 862 423 339 441 523
Riau 366 057 386 606 417 768 426 346
Jambi 369 835 431 127 423 855 438 600
Sumatera Selatan 328 335 390 931 378 739 388 060
Bengkulu 358 294 346 238 425 642 430 572
Lampung 326 468 458 055 386 728 392 488
Kepulauan Bangka Belitung
416 935 378 881 516 835 521 773
Kepulauan Riau 405 578 350 024 485 496 494 418
DKI Jakarta 434 322 459 560 503 038 510 359
Jawa Barat 281 189 294 700 318 297 325 017
Jawa Tengah 268 397 324 902 308 163 315 269
DI Yogyakarta 317 925 286 014 359 470 364 786
Jawa Timur 278 563 333 561 314 320 319 662
Banten 300 109 293 391 365 672 377 052
Bali 298 449 316 235 341 554 348 571
Nusa Tenggara Barat 299 886 315 470 335 284 343 580
Nusa Tenggara Timur 321 163 340 459 374 355 386 139
Kalimantan Barat 280 423 307 789 347 516 353 143
Kalimantan Tengah 299 970 316 683 339 239 348 254
Kalimantan Selatan 313 691 336 782 371 793 386 462
Kalimantan Timur 435 313 459 004 504 551 519 653
Kalimantan Utara - - 505 262 523 914
Sulawesi Utara 255 566 269 212 302 378 312 328
Sulawesi Tengah 324 072 250 157 376 496 391 070
Sulawesi Selatan 235 488 349 978 274 140 281 676
Sulawesi Tenggara 240 089 246 416 282 230 289 827
Gorontalo 237 600 245 959 274 581 284 308
Sulawesi Barat 230 973 254 015 269 080 273 224
Maluku 358 068 369 738 404 929 412 980
Maluku Utara 317 176 339 561 378 538 390 788
Papua Barat 414 900 408 419 478 699 487 727
Papua 387 789 440 241 445 057 466 985
Indonesia 308 826 326 853 356 378 364 527
Sumber: Diolah dari Survei Sosial Ekonomi Nasional (Susenas), BPSSource: Based on National Socio-Economic Survey, BPS-Statistics Indonesia
Catatan: 1) September 2) Maret Note: 1) September 2) March
http
://w
ww
.bps
.go.
id

55Perkembangan Beberapa Indikator Utama Sosial-Ekonomi Indonesia, Agustus 2016
Garis Kemiskinan di Daerah Perdesaan Menurut Provinsi (rupiah/kapita/bulan), 2013-2016Poverty Line in Rural Area by Province (rupiahs/capita/month), 2013-2016
TabelTable 3.18
Provinsi/Province 2013 1) 2014 1) 2015 1) 2016 2)
Aceh 337 962 369 232 394 419 403 985
Sumatera Utara 292 186 312 493 352 637 377 748
Sumatera Barat 321 252 349 824 391 178 413 790
Riau 339 829 374 466 416 780 425 777
Jambi 280 660 399 063 329 895 342 137
Sumatera Selatan 270 166 302 162 319 994 331 570
Bengkulu 313 265 285 791 404 179 409 863
Lampung 284 504 481 226 346 088 354 678
Kepulauan Bangka Belitung
436 899 346 395 542 732 546 998
Kepulauan Riau 364 773 307 818 456 933 466 989
DKI Jakarta - - - -
Jawa Barat 268 251 285 076 319 228 324 937
Jawa Tengah 256 368 296 241 310 295 319 188
DI Yogyakarta 275 786 277 802 324 386 331 308
Jawa Timur 269 294 296 429 318 443 323 779
Banten 264 632 286 798 336 592 347 765
Bali 261 613 279 140 314 218 322 660
Nusa Tenggara Barat 263 107 285 205 313 466 326 656
Nusa Tenggara Timur 234 141 251 040 290 363 306 721
Kalimantan Barat 265 898 294 044 337 288 345 480
Kalimantan Tengah 311 647 338 130 374 938 387 202
Kalimantan Selatan 290 576 313 954 352 972 370 612
Kalimantan Timur 389 784 420 427 476 614 495 975
Kalimantan Utara - - 477 645 499 980
Sulawesi Utara 245 872 264 321 311 068 321 985
Sulawesi Tengah 293 567 246 290 353 080 370 392
Sulawesi Selatan 207 023 321 009 254 524 263 674
Sulawesi Tenggara 221 905 219 109 264 371 271 961
Gorontalo 232 048 246 695 275 163 284 190
Sulawesi Barat 228 346 238 745 279 594 290 340
Maluku 339 466 355 478 405 502 415 177
Maluku Utara 281 482 307 374 356 325 371 289
Papua Barat 389 163 340 846 457 222 466 996
Papua 322 079 423 701 392 446 412 991
Indonesia 275 779 296 681 333 034 343 647
Sumber: Diolah dari Survei Sosial Ekonomi Nasional (Susenas), BPSSource: Based on National Socio-Economic Survey, BPS-Statistics Indonesia Catatan: 1) September 2) Maret Note: 1) September 2) March
http
://w
ww
.bps
.go.
id

Trends of Selected Socio-Economic Indicators of Indonesia, August 201656
Indeks Kedalaman Kemiskinan dan Indeks Keparahan Kemiskinan Menurut Daerah, 2000-2016Poverty Gap Index and Poverty Severity Index by Region, 2000-2016
TabelTable 3.19
TahunYear
Indeks Kedalaman KemiskinanPoverty Gap Index (P1)
Indeks Keparahan KemiskinanPoverty Severity Index (P2)
Kota Urban
Desa Rural
Kota + Desa Urban +
Rural
Kota Urban
Desa Rural
Kota + Desa Urban +
Rural
2000 1,89 4,68 3,51 0,51 1,39 1,02
2001 1,74 4,68 3,42 0,45 1,36 0,97
2002 2,59 3,34 3,01 0,71 0,85 0,79
2003 2,55 3,53 3,13 0,74 0,93 0,85
2004 2,18 3,43 2,89 0,58 0,90 0,78
2005 2,05 3,34 2,78 0,60 0,89 0,76
2006 2,61 4,22 3,43 0,77 1,22 1,00
2007 2,15 3,78 2,99 0,57 1,09 0,84
2008 2,07 3,42 2,77 0,56 0,95 0,76
2009 1,91 3,05 2,50 0,52 0,82 0,68
2010 1,57 2,80 2,21 0,40 0,75 0,58
2011 1,48 2,61 2,05 0,39 0,68 0,53
2012 1,38 2,42 1,90 0,36 0,61 0,48
2013 1,41 2,37 1,89 0,37 0,60 0,48
2014 1,25 2,25 1,75 0,31 0,57 0,40
2015 1,29 2,40 1,84 0,35 0,67 0,51
2016 1,19 2,74 1,94 0,27 0,79 0,52
Sumber: Diolah dari Survei Sosial Ekonomi Nasional (Susenas) Panel Modul, Berita Resmi Statistik, BPSSource: Based on Modul Panel of National Socio-Economic Survey, Official Release, BPS-Statistics Indonesia
Catatan:• 2011-2015 keadaan September, 2016 keadaan Maret • Indeks Kedalaman Kemiskinan (P1) merupakan ukuran rata-rata kesenjangan pengeluaran masing- masing penduduk miskin terhadap garis kemiskinan. Semakin tinggi nilai indeks, semakin jauh rata- rata pengeluaran penduduk dari garis kemiskinan.
• Indeks Keparahan Kemiskinan (P2) memberikan gambaran mengenai penyebaran pengeluaran di antara penduduk miskin, semakin tinggi nilai indeks, semakin tinggi ketimpangan pengeluaran di antara penduduk miskin.Note: • 2011-2015 on September, 2016 on March • Poverty Gap Index (P1) measures the extent to which individuals fall below the poverty line (the poverty gaps) as a proportion of the poverty line. Higher value of the index shows that the gap between average expenditure of the poor and the poverty line is wider.
• Poverty Severity Index (P2) describes inequality among the poor. This is simple a weighted sum of poverty gaps themselves. Hence, by squaring the poverty gap index, the measure implicitly puts more weight on observations that fall well below the poverty line. Higher value of the index shows that inequality among the poor is higher.
http
://w
ww
.bps
.go.
id

57Perkembangan Beberapa Indikator Utama Sosial-Ekonomi Indonesia, Agustus 2016
Gini Ratio Menurut Provinsi, 2012-2016Gini Ratio by Province, 2012-2016
TabelTable 3.20
Provinsi/Province 2012 2013 2014 2015 2016
Aceh 0,32 0,34 0,32 0,34 0,33
Sumatera Utara 0,33 0,35 0,32 0,33 0,32
Sumatera Barat 0,36 0,36 0,33 0,32 0,33
Riau 0,40 0,37 0,35 0,37 0,35
Jambi 0,34 0,35 0,33 0,34 0,35
Sumatera Selatan 0,40 0,38 0,40 0,33 0,35
Bengkulu 0,35 0,39 0,36 0,37 0,36
Lampung 0,36 0,36 0,35 0,35 0,36
Kepulauan Bangka Belitung 0,29 0,31 0,30 0,28 0,28
Kepulauan Riau 0,35 0,36 0,40 0,34 0,35
DKI Jakarta 0,42 0,43 0,43 0,42 0,41
Jawa Barat 0,41 0,41 0,41 0,43 0,41
Jawa Tengah 0,38 0,39 0,38 0,38 0,37
DI Yogyakarta 0,43 0,44 0,42 0,42 0,42
Jawa Timur 0,36 0,36 0,37 0,40 0,40
Banten 0,39 0,40 0,39 0,39 0,39
Bali 0,43 0,40 0,41 0,40 0,37
Nusa Tenggara Barat 0,35 0,36 0,38 0,36 0,36
Nusa Tenggara Timur 0,36 0,35 0,36 0,35 0,34
Kalimantan Barat 0,38 0,40 0,39 0,33 0,34
Kalimantan Tengah 0,33 0,35 0,35 0,30 0,33
Kalimantan Selatan 0,38 0,36 0,36 0,33 0,33
Kalimantan Timur 0,36 0,37 0,35 0,32 0,32
Kalimantan Utara - - - 0,31 0,30
Sulawesi Utara 0,43 0,42 0,42 0,37 0,39
Sulawesi Tengah 0,40 0,41 0,37 0,37 0,36
Sulawesi Selatan 0,41 0,43 0,42 0,40 0,43
Sulawesi Tenggara 0,40 0,43 0,41 0,38 0,40
Gorontalo 0,44 0,44 0,41 0,40 0,42
Sulawesi Barat 0,31 0,35 0,35 0,36 0,36
Maluku 0,38 0,37 0,35 0,34 0,35
Maluku Utara 0,34 0,32 0,32 0,29 0,29
Papua Barat 0,43 0,43 0,44 0,43 0,37
Papua 0,44 0,44 0,41 0,39 0,39
Indonesia 0,41 0,41 0,41 0,40 0,40
Sumber: Indikator Kesejahteraan Rakyat, BPSSource: Welfare Indicators, BPS-Statistics Indonesia
http
://w
ww
.bps
.go.
id

http
://w
ww
.bps
.go.
id

PENGELUARAN KONSUMSI
CONSUMPTION EXPENDITURE
http://www.tabloidbisnis.com/tips-peluang-usaha-pertanian-organik/4http
://w
ww
.bps
.go.
id

http
://w
ww
.bps
.go.
id

61Perkembangan Beberapa Indikator Utama Sosial-Ekonomi Indonesia, Agustus 2016
Rata-rata Pengeluaran per Kapita Sebulan Menurut Kelompok Barang (rupiah), 2013-2015 1) Monthly Average Expenditure per Capita by Commodity Group (rupiahs), 2013-2015 1)
TabelTable
4.1
Kelompok Barang/Commodity Group 2013 2014 2015
A. Makanan/Food 349 344 391 938 478 062
Padi-padian/Cereals 55 216 57 652 64 759
Umbi-umbian/Tubers 3 458 3 897 4 963
Ikan/Fish 29 433 33 231 35 110
Daging/Meat 13 322 16 254 21 157
Telur dan susu/Eggs and milk 21 106 24 874 27 912
Sayur-sayuran/Vegetables 28 965 29 102 30 451
Kacang-kacangan/Legumes 9 182 10 283 11 744
Buah-buahan/Fruits 13 609 17 929 17 402
Minyak dan lemak/Oil and fats 11 566 12 686 12 785
Bahan minuman/Beverage stuff 12 884 13 668 15 204
Bumbu-bumbuan/Spices 6 937 7 731 8 707
Konsumsi lainnya/Miscellaneous food items 6 972 7 861 8 668
Makanan dan minuman jadi/Prepared food and beverages 2)
92 234 105 935 154 430
Tembakau dan sirih/Tobacco and betel 44 460 50 835 64 769
B. Bukan Makanan/Non Food 390 905 451 798 476 368
Perumahan dan fasilitas rumah tanggaHousing and household facility
141 762 165 186 248 400
Barang dan jasa/Goods and services 141 879 162 660 120 729
Pakaian, alas kaki, dan tutup kepalaClothing, footwear and headgear
48 321 55 473 28 070
Barang-barang tahan lama/Durable goods 36 555 41 049 46 708
Pajak dan asuransi/Taxes and insurance 11 813 15 656 19 098
Keperluan pesta dan upacara/Parties and ceremonies
10 575 11 774 13 362
Jumlah/Total 740 249 843 736 954 430
Sumber: Pengeluaran untuk Konsumsi Penduduk Indonesia, BPS Source: Expenditure for Consumption of Indonesia, BPS-Statistics IndonesiaCatatan: Angka merupakan hasil perhitungan asli/bukan pembulatan 1) Berdasarkan hasil Susenas September 2) Sudah termasuk minuman yang mengandung alkohol Note: Figure is the result of the original calculation/instead of rounding 1) Based on September Susenas 2) Include alcoholic beverages
http
://w
ww
.bps
.go.
id

Trends of Selected Socio-Economic Indicators of Indonesia, August 201662
Rata-rata Konsumsi per Kapita Seminggu Beberapa Macam Bahan Makanan Penting Indonesia (rupiah), 2013-2015 1)
Weekly Average Consumption per Capita of Several Food Items in Indonesia (rupiahs), 2013-2015 1)
TabelTable
4.2
Jenis MakananFood Items
SatuanUnits
2013 2014 2015
Beras lokal, ketan/Rice Kg 1,634 1,622 1,628
Jagung basah berkulit/Fresh corn with husk Kg 0,008 0.013 0,018
Jagung pocelan, pipilan/Dry shelled corn Kg 0,019 0.018 0,023
Ketela pohon/Cassava Kg 0,070 0.077 0,083
Ketela rambat/Sweet potatoes Kg 0,055 0.051 0,073
Gaplek/Dried cassava Kg 0,004 0.002 0,005
Ikan dan udang segar/Fresh fish and shrimp 2)
Kg 0,273 0.282 0,308
Ikan dan udang diawetkan/Canned fish and shrimp
Ons 0,442 0.461 0,334
Daging sapi, kerbau/Cow, buffalo meat Kg 0,006 0.006 0,010
Daging ayam ras, kampung/Broiler, Local Chicken meat
Kg 0,075 0.085 0,106
Telur ayam/Chicken egg 3) Kg 0,169 0.177 1,880
Telur itik, telur asin/Duck egg, salted egg Butir/Unit 0,051 0.047 0,034
Susu kental manis/Sweet canned liquid milk (397 gr) 0,059 0.062 0,075
Susu bubuk kaleng,bayi/Canned, baby powder milk
Kg 0,040 0.044 0,014
Bawang Merah/Onion Ons 0,433 0.494 0,529
Bawang Putih/Garlic Ons 0,287 0.309 0,335
Cabe Merah/Chillies Ons 0,277 0.307 0,048
Cabe Rawit/Cayenne pepper Ons 0,254 0.294 0,047
Kacang Kedelai/Soybean 4) Kg 0.000 0.001 -
Tahu/Soybean curd Kg 0.124 0.138 0,166
Tempe/Fermented soybean cake Kg 0.126 0.134 0,157
Minyak kelapa, jagung, goreng, lainnyaCoconut, corn, other frying oil 5)
Liter/Liter 0.201 0.206 0,222
Kelapa/Coconut Butir/Unit 0.114 0.118 0,128
Gula pasir/Sugar Ons 1.278 1,289 1,389
Gula merah/Brown sugar Ons 0.098 0.106 0,124
Sumber: Pengeluaran untuk Konsumsi Penduduk Indonesia, BPS Source: Expenditure for Consumption of Indonesia, BPS-Statistics Indonesia
Catatan: 1) Berdasarkan hasil Susenas September 2) Ikan segar meliputi ikan darat, laut dan udang 3) Satu butir telur ayam diperkirakan beratnya sebesar 0,05 Kg 3) Tahun 2015 Kuesioner Susenas Modul Konsumsi tidak menanyakan konsumsi kacang kedelai 3) Tahun 2015 Kuesioner Susenas Modul Konsumsi hanya menanyakan minyak goreng dan minyak KelapaNote: 1) Based on September Susenas 2) Fresh fish includes fresh water fish, sea fish and shrimp 3) One chicken egg is approximated to weight 0,05 Kg 3) Questionnaire of SUSENAS 2015 Consumption Module only asked the expenditure of soybean 3) Relating to oil expenditure, questionnaire of SUSENAS 2015 Consumption Module only asked the expenditure of frying oil and coconut oil
http
://w
ww
.bps
.go.
id

63Perkembangan Beberapa Indikator Utama Sosial-Ekonomi Indonesia, Agustus 2016
ProvinsiProvince
2014 2015
TotalTotal
MakananFood
TotalTotal
MakananFood
Aceh 747 814 400 512 811 452 464 682
Sumatera Utara 742 617 404 290 844 396 458 709
Sumatera Barat 881 949 471 371 946 588 535 023
Riau 1 039 598 489 227 1 079 104 549 960
Jambi 764 328 384 313 887 006 467 315
Sumatera Selatan 741 227 384 349 820 995 456 690
Bengkulu 760 907 383 670 908 899 468 767
Lampung 644 459 330 974 781 809 405 518
Kepulauan Bangka Belitung 1 092 418 534 815 1 200 723 634 396
Kepulauan Riau 1 674 557 654 153 1 447 805 722 123
DKI Jakarta 1 827 300 618 170 1 886 300 729 896
Jawa Barat 824 107 387 976 981 968 487 538
Jawa Tengah 684 658 320 273 770 595 413 870
DI Yogyakarta 852 141 341 298 1 094 525 511 757
Jawa Timur 750 889 340 295 903 874 446 808
Banten 1 023 121 464 855 1 121 506 557 179
Bali 1 235 270 480 103 1 125 482 474 923
Nusa Tenggara Barat 684 022 362 119 752 870 431 618
Nusa Tenggara Timur 496 171 272 307 569 441 318 870
Kalimantan Barat 848 092 418 014 848 388 472 142
Kalimantan Tengah 959 686 499 107 1 048 890 584 902
Kalimantan Selatan 880 473 454 649 1 120 886 596 390
Kalimantan Timur 1 253 345 533 945 1 274 888 571 488
Kalimantan Utara - - 1 130 391 574 448
Sulawesi Utara 870 993 421 043 909 622 490 685
Sulawesi Tengah 729 392 356 977 840 951 409 337
Sulawesi Selatan 766 937 350 466 859 027 428 884
Sulawesi Tenggara 639 063 294 250 828 680 427 259
Gorontalo 738 544 338 059 736 244 386 531
Sulawesi Barat 578 823 291 379 700 343 374 152
Maluku 730 053 385 272 808 794 425 651
Maluku Utara 747 427 361 396 832 284 433 014
Papua Barat 907 030 458 034 1 172 090 637 690
Papua 856 096 479 097 1 212 686 450 082
Indonesia 843 736 391 938 954 430 478 062
Rata-rata Pengeluaran per Kapita Sebulan Menurut Provinsi (rupiah), 2014-2015 1)
Monthly Average Expenditure per Capita by Province (rupiahs), 2014-2015 1)
TabelTable
4.3
Sumber: Pengeluaran Untuk Konsumsi Penduduk Indonesia per Provinsi, BPSSource: Expenditure for Consumption of Indonesia by Province, BPS-Statistics IndonesiaCatatan: 1) Berdasarkan hasil Susenas SeptemberNote: 1) Based on September Susenas
http
://w
ww
.bps
.go.
id

Trends of Selected Socio-Economic Indicators of Indonesia, August 201664
Rata-rata Konsumsi Protein (gram) per Kapita per Hari Menurut Provinsi dan Tipe Daerah, 2015 1) Average Daily per Capita Consumption of Protein (grams) by Province and Type of Area, 2015 1)
TabelTable
4.4
ProvinsiProvince
PerkotaanUrban
PerdesaanRural
Perkotaan+PerdesaanUrban+Rural
Aceh 55,26 52,39 53,20
Sumatera Utara 54,33 55,92 55,13
Sumatera Barat 55,24 51,87 53,21
Riau 58,05 52,93 54,92
Jambi 50,89 47,81 48,75
Sumatera Selatan 60,35 52,87 55,54
Bengkulu 60,92 52,94 55,42
Lampung 46,01 45,79 45,85
Kepulauan Bangka Belitung 58,82 59,14 58,98
Kepulauan Riau 66,77 51,17 64,21
DKI Jakarta 61,58 - 61,58
Jawa Barat 59,20 58,79 59,07
Jawa Tengah 54,77 51,20 52,84
DI Yogyakarta 66,86 59,77 64,48
Jawa Timur 58,68 54,55 56,53
Banten 62,07 53,44 59,33
Bali 61,34 58,32 60,18
Nusa Tenggara Barat 62,32 59,29 60,57
Nusa Tenggara Timur 57,38 47,96 49,85
Kalimantan Barat 59,44 50,90 53,51
Kalimantan Tengah 64,03 55,31 58,29
Kalimantan Selatan 64,26 59,03 61,24
Kalimantan Timur 56,08 49,52 53,65
Kalimantan Utara 60,60 54,26 57,8
Sulawesi Utara 65,31 59,10 61,93
Sulawesi Tengah 52,80 52,47 52,55
Sulawesi Selatan 60,78 54,49 56,84
Sulawesi Tenggara 62,07 51,53 54,57
Gorontalo 65,33 53,19 57,4
Sulawesi Barat 58,27 51,72 53,04
Maluku 56,02 46,87 50,43
Maluku Utara 55,92 43,77 47,08
Papua Barat 55,90 53,07 54,14
Papua 55,07 33,18 38,98
Indonesia 58,72 53,17 55,97
Catatan: 1) Berdasarkan hasil Susenas SeptemberNote: 1) Based on September Susenas
Sumber: Pengeluaran Untuk Konsumsi Penduduk Indonesia per Provinsi, BPSSource: Expenditure for Consumption of Indonesia by Province, BPS-Statistics Indonesia
http
://w
ww
.bps
.go.
id

65Perkembangan Beberapa Indikator Utama Sosial-Ekonomi Indonesia, Agustus 2016
Rata-rata Konsumsi Kalori (kkal) per Kapita per Hari Menurut Provinsi dan Tipe Daerah, 2015 1) Average Daily per Capita Consumption of Calories (kcal) by Province and Type of Area, 2015 1)
TabelTable
4.5
ProvinsiProvince
PerkotaanUrban
PerdesaanRural
Perkotaan+PerdesaanUrban+Rural
Aceh 1 923,87 1 956,43 1 947,19
Sumatera Utara 1 874,68 2 065,38 1 970,94
Sumatera Barat 1 999,65 2 053,23 2 031,96
Riau 1 963,44 2 037,50 2 008,73
Jambi 1 802,04 1 892,27 1 864,87
Sumatera Selatan 1 991,56 2 007,51 2 001,82
Bengkulu 2 034,87 2 066,97 2 057,01
Lampung 1 695,19 1 794,27 1 768,23
Kepulauan Bangka Belitung 1 913,51 2 021,54 1 968,34
Kepulauan Riau 2 066,06 1 854,25 2 031,33
DKI Jakarta 2 011,70 - 2 011,70
Jawa Barat 2 044,38 2 123,14 2 070,12
Jawa Tengah 1 883,10 1 884,85 1 884,05
DI Yogyakarta 2 132,49 2 186,72 2 150,65
Jawa Timur 1 975,48 1 975,37 1 975,42
Banten 2 051,95 2 017,91 2 041,14
Bali 2 113,44 2 114,33 2 113,78
Nusa Tenggara Barat 2 202,68 2 141,31 2 167,26
Nusa Tenggara Timur 1 971,17 1 893,02 1 908,70
Kalimantan Barat 1 959,31 1 916,14 1 929,33
Kalimantan Tengah 2 134,41 1 983,66 2 035,22
Kalimantan Selatan 2 141,12 2 119,03 2 128,39
Kalimantan Timur 1 767,55 1 758,24 1 764,10
Kalimantan Utara 1 899,99 1 931,39 1 913,83
Sulawesi Utara 2 127,43 2 103,36 2 114,34
Sulawesi Tengah 1 718,26 1 957,99 1 898,49
Sulawesi Selatan 2 024,28 1 998,49 2 008,13
Sulawesi Tenggara 1 993,52 1 910,30 1 934,28
Gorontalo 2 093,38 2 006,96 2 036,95
Sulawesi Barat 2 056,84 1 945,33 1 967,76
Maluku 1 854,68 1 806,12 1 825,01
Maluku Utara 1 789,56 1 667,46 1 700,69
Papua Barat 1 902,70 1 889,08 1 894,23
Papua 1 903,51 1 696,98 1 751,70
Indonesia 1 987,11 1 977,64 1 982,42
Sumber: Pengeluaran Untuk Konsumsi Penduduk Indonesia per Provinsi, BPSSource: Expenditure for Consumption of Indonesia by Province, BPS-Statistics IndonesiaCatatan: 1) Berdasarkan hasil Susenas SeptemberNote: 1) Based on September Susenas
http
://w
ww
.bps
.go.
id

http
://w
ww
.bps
.go.
id

PERTANIANAGRICULTURE
http://www.infoperistiwa.com/wp-content/uploads/2015/10/hasil-panen-padi-yang-melimpah-dan-kualitas.jpg 5ht
tp://w
ww
.bps
.go.
id

http
://w
ww
.bps
.go.
id
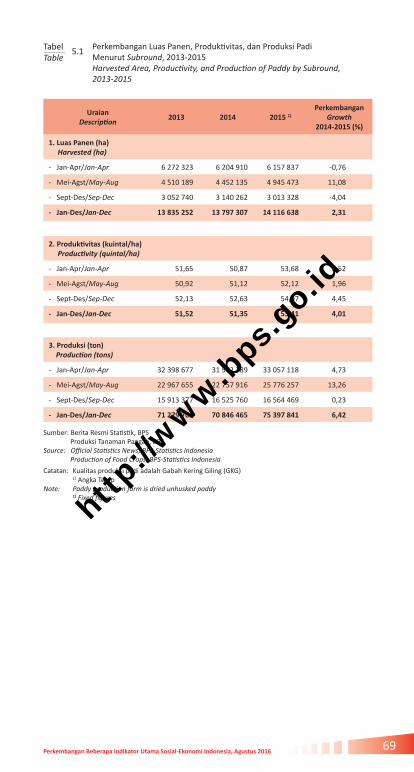
69Perkembangan Beberapa Indikator Utama Sosial-Ekonomi Indonesia, Agustus 2016
Perkembangan Luas Panen, Produktivitas, dan Produksi PadiMenurut Subround, 2013-2015Harvested Area, Productivity, and Production of Paddy by Subround, 2013-2015
TabelTable
5.1
UraianDescription
2013 2014 2015 1)
Perkembangan Growth
2014-2015 (%)
1. Luas Panen (ha) Harvested (ha)
- Jan-Apr/Jan-Apr 6 272 323 6 204 910 6 157 837 -0,76
- Mei-Agst/May-Aug 4 510 189 4 452 135 4 945 473 11,08
- Sept-Des/Sep-Dec 3 052 740 3 140 262 3 013 328 -4,04
- Jan-Des/Jan-Dec 13 835 252 13 797 307 14 116 638 2,31
2. Produktivitas (kuintal/ha) Productivity (quintal/ha)
- Jan-Apr/Jan-Apr 51,65 50,87 53,68 5,52
- Mei-Agst/May-Aug 50,92 51,12 52,12 1,96
- Sept-Des/Sep-Dec 52,13 52,63 54,97 4,45
- Jan-Des/Jan-Dec 51,52 51,35 53,41 4,01
3. Produksi (ton) Production (tons)
- Jan-Apr/Jan-Apr 32 398 677 31 562 789 33 057 118 4,73
- Mei-Agst/May-Aug 22 967 655 22 757 916 25 776 257 13,26
- Sept-Des/Sep-Dec 15 913 377 16 525 760 16 564 469 0,23
- Jan-Des/Jan-Dec 71 279 709 70 846 465 75 397 841 6,42
Sumber: Berita Resmi Statistik, BPS Produksi Tanaman Pangan, BPSSource: Official Statistics News, BPS-Statistics Indonesia Production of Food Crops, BPS-Statistics Indonesia
Catatan: Kualitas produksi padi adalah Gabah Kering Giling (GKG) 1) Angka TetapNote: Paddy production form is dried unhusked paddy 1) Fixed figures
http
://w
ww
.bps
.go.
id
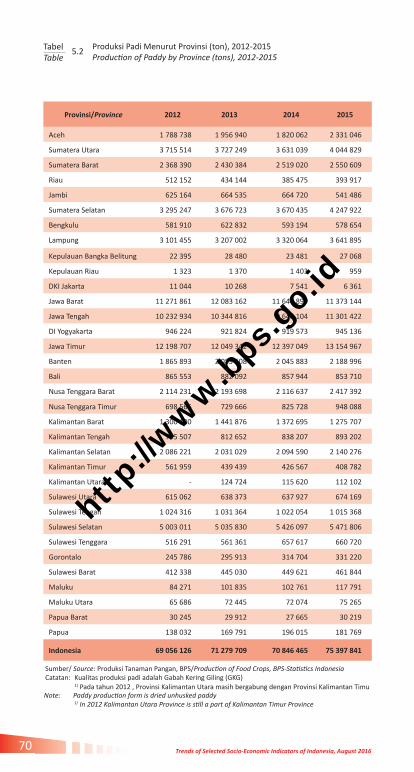
Trends of Selected Socio-Economic Indicators of Indonesia, August 201670
Produksi Padi Menurut Provinsi (ton), 2012-2015 Production of Paddy by Province (tons), 2012-2015
TabelTable
5.2
Provinsi/Province 2012 2013 2014 2015
Aceh 1 788 738 1 956 940 1 820 062 2 331 046
Sumatera Utara 3 715 514 3 727 249 3 631 039 4 044 829
Sumatera Barat 2 368 390 2 430 384 2 519 020 2 550 609
Riau 512 152 434 144 385 475 393 917
Jambi 625 164 664 535 664 720 541 486
Sumatera Selatan 3 295 247 3 676 723 3 670 435 4 247 922
Bengkulu 581 910 622 832 593 194 578 654
Lampung 3 101 455 3 207 002 3 320 064 3 641 895
Kepulauan Bangka Belitung 22 395 28 480 23 481 27 068
Kepulauan Riau 1 323 1 370 1 403 959
DKI Jakarta 11 044 10 268 7 541 6 361
Jawa Barat 11 271 861 12 083 162 11 644 899 11 373 144
Jawa Tengah 10 232 934 10 344 816 9 648 104 11 301 422
DI Yogyakarta 946 224 921 824 919 573 945 136
Jawa Timur 12 198 707 12 049 342 12 397 049 13 154 967
Banten 1 865 893 2 083 608 2 045 883 2 188 996
Bali 865 553 882 092 857 944 853 710
Nusa Tenggara Barat 2 114 231 2 193 698 2 116 637 2 417 392
Nusa Tenggara Timur 698 566 729 666 825 728 948 088
Kalimantan Barat 1 300 100 1 441 876 1 372 695 1 275 707
Kalimantan Tengah 755 507 812 652 838 207 893 202
Kalimantan Selatan 2 086 221 2 031 029 2 094 590 2 140 276
Kalimantan Timur 561 959 439 439 426 567 408 782
Kalimantan Utara 1) - 124 724 115 620 112 102
Sulawesi Utara 615 062 638 373 637 927 674 169
Sulawesi Tengah 1 024 316 1 031 364 1 022 054 1 015 368
Sulawesi Selatan 5 003 011 5 035 830 5 426 097 5 471 806
Sulawesi Tenggara 516 291 561 361 657 617 660 720
Gorontalo 245 786 295 913 314 704 331 220
Sulawesi Barat 412 338 445 030 449 621 461 844
Maluku 84 271 101 835 102 761 117 791
Maluku Utara 65 686 72 445 72 074 75 265
Papua Barat 30 245 29 912 27 665 30 219
Papua 138 032 169 791 196 015 181 769
Indonesia 69 056 126 71 279 709 70 846 465 75 397 841
Sumber/ Source: Produksi Tanaman Pangan, BPS/Production of Food Crops, BPS-Statistics IndonesiaCatatan: Kualitas produksi padi adalah Gabah Kering Giling (GKG) 1) Pada tahun 2012 , Provinsi Kalimantan Utara masih bergabung dengan Provinsi Kalimantan Timu Note: Paddy production form is dried unhusked paddy 1) In 2012 Kalimantan Utara Province is still a part of Kalimantan Timur Province
http
://w
ww
.bps
.go.
id

71Perkembangan Beberapa Indikator Utama Sosial-Ekonomi Indonesia, Agustus 2016
Perkembangan Luas Panen, Produktivitas, dan Produksi Jagung Menurut Subround, 2013-2015 Harvested Area, Productivity, and Production of Maize by Subround,2013-2015
TabelTable
5.3
UraianDescription
2013 2014 2015 1)
Perkembangan Growth
2014-2015 (%)
1. Luas Panen (ha) Harvested (ha)
- Jan-Apr/Jan-Apr 1 939 796 1 890 501 1 948 050 3,04
- Mei-Agst/May-Aug 1 089 691 1 155 714 1 133 922 -1,89
- Sept-Des/Sep-Dec 792 017 790 804 705 393 -10,80
- Jan-Des/Jan-Dec 3 821 504 3 837 019 3 787 367 -1,29
2. Produktivitas (kuintal/ha) Productivity (quintal/ha)
- Jan-Apr/Jan-Apr 45,49 45,54 48,99 7,58
- Mei-Agst/May-Aug 48,74 50,97 51,19 0,43
- Sept-Des/Sep-Dec 55,27 57,01 60,45 6,03
- Jan-Des/Jan-Dec 48,44 49,54 51,78 4,52
3. Produksi (ton) Production (tons)
- Jan-Apr/Jan-Apr 8 823 368 8 608 935 9 544 012 10,86
- Mei-Agst/May-Aug 5 310 778 5 891 110 5 804 249 -1,47
- Sept-Des/Sep-Dec 4 377 707 4 508 381 4 264 174 -5,42
- Jan-Des/Jan-Dec 18 511 853 19 008 426 19 612 435 3,18
Sumber: Berita Resmi Statistik, BPS Produksi Tanaman Pangan, BPSSource: Official Statistics News, BPS-Statistics Indonesia Production of Food Crops, BPS-Statistics Indonesia
Catatan: Bentuk produksi jagung adalah pipilan kering 1) Angka tetap Note: Maize production form is dried loose 1) Fixed figures
http
://w
ww
.bps
.go.
id

Trends of Selected Socio-Economic Indicators of Indonesia, August 201672
Produksi Jagung Menurut Provinsi (ton), 2012-2015Production of Maize by Province (tons), 2012-2015
TabelTable
5.4
Sumber: Produksi Tanaman Pangan, BPS Source: Production of Food Crops, BPS-Statistics IndonesiaCatatan: Bentuk produksi jagung adalah pipilan kering 1) Pada 2012, Provinsi Kalimantan Utara masih bergabung dengan Provinsi Kalimantan Timur Note: Maize production form is dried loose 1) In 2012 Kalimantan Utara Province is still a part of Kalimantan Timur Province
Provinsi/Province 2012 2013 2014 2015
Aceh 167 285 177 842 202 318 205 125
Sumatera Utara 1 347 124 1 183 011 1 159 795 1 519 407
Sumatera Barat 495 497 547 417 605 352 602 549
Riau 31 433 28 052 28 651 30 870
Jambi 25 571 25 690 43 617 51 712
Sumatera Selatan 112 917 167 457 191 974 289 007
Bengkulu 103 771 93 988 72 756 52 785
Lampung 1 760 275 1 760 278 1 719 386 1 502 800
Kepulauan Bangka Belitung 967 783 721 666
Kepulauan Riau 849 790 703 473
DKI Jakarta 6 - - -
Jawa Barat 1 028 653 1 101 998 1 047 077 959 933
Jawa Tengah 3 041 630 2 930 911 3 051 516 3 212 391
DI Yogyakarta 336 608 289 580 312 236 299 084
Jawa Timur 6 295 301 5 760 959 5 737 382 6 131 163
Banten 9 819 12 038 10 514 11 870
Bali 61 873 57 573 40 613 40 603
Nusa Tenggara Barat 642 674 633 773 785 864 959 973
Nusa Tenggara Timur 629 386 707 642 647 108 685 081
Kalimantan Barat 170 123 159 973 135 461 103 742
Kalimantan Tengah 7 947 6 217 8 138 8 189
Kalimantan Selatan 112 066 107 043 117 986 128 505
Kalimantan Timur 9 940 4 864 7 567 8 379
Kalimantan Utara 1) - 973 1 235 1 032
Sulawesi Utara 440 308 448 002 488 362 300 490
Sulawesi Tengah 141 649 139 266 170 203 131 123
Sulawesi Selatan 1 515 329 1 250 202 1 490 991 1 528 414
Sulawesi Tenggara 78 447 67 578 60 600 68 141
Gorontalo 644 754 669 094 719 780 643 512
Sulawesi Barat 122 554 128 327 110 665 100 811
Maluku 18 281 11 940 10 568 13 947
Maluku Utara 25 543 29 421 19 555 11 728
Papua Barat 2 049 2 137 2 450 2 264
Papua 6 393 7 034 7 282 6 666
Indonesia 19 387 022 18 511 853 19 008 426 19 612 435
http
://w
ww
.bps
.go.
id

73Perkembangan Beberapa Indikator Utama Sosial-Ekonomi Indonesia, Agustus 2016
Perkembangan Luas Panen, Produktivitas, dan Produksi Kedelai Menurut Subround, 2013-2015 Harvested Area, Productivity, and Production of Soybean by Subround, 2013-2015
TabelTable
5.5
Sumber: Berita Resmi Statistik, BPS Produksi Tanaman Pangan, BPSSource: Official Statistics News, BPS-Statistics Indonesia Production of Food Crops, BPS-Statistics Indonesia
Catatan: Kualitas produksi kedelai adalah biji kering 1) Angka tetap
UraianDescription
2013 2014 2015 1)
PerkembanganGrowth
2014-2015 (%)
1. Luas Panen (ha) Harvested (ha)
- Jan-Apr/Jan-Apr 156 969 169 291 144 130 -14,86
- Mei-Agst/May-Aug 183 712 222 589 245 487 10,29
- Sept-Des/Sep-Dec 210 112 223 805 224 478 0,30
- Jan-Des/Jan-Dec 550 793 615 685 614 095 -0,26
2. Produktivitas (kuintal/ha) Productivity (quintal/ha)
- Jan-Apr/Jan-Apr 14,25 16,00 17,18 7,38
- Mei-Agst/May-Aug 13,59 14.21 14,63 2,96
- Sept-Des/Sep-Dec 14,59 16.44 15,88 -3,41
- Jan-Des/Jan-Dec 14,16 15.51 15,68 1,10
3. Produksi (ton) Production (tons)
- Jan-Apr/Jan-Apr 223 741 270 790 247 558 -8,58
- Mei-Agst/May-Aug 249 629 316 281 359 133 13,55
- Sept-Des/Sep-Dec 306 622 367 926 356 492 -3,11
- Jan-Des/Jan-Dec 779 992 954 997 963 183 0,86
INote: Soybean production form is dried shelled 1) Fixed figures
http
://w
ww
.bps
.go.
id

Trends of Selected Socio-Economic Indicators of Indonesia, August 201674
Produksi Kedelai Menurut Provinsi (ton), 2012-2015Production of Soybean by Province (tons), 2012-2015
TabelTable
5.6
Sumber: Produksi Tanaman Pangan, BPS Source: Production of Food Crops, BPS-Statistics Indonesia
Catatan: Bentuk produksi kedelai adalah biji kering 1) Pada tahun 2012 , Provinsi Kalimantan Utara masih bergabung dengan Provinsi Kalimantan Timu Note: Soybean production form is dried shelled 1) In 2012 Kalimantan Utara Province is still a part of Kalimantan Timur Province
Provinsi/Province 2012 2013 2014 2015
Aceh 51 439 45 027 63 352 47 910
Sumatera Utara 5 419 3 229 5 705 6 549
Sumatera Barat 1 106 732 911 353
Riau 4 182 2 211 2 332 2 145
Jambi 3 516 2 372 6 800 6 732
Sumatera Selatan 12 162 5 140 12 550 16 818
Bengkulu 2 316 3 987 5 715 5 388
Lampung 7 993 6 156 13 777 9 815
Kepulauan Bangka Belitung 1 - 3 1
Kepulauan Riau 15 18 18 15
DKI Jakarta - - -
Jawa Barat 47 426 51 172 115 261 98 938
Jawa Tengah 152 416 99 318 125 467 129 794
DI Yogyakarta 36 033 31 677 19 579 18 822
Jawa Timur 361 986 329 461 355 464 344 998
Banten 5 780 10 326 6 384 7 291
Bali 8 210 7 433 8 187 7 259
Nusa Tenggara Barat 74 156 91 065 97 172 125 036
Nusa Tenggara Timur 2 781 1 675 2 710 3 615
Kalimantan Barat 1 339 1 677 3 161 2 637
Kalimantan Tengah 1 700 1 684 1 397 1 262
Kalimantan Selatan 3 860 4 072 8 946 10 537
Kalimantan Timur 1 364 1 402 1 128 1 519
Kalimantan Utara 1) - 84 97 2 239
Sulawesi Utara 2 973 5 780 7 529 6 685
Sulawesi Tengah 8 202 12 654 16 399 13 270
Sulawesi Selatan 29 938 45 693 54 723 67 192
Sulawesi Tenggara 3 710 3 595 5 691 12 799
Gorontalo 3 451 4 411 4 273 3 203
Sulawesi Barat 3 222 1 181 3 998 4 218
Maluku 348 254 578 707
Maluku Utara 1 303 1 227 762 475
Papua Barat 650 669 945 1 439
Papua 4 156 4 610 3 983 3 522
Indonesia 843 153 779 992 954 997 963 183
http
://w
ww
.bps
.go.
id
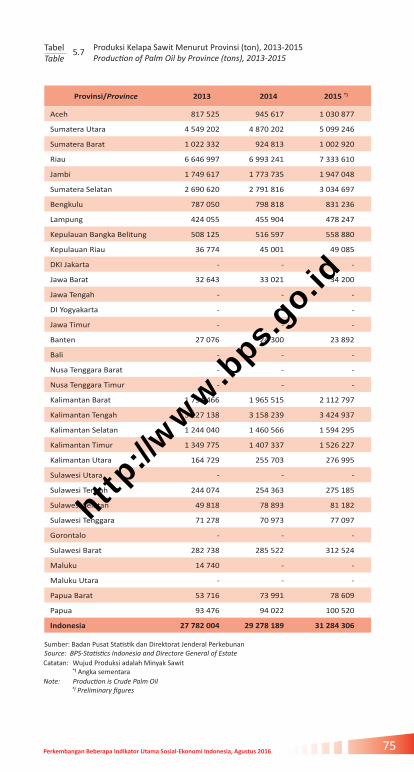
75Perkembangan Beberapa Indikator Utama Sosial-Ekonomi Indonesia, Agustus 2016
Produksi Kelapa Sawit Menurut Provinsi (ton), 2013-2015Production of Palm Oil by Province (tons), 2013-2015
TabelTable
5.7
Provinsi/Province 2013 2014 2015 *)
Aceh 817 525 945 617 1 030 877
Sumatera Utara 4 549 202 4 870 202 5 099 246
Sumatera Barat 1 022 332 924 813 1 002 920
Riau 6 646 997 6 993 241 7 333 610
Jambi 1 749 617 1 773 735 1 947 048
Sumatera Selatan 2 690 620 2 791 816 3 034 697
Bengkulu 787 050 798 818 831 236
Lampung 424 055 455 904 478 247
Kepulauan Bangka Belitung 508 125 516 597 558 880
Kepulauan Riau 36 774 45 001 49 085
DKI Jakarta - - -
Jawa Barat 32 643 33 021 34 200
Jawa Tengah - - -
DI Yogyakarta - - -
Jawa Timur - - -
Banten 27 076 24 300 23 892
Bali - - -
Nusa Tenggara Barat - - -
Nusa Tenggara Timur - - -
Kalimantan Barat 1 794 466 1 965 515 2 112 797
Kalimantan Tengah 3 127 138 3 158 239 3 424 937
Kalimantan Selatan 1 244 040 1 460 566 1 594 295
Kalimantan Timur 1 349 775 1 407 337 1 526 227
Kalimantan Utara 164 729 255 703 276 995
Sulawesi Utara - - -
Sulawesi Tengah 244 074 254 363 275 185
Sulawesi Selatan 49 818 78 893 81 182
Sulawesi Tenggara 71 278 70 973 77 097
Gorontalo - - -
Sulawesi Barat 282 738 285 522 312 524
Maluku 14 740 - -
Maluku Utara - - -
Papua Barat 53 716 73 991 78 609
Papua 93 476 94 022 100 520
Indonesia 27 782 004 29 278 189 31 284 306
Sumber: Badan Pusat Statistik dan Direktorat Jenderal Perkebunan Source: BPS-Statistics Indonesia and Directore General of EstateCatatan: Wujud Produksi adalah Minyak Sawit *) Angka sementara Note: Production is Crude Palm Oil *) Preliminary figures
http
://w
ww
.bps
.go.
id

Trends of Selected Socio-Economic Indicators of Indonesia, August 201676
Perkembangan Produksi Tanaman Sayuran Menurut Jenis Tanaman (ton), 2014-2015Production and Growth of Vegetables Plant by Kind of Plant (tons), 2014-2015
TabelTable
5.8
Jenis Tanaman Kind of Plant
2014 2015
Perkembangan/Growth
2014-2015
Absolut/Absolute %
Bawang Merah/Shallot 1 233 989 1 229 189 - 4 800 -0,39
Bawang Putih/Garlic 16 894 20 293 3 399 20,12
Bawang Daun/Welch Onion 584 631 512 497 - 72 134 -12,34
Kentang/Potato 1 347 818 1 219 277 - 128 541 -9,54
Kubis/Cabbage 1 435 840 1 443 227 7 387 0,51
Kembang Kol/Cauliflower 136 514 118 394 - 18 120 -13,27
Petsai/Chinese Cabbage 602 478 600 200 - 2 278 -0,38
Wortel/Carrot 495 800 522 529 26 729 5,39
Lobak/Chinese radish 31 865 21 479 - 10 386 -32,59
Kacang Merah/Red bean 100 319 42 388 - 57 931 -57,75
Kacang Panjang/Yard long bean 450 727 395 524 - 55 203 -12,25
Cabe Besar/Great Chili 1 074 611 1 045 200 - 29 411 -2,74
Cabe Rawit/Cayenne pepper 800 484 869 954 69 470 8,68
Cabe/Chili 1 875 095 1 915 154 40 059 2,14
Paprika/Sweet pepper 7 028 5 658 - 1 370 -19,49
Jamur/Mushroom 37 410 33 485 - 3 925 -10,49
Tomat/Tomato 916 001 877 801 - 38 200 -4,17
Terung/Egg plant, Aubergin 557 053 514 332 - 42 721 -7,67
Buncis/Green bean 318 218 291 333 - 26 885 -8,45
Ketimun/Cucumber 477 989 447 696 - 30 293 -6,34
Labu Siam/Chayote 357 561 431 219 73 658 20,60
Kangkung/Kangkong 319 618 299 531 - 20 087 -6,28
Bayam/Spinach 134 166 150 093 15 927 11,87
Melinjo/Melinjo 197 648 213 025 15 377 7,78
Petai/Twisted cluster bean 230 406 261 063 30 657 13,31
Jengkol/Jengkol 53 661 58 691 5 030 9,37
Sumber: Statistik Tanaman Sayuran dan Buah-buahan Semusim Indonesia, BPSSource: Statistics of Seasonal Vegetables and Fruit Plants Indonesia, BPS-Statistics Indonesiaht
tp://w
ww
.bps
.go.
id

77Perkembangan Beberapa Indikator Utama Sosial-Ekonomi Indonesia, Agustus 2016
Perkembangan Produksi Tanaman Buah-buahan Menurut Jenis Tanaman (ton), 2014-2015Production and Growth of Fruit Plant by Kind of Plant (tons), 2014-2015
TabelTable 5.9
Jenis Tanaman Kind of Plant
Perkembangan/Growth
2014 2015 2014-2015
Absolut/absolute (%)
Alpukat/ Avocado 307 326 382 542 75 216 24,47
Anggur/ Grape 11 146 11 410 264 2,37
Apel/ Apple 242 915 238 434 - 4 481 -1,84
Belimbing/ Star fruit 81 663 98 968 17 305 21,19
Blewah/ Blewah 38 665 34 306 - 4 359 -11,27
Duku,Langsat/ Duku 208 426 274 319 65 892 31,61
Durian/ Durian 859 127 995 735 136 608 15,90
Jambu air/ Rose apple 91 983 92 549 566 0,62
Jambu Biji/ Guava 187 418 195 751 8 333 4,45
Jeruk besar/ Pomelo 141 296 111 753 - 29 543 -20,91
Jeruk Siam, Keprok/ Tangerine 1 785 264 1 744 339 - 40 925 -2,29
Mangga/ Mango 2 431 329 2 178 833 - 252 496 -10,39
Manggis/ Mangosteen 114 760 203 103 88 342 76,98
Markisa/ Marquisa 108 144 113 130 4 985 4,61
Melon/ Melon 150 356 137 879 - 12 477 -8,30
Nanas/ Pineapple 1 835 490 1 729 603 - 105 888 -5,77
Nangka, Cempedak/ Jackfruit 644 296 699 495 55 198 8,57
Pepaya/ Papaya 840 119 851 532 11 411 1,36
Pisang/ Banana 6 862 567 7 299 275 436 707 6,36
Rambutan/ Rambutan 737 246 882 628 145 381 19,72
Salak/ Salacca 1 118 962 965 205 - 153 757 -13,74
Sawo/Sapodilla/ Star apple 138 209 134 647 - 3 562 -2,58
Semangka/ Wat ermelon 653 995 576 167 - 77 828 -11,90
Sirsak/ Soursop 53068 58 994 5 926 11,17
Stroberi/ Strawberry 58 884 31 798 - 27 086 -46,00
Sukun/ Breadfruit 103 491 125 048 21 555 20,83
Sumber: Statistik Tanaman Buah-buahan dan Sayuran Tahunan Indonesia, BPSSource: Statistics of Annual Fruit and Vegetables Plant Indonesia, BPS-Statistics Indonesia
http
://w
ww
.bps
.go.
id
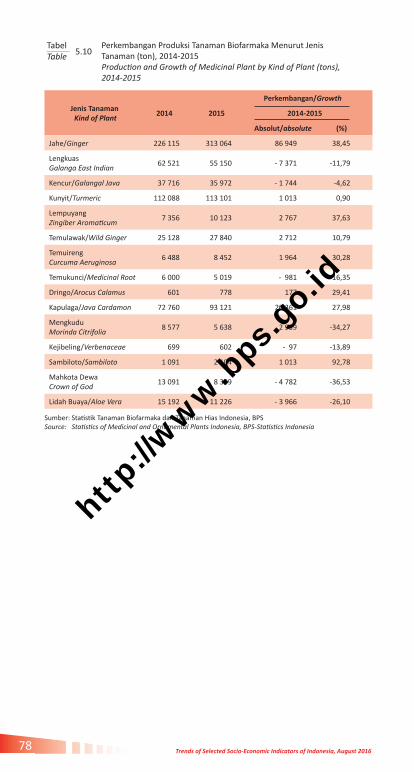
Trends of Selected Socio-Economic Indicators of Indonesia, August 201678
Perkembangan Produksi Tanaman Biofarmaka Menurut Jenis Tanaman (ton), 2014-2015Production and Growth of Medicinal Plant by Kind of Plant (tons), 2014-2015
TabelTable 5.10
Jenis Tanaman Kind of Plant
Perkembangan/Growth
2014 2015 2014-2015
Absolut/absolute (%)
Jahe/Ginger 226 115 313 064 86 949 38,45
LengkuasGalanga East Indian
62 521 55 150 - 7 371 -11,79
Kencur/Galangal Java 37 716 35 972 - 1 744 -4,62
Kunyit/Turmeric 112 088 113 101 1 013 0,90
LempuyangZingiber Aromaticum
7 356 10 123 2 767 37,63
Temulawak/Wild Ginger 25 128 27 840 2 712 10,79
TemuirengCurcuma Aeruginosa
6 488 8 452 1 964 30,28
Temukunci/Medicinal Root 6 000 5 019 - 981 -16,35
Dringo/Arocus Calamus 601 778 177 29,41
Kapulaga/Java Cardamon 72 760 93 121 20 361 27,98
MengkuduMorinda Citrifolia
8 577 5 638 2 939 -34,27
Kejibeling/Verbenaceae 699 602 - 97 -13,89
Sambiloto/Sambiloto 1 091 2 104 1 013 92,78
Mahkota DewaCrown of God
13 091 8 309 - 4 782 -36,53
Lidah Buaya/Aloe Vera 15 192 11 226 - 3 966 -26,10
Sumber: Statistik Tanaman Biofarmaka dan Tanaman Hias Indonesia, BPSSource: Statistics of Medicinal and Ornamental Plants Indonesia, BPS-Statistics Indonesia
http
://w
ww
.bps
.go.
id
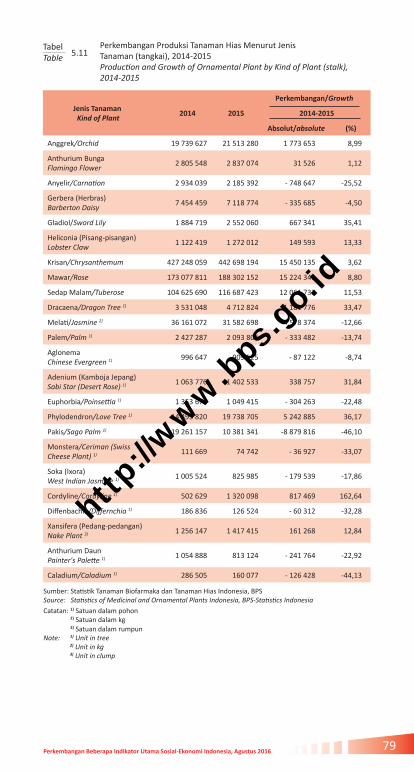
79Perkembangan Beberapa Indikator Utama Sosial-Ekonomi Indonesia, Agustus 2016
Perkembangan Produksi Tanaman Hias Menurut Jenis Tanaman (tangkai), 2014-2015Production and Growth of Ornamental Plant by Kind of Plant (stalk), 2014-2015
TabelTable 5.11
Jenis Tanaman Kind of Plant
Perkembangan/Growth
2014 2015 2014-2015
Absolut/absolute (%)
Anggrek/Orchid 19 739 627 21 513 280 1 773 653 8,99
Anthurium BungaFlamingo Flower
2 805 548 2 837 074 31 526 1,12
Anyelir/Carnation 2 934 039 2 185 392 - 748 647 -25,52
Gerbera (Herbras)Barberton Daisy
7 454 459 7 118 774 - 335 685 -4,50
Gladiol/Sword Lily 1 884 719 2 552 060 667 341 35,41
Heliconia (Pisang-pisangan) Lobster Claw
1 122 419 1 272 012 149 593 13,33
Krisan/Chrysanthemum 427 248 059 442 698 194 15 450 135 3,62
Mawar/Rose 173 077 811 188 302 152 15 224 341 8,80
Sedap Malam/Tuberose 104 625 690 116 687 423 12 061 733 11,53
Dracaena/Dragon Tree 1) 3 531 048 4 712 824 1 181 776 33,47
Melati/Jasmine 2) 36 161 072 31 582 698 -4 578 374 -12,66
Palem/Palm 1) 2 427 287 2 093 805 - 333 482 -13,74
AglonemaChinese Evergreen 1) 996 647 909 525 - 87 122 -8,74
Adenium (Kamboja Jepang) Sabi Star (Desert Rose) 1) 1 063 776 1 402 533 338 757 31,84
Euphorbia/Poinsettia 1) 1 353 678 1 049 415 - 304 263 -22,48
Phylodendron/Love Tree 1) 14 495 820 19 738 705 5 242 885 36,17
Pakis/Sago Palm 1) 19 261 157 10 381 341 -8 879 816 -46,10
Monstera/Ceriman (Swiss Cheese Plant) 1) 111 669 74 742 - 36 927 -33,07
Soka (Ixora)West Indian Jasmine 1) 1 005 524 825 985 - 179 539 -17,86
Cordyline/Cordyline 1) 502 629 1 320 098 817 469 162,64
Diffenbachia/Differnchia 1) 186 836 126 524 - 60 312 -32,28
Xansifera (Pedang-pedangan) Nake Plant 3) 1 256 147 1 417 415 161 268 12,84
Anthurium Daun Painter's Palette 1) 1 054 888 813 124 - 241 764 -22,92
Caladium/Caladium 1) 286 505 160 077 - 126 428 -44,13
Sumber: Statistik Tanaman Biofarmaka dan Tanaman Hias Indonesia, BPSSource: Statistics of Medicinal and Ornamental Plants Indonesia, BPS-Statistics Indonesia
Catatan: 1) Satuan dalam pohon 2) Satuan dalam kg 3) Satuan dalam rumpun Note: 1) Unit in tree 2) Unit in kg 3) Unit in clump
http
://w
ww
.bps
.go.
id

Trends of Selected Socio-Economic Indicators of Indonesia, August 201680
Populasi Sapi Potong, Sapi Perah, dan Kerbau Menurut Provinsi, 2014-2015Population of Beef Cattle, Dairy Cattle, and Buffalo by Province, 2014-2015
TabelTable 5.12
Provinsi Province
Sapi Potong (ribu ekor)Beef Cattle (thousands)
Sapi Perah (ribu ekor)Dairy Cattle (thousands)
Kerbau (ribu ekor)Buffalo (thousands)
2014 2015 *) 2014 2015 *) 2014 2015 *)
Aceh 511,4 536,9 0,1 0,1 166,9 175,2
Sumatera Utara 646,7 666,5 1,1 1,1 116,0 117,2
Sumatera Barat 390,5 400,3 0,7 0,7 118,8 123,6
Riau 217,7 242,2 0,1 0,1 43,2 47,8
Jambi 136,6 140,2 0,1 0,1 43,6 44,5
Sumatera Selatan 245,2 261,5 0,1 0,1 33,4 36,5
Bengkulu 109,2 115,6 0,2 0,2 19,4 20,9
Lampung 587,8 598,7 0,3 0,3 26,2 22,9
Kepulauan Bangka Belitung
10,1 11,1 0,1 0,2 0,2 0,2
Kepulauan Riau 18,0 18,5 0,0 0,0 0,0 0,0
Sumatera 2 873,2 2 991,5 2,8 2,9 567,7 588,8
DKI Jakarta 1,2 2,1 2,6 2,8 0,3 0,3
Jawa Barat 419,1 448,0 123,1 135,3 113,9 117,3
Jawa Tengah 1 592,6 1 628,1 122,6 123,4 66,9 67,7
DI Yogyakarta 302,0 322,8 4,0 4,5 1,0 1,0
Jawa Timur 4 125,3 4 326,3 245,2 253,8 28,5 28,5
Banten 54,9 57,2 0,0 0,0 101,6 104,0
Jawa 6 495,1 6 784,5 497,5 519,8 312,2 318,8
Bali 553,6 570,4 0,1 0,1 1,6 1,6
Nusa Tenggara Barat 1 013,8 1 046,8 - - 129,1 133,3
Nusa Tenggara Timur 865,7 902,3 0,0 0,0 134,5 139,2
Bali, Nusa Tenggara 2 433,1 2 519,5 0,1 0,1 265,2 274,1
Kalimantan Barat 151,4 158,9 0,0 0,1 3,2 3,4
Kalimantan Tengah 65,2 70,9 - - 10,5 10,9
Kalimantan Selatan 141,4 150,9 0,2 0,2 25,3 27,3
Kalimantan Timur 101,7 141,9 0,1 0,1 5,9 6,1
Kalimantan Utara 19,6 22,3 0,0 0,0 3,7 4,0
Kalimantan 479,3 544,9 0,3 0,4 48,6 51,7
Sulawesi Utara 115,2 121,9 0,1 0,1 - -
Sulawesi Tengah 262,9 272,5 0,0 0,0 3,3 3,2
Sulawesi Selatan 1 200,1 1 340,5 1,5 1,6 108,7 111,7
Sulawesi Tenggara 265,4 287,7 0,0 0,0 2,3 2,5
Gorontalo 192,2 194,6 0,0 0,0 0,0 0,0
Sulawesi Barat 84,7 85,6 0,0 0,0 7,6 7,7
Sulawesi 2 120,5 2 302,8 1,6 1,7 121,9 125,1
Maluku 90,4 102,9 - - 18,0 21,1
Maluku Utara 78,8 80,8 - - 0,8 0,8
Papua Barat 61,4 67,3 - - - -
Papua 94,9 100,1 - - 0,8 0,8
Maluku & Papua 325,5 351,1 19,6 22,7
Indonesia 14 726,7 15 494,0 502,3 524,9 1 335,2 1 381,0
Sumber: Direktorat Jenderal Peternakan dan Kesehatan HewanSource: Directorate General of Livestock Service and Animal Health
Catatan: *) Angka sementara Note: *) Preliminary figures
http
://w
ww
.bps
.go.
id

81Perkembangan Beberapa Indikator Utama Sosial-Ekonomi Indonesia, Agustus 2016
Provinsi/ProvinceSapi/Cow Kerbau/Buffalo
2014 2015 *) 2014 2015*)
Aceh 8 814 10 663 2 765 2 765
Sumatera Utara 22 656 23 268 4 170 4 184
Sumatera Barat 24 943 25 981 2 602 2 680
Riau 9 298 9 739 1 840 1 990
Jambi 4 329 4 494 1 982 2 155
Sumatera Selatan 15 281 17 046 840 1 132
Bengkulu 3 106 3 454 1 399 1 497
Lampung 13 074 13 446 252 250
Kepulauan Bangka Belitung 3 427 3 770 4 1
Kepulauan Riau 2 663 2 844 2 1
DKI Jakarta 19 260 20 636 34 34
Jawa Barat 67 073 73 442 1 970 1 969
Jawa Tengah 55 988 59 281 2 202 2 330
DI Yogyakarta 8 611 8 868 - -
Jawa Timur 97 908 100 172 159 149
Banten 37 672 38 954 7 137 1 929
Bali 7 283 7 337 23 24
Nusa Tenggara Barat 10 847 12 921 1 727 2 054
Nusa Tenggara Timur 11 656 12 149 1 290 1 385
Kalimantan Barat 7 274 7 636 49 49
Kalimantan Tengah 3 844 3 940 56 56
Kalimantan Selatan 8 573 8 522 691 723
Kalimantan Timur 8 700 9 135 64 67
Kalimantan Utara 675 708 12 13
Sulawesi Utara 4 587 4 621 - -
Sulawesi Tengah 5 131 6 005 45 47
Sulawesi Selatan 17 214 16 221 3 546 3 622
Sulawesi Tenggara 4 374 4 450 10 12
Gorontalo 2 460 2 552 - -
Sulawesi Barat 1 988 2 079 135 186
Maluku 1 592 2 166 155 283
Maluku Utara 999 846 - -
Papua Barat 3 658 3 759 - -
Papua 2 711 2 821 75 82
Indonesia 497 669 523 926 35 236 31 669
Produksi Daging Ternak Menurut Provinsi (ton), 2014-2015Meat Production by Province (tons) , 2014-2015
TabelTable 5.13
Sumber: Direktorat Jenderal Peternakan dan Kesehatan HewanSource: Directorate General of Livestock Service and Animal HealthCatatan: *) Angka sementara Note: *) Preliminary figures
http
://w
ww
.bps
.go.
id

Trends of Selected Socio-Economic Indicators of Indonesia, August 201682
Produksi Ikan di Indonesia (ton), 1991-2014Production of Fish in Indonesia (tons), 1991-2014
TabelTable 5.14
Sumber: Direktorat Jenderal Perikanan Tangkap dan Direktorat Jenderal Perikanan BudidayaSource: Directorate General of Capture Fisheries and Directorate General of Aquaculture
Tahun Year
Ikan Tangkap Fish Capture
Ikan Budidaya Fish Culture
Jumlah/Total
Berat/Weight % Berat/Weight % Berat/Weight %
1991 2 832 089 517 512 3 349 601
1992 2 992 964 5,68 550 368 6,35 3 543 332 5,78
1993 3 194 938 6,75 600 384 9,09 3 795 322 7,11
1994 3 416 309 6,93 597 520 -0,48 4 013 829 5,76
1995 3 622 640 6,04 640 947 7,27 4 263 587 6,22
1996 3 719 163 2,66 733 095 14,38 4 452 258 4,43
1997 3 917 219 5,33 662 547 -9,62 4 579 766 2,86
1998 4 012 412 2,43 629 797 -4,94 4 642 209 1,36
1999 4 010 071 -0,06 882 989 40,20 4 893 060 5,40
2000 4 125 525 2,88 994 962 12,68 5 120 487 4,65
2001 4 276 720 3,66 1 076 750 8,22 5 353 470 4,55
2002 4 378 495 2,38 1 137 153 5,61 5 515 648 3,03
2003 4 691 796 7,16 1 224 192 7,65 5 915 988 7,26
2004 4 651 121 -0,87 1 468 610 19,97 6 119 731 3,44
2005 4 705 869 1,18 2 163 674 47,33 6 869 543 12,25
2006 4 806 112 2,13 2 682 596 23,98 7 488 708 9,01
2007 5 044 737 4,97 3 193 565 19,05 8 238 302 10,01
2008 5 196 328 3,00 3 855 200 20,72 9 051 528 9,87
2009 5 107 971 -1,70 4 708 563 22,14 9 816 543 8,45
2010 5 384 418 5,41 6 277 929 33,33 11 662 347 18,80
2011 5 714 271 6,13 7 928 963 26,30 13 643 234 16,99
2012 5 829 194 2,01 9 675 553 22,03 15 504 747 13,64
2013 6 115 376 4,91 13 300 906 37,47 19 416 282 25,23
2014 6 484 346 6,03 14 359 129 7,96 20 843 475 7,35http
://w
ww
.bps
.go.
id
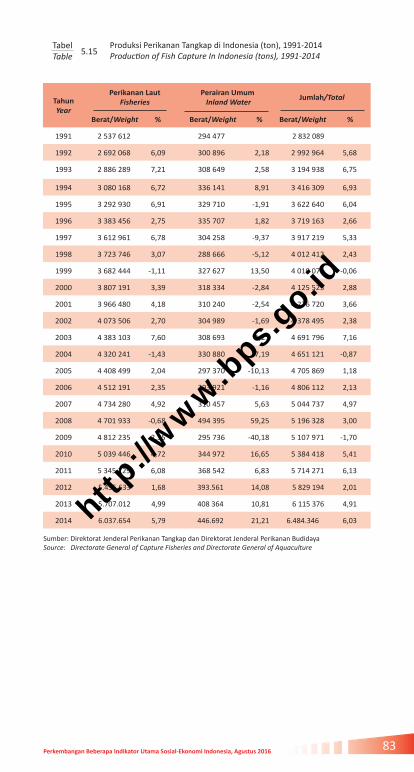
83Perkembangan Beberapa Indikator Utama Sosial-Ekonomi Indonesia, Agustus 2016
Produksi Perikanan Tangkap di Indonesia (ton), 1991-2014Production of Fish Capture In Indonesia (tons), 1991-2014
TabelTable 5.15
Tahun Year
Perikanan Laut Fisheries
Perairan Umum Inland Water
Jumlah/Total
Berat/Weight % Berat/Weight % Berat/Weight %
1991 2 537 612 294 477 2 832 089
1992 2 692 068 6,09 300 896 2,18 2 992 964 5,68
1993 2 886 289 7,21 308 649 2,58 3 194 938 6,75
1994 3 080 168 6,72 336 141 8,91 3 416 309 6,93
1995 3 292 930 6,91 329 710 -1,91 3 622 640 6,04
1996 3 383 456 2,75 335 707 1,82 3 719 163 2,66
1997 3 612 961 6,78 304 258 -9,37 3 917 219 5,33
1998 3 723 746 3,07 288 666 -5,12 4 012 412 2,43
1999 3 682 444 -1,11 327 627 13,50 4 010 071 -0,06
2000 3 807 191 3,39 318 334 -2,84 4 125 525 2,88
2001 3 966 480 4,18 310 240 -2,54 4 276 720 3,66
2002 4 073 506 2,70 304 989 -1,69 4 378 495 2,38
2003 4 383 103 7,60 308 693 1,21 4 691 796 7,16
2004 4 320 241 -1,43 330 880 7,19 4 651 121 -0,87
2005 4 408 499 2,04 297 370 -10,13 4 705 869 1,18
2006 4 512 191 2,35 293 921 -1,16 4 806 112 2,13
2007 4 734 280 4,92 310 457 5,63 5 044 737 4,97
2008 4 701 933 -0,68 494 395 59,25 5 196 328 3,00
2009 4 812 235 2,35 295 736 -40,18 5 107 971 -1,70
2010 5 039 446 4,72 344 972 16,65 5 384 418 5,41
2011 5 345 729 6,08 368 542 6,83 5 714 271 6,13
2012 5.435.633 1,68 393.561 14,08 5 829 194 2,01
2013 5.707.012 4,99 408 364 10,81 6 115 376 4,91
2014 6.037.654 5,79 446.692 21,21 6.484.346 6,03
Sumber: Direktorat Jenderal Perikanan Tangkap dan Direktorat Jenderal Perikanan BudidayaSource: Directorate General of Capture Fisheries and Directorate General of Aquaculture
http
://w
ww
.bps
.go.
id

Trends of Selected Socio-Economic Indicators of Indonesia, August 201684
Tahunyear
Laut/Marine Tambak/Brackishwater Pond
Produksi (ton) Production (tons)
PertumbuhanGrowth (%)
Produksi (ton) Production (tons)
PertumbuhanGrowth (%)
1991 - - 323 156 -
1992 - - 337 431 4,42
1993 - - 355 284 5,29
1994 - - 346 212 -2,55
1995 - - 361 239 4,34
1996 - - 404 335 11,93
1997 - - 370 259 -8,43
1998 - - 353 750 -4,46
1999 135 969 - 412 935 16,73
2000 197 114 44,97 430 017 4,14
2001 221 010 12,12 454 710 5,74
2002 234 859 473 128 4,05
2003 249 242 6,12 501 977 6,10
2004 420 919 68,88 559 612 11,48
2005 890 074 111,46 643 975 15,08
2006 1 365 918 53,46 629 610 -2,23
2007 1 509 528 10,51 933 833 48,32
2008 1 996 002 32,23 959 509 2,75
2009 2 820 083 41,29 907 123 -5,46
2010 3 514 703 24,63 1 416 036 56,10
2011 4 605 827 31,04 1 602 748 13,19
2012 5 769 737 25,27 1 756 799 9,61
2013 8 386 271 45,35 2 337 671 33,06
2014 9 034 756 7,73 2 428 389 3,88
Produksi Ikan Budidaya di Indonesia, 1991-2014Production of Aquaculture Fisheries in Indonesia, 1991-2014
TabelTable 5.16
http
://w
ww
.bps
.go.
id

85Perkembangan Beberapa Indikator Utama Sosial-Ekonomi Indonesia, Agustus 2016
Tahunyear
Kolam/Freshwater Pond Karamba/Cage
Produksi (ton) Production (tons)
PertumbuhanGrowth (%)
Produksi (ton) Production (tons)
PertumbuhanGrowth (%)
1991 106 862 - 6 648 -
1992 116 707 9,21 8 815 32,60
1993 141 890 21,58 26 045 195,46
1994 140 098 -1,26 33 011 26,75
1995 162 198 15,77 39 855 20,73
1996 182 918 12,77 44 630 11,98
1997 171 768 -6,10 26 186 -41,33
1998 168 478 -1,90 17 639 -32,64
1999 177 622 5,43 32 323 83,25
2000 214 393 20,70 25 773 -20,26
2001 222 790 3,92 39 340 52,64
2002 254 625 14,29 40 742 3,56
2003 281 262 10,46 40 304 -1,08
2004 286 182 1,75 53 695 33,22
2005 331 962 16,00 67 889 26,43
2006 381 946 15,06 56 200 -17,22
2007 410 373 7,44 63 929 13,75
2008 479 167 16,76 75 769 18,52
2009 554 067 15,63 101 771 34,32
2010 819 808 47,96 121 270 19,16
2011 1 127 127 37,49 131 383 8,34
2012 1 433 820 27,21 178 367 35,76
2013 1 774 407 23,75 200 006 12,13
2014 1 963 589 10,66 221 304 10,65
Lanjutan tabel 5.16/ Continued table 5.16
http
://w
ww
.bps
.go.
id

Trends of Selected Socio-Economic Indicators of Indonesia, August 201686
Tahunyear
Jaring Apung/Foating Cage Sawah/Paddy Field
Produksi (ton) Production (tons)
PertumbuhanGrowth (%)
Produksi (ton) Production (tons)
PertumbuhanGrowth (%)
1991 - - 80 846 -
1992 - - 87 415 8,13
1993 - - 77 165 -11,73
1994 - - 78 199 1,34
1995 - - 77 655 -0,70
1996 - - 101 212 30,34
1997 - - 94 334 -6,80
1998 - - 89 930 -4,67
1999 29 506 - 94 634 5,23
2000 34 602 17,27 93 063 -1,66
2001 40 710 17,65 98 190 5,51
2002 47 172 15,87 86 627 -11,78
2003 57 628 22,17 93 779 8,26
2004 62 371 8,23 85 831 -8,48
2005 109 421 75,44 120 353 40,22
2006 143 251 30,92 105 671 -12,20
2007 190 893 33,26 85 009 -19,55
2008 263 169 37,86 111 584 31,26
2009 238 606 -9,33 86 913 -22,11
2010 309 499 29,71 96 605 11,15
2011 375 430 21,30 86 448 -10,51
2012 455 012 21,20 81 818 -5,36
2013 505 248 11,04 97 303 18,93
2014 500 873 -0,87 144 263 48,26
Lanjutan tabel 5.16/ Continued table 5.16
Sumber: Direktorat Jenderal Perikanan Tangkap dan Direktorat Jenderal Perikanan BudidayaSource: Directorate General of Capture Fisheries and Directorate General of Aquaculture
http
://w
ww
.bps
.go.
id

87Perkembangan Beberapa Indikator Utama Sosial-Ekonomi Indonesia, Agustus 2016
Produksi Kayu Bulat Perusahaan Hak Pengusahaan Hutan (HPH)Menurut Provinsi (m3), 2010–2014Production of Logs of Forest Concession Estate by Province (m3),2010–2014
TabelTable 5.17
Provinsi/Province 2010 2011 2012 2013 2014
Aceh 50 778 - - - -
Sumatera Utara 49 190 37 698 35 805 135 868 69 573
Sumatera Barat 66 283 102 563 54 159 63 013 70 851
Riau 186 301 140 058 112 821 420 466 214 688
Jambi 53 096 48 889 - - 22 359
Sumatera Selatan 38 165 18 079 61 097 34 266 9 758
Bengkulu - - 15 354 13 997 7 098
Lampung - - - - -
Kepulauan Bangka Belitung - - - 9 501 -
Kepulauan Riau - - - - -
DKI Jakarta - - - - -
Jawa Barat - - - - -
Jawa Tengah - - - - -
DI Yogyakarta - - - - -
Jawa Timur - - - - -
Banten - - - - -
Bali - - - - -
Nusa Tenggara Barat - - - - -
Nusa Tenggara Timut - - - - -
Kalimantan Barat 610 137 398 162 290 300 218 593 160 781
Kalimantan Tengah 1 864 961 1 347 132 1 028 302 1 230 431 2 115 912
Kalimantan Selatan 83 666 86 066 49 973 7 800 17 096
Kalimantan Timur 2 474 066 2 137 723 1 942 627 1 695 449 1 292 769
Kalimantan Utara - - - - 523 643
Sulawesi Utara 12 472 16 043 - 16 154 13 911
Sulawesi Tengah 36 697 31 639 29 299 - 29 271
Sulawesi Selatan 9 759 20 209 16 986 11 519 -
Sulawesi Tenggara 278 805 - - -
Gorontalo 31 462 31 102 5 080 7 174 -
Sulawesi Barat 10 267 6 441 373 - 5 728
Maluku 273 873 232 187 271 091 205 944 85 727
Maluku Utara 340 129 511 308 305 962 36 720 55 820
Papua Barat 466 073 238 019 900 720 454 425 239 832
Papua 683 616 969 288 222 163 291 564 512 225
Indonesia 7 341 269 6 373 409 5 342 112 4 852 881 5 447 041
Sumber: Diolah dari Hasil Survei Perusahaan Hak Pengusahaan HutanSource: Based on Forest Concession Estate Survey
http
://w
ww
.bps
.go.
id

http
://w
ww
.bps
.go.
id

INDUSTRI MANUFAKTUR DAN KONSTRUKSI
MANUFACTURING AND CONSTRUCTION
6http://www.qerja.com/company/view/rekayasa-industri-pt#companyPic
http
://w
ww
.bps
.go.
id

http
://w
ww
.bps
.go.
id

91Perkembangan Beberapa Indikator Utama Sosial-Ekonomi Indonesia, Agustus 2016
Pertumbuhan Produksi Industri Manufaktur Besar dan Sedang Bulanan, 2012-2016 (2010=100) Monthly Production Growth of Large and Medium Manufacturing Industry, 2012-2016 (2010=100)
TabelTable
6.1
Sumber: - Berita Resmi Statistik, BPS - Laporan Bulanan Data Sosial Ekonomi, BPS Source: - Official Statistics News, BPS-Statistics Indonesia - Monthly Report on Socio-Economic Data, BPS-Statistics Indonesia
Bulan/Month 2012 2013 2014 2015 2016
Januari/January -0,13 -0,18 -0,03 -1,29 -1,12*)
Februari/February 2,80 -1,41 -0,61 -2,97 2,30**)
Maret/March -3,00 0,24 0,17 4,84 1,13***)
April/April 0,90 1,37 0,39 1,31
Mei/May 4,77 1,45 2,48 -3,21
Juni/June 1,37 -2,10 0,05 2,62
Juli/July 3,96 1,71 -2,64 -3,20
Agustus/August -9,54 -1,65 2,63 3,93
September/September 8,76 2,64 6,34 2,60
Oktober/October 7,82 1,45 -2,64 1,35
November/November -3,42 -1,57 -2,12 -1,74
Desember/December -0,01 0,99 2,64 -2,26
Industri ManufakturManufacturing Industry
4,12 6,01 4,76 4,76
Catatan: *) Angka sementara **) Angka sangat sementara ***) Angka sangat sangat sementara
Note: *) Preliminary figures **) Very preliminary figures ***) Excessively preliminary figures
http
://w
ww
.bps
.go.
id

Trends of Selected Socio-Economic Indicators of Indonesia, August 201692
Indeks dan Pertumbuhan Produksi Industri Manufaktur Besar dan Sedang Triwulanan (2010=100), 2010-2015 Quarterly Production Indices and Growth of Large and Medium Manufacturing Industry (2010=100), 2010-2015
TabelTable
6.2
Tahun/YearTriwulan/Quarter
I II III IV
201098,00 -1,59
101,934,00
97,72-4,13
100,69 3,04
2011 101,86 0,75
105,02 3,09
105,560,52
103,94 -1,53
2012 103,62 -0,31
107,163,42
107,27 0,10
115,48 7,65
2013 112,94 -2,20
114,21 1,31
115,00 0,51
117,20 1,91
2014 116,91 -0,25
119,211,97
121,64 1,04
123,58 1,68
2015 122,82 -0,70
125,47 2,16
126,51 0,83
128,65 2,41
Catatan: Angka yang tercetak miring menunjukkan pertumbuhan Sejak tahun 2010 dalam persen (2010=100)Note: Number in italic is stand for growth Since 2010 in percent (2010=100)
Sumber: - Berita Resmi Statistik, BPS - Laporan Bulanan Data Sosial Ekonomi, BPSSource: - Official Statistics News, BPS-Statistics Indonesia - Monthly Report on Socio-Economic Data, BPS-Statistics Indonesia
http
://w
ww
.bps
.go.
id
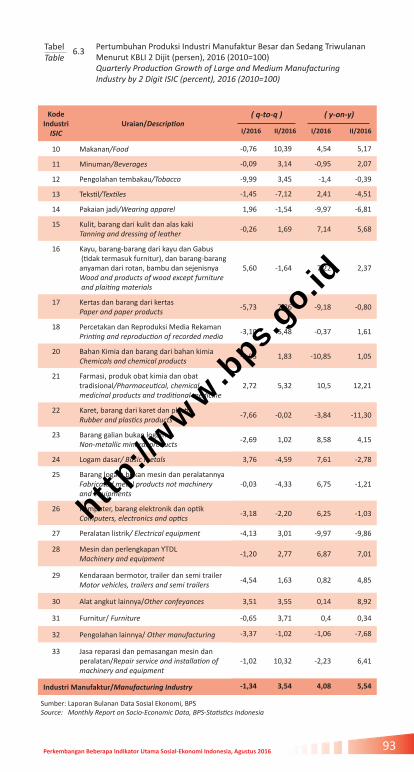
93Perkembangan Beberapa Indikator Utama Sosial-Ekonomi Indonesia, Agustus 2016
Sumber: Laporan Bulanan Data Sosial Ekonomi, BPS Source: Monthly Report on Socio-Economic Data, BPS-Statistics Indonesia
Pertumbuhan Produksi Industri Manufaktur Besar dan Sedang Triwulanan Menurut KBLI 2 Dijit (persen), 2016 (2010=100) Quarterly Production Growth of Large and Medium Manufacturing Industry by 2 Digit ISIC (percent), 2016 (2010=100)
TabelTable
6.3
Kode Industri
ISICUraian/Description
( q-to-q ) ( y-on-y)
I/2016 II/2016 I/2016 II/2016
10 Makanan/Food -0,76 10,39 4,54 5,17
11 Minuman/Beverages -0,09 3,14 -0,95 2,07
12 Pengolahan tembakau/Tobacco -9,99 3,45 -1,4 -0,39
13 Tekstil/Textiles -1,45 -7,12 2,41 -4,51
14 Pakaian jadi/Wearing apparel 1,96 -1,54 -9,97 -6,81
15 Kulit, barang dari kulit dan alas kakiTanning and dressing of leather
-0,26 1,69 7,14 5,68
16 Kayu, barang-barang dari kayu dan Gabus (tidak termasuk furnitur), dan barang-barang anyaman dari rotan, bambu dan sejenisnyaWood and products of wood except furniture and plaiting materials
5,60 -1,64 7,22 2,37
17 Kertas dan barang dari kertasPaper and paper products
-5,73 7,86 -9,18 -0,80
18 Percetakan dan Reproduksi Media RekamanPrinting and reproduction of recorded media
-3,10 5,48 -0,37 1,61
20 Bahan Kimia dan barang dari bahan kimiaChemicals and chemical products
-0,05 1,83 -10,85 1,05
21 Farmasi, produk obat kimia dan obat tradisional/Pharmaceutical, chemical medicinal products and traditional medicine
2,72 5,32 10,5 12,21
22 Karet, barang dari karet dan plastikRubber and plastics products
-7,66 -0,02 -3,84 -11,30
23 Barang galian bukan logamNon-metallic mineral products
-2,69 1,02 8,58 4,15
24 Logam dasar/ Basic metals 3,76 -4,59 7,61 -2,78
25 Barang logam bukan mesin dan peralatannyaFabricated metal products not machinery and equipments
-0,03 -4,33 6,75 -1,21
26 Komputer, barang elektronik dan optikComputers, electronics and optics
-3,18 -2,20 6,25 -1,03
27 Peralatan listrik/ Electrical equipment -4,13 3,01 -9,97 -9,86
28 Mesin dan perlengkapan YTDLMachinery and equipment
-1,20 2,77 6,87 7,01
29 Kendaraan bermotor, trailer dan semi trailerMotor vehicles, trailers and semi trailers
-4,54 1,63 0,82 4,85
30 Alat angkut lainnya/Other confeyances 3,51 3,55 0,14 8,92
31 Furnitur/ Furniture -0,65 3,71 0,4 0,34
32 Pengolahan lainnya/ Other manufacturing -3,37 -1,02 -1,06 -7,68
33 Jasa reparasi dan pemasangan mesin dan peralatan/Repair service and installation of machinery and equipment
-1,02 10,32 -2,23 6,41
Industri Manufaktur/Manufacturing Industry -1,34 3,54 4,08 5,54
http
://w
ww
.bps
.go.
id

Trends of Selected Socio-Economic Indicators of Indonesia, August 201694
Kode Industri
ISICUraian/Description 2014 2015
10 Industri Makanan/Manufacture of food products 10,50 7,37
11 Industri Minuman/Manufacture of beverages 2,94 -0,40
12 Industri Pengolahan Tembakau/Manufacture of tobacco 7,98 5,20
13 Industri Tekstill/Manufacture of textiles -5,46 -2,01
14 Industri Pakaian Jadi/Manufacture of wearing apparels 3,58 -10,86
15Industri Kulit, Barang dari Kulit dan Alas KakiManufacture of leather and related products and footwear 6,21 3,60
16
Industri Kayu, Barang dari Kayu dan Gabus (Tidak Termasuk Furnitur) dan Barang Anyaman dari Bambu, Rotan dan SejenisnyaManufacture of wood and of products of wood and cork, except furniture; manufacture of articles of straw and plait-ing materials, bamboo, rattan and the like
9,10 0,39
17Industri Kertas dan Barang dari KertasManufacture of paper and paper products
2,90 -3,54
18Industri Pencetakan dan Reproduksi Media RekamanPrinting and reproduction of recorded media
-0,78 4,60
20Industri Bahan Kimia dan Barang dari Bahan KimiaManufacture of chemicals and chemical products Basic metals
5,97 0,12
21Industri Farmasi, Produk Obat Kimia dan Obat TradisionalManufacture of pharmaceuticals, medicinal chemical and botanical products
9,92 12,53
22Industri Karet, Barang dari Karet dan PlastikManufacture of rubber and plastic products
0,66 4,61
23Industri Barang Galian Bukan LogamManufacture of other non-metallic mineral products
3,59 7,37
24 Industri Logam Dasar/Manufacture of basic metals 6,25 6,42
25Industri Barang Logam, Bukan Mesin dan PeralatannyaManufacture of fabricated metal products, excepts machin-ery and equipment
3,23 9,47
26Industri Komputer, Barang Elektronik dan OptikManufacture of computers, electronic and optical products
-3,91 3,03
27 Industri Peralatan Listrik/Manufacture of electrical 9,84 -0,67
28Industri Mesin dan Perlengkapan ytdlManufacture of machinery and equipment n.e.c
8,03 2,19
29Industri Kendaraan Bermotor, Trailer dan Semi TrailerManufacture of motor vehicles, trailers and semi-trailers
4,22 4,29
30Industri Alat Angkutan LainnyaManufacture of other transport equipment
-4,14 -6,42
31 Industri Furnitur/Manufacture of furniture 1,80 4,06
32 Industri Pengolahan Lainnya/Other manufacturing 5,37 5,86
33Jasa Reparasi dan Pemasangan Mesin dan Peralatan Repair and installation of machinery and equipment
-5,79 4,47
Pertumbuhan Produksi Industri Manufaktur Besar dan Sedang Tahunan Menurut KBLI 2 Dijit (persen), 2014-2015 Annually Production Growth of Large and Medium Manufacturing Industryby 2 Digit ISIC (percent), 2014-2015
TabelTable
6.4
Sumber: Laporan Bulanan Data Sosial Ekonomi, BPS Source: Monthly Report on Socio-Economic Data, BPS-Statistics Indonesia
http
://w
ww
.bps
.go.
id
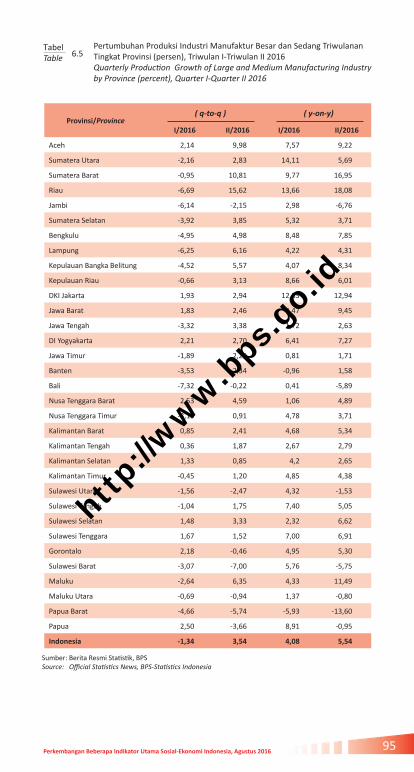
95Perkembangan Beberapa Indikator Utama Sosial-Ekonomi Indonesia, Agustus 2016
Sumber: Berita Resmi Statistik, BPS Source: Official Statistics News, BPS-Statistics Indonesia
Pertumbuhan Produksi Industri Manufaktur Besar dan Sedang Triwulanan Tingkat Provinsi (persen), Triwulan I-Triwulan II 2016 Quarterly Production Growth of Large and Medium Manufacturing Industryby Province (percent), Quarter I-Quarter II 2016
TabelTable 6.5
Provinsi/Province ( q-to-q ) ( y-on-y)
I/2016 II/2016 I/2016 II/2016
Aceh 2,14 9,98 7,57 9,22
Sumatera Utara -2,16 2,83 14,11 5,69
Sumatera Barat -0,95 10,81 9,77 16,95
Riau -6,69 15,62 13,66 18,08
Jambi -6,14 -2,15 2,98 -6,76
Sumatera Selatan -3,92 3,85 5,32 3,71
Bengkulu -4,95 4,98 8,48 7,85
Lampung -6,25 6,16 4,22 4,31
Kepulauan Bangka Belitung -4,52 5,57 4,07 8,34
Kepulauan Riau -0,66 3,13 8,66 6,01
DKI Jakarta 1,93 2,94 12,83 12,94
Jawa Barat 1,83 2,46 9,47 9,45
Jawa Tengah -3,32 3,38 1,72 2,63
DI Yogyakarta 2,21 2,70 6,41 7,27
Jawa Timur -1,89 2,29 0,81 1,71
Banten -3,53 -2,34 -0,96 1,58
Bali -7,32 -0,22 0,41 -5,89
Nusa Tenggara Barat 2,53 4,59 1,06 4,89
Nusa Tenggara Timur -3,13 0,91 4,78 3,71
Kalimantan Barat 0,85 2,41 4,68 5,34
Kalimantan Tengah 0,36 1,87 2,67 2,79
Kalimantan Selatan 1,33 0,85 4,2 2,65
Kalimantan Timur -0,45 1,20 4,85 4,38
Sulawesi Utara -1,56 -2,47 4,32 -1,53
Sulawesi Tengah -1,04 1,75 7,40 5,05
Sulawesi Selatan 1,48 3,33 2,32 6,62
Sulawesi Tenggara 1,67 1,52 7,00 6,91
Gorontalo 2,18 -0,46 4,95 5,30
Sulawesi Barat -3,07 -7,00 5,76 -5,75
Maluku -2,64 6,35 4,33 11,49
Maluku Utara -0,69 -0,94 1,37 -0,80
Papua Barat -4,66 -5,74 -5,93 -13,60
Papua 2,50 -3,66 8,91 -0,95
Indonesia -1,34 3,54 4,08 5,54
http
://w
ww
.bps
.go.
id

Trends of Selected Socio-Economic Indicators of Indonesia, August 201696
Indeks dan Pertumbuhan Produksi Industri Manufaktur Mikro dan kecilTriwulanan (2010=100), 2011-2015 Quarterly Production Indices and Growth of Micro and Small Manufacturing Industry (2010=100), 2011-2015
TabelTable
6.6
Tahun/YearTriwulan/Quarter
I II III IV
2011 101,26 1,26
102,76 1,48
105,032,21
109,80 4,54
2012 108,57 -1,12
104,93-3,35
110,48 5,29
111,88 1,27
2013 113,83 1,74
121,25 6,52
115,85 -4,45
117,68 1,58
2014 118,85 0,99
126,186,17
121,85 -3,43
124,76 2,39
2015 125,56 0,64
131,95 5,09
130,22 -1,31
131,98 1,35
Catatan: Angka yang tercetak miring menunjukkan pertumbuhan Sejak tahun 2010 dalam persen (2010=100)Note: Number in italic is stand for growth Since 2010 in percent (2010=100)
Sumber: - Berita Resmi Statistik, BPS - Laporan Bulanan Data Sosial Ekonomi, BPSSource: - Official Statistics News, BPS-Statistics Indonesia - Monthly Report on Socio-Economic Data, BPS-Statistics Indonesia
http
://w
ww
.bps
.go.
id

97Perkembangan Beberapa Indikator Utama Sosial-Ekonomi Indonesia, Agustus 2016
Kode Industri
ISICUraian/Description 2014 2015
10 Industri Makanan/Manufacture of food products 7,65 6,83
11 Industri Minuman/Manufacture of beverages 4,70 11,52
12 Industri Pengolahan Tembakau/Manufacture of tobacco -38,07 7,66
13 Industri Tekstill/Manufacture of textiles 4,40 7,62
14 Industri Pakaian Jadi/Manufacture of wearing apparels 4,00 6,68
15 Industri Kulit, Barang dari Kulit dan Alas KakiManufacture of leather and related products and footwear
3,47 3,91
16 Industri Kayu, Barang dari Kayu dan Gabus (Tidak Termasuk Furni-tur) dan Barang Anyaman dari Bambu, Rotan dan SejenisnyaManufacture of wood and of products of wood and cork, except furniture; manufacture of articles of straw and plaiting materials, bamboo, rattan and the like
-1,26 -3,73
17 Industri Kertas dan Barang dari KertasManufacture of paper and paper products
3,96 16,36
18 Industri Pencetakan dan Reproduksi Media RekamanPrinting and reproduction of recorded media
11,41 8,24
20 Industri Bahan Kimia dan Barang dari Bahan KimiaManufacture of chemicals and chemical products Basic metals
-1,55 14,31
21 Industri Farmasi, Produk Obat Kimia dan Obat TradisionalManufacture of pharmaceuticals, medicinal chemical and botani-cal products
-9,54 4,52
22 Industri Karet, Barang dari Karet dan PlastikManufacture of rubber and plastic products
-8,41 -3,72
23 Industri Barang Galian Bukan LogamManufacture of other non-metallic mineral products
-4,24 -1,55
24 Industri Logam Dasar/Manufacture of basic metals 2,51 -0,59
25 Industri Barang Logam, Bukan Mesin dan PeralatannyaManufacture of fabricated metal products, excepts machinery and equipment
0,18 -3,58
26 Industri Komputer, Barang Elektronik dan OptikManufacture of computers, electronic and optical products
-2,70 1,02
27 Industri Peralatan Listrik/Manufacture of electrical 17,15 10,14
28 Industri Mesin dan Perlengkapan ytdlManufacture of machinery and equipment n.e.c
-13,27 12,60
29 Industri Kendaraan Bermotor, Trailer dan Semi TrailerManufacture of motor vehicles, trailers and semi-trailers
5,06 1,69
30 Industri Alat Angkutan LainnyaManufacture of other transport equipment
-5,27 -2,76
31 Industri Furnitur/Manufacture of furniture 6,30 6,54
32 Industri Pengolahan Lainnya/Other manufacturing 6,80 2,52
33 Jasa Reparasi dan Pemasangan Mesin dan Peralatan Repair and installation of machinery and equipment
7,34 3,26
Pertumbuhan Produksi Industri Manufaktur Mikro dan Kecil Tahunan Menurut KBLI 2 Dijit (persen), 2014-2015 Annually Production Growth of Micro and Small Manufacturing Industryby 2 Digit ISIC (percent), 2014-2015
TabelTable
6.7
Sumber: Laporan Bulanan Data Sosial Ekonomi, BPS Source: Monthly Report on Socio-Economic Data, BPS-Statistics Indonesia
http
://w
ww
.bps
.go.
id

Trends of Selected Socio-Economic Indicators of Indonesia, August 201698
Kode Industri
ISICUraian/Description
(q-to-q)
I/2016 II/2016
10 Industri Makanan/Manufacture of food products 1,36 5,87
11 Industri Minuman/Manufacture of beverages 1,29 9,43
12 Industri Pengolahan Tembakau/Manufacture of tobacco -6,71 11,70
13 Industri Tekstill/Manufacture of textiles 1,56 11,80
14 Industri Pakaian Jadi/Manufacture of wearing apparels 2,06 10,20
15 Industri Kulit, Barang dari Kulit dan Alas KakiManufacture of leather and related products and footwear
-0,04 8,80
16 Industri Kayu, Barang dari Kayu dan Gabus (Tidak Termasuk Furnitur) dan Barang Anyaman dari Bambu, Rotan danSejenisnya/ Manufacture of wood and of products of wood and cork, except furniture; manufacture of articles of straw and plaiting materials, bamboo, rattan and the like
0,82 0,86
17 Industri Kertas dan Barang dari KertasManufacture of paper and paper products
13,95 5,15
18 Industri Pencetakan dan Reproduksi Media RekamanPrinting and reproduction of recorded media
11,94 1,95
20 Industri Bahan Kimia dan Barang dari Bahan KimiaManufacture of chemicals and chemical products Basic metals
0,33 3,74
21 Industri Farmasi, Produk Obat Kimia dan Obat TradisionalManufacture of pharmaceuticals, medicinal chemical and botanical products
9,60 -3,54
22 Industri Karet, Barang dari Karet dan PlastikManufacture of rubber and plastic products
1,07 -1,37
23 Industri Barang Galian Bukan LogamManufacture of other non-metallic mineral products
-0,40 2,11
24 Industri Logam Dasar/Manufacture of basic metals -2,45 4,90
25 Industri Barang Logam, Bukan Mesin dan PeralatannyaManufacture of fabricated metal products, excepts machinery and equipment
-7,70 1,04
26 Industri Komputer, Barang Elektronik dan OptikManufacture of computers, electronic and optical products
13,35 5,27
27 Industri Peralatan Listrik/Manufacture of electrical 5,06 10,20
28 Industri Mesin dan Perlengkapan ytdlManufacture of machinery and equipment n.e.c
12,37 -6,49
29 Industri Kendaraan Bermotor, Trailer dan Semi TrailerManufacture of motor vehicles, trailers and semi-trailers
9,89 4,45
30 Industri Alat Angkutan LainnyaManufacture of other transport equipment
5,39 1,34
31 Industri Furnitur/Manufacture of furniture 0,75 6,61
32 Industri Pengolahan Lainnya/Other manufacturing -0,57 2,50
33 Jasa Reparasi dan Pemasangan Mesin dan Peralatan Repair and installation of machinery and equipment
-7,75 9,38
Industri Manufaktur/Manufacturing Industry 0,76 5,74
Sumber: Laporan Bulanan Data Sosial Ekonomi, BPS Source: Monthly Report on Socio-Economic Data, BPS-Statistics Indonesia
Pertumbuhan Produksi Industri Manufaktur Mikro dan Kecil Triwulanan(q to q) Menurut KBLI 2 Dijit (persen), Triwulan I-Triwulan II 2016 Quarterly Production Growth of Micro and Small Manufacturing Industry (q to q) by 2 Digit ISIC (percent), Quarter I-Quarter II 2016
TabelTable
6.8
http
://w
ww
.bps
.go.
id
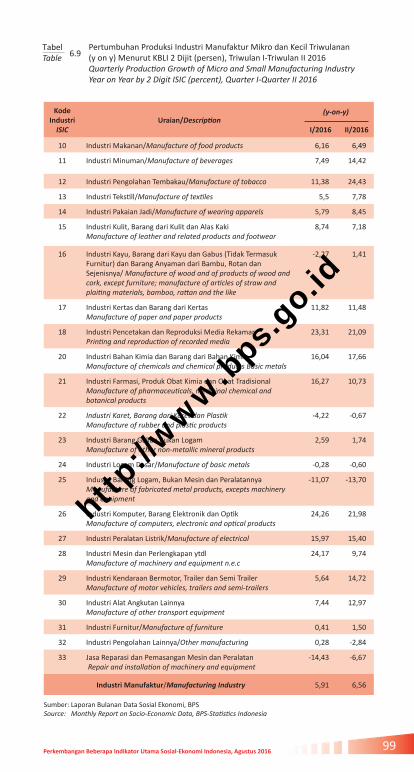
99Perkembangan Beberapa Indikator Utama Sosial-Ekonomi Indonesia, Agustus 2016
Pertumbuhan Produksi Industri Manufaktur Mikro dan Kecil Triwulanan(q to q) Menurut KBLI 2 Dijit (persen), Triwulan I-Triwulan II 2016 Quarterly Production Growth of Micro and Small Manufacturing Industry (q to q) by 2 Digit ISIC (percent), Quarter I-Quarter II 2016
Kode Industri
ISICUraian/Description
(y-on-y)
I/2016 II/2016
10 Industri Makanan/Manufacture of food products 6,16 6,49
11 Industri Minuman/Manufacture of beverages 7,49 14,42
12 Industri Pengolahan Tembakau/Manufacture of tobacco 11,38 24,43
13 Industri Tekstill/Manufacture of textiles 5,5 7,78
14 Industri Pakaian Jadi/Manufacture of wearing apparels 5,79 8,45
15 Industri Kulit, Barang dari Kulit dan Alas KakiManufacture of leather and related products and footwear
8,74 7,18
16 Industri Kayu, Barang dari Kayu dan Gabus (Tidak Termasuk Furnitur) dan Barang Anyaman dari Bambu, Rotan danSejenisnya/ Manufacture of wood and of products of wood and cork, except furniture; manufacture of articles of straw and plaiting materials, bamboo, rattan and the like
-2,27 1,41
17 Industri Kertas dan Barang dari KertasManufacture of paper and paper products
11,82 11,48
18 Industri Pencetakan dan Reproduksi Media RekamanPrinting and reproduction of recorded media
23,31 21,09
20 Industri Bahan Kimia dan Barang dari Bahan KimiaManufacture of chemicals and chemical products Basic metals
16,04 17,66
21 Industri Farmasi, Produk Obat Kimia dan Obat TradisionalManufacture of pharmaceuticals, medicinal chemical and botanical products
16,27 10,73
22 Industri Karet, Barang dari Karet dan PlastikManufacture of rubber and plastic products
-4,22 -0,67
23 Industri Barang Galian Bukan LogamManufacture of other non-metallic mineral products
2,59 1,74
24 Industri Logam Dasar/Manufacture of basic metals -0,28 -0,60
25 Industri Barang Logam, Bukan Mesin dan PeralatannyaManufacture of fabricated metal products, excepts machinery and equipment
-11,07 -13,70
26 Industri Komputer, Barang Elektronik dan OptikManufacture of computers, electronic and optical products
24,26 21,98
27 Industri Peralatan Listrik/Manufacture of electrical 15,97 15,40
28 Industri Mesin dan Perlengkapan ytdlManufacture of machinery and equipment n.e.c
24,17 9,74
29 Industri Kendaraan Bermotor, Trailer dan Semi TrailerManufacture of motor vehicles, trailers and semi-trailers
5,64 14,72
30 Industri Alat Angkutan LainnyaManufacture of other transport equipment
7,44 12,97
31 Industri Furnitur/Manufacture of furniture 0,41 1,50
32 Industri Pengolahan Lainnya/Other manufacturing 0,28 -2,84
33 Jasa Reparasi dan Pemasangan Mesin dan Peralatan Repair and installation of machinery and equipment
-14,43 -6,67
Industri Manufaktur/Manufacturing Industry 5,91 6,56
Pertumbuhan Produksi Industri Manufaktur Mikro dan Kecil Triwulanan(y on y) Menurut KBLI 2 Dijit (persen), Triwulan I-Triwulan II 2016 Quarterly Production Growth of Micro and Small Manufacturing IndustryYear on Year by 2 Digit ISIC (percent), Quarter I-Quarter II 2016
TabelTable 6.9
Sumber: Laporan Bulanan Data Sosial Ekonomi, BPS Source: Monthly Report on Socio-Economic Data, BPS-Statistics Indonesia
http
://w
ww
.bps
.go.
id
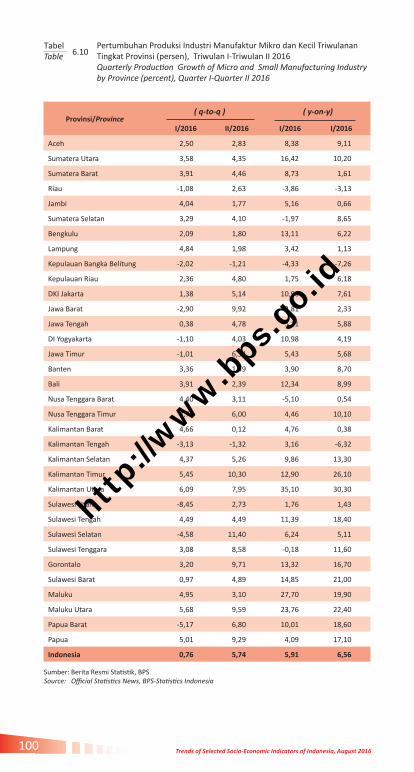
Trends of Selected Socio-Economic Indicators of Indonesia, August 2016100
Pertumbuhan Produksi Industri Manufaktur Mikro dan Kecil Triwulanan Tingkat Provinsi (persen), Triwulan I-Triwulan II 2016 Quarterly Production Growth of Micro and Small Manufacturing Industryby Province (percent), Quarter I-Quarter II 2016
TabelTable 6.10
Sumber: Berita Resmi Statistik, BPS Source: Official Statistics News, BPS-Statistics Indonesia
Provinsi/Province ( q-to-q ) ( y-on-y)
I/2016 II/2016 I/2016 I/2016
Aceh 2,50 2,83 8,38 9,11
Sumatera Utara 3,58 4,35 16,42 10,20
Sumatera Barat 3,91 4,46 8,73 1,61
Riau -1,08 2,63 -3,86 -3,13
Jambi 4,04 1,77 5,16 0,66
Sumatera Selatan 3,29 4,10 -1,97 8,65
Bengkulu 2,09 1,80 13,11 6,22
Lampung 4,84 1,98 3,42 1,13
Kepulauan Bangka Belitung -2,02 -1,21 -4,33 -7,26
Kepulauan Riau 2,36 4,80 1,75 6,18
DKI Jakarta 1,38 5,14 10,90 7,61
Jawa Barat -2,90 9,92 -2,81 2,33
Jawa Tengah 0,38 4,78 5,11 5,88
DI Yogyakarta -1,10 4,03 10,98 4,19
Jawa Timur -1,01 6,54 5,43 5,68
Banten 3,36 1,49 3,90 8,70
Bali 3,91 2,39 12,34 8,99
Nusa Tenggara Barat 4,40 3,11 -5,10 0,54
Nusa Tenggara Timur 4,75 6,00 4,46 10,10
Kalimantan Barat 4,66 0,12 4,76 0,38
Kalimantan Tengah -3,13 -1,32 3,16 -6,32
Kalimantan Selatan 4,37 5,26 9,86 13,30
Kalimantan Timur 5,45 10,30 12,90 26,10
Kalimantan Utara 6,09 7,95 35,10 30,30
Sulawesi Utara -8,45 2,73 1,76 1,43
Sulawesi Tengah 4,49 4,49 11,39 18,40
Sulawesi Selatan -4,58 11,40 6,24 5,11
Sulawesi Tenggara 3,08 8,58 -0,18 11,60
Gorontalo 3,20 9,71 13,32 16,70
Sulawesi Barat 0,97 4,89 14,85 21,00
Maluku 4,95 3,10 27,70 19,90
Maluku Utara 5,68 9,59 23,76 22,40
Papua Barat -5,17 6,80 10,01 18,60
Papua 5,01 9,29 4,09 17,10
Indonesia 0,76 5,74 5,91 6,56
http
://w
ww
.bps
.go.
id

101Perkembangan Beberapa Indikator Utama Sosial-Ekonomi Indonesia, Agustus 2016
Pertumbuhan Produksi Industri Manufaktur Mikro dan Kecil Triwulanan Tingkat Provinsi (persen), Triwulan I-Triwulan II 2016 Quarterly Production Growth of Micro and Small Manufacturing Industryby Province (percent), Quarter I-Quarter II 2016
Indeks Pekerja Tetap, Hari Orang, Balas Jasa, dan Upah serta Nilai Konstruksi yang Diselesaikan (2010=100), Triwulan I 2010-Triwulan I 2016 Indices of Permanent Workers, Mandays, Compesation and Wages andValue of Construction Completed (2010=100) in Construction Sector,Quarter I 2010- Quarter I 2016
TabelTable 6.11
Tahun dan TriwulanYear and Quarter
Pekerja Tetap
Permanent Workers
Hari OrangMandays
Balas Jasa & Upah
Compensation
Nilai KonstruksiValue of
Construction
2010 Rata-rata/Average 100.00 100.00 100.00 100.00
Triw I/Qrt I 97.91 94.08 91.58 91.50
Triw II/Qrt II 99.59 95.17 95.05 94.53
Triw III/Qrt III 100.67 101.12 102.39 102.41
Triw IV/Qrt IV 101.82 109.63 110.98 111.56
2011 Rata-rata/Average 103.01 117.17 117.59 118.28
Triw I/Qrt I 99.87 108.25 108.84 108.04
Triw II/Qrt II 101.66 113.91 114.27 114.30
Triw III/Qrt III 103.27 119.03 118.86 120.33
Triw IV/Qrt IV 107.24 127.48 128.38 130.44
2012 Rata-rata/Average 108.11 131.36 133.00 138.48
Triw I/Qrt I 105.30 123.96 125.01 128.59
Triw II/Qrt II 107.46 128.99 130.52 135.61
Triw III/Qrt III 108.93 133.60 135.19 141.44
Triw IV/Qrt IV 110.75 138.90 141.29 148.27
2013 Rata-rata/Average 112,21 146,83 148,64 155,21
Triw I/Qrt I 110,03 135,96 137,68 143,41
Triw II/Qrt II 111,25 143,94 145,60 151,62
Triw III/Qrt III 112,97 148,55 150,86 157,80
Triw IV/Qrt IV 114,58 158,87 160,44 168,04
2014 Rata-rata/Average 114,36 165,98 166,83 173,54
Triw I/Qrt I 113,82 156,61 155,89 163,74
Triw II/Qrt II 113,98 162,57 163,06 169,48
Triw III/Qrt III 114,40 168,41 170,05 176,21
Triw IV/Qrt IV 115,24 176,32 178,31 184,72
2015 Rata-rata/Average 114,83 177,69 184,36 190,10
Triw I/Qrt I 112,80 167,36 172,77 177,85
Triw II/Qrt II 114,13 173,45 179,78 185,15
Triw III/Qrt III 116,00 180,16 187,29 193,06
Triw IV/Qrt IV 116,38 189,77 197,62 204,36
2016 Rata-rata/Average
Triw I/Qrt I 115,79 187,52 192,98 199,20
Sumber: Indikator Konstruksi, BPS Source: Construction Indicator, BPS-Statistics Indonesia
http
://w
ww
.bps
.go.
id

http
://w
ww
.bps
.go.
id

PERDAGANGAN LUAR NEGERI
FOREIGN TRADE
7http://aceh.tribunnews.com/2015/01/09/peraturan-baru-kementerian-perdagangan-ini-perketat-ekspor-impor
http
://w
ww
.bps
.go.
id

http
://w
ww
.bps
.go.
id

105Perkembangan Beberapa Indikator Utama Sosial-Ekonomi Indonesia, Agustus 2016
Neraca Perdagangan Barang Migas dan Non-migas (juta US$), Januari 2014-Juli 2016Balance of Trade of Oil and Gas and Non-oil and Gas (million US$), January 2014-July 2016
TabelTable
7.1
Sumber: Berita Resmi Statistik, Indikator Ekonomi, BPS Source: Official Statistics News, Economic Indicators, BPS-Statistics Indonesia
Tahun, Bulan Year, Month
Ekspor/Exports Impor/Imports
MigasOil and Gas
Non-migas Non-oil and
Gas
MigasOil and Gas
Non-migas Non-oil and
Gas
2014 30 331,9 145 960,8 43 460,0 134 719,8
Januari/January 2 501,7 11 970,6 3 550,6 11 365,6
Februari/February 2 729,2 11 904,9 3 457,2 10 333,5
Maret/March 2 641,3 12 551,3 3 994,6 10 529,1
April/April 2 651,4 11 641,1 3 692,8 12 562,2
Mei/May 2 375,7 12 447,9 3 706,6 11 064,7
Juni/June 2 786,0 12 623,5 3 394,2 12 303,6
Juli/July 2 496,3 11 627,8 4 173,0 9 908,7
Agustus/August 2 598,2 11 883,5 3 399,3 11 393,9
September/September 2 622,6 12 653,2 3 651,6 11 894,5
Oktober/October 2 469,4 12 879,6 3 577,6 11 750,4
November/November 2 106,9 11 509,3 3 473,0 10 568,6
Desember/December 2 353,3 12 268,0 3 389,5 11 045,0
2015 18 807,8 131 530,1 24 613,2 118 049,0
Januari/January 2 076,8 11 224,1 2 115,4 10 476,1
Februari/February 1 893,6 10 395,5 1 719,5 9 831,3
Maret/March 1 988,9 11 645,4 2 268,0 10 340,7
April/April 1 458,2 11 645,5 2 336,3 10 290,0
Mei/May 1 370,3 11 319,9 2 080,5 9 533,1
Juni/June 1 439,9 12 066,2 2 577,6 10 400,6
Juli/July 1 421,8 9 986,7 2 294,3 7 782,2
Agustus/August 1 530,9 11 195,9 2 108,0 10 291,2
September/September 1 451,3 11 077,6 1 912,2 9 599,5
Oktober/October 1 379,6 10 742,5 1 763,0 9 345,9
November/November 1 497,0 9 614,2 1 640,4 9 879,1
Desember/December 1 299,5 10 616,6 1 798,0 10 279,3
2016
Januari/January 1 108,0 9 372,6 1 220,9 9 228,7
Februari/February 1 113,3 10 198,7 1 122,9 9 052,7
Maret/March 1 239,3 10 570,7 1 552,4 9 749,3
April/April 891,7 10 584,1 1 362,1 9 451,5
Mei/May 957,9 10 556,4 1 668,5 9 472,2
Juni/June 1 187,3 11 787,1 1 772,2 10 323,0
Juli/July 998,6 8 515,7 1 473,7 7 442,3
http
://w
ww
.bps
.go.
id

Trends of Selected Socio-Economic Indicators of Indonesia, August 2016106
Nilai Ekspor Menurut Negara Tujuan Utama (Nilai FOB: juta US$), 2013-2016Value of Exports by Major Country of Destination (FOB value: million US$), 2013-2016
TabelTable
7.2
Sumber/Source: Statistik Indonesia, BPS/Statistical Yearbook of Indonesia, BPS-Statistics IndonesiaCatatan/Note : r) Angka diperbaiki/Revised figures 1) Ekspor Januari-April/Export January-April
Negara TujuanCountry of Destination
2013 2014 r) 2015 r) 2016 1)
ASIA 124 272,1 103 547,4 52 579,6
ASEAN 40 630,0 39 668,1 33 577,0 17 973,8
Thailand/Muangthai 6 061,9 5 783,1 5 507,3 2 947,2
Singapura/Singapore 16 686,3 16 728,3 12 632,6 6 366,8
Filipina/Philippines 3 817,0 3 887,8 3 921,7 2 724,9
Malaysia/Malaysia 10 666,6 9 730,0 7 630,9 3 848,5
Myanmar/Myanmar 556,4 566,9 615,7 321,3
Kamboja/Cambodia 312,4 415,8 429,7 240,0
Brunei Darussalam/Brunei Darussalam 122,7 100,3 91,2 57,3
Laos/Lao People’s D. Rep 5,8 4,5 7,7 3,4
Vietnam/Vietnam 2 400,9 2 451,3 2 740,2 1 464,4
Asia lainnya/Rest of Asia 92 296,2 84 604,0 69 970,5 34 605,8
Jepang/Japan 27 086,3 23 117,5 18 020,9 8 971,6
Hongkong/Hongkong 2 693,3 2 777,6 2 067,2 1 186,6
Korea Selatan/Korea, Republic of 11 422,5 10 601,1 7 664,4 3 905,4
Taiwan/Taiwan 5 862,4 6 425,1 5 043,5 2 102,9
Cina/China 22 601,5 17 605,9 15 046,4 8 085,3
Lainnya/Others 22 630,6 24 076,8 22 128,1 10 354,0
AFRIKA/AFRICA 5.614,0 6 262,3 4 759,4 2 335,0
AUSTRALIA & OCEANIA 5 738,4 4 433,5 2 265,6
Australia/Australia 4 370,5 4 948,4 3 702,3 1 914,4
Selandia Baru/New Zealand 469,5 481,4 436,3 187,8
Oceania lainnya/Rest of Oceania 367,5 308,6 295,0 163,5
AMERIKA/AMERICA 21 035,7 20 237,4 11 310,8
NAFTA 17 161,3 18 136,0 17 787,1 10 005,5
Amerika Serikat/United States of America 15 691,7 16 530,1 16 240,8 9 122,8
Kanada/Canada 782,3 755,0 722,3 413,9
Meksiko/Mexico 687,3 850,9 824,0 468,8
Amerika lainnya/Rest of America 3 018,5 2 899,7 2 450,3 1 305,3
EROPA/EUROPE 18 671,5 17 388,5 10 590,5
Uni Eropa/European Union 16 763,7 16 918,9 14 842,5 8 008,8
Inggris/United Kingdom 1 634,8 1 658,6 1 527,1 874,5
Belanda/Netherlands 4 106,0 3 984,6 3 442,2 1 717,6
Perancis/France 1 062,7 1 019,3 973,0 495,5
Jerman/Germany 2 883,4 2 821,6 2 664,2 1 475,5
Belgia/Belgium 1 259,3 1 217,3 1 113,3 658,1
Denmark/Denmark 224,5 226,6 207,0 107,6
Swedia/Sweden 162,4 177,1 146,8 83,8
Finlandia/Finland 149,1 111,4 84,9 47,0
Italia/Italy 2 128,6 2 286,9 1 872,9 911,7
Spanyol/Spain 1 810,4 1 937,6 1 481,3 847,8
Yunani/Greece 149,2 157,3 143,9 80,9
Polandia/Poland 365,4 395,9 358,9 202,5
Uni Eropa Lainnya/Other U,E 827,9 924,5 827,1 506,3
Eropa Lainnya/Rest of Europe 1 858,7 1 752,7 2 546,0 2 581,8
Jumlah/Total 182 551,8 175 980,0 150 366,3 79 081,6
Sumber: Statistik Indonesia, BPSSource : Statistical Yearbook of Indonesia, BPS-Statistics IndonesiaCatatan: r) Angka diperbaiki 1) Ekspor Januari-JuliNote : r) Revised figures 1)Export January-July
http
://w
ww
.bps
.go.
id

107Perkembangan Beberapa Indikator Utama Sosial-Ekonomi Indonesia, Agustus 2016
TabelTable
7.3 Nilai Impor Menurut Negara Asal Utama (Nilai CIF: juta US$), 2013-2016 Value of Imports by Major Country of Origin (CIF value: million US$), 2013-2016
Negara AsalCountry of Origin
2013 2014 2015 2016 1)
ASIA
ASEAN 53 851,4 50 726,0 38 794,9 19 320,7
Thailand/Muangthai 10 703,1 9 781,0 8 083,4 5 132,3
Singapura/Singapore 25 581,8 25 185,7 18 022,5 7 773,1
Filipina/Philippines 777,4 699,7 683,1 475,4
Malaysia/Malaysia 13 322,5 10 855,4 8 530,7 3 979,2
Myanmar/Myanmar 73,2 122,1 160,4 60,3
Kamboja/Cambodia 17,8 18,7 21,1 14,6
Brunei Darussalam/Brunei Darussalam 645,4 594,3 131,4 60,1
Laos/Lao People’s D. Rep. 7,6 51,3 0,8 3,0
Vietnam/Vietnam 2 722,6 3 417,8 3 161,5 1 822,7
Asia lainnya/Rest of Asia 53 851,4 82 530,1 66 228,2 35 570,6
Jepang/Japan 19 284,3 17 007,6 13 263,5 7 225,0
Cina/China 29 849,5 30 624,3 29 410,9 16 800,6
Korea Selatan/Korea, Republic of 11 592,6 11 847,4 8 427,2 3 829,5
Lainnya/Others 24 471,9 23 050,8 15 126,6 7 715,5
AFRIKA/AFRICA 5 549,6 5 465,6 3 739,2 2 031,1
AUSTRALIA & OCEANIA
Australia/Australia 5 038,2 5 647,5 4 815,8 2 824,5
Selandia Baru/New Zealand 806,0 836,0 637,0 385,2
Oceania lainnya/Rest of Oceania 23,4 38,5 27,4 22,4
AMERIKA/AMERICA
NAFTA 11 648,9 10 217,8 9 400,0 4 777,9
Amerika Serikat/United States of America 9 065,7 8 170,1 7 593,2 3 895,7
Kanada/Canada 2 067,4 1 860,2 1 609,2 778,9
Meksiko/Mexico 515,8 187,5 197,6 103,3
Amerika lainnya/Rest of America 4 768,4 4 562,3 4 136,7 2 254,6
EROPA/EUROPE
Uni Eropa/European Union 13 708,1 12 691,4 11 300,6 6 062,6
Inggris/United Kingdom 1 081,9 894,8 818,9 455,4
Belanda/Netherlands 1 033,8 908,3 785,2 423,8
Perancis/France 1 590,7 1 332,5 1 336,9 819,4
Jerman/Germany 4 426,3 4 091,2 3 471,7 1 678,8
Austria/Austria 383,6 343,0 316,2 210,7
Belgia/Belgium 642,5 585,5 559,4 281,0
Denmark/Denmark 199,3 168,0 201,3 92,1
Swedia/Sweden 825,6 691,1 691,2 304,7
Finlandia/Finland 442,5 668,4 534,1 223,5
Irlandia/Ireland 115,8 100,9 103,3 60,9
Italia/Italy 1 695,6 1 722,9 1 368,2 790,6
Spanyol/Spain 545,2 517,1 472,5 287,0
Uni Eropa lainnyaOthers of European Union
725,3 667,9 641,7 434,7
Eropa lainnya/Rest of Europe 6 036,4 5 463,4 3 615,0 1 684,4
Jumlah/Total 186 628,7 178 178,8 142 694,8 74 934,0
Sumber: Statistik Indonesia, BPS Source: Statistical Yearbook of Indonesia, BPS-Statistics IndonesiaCatatan: 1) Ekspor Januari-JuliNote : 1) Export January-July
http
://w
ww
.bps
.go.
id
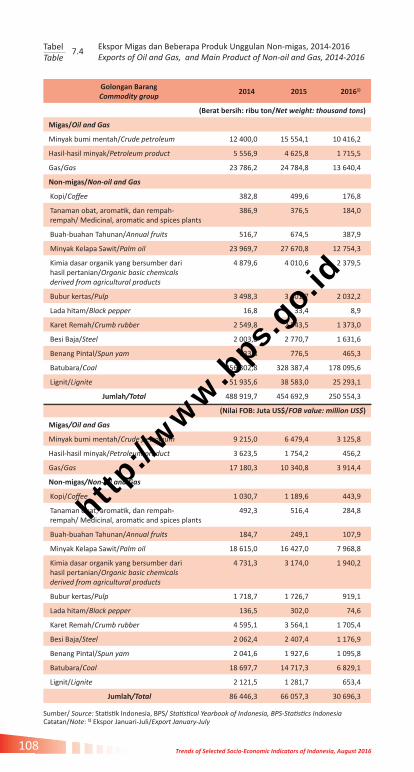
Trends of Selected Socio-Economic Indicators of Indonesia, August 2016108
Golongan BarangCommodity group
2014 2015 20161)
(Berat bersih: ribu ton/Net weight: thousand tons)
Migas/Oil and Gas
Minyak bumi mentah/Crude petroleum 12 400,0 15 554,1 10 416,2
Hasil-hasil minyak/Petroleum product 5 556,9 4 625,8 1 715,5
Gas/Gas 23 786,2 24 784,8 13 640,4
Non-migas/Non-oil and Gas
Kopi/Coffee 382,8 499,6 176,8
Tanaman obat, aromatik, dan rempah-rempah/ Medicinal, aromatic and spices plants
386,9 376,5 184,0
Buah-buahan Tahunan/Annual fruits 516,7 674,5 387,9
Minyak Kelapa Sawit/Palm oil 23 969,7 27 670,8 12 754,3
Kimia dasar organik yang bersumber darihasil pertanian/Organic basic chemicalsderived from agricultural products
4 879,6 4 010,6 2 379,5
Bubur kertas/Pulp 3 498,3 3 401,7 2 032,2
Lada hitam/Black pepper 16,8 33,4 8,9
Karet Remah/Crumb rubber 2 549,8 2 543,5 1 373,0
Besi Baja/Steel 2 003,8 2 770,7 1 631,6
Benang Pintal/Spun yam 733,8 776,5 465,3
Batubara/Coal 356 302,8 328 387,4 178 095,6
Lignit/Lignite 51 935,6 38 583,0 25 293,1
Jumlah/Total 488 919,7 454 692,9 250 554,3
(Nilai FOB: Juta US$/FOB value: million US$)
Migas/Oil and Gas
Minyak bumi mentah/Crude petroleum 9 215,0 6 479,4 3 125,8
Hasil-hasil minyak/Petroleum product 3 623,5 1 754,2 456,2
Gas/Gas 17 180,3 10 340,8 3 914,4
Non-migas/Non-oil and Gas
Kopi/Coffee 1 030,7 1 189,6 443,9
Tanaman obat, aromatik, dan rempah-rempah/ Medicinal, aromatic and spices plants
492,3 516,4 284,8
Buah-buahan Tahunan/Annual fruits 184,7 249,1 107,9
Minyak Kelapa Sawit/Palm oil 18 615,0 16 427,0 7 968,8
Kimia dasar organik yang bersumber darihasil pertanian/Organic basic chemicalsderived from agricultural products
4 731,3 3 174,0 1 940,2
Bubur kertas/Pulp 1 718,7 1 726,7 919,1
Lada hitam/Black pepper 136,5 302,0 74,6
Karet Remah/Crumb rubber 4 595,1 3 564,1 1 705,4
Besi Baja/Steel 2 062,4 2 407,4 1 176,9
Benang Pintal/Spun yam 2 041,6 1 927,6 1 095,8
Batubara/Coal 18 697,7 14 717,3 6 829,1
Lignit/Lignite 2 121,5 1 281,7 653,4
Jumlah/Total 86 446,3 66 057,3 30 696,3
Ekspor Migas dan Beberapa Produk Unggulan Non-migas, 2014-2016Exports of Oil and Gas, and Main Product of Non-oil and Gas, 2014-2016
TabelTable
7.4
Sumber/ Source: Statistik Indonesia, BPS/ Statistical Yearbook of Indonesia, BPS-Statistics IndonesiaCatatan/Note: 1) Ekspor Januari-Juli/Export January-July
http
://w
ww
.bps
.go.
id

109Perkembangan Beberapa Indikator Utama Sosial-Ekonomi Indonesia, Agustus 2016
Golongan BarangCommodity Group
2013 2014 2015 2016
(Berat bersih: ribu ton/Net weight: thousand tons)
Barang Modal/Capital Goods
Barang modal kecuali alat angkutan/Capital goods excluding transport equipment
3.428,2 2.479,0 2.411,1 1.320,9
Mobil penumpang/Passenger cars 108,3 72,8 57,2 35,1
Alat angkut untuk industri/Transport equip-ment for industry
887,3 755,5 556,3 400,0
Komoditi/Commodity
Beras/Rice 472,7 844,2 861,6 1 090,1
Pupuk/Fertilizers 4.986,5 6.654,0 7.365,1 3 967,5
Semen/Cement 3.725,0 4.056,4 3357,3 769,8
Minyak bumi dan hasil-hasinya/Crude petroleum and petroleum products
49.053,7 48.869,4 48.309,1 27 400,4
Pipa besi dan baja/Iron and steel tubes 1.228,9 887,3 742,0 327,4
Kendaraan bermotor/Motor vehicles 337,3 241,9 203,8 107,7
Mesin keperluan industri khusus/Machinery for special industry
1.197,5 1.114,1 1.041,8 580,3
(Nilai CIF: Juta US$/CIF value: million US$)
Barang Modal/Capital Goods
Barang modal kecuali alat angkutan/Capital goods excluding transport equipment
26 128,2 25 661,8 22 326,7 10 849,7
Mobil penumpang/Passenger cars 1 192,4 783,8 583,1 362,2
Alat angkut untuk industri/Transport equip-ment for industry
783,8 2 857,4 1 827,5 920,7
Komoditi/Commodity
Beras/Rice 246,0 382,8 351,6 447,7
Pupuk/Fertilizers 1 747,6 1 822,2 2.011,7 955,3
Semen/Cement 255,1 249,7 191,8 33,6
Minyak bumi dan hasil-hasilnya/Crude petroleum and petroleum products
45 266,4 43 459,9 24.613,2 10 173,3
Pipa besi dan baja/Iron and steel tubes 2 302,6 1 789,9 1 318,9 557,7
Kenderaan bermotor/Motor vehicles 3 361,8 2 328,9 1 859,5 974,8
Mesin keperluan industri khusus/Machinery for special industry
12 954,7 12 292,1 10.281, 5 438,4
Jumlah/Total 94 238,6 91 628,5 65 365,5 30 713,4
Impor Barang Modal dan Beberapa Komoditi, 2013-2016 Imports of Capitals Goods and Commodities, 2013-2016
TabelTable
7.5
Sumber: Statistik Indonesia, BPS Source: Statistical Yearbook of Indonesia, BPS-Statistics IndonesiaCatatan: 1) Ekspor Januari-JuliNote: 1)Export January-July
http
://w
ww
.bps
.go.
id
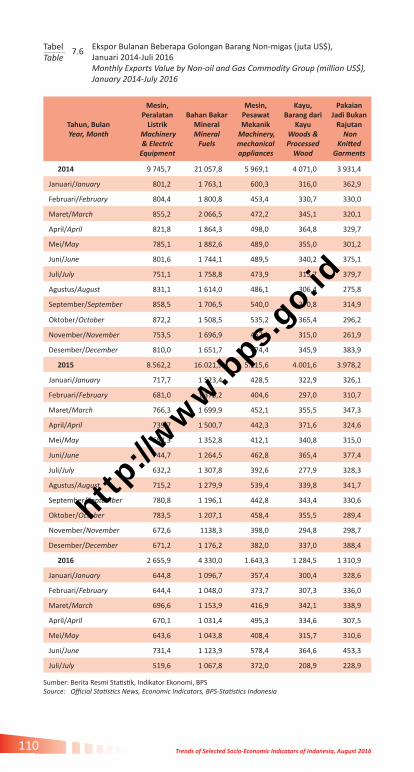
Trends of Selected Socio-Economic Indicators of Indonesia, August 2016110
Ekspor Bulanan Beberapa Golongan Barang Non-migas (juta US$), Januari 2014-Juli 2016Monthly Exports Value by Non-oil and Gas Commodity Group (million US$), January 2014-July 2016
TabelTable
7.6
Tahun, Bulan Year, Month
Mesin, Peralatan
Listrik Machinery & Electric
Equipment
Bahan Bakar MineralMineral
Fuels
Mesin, Pesawat Mekanik
Machinery, mechanical appliances
Kayu, Barang dari
KayuWoods & Processed
Wood
Pakaian Jadi Bukan
Rajutan Non
Knitted Garments
2014 9 745,7 21 057,8 5 969,1 4 071,0 3 931,4
Januari/January 801,2 1 763,1 600,3 316,0 362,9
Februari/February 804,4 1 800,8 453,4 330,7 330,0
Maret/March 855,2 2 066,5 472,2 345,1 320,1
April/April 821,8 1 864,3 498,0 364,8 329,7
Mei/May 785,1 1 882,6 489,0 355,0 301,2
Juni/June 801,6 1 744,1 489,5 340,2 375,1
Juli/July 751,1 1 758,8 473,9 315,7 379,7
Agustus/August 831,1 1 614,0 486,1 306,4 275,8
September/September 858,5 1 706,5 540,0 370,8 314,9
Oktober/October 872,2 1 508,5 535,2 365,4 296,2
November/November 753,5 1 696,9 457,1 315,0 261,9
Desember/December 810,0 1 651,7 474,4 345,9 383,9
2015 8.562,2 16.021,9 5.215,6 4.001,6 3.978,2
Januari/January 717,7 1 523,4 428,5 322,9 326,1
Februari/February 681,0 1 375,2 404,6 297,0 310,7
Maret/March 766,3 1 699,9 452,1 355,5 347,3
April/April 739,7 1 500,7 442,3 371,6 324,6
Mei/May 657,3 1 352,8 412,1 340,8 315,0
Juni/June 744,7 1 264,5 462,8 365,4 377,4
Juli/July 632,2 1 307,8 392,6 277,9 328,3
Agustus/August 715,2 1 279,9 539,4 339,8 341,7
September/September 780,8 1 196,1 442,8 343,4 330,6
Oktober/October 783,5 1 207,1 458,4 355,5 289,4
November/November 672,6 1138,3 398,0 294,8 298,7
Desember/December 671,2 1 176,2 382,0 337,0 388,4
2016 2 655,9 4 330,0 1.643,3 1 284,5 1 310,9
Januari/January 644,8 1 096,7 357,4 300,4 328,6
Februari/February 644,4 1 048,0 373,7 307,3 336,0
Maret/March 696,6 1 153,9 416,9 342,1 338,9
April/April 670,1 1 031,4 495,3 334,6 307,5
Mei/May 643,6 1 043,8 408,4 315,7 310,6
Juni/June 731,4 1 123,9 578,4 364,6 453,3
Juli/July 519,6 1 067,8 372,0 208,9 228,9
Sumber: Berita Resmi Statistik, Indikator Ekonomi, BPS Source: Official Statistics News, Economic Indicators, BPS-Statistics Indonesia
http
://w
ww
.bps
.go.
id
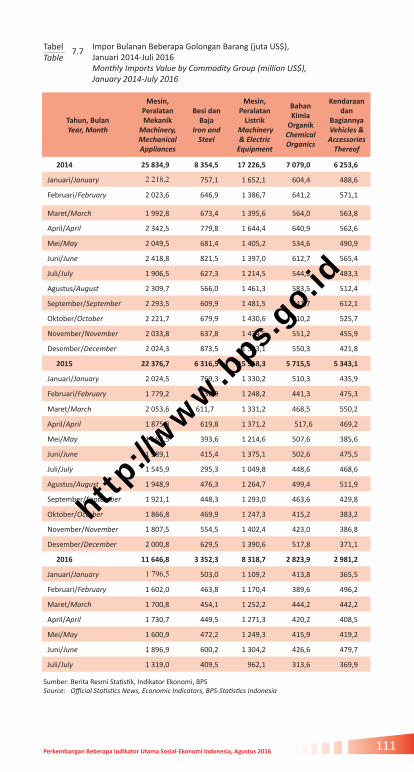
111Perkembangan Beberapa Indikator Utama Sosial-Ekonomi Indonesia, Agustus 2016
Impor Bulanan Beberapa Golongan Barang (juta US$), Januari 2014-Juli 2016Monthly Imports Value by Commodity Group (million US$), January 2014-July 2016
TabelTable
7.7
Tahun, Bulan Year, Month
Mesin, PeralatanMekanik
Machinery, Mechanical Appliances
Besi dan Baja
Iron and Steel
Mesin, Peralatan
Listrik Machinery & Electric
Equipment
Bahan Kimia
Organik Chemical Organics
Kendaraan dan
BagiannyaVehicles & Accessories
Thereof
2014 25 834,9 8 354,5 17 226,5 7 079,0 6 253,6
Januari/January 2 218,2 757,1 1 652,1 604,4 488,6
Februari/February 2 023,6 646,9 1 386,7 641,2 571,1
Maret/March 1 992,8 673,4 1 395,6 564,0 563,8
April/April 2 342,5 779,8 1 644,4 640,9 562,6
Mei/May 2 049,5 681,4 1 405,2 534,6 490,9
Juni/June 2 418,8 821,5 1 397,0 612,7 565,4
Juli/July 1 906,5 627,3 1 214,5 544,3 483,3
Agustus/August 2 309,7 566,0 1 461,3 583,5 512,4
September/September 2 293,5 609,9 1 481,5 641,7 612,1
Oktober/October 2 221,7 679,9 1 430,6 610,2 525,7
November/November 2 033,8 637,8 1 434,5 551,2 455,9
Desember/December 2 024,3 873,5 1 323,1 550,3 421,8
2015 22 376,7 6 316,5 15 518,3 5 715,5 5 343,1
Januari/January 2 024,5 769,3 1 330,2 510,3 435,9
Februari/February 1 779,2 632,9 1 248,2 441,3 475,3
Maret/March 2 053,6 611,7 1 331,2 468,5 550,2
April/April 1 875,8 619,8 1 371,2 517,6 469,2
Mei/May 1 563,5 393,6 1 214,6 507,6 385,6
Juni/June 1 989,1 415,4 1 375,1 502,6 475,5
Juli/July 1 545,9 295,3 1 049,8 448,6 468,6
Agustus/August 1 948,9 476,3 1 264,7 499,4 511,9
September/September 1 921,1 448,3 1 293,0 463,6 429,8
Oktober/October 1 866,8 469,9 1 247,3 415,2 383,2
November/November 1 807,5 554,5 1 402,4 423,0 386,8
Desember/December 2 000,8 629,5 1 390,6 517,8 371,1
2016 11 646,8 3 352,3 8 318,7 2 823,9 2 981,2
Januari/January 1 796,5 503,0 1 109,2 413,8 365,5
Februari/February 1 602,0 463,8 1 170,4 389,6 496,2
Maret/March 1 700,8 454,1 1 252,2 444,2 442,2
April/April 1 730,7 449,5 1 271,3 420,2 408,5
Mei/May 1 600,9 472,2 1 249,3 415,9 419,2
Juni/June 1 896,9 600,2 1 304,2 426,6 479,7
Juli/July 1 319,0 409,5 962,1 313,6 369,9
Sumber: Berita Resmi Statistik, Indikator Ekonomi, BPS Source: Official Statistics News, Economic Indicators, BPS-Statistics Indonesia
http
://w
ww
.bps
.go.
id

Trends of Selected Socio-Economic Indicators of Indonesia, August 2016112
Periode/Period
Ekspor/Exports Impor/Imports
Berat Bersih (ton)/Net
Weight (tons)
Nilai FOB (ribu US$)/FOB Value (thousand US$)
Berat Bersih (ton)/Net
Weight (tons)
Nilai CIF (ribu US$)/CIF Value
(thousand US$)
2011 378,9 836,7 2 750 476,2 1 513 163,5
Triwulan I/Quarter I 65,6 104,2 1 194 657,2 622 728,3
Triwulan II/Quarter II 105,0 151,4 315 690,4 170 527,9
Triwulan III/Quarter III 34,7 108,0 360 325,6 204 170,7
Triwulan IV/Quarter IV 172,6 473,1 879 803,0 515 736,6
2012 897,2 1.186,7 1 810 372,3 945 623,2
Triwulan I/Quarter I 63,7 128,6 770 294,7 420 651,4
Triwulan I/Quarter II 487,3 510,8 171 727,0 111 287,0
Triwulan III/Quarter III 176,7 283,9 122 839,6 64 461,4
Triwulan IV/Quarter IV 169,5 263,4 745 511,0 349 223,4
2013 2 585,7 1 191,4 472 664,6 246 002,1
Triwulan I/Quarter I 174,7 244,3 114 269,0 62.697,1
Triwulan II/Quarter II 560,7 425,1 129 548,2 64 587,9
Triwulan III/Quarter III 131,6 203,2 109 668,2 56 043,2
Triwulan IV/Quarter IV 1 718,4 318,8 119 179,2 62 673,9
2014 516,2 760,0 844 163,8 388 178,5
Triwulan I/Quarter I 85,6 169,3 60 796,9 26 870,3
Triwulan II/Quarter II 161,5 264,7 115 480,6 49 336,5
Triwulan III/Quarter III 82,7 123,7 164 561,7 72 532,3
Triwulan IV/Quarter IV 186,4 202,3 503 324,6 239 439,4
2015
Triwulan I/Quarter I 40,0 51,9 66.562,9 29.213,2
Triwulan II/Quarter II 160,8 206,3 127.932,6 55.730,7
Triwulan III/Quarter III 152,8 195,9 35.053,1 14.362,5
Triwulan IV/Quarter IV 165,9 176,2 631.989,9 251.719,7
2016
Triwulan I/Quarter I 627,7 261,7 981.992,7 401.346,7
Triwulan II/Quarter II 257,4 438,5 91.720,8 40.013,0
Ekspor-Impor Beras Triwulan I/2011-Triwulan II/2016Export-Import Rice Quarter I/2011-Quarter II/2016
TabelTable
7.8
Sumber: - Laporan Bulanan Data Sosial Ekonomi, BPS Source: - Monthly Report on Socio-Economic Data, BPS-Statistics Indonesia
http
://w
ww
.bps
.go.
id

113Perkembangan Beberapa Indikator Utama Sosial-Ekonomi Indonesia, Agustus 2016
Ringkasan Ekspor Nonmigas Bulanan Indonesia (juta US$), Januari 2014-Juli 2016Summary of Indonesian Monthly Non 0il and Gas Exports (million US$), January 2014-July 2016
TabelTable
7.9
Sumber: Indikator Ekonomi, BPS Source: Economic Indicators, BPS-Statistics Indonesia
Tahun, Bulan Year, Month
Hasil Sektor PertanianProducts
of The Agricultural
Sector
Hasil Sektor Industri Products
of The Industrial
Sector
Hasil Sektor Tambang
Products of The Mining
Sector
Hasil Sektor
LainProducts of Other Sector
JumlahTotal
2014 3 373,3 119 753,8 22 827,7 6,5 145 961,2
Januari/January 221,3 9 703,5 2 045,3 0,6 11 970,6
Februari/February 238,5 9 876,1 1 789,7 0,6 11 904,9
Maret/March 244,1 10 261,0 2 045,5 0,7 12 551,3
April/April 253,6 9 529,9 1 857,1 0,6 11 641,1
Mei/May 291,7 10 274,8 1 880,6 0,8 12 447,9
Juni/June 282,6 10 600,8 1 739,2 0,8 12 623,5
Juli/July 284,6 9 593,9 1 749,1 0,2 11 627,8
Agustus/August 303,3 9 666,8 1 913,2 0,2 11 883,5
September/September 324,6 10 141,0 2 187,1 0,6 12 653,2
Oktober/October 313,9 10 814,0 1 751,1 0,6 12 879,6
November/November 306,0 9 295,0 1 908,0 0,2 11 509,3
Desember/December 309,1 9 996,9 1 961,9 0,5 12 268,4
2015 3 726,5 108 603,5 19 456,0 5,9 131 791,9
Januari/January 287,0 9 273,1 1 725,3 0,5 11 285,9
Februari/February 261,2 8 607,8 1 549,9 0,5 10 419,4
Maret/March 294,5 9 434,6 1 915,5 0,5 11 645,2
April/April 289,7 9 757,8 1 598,4 0,5 11 646,4
Mei/May 264,6 9 203,7 1 893,0 0,6 11 361,9
Juni/June 313,5 10 120,5 1 639,8 0,5 12 074,2
Juli/July 299,3 8 057,4 1 686,6 0,6 10 043,9
Agustus/August 416,4 9 090,2 1 688,1 0,6 11 195,2
September/September 375,0 9 187,1 1 572,3 0,3 11 134,8
Oktober/October 342,9 9 129,4 1 269,3 0,5 10 742,2
November/November 293,6 8 073,8 1 257,2 0,6 9 625,1
Desember/December*) 288,8 8 668,0 1 660,5 0,3 10 617,6
2016 908,8 34 697,1 5 118,7 1,5 40 726,1
Januari/January 250,8 7 815,0 1 306,3 0,4 9 372,6
Februari/February 216,4 8 704,8 1 277,2 0,3 10 198,7
Maret/March 228,8 8 971,7 1 369,9 0,3 10 570,7
April/April 212,8 9 205,5 1 165,4 0,4 10 584,1
Mei/May 221,7 9 104,2 1 230,0 0,5 10 556,4
Juni/June 270,8 9 973,6 1 542,3 0,4 11 787,1
Juli/July 179,9 7 086,7 1 248,7 0,4 8 515,6
http
://w
ww
.bps
.go.
id

http
://w
ww
.bps
.go.
id

PARIWISATA DAN TRANSPORTASI
TOURISM AND TRANSPORTATION
8http://siputku.com/pesona-eksotisme-alam-raja-ampat-yang-menakjubkan/
http
://w
ww
.bps
.go.
id

http
://w
ww
.bps
.go.
id

117Perkembangan Beberapa Indikator Utama Sosial-Ekonomi Indonesia, Agustus 2016
Jumlah Wisatawan Mancanegara Menurut Kebangsaan, Jumlah Akomodasi, Kamar, Tempat Tidur, dan Tingkat Hunian Hotel, 2012-2015Number of Foreign Tourist by Nationality, Number of Accommodations, Rooms, Beds, and Room Occupancy, 2012-2015
TabelTable
8.1
Sumber: Statistik Kunjungan Wisatawan Mancanegara, BPS Statistik Hotel dan Akomodasi Lainnya di Indonesia, BPS Statistik Tingkat Penghunian Kamar, BPSSource: International Visitor Arrival Statistics in Indonesia, BPS-Statistics Indonesia Hotel and Other Accommodation Statistics in Indonesia, BPS-Statistics Indonesia Room Occupation Rate, BPS-Statistics Indonesia
Rincian/Description 2012 2013 2014 2015
Wisatawan Mancanegara Menurut Kebangsaan/Foreign Visitors by Nationality
8 044 462 8 802 129 9 435 411 10 230 775
- Asia Pasifik/Asia Pacific 6 376 166 6 943 413 7 475 049 8 096 371
- Amerika/America 312 525 343 573 361 220 401 934
- Eropa/Europe 1 174 079 1 285 097 1 337 553 1 439 464
- Lainnya (Timur Tengah dan Afrika) Others (Middle East and Africa)
181 692 230 046 261 589 293 006
Hotel Berbintang/Classified Hotels
Jumlah AkomodasiNumber of Accom-modations
1 623 1 778 1 996 2 197
Jumlah Kamar/Number of Rooms 155 740 171 432 195 886 217 474
Jumlah Tempat Tidur/Number of Beds 238 485 263 774 295 426 322 590
Hotel Non-bintang/Nonclassified Hotels
Jumlah Akomodasi/Number of Accom-modations
14 375 14 907 15 488 16 156
Jumlah Kamar/Number of Rooms 250 038 259 361 273 391 289 727
Jumlah Tempat Tidur/Number of Beds 389 269 401 069 411 010 421 643
Tingkat Hunian (persen)Room Occupancy (percent)
Hotel Berbintang/Classified Hotels 51,55 52,22 52,56 53,16 *
Hotel Non Bintang dan Akomodasi Lainnya/Nonclassified Hotels and Other Accommodation
38,22 37,34 35,87 37,54 *
Catatan: *) Angkat sementaraNote : *) Preliminary Figures
http
://w
ww
.bps
.go.
id
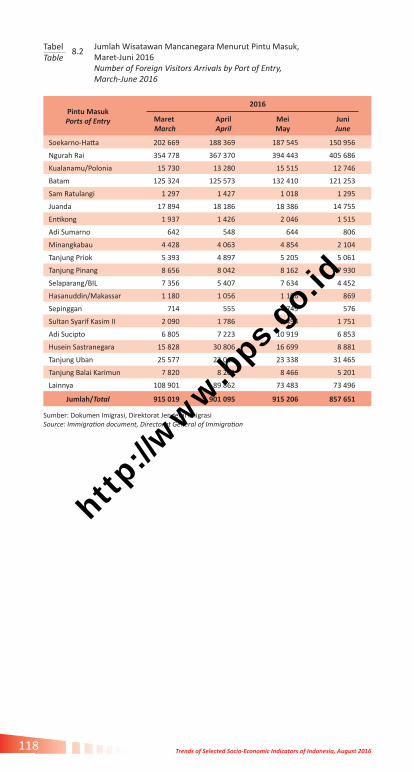
Trends of Selected Socio-Economic Indicators of Indonesia, August 2016118
Jumlah Wisatawan Mancanegara Menurut Pintu Masuk, Maret-Juni 2016Number of Foreign Visitors Arrivals by Port of Entry, March-June 2016
TabelTable
8.2
Sumber: Dokumen Imigrasi, Direktorat Jenderal ImigrasiSource: Immigration document, Directorat General of Immigration
Pintu MasukPorts of Entry
2016
Maret March
AprilApril
MeiMay
JuniJune
Soekarno-Hatta 202 669 188 369 187 545 150 956
Ngurah Rai 354 778 367 370 394 443 405 686
Kualanamu/Polonia 15 730 13 280 15 515 12 746
Batam 125 324 125 573 132 410 121 253
Sam Ratulangi 1 297 1 427 1 018 1 295
Juanda 17 894 18 186 18 386 14 755
Entikong 1 937 1 426 2 046 1 515
Adi Sumarno 642 548 644 806
Minangkabau 4 428 4 063 4 854 2 104
Tanjung Priok 5 393 4 897 5 205 5 061
Tanjung Pinang 8 656 8 042 8 162 7 930
Selaparang/BIL 7 356 5 407 7 634 4 452
Hasanuddin/Makassar 1 180 1 056 1 196 869
Sepinggan 714 555 749 576
Sultan Syarif Kasim II 2 090 1 786 2 494 1 751
Adi Sucipto 6 805 7 223 10 919 6 853
Husein Sastranegara 15 828 30 806 16 699 8 881
Tanjung Uban 25 577 23 018 23 338 31 465
Tanjung Balai Karimun 7 820 8 201 8 466 5 201
Lainnya 108 901 89 862 73 483 73 496
Jumlah/Total 915 019 901 095 915 206 857 651
Sumber: Dokumen Imigrasi, Direktorat Jenderal ImigrasiSource: Immigration document, Directorat General of Immigration
http
://w
ww
.bps
.go.
id

119Perkembangan Beberapa Indikator Utama Sosial-Ekonomi Indonesia, Agustus 2016
Tingkat Penghunian Kamar (TPK) Hotel Berbintang (persen) di 27 Provinsi di Indonesia (persen), Maret-Juni 2016 Room Occupancy Rate of Classified Hotel (percent) in 27 Provinces (percent),March-June 2016
TabelTable
8.3
Sumber: Berita Resmi Statistik, BPSSource: Official Statistics News, BPS-Statistics Indonesia
Provinsi Province
2016
Maret March
AprilApril
MeiMay
JuniJune
Aceh 50,33 48,56 58,06 53,64
Sumatera Utara 49,86 49,35 49,45 46,62
Sumatera Barat 50,96 54,66 60,67 40,23
Riau 41,20 56,82 56,77 45,70
Jambi 55,31 58,58 60,52 53,06
Sumatera Selatan 61,59 50,96 58,18 48,95
Bengkulu 68,69 57,95 62,30 48,65
Lampung 42,32 63,21 52,77 47,55
Kep. Bangka Belitung 46,68 37,42 43,24 32,64
Kepulauan Riau 49,39 47,55 48,92 49,77
DKI Jakarta 59,09 55,64 57,60 53,06
Jawa Barat 50,47 60,68 53,24 41,52
Jawa Tengah 40,64 46,06 45,40 37,08
DI Yogyakarta 52,97 59,53 61,16 45,92
Jawa Timur 56,07 61,82 62,80 56,75
Banten 50,13 52,18 62,12 53,79
Bali 58,56 55,08 60,04 56,77
Nusa Tenggara Barat 45,35 46,16 50,99 38,36
Kalimantan Barat 50,81 59,94 51,99 54,52
Kalimantan Tengah 55,79 65,36 56,74 58,39
Kalimantan Selatan 48,58 45,23 45,00 35,60
Kalimantan Timur 56,87 52,60 52,49 42,95
Sulawesi Utara 65,58 62,70 64,32 58,73
Sulawesi Tengah 72,29 68,55 63,68 60,12
Sulawesi Selatan 40,65 39,61 44,16 40,30
Sulawesi Tenggara 49,29 42,65 44,27 31,21
Gorontalo 45,66 50,27 53,22 46,80
27 Provinsi/ 27 Province 52,88 54,38 55,46 48,63
http
://w
ww
.bps
.go.
id

Trends of Selected Socio-Economic Indicators of Indonesia, August 2016120
Rata-rata Lama Menginap Tamu Asing dan Indonesia Pada Hotel Berbintang (hari) di 27 Provinsi di Indonesia, Maret-Juni 2016Average Length of Stay of Foreign and Domestic Guests at Classified Hotels (days) in 27 Provinces, March-June 2016
TabelTable
8.4
Sumber: Berita Resmi Statistik, BPSSource: Official Statistics News, BPS-Statistics Indonesia
Provinsi Province
2016
Maret March
AprilApril
MeiMay
JuniJune
Aceh 1,63 1,67 1,82 1,75
Sumatera Utara 1,55 1,44 1,39 2,03
Sumatera Barat 1,42 1,48 1,31 1,59
Riau 1,58 1,99 1,83 2,25
Jambi 1,89 1,84 2,11 2,26
Sumatera Selatan 1,54 1,75 1,87 1,47
Bengkulu 1,63 1,58 1,37 1,62
Lampung 1,38 1,55 1,74 2,00
Kep. Bangka Belitung 1,88 1,67 1,96 1,85
Kepulauan Riau 1,76 1,57 2,02 2,19
DKI Jakarta 1,93 1,99 1,94 1,62
Jawa Barat 1,54 1,95 1,64 1,48
Jawa Tengah 1,38 1,49 1,34 1,39
DI Yogyakarta 1,74 1,75 1,55 1,81
Jawa Timur 1,70 1,84 1,55 1,84
Banten 1,75 1,42 1,65 1,75
Bali 3,04 3,07 2,73 2,88
Nusa Tenggara Barat 1,82 1,90 1,80 1,83
Kalimantan Barat 1,58 1,96 1,69 1,67
Kalimantan Tengah 1,61 1,48 1,39 1,63
Kalimantan Selatan 1,70 1,45 1,42 1,43
Kalimantan Timur 1,71 1,88 1,49 1,38
Sulawesi Utara 1,85 1,98 2,11 1,85
Sulawesi Tengah 2,06 1,98 1,88 2,52
Sulawesi Selatan 1,48 1,54 1,55 2,03
Sulawesi Tenggara 1,86 1,64 1,73 1,54
Gorontalo 1,52 1,08 1,22 1,45
27 Provinsi/ 27 Province 1,81 1,88 1,75 1,84
http
://w
ww
.bps
.go.
id
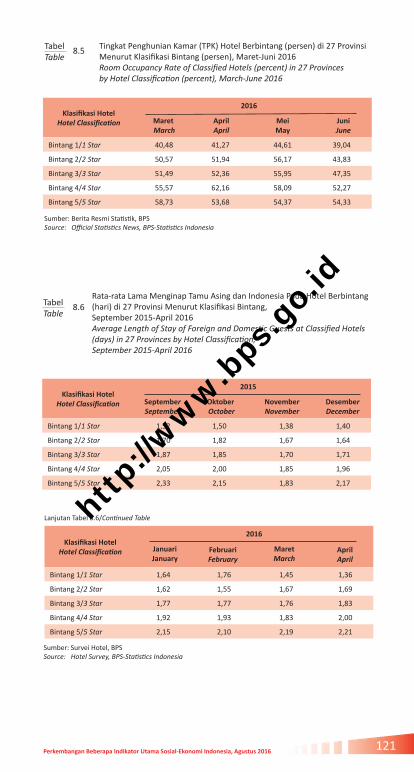
121Perkembangan Beberapa Indikator Utama Sosial-Ekonomi Indonesia, Agustus 2016
Rata-rata Lama Menginap Tamu Asing dan Indonesia Pada Hotel Berbintang (hari) di 27 Provinsi Menurut Klasifikasi Bintang, September 2015-April 2016 Average Length of Stay of Foreign and Domestic Guests at Classified Hotels (days) in 27 Provinces by Hotel Classification, September 2015-April 2016
TabelTable
8.6
Tingkat Penghunian Kamar (TPK) Hotel Berbintang (persen) di 27 Provinsi Menurut Klasifikasi Bintang (persen), Maret-Juni 2016 Room Occupancy Rate of Classified Hotels (percent) in 27 Provinces by Hotel Classification (percent), March-June 2016
TabelTable
8.5
Klasifikasi Hotel Hotel Classification
2016
Maret March
AprilApril
MeiMay
JuniJune
Bintang 1/1 Star 40,48 41,27 44,61 39,04
Bintang 2/2 Star 50,57 51,94 56,17 43,83
Bintang 3/3 Star 51,49 52,36 55,95 47,35
Bintang 4/4 Star 55,57 62,16 58,09 52,27
Bintang 5/5 Star 58,73 53,68 54,37 54,33
Sumber: Berita Resmi Statistik, BPSSource: Official Statistics News, BPS-Statistics Indonesia
Klasifikasi Hotel Hotel Classification
2015
SeptemberSeptember
Oktober October
NovemberNovember
DesemberDecember
Bintang 1/1 Star 1,52 1,50 1,38 1,40
Bintang 2/2 Star 1,70 1,82 1,67 1,64
Bintang 3/3 Star 1,87 1,85 1,70 1,71
Bintang 4/4 Star 2,05 2,00 1,85 1,96
Bintang 5/5 Star 2,33 2,15 1,83 2,17
Lanjutan Tabel 8.6/Continued Table
Klasifikasi Hotel Hotel Classification
2016
JanuariJanuary
FebruariFebruary
MaretMarch
AprilApril
Bintang 1/1 Star 1,64 1,76 1,45 1,36
Bintang 2/2 Star 1,62 1,55 1,67 1,69
Bintang 3/3 Star 1,77 1,77 1,76 1,83
Bintang 4/4 Star 1,92 1,93 1,83 2,00
Bintang 5/5 Star 2,15 2,10 2,19 2,21
Sumber: Survei Hotel, BPSSource: Hotel Survey, BPS-Statistics Indonesia
http
://w
ww
.bps
.go.
id

Trends of Selected Socio-Economic Indicators of Indonesia, August 2016122
Banyaknya Usaha, Kamar, dan Tempat Tidur Dirinci Menurut Klasifikasi Akomodasi, 2015 Number of Establishments, Rooms, and Beds by Accommodation Classification, 2015
Rata-rata Pekerja per Usaha dan per Kamar, Serta Rata-rata Tamu per Hari Pada Usaha Akomodasi Dirinci Menurut Klasifikasi Akomodasi, 2015 Average Workers per Establishments and per Room, and Average Guests per Day of Accommodation Establishments by Accommodation Classification, 2015
TabelTable
TabelTable
8.7
8.8
Sumber: Statistik Hotel dan Akomodasi Lainnya di Indonesia, BPSSource: Hotel and Other Accommodation Statistics in Indonesia, BPS-Statistics Indonesia
Sumber: Statistik Hotel dan Akomodasi Lainnya di Indonesia, BPSSource: Hotel and Other Accommodation Statistics in Indonesia, BPS-Statistics Indonesia
Klasifikasi Akomodasi Accommodation Classification
Banyaknya/Number of
Usaha Establishments
KamarRooms
Tempat TidurBeds
BERBINTANG/STAR 2 197 217 474 322 590
Bintang 1/1 Star 368 17 294 26 399
Bintang 2/2 Star 496 32 332 48 631
Bintang 3/3 Star 739 65 920 99 785
Bintang 4/4 Star 422 63 978 95 086
Bintang 5/5 Star 172 37 950 52 689
AKOMODASI LAINNYA/NON STAR 16 156 289 727 421 643
Non Bintang (Melati)/Non Star 10 387 235 738 349 390
Penginapan remaja/Youth hostel 425 5 402 7 960
Pondok wisata/Home stay 2 910 23 790 30 442
Villa 1 131 9 027 11 397
Jasa akomodasi lainnya/Other accommodation 1 303 15 770 22 454
Jumlah/Total 18 353 507 201 744 233
Klasifikasi AkomodasiAccommodation Classification
Rata-rata PekerjaAverage Worker
Rata-rata Tamu per Hari Average Guests per Day
Usaha Establishments
KamarRoom
Indonesia Asing
Foreign
BERBINTANG/STAR 92,3 0,9 103 385 32 251
Bintang 1/1 Star 29,1 0,6 7 168 633
Bintang 2/2 Star 41,4 0,6 18 362 1 321
Bintang 3/3 Star 77,2 0,9 33 526 5 570
Bintang 4/4 Star 145,7 1,0 30 344 12 467
Bintang 5/5 Star 308,1 1,4 13 985 12 260
AKOMODASI LAINNYA/NON STAR 8,1 0,4 116 400 13 657
Non Bintang (Melati)/Non Star 9,9 0,4 102 328 11 409
Penginapan remaja/Youth hostel 5,0 0,4 1 230 71
Pondok wisata/Home stay 4,5 0,5 5 578 1 372
Villa 5,4 0,7 2 524 512
Jasa akomodasi lainnya Other accommodation
4,7 0,4 4 740 293
Jumlah/Total 18,1 0,7 219 785 45 908
http
://w
ww
.bps
.go.
id

123Perkembangan Beberapa Indikator Utama Sosial-Ekonomi Indonesia, Agustus 2016
Jumlah Penumpang Dalam Negeri Menurut Jenis Angkutan (ribu orang), Januari 2014-Juni 2016 Number of Domestic Passengers by Mode of Transportation (thousand persons), January 2014-June 2016
TabelTable
8.9
Tahun/Bulan Year/Month
Angkutan Kereta Api Railways
Angkutan Laut Sea Transport
Angkutan Udara Air Transport
2014 277 504 13 091 58 917
Januari/January 21 091 1 038 4 917
Februari/February 19 997 986 4 042
Maret/March 22 836 996 4 572
April/April 21 907 985 4 361
Mei/May 22 988 1 023 5 042
Juni/June 23 840 1 052 5 389
Juli/July 22 499 1 201 4 496
Agustus/August 23 199 1 354 5 702
September/September 23 593 1 101 4 835
Oktober/October 24 923 1 078 5 137
November/November 24 356 1 122 4 957
Desember/December 26 275 1 155 5 467
2015 213 580 10 071 45 386
Januari/January 24 676 1 005 4 650
Februari/February 22 790 960 4 737
Maret/March 27 267 1 264 5 132
April/April 26 565 1 264 5 439
Mei/May 27 910 1 301 5 911
Juni/June 27 562 1 329 5 657
Juli/July 27 612 1 566 6 421
Agustus/August 27 796 1 272 6 344
September/September 27 549 1 196 5 331
Oktober/October 28 718 1 375 5 677
November/November 27 669 1 330 5 904
Desember/December 29 831 1 510 6 799
2016 171 782 7 665 37 677
Januari/January 28 358 1 593 6 323
Februari/February 26 511 1 324 5 816
Maret/March 28 617 1 161 6 294
April/April 28 434 1 064 6 143
Mei/May 30 703 1 174 6 883
Juni/June 29 159 1 348 6 219
Sumber: Berita Resmi Statistik, BPSSource: Official Statistics News, BPS-Statistics Indonesia
http
://w
ww
.bps
.go.
id

Trends of Selected Socio-Economic Indicators of Indonesia, August 2016124
Tahun/ Bulan Year/Month
Angkutan Kereta Api Railways
Angkutan Laut Sea Transport
Angkutan Udara Air Transport
(000 ton)Perubahan
Change (%)
(000 ton)Perubahan
Change (%)
(000 ton)Perubahan
Change (%)
2014 33 463 225 517 348,5
Januari/January 2 310 2,85 18 740 6,20 28,5 -2,40
Februari/February 2 274 -1,56 17 527 -6,47 22,4 -21,40
Maret/March 2 472 8,71 19 693 12,36 33,2 48,21
April/April 2 352 -4,85 18 334 -6,90 28,3 -14,76
Mei/May 3 188 35,54 19 101 4,18 30,2 6,71
Juni/June 3 479 9,13 19 749 3,40 27,7 -8,28
Juli/July 2 468 -29,06 19 587 -0,82 29,7 7,22
Agustus/August 2 699 9,36 18 748 -4,28 30,0 1,01
September/September 3 340 23,75 18 903 0,82 29,2 -2,67
Oktober/October 2 956 -11,50 18 759 -0,76 29,4 0,68
November/November 2 775 -6,12 18 586 -0,92 29,7 1,02
Desember/December 3 150 13,51 17 791 -4,27 30,2 1,68
2015 32 035 238 309 401,0
Januari/January 2 709 -14,00 19 761 11,07 32,4 7,28
Februari/February 2 256 -16,72 16 689 -15,55 29,0 -10,49
Maret/March 2 520 11,70 18 136 8,67 29,9 3,10
April/April 2 336 -7,30 17 897 -1,32 34,3 14,72
Mei/May 2 641 13,06 20 134 12,50 36,4 6,12
Juni/June 2 805 6,21 19 870 -1,31 36,2 -0,55
Juli/July 2 678 -4,53 17 948 -9,67 31,9 -14,64
Agustus/August 2 881 7,58 20 066 11,80 33,6 8,74
September/September 2 801 -2,78 21 474 7,02 32,0 -4,76
Oktober/October 2 844 1,54 21 906 2,01 32,9 2,81
November/November 2 677 -5,87 22 082 0,80 33,1 0,61
Desember/December 2 887 7,84 22 346 1,20 39,0 17,82
2016 19 712 145 668 225,2
Januari/January 2 941 1,87 20 142 -9,86 30,1 -22,82
Februari/February 2 682 -8,81 19 595 -2,72 30,6 1,66
Maret/March 2 729 1,75 20 445 4,34 32,2 5,23
April/April 2 883 5,64 20 850 1,98 33,2 3,11
Mei/May 2 683 -6,94 21 692 4,04 33,1 -0,30
Juni/June 2 983 11,18 22 029 1,55 38,7 16,92
Juli/July 2 811 -5,77 20 917 -5,05 27,3 -29,46
Jumlah Barang Dalam Negeri yang Diangkut Menurut Jenis Angkutan (ribu ton), Januari 2014-Juli 2016Number of Domestic Cargo by Mode of Transportation (thousand tons), January 2014-July 2016
TabelTable
8.10
Sumber: Berita Resmi Statistik, BPSSource: Official Statistics News, BPS-Statistics Indonesia
http
://w
ww
.bps
.go.
id
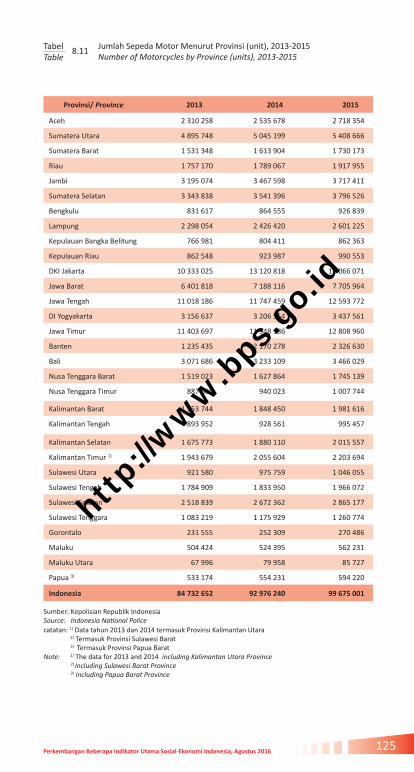
125Perkembangan Beberapa Indikator Utama Sosial-Ekonomi Indonesia, Agustus 2016
Jumlah Sepeda Motor Menurut Provinsi (unit), 2013-2015 Number of Motorcycles by Province (units), 2013-2015
TabelTable
8.11
Sumber: Kepolisian Republik IndonesiaSource: Indonesia National Police
Provinsi/ Province 2013 2014 2015
Aceh 2 310 258 2 535 678 2 718 354
Sumatera Utara 4 895 748 5 045 199 5 408 666
Sumatera Barat 1 531 348 1 613 904 1 730 173
Riau 1 757 170 1 789 067 1 917 955
Jambi 3 195 074 3 467 598 3 717 411
Sumatera Selatan 3 343 838 3 541 396 3 796 526
Bengkulu 831 617 864 555 926 839
Lampung 2 298 054 2 426 420 2 601 225
Kepulauan Bangka Belitung 766 981 804 411 862 363
Kepulauan Riau 862 548 923 987 990 553
DKI Jakarta 10 333 025 13 120 818 14 066 071
Jawa Barat 6 401 818 7 188 116 7 705 964
Jawa Tengah 11 018 186 11 747 459 12 593 772
DI Yogyakarta 3 156 637 3 206 554 3 437 561
Jawa Timur 11 403 697 11 948 186 12 808 960
Banten 1 235 435 2 170 278 2 326 630
Bali 3 071 686 3 233 109 3 466 029
Nusa Tenggara Barat 1 519 023 1 627 864 1 745 139
Nusa Tenggara Timur 887 665 940 023 1 007 744
Kalimantan Barat 1 753 744 1 848 450 1 981 616
Kalimantan Tengah 893 952 928 561 995 457
Kalimantan Selatan 1 675 773 1 880 110 2 015 557
Kalimantan Timur 1) 1 943 679 2 055 604 2 203 694
Sulawesi Utara 921 580 975 759 1 046 055
Sulawesi Tengah 1 784 909 1 833 950 1 966 072
Sulawesi Selatan 2) 2 518 839 2 672 362 2 865 177
Sulawesi Tenggara 1 083 219 1 175 929 1 260 774
Gorontalo 231 555 252 309 270 486
Maluku 504 424 524 395 562 231
Maluku Utara 67 996 79 958 85 727
Papua 3) 533 174 554 231 594 220
Indonesia 84 732 652 92 976 240 99 675 001
catatan: 1) Data tahun 2013 dan 2014 termasuk Provinsi Kalimantan Utara 2) Termasuk Provinsi Sulawesi Barat 3) Termasuk Provinsi Papua BaratNote: 1) The data for 2013 and 2014 including Kalimantan Utara Province 2) Including Sulawesi Barat Province 3) Including Papua Barat Province
http
://w
ww
.bps
.go.
id

Trends of Selected Socio-Economic Indicators of Indonesia, August 2016126
http
://w
ww
.bps
.go.
id
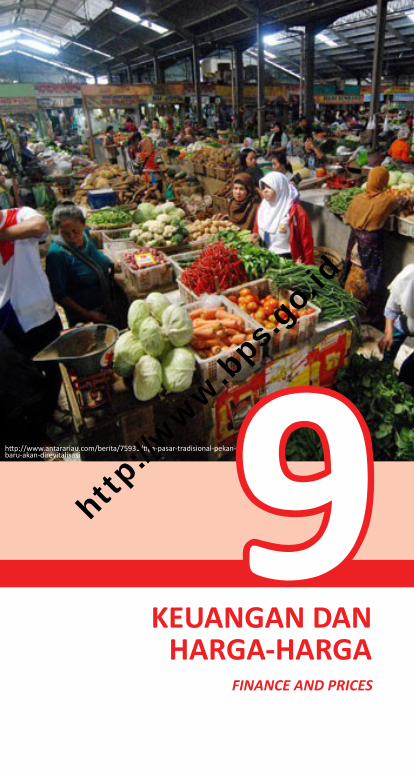
KEUANGAN DAN HARGA-HARGA
FINANCE AND PRICES
9http://www.antarariau.com/berita/75931/tiga-pasar-tradisional-pekan-baru-akan-direvitalisasi
http
://w
ww
.bps
.go.
id

http
://w
ww
.bps
.go.
id

129Perkembangan Beberapa Indikator Utama Sosial-Ekonomi Indonesia, Agustus 2016
Ringkasan Anggaran Pendapatan dan Belanja Negara (triliun rupiah), 2013-2016 Summary of State National Budget (trillion rupiahs), 2013-2016
TabelTable
9.1
2013 2014 2015 2016
LKPPAudited
LKPPAudited
LKPPAudited
APBN-PRevised Budget
A Pendapatan dan Hibah Revenues and Grants
1 438,89 1 550,49 1 508,02 1 786,23
1 Penerimaan dalam negeri Domestic revenue
1 432,06 1 545,46 1 496,05 1 784,25
a. Penerimaan perpajakan/Tax revenue 1 077,31 1 146,87 1 240,42 1 539,17
b. Penerimaan negara bukan pajak Non tax revenue
354,75 398,59 255,63 245,08
2 Hibah/Grants 6,83 5,03 11,97 1,98
B Belanja Negara/State Expenditures 1 650,56 1 777,18 1 806,51 2 082,95
1. Belanja pemerintah pusat Central government expenditures
1 137,16 1 203,58 1 183,30 1 306,70
2. Transfer ke daerah/Transfer to region 513,26 573,70 623,14 776,25
3. Suspen/Suspend 0,14 - 0,10 0,07 0,00
C. Keseimbangan Primer/Primary Balance - 98,64 - 93,25 - 142,48 - 105,50
D. Surplus atau Defisit AnggaranSurplus or Deficit (A-B)
- 211,67 - 226,69 - 298,49 - 296,72
E. Pembiayaan/Financing Net * 237,39 248,89 323,11 296,72
1. Pembiayaan Utang/Debt financing 223,22 255,73 380,92 371,56
2. Pembiayaan Invenstasi Investment financing
- 16,86 - 8,91 - 59,65 - 93,98
3. Pemberian Pinjaman/Loan 0,30 2,49 1,50 0,46
4. Pembiayaan luar negerI Liability Assurance
- 0,71 - 0,96 - - 0,65
5. Pembiayaan lainnya/Other financing 31,44 0,54 0,34 19,33
Sumber: Kementerian KeuanganSource: Ministry of Finance Catatan: - LKPP (Laporan Keuangan Pemerintah Pusat) - Tahun 2013-2016 menggunakan Klasifikasi BaruNote: - Financial Report of Central Government - In 2013-2016 used New Classification
http
://w
ww
.bps
.go.
id
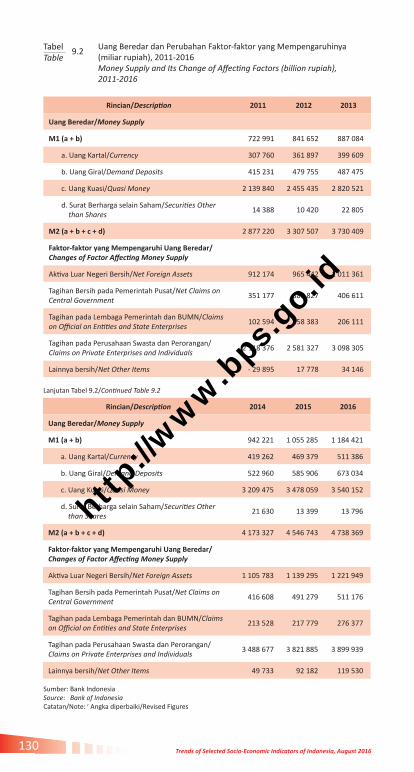
Trends of Selected Socio-Economic Indicators of Indonesia, August 2016130
Uang Beredar dan Perubahan Faktor-faktor yang Mempengaruhinya (miliar rupiah), 2011-2016 Money Supply and Its Change of Affecting Factors (billion rupiah), 2011-2016
TabelTable
9.2
Rincian/Description 2011 2012 2013
Uang Beredar/Money Supply
M1 (a + b) 722 991 841 652 887 084
a. Uang Kartal/Currency 307 760 361 897 399 609
b. Uang Giral/Demand Deposits 415 231 479 755 487 475
c. Uang Kuasi/Quasi Money 2 139 840 2 455 435 2 820 521
d. Surat Berharga selain Saham/Securities Other than Shares
14 388 10 420 22 805
M2 (a + b + c + d) 2 877 220 3 307 507 3 730 409
Faktor-faktor yang Mempengaruhi Uang Beredar/ Changes of Factor Affecting Money Supply
Aktiva Luar Negeri Bersih/Net Foreign Assets 912 174 965 442 1 011 361
Tagihan Bersih pada Pemerintah Pusat/Net Claims on Central Government
351 177 389 827 406 611
Tagihan pada Lembaga Pemerintah dan BUMN/Claims on Official on Entities and State Enterprises
102 594 158 383 206 111
Tagihan pada Perusahaan Swasta dan Perorangan/ Claims on Private Enterprises and Individuals
2 118 376 2 581 327 3 098 305
Lainnya bersih/Net Other Items - 29 895 17 778 34 146
Sumber: Bank IndonesiaSource: Bank of IndonesiaCatatan/Note: r Angka diperbaiki/Revised Figures
Lanjutan Tabel 9.2/Continued Table 9.2
Rincian/Description 2014 2015 2016
Uang Beredar/Money Supply
M1 (a + b) 942 221 1 055 285 1 184 421
a. Uang Kartal/Currency 419 262 469 379 511 386
b. Uang Giral/Demand Deposits 522 960 585 906 673 034
c. Uang Kuasi/Quasi Money 3 209 475 3 478 059 3 540 152
d. Surat Berharga selain Saham/Securities Other than Shares
21 630 13 399 13 796
M2 (a + b + c + d) 4 173 327 4 546 743 4 738 369
Faktor-faktor yang Mempengaruhi Uang Beredar/ Changes of Factor Affecting Money Supply
Aktiva Luar Negeri Bersih/Net Foreign Assets 1 105 783 1 139 295 1 221 949
Tagihan Bersih pada Pemerintah Pusat/Net Claims on Central Government
416 608 491 279 511 176
Tagihan pada Lembaga Pemerintah dan BUMN/Claims on Official on Entities and State Enterprises
213 528 217 779 276 377
Tagihan pada Perusahaan Swasta dan Perorangan/ Claims on Private Enterprises and Individuals
3 488 677 3 821 885 3 899 939
Lainnya bersih/Net Other Items 49 733 92 182 119 530
http
://w
ww
.bps
.go.
id
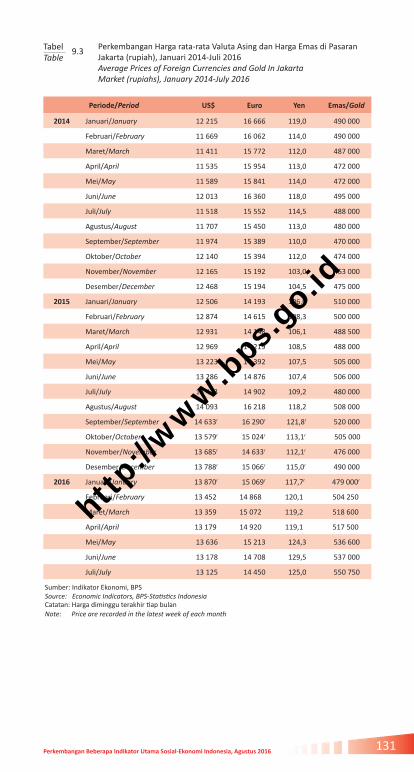
131Perkembangan Beberapa Indikator Utama Sosial-Ekonomi Indonesia, Agustus 2016
Perkembangan Harga rata-rata Valuta Asing dan Harga Emas di Pasaran Jakarta (rupiah), Januari 2014-Juli 2016Average Prices of Foreign Currencies and Gold In Jakarta Market (rupiahs), January 2014-July 2016
TabelTable
9.3
Sumber: Indikator Ekonomi, BPS Source: Economic Indicators, BPS-Statistics Indonesia
Periode/Period US$ Euro Yen Emas/Gold
2014 Januari/January 12 215 16 666 119,0 490 000
Februari/February 11 669 16 062 114,0 490 000
Maret/March 11 411 15 772 112,0 487 000
April/April 11 535 15 954 113,0 472 000
Mei/May 11 589 15 841 114,0 472 000
Juni/June 12 013 16 360 118,0 495 000
Juli/July 11 518 15 552 114,5 488 000
Agustus/August 11 707 15 450 113,0 480 000
September/September 11 974 15 389 110,0 470 000
Oktober/October 12 140 15 394 112,0 474 000
November/November 12 165 15 192 103,0 463 000
Desember/December 12 468 15 194 104,5 475 000
2015 Januari/January 12 506 14 193 106,0 510 000
Februari/February 12 874 14 615 108,3 500 000
Maret/March 12 931 14 148 106,1 488 500
April/April 12 969 14 219 108,5 488 000
Mei/May 13 223 14 392 107,5 505 000
Juni/June 13 286 14 876 107,4 506 000
Juli/July 13 443 14 902 109,2 480 000
Agustus/August 14 093 16 218 118,2 508 000
September/September 14 633r 16 290r 121,8r 520 000
Oktober/October 13 579r 15 024r 113,1r 505 000
November/November 13 685r 14 633r 112,1r 476 000
Desember/December 13 788r 15 066r 115,0r 490 000
2016 Januari/January 13 870r 15 069r 117,7r 479 000r
Februari/February 13 452 14 868 120,1 504 250
Maret/March 13 359 15 072 119,2 518 600
April/April 13 179 14 920 119,1 517 500
Mei/May 13 636 15 213 124,3 536 600
Juni/June 13 178 14 708 129,5 537 000
Juli/July 13 125 14 450 125,0 550 750
Catatan: Harga diminggu terakhir tiap bulan Note: Price are recorded in the latest week of each month
http
://w
ww
.bps
.go.
id
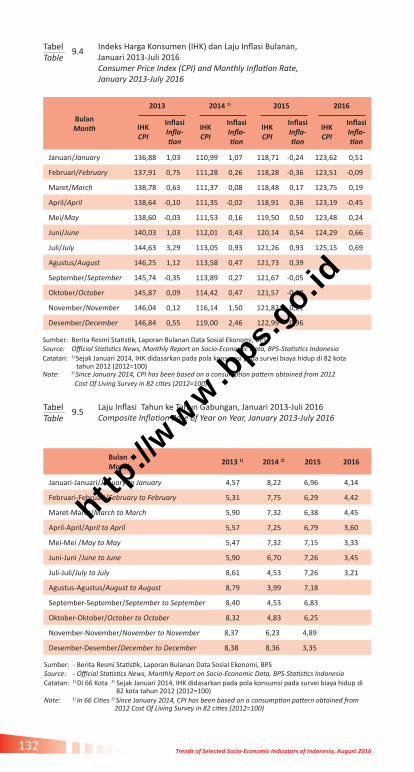
Trends of Selected Socio-Economic Indicators of Indonesia, August 2016132
Indeks Harga Konsumen (IHK) dan Laju Inflasi Bulanan, Januari 2013-Juli 2016Consumer Price Index (CPI) and Monthly Inflation Rate, January 2013-July 2016
Laju Inflasi Tahun ke Tahun Gabungan, Januari 2013-Juli 2016Composite Inflation Rate of Year on Year, January 2013-July 2016
TabelTable
TabelTable
9.4
9.5
BulanMonth
2013 2014 1) 2015 2016
IHKCPI
Inflasi Infla-tion
IHKCPI
Inflasi Infla-tion
IHKCPI
Inflasi Infla-tion
IHKCPI
Inflasi Infla-tion
Januari/January 136,88 1,03 110,99 1,07 118,71 -0,24 123,62 0,51
Februari/February 137,91 0,75 111,28 0,26 118,28 -0,36 123,51 -0,09
Maret/March 138,78 0,63 111,37 0,08 118,48 0,17 123,75 0,19
April/April 138,64 -0,10 111,35 -0,02 118,91 0,36 123,19 -0,45
Mei/May 138,60 -0,03 111,53 0,16 119,50 0,50 123,48 0,24
Juni/June 140,03 1,03 112,01 0,43 120,14 0,54 124,29 0,66
Juli/July 144,63 3,29 113,05 0,93 121,26 0,93 125,15 0,69
Agustus/August 146,25 1,12 113,58 0,47 121,73 0,39
September/September 145,74 -0,35 113,89 0,27 121,67 -0,05
Oktober/October 145,87 0,09 114,42 0,47 121,57 -0,08
November/November 146,04 0,12 116,14 1,50 121,82 0,21
Desember/December 146,84 0,55 119,00 2,46 122,99 0,96
Bulan Month
2013 1) 2014 2) 2015 2016
Januari-Januari/January to January 4,57 8,22 6,96 4,14
Februari-Februari/February to February 5,31 7,75 6,29 4,42
Maret-Maret/March to March 5,90 7,32 6,38 4,45
April-April/April to April 5,57 7,25 6,79 3,60
Mei-Mei /May to May 5,47 7,32 7,15 3,33
Juni-Juni /June to June 5,90 6,70 7,26 3,45
Juli-Juli/July to July 8,61 4,53 7,26 3,21
Agustus-Agustus/August to August 8,79 3,99 7,18
September-September/September to September 8,40 4,53 6,83
Oktober-Oktober/October to October 8,32 4,83 6,25
November-November/November to November 8,37 6,23 4,89
Desember-Desember/December to December 8,38 8,36 3,35
Sumber: Berita Resmi Statistik, Laporan Bulanan Data Sosial Ekonomi, BPSSource: Official Statistics News, Monthly Report on Socio-Economic Data, BPS-Statistics Indonesia
Sumber: - Berita Resmi Statistik, Laporan Bulanan Data Sosial Ekonomi, BPSSource: - Official Statistics News, Monthly Report on Socio-Economic Data, BPS-Statistics Indonesia
Catatan: 1) Sejak Januari 2014, IHK didasarkan pada pola konsumsi pada survei biaya hidup di 82 kota tahun 2012 (2012=100) Note: 1) Since January 2014, CPI has been based on a consumption pattern obtained from 2012 Cost Of Living Survey in 82 cities (2012=100)
Catatan: 1) Di 66 Kota 2) Sejak Januari 2014, IHK didasarkan pada pola konsumsi pada survei biaya hidup di 82 kota tahun 2012 (2012=100) Note: 1) In 66 Cities 2) Since January 2014, CPI has been based on a consumption pattern obtained from 2012 Cost Of Living Survey in 82 cities (2012=100)
http
://w
ww
.bps
.go.
id
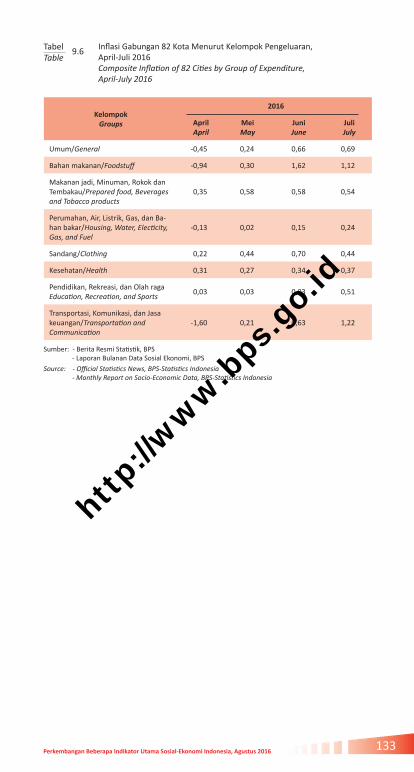
133Perkembangan Beberapa Indikator Utama Sosial-Ekonomi Indonesia, Agustus 2016
Inflasi Gabungan 82 Kota Menurut Kelompok Pengeluaran, April-Juli 2016 Composite Inflation of 82 Cities by Group of Expenditure, April-July 2016
TabelTable
9.6
KelompokGroups
2016
AprilApril
MeiMay
JuniJune
JuliJuly
Umum/General -0,45 0,24 0,66 0,69
Bahan makanan/Foodstuff -0,94 0,30 1,62 1,12
Makanan jadi, Minuman, Rokok dan Tembakau/Prepared food, Beverages and Tobacco products
0,35 0,58 0,58 0,54
Perumahan, Air, Listrik, Gas, dan Ba-han bakar/Housing, Water, Electicity, Gas, and Fuel
-0,13 0,02 0,15 0,24
Sandang/Clothing 0,22 0,44 0,70 0,44
Kesehatan/Health 0,31 0,27 0,34 0,37
Pendidikan, Rekreasi, dan Olah ragaEducation, Recreation, and Sports
0,03 0,03 0,03 0,51
Transportasi, Komunikasi, dan Jasa keuangan/Transportation and Communication
-1,60 0,21 0,63 1,22
Sumber: - Berita Resmi Statistik, BPS - Laporan Bulanan Data Sosial Ekonomi, BPSSource: - Official Statistics News, BPS-Statistics Indonesia - Monthly Report on Socio-Economic Data, BPS-Statistics Indonesia
http
://w
ww
.bps
.go.
id
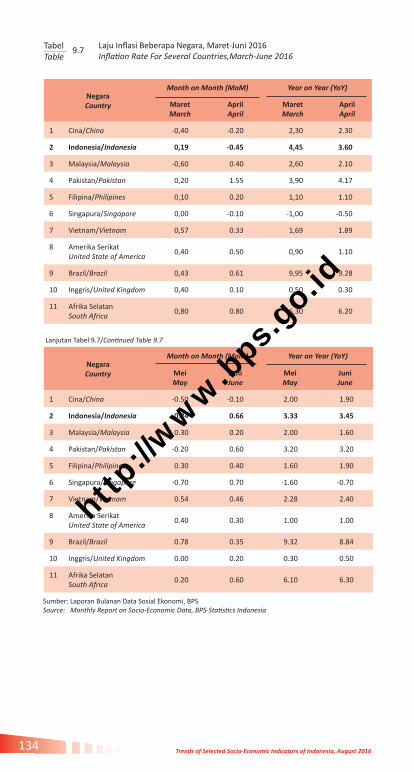
Trends of Selected Socio-Economic Indicators of Indonesia, August 2016134
Laju Inflasi Beberapa Negara, Maret-Juni 2016 Inflation Rate For Several Countries,March-June 2016
Lanjutan Tabel 9.7/Continued Table 9.7
TabelTable
9.7
NegaraCountry
Month on Month (MoM) Year on Year (YoY)
MeiMay
JuniJune
MeiMay
JuniJune
1 Cina/China -0.50 -0.10 2.00 1.90
2 Indonesia/Indonesia 0.24 0.66 3.33 3.45
3 Malaysia/Malaysia 0.30 0.20 2.00 1.60
4 Pakistan/Pakistan -0.20 0.60 3.20 3.20
5 Filipina/Philipines 0.30 0.40 1.60 1.90
6 Singapura/Singapore -0.70 0.70 -1.60 -0.70
7 Vietnam/Vietnam 0.54 0.46 2.28 2.40
8 Amerika SerikatUnited State of America
0.40 0.30 1.00 1.00
9 Brazil/Brazil 0.78 0.35 9.32 8.84
10 Inggris/United Kingdom 0.00 0.20 0.30 0.50
11 Afrika SelatanSouth Africa
0.20 0.60 6.10 6.30
Sumber: Laporan Bulanan Data Sosial Ekonomi, BPSSource: Monthly Report on Socio-Economic Data, BPS-Statistics Indonesia
NegaraCountry
Month on Month (MoM) Year on Year (YoY)
MaretMarch
AprilApril
MaretMarch
AprilApril
1 Cina/China -0,40 -0.20 2,30 2.30
2 Indonesia/Indonesia 0,19 -0.45 4,45 3.60
3 Malaysia/Malaysia -0,60 0.40 2,60 2.10
4 Pakistan/Pakistan 0,20 1.55 3,90 4.17
5 Filipina/Philipines 0,10 0.20 1,10 1.10
6 Singapura/Singapore 0,00 -0.10 -1,00 -0.50
7 Vietnam/Vietnam 0,57 0.33 1,69 1.89
8 Amerika SerikatUnited State of America
0,40 0.50 0,90 1.10
9 Brazil/Brazil 0,43 0.61 9,95 9.28
10 Inggris/United Kingdom 0,40 0.10 0,50 0.30
11 Afrika SelatanSouth Africa
0,80 0.80 6,30 6.20
http
://w
ww
.bps
.go.
id

135Perkembangan Beberapa Indikator Utama Sosial-Ekonomi Indonesia, Agustus 2016
Harga Konsumen Beberapa Komoditas Pangan Bulanan (rupiah), Juli 2015-Juli 2016 Monthly Consumer Prices of Several Foods Items (rupiahs), July 2015-July 2016
Lanjutan Tabel 9.8/Continued Table 9.8
TabelTable
9.8
BulanMonth
BerasRice (kg)
Daging Ayam RasPurebred Chicken
Meat (kg)
Daging SapiBeef (kg)
Susu Kental ManisSweet Canned
Liquid Milk (385 gram)
2015
Juli/July 12 509 39 231 100 862 9 831
Agustus/August 12 709 41 616 102 143 9 896
September/September 12 968 37 742 101 959 9 865
Oktober/October 13 067 35 693 101 826 9 870
November/November 13 139 36 296 101 409 9 893
Desember/December 13 217 38 550 102 038 9 882
2016
Januari/January 13 319 41 372 104 120 9 889
Februari/February 13 376 39 862 105 224 9 895
Maret/March 13 301 36 203 105 676 9 888
April/April 13 105 35 102 105 444 9 871
Mei/May 13 039 37 619 105 623 9 889
Juni/June 13 115 39 635 106 986 9 898
Juli/July 13 181 41 034 108 256 9 925
BulanMonth
Minyak Goreng Cooking Oil (liter/liter)
Gula Pasir Sugar (kg)
Tepung Terigu Wheat Flour (kg)
Cabe Merah Red Chillies
(kg)
2015
Juli/July 13 838 13 065 7 927 35 319
Agustus/August 13 790 13 013 7 953 36 333
September/September 13 521 12 906 7 951 32 344
Oktober/October 13 436 12 918 7 955 23 740
November/November 13 302 13 308 7 938 23 028
Desember/December 13 310 13 116 7 961 32 831
2016
Januari/January 13 277 13 208 7 986 35 412
Februari/February 13 310 13 310 7 980 37 845
Maret/March 13 415 13 415 7 985 45 554
April/April 13 463 13 463 8 007 33 979
Mei/May 13 885 14 459 7 990 30 445
Juni/June 13 941 15 327 8 019 30 031
Juli/July 13 919 15 745 8 042 31 160
Sumber: Laporan Bulanan Data Sosial Ekonomi, BPSSource: Monthly Report on Socio-Economic Data, BPS-Statistics Indonesia
http
://w
ww
.bps
.go.
id
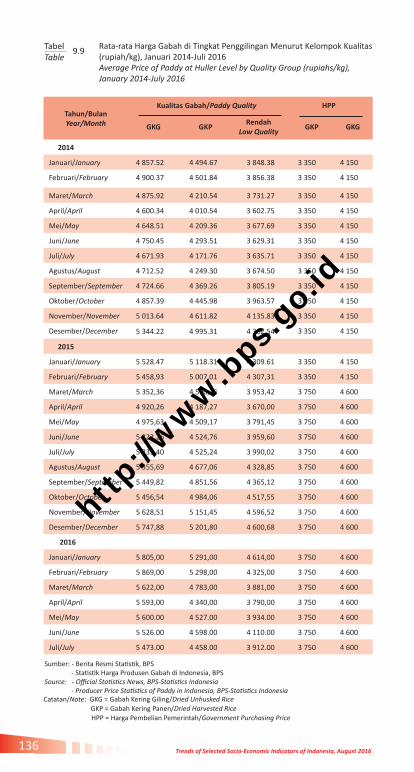
Trends of Selected Socio-Economic Indicators of Indonesia, August 2016136
Rata-rata Harga Gabah di Tingkat Penggilingan Menurut Kelompok Kualitas (rupiah/kg), Januari 2014-Juli 2016 Average Price of Paddy at Huller Level by Quality Group (rupiahs/kg), January 2014-July 2016
TabelTable
9.9
Catatan/Note: GKG = Gabah Kering Giling/Dried Unhusked Rice GKP = Gabah Kering Panen/Dried Harvested Rice HPP = Harga Pembelian Pemerintah/Government Purchasing Price
Sumber: - Berita Resmi Statistik, BPS - Statistik Harga Produsen Gabah di Indonesia, BPS Source: - Official Statistics News, BPS-Statistics Indonesia - Producer Price Statistics of Paddy in Indonesia, BPS-Statistics Indonesia
Tahun/BulanYear/Month
Kualitas Gabah/Paddy Quality HPP
GKG GKPRendah
Low Quality GKP GKG
2014
Januari/January 4 857.52 4 494.67 3 848.38 3 350 4 150
Februari/February 4 900.37 4 501.84 3 856.38 3 350 4 150
Maret/March 4 875.92 4 210.54 3 731.27 3 350 4 150
April/April 4 600.34 4 010.54 3 602.75 3 350 4 150
Mei/May 4 648.51 4 209.36 3 677.69 3 350 4 150
Juni/June 4 750.45 4 293.51 3 629.31 3 350 4 150
Juli/July 4 671.93 4 171.76 3 635.71 3 350 4 150
Agustus/August 4 712.52 4 249.30 3 674.50 3 350 4 150
September/September 4 724.66 4 369.26 3 805.19 3 350 4 150
Oktober/October 4 857.39 4 445.98 3 963.57 3 350 4 150
November/November 5 013.64 4 611.82 4 135.83 3 350 4 150
Desember/December 5 344.22 4 995.31 4 362.54 3 350 4 150
2015
Januari/January 5 528.47 5 118.31 4 309.61 3 350 4 150
Februari/February 5 458,93 5 007,01 4 307,31 3 350 4 150
Maret/March 5 352,36 4 590,26 3 953,42 3 750 4 600
April/April 4 920,26 4 187,27 3 670,00 3 750 4 600
Mei/May 4 975,63 4 509,17 3 791,45 3 750 4 600
Juni/June 5 322,26 4 524,76 3 959,60 3 750 4 600
Juli/July 5 331,40 4 525,24 3 990,02 3 750 4 600
Agustus/August 5 355,69 4 677,06 4 328,85 3 750 4 600
September/September 5 449,82 4 851,56 4 365,12 3 750 4 600
Oktober/October 5 456,54 4 984,06 4 517,55 3 750 4 600
November/November 5 628,51 5 151,45 4 596,52 3 750 4 600
Desember/December 5 747,88 5 201,80 4 600,68 3 750 4 600
2016
Januari/January 5 805,00 5 291,00 4 614,00 3 750 4 600
Februari/February 5 869,00 5 298,00 4 325,00 3 750 4 600
Maret/March 5 622,00 4 783,00 3 881,00 3 750 4 600
April/April 5 593,00 4 340,00 3 790,00 3 750 4 600
Mei/May 5 600.00 4 527.00 3 934.00 3 750 4 600
Juni/June 5 526.00 4 598.00 4 110.00 3 750 4 600
Juli/July 5 473.00 4 458.00 3 912.00 3 750 4 600
http
://w
ww
.bps
.go.
id

137Perkembangan Beberapa Indikator Utama Sosial-Ekonomi Indonesia, Agustus 2016
Rata-rata Harga Gabah di Tingkat Petani Menurut Kelompok Kualitas (rupiah/kg), Januari 2014-Juli 2016 Average Price of Paddy at Farmer Level by Quality Group (rupiahs/kg), January 2014-July 2016
TabelTable
9.10
Catatan/Note: GKG = Gabah Kering Giling/Dried Unhusked Rice GKP = Gabah Kering Panen/Dried Harvested Rice HPP = Harga Pembelian Pemerintah /Government Purchasing Price
Sumber: - Berita Resmi Statistik, BPS - Statistik Harga Produsen Gabah di Indonesia, BPS Source: - Official Statistics News, BPS-Statistics Indonesia - Producer Price Statistics of Paddy in Indonesia, BPS-Statistics Indonesia
Tahun/BulanYear/Month
Kualitas Gabah/Paddy Quality
HPPGKG GKP
RendahLow Quality
2014
Januari/January 4 776.26 4 412.30 3 755.19 3 300
Februari/February 4 791.95 4 423.22 3 780.19 3 300
Maret/March 4 790.71 4 134.76 3 660.81 3 300
April/April 4 528.88 3 935.73 3 524.33 3 300
Mei/May 4 572.07 4 130.49 3 564.91 3 300
Juni/June 4 664.43 4 213.83 3 549.68 3 300
Juli/July 4 597.59 4 097.92 3 562.06 3 300
Agustus/August 4 630.94 4 170.35 3 600.67 3 300
September/September 4 643.25 4 282.54 3 717.56 3 300
Oktober/October 4 782.74 4 364.75 3 877.30 3 300
November/November 4 936.49 4 535.02 4 050.71 3 300
Desember/December 5 264.16 4 910.51 4 264.54 3 300
2015
Januari/January 5 447.14 5 027.89 4 212.30 3 300
Februari/February 5 357,00 4 922,52 4 206,68 3 300
Maret/March 5 264,01 4 499,83 3 878,92 3 700
April/April 4 842,69 4 106,73 3 592,24 3 700
Mei/May 4 885,75 4 428,41 3 698,64 3 700
Juni/June 5 234,51 4 441,70 3 872,75 3 700
Juli/July 5 237,80 4 443,74 3 902,23 3 700
Agustus/August 5 247,92 4 594,72 4 255,91 3 700
September/September 5 330,12 4 764,68 4 287,27 3 700
Oktober/October 5 355,76 4 904,51 4 428,25 3 700
November/November 5 523,57 5 070,45 4 484,73 3 700
Desember/December 5 631,66 5 117,64 4 504,02 3 700
2016
Januari/January 5 689,00 5 206,00 4 520,00 3 700
Februari/February 5 753,00 5 211,00 4 223,00 3 700
Maret/March 5 501,00 4 703,00 3 794,00 3 700
April/April 5 474,00 4 262,00 3 709,00 3 700
Mei/May 5 510.00 4 440.00 3 838.00 3 700
Juni/June 5 430.00 4 501.00 4 008.00 3 700
Juli/July 5 380.00 4 376.00 3 831.00 3 700
http
://w
ww
.bps
.go.
id
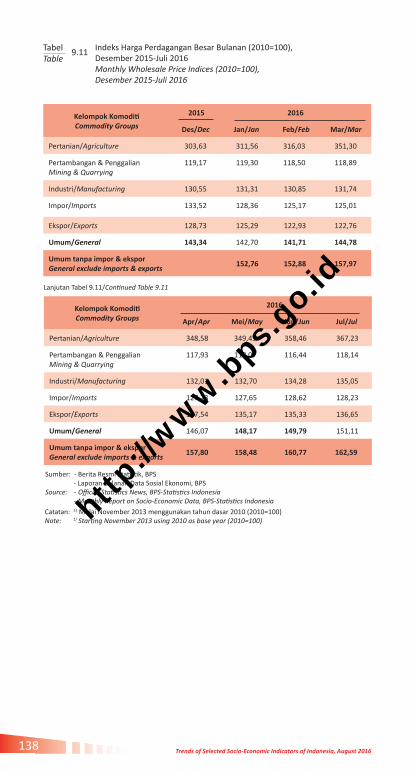
Trends of Selected Socio-Economic Indicators of Indonesia, August 2016138
Indeks Harga Perdagangan Besar Bulanan (2010=100),Desember 2015-Juli 2016Monthly Wholesale Price Indices (2010=100),Desember 2015-Juli 2016
TabelTable
9.11
Sumber: - Berita Resmi Statistik, BPS - Laporan Bulanan Data Sosial Ekonomi, BPSSource: - Official Statistics News, BPS-Statistics Indonesia - Monthly Report on Socio-Economic Data, BPS-Statistics Indonesia
Kelompok KomoditiCommodity Groups
2016
Apr/Apr Mei/May Jun/Jun Jul/Jul
Pertanian/Agriculture 348,58 349,45 358,46 367,23
Pertambangan & Penggalian Mining & Quarrying
117,93 118,07 116,44 118,14
Industri/Manufacturing 132,01 132,70 134,28 135,05
Impor/Imports 127,23 127,65 128,62 128,23
Ekspor/Exports 127,54 135,17 135,33 136,65
Umum/General 146,07 148,17 149,79 151,11
Umum tanpa impor & eksporGeneral exclude imports & exports
157,80 158,48 160,77 162,59
Lanjutan Tabel 9.11/Continued Table 9.11
Kelompok KomoditiCommodity Groups
2015 2016
Des/Dec Jan/Jan Feb/Feb Mar/Mar
Pertanian/Agriculture 303,63 311,56 316,03 351,30
Pertambangan & Penggalian Mining & Quarrying
119,17 119,30 118,50 118,89
Industri/Manufacturing 130,55 131,31 130,85 131,74
Impor/Imports 133,52 128,36 125,17 125,01
Ekspor/Exports 128,73 125,29 122,93 122,76
Umum/General 143,34 142,70 141,71 144,78
Umum tanpa impor & eksporGeneral exclude imports & exports
152,76 152,88 157,97
Catatan: 1) Mulai November 2013 menggunakan tahun dasar 2010 (2010=100)Note: 1) Starting November 2013 using 2010 as base year (2010=100)
http
://w
ww
.bps
.go.
id
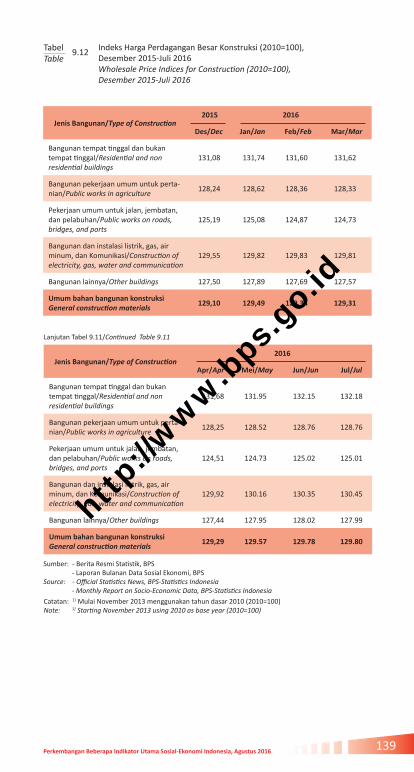
139Perkembangan Beberapa Indikator Utama Sosial-Ekonomi Indonesia, Agustus 2016
Indeks Harga Perdagangan Besar Konstruksi (2010=100), Desember 2015-Juli 2016 Wholesale Price Indices for Construction (2010=100), Desember 2015-Juli 2016
TabelTable
9.12
Lanjutan Tabel 9.11/Continued Table 9.11
Jenis Bangunan/Type of Construction 2016
Apr/Apr Mei/May Jun/Jun Jul/Jul
Bangunan tempat tinggal dan bukan tempat tinggal/Residential and non residential buildings
131,68 131.95 132.15 132.18
Bangunan pekerjaan umum untuk perta-nian/Public works in agriculture
128,25 128.52 128.76 128.76
Pekerjaan umum untuk jalan, jembatan, dan pelabuhan/Public works on roads, bridges, and ports
124,51 124.73 125.02 125.01
Bangunan dan instalasi listrik, gas, air minum, dan Komunikasi/Construction of electricity, gas, water and communication
129,92 130.16 130.35 130.45
Bangunan lainnya/Other buildings 127,44 127.95 128.02 127.99
Umum bahan bangunan konstruksiGeneral construction materials
129,29 129.57 129.78 129.80
Sumber: - Berita Resmi Statistik, BPS - Laporan Bulanan Data Sosial Ekonomi, BPSSource: - Official Statistics News, BPS-Statistics Indonesia - Monthly Report on Socio-Economic Data, BPS-Statistics Indonesia
Jenis Bangunan/Type of Construction 2015 2016
Des/Dec Jan/Jan Feb/Feb Mar/Mar
Bangunan tempat tinggal dan bukan tempat tinggal/Residential and non residential buildings
131,08 131,74 131,60 131,62
Bangunan pekerjaan umum untuk perta-nian/Public works in agriculture
128,24 128,62 128,36 128,33
Pekerjaan umum untuk jalan, jembatan, dan pelabuhan/Public works on roads, bridges, and ports
125,19 125,08 124,87 124,73
Bangunan dan instalasi listrik, gas, air minum, dan Komunikasi/Construction of electricity, gas, water and communication
129,55 129,82 129,83 129,81
Bangunan lainnya/Other buildings 127,50 127,89 127,69 127,57
Umum bahan bangunan konstruksiGeneral construction materials
129,10 129,49 129,34 129,31
Catatan: 1) Mulai November 2013 menggunakan tahun dasar 2010 (2010=100)Note: 1) Starting November 2013 using 2010 as base year (2010=100)
http
://w
ww
.bps
.go.
id
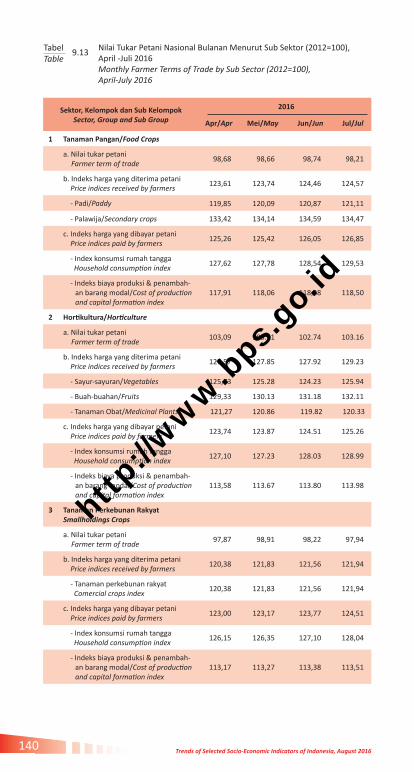
Trends of Selected Socio-Economic Indicators of Indonesia, August 2016140
Nilai Tukar Petani Nasional Bulanan Menurut Sub Sektor (2012=100), April -Juli 2016Monthly Farmer Terms of Trade by Sub Sector (2012=100), April-July 2016
TabelTable
9.13
Sektor, Kelompok dan Sub KelompokSector, Group and Sub Group
2016
Apr/Apr Mei/May Jun/Jun Jul/Jul
1 Tanaman Pangan/Food Crops
a. Nilai tukar petaniFarmer term of trade
98,68 98,66 98,74 98,21
b. Indeks harga yang diterima petani Price indices received by farmers
123,61 123,74 124,46 124,57
- Padi/Paddy 119,85 120,09 120,87 121,11
- Palawija/Secondary crops 133,42 134,14 134,59 134,47
c. Indeks harga yang dibayar petani Price indices paid by farmers
125,26 125,42 126,05 126,85
- Index konsumsi rumah tangga Household consumption index
127,62 127,78 128,54 129,53
- Indeks biaya produksi & penambah-an barang modal/Cost of production and capital formation index
117,91 118,06 118,28 118,50
2 Hortikultura/Horticulture
a. Nilai tukar petaniFarmer term of trade
103,09 103.21 102.74 103.16
b. Indeks harga yang diterima petani Price indices received by farmers
127,57 127.85 127.92 129.23
- Sayur-sayuran/Vegetables 125,73 125.28 124.23 125.94
- Buah-buahan/Fruits 129,33 130.13 131.18 132.11
- Tanaman Obat/Medicinal Plants 121,27 120.86 119.82 120.33
c. Indeks harga yang dibayar petani Price indices paid by farmers
123,74 123.87 124.51 125.26
- Index konsumsi rumah tangga Household consumption index
127,10 127.23 128.03 128.99
- Indeks biaya produksi & penambah-an barang modal/Cost of production and capital formation index
113,58 113.67 113.80 113.98
3 Tanaman Perkebunan RakyatSmallholdings Crops
a. Nilai tukar petaniFarmer term of trade
97,87 98,91 98,22 97,94
b. Indeks harga yang diterima petani Price indices received by farmers
120,38 121,83 121,56 121,94
- Tanaman perkebunan rakyat Comercial crops index
120,38 121,83 121,56 121,94
c. Indeks harga yang dibayar petani Price indices paid by farmers
123,00 123,17 123,77 124,51
- Index konsumsi rumah tangga Household consumption index
126,15 126,35 127,10 128,04
- Indeks biaya produksi & penambah-an barang modal/Cost of production and capital formation index
113,17 113,27 113,38 113,51
http
://w
ww
.bps
.go.
id

141Perkembangan Beberapa Indikator Utama Sosial-Ekonomi Indonesia, Agustus 2016
Lanjutan Tabel 9.13/Continued Table 9.13
Sektor, Kelompok dan Sub KelompokSector, Group and Sub Group
2016
Apr/Apr Mei/May Jun/Jun Jul/Jul
4 Peternakan/Livestock
a. Nilai tukar petani Farmer term of trade
106,55 106,86 107,45 107,79
b. Indeks harga yang diterima petani Price indices received by farmers
125,89 126,27 127,40 128,29
- Ternak besar/Cattle milch 127,74 128,14 129,19 130,18
- Ternak kecil/Small livestock 122,25 121,99 122,68 123,58
- Unggas/Poultry 123,93 124,98 126,90 127,95
- Hasil ternak/Livestock 121,52 121,72 123,19 123,45
c. Indeks harga yang dibayar petani Price indices paid by farmers
118,16 118,16 118,57 119,02
- Index konsumsi rumah tangga Household consumption index
127,21 127,36 128,06 129,04
- Indeks biaya produksi & penambahan barang modal/Cost of production and capital formation index
110,08 109,93 110,11 110,12
5 Perikanan/Fisheries
a. Nilai tukar Nelayan dan pembudidayaan ikan/Fisherman and fish farmer term of trade
102,43 103,13 103.05 103.13
b. Indeks harga yang diterima nelayan dan pembudidaya ikan/Price indices received by fisherman and fish farmers
124,32 124.61 125.80 126.56
- Penangkapan/Fishery 129,33 129,73 131,35 132,51
- Budidaya/Water pond culture 120,74 120,94 121,83 122,32
c. Indeks harga yang dibayar Nelayan dan pembudidayaan/Price indices paid by fisherman and fish farmers
121,38 121,49 122,08 122,73
- Index konsumsi rumah tangga Household consumption index
127,30 127,45 128,31 129,25
- Indeks biaya produksi & penambahan barang modal/Cost of production and capital formation index
111,50 111,52 111,66 111,83
Nasional/National
a. Nilai tukar petaniFarmer term of trade
101,22 101,55 101,47 101,39
b. Indeks harga yang diterima petani Price Indices received by farmers
124,18 124,70 125,18 125,78
c. Indeks harga yang dibayar petani Price Indices paid by farmers
122,68 122,80 123,37 124,06
- Indeks konsumsi rumah tangga Household consumption index
127,08 127,24 128,00 128,97
- Indeks biaya produksi & penambahan barang modal/Cost of production and capital formation index
113,97 114,02 114,19 114,33
Sumber: - Berita Resmi Statistik, BPS - Laporan Bulanan Data Sosial Ekonomi, BPSSource: - Official Statistics News, BPS-Statistics Indonesia - Monthly Report on Socio-Economic Data, BPS-Statistics Indonesia Catatan: 1) Mulai bulan November 2013, tahun dasar berubah menjadi (2012=100) -Note: 1) Start in November 2013, the base year changed into (2012=100)
http
://w
ww
.bps
.go.
id

Trends of Selected Socio-Economic Indicators of Indonesia, August 2016142
Nilai Tukar Petani Nasional Bulanan di 33 Provinsi (2012=100), April -Juli 2016 Monthly Farmers Terms of Trade in 33 Province (2012=100), April-July 2016
TabelTable
9.14
Provinsi Province
2016
AprilApril
MeiMay
JuniJune
JuliJuly
Aceh 96,15 96,92 95,83 95,20
Sumatera Utara 100,80 100,91 99,84 99,08
Sumatera Barat 98,76 98,55 97,37 96,91
Riau 99,41 99,78 98,11 97,41
Jambi 98,62 99,18 98,60 98,19
Sumatera Selatan 94,55 99,57 99,18 98,15
Bengkulu 94,05 94,90 93,84 93,06
Lampung 103,54 103,21 103,74 102,01
Kepulauan Bangka Belitung 103,65 94,91 92,86 91,64
Kepulauan Riau 98,66 104,13 104,59 104,25
DKI Jakarta 100,61 101,67 101,25 101,24
Jawa Barat 104,67 104,29 104,08 104,32
Jawa Tengah 98,99 102,03 101,54 101,32
DI Yogyakarta 102,90 99,86 99,64 99,93
Jawa Timur 103,83 103,21 103,84 104,57
Banten 103,42 104,28 104,59 104,56
Bali 104,81 105,94 106,58 106,67
Nusa Tenggara Barat 103,58 103,81 104,14 104,71
Nusa Tenggara Timur 100,02 100,08 100,67 100,46
Kalimantan Barat 95,64 96,72 96,02 95,21
Kalimantan Tengah 96,92 97,73 98,12 97,92
Kalimantan Selatan 97,54 97,22 97,04 96,69
Kalimantan Timur 98,02 98,27 98,50 98,16
Sulawesi Utara 97,14 96,63 97,00 96,93
Sulawesi Tengah 99,48 105,69 105,57 105,32
Sulawesi Selatan 104,01 99,91 100,62 100,59
Sulawesi Tenggara 98,62 103,90 104,19 104,60
Gorontalo 104,82 106,61 107,51 107,14
Sulawesi Barat 106,65 99,55 100,65 100,64
Maluku 103,96 103,50 103,01 103,14
Maluku Utara 105,34 104,64 104,15 103,34
Papua Barat 100,45 96,24 97,13 96,77
Papua 96,14 99,94 100,44 100,59
Indonesia 101,22 101,55 101,47 101,39
Sumber: Berita Resmi Statistik, BPSSource: Official Statistics News, BPS-Statistics Indonesia
http
://w
ww
.bps
.go.
id

143Perkembangan Beberapa Indikator Utama Sosial-Ekonomi Indonesia, Agustus 2016
Indeks Tendensi Bisnis Menurut Sektor, Triwulan II 2016 Business Tendency Indices by Sector, Quarter II 2016
TabelTable
9.15
Indeks Tendensi Konsumen Menurut Variabel Pembentuknya,Triwulan II/2015-Triwulan II/2016 Consumer Tendency Indices by Main Variables, Quarter II/2015-Quarter II/2016
TabelTable
9.16
Variabel Pembentuk/Main Variables II/2015 III/2015 IV/2015 I/2016 II/2016
Pendapatan rumah tanggaHousehold income
104,39 108,44 103,14 102,43 104,97
Kaitan inflasi dengan konsumsi makanan sehari-hari/Influence of inflation to daily food consumption
105,69 108,05 101,89 103,83 110,37
Tingkat konsumsi beberapa komoditi makanan (daging, ikan, susu, buah-buahan) dan bukan makanan (pakaian, perumahan, pendidikan, transportasi, kesehatan dan rekreasi)Consumption rate of food commodi-ties (meat, fish, milk, fruits) and non food commodities (clothes, housing, transportation, health, recreation)
106,59 111,56 102,99 102,80 111,87
Indeks Tendensi Konsumen Consumer Tendency Indices
105,22 109,00 102,77 102,89 107,93
Sumber: Berita Resmi Statistik, BPSSource: Official Statistics News, BPS-Statistics Indonesia
Sumber: Berita Resmi Statistik, BPSSource: Official Statistics News, BPS-Statistics Indonesia
Sektor/Sector II/2016
Pertanian, Kehutanan & Perikanan/ Agricultural,Forestry and Fisheries 111.02
Pertambangan dan Penggalian/ Mining and Quarrying 96.59
Industri Pengolahan/ Manufacturing Industries 110.13
Pengadaan Listrik dan Gas/ Electricity and Gas 110.24
Pengadaan Air/ Water Supply 108.74
Konstruksi/ Construction 105.5
Perdagangan Besar dan Eceran, Reparasi Mobil dan Sepeda motorWholesale and Retail Trade; Repair of Motor Vehicles and Motorcycles
113.73
Transportasi dan Pergudangan/ Transportation and Storage 110.64
Penyediaan Akomodasi dan Makan MinumAccomodation and Food Service Activities
110.64
Informasi dan Komunikasi/ Information and Communication 118.37
Jasa Keuangan dan Asuransi/ Financial and Insurance Activities 111.37
Real Estat/ Real Estate Activities 109.94
Jasa Perusahaan/ Business Activities 110.09
Administrasi Pemerintahan, Pertahanan dan Jaminan Sosial WajibPublicAdministration and Defence; Compulsory Social Security
108.22
Jasa Pendidikan/ Education 111.76
Jasa Kesehatan dan Kegiatan Sosial/ Human Health and Social Work Activities 108.11
Jasa Lainnya/ Other Services Activities 109.89
Indeks Tendensi Bisnis/ Business Tendency Indices 110.24
http
://w
ww
.bps
.go.
id

Trends of Selected Socio-Economic Indicators of Indonesia, August 2016144
http
://w
ww
.bps
.go.
id
PENDAPATAN NASIONAL DAN REGIONAL
NATIONAL AND REGIONAL INCOME
10http://boossan.blogspot.co.id/2014/03/tips-hemat-ala-mahasiswa.html
http
://w
ww
.bps
.go.
id

Trends of Selected Socio-Economic Indicators of Indonesia, August 2016146
http
://w
ww
.bps
.go.
id
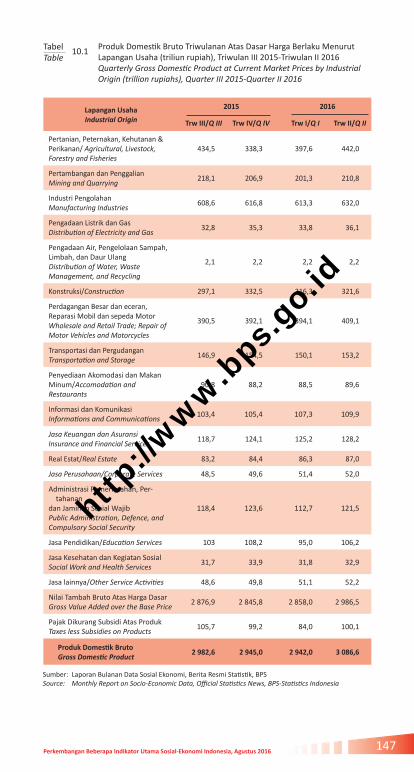
147Perkembangan Beberapa Indikator Utama Sosial-Ekonomi Indonesia, Agustus 2016
Produk Domestik Bruto Triwulanan Atas Dasar Harga Berlaku Menurut Lapangan Usaha (triliun rupiah), Triwulan III 2015-Triwulan II 2016 Quarterly Gross Domestic Product at Current Market Prices by IndustrialOrigin (trillion rupiahs), Quarter III 2015-Quarter II 2016
TabelTable
10.1
Lapangan UsahaIndustrial Origin
2015 2016
Trw III/Q III Trw IV/Q IV Trw I/Q I Trw II/Q II
Pertanian, Peternakan, Kehutanan & Perikanan/ Agricultural, Livestock, Forestry and Fisheries
434,5 338,3 397,6 442,0
Pertambangan dan PenggalianMining and Quarrying
218,1 206,9 201,3 210,8
Industri PengolahanManufacturing Industries
608,6 616,8 613,3 632,0
Pengadaan Listrik dan GasDistribution of Electricity and Gas
32,8 35,3 33,8 36,1
Pengadaan Air, Pengelolaan Sampah, Limbah, dan Daur UlangDistribution of Water, WasteManagement, and Recycling
2,1 2,2 2,2 2,2
Konstruksi/Construction 297,1 332,5 316,3 321,6
Perdagangan Besar dan eceran, Reparasi Mobil dan sepeda MotorWholesale and Retail Trade; Repair ofMotor Vehicles and Motorcycles
390,5 392,1 394,1 409,1
Transportasi dan PergudanganTransportation and Storage
146,9 154,5 150,1 153,2
Penyediaan Akomodasi dan Makan Minum/Accomodation and Restaurants
90,8 88,2 88,5 89,6
Informasi dan KomunikasiInformations and Communications
103,4 105,4 107,3 109,9
Jasa Keuangan dan AsuransiInsurance and Financial Services
118,7 124,1 125,2 128,2
Real Estat/Real Estate 83,2 84,4 86,3 87,0
Jasa Perusahaan/Corporate Services 48,5 49,6 51,4 52,0
Administrasi Pemerintahan, Per-tahanan
dan Jaminan Sosial WajibPublic Administration, Defence, andCompulsory Social Security
118,4 123,6 112,7 121,5
Jasa Pendidikan/Education Services 103 108,2 95,0 106,2
Jasa Kesehatan dan Kegiatan Sosial Social Work and Health Services
31,7 33,9 31,8 32,9
Jasa lainnya/Other Service Activities 48,6 49,8 51,1 52,2
Nilai Tambah Bruto Atas Harga DasarGross Value Added over the Base Price
2 876,9 2 845,8 2 858,0 2 986,5
Pajak Dikurang Subsidi Atas ProdukTaxes less Subsidies on Products
105,7 99,2 84,0 100,1
Produk Domestik BrutoGross Domestic Product
2 982,6 2 945,0 2 942,0 3 086,6
Sumber: Laporan Bulanan Data Sosial Ekonomi, Berita Resmi Statistik, BPSSource: Monthly Report on Socio-Economic Data, Official Statistics News, BPS-Statistics Indonesia
http
://w
ww
.bps
.go.
id

Trends of Selected Socio-Economic Indicators of Indonesia, August 2016148
Produk Domestik Bruto Triwulanan Atas Dasar Harga Konstan 2010Menurut Lapangan Usaha (triliun rupiah), Triwulan III 2015-Triwulan II 2016Quarterly Gross Domestic Product at 2010 Constant Market Prices by Industrial Origin (trillion rupiahs), Quarter III 2015-Quarter II 2016
TabelTable
10.2
Lapangan UsahaIndustrial Origin
2015 2016
Trw III/Q III Trw IV/Q IV Trw I/Q I Trw II/Q II
Pertanian, Peternakan, Kehutanan & Perikanan/ Agricultural, Livestock, Forestry and Fisheries
327,9 251,6 287,9 322,0
Pertambangan dan PenggalianMining and Quarrying
186,6 189,6 189,0 185.2
Industri PengolahanManufacturing Industries
488,8 491,0 489,5 507.5
Pengadaan Listrik dan GasDistribution of Electricity and Gas
23,5 24,9 24,4 25.2
Pengadaan Air, Pengelolaan Sampah, Limbah, dan Daur UlangDistribution of Water, WasteManagement, and Recycling
1,8 1,9 1,9 1.9
Konstruksi/Construction 223,6 237,9 223,0 226.5
Perdagangan Besar dan eceran, Reparasi Mobil dan sepeda MotorWholesale and Retail Trade; Repair ofMotor Vehicles and Motorcycles
307,0 303,6 303,4 315.0
Transportasi dan PergudanganTransportation and Storage
91,1 90,7 89,3 91.7
Penyediaan Akomodasi dan Makan Minum/Accomodation and Restaurants
67,9 69,1 69,2 70.0
Informasi dan KomunikasiInformations and Communications
107,6 109,4 110,5 113.0
Jasa Keuangan dan AsuransiInsurance and Financial Services
88,4 91,7 92,0 93.8
Real Estat/Real Estate 67,7 68,2 69,4 69.8
Jasa Perusahaan/Corporate Services 37,5 38,1 39,0 39.5
Administrasi Pemerintahan, Pertahanandan Jaminan Sosial WajibPublic Administration, Defence, andCompulsory Social Security
76,4 84,8 78,2 78.3
Jasa Pendidikan/Education Services 72,2 77,6 69,1 73.5
Jasa Kesehatan dan Kegiatan Sosial Social Work and Health Services
24,7 26,4 25,0 25.3
Jasa lainnya/Other Service Activities 36,6 37,3 37,9 38.7
Nilai Tambah Bruto Atas Harga DasarGross Value Added over the Base Price
2229,3 2193,8 2 197.7 2 276.9
Pajak Dikurang Subsidi Atas ProdukTaxes less Subsidies on Products
81,9 76,6 64,6 76.3
Produk Domestik BrutoGross Domestic Product
2 311,2 2 270,4 2 262.3 2 353.2
Sumber: Laporan Bulanan Data Sosial Ekonomi, Berita Resmi Statistik, BPSSource: Monthly Report on Socio-Economic Data, Official Statistics News, BPS-Statistics Indonesia
http
://w
ww
.bps
.go.
id
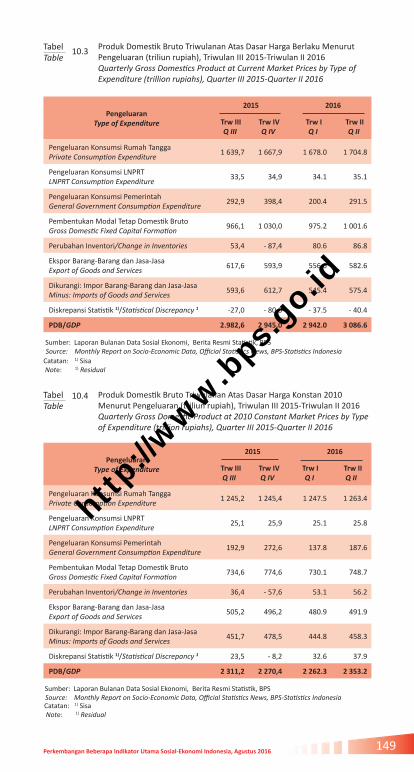
149Perkembangan Beberapa Indikator Utama Sosial-Ekonomi Indonesia, Agustus 2016
Produk Domestik Bruto Triwulanan Atas Dasar Harga Berlaku Menurut Pengeluaran (triliun rupiah), Triwulan III 2015-Triwulan II 2016Quarterly Gross Domestics Product at Current Market Prices by Type of Expenditure (trillion rupiahs), Quarter III 2015-Quarter II 2016
TabelTable
10.3
Produk Domestik Bruto Triwulanan Atas Dasar Harga Konstan 2010 Menurut Pengeluaran (triliun rupiah), Triwulan III 2015-Triwulan II 2016Quarterly Gross Domestic Product at 2010 Constant Market Prices by Type of Expenditure (trillion rupiahs), Quarter III 2015-Quarter II 2016
TabelTable
10.4
Sumber: Laporan Bulanan Data Sosial Ekonomi, Berita Resmi Statistik, BPS Source: Monthly Report on Socio-Economic Data, Official Statistics News, BPS-Statistics Indonesia
Catatan: 1) Sisa Note: 1) Residual
Pengeluaran Type of Expenditure
2015 2016
Trw III Q III
Trw IV Q IV
Trw I Q I
Trw II Q II
Pengeluaran Konsumsi Rumah TanggaPrivate Consumption Expenditure
1 639,7 1 667,9 1 678.0 1 704.8
Pengeluaran Konsumsi LNPRTLNPRT Consumption Expenditure
33,5 34,9 34.1 35.1
Pengeluaran Konsumsi PemerintahGeneral Government Consumption Expenditure
292,9 398,4 200.4 291.5
Pembentukan Modal Tetap Domestik BrutoGross Domestic Fixed Capital Formation
966,1 1 030,0 975.2 1 001.6
Perubahan Inventori/Change in Inventories 53,4 - 87,4 80.6 86.8
Ekspor Barang-Barang dan Jasa-JasaExport of Goods and Services
617,6 593,9 556.6 582.6
Dikurangi: Impor Barang-Barang dan Jasa-JasaMinus: Imports of Goods and Services
593,6 612,7 545.4 575.4
Diskrepansi Statistik 1)/Statistical Discrepancy 1 -27,0 - 80,0 - 37.5 - 40.4
PDB/GDP 2.982,6 2 945,0 2 942.0 3 086.6
Sumber: Laporan Bulanan Data Sosial Ekonomi, Berita Resmi Statistik, BPS Source: Monthly Report on Socio-Economic Data, Official Statistics News, BPS-Statistics Indonesia
Catatan: 1) Sisa Note: 1) Residual
Pengeluaran Type of Expenditure
2015 2016
Trw III Q III
Trw IV Q IV
Trw I Q I
Trw II Q II
Pengeluaran Konsumsi Rumah TanggaPrivate Consumption Expenditure
1 245,2 1 245,4 1 247.5 1 263.4
Pengeluaran Konsumsi LNPRTLNPRT Consumption Expenditure
25,1 25,9 25.1 25.8
Pengeluaran Konsumsi PemerintahGeneral Government Consumption Expenditure
192,9 272,6 137.8 187.6
Pembentukan Modal Tetap Domestik BrutoGross Domestic Fixed Capital Formation
734,6 774,6 730.1 748.7
Perubahan Inventori/Change in Inventories 36,4 - 57,6 53.1 56.2
Ekspor Barang-Barang dan Jasa-JasaExport of Goods and Services
505,2 496,2 480.9 491.9
Dikurangi: Impor Barang-Barang dan Jasa-JasaMinus: Imports of Goods and Services
451,7 478,5 444.8 458.3
Diskrepansi Statistik 1)/Statistical Discrepancy 1 23,5 - 8,2 32.6 37.9
PDB/GDP 2 311,2 2 270,4 2 262.3 2 353.2
http
://w
ww
.bps
.go.
id

Trends of Selected Socio-Economic Indicators of Indonesia, August 2016150
Produk Domestik Bruto Atas Dasar Harga Berlaku Menurut Lapangan Usaha (miliar rupiah), 2013-2015 Gross Domestic Product at Current Market Prices by Industrial Origin (billion rupiahs), 2013-2015
TabelTable
10.5
Sumber: Pendapatan Nasional Indonesia, BPSSource: National Income of Indonesia, BPS-Statistics Indonesia
Lapangan Usaha/Industrial Origin 2013 2014 2015
Pertanian, Peternakan, Kehutanan & Perikanan/ Agricultural, Livestock, Forestry and Fisheries
1 275 048,4 1 409 655,7 1 560 399,3
Pertambangan dan PenggalianMining and Quarrying
1 042 975,9 1 042 900,9 879 399,6
Industri PengolahanManufacturing Industries
1 998 693,7 2 219 441,4 2 405 408,9
Pengadaan Listrik dan GasDistribution of Electricity and Gas
98 686,8 114 617,9 131 264,2
Pengadaan Air, Pengelolaan Sampah, Limbah, dan Daur UlangDistribution of Water, WasteManagement, and Recycling
7 154,9 7 887,1 8 606,0
Konstruksi/Construction 905 990,5 1 1 041 949,5 1 193 346,1
Perdagangan Besar dan eceran, Reparasi Mobil dan sepeda MotorWholesale and Retail Trade; Repair ofMotor Vehicles and Motorcycles
1 263 815,4 1 420 054,3 1 534 067,3
Transportasi dan PergudanganTransportation and Storage
368 678,6 466 968,9 578 963,9
Penyediaan Akomodasi dan Makan Minum/Accomodation and Restaurants
289 498,3 321 062,1 341 790,2
Informasi dan KomunikasiInformations and Communications
341 009,4 369 415,0 406 887,6
Jasa Keuangan dan AsuransiInsurance and Financial Services
368 876,9 408 438,8 464 734,6
Real Estat/Real Estate 264 275,0 294 573,4 329 796,9
Jasa Perusahaan/Corporate Services 144 604,1 165 990,6 190 267,9
Administrasi Pemerintahan, Pertahanandan Jaminan Sosial WajibPublic Administration, Defence, andCompulsory Social Security
371 208,9 404 629,6 450 733,1
Jasa Pendidikan/Education Services 309 438,5 342 063,2 388 682,6
Jasa Kesehatan dan Kegiatan Sosial Social Work and Health Services
96 666,9 109 147,2 123 410,3
Jasa lainnya/Other Service Activities 140 311,9 163 548,8 190 579,5
Nilai Tambah Bruto Atas Harga DasarGross Value Added over the Base Price
9 286 934,1
10 302 344,4 11 178 338,0
Pajak Dikurang Subsidi Atas ProdukTaxes less Subsidies on Products
237 802,4 263 472,9 362 451,8
Produk Domestik BrutoGross Domestic Product
9 524 736,5 10 565 817,3 11 540 789,8
http
://w
ww
.bps
.go.
id

151Perkembangan Beberapa Indikator Utama Sosial-Ekonomi Indonesia, Agustus 2016
Produk Domestik Bruto Atas Dasar Harga Konstan 2010 Menurut Lapangan Usaha (miliar rupiah), 2013-2015 Gross Domestic Product at 2010 Constant Market Prices by Industrial Origin (billion rupiahs), 2013-2015
TabelTable
10.6
Sumber: Pendapatan Nasional Indonesia, BPSSource: National Income of Indonesia, BPS-Statistics Indonesia
Lapangan Usaha/Industrial Origin 2013 2014 2015
Pertanian, Peternakan, Kehutanan & Perikanan/ Agricultural, Livestock, Forestry and Fisheries
1 083 141,8 1 129 052,7 1 174 456,8
Pertambangan dan PenggalianMining and Quarrying
785 016,3 796 711,6 756 239,2
Industri PengolahanManufacturing Industries
1 774 097,3 1 853 688,2 1 932 457,4
Pengadaan Listrik dan GasDistribution of Electricity and Gas
88 805,1 93 755,9 94 894,8
Pengadaan Air, Pengelolaan Sampah, Limbah, dan Daur UlangDistribution of Water, WasteManagement, and Recycling
6 587,1 6 923,5 7 420,2
Konstruksi/Construction 772 719,6 826 615,6 881 583,9
Perdagangan Besar dan eceran, Reparasi Mobil dan sepeda MotorWholesale and Retail Trade; Repair ofMotor Vehicles and Motorcycles
1 118 207,0 1 177 048,6 1 206 074,7
Transportasi dan PergudanganTransportation and Storage
308 521,2 326 933,0 348 775,6
Penyediaan Akomodasi dan Makan Minum/Accomodation and Restaurants
243 748,3 257 815,5 269 054,5
Informasi dan KomunikasiInformations and Communications
349 150,2 384 407,4 423 063,5
Jasa Keuangan dan AsuransiInsurance and Financial Services
306 432,2 319 825,5 347 095,7
Real Estat/Real Estate 244 237,5 256 440,2 268 811,4
Jasa Perusahaan/Corporate Services 125 490,7 137 795,3 148 395,5
Administrasi Pemerintahan, Pertahanandan Jaminan Sosial WajibPublic Administration, Defence, andCompulsory Social Security
288 963,3 296 329,7 310 393,9
Jasa Pendidikan/Education Services 251 784,6 263 889,6 283 540,0
Jasa Kesehatan dan Kegiatan Sosial Social Work and Health Services
84 518,4 91 357,1 97 840,8
Jasa lainnya/Other Service Activities 123 088,8 134 070,1 144 902,4
Nilai Tambah Bruto Atas Harga DasarGross Value Added over the Base Price
7 954 509,4 8 352 659,5 8 695 000,3
Pajak Dikurang Subsidi Atas ProdukTaxes less Subsidies on Products
203 684,3 213 611,7 281 931,2
Produk Domestik BrutoGross Domestic Product
8 158 193,7 8 566 271,2 8 976 931,5
http
://w
ww
.bps
.go.
id

Trends of Selected Socio-Economic Indicators of Indonesia, August 2016152
Produk Domestik Bruto Atas Dasar Harga Berlaku Menurut Jenis Pengeluaran (miliar rupiah), 2013-2015 Gross Domestic Product at Current Market Prices by Type of Expenditure (billion rupiahs), 2013-2015
TabelTable
10.7
Sumber: Pendapatan Nasional Indonesia, BPSSource: National Income of Indonesia, BPS-Statistics IndonesiaCatatan: *) Angka sementara **) Angka sangat sementara 1) Sisa Note: *) Preliminary figures **) Very preliminary figures 1) Residual
Jenis Pengeluaran/Type of Expenditure 2013 2014 *) 2015 **)
Pengeluaran Konsumsi Rumah TanggaPrivate Consumption Expenditure
5 321 087,6 5 915 741,7 6 453 205,5
Pengeluaran Konsumsi LNPRTLNPRT Consumption Expenditure
103 929,0 124 242,0 130 936,0
Pengeluaran Konsumsi PemerintahGovernment Consumption Expenditure
908 574,3 996 197,4 1 125 542,4
Pembentukan Modal Tetap Domestik BrutoGross Domestic Fixed Capital Formation
3 051 496,2 3 442 026,9 3 829 978,4
Perubahan Inventori/Change in Inventories 178 090,5 210 407,1 158 753,9
Ekspor Barang-Barang dan Jasa-JasaExport of Goods and Services
2 283 776,7 2 497 116,4 2 434 180,6
Dikurangi: Impor Barang-Barang dan Jasa-JasaMinus: Imports of Goods and Services
2 359 212,1 2 580 527,1 2 405 762,4
Diskrepansi Statistik 1)/Statistical Discrepancy 1 58 391,9 - 39 387,1 - 186 044,6
Produk Domestik Bruto/Gross Domestic Product 9 546 134,0 10 565 817,3 11 540 789,8
Produk Domestik Bruto Atas Dasar Harga Konstan 2010 Menurut Jenis Pengeluaran (miliar rupiah), 2013-2015 Gross Domestic Product at 2010 Constant Market Prices by Type of Expenditure (billion rupiahs), 2013-2015
TabelTable
10.8
Sumber: Pendapatan Nasional Indonesia, BPSSource: National Income of Indonesia, BPS-Statistics Indonesia
Jenis Pengeluaran/Type of Expenditure 2013 2014 *) 2015 **)
Pengeluaran Konsumsi Rumah TanggaPrivate Consumption Expenditure
4 423 416,9 4 651 480,2 4 882 258,7
Pengeluaran Konsumsi LNPRTLNPRT Consumption Expenditure
88 618,0 99 420,0 98 789,0
Pengeluaran Konsumsi PemerintahGovernment Consumption Expenditure
727 812,1 736 283,1 775 925,1
Pembentukan Modal Tetap Domestik BrutoGross Domestic Fixed Capital Formation
2 654 375,0 2 775 733,6 2 916 601,6
Perubahan Inventori/Change in Inventories 124 453,6 156 720,3 112 847,9
Ekspor Barang-Barang dan Jasa-JasaExport of Goods and Services
2 026 113,7 2 046 296,2 2 005 945,0
Dikurangi: Impor Barang-Barang dan Jasa-JasaMinus: Imports of Goods and Services
1 945 867,3 1 988 537,2 1 872 353,5
Diskrepansi Statistik 1)/Statistical Discrepancy 1 57 575,9 88 875,0 56 917,6
Produk Domestik Bruto/Gross Domestic Product 8 156 497,8 8 566 271,2 8 976 931,5
Catatan: *) Angka sementara **) Angka sangat sementara 1) Sisa Note: *) Preliminary figures **) Very preliminary figures 1) Residual
http
://w
ww
.bps
.go.
id
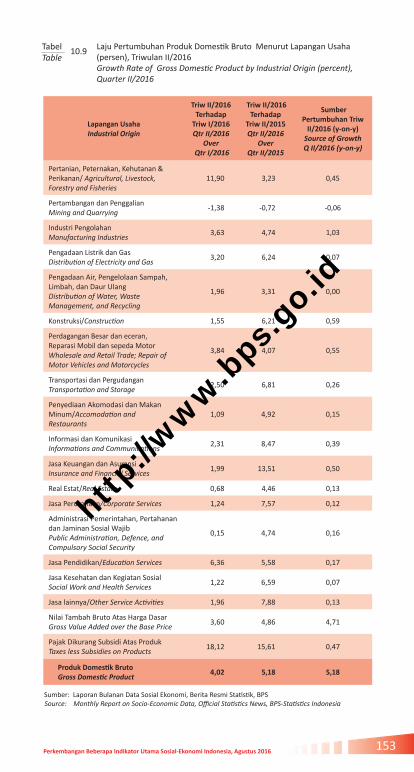
153Perkembangan Beberapa Indikator Utama Sosial-Ekonomi Indonesia, Agustus 2016
Laju Pertumbuhan Produk Domestik Bruto Menurut Lapangan Usaha (persen), Triwulan II/2016 Growth Rate of Gross Domestic Product by Industrial Origin (percent), Quarter II/2016
TabelTable
10.9
Sumber: Laporan Bulanan Data Sosial Ekonomi, Berita Resmi Statistik, BPS Source: Monthly Report on Socio-Economic Data, Official Statistics News, BPS-Statistics Indonesia
Lapangan UsahaIndustrial Origin
Triw II/2016 Terhadap
Triw I/2016 Qtr II/2016
Over Qtr I/2016
Triw II/2016 Terhadap
Triw II/2015Qtr II/2016
Over Qtr II/2015
Sumber Pertumbuhan Triw
II/2016 (y-on-y)Source of Growth Q II/2016 (y-on-y)
Pertanian, Peternakan, Kehutanan & Perikanan/ Agricultural, Livestock, Forestry and Fisheries
11,90 3,23 0,45
Pertambangan dan PenggalianMining and Quarrying
-1,38 -0,72 -0,06
Industri PengolahanManufacturing Industries
3,63 4,74 1,03
Pengadaan Listrik dan GasDistribution of Electricity and Gas
3,20 6,24 0,07
Pengadaan Air, Pengelolaan Sampah, Limbah, dan Daur UlangDistribution of Water, WasteManagement, and Recycling
1,96 3,31 0,00
Konstruksi/Construction 1,55 6,21 0,59
Perdagangan Besar dan eceran, Reparasi Mobil dan sepeda MotorWholesale and Retail Trade; Repair ofMotor Vehicles and Motorcycles
3,84 4,07 0,55
Transportasi dan PergudanganTransportation and Storage
2,50 6,81 0,26
Penyediaan Akomodasi dan Makan Minum/Accomodation and Restaurants
1,09 4,92 0,15
Informasi dan KomunikasiInformations and Communications
2,31 8,47 0,39
Jasa Keuangan dan AsuransiInsurance and Financial Services
1,99 13,51 0,50
Real Estat/Real Estate 0,68 4,46 0,13
Jasa Perusahaan/Corporate Services 1,24 7,57 0,12
Administrasi Pemerintahan, Pertahanandan Jaminan Sosial WajibPublic Administration, Defence, andCompulsory Social Security
0,15 4,74 0,16
Jasa Pendidikan/Education Services 6,36 5,58 0,17
Jasa Kesehatan dan Kegiatan Sosial Social Work and Health Services
1,22 6,59 0,07
Jasa lainnya/Other Service Activities 1,96 7,88 0,13
Nilai Tambah Bruto Atas Harga DasarGross Value Added over the Base Price
3,60 4,86 4,71
Pajak Dikurang Subsidi Atas ProdukTaxes less Subsidies on Products
18,12 15,61 0,47
Produk Domestik BrutoGross Domestic Product
4,02 5,18 5,18
http
://w
ww
.bps
.go.
id
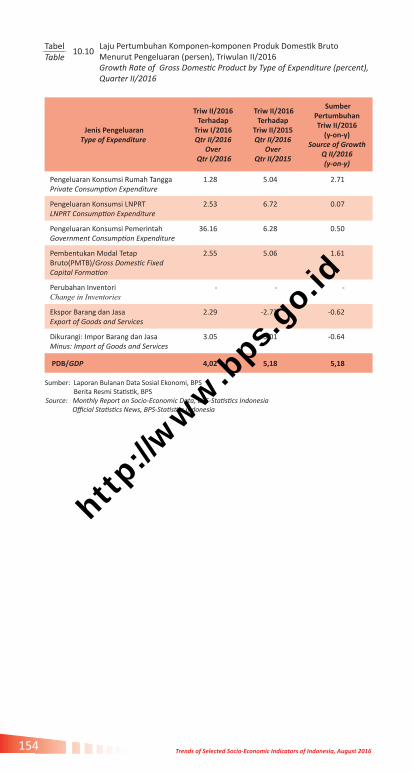
Trends of Selected Socio-Economic Indicators of Indonesia, August 2016154
Laju Pertumbuhan Komponen-komponen Produk Domestik Bruto Menurut Pengeluaran (persen), Triwulan II/2016 Growth Rate of Gross Domestic Product by Type of Expenditure (percent), Quarter II/2016
TabelTable
10.10
Jenis PengeluaranType of Expenditure
Triw II/2016 Terhadap
Triw I/2016 Qtr II/2016
Over Qtr I/2016
Triw II/2016 Terhadap
Triw II/2015Qtr II/2016
Over Qtr II/2015
Sumber Pertumbuhan Triw II/2016
(y-on-y)Source of Growth
Q II/2016(y-on-y)
Pengeluaran Konsumsi Rumah TanggaPrivate Consumption Expenditure
1.28 5.04 2.71
Pengeluaran Konsumsi LNPRTLNPRT Consumption Expenditure
2.53 6.72 0.07
Pengeluaran Konsumsi PemerintahGovernment Consumption Expenditure
36.16 6.28 0.50
Pembentukan Modal Tetap Bruto(PMTB)/Gross Domestic Fixed Capital Formation
2.55 5.06 1.61
Perubahan InventoriChange in Inventories
- - -
Ekspor Barang dan JasaExport of Goods and Services
2.29 -2.73 -0.62
Dikurangi: Impor Barang dan JasaMinus: Import of Goods and Services
3.05 -3.01 -0.64
PDB/GDP 4,02 5,18 5,18
Sumber: Laporan Bulanan Data Sosial Ekonomi, BPS Berita Resmi Statistik, BPS Source: Monthly Report on Socio-Economic Data, BPS-Statistics Indonesia Official Statistics News, BPS-Statistics Indonesia
http
://w
ww
.bps
.go.
id
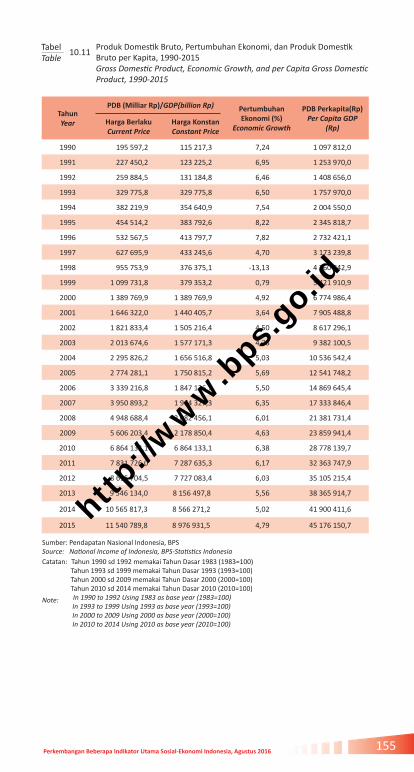
155Perkembangan Beberapa Indikator Utama Sosial-Ekonomi Indonesia, Agustus 2016
Produk Domestik Bruto, Pertumbuhan Ekonomi, dan Produk Domestik Bruto per Kapita, 1990-2015 Gross Domestic Product, Economic Growth, and per Capita Gross Domestic Product, 1990-2015
TabelTable
10.11
Catatan: Tahun 1990 sd 1992 memakai Tahun Dasar 1983 (1983=100) Tahun 1993 sd 1999 memakai Tahun Dasar 1993 (1993=100) Tahun 2000 sd 2009 memakai Tahun Dasar 2000 (2000=100) Tahun 2010 sd 2014 memakai Tahun Dasar 2010 (2010=100)
Note: In 1990 to 1992 Using 1983 as base year (1983=100) In 1993 to 1999 Using 1993 as base year (1993=100) In 2000 to 2009 Using 2000 as base year (2000=100) In 2010 to 2014 Using 2010 as base year (2010=100)
Sumber: Pendapatan Nasional Indonesia, BPS Source: National Income of Indonesia, BPS-Statistics Indonesia
TahunYear
PDB (Milliar Rp)/GDP{billion Rp) Pertumbuhan Ekonomi (%)
Economic Growth
PDB Perkapita(Rp) Per Capita GDP
(Rp)Harga Berlaku Current Price
Harga Konstan Constant Price
1990 195 597,2 115 217,3 7,24 1 097 812,0
1991 227 450,2 123 225,2 6,95 1 253 970,0
1992 259 884,5 131 184,8 6,46 1 408 656,0
1993 329 775,8 329 775,8 6,50 1 757 970,0
1994 382 219,9 354 640,9 7,54 2 004 550,0
1995 454 514,2 383 792,6 8,22 2 345 818,7
1996 532 567,5 413 797,7 7,82 2 732 421,1
1997 627 695,9 433 245,6 4,70 3 173 239,8
1998 955 753,9 376 375,1 -13,13 4 760 842,9
1999 1 099 731,8 379 353,2 0,79 5 421 910,9
2000 1 389 769,9 1 389 769,9 4,92 6 774 986,4
2001 1 646 322,0 1 440 405,7 3,64 7 905 488,8
2002 1 821 833,4 1 505 216,4 4,50 8 617 296,1
2003 2 013 674,6 1 577 171,3 4,78 9 382 100,5
2004 2 295 826,2 1 656 516,8 5,03 10 536 542,4
2005 2 774 281,1 1 750 815,2 5,69 12 541 748,2
2006 3 339 216,8 1 847 126,7 5,50 14 869 645,4
2007 3 950 893,2 1 964 327,3 6,35 17 333 846,4
2008 4 948 688,4 2 082 456,1 6,01 21 381 731,4
2009 5 606 203,4 2 178 850,4 4,63 23 859 941,4
2010 6 864 133,1 6 864 133,1 6,38 28 778 139,7
2011 7 831 726,0 7 287 635,3 6,17 32 363 747,9
2012 8 615 704,5 7 727 083,4 6,03 35 105 215,4
2013 9 546 134,0 8 156 497,8 5,56 38 365 914,7
2014 10 565 817,3 8 566 271,2 5,02 41 900 411,6
2015 11 540 789,8 8 976 931,5 4,79 45 176 150,7ht
tp://w
ww
.bps
.go.
id

Trends of Selected Socio-Economic Indicators of Indonesia, August 2016156
Produk Domestik Regional Bruto dan Peranan PDRB Provinsi Terhadap 33 Provinsi Atas Dasar Harga Berlaku (2010=100), 2014-2015Gross Regional Domestic Product (GRDP) and Provincial GRDP Share to 33 Province at Current Market Prices (2010=100), 2014-2015
TabelTable
10.12
Sumber: Badan Pusat StatistikSource: BPS-Statistics Indonesia
ProvinsiProvince
Produk Domestik Regional Bruto Gross Regional Domestic Product
(triliun Rp/trillion Rp)
Peranan PDRB/GRDP Share (persen/percent)
2014*) 2015**) 2014*) 2015**)
Aceh 128,03 129,20 1,20 1,11
Sumatera Utara 521,96 571,72 4,88 4,91
Sumatera Barat 164,90 178,81 1,54 1,53
Riau 679,39 652,39 6,36 5,60
Jambi 144,81 155,11 1,36 1,33
Sumatera Selatan 306,12 332,73 2,86 2,86
Bengkulu 45,39 50,34 0,42 0,43
Lampung 230.97 253,16 2,16 2,17
Kepulauan Bangka Belitung
56,37 60,99 0,53 0,52
Kepulauan Riau 181,64 203,28 1,70 1,74
DKI Jakarta 1 760,22 1 983,42 16,47 17,02
Jawa Barat 1 386,33 1 525,15 12,97 13,09
Jawa Tengah 925,20 1 014,07 8,66 8,70
DI Yogyakarta 92,83 101,40 0,87 0,87
Jawa Timur 1 539,80 1 689,88 14,41 14,50
Banten 428,47 477,94 4,01 4,10
Bali 156,38 177,17 1,46 1,52
Nusa Tenggara Barat 81,67 102,79 0,76 0,88
Nusa Tenggara Timur 68,60 76,43 0,64 0,66
Kalimantan Barat 132,37 146,89 1,24 1,26
Kalimantan Tengah 89,89 100,15 0,84 0,86
Kalimantan Selatan 127,90 137,52 1,20 1,18
Kalimantan Timur 526,90 501,87 4,93 4,31
Kalimantan Utara 59,57 62,82 0,56 0,54
Sulawesi Utara 80,61 91,28 0,75 0,78
Sulawesi Tengah 90,26 107,60 0,84 0,92
Sulawesi Selatan 299,63 341,75 2,80 2,93
Sulawesi Tenggara 78,61 87,74 0,74 0,75
Gorontalo 25,19 28,54 0,24 0,24
Sulawesi Barat 29,46 33,02 0,28 0,28
Maluku 31,65 34,34 0,30 0,29
Maluku Utara 24,05 26,63 0,23 0,23
Papua Barat 58,21 62,88 0,54 0,54
Papua 133,54 152,13 1,25 1,31
Catatan: *) Angka sementara **) Angka sangat sementara Note: **) Preliminary figures **) Very preliminary figures
http
://w
ww
.bps
.go.
id
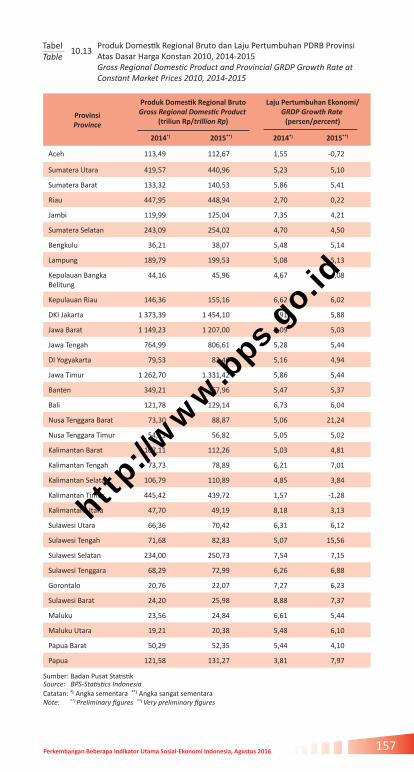
157Perkembangan Beberapa Indikator Utama Sosial-Ekonomi Indonesia, Agustus 2016
Produk Domestik Regional Bruto dan Laju Pertumbuhan PDRB Provinsi Atas Dasar Harga Konstan 2010, 2014-2015 Gross Regional Domestic Product and Provincial GRDP Growth Rate at Constant Market Prices 2010, 2014-2015
TabelTable
10.13
ProvinsiProvince
Produk Domestik Regional Bruto Gross Regional Domestic Product
(triliun Rp/trillion Rp)
Laju Pertumbuhan Ekonomi/GRDP Growth Rate (persen/percent)
2014*) 2015**) 2014*) 2015**)
Aceh 113,49 112,67 1,55 -0,72
Sumatera Utara 419,57 440,96 5,23 5,10
Sumatera Barat 133,32 140,53 5,86 5,41
Riau 447,95 448,94 2,70 0,22
Jambi 119,99 125,04 7,35 4,21
Sumatera Selatan 243,09 254,02 4,70 4,50
Bengkulu 36,21 38,07 5,48 5,14
Lampung 189,79 199,53 5,08 5,13
Kepulauan Bangka Belitung
44,16 45,96 4,67 4,08
Kepulauan Riau 146,36 155,16 6,62 6,02
DKI Jakarta 1 373,39 1 454,10 5,91 5,88
Jawa Barat 1 149,23 1 207,00 5,09 5,03
Jawa Tengah 764,99 806,61 5,28 5,44
DI Yogyakarta 79,53 83,46 5,16 4,94
Jawa Timur 1 262,70 1.331,42 5,86 5,44
Banten 349,21 367,96 5,47 5,37
Bali 121,78 129,14 6,73 6,04
Nusa Tenggara Barat 73,30 88,87 5,06 21,24
Nusa Tenggara Timur 54,11 56,82 5,05 5,02
Kalimantan Barat 107,11 112,26 5,03 4,81
Kalimantan Tengah 73,73 78,89 6,21 7,01
Kalimantan Selatan 106,79 110,89 4,85 3,84
Kalimantan Timur 445,42 439,72 1,57 -1,28
Kalimantan Utara 47,70 49,19 8,18 3,13
Sulawesi Utara 66,36 70,42 6,31 6,12
Sulawesi Tengah 71,68 82,83 5,07 15,56
Sulawesi Selatan 234,00 250,73 7,54 7,15
Sulawesi Tenggara 68,29 72,99 6,26 6,88
Gorontalo 20,76 22,07 7,27 6,23
Sulawesi Barat 24,20 25,98 8,88 7,37
Maluku 23,56 24,84 6,61 5,44
Maluku Utara 19,21 20,38 5,48 6,10
Papua Barat 50,29 52,35 5,44 4,10
Papua 121,58 131,27 3,81 7,97
Sumber: Badan Pusat StatistikSource: BPS-Statistics IndonesiaCatatan: *) Angka sementara **) Angka sangat sementara Note: **) Preliminary figures **) Very preliminary figures
http
://w
ww
.bps
.go.
id

Trends of Selected Socio-Economic Indicators of Indonesia, August 2016158
Kabupaten/Kota dengan Produk Domestik Regional Bruto per Kapita Tertinggi dan Terendah di Tiap Provinsi (juta rupiah), 2014 **) (2000=100) Regencies/Municipalities with the Highest and the Lowest Gross Regional Domestic Product per Capita in Each Province (million Rupiah), 2014 **) (2000=100)
TabelTable
10.14
ProvinsiProvince
Kabupaten/Kota Regencies/
Municipalities
Ter-tinggi
Highest
Kabupaten/Kota Regencies/
Municipalities
Terendah Lowest
Aceh Kota Banda Aceh 56,48 Kab. Aceh Singkil 15,58
Sumatera Utara Kota Medan 67,24 Kab. Nias Barat 13,99
Sumatera Barat Kota Padang Panjang 47,09 Kab. Pesisir Selatan 20,58
Riau Kab. Bengkalis 303,48 Kab. Rokan Hulu 44,26
Jambi Kab. Tanjung Jabung Barat
100,20 Kab. Merangin 27,96
Sumatera Selatan Kab. Musi Banyuasin 87,01 Kab. Empat Lawang 14,78
Bengkulu Kota Bengkulu 42,01 Kab. Seluma 15,79
Lampung Kota Bandar Lampung 36,76 Kab. Lampung Barat 16,02
Kepulauan Bangka Belitung
Kab. Bangka Barat 54,92 Kab. Bangka 33,23
Kepulauan Riau Kab. Kep. Anambas 369,87 Kab. Lingga 32,69
DKI Jakarta Kota Jakarta Pusat 470,85 Kota Jakarta Timur 108,33
Jawa Barat Kab. Bekasi 72,84 Kab. Cianjur 12,83
Jawa Tengah Kab. Kudus 91,94 Kab. Pemalang 13,00
DI Yogyakarta Kota Yogyakarta 60,57 Kab. Kulon Progo 17,42
Jawa Timur Kota Kediri 315,40 Kab. Pamekasan 13,26
Banten Kota Cilegon 173,81 Kab. Lebak 14,98
Bali Kab. Badung 61,50 Kab. Bangli 19,80
Nusa Tenggara Barat Kab. Sumbawa Barat 72,86 Kab. Lombok Timur 11,16
Nusa Tenggara Timur Kota Kupang 39,16 Kab. Sumba Barat Daya 7,71
Kalimantan Barat Kota Pontianak 41,93 Kab. Melawi 17,23
Kalimantan Tengah Kab. Barito Utara 49,96 Kab. Pulang Pisau 26,24
Kalimantan Selatan Kab. Balangan 79,98 Kab. Hulu Sungai Utara 14,60
Kalimantan Timur Kota Bontang 368,24 Kab. Penajam Paser Utara 47,89
Kalimantan Utara Kab. Tana Tidung 200,02 Kota Tarakan 85,65
Sulawesi Utara Kota Manado 53,03 Kab. Kepulauan Talaud 16,42
Sulawesi Tengah Kab. Morowali 68,03 Kab. Banggai Kepulauan 21,75
Sulawesi Selatan Kab. Luwu Timur 75,59 Kab. Gowa 16,92
Sulawesi Tenggara Kab. Kolaka 83,97 Kab. Kolaka Timur 16,41
Gorontalo Kab. Pohuwato 28,35 Kab. Gorontalo Utara 18,17
Sulawesi Barat Kab. Mamuju Utara 44,16 Kab. Mamasa 12,75
Maluku Kab. Kepulauan Aru 26,40 Kab. Seram Bagian Barat 11,99
Maluku Utara Kota Ternate 30,01 Kab. Halmahera Barat 13,46
Papua Barat Kab. Teluk Bintuni 395,49 Kab. Pegunungan Arfak 4,85
Papua Kab. Mimika 199,35 Kab. Lanny Jaya 6,17
Sumber/Source: Badan Pusat Statistik/BPS-Statistics IndonesiaCatatan/Note: **) Angka sangat sementara/Very preliminary figures
http
://w
ww
.bps
.go.
id

159Perkembangan Beberapa Indikator Utama Sosial-Ekonomi Indonesia, Agustus 2016
http
://w
ww
.bps
.go.
id
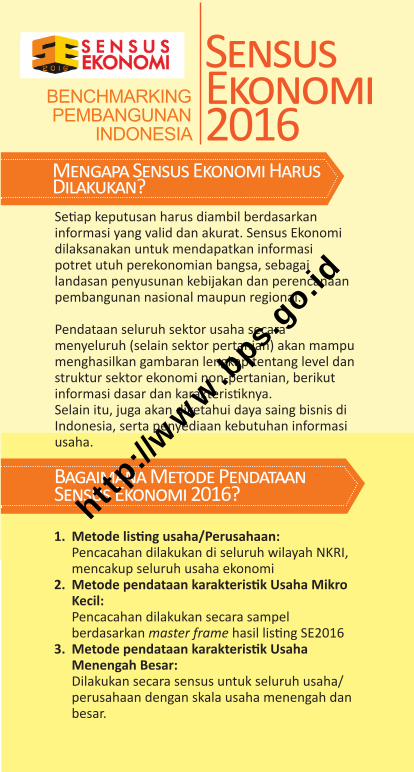
Trends of Selected Socio-Economic Indicators of Indonesia, August 2016160
SensusEkonomi2016
Mengapa Sensus Ekonomi Harus Dilakukan?Setiap keputusan harus diambil berdasarkan informasi yang valid dan akurat. Sensus Ekonomi dilaksanakan untuk mendapatkan informasi potret utuh perekonomian bangsa, sebagai landasan penyusunan kebijakan dan perencanaan pembangunan nasional maupun regional.
Pendataan seluruh sektor usaha secara menyeluruh (selain sektor pertanian) akan mampu menghasilkan gambaran lengkap tentang level dan struktur sektor ekonomi non-pertanian, berikut informasi dasar dan karakteristiknya.Selain itu, juga akan diketahui daya saing bisnis di Indonesia, serta penyediaan kebutuhan informasi usaha.
BENCHMARKINGPEMBANGUNAN
INDONESIA
Bagaimana Metode Pendataan Sensus Ekonomi 2016?
1. Metode listing usaha/Perusahaan: Pencacahan dilakukan di seluruh wilayah NKRI,
mencakup seluruh usaha ekonomi2. Metode pendataan karakteristik Usaha Mikro
Kecil: Pencacahan dilakukan secara sampel
berdasarkan master frame hasil listing SE20163. Metode pendataan karakteristik Usaha
Menengah Besar: Dilakukan secara sensus untuk seluruh usaha/
perusahaan dengan skala usaha menengah dan besar.
http
://w
ww
.bps
.go.
id

161Perkembangan Beberapa Indikator Utama Sosial-Ekonomi Indonesia, Agustus 2016
• Pemetaan potensi (level) ekonomi menurut wilayah, jenis dan pelaku usaha;
• Benchmarking PDB/PDRB, ketenagakerjaan, dan lain-lain;
• Tersedianya sampling frame untuk berbagai kegiatan survei di bidang ekonomi (Survei Harga, Survei Produksi, Survei Distribusi, Survei Jasa, Survei khusus/adhoc, dsb)
• Terbangunnya basis data dan benchmark Updating Integrated Business Register (IBR);
• Karakteristik usaha menurut skala usaha;• Karakteristik usaha (unik): franchise, e-commerce/on-
line business, multilevel marketing, dan lain-lain;• Pemetaan daya saing bisnis menurut wilayah; dan• Tinjauan prospek bisnis dan perencanaan investasi di
Indonesia.
Apa yang Diperoleh dariPelaksanaan Sensus Ekonomi 2016?
• Pertambangan dan penggalian
• Industri Pengolahan• Pengadaan Listrik, gas,
uap/air panas dan udara dingin
• Pengadaan Air, pengelolaan sampah dan daur ulang, pembuangan dan pembersihan limbah dan sampah
• Konstruksi• Perdagangan besar dan
eceran, reparasi dan perawatan mobil motor dan sepeda motor
• Transportasi dan Pergudangan
• Penyediaan akomodasi dan penyediaan makan minum
• Informasi dan Komunikasi
• Jasa Keuangan dan Asuransi
• Real estat• Jasa Profesional,
Ilmiah dan Teknis• Jasa persewaan,
ketenagakerjaan, agen perjalanan dan penunjang usaha lainnya
• Jasa Pendidikan• Jasa kesehatan dan
kegiatan sosial• Kebudayaan, hiburan
dan rekreasi• Kegiatan Jasa Lainnya• Jasa perorangan
yang melayani rumah tangga
• Kegiatan badan dan organisasi internasional
Usaha pada Sektor Apa Saja yang Akan Didata dalam Sensus Ekonomi 2016?
http
://w
ww
.bps
.go.
id

Trends of Selected Socio-Economic Indicators of Indonesia, August 2016162
VISI DAN MISI BPS
Visi
Pelopor data statistik terpercaya untuk semua
Misi
1. Menyediakan data statistik berkualitas melalui kegiatan statistik yang terintegrasi dan berstandar nasional maupun internasional.
2. Memperkuat Sistem Statistik Nasional yang berkesinambungan melalui pembinaan dan koordinasi di bidang statistik.
3. Membangun insan statistik yang profesional, berintegrasi dan amanah untuk kemajuan perstatistikan.
http
://w
ww
.bps
.go.
id

163Perkembangan Beberapa Indikator Utama Sosial-Ekonomi Indonesia, Agustus 2016
DIREKTORAT DISEMINASI STATISTIKDIRECTORATE OF STATISTICAL DISSEMINATION
Gedung 2 lantai 3/Building 2, 3rd floorTelepon/Phone - Faksimile/Faximile: (021) 3863740
Layanan Statistik Subdirektorat Layanan dan Promosi Statistik memberikan layanan informasi statistik berupa:
- Konsultasi statistik - Data mikro - Peta digital - Softcopy Publikasi - Hardcopy Publikasi
Statistical Services Subdirectorate of Statistical Promotion and Services serves statistical information:
- Statistical consultation - Micro data - Digital Map - Publication softcopy - Publication hardcopy
Gedung 2, Lantai 3/Building 2, 3rd floor Telepon/Phone: (021) 3841195, (021) 3842508 psw./Ext. 3230-34 Telepon Langsung/Direct Phone: (021) 3507057 Email/Email: [email protected] Faksimile/Faximile: (021) 3863740
Perpustakaan Subdirektorat Perpustakaan dan Dokumentasi Statistik memberikan layanan perpustakaan berupa data/informasi yang tersedia dalam bentuk publikasi tercetak dan digital.
Library Subdirectorate of Library and Statistical Documentation serves customers in obtaining statistical information in the form of Printed and digital publication.
Gedung 2, Lantai 1/Building 2, 1st floor Telepon/Phone: (021) 3841195, (021) 3842508 psw./Ext. 3240, 3244 Email/Email: [email protected] Faksimile/Faximile: (021) 3863740
Internet http://www.bps.go.id Web BPS memberikan layanan informasi statistik
dalam bidang pertanian, industri, kependudukan dan ketenagakerjaan, perdagangan luar negeri, pendapatan nasional dan regional, keuangan dan harga-harga dan lain-lain.
Internet http://www.bps.go.id BPS Website provides statistical information on agriculture,
manufacturing, population and employment, national and regional income, finance and prices, etc.
http
://w
ww
.bps
.go.
id

Trends of Selected Socio-Economic Indicators of Indonesia, August 2016164
DAFTAR ALAMAT BADAN PUSAT STATISTIK PROVINSIADDRESS OF BPS PROVINCIAL OFFICES
AcehJln. Tgk. H. M. Daud Beureueh No. 50 Kuta Alam Banda AcehTelp./Fax: (0651) 23005Email: [email protected]
Sumatera Utara Jln. Asrama No. 179, Medan-20123Telp./Faks: (061) 8452343/8452773E-mail: [email protected]
Sumatera Barat Jl. Khatib Sulaiman No. 48, Padang 25135Telp./Faks: (0751) 442158, 442160/442161E-mail: [email protected]
Riau Jl. Pattimura No. 12, Pekanbaru 28131Telp./Faks: (0761) 23042/21336E-mail: [email protected]
Jambi Jl. A. Yani No. 4, Telanaipura, Jambi 36122Telp./Fax: (0741) 60497 E-mail: [email protected]
Sumatera Selatan Jln. Kapten Anwar Sastro No.1694 Palembang 30129Telp./Faks: (0711) 318456, 351665/353174E-mail: [email protected]
Bengkulu Jl. Adam Malik Km. 8, Kota Bengkulu 38225Telp./Faks: (0736) 349117/349115E-mail: [email protected]
Lampung Jl. Basuki Rahmat No. 54 Bandar LampungTelp./Fax: (0721) 482909/484329E-mail : [email protected]
Kepulauan Bangka Belitung Komplek Perkantoran Terpadu Pemerintah ProvinsiAir Itam, PangkalpinangTelp./Faks: (0717) 439422/439425E-mail: [email protected]
Kepulauan RiauJl. Kijang Lama A8 Tanjungpinang 29100Telp./Faks: (0771) 4571131/4571131E-mail: [email protected]
DKI JakartaJl. Salemba Tengah No. 36-38, Kelurahan Paseban Kecamatan Senen, Jakarta Pusat 10440 Telp./Faks: (021) 31928493/3152004E-mail: [email protected]
Jawa Barat Jl. PHH Mustofa No. 43 , Bandung 40124 Telp. /Faks: (022)7272595, 7201696/7213572 E-mail: [email protected]
Jawa Tengah Jl. Pahlawan No. 6 SemarangTelp./Faks: (024) 8412802, 8412804, 8412805/8311195 E-mail: [email protected]
D.I. Yogyakarta Jl. Lingkar Selatan Tamantirto, Kasihan Bantul 55183Telp./Faks: (0274) 4342234/4342230E-mail: [email protected]
Jawa Timur Jl. Raya Kendangsari Industri No. 43-44 Surabaya 60292Telp./Faks: (031) 8439343/8494007, 8471143 E-mail: [email protected]
Banten Kawasan Pusat Pemerintahan Provinsi Banten(KP3B), Jl. Syech Nawawi Al Bantani Kav. H1-2Serang 42171,Telp./Faks: (0254) 267027/267026E-mail: [email protected]
Bali Jl. Raya Puputan (Renon) No. 1, Denpasar 80226Telp./Faks: (0361) 238159, 243696/238162E-mail: [email protected]
Nusa Tenggara Barat Jl. Gunung Rinjani No. 2, Mataram 83126Telp./Faks: (0370) 621385/623801 E-mail: [email protected]
Nusa Tenggara Timur Jl.R. Suprapto No. 5, Kupang 85111Telp./Faks: (0380) 826289, 821755/833124 E-mail: [email protected]
Kalimantan BaratJl. Sutan Sjahrir No. 24/42, Pontianak 78116Telp./Faks: (0561) 735345, 765741/732184 Email: [email protected]
Kalimantan Tengah Jl. Kapten Pierre Tendean No. 6 Palangka Raya 73112Telp./Faks: (0536) 3228105/3221380 Email: [email protected]
Kalimantan SelatanJl. KS. Tubun No. 117, Banjarmasin 70242Telp./Faks: (0511) 3262314/3261585 Email: [email protected], [email protected]
Kalimantan Timur Jl. Kemakmuran No. 4, Samarinda 75117 Telp./Faks: (0541) 743372, 732793/201121Email: [email protected]
Sulawesi UtaraJl. 17 Agustus, Manado 95119 Telp./Faks: (0431) 847044/ 862204 E-mail: [email protected]
Sulawesi Tengah Jl. Prof. Moh. Yamin No. 49, Palu 94114Telp./Faks: (0451) 483610, 483611, 483613/483612E-mail: [email protected]
Sulawesi Selatan Jl. Haji Bau No. 6, Makassar 90125Telp./Faks: (0411) 854838, 872879/851225Email: [email protected]
Sulawesi Tenggara Jl. Boulevard No. 1 KendariTelp./Faks: (0401) 3135363/3122355E-mail: [email protected]
Gorontalo Jalan Prof. Dr. Aloei Saboe No. 117, Kota GorontaloTelp./Faks: (0435) 834596/834597E-mail: [email protected]
Sulawesi BaratJl. R.E. Martadinata No. 10, Mamuju 91511Telp./Faks: (0426) 2703340/22103E-mail: [email protected]
Maluku Jl. Wolter Monginsidi – Passo, Ambon 97232Telp./Faks: (0911) 361320, 361321/361319E-mail : [email protected]
Maluku Utara Jl. Stadion No.65 Ternate 97712Telp./Faks: (0921) 3127878/3126301E-mail: [email protected]
Papua BaratJl. Trikora Sowi 4 No.99, Manokwari 98315Telp./Faks: (0986)214199/214199E-mail: [email protected]
Papua Gedung PELNI Lantai 3 Jl.Argapura Atas No.15 Hamadi Jayapura 99222Telp./Faks: (0967) 534519, 533028/536490E-mail: [email protected]
http
://w
ww
.bps
.go.
id

http
://w
ww
.bps
.go.
id