PENDANT final report, deliverable D9 WP3 - data analysis
104
HAL Id: hal-00545956 https://hal.archives-ouvertes.fr/hal-00545956 Submitted on 13 Dec 2010 HAL is a multi-disciplinary open access archive for the deposit and dissemination of sci- entific research documents, whether they are pub- lished or not. The documents may come from teaching and research institutions in France or abroad, or from public or private research centers. L’archive ouverte pluridisciplinaire HAL, est destinée au dépôt et à la diffusion de documents scientifiques de niveau recherche, publiés ou non, émanant des établissements d’enseignement et de recherche français ou étrangers, des laboratoires publics ou privés. PENDANT final report, deliverable D9 WP3 - data analysis Jl Martin, B. van Kampen, C. Perez To cite this version: Jl Martin, B. van Kampen, C. Perez. PENDANT final report, deliverable D9 WP3 - data analysis. 2006, 103p. hal-00545956
-
Upload
khangminh22 -
Category
Documents
-
view
2 -
download
0
Transcript of PENDANT final report, deliverable D9 WP3 - data analysis

HAL Id: hal-00545956https://hal.archives-ouvertes.fr/hal-00545956
Submitted on 13 Dec 2010
HAL is a multi-disciplinary open accessarchive for the deposit and dissemination of sci-entific research documents, whether they are pub-lished or not. The documents may come fromteaching and research institutions in France orabroad, or from public or private research centers.
L’archive ouverte pluridisciplinaire HAL, estdestinée au dépôt et à la diffusion de documentsscientifiques de niveau recherche, publiés ou non,émanant des établissements d’enseignement et derecherche français ou étrangers, des laboratoirespublics ou privés.
PENDANT final report, deliverable D9 WP3 - dataanalysis
Jl Martin, B. van Kampen, C. Perez
To cite this version:Jl Martin, B. van Kampen, C. Perez. PENDANT final report, deliverable D9 WP3 - data analysis.2006, 103p. �hal-00545956�
Deliverable D9 WP3 - Data analysis
Project funded by the European Community under the ‘Competitive and Sustainable Growth’ Programme (1998-2002)
Contract No: GMA2-2001-52066 S07.17215 Acronym: PENDANT Title: Pan-European Co-ordinated Accident and Injury Databases
Project Co-ordinator: Professor Pete Thomas Vehicle Safety Research Centre Ergonomics and Safety Research Institute Loughborough University Holywell Building Holywell Way Loughborough LE11 3UZ
Partners: Institut National de Recherche sur les Transports et leur Sécurité (INRETS), Association pour le Registre des Victimes d’Accidents de la Circulation dans le Département du Rhône (ARVAC), SWOV Institute for Road Safety Research Sub-contractors:
ASPB - Agència de Salut Pública de Barcelona
Authors: Jean-Louis Martin, Boudewijn van Kampen, Catherine Perez
Project Start Date: 1st January 2003 Duration: 3 .5 years

Project funded by the European Community under the ‘Competitive and Sustainable Growth’ Programme (1998-2002)
Contents of Deliverable D9 Introduction......................................................................................................... 5
Chapter 1 Comparison of patterns of injuries ..................................................... 6
Data characteristics and methods................................................................... 6
Data............................................................................................................. 6
Injury codification process ........................................................................... 8
Injury description method ............................................................................ 9
Results.......................................................................................................... 10
Pedestrians ............................................................................................... 17
Car users................................................................................................... 20
Motorised two-wheelers ............................................................................ 23
Cyclists...................................................................................................... 26
Some considerations about non-hospitalised for French and Spanish data.................................................................................................................. 29
Some comments on patterns of injuries in fatalities .................................. 31
Discussion .................................................................................................... 32
Common points between the three data sets ............................................ 32
Comments on discrepancies ..................................................................... 34
Chapter 2 Linkage processes and results ........................................................ 36
Main differences between countries/sources................................................ 36
The linking processes ................................................................................... 36
Linking results............................................................................................... 38
Differences between linked and non-linked data (police bias) ...................... 39
Conclusions regarding linked data with respect to representativeness........ 39
Chapter 3 Analysis of linked data ..................................................................... 41
Car-to-car collisions ...................................................................................... 42
Material and Methods................................................................................ 42
Pattern of injuries and impact area in car-to-car collisions ........................ 44
Severity risk factors in drivers involved in car-to-car collisions (French and Dutch data)................................................................................................ 48
Factors associated with whiplash in car-to-car collisions (Spanish and French data).............................................................................................. 56
Car to pedestrian collisions........................................................................... 66
Car to pedestrian data............................................................................... 66
Results ...................................................................................................... 68
Discussion................................................................................................. 70
Methodological aspects of dealing with hospital data....................................... 72
Evaluation of remaining problems................................................................. 72
Recommendations for possible improvements ............................................. 73
Conclusions and recommendations regarding future legislation................... 74
References ....................................................................................................... 75

PENDANT Deliverable D9 WP3 - Data analysis
Project funded by the European Community under the ‘Competitive and Sustainable Growth’ Programme (1998-2002)
Page 3
Annex 1. The linking of some French hospital and police road casualties data...................................................................................................................... 77
Linking procedure...................................................................................... 77
Results of the linking ................................................................................. 79
Analysis of differences of results from three data sources ........................ 80
Conclusion ................................................................................................ 82
Analysis of differences of results from the two data sources-not restricted to hospitalised only........................................................................................ 82
Annex 2. Linking hospital emergency records with police data in Spain 2002-2004.............................................................................................................. 86
Method ...................................................................................................... 86
Results of the linking ................................................................................. 89
Analysis of differences of results from three data sources ........................ 90
Analysis of under- reporting of road casualties ......................................... 92
Conclusion ................................................................................................ 93
Annex 3. The linking of Dutch hospital, police, and vehicle data .................. 94
Linking procedure...................................................................................... 94
Analysis of differences of results from three data sources ........................ 99
Differences between linked data and police data. ................................... 101
Differences between linked data and hospital data ................................. 101
Conclusions............................................................................................. 102
PENDANT Deliverable D9 WP3 - Data analysis
Project funded by the European Community under the ‘Competitive and Sustainable Growth’ Programme (1998-2002)
Page 4
PENDANT Deliverable D9 WP3 - Data analysis
Project funded by the European Community under the ‘Competitive and Sustainable Growth’ Programme (1998-2002)
Page 5
Introduction
The aim of the WP3 is to demonstrate to what extent it is possible to analyse in a common way hospital data of road injuries to complement police data information coming from the three countries involved, despite all of their differences. The objective is to analyse the databases and identify priorities for future European regulatory and other action. This document includes three chapters. The first one compares the patterns of injuries between the three countries, according to severity of injuries and types of users. The second chapter focuses on the different methodologies of linkage between hospital and police data, in addition to the main part of the deliverable D7. The third chapter shows several analyses dealing with linked data. It includes the analysis of injuries and risk factors in car to car crashes, whiplash in car to car and pedestrian injuries in car to pedestrian collisions. This document is self-contained and the reader is not supposed to have read the previous WP3 deliverables, except for some very technical details.

PENDANT Deliverable D9 WP3 - Data analysis
Project funded by the European Community under the ‘Competitive and Sustainable Growth’ Programme (1998-2002)
Page 6
Chapter 1 Comparison of patterns of injuries
The three data collections (DUHAT from Spain, ARVAC from France, LMR from the Netherlands) are all based on administrative/medically oriented data of casualties from traffic accidents. However, these registrations cover different types of geographical areas, different populations, and probably different injury severities. French and Spanish registrations are based on discharge records of casualties attended at emergency departments of hospitals, including those who were further admitted as in-patients, while the Dutch registration is based on discharge records of hospital in-patients. The geographical areas covered are also quite different: the Spanish registration covers a mostly urban area (the City of Barcelona) with about 1,5 million inhabitants; the French registration covers the 'Département du Rhone', which is largely (80%) urban, with almost 1,6 million inhabitants; the Dutch registration covers all of the Netherlands, with about 16 million inhabitants. As a result, the annual number of casualties is between 16,000 and 18,000 in the Spanish registration, between 10,000 and 11,000 in the French registration, and about 18,000 in the Dutch registration. As regards to the injury coding classification, Spain and the Netherlands use ICD-9, while France uses AIS 90. Because of all these inherent differences, the comparison of patterns of injuries from these three datasets is not straightforward. The data can be made more comparable by adjusting the different samples, using a set of proper selection criteria, commonly available in the datasets, as well as adapting the analysis methodology. The various safeguards used to make these comparisons profitable are detailed in the following section.
Data characteristics and methods
Data
A first important difference comes from the inclusion criteria: − The Dutch system LMR is based on hospital discharge data only, which means that data is available for hospitalised people and only these (for the whole country though) − The Spanish system DUHAT is based on people taken care of by the seven emergency departments in the area of Barcelona. The result is that 86% of these victims are out-patients − The French system ARVAC records every one taken care of by emergency departments, but also medical departments, mobile emergency units as well

PENDANT Deliverable D9 WP3 - Data analysis
Project funded by the European Community under the ‘Competitive and Sustainable Growth’ Programme (1998-2002)
Page 7
as forensic departments, inside the geographical area of the "département du Rhône". As a result, 81% of these victims are out-patients.
Hospitalised means 24 hours or more in hospital, but that a person can sometimes be considered hospitalised when they stay in hospital overnight. Consequently, while the number of recorded victims are quite similar (between 10,000 and 18,000 a year), the number of hospitalised people are quite different. A relevant comparison between the three databases requires dealing separately with hospitalised and non-hospitalised people. This will be done in the following analyses, where we focus on those hospitalised, whereas we provide a not-so-detailed analysis for those non hospitalised (when available, i.e. for DUHAT and ARVAC). Another point to be discussed deals with checking for duplicate records, due to the different data gathering systems: − Netherlands: hospital discharge data means that all information gathered
inside the hospital is supposed to be used for the definition injuries. The only problem could arise for people transferred from one hospital to another, as this could produce duplicate information (two sets of records for the same victim), but this is very rare and considered insignificant. − Spain: information comes only from emergency departments. This means that the injury description can be incomplete. As people do not attend several emergency departments, duplicate information is unlikely. − France: information comes separately from each emergency or medical unit and is put together by ARVAC in a second step. Computerised injury description is based on all available information. The problem of duplicate information is also insignificant.
As regards to fatalities, registration systems are completely different: − LMR (NL) records fatalities only if they were first hospitalised. The
proportion of these cases among all fatalities is estimated to be very low. − DUHAT (SP) records fatalities only if they were first taken care of by emergency services. − ARVAC (FR) records all fatalities from all possible sources of information, including forensic departments. Injury description is hence available for about 90% of these fatalities.
This means that people killed on the spot are known by ARVAC, and almost never by LMR and DUHAT, while we can assume that people killed on the spot of the accident have different injuries than those who survive long enough to arrive alive at the hospital. Furthermore, the definition of hospitalisation in this case needs to be precisely discussed: for example, are two hours in a resuscitation unit considered as hospitalisation? Further consideration needs to be given to this problem in order to compare our fatalities, including regulation differences about the transport of deceased. What is at least obvious is that they have to be analysed separately from other casualties.
PENDANT Deliverable D9 WP3 - Data analysis
Project funded by the European Community under the ‘Competitive and Sustainable Growth’ Programme (1998-2002)
Page 8
Injury codification process
ARVAC uses the Abbreviated Injury Scale (AIS) to code injuries (AAAM (Association for the Advancement of Automotive Medicine) 1994). To each injury code has been assigned a severity level code according to the following scale: 1- minor, 2- moderate, 3 – serious, 4 – severe, 5 – critical, 6 – unsurvivable. DUHAT and LMR use the International Classification of Diseases Clinical Modification (ICD-9-CM) to code injuries. Crash injuries are identified with the E code (external cause), and injuries are described with scores between 800 and 959.9. No severity level is provided by ICD-9. In order to be able to compare our data at given severity levels, a conversion from ICD-9 to AIS is necessary. The AIS score has been derived from the patient's ICD-9 diagnosis using the method developed by MacKenzie and implemented in ICDMAP90 software (MacKenzie et al. 1997). Translation is then possible for a majority of ICD codes, with the associated severity. In order to summarize multiple injury diagnosis data into patient injury patterns, a second step has consisted in converting injury codes into the Barell injury matrix (Barell et al. 2002). This provides a standard format to describe injuries according to nature and body region of injuries. This codification can be made directly from ICD codes, with available software. It can also be done for the AIS codes, with a specific conversion table that we have built. For example, if the nature of the injury is a fracture, and the body region is the thorax (A1 coordinates in Barell matrix), this "cell" includes ICD-9 codes 807.0 to 807.4, and AIS codes 450210.2 to 450268.5 and 450804.2 . In view of the first analyses we have done, we actually use a modified Barell matrix for trauma brain injuries (TBI). The distinction, induced by this matrix, between three levels appeared redundant with the severity level and have hence been grouped together, but the level of consciousness (LOC) has been separately identified (the only codes which do not describe a physical injury). Some other body regions have been grouped, such as face and eye, vertebral column and spinal cord injuries. Because of this choice of classification, we hope to be able to compare our results with other published results. Another point is how to deal with the fact that people have a various number of injuries, and that this number differs between our three countries because of the recording systems: Up to 9 injury diagnoses (per victim) in LMR, no maximum limit in ARVAC (maximum recorded is 22 up to now), but maximum 3 diagnoses in DUHAT. As it is very difficult to prioritise AIS or ICD codes, we have chosen not to set a max. limit of three codes in all three data sets. Let us note that in practice, the great majority of victims have, on average, a quite small number of described injuries (1.8 in LMR, 1.6 in DUHAT and 2.8 in ARVAC). Moreover, distribution of the number of injuries is very asymmetric: in ARVAC data, 48%

PENDANT Deliverable D9 WP3 - Data analysis
Project funded by the European Community under the ‘Competitive and Sustainable Growth’ Programme (1998-2002)
Page 9
have only one injury described (among hospitalised and non hospitalised people) and only 3% have 5 injuries or more. As we need to be as comparable as possible, we have chosen to use MAIS (the highest AIS code in a patient with multiple injuries) to describe overall severity. The Injury Severity Score (ISS), or the New ISS (NISS) are known to give a better fit between overall severity and probability of survival (Grisoni et al. 2001; O’keefe et al. 2001), but are found to be too sensitive to the number of recorded injuries.
Injury description method
− As explained above, overall severity is estimated with MAIS in order to deal with different numbers of injuries allowed to be recorded in the three different registrations. This choice has also been made in order to facilitate the understanding of which injury is responsible for a specific severity level. − Tables of injuries are produced for the whole set of casualties (all types of road user, all MAIS levels), as well as for separate MAIS-groups, in which groups only individual injuries of the severity corresponding to the MAIS-category are admitted (i.e. MAIS=2 casualties include AIS2 injuries only). This is done to avoid confusing injury information of lesser severity and to focus on the worst injuries within that particular MAIS segment. This is all the more relevant since minor injuries are potentially more often forgotten than the severe ones. − These injury descriptions are also provided separately for each type of road user. This is essential because injury profile is very dependent on the type of road user, and furthermore, distributions of road user types are very different from one country to another, especially for cyclists (almost none in Barcelona, whereas the main type of users in the Netherlands).
Table 1 sums up the different points to consider when comparing our three data sets
Table 1 : main characteristics of the three data sets
French data Dutch data Spanish data
Source of information Emergency and medical units, and forensic Hospital Hospital emergency
Type of data collection Active Passive Passive
Area covered Region (urban and rural) National City (only urban)
Maximum number of coded injuries No maximum 9 3
Injury coding AIS ICD9-CM ICD9-CM
Recording of fatalities All fatalities Hospitalised fatalities Emergency fatalities

PENDANT Deliverable D9 WP3 - Data analysis
Project funded by the European Community under the ‘Competitive and Sustainable Growth’ Programme (1998-2002)
Page 10
Results
The distribution of fatalities and casualties is shown in Table 2.
Table 2: distribution of fatalities and casualties in the three datasets - years 1997-2001
French data Dutch data Spanish data
killed 665 1.3 1564 1.9 160 0.2
hospitalised 7804 15.3 81668 98.1 9490 10.8
non hospitalised 42368 83.3 0 - 74299 84.5
The French data are supposed to include all fatalities occurring inside the geographic area considered. The Dutch data come from hospitals only, which implies, on the one hand, that fatalities are only recorded when casualties died at the hospital and, on the other hand, that there are none or only few out-patients recorded. The Spanish data come only from hospital emergency departments of an urban area, and include very few fatalities. As a result, the following analysis focuses on hospitalised casualties. Other results will be shown only when this is meaningful, i.e. about non-hospitalised in French and Spanish data, and fatalities in French and Dutch data. Table 3 shows injury severity sustained by the hospitalised victims according to the Maximum of Abbreviated Injury Scale (MAIS).
Table 3: severity for the hospitalised as estimated by the Maximum Abbreviated Injury Scale
(MAIS)
Severity French Dutch Spanish
Number of hospitalised with known MAIS 7773 81668 4812
MAIS1 18.2 14.6 36.3
MAIS2 48.4 55.1 49.8
MAIS3 25.8 26.0 12.8
MAIS4+ 7.6 4.3 1.1
The mean severity of injuries is higher for the French hospitalised than for the Dutch ones. The Spanish hospitalised appear to be significantly less severely injured than the others, with 36% MAIS 1 and only 1.1% MAIS 4 and above. Interpretation: With regards to Spanish data, this pattern can be due to the fact that injury assessment is less complete, because data come from emergency services only. Even if up to three injuries can be recorded, in fact, in more than 80% of cases only one injury is described. This implies that the number and nature of injuries are under-reported and hence severity. Injuries that require screening tests such as internal injuries are more likely to be under-reported.

PENDANT Deliverable D9 WP3 - Data analysis
Project funded by the European Community under the ‘Competitive and Sustainable Growth’ Programme (1998-2002)
Page 11
Even if the corresponding figures are shown in most of the tables, no consideration is given to AIS 4+ Spanish data as their number is too small. Table 4 shows the mean number of recorded injuries according to severity level and to the dataset. For example, French hospitalised casualties for whom the maximum injury severity is 3 (MAIS 3), have, on average, 1.36 injuries described as severity level 3 and a total of 3.15 injuries without any consideration of severity (which means in this case AIS 1, 2 or 3).
Table 4: mean number of described injuries according to the severity
French data Dutch data Spanish data
Mean number of
injuries Mean number of
injuries Mean number of
injuries
hospitalised
number of
victims at this
severity at any
severity
number of
victims at this
severity at any
severity
number of
victims at this
severity at any
severity
All 7773 2.87 81668 1.73 5616 1.28
MAIS2 3733 1.40 2.63 44981 1.32 1.58 2395 1.01 1.30 MAIS3 2001 1.36 3.15 21247 1.16 2.07 609 1.00 1.27 MAIS4+ 582 1.54 5.42 3504 1.09 2.78 53 1.00 1.15
The mean number of injuries described for hospitalised casualties, considered as a whole or separately for each severity level, is the largest in the French data and the smallest in the Spanish data. This fact is most likely due to the different organisations of data collection (see D6). The main consequence of this is that we have to be careful when comparing proportions of casualties according to nature of injury or body region between the three datasets.

PENDANT Deliverable D9 WP3 - Data analysis
Project funded by the European Community under the ‘Competitive and Sustainable Growth’ Programme (1998-2002)
Page 12
Table 5 shows the nature of injuries and the injured body region for all hospitalised casualties. Fractures are the most frequent nature of injury observed in all three datasets. The second most frequent is internal organ injuries, except in Spanish data. The proportions of victims sustaining superficial contusions and open wounds are also quite high; next are sprains and strains.
Table 5: number of victims, mean numbers of injuries and proportions of victims suffering from at
least one injury according to nature and body region – All casualties
Injury Nature French Dutch Spanish
Fractures 59.4 62.3 51.0
Dislocation 0.3 0.2 3.7
Sprains / strains 17.8 3.9 6.0
Internal organ 41.2 36.5 16.5
Open wounds 45.4 14.3 5.0
Amputations 0.7 0.2 0.2
Blood / vessels 0.5 0.2 0.1
Superficial Contusions 29.2 10.4 23.5
Crushing 0.2 1.0 0.2
Burns 0.3 0.2 0.1
Nerves 0.5 0.5 0.1
Nature unspecified 6.3 1.5 9.9
Detailed Body Region of injury
Head 44.4 31.5 16.0
Trauma Brain Injury 12.0 6.9 12.8
Loss of consciousness 29.2 22.7 3.1
Other head injury 11.0 3.9 0.4
Face 26.1 12.5 3.3
Neck 3.8 0.1 0.0
Spine 15.5 5.8 7.7
Cervical 10.4 2.4 5.0
Thoracic / dorsal 2.4 1.6 0.8
Lumbar 3.6 2.1 1.1
Chest 20.4 14.2 5.9
Abdomen 14.9 6.6 1.8
Pelvis / urogenital 6.9 5.1 3.5
Upper extremity 39.4 22.9 20.4
Shoulder / upper arm 18.4 9.9 8.7
Forearm / elbow 12.6 5.6 6.5
Hand / wrist / fingers 11.0 8.5 5.2
Other unspec upper extrem 8.5 2.6 0.9
Lower extremity 41.9 35.4 35.3
Hip 3.1 0.9 3.3
Upper leg / thigh 6.9 12.3 4.9
Knee 9.0 3.0 3.8
Lower leg / ankle 17.2 17.0 19.2
Foot / toes 3.6 2.2 2.8
Other lower extrem 13.5 4.2 3.2
Unspecified 8.9 3.1 22.9
As regards to body region, the highest three proportions of victims are those with lower extremity, upper extremity and head injuries, but not in the same

PENDANT Deliverable D9 WP3 - Data analysis
Project funded by the European Community under the ‘Competitive and Sustainable Growth’ Programme (1998-2002)
Page 13
order in the three datasets. Lower extremity injury often corresponds to the lower leg and ankle area, while upper extremity injury often corresponds to the shoulder / upper arm. Head and face injuries, as well as chest and abdomen injuries are especially frequent in the French data. Interpretation: at this stage, it is difficult to say whether these higher proportions are due to the fact that patterns of injuries are described in more details in the French registry (as a result of the follow up of all casualties or the direct AIS classification), or to a real higher proportion of multi trauma in French casualties. The main characteristics of the three populations are described below in terms of age, gender and road user type.

PENDANT Deliverable D9 WP3 - Data analysis
Project funded by the European Community under the ‘Competitive and Sustainable Growth’ Programme (1998-2002)
Page 14
Table 6: age distribution for the hospitalised in the three datasets
age 0-14 15-24 25-34 35-44 45-54 55-64 65-74 ≥ 75 Total count
French data 18.3 29.0 17.6 12.5 9.9 5.1 4.1 3.6 7790
Dutch data 11.7 22.7 15.1 12.1 10.9 9.7 9.8 8.9 81668
Spanish data 2.7 33.9 23.8 12.2 7.8 6.3 6.0 7.1 9490
Figure 1: age distribution for the hospitalised in the three datasets
0,0
5,0
10,0
15,0
20,0
25,0
30,0
35,0
40,0
0-14 15-24 25-34 35-44 45-54 55-64 65-74 75 and
more
French
Dutch
Spanish
Table 6 and Figure 1 show that: − the Dutch age distribution is rather flat, − the proportion of young people –under 14 years old–is high in the French
hospitalised, and even under the age of 35 compared to Dutch ones, − in the Spanish data, there are very few hospitalised under the age of 14, but a high proportion between the ages of 15 and 34.
As regards to gender, 70.7% of hospitalised casualties are men in the French dataset, 61.6% in the Dutch dataset and 66.9% in the Spanish one. As regards to differences in road user type, Table 7 and Figure 2 show that the three distributions are very different:
PENDANT Deliverable D9 WP3 - Data analysis
Project funded by the European Community under the ‘Competitive and Sustainable Growth’ Programme (1998-2002)
Page 15
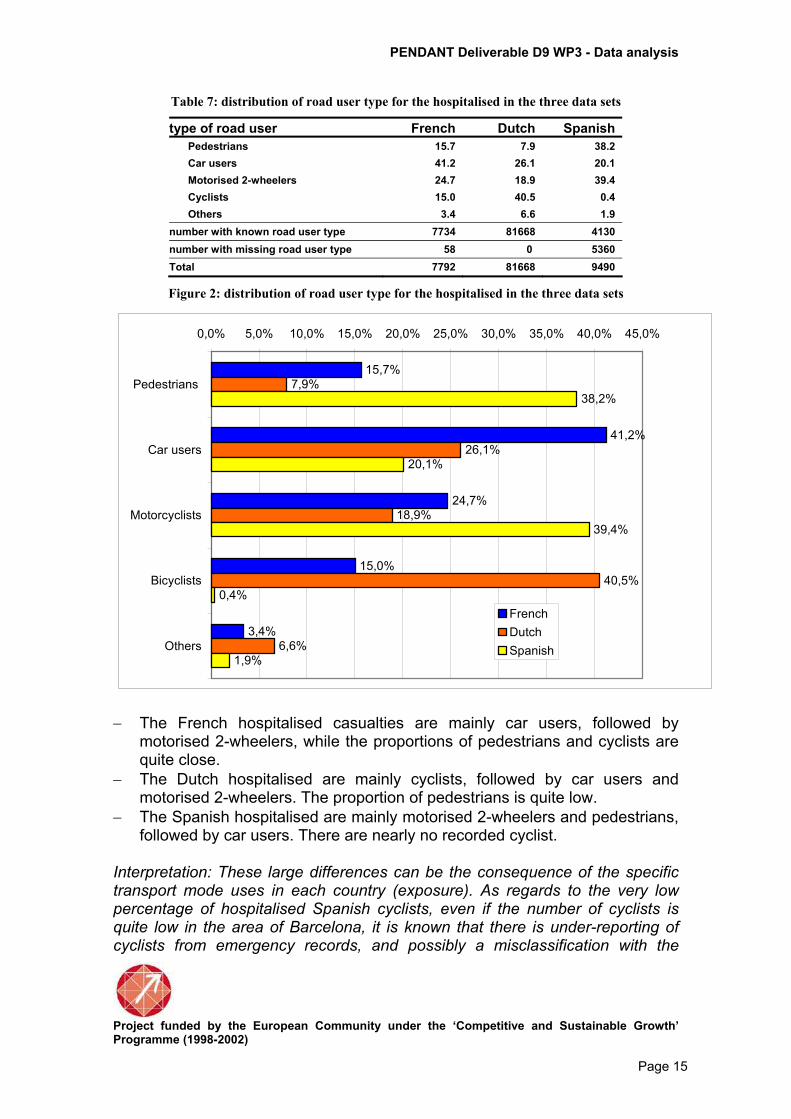
Table 7: distribution of road user type for the hospitalised in the three data sets
type of road user French Dutch Spanish
Pedestrians 15.7 7.9 38.2
Car users 41.2 26.1 20.1
Motorised 2-wheelers 24.7 18.9 39.4
Cyclists 15.0 40.5 0.4
Others 3.4 6.6 1.9
number with known road user type 7734 81668 4130
number with missing road user type 58 0 5360
Total 7792 81668 9490
Figure 2: distribution of road user type for the hospitalised in the three data sets
15,7%
41,2%
24,7%
15,0%
3,4%
7,9%
26,1%
18,9%
40,5%
6,6%
38,2%
20,1%
39,4%
0,4%
1,9%
0,0% 5,0% 10,0% 15,0% 20,0% 25,0% 30,0% 35,0% 40,0% 45,0%
Pedestrians
Car users
Motorcyclists
Bicyclists
Others
French
Dutch
Spanish
− The French hospitalised casualties are mainly car users, followed by motorised 2-wheelers, while the proportions of pedestrians and cyclists are quite close. − The Dutch hospitalised are mainly cyclists, followed by car users and motorised 2-wheelers. The proportion of pedestrians is quite low. − The Spanish hospitalised are mainly motorised 2-wheelers and pedestrians, followed by car users. There are nearly no recorded cyclist.
Interpretation: These large differences can be the consequence of the specific transport mode uses in each country (exposure). As regards to the very low percentage of hospitalised Spanish cyclists, even if the number of cyclists is quite low in the area of Barcelona, it is known that there is under-reporting of cyclists from emergency records, and possibly a misclassification with the

PENDANT Deliverable D9 WP3 - Data analysis
Project funded by the European Community under the ‘Competitive and Sustainable Growth’ Programme (1998-2002)
Page 16
pedestrians, although we cannot estimate it with our data. On the other hand motorcycle is a very popular vehicle in Barcelona. It is estimate that there are 150 motorcycles per 100.000 habitants while in Rome there are 90 and in Madrid 30. In view of these large differences, the analysis is now conducted separately according to road user type: pedestrians, car users, motorised 2 wheelers, cyclists.

PENDANT Deliverable D9 WP3 - Data analysis
Project funded by the European Community under the ‘Competitive and Sustainable Growth’ Programme (1998-2002)
Page 17
Pedestrians
Table 8: sex and age distribution for all hospitalised pedestrians
Table 8 shows that about 50% of hospitalised pedestrians are males in Spanish data, and that this proportion is slightly higher in French and Dutch data. The distributions by age are also quite similar for French and Dutch observations. There are fewer young casualties (less than 14 years of age) and older ones (more than 55 years) in Spanish data.
Table 9: proportion of hospitalised with MAIS2+ and injured body region according to the three
data sets - Pedestrians
Pedestrians FR NL ES
% of hospitalised with MAIS2+ 86.2 88.1 63.8
Body region: % victims with MAIS2+ Head 37.2 35.2 24.3
Face 2.3 1.5 0.5
Neck 0.0 0.0 0.0
Spine 3.3 2.7 3.0
Chest 7.5 7.0 0.3
Abdomen 10.4 2.8 0.3
Pelvis / urogenital 8.3 6.1 6.0
Upper extremity 20.7 13.4 14.3
Lower extremity 39.4 44.7 52.0
Table 9 shows the numbers of hospitalised casualties, the proportions of hospitalised with at least an AIS 2 + injury (MAIS2+) and the body regions injured. The percentages are very similar for French and Dutch observations, smaller for Spanish ones. The most frequent injured body region is the lower extremity, observed in 40% to 52% according to the dataset. The second most frequent is the head and the third is the upper extremity. Percentages for pelvis and urogenital injuries are also quite similar in the three datasets, while abdomen injuries are mainly observed in the French data. The percentage of casualties with at least one AIS 2 chest injury is around 7%, except in Spanish data where it is rarely observed.
Pedestrians FR NL ES
Number of victims 1212 6464 1000
% males 56.3 58.4 50.4
Age group
0-14 30.1 31.6 8.8
15-24 14.7 11.9 10.0
25-34 7.4 10.2 8.4
35-44 8.4 8.4 8.6
45-54 10.4 8.8 10.3
55-64 8.4 7.0 12.4
65-74 8.8 9.6 16.4
75 + 11.7 12.6 25.2
Total number 1211 6464 1576

PENDANT Deliverable D9 WP3 - Data analysis
Project funded by the European Community under the ‘Competitive and Sustainable Growth’ Programme (1998-2002)
Page 18
Table 10 shows, for three severity levels, the numbers of victims, the mean numbers with the corresponding AIS, the mean numbers of all injuries, including those with lower AIS severity, the nature of injuries for the two most frequent categories, and injured body regions, including some details for head, upper and lower extremities.
Table 10: number of victims, mean numbers of injuries and proportions of victims sustaining at
least one injury of the specified severity, according to nature and body region - Pedestrians
Pedestrians AIS 2 AIS 3 AIS4+
Country FR NL ES FR NL ES FR NL
number of victims 578 3721 479 350 1697 147 117 275
mean number of injuries with this AIS 1.48 1.37 1.01 1.27 1.18 1.01 1.5 1.12
mean number of all injuries 2.69 1.62 1.28 3.08 2.16 1.18 5.1 2.95
% with this AIS as maximum severity 47.7 57.6 47.9 28.9 26.3 14.7 9.7 4.3
Injury Nature Fractures 65.6 69.2 69.7 86.9 69.2 96.6 7.7 0.7
Internal organ 45.0 36.6 28.0 17.1 39.3 2.0 94.9 78.6
Injury Body Region Head 45.0 34.6 28.8 12.9 33.9 4.1 71.8 51.3
Trauma Brain Injury 1.4 6.6 22.1 9.4 33.1 4.1 67.5 49.8
Loss of consciousness 43.4 27.9 6.7 3.1 0.9 1.7 1.1
Face 4.0 2.4 0.6 0.3
Neck
Spine 4.8 3.7 3.3 1.1 0.8 2.0 1.7 1.8
Chest 1.7 2.9 0.2 9.4 12.6 29.9 28.1
Abdomen 12.5 2.9 0.4 8.6 0.2 6.0 18.9
Pelvis / urogenital 11.4 2.9 2.7 5.7 13.9 17.0 0.9 0.4
Upper extremity 21.5 19.3 17.3 26.3 2.8 5.4
Shoulder / upper arm 10.6 8.0 9.8 8.9 0.4
Forearm / elbow 4.7 4.9 5.6 7.7 0.7 5.4
Hand / wrist / fingers 8.7 8.2 1.5 14.3 1.3
Lower extremity 38.8 48.0 47.6 53.7 44.6 70.8 0.4
Upper leg / thigh 2.9 0.2 16.6 39.7 37.4 0.4
Knee 3.8 2.2 1.7
Lower leg / ankle 27.5 43.5 44.5 38.9 5.1 7.5
Focusing now on the more severe injuries i.e. AIS 4+, we note that most of them are internal organ injuries. The most frequent body region is the head. The second most frequent is the chest. There is a large discrepancy for the abdomen injuries, with many more in Dutch data compared to French ones. As regards to casualties with at least one AIS 3 injury, we note that most of them sustain fractures. The most frequent body region injured is the lower extremity in the three data sets, but this corresponds to the lower leg / ankle area in French data, when it is the upper leg / thigh area in Dutch and Spanish ones. The head is the second most frequent injured body region in Dutch data, while it is the third (and much less frequent) in French ones, and fourth (and
PENDANT Deliverable D9 WP3 - Data analysis
Project funded by the European Community under the ‘Competitive and Sustainable Growth’ Programme (1998-2002)
Page 19
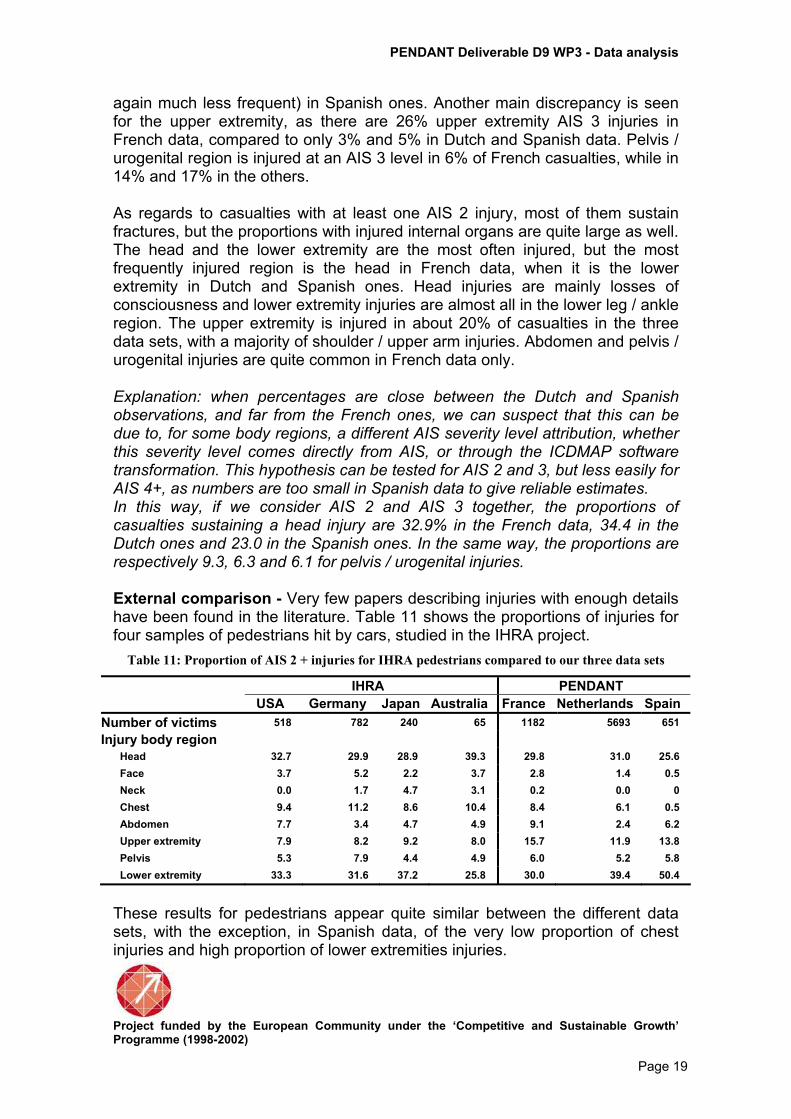
again much less frequent) in Spanish ones. Another main discrepancy is seen for the upper extremity, as there are 26% upper extremity AIS 3 injuries in French data, compared to only 3% and 5% in Dutch and Spanish data. Pelvis / urogenital region is injured at an AIS 3 level in 6% of French casualties, while in 14% and 17% in the others. As regards to casualties with at least one AIS 2 injury, most of them sustain fractures, but the proportions with injured internal organs are quite large as well. The head and the lower extremity are the most often injured, but the most frequently injured region is the head in French data, when it is the lower extremity in Dutch and Spanish ones. Head injuries are mainly losses of consciousness and lower extremity injuries are almost all in the lower leg / ankle region. The upper extremity is injured in about 20% of casualties in the three data sets, with a majority of shoulder / upper arm injuries. Abdomen and pelvis / urogenital injuries are quite common in French data only. Explanation: when percentages are close between the Dutch and Spanish observations, and far from the French ones, we can suspect that this can be due to, for some body regions, a different AIS severity level attribution, whether this severity level comes directly from AIS, or through the ICDMAP software transformation. This hypothesis can be tested for AIS 2 and 3, but less easily for AIS 4+, as numbers are too small in Spanish data to give reliable estimates. In this way, if we consider AIS 2 and AIS 3 together, the proportions of casualties sustaining a head injury are 32.9% in the French data, 34.4 in the Dutch ones and 23.0 in the Spanish ones. In the same way, the proportions are respectively 9.3, 6.3 and 6.1 for pelvis / urogenital injuries. External comparison - Very few papers describing injuries with enough details have been found in the literature. Table 11 shows the proportions of injuries for four samples of pedestrians hit by cars, studied in the IHRA project.
Table 11: Proportion of AIS 2 + injuries for IHRA pedestrians compared to our three data sets
IHRA PENDANT
USA Germany Japan Australia France Netherlands Spain
Number of victims 518 782 240 65 1182 5693 651
Injury body region
Head 32.7 29.9 28.9 39.3 29.8 31.0 25.6
Face 3.7 5.2 2.2 3.7 2.8 1.4 0.5
Neck 0.0 1.7 4.7 3.1 0.2 0.0 0
Chest 9.4 11.2 8.6 10.4 8.4 6.1 0.5
Abdomen 7.7 3.4 4.7 4.9 9.1 2.4 6.2
Upper extremity 7.9 8.2 9.2 8.0 15.7 11.9 13.8
Pelvis 5.3 7.9 4.4 4.9 6.0 5.2 5.8
Lower extremity 33.3 31.6 37.2 25.8 30.0 39.4 50.4
These results for pedestrians appear quite similar between the different data sets, with the exception, in Spanish data, of the very low proportion of chest injuries and high proportion of lower extremities injuries.

PENDANT Deliverable D9 WP3 - Data analysis
Project funded by the European Community under the ‘Competitive and Sustainable Growth’ Programme (1998-2002)
Page 20
Car users
Table 12 shows that sex and age distributions are quite similar between the three datasets, except that there is a higher proportion of young casualties (less than 25 years of age) in French data.
Table 12: sex and age distribution for all hospitalised car users
Car users FR NL ES
Number of victims 3169 21285 702
% males 60.5 62.5 57.2
Age group
0-14 6.9 4.3 5.2
15-24 31.7 25.3 26.1
25-34 22.1 24.2 25.3
35-44 13.7 14.7 14.6
45-54 11.5 10.9 10.8
55-64 6.1 8.1 8.6
65-74 4.6 7.1 5.3
75 + 3.4 5.3 4.1
Total number 3185 21285 830
Table 13: proportion of hospitalised with MAIS2+ and injured body region according to the three
data sets – Car users
Car users FR NL ES
% of hospitalised with MAIS2+ 78.3% 75.7% 40.6%
Body region: % victims with MAIS2+
Head 47.4 37.3 28.4
Face 4.2 1.8 0.7
Neck 0.1 0.0 0.0
Spine 9.5 7.9 11.2
Chest 19.3 24.2 6.0
Abdomen 9.1 5.5 2.1
Pelvis / urogenital 5.6 6.9 6.7
Upper extremity 16.6 14.6 20.7
Lower extremity 16.6 18.7 24.2
The percentages of hospitalised car users sustaining one AIS 2+ injury are not very different between the three datasets. Otherwise, the head is the most frequently injured, the chest is the second one in French and Dutch data, followed by lower and upper extremities. The proportions of casualties with spine injuries are quite similar, as well as those with pelvis injuries. The main discrepancies are seen for chest injury where the Spanish percentage is much smaller than the two others, this is also true for abdomen injuries.

PENDANT Deliverable D9 WP3 - Data analysis
Project funded by the European Community under the ‘Competitive and Sustainable Growth’ Programme (1998-2002)
Page 21
Table 14: number of victims, mean numbers of injuries and proportions of victims suffering from
at least one injury with the specified severity according to nature and body region - Car users
Car users AIS 2 AIS 3 AIS 4+
Country FR NL SP FR NL SP FR NL
number of victims 1601 10312 233 628 4499 46 253 1311
mean number of injuries with this AIS 1.36 1.37 1 1.4 1.27 1 1.64 1.09
mean number of all injuries 2.79 1.79 1.16 3.52 2.85 1.23 5.66 2.9
% with this AIS as maximum severity 50.5 48.4 33.2 19.8 21.1 6.6 8.0 6.2
Injury Nature Fractures 49.2 58.4 59.2 69.9 50.7 95.7 9.5 2.4
Internal organ 60.8 47.1 33.9 37.7 59.7 4.4 92.9 60.0
Injury Body Region
Head 59.3 41.8 32.6 15.1 30.8 4.4 52.6 23.7
Trauma Brain Injury 0.6 8.5 29.2 11.0 30.4 4.4 51.0 22.0
Loss of consciousness 58.3 33.2 3.4 3.7 0.4 0.8 0.5
Face 6.1 2.8 0.9 1.0 0.1
Neck 0.1 0.0 0.2 0.1 0.4
Spine 11.1 10.3 12.5 5.9 2.8 6.5 7.9 7.0
Chest 12.2 15.0 6.9 28.2 37.3 2.2 42.3 51.0
Abdomen 7.1 5.8 1.3 13.7 0.4 10.3 21.0
Pelvis / urogenital 4.9 5.0 3.4 8.1 13.2 23.9 3.6 0.2
Upper extremity 16.6 21.4 21.9 23.4 3.3 17.4
Shoulder / upper arm 6.4 11.1 15.9 11.3 0.9
Forearm / elbow 4.4 4.6 4.7 7.0 1.0 17.4
Hand / wrist / fingers 6.6 8.4 1.3 9.2 1.6
Lower extremity 13.6 17.5 20.6 30.4 26.8 45.7 1.2 0.2
Upper leg / thigh 0.2 0.1 22.3 25.7 30.4 1.2 0.2
Knee 4.0 3.4 3.4 0.2
Lower leg / ankle 5.9 9.6 11.2 10.0 1.6 2.2
As regards to the most severely injured i.e. MAIS 4+ car users, the proportion of head injured casualties is twice as high in the French compared to the Dutch data. One casualty out of two sustains a chest injury in the Dutch data, slightly less in the French data. Abdomen injuries are twice as common in the Dutch compared to the French data. Proportions of hospitalised car users sustaining a spine injury are quite similar. As regards to MAIS 3 hospitalised car users, many discrepancies exist. Lower extremity, and especially the upper leg / thigh area, is the most frequent injured body region, except for the Dutch data where the most frequent injured region is the chest. As is seen for pedestrians, head injuries are much more frequent in the Dutch data than in the French ones, while the proportion in the Spanish ones is very low. Upper extremity injuries are observed in the French and Spanish hospitalised car users, but not for Dutch ones. Pelvis / urogenital injuries are frequent in Spanish casualties, while abdomen injuries are quite frequent in French casualties only. As regards to MAIS 2 hospitalised car users, proportions between the three data sets according to the body region are similar. The most frequently injured

PENDANT Deliverable D9 WP3 - Data analysis
Project funded by the European Community under the ‘Competitive and Sustainable Growth’ Programme (1998-2002)
Page 22
region is the head, mainly because of losses of consciousness in the French and Dutch data. The second most frequent is the upper extremity, the lower extremity coming right after. Proportions of casualties with chest and spine injuries are above 10% (but 6% in Spanish casualties as regards the chest). The proportions of car user casualties with spine injury are quite high, and more or less comparable for the 3 datasets, especially those being MAIS2 or MAIS4. Interpretation: Here again, we see some large discrepancies between the Dutch and the other two distributions, as regards to AIS3 injuries (very low proportion of upper arm injuries, high proportion of brain traumatic injury). The high proportions of spine injuries seem typical for car occupants (drivers?), since we do not observe these for the other road user categories.

PENDANT Deliverable D9 WP3 - Data analysis
Project funded by the European Community under the ‘Competitive and Sustainable Growth’ Programme (1998-2002)
Page 23
Motorised two-wheelers
Table 15 shows that most of hospitalised motorised 2-wheelers are males, with the highest proportion seen in the French data. The age distributions are quite similar across datasets, except for the youngest (less than 15 years of age) that show a higher proportion in the French data (these casualties must be involved as passengers, as they are not supposed to be riders).
Table 15: sex and age distribution for all hospitalised motorised 2-wheelers
Motorised 2-wheelers FR NL ES
Number of victims 1910 15421 1555
% males 89.7 80.4 78.0
Age group
0-14 8.3 2.4 0.6
15-24 44.3 47.9 46.5
25-34 21.8 18.7 31.9
35-44 15.1 13.9 13.3
45-54 7.9 8.9 4.6
55-64 1.7 4.1 1.8
65-74 0.8 2.4 0.7
75 + 0.3 1.8 0.6
Total number 1912 15421 1628
Table 16: proportion of hospitalised with MAIS2+ and injured body region according to the three
data sets – Motorised 2-wheelers
Motorised 2-wheelers FR NL ES
% of hospitalised with MAIS2+ 88.7 88.9 58.6
Body region: % victims with MAIS2+ Head 24.8 26.8 15.8
Face 1.1 2.3 0.1
Neck 0.1 0.0 0.0
Spine 5.0 4.0 3.3
Chest 8.6 8.3 1.3
Abdomen 7.6 5.4 2.1
Pelvis / urogenital 5.1 4.2 2.4
Upper extremity 32.3 20.4 24.1
Lower extremity 40.1 42.6 50.8
The percentages of hospitalised motorised two-wheelers suffering from one AIS 2+ injury are quite similar in the French and Dutch casualties, and lower in the Spanish ones. The most frequently injured body region is the lower extremity. The second and the third most frequent ones are the upper extremity and the head in the French and Spanish data, and in reverse order in the Dutch data. Other body regions, i.e. chest, abdomen, pelvis and spine, are less often injured.

PENDANT Deliverable D9 WP3 - Data analysis
Project funded by the European Community under the ‘Competitive and Sustainable Growth’ Programme (1998-2002)
Page 24
Table 17: number of victims, mean numbers of injuries and proportions of victims suffering from
at least one injury with the specified severity according to nature and body region - Motorised 2-
wheelers
Motorised 2-wheelers AIS 2 AIS 3 AIS 4+
Country FR NL ES FR NL ES FR NL
number of victims 846 9207 722 704 3787 177 144 711 mean number of injuries with this AIS 1.5 1.4 1 1.39 1.21 1 1.56 1.1
mean number of all injuries 2.56 1.65 1.25 3.18 2.42 1.27 5.83 3.13 % with this AIS as maximum severity 44.3 59.7 46.4 36.9 24.6 11.4 7.5 4.6
Injury Nature Fractures 66.7 72.6 71.6 88.2 69.6 94.4 4.2 1.6
Internal organ 37.9 31.7 20.2 16.2 37.7 4.5 94.4 85.8
Injury Body Region Head 35.3 26.6 18.7 6.8 26.5 1.1 50.7 31.9
Trauma Brain Injury 0.1 5.8 15.5 5.5 25.8 1.1 49.3 30.1
Loss of consciousness 35.3 20.8 3.2 1.3 0.6 0.7 0.7
Face 2.3 3.4 0.1 0.1
Neck 0.1 0.1
Spine 6.3 5.1 3.5 2.3 1.0 2.8 10.4 6.1
Chest 2,4 3,3 0,8 10,7 17,6 2,8 35,4 24,1
Abdomen 6,9 5,1 1,8 7,4 0,2 0,6 13,2 38,0
Pelvis / urogenital 5,0 3,2 0,8 5,5 7,3 9,0 3,5 0,8
Upper extremity 38,9 28,8 25,4 31,0 3,8 20,9
Shoulder / upper arm 17,4 14,8 15,1 23,4 1,6 1,1
Forearm / elbow 11,4 7,2 7,1 13,4 1,6 19,2
Hand / wrist / fingers 18,0 11,3 2,9 5,3 1,2
Lower extremity 33,9 42,3 48,8 55,4 51,3 62,7 1,4 0,7
Upper leg / thigh 0,5 0,0 28,6 45,0 45,2 1,4 0,7
Knee 8,3 6,0 5,6 1,0
Lower leg / ankle 17,9 33,8 38,6 29,6 7,5 5,7
As regards to MAIS 4+ motorised 2-wheelers casualties, the most frequently injured body region in the French casualties is the head, followed by the chest and the abdomen. In the Dutch casualties, the most frequently injured body region is the abdomen, followed by the head and the chest. As regards to MAIS 3 motorised 2-wheelers casualties, the lower extremity is the most frequently injured body region (but mainly upper leg / thigh in the Dutch and Spanish data, while it is evenly balanced between upper and lower leg in the French ones). The upper extremity comes next, except in Dutch casualties where it is the head. For chest and abdomen regions, proportions are in opposite ranking in the French and Dutch data, while they are very low in the Spanish ones. Proportion of injuries in the pelvis region is higher in the Spanish data. As regards to MAIS 2 motorised 2-wheelers casualties, Dutch and Spanish data show a high frequency of lower extremity injuries (mainly the lower leg / ankle region), followed by upper extremity injuries and head injuries.

PENDANT Deliverable D9 WP3 - Data analysis
Project funded by the European Community under the ‘Competitive and Sustainable Growth’ Programme (1998-2002)
Page 25
French data show quite similar percentages for these three body regions, but with the highest frequency in upper extremity injuries. Let us note that, once again, AIS 2 head injuries are mainly loss of consciousness. Interpretation: if we put together AIS 3 and 4 + for French and Dutch data concerning chest and abdomen injuries, the percentages are quite similar: respectively 14.9% and 18.6% of chest injuries and 8.4% and 6.1% of abdomen injuries. A possible explanation of the observed discrepancies could then be some lack of precision in the assessment of the severity level.

PENDANT Deliverable D9 WP3 - Data analysis
Project funded by the European Community under the ‘Competitive and Sustainable Growth’ Programme (1998-2002)
Page 26
Cyclists
Table 18 shows that among Dutch hospitalised cyclists there are as many males as females, whereas there is a majority of males among the French ones. The age distributions are also completely different: quite flat in Dutch casualties, whereas half the French casualties are less than 15 years old.
Table 18: sex and age distribution for all hospitalised cyclists
Cyclists FR NL
Number of victims 1163 33102
% males 78.5 51.8
Age group
0-14 53.8 17.5
15-24 14.9 11.0
25-34 8.8 7.9
35-44 7.6 9.2
45-54 6.5 12.1
55-64 4.0 11.8
65-74 3.1 15.5
75 + 1.5 14.2
Total number 1161 33102
Table 19 shows a higher proportion of casualties suffering at least from one AIS 2 injury in the Dutch data. As regards to MAIS 2+ casualties, the most frequently injured body regions are the head and the upper and lower extremities, but while the proportions are similar for the head, they are in opposite ranking for the extremities: mainly lower extremities in Dutch casualties and mainly upper extremities in French ones. All other body regions are injured in less than 4% of casualties.
Table 19: proportion of hospitalised with MAIS2+ and injured body region according to the three
data sets – Cyclists
Cyclists FR NL
% of hospitalised with MAIS2+ 76.1 89.7
Body region: % victims with MAIS2+
Head 36.5 31.7
Face 3.8 3.3
Neck 0.0 0.0
Spine 3.6 3.3
Chest 2.6 4.6
Abdomen 4.4 2.2
Pelvis / urogenital 2.1 3.9
Upper extremity 43.1 19.6
Lower extremity 16.3 37.7

PENDANT Deliverable D9 WP3 - Data analysis
Project funded by the European Community under the ‘Competitive and Sustainable Growth’ Programme (1998-2002)
Page 27
Table 20: number of victims, mean numbers of injuries and proportions of victims suffering from
at least one injury with the specified severity according to nature and body region - Cyclists
Cyclists AIS 2 AIS 3 AIS 4+
Country FR NL FR NL FR NL
number of victims 587 18933 251 9862 47 883
mean number of injuries with this AIS 1.29 1.25 1.33 1.08 1.23 1.07
mean number of all injuries 2.25 1.42 2.35 1.52 4.32 2.28
% with this AIS as maximum severity 50.5 57.2 21.6 29.8 4.0 2.7
Injury Nature
Fractures 60.3 66.8 85.7 76.7 1.9 Internal organ 43.1 36.3 17.5 27.7 100.0 89.6
Injury Body Region Head 41.7 34.3 16.3 24.9 78.7 53.9
Trauma Brain Injury 0.7 4.2 13.9 24.3 74.5 51.9
Loss of consciousness 40.7 30.1 2.0 0.7 2.1 0.6
Face 5.6 5.2 0.4 0.0
Neck 0.0
Spine 4.4 4.6 1.6 0.8 4.3 4.8
Chest 0.0 2.4 6.8 7.3 12.8 20.2
Abdomen 4.1 2.3 4.4 0.1 8.5 21.7
Pelvis / urogenital 2.2 2.6 2.4 6.8 0.3
Upper extremity 43.4 29.8 50.2 1.9
Shoulder / upper arm 26.1 12.1 37.9 0.5
Forearm / elbow 10.6 8.9 21.1 0.9
Hand / wrist / fingers 15.5 11.3 11.2 0.8
Lower extremity 13.5 27.8 25.9 60.2
Upper leg / thigh 0.9 12.4 59.1
Knee 2.4 2.1
Lower leg / ankle 7.0 25.3 13.6 1.1
As regards to MAIS 4+ cyclist casualties the most frequently injured body region is the head. The other two main locations are the chest and the abdomen, but more often so in Dutch casualties. As regards to MAIS 3+ cyclist casualties, 60% of Dutch casualties suffer from an injury at the lower extremity, compared to only 12% of the French ones. On the contrary, 50% of French casualties suffer from an upper extremity AIS 3 injury, and nearly nobody in Dutch casualties. Head injuries come third. As regards to casualties with at least one AIS 2 injury, loss of consciousness is the most frequent injury in Dutch casualties, followed by upper and lower extremity, and mainly the lower leg / ankle region. This is the same in the French data, but still with a higher proportion of upper extremity injuries. Interpretation: The large difference in age distribution could explain the differences observed in the distribution of extremity injuries; young casualties could be more often involved in bicycle falls (alone), while adults could be more often involved in collisions with vehicles (and therefore hit by the vehicle which means more often hit directly on the lower extremities). On the other hand we

PENDANT Deliverable D9 WP3 - Data analysis
Project funded by the European Community under the ‘Competitive and Sustainable Growth’ Programme (1998-2002)
Page 28
recognize much the same kind of differences as we found for the other types of road user (tables 9, 13, 16), concerning brain injuries and upper arm injuries for the MAIS3 casualties.

PENDANT Deliverable D9 WP3 - Data analysis
Project funded by the European Community under the ‘Competitive and Sustainable Growth’ Programme (1998-2002)
Page 29
Some considerations about non-hospitalised for French and Spanish data
Table 21 shows characteristics of pedestrians, car users and motorised 2-wheelers among French and Spanish non-hospitalised casualties. Because the mean level of severity is lower than for the hospitalised, more details are given concerning the nature of injuries and the body region.
Table 21: number of victims, mean numbers of injuries and proportions of victims suffering from
at least one injury according to nature and body region - Non hospitalised - All AIS (including AIS
1 injuries)
Pedestrians Car users Motorised 2-
wheelers
Country FR ES FR ES FR ES
number of victims 3284 6997 23629 10646 7777 15685
mean number of all injuries 1.84 1.34 1.63 1.18 1.83 1.32
Injury Nature Fractures 15.6 15.8 7.2 4.9 18.2 12.7 Sprains and strains 21.6 10.1 38.1 47.6 26.4 12.9 Internal organ 3.1 13.3 2.0 8.8 1.6 4.3 Open wounds 37.7 8.8 22.9 4.5 43.2 6.4 Superficial contusions 63.6 67.3 57.4 43.6 56.5 73.4
Injury Body Region Head 16.0 15.7 15.6 9.6 4.9 4.8
Trauma Brain Injury 4.8 11.7 8.1 8.3 2.6 3.8
Loss of consciousness 2.8 2.6 1.5 0.7 1.3 0.7
Other head injury 9.6 2.2 7.0 0.7 1.2 0.3
Face 16.4 4.6 14.0 3.0 5.1 1.5
Neck 3.8 0.1 20.4 0.0 4.0 0.0
Spine 7.3 5.5 34.2 46.6 6.2 6.7
Cervical 5.0 4.8 31.5 46.0 4.6 6.3
Thoracic / dorsal 0.5 0.2 0.9 0.1 0.3 0.1
Lumbar 2.0 0.3 3.2 0.6 1.4 0.1
Chest 8.5 6.1 21.6 9.0 7.5 3.8
Abdomen 4.7 0.7 4.0 0.7 4.1 0.5
Pelvis / urogenital 0.9 0.5 0.2 0.1 0.3 0.4
Upper extremity 31.5 18.4 20.0 9.8 44.1 21.6
Shoulder / upper arm 13.1 6.1 6.4 3.7 20.4 6.3
Forearm / elbow 7.1 6.3 6.3 2.0 8.7 4.9
Hand / wrist / fingers 2.9 4.6 1.8 3.4 6.3 9.2
Other upper extremity injury 11.5 2.2 7.2 1.0 14.5 2.3
Lower extremity 62.1 30.0 19.6 8.6 62.4 28.4
Hip 7.3 1.7 1.9 0.5 6.1 1.2
Upper leg / thigh 0.4 1.4 0.1 0.3 0.3 0.6
Knee 18.1 5.3 8.5 2.9 22.5 7.3
Lower leg / ankle 16.0 8.7 3.4 2.0 14.4 7.6
Foot / Toes 2.9 6.2 0.5 0.9 3.6 4.6
Other lower extremity injury 28.9 8.6 7.3 2.4 30.3 9.8
Unspecified injury 8.95 33.49 2.9 16.4 15.9 45.1

PENDANT Deliverable D9 WP3 - Data analysis
Project funded by the European Community under the ‘Competitive and Sustainable Growth’ Programme (1998-2002)
Page 30
These data constitute the majority of the data gathered in the French and Spanish datasets. Missing injury descriptions are more frequent than for hospitalised casualties, but some interesting comments can nevertheless be made. Considering the nature of injuries, the most frequent ones are superficial contusions, open wounds, sprains and strains (with a high proportion in the Spanish data). Let us note that the proportions of non-hospitalised casualties sustaining a fracture are rather high in pedestrians and motorised 2-wheelers. The high proportion of sprains and strains injuries, especially in car occupants, is mainly due to whiplash injuries. The most frequently injured body region is the lower extremity in pedestrians and motorised 2-wheelers (mainly knee and lower leg injuries), followed by the upper extremity. In car users, the first occurrence is the spine, more precisely the cervical spine, which means mainly whiplash injury, followed by the upper and lower extremity.
PENDANT Deliverable D9 WP3 - Data analysis
Project funded by the European Community under the ‘Competitive and Sustainable Growth’ Programme (1998-2002)
Page 31
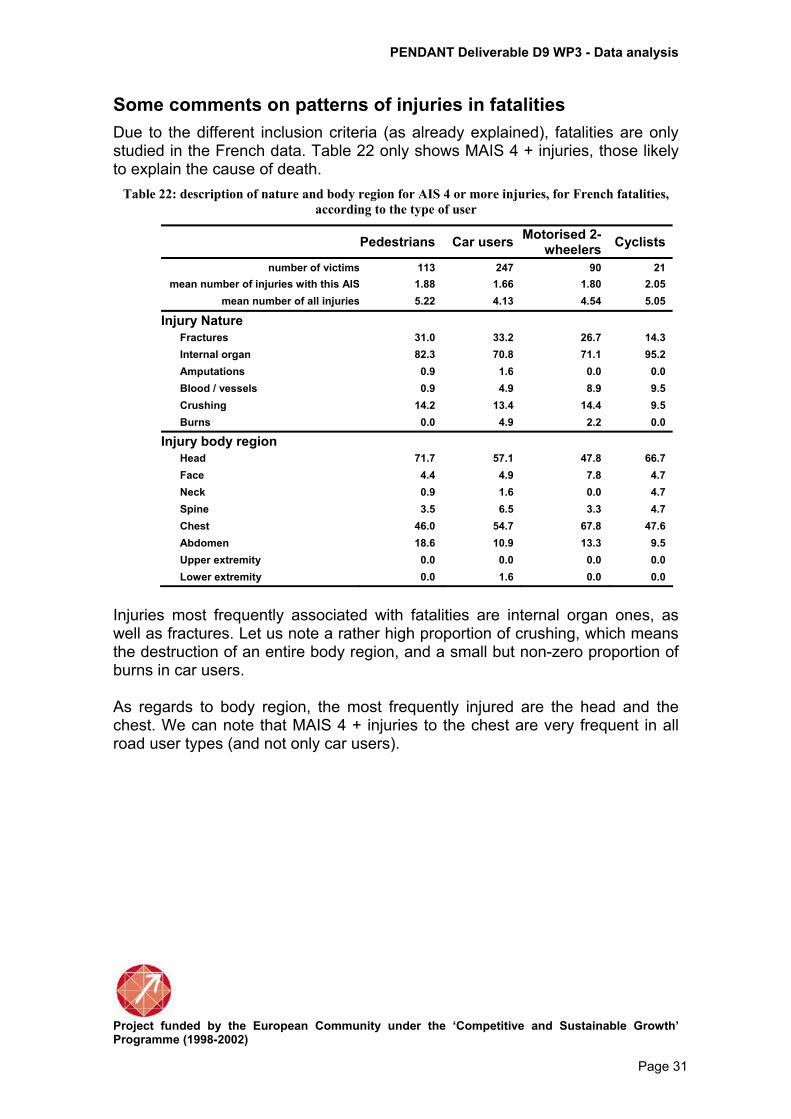
Some comments on patterns of injuries in fatalities
Due to the different inclusion criteria (as already explained), fatalities are only studied in the French data. Table 22 only shows MAIS 4 + injuries, those likely to explain the cause of death.
Table 22: description of nature and body region for AIS 4 or more injuries, for French fatalities,
according to the type of user
Pedestrians Car users Motorised 2-
wheelers Cyclists
number of victims 113 247 90 21
mean number of injuries with this AIS 1.88 1.66 1.80 2.05
mean number of all injuries 5.22 4.13 4.54 5.05
Injury Nature
Fractures 31.0 33.2 26.7 14.3
Internal organ 82.3 70.8 71.1 95.2
Amputations 0.9 1.6 0.0 0.0
Blood / vessels 0.9 4.9 8.9 9.5
Crushing 14.2 13.4 14.4 9.5
Burns 0.0 4.9 2.2 0.0
Injury body region
Head 71.7 57.1 47.8 66.7
Face 4.4 4.9 7.8 4.7
Neck 0.9 1.6 0.0 4.7
Spine 3.5 6.5 3.3 4.7
Chest 46.0 54.7 67.8 47.6
Abdomen 18.6 10.9 13.3 9.5
Upper extremity 0.0 0.0 0.0 0.0
Lower extremity 0.0 1.6 0.0 0.0
Injuries most frequently associated with fatalities are internal organ ones, as well as fractures. Let us note a rather high proportion of crushing, which means the destruction of an entire body region, and a small but non-zero proportion of burns in car users. As regards to body region, the most frequently injured are the head and the chest. We can note that MAIS 4 + injuries to the chest are very frequent in all road user types (and not only car users).

PENDANT Deliverable D9 WP3 - Data analysis
Project funded by the European Community under the ‘Competitive and Sustainable Growth’ Programme (1998-2002)
Page 32
Discussion
Common points between the three data sets
Despite all the differences in inclusion criteria and injury coding processes, some common points between the three datasets can be highlighted. These can be considered as the most interesting result of this study, as they provide consistent estimates of injury patterns. As regards to age and sex distributions, car users are very similar across datasets, as well as pedestrians. Casualties are more often men, and the proportion of males is very high in motorised two-wheelers casualties, especially in French data. This most probably reflects the differences in exposure (e.g. motorised two-wheelers are mostly men in France). As regards to cyclists, French and Dutch casualties probably do not come from the same cycling population at all, as mainly young men are involved in France, whereas males and females are equally involved and at any age in the Netherlands. Among all road casualties, a great majority suffer from injuries with AIS 2 or more. This is true but with a lower figure in Spanish casualties, which will be commented below. As regards to MAIS 2 + casualties, patterns of injuries in car occupants are quite different from the other casualties. For them, the most frequently injured body region is the head, followed by the thorax (except in the Spanish data). Lower and upper extremities follow in very similar proportions. Injuries to the pelvis and the abdomen are also observed, but in lower proportions. In pedestrians and motorised 2-wheelers, the lower extremity is the most frequently injured body region, followed by the head and the upper extremity, this rank being reversed in motorised 2-wheelers (except in the Netherlands). Results for cyclists are quite discordant and will be discussed below. Let us note that motorised two-wheelers are the least injured to the head. This should mean that they most often wear a helmet and that this is efficient (even if they are obviously injured elsewhere, as the data only includes those injured). This gives some idea about what improvement could be obtained if cyclists wear a helmet. If we now consider patterns of injuries separately according to the level of severity, some global results can be given. The most severe injuries (AIS 4 +) are head injuries, followed by thorax injuries. This is true for all types of road users, except in car users where thorax comes first. A quite high proportion of severe abdomen injuries is also observed, but only in Dutch casualties.
PENDANT Deliverable D9 WP3 - Data analysis
Project funded by the European Community under the ‘Competitive and Sustainable Growth’ Programme (1998-2002)
Page 33
As regards to MAIS 3 casualties, the car users category is also different from the others. Thorax injury is the most frequent, followed by lower and upper extremity injuries. For other road user categories, the highest proportion is lower extremity injuries followed by head injuries. As regards to MAIS 2 casualties, pedestrians suffer from lower extremity injuries, followed by head and upper extremity injuries. Car users suffer from head, followed by upper extremity and lower extremity injuries. We can also note a higher proportion of spine injuries compared to the other road user categories. Motorised 2-wheelers suffer first from lower extremity, secondly from upper extremity injuries. Head injury only comes in the third place. Cyclists most often suffer from head injuries, followed by upper extremity and lower extremity injuries. Let us note that, at this severity level, a large majority of head injuries are actually losses of consciousness.

PENDANT Deliverable D9 WP3 - Data analysis
Project funded by the European Community under the ‘Competitive and Sustainable Growth’ Programme (1998-2002)
Page 34
Comments on discrepancies
We have chosen to mainly focus our analysis on hospitalised casualties, because they are the only ones available in the 3 datasets, because Dutch data are restricted to hospitalised casualties. In spite of the selection of a common group, observed levels of severity are quite different across the three data sets: for pedestrians, motorised two-wheelers and car users, the MAIS 4 + casualty proportion is about 1% in Spanish data, 5% in Dutch data (2% in cyclists) and 8% in French data (4% in cyclists). These differences of mean severity in hospitalised casualties can come from different definitions of who is considered hospitalised. This designation can mean "hospitalised for 24 hours or more", or hospitalised at least one night. If we consider that Dutch casualties are truly hospitalised as data only come for hospitals discharge records, it is possible that the selection criteria for French data were too severe, and that the selection criteria for Spanish data were not severe enough. It can also reveal that hospitalisation policies are very different from one country to another. We lack detailed facts and figures to estimate to what extent differences in health policies or in selection criteria can explain these discrepancies. Given how big these differences are, we believe that it is more a question of a difference in the definition of "hospitalised" than a consequence of the different ways in which road casualties are taken into care. Also, the number of injuries allowed to be recorded for any given casualty differs between the three registration systems: the French system allows the highest number, the Spanish the lowest (maximum of 3), while the Dutch system allows a maximum of 9. The analysis has been conducted in order to mitigate the corresponding effects (by focusing on the “worst injuries” at a given severity), but perhaps not completely. Discrepancies between our data can also come from the different codification systems. This can happen because of different mechanisms: − Levels of details for the description of injuries are sometimes slightly
different according to the codification used. For example, AIS 90 code allows a very precise description of head injuries, as well as losses of consciousness. Conversely, ICD 9 code is more detailed for the description of pelvis injuries. − Because of these differences in precision, the same pattern of injuries can be coded by different numbers of injuries according to the AIS or ICD code. The ICDMAP software use, and the fact that injury description is given by level of severity (for example, only AIS 3 injuries described when considering MAIS 3 casualties) should have minimised these possible differences, but probably not completely. − For some injury locations and despite of the point stated above, descriptions of casualties with MAIS 2 + appear sometimes more coherent than when they are split into the three categories MAIS 2, MAIS 3 and MAIS 4+. A possible reason is a shift in AIS level when translating from ICD to AIS. This can be a partial explanation for the differences, for example, between Dutch and French data for MAIS 3 and MAIS 4 + head injured casualties (higher

PENDANT Deliverable D9 WP3 - Data analysis
Project funded by the European Community under the ‘Competitive and Sustainable Growth’ Programme (1998-2002)
Page 35
MAIS 3 and lower MAIS 4 + proportions for Dutch compared to French casualties, for each type of road user), or for abdomen injuries for car users. In this way, Dutch and Spanish observations must be coherent and different from French ones. This can only be checked when comparing MAIS 2 and MAIS 3, as the number of MAIS 4+ casualties is too low in Spanish data to be considered. − Internal organ injuries are not always diagnosed through a clinical exam without radios or medical imaging results. This can explain why the proportion of this type of injury is so low in Spanish data (with only emergency units information). This can also explain their small number of MAIS 4 + casualties.
At this stage, many differences between the three study samples remained unexplained. The point is then to try to distinguish, on the one hand, true differences due to differences in characteristics of the three populations (in terms of exposures, risks, etc.) and, on the other hand, differences due to reasons for which we have been unable to identify the origin. Some examples are listed below: − For MAIS 3 casualties, similar proportions for extremity injuries between
French and Dutch data, but mainly upper leg injuries in the Dutch data while balanced between upper and lower leg in the French casualties. − Very few AIS 3 upper extremity injuries in the Dutch casualties. − High proportions of AIS3 trauma brain injuries in the Dutch casualties. − More pelvis injuries in Spanish casualties.

PENDANT Deliverable D9 WP3 - Data analysis
Project funded by the European Community under the ‘Competitive and Sustainable Growth’ Programme (1998-2002)
Page 36
Chapter 2 Linkage processes and results
In this chapter, the three linking processes as used for this project in France, Spain and the Netherlands, and their results are shortly reviewed, based on the three separate and more complete descriptions from the three partners (see Annexes 1 - 3).
Main differences between countries/sources
While the hospital data from Spain and France is both from in- and out-patients, with emphasis on out-patients, that of the Netherlands covers in-patients only. The Spanish and French data is gathered in restricted area's, surrounding respectively Barcelona and Lyon. The Dutch data covers all of the Netherlands. This means for instance that the Spanish hospital data is based on 7 available hospital emergency departments (DUHAT), the French data include hospitals, emergency departments, and other health care facilities in the area, a total of 150 facilities. In the Netherlands all 110 hospitals provide the hospital data. As far as police data is concerned, in Spain the Barcelona Police Department (GUB) provides the data of traffic accidents mainly from out of Barcelona. In France, The Rhone county police data are used, as well as reports from Fire brigades. In the Netherlands the central registration of traffic accidents from the Ministry of Transport is used, fully based on police information from the Netherlands.
The linking processes
Though the three linking processes have the same purpose, they are not similar. The Spanish process is mainly probabilistic, and partly deterministic; the process is fully computerised; the French system is mainly manual, greatly facilitated by computer software and based on probabilistic way of thinking; the Dutch system is so-called distance based linking, which more or less follows a probabilistic approach; it is also fully computerised. In Spain some final decisions are made by hand to determine whether linked records are indeed from the same casualties, in the Dutch case this type of decision is built in the process using the distance function and an automatically generated quality indicator, leaving 52% of all linked records as properly linked. See further details in the separate descriptions. Key variables used in the three processes are very similar: Date of birth, gender, date of accident were used by all as the most important variables; Spain and France also used vehicle type of the casualty; Spain and Netherlands used hospital (name). Location of crash was also considered important in France, while Spain used position.

PENDANT Deliverable D9 WP3 - Data analysis
Project funded by the European Community under the ‘Competitive and Sustainable Growth’ Programme (1998-2002)
Page 37
It is noticeable that the numbers of records from the two main data sources (police and hospital) used in Spain are largely similar, while in France the number of hospital records is about twice as large as the police ones. However in the Netherlands the number of police records is far greater the number of hospital records (which do not contain out-patients). In the following Table 23, the numbers of records from 2 data sources for each country are given (police and hospital), used for linking. Also the numbers of linked records are shown. All further detail is in the Annexes to this report concerning the linking processes.
Table 23 : Overview of the numbers of records from two data sources (police and hospital), used for
linking, and linking results, according to country
Spain France Netherlands Years linked
Data source
(2002-2004) (1997-2003) (2001-2003)
Police killed 123 801 3,008
seriously injured 1,008 3,784 32,643 slightly injured 17,455 25,714 83,385
unknown severity 21,618 - 4,440 total 40,204 30,299 124,476
Hospital killed 49 884 980
in-patients 2,926 11,033 50,420 out-patients 34,088 56,032 NA
other/unknown 5,503 1,879 NA total 42,566 69,828 51,420
Linked killed 26 735 635
in-patients 1,294 5,089 22,270 out-patients 14,599 13,409
other/unknown 1,611 807 667 total 17,530 20,040 24,172
* estimated Table 23 shows that the resulting number of linked records are more or less similar (roughly around 20,000), given the different periods used. However, emphasis in Spain and France is clearly on out-patients. Since their numbers are not only large, but also medical information is available, it was decided to use these both linked data from hospitalised (for all three countries) and linked data from non-hospitalised (Spain and France) for further analyses (Chapter 3). The following table provides percentages for some of the numbers from Table 23.

PENDANT Deliverable D9 WP3 - Data analysis
Project funded by the European Community under the ‘Competitive and Sustainable Growth’ Programme (1998-2002)
Page 38
Table 24: The relative numbers of linked records, according to source (police or hospital), severity,
and country
Data source Spain France Netherlands
Linked (% of police) Killed 35.0 85.9 21.1
Seriously injured 59.9 75.2 52.9 Slightly injured 31.5 60.2 6.7
Non-injured 0.0 4.2 - Unknown 52.9 - 15.0
Total 22.2 (N=17,530) 37.1 (N=20,040) 19.4 (N=24,172)
Linked (% of hospital) Killed 53.1 83.0 Not known
In-patients 44.2 45.9 45.8 Out-patients 42.8 23.8 NA
Other/unknown 29.3 42.8 NA Total 41.2 (N=17,530) 28.7 (N=20,040) 45.8 (N=24,172)
As we know, both the two previous tables contain different kinds of numbers of linked records: for Spain and France the numbers include both in- and out-patients, while for the Netherlands only records of hospitalised are linked, given the hospital data source. In general however, Table 24 shows that records of seriously injured (police severity estimate) are (far) better linked than records of slightly injured. In view of the differences between the data sources mentioned before, the similarity of the percentages of linked records of in-patients (about 45%) is striking. 24% of the number of slightly injured from the Dutch police sample could be linked to records of hospitalised from the hospital sample, which tells us that police is not always right in their severity judgement. The fact that only 47% of the killed casualties could be linked is not strange, since the majority of the killed traffic casualties die on the street, and are therefore not transported to a hospital.
Linking results
As far as the medical information from the linked data is concerned (as illustrated in table 25 by MAIS).
Table 25 : The relative numbers of casualties from the linked and the hospitalised sample, according
to MAIS and country
Spain France Netherlands MAIS distribution Linked Hospital Linked Hospital Linked Hospital
No injury 0 29.9 37.9 1 23.0 16.3 12.3 17,5 15.6 14.0 2 30.2 29.3 45.4 47.7 47.1 49.6 3 6.0 6.1 31.1 26,7 23.8 24.8 4 0.8 0.8 7.9 5,6 2.8 2.4 5 0 0 2.9 1.8 2.2 1.6 6 0 0 0 0 0.1 0.1
Unknown severity 9 10.2 9.7 0.4 0.7 8.4 8.5
All N=1,294 N=2,926 N=5,006 N=11,033 N=23,541 N=51,420

PENDANT Deliverable D9 WP3 - Data analysis
Project funded by the European Community under the ‘Competitive and Sustainable Growth’ Programme (1998-2002)
Page 39
Table 25 shows that the majority of all casualties from the different data samples has MAIS 1 or 2 injuries. In case of the Spanish data, this would be even more apparent if the records of casualties having no injuries (MAIS=0) is left out. The differences between distribution from linked and from hospitalised are rather small in all three countries. However it is also clear that there are differences between the Spanish data on the one hand, and the French and Dutch on the other, whose distributions agree largely with regard to the percentages of MAIS 1-3. Then the French data show some higher percentages of MAIS 4 than the Dutch data. The Spanish hospitalised casualties, even if not corrected for no-injury cases, are considerably less severely injured than those from both other samples.
Differences between linked and non-linked data (police bias)
Both in France and the Netherlands, it was already established that police reported accidents are both incomplete (a large amount of underreporting), and biased (towards the more severe accidents) as illustrated by the following observations from France (see also Annex 1): Police under-reporting of road casualties and its associated risk factors have been studied using a multivariate analysis (Amoros et al. 2006). It was mainly shown that : 1) police under-reporting is inversely and strongly associated with injury severity, 2) police under-reporting is strongly related to both road user type and involvement of a third party. Casualties in crashes involving a third party (pedestrian or another vehicle) are more police –reported than those without; cyclists are far less police-reported than other road users types. 3) police under-reporting is strongly associated with the combination of road type, crash environment (metropole vs. rural area) and police force area (there are 3 different police forces). More or less the same goes for the Netherlands where it is also apparent that completeness is not evenly distributed among types of road user, favouring motorised traffic modes, and multi-vehicle accidents, while neglecting (not-motorised) two wheelers: cyclists. However in Spain, the linking of motorised two-wheelers and cyclists appeared to be better than average.
Conclusions regarding linked data with respect to representativeness
France - The linked dataset of hospitalised casualties are somewhat different from the hospitalised casualties in the registry (which is assumed to be representative of the road hospitalised casualties in the Rhone county) : they include far fewer cyclists, slightly more car occupants, they are somewhat older (fewer children especially) and they are somewhat more seriously injured.

PENDANT Deliverable D9 WP3 - Data analysis
Project funded by the European Community under the ‘Competitive and Sustainable Growth’ Programme (1998-2002)
Page 40
Spain - The linked dataset of in-patient casualties are somewhat different from the hospitalised casualties. They include more two wheels motor vehicle users and more pedestrians, they are somewhat older, and more females. The linked dataset of all injured casualties are also somewhat different from all injured who attended the hospital emergency department. There are more car occupants, two wheels motor vehicle users and more pedestrians, and fewer cases with unknown road user type. There are no differences by age, sex and severity distribution.
Netherlands - The linked data is more or less comparable to the police registration with regard to most of the variables shown, and less comparable to the hospital registration. This means that as far as representativeness is concerned the linked data are not fully representative of the Dutch situation with regard to hospitalised traffic casualties. There are for instance more car occupants and less cyclists in the linked sample than in the hospital sample (which is considered representative). With regard to injury severity and injury location, we find considerable less difference between the linked data and the hospital data than could be expected in view of the previous conclusions. The linked data appear to be representative in that respect.

PENDANT Deliverable D9 WP3 - Data analysis
Project funded by the European Community under the ‘Competitive and Sustainable Growth’ Programme (1998-2002)
Page 41
Chapter 3 Analysis of linked data
The aim of this chapter is to take advantage of information coming from the police and hospitals to study possible relationships between crash characteristics and resulting injury patterns and severities. Characteristics of the three hospital data sets are given in the chapter 1 and the methodology of linking procedures is detailed in the chapter 2. Among many possible analyses, the choice has been made to focus the following analyses on two crash configurations: car-to-car crashes, with two and only two cars involved (and no pedestrian), and car to pedestrian accidents. Indeed having the availability of both crash characteristics and medical data seems very promising when concerned by these two issues. Specific objectives are:
1. To describe the effect of the impacted area on the patterns of injuries among car driver involved in car-to-car collisions.
2. To identify the associated factors with injury severity among drivers in car-to-car collisions.
3. To estimate risk factors for a car driver involved in a car-to-car crash to sustain a whiplash.
4. To identify the factors associated with injury severity of pedestrians. Table 26 shows all accident and casualty numbers in our three data sources. The status "hospitalised" comes from hospital data, while only police data include non injured people (which is always filled in for car drivers while the completeness is more doubtful for car passengers).
Table 26: numbers of accidents and casualties observed in hospital and police data
Accident Involved Injured hospitalised fatalities Non injured
French data (1997-2003, Rhône county)
Hospital data 62416 72419 11514 884
Police data 22086 53950 30296 801 23654
Common data 14932 20106
Dutch data (2001-2003, the Netherlands)
Hospital data 50420 980
Police data 100486 189888 121468 3008 65412
Common data 24172
Spanish data (2002-2004, Barcelona area)
Hospital data - 48502 3651 62
Police data 33253 78800 40204 123 38596
Common data 14429 15527

PENDANT Deliverable D9 WP3 - Data analysis
Project funded by the European Community under the ‘Competitive and Sustainable Growth’ Programme (1998-2002)
Page 42
Car-to-car collisions
Material and Methods
Car-to-car crashes are identified from police data. This assessment could not be made from hospital data, as information on drivers and their vehicles is only gathered when these drivers are injured themselves.
Table 27: numbers of accidents and casualties (drivers) involved in car-to-car crashes, observed in
the hospital data and the police data in France , Netherlands and Barcelona
Accidents
Involved drivers
Injured drivers
Non hosp. Hosp. MAIS3+ fatalities
French data (1997-2003, Rhône county)
Police data 5632 11264 6215
With car info 7558
Common data 3815 3941 3212 646 250 96
Dutch data (2001-2003, the Netherlands )
Police data 19038 38076 19442
With car info id id Id
Common data 0 2145 454
Spanish data (2002-2004, Barcelona area)
Police data 8442 20394 6123
With car info ??
Common data 2328 2522 2440 50 10 1
Table 27 shows, for French data for example, that 11264 drivers were involved in two-car crashes. Among them, 4899 are considered non injured by the police (and not found injured in the registry). Among the 6215 others, 3941 are identified in the registry, thanks to the linkage process. These injured people are considered hospitalised (646) or not hospitalised (3212). 150 have an unknown status. The classification of casualties is made according to the following rules: − For casualties identified in both data sources, the severity is assessed from
hospital data and can be classified into killed, hospitalised, or injured but non hospitalised (MAIS is then available). − For casualties only identified by the police, the severity can be classified into killed (if so in the police data), non injured (if so in the police data) or non hospitalised (if classified slightly or severely injured by the police).
Let us note that the impact area is not defined in the same way in the three databases. For the French and Dutch ones, it is defined from two variables: the type of collision (head-on, side-impact, rear, multiple) and the impacted area of each car (eight possibilities: front, front right, front left, right side, left side, rear, rear right, rear left). Hence, the three rear impacts are put together, front right is put with front except if the type of collision is coded as side impact (and correspondingly for left side). For the Spanish one, the only available information is the type of collision (without information for each vehicle

PENDANT Deliverable D9 WP3 - Data analysis
Project funded by the European Community under the ‘Competitive and Sustainable Growth’ Programme (1998-2002)
Page 43
separately). Moreover, for Spanish linked data, two problems arose due to the impact area: the first one is that it is difficult to attribute some pattern of injuries for one driver only from the type of collision (except in case of frontal-front crash); the second one is that because of missing values and because of the quite low number of hospitalised people available, the numbers are two low to draw interesting results.

PENDANT Deliverable D9 WP3 - Data analysis
Project funded by the European Community under the ‘Competitive and Sustainable Growth’ Programme (1998-2002)
Page 44
Pattern of injuries and impact area in car-to-car collisions
Method
Injury nature and body region is calculated in the same way as above (Comparison of patterns of injuries, chapter 1). The results are shown for hospitalised and non hospitalised casualties (excluding fatalities). They are not detailed according to the severity level because of the relative low number of hospitalised for French data. Because of the differences in definitions of the impact area explained above, and because of the differences in the numbers available according to our datasets, we have chosen to show separate analyses, one from French and Dutch observations dealing with hospitalised casualties, the other one from French and Spanish ones dealing with those non hospitalised. Results
Table 28 shows the patterns of injuries according to the impact area without distinction between the levels of severity, but only among hospitalised casualties. Spanish data are not shown, because it is too sparse after the linkage process when focusing on hospitalised, and all the more MAIS 3 + casualties. The most often injured body region is the head, with a very high proportion for right side impact. This is quite surprising but could be the result of more severe impacts resulting from higher impact speeds (refusal to give way on the right). The proportion is also very high for rear impact, but only for French observations (with a low number of cases). Most of these injuries are actually losses of consciousness. Chest injuries are the second more often injured region (very close to lower extremities for French data). This high frequency concerns all impact areas, except rear impacts where it is observed half as often. Lower extremities injuries are also quite frequent among hospitalised casualties, mainly for head-on impacts, with a quite equal distribution between upper leg, knee and lower leg injuries. Face and upper extremities injuries come after. Face injuries are more frequent for head-on impacts, and quite rare in case of rear impact for French observations. Upper extremities injuries are mainly the shoulder and the upper arm. Abdomen injuries are more frequent for left side impacts. This trend is even clearer for pelvis / urogenital injuries for this type of impact.

PENDANT Deliverable D9 WP3 - Data analysis
Project funded by the European Community under the ‘Competitive and Sustainable Growth’ Programme (1998-2002)
Page 45
Spine injuries, and especially cervical injuries, are mainly observed in case of rear impact.
Table 28 : number of victims, mean numbers of injuries and proportions of victims suffering from
at least one AIS 1 injury according to nature and body region and impact area – Hospitalised
drivers involved in car-to-car crashes
Country French data Dutch data
impact area Head-
on Rear left side
right side Total
Head-on Rear
left side
right side Total
number of victims 400 35 122 68 625 564 134 367 217 1282 Proportion of impact area 64.0% 5.6% 19.5% 10.9% 44.0% 10.5% 28.6% 16.9%
mean number of all injuries 3.51 2.57 2.82 3.31 3.30 2.34 1.60 1.92 1.88 2.06
Injury Nature Fractures 60.3 34.3 58.2 41.2 56.3 59.0 35.1 52.0 42.4 51.7 Sprains and strains 24.5 31.4 17.2 17.6 22.7 5.3 2.2 0.8 4.2 3.5 Internal organ 49.3 57.1 52.4 73.5 53.0 38.8 44.8 48.5 47.9 43.8 Open wounds 52.5 25.7 32.0 42.6 45.9 20.7 13.4 17.7 18.9 18.8 Superficial contusions 40.5 45.7 39.3 32.3 39.7 18.3 20.2 18.8 23.0 19.4
Injury Body Region Head 49.2 65.7 52.4 72.1 53.3 27.7 27.6 35.2 40.1 31.9
Trauma Brain Injury 12.0 14.3 11.4 22.1 13.1 7.3 6.7 5.7 7.4 6.8
Loss of consciousness 36.0 45.7 34.4 42.6 37.0 19.2 22.4 27.3 29.0 23.5
Other head injury 9.2 25.7 14.7 14.7 11.8 3.6 1.5 6.3 10.6 5.3
Face 37.2 5.7 20.5 27.9 31.2 20.0 14.9 13.1 13.4 16.4
Neck 5.0 11.4 5.7 4.4 5.5 0.0 0.0 0.0 0.0 0.0
Spine 20.2 42.9 22.9 20.6 22.1 6.7 19.4 7.4 7.4 8.4
Cervical 14.5 31.4 14.7 17.6 15.8 3.9 16.4 5.2 6.0 5.9
Thoracic / dorsal 2.7 0 3.3 0 2.4 2.0 1.5 2.2 0.0 1.6
Lumbar 3.7 11.4 5.7 2.9 4.5 1.4 1.5 0.3 1.4 1.1
Chest 40.2 14.3 37.7 42.6 38.6 32.6 16.4 30.3 31.3 30.0
Abdomen 22.2 25.7 37.7 29.4 26.3 10.5 7.5 16.4 9.2 11.6
Pelvis / urogenital 10.2 8.6 25.4 10.3 13.1 9.4 3.0 17.4 4.2 10.1
Upper extremity 30.5 31.4 32.0 20.6 29.8 21.8 15.7 12.8 19.8 18.3
Shoulder / upper arm 15.7 8.6 13.1 10.3 14.2 10.3 8.2 6.5 10.6 9.1
Forearm / elbow 12.2 11.4 13.9 5.9 11.8 5.7 1.5 1.9 2.8 3.7
Hand / wrist / fingers 5.0 8.6 3.3 2.9 4.6 7.6 4.5 3.3 4.6 5.5
Other upper extremity injury 6.7 2.9 6.6 4.4 6.2 2.3 3.0 1.9 3.7 2.5
Lower extremity 47.0 20.0 27.9 20.6 38.9 34.6 17.2 14.7 13.4 23.5
Hip 5.7 8.6 4.9 1.5 5.3 1.6 0.8 0.0 0.5 0.9
Upper leg / thigh 9.7 0 3.3 0 6.9 9.2 4.5 5.2 3.2 6.6
Knee 14.0 11.4 1.6 2.9 10.2 8.5 2.2 1.9 1.4 4.8
Lower leg / ankle 14.0 5.7 9.8 7.3 12.0 12.4 7.5 4.9 4.6 8.4
Other lower extremity injury 13.5 2.9 11.5 8.8 12.0 12.2 3.0 4.1 4.2 7.6
Table 29 shows the patterns of injuries according to the impact area without distinction between the levels of severity, but only among non hospitalised casualties for French and Spanish observations. The first remark from this table is that the distributions of impact areas are very different in each data set, with a very high proportion of rear impacts in Spanish data. A part of the explanation of this difference comes from the fact that there

PENDANT Deliverable D9 WP3 - Data analysis
Project funded by the European Community under the ‘Competitive and Sustainable Growth’ Programme (1998-2002)
Page 46
is the problem of the rear collisions definition in Spanish data, hence involving more often than not a rear impact for one vehicle and a frontal impact for the other one (without possibility to distinguish between both). Instead of 53.3%, the real number should be about 27%, and the number of head-on impacts should be around 62%, which is closer to French observations.
Table 29 : number of victims, mean numbers of injuries and proportions of victims suffering from
at least one AIS 1 injury according to nature and body region and impact area – Non hospitalised
drivers involved in car-to-car crashes
Country French data Spanish data
impact area Head-on Rear
Left side
Right side Total
Head-on Rear
Left or right side Total
number of victims 1696 464 555 349 3064 904 1141 87 2132 Proportion of impact area 55.4% 15.1% 18.1% 16.4% 42.4% 53.5% 4.1%
mean number of all injuries 1.9 1.5 1.8 1.7 1.8 1.4 1.3 1.3
Injury Nature Fractures 14.3 2.6 12.4 9.7 11.7 4.3 3.8 9.2 Sprains and strains 34.6 52.2 39.5 38.1 38.5 61.1 84.5 56.3 Internal organ 2.7 2.6 2.5 3.7 2.8 11.3 4.7 8.0 Open wounds 31.0 13.6 22.2 28.9 26.5 6.2 2.5 10.3 Superficial contusions 62.8 52.4 60.4 56.2 60.0 53.3 31.3 50.6
Injury Body Region
Head 16.7 15.7 19.8 18.6 17.4 13.6 5.4 13.8
Trauma Brain Injury 8.6 7.5 7.2 8.3 8.1 10.5 4.4 9.2
Loss of consciousness 2.4 1.7 2.3 3.4 2.4 0.8 0.4 0.0
Other head injury 6.8 6.9 11.5 8.9 7.9 2.3 0.7 4.6
Face 19.5 8.0 9.7 14.6 15.4 2.8 1.6 4.6
Neck 16.4 26.5 17.5 15.8 18.1 0.0 0.0 0.0
Spine 30.5 50.0 34.4 32.7 34.4 55.1 80.4 50.6
Cervical 28.2 46.3 31.0 27.5 31.4 52.2 74.8 47.1
Thoracic / dorsal 1.2 2.4 2.0 1.7 1.6 0.8 1.6 1.1
Lumbar 2.4 5.6 3.8 4.3 3.3 1.9 4.0 2.3
Chest 30.5 12.7 25.4 25.2 26.3 8.8 6.3 6.9
Abdomen 3.8 4.7 6.3 4.3 4.4 0.6 0.1 0.0
Pelvis / urogenital 0.3 0.0 0.7 0.0 0.3 0.2 0.0 0.0
Upper extremity 22.7 12.3 27.9 22.6 22.1 13.1 7.5 23.0
Shoulder / upper arm 7.8 2.8 10.3 8.3 7.6 3.2 2.0 11.5
Forearm / elbow 6.6 5.8 11.0 7.2 7.3 2.0 1.1 3.4
Hand / wrist / fingers 2.6 0.7 2.0 1.7 2.1 5.5 2.3 3.4
Other upper extremity injury 8.0 3.2 7.4 8.0 7.2 2.3 2.1 4.6
Lower extremity 30.8 13.2 22.2 22.6 25.6 11.8 6.4 8.0
Hip 2.5 1.1 3.6 3.2 2.6 1.1 0.5 0.0
Upper leg / thigh 0.1 0.0 0.2 0.0 0.1 0.4 0.2 2.3
Knee 16.7 4.7 7.8 12.3 12.8 3.3 0.7 1.1
Lower leg / ankle 5.2 1.9 2.2 2.0 3.8 1.8 1.9 3.4
Other lower extremity injury 9.8 6.3 10.3 7.5 9.1 4.4 2.7 1.1
The most common injury is spine injury, the maximum frequency being observed in case of rear impact. These injuries are nearly exclusively whiplashes, which are studied in more detail later in this report. From French observations, it is also shown that neck injuries are quite frequent for rear

PENDANT Deliverable D9 WP3 - Data analysis
Project funded by the European Community under the ‘Competitive and Sustainable Growth’ Programme (1998-2002)
Page 47
impacts, while lower extremity and chest injuries are more common for front impact. Discussion
From these last results we can remark that, even if the number of fractures is lower than for hospitalised, the proportion of people sustaining a fracture and not being hospitalised is not negligible. Otherwise, superficial contusions and sprains and strains are the most common injury types, whatever the impact area. Coming back to hospitalised data, the French and Dutch observations are quite coherent for hospitalised casualties, since we take into account the fact that, on average, less injuries are described for Dutch data (for reasons already explained). Whatever the impact area, injuries most often observed are head and chest injuries. Spine injuries are more characteristic of rear impacts (cervical injuries, and also lumbar injuries in French observations), and abdominal and pelvis injuries of left side impacts. These specificities of injury patterns according to the impact area, which can be considered as a proxy for the direction of impact, could be of some help to pre-hospital providers and clinicians who could, for example, have a higher suspicion of internal thorax injury in case of side impact (Dischinger et al. 1993; McLellan et al. 1996).

PENDANT Deliverable D9 WP3 - Data analysis
Project funded by the European Community under the ‘Competitive and Sustainable Growth’ Programme (1998-2002)
Page 48
Severity risk factors in drivers involved in car-to-car collisions (French and Dutch data)
Method
Regarding this specific objective, injury severity sustained by people involved in a crash is usually estimated only from injured. In our context where we use the information on drivers involved in car-to-car collisions, we know if they have been killed, injured and also not injured. We can then estimate what is shown in the following tables, i.e. the relative risks (RR) to be severely injured (MAIS 3+) when hospitalised, the RR of being hospitalised when injured, but also the RR of being hospitalised for all involved drivers, even those not injured. In other words, three probabilities are estimated: − P(MAIS3+ / hospitalised casualties) − P(hospitalised / injured casualties) − P(hospitalised / all drivers involved) These expressions are conditional probabilities and some extra estimates can be made from different products between them. Results are shown as relative risks and their corresponding 95% confidence intervals. Global effects of risk factors are evaluated by means of the likelihood ratio test (coming from log binomial regression). In addition to impact area, several risk factors are considered: − Age and sex of the driver, seatbelt wearing, place of the accident (main road
or other, urban or not), age and sex of the opponent driver. − When the information is available, vehicle data are also used: car age or first year of car registration, car mass and power of the vehicle and of the opponent vehicle.
All risk factors are finally included in a multivariate regression and all factors are included even if non significant to make the comparison between countries possible. In our cross over study, relative risks can be estimated by odds ratios when the event of interest is a rare event, and are easily obtained from logistic regression. However, the event of interest is not a rare event for the first severity criteria (MAIS 3+ / hospitalised). In this case, different model-based methods can be used to estimate relative risks (Greenland 2004; Spiegelman et al. 2005). We choose to apply a Poisson model to binomial data, which would lead to an over-estimation of the RR estimate error: this is rectified by using a robust error variance procedure, the sandwich estimation (Zou 2004). This is implemented using SAS software, GENMOD procedure (Lindquist 2004). The first criteria allows to highlight possible factors associated with high severity, but is often based on a quite low number of observations. Estimates concerning the two last severity criteria are shown to be rather close whatever

PENDANT Deliverable D9 WP3 - Data analysis
Project funded by the European Community under the ‘Competitive and Sustainable Growth’ Programme (1998-2002)
Page 49
the variable considered. Both are nevertheless shown to give the possibility of some comments concerning the effect of keeping, in our study sample, all involved drivers. Results
Concerning characteristics of the crash and taking rear impact as the reference level, the risk to be hospitalised while involved in a crash is the highest in case of head-on impact (Table 30). The second highest risk is associated to left side impact. Rear impact is shown associated to the lowest risk, except for Dutch data where head-on rear impacts are at lower risk. Concerning the risks to be seriously injured while hospitalised, no RR are found significant. Anyway, from our two data sources, compared with rear impact, all other impact areas are associated with higher risk to be hospitalised, and these risks are clearly higher than risks to be severely injured when hospitalised.

PENDANT Deliverable D9 WP3 - Data analysis
Project funded by the European Community under the ‘Competitive and Sustainable Growth’ Programme (1998-2002 Page 50
Table 30 : univariate relative risks – drivers involved in car-to-car crashes
French data Dutch data
MAIS 3+ / hospitalised
(210 / 646)* Hospitalised / injured
(646/ 6119)* Hospitalised / involved
(646/ 11018)* MAIS 3+ / hospitalised
(461 / 2389)* Hospitalised / injured
(2389/ 18110)* Hospitalised / involved
(2389/ 38076)*
RR 95% CI χ2† RR 95% CI χ2†
RR 95% CI χ2† RR 95% CI χ2†
RR 95% CI χ2† RR 95% CI χ2†
Impact area Rear 1 NS 1 79 1 130 1 18 1 364 1 543
Head-on 1.62 0.82 3.20 3.36 2.39 4.72 3.60 2.55 5.07 1.11 0.65 1.92 1.60 1.25 2.05 2.08 1.60 2.70
Head-on rear 1.28 0.55 2.95 2.10 1.36 3.22 1.26 0.81 1.95 0.70 0.39 1.26 0.57 0.44 0.74 0.57 0.43 0.75
Head-on side 1.88 0.84 4.17 1.78 1.12 2.84 1.39 0.87 2.22 1.06 0.59 1.89 1.19 0.91 1.55 1.33 1.01 1.75
Right side 1.84 0.88 3.82 2.51 1.69 3.73 2.15 1.44 3.21 0.90 0.49 1.67 1.30 0.99 1.71 1.39 1.04 1.85
Left side 1.84 0.91 3.72 2.71 1.88 3.90 2.97 2.05 4.29 1.36 0.77 2.40 1.35 1.04 1.77 1.73 1.31 2.28
Type of road Main 1.24 0.98 1.56 NS 1.85 1.60 2.14 86 2.24 1.93 2.61 111 1.10 0.87 1.40 NS 1.05 0.94 1.17 0.71 0.94 0.84 1.06 NS
Other 1 1 1 1 1 1
Location Not urban 1.27 1.02 1.58 4.3 1.76 1.52 2.04 71 2.17 1.87 2.52 93 1.34 1.12 1.60 10 1.75 1.62 1.89 207 1.91 1.77 2.08 261
Urban 1 1 1 1 1 1
Seatbelt Not worn 1.31 1.04 1.65 4.5 1.74 1.48 2.04 65 1.77 1.50 2.09 67
Worn 1 1 1
Age 16-24 0.91 0.67 1.23 NS 1.09 0.89 1.32 27 1.04 0.85 1.28 25 1.25 0.98 1.60 6.6 1.10 0.98 1.23 194 1.09 0.97 1.22 202
25-34 0.93 0.67 1.28 0.73 0.59 0.90 0.72 0.58 0.90 1.14 0.90 1.46 0.91 0.81 1.01 0.93 0.83 1.05
35-49 1 1 1 1 1 1
50-64 0.86 0.60 1.22 1.13 0.90 1.41 1.08 0.85 1.36 1.05 0.80 1.39 1.20 1.07 1.35 1.19 1.05 1.34
65+ 1.06 0.72 1.58 1.45 1.10 1.91 1.47 1.11 1.96 1.34 1.04 1.73 2.12 1.89 2.37 2.29 2.03 2.59
Sex Male 1.38 1.07 1.79 6.5 1.46 1.25 1.71 23 0.93 0.80 1.09 NS 1.18 0.99 1.41 NS 1.24 1.15 1.34 31 0.79 0.73 0.86 31
Female 1 1 1 1 1 1
Opponent 16-24 1.26 0.94 1.68 NS 1.09 0.89 1.32 NS 1.14 0.93 1.40 NS 0.92 0.73 1.17 NS 1.03 0.92 1.14 2.6 1.06 0.95 1.19 NS
driver age 25-34 0.97 0.70 1.34 0.87 0.70 1.06 0.85 0.69 1.05 1.03 0.83 1.28 0.98 0.89 1.09 0.96 0.86 1.07
35-49 1 1 1 1 1 1
50-64 0.92 0.62 1.35 0.97 0.76 1.23 0.97 0.76 1.23 1.02 0.79 1.31 1.05 0.94 1.18 1.10 0.98 1.24
65+ 1.00 0.60 1.65 1.11 0.81 1.52 1.07 0.77 1.48 0.90 0.63 1.29 0.94 0.80 1.10 0.91 0.77 1.07
* Maximum numbers when no missing values † χ2 corresponding to the likelihood ratio test. Estimation is shown if significant (p < 0.05), Non Significant (NS) otherwise
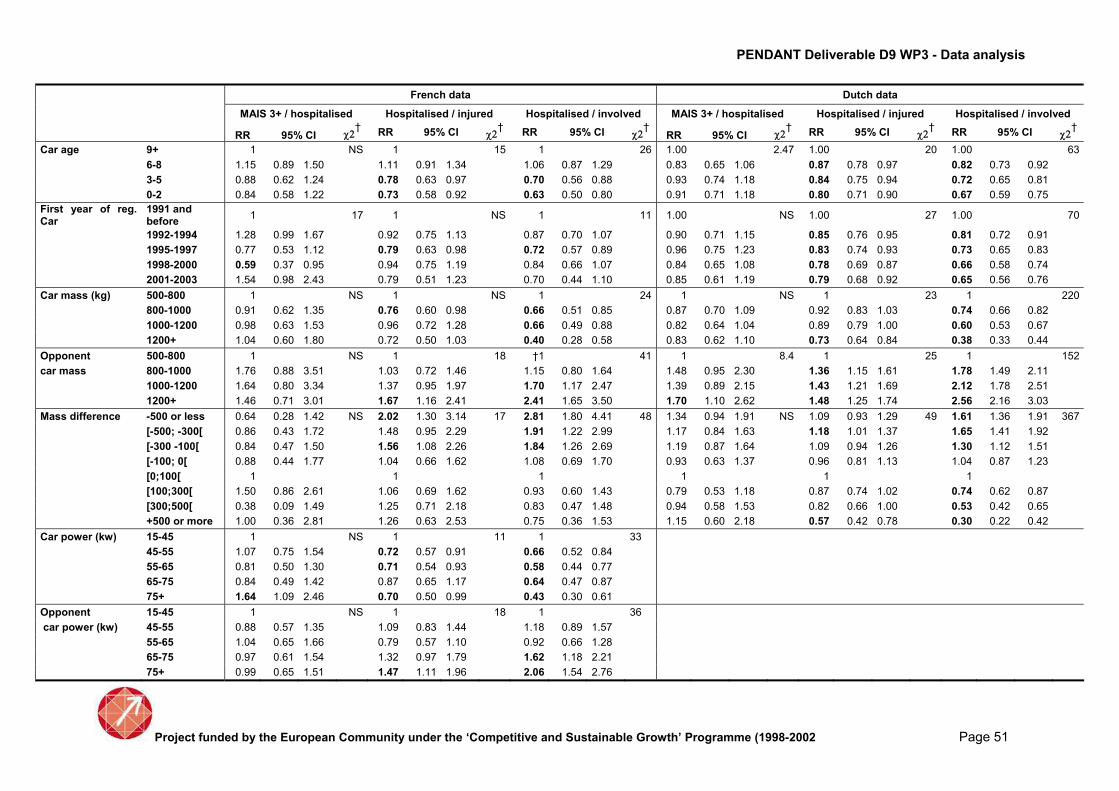
PENDANT Deliverable D9 WP3 - Data analysis
Project funded by the European Community under the ‘Competitive and Sustainable Growth’ Programme (1998-2002 Page 51
French data Dutch data
MAIS 3+ / hospitalised Hospitalised / injured Hospitalised / involved MAIS 3+ / hospitalised Hospitalised / injured Hospitalised / involved
RR 95% CI χ2† RR 95% CI χ2†
RR 95% CI χ2† RR 95% CI χ2†
RR 95% CI χ2† RR 95% CI χ2†
Car age 9+ 1 NS 1 15 1 26 1.00 2.47 1.00 20 1.00 63
6-8 1.15 0.89 1.50 1.11 0.91 1.34 1.06 0.87 1.29 0.83 0.65 1.06 0.87 0.78 0.97 0.82 0.73 0.92
3-5 0.88 0.62 1.24 0.78 0.63 0.97 0.70 0.56 0.88 0.93 0.74 1.18 0.84 0.75 0.94 0.72 0.65 0.81
0-2 0.84 0.58 1.22 0.73 0.58 0.92 0.63 0.50 0.80 0.91 0.71 1.18 0.80 0.71 0.90 0.67 0.59 0.75
First year of reg. Car
1991 and before
1 17 1 NS 1 11 1.00 NS 1.00 27 1.00 70
1992-1994 1.28 0.99 1.67 0.92 0.75 1.13 0.87 0.70 1.07 0.90 0.71 1.15 0.85 0.76 0.95 0.81 0.72 0.91
1995-1997 0.77 0.53 1.12 0.79 0.63 0.98 0.72 0.57 0.89 0.96 0.75 1.23 0.83 0.74 0.93 0.73 0.65 0.83
1998-2000 0.59 0.37 0.95 0.94 0.75 1.19 0.84 0.66 1.07 0.84 0.65 1.08 0.78 0.69 0.87 0.66 0.58 0.74
2001-2003 1.54 0.98 2.43 0.79 0.51 1.23 0.70 0.44 1.10 0.85 0.61 1.19 0.79 0.68 0.92 0.65 0.56 0.76
Car mass (kg) 500-800 1 NS 1 NS 1 24 1 NS 1 23 1 220
800-1000 0.91 0.62 1.35 0.76 0.60 0.98 0.66 0.51 0.85 0.87 0.70 1.09 0.92 0.83 1.03 0.74 0.66 0.82
1000-1200 0.98 0.63 1.53 0.96 0.72 1.28 0.66 0.49 0.88 0.82 0.64 1.04 0.89 0.79 1.00 0.60 0.53 0.67
1200+ 1.04 0.60 1.80 0.72 0.50 1.03 0.40 0.28 0.58 0.83 0.62 1.10 0.73 0.64 0.84 0.38 0.33 0.44
Opponent 500-800 1 NS 1 18 †1 41 1 8.4 1 25 1 152
car mass 800-1000 1.76 0.88 3.51 1.03 0.72 1.46 1.15 0.80 1.64 1.48 0.95 2.30 1.36 1.15 1.61 1.78 1.49 2.11
1000-1200 1.64 0.80 3.34 1.37 0.95 1.97 1.70 1.17 2.47 1.39 0.89 2.15 1.43 1.21 1.69 2.12 1.78 2.51
1200+ 1.46 0.71 3.01 1.67 1.16 2.41 2.41 1.65 3.50 1.70 1.10 2.62 1.48 1.25 1.74 2.56 2.16 3.03
Mass difference -500 or less 0.64 0.28 1.42 NS 2.02 1.30 3.14 17 2.81 1.80 4.41 48 1.34 0.94 1.91 NS 1.09 0.93 1.29 49 1.61 1.36 1.91 367
[-500; -300[ 0.86 0.43 1.72 1.48 0.95 2.29 1.91 1.22 2.99 1.17 0.84 1.63 1.18 1.01 1.37 1.65 1.41 1.92
[-300 -100[ 0.84 0.47 1.50 1.56 1.08 2.26 1.84 1.26 2.69 1.19 0.87 1.64 1.09 0.94 1.26 1.30 1.12 1.51
[-100; 0[ 0.88 0.44 1.77 1.04 0.66 1.62 1.08 0.69 1.70 0.93 0.63 1.37 0.96 0.81 1.13 1.04 0.87 1.23
[0;100[ 1 1 1 1 1 1
[100;300[ 1.50 0.86 2.61 1.06 0.69 1.62 0.93 0.60 1.43 0.79 0.53 1.18 0.87 0.74 1.02 0.74 0.62 0.87
[300;500[ 0.38 0.09 1.49 1.25 0.71 2.18 0.83 0.47 1.48 0.94 0.58 1.53 0.82 0.66 1.00 0.53 0.42 0.65
+500 or more 1.00 0.36 2.81 1.26 0.63 2.53 0.75 0.36 1.53 1.15 0.60 2.18 0.57 0.42 0.78 0.30 0.22 0.42
Car power (kw) 15-45 1 NS 1 11 1 33
45-55 1.07 0.75 1.54 0.72 0.57 0.91 0.66 0.52 0.84
55-65 0.81 0.50 1.30 0.71 0.54 0.93 0.58 0.44 0.77
65-75 0.84 0.49 1.42 0.87 0.65 1.17 0.64 0.47 0.87
75+ 1.64 1.09 2.46 0.70 0.50 0.99 0.43 0.30 0.61
Opponent 15-45 1 NS 1 18 1 36
car power (kw) 45-55 0.88 0.57 1.35 1.09 0.83 1.44 1.18 0.89 1.57
55-65 1.04 0.65 1.66 0.79 0.57 1.10 0.92 0.66 1.28
65-75 0.97 0.61 1.54 1.32 0.97 1.79 1.62 1.18 2.21
75+ 0.99 0.65 1.51 1.47 1.11 1.96 2.06 1.54 2.76

PENDANT Deliverable D9 WP3 - Data analysis
Project funded by the European Community under the ‘Competitive and Sustainable Growth’ Programme (1998-2002)
Page 52
As expected, risks are shown to be higher on main roads, compared to streets and other roads. These RR are only significant for French data. Non urban crashes are also associated with higher risks whatever the criteria considered, for the two data sets. Information on seatbelt wearing is only available for French observations, and, as expected, found associated to a lower risk to be hospitalised when involved, or severely injured when hospitalised. Let us now consider some characteristics of the drivers. Taking the middle age group (35-49) as the reference level, the risk to be hospitalised is higher for the oldest drivers (65 and more). Men appear to be at higher risk to be severely injured than women, or hospitalised when injured. But they are shown less at risk to be hospitalised when involved than women. This is the only result where we have opposite RR depending on the severity criteria used, and this will be discussed later in this document. The second part of the Table 30 shows the RR associated with some characteristics of cars. First are shown the risks associated with car age and first year of registration; the last one is closely associated with the age of the design of the car while the car age is also associated, on average, to the condition of the vehicle. For both these variables, more recent cars are associated with lower risks to be hospitalised. Let us note that, as the inclusion time periods are not the same in the two data sets, the comparison between the two countries is easier when considering the car age instead of the first year of registration. Concerning car mass effect, results are very clear: for the driver, the heavier car, the better. This is observed for the risk of being hospitalised. Conversely, the heavier for the opponent car mass, the worse. These clear trends appear also when considering the mass difference between the two cars involved. The same type of relation is observed when considering the power of the car and the power of the opponent car, power which is highly correlated to the mass, but this information is only available for French data. On the whole, results obtained from our two datasets are very close whatever the risk factor examined and the severity criteria used. Table31 shows adjusted relative risks. As only available in French data, seat belt wearing is not considered any further. Opponent driver age is also given up, as non significant. Car age is included rather than first year of registration, because the trend is clearer with the first one, perhaps because of the difference in the inclusion periods between the datasets. Car mass and opponent car masses are also included. Car power is no more considered, because only available in French data and highly correlated with car mass.
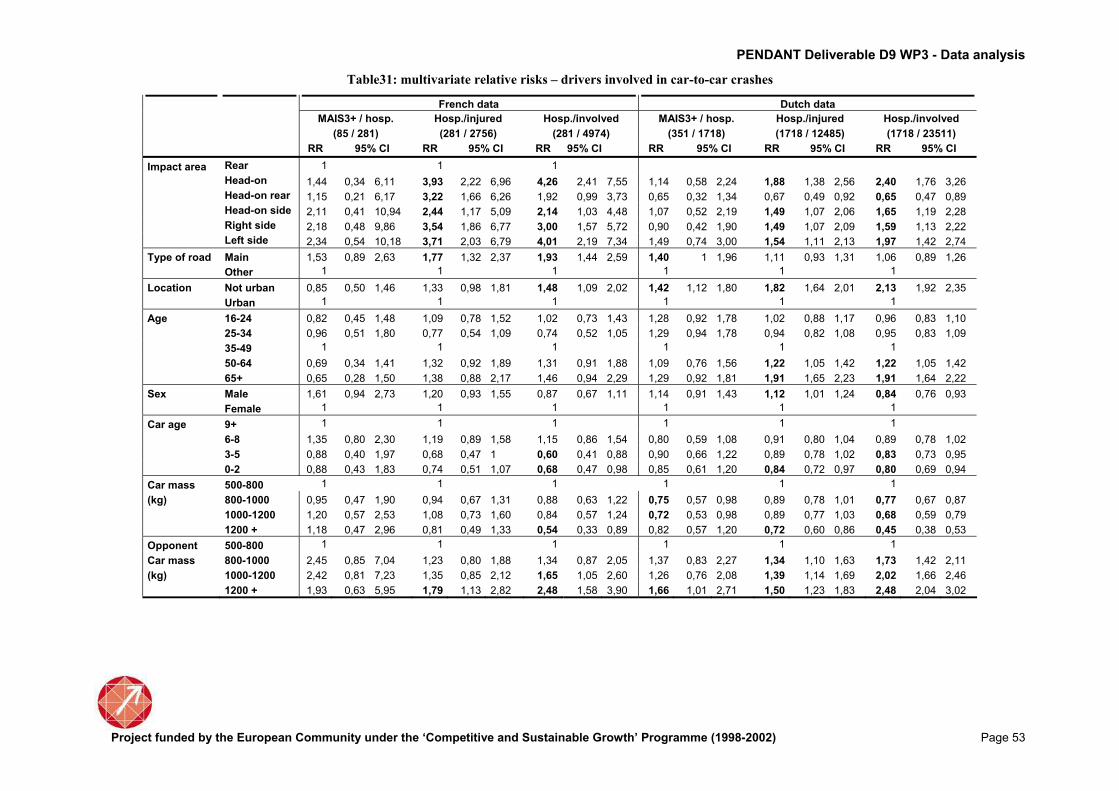
PENDANT Deliverable D9 WP3 - Data analysis
Project funded by the European Community under the ‘Competitive and Sustainable Growth’ Programme (1998-2002) Page 53
Table31: multivariate relative risks – drivers involved in car-to-car crashes
French data Dutch data
MAIS3+ / hosp. Hosp./injured Hosp./involved MAIS3+ / hosp. Hosp./injured Hosp./involved
(85 / 281) (281 / 2756) (281 / 4974) (351 / 1718) (1718 / 12485) (1718 / 23511)
RR 95% CI RR 95% CI RR 95% CI RR 95% CI RR 95% CI RR 95% CI
Impact area Rear 1 1 1
Head-on 1,44 0,34 6,11 3,93 2,22 6,96 4,26 2,41 7,55 1,14 0,58 2,24 1,88 1,38 2,56 2,40 1,76 3,26
Head-on rear 1,15 0,21 6,17 3,22 1,66 6,26 1,92 0,99 3,73 0,65 0,32 1,34 0,67 0,49 0,92 0,65 0,47 0,89
Head-on side 2,11 0,41 10,94 2,44 1,17 5,09 2,14 1,03 4,48 1,07 0,52 2,19 1,49 1,07 2,06 1,65 1,19 2,28
Right side 2,18 0,48 9,86 3,54 1,86 6,77 3,00 1,57 5,72 0,90 0,42 1,90 1,49 1,07 2,09 1,59 1,13 2,22
Left side 2,34 0,54 10,18 3,71 2,03 6,79 4,01 2,19 7,34 1,49 0,74 3,00 1,54 1,11 2,13 1,97 1,42 2,74
Type of road Main 1,53 0,89 2,63 1,77 1,32 2,37 1,93 1,44 2,59 1,40 1 1,96 1,11 0,93 1,31 1,06 0,89 1,26
Other 1 1 1 1 1 1
Location Not urban 0,85 0,50 1,46 1,33 0,98 1,81 1,48 1,09 2,02 1,42 1,12 1,80 1,82 1,64 2,01 2,13 1,92 2,35
Urban 1 1 1 1 1 1
Age 16-24 0,82 0,45 1,48 1,09 0,78 1,52 1,02 0,73 1,43 1,28 0,92 1,78 1,02 0,88 1,17 0,96 0,83 1,10
25-34 0,96 0,51 1,80 0,77 0,54 1,09 0,74 0,52 1,05 1,29 0,94 1,78 0,94 0,82 1,08 0,95 0,83 1,09
35-49 1 1 1 1 1 1
50-64 0,69 0,34 1,41 1,32 0,92 1,89 1,31 0,91 1,88 1,09 0,76 1,56 1,22 1,05 1,42 1,22 1,05 1,42
65+ 0,65 0,28 1,50 1,38 0,88 2,17 1,46 0,94 2,29 1,29 0,92 1,81 1,91 1,65 2,23 1,91 1,64 2,22
Sex Male 1,61 0,94 2,73 1,20 0,93 1,55 0,87 0,67 1,11 1,14 0,91 1,43 1,12 1,01 1,24 0,84 0,76 0,93
Female 1 1 1 1 1 1
Car age 9+ 1 1 1 1 1 1
6-8 1,35 0,80 2,30 1,19 0,89 1,58 1,15 0,86 1,54 0,80 0,59 1,08 0,91 0,80 1,04 0,89 0,78 1,02
3-5 0,88 0,40 1,97 0,68 0,47 1 0,60 0,41 0,88 0,90 0,66 1,22 0,89 0,78 1,02 0,83 0,73 0,95
0-2 0,88 0,43 1,83 0,74 0,51 1,07 0,68 0,47 0,98 0,85 0,61 1,20 0,84 0,72 0,97 0,80 0,69 0,94
Car mass 500-800 1 1 1 1 1 1
(kg) 800-1000 0,95 0,47 1,90 0,94 0,67 1,31 0,88 0,63 1,22 0,75 0,57 0,98 0,89 0,78 1,01 0,77 0,67 0,87
1000-1200 1,20 0,57 2,53 1,08 0,73 1,60 0,84 0,57 1,24 0,72 0,53 0,98 0,89 0,77 1,03 0,68 0,59 0,79
1200 + 1,18 0,47 2,96 0,81 0,49 1,33 0,54 0,33 0,89 0,82 0,57 1,20 0,72 0,60 0,86 0,45 0,38 0,53
Opponent 500-800 1 1 1 1 1 1
Car mass 800-1000 2,45 0,85 7,04 1,23 0,80 1,88 1,34 0,87 2,05 1,37 0,83 2,27 1,34 1,10 1,63 1,73 1,42 2,11
(kg) 1000-1200 2,42 0,81 7,23 1,35 0,85 2,12 1,65 1,05 2,60 1,26 0,76 2,08 1,39 1,14 1,69 2,02 1,66 2,46
1200 + 1,93 0,63 5,95 1,79 1,13 2,82 2,48 1,58 3,90 1,66 1,01 2,71 1,50 1,23 1,83 2,48 2,04 3,02

Project funded by the European Community under the ‘Competitive and Sustainable Growth’ Programme (1998-2002) Page 54
RRs from multivariate analysis are very close to univariate estimates. This means that the same comments are relevant for each factor, after taking account of all other factors included in the regression. Hence, the risk to be hospitalised when involved in an injury car-to-car crash is higher in case of head-on and left side. Older drivers are more often hospitalised. Drivers of newest cars are less often hospitalised, even after taking account of the mass of the car (which is very important as new cars are heavier and heavier). Car mass, and mass of the opponent car play also a clear role. Discussion
Three severity criteria have been estimated thanks to the knowledge of injury outcomes for all drivers involved in car-to-car crashes. Risks to be hospitalised when involved in a crash are found more often significant than risks to be severely injured (MAIS 3+) when hospitalised. This is not surprising as they have been estimated from higher numbers, but The RRs are also more often higher. This highlights, if needed, that the different risk factors studied have not the same effect according to the level of severity considered. Hence, the risk of being hospitalised among drivers involved in a rear-end impact is much lower than for the other impact areas, but this is less clear when considering the risk to be severely injured. Concerning the characteristics of the cars, the protective effect of car mass, as well as the aggressive effect of the opponent car mass, appear more clearly when considering the risk to be hospitalised among involved than when considering MAIS 3 + casualties among hospitalised. Anyway, these results confirm the compatibility issue which is still a research objective (Martin et al. 2003). Drivers with the newest cars are shown less often hospitalised than those driving the oldest ones. This result is quite interesting as it is observed even after taking account of the car mass, which is very important as most recent cars tend to be heavier and heavier. Older drivers appear also more often hospitalised, and this could be , in addition of the severity of their injuries, the effect of their previous health condition, as well as the effect of a different taking care policy. We must take into account that a limitation of the scale of severity AIS is that it do not take into account the age of the person injured, neither the premorbid conditions which are important for decisions such as hospitalisation (Rutledge et al. 1998) Female drivers appear to be more at risk to be hospitalised when involved in an injury crash, but less at risk to be severely injured when hospitalised (with some cautious as corresponding RR are not always significant according to the data set or the severity criteria). These opposite estimates could be due to the fact

PENDANT Deliverable D9 WP3 - Data analysis
Project funded by the European Community under the ‘Competitive and Sustainable Growth’
Programme (1998-2002) Page 55
that, on the one hand, male drivers are more often involved in more severe crashes, and on the other hand female occupants could be more vulnerable (Martin et al. 2004). Crash characteristics are supposed to be taken account by the multivariate analysis, but probably not in a sufficient way because of the lack of precise information such as some equivalent energy speed or delta-V estimates, for example.

PENDANT Deliverable D9 WP3 - Data analysis
Project funded by the European Community under the ‘Competitive and Sustainable Growth’
Programme (1998-2002) Page 56
Factors associated with whiplash in car-to-car collisions (Spanish and French data)
The whiplash injury, i.e. a soft tissue injury of the cervical spine, is the most frequent injury sustained by car occupants involved in a crash. It is defined as an acceleration-deceleration mechanism of energy transfer to the neck. Even if it is most of the time a slight injury, whiplash can have long term consequences (whiplash associated disorders) and deserves to be carefully studied. The objective of this chapter is to estimate the risk factors for a car driver involved in a car-to-car crash to sustain a whiplash. Data
The analysis will focus on car-to-car accidents (without any pedestrian involved), with information available for the two corresponding drivers. These crashes are identified from police data. Every driver can then be linked with hospital data. When a link is assessed, the corresponding pattern of injuries is known, and in particular the fact that a casualty has sustained whiplash or not. When no link has been established, we have two possibilities: either the corresponding driver is considered non injured by the police, and therefore in the analysis, or he is considered injured, and so excluded from the analysis (as we do not know where and to what extent he is injured). Analysis
Two important facts are to be noted concerning whiplash: • If there is no more severe injury, most of the time, people suffering from a whiplash are not hospitalised. This means that the recording of those non hospitalised is essential for working on whiplash. That is why we have chosen to work with French and Spanish data only. • It is highly suspected that a whiplash is not noted when there is a more severe injury.
All the analysis strategy will be very dependant of this last point. The first result to produce is a cross tabulation between whiplash and severity estimated by MAIS. The analysis comprises then several steps. The first analysis will deal with the comparison of casualties suffering only from a whiplash with non injured drivers.

PENDANT Deliverable D9 WP3 - Data analysis
Project funded by the European Community under the ‘Competitive and Sustainable Growth’
Programme (1998-2002) Page 57
The second one will deal with the comparison of casualties sustaining a whiplash and at least another injury to casualties sustaining at least one injury other than a whiplash. As in the previous section (Severity risk factors in drivers involved in car-to-car collisions), crude RRs are estimated by means of a log binomial regression, and adjusted RR with a modified Poisson regression. For the two analyses, three tables are produced: • the first one shows crude relative risks (with 95% confidence intervals)
associated with factors available in each data set (age, sex, seat belt use, impact area, weight, localisation of crash and type of road) • the second one shows adjusted RRs, all factors being included even if non significant in order to make easier the comparison between the two data sets (except the car mass which is unknown for Spanish data and often missing for French data) • the last one shows adjusted RRs including only significant factors.
For the second analysis, severity estimated by MAIS is also shown, and every relative risk is also estimated with adjustment on this severity scale.

PENDANT Deliverable D9 WP3 - Data analysis
Project funded by the European Community under the ‘Competitive and Sustainable Growth’
Programme (1998-2002) Page 58
Results
The following table shows the numbers observed, according to whiplash injury and injury other than whiplash.
Table 32: distribution of whiplash and other injuries among drivers involved in car-to-car
accidents
French data Spanish data
Injury other than whiplash
Injury other than whiplash
Yes No Total Yes No Total
whiplash Yes 646 415 1061 289 615 904
No 2760 4899 7659 534 6120 6654
Total 3406 5314 8720 823 6735 7558
The first analysis will then deal with the 415 whiplash only, compared with the 4899 not injured for the French data and 615 and 6120 respectively for the Spanish data. The following table shows the relative risks of whiplash associated with some characteristics of the crash, i.e. the impact area, the location of the crash (urban/not urban, main road or not, crossroad or not), the time period (night or day, weekend or weekday), the traffic density available in Spanish data, the car mass available in French data, and some characteristics of the driver (age, sex and seat belt wearing).

PENDANT Deliverable D9 WP3 - Data analysis
Project funded by the European Community under the ‘Competitive and Sustainable Growth’
Programme (1998-2002) Page 59
Table 33: Whiplash only vs. Non injured – drivers involved in car-to-car accidents. Crude relative
risks of whiplash according to some risk factors
French data (415/4899)
Spanish data
(615/6120)
RR 95 % CI χ2* RR 95 % CI χ2*
Impact Rear 1 24.2 Type of Rear 1 94.10
area Head-on 0.47 0.37 0.59 crash Frontal 0.77 0.44 1.35
Head-on rear 0.19 0.13 0.28 Front-side 0.43 0.34 0.54
Head-on side 0.24 0.16 0.37 Side 0.20 0.12 0.34
Right side 0.34 0.24 0.47
Left side 0.56 0.43 0.74
Type of Main 1.06 0.88 1.28 NS Type of Beltway 1 NS
road Other 1 road Main 0.98 0.66 1.44
Other 0.95 0.67 1.37
Location Not urban 1.07 0.86 1.33 NS
Urban 1
Crossroad Yes 1.36 1.13 1.64 10.4 Crossroad Yes 0.95 0.79 1.15 NS
No 1 No 1
Time Night 1 NS Time Night 1 30.31
Day 1.17 0.96 1.43 Day 1.76 1.43 2.16
Weekend Yes 1 Weekend Yes 1 7.58
No 1.39 1.12 1.72 9.22 No 1.34 1.09 1.65
Traffic Fluid 1 18.80
density Dense 1.58 1.23 2.02
Traffic jam 2.18 1.28 3.72
Seatbelt Not worn 1.48 0.85 2.59 NS Seatbelt Not worn 1.37 1.00 1.89 NS
Worn 1 Worn 1
Age 16-24 0.84 0.65 1.08 Age 18-24 1.32 1.00 1.74 12.91
25-34 0.97 0.77 1.23 25-34 1.37 1.07 1.75
35-49 1 43.3 35-49 1
50-64 0.67 0.49 0.93 50-64 1.01 0.74 1.39
65+ 0.41 0.22 0.75 65+ 0.62 0.29 1.29
Sex Male 1 24.9 Sex Male 1 65.83
Female 3.85 3.22 4.62 Female 2.39 1.94 2.93
Car mass 500-800 1 28.2
(kg) 800-1000 0.65 0.48 0.88
1000-1200 0.44 0.31 0.63
1200+ 0.29 0.19 0.45
* χ2 corresponding to the likelihood ratio test. Estimation is shown if significant (p < 0.05),
Non Significant (NS) otherwise Concerning the effect of the impact area, head-on and side impacts are shown to be at lowest risk to sustain a whiplash than rear impact (reference level). This is significant even for Spanish data where the coded information only concerns the crash “as a whole”. The risk of whiplash is higher on weekdays, if the crash happens in a crossroad in French observations and during daylight in Spanish ones. From Spanish observations, the risk of whiplash appears higher when traffic is dense, and all the more in case of traffic jam. The age effect is globally significant, with a protective effect almost for the older drivers (>= 65 years). Females appear clearly at higher risk of whiplash.

PENDANT Deliverable D9 WP3 - Data analysis
Project funded by the European Community under the ‘Competitive and Sustainable Growth’
Programme (1998-2002) Page 60
The car mass, only available in French data for about half the observations, appears to be significant, the higher the mass, the lower the risk of sustaining whiplash. Table 34 shows adjusted RR estimates, all previous factors (except the car mass) included in the regression (even non significant).
Table 34 : Whiplash only vs. Non injured – drivers involved in car-to-car accidents. adjusted risks
of whiplash including all previous factors (even non significant)
French data (415/4899)
Spanish data
(615/6120)
RR 95 % CI RR 95 % CI
Impact Rear 1 Type of Rear 1
area Head-on 0.53 0.42 0.66 crash Frontal 0.86 0.39 1.86
Head-on rear 0.20 0.14 0.30 Front-side 0.44 0.33 0.60
Head-on side 0.30 0.20 0.48 Side 0.24 0.12 0.45
Right side 0.40 0.28 0.56
Left side 0. 62 0.48 0.81
Type of Main 0.95 0.75 1.21 Type of Beltway 1
road Other 1 road Main 1.13 0.68 1.85
Other 1.43 0.89 2.27
Location Not urban 0.93 0.72 1.23
urban 1
Crossroad Yes 0.81 0.65 0.99 Crossroad Yes 1
No 1 No 0.98 0.77 1.24
Time Night 1 Time Night 1
Day 1.09 Day 1.39 1.08 1.79
Weekend Yes 1 Weekend Yes 1
No 1.32 1.08 1.59 No 0.87 0.67 1.13
Traffic Fluid 1
density Dense 1.12 0.83 1.50
Traffic jam 1.65 0.79 3.43
Seatbelt Not worn 1.71 1.01 2.90 Seatbelt Not worn 1.70 1.25 2.33
Worn 1 Worn 1
Age 16-24 0.99 0.79 1.27 Age 18-24 1.24 0.90 1.71
25-34 1.14 0.92 1.41 25-34 1.19 0.91 1.57
35-49 1 35-49 1
50-64 0.71 0.53 0.96 50-64 0.87 0.61 1.25
65+ 0.52 0.29 0.95 65+ 0.61 0.28 1.34
Sex Male 1 Sex Male 1
Female 3.53 2.96 4.23 Female 2.33 1.85 2.95

PENDANT Deliverable D9 WP3 - Data analysis
Project funded by the European Community under the ‘Competitive and Sustainable Growth’
Programme (1998-2002) Page 61
Compared to the non adjusted values, the crossroad effect is no more significant in French data and the same for the traffic density effect in Spanish data. This is due to the correlation between these variables and the impact area. On the other hand, seat belt wearing appears with a protective effect. Sex and impact area which have a significant crude effect remain as such when adjusted. Age remains significant only in French data. Table 35 shows adjusted relative risks when only significant factors have been kept.
Table 35: Whiplash only vs. Non injured – drivers involved in car-to-car accidents. adjusted risks
of whiplash including only significant factors
French data (415/4899)
Spanish data (615/6120)
RR 95 % CI RR 95 % CI
Impact Rear 1 Type of Rear 1
area Head-on 0.51 0.41 0.63 crash Frontal 0.91 0.42 1.96
Head-on rear 0.21 0.14 0.30 Front-side 0.45 0.35 0.60
Head-on side 0.28 0.18 0.43 Side 0.23 0.12 0.44
Right side 0.37 0.27 0.52
Left side 0.59 0.46 0.77
Time Night 1
Day 1.29 1.02 1.64
Weekend Yes 1
No 1.32 1.07 1.61
Seatbelt Not worn 1.71 1.02 2.90 Seatbelt Not worn 1.61 1.20 2.13
Worn 1 Worn 1
Age 16-24 0.99 0.78 1.25
25-34 1.16 0.93 1.44
35-49 1
50-64 0.71 0.53 0.96
65+ 0.52 0.29 0.94
Sex Male 1 Sex Male 1
Female 3.55 2.97 4.25 Female 2.36 1.88 2.96
In short, drivers sustaining a whiplash are more often impacted at the rear. Females have a higher risk of whiplash than males, and drivers less often sustain a whiplash when wearing their seatbelt. Drivers older than 50 are less at risk of whiplash than middle aged drivers in French observations.

PENDANT Deliverable D9 WP3 - Data analysis
Project funded by the European Community under the ‘Competitive and Sustainable Growth’
Programme (1998-2002) Page 62
When considering how drivers sustaining at least one AIS 1 injury and a whiplash compared to those sustaining at least one AIS 1 injury but no whiplash (Table 36), the significant factors are almost the same as when comparing drivers with only whiplash and non injured drivers (Table 33): the risk of whiplash is higher for of rear impacts, driving weekdays, and for female drivers. It is lower for older drivers in the French observations.
Table 36: Whiplash and other injury vs. injured elsewhere– drivers involved in car-to-car
accidents. Crude relative risks of whiplash according to some risk factors
French data (646/2760)
Spanish data (289/534)
RR 95 % CI χ2** RR 95 % CI χ2
Impact Rear 1 9.6 Type of Rear 1 NS
area Head-on 0.70 0.55 0.87 crash Frontal 0.40 0.06 2.47
Head-on rear 0.77 0.56 1.07
Front-side
0.88 0.57 1.38
Head-on side 0.70 0.50 1.00 Side 0.30 0.05 1.93
Right side 0.68 0.50 0.93
Left side 0.74 0.57 0.96
Type of Main 0.90 0.75 1.07 NS Type of Beltway 1 NS
road Other 1 road Main 0.81 0.32 2.08
Other 0.80 0.33 1.98
Location Not urban 0.95 0.81 1.11 NS
urban 1.00
Crossroad Yes 1.10 0.94 1.3 NS Crossroad Yes 0.86 0.55 1.35 NS
No 1 No 1
Time Night 1 NS Time Night 1 NS
Day 1.17 0.99 1.33 Day 1.56 0.98 2.50
Weekend Yes 1 6.94 Weekend Yes 1 NS
No 1.28 1.06 1.53 No 1.08 0.69 1.71
Traffic Fluid 1 NS
density Dense 1.37 0.79 2.37
Traffic
jam 3.19 2.48 4.12
Seatbelt Not worn 1.06 0.76 1.47 NS Seatbelt not worn 0.48 0.19 1.20 NS
Worn 1 worn 1
Age 16-24 0.89 0.72 1.11 Age 18-24 1.18 0.65 2.16 NS
25-34 1.01 0.83 1.24 25-34 0.94 0.54 1.66
35-49 1 13.36 35-49 1
50-64 0.82 0.64 1.07 50-64 0.89 0.42 1.91
65+ 0.48 0.30 0.77 65+ 0.81 0.24 2.77
Sex Male 1 34.6 Sex Male 1 12.06
Female 1.59 1.36 1.86 Female 2.21 1.47 3.34
Severity MAIS 1 1.00 51.4 Severity MAIS 1 1 6.50
MAIS 2 0.76 0.62 0.93 MAIS 2 0.37 0.15 0.93
MAIS 3 + 0.14 0.06 0.33
Severity is negatively associated with the risk of whiplash: the more severe the injuries are (other than whiplash), the lower the risk of observed whiplash.

PENDANT Deliverable D9 WP3 - Data analysis
Project funded by the European Community under the ‘Competitive and Sustainable Growth’
Programme (1998-2002) Page 63
When considering all previous factors included in the same regression, no more effects are shown to be significant in the Spanish data, possibly due to a lack of power because of low numbers (N=143 in Spanish data, vs. N=3361 in French data) , except the gender effect.
Table 37 : Whiplash and other injury vs. injured elsewhere – drivers involved in car-to-car
accidents. adjusted risks of whiplash including all previous factors (even non significant)
Age, sex and severity are still significant in the French data, but no longer the impact area. Table 38 shows the RR estimates when only these significant effects are included in the regression.
French data (646/2760)
Spanish data (289/534)
RR 95 % CI RR 95 % CI
Impact Rear 1 Type of Rear 1
area Head-on 0.79 0.63 0.99 crash Frontal -
Head-on rear 0.84 0.61 1.16 Front-side 1.13 0.59 2.15
Head-on side 0.75 0.53 1.07 Side -
Right side 0.74 0.54 1.01
Left side 0.81 0.62 1.06
Type of main 1.12 0.91 1.37 Type of Beltway 1
road other 1 road Main 0.76 0.10 5.63
Other 0.61 0.08 4.60
Location Not urban 0.97 0.78 1.21
urban 1
Crossroad Yes 1.12 0.93 1.34 Crossroad Yes 0.78 0.42 1.45
No 1 No 1
Time Night 1 Time Night 1
Day 0.93 0.79 1.09 Day 1.01 0.55 1.85
Weekend Yes 1 0.70 1.01 Weekend Yes 1
No 1.20 0.99 1.43 No 1.13 0.62 2.04
Traffic Fluid 1
density Dense 1.25 0.69 2.27
Traffic jam 0.85 0.11 6.60
Seatbelt Not worn 1.29 0.93 1.79 Seatbelt Not worn 0.68 0.28 1.64
Worn 1 Worn 1
Age 16-24 0.96 0.77 1.84 Age 18-24 0.76 0.37 1.58
25-34 0.99 0.81 1.21 25-34 0.75 0.43 1.31
35-49 1 35-49 1
50-64 0.85 0.66 1.10 50-64 0.90 0.37 2.21
65+ 0.56 0.35 0.90 65+ 1.77 0.80 3.93
Sex Male 1 Sex Male 1
Female 1.48 1.26 1.74 Female 1.98 1.19 3.30
Severity MAIS 1 1 Severity MAIS 1 1
MAIS 2 0.80 0.65 0.98 MAIS 2 0.60 0.23 1.54
MAIS 3 + 0.16 0.06 0.37

PENDANT Deliverable D9 WP3 - Data analysis
Project funded by the European Community under the ‘Competitive and Sustainable Growth’
Programme (1998-2002) Page 64
Table 38: Whiplash and other injury vs. injured elsewhere– drivers involved in car-to-car
accidents. adjusted relative risks of whiplash according to significant risk factors
French data Spanish data
RR 95 % CI RR 95 % CI
Age 16-24 0.93 0.75 1.15
25-34 1.00 0.82 1.22
35-49 1
50-64 0.85 0.66 1.10
65+ 0.55 0.34 0.88
Sex Male 1 Sex Male 1
Female 1.52 1.30 1.77 Female 2.21 1.47 3.34
Severity MAIS 1 1
MAIS 2 0.80 0.65 0.98
MAIS 3 + 0.15 0.06 0.37
Discussion
As shown in our last table, among drivers sustaining at least one injury other than a whiplash, those who sustain a whiplash have a risk of having a severe injury (AIS 3+) 8 times less often than those who do not sustain a whiplash. Obviously, this observation does not mean that suffering from a severe injury is a protective factor against sustaining a whiplash, but rather confirmation that whiplash injuries are underestimated when there are more severe injuries. Moreover, the proportion of whiplash is about 17.8% among drivers suffering from at least one injury other than a whiplash, while this proportion is 8.6% among drivers sustaining only a whiplash or uninjured. In other words, whiplash is recorded two times more often when casualties suffer from another injury. From our results, five risk factors can then be discussed. First, whiplash injuries are most often observed in case of rear impact. This was expected, as it corresponds to the main injury mechanism suspected and has been observed in most of whiplash studies (Kraft et al. 2002; Lawrence et al. 2000; Watanabe et al. 2000; Welcher et al. 2001). However, it is worth noting that even if the risk to sustain a whiplash is higher in case of rear-end collision, most of whiplash injuries are observed in other accident configurations (as rear impacts represent between 10 and 20% of observed impacts). Second, female drivers are shown to sustain a whiplash between two to three times more often than male drivers. This is observed even after taking into account some crash circumstances and the car mass (which could have been important as, on average, women drive lighter cars than men, and more often for urban trips). This higher proportion has been observed in most of research papers on the subject (Berglund et al. 2003; Bring et al. 1996; Ono et al. 1996). The explanations proposed most of the time are the anthropometric and physiological differences, leading to differences in tolerance to mechanical loading. This could be taken into account in the seat characteristics in terms of shape and stiffness (Viano 2003).

PENDANT Deliverable D9 WP3 - Data analysis
Project funded by the European Community under the ‘Competitive and Sustainable Growth’
Programme (1998-2002) Page 65
Third, car mass seems to be a protective factor, which was expected, but highlights, from a more general point of view, the compatibility issue between vehicles. Fourth, seat belt wearing appears to be protective when comparing drivers sustaining only a whiplash to uninjured drivers. As we have no problem of underestimation of whiplash due to more severe injuries in this sample, this result seems quite interesting but needs to be confirmed by more in depth investigations (Anderson 2006), with details on different possible seat belt technologies for example. The effect of the head restrains is also a limitation that could not been addressed in this study because of lack of information. Finally, older drivers (65 years or older) seem to suffer less often from whiplash than the others. Again, even if this is not because they are more severely injured, this result needs further work as a physiological explanation is not straightforward, and no such association has been previously shown. To obtain these results, we had to use on the one hand all medical data to have a precise injury description, including whiplash, and on the other hand linked police data for three reasons: to identify car-to-car collisions and to know main characteristics of the crash, but above all to identify drivers involved in the crash but not injured. This last point was essential to take account of the whiplash underestimation in the case of more severe injuries. In spite of the many differences between French and Spanish sampling and injury coding, relative risks are shown quite coherent, and this gives a great support to our estimations.
PENDANT Deliverable D9 WP3 - Data analysis
Project funded by the European Community under the ‘Competitive and Sustainable Growth’
Programme (1998-2002) Page 66
Car to pedestrian collisions
Over the past years, the EU has made several attempts at introducing legislative measures in order to improve the pedestrian safety, and a proposal for a framework directive on pedestrian safety has been presented. It aims to reduce deaths and injuries of pedestrians involved in traffic crashes through changes to the construction of the front of vehicles. In this proposal, four tests developed by the European Enhanced Safety Vehicle Committee will be used. The idea of the following study is to evaluate the possibilities of measuring, from real world accident data, the consequences (and their efficiency) of such future changes.
Car to pedestrian data
Car to pedestrian crashes are identified from Police data. Injury patterns are available from hospital data, after linkage with police data. As in the car-to-car collisions study, mark and type of the cars are deduced from the Vehicle Identification Number, and therefore some of the car’s characteristics such as weight. Two classifications of cars have also been produced: one close to the EuroNcap one (Super mini, Small family cars, Large family cars, Executive cars, Small MPVs, MPVs, Off-roaders), the second one relative to front of cars, which includes four main categories according to the shape of the bonnet (short, medium, long or sloping). Table 39 shows the cars corresponding to these groups the most frequently observed in the two crash data sets. The analysis will focus on the association between this front of car classification and the injury patterns, as well as the injury severity of pedestrians. Concerning this last analysis, crude RRs are estimated by means of a log binomial regression as in a previous section (Severity risk factors in drivers involved in car-to-car collisions). Spanish data on car to pedestrian accidents are too sparse to be used in the chapter. The main part of the analysis is then limited to hospitalised, as non hospitalised are not available from Dutch data.

PENDANT Deliverable D9 WP3 - Data analysis
Project funded by the European Community under the ‘Competitive and Sustainable Growth’
Programme (1998-2002) Page 67
Table 39 : mark and type of cars involved in car-to-pedestrian crashes and front-end profile
definition
French data Dutch data
Mark Type N % Mark Type N %
Short bonnet Renault Clio 209 24.53 Volkswagen Polo 20 9.85 Peugeot 205 125 14.67 Opel Corsa 19 9.36 Renault Supercinq 76 8.92 Peugeot 205 16 7.88 Peugeot 106 73 8.57 Suzuki Swift 16 7.88 Citroen Ax 71 8.33 Ford Fiesta 10 4.93 Ford Fiesta 60 7.04 Nissan Micra 9 4.43 Renault R5 50 5.87 Peugeot 106 9 4.43 Opel Corsa 40 4.69 Renault Clio 8 3.94 Fiat Punto 40 4.69 Suzuki Alto 8 3.94 Citroen Saxo 26 3.05 Daihatsu Cuore 7 3.45 Fiat Punto 7 3.45 Seat Ibiza 7 3.45 Fiat Uno 5 2.46 Peugeot 206 5 2.46 Citroen Ax 4 1.97 Mitsubishi Colt 4 1.97 Renault R5 4 1.97 Seat Arosa 4 1.97 Seat Marbella 4 1.97
Medium bonnet Renault R19 75 17.44 Volkswagen Golf 68 20.48 Vw Golf 71 16.51 Opel Astra 29 8.73 Ford Escort 39 9.07 Opel Kadett 27 8.13 Citroen Bx 34 7.91 Honda Civic 24 7.23 Renault Megane 34 7.91 Ford Escort 22 6.63 Citroen Zx 26 6.05 Mazda 323 14 4.22 Renault Express 24 5.58 Nissan Sunny 11 3.31 Peugeot 306 17 3.95 Toyota Starlet 11 3.31 Opel Astra 16 3.72 Fiat Tipo 10 3.01 Fiat Tipo 14 3.26 Toyota Corolla 10 3.01 Citroen Xsara 13 3.02 Volvo 440/460 9 2.71 Vw Golf iii 7 1.63 Renault 19 8 2.41 Fiat Bravo 6 1.40 Citroen Zx 7 2.11 Toyota Corolla 6 1.40 Nissan Almera 6 1.81 Peugeot 306 6 1.81 Renault Megane 6 1.81 Alfa 33 5 1.51 Hyundai Lantra 5 1.51 Peugeot 309 5 1.51 Volvo 340/360 5 1.51 Alfa 146 4 1.20
Long bonnet Renault R21 57 16.76 Mercedes-benz E 26 10.70 Peugeot 405 47 13.82 Bmw 3 series 19 7.82 Renault Laguna 25 7.35 Opel Vectra 15 6.17 Citroen Xantia 23 6.76 Mazda 626 12 4.94 Renault Safrane 21 6.18 Ford Mondeo 11 4.53 Renault R25 18 5.29 Volkswagen Passat 11 4.53 Ford Sierra 14 4.12 Mercedes-benz 190/200 9 3.70 Vw Passat 13 3.82 Bmw 5 series 7 2.88 Opel Vectra 13 3.82 Nissan Primera 7 2.88 Audi 80 12 3.53 Peugeot 405 7 2.88 Citroen Xm 12 3.53 Renault Laguna 7 2.88 Peugeot 406 9 2.65 Audi A4 6 2.47 Audi A4 7 2.06 Citroen Xantia 6 2.47 Peugeot 605 6 1.76 Ford Sierra 6 2.47 Audi A6 4 1.18 Opel Omega 6 2.47 Mercedes Classe E 4 1.18 Volvo V40 6 2.47 Seat Marea 4 1.18 Alfa 156 5 2.06 Bmw Serie 3 4 1.18 Audi 80 5 2.06 Seat Toledo 4 1.18 Peugeot 406 5 2.06 Mercedes-benz 300ce 4 1.65 Mitsubishi Galant 4 1.65 Toyota Camry 4 1.65 Toyota Carina 4 1.65 Volvo 940 4 1.65
Sloping bonnet Renault Twingo 75 41.44 Renault Twingo 11 16.67 Renault Espace 26 14.36 Ford Focus 7 10.61 Renault Boxer 7 3.87 Renault Megane scenic 6 9.09 Opel Zafira 6 3.31 Toyota Yaris 6 9.09 Peugeot 806 5 2.76 Mitsubishi Space 5 7.58 Citroen Xsara picasso 5 2.76 Opel Zafira 5 7.58 Vw Sharan 4 2.21 Ford Ka 4 6.06 Renault Scenic 3 1.66 Chrysler Voyager 3 4.55 Renault Espace 3 4.55

PENDANT Deliverable D9 WP3 - Data analysis
Project funded by the European Community under the ‘Competitive and Sustainable Growth’
Programme (1998-2002) Page 68
Results
Table 40 shows the distributions of the locations of car to pedestrian crashes, car mass, car power, type of car and type of car front of the cars involved, and age and gender of the pedestrians.
Table 40 : some characteristics of hospitalised pedestrians and corresponding cars and crashes
French Dutch
Number Col % Number Col %
Type of road Main 226 25.80 90 10.25
other 650 74.20 888 89.75
Location not urban 41 4.68 114 11.66
urban 835 95.32 864 88.34
Car mass (kg) 500-800 67 13.01 126 14.20
800-1000 215 41.75 273 30.77
1000-1200 115 22.33 243 27.39
1200 + 118 22.91 245 27.62
Car power (kw) 15<-45 107 20.58 -
45<-55 119 22.88 -
55<-65 106 20.38 -
65<-75 92 17.69 -
75 + 96 18.46 -
EuroNCAP category Super minis 238 47.70 235 28.62
Small family cars 139 27.86 332 40.43
Large family cars 44 8.82 164 19.97
Executive cars 23 4.61 56 6.82
Small MPVs 12 2.40 19 2.31
MPVs 13 2.61 8 0.97
Off-roaders 4 0.80 7 0.85
Front-end profile Short bonnet 200 40.08 201 24.39
Medium bonnet 110 22.04 324 39.32
Long bonnet 94 18.84 235 28.51
Sloping bonnet 59 11.82 64 7.76
Other 36 7.21
Car impact area Front center 414 50.55 478 52.12
Front left or right 319 38.95 250 27.26
Rear 43 5.25 56 6.10
Side left or right 43 5.25 133 14.50
Pedestrian age <=10 176 20.18 279 28.53
11-15 107 12.27 73 7.46
16-24 93 10.67 102 10.43
25-34 59 6.77 83 8.49
35-49 110 12.61 98 10.02
50-64 114 13.07 105 10.74
>=65 213 24.43 238 24.34
Sex Male 488 55.71 524 55.92
Female 388 44.29 413 44.07
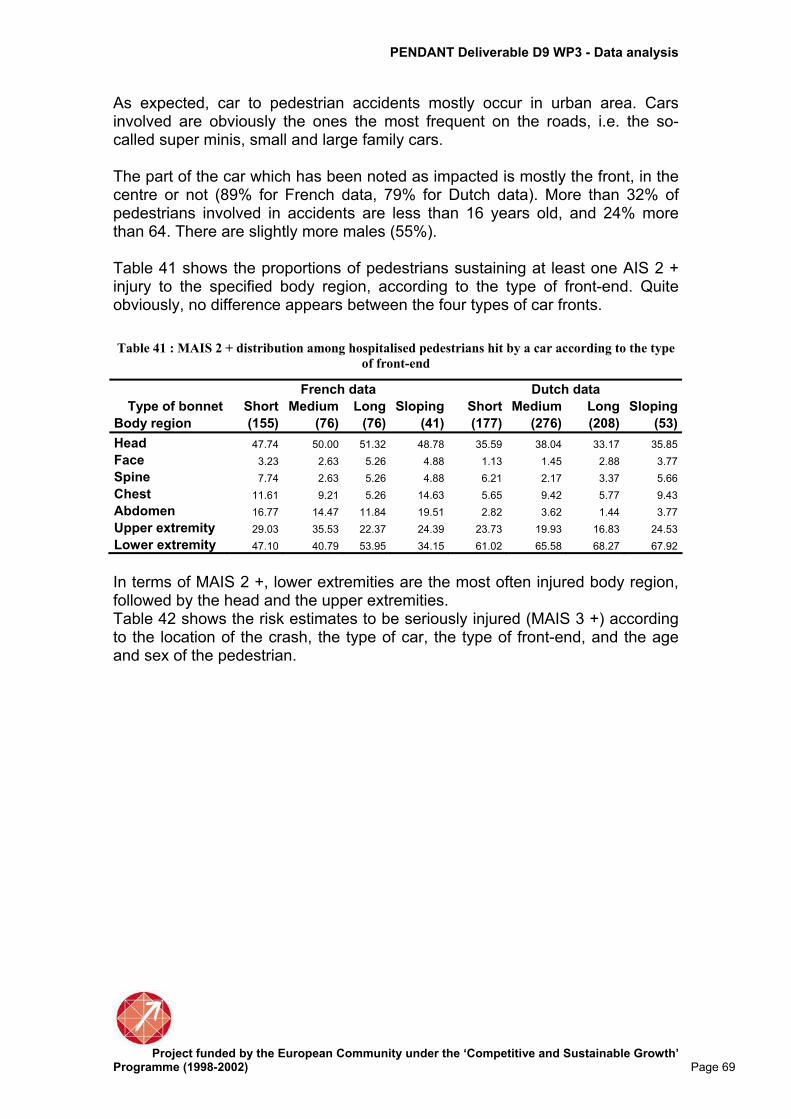
PENDANT Deliverable D9 WP3 - Data analysis
Project funded by the European Community under the ‘Competitive and Sustainable Growth’
Programme (1998-2002) Page 69
As expected, car to pedestrian accidents mostly occur in urban area. Cars involved are obviously the ones the most frequent on the roads, i.e. the so-called super minis, small and large family cars. The part of the car which has been noted as impacted is mostly the front, in the centre or not (89% for French data, 79% for Dutch data). More than 32% of pedestrians involved in accidents are less than 16 years old, and 24% more than 64. There are slightly more males (55%). Table 41 shows the proportions of pedestrians sustaining at least one AIS 2 + injury to the specified body region, according to the type of front-end. Quite obviously, no difference appears between the four types of car fronts.
Table 41 : MAIS 2 + distribution among hospitalised pedestrians hit by a car according to the type
of front-end
French data Dutch data
Type of bonnet Short Medium Long Sloping Short Medium Long Sloping
Body region (155) (76) (76) (41) (177) (276) (208) (53)
Head 47.74 50.00 51.32 48.78 35.59 38.04 33.17 35.85
Face 3.23 2.63 5.26 4.88 1.13 1.45 2.88 3.77
Spine 7.74 2.63 5.26 4.88 6.21 2.17 3.37 5.66
Chest 11.61 9.21 5.26 14.63 5.65 9.42 5.77 9.43
Abdomen 16.77 14.47 11.84 19.51 2.82 3.62 1.44 3.77
Upper extremity 29.03 35.53 22.37 24.39 23.73 19.93 16.83 24.53
Lower extremity 47.10 40.79 53.95 34.15 61.02 65.58 68.27 67.92
In terms of MAIS 2 +, lower extremities are the most often injured body region, followed by the head and the upper extremities. Table 42 shows the risk estimates to be seriously injured (MAIS 3 +) according to the location of the crash, the type of car, the type of front-end, and the age and sex of the pedestrian.

PENDANT Deliverable D9 WP3 - Data analysis
Project funded by the European Community under the ‘Competitive and Sustainable Growth’
Programme (1998-2002) Page 70
Table 42: Hospitalised pedestrians – crude risks of MAIS 3 +
French data Dutch data
RR 95% CI χ2* RR 95% CI χ2*
Type of Main 1.19 1.01 1.40 4.5 1,13 0,85 1,51 NS
road Other 1 1
Location Not urban 1.10 0.78 1.54 NS 1,08 0,83 1,42 NS
Urban 1 1
EuroNCAP Super minis 1 NS 1 NS
category Small family cars 0.86 0.67 1.12 1,01 0,90 1,15
Large family cars 0.95 0.64 1.39 0,95 0,82 1,11
Executive cars 1.32 0.89 1.97 0,82 0,64 1,04
Small mpvs 0.63 0.24 1.67 1,26 0,95 1,69
Mpvs 0.96 0.49 1.91 1,19 0,74 1,89
Front-end Short bonnet 1 NS 1 NS
profile Medium bonnet 0.78 0.57 1.06 0,99 0,87 1,13
Long bonnet 0.92 0.69 1.22 0,91 0,79 1,05
Sloping bonnet 0.68 0.44 1.06 0,93 0,75 1,15
Other 0.74 0.44 1.25
Age 0-10 0.78 0.59 1.04 0,95 0,80 1,13
11-15 0.82 0.60 1.13 0,87 0,68 1,11
16-24 0.66 0.46 0.96 0,76 0,60 0,96
25-34 1.08 0.78 1.50 0,92 0,73 1,16
35-49 1 NS 1 NS
50-64 1.08 0.82 1.43 1,20 0,98 1,46
65+ 1.07 0.84 1.37 1,34 1,13 1,58
Sex Male 1.17 0.99 1.37 0,95 0,79 1,14
Female 1 NS 1 NS
The only significant RR is associated with crashes occurring on main roads in French data. In particular no significant association is shown between severity and type of front-end. Given that no RR is significant except one, multivariate analysis is not relevant.
Discussion
The study of Police-Hospital linked data does not make it possible to highlight a clear effect of car characteristics, such as front-end type or market segment, on the localisation and the severity of pedestrian injuries. This does not mean that these characteristics have no effect, but that the available data precision is not sufficient to demonstrate their potential effect. In published papers, the few observational studies showing differences in pedestrian injury severity according to the front-end of cars are more precise than ours, especially on impact areas and equivalent energy speed or delta-V estimations. But only three car categories (sedan, one-box and SUV) are distinguished (Ballesteros et al. 2004; Mizuno et al. 2001; Roudsari et al. 2005), while the first category represents more than 90% of cars in Europe. Injuries sustained by a pedestrian hit by a car are in fact the result of complex mechanisms, involving many factors such as the impact speed, the mass, the stiffness and the geometry of the car, the relative positions of the car and the pedestrian at the crash time, the subsequent impact on the ground or with any specific obstacle and the own physical ability to take the impact. All this
PENDANT Deliverable D9 WP3 - Data analysis
Project funded by the European Community under the ‘Competitive and Sustainable Growth’
Programme (1998-2002) Page 71
information can not be available from only “standard” police or hospital data, and can only be available from in-depth investigations, even if some information, such as the precise position at the time of the impact requires to “re-build” the accident, which is possible only in few cases for a pedestrian accident. In any case, we can expect that it will not be an easy task to demonstrate the contribution of new front-end cars on improvement of pedestrian safety in case of accident. To balance the very big variability of impact circumstances, a lot of data with the best possible precise information will be necessary. With our data, and going back to the unlinked data shown in chapter 1 (Table 10), we can say that the most severe injuries are observed at the head and the chest. Lower extremities are also often severely injured, especially the tibia, the fibula and the knee. Only a few hip injuries are observed. Upper extremities are also often injured. The European directive project includes tests focused on the head and the lower extremities, but ignores the chest, which nevertheless represents a vital issue.
PENDANT Deliverable D9 WP3 - Data analysis
Project funded by the European Community under the ‘Competitive and Sustainable Growth’
Programme (1998-2002) Page 72
Methodological aspects of dealing with hospital data
Road accidents cause many fatalities and casualties, with or without after-effects. They are therefore a major public health issue in Europe and elsewhere, it is even more important since they mainly affect the young. For that reason it seems essential to measure the health effects of road accidents by recording as fully as possible injury patterns for all victims. The most direct way of collecting such information is from all the structures likely to provide care for the victims. The three WP3 partners have done just this with different strategies and methods, each with their own advantages and disadvantages, some of which became apparent during the course of the work. Linking the hospital data to more detailed information about the accident circumstances from police data seems to be the natural next step. However the linkage came across several problems highlighted earlier in the report. Anything we learn from the linked hospital data is very much dependant on the question that we are trying to answer.
Evaluation of remaining problems
From the outset of WP3 it was decided not create a common database for two reasons; firstly for data ownership and secondly because the data available are very different for each partner. Instead of a common database, pertinent data was selected according to what issues we wanted to study and the analysis was coordinated so that the results were as comparable as possible between partners. The work done during the entire project confirmed that this was the right decision. The main complications essentially came from the differences between the target populations, the selections done by each data source, as well as how precise the medical information gathered was and the way it was coded. Therefore, with only three partners, there are: - Three different data gathering strategies: for the entire country, but only
hospitalised victims (with the underlying problem of what is the definition of hospitalised) in the Dutch data; for one county, but all road accident victims that are taken into care by all medical structures, including mobile ones, in French data; for the region around a large city and only from emergency services, in the Spanish data.
- Two different levels of precision for injury descriptions; theoretically complete for the French and Dutch data and inevitably incomplete for the Spanish data.
- Two different injury coding methods: ICD9-CM which makes it possible to code all illnesses and AIS90 which is specialised in coding injuries with a severity level associated with each injury.
- Two different linking strategies: one uses a program which makes it possible to link a large amount of data and the other one is “manual” assisted by a computer which means more work but makes it possible to use more information contained in some data.

PENDANT Deliverable D9 WP3 - Data analysis
Project funded by the European Community under the ‘Competitive and Sustainable Growth’
Programme (1998-2002) Page 73
Recommendations for possible improvements
In this report we have, where possible, taken into account the differences mentioned above, for example by reducing the populations studied to a common part of each dataset, by converting ICD codes into AIS with the associated severity or by using the Barell matrix. It is however clear that reducing the existing differences would greatly facilitate the common exploitation of the different data. With this in mind we can propose some possible improvements: As far as possible, it is necessary to take care with the sampling (emergencies, hospitalisations, both), the coverage (rural/urban, national/regional/local) and the various codifications (AIS, ICD9-CM, ICD10). The way of assessing injury severity also needs to be addressed. The severity index codified manually could vary slightly from those obtained from through a software such ICDMAP. Although it would be better to manually codify, it is impossible when using big databases, such as national hospital registries, in this case ICDMAP is a useful tool. Nonetheless it is important when comparing data from different sources or countries to be aware of the possible biases. A registry approach, such as in France is totally recommendable. It guaranties exhaustive information because it is an intensive and active data collection that covers urban and non urban areas, codifies directly AIS and includes all injury descriptions. Nonetheless it is a quite expensive register as it needs a great number of human resources. On the other hand national hospital records are less expensive because data is systematically gathered for all people hospitalised for whatever reason, the drawback being that there is no information on non hospitalised road crash victims. ICD 9 – CM is less precise than AIS 90 for injury description, but this is less true when considering ICD 10, which is already used in hospitals in some European countries. This could improve the situation, with the condition that a corresponding ICDMAP be available. Whatever method used to link the medical data to police data, the linked data will inevitably be reduced (and therefore a problem of information loss) and often biased. These biases will need to be identified, estimated and taken into account in the analysis and interpretation In view of the rather large numbers of unlinked data, regardless of the linking method applied, the use of a unique personal identifier in police and hospital data is strongly advocated. However, because of various privacy aspects of such (national) efforts, this road may still be a long one. In the meantime, linking of data might be facilitated by removing barriers that still exist between those responsible for registration, especially concerning medical data, and those trying to make these data useful for scientific research. Part of the fact that the (linked) data used in this project did not yield sufficient results (as in case of pedestrian-car accidents) is due to insufficient numbers of these (linked) cases. It is therefore recommended to use bigger samples, either by having more years, larger areas, or more countries.

PENDANT Deliverable D9 WP3 - Data analysis
Project funded by the European Community under the ‘Competitive and Sustainable Growth’
Programme (1998-2002) Page 74
Conclusions and recommendations regarding future legislation
The health consequences of road accidents are essential knowledge for public health because it defines current issues and makes it possible to monitor eventual changes in public health. It is also important to consider this knowledge in relation to the evolution in road user behaviour, the vehicles and the infrastructure. Working together with several countries has many advantages: Increases the amount of observations, which may make it possible to better identify some risk factors; but the price to pay for this is the increased dispersion of the measures. This study allowed assessing the utility of hospital data on road injuries to complement police data which is usually the most common source of information on road crashes. Some results have been produced, such as the differences of injury patterns between the road user types, or depending on the impact area in car to car collision, as well as more specific results such as the importance of whiplash injury even in case of slight crashes, or the relatively high frequency of chest injuries when focusing on severe injuries sustained by pedestrians hit by a car. This study also shows that when high precision is necessary for some data, in-depth investigations, such as those implemented in the WP2, would be more fruitful. In spite of the limitations, it showed how hospital data, unlinked and linked to police data, can provide information on severity and the nature of injuries according to road user type and crash characteristics. It is especially useful for monitoring and planning international comparisons.

PENDANT Deliverable D9 WP3 - Data analysis
Project funded by the European Community under the ‘Competitive and Sustainable Growth’
Programme (1998-2002) Page 75
References
AAAM (Association for the Advancement of Automotive Medicine). Abbreviated Injury Scale, 1990 Revision. Des Plaines, Illinois, USA. Amoros E, Martin JL, Laumon B. Under-reporting of road crash casualties in France. Accid Anal and Prev 2006; 38:627-35. Anderson RWG. Whiplash associated disorders: a comprehensive review. Adelaide: Center for automotive safety research. Ballesteros MF, Dischinger PC, Langenberg P. Pedestrian injuries and vehicle type in Maryland, 1995-1999. Accident Analysis & Prevention 2004; 36 (1):73-81. Barell V, Aharonson-Daniel L, Fingerhut L et al. An introduction to the Barell body region by nature of injury diagnosis matrix. Injury Prevention 2002; 8:91-6. Berglund A, Alfredsson L, Jensen I et al. Occupant- and Crash-Related Factors Associated with the Risk of Whiplash Injury. Annals of Epidemiology 2003; 13 (1):66-72. Bring G, Bjornstig U, Westman G. Gender patterns in minor head and neck injuries: An analysis of casualty register data. Accident Analysis & Prevention 1996; 28 (3):359-69. Dischinger PC, Cushing BM, Kerns TJ. Injury patterns associated with direction of impact: drivers admitted to trauma centers. Journal of Trauma 1993; 35:p. 454-9. Greenland S. Model-based estimation of relative risks and other epidemiologic measures in studies of common outcomes and in case-control studies. American Journal of Epidemiology 2004; 160 (4):301-5. Grisoni E, Stallion A, Nance M et al. The new injury severity score and the evaluation of pediatric trauma. Journal of Trauma 2001; 50:1106-10. Kraft M, Kullgren A, Ydenius A. Influence of crash pulse characteristics on whiplash associated disorders in rear impacts - crash recording in real life crashes. Traffic Injury Prevention 2002; 3 (141-9). Lawrence JM, Siegmund GP. Seat back and head restraint response during low-speed rear-end automobile collisions. Accident Analysis & Prevention 2000; 32 (2):219-32. Lindquist K. How to estimate relative risk in SAS using Proc Genmod for common outcome in cohort studies 2004 [cited 2004 December 9, 2004]. MacKenzie E, Sacco W. ICDMAP-90 Software: User's Guide. In: University TJH, editor. USA: The Johns Hopkins University and Tri-Analytics. In, translator and editor; 1997; p. 1-25. Martin JL, Derrien Y, Laumon B. Estimating relative driver fatality and injury risk according to some characteristics of cars and drivers using matched-pair multivariate analysis. In 18th ESV Conference. Nagoya; 2003. paper n°364 p. Martin JL, Lafont S, Chiron M et al. Différences entre les hommes et les femmes face au risque routier (full text in English on www.e2med.com/resp). Revue d'épidémiologie et de santé publique 2004; 52:357-67. McLellan BA, Rizoli SB, Brenneman FD et al. Injury Pattern and Severity in Lateral Motor Vehicle Collisions: A Canadian Experience. Journal of Trauma 1996; 41 (4):708-13.
PENDANT Deliverable D9 WP3 - Data analysis
Project funded by the European Community under the ‘Competitive and Sustainable Growth’
Programme (1998-2002) Page 76
Mizuno Y, Ishikawa H. Summary of IHRA pedestrian safety WG activities - Proposed test methods to evaluate pedestrian protection afforded by passenger cars. In ESV. Amsterdam; 2001. O’keefe G, Jurkovich G. Measurement of Injury Severity and Co-Morbidity. In, translator and editor Injury control: A guide to Research and Program Evaluation. Cambridge: Cambridge University Press; 2001. Ono K, Kanno M. Influences of the physical parameters on the risk to neck injuries in low impact speed rear-end collisions. Accident Analysis & Prevention 1996; 28 (4):493-9. Roudsari B, Mock C, Kaufman R. An evaluation of the association between vehicle type and the source and severity of pedestrian injuries. Traffic Injury Prevention 2005; 6:185-92. Rutledge R, Osler T, Emery S et al. The end of the Injury Severity Score (ISS) and the Trauma and Injury Severity Score (TRISS): ICISS, an international classification of diseases, Ninth Revision- based predictions tool, outperforms both ISS and TRISS as predictors of trauma patient survival, Hospital Charges, and Hospital Length of stay. J Trauma 1998; 44 (1):41-9. Spiegelman D, Hertzmark E. Easy SAS Calculations for Risk or Prevalence Ratios and Differences. American Journal of Epidemiology 2005; 162 (3):199-200. Viano D. Seat influences on female neck responses in rear crashes: a reason why women have higher whiplash rates. Traffic Injury Prevention 2003; 4:228-39. Watanabe Y, Ichikawa H, Kayama O et al. Influence of seat characteristics on occupant motion in low-speed rear impacts. Accident Analysis & Prevention 2000; 32 (2):243-50. Welcher JB, Szabo TJ. Relationships between seat properties and human subject kinematics in rear impact tests. Accident Analysis & Prevention 2001; 33 (3):289-304. Zou G. A modified Poisson regression approach to prospective studies with binary data. American Journal of Epidemiology 2004; 159 (7):702-6.

PENDANT Deliverable D9 WP3 - Data analysis
Project funded by the European Community under the ‘Competitive and Sustainable Growth’
Programme (1998-2002) Page 77
Annex 1. The linking of some French hospital and police road casualties data
Emmanuèle Amoros, Jean-Louis Martin INRETS Section 2 describes the record-linkage procedure (methodology, software, datasets), section 3 provides the broad results of the record-linkage, section 4 provides a comparison of the 3 datasets: linked, hospital and police, with the hospital records being restricted to hospitalised casualties (as the ones on which the analysis of injury patterns is based). Section 5 provides a similar comparison, but with the hospital data including both in and out-patients.
Linking procedure
Methodology
We have first implemented a record-linkage methodology to be applied retrospectively on the police and medical datasets, once they are available. The 1997-2003 data have been linked this way. The method used for record-linkage is both a probabilistic and a manual method. It is manual because a major linking variable can not be standardised into numerical codes. This major linking variable is the place of accident: city/village and details such as street name. This variable is unformatted free text; it can not be standardised and coded without important loss of information. The method is manual in the sense that the person in charge of the linking process goes through any single record (of the police dataset), trying to match it with one from the medical registry dataset; this process is performed on the computer screen, assisted by a user-friendly specific application. It is a probabilistic method as we allow for some possible error in the linking variables. Typically, we allow for the date of accident to differ by 1 or 2 days, if the other linking variables agree. No matching weights based on probabilities are computed (since it was not possible on one of the linking variables). The decision of linking two records is made on how many linking variables agree, which ones and, on which values. The linking variables are : • date of crash, • time of crash, • location of crash (town/district/village and details such as road(s) number or
street(s) name), • date of birth (only year and month are available) of the casualties, • gender of the casualties, • road user type of the casualties the most important ones being date of crash, location of crash, year and month of birth of casualties From 2002 onwards :

PENDANT Deliverable D9 WP3 - Data analysis
Project funded by the European Community under the ‘Competitive and Sustainable Growth’
Programme (1998-2002) Page 78
In order to improve the exhaustivity of the registry and the completeness of its information (i.e. reduce the number of missing values), the use of the police data is now part of the registry recording procedure. That is to say, every time a casualty is about to be recorded in the registry, it is first checked whether this casualty can be found in the police dataset. If so, the registry record is created by specifying the link with the record found in the police data and by copying police information about the crash (location, type of crash). If the casualty is not found in the police data, the registry record is created ex-nihilo. Firemen data are used in the same way. Indeed, in France, firemen are very often called to provide emergency health care to casualties. The record-linkage method used in the same as previously ; it is based on the same variables and on the same criteria (except between the hospital data and the firemen data where the date of birth is not available but names are, as in the hospital data).
Linking software
A specific software was developed in Visual Basic ; it works in the Microsoft Access environment. The software is basically a user-friendly way of comparing the two datasets. It allows for different sorting on the linking variables, and pre-selecting of the records that match on date of accident and date of birth (year and month). It displays casualties records grouped within accident. Values of all different linking variables are displayed. One goes through every police casualty record, tries to find the corresponding record in the medical registry dataset. Two records are linked with a “press-button”, and hence be selected out of the records to be linked. From 2002 onwards : A specific software was developed in Visual Basic ; it works in the Microsoft Access environment. It works very much in the same way, apart from the fact that there is a third dataset (firemen data).
Data preparation
Police data The French police are required by law to write a crash report for every road crash causing at least one casualty. A road crash is officially defined as a crash involving at least one vehicle and occurring on the network open to public traffic. Skateboard or roller skate users are considered as pedestrians by the police, and, as such, are only classified as road casualties if hit by a vehicle. There is no restriction about motorised vehicles, in other words there is no exclusion criteria on bicycles. The police crash report should report all the people involved in the crash: injured (i.e. casualties) and non-injured ones. The police crash report contains detailed information on the crash, the crash environment and conditions, the vehicles involved, but it contains limited information on the people involved. These police reports are paper reports; most of the information they contain is recorded into electronic files (BAAC= bulletin d’Analyse d’Accident Corporel), according to a standardised format. The police dataset used here is the one restricted to the Rhône county: only crashes that occur in the Rhône county are selected.
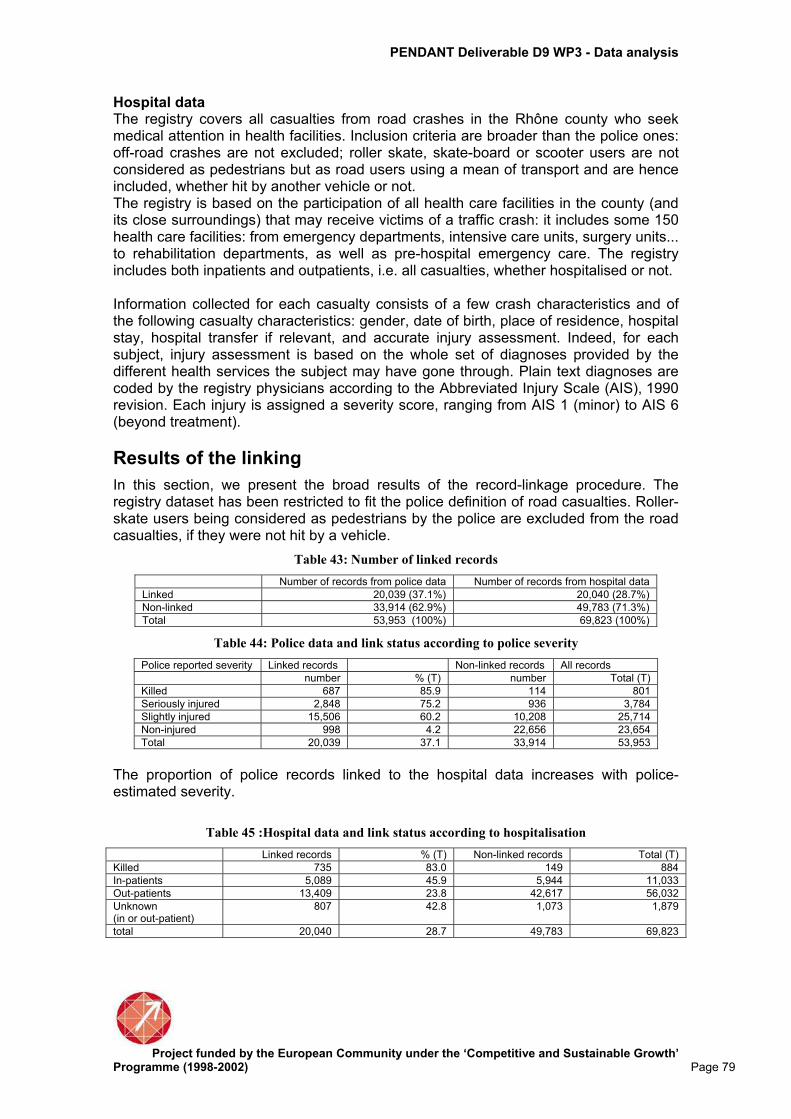
PENDANT Deliverable D9 WP3 - Data analysis
Project funded by the European Community under the ‘Competitive and Sustainable Growth’
Programme (1998-2002) Page 79
Hospital data The registry covers all casualties from road crashes in the Rhône county who seek medical attention in health facilities. Inclusion criteria are broader than the police ones: off-road crashes are not excluded; roller skate, skate-board or scooter users are not considered as pedestrians but as road users using a mean of transport and are hence included, whether hit by another vehicle or not. The registry is based on the participation of all health care facilities in the county (and its close surroundings) that may receive victims of a traffic crash: it includes some 150 health care facilities: from emergency departments, intensive care units, surgery units... to rehabilitation departments, as well as pre-hospital emergency care. The registry includes both inpatients and outpatients, i.e. all casualties, whether hospitalised or not. Information collected for each casualty consists of a few crash characteristics and of the following casualty characteristics: gender, date of birth, place of residence, hospital stay, hospital transfer if relevant, and accurate injury assessment. Indeed, for each subject, injury assessment is based on the whole set of diagnoses provided by the different health services the subject may have gone through. Plain text diagnoses are coded by the registry physicians according to the Abbreviated Injury Scale (AIS), 1990 revision. Each injury is assigned a severity score, ranging from AIS 1 (minor) to AIS 6 (beyond treatment).
Results of the linking
In this section, we present the broad results of the record-linkage procedure. The registry dataset has been restricted to fit the police definition of road casualties. Roller-skate users being considered as pedestrians by the police are excluded from the road casualties, if they were not hit by a vehicle.
Table 43: Number of linked records
Number of records from police data Number of records from hospital data
Linked 20,039 (37.1%) 20,040 (28.7%)
Non-linked 33,914 (62.9%) 49,783 (71.3%)
Total 53,953 (100%) 69,823 (100%)
Table 44: Police data and link status according to police severity
Police reported severity Linked records Non-linked records All records
number % (T) number Total (T)
Killed 687 85.9 114 801
Seriously injured 2,848 75.2 936 3,784
Slightly injured 15,506 60.2 10,208 25,714
Non-injured 998 4.2 22,656 23,654
Total 20,039 37.1 33,914 53,953
The proportion of police records linked to the hospital data increases with police-estimated severity.
Table 45 :Hospital data and link status according to hospitalisation
Linked records % (T) Non-linked records Total (T)
Killed 735 83.0 149 884
In-patients 5,089 45.9 5,944 11,033
Out-patients 13,409 23.8 42,617 56,032
Unknown (in or out-patient)
807 42.8 1,073 1,879
total 20,040 28.7 49,783 69,823

PENDANT Deliverable D9 WP3 - Data analysis
Project funded by the European Community under the ‘Competitive and Sustainable Growth’
Programme (1998-2002) Page 80
Analysis of differences of results from three data sources
In this section, the data are restricted to the criteria used in the analysis of injury patterns. That is to say, hospital data are restricted to hospitalised casualties. From the registry, we exclude non-hospitalised casualties and fatalities (non-injured are already excluded by definition of the registry). From the police data, we exclude non-injured casualties and fatalities ; no restriction on hospitalised casualties can be applied since this information is not available in the French police data.
Table 46 : Numbers of linked and non-linked records, according to data source (police
data, hospital data, 1997-2003)
Number of records from police data Number of records from hospital data (in-patients only)
Linked 5,006 (17.0%) 5,006 (45.4 %)
Non-linked 24,489 (83.0%) 6,027 (54.6 %)
Total 29,495 (100%) 11,033 (100%)
Table 47 : Relative numbers of casualties, according to road user type and to data source
(linked data, police data, hospital data,1997-2003)
Linked data (in-patients only)
Police data (all injured)
Hospital data (in-patients only)
Pedestrian 21.1 13.8 15.8
Cyclist 4.2 3.2 14.9
Car 45.6 61.3 39.5
2-wheeled mv 26.1 17.5 25.9
other 2.8 4.3 4.0
total 5006 (100%) 29,495 (100%) 11,033 (100%)
As regards to road user type, the linked data of hospitalised casualties are different from the hospital data and from the police data. The proportion of car occupants is larger in the linked dataset compared to the hospital dataset (but smaller than in the police dataset) ; the proportion of pedestrians is higher in the linked datset compared to the hospital data and to the police datat. The proportion of cyclists is much smaller in the linked dataset than in the hospital dataset.
Table 48: Relative numbers of casualties, according to age and to data source (linked data,
police data, hospital data,1997-2003)
age Linked data (in-patients only)
Police data (all injured)
Hospital data (in-patients only)
0-14 10.0 9.3 17.4
15-24 30.4 30.8 29.2
25-34 19.5 21.8 17.1
35-44 13.8 14.4 12.7
45-54 10.6 10.6 10.0
55-64 5.8 5.5 5.4
65+ 9.9 6.9 8.1
unknown 0.1 0.7 0.2
(N=5006) 100% (N=29495) 100% (N=11033) 100%
As regards to age, the linked data are similar to the police data, but they show a shift towards older age compared to the hospital data: fewer children in the linked data than in the hospital data, and more adults and older casualties.

PENDANT Deliverable D9 WP3 - Data analysis
Project funded by the European Community under the ‘Competitive and Sustainable Growth’
Programme (1998-2002) Page 81
Table 49 : Relative numbers of casualties, according to sex and to data source (linked data,
police data, hospital data,1997-2003)
Sex Linked data (in-patients only)
Police data (all injured)
Hospital data (in-patients only)
Male 69.0 60.5 70.9
Female 30.9 39.5 29.0
Unknown 0.1 - 0.1
Total (N=5006)100% (N=29495) 100% (N=11033) 100%
The linked data are very similar in terms of gender distribution to the hospital data.
Table 50: Relative numbers of casualties, according to type of crash opponent and to data
source (linked data, police data,1997-2003)
Type of crash opponent Linked data (in-patients only)
Police data (all injured)
Car 63.0 68.5
Van 4.4 4.6
HGV & bus 6.9 6.0
2-wheeled mv 2.6 2.3
Cyclist 0.3 0.3
Pedestrian 0.4 0.6
Obstacle 18.4 14.1
Single vehicle crash 2.7 2.4
Other 1.3 1.1
Total (N=5006) 100% (N=29495) 100%
The linked data are quite similar to the police data in terms of type of crash opponent. The only small difference is that the linked dataset contains sligthly less casualties with car opponents and slightly more casualties from crashes against an obstacle.
Table 51 : Relative numbers of casualties, according to MAIS and to data source (linked
data, hospital data,1997-2003)
MAIS Linked data (in-patients only)
Hospital data (in-patients only)
1 Minor 12.3 17.5
2 Moderate 45.4 47.7
3 Serious 31.1 26.7
4 Severe 7.9 5.6
5 Critical 2.9 1.8
6 Maximum 0.0 0.0
Unknown 0.4 0.7
Total (N=5006) 100% (N=11033) 100%
The linked data display somewhat higher MAIS of the hospitalised casualties than the hospital data.
Table 52 : Relative numbers of casualties, according to ISS and to data source (linked data,
hospital data,1997-2003)
ISS Linked data (in-patients only)
Hospital data (in-patients only)
1-4 26.0 36.4
5-9 42.1 40.5
10-25 25.8 18.9
26-74 5.8 3.6
75 0.0 0.0
Unknown 0.4 0.7
Total (N=5006) 100% (N=11033) 100%
The linked data show a higher ISS of the hospitalised casualties than the hospital data. Altogether, hospitalised casualties in the linked dataset are more seriously injured than hospitalised casualties in the registry.

PENDANT Deliverable D9 WP3 - Data analysis
Project funded by the European Community under the ‘Competitive and Sustainable Growth’
Programme (1998-2002) Page 82
Table 53 : Relative numbers of casualties, according to the most seriously injured body
region and to data source (linked data, hospital data,1997-2003)
Most seriously injured body region
Linked data (in-patients only)
Hospital data (in-patients only)
Head and face 36.4 36.4
Neck 0.6 0.9
Thorax, abdomen 13.7 11.9
Spine 5.9 5.9
Arms 14.2 18.7
Legs 28.2 24.7
Unknown 1.0 1.5
Total (N=5006) 100% (N=11033) 100%
As regards to the most seriously injured body region, hospitalised casualties in the linked dataset are similar to the hospitalised casualties in the registry.
Conclusion The linked dataset of hospitalised casualties are somewhat different from the hospitalised casualties in the registry (which is assumed to be representative of the road hospitalised casualties in the Rhone county) : they include far fewer cyclists, slightly more car occupants, they are somewhat older (fewer children especially) and they are somewhat more seriously injured.
Analysis of differences of results from the two data sources-not restricted to hospitalised only In this section, we no longer restrict the hospital data to hospitalised only ; we use them « as they are » that is to say, including both in-patients and out-patients, so as to understand how the data available in France -police and hospital ones - compare to each other. Casualties excluded from this analysis are the following : 1) killed (excluded from both police and registry), 2) non-injured (excluded from police data ; already excluded from the registry, by definition)
Table 54 : Numbers of linked and non-linked records, according to data source (police
data, hospital data, 1997-2003)
Number of records from police data Number of records from hospital data (in and out-patients)
Linked 18,329 (62.1%) 18,329 (26.5%)
Non-linked 11,169 (37.9%) 50,693 (73.5%)
Total 29,498 (100%) 69,022 (100.0%)
Table 55: Relative numbers of casualties according to road user type and to data source
(linked data, police data, hospital data,1997-2003)
Linked data Police data Hospital data (in and out-patients)
Pedestrian 14.4 13.8 9.6
Cyclist 3.4 3.2 13.3
Car 60.0 61.3 53.0
2-wheeled mv 18.3 17.5 20.2
other 3.9 4.3 3.9
total (N=18329) 100% (N=29498) 100% (N=69022) 100%

PENDANT Deliverable D9 WP3 - Data analysis
Project funded by the European Community under the ‘Competitive and Sustainable Growth’
Programme (1998-2002) Page 83
As regards to road user types, the linked data (of all injured) are very similar to the police dataset. On the contrary the linked data are rather different from the hospital data. The proportion of pedestrians and of car occupants are larger in the linked dataset than in the hospital dataset. The proportion of cyclists is much smaller in the linked dataset than in the hospital dataset.
Table 56: Relative numbers of casualties, according to age group and to data source (linked
data, police data, hospital data,1997-2003)
age Linked data Police data Hospital data (in and out-patients)
0-14 8.2 9.3 13.5
15-24 30.4 30.8 32.6
25-34 23.0 21.8 22.1
35-44 14.7 14.4 13.1
45-54 10.7 10.6 9.0
55-64 5.8 5.5 4.5
65+ 7.1 6.9 4.9
unknown 0.1 0.7 0.2
(N=18329) 100% (N=29498) 100% (N=69022) 100%
As regards to age of the casualties, the linked data are very similar to the police data. The linked data are different from the hospital data, with the linked data corresponding to a shift towards increasing age : fewer children, and slightly more casualties above 45 years old in the linked dataset compared to the hospital dataset.
Table 57: Relative numbers of casualties, according to sex and to data source (linked data,
police data, hospital data,1997-2003)
Sex Linked data Police data Hospital data (in and out-patients)
Male 60.1 60.5 62.0
Female 39.8 39.5 37.9
Unknown 0.1 - 0.1
Total (N=18329) 100% (N=29498) 100% (N=69022) 100%
The distribution of males and females is similar in the 3 datasets.
Table 58: Relative numbers of casualties, according to type of crash opponent and to data
source (linked data, police data, 1997-2003)
Type of crash opponent Linked data Police data
Car 68.4 68.5
Van 4.8 4.6
HGV & bus 6.4 6.0
2-wheeled mv 2.1 2.3
Cyclist 0.3 0.3
Pedestrian 0.5 0.6
Obstacle 14.0 14.1
Single vehicle crash 2.4 2.4
other 1.1 1.1
total (N=18329) 100% (N=29498) 100%
As regards to type of crash opponent, the linked data are very similar to the police data, which are known not to be representative of the whole road casualties. For instance crashes involving a (human) third party are more likely to be police-reported than crashes not involving a third party (ref).

PENDANT Deliverable D9 WP3 - Data analysis
Project funded by the European Community under the ‘Competitive and Sustainable Growth’
Programme (1998-2002) Page 84
Table 59: Relative numbers of casualties, according to MAIS and to data source (linked
data, hospital data, 1997-2003)
MAIS Linked data Hospital data
1 Minor 60.6 72.3
2 Moderate 25.1 19.6
3 Serious 10.2 5.3
4 Severe 2.4 1.0
5 Critical 0.9 0.3
6 Maximum 0.0 0.0
Unknown 0.9 1.5
total (N=18329) 100% (N=69022) 100%
Casualties in the linked dataset are more seriously injured than casualties in the hospital dataset. This corresponds to a selection bias on severity in the reporting to and by the police (note : there is hardly no observation at MAIS 6 as fatalities are excluded from this analysis)
Table 60: Relative numbers of casualties, according to ISS and to data source (linked data,
hospital data, 1997-2003)
ISS Linked data Hospital data (in and out-patients)
1-4 87.1 82.6
5-9 9.1 11.8
10-25 1.9 3.5
26-74 0.3 0.6
75 0.0 0.0
Unknown 0.9 1.5
total (N=18329) 100% (N=69022) 100%
The distribution according to ISS confirms the selection bias towards more seriously injured casualties in the linked dataset.
Table 61: Relative numbers of casualties, according to the most seriously injured body
region and to data source (linked data, hospital data, 1997-2003)
Most seriously injured body region
Linked data Hospital data (in and out-patients)
Head and face 26.2 21.9
Neck 6.3 7.8
Thorax, abdomen 13.2 10.7
Spine 13.4 15.0
Arms 15.3 19.2
Legs 23.2 21.8
Unknown 2.4 3.6
total (N=18329) 100% (N=69022) 100%
As regards to the body region of the most serious injury, the linked dataset includes slightly more casualties with injuries to the head and face, and to the trunk (and respectively fewer casualties with injuries to the arms) Police under-reporting of road casualties and its associated risk factors have been studied using a multivariate analysis (Amoros et al. 2006). It was mainly shown that: 1) police under-reporting is inversely and strongly associated with injury severity, 2) police under-reporting is strongly related to both road user type and involvement of a third party. Casualties in crashes involving a third party (pedestrian or another vehicle) are more police –reported than thoses without; cyclists are far less police-reported than other road users types. 3) police under-reporting is strongly associated with the combination of road type, crash environment (metropole vs. rural area) and police force area (there are 3 different police forces). Detailed results are provided in the table below.

PENDANT Deliverable D9 WP3 - Data analysis
Project funded by the European Community under the ‘Competitive and Sustainable Growth’
Programme (1998-2002) Page 85
Table 62: Adjusted relative risks and adjusted (standardised) probabilities of being police-
reported among casualties in the registry; multivariate analysis (50936 non-fatal
casualties, Rhône county, 1997-2001)
n adj. prob. RR* 95% C.I.
injury severity:
NISS 1-3 37 873 15.1 % 0.38 0.36 0.41
NISS 4-8 8 632 24.3 % 0.62 0.58 0.66
NISS 9-15 2 822 33.1 % 0.84 0.79 0.90
NISS 16-24 997 37.6 % 0.96 0.89 1.03
NISS 25-75 612 39.3 % 1.00 - -
casualty age:
0-13 years old 5712 27.1 % 0.95 0.90 1.00
14-17 5116 26.8 % 0.93 0.89 0.98
18-24 12564 27.8 % 0.97 0.94 1.00
25-64 25111 28.6 % 1.00 - -
65 and above 2433 30.9 % 1.08 1.03 1.13
casualty gender
female 19441 27.5 % 0.95 0.92 0.97
male 31495 29.0 % 1.00 - -
road user type third party
pedestrians with 4742 44.4 % 0.99 0.95 1.03
cyclists with 1651 33.6 % 0.75 0.69 0.81
motorcyclists with 4924 46.5 % 1.03 0.99 1.07
car occupants with 20744 45.0 % 1.00 - -
van, truck, bus, tram users with 476 52.7 % 1.17 1.07 1.29
unknown (& other) with 44 55.0 % 1.22 0.90 1.67
cyclists without 5284 2.1 % 0.06 0.05 0.08 cyclists with - - 1.00 - - motorcyclists without 5127 14.7 % 0.32 0.29 0.35 motorcyclists with - - 1.00 - - car occupants without 6870 34.9 % 0.78 0.75 0.81 car occupants with - - 1.00 - - van, truck, bus, tram users without 675 25.5 % 0.48 0.41 0.57 van, truck, bus, tram users with - - 1.00 - - unknown (& other) without 399 36.3 % 0.66 0.46 0.96 unknown (& other) with - - 1.00 - - police force area x road type x environment:
‘urban motorways police’, motorways 4508 55.1 % 1.16 1.12 1.21
‘rural police’, motorways, rural area 117 46.3 % 0.98 0.81 1.18
‘rural police’, state & county roads, rural area 3027 37.7 % 0.80 0.76 0.83
‘rural police’, state & county roads, metropole 474 29.9 % 0.63 0.56 0.71
‘rural police’, local roads 7221 22.5 % 0.48 0.45 0.50
‘rural police’, off road 810 7.6 % 0.16 0.11 0.24
‘urban police’, state & county roads, metropole 266 58.1 % 1.23 1.10 1.37
‘urban police’, road except motorways, rural area 1523 19.6 % 0.41 0.37 0.47
‘urban police’, local roads, metropole 18764 47.3 % 1.00 - -
‘urban police’, off road 837 18.4 % 0.39 0.32 0.48
unknown 13749 18.3 % 0.39 0.37 0.40
light
day light 27059 28.4 % 0.92 0.89 0.95
night 10107 30.8 % 1.00 - -
unknown 13770 25.7 % 0.83 0.80 0.86
calendar year:
1997 9921 26.9 % 0.98 0.94 1.02
1998 10379 28.8 % 1.05 1.01 1.09
1999 10704 29.1 % 1.06 1.02 1.10
2000 9595 28.9 % 1.05 1.01 1.10
2001 10337 27.4 % 1.00 - -
* from a Poisson regression with robust error estimation; RR=relative risk; C.I. = Confidence Intervals
PENDANT Deliverable D9 WP3 - Data analysis
Project funded by the European Community under the ‘Competitive and Sustainable Growth’
Programme (1998-2002) Page 86
Annex 2. Linking hospital emergency records with police data in Spain 2002-2004
Catherine Pérez, Marc Marí Dell’Olmo ASPB Record linkage was developed in Barcelona to analyse the severity and nature of injuries according vehicle and circumstances of the crash and to estimate total number of casualties and fatalities. The data used in the record linkage are the reports of crashes with casualties recorded by the Barcelona Police Department (Guardia Urbana de Barcelona, GUB), as well as the medical records of the seven hospital emergency departments (ED) participating in the DUHAT project, which collects basic clinical information on all traffic injury cases. This chapter includes a description of the linking procedures of hospital emergency records with police data in Barcelona for years 2002-2004 and analysis of the distribution of linked and unlinked records.
Method All three years, 2002, 2003, and 2004 were linked separately. The method used for linking records was a mix that use probabilistic, with the aid of deterministic to generate blocking and with a final manual review. The probabilistic linkage process consists in matching two or more records which are believed to belong to the same individual. It is based in two probabilities: the probability of matching given that both records belong to the same individual and the probability of matching by chance. The less probable is a value of the variables, the greater is the weight assigned. The process is done by the software WCONNECTA developed by the Agència de Salut Pública de Barcelona (ASPB). Assuming that the methodology has been validated previously, the matching process implies these phases:
1. Data preparation 2. Selection of linkage variables 3. Evaluation of process feasibility 4. Computation of simple weights 5. Restriction of comparison pairs (blocking) 6. Comparison stage (matching) 7. Simple weights assignment 8. Computation of composite weights 9. Decision stage (linking) 10. Threshold determination 11. Review of dubious pairs
1. Data preparation For all three years, the GUB database contained a total number of 40,297 records, while the ED database included 42,566 cases. The discordance in the observed numbers among both databases is mainly due to the fact that some ED cases may result from crashes having occurred outside the jurisdiction of the GUB, that is, beyond

PENDANT Deliverable D9 WP3 - Data analysis
Project funded by the European Community under the ‘Competitive and Sustainable Growth’
Programme (1998-2002) Page 87
the city boundaries. Those who were identified as occurred out of the city were already excluded. Additionally, a number of injured cases recorded by the police may have attended a non-DUHAT ED or a primary care physician. 2. Selection of linkage variables Variables used for linkage were birth date, sex, position, vehicle, hospital, time and date of the crash and attendance, and first letter name and surnames (in Spain usually there are two surnames). The absence of a single a common identifier for both databases resulted in the need to link both sources of information with the probabilistic method, using the information of the common variables in both databases. 3.Evaluation of process feasibility In order to assess feasibility or the process, the number of possible combinations among the categories of the common variables in both files used in the linkage process needed to be higher than the sum of the records in each file (Jaro, 1995). For example, for year 2004, the variables are: sex (2 categories), vehicle (5c.), position (3c.), birth date (12,775c.), date of crash (365c.), hospital (7c.) and initials (514c.), ant total number of categories would be: 2x5x3x12775x365x7x514 = 503310.73x10^6. Since the number of possible combinations with these variables largely overcame the 26.117 records summing both files the process was considered viable. 4. Computation of simple weights Prior to linking records it was necessary to compute weights that will become useful later in the linking phase. These weights are based on two probabilities, the probability of matching given that both records belong to the same individual, and the probability of matching by chance. The less probable is a value of the variable, the greater is the weight assigned (Jaro, 1995). For each category within each variable there are three possible values based all them in the distribution of the variables to be compared among both files and taking into account missing values. A value that will be assigned to the pair if they coincided, a value that will be assigned if they do not coincide and zero if one of the two values are missing. 5. Restriction of comparison pairs (blocking) Once weights had been computed, it is necessary to compare the information obtained for the variables common to both files. This first step, known as the blocking phase (Jaro MA, [1995]), consisted in forming blocks in order to reduce the comparisons number. In our case we form blocks with those ED records for which the date and time of patient attendance was within three days after the crash occurrence reported in the police files. 6. Comparison stage (matching) Within each block, two level comparisons were made: firstly, the contents of the common variables for both files for each GUB record with each ED record were compared. 7. Simple weights assignment Out of every between-variable comparison a weight value was assigned.
-40,00 -20,00 0,00 20,00 40,00 60,00 80,00
Weight
0
200
400
600
800
1.000
Fre
qu
en
cy
dis
trib
uti
on
Mean = 14,5519
Std. Dev. = 21,93025
N = 12.631
Figure 1 Weights distribution, 2004

PENDANT Deliverable D9 WP3 - Data analysis
Project funded by the European Community under the ‘Competitive and Sustainable Growth’
Programme (1998-2002) Page 88
8. Computation of composite weights At a second stage, a composite weight as the sum of the individual weights obtained in between-variable comparisons was generated, allowing the comparison between records. For example, for year 2004, the minimum and maximum weights were –25.17 and 67.24, with a mean weight of 14.55 points (SD= 21.93). The weight variable distribution is described in Figure 1. We can see it is a bimodal distribution, and the only observation of the distribution does not allow to establish the cut points.
9. Decision stage (linking) An ED record was matched to a police record when it was the record with the highest composite weight after its comparison with all the remaining records in the selected block. 10. Threshold determination Using these weights, two threshold values were defined: the lower-threshold limit, under which all records with such weight value would be considered not corresponding to the same individual, and the upper-threshold limit, above which a record would be considered to belong to the same individual. 11. Review of dubious pairs For those pairs with a weight value between the two threshold limits, a manual review of the data by three reviewers was established, using additional information, in order to decide if the linkage was accepted. The software W-conecta includes and adaptation of the sequential review process used in the field of quality control. That is when dubious cases are reviewed, considering the number of correct or incorrect pairs, the software indicates how the thresholds must be modified. If in the chosen interval there are too many correct records the program suggest to lower the upper threshold, and if there are too many incorrect records to higher the lower threshold. The intervals decided to be reviewed were established observing the histogram and the distribution of weights. Review of dubious cases was done by three people to assure objectivity. A conservative criteria was chosen: the linkages between records considered correct by two or more persons, were considered correct linkages. The same criteria was used for incorrect pairs of records. Table 63 describes the number and percentages of concordance of variables coinciding more often among the pairs considered correct, after the records were linked with their best possible pairs.

PENDANT Deliverable D9 WP3 - Data analysis
Project funded by the European Community under the ‘Competitive and Sustainable Growth’
Programme (1998-2002) Page 89
Table 63: : Variables used for linkage. Number and percentage of concordance.
2002 2003 2004
Number Concordance
(%) Number
Concordance (%)
Number Concordance
(%)
Day and Year 5,191 100% 6,192 94.1% 5,509 95.7%
Month and Year 5,191 100% 6,301 95.7% 5,601 97.3%
Position 5,059 97.5% 6,255 95.0% 5,500 95.5%
Sex 4,775 92.0% 6,302 95.8% 5,595 97.2%
Hospital 4,527 100% 5,313 80.7% 4,604 80.0%
Vehicle 3,212 61.9% 3,421 52.0% 3,391 58.9%
Initials - - 4,703 71.5% 4,468 77.6%
Date of crash / attendance 4,566 88.0% 6,121 93.0% 5,275 91.6%
Results of the linking
For all three years, 2002, 2003 and 2004, Police (Guardia Urbana de Barcelona, GUB) included 13,906, 13,480, 12,911 records respectively and the hospital database (Hospital emergencies, DUHAT) included 16,377, 12,983, 13,206 records respectively. In this section, we present the broad results of the record-linkage procedure. As can be seen in Table 64 finally 17,530 records were linked, which represent 22.2% of all police records and 41.2% of hospital records.
Table 64: Number of linked records
Number of records from police data Number of records from hospital data
Linked 17,527 (22.2%) 17,530 (41.2%)
Non-linked 61,273 (77.8%) 25,036 (58.8%)
Total 78,800 (100.0%) 42,566 (100.0%)
Table 65: Police data and link status according to police severity
Police reported severity Linked records Non-linked records All records
number % (T) number Total (T)
Killed 43 35.0 80 123
Seriously injured 604 59.9 404 1,008
Slightly injured 5,497 31.5 11,958 17,455
Non-injured 38 0.001 38,558 38,596
Unknown 11,345 52.9 10,273 21,618
Total 17,527 22.2 61,273 78,800
For a high number of records police do not record the estimated severity. Among linked records this number represents more than half of unknown severity records.

PENDANT Deliverable D9 WP3 - Data analysis
Project funded by the European Community under the ‘Competitive and Sustainable Growth’
Programme (1998-2002) Page 90
Table 66: Hospital data and link status according to hospitalisation
Linked records % (T) Non-linked records
Total (T)
Killed 26 53.1 23 49
In-patients 1,294 44.2 1,632 2,926
Out-patients 14,599 42.8 19,489 34,088
Moved to other hospital 604 40.9 871 1,475
Other 880 29.3 2,116 2,996
Missing 127 12.3 905 1,032
Total 17,530 41.2 25,036 42,566
The proportion of hospital linked records are higher for killed, in-patients, out-patients and moved than for other categories and missing.
Analysis of differences of results from three data sources In this section, the data are restricted to the criteria used in the analysis of injury patterns. Hospital data included all injured and excluded injured that had the collision out of the city of Barcelona. From the police data, we exclude non-injured casualties and fatalities.
Table 67: Numbers of linked and non-linked records, according to data source (police data,
hospital data, 2002-2004)
Number of records from police data
Number of records from hospital data (all injured)
Number of records from hospital data (in-patients
only)
Linked 17,446 (43.5%) 17,530 (41.2 %) 1,294 (44.2 %)
Non-linked 22,635 (56.5%) 25,036 (58.8 %) 1,632 (55.8 %)
Total 40,081 (100%) 42,566 (100%) 2,926 (100%)
Overall the proportion of linked records are similar in all two sources of information: police and hospital, and even considering only in-patients.
Table 68: Relative numbers of casualties, according to road user type and to data source
(linked data, police data, hospital data, 2002-2004)
Linked data (in-patients only)
Linked data (all injured)
Police data (all injured)
Hospital data (all injured)
Hospital data (in-patients only)
Car 10.2 31.5 32.0 22.1 11.0
2-wheeled mot 35.0 47.9 49.3 26.6 27.9
Cyclist 0.2 1.4 1.7 0.3 0.3
Lorry / bus 1.5 2.8 3.0 1.5 1.3
Pedestrian 35.2 16.2 13.5 13.3 26.3
Missing 17.8 0.2 0.5 36.2 33.3
total 1,294 (100%)
17,530 (100%)
40,081 (100%)
42,566 (100%)
2,926 (100%)
As regards to road user type, the linked data of in-patients casualties are different from police records as well as from all injured linked data. The proportion of linked in-patients car occupants is lower than for the police database and all injured in the hospital records, but similar to all in-patients. The proportion of linked two wheeled motor vehicle in-patients is lower than in the police dataset but higher than all hospital injured and only in-patients. The proportion of linked in-patient pedestrians is larger than all other datasets. Regarding the linked all injured casualties they are similar to all injured reported by police data, except for pedestrians, were the proportion of pedestrians is larger.

PENDANT Deliverable D9 WP3 - Data analysis
Project funded by the European Community under the ‘Competitive and Sustainable Growth’
Programme (1998-2002) Page 91
Table 69: Relative numbers of casualties, according to age and to data source (linked data, police
data, hospital data, 2002-2004)
age Linked data (in-patients only)
Linked data (all injured)
Police data (all injured)
Hospital data (all injured)
Hospital data (in-patients only)
0-14 2.4 2.3 3.4 2.8 2.6
15-24 25.3 30.5 29.3 31.3 26.3
25-34 20.8 30.2 30.3 30.8 22.9
35-44 14.0 14.2 14.7 13.7 13.3
45-54 8.2 8.6 8.8 8.0 8.2
55-64 7.6 6.0 5.6 5.7 7.6
65+ 21.7 8.1 6.7 7.4 18.9
unknown 0.0 0.0 1.1 0.3 0.2
(N=1,294) 100% (N=17,530) 100% (N=40,081) 100% (N=42,566) 100% (N=2,919) 100%
Regarding age distribution, among linked in-patient casualties there is a lower proportion of young population (15-34 years old) and a higher proportion of older than among police reported casualties and among all injured data. The distribution is more similar to all in-patients casualties. Regarding all injured linked cases the distribution of cases by age is similar to police data. There is only a slightly higher proportion of older casualties.
Table 70: Relative numbers of casualties, according to sex and to data source (linked data,
police data, hospital data, 2002-2004)
Sex Linked data (in-patients only)
Linked data (all injured)
Police data (all injured)
Hospital data (all injured)
Hospital data (in-patients only)
Male 61.7 58.6 60.1 60.0 65.6
Female 38.3 41.4 35.9 40.0 34.4
Unknown 0.0 0.0 4.0 0.0 0.0
Total (N=1,294)100% (N=17,530) 100% (N=40,081) 100% (N=42,566) 100% (N=2,926) 100%
There is a higher proportion of females than males in the linked datasets than among police casualties and hospital all injured and in-patients.
Table 71: Relative numbers of casualties, according to MAIS and to data source (linked
data, hospital data, 2002-2004)
MAIS Linked data (in-patients only)
Hospital data (in-patients only)
Linked data (all injured)
Hospital data (all injured)
0 No injured 29.9 37.9 11.3 16.1
1 Minor 23.0 16.3 69.2 66.0
2 Moderate 30.2 29.3 16.1 14.8
3 Serious 6.0 6.1 1.3 1.2
4 Severe 0.8 0.8 0.1 0.1
5 Critical 0.0 0.0 0.0 0.0
6 Maximum 0.0 0.0 0.0 0.0
Unknown 10.2 9.7 2.1 2.1
Total (N=1,294) 100% (N=2,926) 100% (N=17,530) 100% (N=42,566) 100%
Table 72: Relative numbers of casualties, according to ISS and to data source (linked data,
hospital data, 2002-2004)
ISS Linked data (in-patients only)
Hospital data (in-patients only)
Linked data (all injured)
Hospital data (all injured)
No ISS 20.2 28.1 8.1 11.6
1-3 23.0 16.3 69.2 66.0
4-8 30.2 29.3 16.0 14.8
9-75 6.7 6.8 1.4 1.3
Unknown 19.9 19.5 5.2 6.2
Total (N=1,294) 100% (N=2926) 100% (N=17,530) 100% (N=42,566) 100%
There are no important differences regarding the severity of injuries among linked and unlinked data.

PENDANT Deliverable D9 WP3 - Data analysis
Project funded by the European Community under the ‘Competitive and Sustainable Growth’
Programme (1998-2002) Page 92
Table 73: Relative numbers of casualties, according to the most seriously injured body
region and to data source (linked data, hospital data, 2002-2004)
Most seriously injured body region
Linked data (in-patients only)
Hospital data (in-patients only)
Linked data (all injured)
Hospital data (all injured)
Head 12.1 10.8 7.2 6.3
Face 1.6 1.4 1.6 1.3
Neck 0.0 0.0 0.0 0.0
Spine 3.2 2.8 20.3 22.0
Chest 3.0 3.1 3.2 3.4
Abdomen 1.0 1.0 0.2 0.3
Pelvis / Urogenital 1.4 1.3 0.3 0.2
Upper extremity 8.3 8.0 12.0 11.5
Lower extremity 19.1 16.8 16.6 15.6
Unknown 50.2 54.9 38.6 39.3
Total (N=1,294) 100% (N=2,926) 100% (N=17,530) 100% (N=42,566) 100%
There are neither important differences regarding the body region of injuries among linked and unlinked data.
Analysis of under- reporting of road casualties Police under-reporting of road casualties and its associated risk factors have been studied using a multivariate analysis Multivariate analysis fitting log-binomial models, is conducted, to estimate the probability of being police-reported among hospital casualties . The adjusted model showed that, considering the hospital database, collisions occurred in January to April, July, September and October were more likely to be reported than those in August; casualties during the daytime were less likely to be reported by the police in front to night time; while users of two motor wheels, bicycle, and pedestrians are more likely to be linked than car users; having a fracture, and internal injury, a or other a wound or other were more likely to be reported and having a injury in the face. There were also differences on the hospitals who reported. Injury severity and having a third party was not associated with a different probability of being police reported.

PENDANT Deliverable D9 WP3 - Data analysis
Project funded by the European Community under the ‘Competitive and Sustainable Growth’
Programme (1998-2002) Page 93
Table 74: Adjusted prevalence ratio (PR) of being police-reported among casualties in the
hospital emergency dataset. Log binomial regression. Barcelona 2002-2004.
Under Reporting log-binomial n PR IC95%
Month January 3.181 1,11** 1,02 1,20 February 3.184 1,08* 1,00 1,17 March 3.387 1,12** 1,04 1,21 April 3.125 1,07* 0,99 1,16 May 3.729 1,03 0,95 1,12 June 3.882 1,03 0,95 1,12 July 3.909 1,08* 1,00 1,16 August 2.748 1 September 3.612 1,08* 1,00 1,17 October 3.775 1,10** 1,01 1,19 November 3.718 1,04 0,96 1,12 December 3.743 1,00 0,92 1,08
Year 2002 16.377 1 2003 12.983 1,17** 1,13 1,21 2004 13.206 1,07** 1,03 1,11
Daytime Day 28.219 0,93** 0,90 0,96 Night 13.508 1
Road user type Car 9.425 1 Two wheels motor veh 11.326 1,10** 1,06 1,14 Bicycle 136 1,20* 0,99 1,45 Truck or bus 645 1,04 0,95 1,14 Pedestrian 5.644 1,11** 1,06 1,16
Type of injury Fracture 4.158 1,12** 1,04 1,20 Esguince 11.271 1 Internal 2.461 1,15** 1,01 1,31 Wound 1.461 1,22** 1,12 1,32 Contusion 15.747 1,06 0,99 1,13 Other 439 1,11* 0,98 1,26 No specified 615 0,89 0,55 1,43
Body region Head 2.683 1,08 0,95 1,22 Face 1.363 1,08* 0,99 1,18 Neck 9.070 1 Thorax 2.329 0,96 0,88 1,04 Abdomen 435 0,91 0,79 1,05 Upper extremities 4.742 0,99 0,92 1,08 Lower extremities 6.937 0,99 0,92 1,07 Undetermined 458 1,06 0,93 1,20
Hospital Sant Pau 8.343 0,76** 0,73 0,80 Hospital del Mar 7.225 1 Hospital Clínic 9.921 0,92** 0,89 0,97 Creu Roja 1.953 0,49** 0,45 0,54 Hospital de l’Esperança 2.771 1,24** 1,19 1,29 Vall d’Hebron 11.188 0,85** 0,81 0,88 Sant Joan de Deu 1.165 0,26** 0,21 0,31
Conclusion The linked dataset of in-patient casualties are somewhat different from the hospitalised casualties. They include more two wheels motor vehicle users and more pedestrians, they are somewhat older, and more females. The linked dataset of all injured casualties are also somewhat different from all injured who attended the hospital emergency department. There are more car occupants, two wheels motor vehicle users and more pedestrians, and fewer cases with unknown road user type. There are no differences by age, sex and severity distribution.

PENDANT Deliverable D9 WP3 - Data analysis
Project funded by the European Community under the ‘Competitive and Sustainable Growth’
Programme (1998-2002) Page 94
Annex 3. The linking of Dutch hospital, police, and vehicle data
Boudewijn van Kampen, SWOV In this chapter, the linking procedure, and the results of linking data from three different data sources are described. Also, differences are analysed between distributions of similar variables from the different data sources. In the end, conclusions are given with respect to the representativeness and usefulness of the linked data for this research project.
Linking procedure
Introduction
The procedure for the linking of statistical data of both the police registration and hospital registration, as used for this Pendant-project, has already been described in Deliverable D7. That description is based on former SWOV-studies, lately carried out in 2000. The main features of this linking procedure are: "The linking procedure compares a number of key variables contained in the two databases on a record by record basis. For each record, the key variables are put together in one overall number. The linking procedure is well suited for situations where unique identifiers like a personal ID number are not available for linking. A generalised distance function is defined which quantifies the similarity between pairs of records in the two databases. This quantified similarity can be used to assess the probability of the correctness of a match: the smaller the distance, the higher the probability that the two records refer to the same individual. The linking procedure therefore is not exactly probabilistic but looks more or less similar, because discrepancies between records are tolerated, including missing information. The procedure is also conjunct because it simultaneously compares all the records in the first database with all of the records in the second database, and therefore only requires two passes through the data. In the SWOV method two records are matched when they are each other’s nearest neighbours in terms of distance or similarity. Moreover, the difference between the distance of a matched pair of records and the distances to their two next best neighbours is used to quantify the selectivity (or exclusiveness or uniqueness) of the match. This selectivity measure provides a second diagnostic for the probability of correctness of a match, and is also new compared to other linking methods discussed in the literature".
It was planned within the Pendant project not only to link police data to hospital data, as in these previous SWOV-studies, but also to link these to vehicle data, as available from the vehicle registration office. A linking of three different data sources (police, hospital, and vehicle) had never before been carried out, though linking of police data to vehicle data was carried out by SWOV in previous studies, among which one for the EU (the first Compatibility project). As it happened, during the course of this Pendant study, at the beginning of 2005, linked data from police registration (accidents) and vehicle registration (license number related vehicle details) became available as standard product provided by the Dutch
PENDANT Deliverable D9 WP3 - Data analysis
Project funded by the European Community under the ‘Competitive and Sustainable Growth’
Programme (1998-2002) Page 95
Ministry of Transport instead of accident data only. So, linking these to the hospital data would provide the three-way linking that was aimed for. Only three years (2001-2003) of linked accident-vehicle data became available, so this was the restriction with regard to years to be analysed with regard to three-way linked data as well. Though SWOV had carried out several projects regarding the linking of police and hospital data, as described before, the actual linking as well as the necessary infrastructure and software to carry out this work, had always been provided by the organisation that also manages the hospital data (now called Prismant). This was done both for practical reasons and because of privacy regulations, pertaining to the handling of hospital data (including personal data such as date of birth, and name of hospital). However, times change, and during negotiations with Prismant concerning the delivery of the hospital data needed for linking, it became obvious that this organisation was no longer involved in extensive data handling, as needed for the linking procedure. Furthermore, the hospital data needed for linking were only slightly different from the hospital data that were already delivered to SWOV on a yearly base. Negotiations resulted therefore in an agreement (protocol) that the linking itself would be carried by SWOV, at SWOV, for which purpose the relevant data would be provided (at a cost). The sensitive elements would have to be deleted right after successful linking. This was a major point with regard to the use of hospital information for this Pendant-study. This way, no further linking to whatever other data source would be possible, complying therefore to privacy regulations in the Netherlands. This also meant that SWOV had to (re)programme all relevant computer work for the linking procedure, as well as for the selection of data from the different sources and for the different years. The negotiations mentioned, followed by the final delivery of the proper hospital data for the years 1997-2003, took about 6 months more than scheduled at the start of this project.
Linking software
All linking software, as well as programmes needed for the selection of the different data, were written in SAS, one the standards used at SWOV. Since the central element of our statistical way of record linking is a comparison of every record from one sample with every record from the other, this was expected to take an enormous amount of computer time to complete (we are talking about tenths of thousands of records for each dataset for each year). The software was produced in May 2005 and was successfully tested on a standard PC; each full year took about one hour of computer running time.
Data preparation
Accident and vehicle data Accident data is standard available at SWOV on a yearly base. The data is based on police registration, and is controlled and processed by the Ministry of Transport. As usual for police registration base data of accidents, this data is not complete, not even with regard to fatal accidents, and is also not representative of the real traffic accident situation. This latter fact is above all caused by huge underrepresentation of accidents involving cyclists, especially single vehicle accidents. Recently (starting 2004) the data is available in a new format (called BRON), not fully comparable to the previous long-lasting format (called VOR).
PENDANT Deliverable D9 WP3 - Data analysis
Project funded by the European Community under the ‘Competitive and Sustainable Growth’
Programme (1998-2002) Page 96
At the same time, the police based accident data (including casualty detail and basic vehicle detail) has been linked to vehicle data by the Ministry of transport. They used the unique license number of every licensed vehicle (cars, vans, heavy goods vehicles, buses, and motorcycles) to acquire all available detail from the records of the Vehicle registration office (RDW). So these linked data represent the real situation, even if for about 10% of all licensed vehicles involved no detail was available at RDW. These vehicle details became available for accidents from 2001. Since the year 2004 was not fully available with regard to accidents at the start of the linking process, the years used for the purpose of Pendant linking were restricted to 2001-2003. Furthermore the years 1997-2003 were used for linking without vehicle detail. From the accident data 1997-2003 all casualty records were selected, not only those concerning hospitalised, but also all other casualties (i.e. fatalities and less severely injured). This was done since it was established during the previous linking activities that most of the fatalities (excluding most of those who were reported by police to have died on the scene or during transport), and a considerable number of less severely injured could be linked to hospital data. This points to the fact that police based information about (injury) severity of casualties is not quite accurate (see also further details in Table 76). This selection procedure yielded some 40,000 records per year, of which some 10,000 are 'hospitalised' according to police. As described, the data for the years 2001-2003 was provided also with considerable vehicle detail, from which Make, Type, Model year, Curb weight are the most relevant. All records contain the necessary key-variables, used in the linking procedure: Date and hour of accident; Date of birth and sex of casualty; Name of hospital; Severity of casualty: fatal, hospitalised, non-hospitalised (A&E treated, slightly injured), and unknown severity. Hospital data Standard hospital data are provided to SWOV by Prismant on a yearly base. The data contains relevant discharge information from each patient, such as Date and hour of admittance; Length of hospital stay; Date of birth; Sex; Main injury diagnosis and secondary diagnoses (ICD-9 based); Collision type an mode of transport (ICD-9/E-code); Mode of discharge. For the purpose of the linking process, each record of these standard data was supplemented with the name of the hospital (this being the part that yielded privacy problems). Furthermore the standard selection of traffic accidents (certain ICD-9/E-codes) was supplemented with several others outside the standard range (E800-E829), such as 'type of accident unspecified' (E928.9). Prismant sent these data for the relevant years (1997-2004) as SPSS-files to SWOV. SWOV translated the files to SAS-data files, thereby also changing the orientation of the years from 'date of discharge' years (as usual) to 'date of admittance' years, in order to become comparable to the 'date of accident' years of the police data. Therefore the discharge data of 2004 was needed, since these contained discharges of patients admitted in 2003. At the same time, the records were stripped from doubles (persons admitted repeatedly for treatment of injuries from the same accident), and other irregularities. This selection procedure yielded some 26,000 records for each relevant year (1997-2003). The key-variables relevant for the linking are: Date and hour of admittance, Birth date, Sex, Name of hospital, and Type of discharge (i.e. dead or alive).

PENDANT Deliverable D9 WP3 - Data analysis
Project funded by the European Community under the ‘Competitive and Sustainable Growth’
Programme (1998-2002) Page 97
2.3.2.1. ICDMAP90 and coding fatal injuries At some time within this procedure, all casualty records have been treated with the software programme ICDMAP90, which translates all ICD-9 based individual diagnoses into AIS-codes (such as predot-codes, severity-codes, as well as MAIS and ISS). It then appeared that more individual AIS-severity=6 injuries (and therefore ISS=75 records) were found than could be expected from already available discharge information (which specifies fatal outcome). Further study revealed that the original ICD-diagnoses contained a relatively large number of 862.8 codes (=Thorax crush), rightly coded as AIS-severity=6 (fatal) by ICDMAP90. However, by comparing these diagnoses with other information (such as length of stay, type of discharge, etc) within the same records, it could be concluded that the injury meant to be described was not the fatal thorax crush, but far more likely a minor thorax contusion (such as ICD-9 code 922.1). After careful consideration, it was decided to replace these so-called fatal injuries with the minor thorax injuries. Of course, then the ICDMAP90 treatment procedure was repeated to obtain the proper injury- and severity scores for the whole sample. At the same time this observation has been reported to the Dutch authority that sets (additional) rules for coding ICD-9 diagnoses from hospital discharge information; it is expected that those rules are wrong with regard to these thorax injuries.
Results of the linking At the beginning of October 2005, the linking process itself was carried out, combining about 26,000 hospital records and 40,000 police records respectively for each year, for a total of 7 years. The linking procedure as developed at SWOV yields several sets of tables (data files) per year. The most relevant ones are of course the files containing the linked data, but there are also files containing non-linked data for each of the original data sources. Apart from the original data obtained from each data source, the linked records contains new variables pertaining to different quality aspects of the linking process: the most important of these being the quality of the linking, expressed by the mathematical distance between the (mathematical expressed) keys of the linked records), and the sensitivity of the linking. Based on these two items, a scaled variable is constructed expressing the overall quality of the linking for each record. The best overall quality is applied to those records where the most relevant variables (such as date of birth and date of accident/admittance to hospital) were identical, and no other records could be linked at the same time (low sensitivity). The value of 1 was appointed to the best overall quality, while the value of 6 was appointed tot the worst category (considered as records that do not belong to identical casualties). Right after the successful linking of all separate years, all data was 'cleaned' from every item of individual nature (such as date of birth, accident date, hospital name, other keys used for identifying records, and so on). Further analyses could thus only be carried out anonymously, according to the aforementioned protocol. It was decided to use linked data having good quality (categories 1-3) for the purpose of this Pendant project, which represents 52% of all linked data (see Table 75). In this table we only show those years for which 3-way linked data are available (2001-2003), since these will become the main focus for further analyses regarding relations between hospital and police data.

PENDANT Deliverable D9 WP3 - Data analysis
Project funded by the European Community under the ‘Competitive and Sustainable Growth’
Programme (1998-2002) Page 98
Table 75: The numbers of linked records according to the quality of linking; 2001-2003
Overall linking quality Number of records linked
1 (best) 14,830
2 4,465
3 4,877
4 2,646
5 1,033
6 (worst) 18,465
Total linked 46,316
Not-linked Hospital data 32,070
Not-linked Police data 78,160
According to Table 75 the amount of records with the best quality of linking is 14,830 (in both datasets of course). Records with linking qualities 2 and 3 are also considered as properly linked, since they only differ slightly with respect to dates, and with respect to (police based) accident severity, and gender. As stated earlier, the analysis will be based on the numbers from the first three rows in the table (linking quality categories 1-3), since in these cases we are (statistically) certain that all relevant data match. We can derive furthermore from Table 75 that the proportion of linked records is far smaller in case of the hospital data, than in case of police data. This was expected, since we used far more police records than hospital records, as for instance records from those who were only slightly injured, or not admitted to hospital according to police. The following table gives more detail concerning those severity categories.
Table 76: The absolute and relative numbers of linked and non-linked records from police
data according to injury severity and linking quality; 2001-2003
Type of records from the police data
Linked records
All linked Good linked (cat 1-3)
Non-linked Records
Police reported severity
Number % (T) Number % (T) Number
Total number of records (T)
Fatal 1,405 46.7 635 21.1 1,603 3,008
Hospitalised 23,038 70.6 17,257 52.9 9,605 32,643
Not-hospitalised 20,158 24.2 5,613 6.7 63,227 83,385
Unknown 1,715 38.6 667 15.0 2,725 4,440
Total 46,316 37.2 24,172 19.4 78,160 124,476
As to be expected, by far the most frequently linked group are hospitalised with 71% linked in all, and still 53% when only the good linked are concerned. Of all police recorded fatalities 47% could be linked in all, of which 21% were good linked. It is obvious that those who died in hospitals are the most likely to have been linked, which excludes about 61% of their number (those who died at the spot, or before hospital admittance). From the large group of non-hospitalised almost 25% could be linked in all, of which 7% are good linked. Since almost 30% of the records of police registered hospitalised could apparently not be linked at all, one wonders whether this is due to misjudgement of police or to other causes. Other causes are more likely, because it is unlikely that the police would wrongly register a casualty as transported, and admitted to a hospital (from which the name also is specified), while this is not the case.
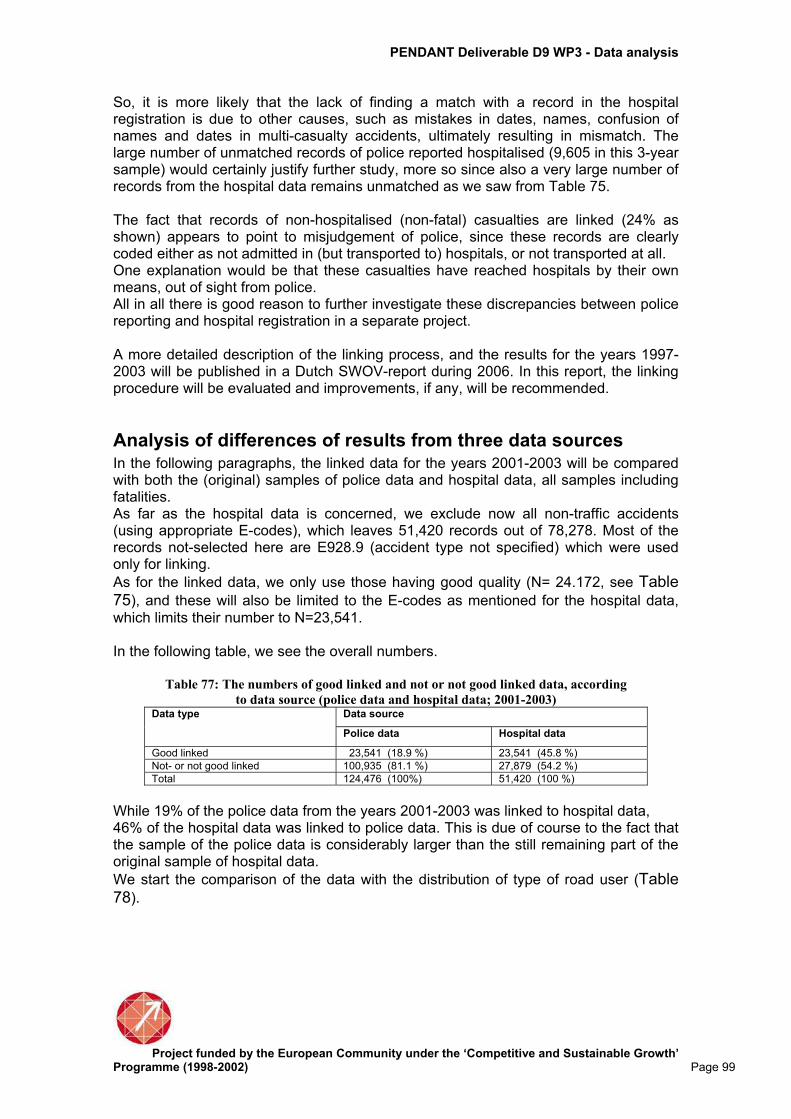
PENDANT Deliverable D9 WP3 - Data analysis
Project funded by the European Community under the ‘Competitive and Sustainable Growth’
Programme (1998-2002) Page 99
So, it is more likely that the lack of finding a match with a record in the hospital registration is due to other causes, such as mistakes in dates, names, confusion of names and dates in multi-casualty accidents, ultimately resulting in mismatch. The large number of unmatched records of police reported hospitalised (9,605 in this 3-year sample) would certainly justify further study, more so since also a very large number of records from the hospital data remains unmatched as we saw from Table 75. The fact that records of non-hospitalised (non-fatal) casualties are linked (24% as shown) appears to point to misjudgement of police, since these records are clearly coded either as not admitted in (but transported to) hospitals, or not transported at all. One explanation would be that these casualties have reached hospitals by their own means, out of sight from police. All in all there is good reason to further investigate these discrepancies between police reporting and hospital registration in a separate project. A more detailed description of the linking process, and the results for the years 1997-2003 will be published in a Dutch SWOV-report during 2006. In this report, the linking procedure will be evaluated and improvements, if any, will be recommended.
Analysis of differences of results from three data sources In the following paragraphs, the linked data for the years 2001-2003 will be compared with both the (original) samples of police data and hospital data, all samples including fatalities. As far as the hospital data is concerned, we exclude now all non-traffic accidents (using appropriate E-codes), which leaves 51,420 records out of 78,278. Most of the records not-selected here are E928.9 (accident type not specified) which were used only for linking.
As for the linked data, we only use those having good quality (N= 24.172, see Table 75), and these will also be limited to the E-codes as mentioned for the hospital data,
which limits their number to N=23,541. In the following table, we see the overall numbers.
Table 77: The numbers of good linked and not or not good linked data, according
to data source (police data and hospital data; 2001-2003) Data source Data type
Police data Hospital data
Good linked 23,541 (18.9 %) 23,541 (45.8 %)
Not- or not good linked 100,935 (81.1 %) 27,879 (54.2 %)
Total 124,476 (100%) 51,420 (100 %)
While 19% of the police data from the years 2001-2003 was linked to hospital data, 46% of the hospital data was linked to police data. This is due of course to the fact that the sample of the police data is considerably larger than the still remaining part of the original sample of hospital data.
We start the comparison of the data with the distribution of type of road user (Table 78).

PENDANT Deliverable D9 WP3 - Data analysis
Project funded by the European Community under the ‘Competitive and Sustainable Growth’
Programme (1998-2002) Page 100
Table 78: The relative numbers of casualties according to type of road user, and data
source (linked data, police data, and hospital data; 2001-2003).
Data source Road user
Linked data Police data Hospital data
Pedestrian 6.7 5.3 7.1
Cyclist 22.9 21.6 42.4
Car 38.9 42.7 26.0
2-wheeled mv 26.3 24.8 18.4
Other 5.2 5.6 6.1
Total (N=23,541) 100% (N=124,476) 100% (N=51,420) 100%
The most prominent differences are observed for the proportions of cyclists and car occupants. We see a change of the relative number of cyclists from a high 42% in the original Hospital data to a low 23% in the linked data, apparently because of their even lower percentage in the police data (22%). Otherwise we observe a change of the relative number of car casualties from 26% in the original hospital data to 39% in the linked data, because of their even higher percentage in the police data (43%). Furthermore we see that the proportion of casualties from two-wheeled motor vehicles is the largest in the linked data (26%), and the smallest in the hospital data (18%). The distribution according to age groups shows some differences with respect to the
data sources (Table 79).
Table 79: The relative numbers of casualties, according to age group, and data source
(linked data, police data, and hospital data; 2001-2003
Data source Age groups
Linked data Police data Hospital data
0-14 7.6 8.0 10.3
15-24 27.9 29.9 21.4
25-34 17.0 18.4 13.9
35-44 13.6 14.9 12.7
45-54 11.3 10.9 11.3
55-64 8.3 7.0 9.7
65+ 14.2 8.7 20.3
Unknown - 2.2 0.4
Total (N=23,541) 100% (N= 124,476)100% (N=51,420) 100%
In general, we observe that the age distribution of the linked data is closer to that of the police data, than of the hospital data. There are some large differences in the proportions of 15-24 years old, and 65+ casualties. The first proportion is low as far as hospital data is concerned (21%) against 28%-30% for the other data sources. The second proportion (65+) is far higher for the hospital data (20%) than for the other groups, while here also the differences are big (14% for the linked data and 9% for the police data). Other differences are relatively small.
Table 80 shows distribution of sex.

PENDANT Deliverable D9 WP3 - Data analysis
Project funded by the European Community under the ‘Competitive and Sustainable Growth’
Programme (1998-2002) Page 101
Table 80: The relative numbers of casualties, according to sex, and data source (linked
data, police data, and hospital data; 2001-2003).
Data source Sex
Linked data Police data Hospital data
Male 64.7 57.9 61.7
Female 34.7 39.5 38.3
Unknown 0.6 2.6 -
Total (N=23,541) 100% (N=124,476) 100% (N=51,420) 100%
Male casualties show a higher proportion (65%) for the linked data than for both other data sources, while the proportion within the police is the lowest (58%). As far as the combination of age and sex is concerned (not shown), we observe for all data sources that the largest proportion of females (about 50%) can be found within the age group 65+, while the smallest proportions (27%-30%) are observed for the age group of 15-24 years old casualties. In the following tables more details are shown of differences between distributions of variables from two different data sources at a time, because these variables are not available for all three data sources.
Differences between linked data and police data.
Table 81: The relative number of casualties according to type of crash opponent and data
source (linked data and police data; 2001-2003).
Data source Type of crash-opponent
Linked data Police data
Car 48.0 53.8
Van 8.7 8.8
HGV & bus 5.7 5.0
2-Wheeled MV 5.7 5.9
Cycle 3.5 4.3
Pedestrian 0.5 0.7
Obstacles 18.6 12.9
Single vehicle accident 7.6 6.6
Other 1.8 2.0
Total (N=23,541) 100% (N=124,476) 100%
In Table 81 the overall impression is that the distributions are comparable, though we see some differences with regard to the proportion of cars (48% against 54%) and obstacles (19% against 13%).
Differences between linked data and hospital data
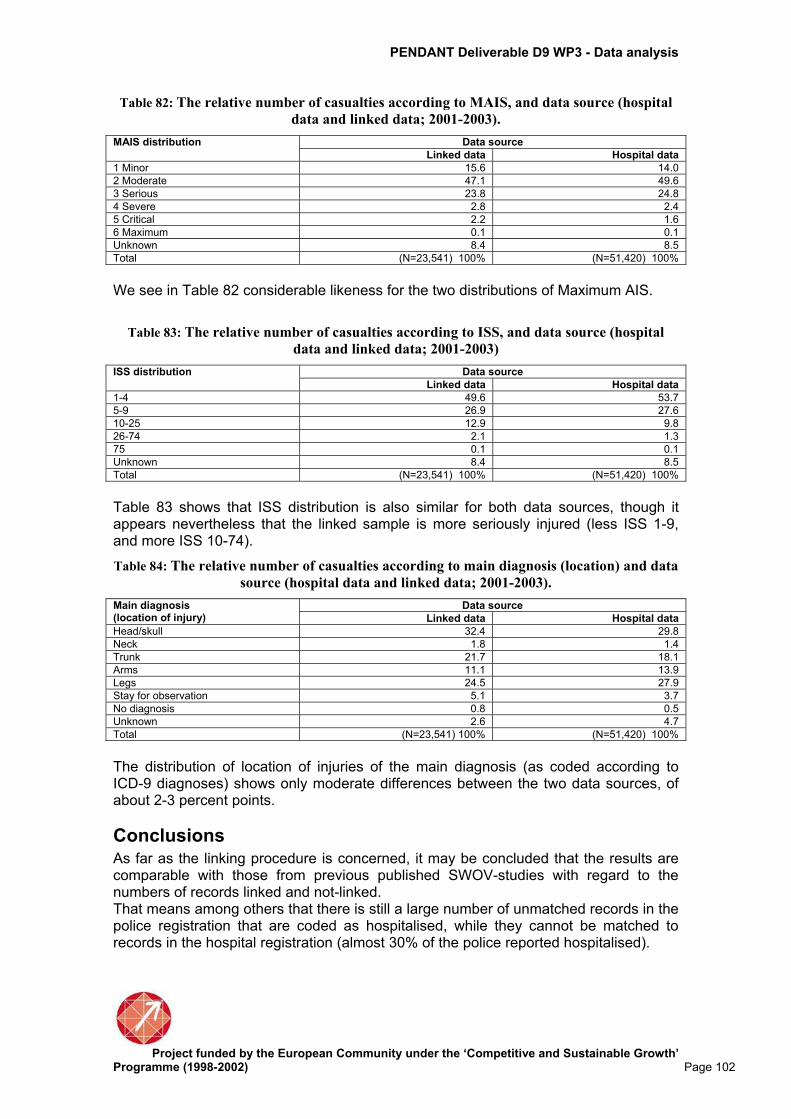
PENDANT Deliverable D9 WP3 - Data analysis
Project funded by the European Community under the ‘Competitive and Sustainable Growth’
Programme (1998-2002) Page 102
Table 82: The relative number of casualties according to MAIS, and data source (hospital
data and linked data; 2001-2003).
Data source MAIS distribution
Linked data Hospital data
1 Minor 15.6 14.0
2 Moderate 47.1 49.6
3 Serious 23.8 24.8
4 Severe 2.8 2.4
5 Critical 2.2 1.6
6 Maximum 0.1 0.1
Unknown 8.4 8.5
Total (N=23,541) 100% (N=51,420) 100%
We see in Table 82 considerable likeness for the two distributions of Maximum AIS.
Table 83: The relative number of casualties according to ISS, and data source (hospital
data and linked data; 2001-2003)
Data source ISS distribution
Linked data Hospital data
1-4 49.6 53.7
5-9 26.9 27.6
10-25 12.9 9.8
26-74 2.1 1.3
75 0.1 0.1
Unknown 8.4 8.5
Total (N=23,541) 100% (N=51,420) 100%
Table 83 shows that ISS distribution is also similar for both data sources, though it appears nevertheless that the linked sample is more seriously injured (less ISS 1-9, and more ISS 10-74).
Table 84: The relative number of casualties according to main diagnosis (location) and data
source (hospital data and linked data; 2001-2003).
Data source Main diagnosis (location of injury) Linked data Hospital data
Head/skull 32.4 29.8
Neck 1.8 1.4
Trunk 21.7 18.1
Arms 11.1 13.9
Legs 24.5 27.9
Stay for observation 5.1 3.7
No diagnosis 0.8 0.5
Unknown 2.6 4.7
Total (N=23,541) 100% (N=51,420) 100%
The distribution of location of injuries of the main diagnosis (as coded according to ICD-9 diagnoses) shows only moderate differences between the two data sources, of about 2-3 percent points.
Conclusions As far as the linking procedure is concerned, it may be concluded that the results are comparable with those from previous published SWOV-studies with regard to the numbers of records linked and not-linked. That means among others that there is still a large number of unmatched records in the police registration that are coded as hospitalised, while they cannot be matched to records in the hospital registration (almost 30% of the police reported hospitalised).

PENDANT Deliverable D9 WP3 - Data analysis
Project funded by the European Community under the ‘Competitive and Sustainable Growth’
Programme (1998-2002) Page 103
The observed differences (and similarities) between the three data sources point to the following: - The linked data is more or less comparable to the police registration with regard to most of the variables shown, and less comparable to the hospital registration. - This means that as far as representativeness is concerned, since the police data are not fully representative, also the linked data are not fully representative of the Dutch situation with regard to hospitalised traffic casualties. There are for instance more car occupants and less cyclists in the linked sample than in the hospital sample (which is considered representative). - With regard to injury severity and injury location, we find considerable less difference between the linked data and the hospital data than could be expected in view of the previous conclusions. The linked data appear to be representative in that respect.