Pegasus: a comprehensive annotation and prediction tool for detection of driver gene fusions in...
14
SOFTWARE Open Access Pegasus: a comprehensive annotation and prediction tool for detection of driver gene fusions in cancer Francesco Abate 1,2,3† , Sakellarios Zairis 2† , Elisa Ficarra 3 , Andrea Acquaviva 3 , Chris H Wiggins 2,6,7 , Veronique Frattini 5 , Anna Lasorella 5 , Antonio Iavarone 5 , Giorgio Inghirami 4 and Raul Rabadan 1,2* Abstract Background: The extraordinary success of imatinib in the treatment of BCR-ABL1 associated cancers underscores the need to identify novel functional gene fusions in cancer. RNA sequencing offers a genome-wide view of expressed transcripts, uncovering biologically functional gene fusions. Although several bioinformatics tools are already available for the detection of putative fusion transcripts, candidate event lists are plagued with non-functional read-through events, reverse transcriptase template switching events, incorrect mapping, and other systematic errors. Such lists lack any indication of oncogenic relevance, and they are too large for exhaustive experimental validation. Results: We have designed and implemented a pipeline, Pegasus, for the annotation and prediction of biologically functional gene fusion candidates. Pegasus provides a common interface for various gene fusion detection tools, reconstruction of novel fusion proteins, reading-frame-aware annotation of preserved/lost functional domains, and data-driven classification of oncogenic potential. Pegasus dramatically streamlines the search for oncogenic gene fusions, bridging the gap between raw RNA-Seq data and a final, tractable list of candidates for experimental validation. Conclusion: We show the effectiveness of Pegasus in predicting new driver fusions in 176 RNA-Seq samples of glioblastoma multiforme (GBM) and 23 cases of anaplastic large cell lymphoma (ALCL). Contact: [email protected]. Keywords: Gene fusion, Next-generation sequencing, Machine learning Background Gene fusions are the result of genetic aberrations (trans- locations, deletions, amplifications and inversions) in- volving the juxtaposition of two genes that can generate a single hybrid transcript. Since 1960, gene fusions have been known to play a major role in tumorgenesis. The BCR-ABL1 gene fusion, arising from the Philadelphia chromosome (t(9;22)(q34;q11)), was the first case of a translocation-induced gene fusion associated with the development of a cancer, namely chronic myelogenous leukemia [1]. In this fusion, the N-terminus oligomerization domain of BCR and the tyrosine kinase domain in ABL1 are essential in promoting oncogenic activity [2]. Among the gene fusions associated with tumor development, it is worth mentioning TMPRSS2-ERG, a gene fusion occurring in 40-80% of cases of prostate cancer [3, 4] and fusions in- volving the ALK gene with different partners in various ma- lignancies [5], such as NPM1-ALK in anaplastic large cell lymphoma (ALCL) [6] and ELM4-ALK in non-small-cell lung cancer [7]. Discovering the relationship between gene fusions and cancer is gaining significant momentum thanks to ad- vances in next generation sequencing (NGS) technology, particularly RNA paired-end sequencing [8]. Recently, the application of this technology allowed the discovery of new chromosomal rearrangements of the CIITA gene with various promiscuous partners in the lymphomagen- esis of primary mediastinal B cell lymphomas [9]. In * Correspondence: [email protected] † Equal contributors 1 Department of Biomedical Informatics, Columbia University, 1130 St. Nicholas Ave, New York, NY 10032, USA 2 Center for Computational Biology and Bioinformatics, Columbia University, 1130 St. Nicholas Ave, New York, NY 10032, USA Full list of author information is available at the end of the article © 2014 Abate et al.; licensee BioMed Central Ltd. This is an Open Access article distributed under the terms of the Creative Commons Attribution License (http://creativecommons.org/licenses/by/4.0), which permits unrestricted use, distribution, and reproduction in any medium, provided the original work is properly credited. The Creative Commons Public Domain Dedication waiver (http://creativecommons.org/publicdomain/zero/1.0/) applies to the data made available in this article, unless otherwise stated. Abate et al. BMC Systems Biology 2014, 8:97 http://www.biomedcentral.com/1752-0509/8/97
-
Upload
independent -
Category
Documents
-
view
4 -
download
0
Transcript of Pegasus: a comprehensive annotation and prediction tool for detection of driver gene fusions in...
Abate et al. BMC Systems Biology 2014, 8:97http://www.biomedcentral.com/1752-0509/8/97
SOFTWARE Open Access
Pegasus: a comprehensive annotation andprediction tool for detection of driver genefusions in cancerFrancesco Abate1,2,3†, Sakellarios Zairis2†, Elisa Ficarra3, Andrea Acquaviva3, Chris H Wiggins2,6,7, Veronique Frattini5,Anna Lasorella5, Antonio Iavarone5, Giorgio Inghirami4 and Raul Rabadan1,2*
Abstract
Background: The extraordinary success of imatinib in the treatment of BCR-ABL1 associated cancers underscoresthe need to identify novel functional gene fusions in cancer. RNA sequencing offers a genome-wide view ofexpressed transcripts, uncovering biologically functional gene fusions. Although several bioinformatics tools arealready available for the detection of putative fusion transcripts, candidate event lists are plagued with non-functionalread-through events, reverse transcriptase template switching events, incorrect mapping, and other systematic errors.Such lists lack any indication of oncogenic relevance, and they are too large for exhaustive experimental validation.
Results: We have designed and implemented a pipeline, Pegasus, for the annotation and prediction of biologicallyfunctional gene fusion candidates. Pegasus provides a common interface for various gene fusion detection tools,reconstruction of novel fusion proteins, reading-frame-aware annotation of preserved/lost functional domains, anddata-driven classification of oncogenic potential. Pegasus dramatically streamlines the search for oncogenic genefusions, bridging the gap between raw RNA-Seq data and a final, tractable list of candidates for experimentalvalidation.
Conclusion: We show the effectiveness of Pegasus in predicting new driver fusions in 176 RNA-Seq samples ofglioblastoma multiforme (GBM) and 23 cases of anaplastic large cell lymphoma (ALCL). Contact: [email protected].
Keywords: Gene fusion, Next-generation sequencing, Machine learning
BackgroundGene fusions are the result of genetic aberrations (trans-locations, deletions, amplifications and inversions) in-volving the juxtaposition of two genes that can generatea single hybrid transcript. Since 1960, gene fusions havebeen known to play a major role in tumorgenesis. TheBCR-ABL1 gene fusion, arising from the Philadelphiachromosome (t(9;22)(q34;q11)), was the first case of atranslocation-induced gene fusion associated with thedevelopment of a cancer, namely chronic myelogenousleukemia [1]. In this fusion, the N-terminus oligomerization
* Correspondence: [email protected]†Equal contributors1Department of Biomedical Informatics, Columbia University, 1130 St.Nicholas Ave, New York, NY 10032, USA2Center for Computational Biology and Bioinformatics, Columbia University,1130 St. Nicholas Ave, New York, NY 10032, USAFull list of author information is available at the end of the article
© 2014 Abate et al.; licensee BioMed Central LCommons Attribution License (http://creativecreproduction in any medium, provided the orDedication waiver (http://creativecommons.orunless otherwise stated.
domain of BCR and the tyrosine kinase domain in ABL1are essential in promoting oncogenic activity [2]. Amongthe gene fusions associated with tumor development, it isworth mentioning TMPRSS2-ERG, a gene fusion occurringin 40-80% of cases of prostate cancer [3, 4] and fusions in-volving the ALK gene with different partners in various ma-lignancies [5], such as NPM1-ALK in anaplastic large celllymphoma (ALCL) [6] and ELM4-ALK in non-small-celllung cancer [7].Discovering the relationship between gene fusions and
cancer is gaining significant momentum thanks to ad-vances in next generation sequencing (NGS) technology,particularly RNA paired-end sequencing [8]. Recently,the application of this technology allowed the discoveryof new chromosomal rearrangements of the CIITA genewith various promiscuous partners in the lymphomagen-esis of primary mediastinal B cell lymphomas [9]. In
td. This is an Open Access article distributed under the terms of the Creativeommons.org/licenses/by/4.0), which permits unrestricted use, distribution, andiginal work is properly credited. The Creative Commons Public Domaing/publicdomain/zero/1.0/) applies to the data made available in this article,
Abate et al. BMC Systems Biology 2014, 8:97 Page 2 of 14http://www.biomedcentral.com/1752-0509/8/97
Singh et al. [10], the analysis of RNA-Seq data led to thediscovery of the highly oncogenic fusion protein FGFR3-TACC3 in 3% of patients diagnosed with glioblastomamultiforme (GBM). Even though FGFR3-TACC3 occursat low frequency, the efficacy of FGFR inhibitors in thetreatment of these tumors opens the door to personal-ized therapies for this deadly disease. Moreover, theFGFR3-TACC3 fusion has been found in other cancerssuch as bladder [11] and lung [12]. These recent discov-eries underscore the power of high throughput genomicsfor the identification of targetable gene fusions, openingthe door to personalized cancer therapies.Several bioinformatics tools are now established for
the detection of candidate fusion events from paired-endRNA-Seq data. Generally, the detection of read pairs thatdiscordantly map to two distinct genes generates a firstset of gene fusion candidates. Subsequently, the exactfusion junction is determined for each candidate bysearching for reads spanning the breakpoint, i.e. readsthat partially map to both genes. FusionSeq [13] and de-Fuse [14] were the earliest examples of software basedon this strategy. Detection tools differ in the type andnumber of cascading filters they apply to reduce thelarge number of false positive fusions. ChimeraScan [15]implements an algorithm based on trimming reads to in-crease fusion detection sensitivity. Bellerophontes [16] usesTopHat [17] and Cufflinks [18] to identify gene fusions in-volving truly expressed genes, and applies a set of modularcascading filters based on an accurate gene fusion model[19]. A comprehensive comparison of fusion detection toolshas recently been published [20].The methods adopted by fusion detection tools to shrink
the list of candidates lead to increased specificity but re-duced sensitivity. As reported in the comparative analysisperformed by Abate et al. [16] , the heterogeneity offiltering strategies often yields poorly overlapping sets ofcandidate transcripts between algorithms. The union of allcandidate fusions reported by different detection toolsshould be considered for further experimental validation, inorder to maximize sensitivity. A problem arises however,since the number of putative gene fusions might be on theorder of hundreds of candidates per RNA-Seq sample. Thisis largely due to the presence of read-through events, re-verse transcriptase template switching artifacts, and differ-ent systematic errors in the analysis of the reads [21]. Thenaïve approach of considering all candidates from all detec-tion tools quickly overwhelms the capacity of experimentalvalidation procedures, and highlights the need to focus ona reduced number of select biologically relevant fusionsdriving the oncogenic progression of disease.The classification of gene fusions into driver and
passenger events is a complex problem that has notbeen fully explored yet. To address this issue, severaldatabases have collected hundreds of chromosomal
translocations involved in cancer cases and reported inthe biomedical literature. For instance, Mitelman [22],TICdb [23] and ChimerDB2.0 [24] are manually curatedrepositories of known gene fusions along with detailedinformation such as chromosomal breakpoints, reportedtissue types, and fusion sequences. New computational ap-proaches to nominate biologically relevant fusions fromhigh-throughput data have been proposed. ConSig assessesdriver gene fusions by combining copy number variations(CNV), ontologies and interactomes based on the assump-tion that fusion events are more likely to arise from geneswith similar biological functions [25]. Wu et al. haveproposed a network based approach relying on relative co-occurrence of protein domains and domain-domain inter-actions, and location of the gene fusion in a gene network[26]. Recently, Oncofuse has improved the computationalanalysis with a machine learning approach based on aNaïve Bayes classifier applied to preserved domains afterchromosomal rearrangement [27]. Compared to earliermethods, Oncofuse introduces a new level of detail byconsidering only the domains that are maintained on theresulting fusion transcripts. The domain analysis should beextended, however, by taking into account all possible tran-script isoforms as well as the reading frame, which plays acrucial role since frame-shifted fusions imply a loss ofthe 3’-gene domains. Moreover, Oncofuse relies on a NaïveBayes classifier that makes a restrictive assumption on theclass conditional independence of all features. Taking theFGFR3-TACC3 gene fusion as an example, however, the ac-quired coiled-coil domain of the TACC3 gene cooperateswith tyrosine kinase functionality of FGFR3 to produce thedramatic oncogenic effect [10]. This example illustrates thelimitations of a model assumption that ignores interactionsbetween functional protein domains.In this paper we aim to discern oncogenic driver fu-
sions from the background of passenger events andartifacts by combining 1) functional domain annotationbased on accurate fusion sequence analysis and 2) a bin-ary classification algorithm using gradient tree boosting.The implementation of this methodology is Pegasus, anew framework for the functional characterization ofRNA-Seq gene fusion candidates and quantification oftheir oncogenic potential. Pegasus runs on top of mul-tiple state of the art fusion detection tools in order tomaximize detection sensitivity and consider the largestpossible set of fusion candidates.The main innovative steps introduced by Pegasus are
as follows:
� Common interface between several fusiondetection tools.
� Chimeric transcript sequence reconstruction: akey feature since fusion detection tools do notreport whole transcript sequences.

Abate et al. BMC Systems Biology 2014, 8:97 Page 3 of 14http://www.biomedcentral.com/1752-0509/8/97
� Reading frame identification and accurate domainannotation, including both preserved and lost proteindomains within the assembled chimeric transcript.
� Prediction of fusion oncogenic potential: highperformance ensemble learning technique trainedon a feature space of protein domain annotations.
� Automated workflow that would otherwise requiremassive effort if manually executed by the scientist.
We assess the trained Pegasus model’s prediction accur-acy by applying it to a set of recently discovered gene fu-sions where it compares quite favorably with the currentstate of the art, Oncofuse. Beyond curated datasets, we re-port the results of Pegasus on real RNA-Seq data fromthree distinct patient cohorts: public GBM samples fromTCGA, non-public GBM samples, and non-public ALCLsamples. We successfully identify driver gene fusions inboth cancer types and demonstrate the utility of couplingour algorithm with experimental analysis.
ImplementationIn order to first motivate our feature engineering, we brieflyreview the main mechanisms hitherto identified in onco-genic gene fusions (see Figure 1). Fusion transcripts can
Figure 1 Common gene fusions in cancer biology. Different mechanismmechanisms of oncogenic transcription factor activation by means of an egene fusion where the 5’ gene leads to the deregulation of the 3’ tumor suNPM1-ALK and FGFR3-TACC3 chimeras where a completely new protein is
broadly lead to three scenarios: i) enhanced overexpressionof an oncogene ii) deregulation of a tumor suppressor geneiii) formation of a new, aberrant protein.Enhanced overexpression of an oncogene is exempli-
fied by the famous IgH-MYC fusion (Figure 1a), and isthe main reason for our explicit annotation of oncogenestatus and interactions with known oncogenes in ourfeature space representation of fusion transcripts. Inother cases, deregulating properties can be associatedwith the fused transcript, such as insertion of one or twonucleotides across the junction breakpoint introducing ashift of the reading frame. This scenario is illustrated inthe PPP2RA-CHEK2 fusion [28] (Figure 1b) where theintroduced frame-shifted sequence prevents the forma-tion of the CHEK2 protein that is a known tumor sup-pressor gene. Here we see the motivation for our explicitannotation of tumor suppressor status and interactionswith known tumor suppressors in the feature space, aswell as the need for computing reading frame of eachcandidate fusion. Finally, fusion transcripts can also yielda completely new chimeric protein. BCR-ABL1 [1] andNPM1-ALK [6] are well studied examples of such in-frame fusions. The new protein is generally larger thanthe kinase involved and causes an increase of the
s of gene fusions in cancer are shown. Figure 1(a) Shows thendogenous enhancer. Figure 1(b) Shows an example of disruptingppressor gene. Finally, Figure 1(c) and 1(d) depicts the BCR-ABL1,produced.
Abate et al. BMC Systems Biology 2014, 8:97 Page 4 of 14http://www.biomedcentral.com/1752-0509/8/97
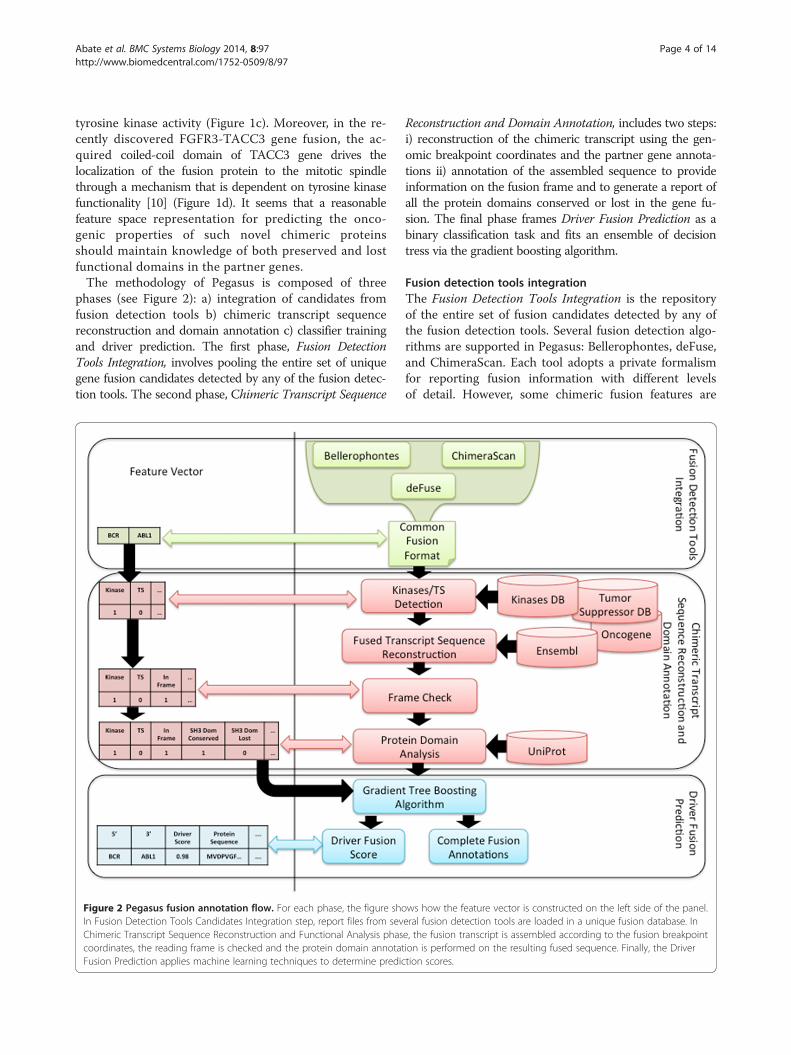
tyrosine kinase activity (Figure 1c). Moreover, in the re-cently discovered FGFR3-TACC3 gene fusion, the ac-quired coiled-coil domain of TACC3 gene drives thelocalization of the fusion protein to the mitotic spindlethrough a mechanism that is dependent on tyrosine kinasefunctionality [10] (Figure 1d). It seems that a reasonablefeature space representation for predicting the onco-genic properties of such novel chimeric proteinsshould maintain knowledge of both preserved and lostfunctional domains in the partner genes.The methodology of Pegasus is composed of three
phases (see Figure 2): a) integration of candidates fromfusion detection tools b) chimeric transcript sequencereconstruction and domain annotation c) classifier trainingand driver prediction. The first phase, Fusion DetectionTools Integration, involves pooling the entire set of uniquegene fusion candidates detected by any of the fusion detec-tion tools. The second phase, Chimeric Transcript Sequence
Figure 2 Pegasus fusion annotation flow. For each phase, the figure shoIn Fusion Detection Tools Candidates Integration step, report files from sevChimeric Transcript Sequence Reconstruction and Functional Analysis phascoordinates, the reading frame is checked and the protein domain annotatFusion Prediction applies machine learning techniques to determine predic
Reconstruction and Domain Annotation, includes two steps:i) reconstruction of the chimeric transcript using the gen-omic breakpoint coordinates and the partner gene annota-tions ii) annotation of the assembled sequence to provideinformation on the fusion frame and to generate a report ofall the protein domains conserved or lost in the gene fu-sion. The final phase frames Driver Fusion Prediction as abinary classification task and fits an ensemble of decisiontress via the gradient boosting algorithm.
Fusion detection tools integrationThe Fusion Detection Tools Integration is the repositoryof the entire set of fusion candidates detected by any ofthe fusion detection tools. Several fusion detection algo-rithms are supported in Pegasus: Bellerophontes, deFuse,and ChimeraScan. Each tool adopts a private formalismfor reporting fusion information with different levelsof detail. However, some chimeric fusion features are
ws how the feature vector is constructed on the left side of the panel.eral fusion detection tools are loaded in a unique fusion database. Ine, the fusion transcript is assembled according to the fusion breakpointion is performed on the resulting fused sequence. Finally, the Drivertion scores.
Abate et al. BMC Systems Biology 2014, 8:97 Page 5 of 14http://www.biomedcentral.com/1752-0509/8/97
common to all the fusion detection tool reports (e.g.genes involved in the fusion, genomic breakpoint coordi-nates, number of reads encompassing and spanning thefusion breakpoint, etc.). Thus, the internal databasestructure of Pegasus provides a unique point of accessfor all the information needed to fully describe a genefusion candidate. Furthermore, experimental analysismight involve the comparison of several RNA-Seqsamples per case study. To this end, the common re-pository embedded in Pegasus provides an organizedoverview of all the fusions occurring in the entire sam-ple set. This feature allows comparison and the recur-rence analysis of the fusion candidates within both thesame experimental dataset (samples of the same dis-ease) and within different experimental datasets (sam-ples across different diseases).
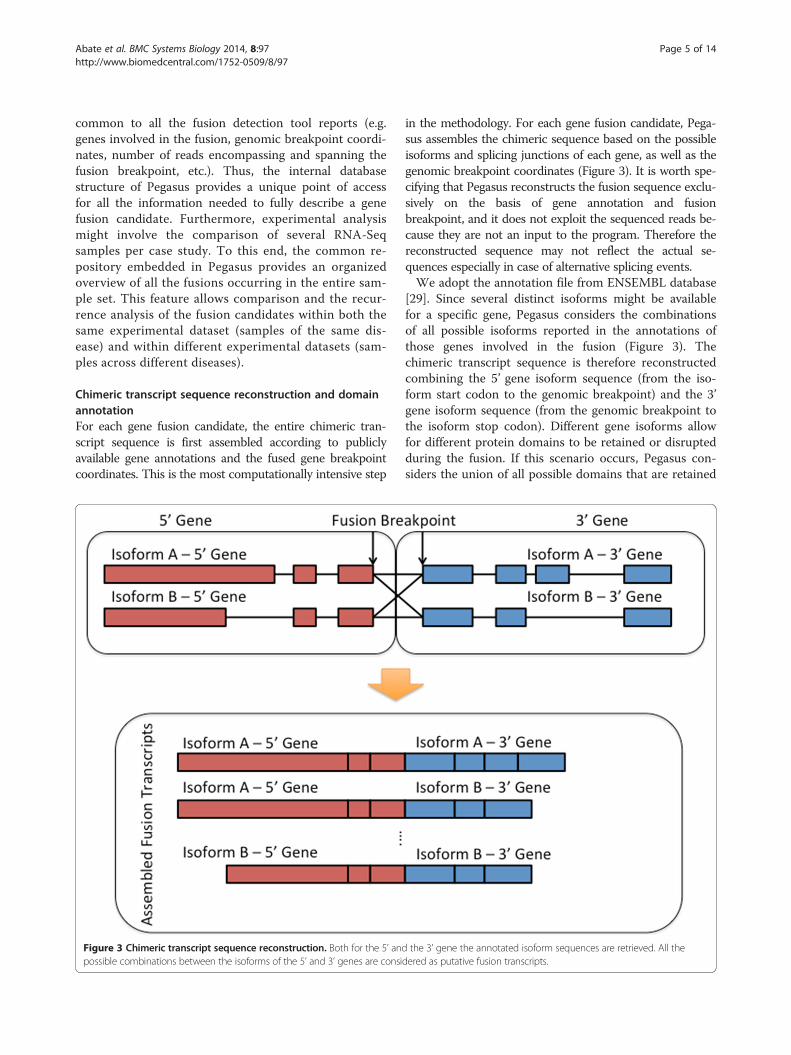
Chimeric transcript sequence reconstruction and domainannotationFor each gene fusion candidate, the entire chimeric tran-script sequence is first assembled according to publiclyavailable gene annotations and the fused gene breakpointcoordinates. This is the most computationally intensive step
Figure 3 Chimeric transcript sequence reconstruction. Both for the 5’ andpossible combinations between the isoforms of the 5’ and 3’ genes are consi
in the methodology. For each gene fusion candidate, Pega-sus assembles the chimeric sequence based on the possibleisoforms and splicing junctions of each gene, as well as thegenomic breakpoint coordinates (Figure 3). It is worth spe-cifying that Pegasus reconstructs the fusion sequence exclu-sively on the basis of gene annotation and fusionbreakpoint, and it does not exploit the sequenced reads be-cause they are not an input to the program. Therefore thereconstructed sequence may not reflect the actual se-quences especially in case of alternative splicing events.We adopt the annotation file from ENSEMBL database
[29]. Since several distinct isoforms might be availablefor a specific gene, Pegasus considers the combinationsof all possible isoforms reported in the annotations ofthose genes involved in the fusion (Figure 3). Thechimeric transcript sequence is therefore reconstructedcombining the 5’ gene isoform sequence (from the iso-form start codon to the genomic breakpoint) and the 3’gene isoform sequence (from the genomic breakpoint tothe isoform stop codon). Different gene isoforms allowfor different protein domains to be retained or disruptedduring the fusion. If this scenario occurs, Pegasus con-siders the union of all possible domains that are retained
the 3’ gene the annotated isoform sequences are retrieved. All thedered as putative fusion transcripts.

Abate et al. BMC Systems Biology 2014, 8:97 Page 6 of 14http://www.biomedcentral.com/1752-0509/8/97
and lost and as input features for downstream classifica-tion. Furthermore, the fusion breakpoint can fall in ei-ther the coding region (exon-exon junction boundaries),or in non-coding regions (exon-intron or intron-intronjunction boundaries). Pegasus takes the latter scenariointo account and if the fusion breakpoint falls in an in-tron, the intronic sequence is retained.After sequence reconstruction we assess the preserva-
tion of the reading frame in the chimeric transcript,which enables a great deal of our downstream featureengineering (see Figure 4a). If the gene fusion introducesor deletes a nucleotide in one of the codons, the entirereading frame is shifted and the corresponding aminoacid sequence changes. Consequently, the resulting pro-tein sequence is different from the one encoded by thegene involved in the fusion. The gene fusion encodes aprotein sequence that either corresponds to a completelyunknown protein or contains a premature stop codon(the presence of a premature stop codon in the chimericsequence interrupts the protein translation resulting inthe truncation of the protein encoded by the 5’ fusedgene). This class of mutations is functionally similar tononsense point mutations that play a role in many can-cers and might imply the loss of functionality of the 5’fused gene. The sequence is labeled as in-frame if thenumber of nucleotides composing the fusion sequencedis a multiple of three and no premature stop codons areintroduced in the chimeric sequence.The annotation of the preserved and lost protein do-
mains is essential in order to capture the oncogenic poten-tial of a translated chimeric transcript. The nucleotidefusion sequence assembled in the previous step is translatedinto an amino acid sequence. Subsequently, the UniProtweb service [30] is queried for all available annotations ofthe putative protein encoded by the two genes involved inthe fusion (Figure 4b). Leveraging the reading frame infor-mation and fusion breakpoint, Pegasus determines the con-served and lost domains associated with both 5’ and 3’genes. It is worth emphasizing that both conserved and thelost domains are valuable features of a fusion transcript,with the former more likely to discriminate oncogene re-lated fusions and the latter more likely to discriminatetumor suppressor related fusions.The domain annotation permits the creation of a de-
tailed feature space for the fusion transcripts, a pre-requisite step for posing the ensuing machine learningtask. In Pegasus the feature space is composed of:
� Binary information about reading frame andbreakpoint region (if the breakpoint falls in codingregions, introns and UTRs);
� Presence or absence of ~1000 protein domains fromUniProt. Our selection was based on the domainsoccurring in the training set from ChimerDB2.0.
� Number of oncogenic or tumor suppressor domains,as defined by association with the keywords “tumorsuppressor” or “oncogene” in the UniProt database.
� Number of protein-protein oncogenic interactingdomains. We check if one or more domains of thefusion interact with both oncogenic and tumor sup-pressor domains.
Driver fusion prediction as a binary classification taskWe aim to fit a model that can identify oncogenic fu-sions from the background of passenger events and arti-facts. More precisely, we aim to learn a mapping f : X→y from the fusion transcript feature space X to a labely ∈ {0, 1} representing oncogenic driver status. Since wedesire a biologically interpretable model that is also cap-able of capturing interactions between features, the deci-sion tree is a natural choice. On the other hand, highdimensional feature spaces predispose to overfitting, andprevious driver fusion prediction studies [27] focused agreat deal on upfront dimensionality reduction for thisreason. A single, large decision tree classifier is not likelyto generalize beyond some training depth. An ensembleof shallower decision trees, if learned in a boostingframework, can guard against overfitting because of theiterative nature of the learning and the additive structureof the model [31]. Therefore the balance we strike be-tween the expressive power of decision trees and robust-ness to overfitting comes in the form of stagewiseadditive modeling. In Pegasus we employ an additive
model f xð Þ ¼Xm
αmhm xð Þ composed of weighted deci-
sion trees, an instance of which is shown in Figure 5,and fit via gradient boosting [32]. There is no manual re-duction of features or feature space dimension in thisstrategy, unlike the manual selection of 6 enriched func-tional categories in the Oncofuse framework [27].Thus we require neither upfront dimensionality reduc-
tion schemes nor the restrictive assumption of class con-ditional feature independence in the Naïve Bayes model.Gradient tree boosting is an ensemble learning tech-nique, wherein decision trees are used as base learnersand the final model is expressed as an expansion inthese basis functions. Figure 5 depicts a sample regres-sion tree that would be added to the ensemble in a sin-gle round of boosting. Although the base learners areperforming regression, appropriate choice of loss func-tion for gradient boosting yields a classification task.Here we use the binomial deviance loss, and enforce amaximum depth of 5 nodes in the individual decisiontrees. The gradient tree boosting algorithm, originallypublished in 2000, is outlined below [33] and the imple-mentation we use can be found in the scikit-learn py-thon library [34]. We denote the number of training
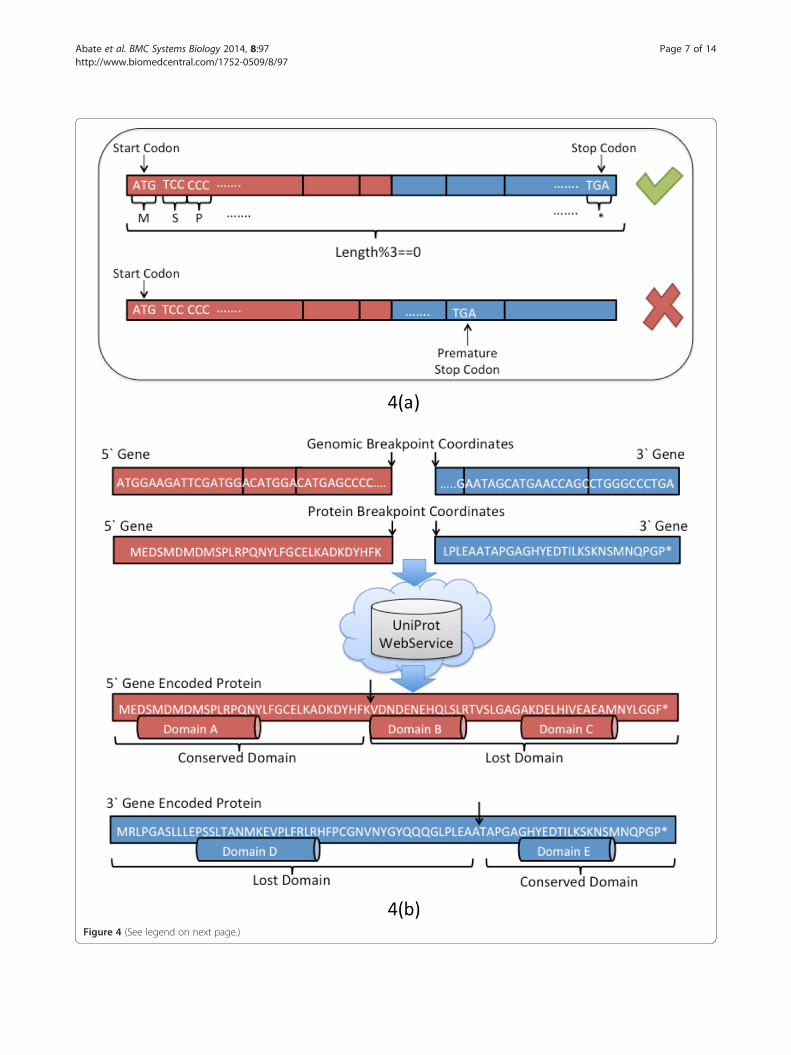
Figure 4 (See legend on next page.)
Abate et al. BMC Systems Biology 2014, 8:97 Page 7 of 14http://www.biomedcentral.com/1752-0509/8/97

(See figure on previous page.)Figure 4 Frame check and domain annotation. Figure 4(a) The length of the fusion transcript, from the start to the stop codon, must bemultiple of three (three nucleotides per single encoded codon). If the length of the sequence module three is non-zero, the fusion sequence ifframe-shifted. A premature stop codon can be introduced in the protein sequence. Figure 4(b) The nucleotide sequence resulting from the fusionof the 5’ and 3’ gene is translated into amino acid sequence. Similarly, the genomic breakpoint coordinates are translated into protein aminoacid coordinates. UniProt Web Service is queried and the list of the available domains for both the gene is retrieved. On the basis of the proteindomain sequence and protein breakpoint, the list of both conserved and lost domains is reported.
Abate et al. BMC Systems Biology 2014, 8:97 Page 8 of 14http://www.biomedcentral.com/1752-0509/8/97
examples by N, the number of boosting rounds by M,and the loss function by ℒ.
að Þ For i ¼ 1; 2;…;N computeLet yi ≡ class label of transcript i
Let f m xð Þ ≡ classification function at boosting round mInitialize f 0 xð Þ ¼ argminγ
Xi¼1:N
ℒ yi; γð ÞFor m ¼ 1 to M :
að Þ For i ¼ 1; 2;…;N compute
rim ¼ − ∂ℒyi; f xið Þ∂f xið Þ
� �f¼f m−1
"
(b) Fit a regression tree to rim producing regions Rjm, j =1, 2,…, Jm
(c)
For j ¼ 1; 2;…; Jmcompute
γ jm ¼ argminγXxi∈Rjm
ℒ yi; f m−1 xið Þ þ γð Þ
(d)
For j ¼ 1; 2;…; Jmcompute
γ jm ¼ argminγXxi∈Rjm
ℒ yi; f m−1 xið Þ þ γð Þ
An alternative ensemble classification strategy, therandom forest algorithm, demonstrated comparable per-formance to gradient tree boosting in our experiments.There is recent precedent in the machine learning
Figure 5 Decision tree base learner. The base learner in the boosted classificthe feature space into disjoint regions each modeled by a constant. Decision nonodes, the samples have been partitioned into disjoint sets with a higher degre
literature for initializing gradient tree boosting modelswith rankings learned via random forests for achievingsuperior performance to either algorithm alone [35].Interestingly, those authors found that posing web-search rankings as a classification task rather than a re-gression task increased the performance of a gradientboosted regression tree model, confirming our hypoth-esis in constructing the current Pegasus classifier.
Results and DiscussionThis section highlights the performance of Pegasus indetecting driver gene fusions. First, we examine the per-formance of the classifier on the training data andcompare its effectiveness to a recently published tool,Oncofuse, on a separately curated validation dataset.Next, we run Pegasus on two experimental datasets anddemonstrate its role in reducing the search space of po-tential oncogenic drivers by accurately ranking fusiontranscripts from a vast set of putative candidates. Thefirst is the publicly available RNA-Seq data of GBM fromTCGA. The second is a non-public set of 23 RNA-Seqsamples from a cohort of patients with ALCL, with 2out of the 23 samples reporting the NPM1-ALK fusion.We analyze these datasets with ChimeraScan or
deFuse and apply Pegasus to the entire set of detectedfusions. It is worth specifying that in the reported
ation model is the decision tree, which defines a recursive partitioning ofdes are colored brown while leaf nodes are colored green. At the leafe of label homogeneity than at the root.
Let I 2k ≡ squared importance of feature kLetM ≡ number of boosting rounds:Let T be a decision tree with J−1 pairs t; iˆt 2ð Þ ofðinternal decision node; estimated improvement in
squared error riskÞ:I 2k Tð Þ ¼
Xt¼1:J−1
iˆt 2I t ¼ kð Þ:
⇒I 2k ¼1
M
Xm¼1:M
I 2k Tmð Þ:
Abate et al. BMC Systems Biology 2014, 8:97 Page 9 of 14http://www.biomedcentral.com/1752-0509/8/97
results about chimeric transcript annotations, if two ormore fusions share the same junction breakpoint coor-dinates, they are counted as a single fusion. The ration-ale is that according to the Pegasus fusion domainanalysis, if two genes fuse in different samples with thesame breakpoint they also share exactly the same do-main. Conversely, if two genes occur in different sam-ples with different junction breakpoint coordinates,the domain analysis accordingly changes.
Classifier performance on training corpus and independentvalidation setThe corpus of labeled data used to train the classifiercomes from two sources. Positive examples, meaningtrue oncogenic driver fusions, are drawn from Chi-merDB2.0, which contains 501 curated driver fusions.1500 negative examples are then drawn from an internalcollection of reactive lymph node tissue in patients withno clinical history of malignancy. The negative examplescontain passenger fusions as well as read-through tran-scripts. We also supplement the negative training datawith 416 deliberately frame-shifted transcripts fromChimerDB2.0 such that the necessary driver domainsare lost. In total there are 501 positive examples and1916 negative examples in the training corpus. The ra-tionale for augmenting the negative set with 416 frame-shifted fusions from ChimerDB2.0 is to include the sce-nario of chimeric transcripts containing an oncogene atthe 3’ position that is frame-shifted. Since such eventsoccur at low frequency in normal lymph node tissue,this design choice improves the performance of the clas-sifier (for a detailed discussion please refer to Additionalfile 1). In summary, the 501 fusions from ChimerDB2.0
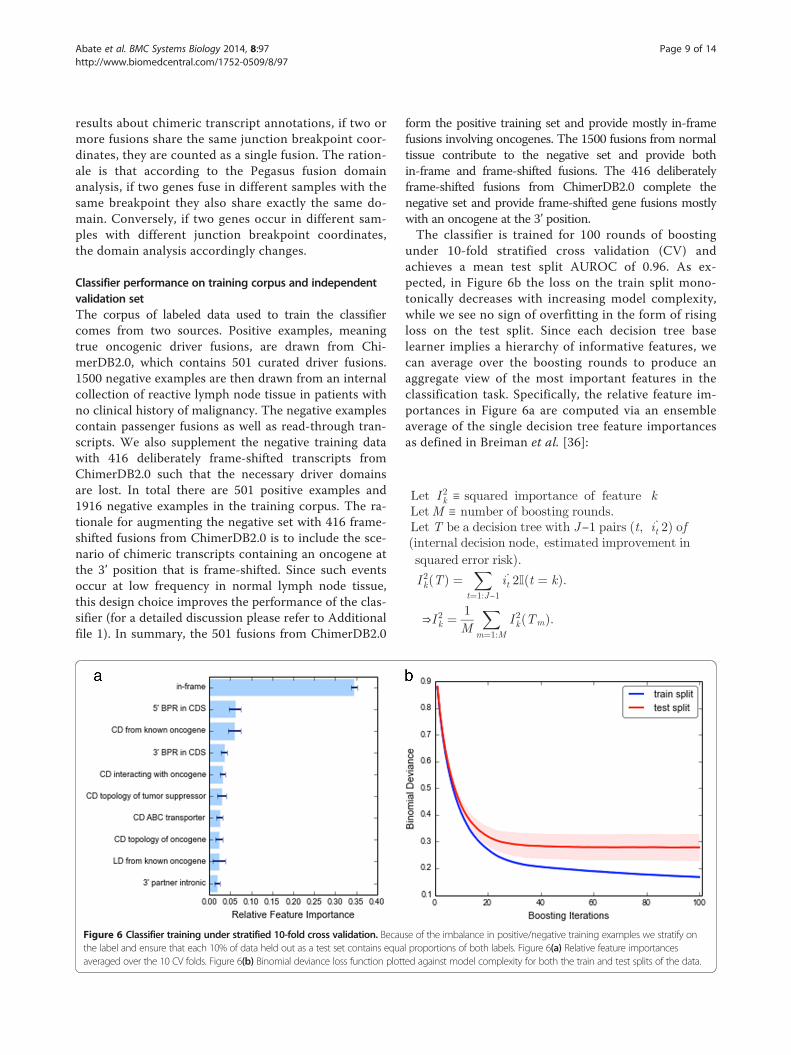
Figure 6 Classifier training under stratified 10-fold cross validation. Becauthe label and ensure that each 10% of data held out as a test set contains equaaveraged over the 10 CV folds. Figure 6(b) Binomial deviance loss function plot
form the positive training set and provide mostly in-framefusions involving oncogenes. The 1500 fusions from normaltissue contribute to the negative set and provide bothin-frame and frame-shifted fusions. The 416 deliberatelyframe-shifted fusions from ChimerDB2.0 complete thenegative set and provide frame-shifted gene fusions mostlywith an oncogene at the 3’ position.The classifier is trained for 100 rounds of boosting
under 10-fold stratified cross validation (CV) andachieves a mean test split AUROC of 0.96. As ex-pected, in Figure 6b the loss on the train split mono-tonically decreases with increasing model complexity,while we see no sign of overfitting in the form of risingloss on the test split. Since each decision tree baselearner implies a hierarchy of informative features, wecan average over the boosting rounds to produce anaggregate view of the most important features in theclassification task. Specifically, the relative feature im-portances in Figure 6a are computed via an ensembleaverage of the single decision tree feature importancesas defined in Breiman et al. [36]:
se of the imbalance in positive/negative training examples we stratify onl proportions of both labels. Figure 6(a) Relative feature importancested against model complexity for both the train and test splits of the data.

Abate et al. BMC Systems Biology 2014, 8:97 Page 10 of 14http://www.biomedcentral.com/1752-0509/8/97
We observe that the computationally expensive step ofcomputing the fusion transcript reading frame is justi-fied in the eyes of the classifier, as it is the single mostinformative feature. Looking a little further down the listwe learn other transcript features that are highly inform-ative of driver events, such as having breakpoints in theCDS and conserving domains shared with or interactingwith known oncogenes.Despite strong performance of the model under 10-
fold CV on the training corpus, we are interested to seewhether the classifier can generalize to new fusion tran-scripts that were unseen during the training phase. A listof 39 driver fusions, the majority of which are morerecent than ChimerDB2.0, and corresponding to thevalidation set used in [27], is adopted as the positive val-idation set examples. To balance the label frequencies,we also select 39 transcripts from benign, reactive lymphnode tissue as the negative validation set examples.None of the 78 validation examples are included in thetraining data. The negative examples are selected to con-tain at least one oncogene or tumor suppressor domainwith the rationale that such transcripts more closely re-semble driver fusions and would be most challenging fora classification function. In Figure 7a we demonstratethe favorable performance of the trained Pegasus classi-fier versus Oncofuse, the current state of the art in data-driven prediction of driver fusions. Since the ROC curvedoes not necessarily reveal how well separated the Pegasusscores are for the two class labels, we include Figure 7b to
Figure 7 Classification performance of trained model. A curated set of 39training corpus are now used as an independent validation set. Figure 7(a) Suthe validation dataset. Figure 7(b) Boxplot demonstrating the high resolutionexamples are consistently scored near 1 and negative examples consistently n
illustrate the remarkable resolution the classifier achievesbetween positive and negative examples. We also verify thatPegasus outperforms Oncofuse on randomly drawn sets of39 non-oncogenic transcripts, though by a smaller margin(ROC curve in Additional file 2: Figure S1). This is to be ex-pected because the majority of non-oncogenic fusions arevery easily classified, whereas our curated subset representsa more challenging task. Such robust performance onmanually curated data sets naturally leads to the next prov-ing ground, applying Pegasus to the enormous candidatelists generated from real RNA-Seq samples.
Pegasus driver fusion predictions in non-public GBM dataIn order to demonstrate the effectiveness of Pegasus inpredicting driver fusions, we analyze 15 samples ofshort-term glioblastoma stem cells freshly isolated fromindividuals with GBM. RNA-Seq samples were first ana-lyzed with ChimeraScan and deFuse [14,15] for fusiondetection. Next, we apply Pegasus to the set of gene fu-sion candidates and consider as driver events all thosefusions having a number of supporting reads greaterthan 10 and a Pegasus Driver Score (PDS) greater than0.8. As shown in Figure 7(b), a threshold of PDS > 0.8promises a good trade-off between specificity and sensi-tivity. Table 1 reports the 4 detected driver fusions. Allfusions have been validated with RT-PCR (see Additionalfile 3: Figure S2) yielding a 100% rate of transcriptvalidation. And while recurrence is often the surrogatemeasure of functional importance, the four unique
recently reported fusions that were not present in the ChimerDB2.0perior classification performance of Pegasus compared to Oncofuse onof the Pegasus driver score in discerning the class boundary. Positiveear 0.
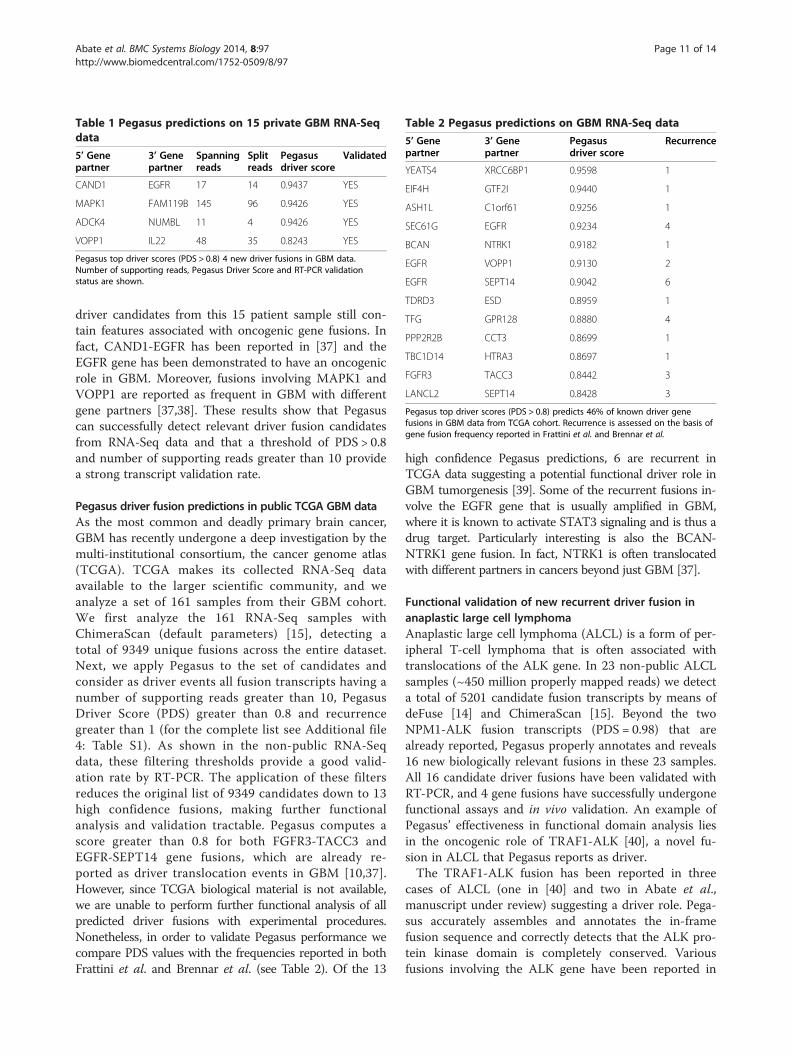
Table 1 Pegasus predictions on 15 private GBM RNA-Seqdata
5’ Genepartner
3’ Genepartner
Spanningreads
Splitreads
Pegasusdriver score
Validated
CAND1 EGFR 17 14 0.9437 YES
MAPK1 FAM119B 145 96 0.9426 YES
ADCK4 NUMBL 11 4 0.9426 YES
VOPP1 IL22 48 35 0.8243 YES
Pegasus top driver scores (PDS > 0.8) 4 new driver fusions in GBM data.Number of supporting reads, Pegasus Driver Score and RT-PCR validationstatus are shown.
Table 2 Pegasus predictions on GBM RNA-Seq data
5’ Genepartner
3’ Genepartner
Pegasusdriver score
Recurrence
YEATS4 XRCC6BP1 0.9598 1
EIF4H GTF2I 0.9440 1
ASH1L C1orf61 0.9256 1
SEC61G EGFR 0.9234 4
BCAN NTRK1 0.9182 1
EGFR VOPP1 0.9130 2
EGFR SEPT14 0.9042 6
TDRD3 ESD 0.8959 1
TFG GPR128 0.8880 4
PPP2R2B CCT3 0.8699 1
TBC1D14 HTRA3 0.8697 1
FGFR3 TACC3 0.8442 3
LANCL2 SEPT14 0.8428 3
Pegasus top driver scores (PDS > 0.8) predicts 46% of known driver genefusions in GBM data from TCGA cohort. Recurrence is assessed on the basis ofgene fusion frequency reported in Frattini et al. and Brennar et al.
Abate et al. BMC Systems Biology 2014, 8:97 Page 11 of 14http://www.biomedcentral.com/1752-0509/8/97
driver candidates from this 15 patient sample still con-tain features associated with oncogenic gene fusions. Infact, CAND1-EGFR has been reported in [37] and theEGFR gene has been demonstrated to have an oncogenicrole in GBM. Moreover, fusions involving MAPK1 andVOPP1 are reported as frequent in GBM with differentgene partners [37,38]. These results show that Pegasuscan successfully detect relevant driver fusion candidatesfrom RNA-Seq data and that a threshold of PDS > 0.8and number of supporting reads greater than 10 providea strong transcript validation rate.
Pegasus driver fusion predictions in public TCGA GBM dataAs the most common and deadly primary brain cancer,GBM has recently undergone a deep investigation by themulti-institutional consortium, the cancer genome atlas(TCGA). TCGA makes its collected RNA-Seq dataavailable to the larger scientific community, and weanalyze a set of 161 samples from their GBM cohort.We first analyze the 161 RNA-Seq samples withChimeraScan (default parameters) [15], detecting atotal of 9349 unique fusions across the entire dataset.Next, we apply Pegasus to the set of candidates andconsider as driver events all fusion transcripts having anumber of supporting reads greater than 10, PegasusDriver Score (PDS) greater than 0.8 and recurrencegreater than 1 (for the complete list see Additional file4: Table S1). As shown in the non-public RNA-Seqdata, these filtering thresholds provide a good valid-ation rate by RT-PCR. The application of these filtersreduces the original list of 9349 candidates down to 13high confidence fusions, making further functionalanalysis and validation tractable. Pegasus computes ascore greater than 0.8 for both FGFR3-TACC3 andEGFR-SEPT14 gene fusions, which are already re-ported as driver translocation events in GBM [10,37].However, since TCGA biological material is not available,we are unable to perform further functional analysis of allpredicted driver fusions with experimental procedures.Nonetheless, in order to validate Pegasus performance wecompare PDS values with the frequencies reported in bothFrattini et al. and Brennar et al. (see Table 2). Of the 13
high confidence Pegasus predictions, 6 are recurrent inTCGA data suggesting a potential functional driver role inGBM tumorgenesis [39]. Some of the recurrent fusions in-volve the EGFR gene that is usually amplified in GBM,where it is known to activate STAT3 signaling and is thus adrug target. Particularly interesting is also the BCAN-NTRK1 gene fusion. In fact, NTRK1 is often translocatedwith different partners in cancers beyond just GBM [37].
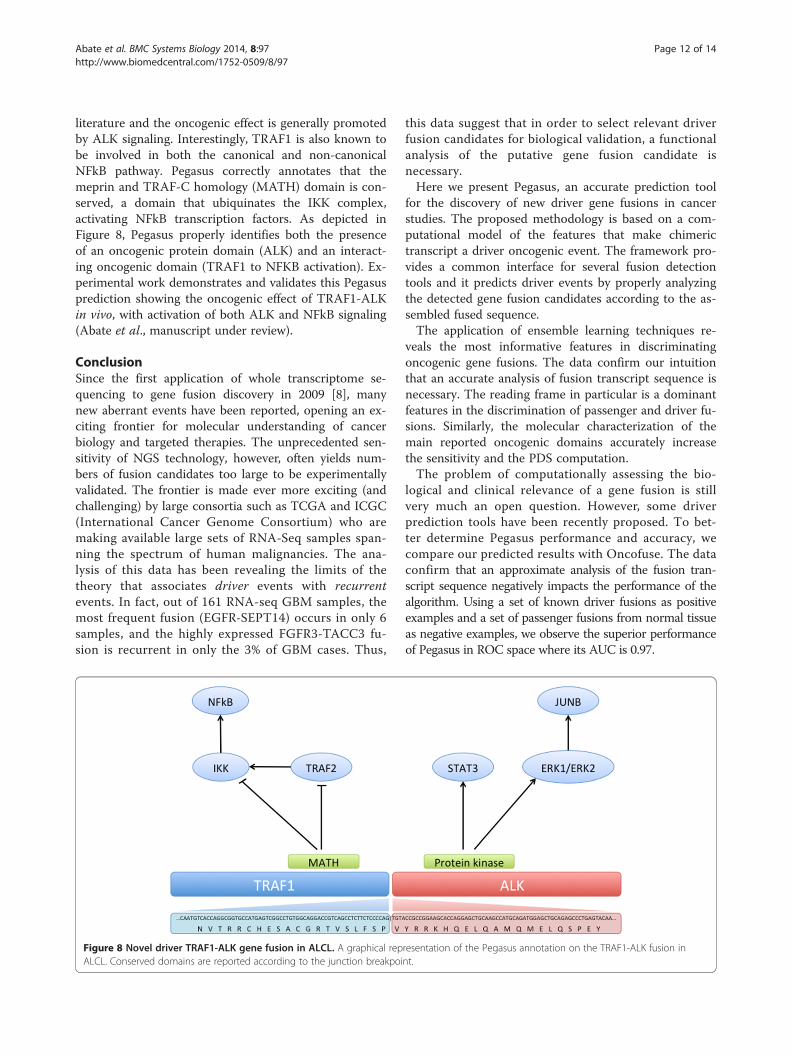
Functional validation of new recurrent driver fusion inanaplastic large cell lymphomaAnaplastic large cell lymphoma (ALCL) is a form of per-ipheral T-cell lymphoma that is often associated withtranslocations of the ALK gene. In 23 non-public ALCLsamples (~450 million properly mapped reads) we detecta total of 5201 candidate fusion transcripts by means ofdeFuse [14] and ChimeraScan [15]. Beyond the twoNPM1-ALK fusion transcripts (PDS = 0.98) that arealready reported, Pegasus properly annotates and reveals16 new biologically relevant fusions in these 23 samples.All 16 candidate driver fusions have been validated withRT-PCR, and 4 gene fusions have successfully undergonefunctional assays and in vivo validation. An example ofPegasus’ effectiveness in functional domain analysis liesin the oncogenic role of TRAF1-ALK [40], a novel fu-sion in ALCL that Pegasus reports as driver.The TRAF1-ALK fusion has been reported in three
cases of ALCL (one in [40] and two in Abate et al.,manuscript under review) suggesting a driver role. Pega-sus accurately assembles and annotates the in-framefusion sequence and correctly detects that the ALK pro-tein kinase domain is completely conserved. Variousfusions involving the ALK gene have been reported in
Abate et al. BMC Systems Biology 2014, 8:97 Page 12 of 14http://www.biomedcentral.com/1752-0509/8/97
literature and the oncogenic effect is generally promotedby ALK signaling. Interestingly, TRAF1 is also known tobe involved in both the canonical and non-canonicalNFkB pathway. Pegasus correctly annotates that themeprin and TRAF-C homology (MATH) domain is con-served, a domain that ubiquinates the IKK complex,activating NFkB transcription factors. As depicted inFigure 8, Pegasus properly identifies both the presenceof an oncogenic protein domain (ALK) and an interact-ing oncogenic domain (TRAF1 to NFKB activation). Ex-perimental work demonstrates and validates this Pegasusprediction showing the oncogenic effect of TRAF1-ALKin vivo, with activation of both ALK and NFkB signaling(Abate et al., manuscript under review).
ConclusionSince the first application of whole transcriptome se-quencing to gene fusion discovery in 2009 [8], manynew aberrant events have been reported, opening an ex-citing frontier for molecular understanding of cancerbiology and targeted therapies. The unprecedented sen-sitivity of NGS technology, however, often yields num-bers of fusion candidates too large to be experimentallyvalidated. The frontier is made ever more exciting (andchallenging) by large consortia such as TCGA and ICGC(International Cancer Genome Consortium) who aremaking available large sets of RNA-Seq samples span-ning the spectrum of human malignancies. The ana-lysis of this data has been revealing the limits of thetheory that associates driver events with recurrentevents. In fact, out of 161 RNA-seq GBM samples, themost frequent fusion (EGFR-SEPT14) occurs in only 6samples, and the highly expressed FGFR3-TACC3 fu-sion is recurrent in only the 3% of GBM cases. Thus,
Figure 8 Novel driver TRAF1-ALK gene fusion in ALCL. A graphical repALCL. Conserved domains are reported according to the junction breakpoi
this data suggest that in order to select relevant driverfusion candidates for biological validation, a functionalanalysis of the putative gene fusion candidate isnecessary.Here we present Pegasus, an accurate prediction tool
for the discovery of new driver gene fusions in cancerstudies. The proposed methodology is based on a com-putational model of the features that make chimerictranscript a driver oncogenic event. The framework pro-vides a common interface for several fusion detectiontools and it predicts driver events by properly analyzingthe detected gene fusion candidates according to the as-sembled fused sequence.The application of ensemble learning techniques re-
veals the most informative features in discriminatingoncogenic gene fusions. The data confirm our intuitionthat an accurate analysis of fusion transcript sequence isnecessary. The reading frame in particular is a dominantfeatures in the discrimination of passenger and driver fu-sions. Similarly, the molecular characterization of themain reported oncogenic domains accurately increasethe sensitivity and the PDS computation.The problem of computationally assessing the bio-
logical and clinical relevance of a gene fusion is stillvery much an open question. However, some driverprediction tools have been recently proposed. To bet-ter determine Pegasus performance and accuracy, wecompare our predicted results with Oncofuse. The dataconfirm that an approximate analysis of the fusion tran-script sequence negatively impacts the performance of thealgorithm. Using a set of known driver fusions as positiveexamples and a set of passenger fusions from normal tissueas negative examples, we observe the superior performanceof Pegasus in ROC space where its AUC is 0.97.
resentation of the Pegasus annotation on the TRAF1-ALK fusion innt.
Abate et al. BMC Systems Biology 2014, 8:97 Page 13 of 14http://www.biomedcentral.com/1752-0509/8/97
Moreover, we demonstrate the practical role of thePegasus framework in computing PDS scores that allowfor triaging lists of gene fusion candidates for experi-mental validation in two actual case studies. In the first,we apply Pegasus to public GBM TCGA data and almost50% of the detected driver fusions turn out to have beenreported as a biologically relevant in independent studies[37,38]. In the second, we compute Pegasus scores forinternal ALCL data and we successfully detect noveloncogenic and targetable driver fusions that have under-gone complete functional and experimental validation.In this work, we extensively report the driver fusionTRAF1-ALK that has been correctly detected and highlyranked by Pegasus.Finally, the accuracy of Pegasus in detecting driver fu-
sions in both the curated validation dataset and the realbiological cases demonstrates the efficacy of the frame-work in supporting biological analysis and cancer re-search. We believe that the Pegasus prediction score, aswell as the accurate annotations provided via our featureengineering, will be of great use to other investigatorssearching for biologically relevant gene fusions in NGSdata.
Availability and RequirementsProject name: PegasusProject home page: http://sourceforge.net/p/pegasus-fus.Operating system: UNIXProgramming language: Java, Perl, Python, BASH.
Additional files
Additional file 1: Supplementary details about the training setdesign and description are provided. Two important points are herebyaddressed. First is the issue of why we augment the negative training setwith deliberately frame-shifted fusions. The second regards the issue ofwhether we can quantify the importance of the “in-frame” feature giventhat we have altered the training set composition.
Additional file 2: Figure S1. Performances of Pegasus compared toOncofuse on randomly drawn sets of 39 non-oncogenic transcripts.
Additional file 3: Figure S2. RT-PCR on 4 fusions (MAPK1-METTL21B,CAND1-EGFR, VOPP1-IL22, ADCK4-NUMBL) that Pegasus predicted ashighly oncogenic in TCGA GBM data.
Additional file 4: Table S1. Complete list of candidates considered asputative driver fusions in TCGA GBM dataset. All fusion transcripts havinga number of supporting reads greater than 10, Pegasus Driver Score(PDS) greater than 0.8 and recurrence greater than 1 are reported.
Competing interestsThe authors declare that they have no competing interests.
Authors’ contributionsFA, SZ designed and developed the tool; RR supervised the project; EF, AA,CHW contributed to the architecture design; AI, AL, VF, GI performedbiological validations; FA, SZ, RR wrote the manuscript and all the authorsimproved it with significant revisions. All authors read and approved thefinal manuscript.
FundingThis project is supported by U54 CA121852 (R.R.), R01 CA179044-01A1 (R.R.),R01 CA164152-01, Stewart Trust Foundation and The Italian Association forCancer Research (AIRC) Special Program in Clinical Molecular Oncology(5x1000 No. 10007, Milan, Italy), Regione Piemonte (ONCOPROT, CIPE 25/2005), ImmOnc (Innovative approaches to boost the immune responses,Programma Operativo Regionale, Piattaforme Innovative BIO F.E.S.R. 2007/13,Asse 1 ‘Ricerca e innovazione’ della LR 34/2004), and the Oncology Programof Compagnia di San Paolo (Turin, Italy) (G.I.).
Author details1Department of Biomedical Informatics, Columbia University, 1130 St.Nicholas Ave, New York, NY 10032, USA. 2Center for Computational Biologyand Bioinformatics, Columbia University, 1130 St. Nicholas Ave, New York, NY10032, USA. 3Department of Control and Computer Engineering, Politecnicodi Torino, Torino 10129, Italy. 4Department of Pathology, Center forExperimental Research and Medical Studies, Laboratory of FunctionalGenomics, University of Torino, Torino, Italy. 5Institute for Cancer Genetics,Columbia University Medical Center, New York, New York, USA. 6Departmentof Applied Physics and Applied Mathematics, The Fu Foundation School forEngineering and Applied Sciences, Columbia University, 500 W. 120th Street,Mudd 200, MC 4701, New York, New York 10027, USA. 7Institute for DataSciences and Engineering, Columbia University, 500 W. 120th Street, Mudd524, New York, New York 10027, USA.
Received: 6 February 2014 Accepted: 5 August 2014
References1. Nowell P, Hungerford D: A minute chromosome in chronic granulocytic
leukemia. Science 1960, 132(3438):1488–1501.2. Zhao X, Ghaffari S, Lodish H, Malashkevich VN, Kim PS: Structure of the
Bcr-Abl oncoprotein oligomerization domain. Nat Struct Biol 2002,9(2):117–120.
3. Tomlins SA, Rhodes DR, Perner S, Dhanasekaran SM, Mehra R, Sun XW,Varambally S, Cao X, Tchinda J, Kuefer R, Lee C, Montie JE, Shah RB,Pienta KJ, Rubin MA, Chinnaiyan AM: Recurrent fusion of TMPRSS2and ETS transcription factor genes in prostate cancer. Science 2005,310(5748):644–648.
4. Merson S, Jhavar S, Flohr P, Edwards S, Foster CS, Eeles R, Martin FL, PhillipsDH, Crundwell M, Christmas T, Thompson A, Fisher C, Kovacs G, Cooper CS:Diversity of TMPRSS2-ERG fusion transcripts in the human prostate.Oncogene 2007, 26(18):2667–2673.
5. Voena C, Ambrogio C, Piva R, Inghirami G: The anaplastic lymphomakinase in the pathogenesis of cancer. Nat Rev Cancer 2008, 8(1):11–23.
6. Morris SW, Kirstein MN, Valentine MB, Dittmer KG, Shapiro DN, Saltman DL,Look AT: Fusion of a kinase gene, ALK, to a nucleolar protein gene, NPM,in non-Hodgkin’s lymphoma. Science 1994, 263(5151):1281–1284.
7. Soda M, Choi YL, Enomoto M, Takada S, Yamashita Y, Ishikawa S, Fujiwara S,Watanabe H, Kurashina K, Hatanaka H, Bando M, Ohno S, Ishikawa Y,Aburatani H, Niki T, Sohara Y, Sugiyama Y, Mano H: Identification of thetransforming EML4-ALK fusion gene in non-small-cell lung cancer.Nature 2007, 448(7153):561–566.
8. Maher CA, Palanisamy N, Brenner JC, Cao X, Kalyana-Sundaram S, Luo S,Khrebtukova I, Barrette TR, Grasso C, Yu J, Lonigro RJ, Schroth G, Kumar-Sinha C,Chinnaiyan AM: Chimeric transcript discovery by paired-end transcriptomesequencing. Proc Natl Acad Sci U S A 2009, 106(30):12353–12358.
9. Steidl C, Shah SP, Woolcock BW, Rui L, Kawahara M, Farinha P, Johnson NA,Zhao Y, Telenius A, Neriah SB, McPherson A, Meissner B, Okoye UC, DiepstraA, van den Berg A, Sun M, Leung G, Jones SJ, Connors JM, Huntsman DG,Savage KJ, Rimsza LM, Horsman DE, Staudt LM, Steidl U, Marra MA,Gascoyne RD: MHC class II transactivator CIITA is a recurrent gene fusionpartner in lymphoid cancers. Nature 2011, 471(7338):377–381.
10. Singh D, Chan JM, Zoppoli P, Niola F, Sullivan R, Castano A, Liu EM, ReichelJ, Porrati P, Pellegatta S, Qiu K, Gao Z, Ceccarelli M, Riccardi R, Brat DJ, GuhaA, Aldape K, Golfinos JG, Zagzag D, Mikkelsen T, Finocchiaro G, Lasorella A,Rabadan R, Iavarone A: Transforming fusions of FGFR and TACC genes inhuman glioblastoma. Science 2012, 337(6099):1231–1235.
11. Williams SV, Hurst CD, Knowles MA: Oncogenic FGFR3 gene fusions inbladder cancer. Hum Mol Genet 2013, 22(4):795–803.

Abate et al. BMC Systems Biology 2014, 8:97 Page 14 of 14http://www.biomedcentral.com/1752-0509/8/97
12. Majewski IJ, Mittempergher L, Davidson NM, Bosma A, Willems SM, HorlingsHM, de Rink I, Greger L, Hooijer GK, Peters D, Nederlof PM, Hofland I, deJong J, Wesseling J, Kluin RJ, Brugman W, Kerkhoven R, Nieboer F, RoepmanP, Broeks A, Muley TR, Jassem J, Niklinski J, van Zandwijk N, Brazma A,Oshlack A, van den Heuvel M, Bernards R: Identification of recurrent FGFR3fusion genes in lung cancer through kinome-centred RNA sequencing.J Pathol 2013, 230(3):270–276.
13. Sboner A, Habegger L, Pflueger D, Terry S, Chen DZ, Rozowsky JS, TewariAK, Kitabayashi N, Moss BJ, Chee MS, Demichelis F, Rubin MA, Gerstein MB:FusionSeq: a modular framework for finding gene fusions by analyzingpaired-end RNA-sequencing data. Genome Biol 2010, 11(10):R104.
14. McPherson A, Hormozdiari F, Zayed A, Giuliany R, Ha G, Sun MG, Griffith M,Heravi Moussavi A, Senz J, Melnyk N, Pacheco M, Marra MA, Hirst M, NielsenTO, Sahinalp SC, Huntsman D, Shah SP: deFuse: an algorithm for genefusion discovery in tumor RNA-Seq data. PLoS Comput Biol 2011,7(5):e1001138.
15. Iyer MK, Chinnaiyan AM, Maher CA: ChimeraScan: a tool for identifyingchimeric transcription in sequencing data. Bioinformatics 2011,27(20):2903–2904.
16. Abate F, Acquaviva A, Paciello G, Foti C, Ficarra E, Ferrarini A, Delledonne M,Iacobucci I, Soverini S, Martinelli G, Macii E: Bellerophontes: an RNA-Seqdata analysis framework for chimeric transcripts discovery based onaccurate fusion model. Bioinformatics 2012, 28(16):2114–2121.
17. Trapnell C, Pachter L, Salzberg SL: TopHat: discovering splice junctionswith RNA-Seq. Bioinformatics 2009, 25(9):1105–1111.
18. Trapnell C, Williams BA, Pertea G, Mortazavi A, Kwan G, van Baren MJ,Salzberg SL, Wold BJ, Pachter L: Transcript assembly and quantification byRNA-Seq reveals unannotated transcripts and isoform switching duringcell differentiation. Nat Biotechnol 2010, 28(5):511–515.
19. Edgren H, Murumagi A, Kangaspeska S, Nicorici D, Hongisto V, Kleivi K,Rye IH, Nyberg S, Wolf M, Borresen-Dale AL, Kallioniemi O: Identification offusion genes in breast cancer by paired-end RNA-sequencing. GenomeBiol 2011, 12(1):R6.
20. Carrara M, Beccuti M, Lazzarato F, Cavallo F, Cordero F, Donatelli S, CalogeroRA: State-of-the-art fusion-finder algorithms sensitivity and specificity.Biomed Res Int 2013, 2013:340620.
21. Ozsolak F, Milos PM: RNA sequencing: advances, challenges andopportunities. Nat Rev Genet 2011, 12(2):87–98.
22. Mitelman F, J.B.a.M.F: Mitelman Database of Chromosome Aberrationsand Gene Fusions in Cancer. In; 2013. Available from: http://cgap.nci.nih.gov/Chromosomes/Mitelman.
23. Novo FJ, de Mendibil IO, Vizmanos JL: TICdb: a collection of gene-mappedtranslocation breakpoints in cancer. BMC Genomics 2007, 8:33.
24. Kim P, Yoon S, Kim N, Lee S, Ko M, Lee H, Kang H, Kim J, Lee S: ChimerDB2.0–a knowledgebase for fusion genes updated. Nucleic Acids Res 2010,38(Database issue):D81–D85.
25. Wang XS, Prensner JR, Chen GA, Cao Q, Han B, Dhanasekaran SM, PonnalaR, Cao XH, Varambally S, Thomas DG, Giordano TJ, Beer DG, Palanisamy N,Sartor MA, Omenn GS, Chinnaiyan AM: An integrative approach to revealdriver gene fusions from paired-end sequencing data in cancer. NatBiotechnol 2009, 27(11):1005.
26. Wu CC, Kannan K, Lin S, Yen L, Milosavljevic A: Identification of cancerfusion drivers using network fusion centrality. Bioinformatics 2013,29(9):1174–1181.
27. Shugay M, Ortiz De Mendibil I, Vizmanos JL, Novo FJ: Oncofuse: acomputational framework for the prediction of the oncogenic potentialof gene fusions. Bioinformatics 2013, 29(20):2539–2546.
28. Jin Y, Mertens F, Kullendorff CM, Panagopoulos I: Fusion of the tumor-suppressor gene CHEK2 and the gene for the regulatory subunit B ofprotein phosphatase 2 PPP2R2A in childhood teratoma. Neoplasia2006, 8(5):413–418.
29. Flicek P, Amode MR, Barrell D, Beal K, Brent S, Carvalho-Silva D, Clapham P,Coates G, Fairley S, Fitzgerald S, Gil L, Gordon L, Hendrix M, Hourlier T,Johnson N, Kahari AK, Keefe D, Keenan S, Kinsella R, Komorowska M, Kos-cielny G, Kulesha E, Larsson P, Longden I, McLaren W, Muffato M, OverduinB, Pignatelli M, Pritchard B, Riat HS, et al: Ensembl 2012. Nucleic Acids Res2012, 40(Database issue):D84–D90.
30. UniProt Consortium: Reorganizing the protein space at the Universal ProteinResource (UniProt). Nucleic Acids Res 2012, 40(Database issue):D71–D75.
31. Friedman J, Hastie T, Tibshirani R: Additive Logistic Regression: a StatisticalView of Boosting. Ann Stat 2000, 28(2):337–407.
32. Friedman JH: Greedy Function Approximation: A Gradient BoostingMachine. Ann Stat 2000, 29:1189–1232.
33. Hastie T, Tibshirani R, Friedman JH: The Elements of Statistical Learning.Springer Series Stat 2001.
34. Varoquaux G, Gramfort A, Michel V, Thirion B, Grisel O, Blondel M,Prettenhofer P, Weiss R, Dubourg V, Vanderplas J, Passos A, Cournapeau D,Brucher M, Perrot M, Duchesnay E: Scikit-learn: Machine Learning inPython. (J Mach Learn Res 2011, 12:2825–2830. MIT Press.
35. Ananth Mohan ZC: Kilian Weinberger Web-Search Ranking with InitializedGradient Boosted Regression Trees. JMLR: Workshop and ConferenceProceedings 2011, 14:77–89.
36. Breiman L: Classification and regression trees. In ; 1984.37. Frattini V, Trifonov V, Chan JM, Castano A, Lia M, Abate F, Keir ST, Ji AX,
Zoppoli P, Niola F, Danussi C, Dolgalev I, Porrati P, Pellegatta S, Heguy A,Gupta G, Pisapia DJ, Canoll P, Bruce JN, McLendon RE, Yan H, Aldape K,Finocchiaro G, Mikkelsen T, Prive GG, Bigner DD, Lasorella A, Rabadan R,Iavarone A: The integrated landscape of driver genomic alterations inglioblastoma. Nat Genet 2013, 45(10):1141–1149.
38. Brennan CW, Verhaak RG, McKenna A, Campos B, Noushmehr H, Salama SR,Zheng S, Chakravarty D, Sanborn JZ, Berman SH, Beroukhim R, Bernard B,Wu CJ, Genovese G, Shmulevich I, Barnholtz-Sloan J, Zou L, Vegesna R,Shukla SA, Ciriello G, Yung WK, Zhang W, Sougnez C, Mikkelsen T, Aldape K,Bigner DD, Van Meir EG, Prados M, Sloan A, Black KL, et al: The somaticgenomic landscape of glioblastoma. Cell 2013, 155(2):462–477.
39. Stratton MR, Campbell PJ, Futreal PA: The cancer genome. Nature 2009,458(7239):719–724.
40. Feldman AL, Vasmatzis G, Asmann YW, Davila J, Middha S, Eckloff BW,Johnson SH, Porcher JC, Ansell SM, Caride A: Novel TRAF1-ALK fusionidentified by deep RNA sequencing of anaplastic large cell lymphoma.Genes Chromosomes Cancer 2013, 52(11):1097–1102.
doi:10.1186/s12918-014-0097-zCite this article as: Abate et al.: Pegasus: a comprehensive annotationand prediction tool for detection of driver gene fusions in cancer. BMCSystems Biology 2014 8:97.
Submit your next manuscript to BioMed Centraland take full advantage of:
• Convenient online submission
• Thorough peer review
• No space constraints or color figure charges
• Immediate publication on acceptance
• Inclusion in PubMed, CAS, Scopus and Google Scholar
• Research which is freely available for redistribution
Submit your manuscript at www.biomedcentral.com/submit