
PDF 464.6 K - Chemical Engineering
11
Proceeding of the 9 th ICEE Conference 3-5 April 2018 CEA Military Technical College Kobry El-Kobbah, Cairo, Egypt 9 th International Conference on Chemical & Environmental Engineering 3-5 April 2018 85 CEA-5 Simulation of Ammonia Production from Synthesis Gas 1 Pr.Dr.Nabil Abdel El Moneim, 2 Dr.Ibrahim Ismail, 3 Nasser. M.M Abstract Ammonia is a compound of nitrogen and hydrogen with the formula NH 3 . It is a colorless gas with a characteristic pungent smell. Several processes have been invented for optimum production of ammonia. Now-a-days, Haber process is a mainly process for Ammonia production in which the reaction between nitrogen and hydrogen done in the presence of an iron catalyst to form ammonia. In our work, simulation of ammonia synthesis process is done on Aspen Hysys V8.8. By using 333.1 kmole/h of steams, 100 kmole/hr of nitrogen, we have produced 74.62 kmole/hr ammonia. It has also been found that ammonia production increases with the rise of pressure & mass flow of steam& decrease of the temperature of the feed of nitrogen. Keywords: Ammonia, Simulation, Haber 1,2 Cairo University of Engineering 3. Egyptian Armed Force.
-
Upload
khangminh22 -
Category
Documents
-
view
0 -
download
0
Transcript of PDF 464.6 K - Chemical Engineering
Proceeding of the 9th
ICEE Conference 3-5 April 2018 CEA
Military Technical College
Kobry El-Kobbah,
Cairo, Egypt
9th
International Conference
on
Chemical & Environmental
Engineering
3-5 April 2018
85
CEA-5
Simulation of Ammonia Production from Synthesis Gas
1 Pr.Dr.Nabil Abdel El Moneim,
2 Dr.Ibrahim Ismail,
3 Nasser. M.M
Abstract
Ammonia is a compound of nitrogen and hydrogen with the formula NH3. It is a colorless
gas with a characteristic pungent smell. Several processes have been invented for
optimum production of ammonia. Now-a-days, Haber process is a mainly process for
Ammonia production in which the reaction between nitrogen and hydrogen done in the
presence of an iron catalyst to form ammonia. In our work, simulation of ammonia
synthesis process is done on Aspen Hysys V8.8. By using 333.1 kmole/h of steams, 100
kmole/hr of nitrogen, we have produced 74.62 kmole/hr ammonia. It has also been found
that ammonia production increases with the rise of pressure & mass flow of steam&
decrease of the temperature of the feed of nitrogen.
Keywords:
Ammonia, Simulation, Haber
1,2 Cairo University of Engineering
3. Egyptian Armed Force.

Proceeding of the 9th
ICEE Conference 3-5 April 2018 CEA
Military Technical College
Kobry El-Kobbah,
Cairo, Egypt
9th
International Conference
on
Chemical & Environmental
Engineering
3-5 April 2018
86
1. Introduction
Ammonia (NH3) is one of the largest synthetic chemicals, produced in more than 80
countries. In fact, the synthesis of this world class commodity figures among the greatest
achievements of industrial chemistry, after which important processes were developed
such as methanol, oxo synthesis, Fischer – Tropsch Process and Reppe reactions.
Ammonia is basically produced by the reaction between nitrogen and hydrogen, in a 1:3
stoichiometric ratio. Its production routes are related to the hydrogen production method,
being steam reforming the main one. Natural gas and naphtha are the most common
hydrocarbon feeds used. Currently, most of the existing and almost all new steam
reforming plants use natural gas for feedstock.
The most important note is that the production of Ammonia by steam reforming of
natural gas is a somewhat clean operation with no significant environmental problems.
On the other hand, the use of heavy feed stocks raises additional environmental issues
related to, for instance, particulate emissions from solids handling of the feeds.
Hager (2007) approved that, the need for NH3 production from abundantly available
resources such as natural gas and air came about from the vast population growth
following in the wake of the industrial revolution in the 1800s. More mouths to feed
demanded increased agricultural output and the answer to this was the large scale
application of fertilizers.
Appl, M. (2006) explained that, feedstock for textiles, chemical products and explosives
is some of applications of ammonia. Haber-Bosch process is used in most modern NH3 -
plants to produce ammonia from nitrogen and hydrogen which are obtained from air and
(mainly) natural gas. These processes are operated with reactor temperatures of 400-
500◦C and pressures ranging from 100-200 bar with considerable recycle of uncreated
synthesis gas.
Williams, J. (2015) explained that, ammonia (NH3) is the most manufactured industrial
chemical in the world per weight. 80% of the annual production of 160 M tons (NH3) is
applied as fertilizer either directly or as other ammonium based products. The huge scale
and global knowledge of the Haber-Bosch process implies that the production process has
to be optimal in order to remain competitive in a global and established yet fluctuating
market. Estimates indicate that the global production capacity of ammonia will increase
by more than 15% from 2015 to 2018, possibly lowering the price of ammonia if the
demand does not simultaneously grow at the same rate.
Computer based simulation has been popular now-a-days for different chemical
engineering purposes. Though our task was to represent production of ammonia in
renowned aspen HYSYS software, making some assumptions and using hypothetical
reactors we have performed the ammonia production simulation. Though it does not give

Proceeding of the 9th
ICEE Conference 3-5 April 2018 CEA
Military Technical College
Kobry El-Kobbah,
Cairo, Egypt
9th
International Conference
on
Chemical & Environmental
Engineering
3-5 April 2018
87
the real world performance or the real life production environment, but it can give relief
from making wide range of experiment without making the small scale reactors or plant.
The simulators are used to evaluate the steady state behavior of the process even though
the mutual agreement about the reaction mechanism has not been established and thus the
reliability of the results cannot be evaluated. The evaluation of the results will be carried
out later when the applicability of the models found from the literature will be studied
with the process data.
2. Methodology
Aspen hysys is the market leading process modeling solution that provides large
economic benefits throughout the process engineering lifecycle & enables companies to
design and bring new plants & reduce capital costs. The process of producing ammonia is
simulated in Simulation software Aspen Hysys V 8.8. In this simulation we used Peng-
Robinson model fits best to equilibrium process.
2.1 Material & Instrumentation:
Material
Synthesis gas Nitrogen
Hydrogen steam
Synthesis gas air
Instrumentation
Coolers Absorbers
separators Reactors
Mixers
Software Aspen Hysys v 8.8
2.2 Process Description: Ammonia is produced in a process known as the Haber process, in which nitrogen and
hydrogen react in the presence of an iron catalyst to form ammonia. The hydrogen is
formed by reacting natural gas and steam at high temperatures and the nitrogen is
supplied from the air. Other gases (such as water and carbon dioxide) are removed from
the gas stream and the nitrogen and hydrogen passed at high temperature and pressure to
form the ammonia.

Proceeding of the 9th
ICEE Conference 3-5 April 2018 CEA
Military Technical College
Kobry El-Kobbah,
Cairo, Egypt
9th
International Conference
on
Chemical & Environmental
Engineering
3-5 April 2018
88
2.3 Hydrogen Production: The reaction of methane with water is used to produce the hydrogen. However, before
doing this, all sulfurous compounds must be removed from the natural gas to prevent
catalyst poisoning. These are removed by heating the gas to 400 o C and reacting it with
zinc oxide:
ZnO + H2S → ZnS + H2O
The gas is sent to the primary reformer for steam reforming, where superheated steam is
fed into the reformer with the methane. The gas mixture heated with natural gas and
purge gas to 770 o C. At this temperature the methane converted to hydrogen, carbon
dioxide and small quantities of carbon monoxide.
CH4 + H2O → CO + 3 H2
CH4 +2 H2O → CO2 + 4 H2
CO + H2O → CO2 + H2
2.4 Removal of Carbon Monoxide: The water gas shift reaction (CO2 absorber) is used to convert all carbon mono oxides to
carbon dioxides according to the following reaction:
CO + H2O → CO2 + H2
2.5 Removal of carbon dioxide: Removing carbon dioxide & remaining of carbon monoxide is very essential step to
prevent the poison of ammonia synthesis reaction.
2.6 Ammonia Production: Ammonia produced due to catalytic reaction between hydrogen and nitrogen according to
the following reaction:
N2+H2→NH3
3. Result and Discussions
After performing the simulation we have found that the production of ammonia depends
on different parameters of the process. So by controlling these parameters optimum
ammonia production can be obtained.
From the simulation result we have observed the effect of several parameters on
production. Those effects are described in below.
Proceeding of the 9th
ICEE Conference 3-5 April 2018 CEA
Military Technical College
Kobry El-Kobbah,
Cairo, Egypt
9th
International Conference
on
Chemical & Environmental
Engineering
3-5 April 2018
89
3.1 Mass flow rate of steam The relation between Mass flow rate of steam & mass flow rate of ammonia product can
be easily realized from the plot given below:
From the plot, it is observed that the Mass flow rate of steam is directly proportional to
ammonia product so the increases of mass flow rate of steam cause increase of the mass
flow rate of produced ammonia.
3.2 Pressure of steam This parameter can be easily observed from the plot given below:
From the plot, it is observed that the pressure of steam is directly proportional to
ammonia product so the increases of pressure of steam cause increase of the mass flow
rate of produced ammonia.
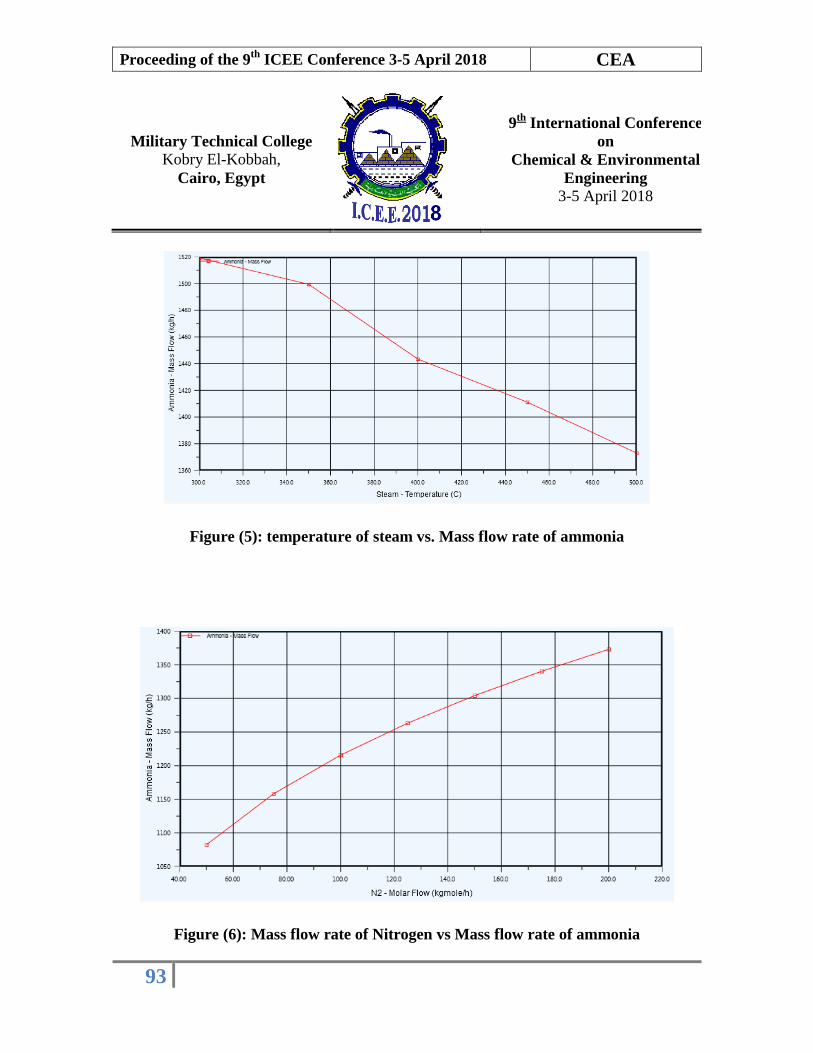
3.3 Temperature of steam From the plot below, it is observed that the temperature of steam is inversely proportional
to ammonia product so the increases of pressure of steam cause decrease of the mass flow
rate of produced ammonia.
3.4 Molar flow rate of Nitrogen From the plot below, it is observed that the Molar flow rate of Nitrogen is directly
proportional to ammonia product so the Molar flow rate of Nitrogen cause increase of the
mass flow rate of produced ammonia.
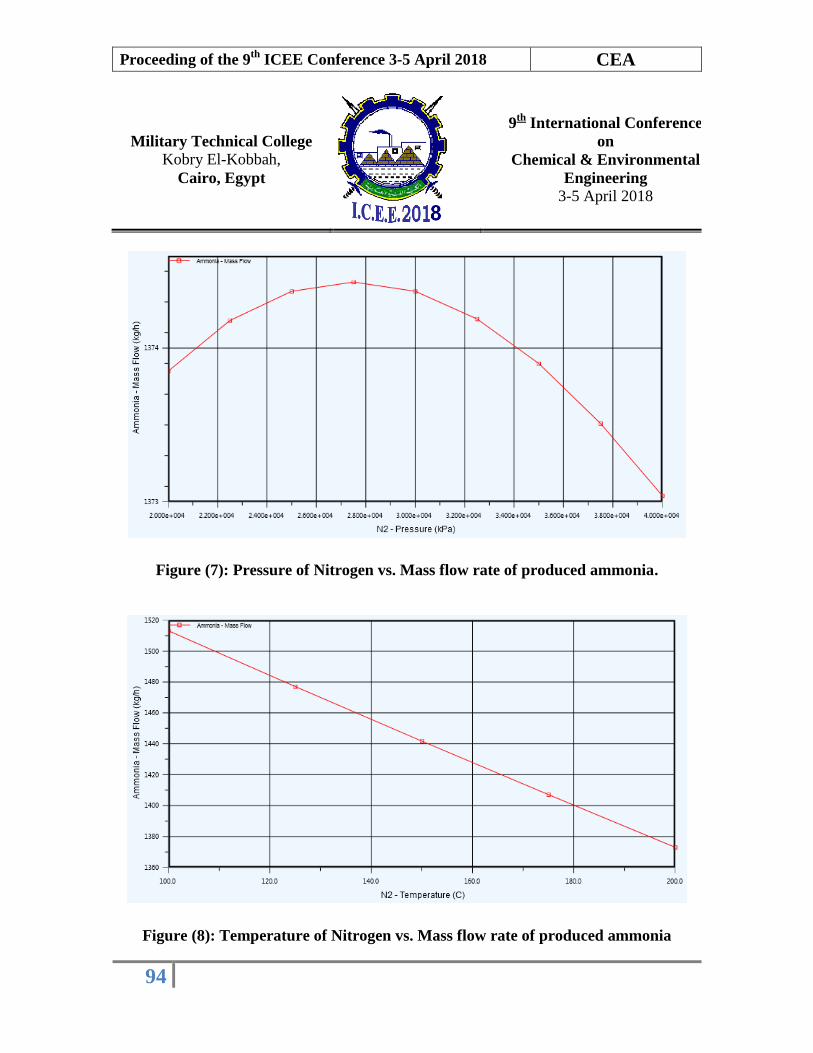
3.5 Pressure of Nitrogen
This parameter can be easily observed from the plot given below:
From the plot, it is observed that the Pressure of Nitrogen is directly proportional to
ammonia product until the pressure reach to 2.754*104 kpa the relation is turned to
inversely proportional so in this simulation the optimum operating pressure of Nitrogen is
2.754*104 kpa.
3.6 Temperature of Nitrogen:
This parameter can be easily observed from the plot given below:
From the plot, it is observed that the temperature of Nitrogen is inversely proportional to
ammonia product so the increases of temperature of Nitrogen cause decrease of the mass
flow rate of produced ammonia.

Proceeding of the 9th
ICEE Conference 3-5 April 2018 CEA
Military Technical College
Kobry El-Kobbah,
Cairo, Egypt
9th
International Conference
on
Chemical & Environmental
Engineering
3-5 April 2018
90
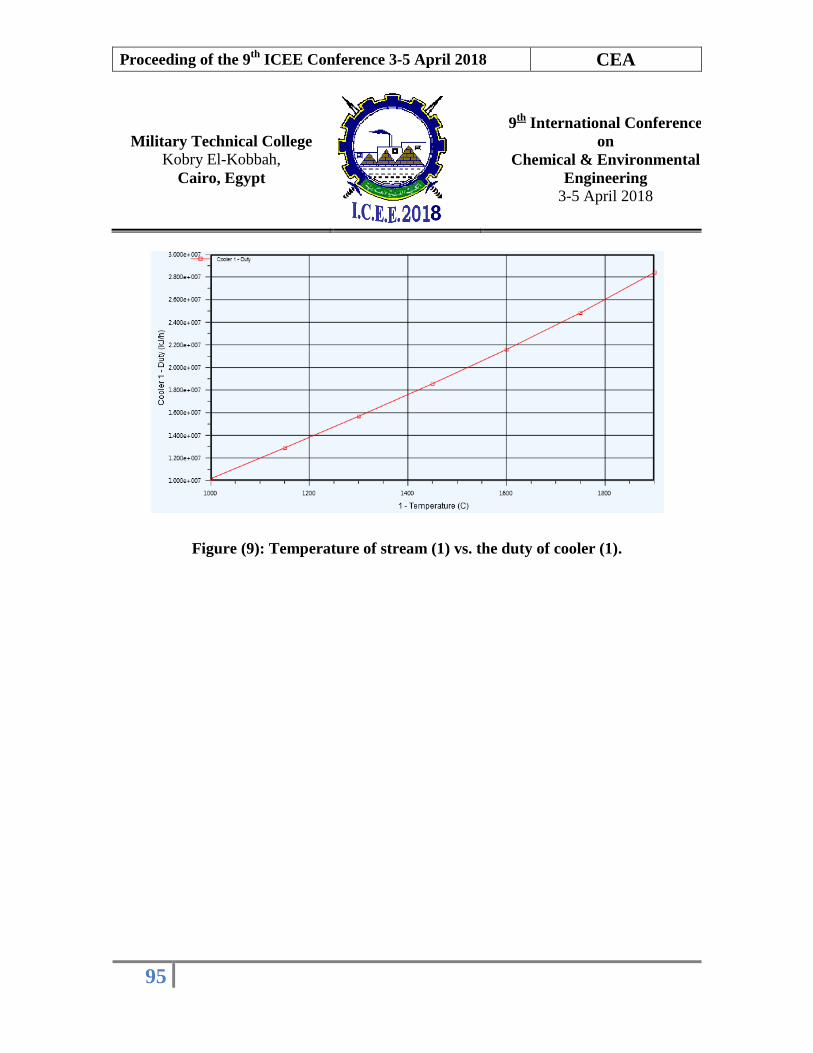
3.7 Temperature of feed of stream (1) on the duty of cooler (1): From the plot below, it is observed that the temperature of feed of stream (1) is directly
proportional to duty of the cooler so the increases of temperature of feed of stream (1)
cause increase of the duty of cooler.
4. Conclusion
Ammonia synthesis is an important chemical process. In our paper, we have generated
data based on the simulation performed in HYSYS. This data can help us understand the
process in different situation in industrial practice. By varying the different parameters in
this simulation environment, the effects of these parameters on ammonia production are
observed and the results are shown in graphical form. Using the plots, the optimum
conditions for ammonia production can be easily found out.
5. References
[1] Amin, M. R., Sharear, S., Siddique, N., & Islam, S. (2013). Simulation of Ammonia
Synthesis. American Journal of Chemical Engineering, 1(3), 59-64.
[2] Appl, M. (2006). Ammonia. Ullmann's encyclopedia of industrial chemistry.
[3] Biegler, L. T. (1987). Process flow sheet optimization: recent results and future
directions.
[4] Biegler, L. T., Grossmann, I. E., & Westerberg, A. W. (1997). Systematic methods for
chemical process design.
[5] Bland. (2015) Optimization of an ammonia synthesis loop.
[6] Gaines, L. D., & Gaddy, J. L. (1976) Process optimization by flow sheet simulation.
Industrial & Engineering Chemistry Process Design and Development, 15(1), 206-
.211
[7] McKenzie, F. C., & Williams, J. (2015). Sustainable food production: constraints,
challenges and choices by 2050. Food Security, 7(2), 221-233.
[8] Sotoft, L. F., Pryds, M. B., Nielsen, A. K., & Norddahl, B. (2015). Process Simulation
of Ammonia Recovery from Biogas Digestate by Air Stripping with Reduced
Chemical Consumption. In Computer Aided Chemical Engineering (Vol. 37, pp.
2465-2470). Elsevier
Proceeding of the 9th
ICEE Conference 3-5 April 2018 CEA
Military Technical College
Kobry El-Kobbah,
Cairo, Egypt
9th
International Conference
on
Chemical & Environmental
Engineering
3-5 April 2018
91
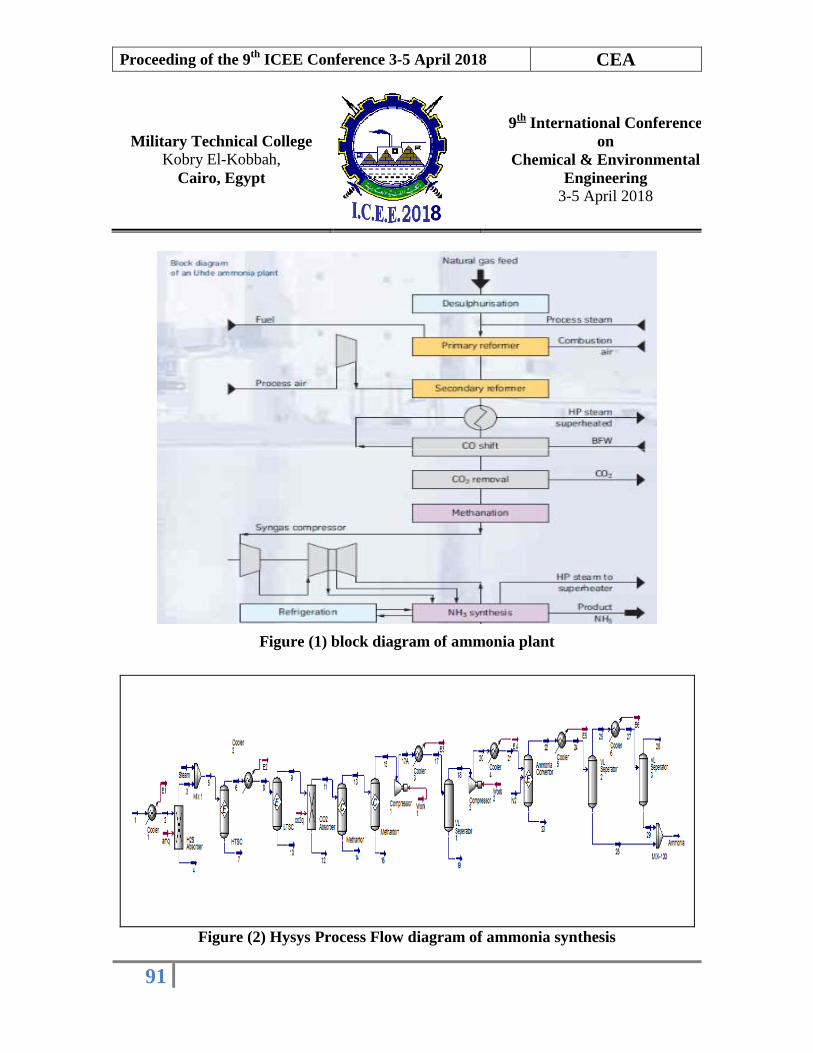
Figure (1) block diagram of ammonia plant
Figure (2) Hysys Process Flow diagram of ammonia synthesis

Proceeding of the 9th
ICEE Conference 3-5 April 2018 CEA
Military Technical College
Kobry El-Kobbah,
Cairo, Egypt
9th
International Conference
on
Chemical & Environmental
Engineering
3-5 April 2018
92
Figure (3): Mass flow rate of steam vs. Mass flow rate of ammonia
Figure (4): pressure of steam vs. Mass flow rate of ammonia
Proceeding of the 9th
ICEE Conference 3-5 April 2018 CEA
Military Technical College
Kobry El-Kobbah,
Cairo, Egypt
9th
International Conference
on
Chemical & Environmental
Engineering
3-5 April 2018
93
Figure (5): temperature of steam vs. Mass flow rate of ammonia
Figure (6): Mass flow rate of Nitrogen vs Mass flow rate of ammonia
Proceeding of the 9th
ICEE Conference 3-5 April 2018 CEA
Military Technical College
Kobry El-Kobbah,
Cairo, Egypt
9th
International Conference
on
Chemical & Environmental
Engineering
3-5 April 2018
94
Figure (7): Pressure of Nitrogen vs. Mass flow rate of produced ammonia.
Figure (8): Temperature of Nitrogen vs. Mass flow rate of produced ammonia
Proceeding of the 9th
ICEE Conference 3-5 April 2018 CEA
Military Technical College
Kobry El-Kobbah,
Cairo, Egypt
9th
International Conference
on
Chemical & Environmental
Engineering
3-5 April 2018
95
Figure (9): Temperature of stream (1) vs. the duty of cooler (1).