
Chemical Engineering and Processing
16
Chemical Engineering and Processing 77 (2014) 50–65 Contents lists available at ScienceDirect Chemical Engineering and Processing: Process Intensification j ourna l ho me page: www.elsevier.com/locate/cep Heterogeneous modeling of an autothermal membrane reactor coupling dehydrogenation of ethylbenzene to styrene with hydrogenation of nitrobenzene to aniline: Fickian diffusion model Nabeel S. Abo-Ghander a , Filip Logist b , John R. Grace a,∗ , Jan F.M. Van Impe b , Said S.E.H. Elnashaie a , C. Jim Lim a a Chemical and Biochemical Engineering Department, University of British Columbia, Vancouver, Canada V6T 1Z3 b BioTeC and OPTEC, Chemical Engineering Department, KU Leuven, W. de Croylaan 46, B-3001 Leuven, Belgium a r t i c l e i n f o Article history: Received 2 August 2012 Received in revised form 17 December 2013 Accepted 30 December 2013 Available online 18 January 2014 Keywords: Integrated catalytic membrane reactor Dehydrogenation Hydrogenation Heterogeneous model Fickian model Effectiveness factors a b s t r a c t Coupling of reactions in catalytic membrane reactors provides a route to process intensification. Dehy- drogenation of ethylbenzene and hydrogenation of nitrobenzene form a promising pair of processes to be coupled in a membrane reactor. The heat released from the hydrogenation side is utilized to break the endothermality on the dehydrogenation side, while hydrogen produced on the dehydrogenation side permeates through the hydrogen-selective membranes, enhances the equilibrium conversion of ethyl- benzene and reacts with nitrobenzene on the permeate side to produce aniline. Mathematical reactor models are excellent tools to evaluate the extent of improvement before experiments are set up. How- ever, a careful selection of phenomena considered by the reactor model is needed in order to obtain accurate model predictions. To investigate the effect of the intraparticle resistances on the performance of the cocurrent configura- tion of the coupling reactor, a heterogeneous fixed bed reactor model is developed with Fickian diffusion inside the catalyst pellets. For the condition of interest, the styrene yield is found to be 82% by the homoge- nous model, 73% by the heterogeneous model for isothermal pellets, and 69% by the heterogeneous model with non-isothermal pellets. Hence, the homogeneous model overestimates the yield by 5–15% of their actual values. © 2014 Elsevier B.V. All rights reserved. 1. Introduction Coupling of reactions in a single reactor can be very beneficial, offering a number of advantages such as eliminating unnecessary heat transfer units [1], reducing overall heat losses, cost savings [2] and significant gains in yield and/or conversions due to shifting the thermodynamic equilibrium conversion by continuously removing one of the reaction products and supplying heat to the endothermic reactions [3]. As a result, these reactors are excellent examples of process integration and intensification. In the last two decades, a number of studies have appeared addressing the usefulness of reaction coupling. An interesting reac- tion for this purpose involves the dehydrogenation of ethylbenzene to styrene. Abdalla and Elnashaie [4] developed a rigorous model to describe the behavior of a membrane reactor in which ethyl- benzene was dehydrogenated to styrene. The dusty gas model was used to describe the diffusion inside the catalyst pellets. ∗ Corresponding author. Fax: +1 604 822 6003. E-mail address: [email protected] (J.R. Grace). Later, this model was used to extract intrinsic kinetics from data obtained from an industrial reactor and to investigate the potential economic advantages of a hydrogen-selective membrane. It was found that a membrane reactor could considerably improve the ethylbenzene conversion, and the yield and selectivity of styrene. Abdalla and Elnashaie [5] studied the effect of the sweep gas flow rates in a catalytic membrane reactor in which dehydrogenation of ethylbenzene to styrene took place. An appreciable enhance- ment in ethylbenzene conversion, styrene yield and selectivity were observed in the proposed membrane reactor. Abdalla and Elnashaie [6] proposed a fluidized bed with and without a selective membrane for dehydrogenating ethylbenzene to styrene. Different design and operating parameters, i.e. bubble diameter, steam-to- ethylbenzene ratio, feed temperature, and number of fluidized beds in series, were investigated. It was demonstrated that a careful choice of those parameters could improve the ethylbenzene con- version and styrene yield compared to industrial fixed bed reactors. Hermann et al. [7] studied dehydrogenation of ethylbenzene to styrene in a composite Pd/porous stainless steel membrane fixed bed reactor. A model was presented in which different types of diffusion were considered. After adjusting the kinetics available to 0255-2701/$ – see front matter © 2014 Elsevier B.V. All rights reserved. http://dx.doi.org/10.1016/j.cep.2013.12.009
-
Upload
khangminh22 -
Category
Documents
-
view
2 -
download
0
Transcript of Chemical Engineering and Processing

Hch
NSa
b
a
ARR1AA
KIDHHFE
1
ohatorp
atttbw
0h
Chemical Engineering and Processing 77 (2014) 50–65
Contents lists available at ScienceDirect
Chemical Engineering and Processing:Process Intensification
j ourna l ho me page: www.elsev ier .com/ locate /cep
eterogeneous modeling of an autothermal membrane reactoroupling dehydrogenation of ethylbenzene to styrene withydrogenation of nitrobenzene to aniline: Fickian diffusion model
abeel S. Abo-Ghandera, Filip Logistb, John R. Gracea,∗, Jan F.M. Van Impeb,aid S.E.H. Elnashaiea, C. Jim Lima
Chemical and Biochemical Engineering Department, University of British Columbia, Vancouver, Canada V6T 1Z3BioTeC and OPTEC, Chemical Engineering Department, KU Leuven, W. de Croylaan 46, B-3001 Leuven, Belgium
r t i c l e i n f o
rticle history:eceived 2 August 2012eceived in revised form7 December 2013ccepted 30 December 2013vailable online 18 January 2014
eywords:ntegrated catalytic membrane reactorehydrogenation
a b s t r a c t
Coupling of reactions in catalytic membrane reactors provides a route to process intensification. Dehy-drogenation of ethylbenzene and hydrogenation of nitrobenzene form a promising pair of processes tobe coupled in a membrane reactor. The heat released from the hydrogenation side is utilized to breakthe endothermality on the dehydrogenation side, while hydrogen produced on the dehydrogenation sidepermeates through the hydrogen-selective membranes, enhances the equilibrium conversion of ethyl-benzene and reacts with nitrobenzene on the permeate side to produce aniline. Mathematical reactormodels are excellent tools to evaluate the extent of improvement before experiments are set up. How-ever, a careful selection of phenomena considered by the reactor model is needed in order to obtainaccurate model predictions.
ydrogenationeterogeneous modelickian modelffectiveness factors
To investigate the effect of the intraparticle resistances on the performance of the cocurrent configura-tion of the coupling reactor, a heterogeneous fixed bed reactor model is developed with Fickian diffusioninside the catalyst pellets. For the condition of interest, the styrene yield is found to be 82% by the homoge-nous model, 73% by the heterogeneous model for isothermal pellets, and 69% by the heterogeneous modelwith non-isothermal pellets. Hence, the homogeneous model overestimates the yield by 5–15% of theiractual values.
. Introduction
Coupling of reactions in a single reactor can be very beneficial,ffering a number of advantages such as eliminating unnecessaryeat transfer units [1], reducing overall heat losses, cost savings [2]nd significant gains in yield and/or conversions due to shifting thehermodynamic equilibrium conversion by continuously removingne of the reaction products and supplying heat to the endothermiceactions [3]. As a result, these reactors are excellent examples ofrocess integration and intensification.
In the last two decades, a number of studies have appearedddressing the usefulness of reaction coupling. An interesting reac-ion for this purpose involves the dehydrogenation of ethylbenzeneo styrene. Abdalla and Elnashaie [4] developed a rigorous model
o describe the behavior of a membrane reactor in which ethyl-enzene was dehydrogenated to styrene. The dusty gas modelas used to describe the diffusion inside the catalyst pellets.∗ Corresponding author. Fax: +1 604 822 6003.E-mail address: [email protected] (J.R. Grace).
255-2701/$ – see front matter © 2014 Elsevier B.V. All rights reserved.ttp://dx.doi.org/10.1016/j.cep.2013.12.009
© 2014 Elsevier B.V. All rights reserved.
Later, this model was used to extract intrinsic kinetics from dataobtained from an industrial reactor and to investigate the potentialeconomic advantages of a hydrogen-selective membrane. It wasfound that a membrane reactor could considerably improve theethylbenzene conversion, and the yield and selectivity of styrene.Abdalla and Elnashaie [5] studied the effect of the sweep gas flowrates in a catalytic membrane reactor in which dehydrogenationof ethylbenzene to styrene took place. An appreciable enhance-ment in ethylbenzene conversion, styrene yield and selectivitywere observed in the proposed membrane reactor. Abdalla andElnashaie [6] proposed a fluidized bed with and without a selectivemembrane for dehydrogenating ethylbenzene to styrene. Differentdesign and operating parameters, i.e. bubble diameter, steam-to-ethylbenzene ratio, feed temperature, and number of fluidized bedsin series, were investigated. It was demonstrated that a carefulchoice of those parameters could improve the ethylbenzene con-version and styrene yield compared to industrial fixed bed reactors.
Hermann et al. [7] studied dehydrogenation of ethylbenzene tostyrene in a composite Pd/porous stainless steel membrane fixedbed reactor. A model was presented in which different types ofdiffusion were considered. After adjusting the kinetics available to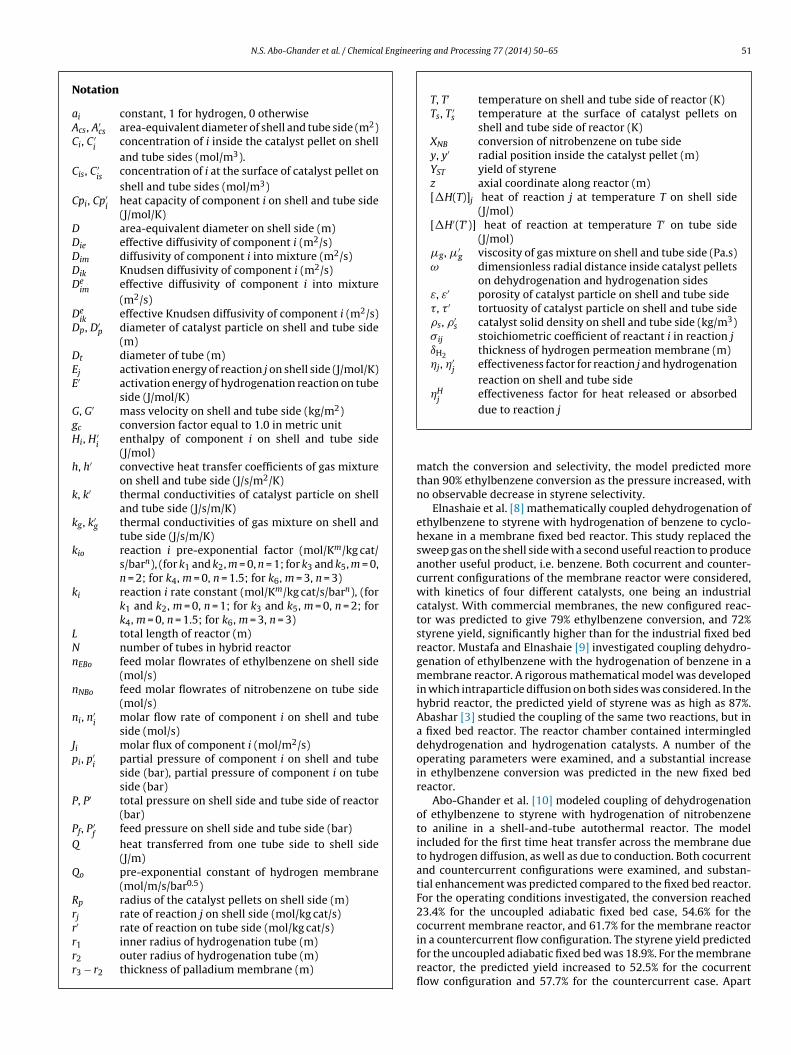
N.S. Abo-Ghander et al. / Chemical Engineering and Processing 77 (2014) 50–65 51
Notation
ai constant, 1 for hydrogen, 0 otherwiseAcs, A′
cs area-equivalent diameter of shell and tube side (m2)Ci, C ′
iconcentration of i inside the catalyst pellet on shelland tube sides (mol/m3).
Cis, C ′is
concentration of i at the surface of catalyst pellet onshell and tube sides (mol/m3)
Cpi, Cp′i
heat capacity of component i on shell and tube side(J/mol/K)
D area-equivalent diameter on shell side (m)Die effective diffusivity of component i (m2/s)Dim diffusivity of component i into mixture (m2/s)Dik Knudsen diffusivity of component i (m2/s)De
imeffective diffusivity of component i into mixture(m2/s)
Deik
effective Knudsen diffusivity of component i (m2/s)Dp, D′
p diameter of catalyst particle on shell and tube side(m)
Dt diameter of tube (m)Ej activation energy of reaction j on shell side (J/mol/K)E′ activation energy of hydrogenation reaction on tube
side (J/mol/K)G, G′ mass velocity on shell and tube side (kg/m2)gc conversion factor equal to 1.0 in metric unitHi, H′
ienthalpy of component i on shell and tube side(J/mol)
h, h′ convective heat transfer coefficients of gas mixtureon shell and tube side (J/s/m2/K)
k, k′ thermal conductivities of catalyst particle on shelland tube side (J/s/m/K)
kg, k′g thermal conductivities of gas mixture on shell and
tube side (J/s/m/K)kio reaction i pre-exponential factor (mol/Km/kg cat/
s/barn), (for k1 and k2, m = 0, n = 1; for k3 and k5, m = 0,n = 2; for k4, m = 0, n = 1.5; for k6, m = 3, n = 3)
ki reaction i rate constant (mol/Km/kg cat/s/barn), (fork1 and k2, m = 0, n = 1; for k3 and k5, m = 0, n = 2; fork4, m = 0, n = 1.5; for k6, m = 3, n = 3)
L total length of reactor (m)N number of tubes in hybrid reactornEBo feed molar flowrates of ethylbenzene on shell side
(mol/s)nNBo feed molar flowrates of nitrobenzene on tube side
(mol/s)ni, n′
imolar flow rate of component i on shell and tubeside (mol/s)
Ji molar flux of component i (mol/m2/s)pi, p′
ipartial pressure of component i on shell and tubeside (bar), partial pressure of component i on tubeside (bar)
P, P′ total pressure on shell side and tube side of reactor(bar)
Pf, P ′f
feed pressure on shell side and tube side (bar)Q heat transferred from one tube side to shell side
(J/m)Qo pre-exponential constant of hydrogen membrane
(mol/m/s/bar0.5)Rp radius of the catalyst pellets on shell side (m)rj rate of reaction j on shell side (mol/kg cat/s)r′ rate of reaction on tube side (mol/kg cat/s)
T, T′ temperature on shell and tube side of reactor (K)Ts, T ′
s temperature at the surface of catalyst pellets onshell and tube side of reactor (K)
XNB conversion of nitrobenzene on tube sidey, y′ radial position inside the catalyst pellet (m)YST yield of styrenez axial coordinate along reactor (m)[�H(T)]j heat of reaction j at temperature T on shell side
(J/mol)[�H′(T′)] heat of reaction at temperature T′ on tube side
(J/mol)�g, �′
g viscosity of gas mixture on shell and tube side (Pa.s)ω dimensionless radial distance inside catalyst pellets
on dehydrogenation and hydrogenation sidesε, ε′ porosity of catalyst particle on shell and tube side�, � ′ tortuosity of catalyst particle on shell and tube side�s, �′
s catalyst solid density on shell and tube side (kg/m3)�ij stoichiometric coefficient of reactant i in reaction jıH2 thickness of hydrogen permeation membrane (m)j, ′
jeffectiveness factor for reaction j and hydrogenationreaction on shell and tube side
Hj
effectiveness factor for heat released or absorbed
r1 inner radius of hydrogenation tube (m)r2 outer radius of hydrogenation tube (m)r3 − r2 thickness of palladium membrane (m)
due to reaction j
match the conversion and selectivity, the model predicted morethan 90% ethylbenzene conversion as the pressure increased, withno observable decrease in styrene selectivity.
Elnashaie et al. [8] mathematically coupled dehydrogenation ofethylbenzene to styrene with hydrogenation of benzene to cyclo-hexane in a membrane fixed bed reactor. This study replaced thesweep gas on the shell side with a second useful reaction to produceanother useful product, i.e. benzene. Both cocurrent and counter-current configurations of the membrane reactor were considered,with kinetics of four different catalysts, one being an industrialcatalyst. With commercial membranes, the new configured reac-tor was predicted to give 79% ethylbenzene conversion, and 72%styrene yield, significantly higher than for the industrial fixed bedreactor. Mustafa and Elnashaie [9] investigated coupling dehydro-genation of ethylbenzene with the hydrogenation of benzene in amembrane reactor. A rigorous mathematical model was developedin which intraparticle diffusion on both sides was considered. In thehybrid reactor, the predicted yield of styrene was as high as 87%.Abashar [3] studied the coupling of the same two reactions, but ina fixed bed reactor. The reactor chamber contained intermingleddehydrogenation and hydrogenation catalysts. A number of theoperating parameters were examined, and a substantial increasein ethylbenzene conversion was predicted in the new fixed bedreactor.
Abo-Ghander et al. [10] modeled coupling of dehydrogenationof ethylbenzene to styrene with hydrogenation of nitrobenzeneto aniline in a shell-and-tube autothermal reactor. The modelincluded for the first time heat transfer across the membrane dueto hydrogen diffusion, as well as due to conduction. Both cocurrentand countercurrent configurations were examined, and substan-tial enhancement was predicted compared to the fixed bed reactor.For the operating conditions investigated, the conversion reached23.4% for the uncoupled adiabatic fixed bed case, 54.6% for thecocurrent membrane reactor, and 61.7% for the membrane reactorin a countercurrent flow configuration. The styrene yield predicted
for the uncoupled adiabatic fixed bed was 18.9%. For the membranereactor, the predicted yield increased to 52.5% for the cocurrentflow configuration and 57.7% for the countercurrent case. Apart
5 gineering and Processing 77 (2014) 50–65
fco[
psolTtstpeszs
ribhtbdp
2
cdzp(
C
C
C
2
H
H
Tmph
pcpnTisd
C
2 N.S. Abo-Ghander et al. / Chemical En
rom membrane reactors, other forms and concepts of reactionoupling, such as coupling endothermic reactions with exothermicnes for efficient utilization of energy, have also been considered2,11–15].
These studies indicate that component effectiveness factors canlay a significant role for dehydrogenation of ethylbenzene totyrene in fixed bed reactors. As a result, the homogenous modelf Abo-Ghander et al. [10] should be adjusted to consider the cata-yst intraparticle diffusion on both sides of the membrane reactor.o achieve this aim, a model based on Fickian diffusion is used inhis paper to model diffusion inside the catalyst pellets on bothides of the membrane. This new model is then used: (i) to studyhe molar flow rates of selected key components and temperaturerofiles compared with those from the homogeneous model; (ii) tovaluate the performance of optimal reactor designs in terms of thetyrene yield on the dehydrogenation side, conversion of nitroben-ene on the hydrogenation side, and temperature profiles on bothides of the reactor.
The paper is structured as follows. Section 2 introduces theeactor configuration and presents the thermodynamic and kineticnformation of all relevant reactions. Section 3 elaborates on thealance equations for the gas and the catalyst phase. On both theydrogenation and the dehydrogenation side, mass balances forhe different reaction species, as well as the energy and momentumalances, are derived and suitable connection terms are added. Alsoetails about the computational procedure are provided. Section 4resents and discusses the simulation results.
. Reactor configuration
The configuration of interest is portrayed in Fig. 1. In the shellompartment packed with catalyst particles, ethylbenzene (EB) isehydrogenated to produce styrene (ST) as the main product; ben-ene (BZ), toluene (TO), ethylene and other light gases are sideroducts. The chemical equations representing the reactions aresee also Eqs. (1)–(6) in [10]):
6H5CH2CH3 ↔ C6H5CHCH2 + H2 �H298 = 117.6 kJ/mol (1)
6H5CH2CH3 → C6H6 + C2H4 �H298 = 105.4 kJ/mol (2)
6H5CH2CH3 + H2 → C6H5CH3 + CH4 �H298 = −54.6 kJ/mol
(3)
H2O + C2H4 → 2CO + 4H2 �H298 = 210.2 kJ/mol (4)
2O + CH4 → CO + 3H2 �H298 = 206.1 kJ/mol (5)
2O + CO → CO2 + H2 �H298 = −41.2 kJ/mol (6)
he first reaction in this network is the main reversible, endother-ic one. From Le Chatelier’s principle, the forward reaction, i.e.
roduction of styrene, is favored by operating at low pressure andigh temperature.
Hydrogen produced in this compartment diffuses throughalladium hydrogen-selective-membrane walls to the inside ofylindrical tubes extending along the reactor. The tube walls areermeable to hydrogen, with a layer of stainless steel of a thick-ess of 1.2 mm coated with a palladium layer of thickness 25 �m.he Palladium supported on palladium stainless steel membranes completely selective toward hydrogen permeation. On the tubeide, the diffused hydrogen reacts with nitrobenzene (NB) to pro-uce aniline (AN):
6H5NO2 + 3H2 → C6H5NH2 + 2H2O �H298 = −443.0 kJ/mol
(7)
Fig. 1. Schematic of the integrated membrane fixed bed reactor.
This reaction is irreversible and highly exothermic (see alsoEq. (7) in [10]). Abo-Ghander et al. [10] showed that couplingthese two reactions, i.e. dehydrogenation of ethylbenzene with thehydrogenation of nitrobenzene, could be very beneficial. Remov-ing hydrogen from the dehydrogenation side and providing heat tothe same side from the hydrogenation heat of reaction were pre-dicted to play very important roles in increasing the styrene yield.The external wall of the coupled reactor is treated as adiabatic, areasonable assumption due to the small surface area-to-volumeratio. Expressions for the rate of reactions and numerical values forthe pre-exponential constants and activation energies are listed inTables 1 and 2. Similar values can be found in Tables 1 and 2 of[10,20]. The shell side of this reactor is assumed to be packed withan iron oxide (Fe2O3) catalyst promoted with potassium carbonate
(K2CO3) and chromium oxide (Cr2O3) while the tube side is packedwith a palladium catalyst supported on an �-alumina carrier. In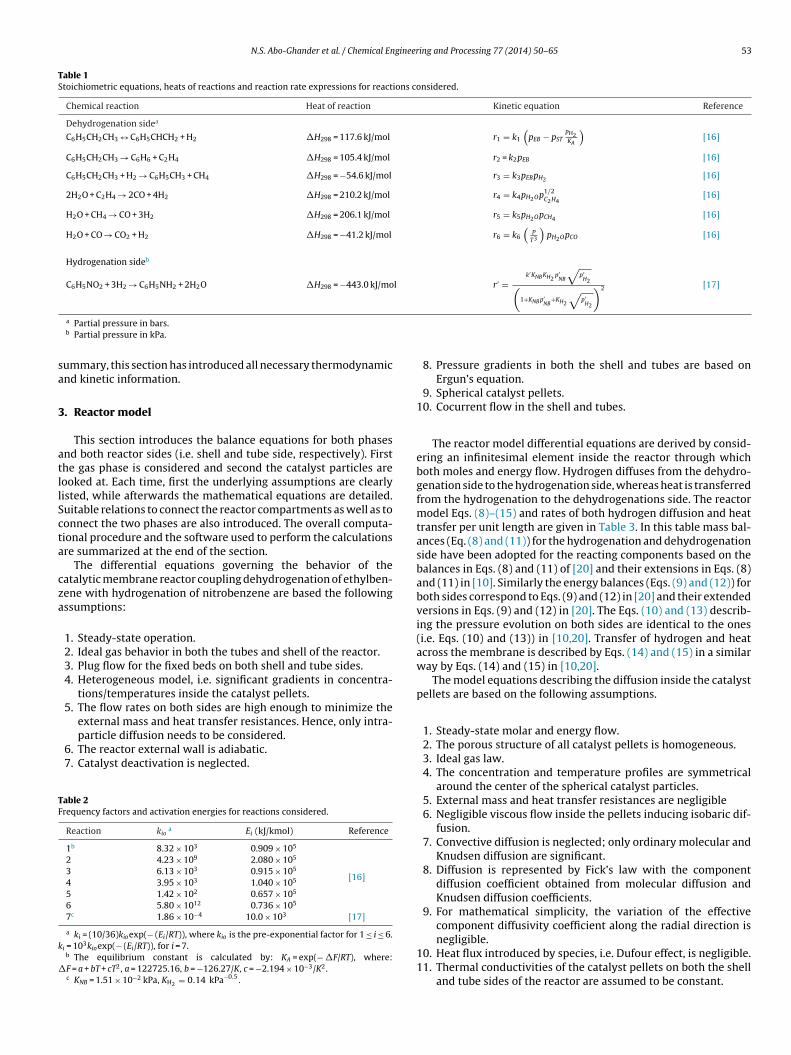
N.S. Abo-Ghander et al. / Chemical Engineering and Processing 77 (2014) 50–65 53
Table 1Stoichiometric equations, heats of reactions and reaction rate expressions for reactions considered.
Chemical reaction Heat of reaction Kinetic equation Reference
Dehydrogenation sidea
C6H5CH2CH3 ↔ C6H5CHCH2 + H2 �H298 = 117.6 kJ/mol r1 = k1
(pEB − pST
pH2KA
)[16]
C6H5CH2CH3 → C6H6 + C2H4 �H298 = 105.4 kJ/mol r2 = k2pEB [16]
C6H5CH2CH3 + H2 → C6H5CH3 + CH4 �H298 = −54.6 kJ/mol r3 = k3pEBpH2 [16]
2H2O + C2H4 → 2CO + 4H2 �H298 = 210.2 kJ/mol r4 = k4pH2Op1/2C2H4
[16]
H2O + CH4 → CO + 3H2 �H298 = 206.1 kJ/mol r5 = k5pH2OpCH4 [16]
H2O + CO → CO2 + H2 �H298 = −41.2 kJ/mol r6 = k6
(P
T3
)pH2OpCO [16]
Hydrogenation sideb
C6H5NO2 + 3H2 → C6H5NH2 + 2H2O �H298 = −443.0 kJ/mol r ′ =k′KNBKH2
p′NB
√p′
H2(1+KNBp′
NB+KH2
√p′
H2
)2 [17]
sa
3
atllScta
cza
TF
k
�
a Partial pressure in bars.b Partial pressure in kPa.
ummary, this section has introduced all necessary thermodynamicnd kinetic information.
. Reactor model
This section introduces the balance equations for both phasesnd both reactor sides (i.e. shell and tube side, respectively). Firsthe gas phase is considered and second the catalyst particles areooked at. Each time, first the underlying assumptions are clearlyisted, while afterwards the mathematical equations are detailed.uitable relations to connect the reactor compartments as well as toonnect the two phases are also introduced. The overall computa-ional procedure and the software used to perform the calculationsre summarized at the end of the section.
The differential equations governing the behavior of theatalytic membrane reactor coupling dehydrogenation of ethylben-ene with hydrogenation of nitrobenzene are based the followingssumptions:
1. Steady-state operation.2. Ideal gas behavior in both the tubes and shell of the reactor.3. Plug flow for the fixed beds on both shell and tube sides.4. Heterogeneous model, i.e. significant gradients in concentra-
tions/temperatures inside the catalyst pellets.5. The flow rates on both sides are high enough to minimize the
external mass and heat transfer resistances. Hence, only intra-particle diffusion needs to be considered.
6. The reactor external wall is adiabatic.7. Catalyst deactivation is neglected.
able 2requency factors and activation energies for reactions considered.
Reaction kioa Ei (kJ/kmol) Reference
1b 8.32 × 10³ 0.909 × 10⁵
[16]
2 4.23 × 10⁹ 2.080 × 10⁵
3 6.13 × 10³ 0.915 × 10⁵
4 3.95 × 10³ 1.040 × 10⁵
5 1.42 × 10² 0.657 × 10⁵
6 5.80 × 10¹² 0.736 × 10⁵
7c 1.86 × 10⁻⁴ 10.0 × 10³ [17]
a ki = (10/36)kioexp(− (Ei/RT)), where kio is the pre-exponential factor for 1 ≤ i ≤ 6.i = 103kioexp(− (Ei/RT)), for i = 7.b The equilibrium constant is calculated by: KA = exp(− �F/RT), where:F = a + bT + cT2, a = 122725.16, b = −126.27/K, c = −2.194 × 10⁻³/K2.c KNB = 1.51 × 10⁻² kPa, KH2 = 0.14 kPa−0.5.
8. Pressure gradients in both the shell and tubes are based onErgun’s equation.
9. Spherical catalyst pellets.10. Cocurrent flow in the shell and tubes.
The reactor model differential equations are derived by consid-ering an infinitesimal element inside the reactor through whichboth moles and energy flow. Hydrogen diffuses from the dehydro-genation side to the hydrogenation side, whereas heat is transferredfrom the hydrogenation to the dehydrogenations side. The reactormodel Eqs. (8)–(15) and rates of both hydrogen diffusion and heattransfer per unit length are given in Table 3. In this table mass bal-ances (Eq. (8) and (11)) for the hydrogenation and dehydrogenationside have been adopted for the reacting components based on thebalances in Eqs. (8) and (11) of [20] and their extensions in Eqs. (8)and (11) in [10]. Similarly the energy balances (Eqs. (9) and (12)) forboth sides correspond to Eqs. (9) and (12) in [20] and their extendedversions in Eqs. (9) and (12) in [20]. The Eqs. (10) and (13) describ-ing the pressure evolution on both sides are identical to the ones(i.e. Eqs. (10) and (13)) in [10,20]. Transfer of hydrogen and heatacross the membrane is described by Eqs. (14) and (15) in a similarway by Eqs. (14) and (15) in [10,20].
The model equations describing the diffusion inside the catalystpellets are based on the following assumptions.
1. Steady-state molar and energy flow.2. The porous structure of all catalyst pellets is homogeneous.3. Ideal gas law.4. The concentration and temperature profiles are symmetrical
around the center of the spherical catalyst particles.5. External mass and heat transfer resistances are negligible6. Negligible viscous flow inside the pellets inducing isobaric dif-
fusion.7. Convective diffusion is neglected; only ordinary molecular and
Knudsen diffusion are significant.8. Diffusion is represented by Fick’s law with the component
diffusion coefficient obtained from molecular diffusion andKnudsen diffusion coefficients.
9. For mathematical simplicity, the variation of the effectivecomponent diffusivity coefficient along the radial direction is
negligible.10. Heat flux introduced by species, i.e. Dufour effect, is negligible.11. Thermal conductivities of the catalyst pellets on both the shell
and tube sides of the reactor are assumed to be constant.

54 N.S. Abo-Ghander et al. / Chemical Engineering and Processing 77 (2014) 50–65
Table 3Model equations for coupled catalytic membrane reactor.
Balance equations Mathematical expressions
Dehydrogenation side
Moledni
dz=
∑6
j=1�ij
(3
∫ 1.0
0
rjω2dω
)(1 − ε)Acs�s − 2r3NaiJi (8)
EnergydT
dz=
∑6
j=1
(3∫ 1.0
0[−�H(T)]jrjω2dω
)(1 − ε)Acs�s + NQ∑10
i=1niCpi
(9)
PressuredP
dz= − G
�ggcDp
(1 − ε
ε3
)[150(1 − ε)�g
Dp+ 1.75G
](10)
Hydrogenation side
Moledn′
i
dz= �i
(3
∫ 1.0
0
r ′ω′2dω′
)(1 − ε′)A′
cs�′s + 2 r3aiJi (11)
EnergydT ′
dz=
(2 r3)∑i
i=1aiJi
∫ T
T ′ CpidT +(
3∫ 1.0
0[−�H′(T ′)] r ′ω′2dω′
)(1 − ε′)A′
cs�′s − Q∑4
i=1n′
iCp′
i
(12)
PressuredP ′
dz= − G′
�′ggcD′
p
(1 − ε′
ε′3
) [150(1 − ε′)�′
g
D′p
+ 1.75G′]
(13)
Diffusion of hydrogen across membrane JH2 = Qo exp(−EH2,P /RT)
ıH2
(√PH2 −
√P ′
H2
)(14)
where: Qo = 7.29 × 10⁻³ (mol × m)/(m2 × min × atm0.5), ıH2 = 25 × 10−6 m, EH2,P = 20.5 × 10³ J/mol
Heat transfer across membrane Q = 2 r1(T ′ − T)[(1/h′) + (r1/kss) ln (r2/r1) + (r1/kPd) ln (r3/r2) + (r1/r2h)]
(15)
where: kss = 22.88 W/m × K, kPd = 93.3 W/m × KhDtkg
= 0.813(
DpG�g
)0.9exp
(− 6Dp
Dt
)D′
pG′
�′g
)
iaai
h′D′t
k′g
= 3.50
(
To derive the catalyst model equations, a small spherical shellnside the catalyst pellets is considered across which both molesnd heat flow, as shown in Fig. 2. Applying the balance equations,nd expressing the molar flux using Fick’s law leads to the follow-ng.
Catalyst mole balance equation on dehydrogenation side:
d2Ci
dy2+ 2
y
dCi
dy= − 1
Die
6∑j=1
�ijrj� (16)
Fig. 2. Infinitesimal slice inside catalyst pellets on dehydrogenation side sh
0.7
exp
(− 4.6D′
p
D′t
)
Catalyst energy balance equation on dehydrogenation side:
d2T
dy2+ 2
y
dT
dy= 1
ke
6∑j=1
[�H(T)]jrj� (17)
Catalyst mole balance equation on hydrogenation side:
d2C ′i
dy′2 + 2y′
dC ′i
dy′ = −� ′ir′�′
D′ie
(18)
owing terms considered in: (a) mole balance, and (b) energy balance.
gineer
dtd
•
•
N.S. Abo-Ghander et al. / Chemical En
Catalyst energy balance equation on hydrogenation side:
d2T ′
dy′2 + 2y′
dT ′
dy′ = [�H(T)]′r′�′
k′e
(19)
These coupled equations form a split boundary value problemescribing the molar and energy flow inside the catalyst on bothhe dehydrogenation and hydrogenation sides. The boundary con-itions are:
Dehydrogenation side:
y = 0 ⇒
⎧⎪⎨⎪⎩
dCi
dy= 0
dT
dy= 0
(20)
y = Rp ⇒{
Ci = Cis
T = Ts
(21)
Hydrogenation side:⎧ ′
y′ = 0 ⇒⎪⎨⎪⎩
dCi
dy′ = 0
dT ′
dy′ = 0
(22)
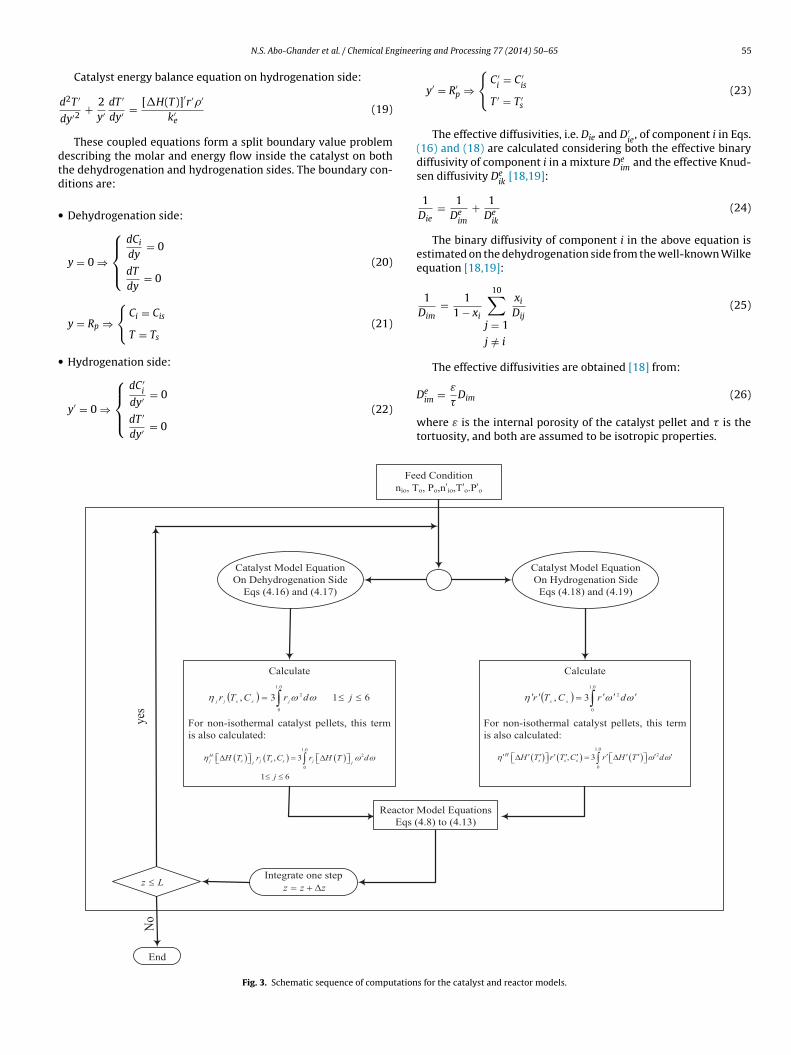
Fig. 3. Schematic sequence of computation
ing and Processing 77 (2014) 50–65 55
y′ = R′p ⇒
{C ′
i= C ′
is
T ′ = T ′s
(23)
The effective diffusivities, i.e. Die and D′ie
, of component i in Eqs.(16) and (18) are calculated considering both the effective binarydiffusivity of component i in a mixture De
imand the effective Knud-
sen diffusivity Deik
[18,19]:
1Die
= 1De
im
+ 1De
ik
(24)
The binary diffusivity of component i in the above equation isestimated on the dehydrogenation side from the well-known Wilkeequation [18,19]:
1Dim
= 11 − xi
10∑j = 1
j /= i
xi
Dij(25)
The effective diffusivities are obtained [18] from:
Deim = ε
�Dim (26)
where ε is the internal porosity of the catalyst pellet and � is thetortuosity, and both are assumed to be isotropic properties.
s for the catalyst and reactor models.

5 gineering and Processing 77 (2014) 50–65
aatcnot
wtib
ts
wgttm
sd
C
Y
msdm(uatgh(lsm
Table 4Dimensional and operating parameters for hybrid catalytic membrane reactor forbase case.
Parameter Value Units
Dimensional variablesNet diameter of the dehydrogenation side 1.95 mDiameter of the hydrogenation tube 3.5 × 10⁻² mTotal number of the hydrogenation tubes 1500 –Length of the reactor 4.0 m
Operating conditions (dehydrogenation side)Ethylbenzene 10.242 mol/sStyrene 0.1861 mol/sBenzene 0.0306 mol/sToluene 0.2444 mol/sSteam 125.86 mol/sTemperature 880.0 KPressure 2.5 barCatalyst density 2146.3 kg/m3
Catalyst thermal conductivity 0.3 J/m/sPore diameters 4800 × 10−10 mCatalyst porosity 0.35 –Catalyst tortuosity 4.0 –Bed voidage 0.48 –
Operating conditions per one tube (hydrogenation side)Nitrobenzene 0.003 mol/sSteam 0.008 mol/sTemperature 900.0 KPressure 1.0 barCatalyst density 1400 kg/m3
Catalyst thermal conductivity 0.05 J/m/sPore diameters 5000 × 10−10 mCatalyst porosity 0.40 –Catalyst tortuosity 4.0 –Bed voidage 0.46 –
Dimensionless Axial Distance
0.0 0.2 0.4 0.6 0.8 1.0
Con
vers
ion
of E
thyl
benz
ene
(XEB
)
0.0
0.2
0.4
0.6
0.8
1.0
0.0 0.2 0.4 0.6 0.8 1.0
Con
vers
ion
of N
itrob
enze
ne (X
NB
)
0.0
0.2
0.4
0.6
0.8
1.0
(a)
(b)
Pseudo-Homogeneous Model
Heterogeneous Model(Isothermal Case)
Heterogeneous Model(Nonisothermal Case)
Pseudo-Homogeneous Model
Heterogeneous Model(Nonisothermal Case)
Heterogeneous Model(Isothermal Case)
6 N.S. Abo-Ghander et al. / Chemical En
The numerical solution of model Eqs. (16)–(19) evaluates theverage reaction rates, as well as the average heat released orbsorbed due to reactions. Those values can be related to the reac-ion rates and heat released or absorbed at bulk conditions, i.e.oncentrations and temperature, through the concept of effective-ess factors, defined for chemical reactions as the ratio of the ratef reaction with pore resistance to the rate of reaction evaluated athe surface conditions:
j =∫ Rp
0rj�(4y2)dy
rj�(4/3R3p)
(27)
ith 1 ≤ j ≤ 6 for dehydrogenation side and j = 1 for hydrogena-ion side. When the dimensionless catalyst radius (ω = y/Rp) isntroduced into Eq. (27), the volume-averaged reaction rate cane formulated as:
jrj(Ts, Cis) = 3
∫ 1.0
0
rjω2dω (28)
For non-isothermal catalyst pellets, a thermal effectiveness fac-or, relating the actual heat released or absorbed to that at theurface conditions, can be defined as:
Hj [−�H(Ts)]rj(Ts, Cis) = 3
∫ 1.0
0
rj[−�H(T)]ω2dω (29)
Component effectiveness factors can be defined as:
i =
j∑j=1
�ij
∫ Rp
0rj�(4y2)dy
∑jj=1�ijrj(Ts, Cis)�(4/3R3
p)(30)
ith 1 ≤ j ≤ 6 for the dehydrogenation side and j = 1 for the hydro-enation side. Integral terms in Eqs. (27)–(30) are evaluated here byhe trapezoidal rule. Eqs. (28) and (29), representing the actual reac-ion rate and heat released or absorbed, are used to update reactor
odel Eqs. (8)–(13) in Table 3.The conversions of ethylbenzene and nitrobenzene on both
ides of the membrane reactor and component yields on the dehy-rogenation side are defined as:
onversions
⎧⎪⎨⎪⎩
XEB = nEBo − nEB
nEBoon Dehydrogenation Side
XNB = nNBo − nNB
nNBoon Hydrogenation Side
(31)
ields
⎧⎪⎪⎪⎪⎨⎪⎪⎪⎪⎩
YST = nST − nSTo
nEBo
YBZ = nBZ − nBZo
nEBo
YTO = nTO − nTOo
nEBo
(32)
The sequence of computations followed to link the reactorodel equations with the catalyst pellets model equations is shown
chematically in Fig. 3. The sequence starts by using the bulk con-itions to establish the boundary conditions to solve the catalystodel Eqs. (16) and (17) on the dehydrogenation side and (18) and
19) on the hydrogenation side. These numerical solutions are thensed to evaluate the molar and heat flux at the surface of the cat-lyst numerically by evaluating Eqs. (28) and (29), substituted inhe reactor model equations, i.e. (8)–(13), which can then be inte-rated one step forward. To compute exchange of hydrogen andeat between the hydrogenation and dehydrogenation side, Eqs.
14) and (15) are used. This procedure is repeated until the entireength of the reactor is covered. Hence, the complete model con-ists of Eqs. (8)–(19) and (28) and (29). Solving these equations asentioned above results in the simulations presented.Dimensionless Axial Distance
Fig. 4. Conversion of key components: (a) ethylbenzene on dehydrogenation side,and (b) nitrobenzene on hydrogenation side.

N.S. Abo-Ghander et al. / Chemical Engineering and Processing 77 (2014) 50–65 57
Dimensionless Axial Distance
0.0 0.2 0.4 0.6 0.8 1.0
Styr
ene
Yie
ld (Y
ST)
0.0
0.2
0.4
0.6
0.8
1.0
Dimensionless Axial Distance
0.0 0.2 0.4 0.6 0.8 1.0
Ben
zene
Yie
ld (Y
BZ) x
102
0.0
1.0
2.0
3.0
4.0
5.0
6.0
Dimensionless Axial Distance
0.0 0.2 0.4 0.6 0.8 1.0
Tol
uene
Yie
ld (Y
TO) x
102
0.0
0.2
0.4
0.6
0.8
1.0
1.2
(c)
(a) (b)
Pseudo-Homogeneous ModelPseudo-Homogeneous Model
Pseudo-Homogeneous Model
Heterogeneous Model(Isothermal Case)
Heterogeneous Model(Isothermal Case)
Heterogeneous Model(Isothermal Case)
Heterogeneous Model(Non-isothermal Case)
Heterogeneous Model(Non-isothermal Case)
Heterogeneous Model(Non-isothermal Case)
e, and
Nsrt
4
teczfflo2d
v(ccfethe
Fig. 5. Yield of: (a) styrene, (b) benzen
In this computational sequence, two Matlab® (The MathWorks,atick) subroutines are invoked. The catalyst model equations are
olved by bvp4c, with a relative tolerance of 1 × 10⁻⁴, while theeactor model equations are integrated by ode15s, with a relativeolerance of 1 × 10⁻⁸.
. Results and discussion
This section presents and discusses the numerical results whenhe model developed in the previous sections is employed. Theffect of the intraparticle diffusion on the performance of theatalytic membrane reactor coupling dehydrogenation of ethylben-ene with hydrogenation of nitrobenzene to aniline was simulatedor the operating conditions listed in Table 4. The component molarow rates and feed pressure on the dehydrogenation side are basedn industrial fixed bed reactors. A feed temperature difference of0 K is chosen to ensure that heat always transfers in the rightirection from the hydrogenation to the dehydrogenation side.
In the following sub-sections, the predictions of several reactorariables are compared and discussed based on three models, i.e.i) homogeneous model, (ii) heterogeneous model with isothermalatalyst pellets, and (iii) heterogeneous model with non-isothermalatalyst pellets. For the homogeneous model, the effect of dif-usional intrusion was neglected and the reaction rates were
valuated at the bulk conditions on both sides of the reactor. Forhe heterogeneous reactor model with isothermal catalyst pellets,owever, the diffusional model Eqs. (16) and (18) were solved tovaluate the actual reaction rates and net heat liberated due to(c) toluene on dehydrogenation side.
reactions from Eqs. (28) and (29). In the heterogeneous modelwith nonisothermal catalyst pellets, Eqs. (16) and (17) on thedehydrogenation side and (18) and (19) on the hydrogenationside were considered to evaluate the actual reaction rate andheat due to reactions on both sides of the reactor using againEqs. (28) and (29).
4.1. Conversion of ethylbenzene and nitrobenzene
The conversion of (i) ethylbenzene on the dehydrogenation sideand of (ii) nitrobenzene on the hydrogenation side are plottedversus the dimensionless distance along the reactor in Fig. 4a andb for the homogeneous and heterogeneous model with isother-mal and non-isothermal catalyst pellets. In Fig. 4a, the conversionof ethylbenzene on the dehydrogenation side of the catalyticmembrane reactor increases monotonically along the catalyticmembrane reactor due to the consumption of ethylbenzene. For theselected operating and design conditions, the homogeneous modelpredicts an ethylbenzene conversion of ∼88%. When the effectof intraparticle diffusion is included, the ethylbenzene conversionpredicted by the heterogeneous model is significantly lower, ∼78%for isothermal pellets and ∼71% for non-isothermal pellets.
Conversion of nitrobenzene on the hydrogenation side of thecatalytic membrane reactor in Fig. 4b shows similar behavior to that
of ethylbenzene, i.e. it increases monotonically along the reactor. Itis predicted to reach ∼68% by the homogenous model, ∼59% by theheterogeneous model for isothermal catalyst pellets, and ∼52% bythe heterogeneous model for non-isothermal pellets.
58 N.S. Abo-Ghander et al. / Chemical Engineering and Processing 77 (2014) 50–65
Dimensionless Axial Distance
0.0 0.2 0.4 0.6 0.8 1.0
Hyd
roge
n M
olar
Fow
rate
on
D
ehyd
roge
natio
n Si
de (m
oles
/s)
0.0
0.2
0.4
0.6
0.8
1.0
1.2
Pseudo-Homogeneous Model
Heterogeneous Model(Isothermal Case)
Heterogeneous Model(Non-isothermal Case)
Dimensionless Axial Distance
0.0 0.2 0.4 0.6 0.8 1.0
Hyd
roge
n M
olar
Fow
rate
on
H
ydro
gena
tion
Side
(mol
es/s
)x 1
04
0.0
0.5
1.0
1.5
2.0
2.5
Heterogeneous Model(Non-isothermal Case)
Heterogeneous Model(Isothermal Case)
Pseudo-Homogeneous Model
(a)
(b)
Ft
4s
titmooown
4h
mtflnfiistcbin
Dimensionless Axial Distance
0.0 0.2 0.4 0.6 0.8 1.0
Tem
pera
ture
on
D
ehyd
roge
natio
n Si
de (K
)
850
860
870
880
890
900
910
920
0.0 0.2 0.4 0.6 0.8 1.0
Tem
pera
ture
on
H
ydro
gena
tion
Side
(K)
880
900
920
940
960
980
1000
1020
Heterogeneous Model(Non-isothermal Case)
Heterogeneous Model(Non-isothermal Case)
Heterogeneous Model(Isothermal Case)
Pseudo-Homogeneous Model
Pseudo-Homogeneous Model
Heterogeneous Model(Isothermal Case)
(a)
(b)
ig. 6. Hydrogen molar flowrates on: (a) dehydrogenation side, and (b) hydrogena-ion side.
.2. Yield of styrene, benzene, and toluene on dehydrogenationide
Fig. 5a–c, plot the yields of styrene, benzene, and toluene versushe dimensionless axial distance along the reactor. All three yieldsncrease along the reactor, with appreciable differences in predic-ion among the models. The homogeneous model for the catalytic
embrane reactor predicts a styrene yield of ∼82%, a benzene yieldf ∼5.0%, and a toluene yield of ∼1.0%. The heterogeneous model,n the other hand, predicts a styrene yield of ∼73%, a benzene yieldf ∼4.6%, and a toluene yield of ∼0.8% for isothermal catalyst pelletshile it predicts corresponding yields of ∼69%, ∼3.2% and ∼0.6% foron-isothermal pellets.
.3. Hydrogen molar flow rates on the dehydrogenation andydrogenation sides
The molar flow rates of hydrogen on both sides of the catalyticembrane reactor are plotted versus the dimensionless axial dis-
ance in Fig. 6a and b. As shown in Fig. 6a, the hydrogen molarow rate on the dehydrogenation side predicted by both homoge-ous and heterogeneous models increases monotonically in therst portion of the reactor fraction length until it reaches a max-
mum where the rate of hydrogen diffusion to the hydrogenationide is balanced by the hydrogen net production due to the reac-ions. After that, the hydrogen molar flow rate continues at a nearly
onstant level to the reactor exit. The hydrogen flow rate predictedy the heterogeneous model for the non-isothermal catalyst pelletss significantly lower than that predicted by either the homoge-ous model or the heterogeneous model with isothermal catalyst
Dimensionless Axial Distance
Fig. 7. Temperature profiles on: (a) dehydrogenation side, and (b) hydrogenation.
pellets, due to the significant effect of temperature. This gives astrong indication of the significance of intraparticle heat resistancein retarding the chemical reactions and the diffusion through themembranes.
The molar flow rate of the diffused hydrogen toward thehydrogenation tubes is plotted in Fig. 6b as a function of the dimen-sionless axial distance. All three models predict monotonicallyincreasing profiles, with a significant difference for the heteroge-neous model with non-isothermal catalyst pellets. At the reactorentrance, the homogenous model and the heterogeneous modelfor the isothermal catalyst pellets give similar predictions over 40%of the reactor length, with a somewhat higher subsequent value forthe heterogeneous model with isothermal catalyst pellets, resultingfrom a higher hydrogen diffusion rate compared to that predictedby the homogenous model. The difference in the predictions ofthese two models becomes more pronounced as the reactor exitis approached. The prediction of the heterogeneous model for thenon-isothermal case is considerably lower than for the other twomodels due to the temperature gradient inside the catalyst pellets.
4.4. Temperature profiles along coupled reactor
Temperature profiles along the reactor on both the shell andtube sides are plotted in Fig. 7a and b. In Fig. 7a, the temperature onthe dehydrogenation side decreases over the first 15% of the reac-tor length due to the net endothermic heat of the reaction. A point
is then reached where the heat lost is balanced by the heat gainedfrom the hydrogenation side. Given the large temperature differ-ence established between the two sides of the integrated reactor,the temperature on the shell side then increases over the reminder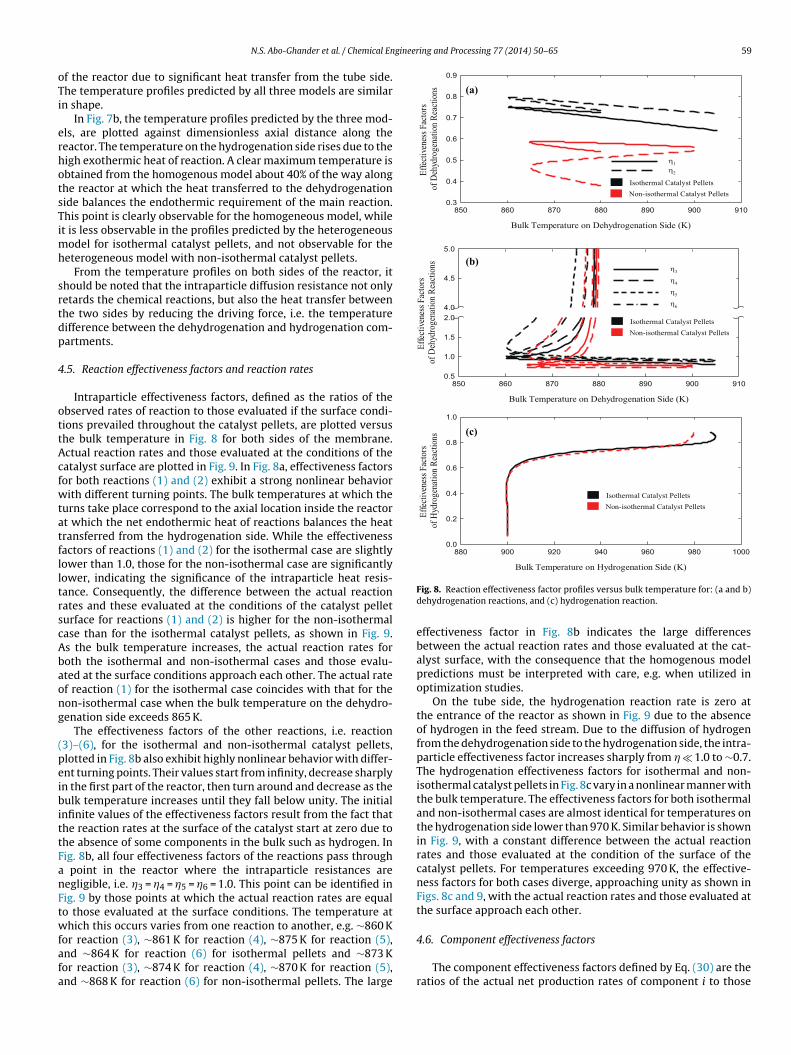
gineering and Processing 77 (2014) 50–65 59
oTi
erhotsTimh
srtdp
4
ottAcfwtatflltrscAbaong
(peibittFanFtwfafa
(a)
(b)
(c)
N.S. Abo-Ghander et al. / Chemical En
f the reactor due to significant heat transfer from the tube side.he temperature profiles predicted by all three models are similarn shape.
In Fig. 7b, the temperature profiles predicted by the three mod-ls, are plotted against dimensionless axial distance along theeactor. The temperature on the hydrogenation side rises due to theigh exothermic heat of reaction. A clear maximum temperature isbtained from the homogenous model about 40% of the way alonghe reactor at which the heat transferred to the dehydrogenationide balances the endothermic requirement of the main reaction.his point is clearly observable for the homogeneous model, whilet is less observable in the profiles predicted by the heterogeneous
odel for isothermal catalyst pellets, and not observable for theeterogeneous model with non-isothermal catalyst pellets.
From the temperature profiles on both sides of the reactor, ithould be noted that the intraparticle diffusion resistance not onlyetards the chemical reactions, but also the heat transfer betweenhe two sides by reducing the driving force, i.e. the temperatureifference between the dehydrogenation and hydrogenation com-artments.
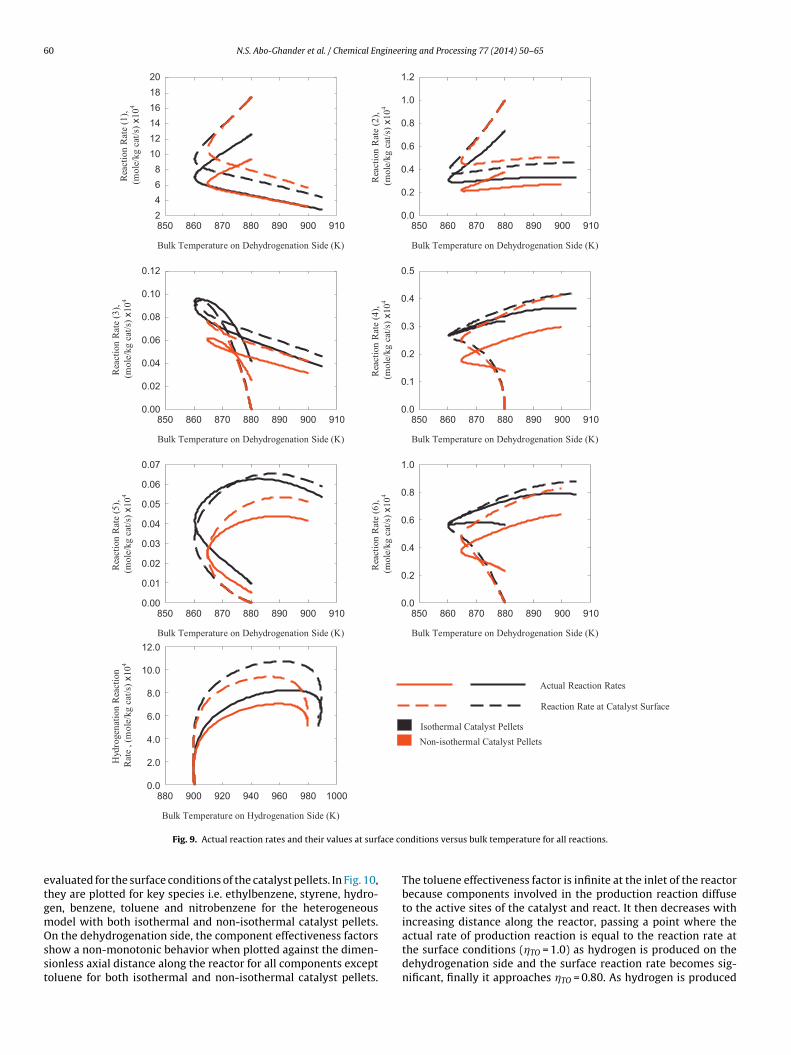
.5. Reaction effectiveness factors and reaction rates
Intraparticle effectiveness factors, defined as the ratios of thebserved rates of reaction to those evaluated if the surface condi-ions prevailed throughout the catalyst pellets, are plotted versushe bulk temperature in Fig. 8 for both sides of the membrane.ctual reaction rates and those evaluated at the conditions of theatalyst surface are plotted in Fig. 9. In Fig. 8a, effectiveness factorsor both reactions (1) and (2) exhibit a strong nonlinear behaviorith different turning points. The bulk temperatures at which the
urns take place correspond to the axial location inside the reactort which the net endothermic heat of reactions balances the heatransferred from the hydrogenation side. While the effectivenessactors of reactions (1) and (2) for the isothermal case are slightlyower than 1.0, those for the non-isothermal case are significantlyower, indicating the significance of the intraparticle heat resis-ance. Consequently, the difference between the actual reactionates and these evaluated at the conditions of the catalyst pelleturface for reactions (1) and (2) is higher for the non-isothermalase than for the isothermal catalyst pellets, as shown in Fig. 9.s the bulk temperature increases, the actual reaction rates foroth the isothermal and non-isothermal cases and those evalu-ted at the surface conditions approach each other. The actual ratef reaction (1) for the isothermal case coincides with that for theon-isothermal case when the bulk temperature on the dehydro-enation side exceeds 865 K.
The effectiveness factors of the other reactions, i.e. reaction3)–(6), for the isothermal and non-isothermal catalyst pellets,lotted in Fig. 8b also exhibit highly nonlinear behavior with differ-nt turning points. Their values start from infinity, decrease sharplyn the first part of the reactor, then turn around and decrease as theulk temperature increases until they fall below unity. The initial
nfinite values of the effectiveness factors result from the fact thathe reaction rates at the surface of the catalyst start at zero due tohe absence of some components in the bulk such as hydrogen. Inig. 8b, all four effectiveness factors of the reactions pass through
point in the reactor where the intraparticle resistances areegligible, i.e. 3 = 4 = 5 = 6 = 1.0. This point can be identified inig. 9 by those points at which the actual reaction rates are equalo those evaluated at the surface conditions. The temperature athich this occurs varies from one reaction to another, e.g. ∼860 K
or reaction (3), ∼861 K for reaction (4), ∼875 K for reaction (5),nd ∼864 K for reaction (6) for isothermal pellets and ∼873 Kor reaction (3), ∼874 K for reaction (4), ∼870 K for reaction (5),nd ∼868 K for reaction (6) for non-isothermal pellets. The large
Fig. 8. Reaction effectiveness factor profiles versus bulk temperature for: (a and b)dehydrogenation reactions, and (c) hydrogenation reaction.
effectiveness factor in Fig. 8b indicates the large differencesbetween the actual reaction rates and those evaluated at the cat-alyst surface, with the consequence that the homogenous modelpredictions must be interpreted with care, e.g. when utilized inoptimization studies.
On the tube side, the hydrogenation reaction rate is zero atthe entrance of the reactor as shown in Fig. 9 due to the absenceof hydrogen in the feed stream. Due to the diffusion of hydrogenfrom the dehydrogenation side to the hydrogenation side, the intra-particle effectiveness factor increases sharply from 1.0 to ∼0.7.The hydrogenation effectiveness factors for isothermal and non-isothermal catalyst pellets in Fig. 8c vary in a nonlinear manner withthe bulk temperature. The effectiveness factors for both isothermaland non-isothermal cases are almost identical for temperatures onthe hydrogenation side lower than 970 K. Similar behavior is shownin Fig. 9, with a constant difference between the actual reactionrates and those evaluated at the condition of the surface of thecatalyst pellets. For temperatures exceeding 970 K, the effective-ness factors for both cases diverge, approaching unity as shown inFigs. 8c and 9, with the actual reaction rates and those evaluated atthe surface approach each other.
4.6. Component effectiveness factors
The component effectiveness factors defined by Eq. (30) are theratios of the actual net production rates of component i to those
60 N.S. Abo-Ghander et al. / Chemical Engineering and Processing 77 (2014) 50–65
Bulk Temperature on Dehydrogenation Side (K)
850 860 870 880 890 900 910
Rea
ctio
n R
ate
(1),
(mol
e/kg
cat
/s) x
104
2
4
6
8
10
12
14
16
18
20
Bulk Temperature on Dehydrogenation Side (K )
850 860 870 880 890 900 910
Rea
ctio
n R
ate
(2),
(mol
e/kg
cat
/s) x
104
0.0
0.2
0.4
0.6
0.8
1.0
1.2
Bulk Temperature on Dehydrogenation Side (K)
850 860 870 880 890 900 910
Rea
ctio
n R
ate
(3),
(mol
e/kg
cat
/s) x
104
0.00
0.02
0.04
0.06
0.08
0.10
0.12
Bulk Temperature on Dehydrogenation Side (K )
850 860 870 880 890 900 910
Rea
ctio
n R
ate
(4),
(mol
e/kg
cat
/s) x
104
0.0
0.1
0.2
0.3
0.4
0.5
Bulk Temperature on Dehydrogenation Side (K)
850 860 870 880 890 900 910
Rea
ctio
n R
ate
(5),
(mol
e/kg
cat
/s) x
104
0.00
0.01
0.02
0.03
0.04
0.05
0.06
0.07
Bulk Temperature on Dehydrogenation Side (K )
850 860 870 880 890 900 910
Rea
ctio
n R
ate
(6),
(mol
e/kg
cat
/s) x
104
0.0
0.2
0.4
0.6
0.8
1.0
Bulk Temperature on Hydrogenation Side (K)
880 900 920 940 960 980 1000
Hyd
roge
natio
n R
eact
ion
Rat
e , (
mol
e/kg
cat
/s) x
104
0.0
2.0
4.0
6.0
8.0
10.0
12.0
Actual Reac tion Rate s
Reaction Rate at Catalyst Surface
Isothermal Catalyst PelletsNon-isothermal Catalyst Pellets
ace co
etgmOsst
Fig. 9. Actual reaction rates and their values at surf
valuated for the surface conditions of the catalyst pellets. In Fig. 10,hey are plotted for key species i.e. ethylbenzene, styrene, hydro-en, benzene, toluene and nitrobenzene for the heterogeneousodel with both isothermal and non-isothermal catalyst pellets.
n the dehydrogenation side, the component effectiveness factorshow a non-monotonic behavior when plotted against the dimen-ionless axial distance along the reactor for all components exceptoluene for both isothermal and non-isothermal catalyst pellets.
nditions versus bulk temperature for all reactions.
The toluene effectiveness factor is infinite at the inlet of the reactorbecause components involved in the production reaction diffuseto the active sites of the catalyst and react. It then decreases withincreasing distance along the reactor, passing a point where the
actual rate of production reaction is equal to the reaction rate atthe surface conditions (TO = 1.0) as hydrogen is produced on thedehydrogenation side and the surface reaction rate becomes sig-nificant, finally it approaches TO = 0.80. As hydrogen is produced
N.S. Abo-Ghander et al. / Chemical Engineering and Processing 77 (2014) 50–65 61
Ffs
ienm
stuhadaii
4c
paatt
fttno
Dimensionless Radial Distance,
0.0 0.2 0. 4 0.6 0. 8 1.0
Te
mp
era
ture
(K)
800
820
840
860
880
900
Dimensionless Radial Distance,
0.0 0.2 0. 4 0.6 0. 8 1.0
Hyd
roge
n M
ole
Frac
tion
0.002
0.004
0.006
0.008
0.010
0.012
~ 0.8
~ 0.1
~ 0.5
Dimensionless Radial Distance,
0.0 0.2 0. 4 0.6 0. 8 1.0
Ethy
lben
zene
Mol
e Fr
actio
n
0.00
0.01
0.02
0.03
0.04
0.05
0.06
0.07
~ 0.1 ~ 0.5
~ 0.8
~ 0.8
~ 0.5
~ 0.1
(a)
(b)
(c)
Isothermal CaseNonisothermal Case
ig. 10. Component effectiveness factor profiles versus dimensionless axial distanceor: (a) ethylbenzene, styrene, hydrogen, benzene, and toluene on dehydrogenationide; and (b) nitrobenzene on hydrogenation side.
n the bulk, the toluene effectiveness factor drops sharply. In gen-ral, the component effectiveness factors reflect the fact that theet production rates of the components from the homogeneousodel are not as accurate as from the heterogeneous models.The nitrobenzene effectiveness factors on the hydrogenation
ide for both isothermal and non-isothermal catalyst pellets plot-ed in Fig. 10b behave in a similar manner. They are mathematicallyndefined at the inlet point of the rector, due to the absence ofydrogen in the compartment, making both the diffusion to the cat-lyst active sites as well as reaction at the surface zero. As hydrogeniffuses to the hydrogenation compartment though the membrane,
sharp increase is observed in both effectiveness factors, head-ng toward 1.0. Note that the differences between both factors forsothermal and non-isothermal catalyst pellets are negligible.
.7. Behavior inside the catalyst pellets on both sides of theoupled reactor
In Fig. 11, the intraparticle mole fractions, temperature and com-onent effective diffusivity profiles on the dehydrogenation sidere plotted at three axial positions, i.e. z/L = 0.1, 0.5, and 0.8. Thebscissa in Fig. 11 is interpreted as the dimensionless radial dis-ance inside the catalyst pellet, i.e. ω = 0.0 represents the center ofhe catalyst pellet, while ω = 1.0 indicates its surface.
As can be seen, the ethylbenzene mole fraction at the pellet sur-ace decreases as the fractional length increases from 0.1 (close to
he inlet of the reactor) to 0.8 (close to the exit) due to the consump-ion in the bulk. Although the profiles for the other components areot presented for brevity, it has been observed that the productionf these, i.e. hydrogen, benzene, and toluene, are limited. The moleFig. 11. Intraparticle profiles of ethylbenzene and hydrogen mole fractions, andtemperature at fractional lengths of 0.1, 0.5, and 0.80 for both the isothermal andnon-isothermal catalyst pellet cases on dehydrogenation side.
fraction of hydrogen on the surface of the catalyst pellet is less than0.01 due to diffusion through the membrane to the hydrogenationside.
The thermal resistance inside the catalyst pellet is detrimental asit reduces the production of all components inside the catalyst par-ticles. The drop in temperature inside the catalyst pellet decreasesfrom ∼50 K at z/L = 0.1 to ∼25 K at z/L = 0.8. This is because at theinlet of the reactor, the mole fractions of the reactants are highat the catalyst surface, while this is no longer the case when thereactor exit is approached.
Hydrogen has the highest effective diffusivities inside the cat-alyst pellet because of its small molecular size. As a consequence
for the heat transferred from the tube side to the shell side, thediffusivities increase with the distance along the reactor. Insidethe catalyst, however, hydrogen diffusivity decreases as the cen-ter of the particle is approached due to the drop in temperature.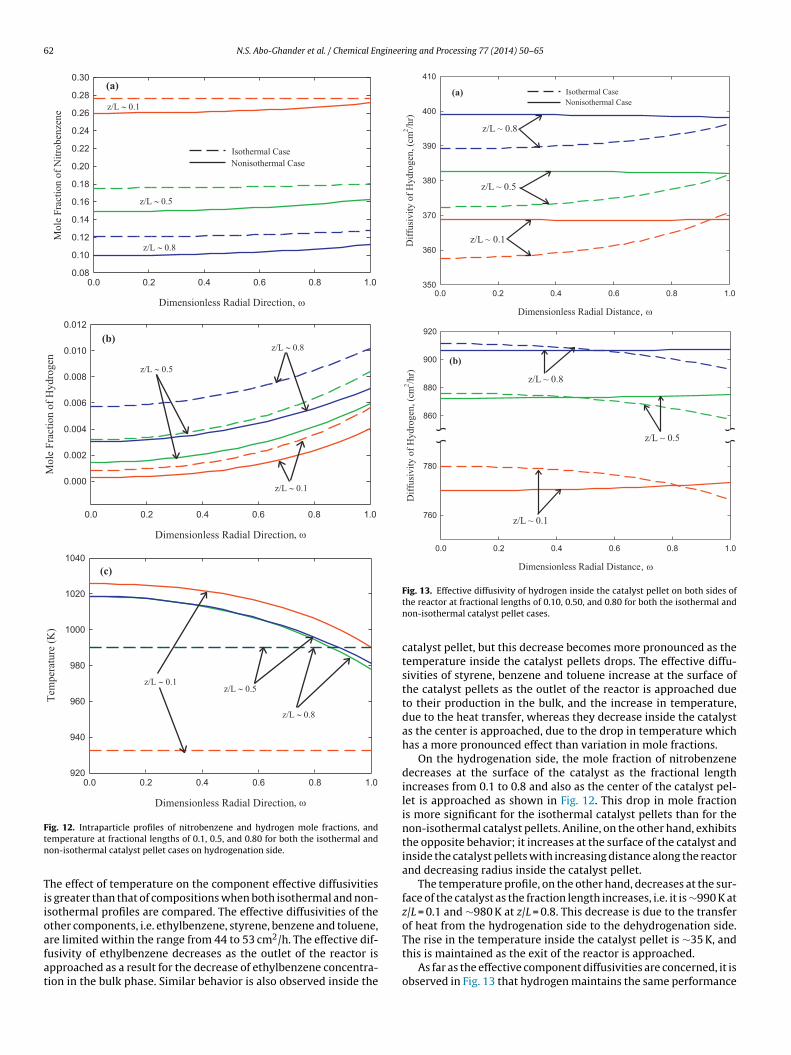
62 N.S. Abo-Ghander et al. / Chemical Engineering and Processing 77 (2014) 50–65
Dimensionless Radial Direction,
0.0 0.2 0. 4 0.6 0. 8 1.0
Mol
e Fr
actio
n of
Hyd
roge
n
0.000
0.002
0.004
0.006
0.008
0.010
0.012
Dimensionless Radial Direction,
0.0 0.2 0. 4 0.6 0. 8 1.0
Tem
pera
ture
(K)
920
940
960
980
1000
1020
1040
Dimensionless Radial Direction,
0.0 0.2 0.4 0.6 0.8 1.0
Mol
e Fr
actio
n of
Nitr
oben
zene
0.08
0.10
0.12
0.14
0.16
0.18
0.20
0.22
0.24
0.26
0.28
0.30
z/L
z/L
z/L
Isothermal CaseNonisothermal Case
z/L
z/Lz/L
z/L
z/L
z/L
(a)
(b)
(c)
Ftn
Tiioafat
Dimensionless Radial Distance,
0.0 0.2 0. 4 0.6 0. 8 1.0
Diff
usiv
ity o
f Hyd
roge
n, (c
m2 /h
r)
760
780
860
880
900
920
Dimensionless Radial Distance,
0.0 0.2 0. 4 0.6 0. 8 1.0
Diff
usiv
ity o
f Hyd
roge
n, (c
m2 /h
r)
350
360
370
380
390
400
410
z/L ~ 0.1
z/L ~ 0.5
z/L ~ 0.8
z/L ~ 0.1
z/L ~ 0.5
z/L ~ 0.8
(a)
(b)
Isothermal CaseNonisothermal Case
ig. 12. Intraparticle profiles of nitrobenzene and hydrogen mole fractions, andemperature at fractional lengths of 0.1, 0.5, and 0.80 for both the isothermal andon-isothermal catalyst pellet cases on hydrogenation side.
he effect of temperature on the component effective diffusivitiess greater than that of compositions when both isothermal and non-sothermal profiles are compared. The effective diffusivities of thether components, i.e. ethylbenzene, styrene, benzene and toluene,
2
re limited within the range from 44 to 53 cm /h. The effective dif-usivity of ethylbenzene decreases as the outlet of the reactor ispproached as a result for the decrease of ethylbenzene concentra-ion in the bulk phase. Similar behavior is also observed inside theFig. 13. Effective diffusivity of hydrogen inside the catalyst pellet on both sides ofthe reactor at fractional lengths of 0.10, 0.50, and 0.80 for both the isothermal andnon-isothermal catalyst pellet cases.
catalyst pellet, but this decrease becomes more pronounced as thetemperature inside the catalyst pellets drops. The effective diffu-sivities of styrene, benzene and toluene increase at the surface ofthe catalyst pellets as the outlet of the reactor is approached dueto their production in the bulk, and the increase in temperature,due to the heat transfer, whereas they decrease inside the catalystas the center is approached, due to the drop in temperature whichhas a more pronounced effect than variation in mole fractions.
On the hydrogenation side, the mole fraction of nitrobenzenedecreases at the surface of the catalyst as the fractional lengthincreases from 0.1 to 0.8 and also as the center of the catalyst pel-let is approached as shown in Fig. 12. This drop in mole fractionis more significant for the isothermal catalyst pellets than for thenon-isothermal catalyst pellets. Aniline, on the other hand, exhibitsthe opposite behavior; it increases at the surface of the catalyst andinside the catalyst pellets with increasing distance along the reactorand decreasing radius inside the catalyst pellet.
The temperature profile, on the other hand, decreases at the sur-face of the catalyst as the fraction length increases, i.e. it is ∼990 K atz/L = 0.1 and ∼980 K at z/L = 0.8. This decrease is due to the transferof heat from the hydrogenation side to the dehydrogenation side.
The rise in the temperature inside the catalyst pellet is ∼35 K, andthis is maintained as the exit of the reactor is approached.As far as the effective component diffusivities are concerned, it isobserved in Fig. 13 that hydrogen maintains the same performance
N.S. Abo-Ghander et al. / Chemical Engineering and Processing 77 (2014) 50–65 63
F optims
ddscatabitacla
4o
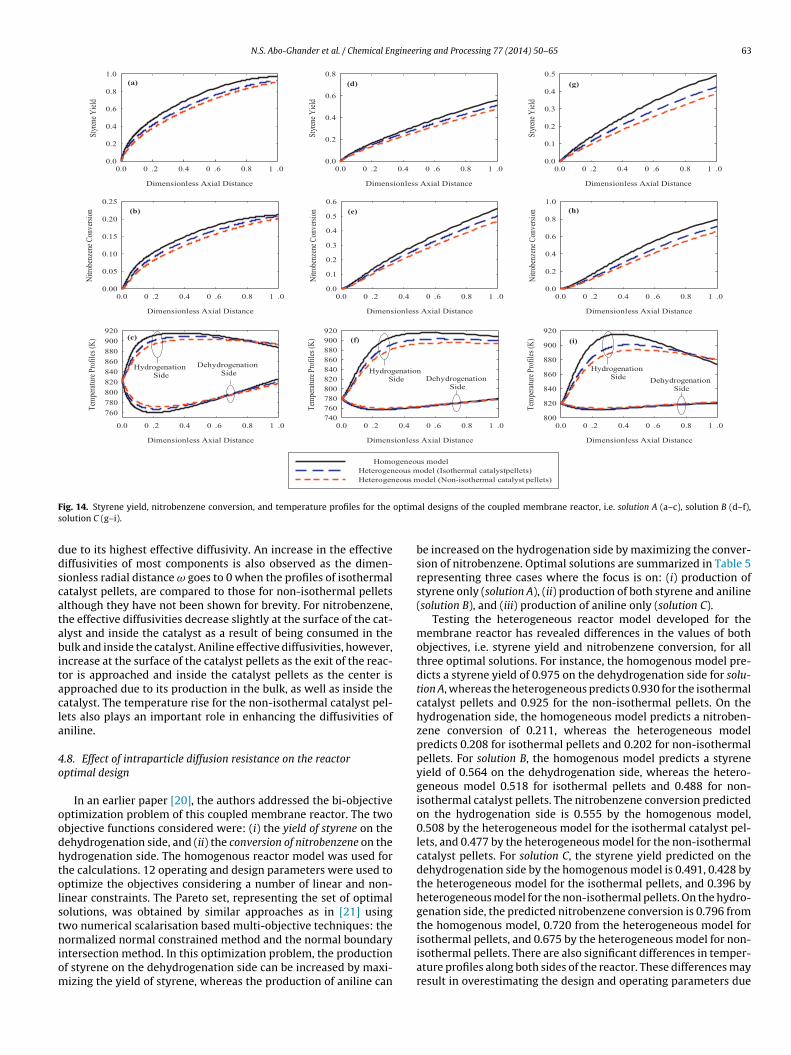
oodhtolstniom
ig. 14. Styrene yield, nitrobenzene conversion, and temperature profiles for the
olution C (g–i).
ue to its highest effective diffusivity. An increase in the effectiveiffusivities of most components is also observed as the dimen-ionless radial distance ω goes to 0 when the profiles of isothermalatalyst pellets, are compared to those for non-isothermal pelletslthough they have not been shown for brevity. For nitrobenzene,he effective diffusivities decrease slightly at the surface of the cat-lyst and inside the catalyst as a result of being consumed in theulk and inside the catalyst. Aniline effective diffusivities, however,
ncrease at the surface of the catalyst pellets as the exit of the reac-or is approached and inside the catalyst pellets as the center ispproached due to its production in the bulk, as well as inside theatalyst. The temperature rise for the non-isothermal catalyst pel-ets also plays an important role in enhancing the diffusivities ofniline.
.8. Effect of intraparticle diffusion resistance on the reactorptimal design
In an earlier paper [20], the authors addressed the bi-objectiveptimization problem of this coupled membrane reactor. The twobjective functions considered were: (i) the yield of styrene on theehydrogenation side, and (ii) the conversion of nitrobenzene on theydrogenation side. The homogenous reactor model was used forhe calculations. 12 operating and design parameters were used toptimize the objectives considering a number of linear and non-inear constraints. The Pareto set, representing the set of optimalolutions, was obtained by similar approaches as in [21] usingwo numerical scalarisation based multi-objective techniques: the
ormalized normal constrained method and the normal boundaryntersection method. In this optimization problem, the productionf styrene on the dehydrogenation side can be increased by maxi-izing the yield of styrene, whereas the production of aniline can
al designs of the coupled membrane reactor, i.e. solution A (a–c), solution B (d–f),
be increased on the hydrogenation side by maximizing the conver-sion of nitrobenzene. Optimal solutions are summarized in Table 5representing three cases where the focus is on: (i) production ofstyrene only (solution A), (ii) production of both styrene and aniline(solution B), and (iii) production of aniline only (solution C).
Testing the heterogeneous reactor model developed for themembrane reactor has revealed differences in the values of bothobjectives, i.e. styrene yield and nitrobenzene conversion, for allthree optimal solutions. For instance, the homogenous model pre-dicts a styrene yield of 0.975 on the dehydrogenation side for solu-tion A, whereas the heterogeneous predicts 0.930 for the isothermalcatalyst pellets and 0.925 for the non-isothermal pellets. On thehydrogenation side, the homogeneous model predicts a nitroben-zene conversion of 0.211, whereas the heterogeneous modelpredicts 0.208 for isothermal pellets and 0.202 for non-isothermalpellets. For solution B, the homogenous model predicts a styreneyield of 0.564 on the dehydrogenation side, whereas the hetero-geneous model 0.518 for isothermal pellets and 0.488 for non-isothermal catalyst pellets. The nitrobenzene conversion predictedon the hydrogenation side is 0.555 by the homogenous model,0.508 by the heterogeneous model for the isothermal catalyst pel-lets, and 0.477 by the heterogeneous model for the non-isothermalcatalyst pellets. For solution C, the styrene yield predicted on thedehydrogenation side by the homogenous model is 0.491, 0.428 bythe heterogeneous model for the isothermal pellets, and 0.396 byheterogeneous model for the non-isothermal pellets. On the hydro-genation side, the predicted nitrobenzene conversion is 0.796 fromthe homogenous model, 0.720 from the heterogeneous model for
isothermal pellets, and 0.675 by the heterogeneous model for non-isothermal pellets. There are also significant differences in temper-ature profiles along both sides of the reactor. These differences mayresult in overestimating the design and operating parameters due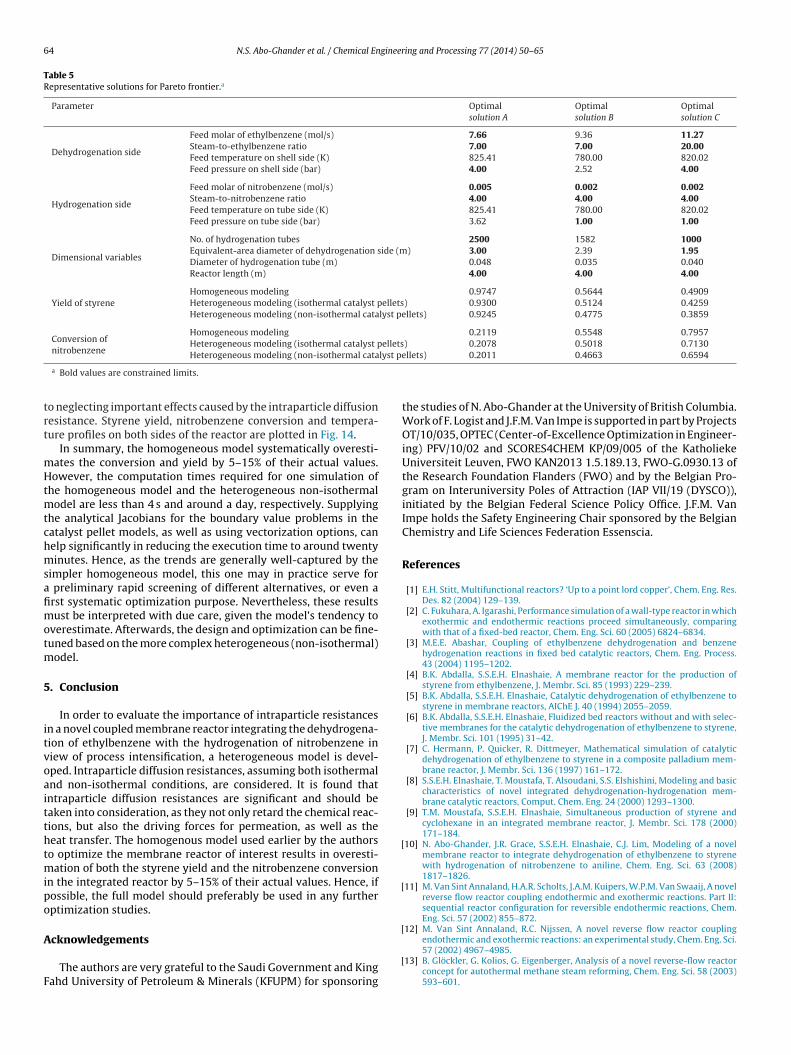
64 N.S. Abo-Ghander et al. / Chemical Engineering and Processing 77 (2014) 50–65
Table 5Representative solutions for Pareto frontier.a
Parameter Optimalsolution A
Optimalsolution B
Optimalsolution C
Dehydrogenation side
Feed molar of ethylbenzene (mol/s) 7.66 9.36 11.27Steam-to-ethylbenzene ratio 7.00 7.00 20.00Feed temperature on shell side (K) 825.41 780.00 820.02Feed pressure on shell side (bar) 4.00 2.52 4.00
Hydrogenation side
Feed molar of nitrobenzene (mol/s) 0.005 0.002 0.002Steam-to-nitrobenzene ratio 4.00 4.00 4.00Feed temperature on tube side (K) 825.41 780.00 820.02Feed pressure on tube side (bar) 3.62 1.00 1.00
Dimensional variables
No. of hydrogenation tubes 2500 1582 1000Equivalent-area diameter of dehydrogenation side (m) 3.00 2.39 1.95Diameter of hydrogenation tube (m) 0.048 0.035 0.040Reactor length (m) 4.00 4.00 4.00
Yield of styreneHomogeneous modeling 0.9747 0.5644 0.4909Heterogeneous modeling (isothermal catalyst pellets) 0.9300 0.5124 0.4259Heterogeneous modeling (non-isothermal catalyst pellets) 0.9245 0.4775 0.3859
Conversion ofHomogeneous modeling 0.2119 0.5548 0.7957Heterogeneous modeling (isothermal catalyst pellets) 0.2078 0.5018 0.7130
lyst pe
trt
mHtmtchmsafimotm
5
itvoaitthtmipo
A
F
[
[
[
nitrobenzene Heterogeneous modeling (non-isothermal cata
a Bold values are constrained limits.
o neglecting important effects caused by the intraparticle diffusionesistance. Styrene yield, nitrobenzene conversion and tempera-ure profiles on both sides of the reactor are plotted in Fig. 14.
In summary, the homogeneous model systematically overesti-ates the conversion and yield by 5–15% of their actual values.owever, the computation times required for one simulation of
he homogeneous model and the heterogeneous non-isothermalodel are less than 4 s and around a day, respectively. Supplying
he analytical Jacobians for the boundary value problems in theatalyst pellet models, as well as using vectorization options, canelp significantly in reducing the execution time to around twentyinutes. Hence, as the trends are generally well-captured by the
impler homogeneous model, this one may in practice serve for preliminary rapid screening of different alternatives, or even arst systematic optimization purpose. Nevertheless, these resultsust be interpreted with due care, given the model’s tendency to
verestimate. Afterwards, the design and optimization can be fine-uned based on the more complex heterogeneous (non-isothermal)
odel.
. Conclusion
In order to evaluate the importance of intraparticle resistancesn a novel coupled membrane reactor integrating the dehydrogena-ion of ethylbenzene with the hydrogenation of nitrobenzene iniew of process intensification, a heterogeneous model is devel-ped. Intraparticle diffusion resistances, assuming both isothermalnd non-isothermal conditions, are considered. It is found thatntraparticle diffusion resistances are significant and should beaken into consideration, as they not only retard the chemical reac-ions, but also the driving forces for permeation, as well as theeat transfer. The homogenous model used earlier by the authorso optimize the membrane reactor of interest results in overesti-
ation of both the styrene yield and the nitrobenzene conversionn the integrated reactor by 5–15% of their actual values. Hence, ifossible, the full model should preferably be used in any furtherptimization studies.
cknowledgements
The authors are very grateful to the Saudi Government and Kingahd University of Petroleum & Minerals (KFUPM) for sponsoring
[
llets) 0.2011 0.4663 0.6594
the studies of N. Abo-Ghander at the University of British Columbia.Work of F. Logist and J.F.M. Van Impe is supported in part by ProjectsOT/10/035, OPTEC (Center-of-Excellence Optimization in Engineer-ing) PFV/10/02 and SCORES4CHEM KP/09/005 of the KatholiekeUniversiteit Leuven, FWO KAN2013 1.5.189.13, FWO-G.0930.13 ofthe Research Foundation Flanders (FWO) and by the Belgian Pro-gram on Interuniversity Poles of Attraction (IAP VII/19 (DYSCO)),initiated by the Belgian Federal Science Policy Office. J.F.M. VanImpe holds the Safety Engineering Chair sponsored by the BelgianChemistry and Life Sciences Federation Essenscia.
References
[1] E.H. Stitt, Multifunctional reactors? ‘Up to a point lord copper’, Chem. Eng. Res.Des. 82 (2004) 129–139.
[2] C. Fukuhara, A. Igarashi, Performance simulation of a wall-type reactor in whichexothermic and endothermic reactions proceed simultaneously, comparingwith that of a fixed-bed reactor, Chem. Eng. Sci. 60 (2005) 6824–6834.
[3] M.E.E. Abashar, Coupling of ethylbenzene dehydrogenation and benzenehydrogenation reactions in fixed bed catalytic reactors, Chem. Eng. Process.43 (2004) 1195–1202.
[4] B.K. Abdalla, S.S.E.H. Elnashaie, A membrane reactor for the production ofstyrene from ethylbenzene, J. Membr. Sci. 85 (1993) 229–239.
[5] B.K. Abdalla, S.S.E.H. Elnashaie, Catalytic dehydrogenation of ethylbenzene tostyrene in membrane reactors, AIChE J. 40 (1994) 2055–2059.
[6] B.K. Abdalla, S.S.E.H. Elnashaie, Fluidized bed reactors without and with selec-tive membranes for the catalytic dehydrogenation of ethylbenzene to styrene,J. Membr. Sci. 101 (1995) 31–42.
[7] C. Hermann, P. Quicker, R. Dittmeyer, Mathematical simulation of catalyticdehydrogenation of ethylbenzene to styrene in a composite palladium mem-brane reactor, J. Membr. Sci. 136 (1997) 161–172.
[8] S.S.E.H. Elnashaie, T. Moustafa, T. Alsoudani, S.S. Elshishini, Modeling and basiccharacteristics of novel integrated dehydrogenation-hydrogenation mem-brane catalytic reactors, Comput. Chem. Eng. 24 (2000) 1293–1300.
[9] T.M. Moustafa, S.S.E.H. Elnashaie, Simultaneous production of styrene andcyclohexane in an integrated membrane reactor, J. Membr. Sci. 178 (2000)171–184.
10] N. Abo-Ghander, J.R. Grace, S.S.E.H. Elnashaie, C.J. Lim, Modeling of a novelmembrane reactor to integrate dehydrogenation of ethylbenzene to styrenewith hydrogenation of nitrobenzene to aniline, Chem. Eng. Sci. 63 (2008)1817–1826.
11] M. Van Sint Annaland, H.A.R. Scholts, J.A.M. Kuipers, W.P.M. Van Swaaij, A novelreverse flow reactor coupling endothermic and exothermic reactions. Part II:sequential reactor configuration for reversible endothermic reactions, Chem.Eng. Sci. 57 (2002) 855–872.
12] M. Van Sint Annaland, R.C. Nijssen, A novel reverse flow reactor coupling
endothermic and exothermic reactions: an experimental study, Chem. Eng. Sci.57 (2002) 4967–4985.13] B. Glöckler, G. Kolios, G. Eigenberger, Analysis of a novel reverse-flow reactorconcept for autothermal methane steam reforming, Chem. Eng. Sci. 58 (2003)593–601.

gineer
[
[
[
[
[
[
[
the dehydrogenation of ethylbenzene to styrene with the hydrogenation of
N.S. Abo-Ghander et al. / Chemical En
14] D. Czechowicz, K. Skutil, A. Torz, M. Taniewski, An integrated process of oxida-tive coupling of methane and pyrolysis of naphtha in a scaled-up unit, J. Chem.Technol. Biotechnol. 79 (2004) 182–186.
15] M.E.E. Abashar, Modeling and simulation of an integrated multi-shell fixed bedmembrane reactor with well-mixed catalyst pattern for production of styreneand cyclohexane, Chem. Eng. Process. 50 (2011) 931–939.
16] S.S.E.H. Elnashaie, B.K. Abdalla, R. Hughes, Simulation of the industrial fixedbed catalytic reactor for the dehydrogenation of ethylbenzene to styrene: het-
erogeneous dusty gas model, Ind. Eng. Chem. Res. 32 (1993) 2537–2541.17] B. Amon, H. Redlingshöfer, E. Klemm, E. Dieterich, G. Emig, Kinetic investiga-tions of the deactivation by coking of a noble metal catalyst in the catalytichydrogenation of nitrobenzene using a catalytic wall reactor, Chem. Eng. Pro-cess. 38 (1999) 395–404.
[
ing and Processing 77 (2014) 50–65 65
18] S.S.E.H. Elnashaie, S.S. Elshishini, Modelling, Simulation and Optimization ofIndustrial Fixed Bed Catalytic Reactors, Gordon and Breach Science Publisher,Singapore, 1993.
19] R.B. Bird, W.E. Stewart, E.N. Lightfoot, Transport Phenomena, Wiley, New York,1960.
20] N.S. Abo-Ghander, F. Logist, J.R. Grace, J.F.M. Van Impe, S.S.E.H. Elnashaie,C.J. Lim, Optimal design of an autothermal membrane reactor coupling
nitrobenzene to aniline, Chem. Eng. Sci. 65 (2010) 3113–3127.21] F. Logist, P. Van Erdeghem, J. Van Impe, Efficient deterministic multiple objec-
tive optimal control of (bio)chemical processes, Chem. Eng. Sci. 64 (11) (2009)2527–2538.